COMBINED ION EXCHANGE/BIOLOGICAL ...
101
COMBINED ION EXCHANGE/BIOLOGICAL DENITRIFICATION FOR NITRATE REMOVAL FROM GROUND WATER 0000 02129969
-
Upload
khangminh22 -
Category
Documents
-
view
0 -
download
0
Transcript of COMBINED ION EXCHANGE/BIOLOGICAL ...

COMBINED ION EXCHANGE/BIOLOGICAL DENITRIFICATION
FOR NITRATE REMOVAL FROM GROUND WATER
0000 0212 9969

Promotor : Dr. L. Lijklema, hoogleraar in de waterzuivering en de waterkwaliteit
Co-promotor : Dr. A. Klapwijk, universitair hoofddocent bij de vakgroep waterzuivering

tW*&W. I*-2.2-
J.P. van der Hoek
COMBINED ION EXCHANGE/BIOLOGICAL DENITRIFICATION
FOR NITRATE REMOVAL FROM GROUND WATER
Proefschrift
ter verkrijging van de graad
van doctor in de landbouwwetenschappen,
op gezag van de rector magnificus,
dr. C.C. Oosterlee,
in het openbaar te verdedigen
op woensdag 18 mei 1988
des namiddags te vier uur in de aula
van de Landbouwuniversiteit te Wageningen.
A/t/- z£8 /v£
jOMO'-2'?oi , xZL'L.
STELLINGEN
1. Rekening houdend met het stijgende sulfaatgehalte van het grondwater in Oost-
Gelderland, is het zwavel-/kalksteenproces daar niet het meest voor de hand liggende
proces voor nitraatverwijdering uit grondwater.
Bennekom C.A. van (1987) Kwaliteitsveranderingen van grondwater als gevolg van uitspoeling van meststoffen. H-fi 20, 194-199. Kruithof J.C., Bennekom C.A. van, Dierx H.A.L., Hijnen W.A.M., Paassen J.A.M. van & Schippers J.C. (1988) Nitrate removal from ground water by sulphur/ limestone filtration. Wat. Supply 6, 207-217.
2. Hoge alkaliteit in een denitrificerend systeem met methanol als energie- en koolstof-
bron voorkomt nitrietophoping.
Dit proefschrift.
3. Heterotrofe denitrificatie met een lage slibopbrengst gecombineerd met behoud van
voldoende activiteit, beide een effect van hoge alkaliteit, heeft in het gecombineerde
ionenwisseling/biologische denitrificatieproces voor nitraatverwijdering uit grondwater
tot gevolg dat dit proces ook ten opzichte van directe biologische denitrificatie van
grondwater gekenmerkt wordt door een minimale afvalstroomproduktie.
Dit proefschrift.
4. De geringe capaciteitsdaling van ionenwisselaars bij gebruik van perazijnzuur als
desinfectiemiddel, die door sommigen is waargenomen, is niet zozeer te danken aan de
zeer goede kwaliteit van de gebruikte ionenwisselaars, alswel aan de onjuiste condities
waaronder de experimenten zijn uitgevoerd.
Schwab H. & Soldavini H. (1977) Desinfektion von Ionenaustauschern mit Peressigsaure Spezialqualitat IA. Chemie-Technik 6, 197-200. Zange D. & Bauer H.J. (1971) Uber die Sterilisation von Ionenaustauschern mit Peressigsaure. Pharm. Prax. 26, 251-252. Falk M., Hellmig R. & Sollik E. (1982) Stabilitat von Wofatit-Ionenaus-tauschern gegenuber Peressigsaure. Pharmazie 37, 387-388.
5. Het gegeven dat nitraatselectieve ionenwisselaars een iets geringere capaciteit hebben
dan sulfaatselective ionenwisselaars en moeilijker zijn te regenereren, betekent niet
dat zij daarmee per definitie minder geschikt zijn voor nitraatverwijdering uit drink-
water.
HSU W.H. & Kretzschmar W. (1988) Combined nitrate and hardness elimination by the Carix ion exchange process. Wat. Supply 6, 51-55.
6. Er dienen op Europees niveau zo spoedig mogelijk afspraken gemaakt te worden en
normen vastgesteld te worden over het gebruik van ionenwisselaars in de drinkwater-
bereiding.
7. De Vaste Commissie Wetenschappen zou bij de beoordeling van de wetenschappelijke
prestaties van vakgroepen naast het aantal publikaties en het niveau van de tijd-
schriften waarin deze verschijnen, ook het aantal aanvragen voor reprints van die
publikaties in ogenschouw moeten nemen.
8. Het dilemma van het paranormale is dat alles voorspeld kan worden, maar dat slechts
een klein gedeelte daarvan ook werkelijk uitkomt.
9. Gezien de gunstige lichamelijke effecten van het joggen dient de uitdrukking "hard-
lopers zijn doodlopers" niet al te letterlijk opgevat te worden.
10. Wie zich overdag verhoogt, zal in de droom vernederd worden.
Biesheuvel J.M.A. (1987) Mijn majesteitsdroom.
11. Geldprijzen voor wetenschappelijk onderzoek behoren in zo sterk mogelijke valuta
uitgekeerd te worden.
Stellingen bij het proefschrift "Combined ion exchange/biological denitrification for nitrate
removal from ground water" van J.P. van der Hoek.
Wageningen, 18 mei 1988.

De Bomen
Want wij zijn als boomstammen in de sneeuw. Schijnbaar staan zij er maar bovenop en met een licht duwtje moest je ze eigenlijk weg kunnen schuiven. Neen, dat kan je niet, want zij zijn vast met de aarde verbonden.
Maar kijk, zelfs dat is slechts schijnbaar.
Uit Franz Kafka, 'Verzameld Werk'

DANKWOORD
Aan het onderzoek dat ten grondslag ligt aan dit proefschrift hebben vele personen een bijdrage geleverd.
In de eerste plaats wil ik Bram Klapwijk bedanken. Hij was het die op het lumineuze idee kwam ionenwisseling en biologische denitrificatie te combineren tot een proces. In de uit-werking van dit idee en de uitvoering van het onderzoek gaf hij mij de vrijheid dit in te richten naar eigen inzicht, wat ik zeer heb weten te waarderen. Bert Lijklema is een uitste-kende raadgever geweest bij de uiteindelijke verslaggeving van het onderzoek. Hem wil ik ook bedanken voor zijn bereidheid als promotor op te treden.
Het onderzoek zou niet mogelijk geweest zijn zonder de hulp van Paul van der Ven, die een groot deel van de chemische analyses voor zijn rekening heeft genomen en de verschillende laboratorium-opstellingen op uitstekende wijze heeft beheerd. De hulp van Jo Ackerman gedurende het eerste halfjaar van het onderzoek is een goede basis geweest voor de rest van het onderzoek. Voor hulp bij de chemisch-analytische apparatuur stonden Johannes van der Laan en Arjen van de Peppel altijd klaar, terwijl Theo Ywema zorgde dat er altijd voldoende pompen en pompslangen waren. De centrale dienst, tekenkamer en fotografisehe afdeling van het Biotechnion stonden garant voor de levering van chemicalien en apparatuur, het tekenwerk en de reproductie daarvan.
Door verschillende studenten is in het kader van hun doctoraalonderzoek een bijdrage geleverd aan het totale onderzoek. Ad Bot, Anton Griffioen, Wim van der Hoek, Paul Latour, Jeroen Verheijen, Pim Vis en Bob Zwanikken worden daarom hartelijk bedankt voor hun inzet en enthousiasme.
Voor de goede sfeer en prettige werkomgeving wil ik ook al die anderen, betrokken bij de vakgroep Waterzuivering, hartelijk danken.
Hoewel niet in dit proefschrift beschreven, is ook onderzoek uitgevoerd met een proefinstal-latie op semi-technische schaal in het Montferland nabij Doetinchem. Van de Waterleiding-maatschappij Oostelijk Gelderland dienen vooral Rik Dierx, Bernard Mijnarends en Herman Wisselink, en van het Waterlaboratorium Oost Cees van Bennekom, genoemd te worden voor de prettige samenwerking, begeleiding en technische ondersteuning.

ABSTRACT
Hoek, J.P. van der 1988. Combined ion exchange/biological denitrification for nitrate removal from ground water. Doctoral thesis, Wageningen Agricultural University, Wageningen, The Netherlands.
This thesis deals with the development of a new process for nitrate removal from ground water. High nitrate concentrations in ground water are a result of fertilization in agriculture. According to a directive of the European Community the maximum admissible concentration of nitrate in drinking water is 11.3 mg NC>3"-N/1 and the guide level is 5.6 mg N03~-N/l. To supply water that meets this standard several water supply companies will have to remove nitrate from ground water. Two existing techniques, viz ion exchange and biological denitrification, have serious disadvantages when used separately. Therefore, a new process has been developed that consists of a combination of ion exchange and biological denitrification. In this process nitrate is removed from the ground water by ion exchange. The ion exchange resins are regenerated in a closed circuit through an upflow sludge blanket (USB) denitrification reactor. In this reactor denitrifying bacteria remove nitrate from the regenerant, so that it can be used again and has not to be disposed of. As compared with conventional regeneration of anion exchange resins regeneration salt requirement and brine production are minimized. Further, in contrast with traditional single denitrification procedures, there is no direct contact between ground water and denitrifying bacteria.
The first part of this thesis deals with the effect of high salt concentrations, as present in the closed regeneration system, on biological denitrification. Concentrations up to 30 g NaHCC>3/l or 30 g NaCl/1 have only little effect on the activity of denitrifying sludge. With high NaHCC>3 concentrations the sludge yield coefficient decreases and nitrite accumulation is suppressed. High sulfate concentrations (5.5 g SO^ ' / l ) do not result in sulfide production in an USB denitrification reactor fed with methanol, when methanol is added in an appropriate ratio to the amount of nitrate to be denitrified.
The second part of this thesis deals with the ion exchange part of the combined process. Regeneration of anion exchange resins can be achieved with a solution containing 30 g NaHCC>3/l provided that a larger flow rate and a longer regeneration time are used as compared with conventional regeneration procedures. With nitrate selective resins it is possible to remove nitrate from ground water that contains high sulfate concentrations, while the nitrate capacity of these resins is not affected by high sulfate concentrations in the regenerant. To safeguard the bacteriological drinking water quality the resins have to be disinfected after each regeneration cycle by rinsing with 0.075% peracetic acid for 15 minutes or by rinsing with 0.20% hydrogen peroxide for 45 minutes. Since the first possibility results in an important loss of resin capacity on the long term, only the latter can be applied in practice.
The third part of this thesis deals with the operation of a lab-scale pilot plant. The most important process variables studied were the regenerant composition (NaCl or NaHCC^), the ion exchange resin type (sulfate selective or nitrate selective) and the ground water composition (low sulfate concentration or high sulfate concentration). To explain some phenomena that were observed during this research a computer model has been developed. With this model the regeneration of anion exchange resins in a closed circuit can be optimized.
Key words: nitrate removal, ground water, drinking water, ion exchange, regeneration, brine, nitrate selective resin, biological denitrification, methanol, sulfide production, disinfection, nitrate, sulfate

CONTENTS
Chapter 1. General introduction 1
Chapter 2. Denitrification with methanol in the presence of high salt 13 concentrations and at high pH levels
Chapter 3. Effect of hydraulic residence time on microbial sulfide 21 production in an upflow sludge blanket denitrification reactor fed with methanol
Chapter 4. Nitrate removal from ground water - Use of a nitrate 31 selective resin and a low concentrated regenerant
Chapter 5. Disinfection of anion exchange resins in the combined ion 43 exchange/biological denitrification process. Part 1: Effect on water quality
Chapter 6. Disinfection of anion exchange resins in the combined ion 49 exchange/biological denitrification process. Part II: Effect on resin capacity
Chapter 7. Nitrate removal from ground water 53
Chapter 8. Combined ion exchange/biological denitrification for 63 nitrate removal from ground water under different process conditions
Chapter 9. Modelling and optimization of the combined ion ex- 75 change/biological denitrification process for nitrate removal from ground water
Chapter 10. Summary 91 Samenvatting
Curriculum vitae 97

CHAPTER 1
GENERAL INTRODUCTION
Nitrate in drinking water
High nitrate levels in ground water and drinking water are a serious problem in several European countries. Two counteracting developments have recently stressed this problem. Firstly, an increasing nitrate concentration is observed in ground water as a result of fertilization in agriculture. Both artificial fertilizers and animal manure cause problems (Bruyn, 1984; Van Beek et al., 1988; Furrer and Stauffer, 1986; Holtmeier, 1984; Marsh, 1980; Richard and Leprince, 1982; Sontheimer and Rohmann, 1984; Strobel and K6nig, 1985). Secondly, in the new E.C. directive relating to the quality of water intended for human consumption the maximum admissible concentration of nitrate in drinking water has been decreased from 22.3 to 11.6 mg N03~-N/l and the guide level to 5.6 mg N03~-N/l (European Community, 1980).
The acceptable concentration of nitrate in drinking water is restricted for medical reasons: 1. The presence of excessive quantities of nitrates in drinking water is known to be a
health risk to infants under three months. Infantile methaemoglobinaemia, a blood disorder in which the oxygen-carrying capacity of the blood is diminished, was first described by Comly (1945). Since then about 2000 cases have been reported from North-America and Europe with a mortality of 7-8 percent (Taylor, 1975). However, the incidence of this disease is also affected by other important factors. Many reported cases resulted from consumption of water of doubtful microbiological quality (Miller, 1982).
2. Nitrate ingestion has been suggested to be associated with an increased risk of stomach cancer possibly through endogenous nitrosamine formation (Jensen, 1982). Laboratory animals appeared to be highly susceptible to the carcinogenic action of N-nitroso compounds, but their role in human cancer is difficult to assess (Fraser et al., 1980). In a case study of Beresford (1985) no evidence of a positive association between nitrate levels in drinking water and mortality from all cancers or stomach cancer in particular was found in the urban areas of the United Kingdom. According to Forman et al. (1985) there is no strong evidence that environmental nitrates and nitrites play a major role in determing the risk of gastric cancer in Britain.
Although the stringent limits on nitrate in drinking water are still open to questions, as described above, water supply companies will have to deal with these regulations and from reports from several countries (summarized in the next paragraph) it is clear that part of the supplied water has already reached or will soon reach the E.C. standards.
The extent of the nitrate problem
In the Netherlands about two-thirds of the drinking water originates from ground water. The Netherlands Waterworks Testing and Research Institute (KIWA) estimates that 25% of the well fields exploited by the Dutch Waterworks will experience problems, either with nitrate itself or with reaction products of nitrate reduction (Van Beek et al., 1984).
The Institute for Land and Water Management Research has made indicative calculations of future nitrate concentrations in ground water in relation to the use of manure as fertilizer in agriculture. The calculations included 166 ground water pumping stations on sandy
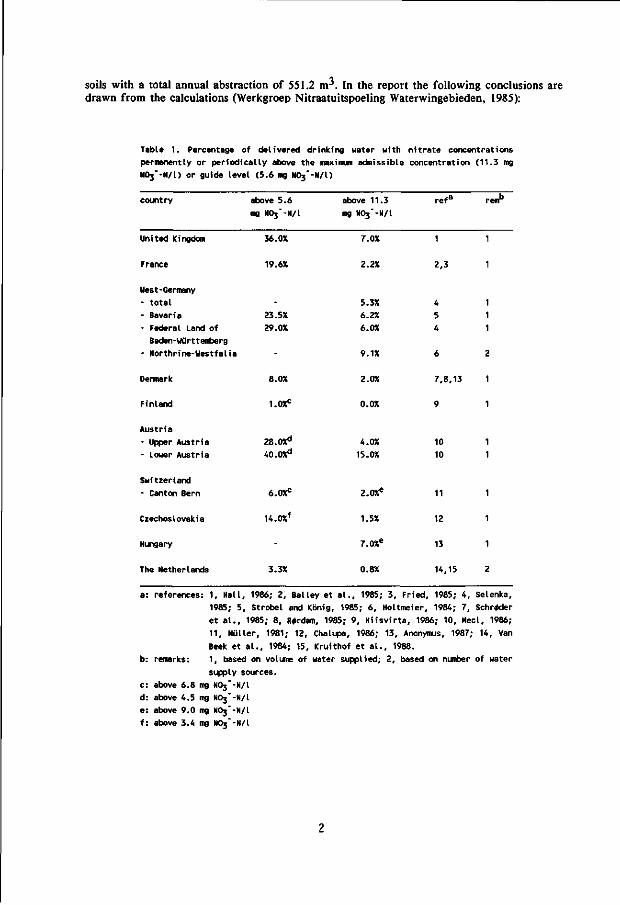
soils with a total annual abstraction of 551.2 m-'. In the report the following conclusions are drawn from the calculations (Werkgroep Nitraatuitspoeling Waterwingebieden, 1985):
Table 1. Percentage of delivered drinking water with nitrate concentrations
permanently or periodically above the maximum admissible concentration (11.3 mg
NOj'-N/l) or guide level (5.6 mg NOj'-N/l)
country
United Kingdom
France
West-Germany
- total
- Bavaria
- Federal Land of
Baden-Wurttemberg
- Northrine-Uestfalia
Denmark
Finland
Austria
- Upper Austria
- Lower Austria
Switzerland
- Canton Bern
Czechoslovakia
Hungary
The Netherlands
above 5.6
mg N03"-N/l
36.0%
19.6X
-23.5X
29.0X
-
8.OX
1.0XC
28.0Xd
40. OX*1
6.0XC
14.0%f
-
3.3X
above 11.3
mg NOj'-N/l
7.OX
2.2X
5.3X
6.2X
6.OX
9.1X
2.0%
0.0%
4.0%
15.OX
2.0Xe
1.5X
7.0Xe
0.8%
refa
1
2,3
4
5
4
6
7,8,13
9
10
10
11
12
13
14,15
renr
2
2
a: references: 1, Hall, 1986; 2, Bailey et al., 1985; 3, Fried, 1985; 4, Selenka,
1985; 5, Strobel and Konig, 1985; 6, Holtmeier, 1984; 7, Schroder
et al., 1985; 8, R*rdam, 1985; 9, Hiisvirta, 1986; 10, Med, 1986;
11, Miiller, 1981; 12, Chalupa, 1986; 13, Anonymus, 1987; 14, Van
Beek et al., 1984; 15, Kruithof et al., 1988.
b: remarks: 1, based on volume of water supplied; 2, based on number of water
supply sources.
c: above 6.8 mg NOj'-N/l
d: above 4.5 mg NOj'-N/l
e: above 9.0 mg NC^'-N/l
f: above 3.4 mg NOj'-N/l

- With unchanged use of manure in agriculture, i.e. with no restrictions in the protection zone and the surrounding fields, 16 stations will exceed the EC-level of 11.3 mg NC>3~-N/1 and 45 stations will exceed the guide level of 5.6 mg NC>3~-N/1 in the year 2080.
- With extreme fertilization restrictions, i.e. application of 50% of the optimum nitrogen dose in the protection zone but no restrictions in the surrounding fields, still 2 stations will exceed the level of 11.6 mg N03"-N/l and 19 stations will exceed the guide level of 5.6 mg NO3--N/I.
From these figures it is clear that several problems are expected in the forthcoming years in the Netherlands.
Also in other countries nitrate in drinking water is a serious problem. Table 1 summarizes figures from several countries in Europe. The figures concern either the volume of water supplied or the number of water supply sources.
The approach to the nitrate problem
In the Netherlands one of the approaches to solve the nitrate problem is to control the use of animal manure in agriculture. The legal framework for the regulation of the use of animal manure consists of the Soil Protection Act and the Fertilizer Act. The Soil Protection Act concerns limitation and regulation of manure application, while the Fertilizer Act addresses to manure quality demands (Scheltinga, 1985). These protection strategies are based on phosphorus dosage and it is questionable whether these regulations are effective in controlling nitrate pollution of ground water (Van Bennekom et al., 1987; Rang, 1986; Trouwborst, 1987). Data of the Institute for Land and Water Management Research (Werkgroep Nitraatuitspoe-ling Waterwingebieden, 1985) have shown that even with extreme restrictions in the use of manure, still several water supply stations will have to deal with high nitrate levels in ground water.
As the origin of the problem is an intensification of animal husbandry, the Interim Act Restriction Pig- and Poultry Farms forbids the operation of new pig- and poultry farms and the extension of existing farms (Scheltinga, 1985).
Besides control of nitrate at the source, which seems to give no complete solution in the Netherlands, other methods are available for controlling nitrate concentrations in drinking water (Miller, 1982; Sorg, 1979): 1. development of another supply 2. blending of supplies 3. provision of low-nitrate bottled drinking water 4. removal of nitrate during treatment Methods 1 and 2 have the disadvantage that the water quality elsewhere may change with time. These alternatives do not give a permanent solution. The third method has considerable practical and financial implications. On the short term nitrate removal during treatment seems to be the only possibility to supply water with acceptable concentrations. Some of these treatment techniques will be discussed in the next paragraph.
Nitrate removal techniques
Several techniques have been proposed for the removal of nitrate from drinking water. Some of these techniques are summarized in Table 2 (Dobias et al., 1985; Ginocchio, 1980; Goodman, 1975; Gros and Ginocchio, 1982; Haberer, 1984; Hall et al., 1985; Van der Hoek and Klapwijk, 1987; Rautenbach et al., 1986; Richard and Leprince, 1982; Sontheimer and Roh-mann, 1984; Sorg, 1979). Chemical reduction appears to be only economically attractive with ferrous iron, but large amounts are required, and the process needs a catalyst and must take place in an alkaline solution (Barlog, 1980; Sorg, 1979). Electrodialysis and reverse osmosis, both membrane processes, are also unattractive for nitrate removal. These processes are not

selective for nitrate, produce a voluminous concentrated waste, and need a pretreatment (Richard and Leprince, 1982). Only ion exchange and biological denitrification can be considered feasible and practical for full-scale treatment of drinking water. However, both these processes have serious disadvantages.
Table 2. Nitrate removal techniques
ion exchange
biological denitrification
combined ion exchange/biological denitrification
reverse osmosis
electrodialysis
chemical reduction
Ion exchange is a relatively simple process. Nitrate is exchanged for chloride or bicarbonate by means of an anion exchange resin. After a certain time the resin has to be regenerated, and for this purpose concentrated sodium chloride or sodium bicarbonate solutions are used. A large excess of salt is needed, and during regeneration a voluminous brine is produced. Some figures are given in Table 3. This brine contains very high chloride, bicarbonate, sulfate and nitrate concentrations, and hence is very difficult to dispose of.
Table 3. Conventional regeneration procedures of strong base anion exchange resins
regenerant
NaCl
NaCl/NaNCC3
NaCl
NaCl
NaCl
NaCl
NaCl
NaCl
NaCl
NaCl
concentration
<g/l>
80 60 110 30-60
100 60 60 75 40-60
-
flow
co-current
co-current
co-current
co-current
co-current
co-current
co-current
counter-current
counter-current
co-current
flourate
(BV/h)a
6 4 2.9 5
----4-6
-
time
(h)
>0.5
1.125
0.92
0.75
---0.83
--
spent regen
erant (BV)b
>3 4.5 2.7 3.75
3 4 1.5
--2.8
refc
1 2,3 4 5 6 7 8 9 10 11
bed volumes per hour
bed volumes
references: 1, Buelow et al., 1975; 2, Deguin et al., 1978; 3, Deguin, 1982; 4,
Anderson et al., 1985; 5, Guter, 1982; 6, Gauntlett, 1975; 7, Guter,
1984; 8, Lauch and Guter, 1986; 9, Partos and Richard, 1985; 10,
Guilhem, 1985; 11, Philipot and de Larminat, 1988.

Biological denitrification is a process by which nitrate is converted into nitrogen gas by denitrifying bacteria. The process is carried out under controlled conditions in a bioreactor containing denitrifying bacteria. Basically two denitrification processes can be distinguished: heterotrophic denitrification and autotrophic denitrification. In heterotrophic denitrification processes organic carbon supplements are used as energy and carbon source. In autotrophic denitrification processes an inorganic carbon source is used (CO2) while oxidation of hydrogen or reduced sulfur compounds delivers the required energy. Both heterotrophic and autotrophic denitrification processes have important disadvantages: 1. A direct contact is created between ground water, which is generally sterile, and
bacteria. In the case of heterotrophic denitrification also a carbon source has to be added to the ground water. This implies a risk of a bacteriological contamination of the ground water (Dries et al., 1988; Frank and Dott, 1985; Hijnen et al., 1988; Mttller and Kiihn, 1982) and extensive post treatment is necessary to safeguard the drinking water quality (Haberer, 1984; Leprince and Richard, 1982; Overath et al., 1986; Phili-pot, 1982; Roennefahrt, 1985; Sontheimer et al., 1982).
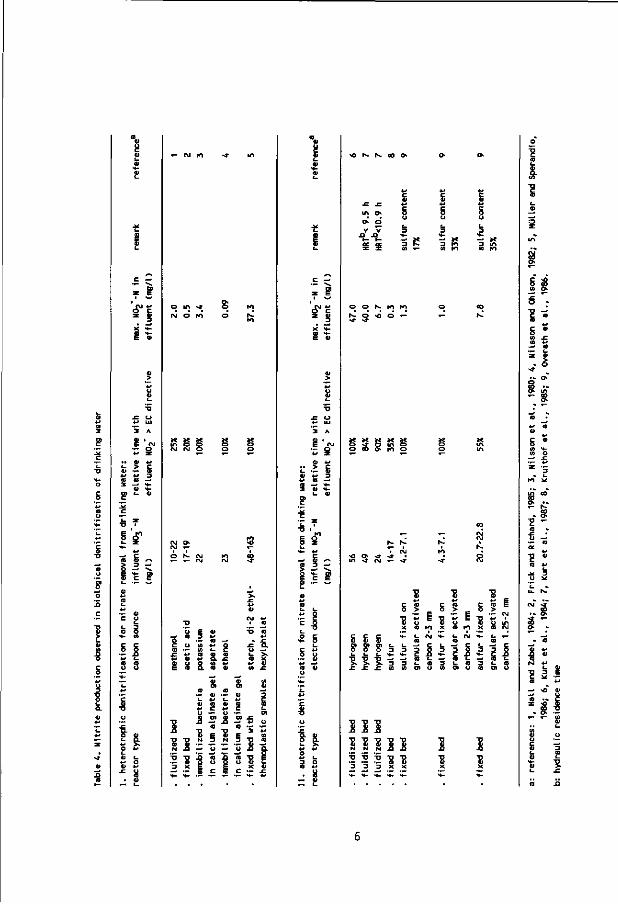
2. The reduction of nitrate to nitrogen gas proceeds via nitrite. This toxic intermediate product is often present in the effluent of denitrification reactors. The maximum acceptable concentration of nitrite in drinking water is only 0.03 mg N02~-N/l (0.1 mg N02~/I) (European Community, 1980). Some examples of nitrite production in biological denitrification processes for nitrate removal from potable water are shown in Table 4. The first and second alternative mentioned in part I of this table are currently being tested on demonstration-plant scale and application in practise is being considered. The other three possibilities concern the use of immobilized bacteria in a matrix and are only in an experimental stage of development.
nitrate low groundwater
I.E. 1 IE 2
nitrate rich groundwater
nitrate low groundwater
IE 1 I.E. 2
nitrate rich groundwater
ion exchanger 1 : nitrate removal ion exchangerl : regeneration ion exchanger 2 : regeneration ion exchanged : nitrate removal
Fig. 1. Combined ion exchange/biological deni t r i f icat ion for n i t rate removal from ground water.
The above mentioned disadvantages of biological denitrification and ion exchange can be avoided by combining these processes into one technique: combined ion exchange/biological denitrification. This process is schematically shown in Figure 1. Nitrate is removed from the
c —
lo~
> g (0 —-—* •*-4> 4 -
> 3 —
§ 1 1
I I
o in >* P*J o to
SS 8 ( \ l (M O
• - « - (\J
O E 4» — to S +* o •— at —•
s .s s t: 8 4) O Q « *-*
E o a a u
. - at • -
* *
*- c *- c o • - o •— CD O) 9 TO .C
a « —
2 §2 s^ -» o — o
2 "8
i t;
41 *-» 3
** « —• X 41 **-
- g . ? 3 •
° i .2 8
t&
« K K (O »
t ec 3 F--
o o N- ro K» N. O ^ O * -
» W
O 0> >* - * U1 -4- (M « - >»
© «5 £ CD
~ i U t - (M
1 1 1 6 S v v V N N N i ,Q
is is is "8 "8
O) O (A O) U
2 2
(A O
S • (A •+-« o
CD * • •
- - >0 0) —' o
g i 41 <-
t 1
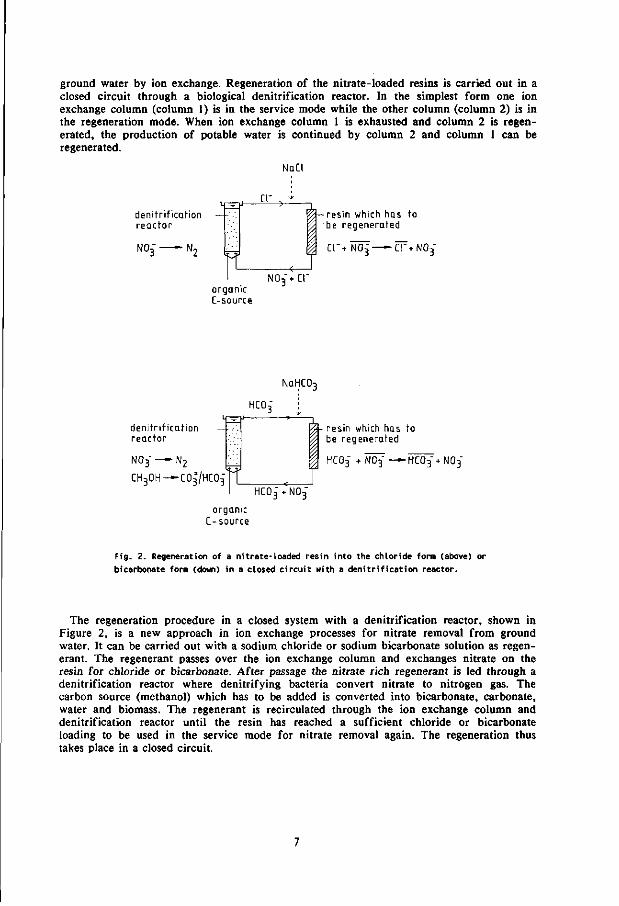
ground water by ion exchange. Regeneration of the nitrate-loaded resins is carried out in a closed circuit through a biological denitrification reactor. In the simplest form one ion exchange column (column 1) is in the service mode while the other column (column 2) is in the regeneration mode. When ion exchange column 1 is exhausted and column 2 is regenerated, the production of potable water is continued by column 2 and column 1 can be regenerated.
NQCI
denitrif ication reactor
NO; 2 to*
organic C-source
<3— resin which has to be regenerated
c r + N O ; • C I ' + N O ;
NaHCO
HCO;
3
denitr i f icat ion _ -reactor
N O 3 — N 2
CH3OH —C0| /HC0 3 "
resin which has to
J i ^ be regenerated I
HCO^ + NO 3 + l
organic C-source
HCO3 + NO3" — HCO3 + N03"
Fig. 2. Regeneration of a nitrate-loaded resin into the chloride form (above) or bicarbonate form (down) in a closed circuit with a denitrification reactor.
The regeneration procedure in a closed system with a denitrification reactor, shown in Figure 2, is a new approach in ion exchange processes for nitrate removal from ground water. It can be carried out with a sodium chloride or sodium bicarbonate solution as regen-erant. The regenerant passes over the ion exchange column and exchanges nitrate on the resin for chloride or bicarbonate. After passage the nitrate rich regenerant is led through a denitrification reactor where denitrifying bacteria convert nitrate to nitrogen gas. The carbon source (methanol) which has to be added is converted into bicarbonate, carbonate, water and biomass. The regenerant is recirculated through the ion exchange column and denitrification reactor until the resin has reached a sufficient chloride or bicarbonate loading to be used in the service mode for nitrate removal again. The regeneration thus takes place in a closed circuit.
The combined process has several advantages over ion exchange and biological denitrifi-cation as separate techniques: 1. Compared with ion exchange regeneration salt requirements and brine disposal are
minimized. The use of a closed regeneration circuit implies that the excess of salt is kept within the system and reuse of the regenerant means a reduction of brine disposal problems. Moreover, the denitrification reactor produces bicarbonate, which is a suitable regeneration ion. The proposed regeneration procedure results in important financial advantages (Van der Hoek, 1987).
2. Compared with biological denitrification a direct contact between the ground water and denitrification reactor is avoided. Hence, the risk of a bacteriological contamination is minimized and nitrite will not affect the treated water quality.
An additional benefit concerns the temperature effect on denitrification. Ground water normally has a temperature of 10-12 °C. In the closed regeneration circuit the temperature easily reaches 20-25 °C during summer, while during winter some heating and good isolation may keep the temperature well above 15 °C. Besides, the exothermic denitrification reaction generates heat (Bosman and Hendricks, 1981; Francis and Malone, 1977) which keeps the temperature high in the closed regeneration circuit during winter. Thus, direct treatment of ground water by biological denitrification, or treatment by ion exchange with biological denitrification of the spent regenerant, as in the combined ion exchange/biological denitrification process, results in a difference of at least 10 °C in the denitrification reactor. This is important since denitrification is rather temperature sensitive. For several carbon sources Lewandowski (1982) measured Qjo values ranging from 1.94 to 2.05 and Timmermans and Van Haute (1983) measured a QIQ of 3.33 for denitrification with methanol.
Objective and outline of the present study
The present study was intended to develop and test the combined ion exchange/biological denitrification process. Before it is possible to design and run plants for nitrate removal from ground water on the basis of the combined process, it is first necessary to study biological denitrification and ion exchange separately in view of the interfacing of both. For the specific process conditions that will prevail in the combined process very little is known about biological denitrification and ion exchange. This research is described in chapters 2 to 6.
Chapter 2 deals with the effect of high sodium chloride and sodium bicarbonate concentrations on denitrification, while chapter 3 deals with denitrification in the presence of high sulfate concentrations. These are important aspects, since in the combined process the denitrification reactor will treat a regenerant containing high chloride, bicarbonate and sulfate concentrations. In chapter 4 the use of a nitrate selective resin and a low concentrated regenerant are discussed. In the combined process a low concentrated regenerant is used to avoid severe inhibition of the denitrification reactor by high salt concentrations. However, this affects the regeneration procedure of the resins. The use of nitrate selective resins offers possibilities to treat ground water containing high sulfate concentrations, but this requires some changes in process control. Especially the length of the service mode and of the regeneration mode are influenced by the use of nitrate selective resins. Chapters 5 and 6 deal with the use of disinfectants in the combined process. Although the biological denitrification reactor is not in direct contact with ground water, still bacteriological contamination of the treated ground water may occur because during regeneration the resins become contaminated as a result of carry-over of sludge particles from the denitrification reactor into the ion exchange column. After regeneration the resins are used for nitrate removal and, without additional measures, would contaminate the ground water. Chapter 5 describes how disinfection of the resins during rinsing, after regeneration, prevents bacteriological contamination of the ground water by the resins. In chapter 6 the effect of disinfectants on resin capacity is described.
The actual process, including plant design and pilot plant experiments, is described in chapters 7, 8 and 9. Chapter 7 deals with the basic design criteria and describes one of the four process conditions that have been studied. The other three process conditions under which the pilot plant has been tested are discussed in chapter 8. In chapter 9 a mathematical model is presented which describes the combined ion exchange/biological denitrification process. The model has been used to explain some phenomena, especially a rather low de-nitrification reactor capacity, observed during the pilot plant experiments and to assess optimal conditions for the regeneration process of the ion exchange columns in a closed circuit.
References
Andersen K.K., Gron C. and Thrane W.W. (1985) Removal of nitrate from ground water by ion exchange. 2nd phase: pilot scale and laboratory experiments. Report 64.90/500, Water Quality Institute Danish Academy of Technical Science (in Danish).
Anonymus (1987) Nitrates: A question of time? Wat. Qual. Int. 1, 24-28. Ballay, Martin, Sebillotte and Tricard (1985) Rapport Fran$ais les nitrates dans l'eau. Pro
ceedings of the congress "Nitrates in Water", SITE 85, Paris, 22-24 October, 1985. Barlog F. (1980) Nitrat im Trinkwasser: Ursachen und Probleml6sungen. Chem. Rdsch. 33, 3,
16. Beek C.G.E.M. van, Kooij D. van der, Noordam P.C. and Schippers J.C. (1984) Nitrate and
drinking water supply. Report 84, Dutch Waterworks Testing and Research Institute K.IWA (in Dutch).
Beek C.G.E.M. van, Boukes H., Rijsbergen D. van and Straatman R. (1988) The threat of the Netherlands waterworks by nitrate in the abstracted groundwater, as demonstrated on the well field Vierlingsbeek. Wat. Supply 6, 313-318.
Bennekom C.A. van, Dierx H.A.L. and Vriezen W.B. (1987) Waterquality in private wells with high nitrate concentrations. H-fi 20, 631-635 (in Dutch).
Beresford S.A.A. (1985) Is nitrate in the drinking water associated with the risk of cancer in the urban UK? Int. J. Epidemiol. 14, 57-63.
Bosman J. and Hendricks F. (1981) The technology and economics of the treatment of a concentrated nitrogenous industrial effluent by biological denitrification using a fluidised-bed reactor. In Biological Fluidised Bed Treatment of Water and Wastewater (Edited by Cooper P.F. and Atkinson B.), pp. 222-233. Ellis Horwood Publishers, Chichester.
Bruyn J. (1984) Ground water quality - manuring: Problems with nitrate in Eastern Gelder-land. H20 17, 502-505 (in Dutch).
Buelow R.W., Kropp K.L., Withered J. and Symons J.M. (1975) Nitrate removal by anion-ex-change resins. J. Am. Wat. Wks Ass. 67, 528-534.
Chalupa M. (1986) Information on national problems in connection with methods of removal of nitrates from drinking water in Czechoslovakia. Paper presented at the WHO Working Group on the Removal of Nitrates from Drinking Water, Budapest, 2-5 September, 1986.
Comly H.H. (1945) Cyanosis in infants caused by nitrates in well water. J. Am. Med. Ass. 129, 112-116.
Deguin A., Rouas P., Neveu A. and Gaspard M. (1978) Les nitrates dans l'eau potable-Differentes possibility de traitement - Resultats obtenus par echanges d'ions. J. Franc. d'Hydrologie 9, 77-90.
Deguin A. (1982) Elimination des nitrates par echange d'ions dans les eaux potables: Mise en equations du procede. Trib. Cebedeau 35, 35-41.
Dobias J., Stahl M. and Fleminger P. (1985) Vergleich gangiger Denitrifikationsverfahren fur Trinkwasser. Wasser und Boden no 10, 481-485.
Dries D., Liessens J., Verstraete W., Stevens P., Vos P. de and Ley J. de (1988) Nitrate removal from drinking water by means of hydrogenotrophic denitrifiers in a polyurethane carrier reactor. Wat. Supply 6, 181-192.

European Community (1980) Council directive of 15 July 1980 relating to the quality of water intended for human consumption, 80/778/EEC. Off. J. Eur. Comm. 23, L229, 11-29.
Forman D., Al-Dabbagh S. and Doll R. (1985) Nitrates, nitrites and gastric cancer in Great Britain. Nature 313, 620-625.
Francis C.W. and Malone CD. (1977) Anaerobic columnar denitrification of high nitrate wastewater. Prog. Wat. Technol. 8, 687-711.
Frank C. and Dott W. (1985) Nitratentfernung aus dem Trinkwasser mit Hilfe biologischer Denitrifikation. Vom Wass. 65, 287-295.
Fraser P., Chilvers C , Beral V. and Hill M.J. (1980) Nitrate and human cancer: A review of the evidence. Int. J. Epidemiol. 9, 3-11.
Frick B.R. and Richard Y. (1985) Ergebnisse und Erfahrungen mit der biologischen Denitrifikation in einem Wasserwerk. Vom Wass. 64, 145-154.
Fried J. (1985) Pollution of groundwater by nitrates. Paper presented at the Workshop on Groundwater Protection against Pollution by Nitrates, European Institute for Water, Va-resse, 3-5 July, 1985.
Furrer O.R. and Stauffer W. (1986) Stickstoff in der Landwirtschaft. Gas Wass. Abwass. 66, 460-472.
Gauntlett R.B. (1975) Nitrate removal from water by ion exchange. Wat. Treat. Exam. 24, 172-193.
Ginocchio J. (1980) Denitrifikation des Trinkwassers. Wasserwirtschaft 70, 397-401. Goodman A.H. (1975) Progress in methods of nitrate removal. Wat. Treat. Exam. 24, 157-171. Gros H., Ginocchio J.C. (1982) Denitrification d'une eau potable: Etude de 3 procedes a
l'echelle pilote. Wat. Supply 1, 24-26. Guilhem M. (1985) Nitrate reduction in potable water with Dowex ion exchange resins. Pro
ceedings of the congress "Nitrates in Water", SITE 85, Paris, 22-24 October, 1985. Guter G.A. (1982) Removal of nitrate from contaminated water supplies for public use.
Report EPA-600/2-82-042, US Environmental Protection Agency. Guter G.A. (1984) Removal of nitrates from contaminated water supplies using a tributyl
amine strong base anion exchange resin. United States Patent, Patent Number 4,479,877. Haberer K. (1984) Probleme und Mdglichkeiten der Nitrateliminierung bei der Trinkwasser-
aufbereitung. Gewdss. Wass. Abwass. 65, 733-753. Hall T. and Zabel T. (1984) Biological denitrification of potable water - Final report to the
department of the environment. Report 319-S/l, Water Research Centre. Hall T., Walker R.A. and Zabel T.F. (1985) Nitrate removal from drinking water - Process
selection and design. Proceedings of the congress "Nitrates in Water", SITE 85, Paris, 22-24 October, 1985.
Hall T. (1986) United Kingdom developments in nitrate removal from water supplies. Paper presented at the WHO Working Group on the Removal of Nitrates from Drinking Water, Budapest, 2-5 September, 1986.
Hiisvirta L.O. (1986) Survey on nitrate problems in Finland. Paper presented at the WHO Working Group on the Removal of Nitrates from Drinking Water, Budapest, 2-5 September, 1986.
Hijnen W.A.M., Koning D., Kruithof J.C. and Kooij D. van der (1988) The effect of bacteriological nitrate removal on the concentration of bacterial biomass and easily assimilable organic carbon compounds in ground water. Wat. Supply 6, 265-273.
Hoek J.P. van der (1987) Nitrate removal from groundwater. Proceedings of the Second European Conference on Environmental Technology, Amsterdam, 22-26 June, 1987 (Edited by Waal K..J.A. de and Brink W.J. van den), pp. 593-603. Martinus Nijhoff Publishers, Dordrecht.
Hoek J.P. van der and Klapwijk A. (1987) Nitrate removal from ground water. Wat. Res. 21, 989-997.
Holtmeier E.L. (1984) Der Schutz des Grundwassers vor Nitratbelastung. GWF-Wass. Abwass. 125, 482-487.
10

Jensen O.M. (1982) Nitrate in drinking water and cancer in Northern Jutland, Denmark, with special reference to stomach cancer. Ecoloxicol. Environ. Safety 6, 258-267.
Kruithof J.C., Paassen J.A.M. van, Hijnen W.A.M., Dierx H.A.L. and Bennekom C.A. van (1985) Experiences with nitrate removal in the Eastern Netherlands. Proceedings of the congress "Nitrates in Water", SITE 85, Paris, 22-24 October, 1985.
Kruithof J.C., Bennekom C.A. van, Dierx H.A.L., Hijnen W.A.M., Paassen J.A.M. and Schippers J.C. (1988) Nitrate removal from ground water by sulphur/limestone filtration. Wat. Supply 6, 207-217.
Kurt M., Denac M., Dunn I.J. and Bourne J.R. (1984) Denitrification of drinking water using hydrogen in a biological fluidized bed reactor. Proceedings of the Third European Congress on Biotechnology, Munchen, 10-14 September, 1984, Vol III pp. 163-168.
Kurt M., Dunn I.J. and Bourne J.R. (1987) Biological denitrification of drinking water using autotrophic organisms with H2 in a fluidized-bed biofilm reactor. Biotechnol. Bioengng 29, 493-501.
Lauch R.P. and Guter G.A. (1986) Ion exchange for the removal of nitrate from well water. J. Am. Wat. Wks Ass. 78, 83-88.
Leprince A. and Richard Y. (1982) La bio-technique au service de l'eau de consommation: Fiabilite et performance du traitement biologique des nitrates. Aqua 76, 455-462.
Lewandowski Z. (1982) Temperature dependency of biological denitrification with organic materials addition. Wat. Res. 16, 19-22.
Marsh T.J. (1980) Towards a nitrate balance for England and Wales. Wat. Serv. October 1980, 601-606.
Mecl R. (1986) Review on contamination with, and purification of drinking water from nitrate in Austria - State of the art and future aspects. Paper presented at the WHO Working Group on the Removal of Nitrates from Drinking Water, Budapest, 2-5 September, 1986.
Miller D.G. (1982) Nitrate in drinking water - A summary of the main technical and economic issues and the research requirements. Report 9-M/2, Water Research Centre.
Muller G. and Kilhn R. (1982) Trinkwasserhygienische Aspekte bei der Anwendung von Mi-kroorganismen bei der Trinkwasseraufbereitung. Mitt. Komm. Wasserforsch. Dtsch. For-schungsgem. 3, 215-218.
Muller U. (1981) Nitrat und seine Entfernung aus dem Trinkwasser - Eine Pilotanlage in Zollikofen bei Bern - Problemstellung, Anlass und Zielsetzung der Versuche. Schweiz. Ing. Archil. 40, 869.
Muller W.R. and Sperandio A. (1986) Der Einsatz zweier Kunststoffgranulate fur die Deni-trifikation in der biologischen Wasseraufbereitung. GWF-Wass. Abwass. Ill, 1-10.
Nilsson I., Ohlson S., Haggstr6m L., Molin N. and Mosbach K. (1980) Denitrification of water using immobilized Pseudomonas denitrificans cells. Eur. J. Appl. Microbiol. Biotechnol. 10, 261-274.
Nilsson I. and Ohlson S. (1982) Immobilized cells in microbial nitrate reduction. Appl. Bio-chem. Biotechnol. 7, 39-41.
Overath H., Hussmann A. and Haberer K. (1986) Biologische Nitratentfernung mit Thiobacil-lus denitrificans unter Verwendung von elementarem Schwefel auf Aktivkoks als Elektro-nendonator. Vom Wass. 66, 59-83.
Partos J. and Richard Y. (1985) Traitement de l'eau souterraine polluee par les nitrates. Wat. Supply 3, 75-92.
Philipot J.M. (1982) Une voi biologique pour la denitrification des eaux potables. Trib. Cebe-deau 35, 11-20.
Philipot J.M. and Larminat G. de (1988) Nitrate removal by ion exchange: the Ecodenit process, an industrial scale facility at Binic (France). Wat. Supply 6, 45-50.
Rang M.C. (1986) The undesired side effects of the Soil and Groundwater Conservation Act on nitrate leaching in the loess-covered hill area in Limburg. H^O 19, 552-556 (in Dutch).
Rautenbach R., Kopp W., Hellekes R., Peters R. and Opbergen G. van (1986) Separation of
11

nitrate from well water by membrane processes (reverse osmosis/electrodialysis reversal). Aqua no 5, 279-282.
Richard Y. and Leprince A. (1982) Pollution par les nitrates: traitements disponibles. Trib. Cebedeau 35, 21-33.
Roennefahrt K. (1985) Biotechnologische Nitratentfernung in Festbettreaktoren. Vom Wass. 65, 271-285.
Rordam E. (1985) Regulatory and financial actions. Paper presented at the Workshop on Groundwater Protection against Pollution by Nitrates, European Institute for Water, Va-resse, 3-5 July, 1985.
Scheltinga H.M.J. (1985) Nitrate problems in the Netherlands. Proceedings of the congress "Nitrates in Water", SITE 85, Paris, 22-24 October, 1985.
Schroder H., Harremoes P. and Simonsen J.F. (1985) Water pollution caused by nitrogen from urban wastewater and from agriculture. Proceedings of the congress "Nitrates in Water", SITE 85, Paris, 22-24 October, 1985.
Selenka F. (1986) Biological denitrification by in-situ treatment and by industrial plants-Methods used in Western Germany and their results. Paper presented at the WHO Working Group on the Removal of Nitrates from Drinking Water, Budapest, 2-5 September, 1986.
Sontheimer H., Cornell P., Fettig J. and Rohmann U. (1982) Grundwasserverunreinigung-Bedrohung fur die Offentliche Wasserversorgung? GWF-Wass. Abwass. 123, 521-530.
Sontheimer H and Rohmann U. (1984) Grundwasserbelastung mit Nitrat - Ursachen, Bedeu-tung, Ldsungswege. GWF-Wass. Abwass. 125, 599-608.
Sorg T.J. (1979) Nitrate removal from drinking water. Paper presented at EPA seminar on nitrates in groundwater, Kansas City Mo, 3-4 October, 1979.
Strobel L. and Kftnig F. (1985) Massnahmen in Bayern zur Verringerung der Nitratbelastung des Trinkwassers. GWF-Wass. Abwass. 126, 199-206.
Taylor N. (1975) Medical aspects of nitrate in drinking water. Wat. Treat. Exam. 24, 194-205. Timmermans P. and Van Haute A. (1983) Denitrification with methanol - Fundamental study
of the growth and denitrification capacity of Hyphomicrobium sp. Wat. Res. 17, 1249-1255. Trouwborst T. (1987) Groundwater pollutants and standards. HyO 20, 330-335 (in Dutch). Werkgroep Nitraatuitspoeling in Waterwingebieden (1985) Nitrate problems and ground water
abstractions in the Netherlands. Report 12, Institute for Land and Water Management Research ICW (in Dutch).
12

Appl Microbiol Biotechnol (1987) 27:199-205
CHAPTER 2
Applied „, Microbiology Biotechnology © Springer-Verlag 1987
Denitrification with methanol in the presence of high salt concentrations and at high pH levels
Jan Peter van der Hoek, Paul J. M. Latour, and Abraham Klapwijk
Wageningen Agricultural University, Department of Water Pollution Control, De Dreyen 12, 6703 BC Wageningen, The Netherlands
Summary. In the combined ion exchange/biological denitrification process for nitrate removal from ground water, in which nitrate is removed by ion exchange, the resins are regenerated in a closed circuit by a biological denitrification reactor. This denitrification reactor eliminates nitrate from the regenerant. Methanol is used as electron donor for biological denitrification. To obtain sufficient regeneration of the resins within a reasonable time, high NaCl or NaHC03 concentrations (10—30 g/1) in the regenerant are necessary. High NaHCO, concentrations affected the biological denitrification in three ways: a) a slight decrease in denitrification capacity (30%) was observed; b) the yield coefficient and CH3OH/ NO, ~-N ratio decreased. When high NaHCO, concentrations (above 10 g NaHC03/l) were used, the yield coefficient was 0.10—0.13 g VSS/g N03~-N and the CH 3 OH/N0 3 -N ratio was 2.00—2.03 g/g; c) high NaHCO, concentrations influenced nitrite production. Nitrite is an intermediate product of biological denitrification and with rising NaHCO, concentrations nitrite accumulation was suppressed. This was explained by the effect of high NaHCO, concentrations on the pH in the microenvironment of the denitrifying organisms. High NaCl concentrations also resulted in a slight decrease in denitrification capacity, but the second and third effects were not observed in the presence of high NaCl concentrations.
Although the pH in the regenerant will rise as a result of biological denitrification, the capacity of a denitrification reactor did not decrease significantly when a pH of 8.8—9.2 was reached.
Offprint requests to: J. P. van der Hoek
Introduction
Nitrate in ground water is becoming an important problem for many water supply companies in Europe. Increasing nitrate concentrations in ground water are a result of fertilization in agriculture. Both artificial fertilizer and animal manure cause nitrate problems (Bruyn 1984; Furrer and Stauffer 1986; Marsh 1980; Sontheimer and Rohmann 1984). At the same time, the maximum admissible concentration of nitrate in drinking water is being decreased from 22.6 to 11.3 mg N03~-N/1 accord ing to an E.C. Council Directive (European Community 1980). Therefore nitrate removal processes have to be applied at ground water stations (Richard and Leprince 1982; Sontheimer and Rohmann 1984; Partos and Richard 1985). Although only ion exchange and biological denitrification are currently considered practical and feasible for full scale treatment of drinking water, it is known that both processes have serious disadvantages (Van der Hoek and Klapwijk 1985).
These disadvantages can be avoided by combining the two processes into one (Van der Hoek and Klapwijk 1987). In this process nitrate is removed from ground water by ion exchange while regeneration of the resins is carried out by way of a biological denitrification reactor. The combined process is called "biological/physical chemical nitrate removal from ground water".
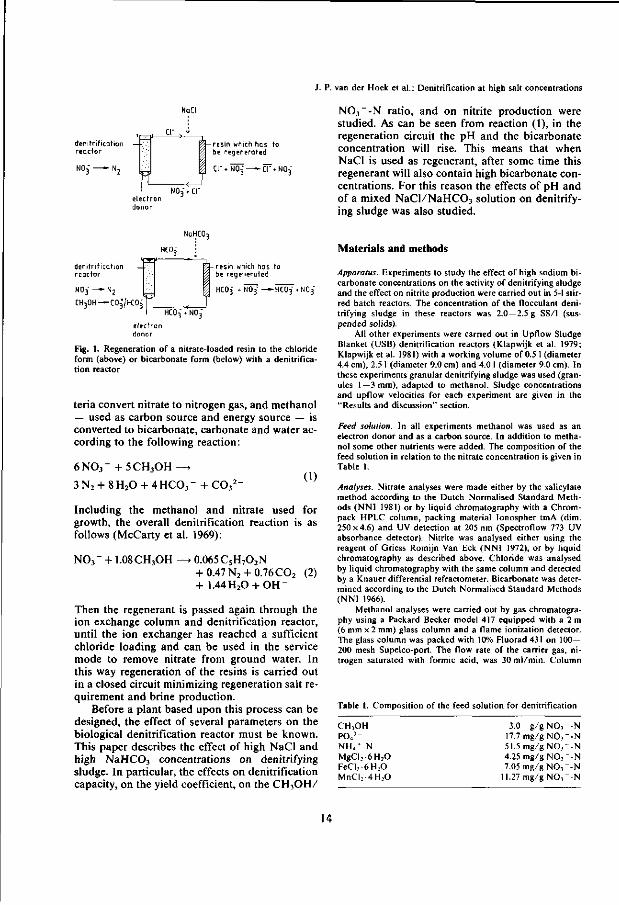
The regeneration procedure is schematically shown in Fig. 1. It can be carried out with a NaCl solution or with a NaHC03 solution as a regenerant. When NaCl is used, the regenerant passes over the nitrate-loaded ion exchange column to exchange nitrate ions for chloride ions. After having passed the ion exchange column the regenerant, now rich in nitrate, is led through a denitrification reactor. In this reactor the denitrifying bac-
J. P. van der Hoek et al.: Denitrification at high salt concentrations
NoCI
denitrification reactor
esin which has to be regenerated
> NO,' -
N03~-N ratio, and on nitrite production were studied. As can be seen from reaction (1), in the regeneration circuit the pH and the bicarbonate concentration will rise. This means that when NaCl is used as regenerant, after some time this regenerant will also contain high bicarbonate concentrations. For this reason the effects of pH and of a mixed NaCl/NaHC03 solution on denitrifying sludge was also studied.
denitrification reactor
CH3OH — C O J ' / H C O J T L
^ - resin which has to be regenerated
electron donor
Fig. 1. Regeneration of a nitrate-loaded resin to the chloride form (above) or bicarbonate form (below) with a denitrification reactor
teria convert nitrate to nitrogen gas, and methanol — used as carbon source and energy source — is converted to bicarbonate, carbonate and water according to the following reaction:
6NO3- + 5CH3OH—^
3N2 + 8H20 + 4HC0 3 - + C032 (1)
Including the methanol and nitrate used for growth, the overall denitrification reaction is as follows (McCarty et al. 1969):
N ( V + 1.08CH3OH • 0.065 C5H702N + 0.47N2 + 0.76CO2 (2) + 1.44H20 + OH
Then the regenerant is passed again through the ion exchange column and denitrification reactor, until the ion exchanger has reached a sufficient chloride loading and can be used in the service mode to remove nitrate from ground water. In this way regeneration of the resins is carried out in a closed circuit minimizing regeneration salt requirement and brine production.
Before a plant based upon this process can be designed, the effect of several parameters on the biological denitrification reactor must be known. This paper describes the effect of high NaCl and high NaHC03 concentrations on denitrifying sludge. In particular, the effects on denitrification capacity, on the yield coefficient, on the CH3OH/
Materials and methods
Apparatus. Experiments to study the effect of high sodium bicarbonate concentrations on the activity of denitrifying sludge and the effect on nitrite production were carried out in 5-1 stirred batch reactors. The concentration of the flocculant denitrifying sludge in these reactors was 2.0—2.5 g SS/1 (suspended solids).
All other experiments were carried out in Upflow Sludge Blanket (USB) denitrification reactors (Klapwijk et al. 1979; Klapwijk et al. 1981) with a working volume of 0.5 1 (diameter 4.4 cm), 2.5 I (diameter 9.0 cm) and 4.0 I (diameter 9.0 cm). In these experiments granular denitrifying sludge was used (granules 1 —3 mm), adapted to methanol. Sludge concentrations and upflow velocities for each experiment are given in the "Results and discussion" section.
Feed solution. In all experiments methanol was used as an electron donor and as a carbon source. In addition to methanol some other nutrients were added. The composition of the feed solution in relation to the nitrate concentration is given in Table 1.
Analyses. Nitrate analyses were made either by the salicylate method according to the Dutch Normalised Standard Methods (NNI 1981) or by liquid chromatography with a Chrom-pack HPLC column, packing material Ionospher tmA (dim. 250 x 4.6) and UV detection at 205 nm (Spectroflow 773 UV absorbance detector). Nitrite was analysed either using the reagent of Griess Romijn Van Eck (NNI 1972), or by liquid chromatography as described above. Chloride was analysed by liquid chromatography with the same column and detected by a Knauer differential refractometer. Bicarbonate was determined according to the Dutch Normalised Standard Methods (NNI 1966).
Methanol analyses were carried out by gas chromatography using a Packard Becker model 417 equipped with a 2 m (6 mm x 2 mm) glass column and a flame ionization detector. The glass column was packed with 10% Fluorad 431 on 100— 200 mesh Supelco-port. The flow rate of the carrier gas, nitrogen saturated with formic acid, was 30 ml/min. Column
Table 1. Composition of the feed solution for denitrification
CH_,OH 3.0 g/gNO,~-N P 0 4 ' - 17.7mg/gNO,--N NH„*-N 5l .5mg/gNO,--N MgCI;-6H20 4.25mg/gNO,--N FeCI, 6H,0 7 .05mg/gNO 3 -N MnCI-4H,0 11.27mg/gNO,--N
14

J. P. van der Hoek et al.: Denitrification at high salt concentrations
temperature was 90°C, detector temperature was I80°C and injection port temperature was 200°C.
Suspended solids (SS) and volatile suspended solids (VSS) were determined according to Standard Methods (American Public Health Association 1980).
Yield coefficient. The yield coefficient (g VSS/g NO,--N) was calculated from influent and effluent nitrate, nitrite and methanol concentrations of the USB denitrification reactor by expressing all concentrations as COD (chemical oxygen demand) and NOE (nitrate oxygen equivalent). A mass of NOE is the equivalent mass of oxygen that would accept as many electrons as the amount of nitrate during reduction to dini-trogen or to nitrite (Klapwijk et al. 1981). Then the sludge increment (expressed as COD) can be derived from the difference in COD removal and NOE removal, and as it was measured that I kg sludge VSS was equal to 1.52 kg COD, the sludge increment expressed as VSS can be calculated, and finally the yield coefficient expressed as g VSS/g N03~-N is known.
of high concentrations of nitrate, thiosulfate, sulphate and chloride on autotrophic denitrification. It was concluded that sodium chloride had no inhibitory effect up to 20 g/1. In a closed-system aquaculture for salmonid rearing, in which 95% to 100% of the purified culture water was recirculated to the fish-rearing tank, nitrate was removed from the water by biological denitrification. Fresh water denitrification columns adapted readily to artificial sea water with a salinity of 18 g/1 without observable inhibition (Balderston and McN. Sieburth 1976).
However, in another experiment a sudden increase in NaHC03 concentration from 0 to 40 g/1 resulted in a loss of denitrification capacity of almost 60% (results not shown).
Results and discussion
Effect of high sodium bicarbonate and sodium chloride concentrations on the capacity of denitrifying sludge
In Fig. 2 the effect of high sodium bicarbonate and sodium chloride concentrations (USB reactor upflow velocity 0.5 m/h, sludge concentration 36 g VSS/1) on the capacity of denitrifying sludge is shown. The pH of the NaCl solution was 7.6 and of the NaHC03 solution 8.3. Each salt concentration was maintained for a period of 6—8 days. With 30 g NaHC03/l the remaining capacity was 75%, and with 25 g NaCl/1 at first 40%, but after a period of three weeks it increased to 60%. This means that there is only slight inhibition. Claus and Kutzner (1985a) studied the effect
denitrif ication capacity ( % l
10 15 20 25
salt concentration ( g / l )
Fig. 2. Influence of sodium bicarbonate and sodium chloride on denitrification capacity (maximum capacity set to 100%). Arrow indicates increased capacity after three weeks of operation at 25 g NaCI/1
Effect of influent pH on the capacity of an USB denitrification reactor
Denitrification has been carried out at a wide range of pH values. Claus and Kutzner (1985b) described the denitrification of nitric acid with methanol as electron donor without neutralization at pH 5.8. The population growing under these conditions proved to be very effective in nitric acid removal. The optimal pH for denitrification with methanol by Hyphomicrobium spp. is 8.3 (Timmermans and Van Haute 1983).
To study the effect of influent pH on a continuous denitrification reactor, as used in the biological/physical chemical nitrate removal process, an USB denitrification reactor was run at different influent pH values (sludge concentration 32 g VSS/1, upflow velocity 1 m/h). Each experiment at a certain pH value lasted for 7—8 days. The capacity was measured as g N03~-N reduced perm3 reactor volume per hour. It was of special interest to measure the capacity at high pH values,
denitrification capacity lgN0,-N/ [m !h]) 500i — » ^
75 8.0 55 9.0 95 pH
Fig. 3. Influence of influent pH on the capacity of an USB denitrification reactor
15

because in the process the regenerant has a pH in the range of 8.8—9.2, as was measured in a pilot plant (Van der Hoek and Klapwijk 1987).
The results are presented in Fig. 3. The effluent pH ranged from 9.2 to 9.5. Although it is not possible to draw any conclusions about a pH optimum in the range of 8.0—8.5, it is clear that in the range of pH 8.8—9.2, which can be expected in the regeneration circuit in the biological/physical chemical nitrate removal process, the denitrifi-cation capacity is close to the maximum capacity of an USB denitrification reactor of 500 g N03~-N/(m3h), as reported by Klapwijk et al. (1979).
Effect of high NaCI and NaHC03 concentrations on the yield coefficient and CH,OH/N03-N ratio
An important aspect in the biological/physical chemical nitrate removal process is the amount of methanol which has to be injected into the regeneration circuit for the reduction of nitrate to nitrogen gas. It is also important to have a record of sludge production in the process. Although brine production is minimized by using a closed regeneration circuit, sludge will be produced as a result of the use of a biological denitrification reactor and disposal of this sludge may cause problems. McCarty et al. (1969) calculated that for the reduction of 1 g N0 3 - -N 2.47 g CH,OH is required and that the yield coefficient is 0.53 g VSS/g N03~-N. Other authors reported values that are close to these figures (Christensen and Harremoes 1975; Engberg and Schroeder 1975; Timmermans and Van Haute 1983; Claus and Kutzner 1985b).
To determine whether high NaCI concentrations or high NaHCO, concentrations affect the CH,OH/NO,~-N ratio and the yield coefficient, two USB denitrification reactors were run. In one reactor (sludge concentration 36 g VSS/1, upflow velocity 0.5 m/h) the NaCI concentration in the influent was step-wise increased, and in the other reactor (sludge concentration 53 g VSS/1, upflow velocity 0.1— 0.5 m/h) the NaHCO, concentrations in the influent was step-wise increased. Neither reactor was nitrate- or methanol-limited as the influent contained excess nitrate and methanol. The results are presented in Tables 2 and 3. It is clear that at high NaCI concentrations the yield coefficients and CH,OH/NO, ~-N ratios are in good agreement with the values reported in literature. However, when the NaHCO, concentration in the influent was increased, the CH,OH/ NO3-N ratio almost decreased to the stoichiom-
. P. van der Hoek et al.: Denitrification at high salt concentrations
Table 2. Effect of increasing NaCI influent concentrations on the yield coefficient and CH,OH/NO, -N ratio in an USB denitrification reactor
NaCI concentration influent (g/l)
Yield (g VSS/g NO.,
CH,OH/NO,--N -N) (g/g)
0 2.5 5.0
10.0 15.0 20.0 25.0
0.50 0.61 0.54 0.42 0.67 0.52 0.74
2.33 2.47 2.36 2.23 2.51 2.40 2.65
Table 3. Effect of increasing NaHCO, influent concentrations on the yield coefficient and CH,OH/NO,~-N ratio in an USB denitrification reactor
NaHCO, concentration influent (g/l)
Yield CH.OH/NO, -N (g VSS/gNO,--N) (g/g)
8.6 13.2 18.1
0.31 0.10 0.12
2.21 2.00 2.02
etric value of 1.90 (reaction 1). In accordance with this, the yield coefficient decreased to a very low value of 0.10-0.12 g VSS/g N03~-N.
Thus both sludge production in the USB denitrification reactor and the methanol consumption are very low when NaHCO, is used as regenerant. When NaCI is used as regenerant it is important to realize that within a short time the bicarbonate concentration will become high as a result of the biological activity in the denitrification reactor (see reaction 1). For this reason an investigation was made of how an USB denitrification reactor would respond when a high NaCI influent concentration was gradually changed to an influent with both NaCI and NaHCO,. This experiment was carried out in a USB denitrification reactor, working with an upflow velocity of 0.25 m/h and with a sludge concentration of 48 g VSS/1. The NaCI concentration and NaHCO, concentration in the influent was changed in such a way, that the total concentration expressed in mmol/1 remained the same. The results are presented in Table 4. After the NaHCO, influent concentration was raised to 4.8 g/l, also in this case the yield coefficient and CH,OH/NO,"-N ratio decreased to low values. An explanation for this phenomenon is currently not available. From the differences in the results presented in Tables 3 and 4 it is clear that there is no absolute relation between bicarbonate concentration and sludge yield.
16

J. P. van der Hoek et al.: Denitrification at high salt concentrations
Table 4 tion on
. Effect of a mixed Na C l / N a H C O , influent concentra-the yield coefficient and C H j O H / N O r - N
USB denitrification reactor
Influent salt concentration
NaCI
(g/D
18.4 16.6 15.6 15.0 12.4
N a H C O ,
(g/1)
0.0 2.5 4.8 7.1 9.6
Total (mmol/1)
315 314 324 341 326
Yield (g VSS/g N O , - - N )
0.51 0.56 0.31 0.21 0.13
ratio in an
C H , O H / N O ,
(g/g)
2.41 2.47 2.22 2.11 2.03
"-N
NO 1fr
14-
1?
10
8
6
L,
7
2~-N concentration
. •
• \
• \ \ \
( m g / l l
• ""\̂ *
• -—̂_«_
Effect of high sodium bicarbonate concentrations on nitrite production during biological denitrification
Nitrite production can be a serious problem in a biological denitrification process, especially in the case of drinking water treatment, because the maximum admissible concentration is only 0.1 mg N 0 2 / 1 (European Community 1980). When drinking water is treated directly by biological denitrification, often unacceptable nitrite concentrations have been observed in effluent water (Nils-son et al. 1980; Philipot 1982; Richard and Le-prince 1982; Kurt et al. 1984; Frick and Richard 1985; Philipot et al. 1985; Miiller and Sperandio 1986).
In all our experiments in which the effect of high NaHCO, concentrations on denitrification capacity, yield coefficient and C H , O H / N O , ~-N ratio was studied, an important effect of bicarbonate on nitrite production was observed. The maximum nitrite concentrations in the batch experiments in which the denitrification capacity was measured in the presence of high NaHCO, concentrations are presented in Fig. 4. The nitrite concentration in the effluent of the USB denitrification reactor in which the NaCI influent concentration was changed to a NaCl /NaHCO, mixture is shown in Table 5. It is clear that high NaHC0 3
concentrations result in reduced nitrite concentrations.
A possible explanation for the observed low nitrite concentrations in response to high bicarbonate concentrations in the feed may be a buffering effect of bicarbonate on the microenviron-ments of the denitrifying organisms. According to the investigations of Arvin and Kristensen (1982) higher pH values prevail in denitrifying biofilms when methanol or ethanol are used as substrates compared with the pH in the bulk solution. Arvin and Kristensen (1982) measured pH values inside
5 10 15 20 25 30 35
N0.HCO3 concentration ( g / l )
Fig. 4. Influence of sodium bicarbonate on nitrite concentrations observed in batch experiments during reduction of nitrate to nitrogen gas
Table 5. Effluent nitrite concentrations (mean and standard deviation) of an USB denitrification reactor in the presence of high NaHCO, concentrations
Salt concentration influent (g/l)
NaCI NaHCO,
Nitrite in effluent (mg NO,--N/l)
18.4 16.6 15.6 15.0 12.4
0.0 2.5 4.8 7.1 9.6
0.52±0.1I 0.36 ±0.04 0.19 ±0.07 0.15 ±0.03 0.06 ± 0.04
denitrifying biofilms up to 9.5 and a pH difference between the interior and surface of a denitrifying biofilm up to two pH units. Since the reduction of nitrite to nitrogen gas causes this pH rise, it is possible that this reaction is inhibited, resulting in nitrite accumulation. In the presence of high bicarbonate concentrations this pH rise will be buffered better, with the effect that this reaction is not inhibited. According to Arvin and Kristensen (1982), increased alkalinity in the bulk solution indeed decreases the pH difference between interior and surface of denitrifying biofilms.
This effect of NaHCO, was also seen in an experiment with an USB denitrification reactor (sludge concentration 30 g VSS/I, upflow velocity 1 m/h) shown in Fig. 5. The nitrite concentration in the effluent was very high, but after N aHC0 3
was added to the influent (10 g/l), the nitrite concentration in the effluent reduced to almost zero. Also the effluent nitrate concentration was reduced. Probably the high nitrite concentration be-
17

J. P. van der Hoek et al.: Denitrification at high salt concentrations
NOj-N and NCL,-N concentration (mg/t 1
20
10
00
SO
70
60
50
to
30
20
10-
mfluen
77 PH influent pH
8.6
start NaHCO, dosing 10 g/1
\ / mtluenf NO,-N
\ / \effluent N03-N
effluent N0;-N \ / \
Fig. 5. Effect of sodium bicarbonate dosing in the influent of an USB denitrification reactor on nitrite concentrations in the effluent
fore starting the NaHC03 dosage inhibited the denitrification process. Inhibition has already been measured above 30 mg N02~-N/1 (Klotter 1969).
Conclusions
The experiments discussed above have shown that the combined ion exchange/biological denitrification process is a feasible technique for nitrate removal from ground water. Denitrification is possible in the presence of 10—30 g/1 sodium chloride or sodium bicarbonate, which is required in the closed regeneration circuit. High pH values in the regeneration circuit will not inhibit the denitrification reactor severely. Waste production is minimal: firstly, brine production is low as a result of the closed regeneration circuit, and secondly, sludge production by the denitrification reactor is also low as a result of low sludge yield in the presence of high bicarbonate concentrations. The high bicarbonate concentration in the system suppresses nitrite accumulation. Nitrite production is one of the main problems of direct biological denitrification of ground water.
Acknowledgements. These investigations were supported by the Netherlands Technology Foundation (STW), the Ross-mark-Van Wijk and Boerma Water Treatment Ltd., the Ministry of Housing, Physical Planning and Environment, the Ministry of Economic Affairs and the Water Supply Company "Oostelijk Gelderland". The authors wish to thank Paul van der Yen for performing most of the analyses.
References
American Public Health Association (1980) Standard methods for the examination of waste and wastewater, 15th edn. APHA, New York
Arvin E, Kristensen GH (1982) Effect of denitrification on the pH in biofilms. Wat Sci Tech 14:833-848
Balderston WL, McN. Sieburth J (1976) Nitrate removal in a closed-system aquaculture by columnar denitrification. Appl Environ Microbiol 32:808 — 818
Bruyn J (1984) Ground water quality — manuring: problems with nitrate in Eastern Gelderland. HzO 17:502—505 (in Dutch)
Christensen MH, Harremoes P (1975) A literature review of biological denitrification of sewage. Proc IAWPR Conf on Nitrogen as a Water Pollutant, Copenhagen, August 18-20, Vol 3
Claus G, Kutzner HJ (1985a) Physiology and kinetics of autotrophic denitrification by Thiobacillus denitrificans. Appl Microbiol Biotechnol 22:283 — 288
Claus G, Kutzner HJ (1985b) Denitrification of nitrate and nitric acid with methanol as carbon source. Appl Microbiol Biotechnol 22:378-381
Engberg DJ, Schroeder ED (1975) Kinetics and stoichiometry of bacterial denitrification as a function of cell residence time. Water Res 9:105 I - 1054
European Community (1980) Council directive of 15 July 1980 relating to the quality of water intended for human consumption, 80/778/EEC. Official Journal of the European Community 23, L229:ll—29
Frick BR, Richard Y (1985) Ergebnisse und Erfahrungen mit der biologischen Denitrifikation in einem Wasserwerk. Vom Wasser 64:145-154
Furrer OJ, Stauffer W (1986) Stickstoff in der Landwirtschaft. Gas-Wasser-Abwasser 66:460—472
Hoek JP van der, Klapwijk A (1985) Nitrate removal from ground water. H,0 18:57—62 (in Dutch)
Hoek JP van der, Klapwijk A (1987) Nitrate removal from ground water. Accepted for publication in Water Res
Klapwijk A, Hoeven JCM van der, Lettinga G (1981) Biological denitrification in an upflow sludge blanket reactor. Water Res 15:1—6
Klapwijk A, Jol C, Donker HJGW (1979) The application of an upflow reactor in the denitrification step of biological sewage purification. Water Res 13:1009—1015
Klotter HE (1969) Moglichkeiten zur Denitrifikation von Grundwassern. Vom Wasser 36:93—140
Kurt M, Denac M, Dunn IJ, Bourne JR (1984) Denitrification of drinking water using hydrogen in a biological fluidized bed reactor. Proc third European Congress on Biotechnology, Munchen, September 10-14, Vol 111: 163-168
Marsh TJ (1980) Towards a nitrate balance for England and Wales. Water Serv October 1980:601-606
McCarty PL, Beck L, St. Amant PP(I969) Biological denitrification of agricultural wastewaters by addition of organic materials. Proc 24th Waste Conf, Purdue Univ Ext Ser 135:1271-1285
Muller WR, Sperandio A (1986) Der Einsatz zweier Kunst-stoffgranulate fur die Denitrification in der biologischen Wasseraufbereitung. GWF-Wasser/Abwasser 127:1 — 10
Nilsson I, Ohlson S, Haggstrom L, Molin N, Mosbach K (1980) Denitrification of water using immobilized Pseudo-monas denitrificans cells. Eur J Appl Microbiol Biotechnol 10:261-274
NNI (1966) Dutch normalised standard method NEN 1056 IV.6. Nederlands Normalisatie-lnstituut, Delft, the Netherlands

J. P. van der Hoek et al.: Denitrification at high salt concentrations
NNI (1972) Dutch normalised standard method NEN 3235 Richard Y, Leprince A (1982) Pollution par les nitrates: traite-6.3. Nederlands Normalisatie-Instituut, Delft, The Nether- ment disponibles. Trib Cebedeau 35:21—33 lands Sontheimer H, Rohmann U (1984) Grundwasserbelastung mit
NNI (1981) Dutch normalised standard method NEN 6440. Nitrat-Ursachen, Bedeutung, Losungswege. GWF-Wasser/ Nederlands Normalisatie-Instituut, Delft, The Nether- Abwasser 125:599—608 lands Timmermans P, Van Haute A (1983) Denitrification with me-
Partos J, Richard Y (1985) Traitement de l'eau souterraine pol- thanol — Fundamental study of the growth and denitrifi-luee par les nitrates. Wat Supply 3:75—92 cation capacity of Hyphomkrobium sp. Water Res
Philipot JM (1982) Une voie biologique pour la denitrification 17:1249—1255 des eaux potables. Trib Cebedeau 35:11 — 20
Philipot JM, Chaffange F, Pascal O (1985) Denitrification biologique: le point sur un an de fonctionnement de la station d'Eragny. Wat Supply 3:93-98 Received January 23, 1987/Revised April 29, 1987
19

CHAPTER 3
EFFECT OF HYDRAULIC RESIDENCE TIME ON MICROBIAL SULFIDE PRODUCTION IN AN UPFLOW SLUDGE BLANKET DENITRIFICATION
REACTOR FED WITH METHANOL
J.P. van der Hoek, P.J.M. Latour and A. Klapwijk
Accepted for publication in Applied Microbiology and Biotechnology
SUMMARY
In the combined ion exchange/biological denitrification process for nitrate removal from ground water anion exchange resins are regenerated in a closed circuit by way of an upflow sludge blanket denitrification reactor. The regenerant (a concentrated sodium bicarbonate solution) is recirculated through the ion exchanger in the regeneration mode and the denitrification reactor. In the closed system sulfate accumulates to very high concentrations. For that reason it was examined under what process conditions sulfate reduction occurs in an upflow sludge blanket denitrification reactor, when the influent contains high sulfate concentrations (5.45 g SOf/l) and high sodium bicarbonate concentrations (19.8 g NaHCOj/l) in addition to nitrate and methanol. It appeared that at a hydraulic residence time of 5 h sulfide production started, when the nitrate loading rate was 20% of the denitrification reactor capacity and methanol was added in excess. The excess of methanol was converted into acetate after nitrate was depleted. Conversion of methanol into acetate was a function of the hydraulic residence time. At hydraulic residence times above 8 h this conversion was complete. Also in batch experiments it was observed that excess of methanol was converted into acetate, and that sulfate reduction started when nitrate was depleted. From all experiments it is clear that, provided that methanol is added in good relation to the quantity of nitrate that has to be denitrified, acetate will not be produced and sulfate reduction will not occur in the denitrification reactor, even in the presence of very high sulfate concentrations.
INTRODUCTION
In the combined ion exchange/biological denitrification process for nitrate removal from ground water nitrate is removed by ion exchange while regeneration of the resins is carried out in a closed system by an upflow sludge blanket (USB) denitrification reactor (Van der Hoek and Klapwijk 1987). This biological denitrification reactor eliminates nitrate from the regenerant, so that it can be used again and has not to be disposed. Regeneration of the ion exchange resins in a closed system results in a low regeneration salt requirement and brine production.
The regenerant contains a high sodium chloride or sodium bicarbonate concentration. The effects of these high concentrations on biological denitrification have been described previously (van der Hoek et al. 1987). Besides high sodium chloride or sodium bicarbonate concentrations the regenerant also contains a high sulfate concentration. In addition to nitrate the ion exchange resins remove sulfate from the ground water too, and during regeneration this is easily removed from the resin into the regenerant. As the regeneration takes place in a closed system, sulfate accumulates.
In pilot plant experiments with the combined process sulfate accumulated up to 2 g
21
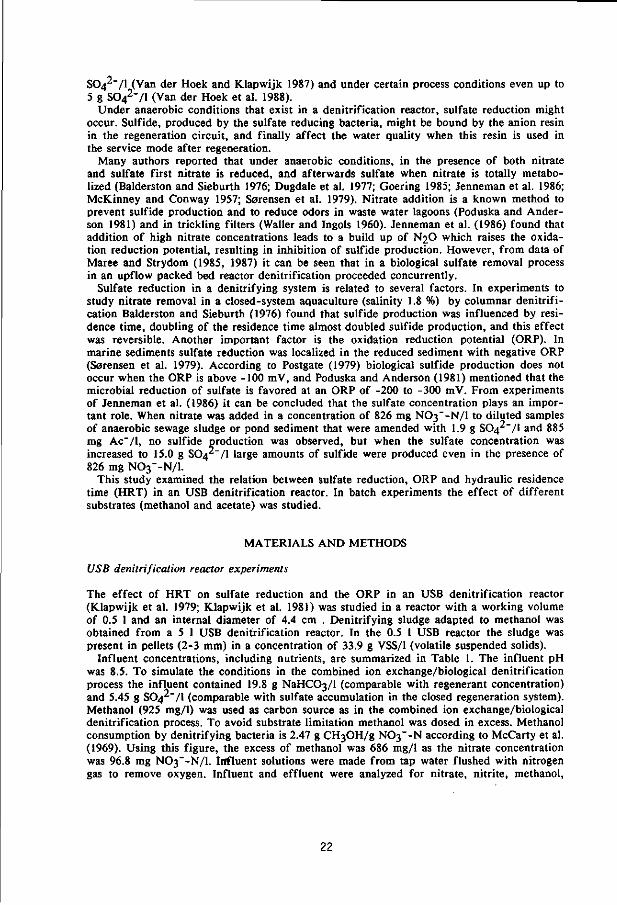
SO4 /l (Van der Hoek and Klapwijk 1987) and under certain process conditions even up to 5 g S042"/l (Van der Hoek et al. 1988).
Under anaerobic conditions that exist in a denitrification reactor, sulfate reduction might occur. Sulfide, produced by the sulfate reducing bacteria, might be bound by the anion resin in the regeneration circuit, and finally affect the water quality when this resin is used in the service mode after regeneration.
Many authors reported that under anaerobic conditions, in the presence of both nitrate and sulfate first nitrate is reduced, and afterwards sulfate when nitrate is totally metabolized (Balderston and Sieburth 1976; Dugdale et al. 1977; Goering 1985; Jenneman et al. 1986; McKinney and Conway 1957; Sorensen et al. 1979). Nitrate addition is a known method to prevent sulfide production and to reduce odors in waste water lagoons (Poduska and Anderson 1981) and in trickling filters (Waller and Ingols 1960). Jenneman et al. (1986) found that addition of high nitrate concentrations leads to a build up of N2O which raises the oxidation reduction potential, resulting in inhibition of sulfide production. However, from data of Maree and Strydom (1985, 1987) it can be seen that in a biological sulfate removal process in an upflow packed bed reactor denitrification proceeded concurrently.
Sulfate reduction in a denitrifying system is related to several factors. In experiments to study nitrate removal in a closed-system aquaculture (salinity 1.8 %) by columnar denitrification Balderston and Sieburth (1976) found that sulfide production was influenced by residence time, doubling of the residence time almost doubled sulfide production, and this effect was reversible. Another important factor is the oxidation reduction potential (ORP). In marine sediments sulfate reduction was localized in the reduced sediment with negative ORP (Sorensen et al. 1979). According to Postgate (1979) biological sulfide production does not occur when the ORP is above -100 mV, and Poduska and Anderson (1981) mentioned that the microbial reduction of sulfate is favored at an ORP of -200 to -300 mV. From experiments of Jenneman et al. (1986) it can be concluded that the sulfate concentration plays an important role. When nitrate was added in a concentration of 826 mg N03~-N/l to diluted samples of anaerobic sewage sludge or pond sediment that were amended with 1.9 g S042"/l and 885 mg Ac"/1, no sulfide production was observed, but when the sulfate concentration was increased to 15.0 g S042"/l large amounts of sulfide were produced even in the presence of 826 mg NO3--N/I.
This study examined the relation between sulfate reduction, ORP and hydraulic residence time (HRT) in an USB denitrification reactor. In batch experiments the effect of different substrates (methanol and acetate) was studied.
MATERIALS AND METHODS
USB denitrification reactor experiments
The effect of HRT on sulfate reduction and the ORP in an USB denitrification reactor (Klapwijk et al. 1979; Klapwijk et al. 1981) was studied in a reactor with a working volume of 0.5 1 and an internal diameter of 4.4 cm . Denitrifying sludge adapted to methanol was obtained from a 5 1 USB denitrification reactor. In the 0.5 1 USB reactor the sludge was present in pellets (2-3 mm) in a concentration of 33.9 g VSS/1 (volatile suspended solids).
Influent concentrations, including nutrients, are summarized in Table 1. The influent pH was 8.5. To simulate the conditions in the combined ion exchange/biological denitrification process the influent contained 19.8 g NaHC03/l (comparable with regenerant concentration) and 5.45 g S042~/l (comparable with sulfate accumulation in the closed regeneration system). Methanol (925 mg/1) was used as carbon source as in the combined ion exchange/biological denitrification process. To avoid substrate limitation methanol was dosed in excess. Methanol consumption by denitrifying bacteria is 2.47 g CH30H/g N03~-N according to McCarty et al. (1969). Using this figure, the excess of methanol was 686 mg/1 as the nitrate concentration was 96.8 mg N03~-N/l. Influent solutions were made from tap water flushed with nitrogen gas to remove oxygen. Influent and effluent were analyzed for nitrate, nitrite, methanol,
22

acetate, sulfide, chemical oxygen demand (COD) and pH. The ORP was monitored in the reactor continuously by a platinum electrode.
Table 1. Influent concentrations of the USB deni t r i f icat ion reactor and i n i t i a l concen
trations in batch experiments
NOj'-N (mg/l)
CH3OH (mg/l>
Ac" (mg/l)
S042" (g/l>
NaHCOj (g/l)
Na2HP04 (mg/l)
NH4Cl (mg/l)
MgCl2.6H20 (mg/l)
FeCl3.6H20 (mg/l)
MnCl2.4H20 (mg/l)
CaCl2.2H20 (mg/l)
CoCl2 (mg/l)
CuS04 (mg/l)
ZnS04 (mg/l)
influent of the USB
denitrification
reactor
96.8
925
-5.45
19.8
8.11
19.12
1.46
2.43
3.88
0.130
0.149
0.178
0.214
initial concentrations
reactor 1
82.6
806
-5.46
17.5
8.11
19.12
1.46
2.43
3.88
0.130
0.149
0.178
0.214
in batch experiments
reactor 2
18.0
422
596
5.46
17.5
8.11
19.12
1.46
2.43
3.88
0.130
0.149
0.178
0.214
Batch experiments
To study the effect of methanol and acetate on sulfate reduction batch experiments were performed with two stirred reactors. In batch reactor 1, with a volume of 1.5 1, methanol was used as substrate. In batch reactor 2, with a volume of 0.5 1, methanol + acetate were used as substrates in equal concentrations expressed as COD.
Denitrifying sludge was obtained from the USB denitrification reactor described above. In reactor 1 the sludge concentration was 9.0 g VSS/1 and in reactor 2 8.5 g VSS/1. In both reactors bicarbonate was present at a concentration of 17.5 g/l and sulfate at a concentration of 5.46 g/l to simulate the conditions in the combined ion exchange/biological denitrification process. Anaerobic conditions were maintained by using gas-tight reactors and by replacing the air above the liquid surface with 02-free nitrogen gas.
After addition of nitrate and methanol, or nitrate and methanol + acetate, the course of nitrate, nitrite, methanol, acetate and sulfide concentrations were followed. Table 1 summarizes the concentrations in both reactors at the start of the experiments.
Analyses
Acetate was analyzed by gas chromatography using a Packard Becker model 417 equipped with a 2 m (2 mm x 2 mm) glass column and a flame ionization detector. The glass column was packed with 10% Fluorad 431 on 100-200 mesh Supelco-port. The flow rate of the carrier gas, nitrogen saturated with formic acid, was 30 ml/min. The column temperature was 130 °C, the detector temperature 280 °C and the injection port temperature 190 °C. Sulfide was measured colorimetrically by the method of Truper and Schlegel (1964). Chemical oxygen demand (COD) was determined according to Standard Methods (American Public Health
23

Association 1980). The oxidation reduction potential (ORP) was measured using a platinum redox electrode and a millivolt meter, connected with a recorder.
All other analyses were carried out as described previously (Van der Hoek and Klapwijk 1987; Van der Hoek et al. 1987).
Temperature
All experiments were performed at a temperature of 21-22 °C.
RESULTS
USB denitrification reactor experiments
Figure 1 shows the ORP and effluent nitrate, methanol, acetate and sulfide concentrations at different HRT. Nitrite concentrations were always below 0.11 mg NC>2~-N/1. Effluent pH ranged from 8.2 to 8.5 over the course of the experiment (average value 8.4). At a HRT of 0.69 h (flow rate 0.72 1/h) the nitrate removal was 64.6 mg NC>3~-N/1. With a sludge volume of 0.42 1 in the reactor the denitrification capacity is 111 mg NC>3~-N/(l-h). This means that nitrate will be depleted at a HRT of approximately 1 h. The methanol-COD removal rate by denitrification is 352 mg COD/(lh) at a HRT of 0.69 h.
> -200 e
4 6 8 10 12
hydraulic residence time(h )
Fig. 1. Effect of hydraulic residence time in the USB denitrification reactor on
effluent nitrate, sulfide, methanol, and acetate concentrations, and oxidation
reduction potential
24

From Fig. 1 it is clear that sulfide production as a result of sulfate reduction starts at a HRT of 5 h, when nitrate is not any more present in the effluent. At a HRT of 5 h the nitrate loading rate is 23 mg NC>3"-N/(l-h) and the methanol-COD loading rate is 330 mg COD/(l-h). Thus, sulfide production started when the nitrate loading rate was approximately 20% of the denitrification reactor capacity.
Increasing the HRT above 1 h still resulted in a further decrease of methanol, although nitrate was already completely converted into nitrogen gas, and an increase of acetate concentrations. The effect of the HRT on acetate concentrations turned out to be reversible: both increasing and decreasing the HRT gave the same course of acetate concentrations as shown in Fig. 1.
From a COD balance over the reactor, calculated from the influent methanol concentration in Table 1 and the effluent methanol, acetate and sulfide concentrations in Fig. 1, and from the fact that in the presence of high alkalinity the reduction of 1 mg NC>3"-N requires 2.02 mg CH3OH equal to 3.03 mg COD (Van der Hoek et al. 1987), it is clear that at all HRTs the effluent contained only methanol and acetate as organic compounds and that no other volatile fatty acids were present. The influent methanol concentration was 925 mg/1 equal to 1388 mg COD/1, while the sum of the effluent COD concentration and the methanol-COD used for denitrification was 1378 mg COD/1, 1356 mg COD/1, 1271 mg COD/1, 1361 mg COD/1, 1421 mg COD/1 and 1419 mg COD/1 at HRT of 0.69 h, 2.36 h, 4.17 h, 6.94 h, 8.62 h and 11.63 h respectively. This indicates that methanol was converted into acetate without other products.
t ime ( h
Fig. 2. Concentrations of nitrate, sulfide, methanol and acetate in batch reactor
1, fed with methanol
25
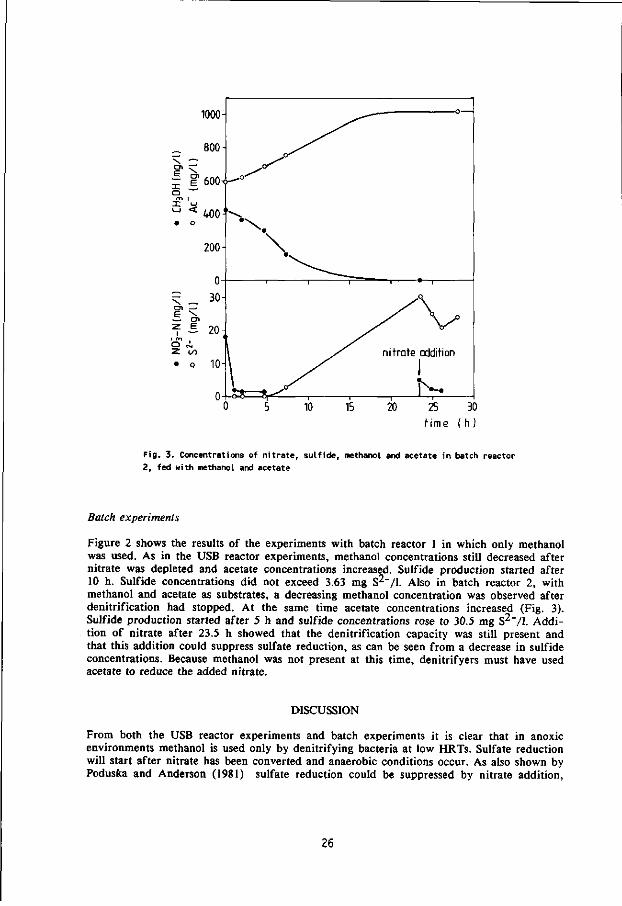
1000-
_ 800-
| E 6 0 0 , o m I X u ° < 400J
• o
200-
0 ? _ 30-en - -
=7 £ 20-i *-«
o ^ 2 00
• Q 10 "
0-
— 0 ^ sS*
\
\ \
>-o-o
\
1 1
J>
1 ' 1 • - 1
y\ / ° \ ^
/ nitrate addition
I -, , 1>
0 5 10 15 20 25 30
t ime ( h)
Fig. 3. Concentrations of nitrate, sulfide, methanol and acetate in batch reactor 2, fed with methanol and acetate
Batch experiments
Figure 2 shows the results of the experiments with batch reactor 1 in which only methanol was used. As in the USB reactor experiments, methanol concentrations still decreased after nitrate was depleted and acetate concentrations increased. Sulfide production started after 10 h. Sulfide concentrations did not exceed 3.63 mg S2"/l. Also in batch reactor 2, with methanol and acetate as substrates, a decreasing methanol concentration was observed after denitrification had stopped. At the same time acetate concentrations increased (Fig. 3). Sulfide production started after 5 h and sulfide concentrations rose to 30.5 mg S2"/l. Addition of nitrate after 23.5 h showed that the denitrification capacity was still present and that this addition could suppress sulfate reduction, as can be seen from a decrease in sulfide concentrations. Because methanol was not present at this time, denitrifyers must have used acetate to reduce the added nitrate.
DISCUSSION
From both the USB reactor experiments and batch experiments it is clear that in anoxic environments methanol is used only by denitrifying bacteria at low HRTs. Sulfate reduction will start after nitrate has been converted and anaerobic conditions occur. As also shown by Poduska and Anderson (1981) sulfate reduction could be suppressed by nitrate addition,
26

clearly visible in Fig. 3. Addition of a small amount of nitrate resulted in a decrease of sulfide concentrations in the batch experiments. The ORP in our experiments at which sulfate reduction started is low as compared with values given by Postgate (1979) and Po-duska and Anderson (1981) (from -100 to -300 mV). In our experiments denitrification coincided with an ORP of 0 to -350 mV. Then the ORP decreased to a value of -480 mV at which sulfate reduction started (Fig. 1). In a nitrate-limited chemostat culture Claus and Kutzner (1985) also found an ORP of -340 to -370 mV at which denitrification took place.
In all experiments the use of methanol continued even after nitrate was completely metabolized. At the same time acetate concentrations increased. It is clear that methanol is converted into acetate. From the results of the USB reactor experiments it can be concluded that the conversion of methanol into acetate proceeds without production of other fatty acids, because the effluent COD was determined by methanol and acetate concentrations in the effluent only. Adamse and Velzeboer (1982) have isolated an acetic acid producing Clostridium strain that converted methanol into acetate only when a suitable amount of NaHCOj was available. This conversion could be expressed by the equation
4CH3OH + 2HC03- * 3CH 3 OXr + H+ + 4H20 [1]
In the USB reactor experiments NaHC03 was present at a concentration of 19.8 g/1 to simulate the conditions of the biological regeneration procedure of the resins. We strongly have the opinion that the above described conversion took place in the USB reactor experiments and batch experiments. For the USB reactor experiments this can be calculated as follows:
The denitrifying bacteria use methanol in a ratio of 2.02 g CH^OH/g N03~-N in the presence of high alkalinity (Van der Hoek et al. 1987). Thus, reduction of 96.8 mg N03~-N/l requires 195.5 mg CH3OH/I. This means that after complete denitrification still 729.5 mg CH3OH/I is present because the influent contained 925 mg CH3OH/I. According to reaction [1] 1008.8 mg Ac"/1 can be produced from 729.5 mg CH3OH/I, and this is in very good accordance with the observed acetate concentration at a HRT above 8 h, shown in Fig. 1.
In the anaerobic treatment of methanolic wastes it is known that methanol is partly converted directly into methane and partly via the intermediate formation of volatile fatty acids, mainly consisting of acetic acid and butyric acid (Lettinga et al. 1979; Lettinga et al. 1981). Especially the HCO3" concentration played an important role in the formation of acetic acid from methanol.
When we used sucrose instead of methanol in the batch experiments denitrification still took place, but the excess of sucrose did not decrease while no acetate was formed (data not shown). This also supports the conclusion that in all other experiments indeed conversion of methanol into acetate took place.
From Fig. 1 it can be concluded that the HRT plays an important role in this conversion. Only at a HRT above 8 h complete conversion took place. It might be possible that the bacteria responsible for the conversion are not capable to adhere to the pelletized denitrifying sludge, and will be washed out of the reactor at a HRT below 8 h. Isa et al. (1986) observed a same phenomenon for sulfate reducing bacteria in a high-rate anaerobic reactor with reticulated polyurethane sponges as carrier material for the microorganisms.
In all experiments in which sulfate reduction took place both methanol and acetate were present when sulfide production started. This means that one of these must have been used as substrate by the sulfate reducing bacteria. Both sulfate reduction with acetate and methanol have been reported in literature. King et al. (1983) described sulfate reduction in marine sediments with both methanol and acetate. However, Oremland and Polcin (1982) and Orem-land et al. (1982) found that in estuarine sediments sulfate reduction was stimulated by acetate but not by methanol. In anaerobic marine sediments Sorensen et al. (1981) found that acetate is a major substrate for the sulfate reducing bacteria in the sediment and may account for 50% of the electron donors for the process. Pfennig and Widdel (1981) isolated sulfate reducing bacteria with acetate from anaerobic marine and brackish water. Also Jenneman et al. (1986) reported sulfate reduction with acetate. In experiments of Balderston
27
and Sieburth (1976) sulfate reduction occurred in a denitrification column for nitrate removal in a closed-system aquaculture when methanol was used as exogenous carbon source.
In our experiments sulfate reduction with acetate has not been demonstrated conclusively. However, acetate concentrations played an important role in all experiments. When methanol was not present any more, sulfide production proceeded, suggesting that acetate was used by sulfate reducing bacteria. Especially in Fig. 2 this is visible. Unfortunately, due to the low sulfide production with concomitant low acetate oxidation, no significant change in acetate concentrations could be measured in the 30-120 h range in Fig. 2. In a batch reactor fed with excess sucrose accumulation of acetate did not occur and sulfate reduction was not observed (data not shown).
Although sulfate reduction may have taken place with acetate it is not understood from these experiments why it started only when acetate concentrations had reached a value of at least 300-800 mg/1, especially when this value is compared with the half-saturation constant K m for acetate uptake by sulfate reducing bacteria. Ingvorsen et al. (1984) measured a K m value of 4.1 mg Ac"/1 in chemostat cultures, and Schdnheit et al. (1982) determined a K m of 13.6 mg Ac"/1 for batch grown cultures. Another unanswered question is the low sulfide concentration that was observed, even after sulfate reduction had started. In the USB reactor experiments it might be possible that wash-out of the sulfate reducing bacteria from the reactor at the used HRT could be the basis of restricted sulfate reduction. This was noticed by Isa et al. (1986). However, also in batch experiments sulfide production started only after nitrate was depleted for 5 h, and sulfide concentrations did not rise above 30.5 mg S2"/l (Fig. 3).
CONCLUSIONS
In an USB denitrification reactor fed with methanol as carbon and energy source, the presence of high sulfate concentrations in the influent does not result in sulfide production when methanol is added in good relation to the amount of nitrate that has to be denitrified. Only excess of methanol can result in sulfate reduction when nitrate is completely denitrified and the excess of methanol has been converted into acetate.
Therefore, the combined ion exchange/biological denitrification process for nitrate removal from ground water can be operated with very high sulfate concentrations in the closed regeneration circuit, because under normal process conditions there is no risk of sulfide production in the denitrification reactor with concomitant adsorption of sulfide by the ion exchange resins during regeneration.
ACKNOWLEDGEMENTS
These investigations were supported by the Netherlands Technology Foundation (STW); Rossmark-Van Wijk & Boerma Water Treatment Ltd.; the Ministry of Housing, Physical Planning and Environment; the Ministry of Economic Affairs and the Water Supply Company "Oostelijk Gelderland".
REFERENCES
Adamse AD, Velzeboer CTM (1982) Features of a Clostridium, strain CV-AA1, an obligatory anaerobic bacterium producing acetic acid from methanol. Antonie van Leeuwenhoek J Microbiol 48:305-313
American Public Health Association (1980) Standard methods for the examination of waste and wastewater, 15th edn. APHA, New York
Balderston WL, McN.Sieburth J (1976) Nitrate removal in a closed-system aquaculture by columnar denitrification. Appl Environ Microbiol 32:808-818
28
Claus G, Kutzner HJ (1985) Denitrification of nitrate and nitric acid with methanol as carbon source. Appl Microbiol Biotechnol 22:378-381
Dugdale RC, Goering JJ, Barber RT, Smith RL, Packard TT (1977) Denitrification and hydrogen sulfide in the Peru up welling region during 1976. Deep Sea Res 24:601-608
Goering JJ (1985) Marine denitrification. In: Golterman HL (ed) Denitrification in the nitrogen cycle. Plenum Press, New York, p 191
Hoek JP van der, Klapwijk A (1987) Nitrate removal from ground water. Water Res 21:989-997
Hoek JP van der, Latour PJM, Klapwijk A (1987) Denitrification with methanol in the presence of high salt concentrations and at high pH levels. Appl Microbiol Biotechnol 27: 199-205
Hoek JP van der, Ven PJM van der, Klapwijk A (1988) Combined ion exchange/biological denitrification for nitrate removal from ground water under different process conditions. Water Res (in press)
Ingvorsen K, Zehnder AJB, J0rgensen BB (1984) Kinetics of sulfate and acetate uptake by Desulfobacter postgatei. Appl Environ Microbiol 47:403-408
Isa Z, Grusenmeyer S, Verstraete W (1986) Sulfate reduction relative to methane production in high-rate anaerobic digestion: microbiological aspects. Appl Environ Microbiol 51:580-587
Jenneman GE, Mclnerney MJ, Knapp RM (1986) Effect of nitrate on biogenic sulfide production. Appl Environ Microbiol 51:1205-1211
King GM, Klug MJ, Lovley DR (1983) Metabolism of acetate, methanol, and methylated amines in intertidal sediments of Lowes Cove, Maine. Appl Environ Microbiol 45:1848-1853
Klapwijk A, Hoeven JCM van der, Lettinga G (1981) Biological denitrification in an upflow sludge blanket reactor. Water Res 15:1-6
Klapwijk A, Jol C, Donker HJGW (1979) The application of an upflow reactor in the denitrification step of biological sewage purification. Water Res 13:1009-1015
Lettinga G, Geest Th van der, Laan J van de (1979) Anaerobic treatment of methanolic wastes. Water Res 13:725-737
Lettinga G, Zeeuw W de, Ouborg E (1981) Anaerobic treatment of wastes containing methanol and higher alcohols. Water Res 15:171-182
Maree JP, Strydom WF (1985) Biological sulphate removal in an upflow packed bed reactor. Water Res 19:1101-1106
Maree JP, Strydom WF (1987) Biological sulphate removal from industrial effluent in an upflow packed bed reactor. Water Res 21:141-146
McCarty PL, Beck L, St.Amant PP (1969) Biological denitrification of agricultural wastewaters by addition of organic materials. Proc 24th Waste Conf, Purdue Univ Ext Ser 135: 1271-1285
McKinney RE, Conway RA (1957) Chemical oxygen in biological waste treatment. Sewage Ind Wastes 29:1097-1106
Oremland RS, Marsh LM, Polcin S (1982) Methane production and simultaneous sulphate reduction in anoxic, salt marsh sediments. Nature 296:143-145
Oremland RS, Polcin S (1982) Methanogenesis and sulfate reduction: competitive and noncompetitive substrates in estuarine sediments. Appl Environ Microbiol 44:1270-1276
Pfennig N, Widdel F (1981) Ecology and physiology of some anaerobic bacteria from the microbial sulfur cycle. In: Bothe H, Trebst A (eds) Biology of inorganic nitrogen and sulphur. Springer, Berlin, p 169
Poduska RA, Anderson BD (1981) Successful storage lagoon odor control. J Water Pollut Control Fed 53:299-310
Postgate JR (1979) The sulphate-reducing bacteria. Cambridge University Press, Cambridge SchSnheit P, Kristjansson JK, Thauer RK (1982) Kinetic mechanism for the ability of sulfate
reducers to outcompete methanogens for acetate. Arch Microbiol 132:285-288 Sorensen J, Jorgensen BB, Revsbech NP (1979) A comparison of oxygen, nitrate, and sulfate
respiration in coastal marine sediments. Microb Ecol 5:105-115 Sorensen J, Christensen D, Jorgensen BB (1981) Volatile fatty acids and hydrogen as sub-
29

strates for sulfate-reducing bacteria in anaerobic marine sediments. Appl Environ Microbiol 42:5-11
Truper HG, Schlegel HG (1964) Sulphur metabolism in Thiorhodaceae. 1. Quantitative measurement on growing cells of Chromatium okenii. Antonie van Leeuwenhoek J Microbiol 30:225-238
Waller LE, Ingols RS (1960) How nitrates reduced odors in flooded trickling filters. Wastes Eng 31:258-259
30
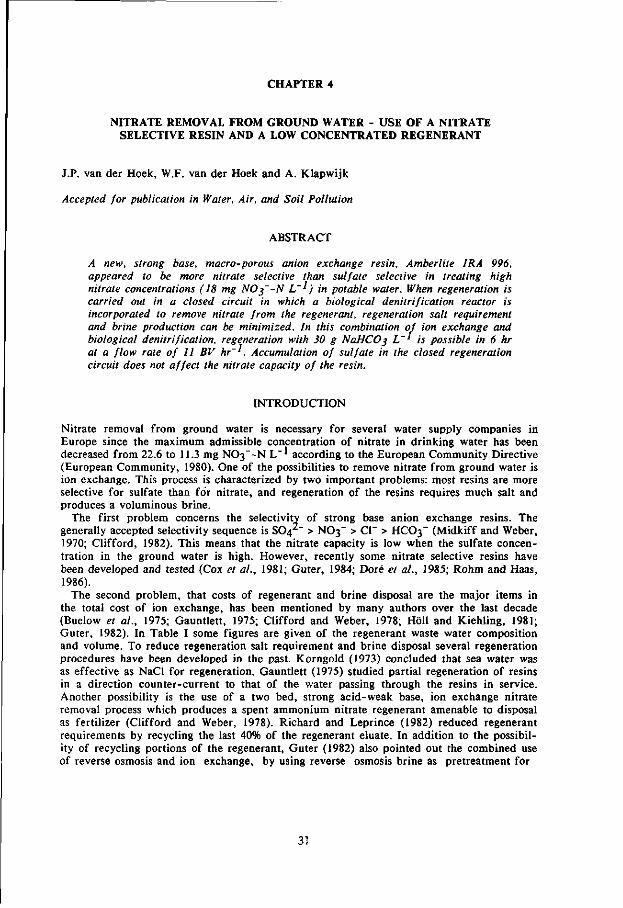
CHAPTER 4
NITRATE REMOVAL FROM GROUND WATER - USE OF A NITRATE SELECTIVE RESIN AND A LOW CONCENTRATED REGENERANT
J.P. van der Hoek, W.F. van der Hoek and A. Klapwijk
Accepted for publication in Water, Air, and Soil Pollution
ABSTRACT
A new, strong base, macro-porous anion exchange resin, Amberlite IRA 996, appeared to be more nitrate selective than sulfate selective in treating high nitrate concentrations (18 mg NOj'-N L~') in potable water. When regeneration is carried out in a closed circuit in which a biological denitrification reactor is incorporated to remove nitrate from the regenerant, regeneration salt requirement and brine production can be minimized. In this combination of ion exchange and biological denitrification, regeneration with 30 g NaHCOj L~' is possible in 6 hr at a flow rate of 11 BV hr''. Accumulation of sulfate in the closed regeneration circuit does not affect the nitrate capacity of the resin.
INTRODUCTION
Nitrate removal from ground water is necessary for several water supply companies in Europe since the maximum admissible concentration of nitrate in drinking water has been decreased from 22.6 to 11.3 mg N03~-N L" ' according to the European Community Directive (European Community, 1980). One of the possibilities to remove nitrate from ground water is ion exchange. This process is characterized by two important problems: most resins are more selective for sulfate than for nitrate, and regeneration of the resins requires much salt and produces a voluminous brine.
The first problem concerns the selectivity of strong base anion exchange resins. The generally accepted selectivity sequence is SO^" > NO3' > CI" > HCO3" (Midkiff and Weber, 1970; Clifford, 1982). This means that the nitrate capacity is low when the sulfate concentration in the ground water is high. However, recently some nitrate selective resins have been developed and tested (Cox et al., 1981; Guter, 1984; Dore et al., 1985; Rohm and Haas, 1986).
The second problem, that costs of regenerant and brine disposal are the major items in the total cost of ion exchange, has been mentioned by many authors over the last decade (Buelow et al., 1975; Gauntlett, 1975; Clifford and Weber, 1978; H611 and Kiehling, 1981; Guter, 1982). In Table I some figures are given of the regenerant waste water composition and volume. To reduce regeneration salt requirement and brine disposal several regeneration procedures have been developed in the past. Korngold (1973) concluded that sea water was as effective as NaCl for regeneration. Gauntlett (1975) studied partial regeneration of resins in a direction counter-current to that of the water passing through the resins in service. Another possibility is the use of a two bed, strong acid-weak base, ion exchange nitrate removal process which produces a spent ammonium nitrate regenerant amenable to disposal as fertilizer (Clifford and Weber, 1978). Richard and Leprince (1982) reduced regenerant requirements by recycling the last 40% of the regenerant eluate. In addition to the possibility of recycling portions of the regenerant, Guter (1982) also pointed out the combined use of reverse osmosis and ion exchange, by using reverse osmosis brine as pretreatment for
31

Table I. Regenerant waste water composition and volume (percentage of treated water)
CI" (g L " 1 )
27.50
18.10
0.80
4.00
5.80
N03"-N
<g L"1>
0.64
0.29
0.09
0.21
5.50
S042"
(9 L"1)
7.87
3.54
8.20
2.00
4.70
vol.
(X)
0.78
1.73
2.40
2.00
0.70
process
single-bed
two-bed
single-bed
single-bed
single-bed
reference
a
a
b*
c
d
* based on spent regenerant and rinse water
references: a, Clifford and Weber, 1978; b, Guter,
d, Philipot and de Larminat, 1988 1982; c, Andersen et al., 1985;
regeneration of resins. The CARIX-process (Feuerstein et al., 1985) for simultaneous softening and removal of sulfate and nitrate works with a combination of a weak acid cation exchanger and a strong base anion exchanger. Both resins can be regenerated simultaneously with CO2 in a non-polluting way.
Recently a nitrate removal process by ion exchange has been developed, which uses a new regeneration scheme (Van der Hoek and Klapwijk, 1987). The most elementary form of this process is shown in Figure 1. While one ion exchange column is in the service mode, the other column is in the regeneration mode. Regeneration is carried out in a closed circuit with the use of a biological denitrification reactor (Figure 2) which removes nitrate from the regenerant by reduction of nitrate to nitrogen gas. The required organic carbon source (methanol) is converted into carbon dioxide, carbonate and biomass. Because regeneration is carried out in a closed system, salt requirement and brine production are minimized. However, it is advisable not to exceed salt concentrations of 30 g L"1 in the regenerant to avoid severe inhibition of the denitrification reactor (Van der Hoek et al., 1987).
low-nitrate groundwater low-nitrate groundwater
I.E. 1 I.E. 2 IE. 1
nitrate rich groundwater
I.E. 2
nitrate rich groundwater
ion exchanger 1 : nitrate removal ion exchanger 2 : regeneration
ion exchanger 1 : regeneration ion exchanged : nitrate removal
Fig. 1. Removal of nitrate from ground water by a combination of ion exchange and biological denitrification. The solid column is the denitrification reactor.
32

NaCl
denitrif ication reactor
NO;
% - resin which has to ^ be regenerated
I Jl" a~* NO; cr.NO,"
Fig. 2. Regeneration of a nitrate-
Loaded resin in a closed circuit
using chloride (above) or bicar
bonate (down).
denitrif icarion reactor
NO a'
CHjOH^COj'/HCO^rL
resin which has to be regenerated
HC(K ~ Of — HCO3 -.NOf
We studied the selectivity for nitrate in the presence of sulfate of the strong base macro-porous anion exchange resin Amberlite IRA 996 (Rohm and Haas, 1986) and compared the results with normal sulfate selective resins (Duolite A 161 and A 165). The regeneration of resins (Duolite A 161, Amberlite IRA 996) was studied with a low concentrated regenerant, as is necessary in the combined process. Because sulfate will accumulate in the closed regeneration circuit in this process, we also studied the effect of the presence of sulfate in the regenerant on the nitrate capacity of a resin (Amberlite IRA 996) in the service mode.
MATERIALS AND METHODS
In the experiments three strong base macro-porous anion exchange resins were used: Duolite A 161, Duolite A 165 and Amberlite IRA 996. Break-through experiments were conducted down flow with resins in the bicarbonate form. The columns used had an internal diameter of 1.9 or 3.2 cm and a height of 19 or 40 cm. The flow rate was 35 BV hr"1 (BV = bed volumes). Regeneration experiments were conducted down flow in columns with an internal diameter of 1.9 or 3.2 cm and a height of 14, 19 or 40 cm. In all regeneration experiments 30 g NaHCC>3 L" ' was used as regenerant.
Selectivity coefficients and binary equilibrium isotherms were determined by a total anion concentration in liquid phase of 0.012 eq L"1. Selectivity coefficients K£0 follow from the chemical equilibrium
aN0 3" -* Aa" + aN03" [1]
33
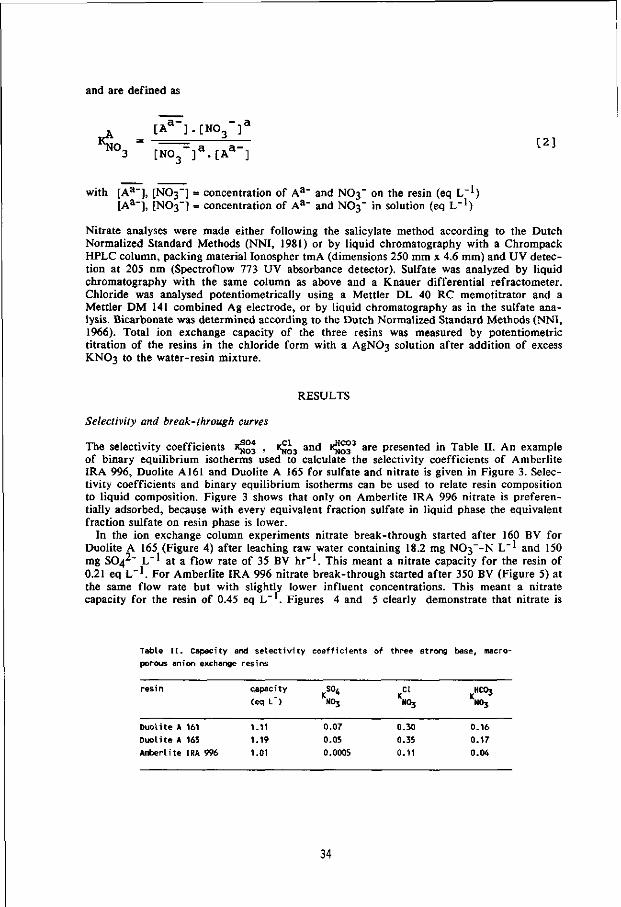
and are defined as
^ C " [Aa ].[N03 ] a
[NO ~]a.[Aa~] [ 2 ]
with [Aa~], [NO3"] = concentration of Aa~ and NO3" on the resin (eq L *) [Aa~], [NO3"] = concentration of Aa" and NO3" in solution (eq L"1)
Nitrate analyses were made either following the salicylate method according to the Dutch Normalized Standard Methods (NNI, 1981) or by liquid chromatography with a Chrompack HPLC column, packing material Ionospher tmA (dimensions 250 mm x 4.6 mm) and UV detection at 205 nm (Spectroflow 773 UV absorbance detector). Sulfate was analyzed by liquid chromatography with the same column as above and a Knauer differential refractometer. Chloride was analysed potentiometrically using a Mettler DL 40 RC memotitrator and a Mettler DM 141 combined Ag electrode, or by liquid chromatography as in the sulfate analysis. Bicarbonate was determined according to the Dutch Normalized Standard Methods (NNI, 1966). Total ion exchange capacity of the three resins was measured by potentiometric titration of the resins in the chloride form with a AgNC>3 solution after addition of excess KNO3 to the water-resin mixture.
RESULTS
Selectivity and break-through curves
The selectivity coefficients Kjj£* , x£i and KJJ£°3 are presented in Table II. An example of binary equilibrium isotherms used to calculate the selectivity coefficients of Amberlite IRA 996, Duolite A161 and Duolite A 165 for sulfate and nitrate is given in Figure 3. Selectivity coefficients and binary equilibrium isotherms can be used to relate resin composition to liquid composition. Figure 3 shows that only on Amberlite IRA 996 nitrate is preferentially adsorbed, because with every equivalent fraction sulfate in liquid phase the equivalent fraction sulfate on resin phase is lower.
In the ion exchange column experiments nitrate break-through started after 160 BV for Duolite A 165 (Figure 4) after leaching raw water containing 18.2 mg NC>3~-N L"1 and 150 mg SO^p L"1 at a flow rate of 35 BV hr~'. This meant a nitrate capacity for the resin of 0.21 eq L"1. For Amberlite IRA 996 nitrate break-through started after 350 BV (Figure 5) at the same flow rate but with slightly lower influent concentrations. This meant a nitrate capacity for the resin of 0.45 eq L . Figures 4 and 5 clearly demonstrate that nitrate is
Table II. Capacity and selectivity coefficients of three strong base, macro-
porous anion exchange resins
resin capacity SO4 CI HCO3
<eq L") NOj SlOj V ^
0.07 0.30 0.16
0.05 0.35 0.17
0.0005 0.11 0.04
Duolite A 161
Duolite A 165
Amberlite IRA 996
1.11
1.19
1.01
34
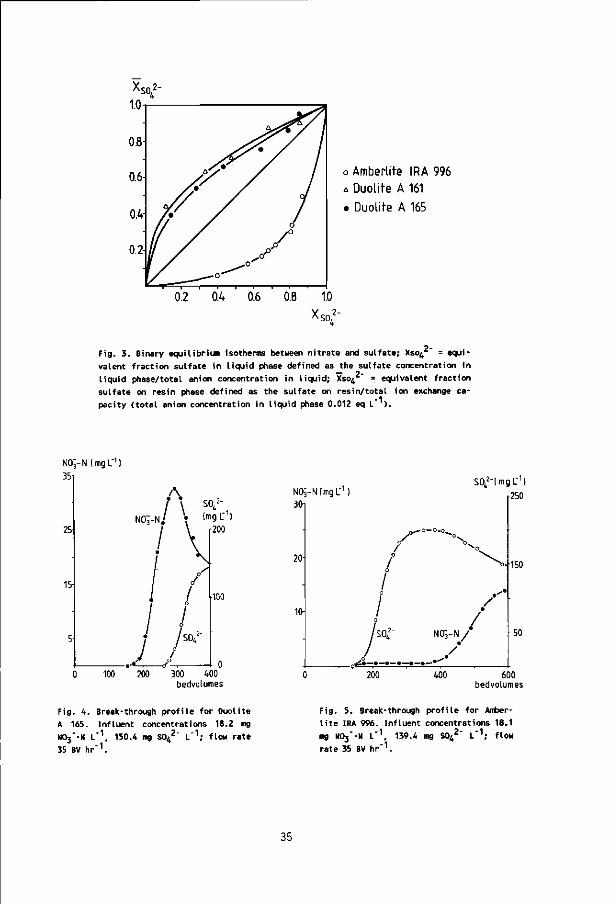
o Amberlil-e IRA 996
A Duolite A 161
• Duolite A 165
^^=—l 1 1 1 1 1 1 1-
0.2 0.4 0.6 0.8 1.0
Fig. 3. Binary equilibrium isotherms between nitrate and sulfate; Xso4 = equi
valent fraction sulfate in liquid phase defined as the sulfate concentration in — o.
liquid phase/total anion concentration in liquid; Xso^ = equivalent fraction sulfate on resin phase defined as the sulfate on resin/total ion exchange ca
pacity (total anion concentration in liquid phase 0.012 eq L ).
NOj-N (mgL"1)
35
N0;-N(mgL"')
30-
20
10-
S042imgL-1)
/ A-
J^~°
0
1 0
/ 0
/ 0 / sot
—•—•—•—•—•-
" ° " ° -n \
\
.'• / • /
N0"3-N/*
• / _.-'•
2S0
150
50
300 400 bedvolumes
200 400 600 bedvolumes
Fig. 4. Break-through profile for Duolite
A 165. Influent concentrations 18.2 mg
NOj'-N L"1, 150.4 mg S042" L"1; flow rate
35 BV hr"1.
Fig. 5. Break-through profile for Amber-
lite IRA 996. Influent concentrations 18.1
mg NOj'-N L"1, 139.4 mg S0 42 " L"1; flow
rate 35 BV hr"1.
35
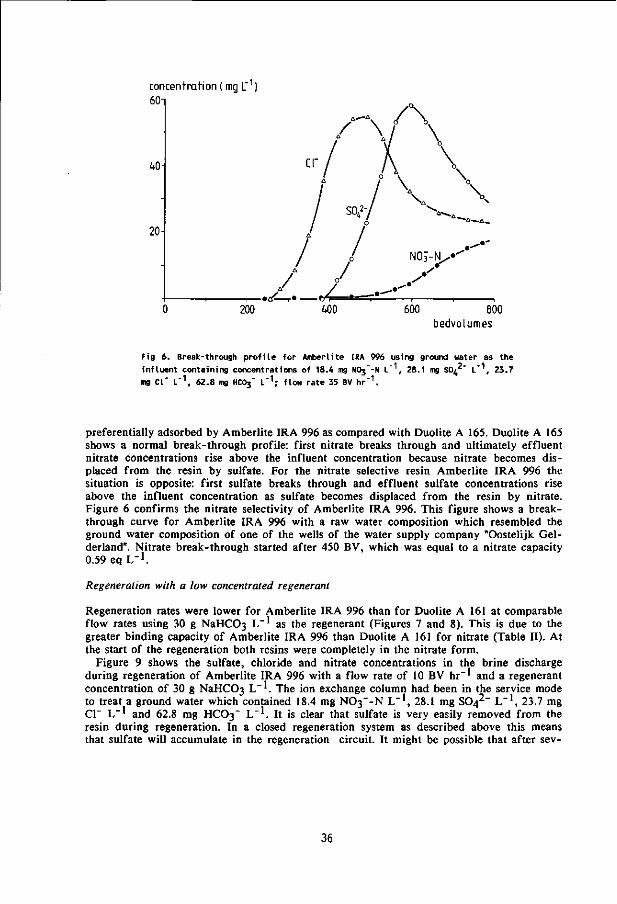
concentration (mg L"1) 6(h
40
20-
200 . . ^ - P . — < / • - 7 " " * " ,
400 600 800 bedvolumes
Fig 6. Break-through profile for Amberlite IRA 996 using ground water as the
influent containing concentrations of 18.4 mg NOj"-N L , 28.1 mg SO^ " L~1, 23.7
mg CI" L"1, 62.8 mg HCO3" L"1; flow rate 35 BV hr"1.
preferentially adsorbed by Amberlite IRA 996 as compared with Duolite A 165. Duolite A 165 shows a normal break-through profile: first nitrate breaks through and ultimately effluent nitrate concentrations rise above the influent concentration because nitrate becomes displaced from the resin by sulfate. For the nitrate selective resin Amberlite IRA 996 the situation is opposite: first sulfate breaks through and effluent sulfate concentrations rise above the influent concentration as sulfate becomes displaced from the resin by nitrate. Figure 6 confirms the nitrate selectivity of Amberlite IRA 996. This figure shows a breakthrough curve for Amberlite IRA 996 with a raw water composition which resembled the ground water composition of one of the wells of the water supply company "Oostelijk Gel-derland". Nitrate break-through started after 450 BV, which was equal to a nitrate capacity 0.59 eq L_ 1 .
Regeneration with a low concentrated regenerant
Regeneration rates were lower for Amberlite IRA 996 than for Duolite A 161 at comparable flow rates using 30 g NaHCC>3 L"1 as the regenerant (Figures 7 and 8). This is due to the greater binding capacity of Amberlite IRA 996 than Duolite A 161 for nitrate (Table II). At the start of the regeneration both resins were completely in the nitrate form.
Figure 9 shows the sulfate, chloride and nitrate concentrations in the brine discharge during regeneration of Amberlite IRA 996 with a flow rate of 10 BV hr" ' and a regenerant concentration of 30 g NaHC03 L" ' . The ion exchange column had been in the service mode to treat a ground water which contained 18.4 mg NC>3~-N L" ' , 28.1 mg SO^" L"1, 23.7 mg CI" L" ' and 62.8 mg HCO3" L"1. It is clear that sulfate is very easily removed from the resin during regeneration. In a closed regeneration system as described above this means that sulfate will accumulate in the regeneration circuit. It might be possible that after sev-
36
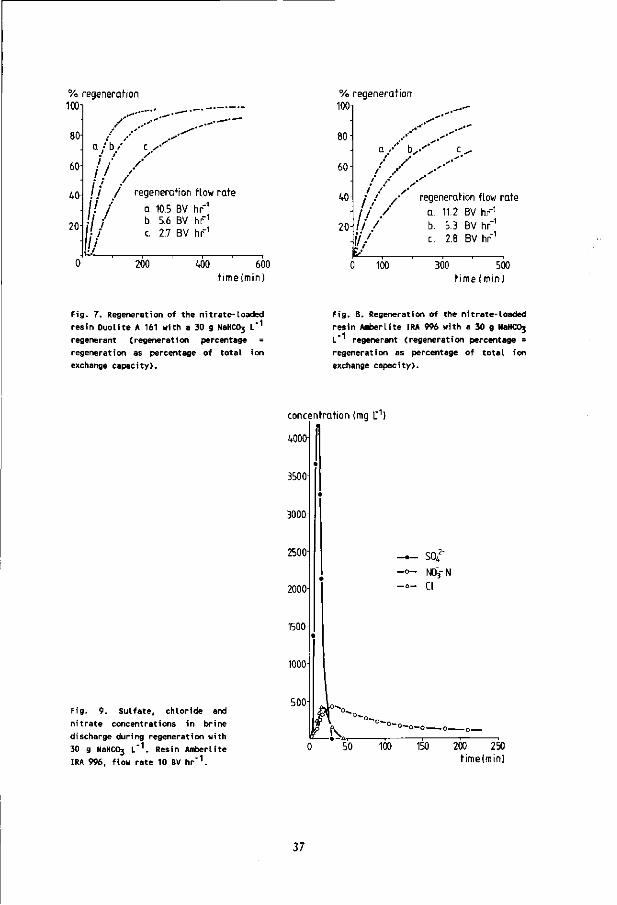
% regeneration 100i
80
60-
40-
20-
/
a /b / /' .•' / / ,
/'
/ / / regeneration flow rate
/ / / a. 10.5 BV hr"1
/ /
b. 5.6 BV hr-1
c. 2.7 BV hr"1
200 400 600 t ime(min)
% regeneration 100n
80 \
60
40
20
b /
; / /• regeneration flow rate
• / /' a. 11.2 BV hr-1
V b. 5.3 BV hr" c. 2.8 BV hr"
0 100 300 500 time (min)
Fig. 7. Regeneration of the nitrate-loaded
resin Duolite A 161 with a 30 g NaHCOj L'1
regenerant (regeneration percentage =
regeneration as percentage of total ion
exchange capacity).
Fig. 8. Regeneration of the nitrate-loaded
resin Amber lite IRA 996 with a 30 g NaHOVj
L regenerant (regeneration percentage =
regeneration as percentage of total ion
exchange capacity).
concentration (mg L"1)
4000
3500
Fig. 9. Sulfate, chloride and
nitrate concentrations in brine
discharge during regeneration with
30 g NaHC03 L"1. Resin Amberlite
IRA 996, flow rate 10 BV hr'1.
3000
2500
2000
1500
1000
500
- . - sor - o - N03-N
- a - cr
- o — 0 - 0 -
0 50 100 150 200 250 time(min)
37
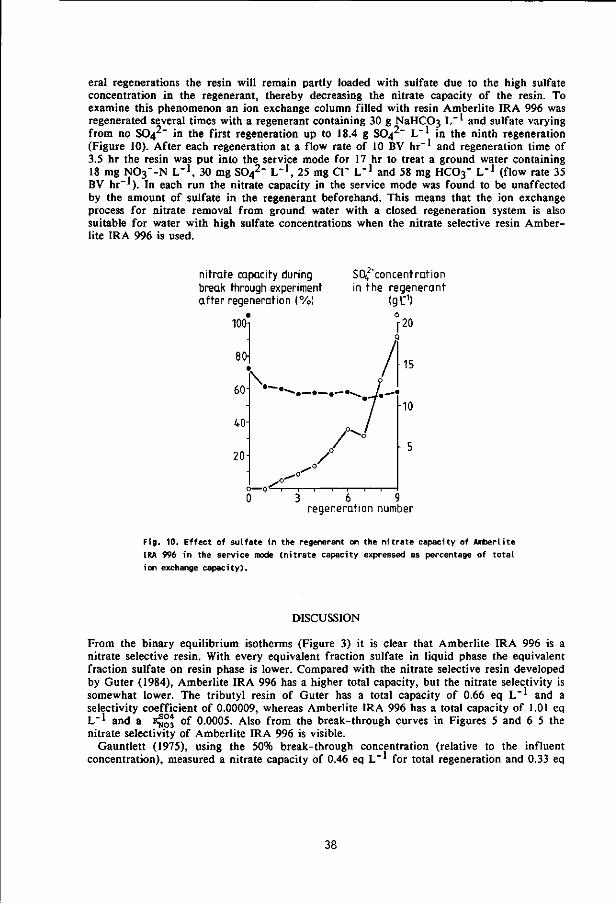
eral regenerations the resin will remain partly loaded with sulfate due to the high sulfate concentration in the regenerant, thereby decreasing the nitrate capacity of the resin. To examine this phenomenon an ion exchange column filled with resin Amberlite IRA 996 was regenerated several times with a regenerant containing 30 g NaHCC>3 L" ' and sulfate varying from no SO42" in the first regeneration up to 18.4 g SO42" L" ' in the ninth regeneration (Figure 10). After each regeneration at a flow rate of 10 BV hr" ' and regeneration time of 3.5 hr the resin was put into the service mode for 17 hr to treat a ground water containing 18 mg NO3--N L"1, 30 mg S0 4
2" L - 1 , 25 mg CP L"1 and 58 mg HCO3- L"1 (flow rate 35 BV hr"*). In each run the nitrate capacity in the service mode was found to be unaffected by the amount of sulfate in the regenerant beforehand. This means that the ion exchange process for nitrate removal from ground water with a closed regeneration system is also suitable for water with high sulfate concentrations when the nitrate selective resin Amber-lite IRA 996 is used.
nitrate capacity during break through experiment after regeneration (%)
SO^'concentration in the regenerant
(gc1)
3 6 9 regeneration number
Fig. 10. Effect of sulfate in the regenerant on the nitrate capacity of Amberlite
IRA 996 in the service mode (nitrate capacity expressed as percentage of total
ion exchange capacity).
DISCUSSION
From the binary equilibrium isotherms (Figure 3) it is clear that Amberlite IRA 996 is a nitrate selective resin. With every equivalent fraction sulfate in liquid phase the equivalent fraction sulfate on resin phase is lower. Compared with the nitrate selective resin developed by Guter (1984), Amberlite IRA 996 has a higher total capacity, but the nitrate selectivity is somewhat lower. The tributyl resin of Guter has a total capacity of 0.66 eq L"1 and a selectivity coefficient of 0.00009, whereas Amberlite IRA 996 has a total capacity of 1.01 eq L"1 and a K^°* of 0.0005. Also from the break-through curves in Figures 5 and 6 5 the nitrate selectivity of Amberlite IRA 996 is visible.
Gauntlett (1975), using the 50% break-through concentration (relative to the influent concentration), measured a nitrate capacity of 0.46 eq L"1 for total regeneration and 0.33 eq
38

L"* for partial regeneration on a water having a similar composition as shown in Figure 6. In the case of Amberlite IRA 996 a nitrate capacity of 0.86 eq L" ' was calculated for the 50% break-through concentration (Figure 6).
Regeneration of resins with 30 g NaHCC>3 L"' is possible, but it takes a longer time and a larger flow rate compared with conventional regeneration procedures. Conventional regeneration is carried out with 50-100 g NaCl L"1 with a flow rate of 2-4 BV hr"1 for a period of 30-50 minutes (Gauntlett, 1975; Deguin et al., 1978; Deguin, 1982; Richard and Leprince, 1982; Lauch and Guter, 1986). Using 30 g NaHCC>3 L"1 as the regenerant, complete regeneration of Duolite A 161 requires at least a flow rate of 10 BV hr"1 for 4 hr (Figure 7). For the nitrate selective resin Amberlite IRA 996 complete regeneration requires a flow rate of 11 BV hr" ' for at least 6 hr (Figure 8). The increase in required flow rate and time compared with conventional regeneration can be explained by the selectivity coefficients and the regenerant concentration used. From Table II it is clear that the resins are more selective for chloride than for bicarbonate because K£03 is twice K^O°3 • This means that it is more difficult to regenerate the resins to the bicarbonate form than to the chloride form. The regenerant with 30 g NaHCC>3 L"1 (357 meq L"1) can be changed into a regenerant containing 10.4 g NaCl L"1 (178 meq L"1) giving the same regeneration results since KJJ03
is twice ^033 • Thus, instead of the usual regenerant concentration of 50-100 g NaCl L"1
in conventional ion exchange processes, we in fact only used 10.4 g NaCl L"1, equal to 30 g NaHC03 L"1.
The difference in regeneration times between Duolite A 161 and Amberlite IRA 996 is caused by the stronger nitrate selectivity of Amberlite IRA 996 compared with Duolite A 161. This can be seen from the selectivity coefficients *§o°3 in Table II. As a consequence, Amberlite IRA 996 is much more difficult to regenerate than Duolite A 161.
Although regeneration of the resins with 30 g NaHCC<3 L"1 is possible, the regeneration efficiency is very low. Regeneration efficiency is defined as the ratio of equivalents of nitrate removed from the resin during regeneration to the equivalents of regenerant used. Gauntlett (1975) measured with total regeneration (regenerant 100 g NaCl L"1) an efficiency of 0.090 eq NC>3"/eq CI" for a low sulfate water and 0.045 eq NC>3"/eq CI" for a high sulfate water. With partial regeneration these values were 0.240 eq NC<3"/eq CI" and 0.120 eq NC>3"/eq CI" for the low and high sulfate waters, respectively. For a high sulfate water and partial regeneration Lauch and Guter (1986) measured a regeneration efficiency of 0.180 eq NC>3"/eq CI" (regenerant 60 g NaCl L"1). To regenerate a resin used for nitrate removal from water which contained only nitrate, Buelow et al. (1975) found a regeneration efficiency of 0.256 eq NC>3"/eq CI" (regenerant 80 g NaCl L"1).
From Figures 7 and 8 the regeneration efficiency of Duolite A 161 and Amberlite IRA 996 can be calculated for 30 g NaHCC>3 L"1 used as regenerant. To obtain 97% regeneration at the highest flow rate (10.5 BV hr" ') the regeneration efficiency of Duolite A 161 is 0.072 eq NC>3"/eq HCO3". To obtain 97% regeneration for Amberlite IRA 996 at a flow rate of 11.2 BV hr"1 the regeneration efficiency is 0.041 eq NC>3"/eq HCO3". However, a low regeneration efficiency is not a serious problem in a closed regeneration system, because the excess of NaHCC>3 will stay in the system and is not lost in the disposed brine. From experiments with a lab-scale pilot plant of the combined process (Van der Hoek and Klapwijk, 1987) a ratio of removed NO3" from the ground water (with a raw water composition almost equal to the influent concentrations in Figure 6) and HCO3" dosage (necessary for brine renewal every six days of operation and compensation of HCO3" losses due to one lost bed volume of regenerant every new regeneration) was 0.339 eq NC<3"/eq HCO3". This ratio can be regarded as the "real regeneration efficiency" of the combined process. With a more sophisticated plant control to avoid losses of HCO3" due to the lost bed volume of regenerant every new regeneration, an even better "real regeneration efficiency" can be obtained.
39

CONCLUSIONS
The nitrate concentration of Dutch ground water (18.4 mg N03~-N L"1), treated with the nitrate selective resin Amberlite IRA 996 at a flow rate of 35 BV hr"1, will reach the European guide level of 5.6 mg N03~-N L"1 after 600 BV (17 hr). Regeneration of Amberlite IRA 996 with 30 g NaHC03 L"1 is possible in approximately 6 hr at a flow rate of 11 BV hr"1. This means that the ion exchange nitrate removal process with the closed regeneration system can be designed with three ion exchange columns and one biological denitrification reactor. Two ion exchange columns are in the service mode and have a run time of 14 hr each. They work 7 hr out of phase. The third ion exchange column is in the regeneration mode for 6 hr, after which 1 hr is left for rinsing and/or disinfection of this resin (Van der Hoek and Klapwijk, 1987). Thus in every 7 hr a regenerated ion exchange column can be put into the service mode. While the service mode takes 14 hr, there is a safety of 3 hr before the effluent nitrate concentration of the columns will reach the European guide level. Accumulation of sulfate in the closed regeneration circuit has no effect on the nitrate capacity of Amberlite IRA 996.
Although the Dutch ground water has a low sulfate concentration (28.2 mg SO^p L"1) Amberlite IRA 996 has the important advantage above Duolite A 161 or Duolite A 165 in that sulfate is only removed partially from the ground water. This means that the treated water will have a lower average chloride or bicarbonate concentration (dependent on a NaCl regenerant or a NaHC03 regenerant) than water treated by a conventional resin.
ACKNOWLEDGMENT
These investigations were supported by the Netherlands Technology Foundation (STW); Rossmark-Van Wijk & Boerma Water Treatment Ltd.; the Ministry of Housing, Physical Planning and Environment; the Ministry of Economic Affairs and the Water Supply Company "Oostelijk Gelderland". The authors wish to thank Paul van der Ven for analytical assistance.
REFERENCES
Andersen, K.K., Gron, C , Thrane, W.W.: 1985, Removal of nitrate from ground water by ion exchange. 2nd phase: pilot scale and laboratory experiments, Report 64.90/500 Water Quality Institute Danish Academy of Technical Science (in Danish).
Buelow, R.W., Kropp, K.L., Withered, J., Symons, J.M.: 1975, / . Am. Water Works Assoc. 67, 528.
Clifford, D.: 1982, Physicochemical methods for water and wastewater treatment, Elsevier Scientific Publishing Company, Amsterdam-Oxford-New York, p. 179.
Clifford, D.A., Weber, W.J. Jr.: 1978, Ind. Water Eng. 15, 18. Cox, M., Harries, R.C., Nowell, D.V., Clark, R.: 1981, Chem. Ind. 7 March 1981, 161. Deguin, A.: 1982, Trib. Cebedeau 35, 35. Deguin, A., Rouas, R., Neveu, A., Gaspard, M.: 1978, / . Francais d'Hydrologie 9, 77. Dore, M., Perot, J., Simon, Ph.: 1985, Proceedings of the congress "Nitrates in Water", SITE
85, Paris, October 22-24, 1985. European Community: 1980, Official Journal of the European Community 23, L229, 11. Feuerstein, W., Holl, W., Kretzschmar, W., Hagen, K.: 1985, GWF-Wasser/Abwasser 126, 343. Gauntlett, R.B.: 1975, Water Treat. Exam. 24, 172. Guter, G.A.: 1982, Removal of nitrate from contaminated water supplies for public use,
Report EPA-600/2-82-042 US Environmental Protection Agency. Guter, G.A.: 1984, United States Patent, Patent Number 4,479,877. Hoek, J.P. van der, Klapwijk, A.: 1987, Water Res. 21, 989. Hoek, J.P. van der, Latour, P.J.M., Klapwijk, A.: 1987, Appl. Microb. Biotechnol. 27, 199.
40

H611, W., Kiehling, B.: 1981, Water Res. 15, 1027. Korngold, E.: 1973, Water, Air, and Soil Pollut. 2, 15. Lauch, R.P., Guter, G.A.: 1986, J. Am. Water Works Assoc. 78, 83. Midkiff, W.S., Weber, W.J. Jr.: 1970, Purdue Univ. Ext. Ser. 137, 593. NNI: 1966, Dutch Normalized Standard Method NEN 1056 IV.6, Nederlands Normalisatie-
Instituut, Delft, The Netherlands. NNI: 1981, Dutch Normalized Standard Method NEN 6440, Nederlands Normalisatie-Instituut,
Delft, The Netherlands. Philipot, J.M., Larminat, G. de: 1988, Wat. Supply 6, 45. Richard, Y., Leprince, A.: 1982, Trib. Cebedeau 35, 21. Rohm and Haas European Region: 1986, Preliminary product data sheet Amberlite IRA 996.
41

CHAPTER 5
Disinfection of Anion Exchange Resins in the Combined Ion Exchange/Biological Denitrification Process Part I: Effect on Water Quality
By Jan Peter van der Hoek, Jeroen Verheijen, Pirn I. M. Vis and Abraham Klapwijk*
Contamination of ground water with nitrate is an important problem in several European countries. The combined ion exchange/biological denitrification process is a technique for nitrate removal from ground water. In this process the resins are regenerated with a biological denitrification reactor. However, this causes a bacterial contamination of the resins and the colony counts in the treated water will be increased by the resins. For that reason the resins have to be disinfected after regeneration during the rinse phase, before they are used for nitrate removal again. It was possible to reduce the colony counts in the treated water below 30/ml with the use of 0.075% peracetic acid for 15 min or 0.20% hydrogen peroxide for 45 min during rinsing.
Desinfektion von Anionen-Austauschern im kombinierten Verfahren lonenaustausch/biologische Denitrifikation. Teil I: Auswirkung auf die Wasserqualitat. Grundwasserbe-lastung mit Nitrat ist ein wichtiges Problem in mehreren europaischen Landern. Das kombinierte Verfahren lonenaustausch/biologische Denitrifikation ist eine Moglichkeit zur Nitratentfernung aus Grundwasser. In diesem Verfahren wird das Austauscherharz mit Hilfe eines biologischen Denitrifika-tionsreaktors regeneriert. Jedoch wird das Harz dadurch bakte-riologisch kontaminiert und das verkeimte Austauscherharz erhoht die Koloniezahl im Trinkwasser. Darum soil das Harz nach der Regeneration, wahrend des Spiilprozesses, desinfi-ziert werden, bevor es wieder zur Nitratentfernung benutzt wird. Die Koloniezahl des behandelten Grundwassers konnte bis unter 30/ml reduziert werden durch Sptilen entweder mit 0,075%iger Peressigsaure (Dauer 15 Min.) oder mit 0,20%igem Wasserstoffperoxid (Dauer 45 Min.).
1 Introduction As a result of fertilization in agriculture nitrate concentrations in ground water are increasing in many European countries. Both artificial fertilizer and animal manure cause nitrate prob-
: Dipi.-Ing. J. P. icm der Hoek, J. Verheijen, P. I. M. Vis and Dr. A, Klapwijk, Wageningen Agricultural University, Department of Water Pollution Control. De Dreyen 12, 6703 BC Wageningen, The Netherlands
lems [1 -7] , In the new EC directive relating to the quality of water intended for human consumption the maximum admissible concentration of nitrate in drinking water is decreased from 22.6 mg NO , " -N /1 to 11.3 mg N 0 3 " - N/1 [8]. To supply water with an acceptable nitrate concentration nitrate removal processes will be necessary at several ground water stations. One of the techniques is the combined ion exchange/biological denitrification process [9,10]. In this process nitrate is removed from the ground water by ion exchange, and the resins are regenerated in a closed system with a
Z. Wasscr- Abwasser-Forsch. 20, 155-160 (1987) © VCH Vcrlagsgesellschaft mbH. D-6940 Weinheira. 1987 0O44-3727/87/0510-0155$02.50/0
43
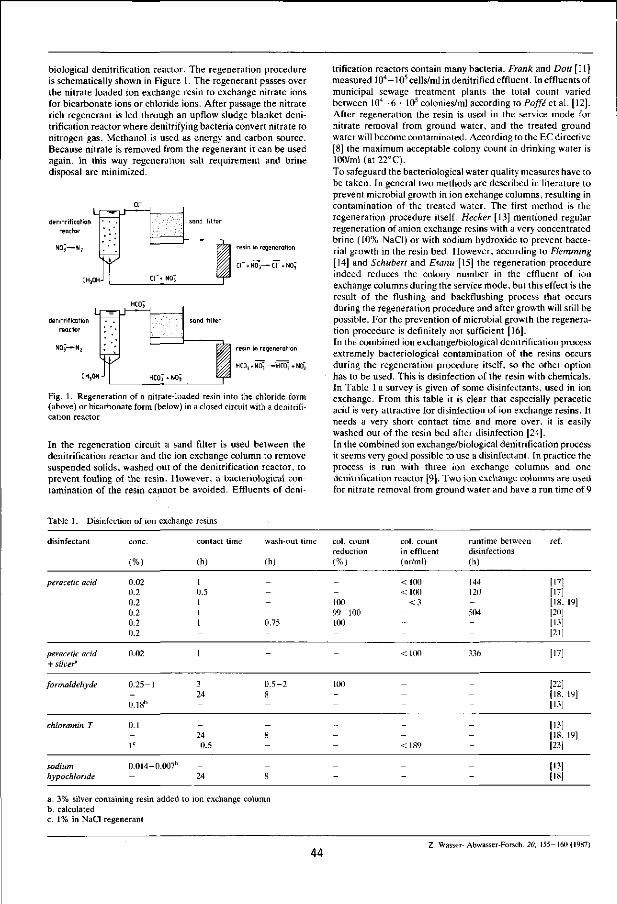
biological denitrification reactor. The regeneration procedure is schematically shown in Figure 1. The regenerant passes over the nitrate loaded ion exchange resin to exchange nitrate ions for bicarbonate ions or chloride ions. After passage the nitrate rich regenerant is led through an upflow sludge blanket denitrification reactor where denitrifying bacteria convert nitrate to nitrogen gas. Methanol is used as energy and carbon source. Because nitrate is removed from the regenerant it can be used again. In this way regeneration salt requirement and brine disposal are minimized.
denitrification reactor
denitrification reactor
resin in regeneration
CH,0HJ HCO3 • NO,
resin in regeneration
HCOJ.NOj—HCO~3*NC5 P HC0" Fig. 1. Regeneration of a nitrate-loaded resin into the chloride form (above) or bicarbonate form (below) in a closed circuit with a denitrification reactor
In the regeneration circuit a sand filter is used between the denitrification reactor and the ion exchange column to remove suspended solids, washed out of the denitrification reactor, to prevent fouling of the resin. However, a bacteriological contamination of the resin cannot be avoided. Effluents of deni
trification reactors contain many bacteria. Frank and Dott [11] measured 104—105 cells/ml in denitrified effluent. In effluents of municipal sewage treatment plants the total count varied between 104—6 • Iff" colonies/ml according to Poffe et al. [12]. After regeneration the resin is used in the service mode for nitrate removal from ground water, and the treated ground water will become contaminated. According to the EC directive [8] the maximum acceptable colony count in drinking water is 100/ml (at 22°C).
To safeguard the bacteriological water quality measures have to be taken. In general two methods are described in literature to prevent microbial growth in ion exchange columns, resulting in contamination of the treated water. The first method is the regeneration procedure itself. Hecker [13] mentioned regular regeneration of anion exchange resins with a very concentrated brine (10% NaCl) or with sodium hydroxide to prevent bacterial growth in the resin bed. However, according to Flemming [14] and Schubert and Esanu [15] the regeneration procedure indeed reduces the colony number in the effluent of ion exchange columns during the service mode, but this effect is the result of the flushing and backflushing process that occurs during the regeneration procedure and after growth will still be possible. For the prevention of microbial growth the regeneration procedure is definitely not sufficient [16]. In the combined ion exchange/biological denitrification process extremely bacteriological contamination of the resins occurs during the regeneration procedure itself, so the other option has to be used. This is disinfection of the resin with chemicals. In Table 1 a survey is given of some disinfectants, used in ion exchange. From this table it is clear that especially peracetic acid is very attractive for disinfection of ion exchange resins. It needs a very short contact time and more over, it is easily washed out of the resin bed after disinfection [24]. In the combined ion exchange/biological denitrification process it seems very good possible to use a disinfectant. In practice the process is run with three ion exchange columns and one denitrification reactor [9]. Two ion exchange columns are used for nitrate removal from ground water and have a run time of 9
Table 1. Disinfection of ion exchange resins
disinfectant cone.
(%)
contact time
(h)
wash-out time
(h)
col. count reduction (%>
col. count in effluent (nr/ml)
runtime between disinfections (h)
ref.
peracetic acid 0.02 0.2 0.2 0.2 0.2 0.2
1 0.5 1 1 1
-0.75
--100 99-100 100
< 100 < 100
< 3
--
144 120
-504
-
a. 3% silver containing resin added to ion exchange column b. calculated c. 1% in NaCl regenerant
[17] [17] [18. 19] [20] [13] [21]
peracetic acid + silver11
formaldehyde
chloramin T
sodium hypochloride
0.02
0 .25-1
0.18"
0.1
l c
0.014-0.007"
1
3 24
24 0.5
24
-
0 .5 -2 8
8
8
-
100
-
-
< 100
-
< 189
-
336
-
-
-
[17]
[22] [18, 19] [13]
[13] [18, 19] [23]
[13] [18]
44 Z. Wasser- Abwasser-Forsch. 20. 155-160 (1987)

h each, but a phase shift of 4.5 h. The third column is connected with the denitrification reactor and is regenerated for 3.5 h, followed by one hour rinsing. Especially in this rinse phase after regeneration a disinfectant can be used the first minutes of rinsing. In our experiments we examined to what extend the treated ground water becomes polluted when no disinfectant is used, and we studied the use of two disinfectants in the process, peracetic acid and hydrogen peroxide. Both concentration and contact time were optimized.
2 Materials & Methods
2.1 Disinfectants
Two disinfectants were used in the experiments: peracetic acid and hydrogen peroxide. Peracetic acid was obtained from Degussa in a concentration of 30% ("Peressigsaure IA 30%"). As hydrogen peroxide we used the product DEWA T l— 50. This product contains 47% H 2 0 2 (w/v). 846 mg Ag+/1 and 0.012% P0 4
3~ (w/v).
2.2 Anion exchange resins
All experiments were carried out in columns with an internal diameter of 1.9 cm and a height of 40 cm. We used the strong base macro porous anion exchange resins Duolite A 165 and Amberlite IRA 996 (now called IMAC HP 555).
2.3 Experiments without the use of a disinfectant
Experiments without the use of a disinfectant were performed to determine the degree of bacteriological contamination that will occur in the combined ion exchange/biological denitrification process. For this reason effluent of an upflow sludge blanket denitrification reactor was collected and led through a filter paper (Schleicher & Schull) to remove suspended solids. With this effluent an ion exchange column was run for 3.5 h with a flow rate of 10 BV/h (BV = bed volumes) (downflow) to simulate the regeneration procedure. Then the column was rinsed with tap water for 1 h (10 BV/h, upflow), and finally the column was run with tap water for 19.5 h (30 BV/h, downflow) to simulate the service mode. Colony counts were measured in the regenerant and in the effluent of the ion exchange column during rinsing and in the service mode at several moments. This procedure was repeated 12 times.
In order to determine whether there is a strong adherence mechanism for the bacteria on the ion exchange resin, samples of the resin were crushed, and in the obtained water/resin mixture colony counts were measured. The results were compared with the colony counts in the effluent of the ion exchange column, just before the resin samples were taken.
2.4 Experiments with the use of a disinfectant
To study the effect of disinfection on the bacteriological quality of the treated ground water, the regeneration, rinsing and running of an ion exchange column was carried out with exactly the same flow rates and periods as in the combined ion exchange/biological denitrification process, run with resin Duolite A 165. Effluent from an upflow sludge blanket denitrification reactor was collected and led through a filter paper (Schleicher & Schiill) to remove suspended solids. With this effluent an ion exchange column was run for 3.5 h (10 BV/h, downflow) to simulate regeneration. Then the column was rinsed for 1 h (10 BV/h, upflow) with sterilized water (sterilized at 121 °C for 25 min) that contained a disinfectant the first period of rinsing. Finally the ion exchange column was run for
9 h (30 BV/h, downflow) with sterilized water to simulate the service mode. In the regenerant and in the effluent of the ion exchange column during the service mode colony counts were measured at several moments. All experiments were carried out in triplicate.
2.5 Analyses
Colony counts (number/ml) were performed at 22°C on glucose yeast extract. The plates were incubated for 72 h according to the Dutch Normalised Standard Methods [25], Colony counts between 0 and 30 are mentioned as "< 30" only when all values of the triplicate experiments showed counts below 30. Peracetic acid was determined in two steps. First H 2 0 2 was determined and neutralised as described below, and then peracetic acid was analyzed iodometrically according to Mucke and Sprossig [26].
Hydrogen peroxide was analyzed by titration with 0.1 N KMn0 4 after addition of 10 ml 4 N H2SG4 and MnS0 4 as catalyst, until the sample remained red.
3 Results and Discussion
3.1 Experiments without disinfection
In Table 2 the results are summarized of 12 successive process-cycles in which an ion exchange column was regenerated for 3.5 h with effluent of an upflow sludge blanket denitrification reactor, then rinsed for 1 h with tap water without the use of a disinfectant and finally run for 19.5 h with tap water. It is clear that already after the first cycle the treated water cannot meet the demands of a colony count less than 100/ml. During rinsing
Table 2. Colony counts (number per ml x 10"3) in regenerant, and in ion exchange column effluent during rinsing and service (nd = not determined, sd = standard deviation)
cycle
1 2 3 4 5 6 7 8 9
10 11 12 average ±sd
in regenerant
27 nd nd 40
nd 60 63 30 60
150 70
185 76 55
during rinsing
55 187 400 430 300 120 500 25 75
190 100 600 249 193
during service t = 0 h
16 72
220 50 44 60 98
4 39
155 48
600 117 164
t = 1.5 h t
15 25 30 13 20 6
70 7
25 120 50
140 43 45
= 2 0 h
nd nd nd 16 30
nd 50 8
44 75
nd 133 51 43
colony counts are higher than colony counts in the regenerant. This indicates that during the regeneration of 3.5 h bacteria might accumulate in the ion exchange column, but that they are easily washed out during rinsing. Flemming [16] also found that bacteria are relatively easily rinsed from the resin surface. During the first hour in the service mode this wash out is still visible, but the next 19 h the colony count in the treated water is quite stable. Flemming [14] examined the effect of backflushing and found that during backflushing the colony counts in the water were two to ten times higher than in the water treated after backflushing. Same results can be seen from Table 2. Table 3 supports the conclusion that there is no special adherence mechanism for bacteria on ion exchange resins. The
. Wasser- Abwasser-Forsch. 20. 155-160 (1987) 45

Table 3. Colony counts in treated water compared with colony counts in resin bed
Table 6. Effect of disinfection with peracetic acid for 15 min during rinsing with 7 min continuous and 8 min batch-wise operation
in resin bed in treated water
Amberlite IRA 996 Duolite A 165
2800 5000
2500 6500
colony counts in the resin bed are the same as the colony counts in the water, treated with the resin. From these experiments it is obvious that rinsing and backflush-ing is not sufficient to produce water with a colony count that can meet the EC standard [8]. This means that the use of a disinfectant is necessary after each regeneration. When the average colony count in the water during service in Table 2 is compared with the required colony count of less than 100/ml, the reduction must be at least 99.9%.
3.2 Disinfection with peracetic acid
In the first experiments peracetic acid was used for 30 min in the rinse phase after regeneration. As the total rinse phase is 1 h, still 30 min are left to wash out the disinfectant from the ion exchange column before it is put into the service mode. According to Wagner and Flemming [24] this should be sufficient. After the rinse phase the ion exchange columns were run with sterilized water for 9 h. The colony counts in the effluent are shown in Table 4, together with the colony count in the regenerant itself. The results show that with a relatively high
Table 4. Effect of disinfection with peracetic acid for 30 min during rinsing
peracetic
acid cone.
(%)
0.015 0.15
in regenerant
110000 125000
colon}
t = 0 h t
< 3 0 < 3 0
counts
during = 2 h
60 < 3 0
service t = 4 h
>300 < 30
t = 8 h
30
peracetic acid concentration it is possible to produce water with an acceptable colony count. In order to reduce the use of peracetic acid it was examined if the same results could be obtained when peracetic acid was only applied for 15 min during the rinse phase of 1 h. The results are presented in Table 5. From this Table it is clear that with 0.15% peracetic acid and a contact time of 15 min a satisfactory disinfection can be
Table 5. Effect of disinfection with peracetic acid for 15 min during rinsing
peracetic
acid cone.
(%)
0.075 0.15
in regenerant
1000000 225000
colony counts
t = 0 h
< 3 0 < 3 0
during t = 2 h
< 3 0 < 3 0
service t = 4 h
50 < 3 0
t = 8 h
50 70
reached. Also the use of 0.075% peracetic acid with a contact time of 15 min shows a good disinfection. When the peracetic acid concentration in the effluent was measured during disinfection it appeared that the concentration had hardly decreased. For this reason two other experiments were performed. In the first experiment (Table 6) the disinfectant was added for 7 min, after which the pump was stopped for 8 min. In 7 min approximately one bed volume is pumped into
peracetic
acid cone.
(%>
0.075 0.15
in regenerant
1000000 250000
colony counts
t = 0 h
> 300 < 30
during t = 2 h
>300 < 30
service t = 4 h
< 3 0
t = 8 h
30
the ion exchange column. So, also in this experiment a total contact time of 15 min was obtained, but the second half was batch-wise. In the second experiment (Table 7) the effluent of the ion exchange column during disinfection was recirculated after 8 min for 7 min, also resulting in a total contact time of 15
Table 7. Effect of disinfection with peracetic acid for 15 min during rinsing, with recirculation the last 7 min
peracetic
acid cone.
(%)
0.075 0.15
in regenerant
2000000 1500000
colony counts
t = 0 h
< 3 0 < 3 0
during t = 2 h
< 3 0 < 3 0
service t = 4 h
< 3 0 < 3 0
t = 8 h
30 < 3 0
min, but in contrast to the first experiment in a continuous manner. From Table 6 it is clear that only with 0.15% peracetic acid the colony count remains below 100/ml. Compared with the results in Table 5 (0.075% peracetic acid for 15 min) no restrictions in the use of peracetic acid can be obtained. However, when 0.075% peracetic acid is used 8 min and recirculated for 7 min, still the colony count remains below 100/ ml. This means that a reduction of 50% in the use of peracetic acid can be obtained as compared with the results in Table 5. When our results are compared with others we need a relatively high concentration for disinfection. Flemming [17] found that 0.02% peracetic acid is suitable for satisfactory disinfection of a strong cation exchanger. The colony count remained below 100/ ml for six days after 60 min disinfection. However, it is important to realize that in our experiments we have to deal with an extremely bacteriological contamination during regeneration, as the regenerant contained up to 2 • 106 cells/ml. In experiments to disinfect effluents from municipal sewage treatment plants (colony counts 104—6 • 105/ml) Poffe et al. [12] used 0.2% peracetic acid for 1 min and 0.04% peracetic acid for 10 min to reach 99.9% disinfection. It is more realistic to compare our results with these figures, and then it can be concluded that they are in agreement.
3.3 Disinfection with silver containing hydrogen peroxide
Disinfection with hydrogen peroxide was carried out with a contact time of 30 min or 45 min during the rinse phase of 1 h, after regeneration for 3.5 h. Then the ion exchange columns were run for 9 h with sterilized water. In the effluent as well as in the regenerant, colony counts were determined. The results are presented in Table 8 and Table 9. Because silver might have affected the results, the silver concentrations during disinfection, calculated from the concentrated H2C>2 solution, are also shown in Table 8 and Table 9. Disinfection is possible with 0.5% H 2 0 2 and 30 min contact time, or with 0.2% H 2 0 2 and 45 min contact time..The latter possibility has the advantage that less disinfectant has to be used.
46 Z. Wasser- Abwasser-Forsch. 20. 155-160 (1987)

Table 8. Effect of disinfection with H202 for 30 min during rinsing
H 2 0 2
(%)
0.02 0.2 0.5
Table 9.
H , 0 2
(%)
0.1 0.2
Ag +
(mg/l)
0.34 3.38 8.48
in regenerant
150000 2000000 2000000
colon)
t = 0 h
> 300 200
< 30
Effect of disinfection with H 2 0 2
Ag +
(mg/l)
1.69 3.38
in regenerant
3000000 3000000
colony
t = 0 h
>300 < 30
counts
during t = 2 h
>300 220
< 30
service t = 4 h
>300 < 30
for 45 min during
counts
during t = 2 h
150 < 3 0
service t = 4 h
50 < 3 0
t = 7 h
> 300 < 30
rinsing
t = 7 h
> 300 < 30
When these values are compared with results of Poffe et al. [27] who used H : 0 2 (without silver addition) to disinfect effluents from municipal sewage treatment plants, it is clear that low concentrations and a relatively short contact time were sufficient in our experiments. Poffe et al. used 0.55% H 2 0 2 with a contact time of 2 h to obtain a colony reduction of 99%. With a contact time of 30 min and a concentration of 0.15% - 0 . 25% or 0 .35%-0.55%, they reached a reduction of only 70%, respectively 90%. These concentrations and contact time are comparable with ours, but we reached a reduction of more than 99.9%. One of the possibilities that can account for this difference might be the presence of silver in the H 2 0 2 solution we used, as silver also acts as a disinfectant. For example, tap water could be conserved for one day with 20 ug Ag+/1 and for seven days with 50 ug Ag+/1 [28]. According to Piimpel and Schinner [29] as little as 1 mg Ag+/1 influenced bacterial growth, and with every increase in silver concentration to the power of 10 the bacterial count decreased by a factor of 60. Above 1 g Ag+/1 no growth occurred. In our experiments sufficient disinfection was obtained with 0.2% H 2 0 2 and 0.5% H 2 0 2 , resulting in a silver concentration of 3.38 mg Ag+/1 and 8.48 mg Ag+/1 respectively. However, the effect of silver on bacterial growth can diminish as a result of an increase in tolerance of the bacterial flora towards silver ions. Especially in ion exchange beds this phenomenon has been observed. Silver can be very effective against bacterial growth during offperiods of operation of ion exchange plants, but after several weeks bacteria were able to tolerate silver concentrations up to 10 mg Ag+/I [30]. On the other hand, the combined use of peracetic acid and silver resulted in a decrease of the silver concentration that could be tolerated by the bacteria from 0.25 mg Ag+/I to 0.03 mg Ag+/1 [17].
It can be concluded that although disinfection is possible with the product DEWA T 1-50, it is not clear whether the same disinfection can be obtained when hydrogen peroxide is used without silver addition.
4 Conclusions
In the combined ion exchange/biological denitrification process for nitrate removal from ground water, in which the anion exchange resins are regenerated in a closed circuit with a biological denitrification reactor, disinfection of the resins is necessary to produce a bacteriologically reliable water. This can be accomplished by the use of a disinfectant during the rinse phase of 1 h after regeneration. Two disinfectants can be used.
Peracetic acid is suitable in a concentration of 0.075% and needs a contact time of 15 min. In the combined ion exchange/ biological denitrification process this results in a peracetic acid use of 1.875 g/1 resin each regeneration, or 1.0 g/1 resin when the disinfectant is recirculated the last 7 minutes. Hydrogen peroxide is suitable in a concentration of 0.20% with a contact time of 45 min, resulting in a hydrogen peroxide use of 15.0 g/1 resin each regeneration. The latter is probably influenced by the presence of silver in the concentrated hydrogen peroxide solution. With the use of these disinfectants the treated ground water contains less than 30 cells/ml, and fulfils the EC standard of a maximum acceptable colony count of 100/ml.
Acknowledgement
These investigations were supported by the Netherlands Technology Foundation (STW); Rossmark-Van Wijk & Boerma Water Treatment Ltd.; the Ministry of Housing, Physical Planning and Environment; the Ministry of Economic Affairs and the Water Supply Company "Oos-telijk Gelderland".
References
[1] Bruyn, J.: Ground water quality - manuring: problems with nitrate in Eastern Gelderland. H,0 17, 502-505 (1984) (in Dutch)
[2] Furrer, O. J. und Stauffer, W.: Stickstoff in der Landwirtschaft. Gas-Wasser-Ahwasser 66, 460-472 (1986)
[3] Holtmeier, E. L.: Der Schutz des Grundwassers vor Nitratbela-stung. Gas- und Wasserfach- wasser/abwasser 125.482-487 (1984)
[4] Marsh, T. J.: Towards a nitrate balance for England and Wales. Water Serv. 1980, 601-606 (1980)
[5] Richard, Y. et Leprince, A.: Pollution par les nitrates: traitements disponibles. Trib. Cebedeau 35, 21-33 (1982)
[6] Sontheimer, H. und Rohmann, U.: Grundwasserbelastung mit Nitrat — Ursachen, Bedeutung, Losungswege. Gas- und Wasserfach- wasser/abwasser 125, 599-608 (1984)
[7] Strobel, K. und Konig, F.: MaBnahmen in Bayern zur Verringe-rung der Nitratbelastung des Trinkwassers. Gas- und Wasserfach-wasser/abwasser 126, 199-206 (1985)
[8] E. C: Council Directive of 15 July 1980 relating to the quality of water intended for human consumption, 80/778/EEC. Official Journal of the European Community 23, L229 11-29 (1980)
[9] Hoek. J. P. ran der and Klapwijk, A.: Nitrate removal from groundwater. Paper accepted for publication in Water Res. (1987)
[10] Hoek,J. P. van der, Hoek, W. F. van der and Klapwijk A.: Nitrate removal from ground water — Use of a nitrate selective resin and a low concentrated regenerant. Paper submitted for publication in Water, Air. and Soil Pollut. (1987)
[11] Frank, C. und Don, W.: Nitratentfernung aus dem Trinkwasser mit Hilfe biologischer Denitrifikation. Vom Wasser 65, 287—295 (1985)
[12] Poffe, R. Burggrave. A. de, Houtmeyers, J. and Verachtert, li.: Disinfection of effluents from municipal sewage treatment plants with peroxy acids. Zbl. Bakt. Hyg.. I. Abt. Orig. B /67, 337-346 (1978)
[13] Hecker, W.: Mikrobiologische Probleme bei den sekundaren Wasseraufbereitungsverfahren in pharmazeutischen Betrieben. Swiss Food/, 17-26(1979)
[14] Flemming, H. C.: Bakterienwachstum auf Ionenaustauscher-Harz - Untersuchungen an einem stark sauren Kationen-Austauscher. Teil I: Anhaftung und Verteilung der Bakterien; betriebliche Moglichkeiten der Wachstums-Unterdriickung. Z. Wasser-Abwasser-Forsch. 14. 132-139 (1981)
[15] Schubert, R. H. W. und Esamt, J.: Zur Frage der Nachverkeimung von Trink- und Brauchwasser. I. Der EinfluB von lonenaustau-scheranlagen. Zbl. Bakt. Hyg., I. Abt. Orig. B 155, 488-501 (1972)
[16] Flemming, H. C.: Zur Auswirkung der Regeneration auf die Verkeimung eines Kationen-Austauscherharzes beim Neutralaus-tausch. Vom Wasser 56. 215-224 (1981)
(17] Flemming, H. C.: Bakterienwachstum auf Ionenaustauscher-Harz - Untersuchungen an einem stark sauren Kationen-Austauscher. Teil III: Desinfektion mit Peressigsaure. Z. Wasser- Abwasser-Forsch. 77.229-234(1984)
Z. Wasser- Abwasscr-Forsch. 20. 155-160 (1987) 47

[18] Ballmoos, U. und Soldavini, H.: Desinfektion von Ionenaustau-schern mit Peressigsaure (PES) Spezialqualitat IA. Gas-Wasser-Abwasser 59, 487-488 (1979)
[19] Schwab, H. und Soldavini, H.: Desinfektion von Ionenaustau-schern mit Peressigsaure Spezialqualitat IA. Chemie-Technik 6, 197-200 (1977)
[20] Falk, M. und Losche, D.: Keimgehalt von deminieralisertem Wasser nach Peressigsaure-Behandlung der Ionenaustauscher vom Typ Wofatit. Pharmazie 26, 715-716 (1981)
[21] Zange, D. und Bauer, H. J.: Ober die Sterilisation von Ionenaus-tauschern mit Peressigsaure. Pharm. Prax. 26, 251-252 (1971)
[22] Michalson, A. W.: Production of sterile deionized water. Am. Perfumer Cosmetics 55, 37-40 (1970)
[23] Schubert, R. H. W.: Zur Frage der Nachverkeimung von Trink-und Brauchwasser. II. Apparative und verfahrenstechnische Ein-fliisse auf die Verkeimung und die Moglichkeit zur Desinfektion von Ionenaustauscheranlagen. Zbl. Bakt. Hyg., I. Abt. Orig. B 767,248-265 (1975)
[24] Wagner. R. und Flemming, H. C: Untersuchungen uber das Auswaschverhalten von Ionenaustauscherbetten. Z Wasser-Abwasser-Forsch. 77, 235-239 (1984)
[25] Dutch Normalised Standard Methods. The Netherlands Normalisation Institute, Delft, The Netherlands
[26] Mticke, H. und Sprossig, M.: Uber die antimikrobielle Wirkung der Peressigsaure. 1. Mitteilung: Herstellung, Gehaltsbestimmung und Eigenschaften der Peressigsaure. Pharmazie 22, 444—445 (1967)
[27] Poffe, R., Vanbrabani, R., Houtmeyers, J. and Verachtert, H.: Disinfection of effluents from municipal sewage treatment plants with hydrogen peroxide. Zbl. Bakt. Hyg., I. Abt. Orig. B 166, 390-398(1978)
[28] Flemming, H. C. und Rentschler, H.: Testverfahren zur Priifung der Empfindlichkeit von Wasserkeimen gegeniiber Silber-Ionen. Z. Wasser- Abwasser-Forsch. 16, 157-160 (1983)
[29] Piimpel, T. and Schinner, F.: Silver tolerance and silver accumulation of microorganisms from soil materials of a silver mine. Appl. Microbiol. Biotechnol. 24, 244-247 (1986)
[30] Flemming, H. C.: Bakterienwachstum auf Ionenaustauscher-Harz. Untersuchungen an einem stark sauren Kationen-Austau-scher. Teil II: Wirksamkeit von Silber-Zusatzen gegen die Nachverkeimung wahrend Stillstandszeiten. Z. Wasser- Abwasser-Forsch. 75.259-266(1982)
48
CHAPTER 6
Disinfection of Anion Exchange Resins in the Combined Ion Exchange/Biological Denitrification Process Part II: Effect on Resin Capacity*
By Jan Peter van der Hoek, Paul J. M. van der Ven and Abraham Klapwijk**
In the combined ion exchange/biological denitrification process for nitrate removal from ground water, the resins are regenerated in a closed system with a biological denitrification reactor. During regeneration the resins become bac-teriologically polluted. To safeguard the drinking water quality the resins have to be disinfected with 0.075% peracetic acid or 0.20% hydrogen peroxide, once every process cycle of service and regeneration. With 0.075% peracetic acid, all three examined resins (Duolite A 165, Amberlite IRA 996, Purolite A 520) showed important loss of capacity on the long term. It appeared that with 0.20% hydrogen peroxide this could be avoided. Although the capacities of Amberlite IRA 996 and Purolite A 520, both nitrate selective resins, were severely reduced, the nitrate selectivity was not changed by 0.075% peracetic acid.
Desinfektion von Anionenaustauschern im kombinierten Verfahren lonenaustausch/biologische Denitrifikation. Teil II Auswirkung auf die Harz-Kapazitat. Im kombinierten Verfahren lonenaustausch/biologische Denitrifikation zur Nitratentfernung aus Grundwasser werden die Ionenaustau-scher in einem geschlossenen System mit Hilfe eines biologi-schen Denitrifikationsreaktors regeneriert und dabei bakte-riologisch kontaminiert. Deshalb ist es notwendig, daB Harz nach jeder Regeneration mit 0,075%iger Peressigsaure oder mit 0,20% iger Wasserstoffperoxidlosung zu desinfizieren. Alle drei untersuchten Harze (Duolite A 165, Amberlite IRA 996 und Purolite A 520) zeigten einen betrachtlichen Verlust an Austauscherkapazitat bei der Behandlung mit Peressigsaure, mit Wasserstoffperoxid konnte dies vermieden werden. Obwohl die Kapazitat von Amberlite IRA 996 und Purolite A 520 - beide nitrat-selective Harze — bei der Verwendung von Peressigsaure sich erheblich verminderte, blieb die Nitratselektivitat durch die Peressigsaure unverandert.
1 Introduction The combined ion exchange/biological denitrification process is a technique for nitrate removal from ground water. In this process nitrate is removed by anion exchange resins while regeneration of the resins is carried out in a closed system with a biological denitrification reactor [1, 2]. As the ion exchange columns become polluted during this regeneration procedure, a disinfectant has to be used to prevent bacteriological contamination of the treated ground water. Especially disinfection of the resins appeared to be an attractive method to safeguard the drinking water quality [3 -6] .
In the combined ion exchange/biological denitrification process disinfection of the resins is possible after regeneration during the rinse phase, before the resins are used for nitrate removal again. For this purpose it is advisable to use 0.075% peracetic acid for 15 minutes or 0.20% hydrogen peroxide for 45 minutes during the rinse phase of 1 h, both with a flow rate of 10 BV/h (BV = bed volumes) [7], An important aspect of the use of disinfectants in ion exchange systems is the effect on resin capacity. With respect to the use of peracetic acid Schwab and Soldavini [8] reported that with 1% peracetic acid the capacity of anion and cation exchange resins did not change and only a slight decrease was observed with 5%
! Part I: Effect on Water Quality. Z.Wasser- Abwasser-Forsch. 20, 155-160(1987)
; Dipl.-Ing. J. P. van der Hoek, P. J. M. van der Ven and Dr. A. Klapwijk, Wageningen Agricultural University, Department of Water Pollution Control, De Dreyen 12, 6703 BC Wageningen, The Netherlands
peracetic acid. The contact time was l h . According to Zange and Bauer [9] disinfection for 20 min with 0.2% peracetic acid did not affect the capacity of anion exchange resins, but the capacity of a cation exchange resin decreased with 2%. However, in practice cumulative contact times are much longer during successive disinfections. Therefore Falk et al. [10] examined the effect of 0.2% peracetic acid on resin capacity during a period of 25 weeks. They found that the capacity of anion exchange resins only slightly decreased in this period (2.3—7.1%), but the capacity of cation exchange resins showed a reduction of 8 .3-33.7%.
All experiments described above deal with a batch-wise contact between resin and disinfectant. In practice disinfection is carried out by pumping the disinfectant continuously through the ion exchange column to ensure a constant concentration the whole disinfection period. Flemming [5] examined the effect of peracetic acid on a cation exchange resin in a continuous experiment by pumping a peracetic acid solution 24 h through the column. It was found that up to a concentration of 1% peracetic acid no loss of resin capacity appeared. With 5% peracetic acid a decrease of 14% was measured. With respect to the use of hydrogen peroxide as disinfectant of anion exchange resins and effect on resin capacity no information was found in literature, because this is not often used in ion exchange systems.
In our experiments we examined the effect of peracetic acid and hydrogen peroxide on the total ion exchange capacity of three strong base anion resins. We used a sulfate selective resin (Duolite A 165) and two nitrate selective resins (Amberlite IRA 996 and Purolite A 520). Column experiments as well as batch-wise experiments were performed. For the nitrate selec-
Z. Wasser- Abwasser-Forsch. 20, 193-196 (1987) © VCH Verlagsgcsellschaft mbH. D-6940 Weinheim. 1987 0044-3727/87/0612-0193$02.50/0
49

tive resins we also studied the effect of peracetic acid on nitrate-sulfate selectivity. Both binary equilibrium isotherms and break-through curves before and after peracetic acid treatment were compared.
2 Materials and Methods
2.1 Ion exchange resins and disinfectants
Experiments were conducted with three strong base macro porous anion exchange resins: Duolite A 165, Amberlite IRA 996, and Purolite A 520. The total exchange capacities of these resins are 1.19, 1.01, and 0.94 equiv/1 respectively. The latter two resins are nitrate selective. Peracetic acid and silver containing hydrogen peroxide, as described in [7], were used as disinfectants.
2.2 Column experiments with disinfectants
Column experiments to study the effect of disinfection on resin capacity were carried out in ion exchange columns with an internal diameter of 3.2cm and a height of 40cm. We used 0.075% peracetic acid and 0.20% hydrogen peroxide. The disinfectant was pumped upflow through the columns with a flow rate of 10 BV/h. These are the process conditions of the combined ion exchange/biological denitrification process [7]. After contact with the disinfectant for 24 h, 48 h, 72 h, or 168 h the resins were turned to the bicarbonate form to measure the total exchange capacity.
2.3 Batch experiments with disinfectants
The effect of a 0.15% peracetic acid solution and a 0.20% hydrogen peroxide solution on the capacity of Duolite A 165 was studied in a batch experiment by adding resin samples of 50 ml to the solution and storing this at 4 °C to maintain the peracetic acid concentration close to the desired value. Every week this concentration was checked and the solution was renewed whenever necessary. After 4, 10, and 15 weeks the capacity of the resin was measured.
2.4 Equilibrium isotherms of nitrate and sulfate and selectivity coefficients -
Binary equilibrium isotherms were determined at a total anion concentration in liquid phase of 0.012 equiv/1. From the isotherms the selectivity coefficient KNO4, was calculated. The selectivity coefficient KNO1, follows from the chemical equilibrium
S O l " + 2NOT ^ s a p + 2NO3-
and is defined as
„so. POT] • [NO3-]2
"""> [ s o n • [NO3-]2
with[S04~], [NO3"] = concentrations of SOl" andNOf on the resin (equiv/1)
[SO 2 - ] , [N03"]= concentrations of SO 2" and N03~ in solution (equiv/1)
2.5 Break-through experiments
Break-through experiments were conducted with Amberlite IRA 996 with resin, not contacted with peracetic acid and with resin, contacted with peracetic acid (72h, 10 BV/h, 0.075% peracetic acid). Before the break-through experiments were started the resins were turned to the bicarbonate form with a
solution containing 50 g NaHC03/l, with a flow rate of 10 BV/h for 5h. The break-through experiments were run with a flow rate of 35 BV/h in columns with an internal diameter of 3.2 cm and a height of 40 cm. The influent consisted of deionized water enriched with nitrate and sulfate (not disinfected column: 18.1 mg NOf-N/1 and 139.4mg S02"/1 disinfected column 17.4mg NO3--N/I and 133.7mg S02"/1).
2.6 Determination of total ion exchange capacity
The total anion exchange capacity of the resins was determined by pH titration of resins in the bicarbonate form in water with a 0.1 N HC1 solution after addition of excess NaCl to the water-resin mixture.
3 Results
3.1 Effect of disinfection on resin capacity
In Figures 1 and 2 the effect of peracetic acid and hydrogen peroxide on resin capacity is shown, as measured in the experiments in which the disinfectant was pumped continuously through the ion exchange columns. Especially the nitrate selective resins Amberlite IRA 996 and Purolite A 520 appeared to be very sensitive to peracetic acid. During the first 24h peracetic acid only had little effect on the capacity of Duolite A 165, but the next two days clearly a loss of exchange capacity was visible. The effect of hydrogen peroxide on resin capacity was quite different from the effect of peracetic acid. Hydrogen peroxide had no influence on Purolite A 520, and with respect to
• Amberlite IRA 996 - 0075 % peracetic ac id
o Amberlite IRA 996 - 0 20 % hydrogen peroxide * Purol i te A 520 - 0075 % peracet ic acid & Puro l i te A 520 - 0 20 % hydrogen peroxide
loss of resin capacity (% )
401
20 40 60 80 time ( h |
Fig. 1. Loss of resin capacity of Amberlite IRA 996 and Purolite A 520 by disinfection with 0.075% peracetic acid and 0.20% hydrogen peroxide (disinfection in columns, flow rate 10 BV/h)
loss of resin capacity (°/e 30-
• 0.07S % peracet ic ac id
o 0.20 % hydrogen peroxide
60 BO
t ime (h )
Fig. 2. Loss of resin capacity of Duolite A 165 by disinfection with 0.075% peracetic acid and 0.20% hydrogen peroxide (disinfection in columns, flow rate 10 BV/h)
50 Z. Wasser- Abwasser-Forsch. 20, 193-196 (1987)

Amberlite IRA 996 it stabilized after 2 days, resulting in a loss of 8%. Also the effect on Duolite A 165 was negligible. From Figures 1 and 2 it looks as if the effect of peracetic acid on Amberlite IRA 996 and Purolite A 520 stabilizes, while this is not the case with Duolite A165. Therefore it was examined how resin capacities of Amberlite IRA 996 and Duolite A 165 were changed during seven days of continuous contact with peracetic acid. For Amberlite IRA 996 this resulted in a loss of capacity of 52% and for Duolite A 165 in 44%.
Table 1 summarizes the results of the experiments in which the effect of peracetic acid (0.15%) and hydrogen peroxide (0.20%) on the capacity of Duolite A 165 was studied batch-wise.
Table 1. Effect of peracetic acid (0.15%) and hydrogen peroxide (0.20%) on resin capacity of Duolite A 165, determined in batch-experiments
contact time (weeks)
4 10 15
loss of peracetic acid
4 8
15
resin capacity (%) hydrogen peroxide
0 0 2
3.2 Effect of disinfection on resin selectivity
As can be seen from Figure 1, peracetic acid especially reduces the capacity of the nitrate selective resins Amberlite IRA 996 and Purolite A 520. To examine whether peracetic acid also affected the selectivity, the binary equilibrium isotherms of sulfate and nitrate were measured with resin, not disinfected and with resin, disinfected with 0.075% peracetic acid for 24 h (in columns, flow rate 10 BV/h). From the equilibrium isotherms in Figure 3 it is clear that the selectivity of these resins is not changed by peracetic acid. In accordance with these results the selectivity coefficient KN°' , which can be calculated from the equilibrium isotherms didn't change significantly. For Purolite A 520 the KNO4, value was 7.3 • 10~4 before and 7.5 • 10~4 after peracetic acid treatment. For Amberlite IRA 996 these values were respectively 5.2 • 10~4 and 8.5 • 1<T4. With Amberlite IRA 996 the effect of peracetic acid on resin selectivity was also studied in a break-through experiment. Figure 4 shows the break-through curve of Amberlite IRA 996, not treated with a disinfectant, and Figure 5 shows the breakthrough curve of Amberlite IRA 996, after it has been treated for 72 h with 0.075% peracetic acid (in a column, flow rate 10 BV/h).
4 Discussion
From the column experiments it is clear that especially peracetic acid reduces the capacity of all three ion exchange resins. For the sulfate selective resin Duolite A 165 the results are in close agreement with the results of Flemming [5]. During 24 h of contact Flemming measured no loss of capacity while we measured only a loss of 1.5%. However, when this experiment was extended, also Duolite A 165 showed an important reduction of exchange capacity, resulting in a loss of 44% after seven days of contact. For the nitrate selective resins Amberlite IRA 996 and Purolite A 520 peracetic acid immediately reduces the exchange capacity, and from the effect of peracetic acid on Amberlite IRA 996 during 7 days it is apparent that this effect doesn't stabilize. Hydrogen peroxide is less aggressive to ion exchange resins. Only Amberlite IRA 996 showed a loss of capacity, but this was no more than 8% and stabilized after 48 h of continuously contact.
Uo
/ l\
Fig. 3. Binary equilibrium isotherms of nitrate and sulfate. XSOj2- = equivalent fraction sulfate in liquid phase = sulfate concentration in liquid/total anion concentration in liquid; XSo42- = equivalent fraction sulfate on resin phase = sulfate on resin/ total ion exchange capacity; la Amberlite IRA 996, not disinfected lb Amberlite IRA 996, disinfected with 0.075% peracetic acid (24h,
10 BV/h) Ha Purolite A 520, not disinfected lib Purolite A 520, disinfected with 0.075% peracetic acid (24h,
10 BV/h)
NC 3-N(mg/l)
25i
20-
15
10-
5'
0
S( \ 2 " Img/L)
0.-o-o-o.^_ r200
f \ / \
/
/ h" / o' . ' N O " N
150
•100
•50
200 400 600
bed volumes
Fig. 4. Break-through curve of Amberlite IRA 996, not disinfected. Influent concentrations 18.1 mg NCV-N/l and 139.4mg SOj"/l; flow rate 35 BV/h; resin in bicarbonate form
N0 r N(mg/ l )
25T
20-
15
10
5-
SO^lmg/l I
200
\
/ / NO " N
/• _ 3 g = p : J . . . ^ ^ _
150
•100
50
200 400 600 bed volumes
Fig. 5. Break-through curve of Amberlite IRA 996, disinfected with 0.075% peracetic acid (72 h, 10 BV/h). Influent concentrations 17.4 mg NCV-N/l and 133.7mg SO|"/l; flow rate 35 BV/h; resin in bicarbonate form
Z. Wasser- Abwasser-Forsch. 20, 193-196 (1987)
51
Although the capacity of the nitrate selective resins is severely reduced by peracetic acid, they still remain nitrate selective, as can be seen from the binary equilibrium isotherms (Figure 3). The break-through curves of Amberlite IRA 996 show same results (Figures 4 and 5). With a not disinfected resin, as well as with a disinfected resin (72 h, 0.075% peracetic acid, 10 BV/h), sulfate will break-through first and effluent sulfate concentrations rise above the influent concentration because sulfate becomes displaced from the resin by nitrate. The number of bed volumes that could be treated with both ion exchange columns before nitrate and sulfate break-through started, is summarized in Table 2. The reduction is 43%. This is in good accordance with the loss of capacity of Amberlite IRA 996 during 3 days of continuously contact with 0.075% peracetic acid (39%, Figure 1).
Table 2. Start of nitrate and sulfate break-through of Amberlite IRA 996, not disinfected, and disinfected with 0.075% peracetic acid (72 h, 10 BV/h). Flow rates and influent concentrations as in Figures 4 and 5
Amberlite IRA 996 number of bed volumes treated before break-through started SO|" NOf
not disinfected disinfected
140 350 200
disinfection with peracetic acid takes place 15 min every 21 h. This means that with Duolite A 165 a contact time of 7 days implies a total process period of 378 days, in which the capacity decreases with 44%. With Amberlite IRA 996 a contact time of 7 days implies a total process period of 588 days, in which the capacity decreases with 52%. It can be concluded that the process can only be operated with hydrogen peroxide as disinfectant to avoid reduction of ion exchange capacity of the resins. When a nitrate selective resin has to be used, the application of Purolite A 520 or Amberlite IRA 996 makes no difference, because with a loss of 8% the latter will have the same total ion exchange capacity as Purolite A 520, which shows no reduction of capacity.
Acknowledgement
These investigations were supported by the Netherlands Technology Foundation (STW); Rossmark-Van Wijk & Boerma Water Treatment Ltd.; the Ministry of Housing, Physical Planning and Environment; the Ministry of Economic Affairs and the Water Supply Company "Oostelijk Gelderland". The authors thank Jeroen Verheijen, Pirn Vis and Wim van der Hoek for performing part of the analyses.
References
The difference in response to peracetic acid treatment between nitrate selective resins (fast response) and sulfate selective resins (slow response) probably is a result of a difference in functional groups of these resins. Nitrate selectivity is changed by the molecular structure of the alkyl substituents on the quarternary amine ion exchange resins. Sulfate selective strong base anion resins are trimethyl amine resins (type I) or dimethyl ethanol amine resins (type II) [11], while in nitrate selective resins the functional groups contain more C-atoms. Guler [12] developed a tributyl amine resin and Dore et al. [13] used a triethyl resin. Unfortunately no information was obtained from the manufacturers of Amberlite IRA 996 and Purolite A 520 about the exact composition of the functional groups of these nitrate selective resins.
By increasing the length of the functional groups it might be possible that they are more easily oxidized by peracetic acid, resulting in a direct loss of resin capacity. Because the nitrate-sulfate selectivity is unchanged, it can be concluded that the functional groups are totally oxidized, without destruction of the long alkyl groups into methyl groups. In that case the selectivity would have changed in the direction of sulfate. Another possibility is that the total resin, including the matrix, is destroyed by peracetic acid. From our experimental results it can not be concluded whether the functional groups or the whole resin is oxidized by peracetic acid. The differences in results with column experiments and batch-wise experiments show that batch-wise experiments are rather unreliable to estimate the effect of disinfectants on resin capacity. This might explain the relatively low effect of disinfectants on resin capacity reported in literature [8-10] , compared with our results.
5 Conclusions
The results have important consequences on the combined ion exchange/biological denitrification process for nitrate removal from ground water. When the process is run with a sulfate selective resin like Duolite A165, disinfection of the resins with peracetic acid takes place 15 min every 13.5 h (once every process cycle of service and regeneration). When the process is run with a nitrate selective resin like Amberlite IRA 996
[1] Hoek, J. P. van der and Klapwijk, A.: Nitrate removal from ground water. Water Res. 21, 989-997 (1987)
[2] Hoek, J. P. van der, Hoek, W. F. van der and Klapwijk, A.: Nitrate removal from ground water - Use of a nitrate selective resin and a low concentrated regenerant. Paper submitted for publication in Water, Air, and Soil Pollut. 1987
[3] Ballmoos, U. und Soldavini, H.: Desinfektion von Ionenaustau-schern mit Peressigsaure (PES) Spezialqualitat IA. Gas-Wasser-Abwasser 59, 487-488 (1979)
[4] Falk, M. und Losche, D.: Keimgehalt von demineralisiertem Wasser nach Peressigsaurebehandlung der Ionenaustauscher vom Typ Wofatit. Pharmazie 26, 715-716 (1981)
[5] Flemming, H. C.: Bakterienwachstum auf lonenaustauscher-Harz — Untersuchungen an einem stark sauren Kationen-Austauscher. Teil III: Desinfektion mit Peressigsaure. Z. Wasser- Abwasser-Forsch. 17, 229-234 (1984)
[6] Schubert, R. H. W. : Zur Frage der Nachverkeimung von Trink-und Brauchwasser. II. Apparative und verfahrenstechnische Ein-fliisse auf die Verkeimung und die Moglichkeit zur Desinfektion von Ionenaustauscheranlagen. Zbl. Bakt. Hyg., I. Abt. Orig. B 161, 248-265 (1975)
[7] Hoek, J. P. van der, Verheijen, J., Vis, P. 1. M. and Klapwijk, A.: Disinfection of anion exchange resins in the combined ion exchange/biological denitrification process. Part I: Effect on water quality. Z. Wasser-Abwasser-Forsch. 20, 155-160 (1987)
[8] Schwab, H. und Soldavini, H.: Desinfektion von Ionenaustau-schern mit Peressigsaure Spezialqualitat IA. Chemie-Technik 6, 197-200 (1977)
[9] Zange, D., und Bauer, H. J.: Uber die Sterilisation von Ionenaus-tauschern mit Peressigsaure. Pharm. Prax. 26, 251-252 (1971)
[10] Falk, M., Hellmig, R., und Sollik, £.. Stabilitat von Wofatit-Ionenaustauschern gegeniiber Peressigsaure. 2. Mitteilung: Uber die Peressigsaure-Desinfektion von Ionenaustauschern. Pharmazie 37, 387-388 (1982)
[11] Deguin, A., Rouas, P., Neveu, A., and Gaspard, M.: Les nitrates dans l'eau potable — Differentes possibilites de traitement — Resultats obtenu par echanges d'ions. J. Francais d'Hydrologie 9, 11-90 (1978)
[12] Guler, G. A.: Removal of nitrate from water supplies using a tributyl amine strong base anion exchange resin. United States Patent, Patent Number 4,479,877 (1984)
[13] Dore, M., Perot, J., and Simon, Ph.: Eliminations des nitrates sur resines echangeuses d'ions — Influence de la structure de la macromolecule sur la selectivity et la qualite phisico-chimique des eaux denitratees. Proceedings of the Congress "Nitrates in Water", SITE 85, Paris, October 22-24, 1985
52 Z. Wasser- Abwasser-Forsch. 20, 193-196 (1987)
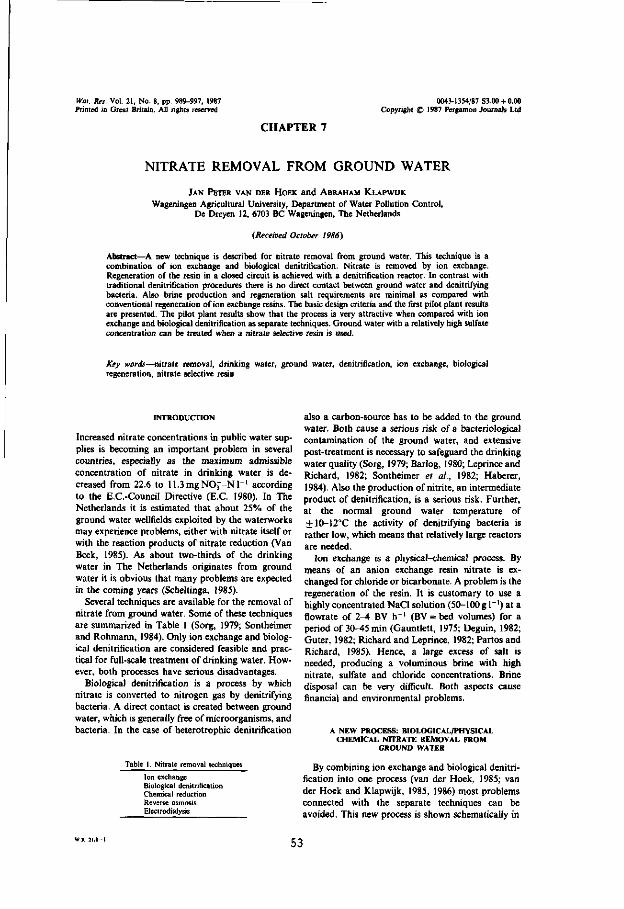
Wat. Res. Vol. 21, No. 8, pp. 989-997, 1987 Printed in Great Britain. All rights reserved
0043-1354/87 S3.00 + 0.00 Copyright © 1987 Pergamon Journals Ltd
CHAPTER 7
NITRATE REMOVAL FROM GROUND WATER
JAN PETER VAN DER HOEK and ABRAHAM KLAPWUK
Wageningen Agricultural University, Department of Water Pollution Control, De Dreyen 12, 6703 BC Wageningen, The Netherlands
(Received October 1986)
Abstract—A new technique is described for nitrate removal from ground water. This technique is a combination of ion exchange and biological denitrification. Nitrate is removed by ion exchange. Regeneration of the resin in a closed circuit is achieved with a denitrification reactor. In contrast with traditional denitrification procedures there is no direct contact between ground water and denitrifying bacteria. Also brine production and regeneration salt requirements are minimal as compared with conventional regeneration of ion exchange resins. The basic design criteria and the first pilot plant results are presented. The pilot plant results show that the process is very attractive when compared with ion exchange and biological denitrification as separate techniques. Ground water with a relatively high sulfate concentration can be treated when a nitrate selective resin is used.
Key words—nitrate removal, drinking water, ground water, denitrification, ion exchange, biological regeneration, nitrate selective resin
INTRODUCTION
Increased nitrate concentrations in public water supplies is becoming an important problem in several countries, especially as the maximum admissible concentration of nitrate in drinking water is decreased from 22.6 to 11.3mgN03~-Nr1 according to the E.C.-Council Directive (E.C. 1980). In The Netherlands it is estimated that about 25% of the ground water wellfields exploited by the waterworks may experience problems, either with nitrate itself or with the reaction products of nitrate reduction (Van Beek, 1985). As about two-thirds of the drinking water in The Netherlands originates from ground water it is obvious that many problems are expected in the coming years (Scheltinga, 1985).
Several techniques are available for the removal of nitrate from ground water. Some of these techniques are summarized in Table 1 (Sorg, 1979; Sontheimer and Rohmann, 1984). Only ion exchange and biological denitrification are considered feasible and practical for full-scale treatment of drinking water. However, both processes have serious disadvantages.
Biological denitrification is a process by which nitrate is converted to nitrogen gas by denitrifying bacteria. A direct contact is created between ground water, which is generally free of microorganisms, and bacteria. In the case of heterotrophic denitrification
Table 1. Nitrate removal techniques
Ion exchange Biological denitrification Chemical reduction Reverse osmosis Electrodialysis
also a carbon-source has to be added to the ground water. Both cause a serious risk of a bacteriological contamination of the ground water, and extensive post-treatment is necessary to safeguard the drinking water quality (Sorg, 1979; Barlog, 1980; Leprince and Richard, 1982; Sontheimer et at., 1982; Haberer, 1984). Also the production of nitrite, an intermediate product of denitrification, is a serious risk. Further, at the normal ground water temperature of + 10-12°C the activity of denitrifying bacteria is rather low, which means that relatively large reactors are needed.
Ion exchange is a physical-chemical process. By means of an anion exchange resin nitrate is exchanged for chloride or bicarbonate. A problem is the regeneration of the resin. It is customary to use a highly concentrated NaCl solution (50-100 gl"1) at a flowrate of 2-4 BV h_ l (BV = bed volumes) for a period of 30-45 min (Gauntlett, 1975; Deguin, 1982; Guter, 1982; Richard and Leprince, 1982; Partos and Richard, 1985). Hence, a large excess of salt is needed, producing a voluminous brine with high nitrate, sulfate and chloride concentrations. Brine disposal can be very difficult. Both aspects cause financial and environmental problems.
A NEW PROCESS: BIOLOGICAL/PHYSICAL CHEMICAL NITRATE REMOVAL FROM
GROUND WATER
By combining ion exchange and biological denitrification into one process (van der Hoek, 1985; van der Hoek and Klapwijk, 1985, 1986) most problems connected with the separate techniques can be avoided. This new process is shown schematically in
53

JAN PETER VAN DER HOEK and ABRAHAM KLAPWUK
nitrate low groundwater nitrate low groundwater
I.E. 1 IE 2
nitrate rich groundwater
IE. 1 I.E. 2
nitrate rich groundwater
ion exchanger 1 : ion exchanger 2
nitrate removal regeneration
ion exchanger 1 : regeneration ion exchanged : nitrate removal
Fig. 1. Combination of ion exchange and biological denitrificalion: biological/physical chemical nitrate removal from ground water.
Fig. 1. Nitrate is removed from the ground water by ion exchange and for the regeneration of a nitrate loaded resin a denitrifkation reactor is used.
In the simplest form one ion exchange column (column 1) is used for production of potable water while another ion exchange column (column 2) is regenerated. When ion exchange column 1 is exhausted and ion exchange column 2 is regenerated the denitrification reactor is connected with the exhaus
ted ion exchange column 1 and the regenerated resin (column 2) is used for potable water production. Depending on the ratio of run time and regeneration time more ion exchange columns can be used in this process.
The regeneration process itself is schematically shown in Figs 2 and 3. It can be carried out with a NaCl solution (Fig. 2) or a NaHCOj solution as regenerant (Fig. 3). The regenerant, for example a
NaCl
denitrification reactor
NO," — - N,
| j - resin which has to y/ be regenerated
I cr+ NOJ^CT%NO3'
Fig. 2. Regeneration of a nitrate-loaded resin into the chloride form with a denitrification reactor.
NaHCO,
HCCK
denitrification reactor
NO3--
CH,0H — COj/HCOfj l HCO3' • N03"
resin which has to s y be regenerated I HCO3" + NOf — HCO3" • N03"
organic C-source
Fig. 3. Regeneration of a nitrate-loaded resin into the bicarbonate form with a denitrincation reactor.
54

Nitrate removal from ground water
NaHCOj solution, passes over the ion exchange column to exchange nitrate ions for bicarbonate ions. After passage the nitrate rich regenerant is led through a denitrification reactor where denitrifying bacteria convert nitrate to nitrogen gas. The organic C-source (methanol) which has to be added is converted into bicarbonate, carbonate and water. The regenerant is recirculated through the ion exchange column and the denitrification reactor, until the ion exchanger has reached a sufficient bicarbonate loading. The regeneration thus takes place in a closed system.
Compared with separate ion exchange or biological denitrification the most important advantages of this new process are:
(1) The regeneration is carried out in a closed system in which the production of a voluminous brine can be avoided and the salt requirements are minimized. The use of NaHCOj as regenerant has the advantage that the system itself produces the salt necessary for regeneration because bicarbonate is an endproduct of biological denitrification. When NaCl is used as regenerant only the stoichiometric required amount has to be dosed.
(2) As the biological process does not take place in direct contact with the ground water there is no risk that nitrite production will affect the water quality.
(3) There is no direct contact of bacteria and the C-source with the ground water and concomitant contamination. Still pollution of the resin by carryover of suspended material from the denitrification reactor to the ion exchange column is possible. However, measures against this can be taken in the regeneration circuit itself, so there is no need for an extensive post-treatment.
MATERIALS AND METHODS
Ion exchange experiments Breakthrough and regeneration experiments were con
ducted in columns with i.d.s of 1.9 or 3.2 cm and a height of 14, 19 or 40 cm.
The total anion exchange capacity of resins was measured by potentiometric titration of resins in the chloride form in water with a AgN03 solution after addition of excess KN03 to the water-resin mixture, or by pH titration of resins in the bicarbonate form in water with a HC1 solution after addition of excesss NaCl to the water-resin mixture.
Selectivity coefficients and binary equilibrium isotherms were determined at a total anion concentration of 0.012 equiv 1 ' in liquid phase.
Resin disinfection experiments were performed with ion exchange columns (resin Duolite A 165) with an i.d. of 1.9 cm and a height of 40 cm.
Denitrification experiments The effect of high sodium bicarbonate concentrations on
denitrifying sludge was studied in 51. batch reactors. To avoid accumulation of bicarbonate, one of the end products of denitrification with methanol, the effect of high sodium chloride concentrations on denitrifying sludge was studied in an upflow sludge blanket denitrification reactor with a working volume of 2.51.
Pilot plant experiments Design and dimensions of the pilot plant are described in
"Results and Discussion".
Analyses Nitrate was analyzed either through the salicylate method
according to the Dutch Normalized Standard Methods (NNI1981) or by liquid chromatography with a Chrompack HPLC column, packing material Ionospher tmA (dim: 250 x 4.6) and u.v. detection at 205 nm (Spectroflow 773 u.v. adsorbance detector). Alkalinity was determined according to the Dutch Normalized Standard Methods (NNI, 1966). Sulfate was analyzed by liquid chromatography with the same column as used for nitrate and a Knauer differential refractometer. Chloride was analyzed poten-tiometrically using a Mettler DL 40 RC memotitrator and a Mettler DM 141 combined Ag electrode, or by liquid chromatography along with sulfate.
Standard plate counts were performed at 22°C on glucose yeast extract according to the Dutch Normalized Standard Methods (NNI, 1982).
The accumulation of organics fouling the ion exchange resins was measured by extracting samples of resin with a solution containing 2% NaOH and 10% NaCl. The optical density of the extract at 435 nm was related to the optical density of a standard humic substance. For this purpose a solution of commercially available humic acids was used, which was prepared by adding NaOH to a 0.25% solution of sodium humate (Fluka) in deionized water until pH 11 was reached. After stirring for 24 h the suspension was neutralized with HC1 to pH 5.5 which resulted in partial precipitation of the humic compounds. This solution was filtered over a 0.45 /i m membrane filter and used as standard humic substance solution.
RESULTS AND DISCUSSION
Basic design criteria
Salt concentration of the regenerant. The optimal salt concentration of the regenerant is controlled by two factors. Very high salt concentrations can have an inhibiting effect on the biological denitrification, but the salt concentration must be high enough to produce sufficient regeneration of the resin within a reasonable time.
Claus and Kutzner (1985) demonstrated that 20 g NaCl 1 ' has no effect on autotrophic denitrification. Denitrification has also been observed in marine sediments (Sarensen, 1978, 1979). Our experiments on the effect of NaCl and NaHCOj on the capacity of denitrifying sludge with methanol as C-source are summarized in Fig. 4. It is clear that with NaHCOj concentrations of 25-30 g l _ 1 and NaCl concentrations of 10-15 g 1~' the dentrification capacity is still present for about 80%.
Figure 5 shows that regeneration of a nitrate loaded resin is possible with a solution containing 30 g NaHCOj l"1 (357m-equivl ' ) . Compared with the usual regeneration procedure with 50-100 g NaCl l~ \ a flowrate of 2-4 BVh ' and a period of approx. 30-45 min (Gauntlett, 1975; Deguin, 1982; Guter, 1982; Richard and Leprince, 1982; Partos and Richard, 1985) more time and a higher flowrate are needed. However, with 30 g NaHCOj I"1 and a flow-rate of lOBVh - ' almost complete regeneration is possible in 3.5 h.
55

JAN PETER VAN DEK HOEK and ABRAHAM KLAPWUK
denitrificQtion capacity ( % )
100
80
60 -I
kO
20
after adaptation
NaHCO,
• NaCI
5 10 15 20 25 30 35
salt concentration ( g / l )
Fig. 4. Effect of high NaCI and NaHC03 concentrations on denitrification.
In Table 2 the selectivity coefficients K°0j and ATSof1 of some strong base anion exchange resins are shown. The coefficients are defined as
vNOj — [A-]-[NO,-] [NOf)[A-]
with
[A^], [NO^] = concentration of A" and N03~ on the resin (equiv 1~')
[A-], [NOj-] = concentration of A" and N03~ in solution (equiv 1"').
Because K^0l is about twice ATfJS?3 •' ' s possible to use a NaCI solution as regenerant with a concentration which is only half of the NaHC03 concentration. So, regeneration can also be carried out in 3.5 h with 10.4g NaCll"1 (178m-equivl-') and a flowrate of lOBVh"1.
Selection of denitrification reactor type. The denitri-fication reactor in this process must fulfill a number of conditions:
(1) Hydraulically it should fit in the process: this means that the flowrate through the denitrification reactor must equal the regeneration flowrate through
% regeneration
100
Fig. 5. Regeneration of a nitrate-loaded resin (Duolite A 161) with a solution containing 30g NaHCOjl-' (regeneration percentage = regeneration as percentage of total ion
exchange capacity).
the ion exchange column, otherwise a bypass would be necessary.
(2) The reactor must be capable to treat solutions with very high nitrate concentrations without re-
Table 2. Capacity and selectivity coefficients K^^ and ATfJo?1 °f strong t anion exchange resins
Anion exchange resin
Macroporous resins Duolite A 161 Duolite A 162 Duolite A 165 Bayer Lewatit MP 500 Bayer Lewatit MP 600 Amberlite IRA 996
Gel resins Bayer Lewatit M 500 Bayer Lewatit M 600
Capacity (equiv l"1)
111 1.19 1.19 109 1.14 1.01
1.36 1.29
^ N 0 3
0.30 0.24 0.35 0.36 0.30 0.11
0.33 0.35
ANOj
0.16 0.12 0.17 0.18 0.15 0.04
0.18 0.18
56
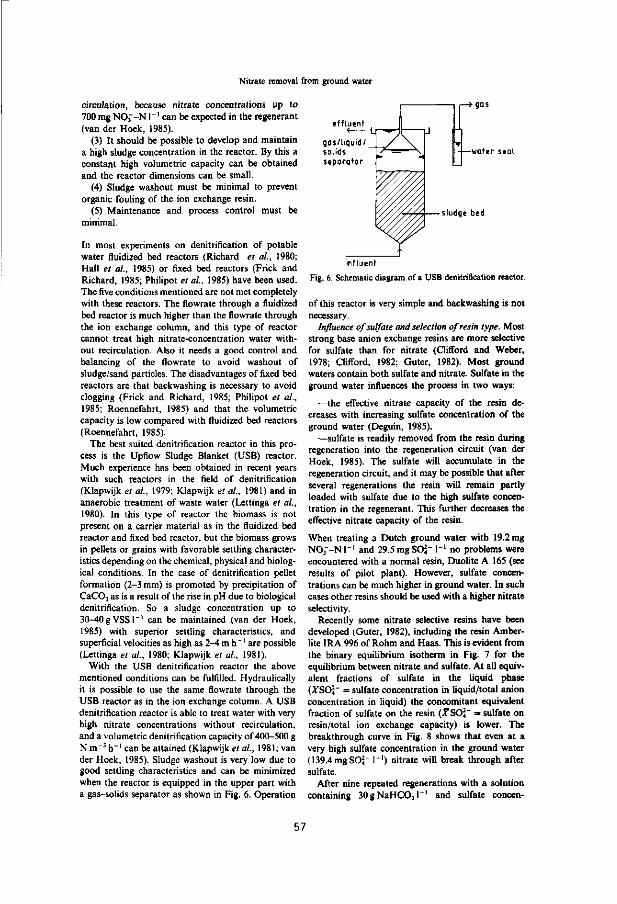
Nitrate removal from ground water
circulation, because nitrate concentrations up to 700mgNO3"-N I"1 can be expected in the regenerant (van der Hoek, 1985).
(3) It should be possible to develop and maintain a high sludge concentration in the reactor. By this a constant high volumetric capacity can be obtained and the reactor dimensions can be small.
(4) Sludge washout must be minimal to prevent organic fouling of the ion exchange resin.
(5) Maintenance and process control must be minimal.
In most experiments on denitrification of potable water fluidized bed reactors (Richard el al, 1980; Hall et al, 1985) or fixed bed reactors (Frick and Richard, 1985; Philipot el al, 1985) have been used. The five conditions mentioned are not met completely with these reactors. The flowrate through a fluidized bed reactor is much higher than the flowrate through the ion exchange column, and this type of reactor cannot treat high nitrate-concentration water without recirculation. Also it needs a good control and balancing of the flowrate to avoid washout of sludge/sand particles. The disadvantages of fixed bed reactors are that backwashing is necessary to avoid clogging (Frick and Richard, 1985; Philipot et al, 1985; Roennefahrt, 1985) and that the volumetric capacity is low compared with fluidized bed reactors (Roennefahrt, 1985).
The best suited denitrification reactor in this process is the Upflow Sludge Blanket (USB) reactor. Much experience has been obtained in recent years with such reactors in the field of denitrification (Klapwijk et al, 1979; Klapwijk et al, 1981) and in anaerobic treatment of waste water (Lettinga et al, 1980). In this type of reactor the biomass is not present on a carrier material as in the fluidized bed reactor and fixed bed reactor, but the biomass grows in pellets or grains with favorable settling characteristics depending on the chemical, physical and biological conditions. In the case of denitrification pellet formation (2-3 mm) is promoted by precipitation of CaC0 3 as is a result of the rise in pH due to biological denitrification. So a sludge concentration up to 30-40gVSSl" ' can be maintained (van der Hoek, 1985) with superior settling characteristics, and superficial velocities as high as 2-4 m h" ' are possible (Lettinga et al, 1980; Klapwijk et al, 1981).
With the USB denitrification reactor the above mentioned conditions can be fulfilled. Hydraulically it is possible to use the same flowrate through the USB reactor as in the ion exchange column. A USB denitrification reactor is able to treat water with very high nitrate concentrations without recirculation, and a volumetric denitrification capacity of 400-500 g N m " 3 h " ' can be attained (Klapwijk et al, 1981; van der Hoek, 1985). Sludge washout is very low due to good settling characteristics and can be minimized when the reactor is equipped in the upper part with a gas-solids separator as shown in Fig. 6. Operation
effluent
gas
water seal
sludge bed
influent
Fig. 6. Schematic diagram of a USB denitrification reactor.
of this reactor is very simple and backwashing is not necessary.
Influence of sulfate and selection of resin type. Most strong base anion exchange resins are more selective for sulfate than for nitrate (Clifford and Weber, 1978; Clifford, 1982; Guter, 1982). Most ground waters contain both sulfate and nitrate. Sulfate in the ground water influences the process in two ways:
—the effective nitrate capacity of the resin decreases with increasing sulfate concentration of the ground water (Deguin, 1985).
—sulfate is readily removed from the resin during regeneration into the regeneration circuit (van der Hoek, 1985). The sulfate will accumulate in the regeneration circuit, and it may be possible that after several regenerations the resin will remain partly loaded with sulfate due to the high sulfate concentration in the regenerant. This further decreases the effective nitrate capacity of the resin.
When treating a Dutch ground water with 19.2 mg N O j ' - N r 1 and 29.5mgSOj" 1"' no problems were encountered with a normal resin, Duolite A 165 (see results of pilot plant). However, sulfate concentrations can be much higher in ground water. In such cases other resins should be used with a higher nitrate selectivity.
Recently some nitrate selective resins have been developed (Guter, 1982), including the resin Amber-lite IRA 996 of Rohm and Haas. This is evident from the binary equilibrium isotherm in Fig. 7 for the equilibrium between nitrate and sulfate. At all equivalent fractions of sulfate in the liquid phase (JfSOj" = sulfate concentration in liquid/total anion concentration in liquid) the concomitant equivalent fraction of sulfate on the resin (-TSOJ" = sulfate on resin/total ion exchange capacity) is lower. The breakthrough curve in Fig. 8 shows that even at a very high sulfate concentration in the ground water (139.4 mgSOS- r 1 ) nitrate will break through after sulfate.
After nine repeated regenerations with a solution containing 30gNaHCO 3 l " ' and sulfate concen-
57

JAN PETER VAN DER HOEK and ABRAHAM KLAPWUK
- 1,0-Xscv
Qfr
0,6
0,4
0,2
0-
/ ,
(/ V ^
/v\ <</ \ / /
/
nitrate capacity during break-through experiment after regeneration (%)
SQ7 concentration in the regenerant
( g / l l o Amberlite IRA 996 • Ouolite A165
0,8 10
Xso,'"
Fig. 7. Binary equilibrium isotherm of nitrate and sulfate for a sulfate selective resin (Duolite A 165) and a nitrate selective resin (Amberlite IRA 996) (total anion concen
tration in liquid phase 0.012equivTi
trations varying from OgSOj" 1~' in the first up to 18.4gSOj" 1"' in the ninth regeneration the nitrate capacity of this resin in the service mode after each regeneration turned out to be almost independent of the sulfate concentration in the regenerant (Fig. 9).
This means that the proposed process is also suitable for ground water with high sulfate concentrations when nitrate selective resins, such as Amber-lite IRA 996, are used.
Use of a sandfilter and a disinfectant in the process. Although sludge washout can be minimized with a USB denitrification reactor, the resin can still become polluted by carry-over of suspended solids from the denitrification reactor to the ion exchange column. Also humic and fulvic acids, which can accumulate in a closed regeneration circuit with a biological process, can cause organic fouling of the resin (Wilson, 1959; Frisch and Kunin, 1960; Ungar, 1962; Abrams, 1982; Pelosi and McCarthy, 1982). This pollution of the resin can affect the bacteriological quality of the treated water because after regeneration the resin is in contact with drinking water.
0 1 2 3 4 5 6 7 8 9
regeneration number
Fig. 9. Effect of sulfate in the regenerant on nitrate capacity of the nitrate selective resin Amberlite IRA 996 (nitrate capacity expressed as percentage of total ion exchange capacity). Ground water composition during breakthrough experiments 18mgNOj--NT', 30mgSOj-T', 25mg CT T1 and 58 mg HCO," T'; flowrate 35BVh-'; runtime 17h. Regeneration flowrate lOBVh-1; regeneration time 3.5 h. O, SOJ" concentration (gT1); • , nitrate capacity
(%).
To overcome these problems a sandfilter can be placed in the regeneration circuit between the USB denitrification reactor and the ion exchange column to remove suspended solids from the regenerant before they reach the resin. Secondly, the ion exchanger can be disinfected in the process. After regeneration the ion exchange column is rinsed with water. It is advisable to use a disinfectant during the first minutes of this rinsing. Especially peracetic acid is often used for disinfection of ion exchange resins (Ballmoos and Soldavini, 1979; Flemming, 1984).
In a pilot plant for nitrate removal from ground water the ion exchange columns are used for 9 h for
mg NOJ-N/t
30i
mg S0t27l
r250
0 150 200 250 300 350 400 450 500 550 600
bedvolumes
Fig. 8. Breakthrough profile of ion exchange resin Amberlite IRA 996. Influent concentrations 18.1 mgNOf-NT1 and 139.4mg SOj" T ' , flowrate 35BVrr', resin in HCOj" form.
58

Nitrate removal from ground water
Table 3. Standard plate counts in biological regenerant, in water treated with a non disinfected resin and in water treated with a
disinfected resin (resin disinfected with peracetic acid)
Standard plate counts (No. of bacteria ml-1)
Table 4. Dimensions of the pilot plant and ground water composition
Regenerant (effluent from USB denitrification reactor)
Water treated with a non disinfected resin Water treated with a disinfected resin
100,000-1,000,000
50,000-100,000 0-30
potable water production after which they are regenerated for 3.5 h and rinsed for 1 h (see "Design of the pilot plant"). To study the effect of the use of a disinfectant during rinsing on the bacteriological water quality this sequence was simulated in a laboratory experiment with two ion exchange columns. After regeneration with a bacteriologically contaminated regenerant (see Table 3) one column was rinsed with water, containing 0.15% peracetic acid during the first 15min, and the other column was rinsed without peracetic acid. For the next 9 h both columns were run with sterilized water. In the water, leaving the ion exchange columns, the number of bacteria was measured. This procedure was repeated several times. In Table 3 the results are presented. It can be seen that a bacteriologically reliable water [standard plate counts < 100 ml_l according to the
nitrate rich groundwater rinse+ disinfectant
*—'s—<—" i '< sand
f i l ter
bypass
TLlf If V l—> c \_L_> r\_] ^ 1_> 1
denitr i f ication reactor
nitrate low groundwater
I |C-soijrce + phosphate
Fig. 10. Lab-scale pilot plant for nitrate removal from ground water using the biological/physical chemical process.
Volume ion exchange columns Volume denitrification reactor Ground water flowrate Regeneration flowrate Rinse flowrate Ground water composition
NO,-N soj-ci-HCO, PH
Regenerant NaHCOj
0.951. 51.
65.7 lh- ' (2x32.9Hr') 9-12UT' 9-121h-'
19.2 mgl"1
29.5 mgl-' 26.1 mgl"1
98.3 mgl"1
7.8 10.5-23.7gl-'
E.C, Council Directive (1980)] can be produced when 0.15% peracetic acid is used the first 15min during rinsing.
Pilot plant study
Design of the pilot plant. With the conditions mentioned above a lab-scale pilot plant was designed. The pilot plant is shown schematically in Fig. 10. It consists of three ion exchange columns filled with resin Duolite A 165, a sand filter and a USB denitrification reactor. Methanol is used as substrate for the denitrification reactor.
Two ion exchange columns are used simultaneously for production of potable water with a run time of 9 h each, but a phase shift of 4.5 h. The third ion exchange column is connected with the denitrification reactor and is regenerated for 3.5 h followed by 1 h rinsing with water that contains a disinfectant (peracetic acid) during the first 15 min. During rinsing, water is recirculated through the denitrification reactor by means of a bypass. In this way every 4.5 h a regenerated ion exchange column is put into service for nitrate removal from ground water. The pilot plant is controlled by a programmable logic controller (PLC).
Table 4 summarizes the dimensions of the plant and the ground water composition. During the experimental period NaHCOj was used as regenerant. No disinfectant was used and the sand filter was used only temporarily.
Operation of the pilot plant. In Fig. 11 the nitrate concentration in the treated ground water is shown.
NOvN in treated groundwater lmg/l)
2fj, influent
Fig. 11. Nitrate concentration in the treated ground water. I—Denitrification reactor capacity 525mgNh-'; II—denitrification reactor capacity 625mgNh-1; III—denitrification reactor capacity 840mgNh"' (denitrification reactor vol 5 1., influent concentration 19.2mgNOj--Nl_1, maximum
admissible concentration 11.3mg NOf-NT1).
59
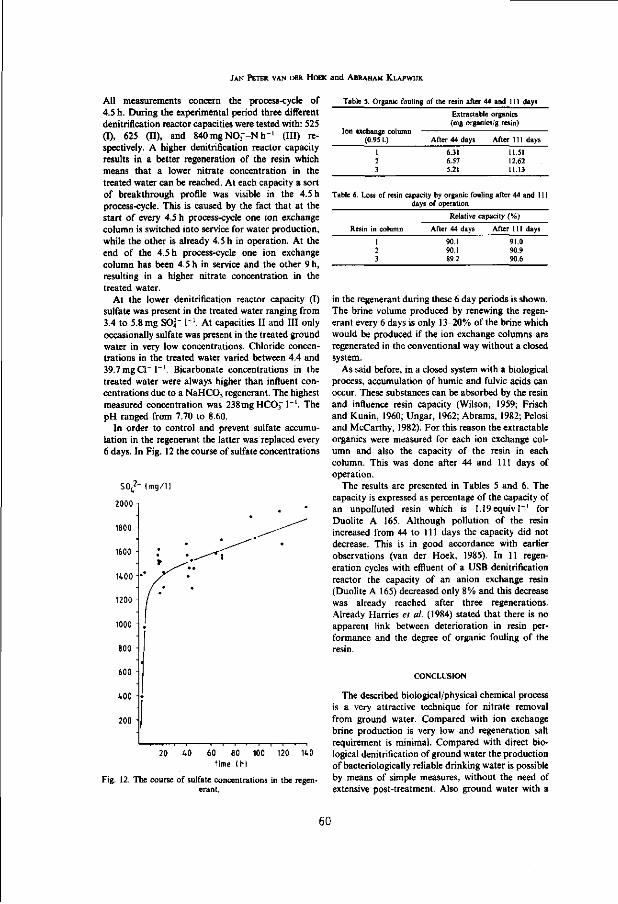
JAN PETER VAN DER HOEK and ABRAHAM KLAPWUK
All measurements concern the process-cycle of 4.5 h. During the experimental period three different denitriflcation reactor capacities were tested with: 525 (I), 625 (II), and 840mgNO 3 - -Nh- ' (III) respectively. A higher denitriflcation reactor capacity results in a better regeneration of the resin which means that a lower nitrate concentration in the treated water can be reached. At each capacity a sort of breakthrough profile was visible in the 4.5 h process-cycle. This is caused by the fact that at the start of every 4.5 h process-cycle one ion exchange column is switched into service for water production, while the other is already 4.5 h in operation. At the end of the 4.5 h process-cycle one ion exchange column has been 4.5 h in service and the other 9 h, resulting in a higher nitrate concentration in the treated water.
At the lower denitriflcation reactor capacity (I) sulfate was present in the treated water ranging from 3.4 to 5.8 mg SOJ" l '1 . At capacities II and III only occasionally sulfate was present in the treated ground water in very low concentrations. Chloride concentrations in the treated water varied between 4.4 and 39.7mgCl~ 1~'. Bicarbonate concentrations in the treated water were always higher than influent concentrations due to a NaHCO, regenerant. The highest measured concentration was 238mgHC03~ l"1. The pH ranged from 7.70 to 8.60.
In order to control and prevent sulfate accumulation in the regenerant the latter was replaced every 6 days. In Fig. 12 the course of sulfate concentrations
SO,/" lmg/11
2000 -
1600 -
1400 -
1200 -
1000 -
800 -
600 -
400 -
200 -
•
»
•'
•
""*̂ •• ^T""
• •
•
•
Table 5. Organic fouling of the resin after 44 and 111 days
Extractable organics (mg organics/g resin)
(0.951.)
1 2 3
After 44 days
6.31 6.57 5.21
After 111 days
11.51 12.62 11.13
Table 6. Loss of resin capacity by organic fouling after 44 and 111 days of operation
Resin in column
1 2 3
Relative
After 44 days
90.1 90.1 89.2
capacity (%)
After 111 days
91.0 90.9 90.6
20 40 60 80 100 time (h)
120 140
Fig. 12. The course of sulfate concentrations in the regenerant.
in the regenerant during these 6 day periods is shown. The brine volume produced by renewing the regenerant every 6 days is only 13-20% of the brine which would be produced if the ion exchange columns are regenerated in the conventional way without a closed system.
As said before, in a closed system with a biological process, accumulation of humic and fulvic acids can occur. These substances can be absorbed by the resin and influence resin capacity (Wilson, 1959; Frisch and Kunin, 1960; Ungar, 1962; Abrams, 1982; Pelosi and McCarthy, 1982). For this reason the extractable organics were measured for each ion exchange column and also the capacity of the resin in each column. This was done after 44 and 111 days of operation.
The results are presented in Tables 5 and 6. The capacity is expressed as percentage of the capacity of an unpolluted resin which is 1.19equivl_1 for Duolite A 165. Although pollution of the resin increased from 44 to 111 days the capacity did not decrease. This is in good accordance with earlier observations (van der Hoek, 1985). In 11 regeneration cycles with effluent of a USB denitriflcation reactor the capacity of an anion exchange resin (Duolite A 165) decreased only 8% and this decrease was already reached after three regenerations. Already Harries et al. (1984) stated that there is no apparent link between deterioration in resin performance and the degree of organic fouling of the resin.
CONCLUSION
The described biological/physical chemical process is a very attractive technique for nitrate removal from ground water. Compared with ion exchange brine production is very low and regeneration salt requirement is minimal. Compared with direct biological denitriflcation of ground water the production of bacteriologically reliable drinking water is possible by means of simple measures, without the need of extensive post-treatment. Also ground water with a
60
Nitrate removal from ground water
high sulfate concentration can be treated with this technique when a nitrate selective resin is used, for example Amberlite IRA 996.
Acknowledgements—These investigations were supported by The Netherlands Technology Foundation (STW); Rossmark-Van Wijk & Boerma Water Treatment Ltd; the Ministry of Housing, Physical Planning and Environment; the Ministry of Economic Affairs and the Water Supply Company "Oostelijk Gelderland".
The authors thank P. J. M. van der Ven, J. Verheyen, P. Vis, W. F. van der Hoek and J. Jacobs for performance of the analyses.
REFERENCES
Abrams I. M. (1982) Organic fouling of ion exchange resins. In Physico-chemical Methods for Water and Wastewater Treatment (Edited by Pawlowski L.), pp. 213-224. Elsevier, Amsterdam.
Ballmoos U. and Soldavini H. (1979) Desinfektion von Ionenaustauschern mit Peressigsaure (PES) Spezialquali-tat IA. Gas Wass. Abwass. 59, 487-488.
Barlog F. (1980) Nitrat im Trinkwasser: Ursachen und Problemlosungen. Chem. Rdsch. 33, 3, 16.
Claus G. and Kutzner H. J. (1985) Physiology and kinetics of autotrophic denitrification by Thiobacillus denitrificans. Appl. Microbiol. Biotechnoi. 22, 283-288.
Clifford D. (1982) Breakthrough predictions in multi-component ion exchange processes for nitrate removal. In Physico-chemical Methods for Water and Wastewater Treatment (Edited by Pawlowski L.), pp. 179-211. Elsevier, Amsterdam.
Clifford D. A. and Weber Jr W. J. (1978) Nitrate Removal from Water Supplies by Ion Exchange. Report EPA-600/2-78-052, U.S. Environmental Protection Agency.
Deguin A. (1982) Elimination des nitrates par echange d'ions dans les eaux potables: mise en equations du procede. Trib. Cebedeau 35, 35-41.
E.C. (1980) Council directive of 15 July 1980 relating to the quality of water intended for human consumption, 80/778/EEC. Off. J. Eur. Commun. 23, L229, 11-29.
Hemming H. C. (1984) Bakterienwachstum auf Ionen-austauscher-Harz—Untersuchungen an einem stark sau-ren Kationen-Austauscher. Teil III: Desinfektion mit Peressigsaure. Z. Wass. Abwass. Forsch. 17, 229-234.
Frick B. R. and Richard Y. (1985) Ergebnisse und Erfah-rungen mit der biologischen Denitrinkation in einem Wasserwerk. Vom Wass. 64, 145-154.
Frisch N. W. and Kunin R. (I960) Organic fouling of anion exchange resins. J. Am. Wat. Wks Ass. 52, 875-887.
Gauntlett R. B. (1975) Nitrate removal from water by ion exchange. Wat. Treat. Exam. 24, 172-193.
Guter G. A. (1982) Removal of Nitrate from Contaminated Water Supplies for Public Use. Report EPA-600/2-8 2-042, U.S. Environmental Protection Agency.
Haberer K. (1984) Probleme und Moglichkeiten der Nitrate-liminierung bei der Trinkwasseraufbereitung. Gewdss.-Wass.-Abwass. 65, 733-752.
Hall T., Walker R. A. and Zabel T. F. (1985) Nitrate removal from drinking water—process selection and design. Proceedings of the congress "Nitrates in Water", SITE 85, Paris, 22-24 October, 1985.
Harries R. R. and Ray N. J. (1984) Anion exchange in high flow rate mixed beds. Effl. Wat. Treat. J. 24, 131-139.
Hoek J. P. van der (1985) Biological/physical chemical nitrate removal from groundwater—an environmental and financial attractive alternative. Proceedings of the
congress "Nitrates in Water", SITE 85, Paris, 22-24 October, 1985.
Hoek J. P. van der and Klapwijk A. (1985) Biological/ physical chemical methods—nitrate removal from ground water. PT/Procestechniek 40, 22-25 (in Dutch).
Hoek J. P. van der and Klapwijk A. (1986) Feasibility study to biological/physical chemical nitrate removal from ground water. Hfi 19, 53-58 (in Dutch).
Klapwijk A., Jol C. and Donker H. J. G. W. (1979) The application of an upflow reactor in the denitrification step of biological sewage purification. Wat. Res. 13, 1009-1015.
Klapwijk A., Hoeven J. C. M. van der and Lettinga G. (1981) Biological denitrification in an upflow sludge blanket reactor. Wat. Res. 15, 1-6.
Leprince A. and Richard Y. (1982) La bio-technique au service de l'eau de consommation: fiabilite et performance du traitement biologique des nitrates. Aqua 76, 455-462.
Lettinga G., Velsen A. F. M. van, Hobma S. W., Zeeuw W. de and Klapwijk A. (1980) Use of the Upflow Sludge Blanket (USB) reactor concept for biological wastewater treatment, especially for anaerobic treatment. Biotechnoi. Bioengng 22, 699-734.
NNI (1966) Dutch Normalized Standard Method NEN 1056 IV.6. Nederlands Normalisatie-Instituut, Delft, The Netherlands.
NNI (1981) Dutch Normalized Standard Method'NEN 6440. Nederlands Normalisatie-Instituut, Delft, The Netherlands.
NNI (1982) Dutch Normalized Standard Method NEN 6560. Nederlands Normalisatie-Instituut, Delft, The Netherlands.
Partos J. and Richard Y. (1985) Traitement de l'eau sou-terraine polluee par les nitrates. Wat. Supply 3, 75-92.
Pelosi P. and McCarthy J. (1982) Preventing fouling of ion exchange resins—II. Chem. Engng 89, 125-128.
Philipot J. M., Chaffange F. and Pascal O. (1985) Denitrification biologique: le point sur un an de fonc-tionnement de la station d'Eragny. Wat. Supply 3,93-98.
Richard Y. and Leprince A. (1982) Pollution per les nitrates: traitements disponibles. Trib. Cebedeau 35, 21-33.
Richard Y., Leprince A., Martin G. and Leblanc C. (1980) Denitrification of water for human consumption. Prog. Wat. Technol. 12, 173-191.
Roennefahrt K. (1985) Biotechnologische Nitratentfernung in Festbettreaktoren. Vom Wass. 65, 271-285.
Scheltinga H. M. J. (1985) Nitrate problems in The Netherlands. Proceedings of the congress "Nitrates in Water", SITE 85, Paris, 22-24 October, 1985.
Sontheimer H., Cornel P., Fettig J. and Rohmann U. (1982) Grundwasserverunreinigung—Bedrohung fur die offent-liche Wasserversorgung? GWF-Wass. Abwass. 123, 521-530.
Sontheimer H. and Rohmann U. (1984) Grand wasserbelas-tung mit Nitrat—Ursachen, Bedeutung, Losungswege. GWF-Wass. Abwass. 125, 599-^08.
Sarensen J. (1978) Capacity for denitrification and reduction of nitrate to ammonia in a coastal marine sediment. Appl. envir. Microbiol. 35, 301-305.
Sorensen J. (1979) A comparison of oxygen, nitrate and sulfate respiration in coastal marine sediments. Microb. Ecol. 5, 105-115.
Sorg T. J. (1979) Nitrate removal from drinking water. Paper presented at EPA seminar on nitrates in groundwater, Kansas City, Mo, 3-4 October, 1979.
Ungar J. (1962) Anion exchange resin fouling. Effl. Wat. Treat. J. 2, 331-334.
Wilson A. L. (1959) Organic fouling of strongly basic anion exchange resins. J. appl. Chem. 9, 352-359.

CHAPTER 8
COMBINED ION EXCHANGE/BIOLOGICAL DENITRIFICATION FOR NITRATE REMOVAL FROM GROUND WATER
UNDER DIFFERENT PROCESS CONDITIONS
J.P. van der Hoek, P.J.M. van der Ven and A. Klapwijk
Accepted for publication in Water Research
ABSTRACT
Combined ion exchange/biological denitrification is a process for nitrate removal from ground water in which nitrate is removed by an ion exchanger and the resins are regenerated in a closed circuit through a biological denitrification reactor. On laboratory-scale the process was run under three process conditions. Ground water with a relatively low sulfate concentration (31 mg SO^'/l) was treated with the sulfate selective resin Duolite A 165 and with the nitrate selective resin Amberlite IRA 996. In both cases NaCl was used as regenerant. Although the nitrate concentration in the treated water was hardly influenced by the different resin types, chloride and sulfate concentrations were clearly affected. With the nitrate selective resin sulfate concentrations were higher and chloride concentrations were lower as compared with the sulfate selective resin. Treatment of ground water containing a very high sulfate concentration (181 mg SO42'/I) was possible by the combined process with the nitrate selective resin. In all three cases sulfate accumulated in the regeneration circuit without impairing the nitrate removal in the service mode. The regenerant was renewed every two weeks under one process condition. Compared with conventional ion exchange regeneration this results in a reduction of brine production of 95%.
INTRODUCTION
High nitrate concentrations in ground water, used for drinking water, is a problem in several European countries (Marsh, 1980; Richard and Leprince, 1982; Bruyn, 1984; Holtmeier, 1984; Sontheimer and Rohmann, 1984; Furrer and Stauffer, 1986), especially since the European Community introduced a new directive relating to the quality of water intended for human consumption (European Community, 1980). In this directive the maximum admissible concentration of nitrate in drinking water has been decreased from 22.6 to 11.3 mg N03~-N/l. The guide level is 5.6 mg N03~-N/l.
To remove nitrate from ground water a new process has been developed recently: combined ion exchange/biological denitrification. The process, including basic design criteria and advantages, has been described previously (Van der Hoek and Klapwijk, 1987). In this process nitrate is removed from the ground water by ion exchange. Regeneration of the nitrate-loaded resins is carried out in a closed circuit through a biological denitrification reactor. This reactor removes nitrate from the regenerant so that it can be used again.
The process can be operated under different process conditions. Firstly, the regenerant can be varied. Regeneration of anion exchange resins can be achieved with sodium chloride solutions or with sodium bicarbonate solutions as regenerant (Deguin el al., 1978). Secondly, it is possible to vary the resin type. Strong base anion exchange resins are normally sulfate selective, but recently some nitrate selective resins have been developed (Guter, 1982) and
63
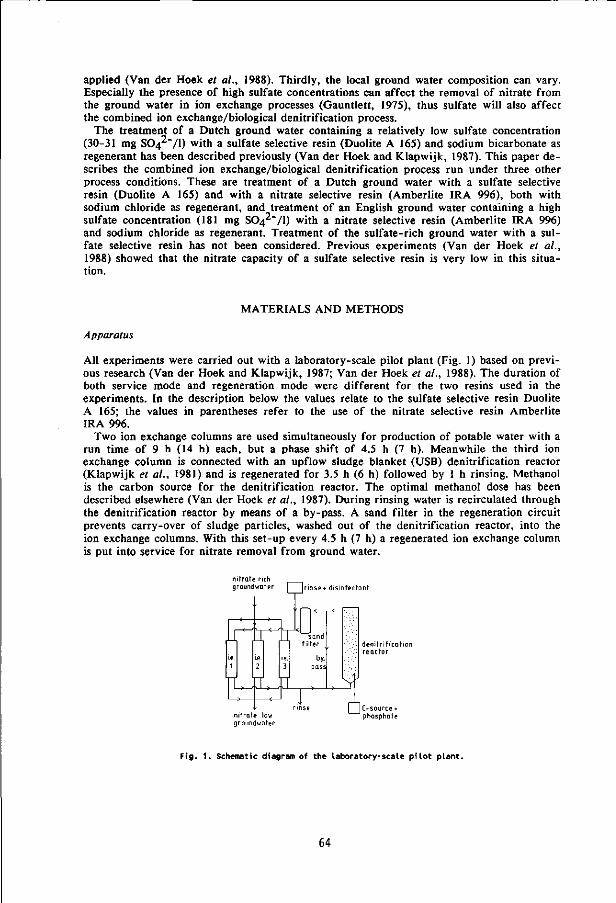
applied (Van der Hoek et al., 1988). Thirdly, the local ground water composition can vary. Especially the presence of high sulfate concentrations can affect the removal of nitrate from the ground water in ion exchange processes (Gauntlett, 1975), thus sulfate will also affect the combined ion exchange/biological denitrification process.
The treatment of a Dutch ground water containing a relatively low sulfate concentration (30-31 mg SC>42~/1) with a sulfate selective resin (Duolite A 165) and sodium bicarbonate as regenerant has been described previously (Van der Hoek and Klapwijk, 1987). This paper describes the combined ion exchange/biological denitrification process run under three other process conditions. These are treatment of a Dutch ground water with a sulfate selective resin (Duolite A 165) and with a nitrate selective resin (Amberlite IRA 996), both with sodium chloride as regenerant, and treatment of an English ground water containing a high sulfate concentration (181 mg SO^ ' / l ) with a nitrate selective resin (Amberlite IRA 996) and sodium chloride as regenerant. Treatment of the sulfate-rich ground water with a sulfate selective resin has not been considered. Previous experiments (Van der Hoek et al., 1988) showed that the nitrate capacity of a sulfate selective resin is very low in this situation.
MATERIALS AND METHODS
Apparatus
All experiments were carried out with a laboratory-scale pilot plant (Fig. 1) based on previous research (Van der Hoek and Klapwijk, 1987; Van der Hoek et al., 1988). The duration of both service mode and regeneration mode were different for the two resins used in the experiments. In the description below the values relate to the sulfate selective resin Duolite A 165; the values in parentheses refer to the use of the nitrate selective resin Amberlite IRA 996.
Two ion exchange columns are used simultaneously for production of potable water with a run time of 9 h (14 h) each, but a phase shift of 4.5 h (7 h). Meanwhile the third ion exchange column is connected with an upflow sludge blanket (USB) denitrification reactor (Klapwijk et al., 1981) and is regenerated for 3.5 h (6 h) followed by 1 h rinsing. Methanol is the carbon source for the denitrification reactor. The optimal methanol dose has been described elsewhere (Van der Hoek et al., 1987). During rinsing water is recirculated through the denitrification reactor by means of a by-pass. A sand filter in the regeneration circuit prevents carry-over of sludge particles, washed out of the denitrification reactor, into the ion exchange columns. With this set-up every 4.5 h (7 h) a regenerated ion exchange column is put into service for nitrate removal from ground water.
nitrate rich groundwater | |rinse * disinfectant
IT sand f i l ter
by. pass
nitrate low groundwater
, I, V
deni t r i f icat ion reactor
| C-source + phosphate
Fig. 1. Schematic diagram of the laboratory-scale p i lo t plant.
64

Table 1 . Three process conditions tested with the laboratory-scale p i lo t plant
test condition
A B
ion exchange resin
regenerant
sul fate concentration in
ground water
Duolite A 165
Nad
low
Antierlite IRA 996
NaCl
low
Amber l i t e IRA 996
NaCl
high
0.95
5
69.2
9-12
9-12
19.8 ±
31.6 ±
28.1 i
104.9 ±
7.76±
0
1
1
3
0
7
8
4
8
.15
Table 2 . Dimensions of the laboratory-scale p i lo t plant and concentrations in tests A, B and C
test condition
A B C
- p i lo t plant dimensions
volume ion exchange columns ( I )
volume den i t r i f i ca t ion reactor ( I )
ground water f lowrate ( l / h )
regeneration flowrate ( l / h )
rinse f lowrate ( l / h )
- raw water composition
NOj'-N (mg/l)
SOA2" (mg/l)
CI" (mg/l)
HCO3" (mg/l)
pH
- regenerant concentration (g NaCl/ l ) 10.1 ± 1.25
- sludge concentration USB reactor
suspended solids ( g / l ) 200
ash content (%) 62
Pilot plant dimensions, ground water composition and regenerant concentration
Three different process conditions were tested. These are summarized in Table 1. Table 2 shows the pilot plant dimensions, flowrates, raw water composition, regenerant concentration and sludge concentration in the USB denitrification reactor (internal diameter 9.4 cm) during each experimental period. Granular denitrifying sludge (granules 0.5-2 mm), cultivated on methanol, was used. In test C two different ground water flowrates were used: test CI with a high flowrate and test C2 with a low flowrate.
In the experiments artificial ground water has been used, made up from tap water. The composition of the low sulfate ground water was approximately the same as water from one of the well fields of the water supply company "Oostelijk Gelderland", the Netherlands, while the sulfate-rich ground water was based on analysis from Waneham, England.
1.02
5
76.8
10-12
10-12
19.7 t
31.1 ±
26.2 t
102.8 t
7.88±
10.3 ±
190
64
0 .9
1.4
1.4
4.1
0.16
1.25
1.45
5
71.5/57.4
14-16
14-16
22.7 ± 0 .8
181.1 ± 3 .6
91.6 ± 3.5
239.3 ± 4 .1
8.20± 0.08
9.0 ± 1.60
175
53
65

Ion exchange resins
Both resins used in the experiments are strong base macro porous anion exchange resins, and are described in detail elsewhere (Van der Hoek et al., 1988). Duolite A 165 is a sulfate selective resin with a total exchange capacity of 1.19 eq/1. Amberlite IRA 996 is a nitrate selective resin with a total exchange capacity of 1.01 eq/1.
Analyses
Suspended solids and ash content were determined according to Standard Methods (American Public Health Association, 1980). All other analyses were carried out as described elsewhere (Van der Hoek and Klapwijk, 1987).
RESULTS AND DISCUSSION
/ Treatment of the low sulfate ground water (tests A and B)
Figure 2 shows the nitrate concentration in the treated ground water in tests A and B. All measurements relate to the process cycle of 4.5 h (test A) or 7 h (test B). During test A the denitrification reactor capacity was 505 mg N03~-N/h, and during test B 890 mg NC>3"-N/h. It is clear that during test A the capacity was too low to maintain the maximum admissible concentration of 11.3 mg NC>3~-N/1 during the whole process cycle.
Figure 2 does not show the effect of the use of a nitrate selective resin. However, when comparing the sulfate, chloride and bicarbonate concentrations in the treated ground water in both tests A and B, the difference is obvious, see Table 3. While in test A (sulfate selective resin) sulfate is almost removed completely, this is only partly so in test B (nitrate selective resin). Hence the rise of the chloride concentrations in the treated water was moderate in test B as compared with test A, because in test B a part of the sulfate was exchanged for chloride. Apparently also in test B the bicarbonate concentrations remained vir-
NO^-N in treated ground water(mg/l)
influent
NO^-N in treated ground water (mg/l)
20 t~ influent
1 2 3 4 time (h)
Fig. 2. Nitrate concentration in the treated ground water during test A and test B.
66

Table 3. Effluent sulfate, chloride and bicarbonate concentrations in tests A, B, C1 and C2
effluent concentration
Cmg/l)
S042"
CI" HCO3"
A
0.0- 5.7
72.0-108.1
78.1-106.8
test
B
3.4- 27.9
46.7- 86.0
98.8-115.9
condition
C1
106.1-199.1
98.6-185.8
237.3-261.1
C2
99.8-184.0
133.3-194.6
247.1-258.7
A S0 f (mg / l )
. N0"3-N(mg/0
25-
20
15
10-
5-
• CI" (mg / l )
• HCOj Img/ l )
r120
-100
80
60
40
20
0 —r-& r-A r-A— 6 7 8
t ime ( h )
Fig. 3. Break-through curve of a single ion exchange column in test A. Influent
concentrations 19.3 mg NO^'-N/l, 30.8 mg SO^'/l, 28.3 mg Cl"/l and 101.3 mg
HCO3VI; column flowrate 34.6 l/h.
tually the same whereas in test A a small bicarbonate removal was observed. The difference between the sulfate selective resin and the nitrate selective resin is even
more distinct when break-through curves of one single ion exchange column are compared. Figure 3 shows such a break-through curve during the 9 h service mode of one column in test A, and Fig. 4 for the 14 h service mode of one column in test B. Although the influent concentration of 14.1 mg N03~-N/l in Fig. 4 was low as compared with the average ground water composition in test B, the difference is clear. In test A nitrate breaks through first, but in test B the situation is opposite: nitrate breaks through after sulfate does.
Besides differences in the composition of the treated water also differences in the regen-erant composition were observed. In test A the regenerant was replaced every 6 days, but in test B it was decided to extend this period to 11 days. In both cases the pH and alkalinity increased in the regeneration circuit to high values within a very short time as a result of the biological denitrification reaction with methanol. In test A, alkalinity rose to 70-75 meq/1 and the pH to 8.9, and in test B to 100-110 meq/1 and 8.9 respectively. So, in fact
67
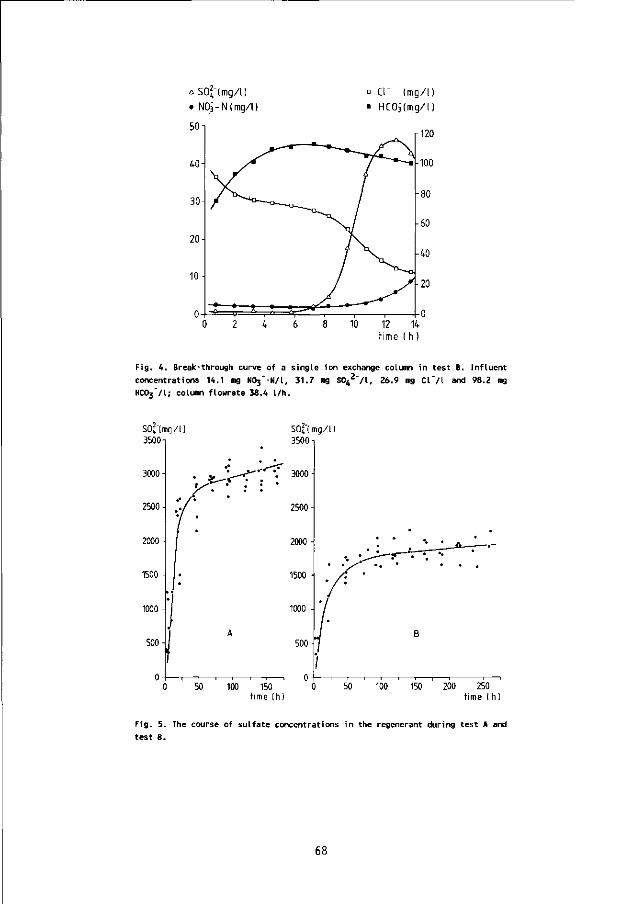
a SOf (mg/l)
• N0i-N(mg/l
50
° CI" (mg/l)
• HC0i(mg/l)
10 12 14 time ( h )
Fig. 4 . Break-through curve of a single ion exchange column in test B. Inf luent
concentrations 14.1 mg N03 _ -N/ l , 31.7 mg S 0 42 " / l , 26.9 mg C l " / l and 98.2 tng
HCO3VI; column flowrate 38.4 l / h .
S0r(mg/l) JbUU-
3000-
2500-
2000
1500
1000 •
500-
0-
• .v
f-: \
>}
t
I
• • •
• • • •
A
sof lmg/D 3500
3000
2500
2000
1500
1000
500
0 50 100 150 t ime (h)
50 100 150 200 250 time ( h)
Fig. 5. The course of sulfate concentrations in the regenerant during test A and
test B.
68

the regeneration was not the effect of a chloride solution, but of a combined chloride/bicarbonate solution. The higher alkalinity in test B was caused by the extended period during which the same regenerant was used without renewal, and by the higher capacity of the denitrification reactor in this test. This may also explain the absence of bicarbonate removal from the ground water in test B, since the ion exchange columns contained more bicarbonate at the start of each service mode as a result of the higher alkalinity in the regeneration circuit.
The removal of sulfate from the resin into the regenerant during regeneration leads to an accumulation of sulfate in the regenerant. Figure 5 shows the course of the sulfate concentration in the regenerant during the 6 day (A) or 11 day (B) periods. Because in test B sulfate was only removed in part from the ground water, the resin contained less sulfate after each service mode and sulfate concentrations in the regenerant did not reach the values, measured in test A.
/ / Treatment of the sulfate-rich ground water (test C)
Figure 6 shows the nitrate concentration in the treated ground water in test C. A ground water flowrate of 71.5 1/h, comparable with the flowrates in test A and B, resulted in nitrate concentrations above the maximum admissible concentration of 11.3 mg NC>3~-N/1 at the end of the 7 h process cycle (test CI). At the end of the process cycle one ion exchange column has been in service for 7 h and the other for 14 h, resulting in nitrate break-through. When the flowrate was reduced to 57.4 1/h (test C2) it was possible to attain the guide level of 5.6 mg NC>3~-N/1 in spite of the high sulfate concentration in the ground water. As a result of the lower flowrate the nitrate load of the ion exchange columns is lower and at the end of the 7 h process cycle no break-through is observed. In both cases the capacity of the denitrification reactor was 1020 mg N03"-N/h.
The sulfate, chloride and bicarbonate concentrations in the treated ground water are summarized in Table 3. Chloride concentrations were always higher than the influent concentration due to the use of sodium chloride as regenerant. Compared with test CI, effluent chloride concentrations were somewhat higher in test C2 since nitrate removal was better in
N03-N in treated
ground water(mg/l
25
NOj- N in treated
ground water (mg/l)
25T
Fig. 6. Nitrate concentration in the treated ground water during test C1 and test C2.
69
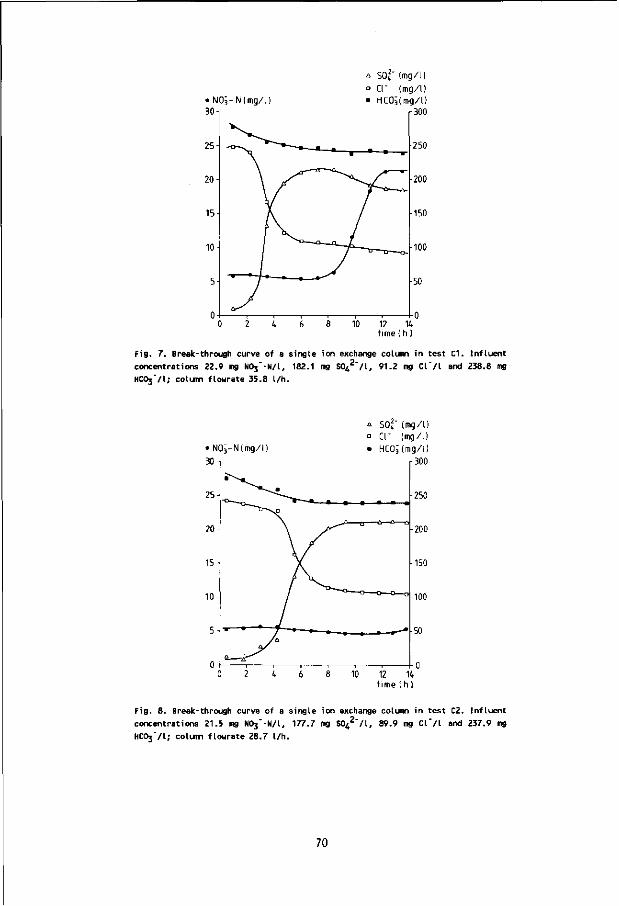
• NOi- N (mg/l) 30-,
25
20
15-
o SO; (mg/l I ° CI" (mg/l) • HCOjImg/l)
r300
250
200
150
100
50
0 2 4 6 8 10 12 14 time (h )
Fig. 7. Break-through curve of a single ion exchange column in test CI. Influent concentrations 22.9 mg N03"-N/l, 182.1 mg S04' HC03"/l; column flowrate 35.8 l/h.
" / I , 91.2 mg Cl"/l and 238.8 mg
• NOi-N( mg/l) 30
10 12 14 time (h)
Fig. 8. Break-through curve of a single ion exchange column in test C2. Influent concentrations 21.5 mg Nt^'-N/l, 177.7 mg SO4' HC03"/l; column flowrate 28.7 l/h.
2- / l , 89.9 mg Cl"/l and 237.9 mg
70
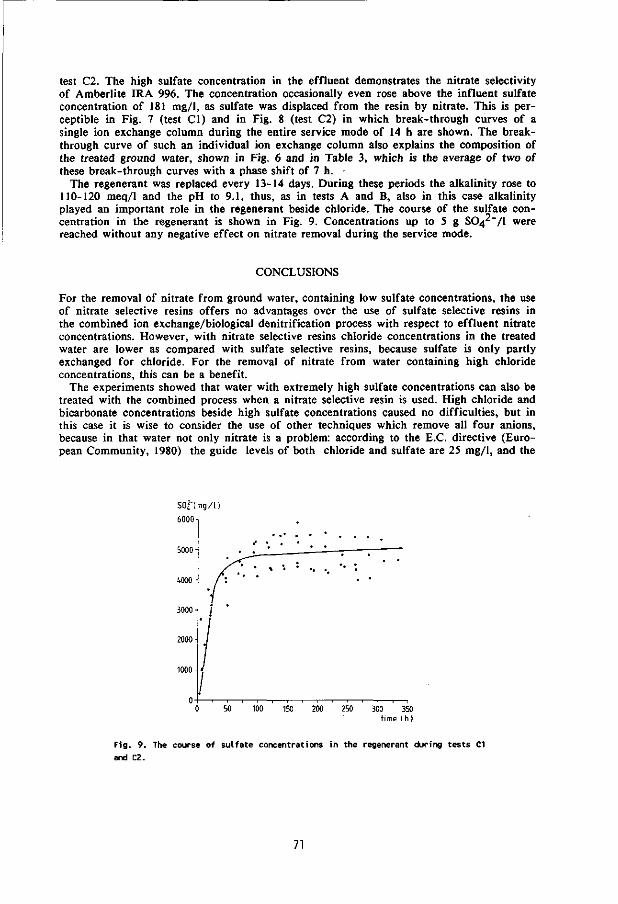
test C2. The high sulfate concentration in the effluent demonstrates the nitrate selectivity of Amberlite IRA 996. The concentration occasionally even rose above the influent sulfate concentration of 181 mg/1, as sulfate was displaced from the resin by nitrate. This is perceptible in Fig. 7 (test CI) and in Fig. 8 (test C2) in which break-through curves of a single ion exchange column during the entire service mode of 14 h are shown. The breakthrough curve of such an individual ion exchange column also explains the composition of the treated ground water, shown in Fig. 6 and in Table 3, which is the average of two of these break-through curves with a phase shift of 7 h. •
The regenerant was replaced every 13-14 days. During these periods the alkalinity rose to 110-120 meq/1 and the pH to 9.1, thus, as in tests A and B, also in this case alkalinity played an important role in the regenerant beside chloride. The course of the sulfate concentration in the regenerant is shown in Fig. 9. Concentrations up to 5 g S042"/l were reached without any negative effect on nitrate removal during the service mode.
CONCLUSIONS
For the removal of nitrate from ground water, containing low sulfate concentrations, the use of nitrate selective resins offers no advantages over the use of sulfate selective resins in the combined ion exchange/biological denitrification process with respect to effluent nitrate concentrations. However, with nitrate selective resins chloride concentrations in the treated water are lower as compared with sulfate selective resins, because sulfate is only partly exchanged for chloride. For the removal of nitrate from water containing high chloride concentrations, this can be a benefit.
The experiments showed that water with extremely high sulfate concentrations can also be treated with the combined process when a nitrate selective resin is used. High chloride and bicarbonate concentrations beside high sulfate concentrations caused no difficulties, but in this case it is wise to consider the use of other techniques which remove all four anions, because in that water not only nitrate is a problem: according to the E.C. directive (European Community, 1980) the guide levels of both chloride and sulfate are 25 mg/1, and the
S0 f (mg / l )
6000n
5000
3000 - /
2000
0 50 100 150 200 250 300 350 t ime ( h )
Fig. 9. The course of sulfate concentrations in the regenerant during tests C1
and C2.
71
maximum admissible concentration of sulfate is 250 mg/1. For chloride no maximum admissible concentration is given, but it has been noticed that above 200 mg CP/1 effects might occur (European Community, 1980). Reverse osmosis (Guter, 1982; Richard and Le-prince, 1982; Bilidt, 1985; Rautenbach et al., 1986) or electrodialysis (Perry and Kedem, 1981; Richard and Leprince, 1982; Rautenbach et al., 1985) may be better techniques to deal with those waters. Nevertheless, the experiments with the English ground water clearly demonstrated that nitrate removal from ground water by the combined ion exchange/biological denitrification process is hardly affected by other anions.
Finally, it is possible to reach a very substantial reduction in brine production. As compared with conventional regeneration procedures (regeneration for 30 min with 5 bed vol-umes/h), the renewal of the regenerant once every two weeks results in a reduction of 95% in volume.
ACKNOWLEDGEMENTS
These investigations were supported by the Netherlands Technology Foundation (STW); Rossmark-Van Wijk & Boerma Water Treatment Ltd.; the Ministry of Housing, Physical Planning and Environment; the Ministry of Economic Affairs and the Water Supply Company "Oostelijk Gelderland".
REFERENCES
American Public Health Association (1980) Standard Methods for the Examination of Waste and Wastewater, 15th edn. APHA, New York.
Bilidt H. (1985) The use of reverse osmosis for removal of nitrate in drinking water. Proceedings of the Symposium on Membrane Technology, TylosSnnet, Sweden, 28-30 May 1985, pp. 225-230.
Bruyn J. (1984) Ground water quality - manuring: Problems with nitrate in Eastern Gelderland. H2O 17, 502-505 (in Dutch).
Deguin A., Rouas P., Neveu A. and Gaspard M. (1978) Les nitrates dans l'eau potable - Dif-ferentes possibility de traitement - Resultats obtenus par echanges d'ions. J. Francois d'Hydrologie 9, 77-90.
European Community (1980) Council directive of 15 July 1980 relating to the quality of water intended for human consumption, 80/778/EEC. Off. J. Eur. Commun. 23, L229, 11-29.
Furrer O.J. and Stauffer W. (1986) Stickstoff in der Landwirtschaft. Gas Wass. Abwass. 66, 460-471.
Gauntlett R.B. (1975) Nitrate removal from water by ion exchange. Wat. Treat. Exam. 24, 172-193.
Guter G.A. (1982) Removal of Nitrate from Contaminated Water Supplies for Public Use. Report EPA-600/2-82-042, U.S. Environmental Protection Agency.
Hoek J.P. van der and Klapwijk A. (1987) Nitrate removal from ground water. Wat. Res. 21, 989-997.
Hoek J.P. van der, Latour P.J.M. and Klapwijk A. (1987) Denitrification with methanol in the presence of high salt concentrations and at high pH levels. Appl. Microbiol. Biotechnol. 27, 199-205.
Hoek J.P. van der, Hoek W.F. van der and Klapwijk A. (1988) Nitrate removal from ground water - Use of a nitrate selective resin and a low concentrated regenerant. Wat. Air Soil Pollut. (in press).
Holtmeier E.-L. (1984) Der Schutz des Grundwassers vor Nitratbelastungen. GWF-Wass. Abwass. 125, 482-487.
Klapwijk A., Hoeven J.C.M van der and Lettinga G. (1981) Biological denitrification in an upflow sludge blanket reactor. Wat. Res. 15, 1-6.
72
Marsh T.J. (1980) Towards a nitrate balance for England and Wales. Wat. Serv. October 1980, 601-606.
Perry M. and Kedem O. (1981) La purification de l'eau par electrodialyse du nitrate. Eaux et Industries 55, 47-52.
Rautenbach R., Kopp W., Opbergen G. van, Peters Th. and Hellekes R. (1985) Elektrodialyse zur Nitratentfernung aus Grundwassern. GWF-Wass. Abwass. 126, 349-355.
Rautenbach R., Kopp W., Hellekes R., Peters R. and Opbergen G. van (1986) Separation of nitrate from well water by membrane processes (reverse osmosis/electrodialysis). Aqua No. 5, 279-282.
Richard Y. and Leprince A. (1982) Pollution par les nitrates: Traitements disponibles. Trib. Cebedeau 35, 21-33.
Sontheimer H. and Rohmann U. (1984) Grundwasserbelastung mit Nitrat - Ursachen, Bedeu-tung, LSsungswege. GWF-Wass. Abwass. 125, 599-608.
73

CHAPTER 9
MODELLING AND OPTIMIZATION OF THE COMBINED ION EXCHANGE/BIOLOGICAL DENITRIFICATION PROCESS
FOR NITRATE REMOVAL FROM GROUND WATER
J.P. van der Hoek, R.J.B. Zwanikken, A. Griffioen and A. Klapwijk
Accepted for publication in Zeitschrift fur Wasser- und Abwasser-F'orschung
ABSTRACT
Combined ion exchange/biological denitrification is a process for nitrate removal from ground water. In this process nitrate is removed from the water by ion exchange. The resins are regenerated in a closed system including a biological denitrification reactor which removes nitrate from the regenerant. A mathematical model has been developed to describe the combined ion exchange/biological denitrification process. The ion exchange model is based on chemical equilibria and selectivity coefficients. The biological denitrification model is based on zero order kinetics for reduction of nitrate to nitrogen gas. The model has been very useful in explaining low denitrification reactor capacities observed in a laboratory scale pilot plant. These low capacities were due to nitrate limitation of the denitrification reactor during regeneration of anion exchange resins. The model showed that it is possible to optimize the regeneration procedure by introducing a buffer in the regeneration circuit after the ion exchange column.
INTRODUCTION
Nitrate removal from ground water and drinking water is necessary in several countries (Greene, 1978; Richard and Leprince, 1982; Bruyn, 1984; Sontheimer and Rohmann, 1984; Anonymus, 1987) to supply water with nitrate concentrations below the maximum admissible concentration of 50 mg NO3VI according to the EC directive (European Community, 1980). One of the methods to achieve this is the combined ion exchange/biological denitrification process (Van der Hoek and Klapwijk, 1987; Van der Hoek et al., 1988b). In this process nitrate is removed from the ground water by ion exchange, while the resins are regenerated in a closed system by an upflow sludge blanket (USB) denitrification reactor. The regeneration procedure is shown schematically in Fig. 1. The regenerant flows through the ion exchange column, and the nitrate rich regenerant then passes through the denitrification reactor where denitrifying bacteria convert nitrate into nitrogen gas. Methanol is added as carbon source and energy source. After removal of nitrate from the regenerant it can be used again and thus regeneration salt requirement and brine production are minimized.
The process has been tested successfully at laboratory-scale under different process conditions (Van der Hoek and Klapwijk, 1987; Van der Hoek et al., 1988b). The laboratory pilot plant consists of three ion exchange columns and one denitrification reactor. The regeneration time, including rinse time, is half of the run time of each ion exchange column in the service mode. This offers the opportunity to run the process on a continuous base by using two ion exchange columns for nitrate removal from ground water, working with a phase shift which is half of the run time, while the third column is being regenerated.
In all experiments it has been noticed that the volumetric capacity of the USB denitrification reactor during implementation in the combined process was only one-third to a half
75

of the maximum capacity attainable for this type of reactor. The maximum capacity of this reactor is 35.7 meq N03"/(l.h) (500 g NC>3~-N/(m3.h)) (Klapwijk et al., 1981). Even though the process was started with a USB denitrification reactor with this high capacity, within one day the capacity fell to a much lower value (33-50%).
NQCI
denitrification reactor
NO, — - N,
in
organic C-source
J yfyr- resin which has to % be regenerated
& _ ^ c r+ NO3—-CI" + NO3"
N03"+ CI
Fig. 1. Regeneration of a nitrate-loaded anion resin into the chloride form in a
closed system with a biological denitrification reactor.
This paper presents a mathematical model including the ion exchange and biological denitrification processes. As the aim was to model the regeneration procedure as a whole, the separate processes are not described in detail, but denitrification has been schematized by zero order reaction kinetics, and ion exchange through selectivity coefficients and chemical equilibria. With the model it is possible to explain the reduction of the volumetric capacity of the denitrification reactor. The model shows that the regeneration process can be optimized by using a buffer in the regeneration circuit after the ion exchange column.
MODEL DEVELOPMENT
The mathematical model includes the following submodels: - a model in which the ion exchange process is calculated, both for the service mode when
ground water flows through the ion exchange column and for the regeneration mode when the column is regenerated with a concentrated NaCl solution.
- a model of the upflow sludge blanket denitrification reactor. In this section both submodels and the combination of the submodels into one overall model to describe the regeneration of an ion exchange column in a closed circuit will be discussed.
The ion exchange model
1. Processes The ion exchange process can be described by chemical equilibria and selectivity coefficients. For the anions nitrate, sulfate, bicarbonate, nitrite (Aa~) and chloride (Cl~) liquid composition and resin composition are related to each other by the chemical equilibrium
76
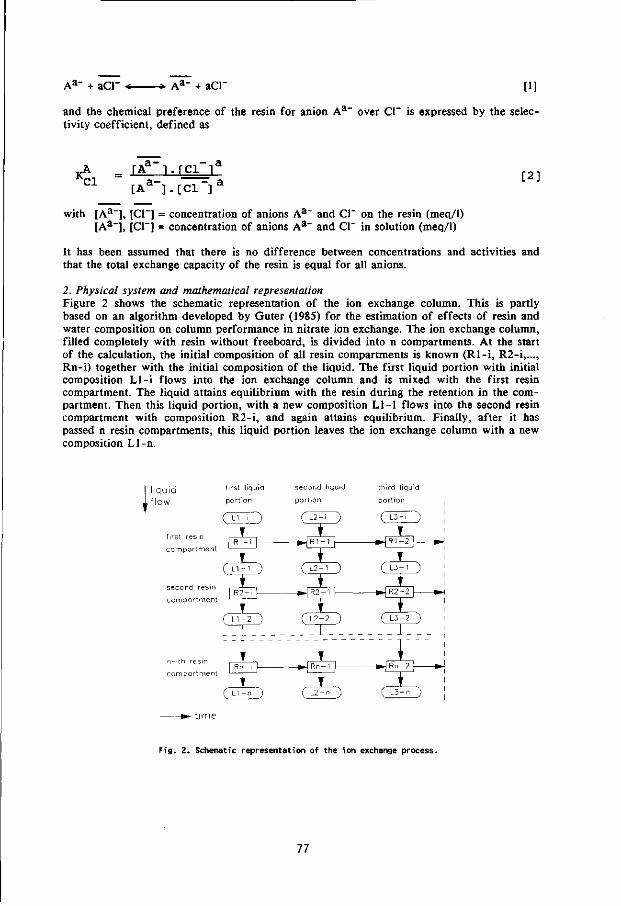
+ aCl" •*- -*. Aa" + aCr [1]
and the chemical preference of the resin for anion Aa" over CI" is expressed by the selectivity coefficient, defined as
[ 2 ] RA = TAa l . f C l l a
0 1 [ A a ] . [ C 1 ] a
with [Aa~], [CI"] = concentration of anions Aa~ and CI" on the resin (meq/1) [Aa"], [CI"] = concentration of anions Aa" and CI" in solution (meq/1)
It has been assumed that there is no difference between concentrations and activities and that the total exchange capacity of the resin is equal for all anions.
2. Physical system and mathematical representation Figure 2 shows the schematic representation of the ion exchange column. This is partly based on an algorithm developed by Guter (1985) for the estimation of effects of resin and water composition on column performance in nitrate ion exchange. The ion exchange column, filled completely with resin without freeboard, is divided into n compartments. At the start of the calculation, the initial composition of all resin compartments is known (Rl-i , R2-i,..., Rn-i) together with the initial composition of the liquid. The first liquid portion with initial composition Ll- i flows into the ion exchange column and is mixed with the first resin compartment. The liquid attains equilibrium with the resin during the retention in the compartment. Then this liquid portion, with a new composition Ll-1 flows into the second resin compartment with composition R2-i, and again attains equilibrium. Finally, after it has passed n resin compartments, this liquid portion leaves the ion exchange column with a new composition Ll-n.
liquid , flow
first resin
compartment
second resin
compartment
compartment
first liquid
portion
( L l - n " ) (~L2-n ) C L 3 ' n ~)
t ime
Fig. 2. Schematic representation of the ion exchange process.
77

The change in composition of the first liquid portion during passage through all resin compartments is accompanied by a concomitant change in the composition of each resin compartment. After passage of the first liquid portion the ion exchange column has been changed into n resin compartments with compositions R l - 1 , R2-1, , Rn-1. Then a second liquid portion with initial composition L2-i can flow into the ion exchange column with the new composition (Rl-1, R2-1,...., Rn-1) and the calculations can be repeated.
In the calculations absolute quantities of anions (meq) in liquid portions and in resin compartments are used instead of concentrations (meq/1). For equilibria between monovalent anions the selectivity coefficient defined in equation [2] can be used, but for equilibria between monovalent and divalent anions the selectivity coefficient must be recalculated. For the equilibrium between sulfate and chloride this results in
S04 _ S04 Vlport x n K2C1 _ KC1 X Vie [ 3 ]
„,S04 with R^ci = recalculated selectivity coefficient
KC1 = selectivity coefficient according to equation [2] Vlport = volume of the liquid portion (1) Vie = total volume of the ion exchange column (1) n = number of resin compartments
In each calculation first estimates of the quantities of anions on resin phase and in liquid phase are made; through a series of iterations converging to within an acceptable range of the equilibrium value the new values are calculated.
The denitrification reactor model
1. Processes The denitrification reaction with methanol can be described as follows:
6NO3" + 5CH3OH *• 3N2 + 4HCO3- + CO32- + 8H20 [4]
This implies that no intermediates (NO2") are formed in the reactor. In the calculations, the 6 equivalents alkalinity (4HCO3" + CO32") that are produced during reduction of 6 equivalents NO3" are taken together as 6 equivalents HCO3". This does not interfere with the ion exchange process because anion exchange resins do not prefer CO32" over HCO3-
(Clifford and Weber, 1978). However, with this simplification it is not possible to calculate pH changes due to the biological denitrification process. The result of this approach is, that in the model only nitrate and bicarbonate concentrations are affected by the denitrification process. It is assumed that the biological denitrification process follows zero order kinetics (Cooper and Wheeldon, 1980; Requa and Schroeder, 1973). Production of biomass and sludge wash-out from the denitrification reactor are not incorporated in the model, thus the mathematical model is restricted to a stationary situation with respect to sludge and the capacity of the denitrification reactor is assumed to be constant.
2. Physical system and mathematical representation The USB denitrification reactor is also modelled by dividing it into n compartments. A portion of liquid is mixed with the first compartment and a mass balance is made. Part of the nitrate is denitrified and part of the nitrate flows to the next compartment, in which a mass balance is made again. Finally the composition of a liquid portion leaving the denitrification reactor is known. Figure 3 shows the mass balance for nitrate or alkalinity over compartment j which is calculated according to equation [5]:
DR(j,m)new = DR(j,m)old + DI(j-l,m) - DO(j,m) - DD(j,m) [5]
78

•COMPARTMENT i + 1
COMPARTMENT
COMPARTMENT i - 1
Fig. 3. Schematic representation of the deni-t r i f i ca t i on process.
DD(j,m)
with DR(j,m) = number of equivalents of component m in denitrification reactor compartment j ;
DI(j-l,m) = number of equivalents of component m that flows from denitrification reactor compartment j -1 into compartment j ;
DO(j,m) = number of equivalents of component m that flows to the next denitrification reactor compartment j+1;
DD(j,m) = number of equivalents of component m that changes in compartment j by the biological denitrification process.
Since it is assumed that the denitrification process follows zero order kinetics, the term DD(j,m) in equation [5] is calculated by the following equation and checked for negative concentrations:
DD(j,m) = rvol x (Vlport/Q) x Vcomp [6]
with rvol = volumetric denitrification capacity (meq N03~/(l.h)) Vlport = volume of the liquid portion (1) Q = flow rate through the denitrification reactor (1/h) Vcomp = volume of the denitrification reactor compartment (1)
Connection of the ion exchange column and the denitrification reactor
The overall model of the biological regeneration of an ion exchange column is obtained by combining the ion exchange model with the denitrification reactor model. To optimize the regeneration procedure, four different process configurations have been modelled, as shown in Fig. 4. In configuration A the ion exchange column and denitrification reactor are connected directly without the use of a buffer. In configurations B, C and D a buffer is introduced between the two units. The function of this buffer is to smooth variations in nitrate concentrations and will be explained in detail in a following section. The composition of the liquid in the buffer is calculated from a mass balance. It is assumed that the buffer is completely mixed and that no chemical or biological reactions take place.
Other assumptions and restrictions in this part of the computer program are: - The volumes of pipes connecting the reactors are neglected
79

± IE
T
A
± DR
T
± IE
T
1 T
B B
i f DR
T
i
IE
i
B ^
c DR
T
± IE D
L ^ B
1
DR
T IE = ION EXCHANGE COLUMN DR = DENITRIFICATION REACTOR B = BUFFER
Fig. 4. Four process configurations to regenerate a nitrate-loaded anion exchange resin in a closed system with a biological deni t r i f icat ion reactor.
- No anions are lost from the system by precipitation or rinsing of the ion exchange column.
The model allows simulation of liquid and resin composition for a wide variety of conditions and different process configurations.
MODEL VERIFICATION
The most important model parameters are selectivity coefficients, resin capacities and the denitrification reactor capacity. All these parameters have been determined in separate experiments. Selectivity coefficients and ion exchange capacity for the nitrate selective resin Amberlite IRA 996 were taken from Van der Hoek and Klapwijk (1987) and from Van der Hoek et al. (1988a). For the sulfate selective resin Amberlite IRA 400 these parameters were derived from additional experiments. The maximum capacity of a USB denitrification reactor was taken from Klapwijk et al. (1981).
The ion exchange part of the model has been tested by comparing an experimental and a simulated break-through curve. The resin used was Amberlite IRA 400 (sulfate selective) in the chloride cycle and test conditions are summarized in Table 1. Figure 5 shows the results using different numbers of resin compartments. Dividing the ion exchange column into more compartments results in a closer agreement with the experimental data. In a tanks in series model the number of tanks is related to the axial dispersion according to equation [7] (Beek and Muttzall, 1975):
vL . „ vL _ n = 2D < f o r ~D > 10) [ 7 ]
with n = number of tanks v = real liquid velocity (m/s) L = characteristic reactor length (m) D = axial dispersion coefficient (m^/s)
80
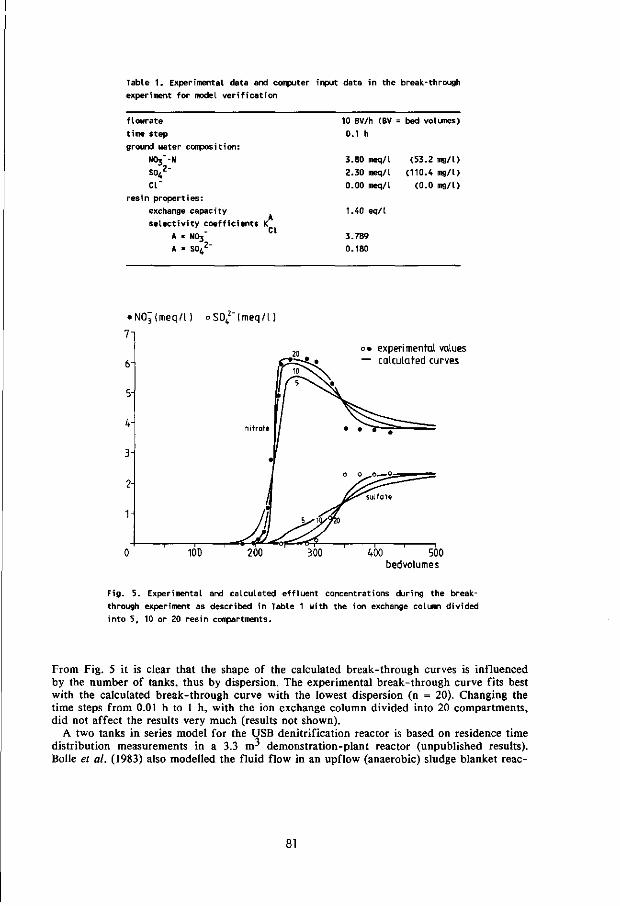
Table 1. Experimental data and computer input data in the break-through
experiment for model verification
flowrate
time step
ground water composition:
NOT"-M
CI"
resin properties:
exchange capacity
selectivity coefficients K NO3"
CI
10 BV/h (BV
0.1 h
3.80 meq/l
2.30 meq/l
0.00 meq/l
1.40 eq/l
3.789
0.180
= bed volumes)
(53.2 mg/l)
(110.4 mg/l)
(0.0 mg/l)
'N0 3 (meq / l ) o S O ^ I m e q /
experimental values calculated curves
400 500 bedvolumes
Fig. 5. Experimental and calculated effluent concentrations during the break
through experiment as described in Table 1 with the ion exchange column divided
into 5, 10 or 20 resin compartments.
From Fig. 5 it is clear that the shape of the calculated break-through curves is influenced by the number of tanks, thus by dispersion. The experimental break-through curve fits best with the calculated break-through curve with the lowest dispersion (n = 20). Changing the time steps from 0.01 h to 1 h, with the ion exchange column divided into 20 compartments, did not affect the results very much (results not shown).
A two tanks in series model for the USB denitrification reactor is based on residence time distribution measurements in a 3.3 m^ demonstration-plant reactor (unpublished results). Bolle et al. (1983) also modelled the fluid flow in an upflow (anaerobic) sludge blanket reac-
81
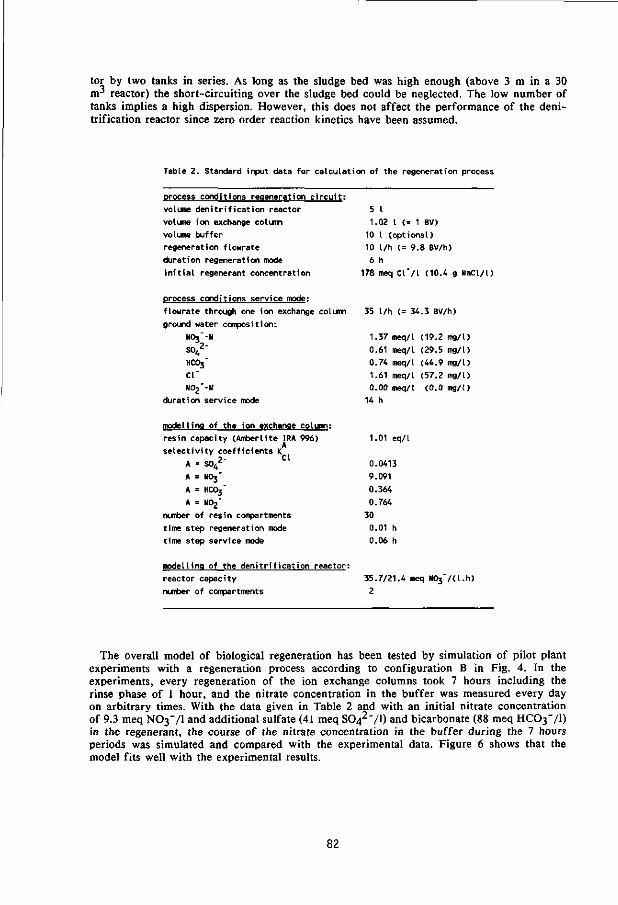
tor by two tanks in series. As long as the sludge bed was high enough (above 3 m in a 30 m3 reactor) the short-circuiting over the sludge bed could be neglected. The low number of tanks implies a high dispersion. However, this does not affect the performance of the deni-trification reactor since zero order reaction kinetics have been assumed.
Table 2. Standard input data for calculation of the regeneration process
process conditions regeneration circuit:
volume denitrification reactor 5 I
volume ion exchange column 1.02 I <= 1 BV)
volume buffer 10 I (optional)
regeneration flowrate 10 l/h (= 9.8 BV/h)
duration regeneration mode 6 h
initial regenerant concentration 178 meq Cl"/l (10.4 g NaCl/l)
process conditions service mode:
flowrate through one ion exchange column 35 l/h (= 34.3 BV/h)
ground water composition:
N03_-N
so42"
HC03
CI"
N02"-N
duration service mode
modelling of the ion exchange column:
resin capacity (Amberlite IRA 996)
selectivity coefficients K
A - SO,*"
A = NO3"
A = HCO3"
A = N02"
number of resin compartments
time step regeneration mode
time step service mode
1.37 meq/l
0.61 meq/l
0.74 meq/l
1.61 meq/l
0.00 meq/l
14 h
1.01 eq/l
0.0413
9.091
0.364
0.764
0.01 h
0.06 h
(19.2 mg/l)
(29.5 mg/l)
(44.9 mg/l)
(57.2 mg/l)
(0.0 mg/l)
modelling of the denitrification reactor:
reactor capacity 35.7/21.4 meq NC^'/d.h)
number of compartments 2
The overall model of biological regeneration has been tested by simulation of pilot plant experiments with a regeneration process according to configuration B in Fig. 4. In the experiments, every regeneration of the ion exchange columns took 7 hours including the rinse phase of 1 hour, and the nitrate concentration in the buffer was measured every day on arbitrary times. With the data given in Table 2 and with an initial nitrate concentration of 9.3 meq NO3VI and additional sulfate (41 meq SC>42"/1) and bicarbonate (88 meq HCC>3~/1) in the regenerant, the course of the nitrate concentration in the buffer during the 7 hours periods was simulated and compared with the experimental data. Figure 6 shows that the model fits well with the experimental results.
82

NO3 (meq/l
30
experimental values calculated curve
Fig 6. Experimental and calculated nitrate concentrations in the buffer (process
configuration B) during regeneration of an anion exchange column.
OPTIMIZATION OF THE REGENERATION
The origin of a low denitrification reactor capacity
As mentioned in the introduction a rather low capacity of the denitrification reactor was observed when it was used in the regeneration circuit according to process configuration B in Fig. 4. Figure 7 clearly demonstrates this. The capacity, expressed as meq N03"/(l.h), has been calculated from the observed amount of nitrate reduced to nitrogen gas in the denitrification reactor during periods of 24 hours, and thus represents an average capacity. Period I shows the increase of the capacity to 45 meq N03"/(l.h) during the start-up of the reactor with synthetic waste water containing nitrate and methanol. In period II the reactor is used in the regeneration circuit to remove nitrate from the regenerant, and immediately the capacity decreases to about 15 meq N03"/(l.h), although complete regeneration of the ion exchange columns would have resulted in an average capacity of 32.6 meq N03"/(l.h) in this experiment. In period III the regeneration process is stopped and the denitrification reactor is fed with nitrate and methanol, resulting in an increase of the capacity to 35 meq N03"/(l.h). However, restart of the regeneration process at day 77 (period IV) shows the same decrease as in period II, and after the regeneration process is stopped at day 122 for a second time, immediately the capacity returns to a high value (period V).
At first it was thought that toxic compounds from the ion exchange resin might have inhibited the denitrification during the regeneration process. It is known that constitutive monomers like styrene, divinylbenzene, trimethylamine, dimethylethanolamine and there derivates can leach from strong base anion exchange resins (Deguin el at., 1978; Dore el al., 1986; Sibony, 1979). However, batch experiments showed that the activity of denitrifying sludge suspended in water containing nitrate and methanol was exactly the same as the
83
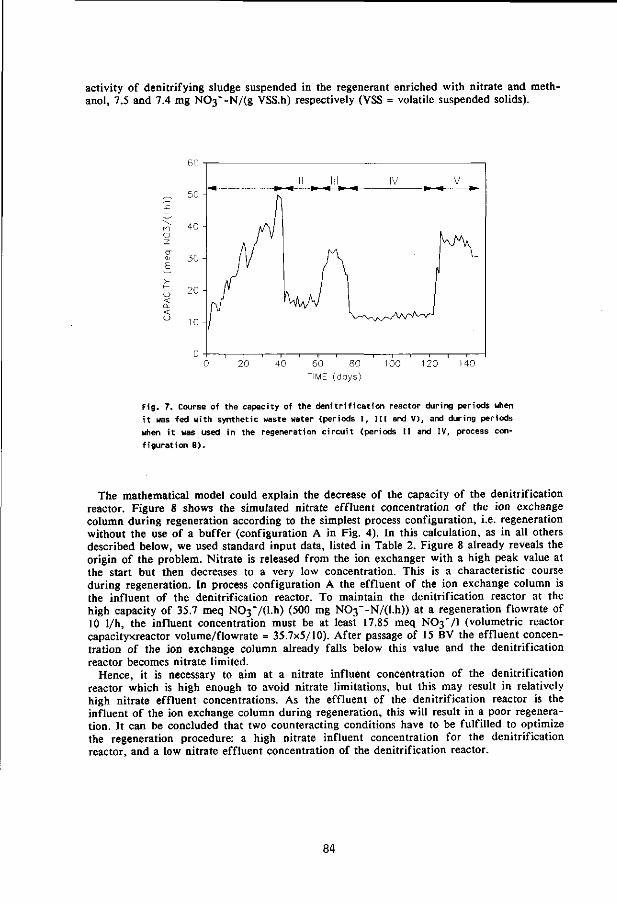
activity of denitrifying sludge suspended in the regenerant enriched with nitrate and methanol, 7.5 and 7.4 mg NC>3~-N/(g VSS.h) respectively (VSS = volatile suspended solids).
r, 20
80 TIME (days)
Fig. 7. Course of the capacity of the dem'tr i f ication reactor during periods when i t was fed with synthetic waste water (periods I , I I I and V), and during periods when i t was used in the regeneration c i rcui t (periods I I and IV, process configuration B).
The mathematical model could explain the decrease of the capacity of the denitrification reactor. Figure 8 shows the simulated nitrate effluent concentration of the ion exchange column during regeneration according to the simplest process configuration, i.e. regeneration without the use of a buffer (configuration A in Fig. 4). In this calculation, as in all others described below, we used standard input data, listed in Table 2. Figure 8 already reveals the origin of the problem. Nitrate is released from the ion exchanger with a high peak value at the start but then decreases to a very low concentration. This is a characteristic course during regeneration. In process configuration A the effluent of the ion exchange column is the influent of the denitrification reactor. To maintain the denitrification reactor at the high capacity of 35.7 meq NC>3~/(l.h) (500 mg NC>3~-N/(l.h)) at a regeneration flowrate of 10 1/h, the influent concentration must be at least 17.85 meq N03"/l (volumetric reactor capacityxreactor volume/flowrate = 35.7x5/10). After passage of 15 BV the effluent concentration of the ion exchange column already falls below this value and the denitrification reactor becomes nitrate limited.
Hence, it is necessary to aim at a nitrate influent concentration of the denitrification reactor which is high enough to avoid nitrate limitations, but this may result in relatively high nitrate effluent concentrations. As the effluent of the denitrification reactor is the influent of the ion exchange column during regeneration, this will result in a poor regeneration. It can be concluded that two counteracting conditions have to be fulfilled to optimize the regeneration procedure: a high nitrate influent concentration for the denitrification reactor, and a low nitrate effluent concentration of the denitrification reactor.
84

NOjImgq/l
70
50 60 bedvolumes
Fig. 8. Nitrate effluent concentration of the ion exchange column during regeneration according to process configuration A (deni t r i f icat ion reactor capacity 35.7 meq N03"/( l .h)>.
Process configurations to optimize the regeneration
Three other process configurations were simulated with the model to find an optimal process scheme by which both conditions can be fulfilled. In each of these a buffer has been introduced in the regeneration circuit to dilute the influent of the ion exchange column (configuration C), to smooth the influent concentrations to the denitrification reactor (configuration D) or to attain both (configuration B). Figure 4 shows these configurations. As the pilot plant experiments have been carried out according to process configuration B (Van der Hoek and Klapwijk, 1987; Van der Hoek et al., 1988b), first the computer simulations of this configuration will be presented and compared with the experimental results. After that configurations C and D will be discussed.
Process configuration B
Figure 9 shows the nitrate concentration in the buffer during regeneration of an ion exchange resin. Curve Bl simulates a denitrification reactor capacity of 35.7 meq NC>3~/(l.h) and curve B2 a capacity of 21.4 meq NC>3~/(l.h) (300 mg NC>3~-N/(l.h)). It is clear that also with this process configuration the denitrification reactor operates under nitrate limitation. The water in the buffer in fact serves as the influent of the denitrification reactor. The minimum concentration of 17.85 meq NC>3~/1 necessary to attain the denitrification reactor capacity of 35.7 meq NC>3~/(l.h) at a flowrate of 10 1/h is never reached: curve Bl (Fig. 9) shows that it varies between 4.0 and 16.75 meq NO3VI. The reactor capacity as measured in the pilot plant experiments (Fig. 7), which is only 33-50% of the maximum capacity, is in
85
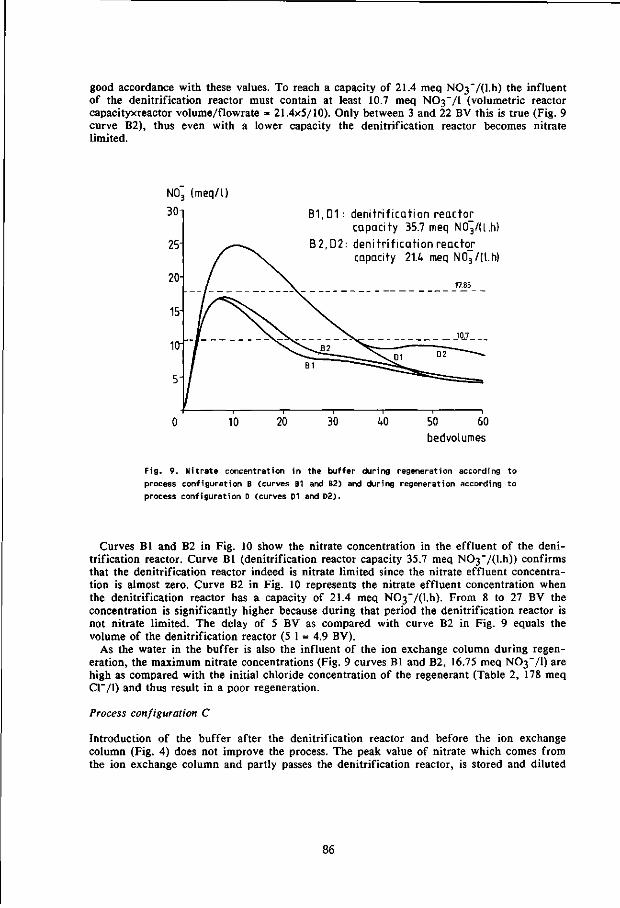
good accordance with these values. To reach a capacity of 21.4 meq NC>3"/(l.h) the influent of the denitrification reactor must contain at least 10.7 meq NO3VI (volumetric reactor capacityxreactor volume/flowrate = 21.4x5/10). Only between 3 and 22 BV this is true (Fig. 9 curve B2), thus even with a lower capacity the denitrification reactor becomes nitrate limited.
N03 (meq/l)
30i B1.D1
B2.D2
denitrification reacto£ capacity 35.7 meq N03/(l.h) denitrification reactor capacity 21.4 meq N03/(l.h)
50 60 bedvolumes
Fig. 9. Nitrate concentration in the buffer during regeneration according to
process configuration B (curves B1 and B2) and during regeneration according to
process configuration D (curves D1 and D2).
Curves Bl and B2 in Fig. 10 show the nitrate concentration in the effluent of the denitrification reactor. Curve Bl (denitrification reactor capacity 35.7 meq NC>3"/(l.h)) confirms that the denitrification reactor indeed is nitrate limited since the nitrate effluent concentration is almost zero. Curve B2 in Fig. 10 represents the nitrate effluent concentration when the denitrification reactor has a capacity of 21.4 meq NC>3~/(l.h). From 8 to 27 BV the concentration is significantly higher because during that period the denitrification reactor is not nitrate limited. The delay of 5 BV as compared with curve B2 in Fig. 9 equals the volume of the denitrification reactor (5 1 = 4.9 BV).
As the water in the buffer is also the influent of the ion exchange column during regeneration, the maximum nitrate concentrations (Fig. 9 curves Bl and B2, 16.75 meq N03"/l) are high as compared with the initial chloride concentration of the regenerant (Table 2, 178 meq Cl"/1) and thus result in a poor regeneration.
Process configuration C
Introduction of the buffer after the denitrification reactor and before the ion exchange column (Fig. 4) does not improve the process. The peak value of nitrate which comes from the ion exchange column and partly passes the denitrification reactor, is stored and diluted
86
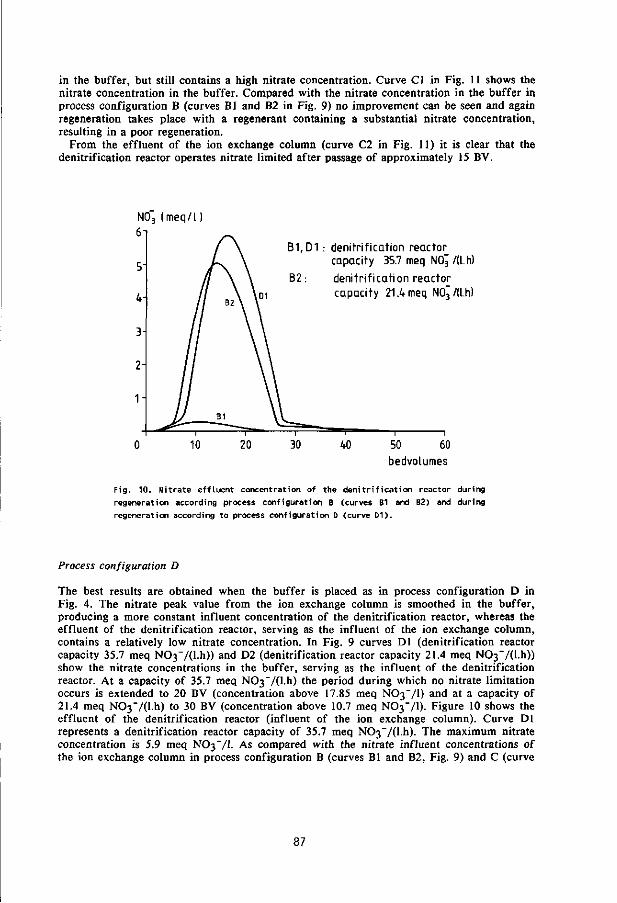
in the buffer, but still contains a high nitrate concentration. Curve CI in Fig. 11 shows the nitrate concentration in the buffer. Compared with the nitrate concentration in the buffer in process configuration B (curves Bl and B2 in Fig. 9) no improvement can be seen and again regeneration takes place with a regenerant containing a substantial nitrate concentration, resulting in a poor regeneration.
From the effluent of the ion exchange column (curve C2 in Fig. 11) it is clear that the denitrification reactor operates nitrate limited after passage of approximately 15 BV.
N03 (meq/ l ) 6
B1.D1 denitrification reactor capacity 35.7 meq NO3 /(l.h)
denitrif ication reactor capacity 21.4 meq NOJ/d.h)
—i 1 50 60
bedvolumes
Fig. 10. Nitrate effluent concentration of the deni t r i f icat ion reactor during regeneration according process configuration B (curves B1 and B2) and during regeneration according to process configuration D (curve D1).
Process configuration D
The best results are obtained when the buffer is placed as in process configuration D in Fig. 4. The nitrate peak value from the ion exchange column is smoothed in the buffer, producing a more constant influent concentration of the denitrification reactor, whereas the effluent of the denitrification reactor, serving as the influent of the ion exchange column, contains a relatively low nitrate concentration. In Fig. 9 curves Dl (denitrification reactor capacity 35.7 meq N03~/(l.h)) and D2 (denitrification reactor capacity 21.4 meq N03~/(l.h)) show the nitrate concentrations in the buffer, serving as the influent of the denitrification reactor. At a capacity of 35.7 meq NC^'/O-h) the period during which no nitrate limitation occurs is extended to 20 BV (concentration above 17.85 meq N03"/l) and at a capacity of 21.4 meq NC>3~/(l.h) to 30 BV (concentration above 10.7 meq NO3VI). Figure 10 shows the effluent of the denitrification reactor (influent of the ion exchange column). Curve Dl represents a denitrification reactor capacity of 35.7 meq N03~/(l.h). The maximum nitrate concentration is 5.9 meq NO3VI. As compared with the nitrate influent concentrations of the ion exchange column in process configuration B (curves Bl and B2, Fig. 9) and C (curve
87
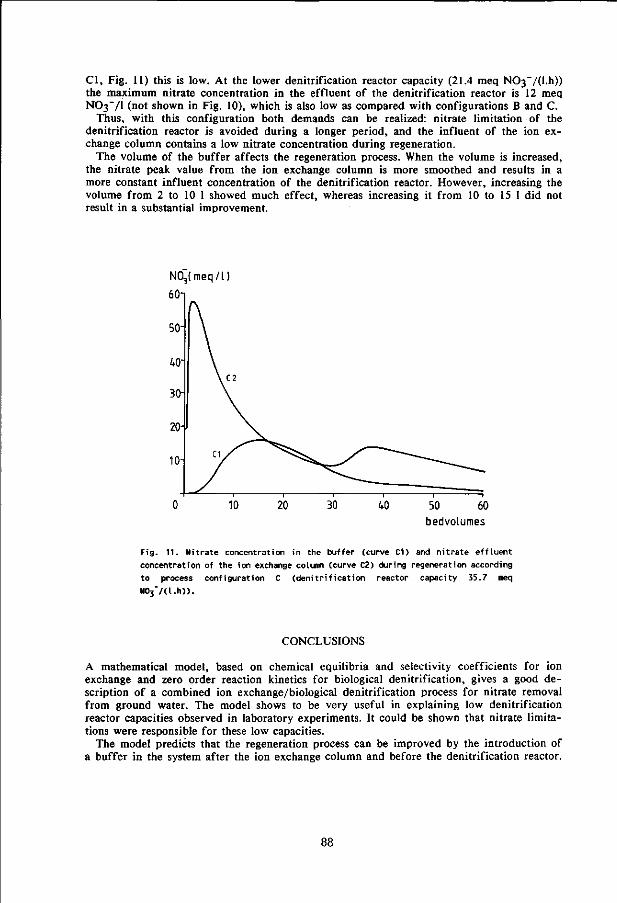
CI, Fig. 11) this is low. At the lower denitrification reactor capacity (21.4 meq N03~/(l.h)) the maximum nitrate concentration in the effluent of the denitrification reactor is 12 meq NO3VI (not shown in Fig. 10), which is also low as compared with configurations B and C.
Thus, with this configuration both demands can be realized: nitrate limitation of the denitrification reactor is avoided during a longer period, and the influent of the ion exchange column contains a low nitrate concentration during regeneration.
The volume of the buffer affects the regeneration process. When the volume is increased, the nitrate peak value from the ion exchange column is more smoothed and results in a more constant influent concentration of the denitrification reactor. However, increasing the volume from 2 to 10 1 showed much effect, whereas increasing it from 10 to 15 1 did not result in a substantial improvement.
N0~(meq/l)
60
50 60 bedvolumes
Fig. 11. Nitrate concentration in the buffer (curve C D and nitrate effluent
concentration of the ion exchange column (curve C2) during regeneration according
to process configuration C (denitrification reactor capacity 35.7 meq
NOj'/d.h)).
CONCLUSIONS
A mathematical model, based on chemical equilibria and selectivity coefficients for ion exchange and zero order reaction kinetics for biological denitrification, gives a good description of a combined ion exchange/biological denitrification process for nitrate removal from ground water. The model shows to be very useful in explaining low denitrification reactor capacities observed in laboratory experiments. It could be shown that nitrate limitations were responsible for these low capacities.
The model predicts that the regeneration process can be improved by the introduction of a buffer in the system after the ion exchange column and before the denitrification reactor.

In this configuration nitrate limitations of the denitrification reactor can be avoided and the effluent of the denitrification reactor, which serves as the influent of the ion exchange column during regeneration, will contain a relatively low nitrate concentration. This promotes a good regeneration of the anion resin.
ACKNOWLEDGEMENTS
These investigations were supported by the Netherlands Technology Foundation (STW); Rossmark-Van Wijk & Boerma Water Treatment Ltd.; the Ministry of Housing, Physical Planning and Environment; the Ministry of Economic Affairs and the Water Supply Company "Oostelijk Gelderland". The authors thank Paul van der Ven for performing part of the analyses and greatly appreciate the constructive comments of Prof. Dr. L. Lyklema on the manuscript.
REFERENCES
Anonymus (1987) Nitrates: a question of time? Wat. Qual. Int. 1, 24-28. Beek W.J. and Muttzall K.M.K. (1975) Transport phenomena, John Wiley & Sons Ltd., New
York. Bolle W.L., Breugel J. van, Eybergen G. Ch. van and Zoetemeyer R.J. (1983) Modelling the
fluid flow in up-flow anaerobic sludge blanket reactors. Proceedings of the European Symposium on Anaerobic Waste Water Treatment, Noordwijkerhout, 23-24 November, 1983 (Edited by Brink W.J. van den), pp. 97-99, TNO Corporate Communication Department, The Hague.
Bruyn J. (1984) Ground water quality - manuring: Problems with nitrate in Eastern Gelderland. H2O 17, 502-505 (in Dutch).
Clifford D.A. and Weber Jr W.J. (1978) Multicomponent ion exchange: Nitrate-removal process with land-disposable regenerant. Ind. Wat. Engng 15, 18-26.
Cooper P.F. and Wheeldon D.H.V. (1980) Fluidized- and expanded-bed reactors for wastewater treatment. Wat. Pollut. Control 79, 286-306.
Deguin A., Rouas P., Neveu A. and Gaspard M. (1978). Les nitrates dans l'eau potable - Dif-ferentes possibility de traitement - Resultats obtenus par echanges d'ions. J. Francois d'Hydrologie 9, 77-90.
Dore M., Simon Ph., Deguin A. and Victot J. (1986) Removal of nitrate in drinking water by ion exchange - Impact on the chemical quality of treated water. Wat. Res. 20, 221-232.
European Community (1980) Council directive of 15 July 1980 relating to the quality of water intended for human consumption, 80/778/EEC. Off. J. Eur. Commun. 23, L229, 11-29.
Greene L.A. (1978) Nitrates in water supply abstractions in the Anglian Region: Current trends and remedies under investigation. Wat. Poll. Control 77, 478-491.
Guter G.A. (1985) Computer simulation of nitrate removal by ion exchange. Paper presented at AWWA annual conference and exhibition, Washington, D.C., June 23-27, 1985.
Hoek J.P. van der and Klapwijk A. (1987) Nitrate removal from ground water. Wat. Res. 21, 989-997.
Hoek J.P. van der, Hoek W.F. van der and Klapwijk A. (1988a) Nitrate removal from ground water - Use of a nitrate selective resin and a low concentrated regenerant. Wat. Air Soil Poll, (in press).
Hoek J.P. van der, Ven P.J.M. van der and Klapwijk A. (1988b) Combined ion exchange/biological denitrification for nitrate removal from ground water under different process conditions. Wat. Res. (in press).
Klapwijk A., Hoeven J.C.M. van der and Lettinga G. (1981) Biological denitrification in an upflow sludge blanket reactor. Wat. Res. 15, 1-6.
89

Requa D.A. and Schroeder E.D. (1973) Kinetics of packed-bed denitrification. J. Wat. Poll. Contr. Fed. 45, 1696-1707.
Richard Y. and Leprince A. (1982) Pollution par les nitrates: Traitements disponibles. Trib. Cebedeau 35, 21-33.
Sibony J. (1979) Traitement physico-chimique des nitrates et de l'ammoniaque pour la production d'eau potable. TSM I'Eau 74, 355-359.
Sontheimer H. and Rohmann U. (1984) Grundwasserbelastung mit Nitrat - Ursachen, Bedeutung, Losungswege. GWF-Wass. Abwass. 125, 599-608.
90
CHAPTER 10
SUMMARY
Nitrate pollution of ground water as a result of fertilization in agriculture is a serious problem in many European countries. Both animal manure and artificial fertilizer cause problems. Ground water is often used for drinking water supply, and according to the European Community directive the maximum admissible concentration of nitrate in drinking water is 11.3 mg NC<3"-N/1 while the guide level is only 5.6 mg NC>3~-N/1.
To supply water that meets this standard several water supply companies will have to remove nitrate from ground water. For this purpose various biological and physico-chemical techniques are available, but only biological denitrification and ion exchange are considered practical and feasible for treatment of drinking water. However, both these processes have important disadvantages. Biological denitrification implies a direct contact between ground water, which in general is bacteriologically reliable, and micro organisms, and in the case of heterotrophic denitrification also between ground water and the carbon source that has to be added. Therefore, extensive post treatment is necessary to safeguard the drinking water quality. The production of nitrite, an intermediate product of biological denitrification, is another important drawback. Ion exchange has the disadvantage that for regeneration of the resins a large excess of salt is needed while the disposal of the voluminous concentrated brine, produced during regeneration, causes problems.
This study focuses on the development of a new technique that consists of a combination of ion exchange and biological denitrification into one process, by which the disadvantages of the separate techniques can be avoided. Nitrate is removed from the ground water by ion exchange. Regeneration of the resins takes place in a closed system, containing an upflow sludge blanket (USB) denitrification reactor. In this reactor nitrate, removed from the resins during regeneration, is converted into nitrogen gas, so that the regenerant has not to be disposed of but can be used again. Advantages of this process are the reduced regeneration salt requirement and minimal brine production as a result of the regeneration in a closed system. There is no need for an extensive post treatment because the ground water is not in direct contact with the biological process. Measures necessary to safeguard the bacteriological drinking water quality can be taken in the regeneration system itself.
In this combined ion exchange/biological denitrification process in fact the regenerant, containing the nitrate removed from the ion exchanger, is treated by the denitrification reactor. As the concentration of salts used for regeneration, NaCl or NaHCC<3, in this liquid is high, it is important to know how these high salt concentrations affect the biological denitrification process with methanol as carbon and energy source. Chapter 2 describes this research. We examined the effect of high salt concentrations on the activity of denitrifying sludge, the sludge yield coefficient and the methanol/nitrate ratio. Concentrations up to 30 g NaCl/1 or 30 g NaHCC>3/l had only little effect on the activity of denitrifying sludge. In contrast to NaCl, high NaHCC>3 concentrations reduced the sludge yield coefficient, and the methanol/nitrate ratio almost reached the stoichiometric value. High NaHCC<3 concentrations also resulted in low nitrite concentrations in the denitrification process. As a result of the denitrification reaction with methanol, the pH in the closed regeneration system rises up to 8.8-9.2. Therefore we studied the effect of these high pH values on biological denitrification. It appeared that up to a pH of 9.5 denitrification proceeded very well.
In addition to nitrate also sulfate will be removed from the ground water by the ion exchange resins. During regeneration this is removed from the resins very easily, resulting in accumulation of sulfate in the regeneration circuit up to 5 g SO^ ' / l . Chapter 3 deals with the occurrence of sulfate reduction in a denitrification reactor in the presence of high sulfate concentrations. Under normal process conditions and with the use of methanol as
91
carbon and energy source for the denitrifying bacteria sulfate reduction will not be initiated in the closed regeneration system.
Recently nitrate selective resins have been developed. Chapter 4 describes the applicability of these resins in the combined ion exchange/biological denitrification process. Experiments have been carried out with the resin Amberlite IRA 996. This resin offers the possibility to treat also ground waters containing a very high sulfate concentration. As compared with sulfate selective resins a longer regeneration duration is needed. However, the resin is insensible to sulfate accumulation in the regeneration circuit: the nitrate capacity in the service mode during nitrate removal from ground water is not affected by high sulfate concentrations in the regenerant.
In conventional regeneration procedures of strong base anion exchange resins regeneration solutions are used containing 10% salt. In the combined ion exchange/biological denitrification process the concentration is restricted to 3% to avoid severe inhibition of the denitrification reactor. This low concentration influences the required time and flow rate for regeneration. The research into these relationships is described in chapter 4. The regeneration flow rate has to be 10 bedvolumes/h while sulfate selective resins need a regeneration time of approximately 3.5 h and nitrate selective resins a regeneration time of 6 h.
Despite the use of a sand filter in the regeneration circuit to avoid pollution of the resins with sludge washed out of the denitrification reactor, some bacteriological contamination of the resins cannot be avoided. Therefore, the ion exchange resins have to be disinfected during rinsing after each regeneration cycle. The research done in this area is described in chapters 5 and 6. Disinfection can be achieved by rinsing with 0.075% peracetic acid during the first 15 min of the rinse phase, or by rinsing with 0.20% hydrogen peroxide during the first 45 min of the rinse phase. However, as peracetic acid decreases the capacity of the ion exchange resins, only the latter possibility can be used in practice.
The process has been tested under different process conditions with a lab-scale pilot plant. This research is described in chapters 7 and 8. The most important process variables studied were the regenerant composition (NaCl or NaHC03), the ion exchange resin type (sulfate selective or nitrate selective) and the ground water composition (low sulfate concentration or high sulfate concentration). Even in the presence of a very high sulfate concentration in the ground water (180 mg SO^ ' / l ) it was possible to remove nitrate from the ground water by the combined process. However, the use of a nitrate selective resin is essential in that situation. Once every 13-14 days the regenerant in the closed system had to be replaced because it became polluted by suspended material from the denitrification reactor. However, as compared with conventional regeneration of ion exchange resins, this results in a reduction of 95% in brine volume. When the operation of the sand filter in the regeneration circuit can be improved further this percentage will be even higher.
During the operation of the pilot plant a decrease of the volumetric capacity of the denitrification reactor was observed as soon as it was connected with the ion exchange columns. With the help of a computer model the cause of this decrease has been traced. Fluctuating nitrate influent concentrations of the denitrification reactor resulted in nitrate limitation. Several process configurations have been simulated to reduce this decrease. Especially the use of a buffer in the regeneration circuit appeared to be attractive to optimize the regeneration process. This model study is described in chapter 9. In the model, ion exchange is schematized through selectivity coefficients and chemical equilibria, while the denitrification process is described by zero order reaction kinetics.
The overall results of this study illustrate clearly that the combined ion exchange/biological denitrification process is an attractive alternative for nitrate removal from ground water. In comparison with conventional ion exchange, regeneration salt requirement and brine production are minimized. In contrast with biological denitrification no extensive post treatment is required and the risk of nitrite production into the treated ground water is avoided.
92
SAMENVATTING
Verontreiniging van grondwater met nitraat als gevolg van bemesting in de landbouw is een probleem in vele Europese landen. Zowel dierlijke mest als kunstmest zorgen voor problemen. Grondwater wordt vaak gebruikt voor de drinkwatervoorziening, en volgens een richtlijn van de Europese Gemeenschappen bedraagt de maximaal toelaatbare concentratie van nitraat in drinkwater 11.3 mg N03"-N/l terwijl het richtniveau slechts 5.6 mg N03~-N/l bedraagt.
Om drinkwater te distribueren dat aan deze norm voldoet zullen meerdere waterleidingbe-drijven over moeten gaan tot nitraatverwijdering uit grondwater. Hiertoe zijn verschillende biologische en fysisch-chemische technieken beschikbaar, maar alleen biologische denitrifi-catie en ionenwisseling worden als toepasbaar gekenmerkt. Beide processen hebben echter belangrijke nadelen. Biologische denitrificatie brengt het bacteriologisch betrouwbare grondwater in contact met micro-organismen, en in het geval van heterotrofe denitrificatie ook met de te doseren koolstofbron. Na de biologische denitrificatie is daarom een uitgebreide nazuivering vereist om de kwaliteit van het water te kunnen waarborgen. Een tweede be-langrijk nadeel is de vorming van nitriet, een tussenprodukt in het biologische denitrificatie-proces. Ionenwisseling heeft als nadeel dat voor regenerate van de harsen een grote hoe-veelheid zout benodigd is, terwijl afvoer van de volumineuze, hoog geconcentreerde brijn die ontstaat tijdens de regeneratie op problemen stuit.
Onderwerp van deze studie is het ontwikkelen van een nieuwe techniek, die bestaat uit een combinatie van ionenwisseling en biologische denitrificatie. Door de combinatie worden de nadelen van de afzonderlijke processen voorkomen. Nitraat wordt uit het grondwater verwij-derd door ionenwisseling. Regeneratie van de harsen vindt plaats in een gesloten systeem, waarin een upflow sludge blanket (USB) denitrificatiereactor is opgenomen. In deze reactor zetten denitrificerende bacterien het nitraat, afkomstig van de ionenwisselaar, om in stik-stofgas, zodat de regenerant niet hoeft te worden afgevoerd maar opnieuw gebruikt kan worden. Voordelen van dit proces zijn, dat de regeneratie in een gesloten systeem wordt uitgevoerd waardoor het regeneratie-zoutgebruik en brijnproduktie worden geminimaliseerd, en dat het biologische proces niet in direct contact staat met het grondwater, waardoor geen uitgebreide nazuivering vereist is. De maatregelen die nodig zijn om de bacteriologische kwaliteit van het grondwater te garanderen kunnen in het regeneratiesysteem zelf worden genomen.
In dit gecombineerde ionenwisseling/biologische denitrificatie proces wordt in feite de regenerant, die het nitraat bevat afkomstig van de ionenwisselaar, behandeld in de denitrificatiereactor. Aangezien de concentraties van de zouten die gebruikt worden voor regeneratie, NaCl of NaHCC>3, hoog zijn in deze oplossing, is het van belang te weten wat de effec-ten van deze hoge zoutconcentraties op de denitrificatie, met methanol als energie- en koolstofbron, zijn. In hoofdstuk 2 wordt dit onderzoek beschreven. Gekeken is naar het effect van hoge zoutconcentraties op de activiteit van denitrificerend slib, de slibopbrengst en de methanol/nitraat verhouding. Concentraties tot 30 g NaCl/1 of 30 g NaHCC>3/l bleken slechts een geringe invloed op de activiteit van denitrificerend slib te hebben. In tegenstel-ling tot NaCl bleek NaHCC>3 de slibopbrengst te verlagen en de methanol/nitraat verhouding terug te brengen tot bijna de stoichiometrische waarde. Hoge NaHCC>3 concentraties gaven ook aanleiding tot een geringere nitrietconcentratie in het denitrificatieproces. Aangezien in het regeneratiesysteem de pH oploopt tot circa 8.8-9.2 ten gevolge van de denitrificatie met methanol, is tevens het effect van een hoge pH op de biologische denitrificatie bestudeerd. Denitrificatie tot een pH van 9.5 bleek zeer goed mogelijk.
De ionenwisselaars zullen naast nitraat ook sulfaat uit het grondwater verwijderen. Tijdens de regeneratie komt dit zeer gemakkelijk van de ionenwisselaars af, waardoor sulfaat zich zal ophopen in het regeneratiecircuit tot concentraties van 5 g SO^ ' / l . In hoofdstuk 3 wordt ingegaan op het optreden van sulfaatreductie in een denitrificatiereactor in aanwezig-heid van deze hoge sulfaatconcentraties. Onder normale bedrijfsomstandigheden en met
93

methanol als energie- en koolstofbron voor de denitrificerende bacterien is sulfaatreductie uitgesloten in het gesloten regeneratiesysteem.
Recent zijn nitraatselectieve ionenwisselaars ontwikkeld. De toepassingsmogelijkheid van deze ionenwisselaars in het gecombineerde ionenwisseling/biologische denitrificatie proces is beschreven in hoofdstuk 4. De benodigde experimenten zijn uitgevoerd met behulp van de hars Amberlite IRA 996. Deze ionenwisselaar biedt de mogelijkheid om ook grondwater te behandelen dat een hoog sulfaatgehalte bevat. Vergeleken met sulfaatselectieve ionenwisselaars is wel een iets langere regeneratieduur vereist. De hars is echter ongevoelig voor sulfaataccumulatie in het regeneratiecircuit: de nitraatcapaciteit tijdens het gebruik van de ionenwisselaar voor nitraatverwijdering uit grondwater wordt hierdoor niet bei'nvloed.
In conventionele regeneratiesystemen voor sterk basische anionenwisselaars worden rege-neratie-oplossingen gebruikt met zoutconcentraties van 10%. In het gecombineerde ionenwisseling/biologische denitrificatie proces wordt de concentratie van de regenerant beperkt tot 3% om inhibitie van de denitrificatiereactor te voorkomen. Deze lage concentraties be'invloe-den de benodigde tijd en het benodigde debiet om de ionenwisselaars te kunnen regenereren. Onderzoek naar deze relaties wordt beschreven in hoofdstuk 4. Een regeneratiedebiet van 10 bedvolumes/h is noodzakelijk, terwijl voor sulfaatselectieve ionenwisselaars een regeneratie-tijd nodig is van circa 3± uur en voor nitraatselectieve ionenwisselaars een regeneratietijd van circa 6 uur.
Ondanks het gebruik van een zandfilter in het regeneratiecircuit, met als doel vervuiling van de hars met slib uitgespoeld uit de denitrificatiereactor te voorkomen, is een bacteriolo-gische verontreiniging van de hars niet te vermijden. Daarom moeten de ionenwisselaars in de spoelfase na iedere regeneratie gedesinfecteerd worden. Onderzoek hiernaar wordt beschreven in hoofdstuk 5 en 6. Desinfectie kan worden bereikt door te spoelen met 0,075% perazijnzuur gedurende de eerste 15 minuten van de spoelfase of door te spoelen met 0,20% waterstofperoxide gedurende de eerste 45 minuten van de spoelfase. Perazijnzuur tast echter de capaciteit van de ionenwisselaars aan, zodat in de praktijk alleen de tweede mogelijkheid kan worden toegepast.
Met behulp van een proefinstallatie op laboratoriumschaal is het proces onder verschillende condities bedreven. Dit onderzoek wordt beschreven in hoofdstuk 7 en 8. De belangrijkste procesvariabelen die werden onderzocht zijn de regenerant-samenstelling (NaCl of NaHCC>3), het type ionenwisselaar (sulfaatselectief of nitraatselectief) en de grondwater-samenstelling (laag sulfaatgehalte of hoog sulfaatgehalte). Zelfs in aanwezigheid van een extreem hoge sulfaatconcentratie in het grondwater (180 mg SO^ ' / l ) bleek het proces in staat nitraat uit het grondwater te verwijderen. In deze situatie is echter wel het gebruik van een nitraatselectieve ionenwisselaar noodzakelijk. Eenmaal per 13-14 dagen werd de regenerant in het gesloten systeem ververst omdat deze sterk vervuilde door gesuspendeerd materiaal uit de denitrificatiereactor. Vergeleken met conventionele regeneratie van ionenwisselaars resulteert dit echter in een reductie van 95% in brijnproduktie. Dit percentage kan in principe nog worden verhoogd door de bedrijfsvoering van het zandfilter in het regeneratiecircuit te verbeteren.
Gedurende de bedrijfsvoering van de proefinstallatie werd een daling van de volumetrische capaciteit van de denitrificatiereactor waargenomen zodra deze in het proces werd gekoppeld aan de ionenwisselaars. Met behulp van een computermodel is de oorzaak van deze capaci-teitsdaling achterhaald. Wisselende nitraat influentconcentraties van de denitrificatiereactor resulteerden in nitraat-limitatie. Verschillende oplossingen zijn doorgerekend waarmee de capaciteitsdaling kan worden beperkt. Met name het gebruik van een buffervat in het regeneratiesysteem bleek aantrekkelijk te zijn om het regeneratieproces te optimaliseren. Deze modelstudie wordt beschreven in hoofdstuk 9. In het model worden de ionenwisselaars ge-schematiseerd met behulp van chemische evenwichten en selectiviteitscoefficienten, terwijl het denitrificatieproces wordt beschreven met behulp van een 0e-orde reactiekinetiek.
Uit de resultaten van dit proefschrift blijkt dat het gecombineerde ionenwisseling/biologische denitrificatie proces een goed alternatief is voor nitraatverwijdering uit grondwater. Verge-
94

leken met conventionele ionenwisselingsprocessen is het regeneratiezoutgebruik beperkt en treedt er geen produktie van een volumineuze afvalbrijn op tijdens de regeneratie. In tegen-stelling tot biologische denitrificatie is er geen uitgebreide nazuivering vereist en ontbreekt het risico van nitrietvorming in het behandelde grondwater.
95

CURRICULUM VITAE
De auteur van dit proefschrift werd op 21 december 1959 geboren in Rotterdam en bezocht daar de lagere school. Het middelbaar onderwijs werd gevolgd aan het College Blaucapel te Utrecht vanaf 1972, en in 1978 afgesloten met het diploma Atheneum B. Daarna werd begon-nen met de studie Civiele Techniek aan de Technische Universiteit Delft. In februari 1984 werd deze studie afgerond met als specialisatie de Civiele Gezondheidstechniek.
Vanaf april 1984 is de auteur werkzaam bij de vakgroep Waterzuivering van de Landbouw-universiteit Wageningen als tijdelijk wetenschappelijk medewerker en voert daar onderzoek uit naar nitraatverwijdering uit grondwater; per 1 juni 1988 zal een functie worden aanvaard als onderzoeker/chemisch technoloog bij TAUW Infra Consult BV, hoofdafdeling Milieu en Technologie, stafgroep Onderzoek en Ontwikkeling.
97