Preferential recruitment of interferon-γ-expressing T H 17 cells in multiple sclerosis

311
1 Department of Medicine, Stanford University School of Medicine, Stanford, California.
2 VA Palo Alto Health Care System, Palo Alto, California.
3 Liver Diseases Branch, NIDDK, NIH, Bethesda, Maryland.
*These authors contributed equally to this work.
Differential Transcriptional Responses to Interferon-α and Interferon-γ in Primary Human Hepatocytes
Xiao-Song He,1,2 Santosh Nanda,3 Xuhuai Ji,1,2 Gloria M. Calderon-Rodriguez,3 Harry B. Greenberg,1,2,* and T. Jake Liang3,*
Interferon (IFN) plays a central role in the innate and adaptive antiviral immune responses. While IFN-α is cur-rently approved for treating chronic hepatitis B and hepatitis C, in limited studies, IFN-γ has not been shown to be effective for chronic hepatitis B or C. To identify the potential mechanism underlying the differential antiviral effects of IFN-α and IFN-γ, we used cDNA microarray to profi le the global transcriptional response to IFN-α and IFN-γ in primary human hepatocytes, the target cell population of hepatitis viruses. Our results reveal dis-tinct patterns of gene expression induced by these 2 cytokines. Overall, IFN-α induces more genes than IFN-γ at the transcriptional level. Distinct sets of genes were induced by IFN-α and IFN-γ with limited overlaps. IFN-α induces gene transcription at an early time point (6 h) but not at a later time point (18 h), while the effects of IFN-γ are more prominent at 18 h than at 6 h, suggesting a delayed transcriptional response to IFN-γ in the hepato-cytes. These fi ndings indicate differential actions of IFN-α and IFN-γ in the context of therapeutic intervention for chronic viral infections in the liver.
Introduction
Type I and type II interferons (IFNs) play a central role in the innate and adaptive immune responses against both
acute and chronic viral infections. Type I IFNs, including IFN-α, IFN-β, and IFN-ω, are produced directly by virus-infected host cells, while type II IFN, or IFN-γ, is induced by viral antigen-stimulated immune cells including NK cells and T cells (Stark and others 1998). Although the mechanisms for the antiviral effects of these IFNs are not entirely clear, it is believed that they exert their antiviral function through both direct and indirect mechanisms. Both IFN-α and IFN-γ have a profound effect on host gene expression. The direct antiviral effects of IFNs are thought to involve induction of IFN-stimulated genes (ISGs), which establishes an antiviral state in the infected cells (Samuel 1991; Stark and others 1998; Samuel 2001). The indirect antiviral effects of IFNs involve their regulation of the innate and adaptive immune systems, which is also likely to be mediated by ISGs.
IFN-α is the major FDA-approved therapeutic for chronic infection with hepatitis C virus (HCV) and remains an effective therapeutic in certain circumstances for hepatitis B
virus (HBV) infection. HCV treatment with recently devel-oped peginterferon α-2b and peginterferon α-2a in combina-tion with ribavirin has a signifi cantly higher response rate than treatment with IFN-α alone, resulting in a sustained virological response rate of ~50% (Manns and others 2001; Fried and others 2002). Subgenomic HCV replicon cells and more recently, infectious HCV cell culture systems have been used to study the anti-HCV effects of IFNs in vitro. It has been demonstrated that both IFN-α and IFN-γ potently suppress HCV replication in cell culture (Frese and oth-ers 2002; Lanford and others 2003; Kato and others 2007). Despite the similarity between IFN-α and IFN-γ regarding their effects on cellular gene expression and subgenomic HCV replicon, the therapeutic effect of IFN-γ on chronic HCV infection has not been evaluated in clinical trials with treatment-naïve patients. A pilot study with IFN-γ in patients with chronic hepatitis C who had failed to achieve a sustained response to IFN-α-based therapies showed no effect of IFN-γ (100–400 μg, 3 times per week) on HCV RNA levels (Soza and others 2005). In addition to HCV, IFN-α is also one of the current therapeutic agents for chronic HBV
JOURNAL OF INTERFERON & CYTOKINE RESEARCHVolume 30, Number 5, 2010© Mary Ann Liebert, Inc.DOI: 10.1089/jir.2009.0082

HE ET AL.312
in the hepatocyte cultures compared to the standard clin-ical dosage of IFN-α-2b (3 million U) versus the dosage of IFN-γ-1b (100–400 μg) in a previous clinical trial of IFN-γ for treating chronic HCV infection (Soza and others 2005).
Microarray assay
Hepatocyte total RNA isolation, cDNA synthesis, as well as preparation of fl uorescence labeled targets, and cDNA microarray hybridization were carried out as previously reported (He and others 2006). Microarrays were obtained from Stanford Functional Genomics Facility (Stanford, CA). Each microarray contained ~43,000 spots, including 85.8% I.M.A.G.E. consortium clones from the Research Genetics Sequence Verifi ed clone set (http://www.invitrogen.com/content/sfs/manuals/sequenceverifiedclones_man.pdf), 9.8% CGAP clone set (http://cgap.nci.nih.gov/Genes/PurchaseReagents), and 4.4% control spots or customer spots, corresponding to ~38,500 human sequence-verifi ed genes. Detection and processing of the fl uorescence signals on microarrays were carried out as described (He and others 2006). For all subsequent analyses, we included 7,379 array elements whose expression was well-measured. We defi ned well-measured genes by having (1) a ratio of normalized sig-nal intensity to background noise of >2 for either the Cy5 signal derived from IFN-stimulated hepatocytes or the Cy3 signal derived from unstimulated hepatocytes and (2) a pixel regression correlation of R < 0.6 in at least 70% of all arrays (He and others 2006).
Microarray data analysis
One-class SAM analysis (Tusher and others 2001) was per-formed to identify IFN-regulated genes under each experi-mental condition at a False Discovery Rate (FDR) of <10%. Ingenuity Pathways Analysis (IPA; Ingenuity, Redwood City, CA) was used to identify pathways signifi cantly (P < 0.002) activated by IFN-α at 6 h and by IFN-γ at 18 h.
Quantitative real-time PCR analysis
To validate the results of microarray analysis, several ISGs—MxA, IFIT1, IP10, and interferon responsive factor 1 (IRF1)—were selected for TaqMan real-time reverse tran-scription (RT)-PCR analysis using the iCycler (Bio-Rad, Hercules, CA). In brief, cDNA was generated using 500 ng of total RNA in a 20-μL RT reaction with the First-Strand cDNA Synthesis System for Quantitative RT-PCR Kit (Marligen Biosciences, Ljamsville, MD) as templates. TaqMan probes and primers for the genes of interest were purchased from PE Applied Biosystems (Foster City, CA) and the reactions were performed according to the manufacturer’s guidelines. Standard curve for each individual target amplicon was constructed using cDNA from Huh7. All PCR assays were performed in duplicates, and results are represented by the mean values. The 18s rRNA was used as a housekeeping gene against which all samples were normalized.
Results
To investigate the transcriptional responses of hepatic genes induced by IFN-α or IFN-γ, we prepared primary hepatocytes from 5 healthy human donor livers. Each
infection, although the treatment effect on HBV viral load is smaller compared to HCV and only about 30% of treated individuals respond to treatment (Leung 2002; Lau and oth-ers 2005; Lai and others 2006). Clinical trials of IFN-γ for chronic HBV infection failed to show a signifi cant anti-HBV effect (Marcellin and others 1990; Kakumu and others 1991; Lau and others 1991).
Previous studies have shown that IFN-α and IFN-γ share a broad range of signal transduction pathways (Stark and others 1998; Samuel 2001; Sanda and others 2006). However, the overall patterns of transcriptional responses of human hepatocytes to IFN-α and IFN-γ have not been compared systematically. We had previously used microarray expres-sion analyses to investigate ISGs in liver or PBMCs from chronic hepatitis C patients starting IFN-α therapy and demonstrated that the outcome of IFN-α therapy is asso-ciated with the magnitude of overall ISG induction (Ji and others 2003; He and others 2006; Feld and others 2007). To explore the potential mechanism underlying the differ-ences in the in vivo antiviral effects of IFN-α and IFN-γ, we used cDNA microarray to profi le the global transcriptional response to IFN-α and IFN-γ in primary human hepato-cytes, the major target of infection by hepatitis viruses. Our results reveal distinct patterns of gene expression induced by these 2 cytokines in terms of the kinetics, breadth, and magnitude of transcriptional response in the hepatocytes. These fi ndings suggest differential actions of these 2 IFNs in the context of therapeutic intervention for chronic viral infections in the liver.
Materials and Methods
Human hepatocyte culture and interferon treatment
Primary human hepatocytes were obtained from Stephen C. Strom of University of Pittsburgh, through Liver Tissue Procurement and Distribution System (Pittsburgh, Pennsylvania). Five donor livers were used for this study. These hepatocytes maintain liver-specifi c functions for many days under a defi ned culture condition (Kostrubsky and others 1999). In brief, human hepatocytes were prepared from livers not used for whole organ transplant within 24 h of procurement. Hepatocytes were isolated by a 3-step colla-genase perfusion technique, as described (Strom and others 1996). Hepatocytes with a viability of >80% (assessed by a Trypan Blue exclusion method) were plated at a cell density of 2 × 10⁶ cells per well on 6-well culture plates previously coated with rat-tail collagen in human hepatocyte mainte-nance medium (HMM) supplemented with 0.1 μM insulin, 0.1 μM dexamethasone, 0.05% streptomycin, 0.05% peni-cillin, 0.05% amphotericin B, and 10% bovine calf serum (HMM+) (Runge and others 2000). After 4 h of culturing for cell attachment, the medium was replaced with serum-free HMM+. After another 24 h in culture, unattached cells were removed by gentle agitation and washing with PBS. The cells were maintained in culture at 37°C in serum-free HMM containing 5% CO2 for 6 and 18 h, with or without IFN-α-2b (Schering, Kenilworth, NJ) at a concentration of 200 U/mL as previously described (Ji and others 2003; He and others 2006), or with IFN-γ-1b (Actimmune®, kindly provided by Larry Blatt, InterMune, Inc., Brisbane, CA) at a concentration of 20 ng/mL. This concentration of IFN-γ was chosen based on a similar ratio of concentrations of IFN-α versus IFN-γ

IFN-𝛂 AND IFN-𝛄 TRANSCRIPTIONAL RESPONSES 313
We further compared the aFC of individual ISG between the 2 time points for each IFN treatment. In hepatocytes incubated with IFN-α (Fig. 2A), the majority (274 of 331, 83%) of genes with an overall aFC > 1.4 had a greater aFC at 6 h than at 18 h. In contrast, in hepatocytes incubated with IFN-γ (Fig. 2B), the majority (188 of 308, 61%) of genes with an overall aFC > 1.4 had a greater aFC at 18 h than at 6 h. Taken together, these results indicated that the effects of IFN-α on hepatocyte gene expression decrease from 6 h to 18 h, while the effects of IFN-γ increase during the same time frame, suggesting that compared to IFN-α, the hepatocyte tran-scriptional responses to IFN-γ were delayed.
To compare the pattern of ISG induction by IFN-α versus IFN-γ in hepatocytes, we fi rst compared the aFC of individ-ual ISGs in hepatocytes incubated with these 2 IFNs at each time point. At the 6-h time point, the majority (314 of 414, 76%) of genes with an overall aFC > 1.4 were induced to a greater FC by IFN-α than by IFN-γ (Fig. 2C). At 18 h, how-ever, the majority (154 of 214, 72%) of the ISGs with an overall aFC > 1.4 were induced to a greater aFC by IFN-γ than by IFN-α (Fig. 2D).
Next we used SAM to identify genes signifi cantly induced by IFN-α or IFN-γ at the 2 time points, with a false discovery rate of <10%. Table 1 lists all the identifi ed genes and their aFC values. For IFN-α, 107 genes were identifi ed as signif-icantly up-regulated at 6 h. At 18 h, not a single gene was
hepatocyte culture was incubated with or without IFN-α or IFN-γ for 6 and 18 h, followed by microarray analysis to identify genes regulated by each cytokines at the 2 time points. Across these 20 microarrays, a total of 7,379 array ele-ments were identifi ed as well-measured genes based on the pre-set criteria (He and others 2006).
First, we examined the kinetics of transcriptional responses to IFN-α and IFN-γ. For each experimental condi-tion (IFN-α/6 h, IFN-α/18 h, IFN-γ/6 h, and IFN-γ/18 h), aver-age fold change (aFC) was calculated for each gene across all 5 samples. The aFC values of the 7,379 genes were sorted by descending order and plotted against their ranking (Fig. 1). While the vast majority of these genes had an aFC close to 1, both up-regulated genes, or by defi nition, ISGs, and down-regulated genes were identifi ed under each experimental condition. In hepatocytes incubated with IFN-α, the num-bers of ISGs with aFC > 1.4 or aFC > 2 are greater at the 6-h time point than at the 18-h time point (Fig. 1, insets A and B). Similarly, the numbers of down-regulated genes with aFC < 1/1.4 or aFC < 1/2 are both greater at 6 h than at 18 h (Fig. 1, inset C). In contrast to IFN-α, when hepatocytes were incubated with IFN-γ, the numbers of ISGs with aFC > 1.4 or aFC > 2 are both smaller at the 6-h time point than at the 18-h time point (Fig. 1, insets A and B), while the numbers of down-regulated genes with aFC < 1/1.4 or aFC < 1/2 are both smaller at 6 h than at 18 h (Fig. 1, inset C).
1
1/4
1/2
1
2
4
8
16
1001
0
18 h
6 h
18 h
6 hIFN-α
IFN-α
IFN-γ
IFN-γ
200 400 600
A B C
800
aFC > 1.4
aFC > 2
1000 12002
1 201 400 6980
1/4
1/2
1/1.4
7179 7379
4
8
2001 3001
Number of Genes
aFC
4001 5001 6001 7001 7379
FIG. 1. Distribution of average fold change (aFC) values for mRNA levels of hepatocyte genes induced by interferon (IFN)-α or IFN-γ. Primary human hepatocyte cultures from 5 donors were incubated with and without IFN-α or IFN-γ for 6 and 18 h. Microarray assay was used to measure FC of mRNA levels for individual genes in response to IFN-α or IFN-γ, respec-tively, at each time point. For each experimental condition, the aFC values for individual genes were calculated across all 5 donors, sorted by descending order, and normalized to make the median aFC equal to 1. The normalized aFC values were plotted against the rank number of genes. Inset A shows the number of genes with aFC > 2 and aFC > 1.4 under each exper-imental condition. Inset B shows a close-up look of the fi rst 400 genes with the greatest aFC values (up-regulated genes) from the main graph. Inset C shows a close-up look of the last 400 genes with the smallest aFC values (down-regulated genes) from the main graph.

HE ET AL.314
Discussion
We used microarrays to investigate the transcriptional responses in primary hepatocytes induced by IFN-α and IFN-γ, 2 cytokines that have been approved or tested in clin-ical trials for treating chronic hepatitis B or C. The antiviral effects of IFNs are believed to be mediated by the induction of ISGs, which have been examined extensively in previ-ous studies. However, most of the previously documented human ISGs were identifi ed either in the cell lines (Der and others 1998), or in PBMCs (Ji and others 2003). In this study, we used primary human hepatocytes derived from donor livers to examine the transcriptional responses to IFN-α and IFN-γ, which should generate more relevant information for the therapeutic effects of these 2 cytokines against the hepa-titis viruses in their target organ.
Our results indicated that in the primary hepatocytes, while both IFN-α and IFN-γ induced large numbers of gene transcripts, a striking difference between the cellular tran-scriptional responses to these 2 IFNs is the kinetics of gene induction. A vigorous response to IFN-α was seen at 6 h that disappeared completely at 18 h. In contrast, a slower tran-scriptional response to IFN-γ was observed that was greatly enhanced at 18 h compared to 6 h. Although the implication of this kinetic difference to the antiviral effects of IFN-α ver-sus IFN-γ is not clear at this time, it is likely that the vigor-ous early transcriptional response to IFN-α in hepatocytes is directly related to the rapid decline of serum HCV viral load observed within hours of IFN-α injection (Neumann and others 1998).
The best understood signal transduction pathway trig-gered by IFNs is the JAK-STAT pathway (Stark and others 1998; Sen 2001; Platanias 2005). Binding of IFN to its cog-nate transmembrane receptors on the cell surface triggers dimerization of the receptor subunits and activation of the receptor-associated Janus kinases, JAK1 and TYK2 for the
signifi cantly up-regulated. In contrast, the number of genes signifi cantly up-regulated by IFN-γ increased from 56 at 6 h to 77 at 18 h. We then examined the overall pattern of ISG induction in response to IFN-α and IFN-γ by comparing the list of signifi cantly up-regulated genes identifi ed with SAM. As shown in Figure 3, the majority (64%), or 69 of 107 genes signifi cantly up-regulated by IFN-α at 6 h were not up-reg-ulated by IFN-γ, while the majority of IFN-γ up-regulated genes at 6 h (but not at 18 h) were also up-regulated by IFN-α at the same time point. Of note, even when the genes signifi -cantly up-regulated by IFN-γ at 18 h were compared to those up-regulated by IFN-α at 6 h, <50% of the 2 gene lists over-lapped with each other. These results suggest that IFN-α and IFN-γ induced distinct sets of ISGs in hepatocytes with limited overlap.
To validate the results of microarray analysis, we per-formed real-time quantitative PCR. The ISGs, Mx1 and IFIT1, were chosen as representative genes more specifi c for IFN-α, while IRF1 and IP10 (CXCL10) were chosen for IFN-γ. Both Mx1 and IFIT1 were highly induced in comparison to their respective controls in the IFN-α-treated hepatocytes at the 6-h time point (Fig. 4). Their strength of induction dimin-ished at 18 h of IFN-α treatment. In contrast, the more IFN-γ-specifi c genes IRF1 and IP10 followed the opposite trend and were induced to higher levels at the 18-h time point (Fig. 4). Quantitative PCR of these selected ISGs supported the overall trend as defi ned by microarray analysis.
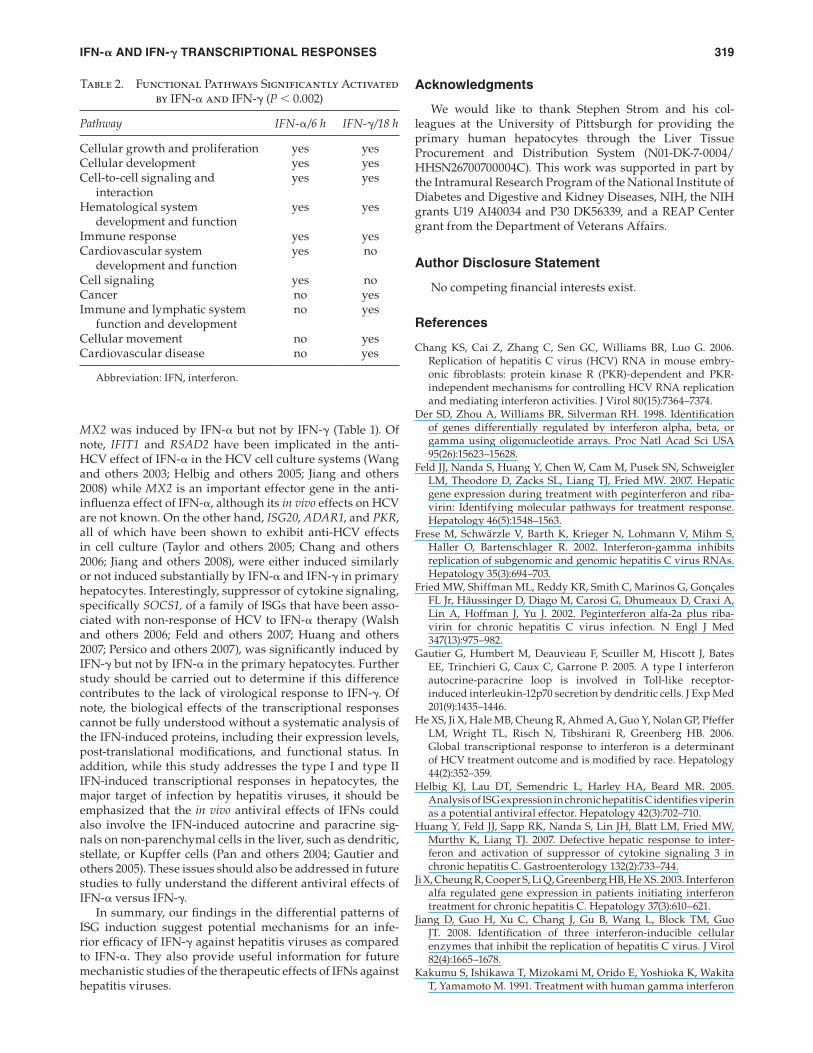
To examine the functional pathways activated by IFN-α and IFN-γ, we used Ingenuity Pathways Analysis (IPA) to identify functional pathways that were signifi cantly acti-vated by IFN-α (at 6 h) or by IFN-γ (at 18 h). At the sig-nifi cance level of P < 0.002, 5 functional pathways were commonly activated by IFN-α and IFN-γ, 2 functional path-ways were signifi cantly activated by IFN-α only, while 4 functional pathways were signifi cantly activated by IFN-γ only (Table 2).
Gene
1 1 50 100 150 2140.5
1
2
4
aFC
8
16
0.5
1
2
4
aFC
8
16
100 200
6 h 18 h
300
IFN-γ
IFN-α
IFN-γIFN-α
IFN-γ
IFN-α
412
1 100 200
6 h
18 h
6 h
18 h
331 1 100 200 308
A B
C D
FIG. 2. Group-wise comparison of average FC (aFC) of mRNA levels of individual genes in human hepatocytes incubated with inter-feron (IFN)-α or IFN-γ at 6 and 18 h. Included are all genes with aFC > 1.4. The genes are ranked by descending order of the overall average FC across all the individual samples in the compared groups. (A) Comparison of IFN-α-induced changes for 331 genes, 6 h versus 18 h. (B) Comparison of IFN-γ-induced changes for 308 genes, 6 h versus 18 h. (C) Comparison of 412 genes, IFN-α versus IFN-γ at 6 h. (D) Comparison of 214 genes, IFN-α versus IFN-γ at 18 h.

IFN-𝛂 AND IFN-𝛄 TRANSCRIPTIONAL RESPONSES 315
Table 1. Significantly Up-Regulated Human Hepatocyte Genes by IFN-α and IFN-γ at 6 and 18 h
ID Name IFN-α/6 h IFN-γ/6 h IFN-γ/18 h
ARL5B ADP-ribosylation factor-like 5B 2.6BAZ1A Bromodomain adjacent to zinc fi nger domain, 1A 2.7BLZF1 Basic leucine zipper nuclear factor 1 (JEM-1) 2.6BST2 Bone marrow stromal cell antigen 2 4.3 3.6 5.9C1orf38 Chromosome 1 open reading frame 38 3.8C3AR1 Complement component 3a receptor 1 2.8CA7 Carbonic anhydrase VII 6.2CARHSP1 Calcium-regulated heat stable protein 1, 24 kDa 2.6CASP1 Caspase 1, apoptosis-related cysteine peptidase 3.0CCRL1 Chemokine (C–C motif) receptor-like 1 3.9CD38 CD38 molecule 2.7CD40 CD40 molecule, TNF receptor superfamily member 5 5.0CD53 CD53 molecule 2.5CDC25B Cell division cycle 25 homolog B (Schizosaccharomyces pombe) 2.5CMPK2 Cytidine monophosphate (UMP–CMP) kinase 2, mitochondrial 3.7CSF2RB Colony-stimulating factor 2 receptor, β, low affi nity 3.5CTSO Cathepsin O 2.8CTSS Cathepsin S 3.1 2.7CX3CL1 Chemokine (C–X3–C motif) ligand 1 5.2 7.5 7.3CXCL10 Chemokine (C–X–C motif) ligand 10 8.2 7.0 3.9CXCL9 Chemokine (C–X–C motif) ligand 9 3.5 3.8CYorf15A Chromosome Y open reading frame 15A 6.8 3.2 3.0CYP1B1 Cytochrome P450, family 1, subfamily B, polypeptide 1 2.8DDO d-Aspartate oxidase 3.2DDX58 DEAD (Asp-Glu-Ala-Asp) box polypeptide 58 8.9 3.0DDX60L DEAD (Asp-Glu-Ala-Asp) box polypeptide 60-like 4.5DUOXA1 Dual oxidase maturation factor 1 2.9DUOXA2 Dual oxidase maturation factor 2 2.9DUSP6 Dual specifi city phosphatase 6 2.6EIF2AK2 Eukaryotic translation initiation factor 2-α kinase 2 3.0EPSTI1 Epithelial stromal interaction 1 (breast) 8.8 7.2 9.2ETV6 Ets variant gene 6 (TEL oncogene) 2.5EXT1 Exostoses (multiple) 1 2.9FAM111A Family with sequence similarity 111, member A 2.9FAM26F Family with sequence similarity 26, member F 6.2 5.0FAM72B Family with sequence similarity 72, member B 3.6FLJ11171 Hypothetical protein FLJ11171 3.8 2.7FLJ39639 Hypothetical protein FLJ39639 2.5FST Follistatin 2.4GBP1 Guanylate-binding protein 3 3.3GBP2 Guanylate-binding protein 2, interferon-inducible 3.6 4.5GCNT1 Glucosaminyl (N-acetyl) transferase 1, core 2 3.5GLB1 Galactosidase, β1 2.8GMPR Guanosine monophosphate reductase 7.9GNB4 Guanine nucleotide-binding protein (G protein), β-polypeptide 4 2.9HIST2H2AA3 Histone cluster 2, H2aa3 2.6HK2 Hexokinase 2 2.8 3.2HLA-DPA1 Major histocompatibility complex, class II, DP-α1 3.3HLA-DQB1 Major histocompatibility complex, class II, DQ-β1 3.2HLA-DRB1 Major histocompatibility complex, class II, DR-β3 3.2 3.6HLA-DRB4 Major histocompatibility complex, class II, DR-β4 3.8 5.1HLA-E Major histocompatibility complex, class I, E 2.5 2.8 4.8HMCN2 Hemicentin 2 5.8IFI16 Interferon, γ-inducible protein 16 2.5IFI30 Interferon, γ-inducible protein 30 2.9IFI44L Interferon-induced protein 44-like 6.3 3.8 5.4IFI6 Interferon, α-inducible protein 6 3.1IFIH1 Interferon induced with helicase C domain 1 9.0 3.0 3.0
(Continued)
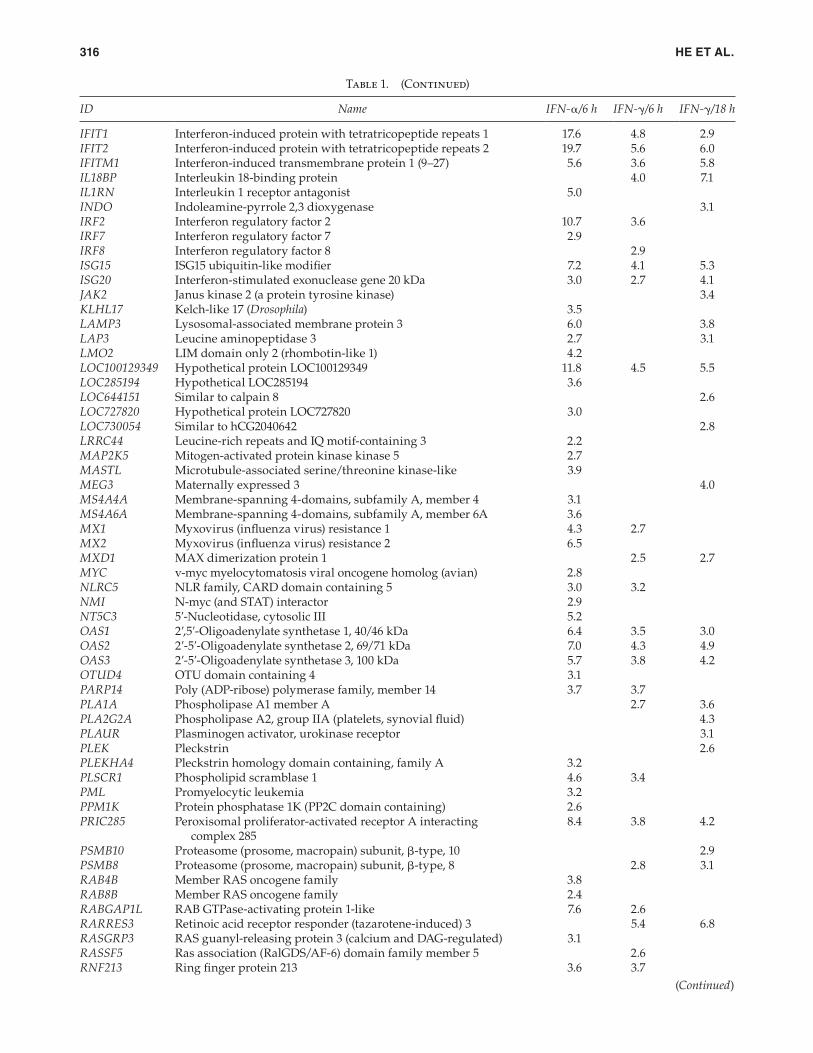
HE ET AL.316
Table 1. (Continued)
ID Name IFN-α/6 h IFN-γ/6 h IFN-γ/18 h
IFIT1 Interferon-induced protein with tetratricopeptide repeats 1 17.6 4.8 2.9IFIT2 Interferon-induced protein with tetratricopeptide repeats 2 19.7 5.6 6.0IFITM1 Interferon-induced transmembrane protein 1 (9–27) 5.6 3.6 5.8IL18BP Interleukin 18-binding protein 4.0 7.1IL1RN Interleukin 1 receptor antagonist 5.0INDO Indoleamine-pyrrole 2,3 dioxygenase 3.1IRF2 Interferon regulatory factor 2 10.7 3.6IRF7 Interferon regulatory factor 7 2.9IRF8 Interferon regulatory factor 8 2.9ISG15 ISG15 ubiquitin-like modifi er 7.2 4.1 5.3ISG20 Interferon-stimulated exonuclease gene 20 kDa 3.0 2.7 4.1JAK2 Janus kinase 2 (a protein tyrosine kinase) 3.4KLHL17 Kelch-like 17 (Drosophila) 3.5LAMP3 Lysosomal-associated membrane protein 3 6.0 3.8LAP3 Leucine aminopeptidase 3 2.7 3.1LMO2 LIM domain only 2 (rhombotin-like 1) 4.2LOC100129349 Hypothetical protein LOC100129349 11.8 4.5 5.5LOC285194 Hypothetical LOC285194 3.6LOC644151 Similar to calpain 8 2.6LOC727820 Hypothetical protein LOC727820 3.0LOC730054 Similar to hCG2040642 2.8LRRC44 Leucine-rich repeats and IQ motif-containing 3 2.2MAP2K5 Mitogen-activated protein kinase kinase 5 2.7MASTL Microtubule-associated serine/threonine kinase-like 3.9MEG3 Maternally expressed 3 4.0MS4A4A Membrane-spanning 4-domains, subfamily A, member 4 3.1MS4A6A Membrane-spanning 4-domains, subfamily A, member 6A 3.6MX1 Myxovirus (infl uenza virus) resistance 1 4.3 2.7MX2 Myxovirus (infl uenza virus) resistance 2 6.5MXD1 MAX dimerization protein 1 2.5 2.7MYC v-myc myelocytomatosis viral oncogene homolog (avian) 2.8NLRC5 NLR family, CARD domain containing 5 3.0 3.2NMI N-myc (and STAT) interactor 2.9NT5C3 5′-Nucleotidase, cytosolic III 5.2OAS1 2′,5′-Oligoadenylate synthetase 1, 40/46 kDa 6.4 3.5 3.0OAS2 2′-5′-Oligoadenylate synthetase 2, 69/71 kDa 7.0 4.3 4.9OAS3 2′-5′-Oligoadenylate synthetase 3, 100 kDa 5.7 3.8 4.2OTUD4 OTU domain containing 4 3.1PARP14 Poly (ADP-ribose) polymerase family, member 14 3.7 3.7PLA1A Phospholipase A1 member A 2.7 3.6PLA2G2A Phospholipase A2, group IIA (platelets, synovial fl uid) 4.3PLAUR Plasminogen activator, urokinase receptor 3.1PLEK Pleckstrin 2.6PLEKHA4 Pleckstrin homology domain containing, family A 3.2PLSCR1 Phospholipid scramblase 1 4.6 3.4PML Promyelocytic leukemia 3.2PPM1K Protein phosphatase 1K (PP2C domain containing) 2.6PRIC285 Peroxisomal proliferator-activated receptor A interacting
complex 285 8.4 3.8 4.2
PSMB10 Proteasome (prosome, macropain) subunit, β-type, 10 2.9PSMB8 Proteasome (prosome, macropain) subunit, β-type, 8 2.8 3.1RAB4B Member RAS oncogene family 3.8RAB8B Member RAS oncogene family 2.4RABGAP1L RAB GTPase-activating protein 1-like 7.6 2.6RARRES3 Retinoic acid receptor responder (tazarotene-induced) 3 5.4 6.8RASGRP3 RAS guanyl-releasing protein 3 (calcium and DAG-regulated) 3.1RASSF5 Ras association (RalGDS/AF-6) domain family member 5 2.6RNF213 Ring fi nger protein 213 3.6 3.7
(Continued)
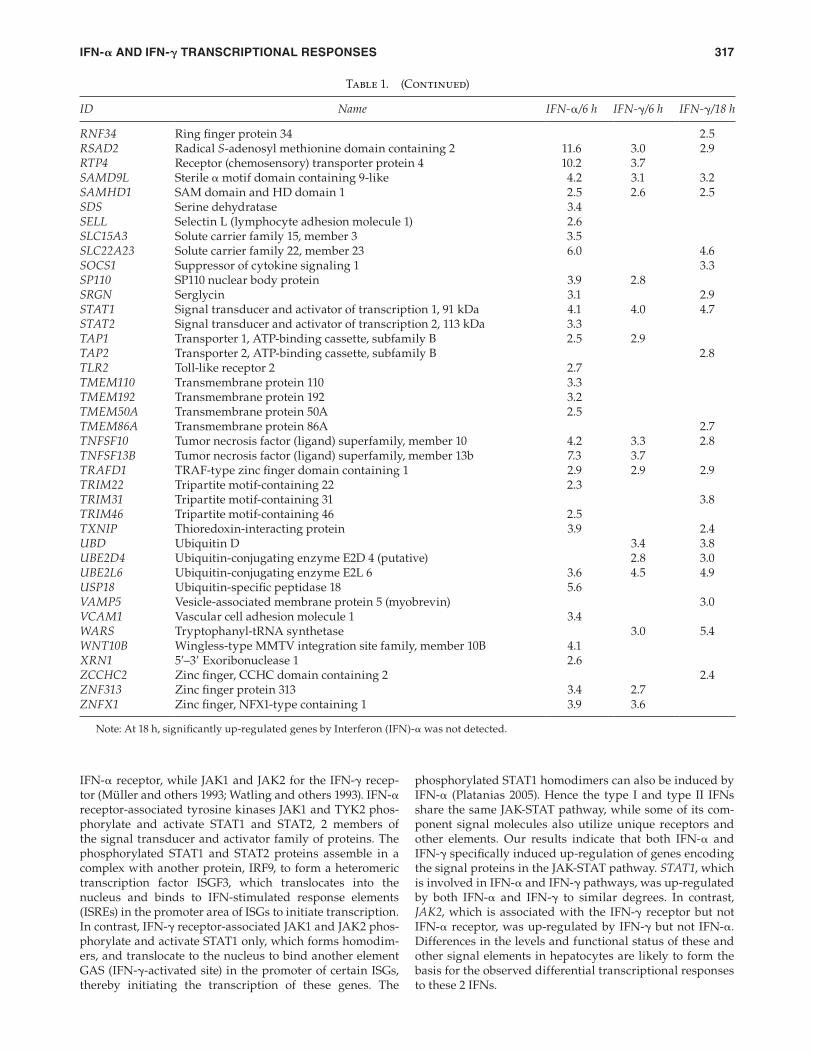
IFN-𝛂 AND IFN-𝛄 TRANSCRIPTIONAL RESPONSES 317
phosphorylated STAT1 homodimers can also be induced by IFN-α (Platanias 2005). Hence the type I and type II IFNs share the same JAK-STAT pathway, while some of its com-ponent signal molecules also utilize unique receptors and other elements. Our results indicate that both IFN-α and IFN-γ specifi cally induced up-regulation of genes encoding the signal proteins in the JAK-STAT pathway. STAT1, which is involved in IFN-α and IFN-γ pathways, was up-regulated by both IFN-α and IFN-γ to similar degrees. In contrast, JAK2, which is associated with the IFN-γ receptor but not IFN-α receptor, was up-regulated by IFN-γ but not IFN-α. Differences in the levels and functional status of these and other signal elements in hepatocytes are likely to form the basis for the observed differential transcriptional responses to these 2 IFNs.
IFN-α receptor, while JAK1 and JAK2 for the IFN-γ recep-tor (Müller and others 1993; Watling and others 1993). IFN-α receptor-associated tyrosine kinases JAK1 and TYK2 phos-phorylate and activate STAT1 and STAT2, 2 members of the signal transducer and activator family of proteins. The phosphorylated STAT1 and STAT2 proteins assemble in a complex with another protein, IRF9, to form a heteromeric transcription factor ISGF3, which translocates into the nucleus and binds to IFN-stimulated response elements (ISREs) in the promoter area of ISGs to initiate transcription. In contrast, IFN-γ receptor-associated JAK1 and JAK2 phos-phorylate and activate STAT1 only, which forms homodim-ers, and translocate to the nucleus to bind another element GAS (IFN-γ-activated site) in the promoter of certain ISGs, thereby initiating the transcription of these genes. The
Table 1. (Continued)
ID Name IFN-α/6 h IFN-γ/6 h IFN-γ/18 h
RNF34 Ring fi nger protein 34 2.5RSAD2 Radical S-adenosyl methionine domain containing 2 11.6 3.0 2.9RTP4 Receptor (chemosensory) transporter protein 4 10.2 3.7SAMD9L Sterile α motif domain containing 9-like 4.2 3.1 3.2SAMHD1 SAM domain and HD domain 1 2.5 2.6 2.5SDS Serine dehydratase 3.4SELL Selectin L (lymphocyte adhesion molecule 1) 2.6SLC15A3 Solute carrier family 15, member 3 3.5SLC22A23 Solute carrier family 22, member 23 6.0 4.6SOCS1 Suppressor of cytokine signaling 1 3.3SP110 SP110 nuclear body protein 3.9 2.8SRGN Serglycin 3.1 2.9STAT1 Signal transducer and activator of transcription 1, 91 kDa 4.1 4.0 4.7STAT2 Signal transducer and activator of transcription 2, 113 kDa 3.3TAP1 Transporter 1, ATP-binding cassette, subfamily B 2.5 2.9TAP2 Transporter 2, ATP-binding cassette, subfamily B 2.8TLR2 Toll-like receptor 2 2.7TMEM110 Transmembrane protein 110 3.3TMEM192 Transmembrane protein 192 3.2TMEM50A Transmembrane protein 50A 2.5TMEM86A Transmembrane protein 86A 2.7TNFSF10 Tumor necrosis factor (ligand) superfamily, member 10 4.2 3.3 2.8TNFSF13B Tumor necrosis factor (ligand) superfamily, member 13b 7.3 3.7TRAFD1 TRAF-type zinc fi nger domain containing 1 2.9 2.9 2.9TRIM22 Tripartite motif-containing 22 2.3TRIM31 Tripartite motif-containing 31 3.8TRIM46 Tripartite motif-containing 46 2.5TXNIP Thioredoxin-interacting protein 3.9 2.4UBD Ubiquitin D 3.4 3.8UBE2D4 Ubiquitin-conjugating enzyme E2D 4 (putative) 2.8 3.0UBE2L6 Ubiquitin-conjugating enzyme E2L 6 3.6 4.5 4.9USP18 Ubiquitin-specifi c peptidase 18 5.6VAMP5 Vesicle-associated membrane protein 5 (myobrevin) 3.0VCAM1 Vascular cell adhesion molecule 1 3.4WARS Tryptophanyl-tRNA synthetase 3.0 5.4WNT10B Wingless-type MMTV integration site family, member 10B 4.1XRN1 5′–3′ Exoribonuclease 1 2.6ZCCHC2 Zinc fi nger, CCHC domain containing 2 2.4ZNF313 Zinc fi nger protein 313 3.4 2.7ZNFX1 Zinc fi nger, NFX1-type containing 1 3.9 3.6
Note: At 18 h, signifi cantly up-regulated genes by Interferon (IFN)-α was not detected.

HE ET AL.318
patterns of genes expression (Fig. 3). This conclusion is also supported by the pathway analysis (Table 2), which indicated that at the same signifi cance level of P < 0.002, functional pathways commonly activated by both IFN-α and IFN-γ, as well as those activated by either IFN-α or IFN-γ, were identi-fi ed. Previous studies in a human fi brosarcoma cell line sug-gested some ISGs are preferentially induced by IFN-α but not by IFN-γ, including the 2′,5′-oligoadenylate synthetase family of genes (OAS), MxA (MX1) and MxB (MX2) genes, and the gene family comprising ISG54, ISG56, and ISG60 collectively known as IFN-induced proteins with tetratri-copeptide repeats (IFIT1, IFIT2, and IFIT3; Der and others 1998). In the primary hepatocytes, we found that OAS1, OAS2, and OAS3 were induced by both IFN-α and IFN-γ, with differences in aFC between the 2 IFNs smaller than 2-fold (Table 1). These results are largely in agreement with previous fi ndings derived from limited number of human (n = 2) and chimpanzee (n = 1) hepatocyte samples (Lanford and others 2006).
IFIT1 and IFIT2 were induced by both IFN-α and IFN-γ, although the aFC values of IFN-α were substantially greater than those by IFN-γ. Similarly, RSAD2 (viperin) was also induced to a greater degree by IFN-α than IFN-γ. In addition,
Analyses of the overall induction of hepatocyte ISGs sug-gested that while some genes were commonly induced by IFN-α and IFN-γ, these 2 cytokines induced very distinct
69 38 18
75 32 45
IFN-γ 18 h
IFN-γ 6 h
IFN-α 6 h
FIG.3. Numbers of signifi cantly up-regulated genes, including commonly and uniquely up-regulated genes, induced by interferon (IFN)-α or IFN-γ in primary hepato-cytes. Genes were identifi ed by one-class SAM analysis at false discovery rate (FDR) < 10%.
IFN-α 6 h0
20
40
60
80
100
120
0
200
400
600
800
1000
1200
1400
16001362
858
0
500
1000
1500
2000
2500
141
584
133
1151
137
420
2082
230326
869 2.6 20 4
108
17
38
11
1.8 1.6
PH 1
PH 2 PH 1
PH 2
4
IFN-α 18 h
Treatment Treatment
Mx1 IFIT1
IP10IRF1
Fold
Induction
Fold
Induction
PH 1
PH 2PH 1
PH 2
Fold
Induction
Fold
Induction
IFN-γ 6 h IFN-γ 18 h IFN-α 6 h IFN-α 18 h IFN-γ 6 h IFN-γ 18 h
Treatment
IFN-α 6 h IFN-α 18 h IFN-γ 6 h IFN-γ 18 h
Treatment
IFN-α 6 h
0
2
4 3.63.2
1.92.3
6.36.4
1.4
5.26
8
10
12
14
IFN-α 18 h IFN-γ 6 h IFN-γ 18 h
FIG. 4. Induction of interferon (IFN)-stimulated genes (ISGs) by interferon (IFN)-α and IFN-γ. Primary hepatocytes were treated with IFN-α or IFN-γ for 6 and 18 h as described. Total RNA was extracted and subjected to TaqMan quantifi cation of Mx1, IFIT1, IRF1, and IP10 mRNA levels. Data from 2 sets of hepatocytes (PH 1 and PH 2) were analyzed and the fold induc-tion of the ISG for each condition is shown (numerical value on top of the bar).
IFN-𝛂 AND IFN-𝛄 TRANSCRIPTIONAL RESPONSES 319
Acknowledgments
We would like to thank Stephen Strom and his col-leagues at the University of Pittsburgh for providing the primary human hepatocytes through the Liver Tissue Procurement and Distribution System (N01-DK-7-0004/HHSN26700700004C). This work was supported in part by the Intramural Research Program of the National Institute of Diabetes and Digestive and Kidney Diseases, NIH, the NIH grants U19 AI40034 and P30 DK56339, and a REAP Center grant from the Department of Veterans Affairs.
Author Disclosure Statement
No competing fi nancial interests exist.
References
Chang KS, Cai Z, Zhang C, Sen GC, Williams BR, Luo G. 2006.
Replication of hepatitis C virus (HCV) RNA in mouse embry-
onic fi broblasts: protein kinase R (PKR)-dependent and PKR-
independent mechanisms for controlling HCV RNA replication
and mediating interferon activities. J Virol 80(15):7364–7374.
Der SD, Zhou A, Williams BR, Silverman RH. 1998. Identifi cation
of genes differentially regulated by interferon alpha, beta, or
gamma using oligonucleotide arrays. Proc Natl Acad Sci USA
95(26):15623–15628.
Feld JJ, Nanda S, Huang Y, Chen W, Cam M, Pusek SN, Schweigler
LM, Theodore D, Zacks SL, Liang TJ, Fried MW. 2007. Hepatic
gene expression during treatment with peginterferon and riba-
virin: Identifying molecular pathways for treatment response.
Hepatology 46(5):1548–1563.
Frese M, Schwärzle V, Barth K, Krieger N, Lohmann V, Mihm S,
Haller O, Bartenschlager R. 2002. Interferon-gamma inhibits
replication of subgenomic and genomic hepatitis C virus RNAs.
Hepatology 35(3):694–703.
Fried MW, Shiffman ML, Reddy KR, Smith C, Marinos G, Gonçales
FL Jr, Häussinger D, Diago M, Carosi G, Dhumeaux D, Craxi A,
Lin A, Hoffman J, Yu J. 2002. Peginterferon alfa-2a plus riba-
virin for chronic hepatitis C virus infection. N Engl J Med
347(13):975–982.
Gautier G, Humbert M, Deauvieau F, Scuiller M, Hiscott J, Bates
EE, Trinchieri G, Caux C, Garrone P. 2005. A type I interferon
autocrine-paracrine loop is involved in Toll-like receptor-
induced interleukin-12p70 secretion by dendritic cells. J Exp Med
201(9):1435–1446.
He XS, Ji X, Hale MB, Cheung R, Ahmed A, Guo Y, Nolan GP, Pfeffer
LM, Wright TL, Risch N, Tibshirani R, Greenberg HB. 2006.
Global transcriptional response to interferon is a determinant
of HCV treatment outcome and is modifi ed by race. Hepatology
44(2):352–359.
Helbig KJ, Lau DT, Semendric L, Harley HA, Beard MR. 2005.
Analysis of ISG expression in chronic hepatitis C identifi es viperin
as a potential antiviral effector. Hepatology 42(3):702–710.
Huang Y, Feld JJ, Sapp RK, Nanda S, Lin JH, Blatt LM, Fried MW,
Murthy K, Liang TJ. 2007. Defective hepatic response to inter-
feron and activation of suppressor of cytokine signaling 3 in
chronic hepatitis C. Gastroenterology 132(2):733–744.
Ji X, Cheung R, Cooper S, Li Q, Greenberg HB, He XS. 2003. Interferon
alfa regulated gene expression in patients initiating interferon
treatment for chronic hepatitis C. Hepatology 37(3):610–621.
Jiang D, Guo H, Xu C, Chang J, Gu B, Wang L, Block TM, Guo
JT. 2008. Identifi cation of three interferon-inducible cellular
enzymes that inhibit the replication of hepatitis C virus. J Virol
82(4):1665–1678.
Kakumu S, Ishikawa T, Mizokami M, Orido E, Yoshioka K, Wakita
T, Yamamoto M. 1991. Treatment with human gamma interferon
MX2 was induced by IFN-α but not by IFN-γ (Table 1). Of note, IFIT1 and RSAD2 have been implicated in the anti-HCV effect of IFN-α in the HCV cell culture systems (Wang and others 2003; Helbig and others 2005; Jiang and others 2008) while MX2 is an important effector gene in the anti-infl uenza effect of IFN-α, although its in vivo effects on HCV are not known. On the other hand, ISG20, ADAR1, and PKR, all of which have been shown to exhibit anti-HCV effects in cell culture (Taylor and others 2005; Chang and others 2006; Jiang and others 2008), were either induced similarly or not induced substantially by IFN-α and IFN-γ in primary hepatocytes. Interestingly, suppressor of cytokine signaling, specifi cally SOCS1, of a family of ISGs that have been asso-ciated with non-response of HCV to IFN-α therapy (Walsh and others 2006; Feld and others 2007; Huang and others 2007; Persico and others 2007), was signifi cantly induced by IFN-γ but not by IFN-α in the primary hepatocytes. Further study should be carried out to determine if this difference contributes to the lack of virological response to IFN-γ. Of note, the biological effects of the transcriptional responses cannot be fully understood without a systematic analysis of the IFN-induced proteins, including their expression levels, post-translational modifi cations, and functional status. In addition, while this study addresses the type I and type II IFN-induced transcriptional responses in hepatocytes, the major target of infection by hepatitis viruses, it should be emphasized that the in vivo antiviral effects of IFNs could also involve the IFN-induced autocrine and paracrine sig-nals on non-parenchymal cells in the liver, such as dendritic, stellate, or Kupffer cells (Pan and others 2004; Gautier and others 2005). These issues should also be addressed in future studies to fully understand the different antiviral effects of IFN-α versus IFN-γ.
In summary, our fi ndings in the differential patterns of ISG induction suggest potential mechanisms for an infe-rior effi cacy of IFN-γ against hepatitis viruses as compared to IFN-α. They also provide useful information for future mechanistic studies of the therapeutic effects of IFNs against hepatitis viruses.
Table 2. Functional Pathways Significantly Activated by IFN-α and IFN-γ (P < 0.002)
Pathway IFN-α/6 h IFN-γ/18 h
Cellular growth and proliferation yes yesCellular development yes yesCell-to-cell signaling and
interactionyes yes
Hematological system development and function
yes yes
Immune response yes yesCardiovascular system
development and functionyes no
Cell signaling yes noCancer no yesImmune and lymphatic system
function and developmentno yes
Cellular movement no yesCardiovascular disease no yes
Abbreviation: IFN, interferon.

HE ET AL.320
Platanias LC. 2005. Mechanisms of type-I- and type-II-interferon-
mediated signalling. Nat Rev Immunol 5(5):375–386.
Runge D, Köhler C, Kostrubsky VE, Jäger D, Lehmann T, Runge DM,
May U, Stolz DB, Strom SC, Fleig WE, Michalopoulos GK. 2000.
Induction of cytochrome P450 (CYP)1A1, CYP1A2, and CYP3A4
but not of CYP2C9, CYP2C19, multidrug resistance (MDR-1) and
multidrug resistance associated protein (MRP-1) by prototypical
inducers in human hepatocytes. Biochem Biophys Res Commun
273(1):333–341.
Samuel CE. 1991. Antiviral actions of interferon. Interferon-
regulated cellular proteins and their surprisingly selective anti-
viral activities. Virology 183(1):1–11.
Samuel CE. 2001. Antiviral actions of interferons. Clin Microbiol
Rev 14(4):778–809, table of contents.
Sanda C, Weitzel P, Tsukahara T, Schaley J, Edenberg HJ, Stephens
MA, McClintick JN, Blatt LM, Li L, Brodsky L, Taylor MW. 2006.
Differential gene induction by type I and type II interferons and
their combination. J Interferon Cytokine Res 26(7):462–472.
Sen GC. 2001. Viruses and interferons. Annu Rev Microbiol
55:255–281.
Soza A, Heller T, Ghany M, Lutchman G, Jake Liang T, Germain J,
Hsu HH, Park Y, Hoofnagle JH. 2005. Pilot study of interferon
gamma for chronic hepatitis C. J Hepatol 43(1):67–71.
Stark GR, Kerr IM, Williams BR, Silverman RH, Schreiber RD.
1998. How cells respond to interferons. Annu Rev Biochem
67:227–264.
Strom SC, Pisarov LA, Dorko K, Thompson MT, Schuetz JD, Schuetz
EG. 1996. Use of human hepatocytes to study P450 gene induc-
tion. Meth Enzymol 272:388–401.
Taylor DR, Puig M, Darnell ME, Mihalik K, Feinstone SM. 2005.
New antiviral pathway that mediates hepatitis C virus replicon
interferon sensitivity through ADAR1. J Virol 79(10):6291–6298.
Tusher VG, Tibshirani R, Chu G. 2001. Signifi cance analysis of
microarrays applied to the ionizing radiation response. Proc
Natl Acad Sci USA 98(9):5116–5121.
Walsh MJ, Jonsson JR, Richardson MM, Lipka GM, Purdie DM,
Clouston AD, Powell EE. 2006. Non-response to antiviral ther-
apy is associated with obesity and increased hepatic expression
of suppressor of cytokine signalling 3 (SOCS-3) in patients with
chronic hepatitis C, viral genotype 1. Gut 55(4):529–535.
Wang C, Pfl ugheber J, Sumpter R Jr, Sodora DL, Hui D, Sen GC,
Gale M Jr. 2003. Alpha interferon induces distinct translational
control programs to suppress hepatitis C virus RNA replication.
J Virol 77(7):3898–3912.
Watling D, Guschin D, Müller M, Silvennoinen O, Witthuhn BA,
Quelle FW, Rogers NC, Schindler C, Stark GR, Ihle JN. 1993.
Complementation by the protein tyrosine kinase JAK2 of a
mutant cell line defective in the interferon-gamma signal trans-
duction pathway. Nature 366(6451):166–170.
Address correspondence to:Dr. Xiao-Song He
VA Medical Center 154C3801 Miranda Avenue
Palo Alto, CA 94304
E-mail: [email protected]
Received 17 July 2009/Accepted 29 August 2009
of chronic hepatitis B: comparative study with alpha interferon.
J Med Virol 35(1):32–37.
Kato T, Matsumura T, Heller T, Saito S, Sapp RK, Murthy K, Wakita
T, Liang TJ. 2007. Production of infectious hepatitis C virus of
various genotypes in cell cultures. J Virol 81(9):4405–4411.
Kostrubsky VE, Ramachandran V, Venkataramanan R, Dorko K,
Esplen JE, Zhang S, Sinclair JF, Wrighton SA, Strom SC. 1999. The
use of human hepatocyte cultures to study the induction of cyto-
chrome P-450. Drug Metab Dispos 27(8):887–894.
Lai L, Hui CK, Leung N, Lau GK. 2006. Pegylated interferon
alpha-2a (40 kDa) in the treatment of chronic hepatitis B. Int J
Nanomedicine 1(3):255–262.
Lanford RE, Guerra B, Lee H, Averett DR, Pfeiffer B, Chavez D,
Notvall L, Bigger C. 2003. Antiviral effect and virus-host interac-
tions in response to alpha interferon, gamma interferon, poly(i)-
poly(c), tumor necrosis factor alpha, and ribavirin in hepatitis C
virus subgenomic replicons. J Virol 77(2):1092–1104.
Lanford RE, Guerra B, Lee H, Chavez D, Brasky KM, Bigger CB.
2006. Genomic response to interferon-alpha in chimpanzees:
implications of rapid downregulation for hepatitis C kinetics.
Hepatology 43(5):961–972.
Lau GK, Piratvisuth T, Luo KX, Marcellin P, Thongsawat S, Cooksley
G, Gane E, Fried MW, Chow WC, Paik SW, Chang WY, Berg T,
Flisiak R, McCloud P, Pluck N; Peginterferon Alfa-2a HBeAg-
Positive Chronic Hepatitis B Study Group. 2005. Peginterferon
Alfa-2a, lamivudine, and the combination for HBeAg-positive
chronic hepatitis B. N Engl J Med 352(26):2682–2695.
Lau JY, Lai CL, Wu PC, Chung HT, Lok AS, Lin HJ. 1991. A ran-
domised controlled trial of recombinant interferon-gamma in
Chinese patients with chronic hepatitis B virus infection. J Med
Virol 34(3):184–187.
Leung N. 2002. Treatment of chronic hepatitis B: case selection and
duration of therapy. J Gastroenterol Hepatol 17(4):409–414.
Manns MP, McHutchison JG, Gordon SC, Rustgi VK, Shiffman M,
Reindollar R, Goodman ZD, Koury K, Ling M, Albrecht JK. 2001.
Peginterferon alfa-2b plus ribavirin compared with interferon
alfa-2b plus ribavirin for initial treatment of chronic hepatitis C:
a randomised trial. Lancet 358(9286):958–965.
Marcellin P, Loriot MA, Boyer N, Martinot-Peignoux M, Degott C,
Degos F, Brandely M, Lenfant B, Benhamou JP. 1990. Recombinant
human gamma-interferon in patients with chronic active hepa-
titis B: pharmacokinetics, tolerance and biological effects.
Hepatology 12(1):155–158.
Müller M, Briscoe J, Laxton C, Guschin D, Ziemiecki A, Silvennoinen
O, Harpur AG, Barbieri G, Witthuhn BA, Schindler C. 1993. The
protein tyrosine kinase JAK1 complements defects in inter-
feron-alpha/beta and -gamma signal transduction. Nature
366(6451):129–135.
Neumann AU, Lam NP, Dahari H, Gretch DR, Wiley TE, Layden
TJ, Perelson AS. 1998. Hepatitis C viral dynamics in vivo and
the antiviral effi cacy of interferon-alpha therapy. Science
282(5386):103–107.
Pan J, Zhang M, Wang J, Wang Q, Xia D, Sun W, Zhang L, Yu H, Liu
Y, Cao X. 2004. Interferon-gamma is an autocrine mediator for
dendritic cell maturation. Immunol Lett 94(1–2):141–151.
Persico M, Capasso M, Persico E, Svelto M, Russo R, Spano D, Crocè L,
La Mura V, Moschella F, Masutti F, Torella R, Tiribelli C, Iolascon
A. 2007. Suppressor of cytokine signaling 3 (SOCS3) expression
and hepatitis C virus-related chronic hepatitis: Insulin resistance
and response to antiviral therapy. Hepatology 46(4):1009–1015.
Copyright © 2022 FDOKUMEN