Abnormal T cell signal transduction in systemic lupus erythematosus
Upload
independentCategory
view
0download
0
Modeling Regulatory Mechanisms inIL-6 Signal Transduction in Hepatocytes
Abhay Singh, Arul Jayaraman, Juergen Hahn
Department of Chemical Engineering, Texas A&M University, College Station,Texas 77843-3122. telephone): (979) 845 3568; e-mail: [email protected]
Received 20 February 2006; accepted 10 May 2006
Published online 2 June 2006 in Wiley InterScience (www.interscience.wiley.com). DOI: 10.1002/bit.21026
Abstract: Cytokines like interleukin-6 (IL-6) play an impor-tant role in triggering the acute phase response of thebody to injury or inflammation. Signaling by IL-6 involvestwo pathways: Janus-associated kinases (JAK) and signaltransducers and activators of transcription (STAT 3) areactivated in the first pathway while the second pathwayinvolves the activation of mitogen-activated proteinkinases (MAPK).While it is recognized that both pathwaysplay a major role in IL-6 signal transduction, a majority ofstudies have focused on signaling through either one ofthe pathways. However, simultaneous signaling throughboth JAK/STAT and MAPK pathways is still poorlyunderstood. In this work, a mathematical model has beendeveloped that integrates signaling throughboth the JAK/STAT and the MAPK pathway. The presented model isused to analyze the effect of three molecules that areinvolved in the regulation of IL-6 signaling—SHP-2(domain containing tyrosine phosphatase 2), SOCS3(suppressor of cytokine signaling 3), and a STAT3 nuclearphosphatase (PP2)—on the dynamics of IL-6 signaltransduction inhepatocytes. Theobtained results suggestthat interactions between SHP-2 and SOCS3 influencesignaling through the JAK/STATand theMAPKpathways.It is shown that SHP-2 and SOCS3 do not just regulate thepathway that theyare known tobeassociatedwith, (SHP-2with MAPK and SOCS3 with JAK/STAT), but also have astrong effect on the other pathway. Several simulationswith SOCS3, SHP-2, and PP2 knockout cells, that is,where the signaling pathway is unable to produce theseproteins, havebeenperformed tocharacterize theeffect ofthese regulatory proteins on IL-6 signal transduction inhepatocytes. � 2006 Wiley Periodicals, Inc.
Keywords: interleukin-6; hepatocytes; mathematicalmodel; cross-talk; signal transduction; STAT; MAPK
INTRODUCTION
Systemic inflammatory mediators, such as the cytokines
interleukin-1 (IL-1), interleukin-6 (IL-6), and tumor necrosis
factor (TNF) (Baumann and Gauldie, 1994), play an
important role in the induction of the inflammatory acute
phase response (APR) in the liver upon trauma or injury. The
APR is characterized by, among others, a dramatic alteration
in the protein synthetic profile of the liver, with several
plasma acute phase proteins (APPs) being upregulated
(e.g., C-reactive protein, haptoglobin, and serum amyloid
A) or down regulated (e.g., albumin and transferrin) through
the coordinated action of inflammatory mediators. While
the APR is primarily a short-term (24–72 h) (Baumann
and Gauldie, 1994) beneficial host response to injury, an
increasing body of data has also correlated elevatedmeasures
of APR with organ failure and mortality resulting from
chronic inflammation. In particular, the ratio of increase in
C-reactive protein to decrease in albumin has been negatively
correlated to survival from systemic inflammation (Pinilla
et al., 1998). An improved understanding of the molecular
mechanisms involved in the APR can lead to improved
treatment of complications arising from chronic inflamma-
tory disorders.
The dynamics of expression and interaction of the IL-6
signaling pathway molecules is a key determinant of the
phenotypical changes characteristic of the APR. The IL-6
signaling pathway is characterized by multiple branches and
possible cross-talk and redundancies. While the dynamic
behavior of some individual molecules in this pathway is
known, comprehensive system dynamics are still poorly
understood. In this work, we focus on the molecular
mechanisms involved in the regulation of IL-6 signaling
during the hepatic APR. Signal transduction by the IL-6
family of cytokines involves the activation of two major
pathways: the JAK /STATand theMAPKpathways (Heinrich
et al., 1998, 2003) that lead to a wide range of cellular
responses, including inflammation, growth, differentiation,
and apoptosis. Signaling through the JAK/STAT pathway
involves the binding of gp130 (glycoprotein 130), JAK, and
transcription factor STAT3. The MAPK pathway is linked to
the JAK/STAT pathway through SHP-2 binding to the (IL6-
gp80-gp130-JAK)2 complex. The activation of SHP-2 is a
crucial event for signaling through the MAPK pathway (Lai
et al., 1999). In addition to acting as an adaptor protein for
the MAPK pathway, SHP-2 acts as a phosphatase for the
JAK/STAT pathway and regulates this pathway (Kim and
Baumann, 1999; Schaper et al., 1998). The dual role of
SHP-2 suggests possible interactions between the JAK/STAT
and the MAPK pathways. However, the involvement of both
�2006 Wiley Periodicals, Inc.
Correspondence to: J. Hahn

JAK/STAT and MAPK pathways in IL-6 signaling has only
been studied in few cases (Schaper et al., 1998) and the
interactions between the two pathways as well as the role
played by SHP-2 in IL-6 signal transduction are not clearly
understood.
It is well established that SOCS3 acts as an inhibitor
for signal transduction through the JAK/STAT pathway
(Fischer et al., 2004; Heinrich et al., 1998, 2003). However,
SOCS3 has an effect on signaling through the MAPK
pathway (Lehmann et al., 2003; Schmitz et al., 2000) through
phosphorylation of SHP-2.
In this work, we have comprehensively analyzed the
interaction between the JAK/STATand the MAPK pathways
by developing a kinetic model that considers signaling
through both pathways. The developed model is used to
analyze the interactions between the two pathways and
investigate the role of SHP-2 in signal transduction. The
influence of SOCS3 on signal transduction has also been
evaluated by simulation of the developed model. The results
obtained through simulations have been compared with
available results from the literature and were found in
good agreement with semi-quantitative experimental obser-
vations.
MODEL DESCRIPTION
The kinetic model (Fig. 1) developed in this work is based on
the IL-6 cytokine signaling pathway presented in Heinrich
et al. (2003). The JAK/STAT part of the signal transduction
pathway and the model parameters have been adopted from
Yamada et al. (2003) while the MAPK signaling pathway is
mainly based on the work presented by Schoeberl et al.
(2002). Only the Shc-dependent pathway of the Schoeberl
et al. (2002) model has been adopted for this work as the
implemented structure of the pathway has been taken from
the work by Heinrich et al. (2003). The assumption has been
made to replace Shcwith SHP-2 in themodel as both proteins
exhibit a similar response for stimulation by IL-6. Another
assumptionwas that the signal transduction pathways and the
kinetic parameters were taken from various sources in the
literature for this model (Heinrich et al., 2003; Schoeberl
et al., 2002; Yamada et al., 2003). The pathway model of
Figure 1. Signal transduction in hepatocytes induced by IL-6.A:Marks the reaction to be knocked out for a SOCS3knockout cell;B:Marks the reaction to be
knocked out for cells where theMAPK is inactive;C:Marks the reaction to be eliminated for a PP2 knockout cell. [Color figure can be seen in the online version
of this article, available at www.interscience.wiley.com.]
Singh et al.: Modeling Regulatory Mechanisms 851
Biotechnology and Bioengineering. DOI 10.1002/bit

Yamada et al. (2003) and Schoeberl et al. (2002) do not
involve STAT3 in hepatocytes, butwere derived for STAT1 in
hepatocytes or STAT3 in HeLa cells, respectively. However,
kinetic parameters and sub-model structures from these
signaling models have been adopted assuming that the
signaling transduction pathways are conserved in cells
(Kholodenko, 2000).
In the presented model IL-6 attaches to its receptor gp80,
which is referred to as the non-signaling part of the receptor.
The signaling part of the receptor gp130 binds to protein
tyrosine kinases of the JAK family. The IL-6/gp80 complex
then binds to the gp130/JAK compound and as a result the
IL6-gp80-gp130-JAK complex is formed. This binding
results in the dimerization of the IL6-gp80-gp130-JAK
complex forming (IL6-gp80-gp130-JAK)2 (Heinrich et al.,
1998, 2003; Roth et al., 1997). gp130 becomes tyrosine
phosphorylated as a result of dimerization and the phos-
phorylated dimer serves as the starting point for both the
JAK/STAT and the MAPK pathway.
In the JAK/STAT pathway, the phosphorylated dimer
recruits the transcription factor STAT3 which is also tyrosine
phosphorylated. The phosphorylated STAT3 dissociates
from the receptor complex (IL6-gp80-gp130-JAK)2 and
undergoes dimerization. The dimerized STAT3 complex
translocates to the nucleus where some of it binds to its
consensus target sequence in the promoter/enhancer
regions of IL-6 target genes (such as haptoglobin and a2-macroglobulin) (Heinrich et al., 1998, 2003). The nuclear
STAT3 dimer is dephosphorylated and exported back to
the cytosol for another phosphorylation–dephosphorylation
cycle (Heinrich et al., 1998, 2003; ten Hoeve et al., 2002).
In addition to activating the STAT3 transcription factor for
the JAK/STAT pathway, the phosphorylated gp130 also
recruits SHP-2 which subsequently undergoes phosphoryla-
tion. The activated SHP-2 is essential for signaling through
the MAPK pathway (Heinrich et al., 2003; Schaper et al.,
1998; Schmitz et al., 2000). The phosphorylated SHP-2
interacts with Grb2 (growth factor receptor bound protein)
and SOS (son of sevenless). The binding of Grb2 and SOS to
the receptor complex leads to the activation of RAS, which
further leads to the activation of the MAPK cascade
(Heinrich et al., 2003). Three phosphatases Phosp1,
Phosp2, and Phosp3 are considered in the MAPK pathway
that influence the activation of Raf, MEK, and ERK,
respectively.
Signal transduction through the JAK/STAT pathway is
regulated by twoways—SOCS3 is induced by the JAK/STAT
pathway and binds to the activated (IL6-gp80-gp130-JAK)2,
thereby inhibiting the phosphorylation of STAT3 and regulat-
ing IL-6 signaling; in addition to SOCS3, signal transduction
through the JAK/STAT pathway is also regulated by SHP-2
and two STAT3 phosphatases, PP1 and PP2. SHP-2 acts as a
phosphatase for the (IL6-gp80-gp130-JAK*)2 complex and
inactivates it (Heinrich et al., 1998, 2003; Levy and Darnell,
2002; ten Hoeve et al., 2002). The phosphatases PP1 and PP2
influence the activation of STATin the cytosol and the nucleus,
respectively. The nuclear phosphatase PP2, also known as
TC45,dephosphorylatesSTAT3 in the nucleuswhich results in
STAT3 being returned to the cytosol (Levy and Darnell, 2002;
ten Hoeve et al., 2002).
The only regulatory mechanisms in the MAPK pathway
that were modeled are given by the phosphatases Phosp1,
Phosp2, and Phosp3. These regulate the activity of RAF,
MEK, and ERK, respectively (Schoeberl et al., 2002).
Most of the reactions in the model are represented by
mass-action kinetics with a few exceptions where Michae-
lis–Menten kinetics are used. The reason for the use of
mass-action kinetics for most parts of the model is that in
signal transduction pathways the condition that the substrate
concentration is much larger than the enzyme concentration
is usually not satisfied (Yamada et al., 2003). There are
68 state variables in the presentedmodel, resulting in asmany
ordinary differential equations. The differential equation for
a particular component (A) is written as:
Rate of change
of component
ðAÞ
0@
1A ¼
Amount of ðAÞformed in all
reactions
0@
1A�
Amount of ðAÞconsumed in all
reactions
0@
1A
dNA
dt¼
XvA;produced �
XvA;consumed
where vA represents the rate of formation/consumption of
species A in a particular reaction.
The presented model is implemented inMATLAB and the
model is solved using the ODE15s subroutines. A detailed
description of the signaling pathway is provided in
Figure A.1 in Appendix I and the model equations are
provided in Appendix II.
RESULTS
The gp80 receptor and the gp130 receptor concentration in
the cell are assumed constant at 5,000 receptors/cell and 500
receptors/cell, respectively (Baumann et al., 1988; Roth
et al., 1997). Further, hepatocytes are assumed to be
continuously exposed to 10 ng/mL of IL-6 for 24 h. IL-6
binds to the receptor gp80 with low affinity (Kd¼ 500 pM)
and the IL-6-gp80 complex further binds to the gp130
receptor (Roth et al., 1997). IL-6 binding to the receptor
eventually results in dimerization and phosphorylation of the
IL6-gp80-gp130-JAK complex. The phosphorylated com-
plex (IL6-gp80-gp130-JAK*)2 reaches a maximal concen-
tration within 15 min of IL-6 binding (Fig. 2). Subsequently,
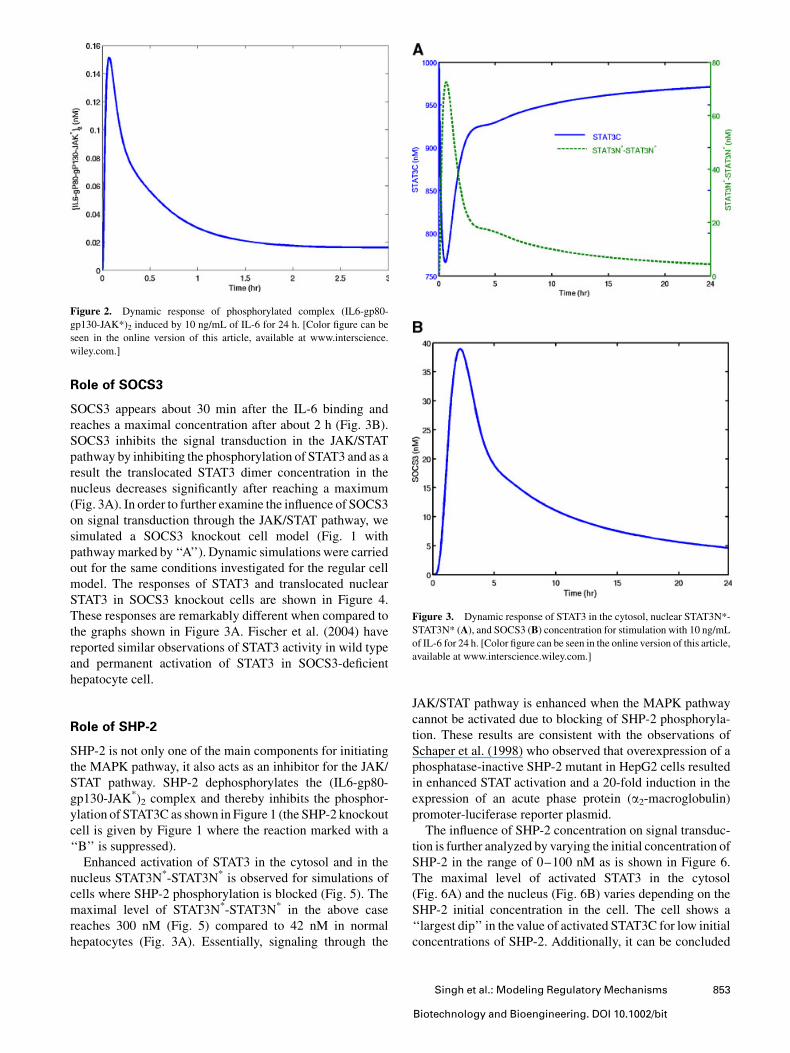
the STAT3C (STAT3 in the cytosol) transcription factor
undergoes phosphorylation (Fig. 3A) and dimerization. The
dimerized STAT3 (STAT3C*-STAT3C*) translocates to the
nucleus approximately 10min after signal induction by IL-6.
The nuclear STAT3 complex (STAT3N*-STAT3N*) reaches
a maximal concentration in about 1 h, rapidly decays, and
attains a new steady state after about 5 h (Fig. 3A). These
findings are consistent with the ones reported in Jayaraman
et al. (2000) where STAT3-mRNA attains a new steady state
on continuous exposure to IL-6.
852 Biotechnology and Bioengineering, Vol. 95, No. 5, December 5, 2006
DOI 10.1002/bit
Role of SOCS3
SOCS3 appears about 30 min after the IL-6 binding and
reaches a maximal concentration after about 2 h (Fig. 3B).
SOCS3 inhibits the signal transduction in the JAK/STAT
pathway by inhibiting the phosphorylation of STAT3 and as a
result the translocated STAT3 dimer concentration in the
nucleus decreases significantly after reaching a maximum
(Fig. 3A). In order to further examine the influence of SOCS3
on signal transduction through the JAK/STAT pathway, we
simulated a SOCS3 knockout cell model (Fig. 1 with
pathwaymarked by ‘‘A’’). Dynamic simulations were carried
out for the same conditions investigated for the regular cell
model. The responses of STAT3 and translocated nuclear
STAT3 in SOCS3 knockout cells are shown in Figure 4.
These responses are remarkably different when compared to
the graphs shown in Figure 3A. Fischer et al. (2004) have
reported similar observations of STAT3 activity in wild type
and permanent activation of STAT3 in SOCS3-deficient
hepatocyte cell.
Role of SHP-2
SHP-2 is not only one of the main components for initiating
the MAPK pathway, it also acts as an inhibitor for the JAK/
STAT pathway. SHP-2 dephosphorylates the (IL6-gp80-
gp130-JAK*)2 complex and thereby inhibits the phosphor-
ylation of STAT3C as shown in Figure 1 (the SHP-2 knockout
cell is given by Figure 1 where the reaction marked with a
‘‘B’’ is suppressed).
Enhanced activation of STAT3 in the cytosol and in the
nucleus STAT3N*-STAT3N* is observed for simulations of
cells where SHP-2 phosphorylation is blocked (Fig. 5). The
maximal level of STAT3N*-STAT3N* in the above case
reaches 300 nM (Fig. 5) compared to 42 nM in normal
hepatocytes (Fig. 3A). Essentially, signaling through the
JAK/STAT pathway is enhanced when the MAPK pathway
cannot be activated due to blocking of SHP-2 phosphoryla-
tion. These results are consistent with the observations of
Schaper et al. (1998) who observed that overexpression of a
phosphatase-inactive SHP-2 mutant in HepG2 cells resulted
in enhanced STAT activation and a 20-fold induction in the
expression of an acute phase protein (a2-macroglobulin)
promoter-luciferase reporter plasmid.
The influence of SHP-2 concentration on signal transduc-
tion is further analyzed by varying the initial concentration of
SHP-2 in the range of 0–100 nM as is shown in Figure 6.
The maximal level of activated STAT3 in the cytosol
(Fig. 6A) and the nucleus (Fig. 6B) varies depending on the
SHP-2 initial concentration in the cell. The cell shows a
‘‘largest dip’’ in the value of activated STAT3C for low initial
concentrations of SHP-2. Additionally, it can be concluded
Figure 2. Dynamic response of phosphorylated complex (IL6-gp80-
gp130-JAK*)2 induced by 10 ng/mL of IL-6 for 24 h. [Color figure can be
seen in the online version of this article, available at www.interscience.
wiley.com.]
Figure 3. Dynamic response of STAT3 in the cytosol, nuclear STAT3N*-
STAT3N* (A), and SOCS3 (B) concentration for stimulation with 10 ng/mL
of IL-6 for 24 h. [Color figure can be seen in the online version of this article,
available at www.interscience.wiley.com.]
Singh et al.: Modeling Regulatory Mechanisms 853
Biotechnology and Bioengineering. DOI 10.1002/bit

that there is a stronger long-term activation of STAT3C, the
lower the initial SHP-2 concentration.
In a next step the effect of SOCS3 on the phosphorylation of
SHP-2 is investigated. As shown in the earlier results, SOCS3
appears about 30min after IL-6 binds to the receptor (Fig. 3B).
As SOCS3 influences the phosphorylation of SHP-2, the
concentration of phosphorylated SHP-2 decreases after
reaching a maximal level about 1 h after IL-6 stimulation
of the cell (Fig. 7 (top)). SHP-2 acts as an adaptor protein for
the MAPK pathway and its phosphorylation is essential for
initiation of the MAPK pathway. Therefore, in the presence
of SOCS3 signal transduction through theMAPK pathway is
down regulated. However, in order to corroborate these
observations simulations have also been carried out in
SOCS3 knockout cells. In the absence of SOCS3, phos-
phorylated SHP-2 shows sustained activation (Fig. 7 (top)).
Such sustained activation of SHP-2 can lead to increased
signaling through the MAPK pathway as illustrated in
Figure 7 (bottom). Note that the long-term Raf* concentra-
tion reaches a value in a SOCS3 knockout cell that is three
times as large as the one for a normal cell, even though both
concentrations are relatively small.
Due to the effect on SHP-2 it can be concluded that SOCS3
has a regulatory effect on the MAPK pathway in addition to
its effect on the JAK/STAT pathway.
Role of PP2
The nuclear phosphatase PP2 plays an important role in
the JAK/STAT pathway as it causes deactivation of the phos-
Figure 4. Dynamic response of STAT3 in the cytosol and nuclear
STAT3N*-STAT3N* in SOCS3 knockout cells for stimulation with 10 ng/
mL of IL-6 for 24 h. [Color figure can be seen in the online version of this
article, available at www.interscience.wiley.com.]
Figure 5. Dynamic response of STAT3 in the cytosol and nuclear
STAT3N*-STAT3N* for signal transduction induced by IL-6 for 24 h. with
no phosphorylation of SHP-2. [Color figure can be seen in the online version
of this article, available at www.interscience.wiley.com.]
Figure 6. Dynamic response for signal transduction induced by IL-6 for
24 h. with SHP-2 initial concentration varied in the range of 0–100 Nm.
A: STAT3 in the cytosol B: nuclear STAT3N*-STAT3N*. [Color figure canbe seen in the online version of this article, available at www.interscience.
wiley.com.]
854 Biotechnology and Bioengineering, Vol. 95, No. 5, December 5, 2006
DOI 10.1002/bit

phorylated STAT3 dimer in the nucleus. This deactivation is
an important step for returning STAT3 to the cytosol for
another phosphorylation–dephosphorylation cycle. There-
fore, we developed a PP2 knockout cell model (Fig. 1; the
pathway marked with a ‘‘C’’) to further study the effect that
PP2 has on signal transduction.
When PP2 knockout cells are stimulated with IL-6, signal
transduction is strongly inhibited as the phosphorylated
STAT3 dimer in the nucleus is not deactivated. As a result,
the concentration of STAT3 in the cytosol continuously
decreases with time (Fig. 8A), while the STAT3N*-
STAT3N* concentration increases (Fig. 8A) and reaches a
new steady state concentration. These results are in line with
the western blot analysis reported in ten Hoeve et al. (2002)
which shows sustained activation of nuclear phosphorylated
STAT3 in nuclear STAT3 phosphatase null cell. Since STAT3
in the cytosol is an essential component for signaling through
the JAK/STAT pathway, signal transduction is strongly
inhibited in PP2 knockout cells.
It should be noted that the implementedmodel does not take
into account de novo synthesis of STAT3 in the cytosol, which
would have the effect of increasing nuclear STAT3 over time
as compared to the results shown in Figure 8A. Since the
amount of nuclear STAT3 reaches a high level in PP2knockout
cells, a large amount of SOCS3 is generated and the SOCS3
concentration approaches a steady state within 24 h as shown
in Figure 8B.
A comparison between the rate of STAT3 transported into
the nucleus is shown in Figure 9 as this is an indicator of the
activation of the JAK/STATpathway. It can be concluded that
SOCS3 knockout cells have a higher activation than regular
hepatocytes, while PP2 knockout cells show less activity in
the JAK/STAT pathway.
DISCUSSION
The model was developed by aggregating several parts of
the signaling pathways that had previously been published
in the literature (Schoeberl et al., 2002; Yamada et al., 2003).
The assumption has been made that these individual parts of
the pathways can be modeled together without requiring
changes to the parameters. While comparisons of the
simulated behavior of individual proteins have been made
to semi-quantitative data from the literature, an experimental
investigation of the dynamic protein profiles is currently
under way.
Discussion of SimulationResults for Hepatocytes
The dynamic response of STAT3 as predicted by the
simulation is inline with results reported in the literature
(Fischer et al., 2004). The strong initial increase in the con-
centration of nuclear STAT3 in our simulations is remarkably
consistent with the dynamics of nuclear STAT3 in HepG2
cells upon continuous exposure to IL-6 (Fischer et al., 2004).
The authors also observed a second peak of activated STAT3
in the nucleus, which is also observed in our simulations. Our
simulation results indicate that the short-term SOCS3 levels
in response to IL-6 are approximately five-fold greater than
the long-term levels seen at 24 h. These simulation results
are consistent with the mRNA data from IL-6 stimulated
adipocytes reported by Fasshauer et al. (2004) who observed
an approximately 10-fold higher values in the short-term
response as compared to the long-term response. Both our
simulations and the adipocyte data clearly show an initial
Figure 7. Dynamic responses of (a) phosphorylated SHP-2 (SHP-2*) and (b) Raf* for signal transduction inducedby 10 ng/mLof IL-6 for 24 h in normal and
SOCS3 knockout cells. [Color figure can be seen in the online version of this article, available at www.interscience.wiley.com.]
Singh et al.: Modeling Regulatory Mechanisms 855
Biotechnology and Bioengineering. DOI 10.1002/bit

increase in SOCS3 levels, with minimal change after 8 h of
IL-6 stimulation.
These results indicate the validity of the developed model,
at least with respect to the JAK/STAT arm of the IL-6
signaling pathway in hepatocytes.
Role of SOCS3
While simulations of SOCS3 knockout cells were mainly
performed to characterize the effect of SOCS3 on IL-6
signal transduction during the hepatic APR, a quantitative
understanding of IL-6 signaling in SOCS3 knockout
cells could also have broader impact, as SOCS3 has been
shown to be involved in certain types of cancer as well
(He et al., 2004; Niwa et al., 2005). Our simulations with
SOCS3 knockout cells predict sustained activation of nuclear
STAT3N*-STAT3N* upon IL-6 stimulation as compared
to normal cells (855 nM after 24 h for SOCS3 knockout
cells versus 960 nM for normal cells; see Figures 4
and 3A), which in turn, indicates increased signaling through
the JAK/STAT pathway. These results are consistent with
those of Niwa et al. (2005) who suggest that methylation
silencing of SOCS3 expression (i.e., analogous to SOCS3
knockout cells) resulted in higher JAK/STAT pathway
activity.
The simulations results are validated when comparisons
are made to the Western blot data reported in Lang et al.
(2003) for the dynamic profile of phosphorylated nuclear
STAT3 concentrations for regular cells and SOCS knockout
cells stimulated by IL-6 measured at 25, 100, and 400 min.
The results show that the (semi-quantitative) concentration
of phosphorylated nuclear STAT3 in regular cells and in
SOCS knockout cells follows the results shown in Figures 3A
and 4.
Role of SHP-2
The sustained activation of SHP-2 shown in the simulation
will result in sustained signaling through the MAPK
pathway. Simulations results for variations in the SHP-2
concentration showed that absence of SHP-2 will result in no
signaling through the MAPK pathway and in increased
signaling through the JAK/STAT pathway. From the
presented results, it can be concluded that both SHP-2 and
SOCS3 act as inhibitors for the JAK/STAT part of the
signaling pathway, however, each utilizes a different
process for the inhibition (Lehmann et al., 2003). While
SOCS3 inhibits the JAK/STAT pathway by binding to
the (IL6-gp80-gp130-JAK)2 complex and thereby inhibits
phosphorylation of STAT3 in the cytosol, SHP-2 inhibits
the JAK/STAT pathway by dephosphorylation of the
Figure 8. Dynamic response of STAT3 in the cytosol, nuclear STAT3N*-
STAT3N* (A) and SOCS3 (B) in PP2 knockout cell for signal transduction
induced by 10 ng/mL of IL-6 for 24 h. [Color figure can be seen in the online
version of this article, available at www.interscience.wiley.com.]
Figure 9. STAT3 influx of the nucleus for normal hepatocyte cells, SOCS3
knockout cells, and PP2 knockout cells. [Color figure can be seen in the
online version of this article, available at www.interscience.wiley.com.]
856 Biotechnology and Bioengineering, Vol. 95, No. 5, December 5, 2006
DOI 10.1002/bit

(IL6-gp80-gp130-JAK*)2 complex. Moreover, it can be
deduced that SOCS3 and SHP-2 do not act independent of
each other in IL-6 signaling, but are functionally connected
and influence signaling through the JAK/STAT and the
MAPK pathways. Our simulation results on the functional
link between SOCS3 and SHP-2 are consistent with the
experimental observations of Schmitz et al. (2000). In this
study, the authors reported that impaired SHP-2 activation in
HepG2 cells resulted in enhanced SOCS3 induction and
suggest that the SOCS3 activation may be a result of
compensation for the reduced SHP-2 activity. Together, our
simulation support the hypothesis proposed by Schmitz et al.
(2000) that the inhibitory role of SHP-2 on IL-6 signaling, in
part, is through the recruitment of SOCS3 to the IL-6 receptor
complex.
Our simulation results are further validated when compar-
isons are made to the Western blot data reported in
Lang et al. (2003) for the dynamic profile of SHP-2
concentrations for regular cells and SOCS knockout cells
stimulated by IL-6. The results show that the concentration
of phosphorylated SHP-2 is about the same after 25 min
after stimulation for both types of cells. However, the SHP-2
concentration after 100 and 400 min clearly indicates that
the SOCS3 knockout cell has a significantly higher
concentration of SHP-2 at these time points than the regular
cell. These results validate the simulation results shown in
Figure 7.
Furthermore, the results shown in the bottom plot of
Figure 7 illustrate that while SOCS3 knockout cells have a
higher activity in the MAPK pathway, that the long-
term concentration of phosphorylated RAF is quite small
for both cell types and the results are indistinguishable from
one another in an experimental setting. These results are
inline with experimental observations made by Lang et al.
(2003) that the increase in SHP-2 phorphorylation did not
seem to be linked to the downstream increase in MAPK
activation.
Role of PP2
Yamada et al. (2003) have observed that the effect of SOCS
knockout cells and PP2 knockout cells on the dynamics of
STAT1 in cells are similar.While our investigation deals with
STAT3, the underlying structure of the signal transduction
network is nevertheless the same for the two proteins;
therefore, we compared the effect of SOCS3 and PP2
knockout cells on STAT3 activation. We found that SOCS3
knockout cells have a higher activation than regular
hepatocytes, while PP2 knockout cells show a reduced
amount of signaling through the JAK/STAT pathway. As
such, preventing SOCS3 formation in cells has the opposite
effect on the amount rate of STAT3 translocating to the
nucleus compared to PP2 knockout cells. However, this is not
to be confused with the amount of IL-6 regulated transcrip-
tion of APP genes taking place in those cells: both SOCS3
knockout cells and PP2 knockout cells have a high nuclear
STAT3 concentration that will lead to an increased
transcription rate (Schaper et al., 1998).
Limitations of the Implemented Model
All the presented results are affected by the assumptions
made while developing the model. As such any conclusions
drawn from a simulation study can only be as good as the
assumptions underlying the model. It is important to list
these assumptions as they form the basis for future
improvements:
The developed model focuses only on signal transduction in
the cytosol and translocation of STAT3 dimers to the
nucleus and STAT3 monomer to the cytosol. All other
import/export across the nuclear membrane has been
ignored with the exception of SOCS3-mRNA to the cytosol.
Therefore, the JAK/STAT pathway is not extended beyond
the translocation of STAT3 and production of SOCS3 and
the MAPK pathway has ERK as the end point. The only
transcriptional up-regulation term included is the expression
of SOCS3 as it directly influences the dynamics of the JAK/
STAT pathway.
De novo synthesis of transcription factors (including auto-
regulatory effects), protein turnover in the cytosol, and
receptor recycling have not been included in the current
model.
Due to these assumptions it is not possible tomake statements
about redundancy of the pathways for the APR as the
transcription of APR proteins has not been modeled. Future
work will include validation of the model, fitting of model
parameters, and investigation/implementation of the parts of
the APR that cannot be modeled at this point in time.
CONCLUSIONS
In this work a kinetic model for signal transduction of
hepatocytes stimulated by IL-6 has been presented. The
model includes signal transduction occurring via the JAK/
STAT and the MAPK pathways. The model has been shown
to predict behavior qualitatively inline with experimental
studies found in the literature.
The presented model was used to investigate the effect of
SHP-2, SOCS3, and PP2 on signal transduction induced by
IL-6. Simulations carried out with the model show that
SOCS3 acts as an inhibitor for the JAK/STAT pathway and it
also down regulates the phosphorylation of SHP-2 and
presumably inhibits signaling through theMAPK pathway. It
has also been illustrated that while SHP-2 plays an important
function for signaling through MAPK pathway, that SHP-2
downs regulates signaling through the JAK/STAT pathway.
It can be further concluded from the presented results that
SHP-2 and SOCS3 are functionally linked to each other.
They influence signal transduction through the JAK/STATas
well as the MAPK pathway.
Singh et al.: Modeling Regulatory Mechanisms 857
Biotechnology and Bioengineering. DOI 10.1002/bit

PP2 was found to play an important role for signal
transduction through the JAK/STAT pathway. Themodel of a
PP2 knockout cells was unable to eject STAT3 from the
nucleus which resulted in a low STAT3 concentration in the
cytosol and very high levels of SOCS3. As a result the model
of the knockout cell showed strongly reduced signaling
through the JAK/STAT pathway. At the same time, the level
of protein transcription expression is high in PP2 knockout
cells due to a high concentration of nuclear STAT3 (Schaper
et al., 1998).
APPENDIX-I
Appendix-I A.1. Reaction network for IL-6 induced signal transduction in hepatocytes. The blue text represents the JAK/STAT branch of the signaling
pathway and green text represents the MAPK branch of the pathway. The red text in the signaling network represents pathway common to the JAK/STATand
MAPK branches. [Color figure can be seen in the online version of this article, available at www.interscience.wiley.com.]
858 Biotechnology and Bioengineering, Vol. 95, No. 5, December 5, 2006
DOI 10.1002/bit

APPENDIX-II
Model Equations:
dx1
dt¼ �kf0x1uþ kr0x2
dx2
dt¼ kf0x1u� kr0x2 þ kr2x6 � kf2x2x5
dx3
dt¼ �kf1x3x4 þ kr1x5
dx4
dt¼ �kf1x3x4 þ kr1x5
dx5
dt¼ kf1x3x4 � kr1x5 � kf2x2x5 þ kr2x6
dx6
dt¼ kf2x2x5 � kr2x6 � 2kf3x
26 þ 2kr3x7
dx7
dt¼ kf3x
26 � kr3x7 � k4x7 þ k10x16 þ k10x32
dx8
dt¼ k4x7 � kf5x8x9 þ kr5x11 þ k6x11 � kf7x8x10 þ kr7x12
� kf9x8x15 þ kr9x16 � kf21x29x8 þ kr21x30 þ kf37x39
� kr37x8x46 þ kf39x40 � kr30x45x8 þ kf32x41 � kr32x44x8
dx9
dt¼ �kf5x8x9 þ kr5x11 þ k12x18 � kf13x9x10
þ kr13x14 þ k17x22 � kf5x9x30 þ kr5x31 þ k10x32
dx10
dt¼ k6x11 � kf7x8x10 þ kr7x12 � 2kf8x
210
þ 2kr8x13 � kf11x10x17 þ kr11x18 � kf13x9x10 þ kr13x14
dx11
dt¼ kf5x8x9 � kr5x11 � k6x11
dx12
dt¼ kf7x8x10 � kr7x12
dx13
dt¼ kf8x
210 � kr8x13 � kf11x13x17 þ kr11x19 � k14x13
dx14
dt¼ k12x19 þ kf13x9x10 � kr13x14
dx15
dt¼ �kf9x8x15 þ kr9x16 þ k10x16
� kf9x15x31 þ kr9x32 þ k10x32 þ Vmx46
Km þ x46
dx16
dt¼ kf9x14x8 � kr9x16 � k10x16 � kf34x16 þ kr34x39
dx17
dt¼ �kf11x10x17 þ kr11x18 þ k12x18
� kf11x13x17 þ kr11x19 þ k12x19
dx18
dt¼ kf11x10x17 � kr11x18 � k12x18
dx19
dt¼ kf11x13x17 � kr11x19 � k12x19
dx20
dt¼ k14x13 � kf60x20 þ kr60x
221 � kf15x23x20 þ kr15x27
dx21
dt¼ 2kf60x20 � 2kr60x
221
� kf15x23x21 þ kr15x28 þ kf61x24 � kr61x21x22
dx22
dt¼ k16x28 þ kf61x24 � kr61x21x22 � k17x22
dx23
dt¼ �kf15x21x23
þ kr15x28 þ k16x28 � kf15x20x23 þ kr15x27 þ k16x27
dx24
dt¼ k16x27 � kf61x24 þ kr61x21x22
dx25
dt¼ k18ax20
k18b þ x20� k19x25
dx26
dt¼ k19x25 � k22x26
dx27
dt¼ kf15x23x20 � kr15x27 � k16x27
dx28
dt¼ kf15x23x21 � kr15x28 � k16x28
dx29
dt¼ k20x26 � k23x29
� kf21x29x8 þ kr21x30 þ k23x32 þ k10x32
dx30
dt¼ kf21x29x8 � kr21x30 � kf5x9x30 þ kr5x31
dx31
dt¼ kf5x9x30 � kr5x31 � kf9x15x31 þ kr9x32
dx32
dt¼ kf9x15x31 � kr9x32 � k10x32 � k23x32
Singh et al.: Modeling Regulatory Mechanisms 859
Biotechnology and Bioengineering. DOI 10.1002/bit

dx33
dt¼ k23x32
dx34
dt¼ �kf38x34x46 þ kr38x45
þ kf35x38 � kr35x34x35 � kf24x39x34 þ k24rx40
dx35
dt¼ �kf25x35x40 þ kr25x41
� kf40x35x45 þ kr40x44 þ kf35x38 � kr35x34x35
dx36
dt¼ �kf26x36x41 þ kr26x42 þ kf31x43 � kr31x36x41
dx37
dt¼ kf27x42 � kr27x37x41 � kf28x37x47 þ kr28x48
dx38
dt¼ �kf35x38 þ kr35x34x35
� kf41x38x39 þ kr41x41 þ kf33x44 � kr33x38x46
dx39
dt¼ kf34x16 � kr34x39 � kf37x39 þ kr37x8x46
� kf24x39x34 þ kr24x40 � kf41x39x38 þ kr41x41
dx40
dt¼ kf24x39x34 � kr24x40
� kf25x40x35 þ kr25x41 � kf39x40 þ kr39x45x8
dx41dt
¼ kf25x35x40 � kr25x41 � kf32x41 þ kr32x44x8 � kf26x41x36
þ kr26x42 þ kf31x43 � kr31x41x36 þ kf41x39x38 � kr41x41
� kf30x49x41 þ kr30x43 þ kf27x42 � kr27x41x37
dx42dt
¼ kf26x36x41 � kr26x42 � kf27x42 þ kr27x37x41
dx43dt
¼ kf30x41x49 � kr30x43 � kf31x43 þ kr31x36x41
dx44dt
¼ kf32x41
� kr32x44x8 � kf33x44 þ kr33x38x46 þ kf40x35x45 � kr40x44
dx45dt
¼ kf38x34x46
� kr38x45 þ kf39x40 � kr39x8x45 � kf40x35x45 þ kr40x44
dx46dt
¼ kf37x39 � kr37x8x46
� Vmx46
Km þ x46� kf38x34x46 þ kr38x45 þ kf33x44 � kr33x38x46
dx47dt
¼ �kf28x37x47 þ kr28x48 þ k43x52
dx48dt
¼ kf28x37x47 � kr28x48 � kf29x48 þ kr29x49x51
dx49dt
¼ kf29x48 � kr29x49x51 � kf30x41x49 þ kr30x43
dx50dt
¼ �kf42x50x51 þ kr42x52 þ k43x52
dx51dt
¼ kf29x48 � kr29x49x51 � kf42x50x51 þ kr42x52 � kf44x51x53
þ kr44x54 þ k45x54 þ k47x56 � kf46x55x51 þ kr46x56
dx52dt
¼ kf42x50x51 � kr42x52 � k43x52
dx53dt
¼ �kf44x51x53 þ kr44x54 þ k51x60
dx54dt
¼ kf44x51x53 � kr44x54 � k45x54
dx55dt
¼ k45x54 � kf46x51x55
þ kr46x56 þ k49x58 � kf50x55x59 þ kr50x60
dx56dt
¼ �k47x56 þ kf46x51x55 � kr46x56
dx57dt
¼ k47x56 � kf48x57x59 þ kr48x58 � kf52x57x61 þ kr52x62
þ k53x62 � kf54x57x63 þ kr54x64 þ k55x64
dx58dt
¼ kf48x57x59 � kr48x58 � k49x58
dx59dt
¼ k49x58 � kf48x57x59 þ kr48x58 � kf50x55x59
þ kr50x60 þ k51x60
dx60dt
¼ kf50x55x59 � kr50x60 � k51x60
dx61dt
¼ �kf52x57x61 þ kr52x62 þ k59x68
dx62dt
¼ kf52x57x61 � kr52x62 � k53x62
dx63dt
¼ k53x62 � kf54x57x63 þ kr54x64
þ k57x67 � kf58x63x66 þ kr58x68
dx64dt
¼ kf54x57x63 � kr54x64 � k55x64
dx65
dt¼ k55x64 � kf56x65x66 þ kr56x67
APPENDIX-II
(continued)
860 Biotechnology and Bioengineering, Vol. 95, No. 5, December 5, 2006
DOI 10.1002/bit

dx66
dt¼ �kf56x65x66 þ kr56x67 þ k57x67
� kf58x63x66 þ kr58x68 þ k59x68
dx67
dt¼ kf56x65x66 � kr56x67 � k57x67
dx68
dt¼ kf58x63x66 � kr58x68 � k59x68
APPENDIX-III
Model Variable Description:
Variable Description
x1 gp80
x2 IL6-gp80
x3 gp130
x4 JAK
x5 gp130-JAK
x6 IL6-gp80- gp130-JAK
x7 (IL6-gp80- gp130-JAK)2x8 (IL6-gp80- gp130-JAK)2
*
x9 STAT3C
x10 STAT3C*
x11 (IL6-gp80- gp130-JAK)2*-STAT3C
x12 (IL6-gp80- gp130-JAK)2*-STAT3C*
x13 STAT3C*-STAT3C*
x14 STAT3C-STAT3C*
x15 SHP2
x16 (IL6-gp80- gp130-JAK)2*–SHP2
x17 PP1
x18 PP1-STAT3C*
x19 PP1-STAT3C*- STAT3C*
x20 STAT3N*- STAT3N*
x21 STAT3N*
x22 STAT3N
x23 PP2
x24 STAT3N-STAT3N*
x25 Mrna-SOCS3N
x26 Mrna-SOCS3C
x27 PP2-STAT3N*-STAT3N*
x28 PP2-STAT3N*
x29 SOCS3
x30 (IL6-gp80-gp130-JAK)2*–SOCS3
x31 (IL6-gp80- gp130-JAK)2*–STAT3C-SOCS3
x32 (IL6-gp80- gp130-JAK)2*–STAT3C-SOCS3-SHP2
x33 (IL6-gp80- gp130-JAK)2*–STAT3C-SHP2
x34 Grb2
x35 SOS
x36 Ras-GDP
x37 Ras-GTP
x38 Grb2-SOS
x39 (IL6-gp80- gp130-JAK)2*–SHP2*
x40 (IL6-gp80- gp130-JAK)2*–SHP2*-Grb2
x41 (IL6-gp80- gp130-JAK)2*–SHP2*-Grb2-SOS
x42 (IL6-gp80- gp130-JAK)2*–SHP2*-Grb2-SOS-Ras-GDP
x43 (IL6-gp80- gp130-JAK)2*–SHP2*-Grb2-SOS-Ras-GTP
x44 SHP2*-Grb2-SOS
x45 SHP2*-Grb2
x46 SHP2*
x47 Raf
x48 Raf-Ras-GTP
x49 Ras-GTP*
x50 Phosp1
x51 Raf*
x52 Raf*-Phosp1
x53 MEK
x54 MEK-Raf*
x55 MEK-P
x56 MEK-P-Raf*
x57 MEK-PP
x58 MEK-PP-Phosp2
x59 Phosp2
x60 MEK-P-Phosp2
x61 ERK
x62 ERK-MEK-PP
x63 ERK-P
x64 ERK-P-MEK-PP
x65 ERK-PP
x66 Phosp3
x67 ERK-PP-Phosp3
x68 ERK-P-Phosp3
APPENDIX-IV
Model Parameters:
kf0 ¼ 100� 10�3 kr0 ¼ 0:05kf1 ¼ 100� 10�3 kr1 ¼ 0:05
kf2 ¼ 20� 10�3 kr2 ¼ 0:02
kf3 ¼ 40� 10�3 kr3 ¼ 0:2
k4 ¼ 0:005
kf5 ¼ 8� 10�3 kr3 ¼ 0:8
k6 ¼ 0:4
kf7 ¼ 5� 10�3 kr7 ¼ 0:5
kf8 ¼ 20� 10�3 kr8 ¼ 0:1
kf9 ¼ 1� 10�3 kr9 ¼ 0:2
k10 ¼ 0:003
kf11 ¼ 1� 10�3 kr11 ¼ 0:2
k12 ¼ 0:003
kf13 ¼ 0:0002� 10�3 kr13 ¼ 0:2
k14 ¼ 0:005
kf15 ¼ 1� 10�3 kr15 ¼ 0:2
k16 ¼ 0:005
k17 ¼ 0:05
k18a ¼ 0:01 k18b ¼ 400
k19 ¼ 0:001
k20 ¼ 0:01
kf21 ¼ 20� 10�3 kr21 ¼ 0:1
k22 ¼ 0:0005
k23 ¼ 0:0005
kf24 ¼ 1� 10�2 kr24 ¼ 0:55
kf25 ¼ 1� 10�2 kr25 ¼ 0:0214kf26 ¼ 1:5� 10�2 kr26 ¼ 1:3
kf27 ¼ 0:5 kr27 ¼ 1� 10�4
kf28 ¼ 1� 10�3 kr28 ¼ 0:0053
kf29 ¼ 1 kr29 ¼ 7� 10�4
kf30 ¼ 7:9� 10�3 kr30 ¼ 0:3
kf31 ¼ 0:023 kr31 ¼ 2:2� 10�4
kf32 ¼ 0:1 kr32 ¼ 2:45� 10�4
kf33 ¼ 0:3 kr33 ¼ 2:1� 10�2
kf34 ¼ 6 kr34 ¼ 0:6
APPENDIX-II
(continued)Variable Description
Singh et al.: Modeling Regulatory Mechanisms 861
Biotechnology and Bioengineering. DOI 10.1002/bit

References
Baumann H, Gauldie J. 1994. The acute phase response. Immunol Today
15:74–80.
BaumannH, Isseroff H, Latimer JJ, Jahreis GP. 1988. Phorbolster modulates
interleukin 6 and interleukin 1 regulated expression of acute phase
plasma proteins in hepatoma cells. J Biol Chem 263:17390–17396.
Fasshauer M, Kralisch S, Klier M, Lossner U, Bluher M, Klein J. 2004.
Insulin resistance-inducing cytokines differentially regulate SOCS
mRNA expression via growth factor- and JAK/STAT-signaling path-
ways in 3T3-L1 adipocytes. J Endocrinol 181:129–138.
Fischer P, Lehmann U, Sobota RM, Schmitz J, Niemand C, Linnemann S,
Haan S, Behrmann I, Yoshimura A, Johnston JA, Muller-Newen G,
Heinrich PC, Schaper F. 2004. The role of the inhibitors of interleukin-6
signal transduction SHP-2 and SOCS3 foe desensitization of inter-
leukin-6 signaling. Biochem J 378:449–460.
He B, You L, Xu Z, Mazieres J, Lee AY, Jablons DM. 2004. Activity of the
suppressor of cytokine signaling-3 promoter in human non-small-cell
lung cancer. Clin Lung Cancer 5(6):366–370.
Heinrich PC, Behrmann I, Muller-Newen G, Schaper F, Graeve L. 1998.
Interleukin-6-type cytokine signaling through the gp130/JAK/STAT
pathway. Biochem J 334:297–314.
Heinrich PC, Behrmann I, Haan S, Hermanns HM, Muller-Newen G,
Schaper F. 2003. Principles of interleukin (IL)-6-type cytokine signaling
and its regulation. Biochem J 374:1–20.
Jayaraman A, Yarmush ML, Roth CM. 2000. Dynamics of Gene
expression in rat hepatocytes under stress. Metab Eng 2:239–251.
Kholodenko BN. 2000. Negative feedback and ultrasenstivity can bring
about oscillations in the mitogen-activated protein kinase cascades. Eur
J Biochem 267:1583–1588.
Kim H, Baumann H. 1999. Dual signaling role of the protein tyrosine
phosphate SHP-2 in regulating expression of acute-phase plasma
proteins by interleukin-6 cytokine receptors in hepatic cells. Mol Cell
Biol 19:5326–5338.
Lai CF, Ripperger J, Wang Y, Kim H, Hawleys RB. 1999. The STAT3-
independent signaling pathway by glycoprotein 130 in hepatic cells.
J Biol Chem 274:7793–7802.
Lang R, Pauleau AL, Parganas E, Takahashi Y,Mages J, Ihle JN, Rutschman
R, Murray PJ. 2003. SOCS regulates the plasticity of gp120 signaling.
Nat Immunol 4:546–550.
LehmannU, Schmitz J,WeissenbachM, Sobota RM,HortnerM, Friederichs
K, Behrmann I, Tsiaris W, Sasaki A, Schneider-Mergener J, Yoshimura
A,Neel BG,Heinrich PC, Schaper F. 2003. SHP2 and SOCS3 contribute
to Tyr-759-dependent attenuation of interleukin-6 signaling through
gp130. J Biol Chem 278:661–667.
Levy DE, Darnell JE Jr. 2002. Stats: Transcriptional control and biological
impact. Nature Review Mol Cell Biol 3:651–662.
Niwa Y, Kanda H, Shikauchi Y, Saiura Y, Matsubara K, Kitagawa T,
Yamamoto J, Kubo T, Yoshikawa H. 2005. Methylation silencing of
SOCS-3 promotes cell growth and migration of enhancing JAK/STAT
and FAK signalings in human hepatocellular carcinoma. Oncogene
24:6406–6417.
Pinilla JC, Hayes P, Laverty W, Arnold C, Laxdal V. 1998. The C-reactive
protein to prealbumin ratio correlates with the severity ofmultiple organ
dysfunction. Surgery 24:799–806.
Roth CM, Reiken SR, Le Doux JM, Rajur SB, Lu XM,Morgan JR, Yarmush
ML. 1997. Targeted antisense modulation of inflammatory cytokine
receptors. Biotechnol Bioeng 55:72–81.
Schaper F, Gendo C, Monika E, Schmitz J, Grimm C, Anhuf D, Kerr IM.
1998. Activation of the protein tyrosine phosphate SHP-2 via the
interleukin-6 signal transducing receptor protein gp130 requires
tyrosine kinase JAK1 and limits acute-phase protein expression.
Biochem J 335:557–565.
Schmitz J, Weissenbach M, Haan S, Henerich PC, Schaper F. 2000. SOCS3
exerts its inhibitory function on interleukin-6 signal transduction
through the SHP-2 recruitment site of gp130. J Biol Chem 275:
12848–12856.
Schoeberl B, Eichler-Jonsson C, Gilles ED, Muller G. 2002. Computational
modeling of the dynamics of the MAP kinase cascade activated by
surface and internalized EGF receptors. Nat Biotechnol 20:370–375.
ten Hoeve J, Ibarra-Sanchez M, Fu Y, Zhu W, Tremblay M, David M, Shuai
K. 2002. Identification of a nuclear Stat1 protein tyrosine phosphatase.
Mol Cell Biol 22:5662–5668.
Yamada S, Shiono S, Joo A, Yoshimura A. 2003. Control mechanism of
JAK/STAT signal transduction pathway. FEBS Lett 534:190–196.
APPENDIX-IV
(continued)
kf35 ¼ 0:0015 kr35 ¼ 4:5� 10�3
Vm ¼ 1:7 Km ¼ 340
kf37 ¼ 0:3 kr37 ¼ 9� 10�4
kf38 ¼ 1� 10�2 kr38 ¼ 0:55
kf39 ¼ 0:3 kr39 ¼ 9� 10�4
kf40 ¼ 3� 10�2 kr40 ¼ 0:064
kf41 ¼ 3� 10�2 kr41 ¼ 0:0429
kf42 ¼ 7:17� 10�2 kr42 ¼ 0:2
k43 ¼ 1
kf44 ¼ 1:1� 10�2 kr44 ¼ 0:01833
k45 ¼ 3:5
kf46 ¼ 1:1� 10�2 kr46 ¼ 0:01833
k47 ¼ 2:9
kf48 ¼ 1:43� 10�2 kr48 ¼ 0:8
k49 ¼ 0:058
kf50 ¼ 2:7� 10�4 kr50 ¼ 0:5
k51 ¼ 0:058
kf52 ¼ 1:1� 10�4 kr52 ¼ 0:033
k53 ¼ 16
kf54 ¼ 1:1� 10�4 kr54 ¼ 0:033
k55 ¼ 5:7
kf56 ¼ 1:4� 10�2 kr56 ¼ 0:6
k57 ¼ 0:27
kf58 ¼ 5� 10�3 kr58 ¼ 0:5
k59 ¼ 0:3
kf60 ¼ 0:5 kr60 ¼ 5� 10�3
kf61 ¼ 0:2 kr61 ¼ 0:0002� 10�3
First order rate constants are in units of s�1 and second order rateconstants are expressed in nM�1 s�1. Michaelis constants are in nM.
APPENDIX-V
Initial Conditions:
x1 gp80 8
x3 gp130 0.8
x4 JAK 12
x9 STAT3C 1000
x15 SHP2 100
x17 PP1 50
x23 PP2 60
x34 Grb2 85
x35 SOS 34
x36 Ras-GDP 19000
x47 Raf 67
x50 Phosp1 67
x53 MEK 41667
x59 Phosp2 67
x61 ERK 35000
x66 Phosp3 16667
All other initial conditions are set to zero.Initial concentrations of proteins are in units of nM.
862 Biotechnology and Bioengineering, Vol. 95, No. 5, December 5, 2006
DOI 10.1002/bit
Copyright © 2022 FDOKUMEN