Lipophilic aroylhydrazone chelator HNTMB and its multiple effects on ovarian cancer cells
Upload
khangminh22Category
view
1download
0
HAL Id: hal-02911050https://hal.archives-ouvertes.fr/hal-02911050
Submitted on 20 Dec 2021
HAL is a multi-disciplinary open accessarchive for the deposit and dissemination of sci-entific research documents, whether they are pub-lished or not. The documents may come fromteaching and research institutions in France orabroad, or from public or private research centers.
L’archive ouverte pluridisciplinaire HAL, estdestinée au dépôt et à la diffusion de documentsscientifiques de niveau recherche, publiés ou non,émanant des établissements d’enseignement et derecherche français ou étrangers, des laboratoirespublics ou privés.
A liver-targeting Cu(l) chelator relocates Cu inhepatocytes and promotes Cu excretion in a murine
model of Wilson’s diseaseMarie Monestier, Anais M. Pujol, Aline Lamboux, Martine Cuillel, IsabellePignot-Paintrand, Doris Cassio, Peggy Charbonnier, Khémary Um, Amélie
Harel, Sylvain Bohic, et al.
To cite this version:Marie Monestier, Anais M. Pujol, Aline Lamboux, Martine Cuillel, Isabelle Pignot-Paintrand, et al..A liver-targeting Cu(l) chelator relocates Cu in hepatocytes and promotes Cu excretion in a murinemodel of Wilson’s disease. Metallomics, Royal Society of Chemistry, 2020, 12 (6), pp.1000-1008.�10.1039/d0mt00069h�. �hal-02911050�
A liver-targeting Cu(I) chelator relocates Cu in hepatocytes and promotes Cu excretion in ATP7b-/- mice
Marie Monestier,a,b Anaïs M. Pujol,a,b Aline Lamboux,c Martine Cuillel,a Isabelle Pignot-Paintrand,d Doris Cassio,e
Peggy Charbonnier,a Khémary Um,a Amélie Harel,a Sylvain Bohic,f Christelle Gateau,b Vincent Balter,c Virginie
Brun,g Pascale Delangle,*b Elisabeth Mintz*a
Abstract.
Copper chelation is the most commonly used therapeutic strategy nowadays to treat Wilson’s disease,
a genetic disorder primarily inducing a pathological accumulation of Cu in the liver. The mechanism of
action of Chel2, a liver-targeting Cu(I) chelator known to promote intracellular Cu chelation, was
studied in hepatic cells that reconstitute polarized epithelia with functional bile canaliculi, reminiscent
of the excretion pathway in the liver. The interplay between Chel2 and Cu localization in these cells
was demonstrated through confocal microscopy using a fluorescent derivative and nano X-ray
fluorescence. The Cu(I) bound chelator was found in vesicles potentially excreted in the canaliculi.
Moreover, injection of Chel2 either intravenously or subcutaneously to a murine model of Wilson’s
disease increased excretion of Cu in the faeces, confirming in vivo biliary excretion. Therefore, Chel2
turns to a possible means to collect and excrete hepatic Cu in the faeces, hence restoring the
physiological pathway.
Introduction.
A possible involvement of metal ions has been brought to the forefront in many neurodegenerative
diseases without knowing whether the abnormal presence of metal ions is the cause or a consequence
of the disease, for instance in Alzheimer’s disease.1 In some cases however, when the homeostasis of
an essential metal ion is disrupted by a genetic defect, the excess of the given metal is known to be
responsible for the disease; this is the case for iron in hemochromatosis and aceruloplasminemia,
manganese in hypermanganesemia or copper in Wilson’s disease.2 Systemic metal chelation is the
usual therapy for most of these diseases, in order to lower the dietary absorption of the metal ions
and, hopefully, to deplete the excess stores by excreting the metal ions, often in urine. One striking
observation is that these diseases promote a high increase in the liver content of the metal with
disrupted homeostasis. Some metal ions also promote neurological symptoms with abnormal
magnetic resonance images of the brain.3
Wilson’s disease is an autosomal recessive disease resulting from mutations of the ATP7B gene, whose
product is a Cu(I)-transporting ATPase, a membrane protein that pumps copper out of the cytoplasm.
a. Univ. Grenoble Alpes, CEA, CNRS, IRIG, LCBM, F-38000 Grenoble, France. b. Univ. Grenoble Alpes, CEA, CNRS, IRIG, SyMMES, F-38000 Grenoble, France. c. Univ. Lyon, CNRS, ENS de Lyon, LGLTPE, F-69007 Lyon, France d. Univ. Grenoble Alpes, CNRS, Grenoble INP, LMGP, F-38000 Grenoble, France e. INSERM, Univ. Paris Sud, UMR U 1174, F-91405 Orsay, France. f. Inserm, UA7, Synchrotron Radiation for Biomedicine (STROBE), 38000, Grenoble, France g. Univ. Grenoble Alpes, CEA, INSERM, IRIG, BGE, F-38000 Grenoble, France Electronic Supplementary Information (ESI) available: detailed experimental section. Supplementary nano XRF images (Fig. S1 and S2). Supplementary data for the 65Cu experiments on mice (Table S1 and Fig. S3)]. See DOI: 10.1039/x0xx00000x

Under basal condition, the so-called Wilson protein is in the trans-Golgi network for dispensing copper
to enzymes that use it as a co-factor. In case of excess copper in the cell, the Wilson protein changes
its localization for pumping copper into intracellular vesicles that will eventually excrete it out of the
cells.4 The ATP7B gene is expressed mainly in the liver and the brain and to a lesser extent in kidney,
lung, placenta, mammary gland and intestine.4,5 Because vertebrates get rid of the excess copper by
transferring it into the bile and then the faeces, the Wilson protein is responsible for the detoxification
of the whole organism. Therefore, mutations in ATP7B genes primarily induce a pathological
accumulation of copper in the liver.6,7 Over the years, the liver undergoes fibrosis, cirrhosis and in some
cases, acute hepatitis that requires a liver transplantation for the patient to survive. In addition, about
40% of the Wilson’s disease patients develop neurological symptoms and 20%, psychiatric symptoms
with no obvious signs of chronic liver disease. Among the patients with a neurological presentation,
those who underwent a liver transplantation generally improved their condition. Their liver was loaded
with copper, even though these patients did not necessarily exhibit typical signs of a liver condition.8-
10
The heterogeneous clinical presentations and the late onset of the neurological signs make Wilson’s
disease difficult to diagnose from scratch, even though there is a clear MRI signature in the brain and
many patients have a large copper overload at the time of diagnosis. The chelators prescribed all over
the world are d-penicillamine and triethylenetetramine, two molecules that allow some copper
removal of the body. Unfortunately, they also have adverse effects which preclude their use, in up to
30% of the cases for d-penicillamine.11 One major drawback of these molecules is that they are
systemic and used at high dosage. They are only moderately specific for the excess copper stored in
hepatocytes, especially when one has in mind the very high affinity and specificity found in proteins
devoted to copper homeostasis.12
Given these observations, we have developed in the past decade bio-inspired chelators mimicking the
Cu(I) binding sites from two cysteine-rich proteins involved in copper homeostasis.12,13 One chelator
mimics a metallochaperone binding site with a CuS2 coordination14 and the other one mimics a
metallothionein binding site with a CuS3 coordination.15,16 To protect the Cu(I) binding sites until they
reach their target, the chelator’s thiol functions have been oxidized into disulphide bonds, so that Cu(I)
chelation would be activated only once inside the cells. Indeed, intracellular glutathione is millimolar
and ensures the reduction of the disulphide bonds.14,17 Finally, because Wilson’s disease starts in the
hepatocytes, the so-designed pro-chelators were grafted with ligands that specifically recognize the
asialoglycoprotein receptors (ASGPR) at the hepatocyte sinusoidal membrane.18 The design and the
efficiency of the final molecules, i.e. the hepatocyte targeting pro-chelators, have been described
earlier.19 These studies, performed on hepatocyte-derived cell lines, show that both ASGPR-targeting
pro-chelators release an efficient Cu chelator inside the cells, suggesting these compounds were
models for the development of new hepatocyte- and Cu(I)- specific chelators. However, the
intracellular mechanism of action of the chelators and the fate of the Cu(I) chelator complexes are still
to be determined.
The work reported here aims at understanding the mechanism of action of Chel2 (Scheme 1), the
hepatocyte-directed pro-chelator releasing a tristhiolate chelator in the cells.17 a sulphocyanin5
labelled version of Chel2 and on the effects of Chel2 on the intracellular distribution of metal ions,
following their X-ray fluorescence at the sub-micron scale (nano XRF) thanks to the ESRF synchrotron
beam in Grenoble. Based on these studies, we propose a mechanism of action for the pro-chelator
which would result in the transfer of the Cu(I)-chelator complex into the bile. This mechanism was
further tested on ATP7b-/- mice, an animal model of Wilson’s disease which develops the hepatic form
of the disease.20 To this end, ATP7b-/- mice were administrated 65Cu which accumulated in their liver.
We found that a treatment with Chel2 increased the 65Cu content of the mice faeces, in agreement
with partial restoration of the physiological pathway for Cu excretion through the bile.
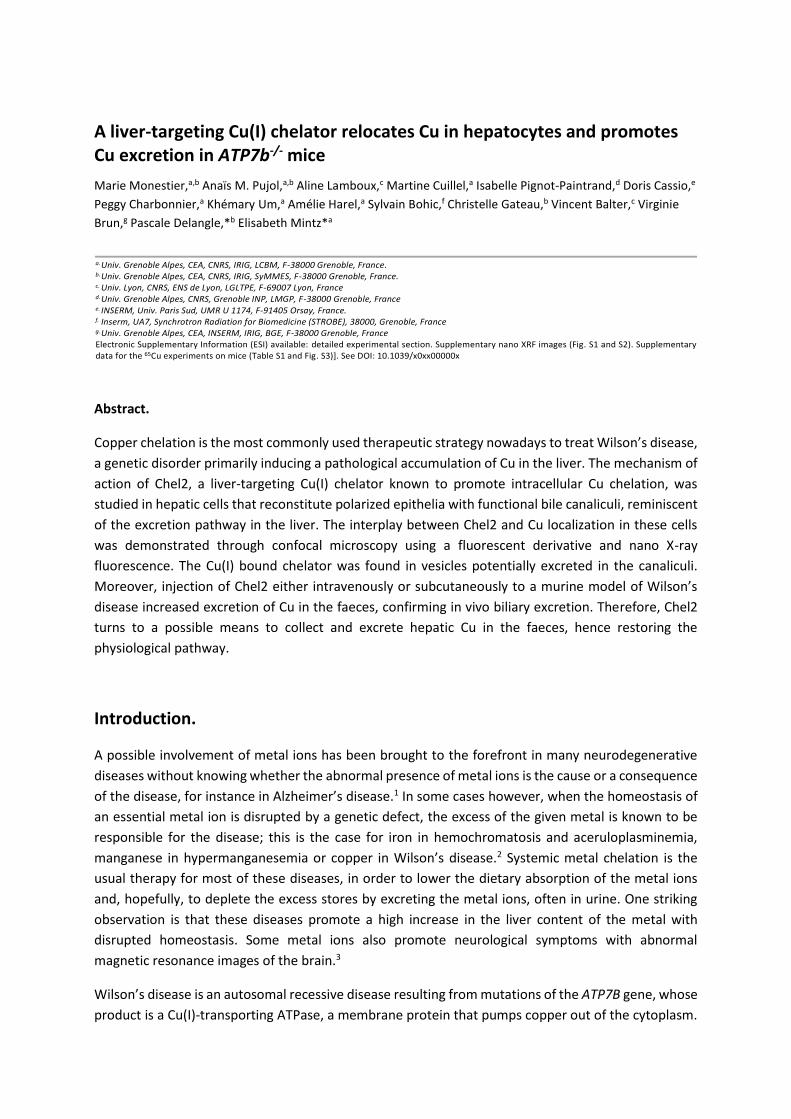
Scheme 1 Structures of the glycoconjugates Chel2 and Chel2*and the released chelators Chel(SH)3
and Chel*(SH)3.
Results.
Chel2 has been shown to release in WIF-B9 cells the high affinity Cu(I) chelator, Chel(SH)3 (scheme 1).17
The latter is a tripodal sulphur chelator based on a nitrilotriacetic core grafted with three cysteine
moieties that chelate Cu(I) with properties reminiscent of metallothioneins. The complex, denoted
ChelS3Cu, exhibits a CuS3 coordination and an affinity constant as large as 1019.16,21 In the hepatocyte-
targeting pro-chelator Chel2, the three thiol functions are hidden in disulphide bridges carrying the
targeting units, namely three polyethylene glycol chains grafted with N-acetyl galactosamine moieties
to get an architecture perfectly adapted for the interaction with the ASGP-R.19
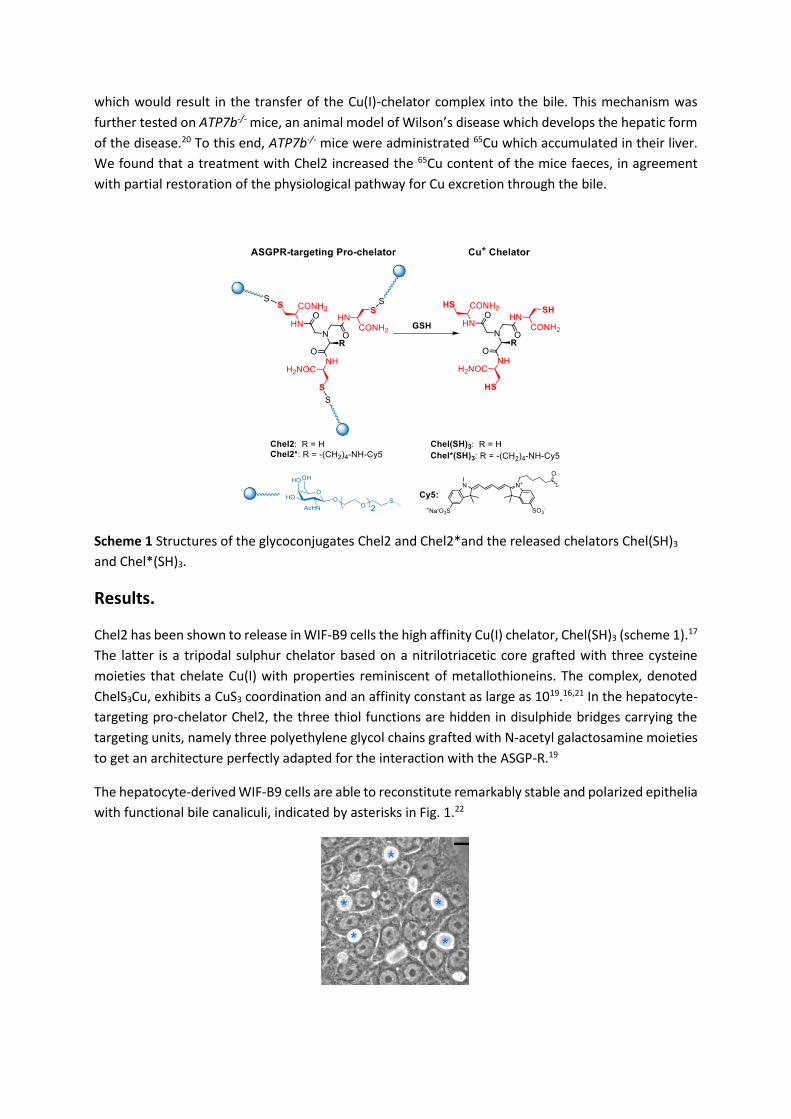
The hepatocyte-derived WIF-B9 cells are able to reconstitute remarkably stable and polarized epithelia
with functional bile canaliculi, indicated by asterisks in Fig. 1.22
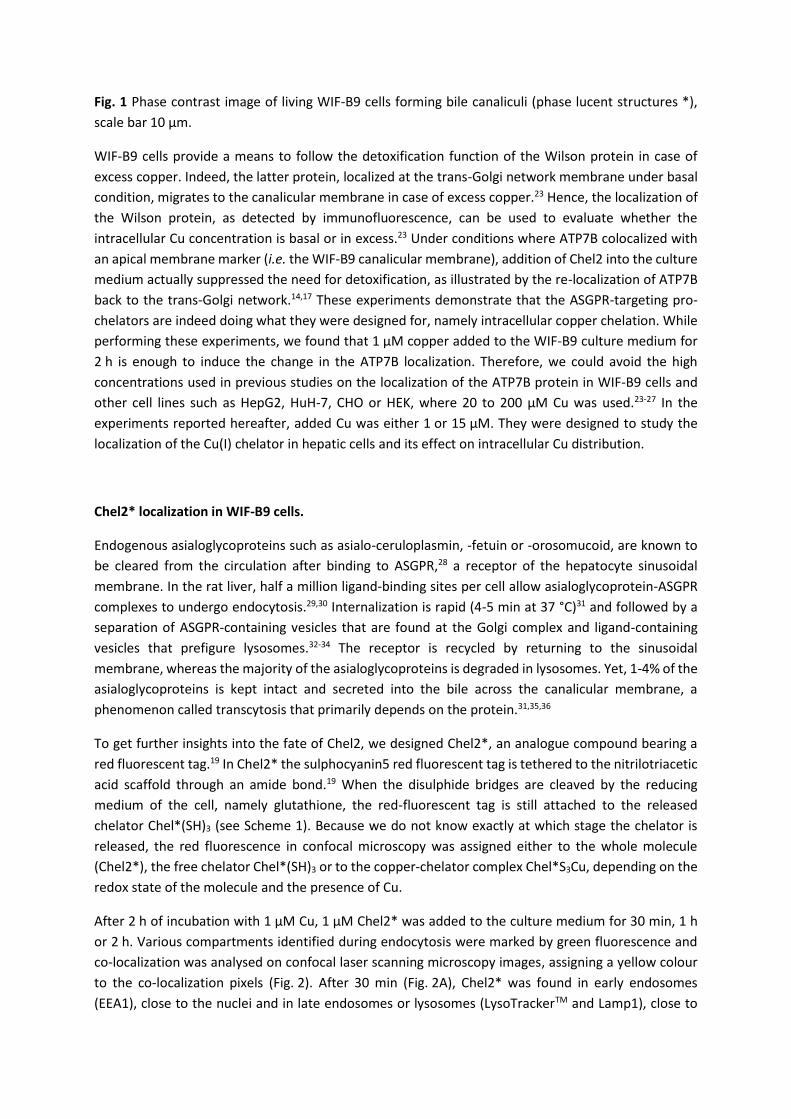
Fig. 1 Phase contrast image of living WIF-B9 cells forming bile canaliculi (phase lucent structures *),
scale bar 10 µm.
WIF-B9 cells provide a means to follow the detoxification function of the Wilson protein in case of
excess copper. Indeed, the latter protein, localized at the trans-Golgi network membrane under basal
condition, migrates to the canalicular membrane in case of excess copper.23 Hence, the localization of
the Wilson protein, as detected by immunofluorescence, can be used to evaluate whether the
intracellular Cu concentration is basal or in excess.23 Under conditions where ATP7B colocalized with
an apical membrane marker (i.e. the WIF-B9 canalicular membrane), addition of Chel2 into the culture
medium actually suppressed the need for detoxification, as illustrated by the re-localization of ATP7B
back to the trans-Golgi network.14,17 These experiments demonstrate that the ASGPR-targeting pro-
chelators are indeed doing what they were designed for, namely intracellular copper chelation. While
performing these experiments, we found that 1 µM copper added to the WIF-B9 culture medium for
2 h is enough to induce the change in the ATP7B localization. Therefore, we could avoid the high
concentrations used in previous studies on the localization of the ATP7B protein in WIF-B9 cells and
other cell lines such as HepG2, HuH-7, CHO or HEK, where 20 to 200 µM Cu was used.23-27 In the
experiments reported hereafter, added Cu was either 1 or 15 µM. They were designed to study the
localization of the Cu(I) chelator in hepatic cells and its effect on intracellular Cu distribution.
Chel2* localization in WIF-B9 cells.
Endogenous asialoglycoproteins such as asialo-ceruloplasmin, -fetuin or -orosomucoid, are known to
be cleared from the circulation after binding to ASGPR,28 a receptor of the hepatocyte sinusoidal
membrane. In the rat liver, half a million ligand-binding sites per cell allow asialoglycoprotein-ASGPR
complexes to undergo endocytosis.29,30 Internalization is rapid (4-5 min at 37 °C)31 and followed by a
separation of ASGPR-containing vesicles that are found at the Golgi complex and ligand-containing
vesicles that prefigure lysosomes.32-34 The receptor is recycled by returning to the sinusoidal
membrane, whereas the majority of the asialoglycoproteins is degraded in lysosomes. Yet, 1-4% of the
asialoglycoproteins is kept intact and secreted into the bile across the canalicular membrane, a
phenomenon called transcytosis that primarily depends on the protein.31,35,36
To get further insights into the fate of Chel2, we designed Chel2*, an analogue compound bearing a
red fluorescent tag.19 In Chel2* the sulphocyanin5 red fluorescent tag is tethered to the nitrilotriacetic
acid scaffold through an amide bond.19 When the disulphide bridges are cleaved by the reducing
medium of the cell, namely glutathione, the red-fluorescent tag is still attached to the released
chelator Chel*(SH)3 (see Scheme 1). Because we do not know exactly at which stage the chelator is
released, the red fluorescence in confocal microscopy was assigned either to the whole molecule
(Chel2*), the free chelator Chel*(SH)3 or to the copper-chelator complex Chel*S3Cu, depending on the
redox state of the molecule and the presence of Cu.
After 2 h of incubation with 1 µM Cu, 1 µM Chel2* was added to the culture medium for 30 min, 1 h
or 2 h. Various compartments identified during endocytosis were marked by green fluorescence and
co-localization was analysed on confocal laser scanning microscopy images, assigning a yellow colour
to the co-localization pixels (Fig. 2). After 30 min (Fig. 2A), Chel2* was found in early endosomes
(EEA1), close to the nuclei and in late endosomes or lysosomes (LysoTrackerTM and Lamp1), close to
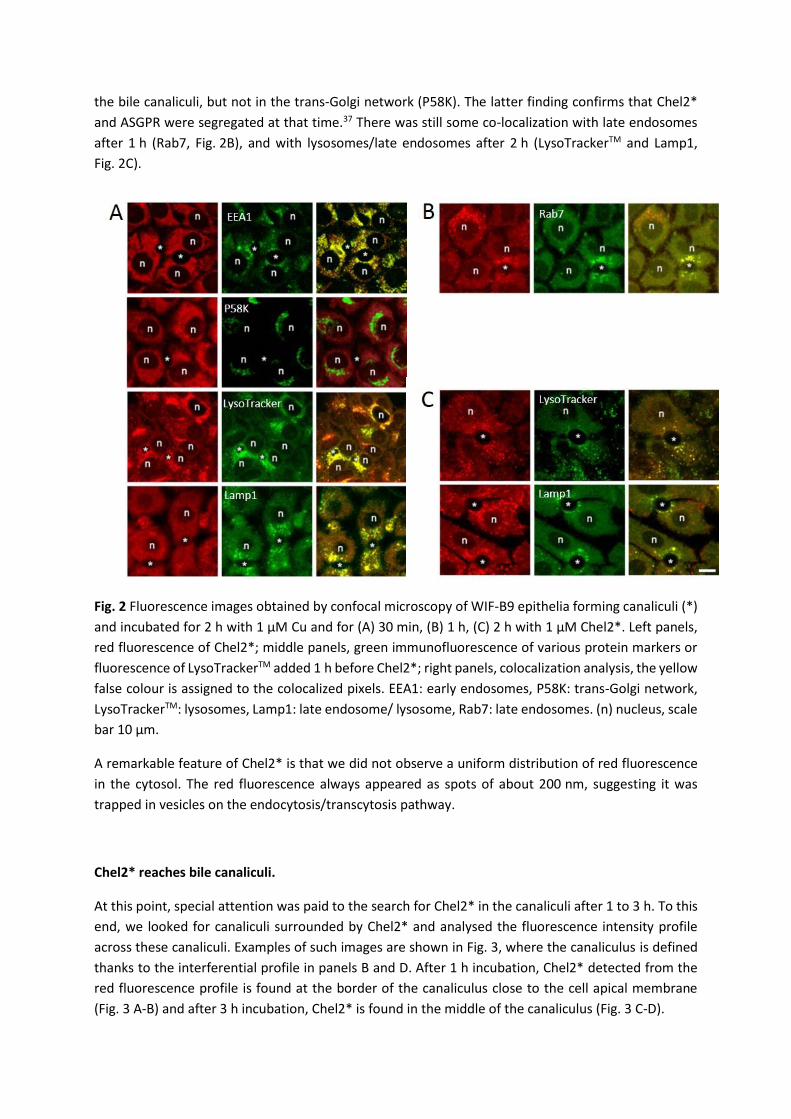
the bile canaliculi, but not in the trans-Golgi network (P58K). The latter finding confirms that Chel2*
and ASGPR were segregated at that time.37 There was still some co-localization with late endosomes
after 1 h (Rab7, Fig. 2B), and with lysosomes/late endosomes after 2 h (LysoTrackerTM and Lamp1,
Fig. 2C).
Fig. 2 Fluorescence images obtained by confocal microscopy of WIF-B9 epithelia forming canaliculi (*)
and incubated for 2 h with 1 µM Cu and for (A) 30 min, (B) 1 h, (C) 2 h with 1 µM Chel2*. Left panels,
red fluorescence of Chel2*; middle panels, green immunofluorescence of various protein markers or
fluorescence of LysoTrackerTM added 1 h before Chel2*; right panels, colocalization analysis, the yellow
false colour is assigned to the colocalized pixels. EEA1: early endosomes, P58K: trans-Golgi network,
LysoTrackerTM: lysosomes, Lamp1: late endosome/ lysosome, Rab7: late endosomes. (n) nucleus, scale
bar 10 µm.
A remarkable feature of Chel2* is that we did not observe a uniform distribution of red fluorescence
in the cytosol. The red fluorescence always appeared as spots of about 200 nm, suggesting it was
trapped in vesicles on the endocytosis/transcytosis pathway.
Chel2* reaches bile canaliculi.
At this point, special attention was paid to the search for Chel2* in the canaliculi after 1 to 3 h. To this
end, we looked for canaliculi surrounded by Chel2* and analysed the fluorescence intensity profile
across these canaliculi. Examples of such images are shown in Fig. 3, where the canaliculus is defined
thanks to the interferential profile in panels B and D. After 1 h incubation, Chel2* detected from the
red fluorescence profile is found at the border of the canaliculus close to the cell apical membrane
(Fig. 3 A-B) and after 3 h incubation, Chel2* is found in the middle of the canaliculus (Fig. 3 C-D).

Fig. 3 Detailed analysis of Chel2* position in the region of the canaliculus. Analysis from interferential
contrast and fluorescence images obtained by confocal microscopy of WIF-B9 epithelia forming
canaliculi and incubated with 1 µM Chel2* for (A-B) 1 h or (C-D) 3 h. (A and C) merged images of
interferential contrast and red fluorescence. The canaliculi are crossed by a 15-µm red line along which
interferential contrast and fluorescence intensities are analysed. (B and D) interferential profiles in
black and red fluorescence profiles along the line crossing the canaliculus.
Copper intracellular distribution by nano XRF.
To get further insights into the fate of the chelator and the Cu(I)-chelator complexes, the WIF-B9 cells
were analysed for their intracellular metal distribution, paying special attention to the bile canaliculi
and the cytoplasmic region close to the canalicular membrane.
Nano XRF maps were performed on WIF-B9 cells forming a polarized epithelium and submitted to
different conditions, starting with the basal culture medium, adding Cu for 2 h and then adding Chel2
for 3 h (Fig. 4). The nano XRF images shown in Fig. 4 are representative of the 2-5 canalicular regions
scanned under each condition (Fig. S1 in the Electronic Supplementary Information), bile canaliculi are
indicated by asterisks. The P distribution covers the nuclei and the Zn distribution indicates the nuclei
showing nucleoli as holes. Comparison with the phase image (Fig. 1) shows that the WIF-B9
organization and polarization were preserved by the sample preparation and the scans. The image
obtained under the basal condition (Fig. 4A) shows two cells sharing a bile canaliculus and the Cu
distribution is homogeneous across the cytoplasm with only scarce hot spots. After 2 h in the presence
of 1 µM Cu, the Cu distribution shows a lot more hot spots in the three cells forming a canaliculus (Fig.
4B). Under the next condition, 5 h in 1 µM Cu including 50 µM Chel2 for the last 3 h, the Cu distribution
appears concentrated along the apical membranes forming the canaliculus (Fig. 4C).
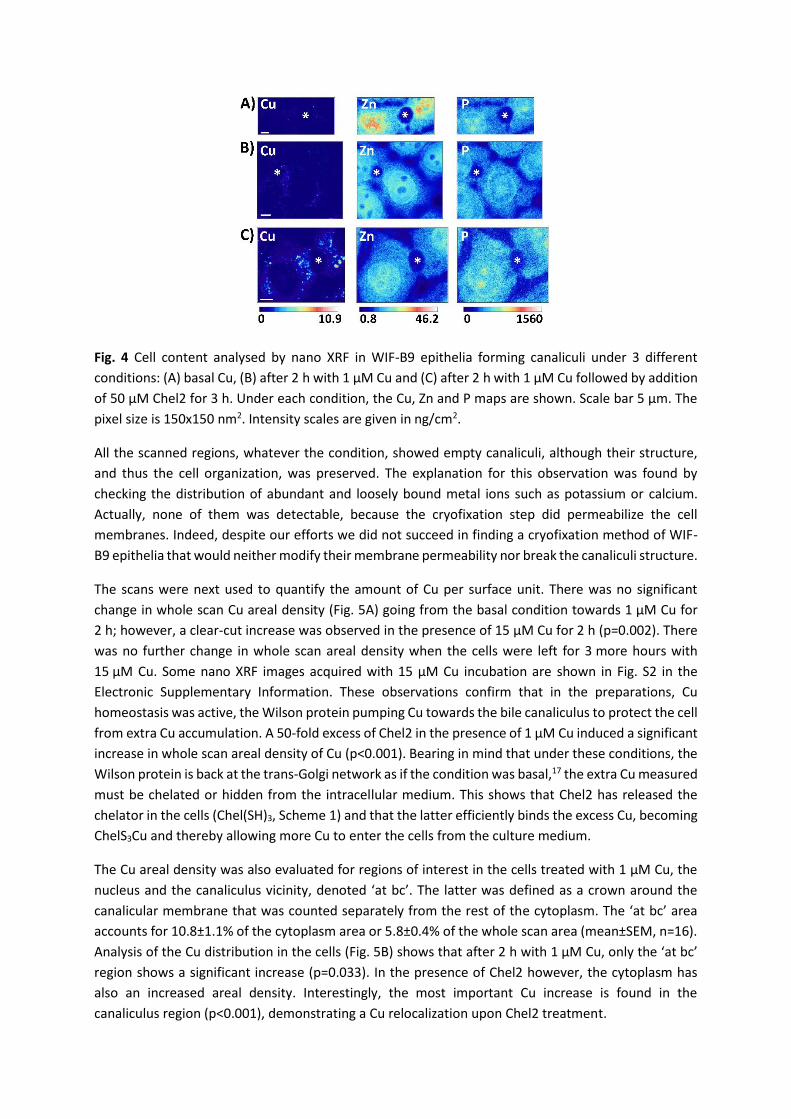
Fig. 4 Cell content analysed by nano XRF in WIF-B9 epithelia forming canaliculi under 3 different
conditions: (A) basal Cu, (B) after 2 h with 1 µM Cu and (C) after 2 h with 1 µM Cu followed by addition
of 50 µM Chel2 for 3 h. Under each condition, the Cu, Zn and P maps are shown. Scale bar 5 μm. The
pixel size is 150x150 nm2. Intensity scales are given in ng/cm2.
All the scanned regions, whatever the condition, showed empty canaliculi, although their structure,
and thus the cell organization, was preserved. The explanation for this observation was found by
checking the distribution of abundant and loosely bound metal ions such as potassium or calcium.
Actually, none of them was detectable, because the cryofixation step did permeabilize the cell
membranes. Indeed, despite our efforts we did not succeed in finding a cryofixation method of WIF-
B9 epithelia that would neither modify their membrane permeability nor break the canaliculi structure.
The scans were next used to quantify the amount of Cu per surface unit. There was no significant
change in whole scan Cu areal density (Fig. 5A) going from the basal condition towards 1 µM Cu for
2 h; however, a clear-cut increase was observed in the presence of 15 µM Cu for 2 h (p=0.002). There
was no further change in whole scan areal density when the cells were left for 3 more hours with
15 µM Cu. Some nano XRF images acquired with 15 µM Cu incubation are shown in Fig. S2 in the
Electronic Supplementary Information. These observations confirm that in the preparations, Cu
homeostasis was active, the Wilson protein pumping Cu towards the bile canaliculus to protect the cell
from extra Cu accumulation. A 50-fold excess of Chel2 in the presence of 1 µM Cu induced a significant
increase in whole scan areal density of Cu (p<0.001). Bearing in mind that under these conditions, the
Wilson protein is back at the trans-Golgi network as if the condition was basal,17 the extra Cu measured
must be chelated or hidden from the intracellular medium. This shows that Chel2 has released the
chelator in the cells (Chel(SH)3, Scheme 1) and that the latter efficiently binds the excess Cu, becoming
ChelS3Cu and thereby allowing more Cu to enter the cells from the culture medium.
The Cu areal density was also evaluated for regions of interest in the cells treated with 1 µM Cu, the
nucleus and the canaliculus vicinity, denoted ‘at bc’. The latter was defined as a crown around the
canalicular membrane that was counted separately from the rest of the cytoplasm. The ‘at bc’ area
accounts for 10.8±1.1% of the cytoplasm area or 5.8±0.4% of the whole scan area (mean±SEM, n=16).
Analysis of the Cu distribution in the cells (Fig. 5B) shows that after 2 h with 1 µM Cu, only the ‘at bc’
region shows a significant increase (p=0.033). In the presence of Chel2 however, the cytoplasm has
also an increased areal density. Interestingly, the most important Cu increase is found in the
canaliculus region (p<0.001), demonstrating a Cu relocalization upon Chel2 treatment.
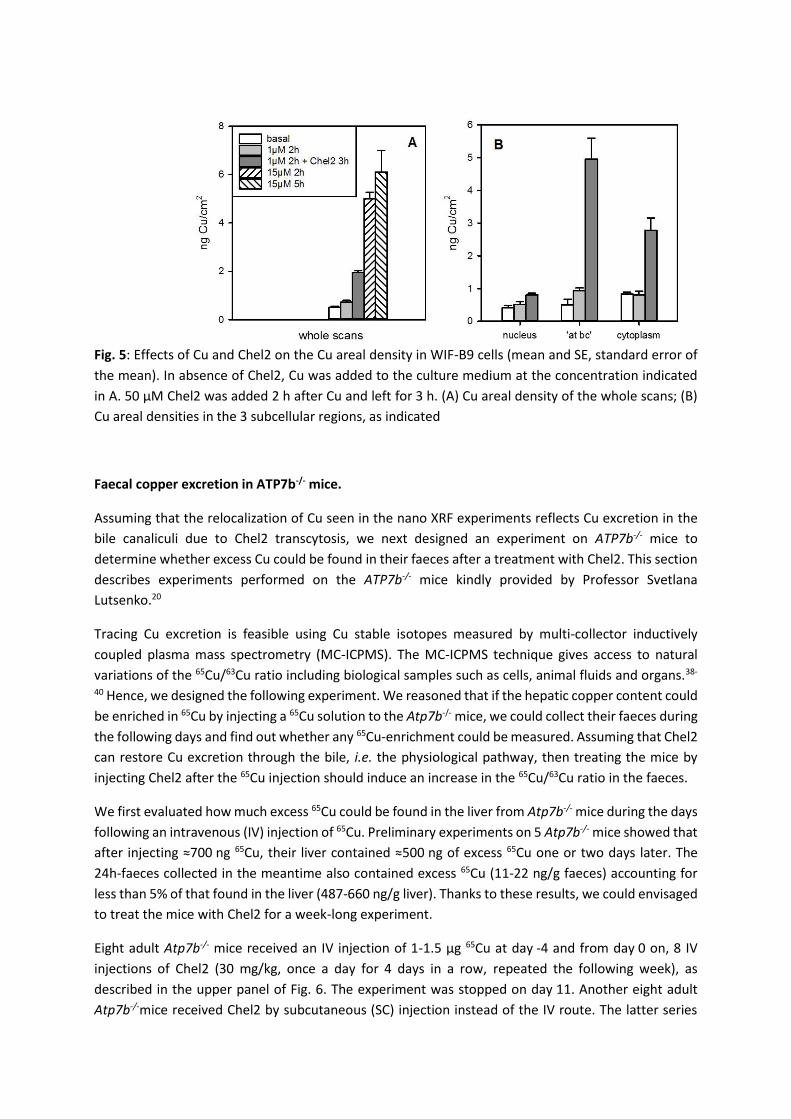
Fig. 5: Effects of Cu and Chel2 on the Cu areal density in WIF-B9 cells (mean and SE, standard error of
the mean). In absence of Chel2, Cu was added to the culture medium at the concentration indicated
in A. 50 µM Chel2 was added 2 h after Cu and left for 3 h. (A) Cu areal density of the whole scans; (B)
Cu areal densities in the 3 subcellular regions, as indicated
Faecal copper excretion in ATP7b-/- mice.
Assuming that the relocalization of Cu seen in the nano XRF experiments reflects Cu excretion in the
bile canaliculi due to Chel2 transcytosis, we next designed an experiment on ATP7b-/- mice to
determine whether excess Cu could be found in their faeces after a treatment with Chel2. This section
describes experiments performed on the ATP7b-/- mice kindly provided by Professor Svetlana
Lutsenko.20
Tracing Cu excretion is feasible using Cu stable isotopes measured by multi-collector inductively
coupled plasma mass spectrometry (MC-ICPMS). The MC-ICPMS technique gives access to natural
variations of the 65Cu/63Cu ratio including biological samples such as cells, animal fluids and organs.38-
40 Hence, we designed the following experiment. We reasoned that if the hepatic copper content could
be enriched in 65Cu by injecting a 65Cu solution to the Atp7b-/- mice, we could collect their faeces during
the following days and find out whether any 65Cu-enrichment could be measured. Assuming that Chel2
can restore Cu excretion through the bile, i.e. the physiological pathway, then treating the mice by
injecting Chel2 after the 65Cu injection should induce an increase in the 65Cu/63Cu ratio in the faeces.
We first evaluated how much excess 65Cu could be found in the liver from Atp7b-/- mice during the days
following an intravenous (IV) injection of 65Cu. Preliminary experiments on 5 Atp7b-/- mice showed that
after injecting ≈700 ng 65Cu, their liver contained ≈500 ng of excess 65Cu one or two days later. The
24h-faeces collected in the meantime also contained excess 65Cu (11-22 ng/g faeces) accounting for
less than 5% of that found in the liver (487-660 ng/g liver). Thanks to these results, we could envisaged
to treat the mice with Chel2 for a week-long experiment.
Eight adult Atp7b-/- mice received an IV injection of 1-1.5 µg 65Cu at day -4 and from day 0 on, 8 IV
injections of Chel2 (30 mg/kg, once a day for 4 days in a row, repeated the following week), as
described in the upper panel of Fig. 6. The experiment was stopped on day 11. Another eight adult
Atp7b-/-mice received Chel2 by subcutaneous (SC) injection instead of the IV route. The latter series

lasted only one week and was stopped at day 4. Two other groups of 4 Atp7b-/-mice were treated for
control experiments that were stopped at day 4. They received either one dose of 65Cu at day -4 and 4
injections of buffer instead of Chel2, or one injection of vehicle at day -4 and 4 injections of Chel2. The
faeces of all mice were collected every other day during treatment and at euthanasia, their liver was
removed for analysis.
The excess of 65Cu, denoted 65Cuxs from now on, reflects in all samples the effect of the 65Cu spike on
the isotopic Cu distribution. It is calculated by the difference between 65Cuspl, the 65Cu amount
measured in the sample and the natural 65Cu amount in the sample. The latter is calculated from 63Cuspl,
the 63Cu amount measured in the sample and rref, the natural 65Cu/63Cu ratio measured in the isotopic
standard NIST SRM 976 solution that always brackets the samples during the analysis.
Denoting rref = 65Curef / 63Curef and rspl = 65Cuspl / 63Cuspl, the isotopic ratio measured in the reference
solution and the sample, respectively and designating by Cut = 65Cuspl + 63Cuspl, the total Cu measured
in the sample, 65Cuxs is calculated as follows:
65Cuxs = (rspl - rref) 63Cuspl,
with 63Cuspl ( rspl + 1) = Cut,
and finally 65Cuxs = (rspl - rref) / (rspl + 1) Cut
The results are then expressed per unit of wet weight, ranging from 5 to 117 ng/g for the faeces and
from 0.1 to 1.4 µg/g for the liver. In the control experiment where the mice did not receive 65Cu, the
faeces contained 1.6 ng/g excess 65Cu (mean from 12 samples) and the 4 livers, -0.012 µg/g, showing
that rspl was not changed by the Chel2 treatment. In the other experiments where 65Cu was injected to
the mice, dividing 65Cuxs obtained in the faeces by 65Cuxs obtained in the liver allows to evaluate 65CuxsF,
the fraction of hepatic 65Cu excreted in the faeces, independently of individual variability. All the data
is shown in Fig. 6 in permil.

Fig. 6 Effect of Chel2 injections (starting at day 0, black arrows on top) on the fraction of hepatic 65Cu
excreted in the faeces of mice (65CuxsF in permil) following an IV injection of 65Cu at day -4 (red arrow).
() 4 mice received 4 IV injections of buffer from day 0 to day 4; () 7 mice received 8 IV injections of
Chel2 (30 mg/kg) from day 0 to day 10; () 8 mice received 4 SC injections of Chel2 (50 mg/kg) from
day 0 to day 4. On top, segments figure the 24-h faeces collections and black symbols, euthanasia.
Before any treatment, i.e. during the 24h-period following the 65Cu injection, excess of 65Cu was
evidenced in the faeces (see 65CuxsF at day -3 in Fig. 6). In the control group, after the first buffer
injection and thereafter, there was almost no more excess of 65Cu in each 24h-faeces sample and 65CuxsF
value was around 15‰. Bearing in mind that these mice do not excrete Cu from their liver, the
measured 65Cuxs value in the faeces at day -3 suggests the existence of an excretion pathway for Cu
from blood to faeces, crossing the intestinal epithelium. The existence of such a Cu-excretion pathway
has not been documented up to now. As a secondary excretion pathway appearing in the Atp7b-/- mice,
it could also reflect the role of non absorptive cells in the intestine.41
In the groups that received Chel2, either by IV or by SC injections, the fraction of hepatic 65Cu excreted
in the faeces was significantly higher than in the control group. The 65CuxsF values for each group are
pooled per day in Fig. S3 (mean and SEM). The IV-treated mice excretion was stable for the two weeks
of treatment with a value around 33‰, twice as much as the control mice. In the Chel2 SC-treated
animals, the excretion reached 45‰ at day 1 and tended to increase during the week of treatment.
The data collected from the different mice during the 4 days were pooled and submitted to statistical
analysis, which demonstrates that both 4-day treatments were more effective than the control
treatment, with a larger efficacy of the SC treatment with respect to the IV one: Chel2 IV-injections
33±4‰ (n=14) or Chel2 SC-injections 73±11‰ (n=16) vs buffer 15±2‰ (n=8) (p<0.001, t-test). When
Chel2 was given through IV injections for a second week, the effect on 65CuxsF was the same as during
the first week, suggesting that it was limited by the amount of Chel2 reaching the liver and the bile. As
a matter of fact, Chel2 is a highly hydrophilic compound, therefore expected to be rapidly cleared from
the serum. Altogether, the IV injections were probably limiting the amount of Chel2 reaching the liver
and crossing the hepatocytes. In contrast with the IV treatment, the SC injections were more effective
in excreting excess 65Cu from the liver, suggesting a more progressive delivery of Chel2 to the liver.

Discussion.
The mechanism of action of Chel2, the liver-targeting Cu(I) chelator, was studied in WIF-B9 cells that
reconstitute polarized epithelia with functional bile canaliculi. The relationship between Chel2 and Cu
localization and distribution in these cells could be inferred from fluorescence confocal microscopy
using the fluorescent derivative Chel2* and nano XRF, respectively.
For further discussion, we need to bear in mind that upon endocytosis in WIF-B9 cells, Chel2 releases
Chel(SH)3, the high affinity Cu(I) chelator. This was shown before, following the effect of Chel2 addition
to the culture medium in the presence of 1 µM Cu on the Wilson protein localization and it provided
the conditions used here for chelation (50 µM Chel2 + 1 µM Cu).17 We can therefore expect the same
for Chel2* (1 µM Chel2* + 1 µM Cu) which will also release the high affinity chelator. Therefore, we
assign to Chel*(SH)3 and Chel*S3Cu(I) the red spots in Fig. 2 and 3.
Asialoglycoprotein endocytosis in polarized WIF-B9 cells has been previously studied and a remarkable
feature is that the proteins pass through a subapical compartment that sorts them: some are sent to
the lysosomes for degradation and others are sent to the apical membrane for transcytosis.42 Using
the same route with Chel2* instead of a protein, however, shows that there is colocalization with
lysosomes and that red vesicles also concentrate around the canaliculi (Fig. 2). This suggests that after
reduction of Chel2*, some Chel*(SH)3 and Chel*S3Cu are trapped in non-lysosomal vesicles on their
way to exocytosis. Indeed, red fluorescence is seen in the middle of the canaliculus after 3 h (Fig. 3).
Interestingly enough, these subapical vesicles could also be the hot spots of Cu seen by XRF, which
would be full of ChelS3Cu, under the chelation conditions (50 µM Chel2, Fig. 4C).
Going back to the effect of 1 µM Cu for 2 h, we recall that under these conditions, ATP7B is found in
the canalicular membrane, where it pumps Cu out of the cell, into the bile canaliculus.17 According to
Nyasae et al.43 whose conclusions were derived from a similar polarized epithelium, we can assume
ATP7B to have left the trans-Golgi network in vesicles and trafficked to the canalicular membrane via
at first, basolateral endosomes and then, the subapical compartment. The same observation in Can-
10 hepatic cells,44 that are also able to reconstitute a polarized epithelium, suggests that in polarized
hepatic cells, proteins undergoing transcytosis and proteins meant to reach the apical membrane use
the same route and there is no such a secretory pathway from the Golgi to the apical membrane.
Therefore, we can assume that while being transported towards the canalicular membrane, ATP7B has
pumped Cu inside the vesicles. Hence, the hot spots of Cu that are seen in the cytoplasm of the cells
(Fig. 4B). In the presence of Chel2, endocytosis vesicles, that have a Cu transporter in their
membrane,45 are also able to accumulate Cu because Chel(SH)3 binds Cu(I) inside the vesicles, hence
creating a gradient for the Cu transporter. This will last until the basal “free” Cu concentration is
reached, when ATP7B will return to the trans-Golgi network. At that time, the canalicular region will
be full of subapical vesicles entrapping ChelS3Cu and ready for exocytosis. All these observations led
us to propose the mechanism shown in scheme 2 for Chel2 fate in hepatic cells and its relationship
with intracellular copper chelation. It can be described as follows: ① Chel2 binds to ASGPR and enters
the hepatocytes by basolateral or sinusoidal endocytosis, ② Chel(SH)3, the high affinity chelator, is
released from Chel2 by reduction with GSH in these vesicles, ③ChelS3Cu, the Cu(I) complex, is formed
in sinusoidal endocytic vesicles, ④ some vesicles fuse with lysosomes, while others become the
subapical compartment and ⑤ the latter spills its load into the canalicular lumen leading to Cu
excretion into the bile canaliculi.
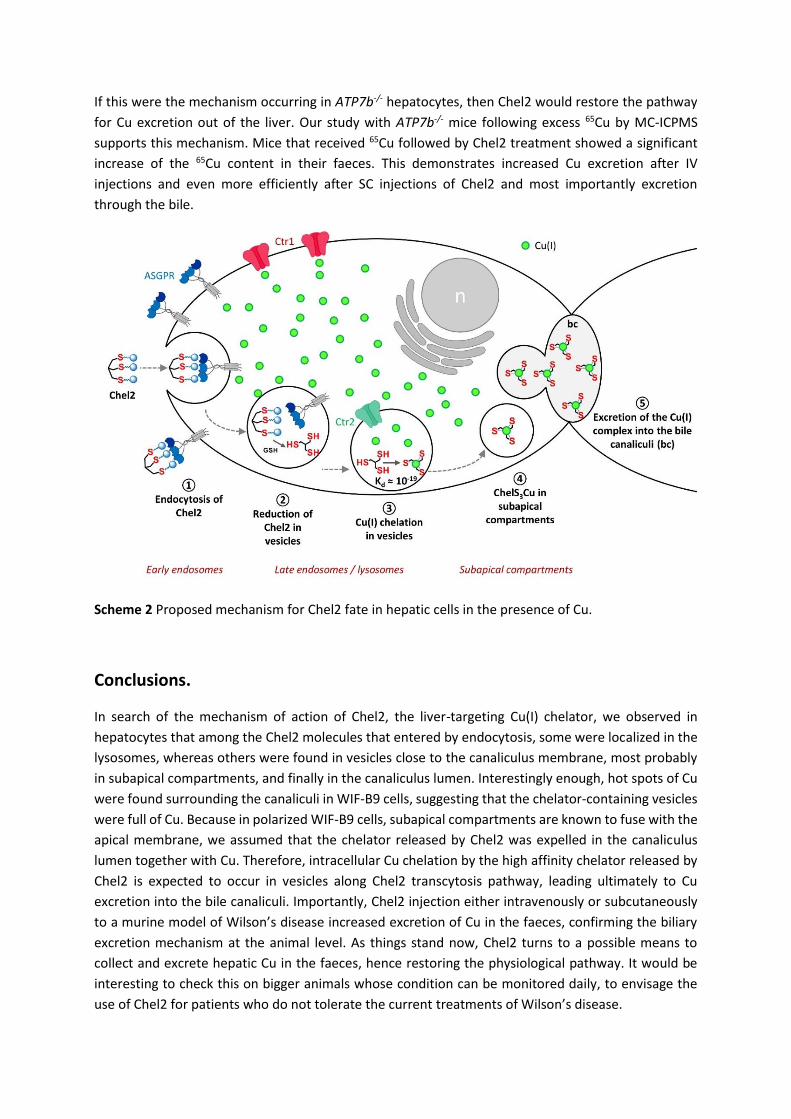
If this were the mechanism occurring in ATP7b-/- hepatocytes, then Chel2 would restore the pathway
for Cu excretion out of the liver. Our study with ATP7b-/- mice following excess 65Cu by MC-ICPMS
supports this mechanism. Mice that received 65Cu followed by Chel2 treatment showed a significant
increase of the 65Cu content in their faeces. This demonstrates increased Cu excretion after IV
injections and even more efficiently after SC injections of Chel2 and most importantly excretion
through the bile.
Scheme 2 Proposed mechanism for Chel2 fate in hepatic cells in the presence of Cu.
Conclusions.
In search of the mechanism of action of Chel2, the liver-targeting Cu(I) chelator, we observed in
hepatocytes that among the Chel2 molecules that entered by endocytosis, some were localized in the
lysosomes, whereas others were found in vesicles close to the canaliculus membrane, most probably
in subapical compartments, and finally in the canaliculus lumen. Interestingly enough, hot spots of Cu
were found surrounding the canaliculi in WIF-B9 cells, suggesting that the chelator-containing vesicles
were full of Cu. Because in polarized WIF-B9 cells, subapical compartments are known to fuse with the
apical membrane, we assumed that the chelator released by Chel2 was expelled in the canaliculus
lumen together with Cu. Therefore, intracellular Cu chelation by the high affinity chelator released by
Chel2 is expected to occur in vesicles along Chel2 transcytosis pathway, leading ultimately to Cu
excretion into the bile canaliculi. Importantly, Chel2 injection either intravenously or subcutaneously
to a murine model of Wilson’s disease increased excretion of Cu in the faeces, confirming the biliary
excretion mechanism at the animal level. As things stand now, Chel2 turns to a possible means to
collect and excrete hepatic Cu in the faeces, hence restoring the physiological pathway. It would be
interesting to check this on bigger animals whose condition can be monitored daily, to envisage the
use of Chel2 for patients who do not tolerate the current treatments of Wilson’s disease.

Acknowledgements
We thank Prof. Svetlana Lutsenko for providing the ATP7b-/- mice, Sandrine Miesch-Fremy for technical
support with the experiments on mice, Dr Michel Ferrand for fruitful discussions on the project and Dr
Michaud-Soret for critical reading of the manuscript. We acknowledge ESRF committees for providing
synchrotron radiation beamtime (proposal MD-714) and all the ID22 beamline staff for help during the
experiment. This research was supported by the French National Agency for Research in the framework
of the “Investissements d’avenir” Program (ANR-15-IDEX-02), the Labex ARCANE (ANR-11-LABX-003),
the CBH-EUR-GS (ANR-17-EURE-0003) and the grant “COPDETOX” (ANR-11-EMMA-025), the
“Fondation pour la Recherche Médicale” (grant DCM20111223043), the “Programme transversal du
CEA Technologies pour la santé” (WILCOP) and ADDMEDICA, the company that funded the
experiments with 65Cu on mice.
Notes and references
1. D. Strausak, J. F. Mercer, H. H. Dieter, W. Stremmel and G. Multhaup, Brain Res. Bull., 2001,
55, 175.
2. A. B. Piperno, F.; Bentivegna, A. (2005, Feb 17) [Updated 2020 Jan 9]. Juvenile
Hemochromatosis [Web page]. Barton, J.C.; Edwards, C.Q. (2000, Apr 3) [Updated 2018 Dec 6]. HFE
Hemochromatosis [Web page]. De Gobbi, M.; Roetto, A. (2005, Aug 29) [Updated 2018 Feb 15]. TFR2-
Related Hereditary Hemochromatosis [Web page]. Miyajima, H.; Hosoi, Y. (2003, Aug 12) [Updated
2018 Sep 27]. Aceruloplasminemia [Web page]. Tuschl, K.; Clayton, P.T.; Gospe, S.M. Jr et al. (2012,
Aug 30) [Updated 2017 Feb 9]. Dystonia/Parkinsonism, Hypermanganesemia, Polycythemia and
Chronic Liver Disease [Web page]. Weiss, K.H. (1999, Oct 22) [Updated 2016 Jul 29]. Wilson Disease
[Web page]. All retrieved February 9, 2020 from https://www.ncbi.nlm.nih.gov/books/NBK1116/
3. F. Woimant and J. M. Trocello, Handbook of clinical neurology, 2014, 120, 851.
4. S. Lutsenko, N. L. Barnes, M. Y. Bartee and O. Y. Dmitriev, Physiol. Rev., 2007, 87, 1011.
5. K. H. Weiss, J. Wurz, D. Gotthardt, U. Merle, W. Stremmel and J. Fullekrug, J. Anat., 2008, 213,
232.
6. J. M. Walshe, Mov. Disord., 2006, 21, 142.
7. J. M. Walshe, Mov. Disord., 2007, 22, 2216.
8. A. Stracciari, A. Tempestini, A. Borghi and M. Guarino, Arch. Neurol., 2000, 57, 384.
9. O. Guillaud, J. Dumortier, R. Sobesky, D. Debray, P. Wolf, C. Vanlemmens, F. Durand, Y. Calmus,
C. Duvoux, S. Dharancy, N. Kamar, K. Boudjema, P. H. Bernard, G. P. Pageaux, E. Salame, J. Gugenheim,
A. Lachaux, D. Habes, S. Radenne, J. Hardwigsen, O. Chazouilleres, J. M. Trocello, F. Woimant, P. Ichai,
S. Branchereau, O. Soubrane, D. Castaing, E. Jacquemin, D. Samuel and J. C. Duclos-Vallee, Journal of
hepatology, 2014, 60, 579.

10. C. Laurencin, A. S. Brunet, J. Dumortier, L. Lion-Francois, S. Thobois, J. Y. Mabrut, R. Dubois, F.
Woimant, A. Poujois, O. Guillaud, A. Lachaux and E. Broussolle, Eur. Neurol., 2017, 77, 5.
11. K. H. Weiss, F. Thurik, D. N. Gotthardt, M. Schafer, U. Teufel, F. Wiegand, U. Merle, D. Ferenci-
Foerster, A. Maieron, R. Stauber, H. Zoller, H. H. Schmidt, U. Reuner, H. Hefter, J. M. Trocello, R. H.
Houwen, P. Ferenci, W. Stremmel and E. Consortium, Clin. Gastroenterol. Hepatol., 2013, 11, 1028.
12. P. Delangle and E. Mintz, Dalton Trans., 2012, 41, 6359.
13. C. Gateau, E. Mintz and P. Delangle, in Ligand Design in Medicinal Inorganic Chemistry ed. T.
Storr, WILEY-BLACKWELL, 2014, pp. 287.
14. A. M. Pujol, M. Cuillel, O. Renaudet, C. Lebrun, P. Charbonnier, D. Cassio, C. Gateau, P. Dumy,
E. Mintz and P. Delangle, J. Am. Chem. Soc., 2011, 133, 286.
15. A. M. Pujol, C. Gateau, C. Lebrun and P. Delangle, J. Am. Chem. Soc., 2009, 131, 6928.
16. A. M. Pujol, C. Gateau, C. Lebrun and P. Delangle, Chem-Eur J, 2011, 17, 4418.
17. A. M. Pujol, M. Cuillel, A.-S. Jullien, C. Lebrun, D. Cassio, E. Mintz, C. Gateau and P. Delangle,
Angew. Chem., 2012, 51, 7445.
18. G. Ashwell and J. Harford, Annual review of biochemistry, 1982, 51, 531.
19. M. Monestier, P. Charbonnier, C. Gateau, M. Cuillel, F. Robert, C. Lebrun, E. Mintz, O. Renaudet
and P. Delangle, ChemBioChem, 2016, 17, 590.
20. O. I. Buiakova, J. Xu, S. Lutsenko, S. Zeitlin, K. Das, S. Das, B. M. Ross, C. Mekios, I. H. Scheinberg
and T. C. Gilliam, Hum. Mol. Genet., 1999, 8, 1665.
21. A.-S. Jullien, C. Gateau, I. Kieffer, D. Testemale and P. Delangle, Inorg. Chem., 2013, 52, 9954.
22. C. Decaens, P. Rodriguez, C. Bouchaud and D. Cassio, J. Cell. Sci., 1996, 109 ( Pt 6), 1623.
23. Y. Guo, L. Nyasae, L. T. Braiterman and A. L. Hubbard, Am. J. Physiol. Gastrointest. Liver Physiol.,
2005, 289, G904.
24. H. Roelofsen, H. Wolters, M. J. Van Luyn, N. Miura, F. Kuipers and R. J. Vonk, Gastroenterology,
2000, 119, 782.
25. M. Harada, H. Kumemura, S. Sakisaka, S. Shishido, E. Taniguchi, T. Kawaguchi, S. Hanada, H.
Koga, R. Kumashiro, T. Ueno, T. Suganuma, K. Furuta, M. Namba, T. Sugiyama and M. Sata, Int. J. Mol.
Med., 2003, 11, 293.
26. D. Huster, M. Hoppert, S. Lutsenko, J. Zinke, C. Lehmann, J. Mossner, F. Berr and K. Caca,
Gastroenterology, 2003, 124, 335.
27. M. A. Cater, J. Forbes, S. La Fontaine, D. Cox and J. F. Mercer, Biochem. J., 2004, 380, 805.
28. H. J. Geuze, J. W. Slot, G. J. Strous, H. F. Lodish and A. L. Schwartz, The Journal of cell biology,
1982, 92, 865.
29. G. Gregoriadis, A. G. Morell, I. Sternlieb and I. H. Scheinberg, The Journal of biological
chemistry, 1970, 245, 5833.
30. P. A. Charlwood, E. Regoeczi and M. W. Hatton, Biochimica et biophysica acta, 1979, 585, 61.
31. H. Tolleshaug, The International journal of biochemistry, 1981, 13, 45.
32. T. Tanabe, W. E. Pricer, Jr. and G. Ashwell, The Journal of biological chemistry, 1979, 254, 1038.
33. H. J. Geuze, J. W. Slot, G. J. Strous, H. F. Lodish and A. L. Schwartz, Cell, 1983, 32, 277.
34. S. C. Mueller and A. L. Hubbard, The Journal of cell biology, 1986, 102, 932.
35. P. Thomas and J. W. Summers, Biochemical and biophysical research communications, 1978,
80, 335.
36. T. M. Chang and C. H. Chang, Biochimica et biophysica acta, 1989, 1014, 229.
37. P. P. Breitfeld, C. F. Simmons, Jr., G. J. Strous, H. J. Geuze and A. L. Schwartz, International
review of cytology, 1985, 97, 47.
38. V. Balter, A. N. da Costa, V. P. Bondanese, K. Jaouen, A. Lamboux, S. Sangrajrang, N. Vincent,
F. Fourel, P. Telouk, M. Gigou, C. Lecuyer, P. Srivatanakul, C. Brechot, F. Albarede and P. Hainaut, Proc.
Natl. Acad. Sci. USA, 2015, 112, 982.
39. V. P. Bondanese, A. Lamboux, M. Simon, J. E. Lafont, E. Albalat, S. Pichat, J. M. Vanacker, P.
Telouk, V. Balter, P. Oger and F. Albarede, Metallomics, 2016, 8, 1177.
40. L. Sauzeat, E. Bernard, A. Perret-Liaudet, I. Quadrio, A. Vighetto, P. Krolak-Salmon, E.
Broussolle, P. Leblanc and V. Balter, iScience, 2018, 6, 264.
41. H. Pierson, H. J. Yang and S. Lutsenko, Annu. Rev. Nutrition, 2019, 39, 75.
42. G. Ihrke, G. V. Martin, M. R. Shanks, M. Schrader, T. A. Schroer and A. L. Hubbard, The Journal
of cell biology, 1998, 141, 115.
43. L. K. Nyasae, M. J. Schell and A. L. Hubbard, Traffic, 2014, 15, 1344.
44. V. Lalioti, R. Peiro, M. Perez-Berlanga, Y. Tsuchiya, A. Munoz, T. Villalba, C. Sanchez and I. V.
Sandoval, Journal of cell science, 2016, 129, 2190.
45. C. Y. Tsai, J. K. Liebig, I. F. Tsigelny and S. B. Howell, Metallomics, 2015, 7, 1477.
Copyright © 2022 FDOKUMEN