MeCP2/H3meK9 are involved in IL6 gene silencing in pancreatic adenocarcinoma cell lines
10
MeCP2/H3meK9 are involved in IL-6 gene silencing in pancreatic adenocarcinoma cell lines Mario Dandrea 1,2 , Massimo Donadelli 1 , Chiara Costanzo 1 , Aldo Scarpa 2 and Marta Palmieri 1, * 1 Department of Morphological and Biomedical Sciences, Section of Biochemistry and 2 Department of Pathology, University of Verona, Verona, Italy Received January 24, 2008; Revised August 11, 2009; Accepted August 16, 2009 ABSTRACT The aim of the present study was to analyse the molecular mechanisms involved in the Interleukin-6 (IL-6) silencing in pancreatic adenocarcinoma cell lines. Our results demonstrate that TNF-a, a major IL-6 inducer, is able to induce IL-6 only in three out of six cell lines examined. 5-aza-2 0 -deoxycytidine (DAC), but not trichostatin A (TSA), activates the expression of IL-6 in all cell lines, indicating that DNA methylation, but not histone deacetylation, plays an essential role in IL-6 silencing. Indeed, the IL-6 upstream region shows a methylation status that correlates with IL-6 expression and binds MeCP2 and H3meK9 only in the non-expressing cell lines. Our results suggest that critical methy- lations located from positions –666 to –426 relative to the transcription start site of IL-6 may act as binding sites for MeCP2. INTRODUCTION Interleukin-6 (IL-6) is a cytokine produced constitutively and/or under specific stimuli by almost all nucleated cells (1). Its biological role includes a wide range of activities, such as the regulation of the immune response, the acute- phase reaction, cell proliferation and differentiation, apoptosis and cell trafficking (1,2). All these activities may have a direct correlation to the pathogenesis of several diseases, including various types of cancers (3–5). Pancreatic adenocarcinoma is a very aggressive cancer, characterized by a high frequency of gene mutations (TP53, K-RAS, P16 and DPC4) (6) and alterations in the expression of secondary messengers involved in cancer pathogenesis (1). In pancreatic cancer, IL-6 deregulation has been associated with carcinogenesis, cell proliferation, angiogenesis, alteration in cell adhesion molecules and chemotaxis, and reduction of sensitivity to apoptosis (1,7,8). Transcriptional activation of IL-6 has been extensively studied (9–12), whereas the mechanisms involved in its repression remain largely unclarified (13–19). Epigenetic events, such as DNA methylation and histone modifications, play critical roles in gene silencing, which is a key event in both carcinogenesis and drug resistance (20,21). DNA methylation leads to transcriptional repression either by directly interfering with the binding of transcription factors or by the involvement of proteins that specifically recognize methylated CpGs (mCpGs) (22), the prototype of which is the methyl-CpG-binding protein 2 (MeCP2). Two independent, not mutually exclusive, mechanisms have been claimed for MeCP2 activities (23). In the enzymatic model, MeCP2 specifically targets mCpGs and determines repressive heterochromatin by interact- ing with the co-repressor mSin3A, which is part of a large complex containing histone deacetylases (HDACs) (24,25). MeCP2 can also recruit histone methyltrans- ferase that methylates local H3 lysine 9 strengthening the repressive state (26). In this model, repression may be partially or totally relieved by the HDAC inhibitor trichostatin A (TSA). The structural model, which is not affected by HDAC inhibitors, postulates the ability of MeCP2 to repress gene transcription by mechanisms of chromatin condensation independent of histone acetylation (23). In the present work, we have studied the molecular mechanisms leading to IL-6 repression in three non- expressing and three IL-6-expressing pancreatic adenocarcinoma cell lines. We demonstrate that in all cell lines the DNA methyltransferase inhibitor 5-aza-2 0 - deoxycytidine (DAC) induces IL-6 transcription, while the HDAC inhibitor TSA does not significantly modify IL-6 expression. Furthermore, we report that the IL-6 upstream region shows a methylation status that *To whom correspondence should be addressed. Tel: +39 045 8027169; Fax: +39 045 8027170; Email: [email protected] Published online 10 September 2009 Nucleic Acids Research, 2009, Vol. 37, No. 20 6681–6690 doi:10.1093/nar/gkp723 ß The Author(s) 2009. Published by Oxford University Press. This is an Open Access article distributed under the terms of the Creative Commons Attribution Non-Commercial License (http://creativecommons.org/licenses/ by-nc/2.5/uk/) which permits unrestricted non-commercial use, distribution, and reproduction in any medium, provided the original work is properly cited.
-
Upload
independent -
Category
Documents
-
view
0 -
download
0
Transcript of MeCP2/H3meK9 are involved in IL6 gene silencing in pancreatic adenocarcinoma cell lines

MeCP2/H3meK9 are involved in IL-6 gene silencingin pancreatic adenocarcinoma cell linesMario Dandrea1,2, Massimo Donadelli1, Chiara Costanzo1, Aldo Scarpa2 and
Marta Palmieri1,*
1Department of Morphological and Biomedical Sciences, Section of Biochemistry and 2Department of Pathology,University of Verona, Verona, Italy
Received January 24, 2008; Revised August 11, 2009; Accepted August 16, 2009
ABSTRACT
The aim of the present study was to analyse themolecular mechanisms involved in the Interleukin-6(IL-6) silencing in pancreatic adenocarcinoma celllines. Our results demonstrate that TNF-a, a majorIL-6 inducer, is able to induce IL-6 only in three outof six cell lines examined. 5-aza-20-deoxycytidine(DAC), but not trichostatin A (TSA), activates theexpression of IL-6 in all cell lines, indicating thatDNA methylation, but not histone deacetylation,plays an essential role in IL-6 silencing. Indeed, theIL-6 upstream region shows a methylation statusthat correlates with IL-6 expression and bindsMeCP2 and H3meK9 only in the non-expressingcell lines. Our results suggest that critical methy-lations located from positions –666 to –426 relativeto the transcription start site of IL-6 may act asbinding sites for MeCP2.
INTRODUCTION
Interleukin-6 (IL-6) is a cytokine produced constitutivelyand/or under specific stimuli by almost all nucleated cells(1). Its biological role includes a wide range of activities,such as the regulation of the immune response, the acute-phase reaction, cell proliferation and differentiation,apoptosis and cell trafficking (1,2). All these activitiesmay have a direct correlation to the pathogenesis ofseveral diseases, including various types of cancers (3–5).
Pancreatic adenocarcinoma is a very aggressive cancer,characterized by a high frequency of gene mutations(TP53, K-RAS, P16 and DPC4) (6) and alterations inthe expression of secondary messengers involved incancer pathogenesis (1). In pancreatic cancer, IL-6deregulation has been associated with carcinogenesis, cellproliferation, angiogenesis, alteration in cell adhesion
molecules and chemotaxis, and reduction of sensitivityto apoptosis (1,7,8).Transcriptional activation of IL-6 has been extensively
studied (9–12), whereas the mechanisms involved in itsrepression remain largely unclarified (13–19).Epigenetic events, such as DNA methylation and
histone modifications, play critical roles in genesilencing, which is a key event in both carcinogenesisand drug resistance (20,21). DNA methylation leads totranscriptional repression either by directly interferingwith the binding of transcription factors or by theinvolvement of proteins that specifically recognizemethylated CpGs (mCpGs) (22), the prototype ofwhich is the methyl-CpG-binding protein 2 (MeCP2).Two independent, not mutually exclusive, mechanismshave been claimed for MeCP2 activities (23). In theenzymatic model, MeCP2 specifically targets mCpGsand determines repressive heterochromatin by interact-ing with the co-repressor mSin3A, which is part of alarge complex containing histone deacetylases (HDACs)(24,25). MeCP2 can also recruit histone methyltrans-ferase that methylates local H3 lysine 9 strengtheningthe repressive state (26). In this model, repression maybe partially or totally relieved by the HDAC inhibitortrichostatin A (TSA). The structural model, whichis not affected by HDAC inhibitors, postulates theability of MeCP2 to repress gene transcription bymechanisms of chromatin condensation independent ofhistone acetylation (23).In the present work, we have studied the molecular
mechanisms leading to IL-6 repression in three non-expressing and three IL-6-expressing pancreaticadenocarcinoma cell lines. We demonstrate that in allcell lines the DNA methyltransferase inhibitor 5-aza-20-deoxycytidine (DAC) induces IL-6 transcription, whilethe HDAC inhibitor TSA does not significantly modifyIL-6 expression. Furthermore, we report that the IL-6upstream region shows a methylation status that
*To whom correspondence should be addressed. Tel: +39 045 8027169; Fax: +39 045 8027170; Email: [email protected]
Published online 10 September 2009 Nucleic Acids Research, 2009, Vol. 37, No. 20 6681–6690doi:10.1093/nar/gkp723
� The Author(s) 2009. Published by Oxford University Press.This is an Open Access article distributed under the terms of the Creative Commons Attribution Non-Commercial License (http://creativecommons.org/licenses/by-nc/2.5/uk/) which permits unrestricted non-commercial use, distribution, and reproduction in any medium, provided the original work is properly cited.
correlates with IL-6 expression and binds MeCP2 andH3meK9 only in the non-expressing cell lines.
MATERIALS AND METHODS
Reagents
TSA and DAC were purchased from Sigma (Sigma–Aldrich), solubilized in DMSO and stored at �80�Cuntil use. TNF-a (PeproTech, Calbiochem) wassolubilized in PBS/1% BSA. Sodium bisulphite wasobtained from Sigma–Aldrich.
Cell lines
Six human pancreatic adenocarcinoma cell lines, PaCa44,CFPAC1, PT45P1, PC, HPAFII and Panc1 [Moore et al.(6) for genetic characterization and primary tissue source],were grown in RPMI 1640 supplemented with 10% FBSand 50 mg/ml gentamicin sulphate (BioWhittaker), andwere incubated at 37�C with 5% CO2. All cell lines wereroutinely screened for mycoplasma contamination byPCR analysis.
RNA extraction and northern blot analysis
Total RNA from 5� 106 cells was extracted by TRIzolReagent (Invitrogen) according to the manufacturer’sinstructions. Cells were treated with TNF-a (5 ng/ml) for1 h. Ten micrograms of denaturated RNA was separatedby electrophoresis in 1% agarose gel containing 5% form-aldehyde and 20mM 3-[N-morpholino]propanesulphonicacid (MOPS) and was transferred onto nylon membranes(Hybond-N, Amersham-Pharmacia Biotech.) in 10� SSC.The membranes were hybridized overnight at 65�C witha 32P-labelled IL-6 cDNA probe (DECAprimeII kit,Ambion) in a solution containing 7% SDS, 1% BSA,1mM EDTA and 50% NaH2PO4. Filters were coldwashed twice with a solution containing 5% SDS, 0.5%BSA, 1mM EDTA and 4% NaH2PO4, then twice at65�C with a pre-warmed solution containing 1% SDS,1mM EDTA and 4% NaH2PO4. Specific mRNAswere detected and quantified by scanning the filters inthe PhosphorImager (Molecular Dynamics) usingImageQuant software (ACHS).
IL-6 enzyme-linked immunosorbent assay
Cells were seeded in 96-well microtiter plates (4� 103 cells/well) and treated for 24 h with TNF-a (5 ng/ml). Culturesupernatants were assayed for IL-6 production byPREDICTATM kit (Genzyme diagnostic) according tothe manufacturer’s instructions.
Nuclear extracts and electrophoretic mobility shift assay
Nuclear extracts were prepared according to Osborn et al.(27) from 5� 106 cells treated with TNF-a (5 ng/ml) for30min and/or DAC (2.5 mM) for 72 h and/or TSA(300 nM) for the last 8 h. Protein concentration wasmeasured by the Coomassie Protein Assay Reagent(Pierce), using BSA as a standard. Binding reactionswere carried out using 10 mg of nuclear proteinextracts in a binding buffer containing 20mM Hepes
(pH 7.5), 50mM KCl, 0.5mM DTT, 0.1mM EDTA,10% glycerol and 2 mg Poly(dI-dC) (Amersham).Radiolabelled probe (0.02 pmol; sp.act 3� 106 cpm/pmol) was added last to each reaction mix, and sampleswere incubated at room temperature for 30 minutes.In competition assays, a 200-fold molar excess of colddouble-stranded oligonucleotides was added to thereaction mix. Samples were run on 5% (30 : 1.2) nativepolyacrylamide gel in 0.5� TBE, dried, detected andquantified by scanning the filters in the PhosphorImager(Molecular Dynamics) using ImageQuant software(ACHS). The oligonucleotide sequences used were 50-AATGTGGGATTTTCCCATG-30 for IL-6-NF-kB and 50-CTCAACCCCCAATAAATAT-30 for IL-6-C/EBP. Theformation of specific complexes was previously establishedby using specific antibodies.
Plasmid constructs and transient transfections
The reporter constructs p4xNF-kB-LUC and p4xC/EBP-LUC were obtained by cloning four tandem repeats ofNF-kB or C/EBP binding sites of the IL-6 promoterinto the pGL Promoter vector (Promega). The pIL-6(�592) construct was obtained by inserting the MscI/XhoI fragment of the human IL-6 promoter into thepGL Basic vector (Promega). All plasmids were amplifiedin dam� bacterial strains. 2.5� 105 cells/well were seededin 6-well plates. Twenty-four hours later, transfectionswere carried out with FuGENE 6 Transfection Reagent(Roche) keeping a transfection reagent:DNA ratio of 3:2.TNF-a (5 ng/ml) stimulation was carried out 18 h later.Twenty-four hours after transfection, reporter geneactivity was determined by Luciferase Assay System(Promega) according to the manufacturer’s instructions.
When DAC treatment was performed, cells were seededin a six-well plate at a density of 1.5� 105 cells/well andDAC (2.5 mM) was added after 24 h. Forty-eight hourslater, the pIL-6(�592) vector was transfected withFuGENE 6 Transfection Reagent. Twenty-four hoursafter transfection, reporter gene activity was determinedby Luciferase Assay System.
In each transfection, 0.2 mg of pSV�gal was added, andthe luciferase activity was normalized with respect to the�-galactosidase activity.
RT–PCR
Total RNA was extracted as described above. Onemicrogram of total RNA was reverse-transcribed byFirst Strand cDNA Synthesis (Invitrogen) in a finalvolume of 20 ml. One microlitre of cDNA was used forPCR amplification. The sequences of the primers were asfollows: IL6 forward 50-CTTCTCCACAAGCGCCTTCG-30; IL6 reverse 50-TACTCTTGTTACATGTCTCC-30;�-ACTIN forward 50-ACCAACTGGGACGACATGGAGAA-30; �-ACTIN reverse 50-TGGTGGTGAAGCTGTAGCC-30. PCR conditions included 25–40 cycles(depending on cell lines and genes) at 94�C for 1min,58�C for 1min and 72�C for 30 s, and a final extensionat 72�C for 4min. �-ACTIN was used as an internalstandard to evaluate the relative expression levels of
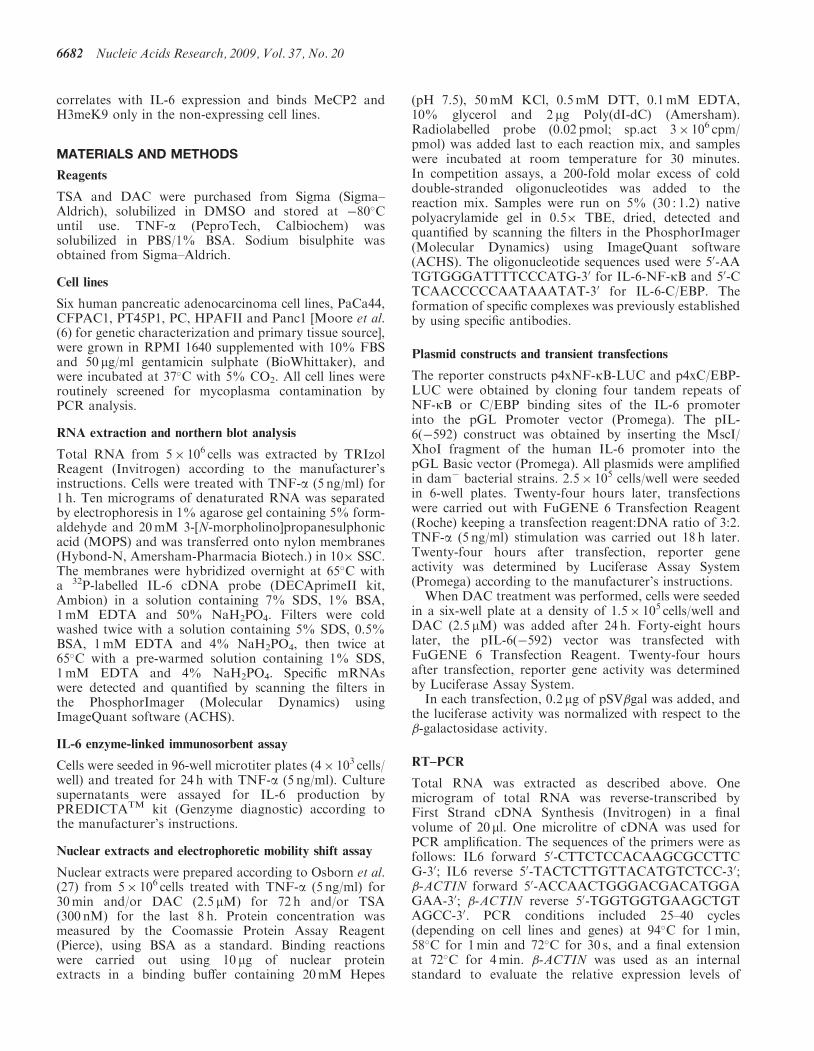
6682 Nucleic Acids Research, 2009, Vol. 37, No. 20

IL-6. PCR products were separated by electrophoresis in1.5% agarose gel and stained with ethidium bromide.
DNA methylation analysis
The DNA methylation status was analysed by bisulphitegenomic sequencing (BGS). Genomic DNA was extractedfrom cultured cells by Wizard Genomic DNA PurificationKit (Promega) and used for bisulphite treatment per-formed with EZ DNA Methylation-Gold kit (ZymoResearch, Orange, California) according to the manufac-turer’s instructions.
Fifty nanograms of each modified DNA was amplifiedby PCR from �1150 to +50 with respect to the IL-6transcriptional start site.
PCR products were separated by electrophoresis in1.5% agarose gel stained with ethidium bromide,excised, cleaned by Qiagen Gel Extraction Kit (Qiagen)and used for pyrosequencing analysis. The pyrose-quencing service was offered by EpigenDx Inc(Worcester, Massachusetts). The assay design packageincluding primer sequences and PCR conditions is avail-able on request.
Chromatin immunoprecipitation assays.
Chromatin immunoprecipitation (ChIP) assays wereperformed using the EpiQuik TM ChromatinImmunoprecipitation Kit (Epigentek) according to themanufacturer’s instructions. Briefly, DMSO (control),TNF-a-, DAC- or TNF-a/DAC-treated cells were fixedusing 1% formaldehyde at room temperature for 10min.Cells were washed twice in ice-cold PBS, resuspended inSDS lysis buffer and sonicated until crosslinked chromatinwas sheared to an average DNA fragment molecularlength of 300–500 bp. Five per cent of the sonicatedlysate was used to quantify the total amount of DNApresent in different samples before immunoprecipitation(inputs). Chromatin preparations were immunopre-cipitated using antibodies anti-RNA polymerase II(PolII), anti-histone H4 acetylated (H4Ac, UpstateBiotechnology), anti–dimethylhistone H3 (Lys9)(H3meK9, Upstate Biotechnology), anti-methyl-CpG-binding protein 2 (MeCP2, Abcam) and a non-specificantibody (IgG). Non-immunoprecipitated samples(NoAb) were used as negative controls. Precipitatedcomplexes were bound to Protein A Agarose, washedand then eluted in 1% SDS/0.1M NaHCO3.Crosslinking between DNA and proteins was reversedby heating the samples at 65�C for 15min, followed byProteinase K digestion at 65�C for 1.5 h. After cleaning onspin columns, DNA was eluted in 20 ml of 10 mM Tris–EDTA. Four microlitres of ChIP-DNA was analysedusing Brilliant� SYBR� Green QPCR Master Mix(Stratagene, La Jolla, CA, USA) and the StratageneMx3005PTM QPCR System. qPCR was performed in trip-licate with primers for IL-6, �-ACTIN and the humanchromosome 16 centromere region (16CEN).
The sequences of the primers used for �-ACTIN and16CEN were: �-ACTIN For 50-CTGCGCATAGCAGACATACAA-30 and �-ACTIN Rev 50-CTGGGCTTGAGAGGTAGAGTG-30; 16CEN For 50-GTCTCTTTCTTG
TTTTTAAGCTGGG-30 and 16CEN Rev 50-TGAGCTCATTGAGACATTTGG-30. The sequences of the sixprimer pairs used for IL-6 were: IL6-1 For 50-GGGCTTCTGAACCAGCTTGA-30 and IL6-1 Rev 50-CAGGCACGGCTCTAGGCTC-30; IL6-2 For 50-AAGATGCCACAAGGTCCTCCT-30 and IL6-2 Rev 50-CCACTTGGTTCAGGGCAGA-30; IL6-3 For 50-CAGCAGCCAACCTCCTCTAAGT-30 and IL6-3 Rev 50-CAAGGCGTCTCCAGGTGG-30; IL6-4 For 50-AGGATGGCCAGGCAGTTCTA-30 and IL6-4 Rev 50-AAGCCTGGGATTATGAAGAAGGTA-30; IL6-5 For 50-TGCATGACTTCAGCTTTACTC-30 and IL6-5 Rev 50-GCAGAACCACTCTTCCTTTAC-30; IL6-6 For 50-ACCGGGAACGAAAGAGAAGC-30 and IL6-6 Rev 50-CTGGCAGTTCCAGGGCTAAG-30. The following cycling conditions were used:10min at 95�C, 40 cycles at 95�C for 30 s, 65�C for1min and 72�C for 30 s. The average of cycle threshold(CT) of each triplicate was analysed according to the2(���Ct) method. For each cell line in each condition,the result of the NoAb sample was subtracted fromthose of the IgG, PolII, H4Ac, MeCP2 and H3MeK9samples. The resulting data were divided by their corre-sponding input DNA and finally plotted in a scale inwhich the final value of IgG was arbitrarily set to 1.
RESULTS
IL-6 expression in human pancreatic adenocarcinomacell lines
We analysed IL-6 expression in six human pancreaticadenocarcinoma cell lines treated with TNF-a for 1 h.The presence of IL-6 mRNA was evaluated by northernblot analysis. Figure 1A shows that mRNA IL-6 was con-stitutively expressed in three of the cell lines examined(PaCa44, CFPAC1 and PT45P1), and its level was
BA
0
50
100
150
200
250
300
350
950
1000
CFP
AC
1
PaC
a44
PT45
P1
HPA
F IIPC
Panc
1
Control
TNF-
0
25
50
75
100
125
700
800
900
IL-6
(pg
/ml)
Control
TNF-
CFP
AC
1
PaC
a44
PT45
P1
HPA
F IIPC
Panc
1IL-6
mR
NA
nor
mal
ized
to
-AC
TIN
Figure 1. IL-6 expression in human pancreatic adenocarcinoma celllines. (A) Cells were incubated in the absence or presence of TNF-afor 1 h. IL-6 induction was evaluated by northern blot analysis per-formed as described in ‘Materials and Methods’ section. The expressionof �-ACTIN was used as an internal control. (B) Cells were incubatedin the absence or presence of TNF-a for 24 h. Culture supernatantsfrom untreated and treated cells were assayed for IL-6 production asdescribed in ‘Materials and Methods’ section. The results are themeans±SE of three independent experiments.
Nucleic Acids Research, 2009, Vol. 37, No. 20 6683

increased in response to TNF-a. PC, HPAFII and Panc1cells exhibited neither basal nor TNF-a-induced expres-sion of IL-6 (Figure 1A). Consistent with the data ofgene expression, IL-6 was constitutively present inPaCa44, CFPAC1 and PT45P1 cell lines and significantlyincreased after 24 h of TNF-a treatment (Figure 1B). Incontrast, no IL-6 was detected in PC, HPAFII and Panc1cells both in the absence and in the presence of TNF-a.
NF-iB and C/EBP DNA binding activity and theirfunctional role
To verify whether the absence of IL-6 production wasdue to alterations in the transcriptional machinery,we analysed the DNA binding activities of NF-kB andC/EBP, the main transcription factors for IL-6 promoteractivation. Electrophoretic mobility shift assays (EMSAs)performed with the IL-6-NF-kB oligonucleotide as aprobe showed the formation of specific and TNF-a-inducible DNA-protein complexes in all cell lines(Figure 2A: lanes 1, 2 and 9). EMSAs performed withthe IL-6-C/EBP oligonucleotide showed specific DNA-protein complexes constitutive and non-inducible byTNF-a (Figure 2B: lanes 1, 2 and 9). To determinewhether NF-kB and C/EBP were functionally active, wecarried out transfection assays with the reporter constructs
p4xNF-kB-LUC and p4xC/EBP-LUC, containing fourtandem repeats of the NF-kB or C/EBP binding sites ofthe IL-6 promoter. In all cell lines, transfections with bothconstructs produced a strong activation of the luciferasegene following TNF-a induction (Figure 3), indicatingthat either in non-expressing or in IL-6-expressing celllines TNF-a signalling and NF-kB and C/EBP trans-criptional activities were similarly functional.
IL-6 regulation by DAC and/or TSA treatments
To study the involvement of epigenetic events in the IL-6silencing in pancreatic cell lines, we examined IL-6 mRNAexpression by RT–PCR analyses following treatmentswith DAC and/or TSA. Cells were treated with DAC(2.5 mM) for 72 h and/or TSA (300 nM) for the last 8 h.The time of TSA and DAC treatments was chosen on thebasis of our published results (28,29) and preliminaryexperiments aimed to obtain the highest IL-6 mRNAlevel and the most direct effects of TSA and DAC.Figure 4A shows that TSA did not significantly modifyIL-6 expression, while DAC was able to induce IL-6mRNA both in non-expressing and in IL-6-expressingcell lines. The association TSA/DAC did not furtherincrease the level of DAC-induced IL-6 mRNA. It isworth to note that a very different number of PCRcycles between the two groups of cell lines was necessaryto obtain a similar signal. Enzyme-linked immunosorbentassay (ELISA) confirmed that DAC, but not TSA, enablesPC, HPAFII and Panc1 cell lines to secrete detectablelevels of IL-6 (data not shown). To rule out the possibilitythat DAC indirectly induces IL-6, we performedtransfection experiments with the unmethylated pIL-6(�592) luciferase reporter plasmid in the absence orpresence of DAC. No significant difference in luciferase
Figure 2. NF-kB and C/EBP DNA binding activity. Cells were treatedas described in ‘Materials and Methods’ section and cell extracts wereanalysed by EMSAs using (A) the IL-6-NF-kB or (B) the IL-6-C/EBPoligonucleotides, as probes. Lanes: (1) uninduced; (2) TNF-a; (3) TSA;(4) DAC; (5) TNF-a +TSA; (6) TNF-a+DAC; (7) TSA+DAC; (8)TNF-a+TSA+DAC; (9) specific competitor. The arrows indicatespecific complexes.
3000
2000
1000
0
PaC
a44
Pan
c1
HP
AF
IIPC
PT
45P
1
CF
PA
C1
RL
U
4x NF-κB
4x NF-κB+TNF-α
4x C/EBP
4x C/EBP+TNF-α
Figure 3. NF-kB and C/EBP transcriptional activity. Cell lines weretransfected with the plasmids p4xNF-kB-LUC and p4xC/EBP-LUCobtained by cloning four tandem repeats of NF-kB or C/EBPbinding sites of the IL-6 promoter into the pGL Promoter vector.TNF-a (5 ng/ml) stimulation was carried out 18 h later. Twenty-fourhours after transfection, luciferase gene activity was normalized withrespect to the b-galactosidase activity (RLU). The results are themeans±SE of three independent experiments.
6684 Nucleic Acids Research, 2009, Vol. 37, No. 20

activity between untreated and DAC-treated cells wasobserved (Figure 4B).
Methylation pattern of the IL-6 upstream region
To verify whether DAC activates IL-6 expression byepigenetic mechanisms, we examined by BGS (bisulphitegenomic sequencing) the methylation profile of the IL-6upstream region spanning from positions �1099 to +26and containing 22 CpGs (Figure 5A). Figure 5B showsthat the CpG methylation pattern correlated with IL-6expression (Figure 1). To evidence the relation betweenthe levels of methylation and gene expression, we clusteredthe CpGs into five groups (I, II, III, IV and V) and wesummarized the methylation levels in four ranges, asindicated in the figure. Group I was highly methylatedin all cell lines, while groups II and III presented differentsites of methylation exclusively in the non-expressing celllines; remarkably, only position �426 was methylatedin all three non-expressing cell lines. Groups IV and Vwere methylated in two non-expressing cell lines, PCand PANC1, and in Paca44, the least IL-6-expressing
cell line. These results strongly suggest that the IL-6-inducing activity of DAC in the non-expressing cell linesdepends on directly removing specific mCpGs locatedbetween positions �666 and �426 and responsible fortranscriptional repression.
ChIP analysis of the IL-6 upstream region
To verify whether the differentially methylated IL-6upstream region could bind MeCP2 and/or H3meK9, weperformed ChIP analysis. Figure 6A shows the pattern ofbinding of RNA polymerase II, acetylated histone H4,methylated histone H3 and MeCP2 on the upstreamregion of IL-6 and �-ACTIN and on 16CEN, in anIL-6-expressing (CFPAC1) and a non-expressing (PC)cell line. While in CFPAC1 cells the pattern of bindingon IL-6 was similar to that of �-ACTIN, in PC cells, itcorresponded to that of 16CEN in control and TNF-a-treated cells. Interestingly, following DAC or TNF-a/DAC treatments, the pattern of binding on IL-6 becamesimilar to that of �-ACTIN also in PC cells. Results com-parable to those shown for each representative cell line
IL-6 -ACTIN
CFPAC1
PaCa44
PT45P1
HPAF II
PC
Panc1
- TSA DACTSADAC - TSA DAC
TSADAC
27 c
ycle
s40
cyc
les
25 c
ycle
s
0
20
40
60
80
100
120
PaCa44
CFPAC1
PT45P1
PC
HPAFII
PANC1
% r
elat
ive
to c
ontr
ols
A
B
Figure 4. IL-6 expression following treatment with DAC or TSA. (A) Cells were treated with DAC (2.5 mM) for 72 h and/or TSA (300 nM) for thelast 8 h. Cell extracts and RT–PCR analyses were performed as described in ‘Materials and Methods’ section. The expression of �-ACTIN was usedas an internal control. A representative experiment is reported. (B) Cell lines were transfected with the pIL-6(–592) plasmid. Twenty-four hours aftertransfection, cells were treated with DAC (2.5 mM) for 24 h. Luciferase gene activity was normalized with respect to the b-galactosidase activity andexpressed as percentage relative to controls. The results are the means±SE of three independent experiments.
Nucleic Acids Research, 2009, Vol. 37, No. 20 6685

were obtained with the other cell lines (data not shown).Figure 6B shows the pattern of binding of RNApolymerase II, acetylated histone H4, methylated histoneH3 and MeCP2 on the upstream region of IL-6 in all celllines following treatment with TNF-a and/or DAC.H3meK9 and MeCP2 were present only in the threenon-expressing cell lines and disappeared after DAC treat-ment, while H4Ac was present in all cell lines in theabsence or presence of treatments. To finely identify thesequence that allows the recruitment of MeCP2/H3meK9on the 50-flanking region of IL-6, we performed ChIP
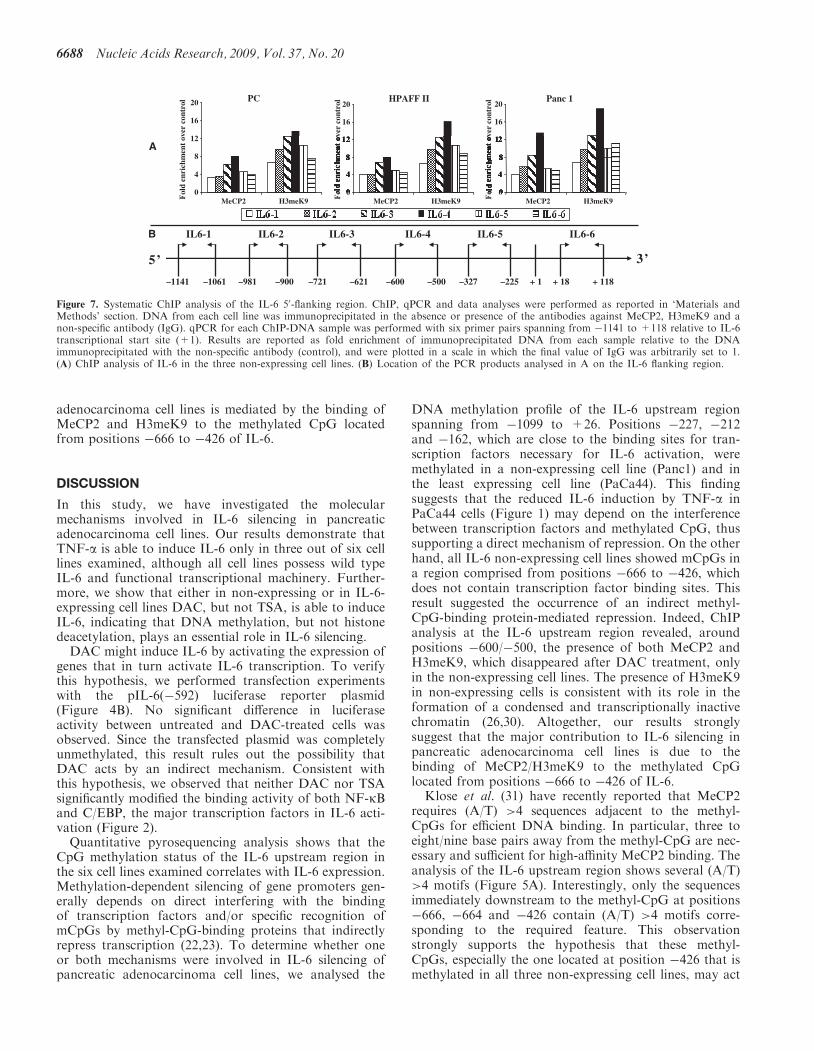
assays with a more systematic quantitative RT–PCRanalysis using six sets of primers located from �1141 to+118. Figure 7 shows that the peak of MeCP2/H3meK9binding was obtained with the primer set amplifying theregion located from �600 to �500. This finding indicatesthat in IL-6 non-expressing cell lines MeCP2/H3meK9binds at the 50-flanking region of IL-6 around positions�600/�500. Together with the observation that DAC isable to induce IL-6 mRNA (Figure 4) and preventMeCP2/H3meK9 binding (Figure 6B), these datastrongly suggest that IL-6 repression in pancreatic
+1
PaCa44
CFPAC1
Panc1
PC
PT45P1
HPAFII
Methylation ranges
*
VIIIIII IV
0–25% 25–50% 50–75% 75–100%
IL-6expression
+
+
+
–
–
–
MeCP2binding
+
+
+
–
–
–
CpGsposition
–1099 –1096 –1094 –1069 –1061 –1057 –1001 –666 –664 –628 –610 –574 –491 –426 –329 –227 –162 –118–212 +11 +20 +26
A
B
Figure 5. Schematic map of the methylation status of the IL-6 upstream region. (A) Sequence of the IL-6 upstream region. CpGs are underlined and(A/T)> 4 motifs are marked with shaded boxes. (B) Numbers at the top of the squares represent the position of 22 consecutive CpGs located from�1099 to +26 respect to IL-6 transcriptional start site. CpGs are clustered into five groups (I, II, III, IV and V) and methylation levels arerepresented by four ranges, as indicated at the bottom of the figure. Asterisk indicates the presence of a G to T mutation.
6686 Nucleic Acids Research, 2009, Vol. 37, No. 20

PC (control)
02468
1012141618
Fol
d e
nri
chm
ent
over
con
trol
PC (DAC)
0
2
4
6
8
10
12
14
Fold
enr
ichm
ent o
ver
cont
rol
PC (TNFα)
02468
10121416
Fold
enr
ichm
ent o
ver
cont
rol
PC (TNFα + DAC)
0
2
4
6
8
10
12Fo
ld e
nric
hmen
t ove
r co
ntro
l
CFPAC (control)
16CENACTBIL-6 16CENACTBIL-6
16CENACTBIL-6
16CENACTBIL-6
16CENACTBIL-6
16CENACTBIL-6
16CENACTBIL-6
16CENACTBIL-6
02468
101214161820
Fol
d en
rich
men
t ov
er c
ontr
olCFPAC (TNFα)
02468
1012141618
Fold
enr
ichm
ent o
ver
cont
rol
CFPAC (DAC)
0
2
4
6
8
10
12
14
Fold
enr
ichm
ent o
ver
cont
rol
CFPAC (TNFα + DAC)
02468
10121416
Fold
enr
ichm
ent o
ver
cont
rol
IL-6 (control)
H3meK9MeCP2H4AcPolII H3meK9MeCP2H4AcPolII
H3meK9MeCP2H4AcPolII H3meK9MeCP2H4AcPolII
IL-6 (DAC)
IL-6 (TNFα)
IL-6 (TNFα + DAC)
A
B
Figure 6. ChIP analysis. ChIP, qPCR and data analyses were performed as reported in ‘Materials and Methods’ section. DNA from each cell line ineach condition (control, TNF-a, DAC TNF-a/DAC) was immunoprecipitated in the absence or presence of the antibodies against PolII, H4Ac,H3meK9, MeCP2 and a non-specific antibody (IgG). qPCR for each ChIP-DNA sample was performed for IL-6, �-ACTIN and 16CEN. Results arereported as fold enrichment of immunoprecipitated DNA from each sample relative to the DNA immunoprecipitated with the non-specific antibody(control), and were plotted in a scale in which the final value of IgG was arbitrarily set to 1. (A) ChIP analysis of IL-6, �-ACTIN and 16CEN in tworepresentative cell lines, an IL-6-expressing (CFPAC1) and a non-expressing (PC) cell line. (B) ChIP analysis of IL-6 in all six cell lines performedwith IL6-5 primer pairs.
Nucleic Acids Research, 2009, Vol. 37, No. 20 6687
adenocarcinoma cell lines is mediated by the binding ofMeCP2 and H3meK9 to the methylated CpG locatedfrom positions �666 to �426 of IL-6.
DISCUSSION
In this study, we have investigated the molecularmechanisms involved in IL-6 silencing in pancreaticadenocarcinoma cell lines. Our results demonstrate thatTNF-a is able to induce IL-6 only in three out of six celllines examined, although all cell lines possess wild typeIL-6 and functional transcriptional machinery. Further-more, we show that either in non-expressing or in IL-6-expressing cell lines DAC, but not TSA, is able to induceIL-6, indicating that DNA methylation, but not histonedeacetylation, plays an essential role in IL-6 silencing.DAC might induce IL-6 by activating the expression of
genes that in turn activate IL-6 transcription. To verifythis hypothesis, we performed transfection experimentswith the pIL-6(�592) luciferase reporter plasmid(Figure 4B). No significant difference in luciferaseactivity between untreated and DAC-treated cells wasobserved. Since the transfected plasmid was completelyunmethylated, this result rules out the possibility thatDAC acts by an indirect mechanism. Consistent withthis hypothesis, we observed that neither DAC nor TSAsignificantly modified the binding activity of both NF-kBand C/EBP, the major transcription factors in IL-6 acti-vation (Figure 2).Quantitative pyrosequencing analysis shows that the
CpG methylation status of the IL-6 upstream region inthe six cell lines examined correlates with IL-6 expression.Methylation-dependent silencing of gene promoters gen-erally depends on direct interfering with the bindingof transcription factors and/or specific recognition ofmCpGs by methyl-CpG-binding proteins that indirectlyrepress transcription (22,23). To determine whether oneor both mechanisms were involved in IL-6 silencing ofpancreatic adenocarcinoma cell lines, we analysed the
DNA methylation profile of the IL-6 upstream regionspanning from �1099 to +26. Positions �227, �212and �162, which are close to the binding sites for tran-scription factors necessary for IL-6 activation, weremethylated in a non-expressing cell line (Panc1) and inthe least expressing cell line (PaCa44). This findingsuggests that the reduced IL-6 induction by TNF-a inPaCa44 cells (Figure 1) may depend on the interferencebetween transcription factors and methylated CpG, thussupporting a direct mechanism of repression. On the otherhand, all IL-6 non-expressing cell lines showed mCpGs ina region comprised from positions �666 to �426, whichdoes not contain transcription factor binding sites. Thisresult suggested the occurrence of an indirect methyl-CpG-binding protein-mediated repression. Indeed, ChIPanalysis at the IL-6 upstream region revealed, aroundpositions �600/�500, the presence of both MeCP2 andH3meK9, which disappeared after DAC treatment, onlyin the non-expressing cell lines. The presence of H3meK9in non-expressing cells is consistent with its role in theformation of a condensed and transcriptionally inactivechromatin (26,30). Altogether, our results stronglysuggest that the major contribution to IL-6 silencing inpancreatic adenocarcinoma cell lines is due to thebinding of MeCP2/H3meK9 to the methylated CpGlocated from positions �666 to �426 of IL-6.
Klose et al. (31) have recently reported that MeCP2requires (A/T) >4 sequences adjacent to the methyl-CpGs for efficient DNA binding. In particular, three toeight/nine base pairs away from the methyl-CpG are nec-essary and sufficient for high-affinity MeCP2 binding. Theanalysis of the IL-6 upstream region shows several (A/T)>4 motifs (Figure 5A). Interestingly, only the sequencesimmediately downstream to the methyl-CpG at positions�666, �664 and �426 contain (A/T) >4 motifs corre-sponding to the required feature. This observationstrongly supports the hypothesis that these methyl-CpGs, especially the one located at position �426 that ismethylated in all three non-expressing cell lines, may act
PC
0
4
8
12
16
20
MeCP2 H3meK9Fol
d en
rich
men
t ov
er c
ontr
ol HPAFF II
0
4
8
12
16
20
MeCP2 H3meK9Fol
d en
rich
men
t ov
er c
ontr
ol Panc 1
0
4
8
12
16
20
MeCP2 H3meK9Fol
d en
rich
men
t ov
er c
ontr
ol
B
A
+ 1–1141 –1061 –981 –900 –721 –621 –600 –500 –327 –225 + 18 + 118
’3’5
IL6-1 IL6-2 IL6-3 IL6-4 IL6-5 IL6-6
Figure 7. Systematic ChIP analysis of the IL-6 50-flanking region. ChIP, qPCR and data analyses were performed as reported in ‘Materials andMethods’ section. DNA from each cell line was immunoprecipitated in the absence or presence of the antibodies against MeCP2, H3meK9 and anon-specific antibody (IgG). qPCR for each ChIP-DNA sample was performed with six primer pairs spanning from �1141 to +118 relative to IL-6transcriptional start site (+1). Results are reported as fold enrichment of immunoprecipitated DNA from each sample relative to the DNAimmunoprecipitated with the non-specific antibody (control), and were plotted in a scale in which the final value of IgG was arbitrarily set to 1.(A) ChIP analysis of IL-6 in the three non-expressing cell lines. (B) Location of the PCR products analysed in A on the IL-6 flanking region.
6688 Nucleic Acids Research, 2009, Vol. 37, No. 20
as binding sites for MeCP2. Nevertheless, we cannotrule out the possibility that MeCP2 binds unmethylatedDNA of the IL-6 upstream region through the connec-tion to faraway DNA sequences via still unknownmechanisms (32).
In the expressing cell lines, IL-6 induction by DAC,which is lower than that observed in the non-expressingcell lines, may depend on the demethylation of the IL-6regions localized upstream to position �1001. We supposethat in these cell lines DAC treatment is able to improvethe accessibility of the already transcriptionally active IL-6promoter and to increase the constitutive IL-6 expression.
The methylation at any given site of the IL-6 regiondownstream to position �666 appears to be incomplete,as indicated by the different percentage of the methylationlevel (Figure 5B). This finding suggests allelic/cellular het-erogeneity and is consistent with results already reportedby other authors (33,34).
In conclusion, we have presented the first evidence of anMeCP2/H3meK9-mediated epigenetic mechanism leadingto IL-6 silencing.
ACKNOWLEDGEMENT
The authors thank Dr Ilaria Mazzon for her technicalsupport and helpful comments.
FUNDING
Fondazione Giorgio Zanotto, Verona, Italy; AssociazioneItaliana Ricerca sul Cancro, Milan, Italy; Italian Ministryof University and Research. Funding for open accesscharge: University of Verona.
Conflict of interest statement. None declared.
REFERENCES
1. Feurino,L.W., Fisher,W.E., Bharadwaj,U., Yao,Q., Chen,C. andLi,M. (2006) Current update of cytokines in pancreatic cancer:pathogenic mechanisms, clinical indication, and therapeutic values.Cancer Invest., 24, 696–703.
2. Hodge,D.R., Hurt,E.M. and Farrar,W.L. (2005) The role of IL-6and STAT3 in inflammation and cancer. Eur. J. Cancer, 41,2502–2512.
3. Bellone,G., Smirne,C., Mauri,F.A., Tonel,E., Carbone,A.,Buffolino,A., Dughera,L., Robecchi,A., Pirisi,M. and Emanuelli,G.(2006) Cytokine expression profile in human pancreatic carcinomacells and in surgical specimens: implications for survival. CancerImmunol. Immunother., 55, 684–698.
4. Ishihara,K. and Hirano,T. (2002) IL-6 in autoimmune disease andchronic inflammatory proliferative disease. Cytokine Growth FactorRev., 13, 357–368.
5. Heinrich,P.C., Behrmann,I., Haan,S., Hermanns,H.M., Muller-Newen,G. and Schaper,F. (2003) Principles of interleukin (IL)-6-type cytokine signalling and its regulation. Biochem. J., 374, 1–20.
6. Moore,P.S., Sipos,B., Orlandini,S., Sorio,C., Real,F.X.,Lemoine,N.R., Gress,T., Bassi,C., Kloppel,G., Kalthoff,H. et al.(2001) Genetic profile of 22 pancreatic carcinoma cell lines.Analysis of K-ras, p53, p16 and DPC4/Smad4. Virchows Arch., 439,798–802.
7. Feurino,L.W., Zhang,Y., Bharadwaj,U., Zhang,R., Li,F.,Fisher,W.E., Brunicardi,F.C., Chen,C., Yao,Q. and Li,M. (2007)IL-6 Stimulates Th2 Type Cytokine Secretion and Upregulates
VEGF and NRP-1 Expression in Pancreatic Cancer Cells.Cancer Biol. Ther., 6, 1096–1100.
8. ten Kate,M., Hofland,L.J., van Koetsveld,P.M., Jeekel,J. andvan Eijck,C.H. (2006) Pro-inflammatory cytokines affect pancreaticcarcinoma cell. Endothelial cell interactions. Jop, 7, 454–464.
9. Merola,M., Blanchard,B. and Tovey,M.G. (1996) The kappa Benhancer of the human interleukin-6 promoter is necessary andsufficient to confer an IL-1 beta and TNF-alpha response intransfected human cell lines: requirement for members of theC/EBP family for activity. J. Interferon Cytokine Res., 16, 783–798.
10. Akira,S. and Kishimoto,T. (1997) NF-IL6 and NF-kappa B incytokine gene regulation. Adv. Immunol., 65, 1–46.
11. Vanden Berghe,W., Vermeulen,L., De Wilde,G., De Bosscher,K.,Boone,E. and Haegeman,G. (2000) Signal transduction by tumornecrosis factor and gene regulation of the inflammatory cytokineinterleukin-6. Biochem. Pharmacol., 60, 1185–1195.
12. Faggioli,L., Merola,M., Hiscott,J., Furia,A., Monese,R., Tovey,M.and Palmieri,M. (1997) Molecular mechanisms regulating inductionof interleukin-6 gene transcription by interferon-gamma. Eur. J.Immunol., 27, 3022–3030.
13. Plaisance,S., Vanden Berghe,W., Boone,E., Fiers,W. andHaegeman,G. (1997) Recombination signal sequence bindingprotein Jkappa is constitutively bound to the NF-kappaB site of theinterleukin-6 promoter and acts as a negative regulatory factor.Mol. Cell Biol., 17, 3733–3743.
14. Armenante,F., Merola,M., Furia,A. and Palmieri,M. (1999)Repression of the IL-6 gene is associated with hypermethylation.Biochem. Biophys. Res. Commun., 258, 644–647.
15. Armenante,F., Merola,M., Furia,A., Tovey,M. and Palmieri,M.(1999) Interleukin-6 repression is associated with a distinctivechromatin structure of the gene. Nucleic Acids Res., 27, 4483–4490.
16. Palmieri,M., Sasso,M.P., Monese,R., Merola,M., Faggioli,L.,Tovey,M. and Furia,A. (1999) Interaction of the nuclear proteinCBF1 with the kappaB site of the IL-6 gene promoter. NucleicAcids Res., 27, 2785–2791.
17. Gerlo,S., Haegeman,G. and Vanden Berghe,W. (2008)Transcriptional regulation of autocrine IL-6 expression in multiplemyeloma cells. Cell Signal., 20, 1489–1496.
18. Kannabiran,C., Zeng,X. and Vales,L.D. (1997) The mammaliantranscriptional repressor RBP (CBF1) regulates interleukin-6 geneexpression. Mol. Cell Biol., 17, 1–9.
19. Vales,L.D. and Friedl,E.M. (2002) Binding of C/EBP and RBP(CBF1) to overlapping sites regulates interleukin-6 gene expression.J. Biol. Chem., 277, 42438–42446.
20. Ballestar,E. and Wolffe,A.P. (2001) Methyl-CpG-binding proteins.Targeting specific gene repression. Eur. J. Biochem., 268, 1–6.
21. Sansom,O.J., Maddison,K. and Clarke,A.R. (2007) Mechanisms ofdisease: methyl-binding domain proteins as potential therapeutictargets in cancer. Nat. Clin. Pract. Oncol., 4, 305–315.
22. Bird,A. (2002) DNA methylation patterns and epigenetic memory.Genes Dev., 16, 6–21.
23. Bowen,N.J., Palmer,M.B. and Wade,P.A. (2004) Chromosomalregulation by MeCP2: structural and enzymatic considerations. CellMol. Life Sci., 61, 2163–2167.
24. Nan,X., Campoy,F.J. and Bird,A. (1997) MeCP2 is atranscriptional repressor with abundant binding sites in genomicchromatin. Cell, 88, 471–481.
25. Nan,X., Ng,H.H., Johnson,C.A., Laherty,C.D., Turner,B.M.,Eisenman,R.N. and Bird,A. (1998) Transcriptional repression bythe methyl-CpG-binding protein MeCP2 involves a histonedeacetylase complex. Nature, 393, 386–389.
26. Fuks,F., Hurd,P.J., Wolf,D., Nan,X., Bird,A.P. and Kouzarides,T.(2003) The methyl-CpG-binding protein MeCP2 links DNAmethylation to histone methylation. J. Biol. Chem., 278, 4035–4040.
27. Osborn,L., Kunkel,S. and Nabel,G.J. (1989) Tumor necrosis factoralpha and interleukin 1 stimulate the human immunodeficiencyvirus enhancer by activation of the nuclear factor kappa B.Proc. Natl Acad. Sci. USA, 86, 2336–2340.
28. Moore,P.S., Barbi,S., Donadelli,M., Costanzo,C., Bassi,C.,Palmieri,M. and Scarpa,A. (2004) Gene expression profiling aftertreatment with the histone deacetylase inhibitor trichostatin Areveals altered expression of both pro- and anti-apoptotic genesin pancreatic adenocarcinoma cells. Biochim. Biophys. Acta., 1693,167–176.
Nucleic Acids Research, 2009, Vol. 37, No. 20 6689

29. Missiaglia,E., Donadelli,M., Palmieri,M., Crnogorac-Jurcevic,T.,Scarpa,A. and Lemoine,N.R. (2005) Growth delay of humanpancreatic cancer cells by methylase inhibitor 5-aza-20-deoxycytidinetreatment is associated with activation of the interferon signallingpathway. Oncogene, 24, 199–211.
30. Nakagawachi,T., Soejima,H., Urano,T., Zhao,W., Higashimoto,K.,Satoh,Y., Matsukura,S., Kudo,S., Kitajima,Y., Harada,H. et al.(2003) Silencing effect of CpG island hypermethylation and histonemodifications on O6-methylguanine-DNA methyltransferase(MGMT) gene expression in human cancer. Oncogene, 22,8835–8844.
31. Klose,R.J., Sarraf,S.A., Schmiedeberg,L., McDermott,S.M.,Stancheva,I. and Bird,A.P. (2005) DNA binding selectivity of
MeCP2 due to a requirement for A/T sequences adjacent tomethyl-CpG. Mol. Cell, 19, 667–678.
32. Nikitina,T., Shi,X., Ghosh,R.P., Horowitz-Scherer,R.A.,Hansen,J.C. and Woodcock,C.L. (2007) Multiple modes ofinteraction between the methylated DNA binding protein MeCP2and chromatin. Mol. Cell Biol., 27, 864–877.
33. Danam,R.P., Howell,S.R., Remack,J.S. and Brent,T.P. (2001)Heterogeneous methylation of the O(6)-methylguanine-DNAmethyltransferase promoter in immortalized IMR90 cell lines.Int. J. Oncol., 18, 1187–1193.
34. Qian,X.C. and Brent,T.P. (1997) Methylation hot spots in the 50
flanking region denote silencing of the O6-methylguanine-DNAmethyltransferase gene. Cancer Res., 57, 3672–3677.
6690 Nucleic Acids Research, 2009, Vol. 37, No. 20