Type I Interferon Production of Plasmacytoid Dendritic Cells ...
Upload
khangminh22Category
view
0download
0
Citation: Ackerman, E.E.; Weaver,
J.J.A.; Shoemaker, J.E. Mathematical
Modeling Finds Disparate Interferon
Production Rates Drive
Strain-Specific Immunodynamics
during Deadly Influenza Infection.
Viruses 2022, 14, 906. https://
doi.org/10.3390/v14050906
Academic Editors: Amber M. Smith
and Ruian Ke
Received: 18 January 2022
Accepted: 23 April 2022
Published: 27 April 2022
Publisher’s Note: MDPI stays neutral
with regard to jurisdictional claims in
published maps and institutional affil-
iations.
Copyright: © 2022 by the authors.
Licensee MDPI, Basel, Switzerland.
This article is an open access article
distributed under the terms and
conditions of the Creative Commons
Attribution (CC BY) license (https://
creativecommons.org/licenses/by/
4.0/).
viruses
Article
Mathematical Modeling Finds Disparate Interferon ProductionRates Drive Strain-Specific Immunodynamics during DeadlyInfluenza InfectionEmily E. Ackerman 1,†, Jordan J. A. Weaver 1,† and Jason E. Shoemaker 1,2,3,*
1 Department of Chemical & Petroleum Engineering, University of Pittsburgh, Pittsburgh, PA 15260, USA;[email protected] (E.E.A.); [email protected] (J.J.A.W.)
2 McGowan Institute for Regenerative Medicine, University of Pittsburgh, Pittsburgh, PA 15260, USA3 Department of Computational and Systems Biology, University of Pittsburgh, Pittsburgh, PA 15260, USA* Correspondence: [email protected]† These authors contributed equally to this work.
Abstract: The timing and magnitude of the immune response (i.e., the immunodynamics) associatedwith the early innate immune response to viral infection display distinct trends across influenzaA virus subtypes in vivo. Evidence shows that the timing of the type-I interferon response andthe overall magnitude of immune cell infiltration are both correlated with more severe outcomes.However, the mechanisms driving the distinct immunodynamics between infections of different virusstrains (strain-specific immunodynamics) remain unclear. Here, computational modeling and strain-specific immunologic data are used to identify the immune interactions that differ in mice infectedwith low-pathogenic H1N1 or high-pathogenic H5N1 influenza viruses. Computational explorationof free parameters between strains suggests that the production rate of interferon is the major driverof strain-specific immune responses observed in vivo, and points towards the relationship betweenthe viral load and lung epithelial interferon production as the main source of variance betweeninfection outcomes. A greater understanding of the contributors to strain-specific immunodynamicscan be utilized in future efforts aimed at treatment development to improve clinical outcomes ofhigh-pathogenic viral strains.
Keywords: viral strains; ODE modeling; systems biology
1. Introduction
Infections with different influenza A viruses reveal distinct trends in the observedtiming and magnitude of immune system dynamics, which correlate to the severity ofclinical outcomes [1]. Seasonal influenza viruses, usually of the H1N1 subtype, cause~700,000 hospitalizations and ~56,000 deaths in the US annually [2]. Occasionally, highpathogenic subtypes emerge, which can result in deadly, worldwide pandemics such asthe 1918 Spanish Flu and 1968 Flu pandemics. Of particular concern is the threat thatavian H5N1 influenza viruses pose to public health [3]. An estimated 60% of human H5N1infections end in death, the majority of which unexpectedly occur in those under the age of65 [4]. Infections with H5N1 viruses are characterized by higher viral loads, longer viralclearance times, and increased levels of inflammation and tissue damage in comparisonwith low-pathogenic influenza viruses [5].
Although it remains unclear how H5N1 and other highly pathogenic viruses inducea more severe inflammatory response, there are several potential explanations. One pos-sibility is that H5N1 viruses replicate more quickly, and that observed differences in theimmune response are driven primarily by the viral replication rate [6]. Another possibilityis that H5N1 viruses may antagonize the immune system differently during the earlystages of infection. A specific candidate mechanism involves the influenza virus’ nonstruc-tural protein 1 (NS1). NS1 is well-established as an antagonist of intracellular immune
Viruses 2022, 14, 906. https://doi.org/10.3390/v14050906 https://www.mdpi.com/journal/viruses

Viruses 2022, 14, 906 2 of 17
signaling through the inhibition of retinoic acid-inducible gene I (RIG-I) activity, whichleads to a delayed type-I interferon response [7,8]. By introducing mutations to the NS1protein, some studies have shown that the NS1 protein of H5N1 viruses may more stronglyantagonize cellular antiviral responses [9,10]. Another factor that may contribute to theH5N1 virus’ enhanced pathogenicity is that H5N1 can more readily infect lung residentmacrophages, though there is conflicting evidence on whether infected macrophages leadto enhanced inflammation [11] or not [12]. Given the many factors contributing to H5N1′spathogenicity, there is an opportunity to use dynamical mathematical modeling to analyzetime-course infection data and identify the processes (factors) that differ between infectionswith different viruses.
Dynamic mathematical models have been used to better understand the mecha-nisms driving in vitro and in vivo immunodynamics observed during influenza infection(see [13,14] for reviews of some relevant models). To date, most mathematical models ofinfluenza infection consist of ordinary differential equations (ODEs) that systematicallylink virus replication and the availability of host target cells (cells that can be infected) tointracellular immune signaling (interferon responses) and/or immune cell activity. Thesemodels have been used to explore a variety of areas: to provide possible explanations as towhy a double peak in the viral load may be observed [15], to prioritize therapeutic targetsto optimally reduce inflammation while controlling viral load [15–18], to provide evidencethat interferon paracrine signaling is the primary factor regulating hypercytokinemia [19],and to determine why viral titers rebound during bacterial co-infection [20]. Separately,agent-based models (ABMs), a rule-based approach that treats each cell as an individualentity while considering spatial effects and stochasticity, have been used to reveal theoptimal experimental conditions for examining infection-induced interferon production,to quantify the benefits of noisy intracellular immune signaling [21], and to elucidatethe effect of spatial aspects on infection outcomes [22]. An engineering-based approachthat employed a reduced ODE model of virus replication, and treated measurements ofkey immune factors as system inputs, suggested that increased levels of interferon-α/βpromoted slower viral growth, and limited immune cell stimulation in aged mice [23].As in these previous studies, mathematical modeling is a knowledge-driven, integrativeapproach well-suited to explore the regulatory mechanisms responsible for the differencesobserved between mild and severe influenza infections.
To elucidate the biological mechanisms that contribute to the distinct immunody-namics observed between H1N1 and H5N1 influenza virus infections, we developedmechanism-based, dynamic mathematical models of the innate immune response,and performed several parameterizations to identify the biological processes (parameters)that are most likely to be differentially regulated between the two infections. The modelparameters were fit to viral load and immunologic data from mice that had been infectedwith either an H1N1 or H5N1 virus. Comparing model fits to the data using the AkaikeInformation Criteria (AIC) suggests that the optimal model is achieved when the parameterrepresentative of the production rate of interferon is distinct between the two infections.Using parameterization to test the contribution of macrophage activity in interferon pro-duction and viral suppression reveals that the inclusion of these mechanisms negativelyimpacts model quality. In total, this modeling-based approach determines that the distinctrate of interferon induction in H5N1 infections is the most likely candidate mechanism forexplaining the distinctive immune response observed in H5N1 infections.
2. Materials and Methods2.1. Model Development Rationale and Equations
Studies have established that many innate immune processes are differentially regu-lated in mild and severe influenza infections [24–29]. As such, we focused on developingsimple models of the early immune response. We first describe the relevant immunology,and then describe how virus replication and innate immunity are mathematically modeled.

Viruses 2022, 14, 906 3 of 17
Lung epithelial cells, as well as lung-resident innate immune cells (i.e., macrophagesand neutrophils), display pattern recognition receptors to detect viral RNA at the site ofinfection [30,31]. Pattern-recognition toll-like receptors 7 and 9 (TLR7/9) [32], retinoicacid-inducible gene I (RIG-I) [33], and the pro-inflammatory NF-kB [34] pathway work inconcert to activate the type-I interferon response [8]. These pattern recognition receptors areantagonized by the invading virus to strain-specific degrees [35,36]. Interferons induce thetranscription of interferon-stimulated genes (ISGs) that are responsible for establishing anantiviral state in the cells near infected cells [37], and activating several components of theimmune system. Studies suggest that the timing of the type-I interferon response is key inlimiting viral replication and recruiting an appropriate pro-inflammatory response [38–40].Induction of interferon production is also partially responsible for regulating the activityof innate immune cells such as macrophages and neutrophils. The precise role of theseimmune cells in viral clearance is still debated: though macrophages can engage in severalinflammatory processes [41] and are important for enhancing interferon induction [42], theymay also be targeted for infection by highly pathogenic viruses such as H5N1 influenza,altering their overall activity [11,12].
A three-state ODE model, referred to as Model 1, was developed using the immuno-logical knowledge of the early innate immune response to a primary influenza A virusinfection (i.e., the animal’s first exposure, no antibodies for the virus present) describedabove (See Section 3 for a schematic of the model contained in Equations (1)–(3)). The unitsof each state (V, I, and M) are discussed in Section 2.2.
dVdt
= rV,VV(
1− VKV,V
)− rV,IV I − rV,MV M− dVV (1)
dIdt
= rI,VV + rI,M M− dI I (2)
dMdt
=r M,I In
K M,I + In − dM M (3)
Virus production is modeled in Equation (1). V, the concentration of virus in lungtissue, is modeled as logistic growth with a constant of proportionality, rV,V, and a carryingcapacity, KV,V. This form of virus production was selected over target-cell-based modelingapproaches because data concerning the number of available target cells in the lung are notavailable, limiting the viability and accuracy of training a model. The effect of interferon-regulated inhibition of virus replication is modeled using mass action kinetics, where rV,Iis the corresponding rate constant. The inhibition of virus production via macrophage isalso modeled with mass-action kinetics, where rV,M is the rate constant. Virus degrades at arate, dV.
Type-I interferon production is modeled by Equation (2), where I is the concentration ofinterferon in the lung. Interferon is produced at a rate, rI,V, relative to viral load, and decaysat rate, dI. Upregulation of interferon production via macrophages was modeled as a first-order mass-action kinetic with a rate, rI,M.
Macrophage production is modeled in Equation (3), where M is the number ofmacrophages in the lung. Interferon induction of macrophage production is modeledusing a Hill kinetic with a production rate, rM,I, and an apparent dissociation constant,KM,I. Instead of the classic interpretation of the Hill coefficient, n, as cooperativity in ligandbinding [43], it can be interpreted in this context as an activation threshold representingthe threshold of interferon needed to induce macrophage production. This is similar to theactivation threshold that must be exceeded to induce T cell cytokine production [44,45].The parameter, KM,I, is not raised to the Hill-like coefficient, n, to improve parameter fitting.Macrophage decays at a rate of dM.
Equations (1)–(3) define the dynamic behavior of Model 1. We also developed reducedmodels, Models 2–4, in which select interactions were removed to consider additionalhypotheses on how the immune system in the lung might be regulated. For example,

Viruses 2022, 14, 906 4 of 17
in CCR2-/- mice, there is conflicting evidence concerning whether inhibited macrophageinfiltration into the lung of infected mice affects viral load [46,47]. In addition, althoughmacrophage upregulation of interferon is well justified, it is not guaranteed that parametersassociated with this interaction can be estimated from the data. In Model 2, M inductionof I is removed. In Model 3, M inhibition of V is removed. In Model 4, both M inductionof I and M inhibition of V are removed. These models were each fit to the experimentaldata to determine which model (and, therefore, which combination of biological processes)optimally fits the data based on the goodness of fit and the number of parameters estimated(degrees of freedom, DoF).
2.2. Experimental Data Collected from Literature and Relating the Data to the Model
Measurements of the viral load, interferon concentration, and a surrogate measure-ment of macrophage counts were collected and organized from Shoemaker et al. [1]. Briefly,female C57BL/6J mice were infected with a low pathogenic A/Kawasaki/UTK-4/09 H1N1virus (H1N1) or high pathogenic A/Vietnam/1203/04 H5N1 virus (H5N1) at 105 PFU.A control group was mock-infected with PBS. At 14 time points spanning the first week ofinfection, three animals per infection group were sacrificed. Their lungs were harvested andanalyzed by a variety of techniques to quantify the viral load and the state of the immunesystem. The H5N1-infected animals died between days 5 and 7. As such, only the first13 measurements spanning days 0–5 are included in this work. In all, 234 measurements(78 for each model state) were collected and organized for model parameterization.
The specific measurements used from [1] and their relationship to the mathematicalmodels are as follows: Viral titers were determined via plaque assay, resulting in units ofplaque-forming units per mg of lung tissue (PFU/mg). In Equation (1), V is the log10 ofPFU/mg. To represent the change in interferon concentration over time in Equation (2),log2 fold change of the gene expression of Ifnb1 relative to mock-infected, time-matchedsamples (unitless) was used. Full details on normalizing the gene expression can be foundin the original work [1]. Whole lung macrophage counts were determined at only four timepoints in the original work, spread across several days [1]. As a result, the concentration ofMCP1 (measured using ELISA assay) was selected to act as a surrogate measurement ofmacrophage cell count (M). Supplementary Figure S1 shows a linear regression of the log10macrophage cell count and log2 MCP1 concentration (R2 = 0.98, with a slope of 0.613).The conversion between macrophage and MCP1 is, therefore, given by Equation (4):
log10(M) = 0.6301 log2(MCP1) (4)
where M is the macrophage cell count in the lung, and MCP1 has units of pg/mL. Duringparameter training, the macrophage state (Equation (3)) is fit to the log2 of MCP1 mea-surements. Equation (4) is then used to transform MCP1 predictions into estimates ofmacrophage counts in the lung.
2.3. Parameter Training
Basin Hopping (BH) [48], via SciPy [49], and Parallel Tempering Markov chain MonteCarlo (PT MCMC) [50] were employed as global optimization algorithms to train parametervalues. BH rapidly identifies a single estimate of parameter values, whereas PT MCMCcharacterizes the parameter space over an extended number of samples. The objectivefunction used (Equation (5)) is the weighted sum of squared error, and is referred tohereafter as energy, following Metropolis et al. [51]).
Energy = ∑Xx=1 ∑T
t=0(Mx,t −Ox,t)
2
2Ox,t(5)
Mx,t and Ox,t are the model output and the average of triplicate observed data points,respectively, for each state, x, and time point, t, across all states, X, and time points, T.Each time point was divided by the corresponding data point, Ox,t, to normalize energy
Viruses 2022, 14, 906 5 of 17
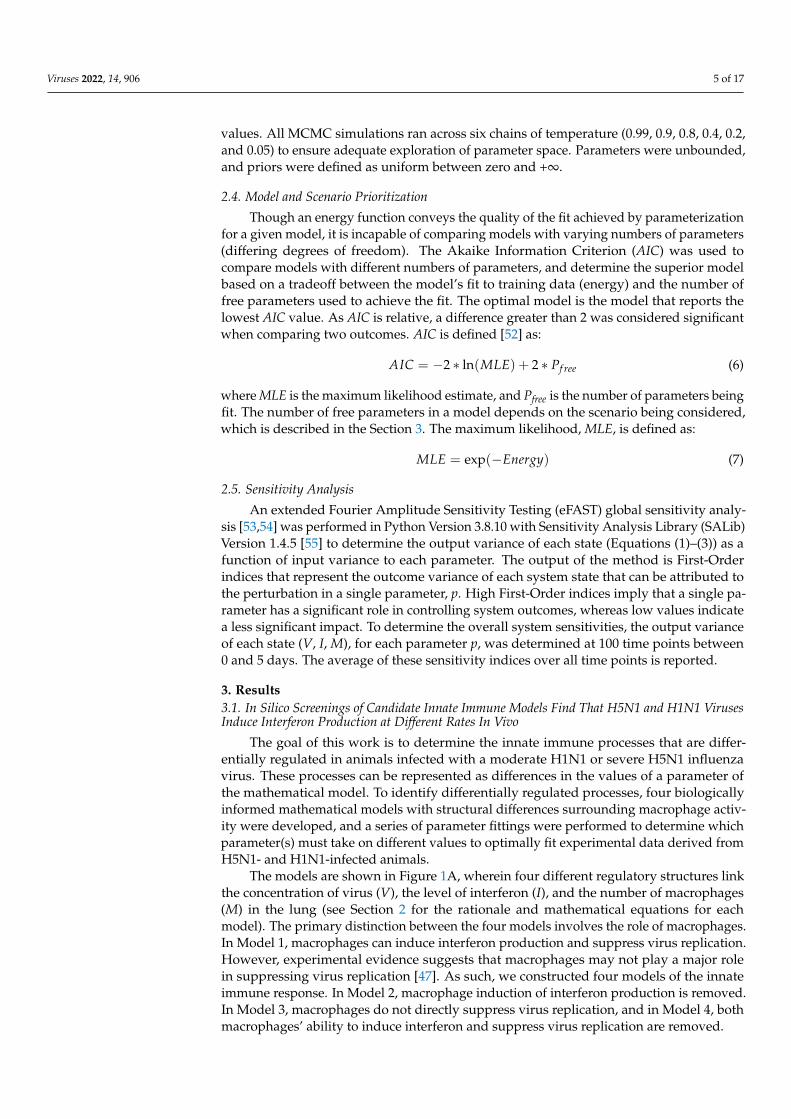
values. All MCMC simulations ran across six chains of temperature (0.99, 0.9, 0.8, 0.4, 0.2,and 0.05) to ensure adequate exploration of parameter space. Parameters were unbounded,and priors were defined as uniform between zero and +∞.
2.4. Model and Scenario Prioritization
Though an energy function conveys the quality of the fit achieved by parameterizationfor a given model, it is incapable of comparing models with varying numbers of parameters(differing degrees of freedom). The Akaike Information Criterion (AIC) was used tocompare models with different numbers of parameters, and determine the superior modelbased on a tradeoff between the model’s fit to training data (energy) and the number offree parameters used to achieve the fit. The optimal model is the model that reports thelowest AIC value. As AIC is relative, a difference greater than 2 was considered significantwhen comparing two outcomes. AIC is defined [52] as:
AIC = −2 ∗ ln(MLE) + 2 ∗ Pf ree (6)
where MLE is the maximum likelihood estimate, and Pfree is the number of parameters beingfit. The number of free parameters in a model depends on the scenario being considered,which is described in the Section 3. The maximum likelihood, MLE, is defined as:
MLE = exp(−Energy) (7)
2.5. Sensitivity Analysis
An extended Fourier Amplitude Sensitivity Testing (eFAST) global sensitivity analy-sis [53,54] was performed in Python Version 3.8.10 with Sensitivity Analysis Library (SALib)Version 1.4.5 [55] to determine the output variance of each state (Equations (1)–(3)) as afunction of input variance to each parameter. The output of the method is First-Orderindices that represent the outcome variance of each system state that can be attributed tothe perturbation in a single parameter, p. High First-Order indices imply that a single pa-rameter has a significant role in controlling system outcomes, whereas low values indicatea less significant impact. To determine the overall system sensitivities, the output varianceof each state (V, I, M), for each parameter p, was determined at 100 time points between0 and 5 days. The average of these sensitivity indices over all time points is reported.
3. Results3.1. In Silico Screenings of Candidate Innate Immune Models Find That H5N1 and H1N1 VirusesInduce Interferon Production at Different Rates In Vivo
The goal of this work is to determine the innate immune processes that are differ-entially regulated in animals infected with a moderate H1N1 or severe H5N1 influenzavirus. These processes can be represented as differences in the values of a parameter ofthe mathematical model. To identify differentially regulated processes, four biologicallyinformed mathematical models with structural differences surrounding macrophage activ-ity were developed, and a series of parameter fittings were performed to determine whichparameter(s) must take on different values to optimally fit experimental data derived fromH5N1- and H1N1-infected animals.
The models are shown in Figure 1A, wherein four different regulatory structures linkthe concentration of virus (V), the level of interferon (I), and the number of macrophages(M) in the lung (see Section 2 for the rationale and mathematical equations for eachmodel). The primary distinction between the four models involves the role of macrophages.In Model 1, macrophages can induce interferon production and suppress virus replication.However, experimental evidence suggests that macrophages may not play a major rolein suppressing virus replication [47]. As such, we constructed four models of the innateimmune response. In Model 2, macrophage induction of interferon production is removed.In Model 3, macrophages do not directly suppress virus replication, and in Model 4, bothmacrophages’ ability to induce interferon and suppress virus replication are removed.

Viruses 2022, 14, 906 6 of 17
Figure 1. (A) Model schemes of the four models considered in this work. V, I, and M represent virusconcentration, interferon concentration, and macrophage cell count in the lungs of infected mice.Arrows represent activating interactions; lines ending in crosses represent inhibiting interactions.The parameters involved in each interaction are indicated in Model 1 (degradation reactions notshown). Model 1 is the fully connected model of the innate immune response model. Models 2–4 arereduced versions of Model 1, wherein select interactions were removed. (B) Each model is analyzedfor its goodness of fit to experimental data under three different scenarios. Schemes of the modelemphasize the different outcomes that occur under each scenario. Black arrows indicate parametersthat retain the same value when fitting the model to H5N1 and H1N1 infection data. Red, brokenarrows identify parameters that take on different values when training two copies of a model to theH5N1 and H1N1 infection data.
All four models were compared under three scenarios using the AIC as the discrim-ination metric. The overall strategy of the approach is illustrated in Figure 1B. In the“No strain-specific differences” (NSSD) scenario, parameters have equal values in bothinfections. A single copy of each model is trained to the H5N1 and H1N1 data, resulting inone trained (parameterized) model. In the “One strain-specific difference” (OSSD) scenario,we assume that a single interaction or process may be differentially regulated in the twoinfections. To consider this, we train two copies of a model to the data, one copy forthe H5N1 data and another for the H1N1 data, but only allow one parameter to take ondifferent values between each copy (referred to as independent parameters, similar to theapproach used in [18]). All other parameters must maintain the same value. This resultsin an H1N1- and an H5N1-specific parameterized version of a model, each of which hasidentical parameter values except for the strain-specific parameter under consideration.Lastly, we considered the “All different” (AD) scenario in which all parameters can takeon different values when training a model to the H1N1 or H5N1 data, resulting in anH1N1- and an H5N1-specific parameterized version of the model in which all parametershave different values. AD provides a benchmark of the equations’ ability to capture thedynamics of each strain individually, whereas NSSD benchmarks the goodness of fit forwhen each infection is considered to be mechanistically identical. All four models wereparameterized under each scenario using a basin hopping algorithm. AIC scores were usedto determine which model and scenario results in the best fit to the data.
Comparing the AIC results after training each model to the experimental data undereach scenario suggests that H5N1 and H1N1 viruses induce the production of interferon atdifferent rates. Figure 2 shows the energy (goodness of fit) and the AIC for all combinationsof model and scenario. Generally, all four models can attain similar goodness of fits to theimmunologic data. Model 4 tends to have the lowest AIC, a result of both low energy fitsand the fact that Model 4 has the fewest parameters. The lowest energy is achieved by allfour models under the AD scenario, which is expected, as this scenario has the highestdegree of freedom for fitting the models to the data. However, the lowest AIC values are

Viruses 2022, 14, 906 7 of 17
not achieved under the AD scenario. The minimum AIC occurs in the OSSD scenario,where the parameter representative of interferon production rate, rI,V, takes on H5N1-and H1N1-specific values. All four models achieve their lowest AIC under this condition(noted in Figure 2), with Model 4 achieving the lowest AIC overall. This suggests that virus-induced interferon production is regulated in a strain-dependent manner, a propositionthat is independent of the model, and therefore, macrophage activity, employed. Thesefindings also suggest that Model 4 is the best model for regressing against the H5N1 andH1N1 immunologic data.
Figure 2. Energy versus AIC values for all four model structures under different parameterizationscenarios (All Different (AD), One Strain-Specific Difference (OSSD), and No Strain-Specific Difference(NSSD)). The Model 4 OSSD rI,V scenario yields the global minima.
3.2. Strain-Specific Interferon Production Is Not an Artifact of Parameter Sensitivity
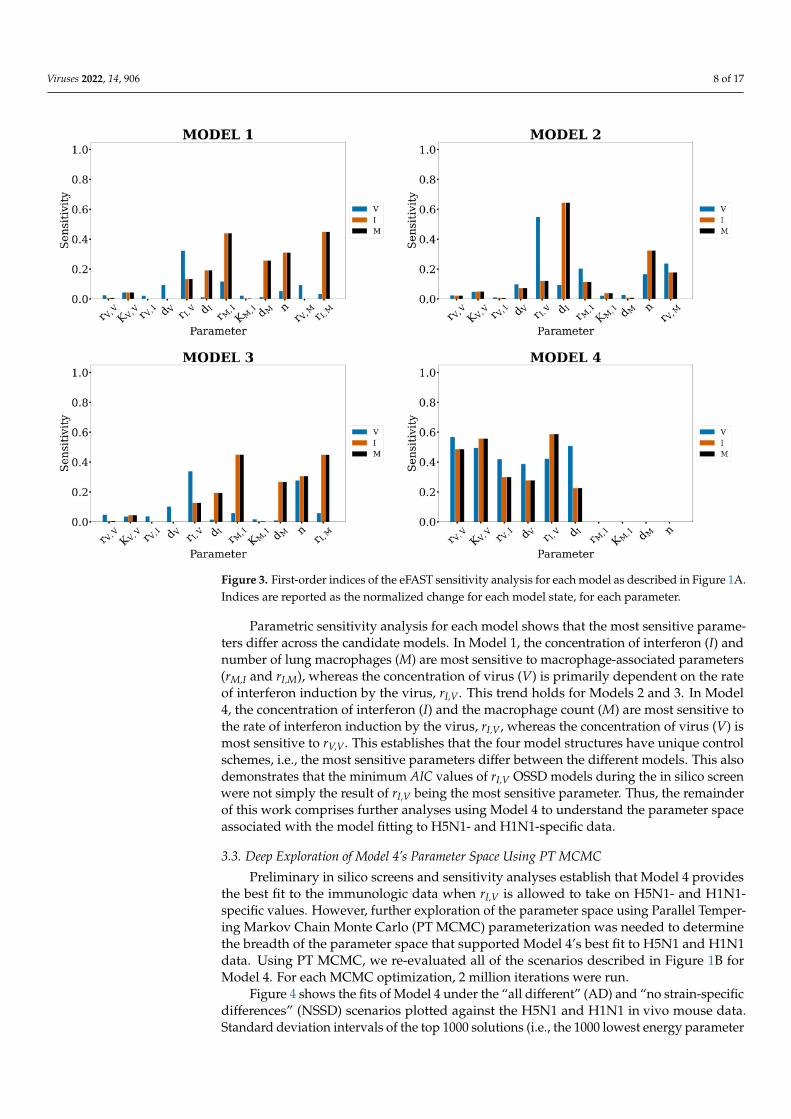
A challenge associated with this type of in silico screen is to determine if the screeningmethods have merely identified the most sensitive model parameter as the best parameterto take on different values and provide the best fit to the data. We next investigated theparametric sensitivity of the candidate models to determine if rI,V was the most sensitivemodel parameter. We conducted a sensitivity analysis of all the models to each of theirconstituent parameters using the eFAST algorithm [53,54]. The sensitivity of each state isreported in the form of fractional variance that can be explained by the variance of a singleparameter, p. These indices are shown in Figure 3.
Viruses 2022, 14, 906 8 of 17
Figure 3. First-order indices of the eFAST sensitivity analysis for each model as described in Figure 1A.Indices are reported as the normalized change for each model state, for each parameter.
Parametric sensitivity analysis for each model shows that the most sensitive parame-ters differ across the candidate models. In Model 1, the concentration of interferon (I) andnumber of lung macrophages (M) are most sensitive to macrophage-associated parameters(rM,I and rI,M), whereas the concentration of virus (V) is primarily dependent on the rateof interferon induction by the virus, rI,V. This trend holds for Models 2 and 3. In Model4, the concentration of interferon (I) and the macrophage count (M) are most sensitive tothe rate of interferon induction by the virus, rI,V, whereas the concentration of virus (V) ismost sensitive to rV,V. This establishes that the four model structures have unique controlschemes, i.e., the most sensitive parameters differ between the different models. This alsodemonstrates that the minimum AIC values of rI,V OSSD models during the in silico screenwere not simply the result of rI,V being the most sensitive parameter. Thus, the remainderof this work comprises further analyses using Model 4 to understand the parameter spaceassociated with the model fitting to H5N1- and H1N1-specific data.
3.3. Deep Exploration of Model 4’s Parameter Space Using PT MCMC
Preliminary in silico screens and sensitivity analyses establish that Model 4 providesthe best fit to the immunologic data when rI,V is allowed to take on H5N1- and H1N1-specific values. However, further exploration of the parameter space using Parallel Temper-ing Markov Chain Monte Carlo (PT MCMC) parameterization was needed to determinethe breadth of the parameter space that supported Model 4’s best fit to H5N1 and H1N1data. Using PT MCMC, we re-evaluated all of the scenarios described in Figure 1B forModel 4. For each MCMC optimization, 2 million iterations were run.
Figure 4 shows the fits of Model 4 under the “all different” (AD) and “no strain-specificdifferences” (NSSD) scenarios plotted against the H5N1 and H1N1 in vivo mouse data.Standard deviation intervals of the top 1000 solutions (i.e., the 1000 lowest energy parameter

Viruses 2022, 14, 906 9 of 17
sets that were identified) are narrow for the model’s fits under both the AD (black) andNSSD (blue) scenarios, indicating a range of possible model trajectories with similar energy.The resultant trajectory for the NSSD scenario is the average of the two strains’ datasetsand, expectedly, fits neither strain. The AD scenario fits reproduce the observed dynamicsfor each strain very well, showing that the Model 4 equations are capable of producingknown in vivo behavior, and strain-specific parameterizations can improve model energyat the cost of higher degrees of freedom.
Viruses 2022, 14, x FOR PEER REVIEW 9 of 17
similar energy. The resultant trajectory for the NSSD scenario is the average of the two strains’ datasets and, expectedly, fits neither strain. The AD scenario fits reproduce the observed dynamics for each strain very well, showing that the Model 4 equations are capable of producing known in vivo behavior, and strain-specific parameterizations can improve model energy at the cost of higher degrees of freedom.
Figure 4. The top 1000 fits of Model 4 to the H1N1 (top row) and H5N1 data (bottom row) when using PT MCMC parameterization. The top fits under the AD scenario (all parameters allowed to independently estimate across strains) are shown in black, and NSSD results (all parameters shared between strains) are shown in blue. Intervals represent the standard deviation of the 1000 lowest energy parameter sets. Data from Shoemaker et al. [1] are shown as circles, with bars indicating the standard deviation.
3.4. MCMC-Based Parameter Exploration Again Finds That H5N1 and H1N1 Viruses Induce Interferon Production at Different Rates In Vivo
We next considered Model 4’s goodness of fit to the H5N1 and H1N1 data under the OSSD scenario. The energy and AIC for all scenarios tested are reported in Table 1. For completeness, we show the time course trajectories of the best fit achieved for Model 4 under all OSSD scenarios in Figure 5. Energy per iteration for both AD and NSSD scenarios are shown in Supplemental Figure S3, whereas best-fit parameter values and units are provided in Appendix A. The lowest AIC is achieved when the rate of virus induction of interferon, rI,V, is allowed to have strain-specific values. Minimum energy values fall between 9 and 13 except in the case where the rate of interferon production, rI,V, is independently estimated, which yields a minimum energy of 6.65. Though this is closest to the minimum AD energy for Model 4 (3.33), AIC calculations reveal that the resulting value of 35.30 for rI,V is not only lower than the results of the other nine OSSD parameterizations of Model 4, but is lower than that of the high degree of freedom AD results. Overall, using MCMC instead of basin-hopping for data fitting did not lead to a different conclusion with regards to the optimal solution occurring when rI,V is independently estimated for H5N1 and H1N1.
Table 1. The minimum energy, degrees of freedom (DoF), and AIC values achieved by Model 4 for each scenario. The independent parameter column identifies the parameter allowed to take on different values while training two copies of the model to the H5N1 and H1N1 data.
Scenario Independent Parameter Energy DoF AIC NSSD None 15.04 10 50.08
Figure 4. The top 1000 fits of Model 4 to the H1N1 (top row) and H5N1 data (bottom row) whenusing PT MCMC parameterization. The top fits under the AD scenario (all parameters allowed toindependently estimate across strains) are shown in black, and NSSD results (all parameters sharedbetween strains) are shown in blue. Intervals represent the standard deviation of the 1000 lowestenergy parameter sets. Data from Shoemaker et al. [1] are shown as circles, with bars indicating thestandard deviation.
3.4. MCMC-Based Parameter Exploration Again Finds That H5N1 and H1N1 Viruses InduceInterferon Production at Different Rates In Vivo
We next considered Model 4’s goodness of fit to the H5N1 and H1N1 data under theOSSD scenario. The energy and AIC for all scenarios tested are reported in Table 1. Forcompleteness, we show the time course trajectories of the best fit achieved for Model 4 underall OSSD scenarios in Figure 5. Energy per iteration for both AD and NSSD scenarios areshown in Supplemental Figure S3, whereas best-fit parameter values and units are providedin Appendix A. The lowest AIC is achieved when the rate of virus induction of interferon,rI,V, is allowed to have strain-specific values. Minimum energy values fall between 9 and 13except in the case where the rate of interferon production, rI,V, is independently estimated,which yields a minimum energy of 6.65. Though this is closest to the minimum AD energyfor Model 4 (3.33), AIC calculations reveal that the resulting value of 35.30 for rI,V is notonly lower than the results of the other nine OSSD parameterizations of Model 4, but islower than that of the high degree of freedom AD results. Overall, using MCMC instead

Viruses 2022, 14, 906 10 of 17
of basin-hopping for data fitting did not lead to a different conclusion with regards to theoptimal solution occurring when rI,V is independently estimated for H5N1 and H1N1.
Table 1. The minimum energy, degrees of freedom (DoF), and AIC values achieved by Model 4for each scenario. The independent parameter column identifies the parameter allowed to take ondifferent values while training two copies of the model to the H5N1 and H1N1 data.
Scenario Independent Parameter Energy DoF AIC
NSSD None 15.04 10 50.08
AD All 3.33 20 46.66
OSSD
rV,I 10.83 11 43.66
rV,V 9.37 11 40.74
KV,V 9.79 11 41.59
dV 9.65 11 41.31
rI,V 6.65 11 35.30
dI 10.3 11 42.61
rM,I 12.36 11 46.73
kM,I 12.29 11 46.57
n 12.28 11 46.57
dM 12.37 11 46.75
Figure 5. Model 4 output for the minimum energy parameter set (lines) for OSSD parameterizationsand corresponding training data (markers) for H1N1 (top row) and H5N1 (bottom row). Data fromShoemaker et al. [1] are shown with the standard deviation associated with triplicate data points pertime point.

Viruses 2022, 14, 906 11 of 17
In total, the model fits in Figure 5 capture some trends of the in vivo data, fallingshort in the inability to capture V after day 1 and late infection behavior for all threestates. However, the rI,V OSSD scenario shows a distinct improvement in fit over the NSSDresults. When each parameter is allowed to differ between strains, histograms can informwhether the strains’ parameter distributions are unique. Focusing on the rI,V OSSD scenariohistograms, a comparison of the resultant top 1000 parameter distributions across strainsyields a significant difference between distribution means (Mann–Whitney test p < 0.001 forrI,V between H1N1 (blue) and H5N1 (red), Figure 6), indicating that the strains have uniquevalues for this parameter. All other parameter distributions for OSSD models overlapsignificantly (Supplemental Figure S4), except for dI. Combined with the AIC results inTable 1, these results highlight that rI,V OSSD achieves the most statistically defensible fit tothe datasets.
Figure 6. Posterior density distributions for all parameters for Model 4, with rI,V varying betweenstrains. Only rI,V can have strain-specific values. All other parameters have the same value whenfitting the model to H5N1 and H1N1 data. The x axis is given in log10 Parameter Value. Distributionsresult from the 1000 lowest energy solutions identified using PT MCMC. Narrow posterior distribu-tions indicate that the parameter had a small range of values under which the model optimally fit thedata, whereas broad distributions indicate that a range of values would yield fits of the same energy.
3.5. Independent Estimation of Virus Parameters per Strain Does Not Improve Model AIC
Because it would be computationally intractable to fit all possible combinations ofparameter values, this study focused largely on observing the effect that differences insingle parameters while training to two infection datasets have on model quality. However,we hypothesized that disparate immune dynamics between viral strains may be related

Viruses 2022, 14, 906 12 of 17
to all virus-based rates, such as growth rate, rV,V, or death rate, dV. To test this, Model 4was parameterized such that the viral state parameters, rV,V, KV,V, rV,I, and dV (denoted{V}), could take on different values when training to the H5N1 and H1N1 data, while allother parameters remained shared between strains. Six additional “Virus-Host” param-eterizations were performed with the addition of one of the non-viral state parameters,{V} +OSSD (DoF: 15).
The model solutions for each parameterization are found in Figure 7. Qualitatively,the resulting fits are more indicative of the expected dynamic trends, including duringlate infection. Model fits follow similar trends to Figures 4 and 5, with {V} + rI,V achiev-ing the best fit to data. Corresponding minimum energy and AIC values are found inTable 2. A comparison of the top 1000 parameter distributions per strain yields significantdifferences between distribution means, except for rV,I in {V} + KM,I (Mann–Whitney testp < 0.001 for all independently estimated parameters). This indicates that virus-relatedkinetic parameters likely vary between strains. Minimum energies associated with the{V} + OSSD parameterizations are lower than that of {V} alone, with a minimum energy of5.55, associated with the independent fitting of {V} + rI,V. Compared to the AD and NSSDscenarios, {V} + rI,V results in a lower AIC value, reiterating the role of interferon produc-tion rate in strain-specific infection dynamics. Although strain-specific viral parametersare demonstrably present in the datasets, {V} + rI,V has a higher AIC than the rI,V OSSDscenario. This attributes great importance to strain-dependent interferon production rateover simple strain-dependent viral kinetics and implies that increased degrees of freedomare detrimental to model quality. Investigations with higher degrees of freedom were notperformed due to the computational time required for each MCMC fit to run 2 millionsamples per study.
Figure 7. Model 4 output for minimum energy parameter set (line) for virus-related parameter inde-pendent ({V}) and corresponding training data (markers) for H1N1 (top row) and H5N1 (bottom row).{V} is representative of four viral parameters: rV,V, KV,V, rV,I,, and dV. Data from Shoemaker et al. [1]are shown with the standard deviation associated with triplicate data points per time point.

Viruses 2022, 14, 906 13 of 17
Table 2. The minimum energy, degrees of freedom (DoF), and AIC values for all seven viral subset({V}) studies. {V} is representative of four viral parameters: rV,V, KV,V, rV,I and dV. Model scenariosare given in Figure 1. Independent parameter identifies the parameters allowed to take on differentvalues when training to the H5N1 and H1N1 data.
Scenario Independent Parameter Energy DoF AIC
{V} {V} 9.34 14 46.68
{V} + OSSD
{V}+ rI,V 5.55 15 41.11
{V}+ dI 8.38 15 46.75
{V}+ rM,I 8.86 15 47.72
{V}+ KM,I 8.89 15 47.79
{V}+ n 8.92 15 47.85
{V}+ dM 8.89 15 47.78
4. Discussion
In this work, four distinct, three-state ODE models of the early innate immune re-sponse to influenza virus were used to investigate the mechanistic roots of differentialimmunoregulatory behavior observed in vivo between low- and high-pathogenic H1N1and H5N1 strains. Several mechanisms have been hypothesized to explain differentialimmunoregulation between low- and high-pathology infections. Three specific mecha-nisms are that high-pathogenic viruses may simply replicate more quickly, high-pathogenicviruses may differently interact with antiviral signaling pathways (i.e., interferon signaling),or high-pathogenic viruses may infect and/or alter the behavior of macrophages (see intro-duction for further details). Prior modeling efforts implicated the infection of macrophagesas a driving factor for strain-dependent pathogenicity [18]; however, the study did notconsider alternative mechanisms, and further exploration was needed [46,47]. The in silicoscreen used here is an unbiased approach that allows several candidate mechanisms tocompete, with the most likely candidate mechanism being selected based on the model’sgoodness of fit to H5N1 and H1N1 training data. The infection data originate from identicallineage-, age-, and gender-matched murine subjects, minimizing inter-individual variabil-ity, and increasing the likelihood that differences observed between infections are due tostrain-specific immunoregulation or virus replication.
Of the three hypotheses for why H5N1 viruses induce distinct immune responses,the primary finding from the in silico screen (Figure 2) is that the rate of interferon pro-duction by infected lung cells is likely different in H1N1- and H5N1-infected animals.The lowest AIC was achieved when the interferon-associated parameter, rI,V, was allowedto take on different values while training to each infection cohort—regardless of the modelemployed. The robustness of this finding is further supported by the wide distribution ofparameter values which optimally fit the data, quantified by the MCMC analysis, and bythe results of the sensitivity analysis. One concern about our in silico screening approach,and indeed in model-based analysis in general, is that the most sensitive parameters areoften identified as the most important for maintaining phenotypes, as they are the easiestto use for tuning system dynamics. Across the four models considered here, the top pa-rameters to which the model outputs are sensitive differed (Figure 3). Nonetheless, rI,Vwas identified as the most likely candidate across all four models. Finally, in Figure 5,MCMC analysis showed that the best fit for the scenario with strain-specific rI,V valuescould be achieved for a wide range of parameter values. It was found that the rate ofinterferon production, rI,V, is approximately 2–3 times faster in H5N1-infected lung cells.Additional analyses were performed to consider strain-specific virus replication ratescombined with strain-specific immune rates (Table 2; Figure 7). Our work demonstratesthat strain-dependent differences arise from host–virus interactions and immunologicalreactions, rather than strain-specific viral replication behavior.

Viruses 2022, 14, 906 14 of 17
It is important to note that although the in silico screen identifies strain-specific inter-feron production as the key mechanism for differential immunodynamics, this does notfully negate the possibility of other mechanisms. Each of the three mechanisms discussedare supported by some studies and contradicted by others. For example, with regards tomacrophages, studies have shown that macrophages are susceptible to high-pathogenicviruses [56], and H5N1 viruses can replicate in human macrophages cultured from mono-cytes [57]. However, it has also been shown that macrophages collected from human donorscan be infected by H5N1 viruses, but do not produce virus nor inflammatory cytokines [12].With regards to strain-specific regulation of interferon, there is evidence that H5N1 virusesmay upregulate interferon production early in infected cells in vitro [58]. Our in silicoscreen considers several possible mechanisms for why H5N1 and H1N1 immunodynam-ics may differ, and though we conclude that strain-specific interferon production is themost likely mechanism, we only considered two or more possible mechanisms occurringsimultaneously. Given the complexity of the immune system, future efforts will focus onconsidering more complex candidate mechanisms.
The caveats of this study primarily relate to the available data and parameter iden-tifiability. Insufficient macrophage count data were available, and the concentration ofMCP1 was used as a surrogate measurement. Although data were available to assess theaccuracy of using MCP1 as a surrogate, there remains the possibility that macrophagecounts differed from our estimates. With regards to parameter identifiability, in highlyconnected systems, such as Model 1, it is often difficult to reasonably estimate values for allparameters. This can be improved in future work by incorporating data from knockoutmice studies wherein feedback in immune signaling can be removed. The shared parameteroptimization framework is highly generalizable to other cohorts of data, including age-,race-, and sex-specific studies, making it a highly valuable tool for investigating disparatekinetics between groups of interest and the drivers of observed clinical behavior [59,60].Additionally, conclusions from cohort-specific studies may prove useful for informing andsimplifying future modeling work with additional cohorts.
Supplementary Materials: The following supporting information can be downloaded at: https://www.mdpi.com/article/10.3390/v14050906/s1, Figure S1: Macrophage and MCP1 correlation;Figure S2: Models 2 and 3 predictions; Figure S3: AD and NSSD model 4 energy plots; Figure S4: AD,NSSD, and OSSD model 4 parameter posterior density distributions.
Author Contributions: Conceptualization, J.E.S.; methodology, J.E.S., E.E.A. and J.J.A.W.; software,E.E.A. and J.J.A.W.; validation, E.E.A. and J.J.A.W.; formal analysis, E.E.A. and J.J.A.W.; investigation,E.E.A. and J.J.A.W.; resources, J.E.S.; data curation, E.E.A.; writing—original draft preparation, E.E.A.;writing—review and editing, J.E.S., E.E.A. and J.J.A.W.; visualization, E.E.A.; supervision, J.E.S.;project administration, J.E.S.; funding acquisition, J.E.S. All authors have read and agreed to thepublished version of the manuscript.
Funding: This research was funded by the National Science Foundation, grant number 1943777,and by the Howard Hughes Medical Institute through the James H. Gilliam Fellowships for AdvancedStudy program.
Institutional Review Board Statement: Not applicable.
Informed Consent Statement: Not applicable.
Data Availability Statement: Visualization codes for Figures 4, 5 and 7, which result from MCMCparameterization, can be found at https://github.com/ImmuSystems-Lab/Macrophage_Model.
Acknowledgments: Thank you to the Howard Hughes Medical Institute for supporting this projectthrough the James H. Gilliam Fellowships for Advanced Study program.
Conflicts of Interest: The authors declare no conflict of interest.

Viruses 2022, 14, 906 15 of 17
Appendix A
Table A1. AD Minimum energy parameter values and units for each strain in Model 4.
Parameter H1N1 H5N1 Unit
rV,V 1.22 1.21 days−1
KV,V 3.65 × 101 7.80 × 10² log10(PFU/mg)
rV,I 1.20 × 10⁻¹ 1.07 × 10⁻¹ days−1
dV 1.61 × 10⁻¹ 1.10 × 10⁻⁵ days−1
rI,V 7.70 × 10⁻¹ 3.06 [log10(PFU/mg) hours]−1
dI 9.59 × 10⁻¹ 3.22 days−1
rM,I 2.16 × 10⁷ 9.71 × 10³ Macrophage Cell Countdays
KM,I 1.90 × 10⁵ 1.04 × 10⁹ unitless
dM 8.80 × 10³ 6.18 × 10⁻¹ days−1
n 5.47 9.98 unitless
rV,M N/A [Macrophage Cell Count days]−1
rI,M N/A [Macrophage Cell Count days]−1
References1. Shoemaker, J.E.; Fukuyama, S.; Eisfeld, A.J.; Zhao, D.; Kawakami, E.; Sakabe, S.; Maemura, T.; Gorai, T.; Katsura, H.;
Muramoto, Y.; et al. An Ultrasensitive Mechanism Regulates Influenza Virus-Induced Inflammation. PLoS Pathog. 2015,11, e1004856. [CrossRef]
2. 2016–2017 Estimated Influenza Illnesses, Medical Visits, Hospitalizations, and Deaths Averted by Vaccination in theUnited States|CDC. Available online: https://www.cdc.gov/flu/vaccines-work/burden-averted-2016-17.htm (accessed on2 March 2022).
3. Kawaoka, Y. H5N1: Flu Transmission Work Is Urgent. Nature 2012, 482, 155. [CrossRef]4. CDC Highly Pathogenic Asian Avian Influenza A(H5N1) in People|Avian Influenza (Flu). Available online: https://www.cdc.
gov/flu/avianflu/avian-in-humans.htm (accessed on 2 March 2022).5. Guarner, J.; Falcón-Escobedo, R. Comparison of the Pathology Caused by H1N1, H5N1, and H3N2 Influenza Viruses. Arch. Med.
Res. 2009, 40, 655–661. [CrossRef] [PubMed]6. Boon, A.C.M.; Finkelstein, D.; Zheng, M.; Liao, G.; Allard, J.; Klumpp, K.; Webster, R.; Peltz, G.; Webby, R.J. H5N1 Influenza Virus
Pathogenesis in Genetically Diverse Mice Is Mediated at the Level of Viral Load. mBio 2011, 2, e00171-11. [CrossRef]7. Hale, B.G.; Randall, R.E.; Ortin, J.; Jackson, D. The Multifunctional NS1 Protein of Influenza A Viruses. J. Gen. Virol. 2008, 89,
2359–2376. [CrossRef] [PubMed]8. Sun, L.; Liu, S.; Chen, Z.J. SnapShot: Pathways of Antiviral Innate Immunity. Cell 2010, 140, 436–436.e2. [CrossRef] [PubMed]9. Li, W.; Wang, G.; Zhang, H.; Xin, G.; Zhang, D.; Zeng, J.; Chen, X.; Xu, Y.; Cui, Y.; Li, K. Effects of NS1 Variants of H5N1 Influenza
Virus on Interferon Induction, TNFα Response and P53 Activity. Cell. Mol. Immunol. 2010, 7, 235–242. [CrossRef]10. Mok, B.W.-Y.; Liu, H.; Chen, P.; Liu, S.; Lau, S.-Y.; Huang, X.; Liu, Y.-C.; Wang, P.; Yuen, K.-Y.; Chen, H. The Role of Nuclear NS1
Protein in Highly Pathogenic H5N1 Influenza Viruses. Microbes Infect. 2017, 19, 587–596. [CrossRef]11. Cheung, C.Y.; Poon, L.L.M.; Lau, A.S.; Luk, W.; Lau, Y.L.; Shortridge, K.F.; Gordon, S.; Guan, Y.; Peiris, J.S.M. Induction of
Proinflammatory Cytokines in Human Macrophages by Influenza A (H5N1) Viruses: A Mechanism for the Unusual Severity ofHuman Disease? Lancet 2002, 360, 1831–1837. [CrossRef]
12. van Riel, D.; Leijten, L.M.E.; van der Eerden, M.; Hoogsteden, H.C.; Boven, L.A.; Lambrecht, B.N.; Osterhaus, A.D.M.E.; Kuiken, T.Highly Pathogenic Avian Influenza Virus H5N1 Infects Alveolar Macrophages without Virus Production or Excessive TNF-AlphaInduction. PLoS Pathog. 2011, 7, e1002099. [CrossRef]
13. Mochan, E.; Ackerman, E.; Shoemaker, J. A Systems and Treatment Perspective of Models of Influenza Virus-Induced HostResponses. Processes 2018, 6, 138. [CrossRef]
14. Smith, A.M. Validated Models of Immune Response to Virus Infection. Curr. Opin. Syst. Biol. 2018, 12, 46–52. [CrossRef][PubMed]
15. Pawelek, K.A.; Huynh, G.T.; Quinlivan, M.; Cullinane, A.; Rong, L.; Perelson, A.S. Modeling Within-Host Dynamics of InfluenzaVirus Infection Including Immune Responses. PLoS Comput. Biol. 2012, 8, e1002588. [CrossRef]
16. Price, I.; Mochan-Keef, E.D.; Swigon, D.; Ermentrout, G.B.; Lukens, S.; Toapanta, F.R.; Ross, T.M.; Clermont, G. The InflammatoryResponse to Influenza A Virus (H1N1): An Experimental and Mathematical Study. J. Theor. Biol. 2015, 374, 83–93. [CrossRef]

Viruses 2022, 14, 906 16 of 17
17. Gregg, R.W.; Sarkar, S.N.; Shoemaker, J.E. Mathematical Modeling of the CGAS Pathway Reveals Robustness of DNA Sensing toTREX1 Feedback. J. Theor. Biol. 2019, 462, 148–157. [CrossRef] [PubMed]
18. Pawelek, K.A.; Dor, D.; Salmeron, C.; Handel, A. Within-Host Models of High and Low Pathogenic Influenza Virus Infections:The Role of Macrophages. PLoS ONE 2016, 11, e0150568. [CrossRef]
19. Weaver, J.J.A.; Shoemaker, J.E. Mathematical Modeling of Rna Virus Sensing Pathways Reveals Paracrine Signaling as the PrimaryFactor Regulating Excessive Cytokine Production. Processes 2020, 8, 719. [CrossRef]
20. Smith, A.M.; Adler, F.R.; Ribeiro, R.M.; Gutenkunst, R.N.; McAuley, J.L.; McCullers, J.A.; Perelson, A.S. Kinetics of Coinfectionwith Influenza A Virus and Streptococcus Pneumoniae. PLoS Pathog. 2013, 9, e1003238. [CrossRef]
21. Gregg, R.W.; Shabnam, F.; Shoemaker, J.E. Agent-Based Modeling Reveals Benefits of Heterogeneous and Stochastic CellPopulations during CGAS-Mediated IFNβ Production. Bioinformatics 2021, 37, 1428–1434. [CrossRef]
22. Aponte-Serrano, J.O.; Weaver, J.J.A.; Sego, T.J.; Glazier, J.A.; Shoemaker, J.E. Multicellular Spatial Model of RNA Virus Replicationand Interferon Responses Reveals Factors Controlling Plaque Growth Dynamics. PLoS Comput. Biol. 2021, 17, e1008874. [CrossRef]
23. Hernandez-Vargas, E.A.; Wilk, E.; Canini, L.; Toapanta, F.R.; Binder, S.C.; Uvarovskii, A.; Ross, T.M.; Guzman, C.A.; Perelson, A.S.;Meyer-Hermann, M. Effects of Aging on Influenza Virus Infection Dynamics. J. Virol. 2014, 88, 4123–4131. [CrossRef] [PubMed]
24. Peiris, J.S.M.; Cheung, C.Y.; Leung, C.Y.H.; Nicholls, J.M. Innate Immune Responses to Influenza A H5N1: Friend or Foe? TrendsImmunol. 2009, 30, 574–584. [CrossRef] [PubMed]
25. Shinya, K.; Ito, M.; Makino, A.; Tanaka, M.; Miyake, K.; Eisfeld, A.J.; Kawaoka, Y. The TLR4-TRIF Pathway Protects against H5N1Influenza Virus Infection. J. Virol. 2012, 86, 19–24. [CrossRef] [PubMed]
26. Neumann, G.; Chen, H.; Gao, G.F.; Shu, Y.; Kawaoka, Y. H5N1 Influenza Viruses: Outbreaks and Biological Properties. Cell Res.2010, 20, 51–61. [CrossRef]
27. Shinya, K.; Gao, Y.; Cilloniz, C.; Suzuki, Y.; Fujie, M.; Deng, G.; Zhu, Q.; Fan, S.; Makino, A.; Muramoto, Y.; et al. IntegratedClinical, Pathologic, Virologic, and Transcriptomic Analysis of H5N1 Influenza Virus-Induced Viral Pneumonia in the RhesusMacaque. J. Virol. 2012, 86, 6055–6066. [CrossRef]
28. Muramoto, Y.; Shoemaker, J.E.; Mai, L.T.Q.; Itoh, Y.; Tamura, D.; Sakai-Tagawa, Y.; Imai, H.; Uraki, R.; Takano, R.;Kawakami, E.; et al. Disease Severity Is Associated with Differential Gene Expression at the Early and Late Phases of Infection inNon-Human Primates Infected with Different H5N1 Highly Pathogenic Avian Influenza Viruses. J. Virol. 2014, 88, 8981–8997.[CrossRef]
29. Kobasa, D.; Jones, S.M.; Shinya, K.; Kash, J.C.; Copps, J.; Ebihara, H.; Hatta, Y.; Kim, J.H.; Halfmann, P.; Hatta, M.; et al. AberrantInnate Immune Response in Lethal Infection of Macaques with the 1918 Influenza Virus. Nature 2007, 445, 319–323. [CrossRef]
30. Diamond, G.; Legarda, D.; Ryan, L.K. The Innate Immune Response of the Respiratory Epithelium. Immunol. Rev. 2000, 173, 27–38.[CrossRef]
31. Koyama, S.; Ishii, K.J.; Coban, C.; Akira, S. Innate Immune Response to Viral Infection. Cytokine 2008, 43, 336–341. [CrossRef]32. Petes, C.; Odoardi, N.; Gee, K. The Toll for Trafficking: Toll-like Receptor 7 Delivery to the Endosome. Front. Immunol. 2017, 8, 1.
[CrossRef]33. Rehwinkel, J.; Gack, M.U. RIG-I-like Receptors: Their Regulation and Roles in RNA Sensing. Nat. Rev. Immunol. 2020, 20, 537–551.
[CrossRef] [PubMed]34. Liu, T.; Zhang, L.; Joo, D.; Sun, S.C. NF-KB Signaling in Inflammation. Signal Transduct. Target. Ther. 2017, 2, e17023. [CrossRef]
[PubMed]35. Rajsbaum, R.; Albrecht, R.A.; Wang, M.K.; Maharaj, N.P.; Versteeg, G.A.; Nistal-Villán, E.; García-Sastre, A.; Gack, M.U. Species-
Specific Inhibition of RIG-I Ubiquitination and IFN Induction by the Influenza A Virus NS1 Protein. PLoS Pathog. 2012, 8, e1003059.[CrossRef] [PubMed]
36. Gack, M.U.; Albrecht, R.A.; Urano, T.; Inn, K.S.; Huang, I.C.; Carnero, E.; Farzan, M.; Inoue, S.; Jung, J.U.; García-Sastre, A.Influenza A Virus NS1 Targets the Ubiquitin Ligase TRIM25 to Evade Recognition by the Host Viral RNA Sensor RIG-I. Cell HostMicrobe 2009, 5, 439–449. [CrossRef]
37. Koyama, S.; Ishii, K.J.; Kumar, H.; Tanimoto, T.; Coban, C.; Uematsu, S.; Kawai, T.; Akira, S. Differential Role of TLR- andRLR-Signaling in the Immune Responses to Influenza A Virus Infection and Vaccination. J. Immunol. 2007, 179, 4711–4720.[CrossRef]
38. Zeng, H.; Goldsmith, C.; Thawatsupha, P.; Chittaganpitch, M.; Waicharoen, S.; Zaki, S.; Tumpey, T.M.; Katz, J.M. HighlyPathogenic Avian Influenza H5N1 Viruses Elicit an Attenuated Type I Interferon Response in Polarized Human BronchialEpithelial Cells. J. Virol. 2007, 81, 12439–12449. [CrossRef]
39. Channappanavar, R.; Fehr, A.R.; Zheng, J.; Wohlford-Lenane, C.; Abrahante, J.E.; Mack, M.; Sompallae, R.; McCray, P.B.;Meyerholz, D.K.; Perlman, S. IFN-I Response Timing Relative to Virus Replication Determines MERS Coronavirus InfectionOutcomes. J. Clin. Investig. 2019, 129, 3625–3639. [CrossRef]
40. Galani, I.E.; Rovina, N.; Lampropoulou, V.; Triantafyllia, V.; Manioudaki, M.; Pavlos, E.; Koukaki, E.; Fragkou, P.C.; Panou, V.;Rapti, V.; et al. Untuned Antiviral Immunity in COVID-19 Revealed by Temporal Type I/III Interferon Patterns and FluComparison. Nat. Immunol. 2021, 22, 32–40. [CrossRef]
41. Lee, J.; Adler, F.R.; Kim, P.S. A Mathematical Model for the Macrophage Response to Respiratory Viral Infection in Normal andAsthmatic Conditions. Bull. Math. Biol. 2017, 79, 1979–1998. [CrossRef]

Viruses 2022, 14, 906 17 of 17
42. Kumagai, Y.; Takeuchi, O.; Kato, H.; Kumar, H.; Matsui, K.; Morii, E.; Aozasa, K.; Kawai, T.; Akira, S. Alveolar Macrophages Arethe Primary Interferon-Alpha Producer in Pulmonary Infection with RNA Viruses. Immunity 2007, 27, 240–252. [CrossRef]
43. Weiss, J.N. The Hill Equation Revisited: Uses and Misuses. FASEB J. 1997, 11, 835–841. [CrossRef] [PubMed]44. Waldrop, S.L.; Davis, K.A.; Maino, V.C.; Picker, L.J. Normal Human CD4+ Memory T Cells Display Broad Heterogeneity in Their
Activation Threshold for Cytokine Synthesis. J. Immunol. 1998, 161, 5284–5295. [PubMed]45. Itoh, Y.; Germain, R.N. Single Cell Analysis Reveals Regulated Hierarchical T Cell Antigen Receptor Signaling Thresholds and
Intraclonal Heterogeneity for Individual Cytokine Responses of CD4+ T Cells. J. Exp. Med. 1997, 186, 757–766. [CrossRef][PubMed]
46. Dawson, T.C.; Beck, M.A.; Kuziel, W.A.; Henderson, F.; Maeda, N. Contrasting Effects of CCR5 and CCR2 Deficiency in thePulmonary Inflammatory Response to Influenza A Virus. Am. J. Pathol. 2000, 156, 1951–1959. [CrossRef]
47. Lin, K.L.; Suzuki, Y.; Nakano, H.; Ramsburg, E.; Gunn, M.D. CCR2 + Monocyte-Derived Dendritic Cells and Exudate MacrophagesProduce Influenza-Induced Pulmonary Immune Pathology and Mortality. J. Immunol. 2008, 180, 2562–2572. [CrossRef]
48. Wales, D.J.; Doye, J.P.K. Global Optimization by Basin-Hopping and the Lowest Energy Structures of Lennard-Jones ClustersContaining up to 110 Atoms. J. Phys. Chem. A 1997, 101, 5111–5116. [CrossRef]
49. Virtanen, P.; Gommers, R.; Oliphant, T.E.; Haberland, M.; Reddy, T.; Cournapeau, D.; Burovski, E.; Peterson, P.; Weckesser, W.;Bright, J.; et al. SciPy 1.0: Fundamental Algorithms for Scientific Computing in Python. Nat. Methods 2020, 17, 261–272. [CrossRef]
50. Geyer, C.J. Markov Chain Monte Carlo Maximum Likelihood, Computing Science and Statistics. In Proceedings of the 23rdSymposium Interface, Seattle, DC, USA, 21–24 April 1991; pp. 156–163.
51. Metropolis, N.; Rosenbluth, A.W.; Rosenbluth, M.N.; Teller, A.H.; Teller, E. Equation of State Calculations by Fast ComputingMachines. J. Chem. Phys. 1953, 21, 1087–1092. [CrossRef]
52. Akaike, H. A New Look at the Statistical Model Identification. IEEE Trans. Autom. Control. 1974, 19, 716–723. [CrossRef]53. Saltelli, A.; Bolado, B. An Alternative Way to Compute Fourier Amplitude Sensitivity Test (FAST); Elsevier: Amsterdam, The
Netherlands, 1998.54. Marino, S.; Hogue, I.B.; Ray, C.J.; Kirschner, D.E. A Methodology for Performing Global Uncertainty and Sensitivity Analysis in
Systems Biology. J. Theor. Biol. 2008, 254, 178–196. [CrossRef]55. Herman, J.; Usher, W. SALib: An Open-Source Python Library for Sensitivity Analysis. J. Open Source Softw. 2017, 2, 97. [CrossRef]56. Perrone, L.A.; Plowden, J.K.; García-Sastre, A.; Katz, J.M.; Tumpey, T.M. H5N1 and 1918 Pandemic Influenza Virus Infection
Results in Early and Excessive Infiltration of Macrophages and Neutrophils in the Lungs of Mice. PLoS Pathog. 2008, 4, e1000115.[CrossRef] [PubMed]
57. Yu, W.C.L.; Chan, R.W.Y.; Wang, J.; Travanty, E.A.; Nicholls, J.M.; Peiris, J.S.M.; Mason, R.J.; Chan, M.C.W. Viral Replication andInnate Host Responses in Primary Human Alveolar Epithelial Cells and Alveolar Macrophages Infected with Influenza H5N1and H1N1 Viruses. J. Virol. 2011, 85, 6844. [CrossRef]
58. Mi, Z.; Ma, Y.; Tong, Y. Avian Influenza Virus H5N1 Induces Rapid Interferon-Beta Production but Shows More Potent Inhibitionto Retinoic Acid-Inducible Gene i Expression than H1N1 in Vitro. Virol. J. 2012, 9, 145. [CrossRef] [PubMed]
59. Cate, T.R. Clinical Manifestations and Consequences of Influenza. Am. J. Med. 1987, 82, 15–19. [CrossRef]60. Cromer, D.; van Hoek, A.J.; Jit, M.; Edmunds, W.J.; Fleming, D.; Miller, E. The Burden of Influenza in England by Age and Clinical
Risk Group: A Statistical Analysis to Inform Vaccine Policy. J. Infect. 2014, 68, 363–371. [CrossRef]
Copyright © 2022 FDOKUMEN