Dietary fiber and protein: Changes in degradation ... - Pure
185
Dietary fiber and protein: Changes in degradation, fermentation pattern and metabolic response of lean and obese pigs Yetong Xu PhD Thesis August 2020 Department of Animal Science Graduate School of Technical Sciences Aarhus University, Foulum Denmark
-
Upload
khangminh22 -
Category
Documents
-
view
0 -
download
0
Transcript of Dietary fiber and protein: Changes in degradation ... - Pure

Dietary fiber and protein: Changes in degradation,
fermentation pattern and metabolic response of lean and
obese pigs
Yetong Xu
PhD Thesis
August 2020
Department of Animal Science
Graduate School of Technical Sciences
Aarhus University, Foulum
Denmark

SUPERVISORS
Senior scientist Helle Nygaard Lærke, Department of Animal Science, Faculty of Technical
Sciences, Aarhus University
Senior scientist Mette Skou Hedemann, Department of Animal Science, Faculty of Technical
Sciences, Aarhus University
Professor Knud Erik Bach Knudsen, Department of Animal Science, Faculty of Technical
Sciences, Aarhus University
ASSESSMENT COMMITTEE
Senior scientist, Ph.D., Ole Højberg (Chairman), Department of Animal Science, Faculty of
Technical Sciences, Aarhus University, Denmark
Senior research scientist, Ph.D., Sergio Polakof, Human Nutrition, French National Institute
for Agricultural Research (INRA), France
Senior Lecturer, Associate Professor, Ph.D., Anne Nilsson, Department of Food Technology,
Engineering and Nutrition, Lund University, Sweden

I
Preface
This thesis is based on research conducted during my enrolment as a PhD student at the Department
of Animal Science, Aarhus University from September 2017 until August 2020. The thesis includes
data from two animal experiments from two separate projects:
1. MERITS (Metabolic changes by carbohydrate and protein quality in the development and
mitigation of metabolic syndrome) funded by Innovation Fund Denmark (Project no. 4105-
00002B) in collaboration with Aarhus University Hospital, University of California, Davis,
Norwegian University of Life Science, Arla Food Ingredients/Arla Food, Lantmännen R&D,
DuPont Nutrition Biosciences and Ellegaard Gӧttingen Minipigs.
2. ELIN (The effects of enterolignans in chronic disease) funded by Innovation Fund Denmark
(Project no. 0603-00580B) in collaboration with Danish Cancer Society Research Center,
Swedish University of Agricultural Sciences, Lantmännen R&D and DuPont Nutrition
Biosciences.
The PhD project included a stay abroad from April 2018 to July 2018 in the lab of Professor Maria
L. Marco, PhD, Department of Food Science & Technology, University of California, Davis, U.S.A.,
founded by the Graduate School of Science and Technology at Aarhus University.
The animal experiment from MERITS project was completed in March 2017. I am responsible for
sample analysis and data handling of short chain fatty acid (SCFA), microbiota, starch and non-starch
polysaccharides (NSP) of gut content, which are included in Paper I and Paper II. The animal trials
and sample analysis of ELIN project have been completed by others before I enrolled. I was
responsible for data analysis of nutrient digestibility, NSP composition in gut content, SCFA in gut
content and blood and correlations between intestinal microbiota and metabolites, which are included
in Paper III.
This PhD project aims to study the detailed mechanisms of how dietary fiber and protein interact
with the microbiota profile, production and absorption of SCFA and metabolic response, thereby
enhance metabolic health using pigs as models for humans.

II
Acknowledgement
There are so many people encouraging and motivating me during my PhD study and I would never
finish my study without your help. I’m very grateful to all the people who have supported me during
my stay in Denmark.
First of all, I would like to thank my main supervisor Helle Nygaard Lærke, for her patient
supervision and valuable suggestions along the way. Thank you for providing me an opportunity to
study in Denmark and work with a group of wonderful people in Foulum. Your deep understanding
in nutrition and physiology always impress me, and I feel so lucky to have you as my role model in
research. More importantly, thanks for your constructive and precise guidance for my study to help
me improve my understanding in my PhD project and writing skills, moreover, support me and lead
me to this scientific road.
Then I would like to thank my co-supervisor, Knud Eric Bach Knudsen, for giving me the possibility
to join in MERITS project. Thanks for being my main-supervisor for a few months and providing
great supervision in my PhD study and valuable comments in my manuscripts. In addition, I would
like to thank my co-supervisor Mette Skou Hedemann for your kind support and encouragement, and
always constructive and detailed input in my PhD study.
Thanks everyone involved in the MERITS project for their contributions and helpful advice. I would
like to extend my gratitude to Professor Maria L. Marco to give me the opportunity to stay abroad
for three months in her lab at University of California, Davis. Special thanks to Zach and Jason for
your help and guidance in analyzing microbiota and data handling and thanks Zhengyao Xue, Jinlin
Guo, Annabelle Yu, Eric Stevens and Dustin Heeney for kind care and making my stay so
memorable.
Many thanks to all my colleagues at the Department of Animal Science especially Winnie Østergaard,
Lisbeth Mӓrcher, Stina Greis Handberg, Kasper Vrangstrup Poulsen and Thomas Rebsdorf for
excellent technical assistance in my lab work and thanks Leslie Foldager for supporting me on data
handling. I also want to thank Mihai Curtasu for providing so much help for me about the animal
experiments and sample analysis.
Last but not least, my deepest thanks go to my Chinese friends and family for always being supportive
and for believing in me. I would never forget the help and kind care from Xiangyu Guo, Yuan Yue,
Pan Zhou, Long Chen, Kun Zhou, Zhi Liang and Qianying Yi, thank you for making my work and
stay in Foulum so enjoyable. Thanks my best friend Kangni Liu who works in Japan but always
support and comfort me when I’m upset, you always bring me a lot of fun and I’m so lucky to have
you as my bestie for 11 years. Heartfelt thanks to my parents and brother who support me to do
whatever I want, and I would never finish my study and work in Denmark without your love.
Yetong Xu,
August 2020

III
Summary
The rising prevalence of obesity, accompanied by increased risk of metabolic syndrome (MetS) is
raising a worldwide alarm. One of the major factors is the western lifestyle including an unhealthy
diet with high fat and refined carbohydrate contents. Dietary fiber (DF) intake has been proved to
have health beneficial properties such as modulating digestion processes, improving microbiota
profile, and short chain fatty acid (SCFA) production, which are linked to a lower risk of MetS
including cardiovascular disease and type 2 diabetes. Some dietary proteins have insulinotropic
effects, especially the abundant branched chain amino acids of whey protein have been shown to be
efficient in promoting postprandial insulin and incretin, therefore improving the glycemic and insulin
responses.
In this PhD thesis, the effects of dietary strategies based on low or high DF meals rich in arabinoxylan
(AX) and low or high protein contents by addition of whey protein hydrolysate on metabolic
responses and fermentation profile were studied using an obese Gӧttingen Minipig model. Before the
DF and protein intervention, forty-three minipigs were fed a high fat high fructose diet for 20 weeks
to induce obesity. After that, the minipigs were assigned to one of four diets for 8-week ad libitum
feeding. Metabolic responses of blood and urine samples taken in the fasting and non-fasting states
were determined, gene expression of liver, muscle and adipose tissues, carbohydrate, SCFA and
microbiota in gut content were analyzed. In another study, the effects of DF ingredients on digestion
and fermentation processes as well as SCFA absorption were investigated by feeding a rye bran (RB)
diet high in AX to conventional pigs (n = 20) to make a comparison with a refined wheat fiber
(Control) diet high in cellulose (n = 10). Half of the pigs fed the RB diets was treated with antibiotics
to study if it would modify the effects of the RB diets on macronutrient digestibility, DF degradation,
SCFA production and absorption.
The first experiment showed that a high DF content reduced weight gain and improved the C-peptide
secretion of obese minipigs in the non-fasting state without alleviating mild tissue inflammation.
However, a high dietary protein content increased weight gain, and unfavorably altered metabolic
biomarkers and gene expression related to carbohydrate metabolism. AX in the high-DF diets was
degraded until the mid colon, stimulated the abundance of butyrogenic genera, slightly increased
intestinal butyrate production and circulating butyrate levels. High dietary protein also contributed
to intestinal SCFA production, decreased circulating succinate levels, but did not show prebiotic
effects, and proteolytic fermentation was attenuated by high DF. Overall, the modulated fermentation
profile could be linked with the potential mechanisms of the effects of DF and protein on metabolic
responses separately, and a combination of high DF and protein did not have a synergistic effect on

IV
metabolic health in this study. The second experiment showed that the RB diets slowed down and
decreased the protein degradation in the gut. AX in the RB diets was mainly degraded in the cecum
and proximal colon, showed higher butyrate production - but not absorption - compared with the
Control diet. Cellulose in the Control diet was slowly degraded along the large intestine and increased
the production and absorption of total SCFA, acetate and propionate, which influenced the plasma
lipid profile. Although the use of antibiotics did not show noticeable change in the degradation
process, it led to a reduction in butyrate production. Collectively, the study demonstrated that the
intestinal degradation and fermentation patterns were closely associated with the DF ingredients,
which resulted in different profiles of SCFA production and absorption.
In conclusion, the results in this PhD study show how DF and protein influence the metabolic
responses by associating them with the intestinal degradation and fermentation patterns, and provide
a greater understanding regarding the mechanisms of dietary strategies to modulate MetS.
V
Dansk resumé
Forekomst af fedme og deraf følgende forekomst af metabolisk syndrom (MetS) stiger alarmerende
verden over. En af de væsentlige faktorer er den vestlige livsstil, som omfatter en usund kost med
højt indhold af fedt og raffinerede kulhydrater. Indtag af kostfibre (DF) har vist sig at have
sundhedsgavnlige effekter såsom ændring af fordøjelsesprocesser, forbedring af mikrofloraens
sammensætning og produktion af kortkædede fedtsyrer (SCFA), hvilket er forbundet med en lavere
risiko for MetS, inklusiv kardiovaskulære sygdomme og type 2 diabetes. Nogle fødevareproteiner
har insulinotrofiske effekter, især den høje forekomst af forgrenede aminosyrer i valleprotein har vist
sig at stimulere det postprandiale insulin- og inkretinrespons og dermed forbedreglukose- og
insulinresponset.
I denne PhD afhandling blev effekter af fodringsstrategier baseret på lav eller høj DF diæter med højt
indhold af arabinoxylan (AX) og lavt eller højt indhold af protein baseret på tilsætning af
valleproteinhydrolysat på det metaboliske respons og fermenteringsprofilen studeret i en fed
Gӧttingen Minigrisemodel. Før interventionen med DF og protein var 43 minigrise blevet fodret med
en diæt med højt indhold af fedt og fruktose i 20 uger for at inducere fedme. Herefter blev grisene
allokeret til en af fire diæter i 8 uger med ad libitum fodring. Metaboliske responser blev målt i blod
taget fastende og ikke-fastende, genekspression blev målt i lever-, muskel- og fedtvæv, og
kulhydrater, fermenteringsprodukter og mikrobiotasammensætning i tarmindhold blev analyseret. I
et andet forsøg blev effekt af fiberingredienser på fordøjelses- og fermenteringsprocesser samt SCFA
absorption undersøgt i konventionelle grise (n = 20), der blev fodret med en rugklidsbaseret diæt
(RB) med højt indhold af AX og sammenlignet med grise fodret med kontroldiæt indeholdende
raffineret hvedefibre med højt celluloseindhold (n = 10). Halvdelen af grisene i RB gruppen blev
behandlet med antibiotika for at undersøge, om dette ville påvirke effekten af RB diæten på
makronæringsstoffernes fordøjelighed, nedbrydning af DF, samt SCFA produktion og absorption.
Det første forsøg viste, at et højt fiberindhold reducerede vægtøgning og forbedrede sekretionen af
C-peptid i de fede minigrise i ikke-fastende tilstand uden at dæmpe den milde vævsinflammation.
Derimod øgede et højt proteinindhold vægtstigningen og ændrede metaboliske biomarkører samt
ekspression af gener relateret til kulhydratomsætning i ugunstig retning. AX i høj-DF diæterne blev
nedbrudt indtil midten af kolon, stimulerede forekomsten af butyrogene bakterieslægter, samt øgede
den intestinale produktion og det cirkulerende niveauer af butyrat (smørsyre) i moderat omfang. Et
højt proteinindhold bidrog også til SCFA produktion i tarmen, reducerede det cirkulerende niveau af
succinat (ravsyre), men havde ingen prebiotiske effekter, og den proteolytiske fermentering blev
dæmpet af et højt DF indhold. Overordnet kunne en ændret fermentationsprofil forbindes med de
VI
potentielle mekanismer for effekt af henholdsvis DF og protein på metabolisk sundhed, og i dette
studie sås ingen synergistisk effekt af at kombinere DF og protein. Det andet forsøg viste, at RB
diæterne forsinkede og reducerede proteinnedbrydningen i tarmen. AX i RB grupperne blev
hovedsagelig nedbrudt i blindtarmen og den forreste del af kolon, og viste samtidig en højere
butyratproduktion - men ikke absorption - sammenlignet med kontroldiæten. Cellulose i
kontroldiæten blev langsomt nedbrudt gennem tyktarmen og øgede produktionen og absorptionen af
total SCFA, acetat og propionat, hvilket påvirkede plasmalipid-profilen. Selvom brugen af
antibiotika ikke viste nævneværdige ændringer i nedbrydningsprocessen, førte det til en reduktion i
butyratproduktionen. Samlet viste studiet, at den intestinale nedbrydning og fermenteringsmønsteret
var tæt forbundet med DF kilderne, hvilket resulterede i forskellige profiler for SCFA produktion og
absorption.
Sammenfattende viser resultaterne i dette PhD studium, hvordan DF og protein påvirker det
metaboliske respons gennem deres association til nedbrydning og fermenteringsmønster i tarmen, og
studiet bidrager til en større forståelse af de mekanismer, hvorved forskellige koststrategier påvirker
MetS.

VII
My own contributions to the thesis
This PhD thesis comprises three manuscripts based on two animal experiments performed at Aarhus
University. The animal experimental work was completed before I enrolled. Therefore, I was not
involved in planning the studies, but I contributed proportionally in conduction the research by
conducting the analytical work, moreover, was responsible for data handling, interpretation and
presentation; drafting, revising and submitting the manuscripts to peer-reviewed journals. In Paper
I, I performed the data handling and statistical analysis of metabolic biomarkers in blood and urine
samples and gene expression of liver, muscle and adipose tissues and wrote the manuscript; In Paper
II, I conducted the sample analysis of carbohydrates (starch and NSP), SCFA and microbiota of gut
content, performed data handling and wrote, revised and submitted the manuscript; For Paper III, I
accomplished data analysis of nutrient digestibility, carbohydrate and SCFA composition in gut
content and SCFA in the blood samples, correlation analysis of intestinal microbiota and metabolites,
drafted, revised and submitted the manuscript.
For the residual parts of the thesis, I have written all of it and my main supervisor Helle Nygaard
Lærke has given feedback especially in linguistic accuracy and appropriateness, data analysis,
scientific perspectives, suggestions about writing structure and coherence of my thesis and the
manuscripts. My co-supervisors Mette Skou Hedemann and Knud Eric Bach Knudsen have given
their feedback mainly to linguistic expressions, scientific perspectives and rhetorical organization of
the manuscripts.
There are no conflicts of interest to declare in this thesis.
VIII
Other scientific contribution
Scientific paper
‘Obesity-related Metabolome and Gut Microbiota Profiles of Juvenile Göttingen Minipigs – Long-
term Intake of Fructose and Resistant Starch’
Mihai V. Curtasu, Valeria Tafintseva, Zachary Bendiks, Maria L. Marco, Achim Kohler, Yetong Xu, Helle
Nygaard Lærke, Knud Erik Bach Knudsen, Mette Skou Hedemann; Manuscript in preparation.
Presentation at conferences
Oral presentation: ‘Does ad libitum access to carbohydrates influence the development of obesity
and MetS in Göttingen Minipigs - and can it be reverted by fiber and protein?’
The 7th Porcine Biomedical Models meeting, 22 November 2018, University of Copenhagen.
Planned presentation: ‘Microbiome alterations in response to dietary fiber and protein in obese
Göttingen Minipigs?’
The 14th Minipig Research Forum, 13-15 May 2020, Lisbon, Portugal. (The meeting was cancelled due to
Covid-19)
Scientific assistance
Assisted the PhD course ‘Carbohydrates emphasis on nutrition and intestinal health of non-ruminant
animals’
Conducted SCFA analysis of faeces in the human study of MERITS project
IX
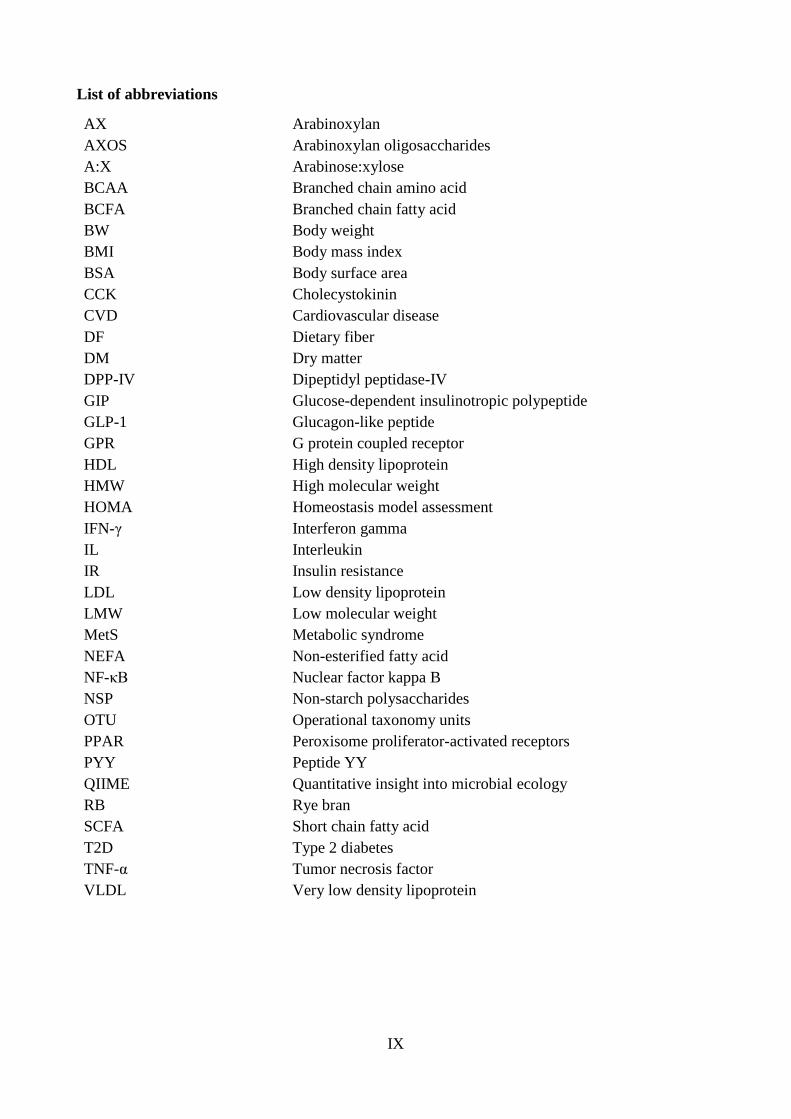
List of abbreviations
AX Arabinoxylan
AXOS Arabinoxylan oligosaccharides
A:X Arabinose:xylose
BCAA Branched chain amino acid
BCFA Branched chain fatty acid
BW Body weight
BMI Body mass index
BSA Body surface area
CCK Cholecystokinin
CVD Cardiovascular disease
DF Dietary fiber
DM Dry matter
DPP-IV Dipeptidyl peptidase-IV
GIP Glucose-dependent insulinotropic polypeptide
GLP-1 Glucagon-like peptide
GPR G protein coupled receptor
HDL High density lipoprotein
HMW High molecular weight
HOMA Homeostasis model assessment
IFN-γ Interferon gamma
IL Interleukin
IR Insulin resistance
LDL Low density lipoprotein
LMW Low molecular weight
MetS Metabolic syndrome
NEFA Non-esterified fatty acid
NF-κB Nuclear factor kappa B
NSP Non-starch polysaccharides
OTU Operational taxonomy units
PPAR Peroxisome proliferator-activated receptors
PYY Peptide YY
QIIME Quantitative insight into microbial ecology
RB Rye bran
SCFA Short chain fatty acid
T2D Type 2 diabetes
TNF-α Tumor necrosis factor
VLDL Very low density lipoprotein
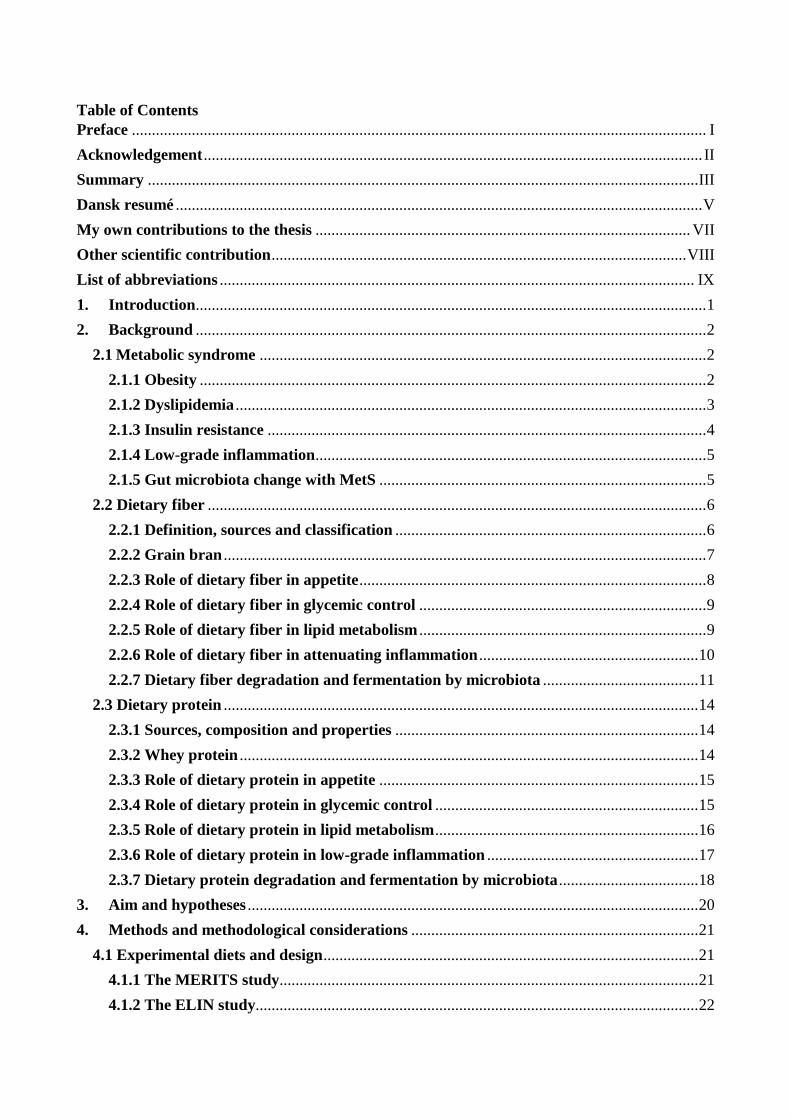
Table of Contents
Preface ................................................................................................................................................ I
Acknowledgement ............................................................................................................................. II
Summary .......................................................................................................................................... III
Dansk resumé .................................................................................................................................... V
My own contributions to the thesis .............................................................................................. VII
Other scientific contribution ........................................................................................................ VIII
List of abbreviations ....................................................................................................................... IX
1. Introduction................................................................................................................................ 1
2. Background ................................................................................................................................ 2
2.1 Metabolic syndrome ................................................................................................................ 2
2.1.1 Obesity ............................................................................................................................... 2
2.1.2 Dyslipidemia ...................................................................................................................... 3
2.1.3 Insulin resistance .............................................................................................................. 4
2.1.4 Low-grade inflammation .................................................................................................. 5
2.1.5 Gut microbiota change with MetS .................................................................................. 5
2.2 Dietary fiber ............................................................................................................................. 6
2.2.1 Definition, sources and classification .............................................................................. 6
2.2.2 Grain bran ......................................................................................................................... 7
2.2.3 Role of dietary fiber in appetite ....................................................................................... 8
2.2.4 Role of dietary fiber in glycemic control ........................................................................ 9
2.2.5 Role of dietary fiber in lipid metabolism ........................................................................ 9
2.2.6 Role of dietary fiber in attenuating inflammation ....................................................... 10
2.2.7 Dietary fiber degradation and fermentation by microbiota ....................................... 11
2.3 Dietary protein ....................................................................................................................... 14
2.3.1 Sources, composition and properties ............................................................................ 14
2.3.2 Whey protein ................................................................................................................... 14
2.3.3 Role of dietary protein in appetite ................................................................................ 15
2.3.4 Role of dietary protein in glycemic control .................................................................. 15
2.3.5 Role of dietary protein in lipid metabolism .................................................................. 16
2.3.6 Role of dietary protein in low-grade inflammation ..................................................... 17
2.3.7 Dietary protein degradation and fermentation by microbiota ................................... 18
3. Aim and hypotheses ................................................................................................................. 20
4. Methods and methodological considerations ........................................................................ 21
4.1 Experimental diets and design .............................................................................................. 21
4.1.1 The MERITS study......................................................................................................... 21
4.1.2 The ELIN study............................................................................................................... 22

4.2 Pigs as experimental models for humans............................................................................. 23
4.3 Obesity measurement ............................................................................................................ 24
4.4 Insulin sensitivity assessment................................................................................................ 25
4.5 Gut microbiota analysis ........................................................................................................ 25
4.6 SCFA production and circulation ........................................................................................ 26
4.7 Type and administration route of antibiotics ...................................................................... 27
4.8 Statistical methods ................................................................................................................. 27
5. Brief summary of results ............................................................................................................. 28
6. Paper ............................................................................................................................................. 31
6.1 Paper I ..................................................................................................................................... 31
6.2 Paper II ................................................................................................................................... 71
6.3 Paper III ............................................................................................................................... 112
7. Discussion ................................................................................................................................... 147
7.1 Obesity development of minipig models ............................................................................ 147
7.2 Clinical parameters associated with MetS in minipig models ......................................... 148
7.3 Dietary fiber degradation and nutrient digestion ............................................................. 150
7.4 SCFA production and circulation ...................................................................................... 152
7.5 Microbiome profile .............................................................................................................. 154
8. Conclusion and perspectives ..................................................................................................... 157
References ....................................................................................................................................... 160
1
1. Introduction
The prevalence of obesity is rising worldwide and it has become a critical risk factor for the
development of metabolic syndrome (MetS) including type 2 diabetes, cardiovascular disease,
dyslipidemia and some cancers. Easy access to high in fat, calories, and refined sugar food is a critical
factor responsible for the obesity development (1). Excessive nutrient intake stimulates the synthesis
of triglycerides and lead to an abnormal fat accumulation, which is closely linked with insulin
resistance, hypertention and inflammation (2). Therefore, controlling the development of MetS
becomes greatly significant for public health and it is of interest to investigate if dietary interventions
can prevent metabolic alterations and alleviate obesity–related MetS.
Intake of dietary fiber (DF) obtained from cereals, fruits and vegetables has been associated with
lower risk of MetS (3). DF can not be digested by endogenous enzymes in the small intestine and can
be delivered to large intestine and to some extent fermented by the intestinal microbiota into short-
chain fatty acid (SCFA). The profile of microbiota and their SCFA production in the large intestine
vary depending on different type and composition of DF. For instance, arabinoxylan is an efficient
substrate for intestinal butyrate production as well as enrichment of butyrogenic species (4). SCFA
produced in the gut can signal through receptors on enteroendocrine cells, influence the secretion of
gut hormones to increase satiety and insulin sensitivity (5). Additionally, absorbed SCFA can
influence the release of adipokines, which may inhibit lipolysis and ectopic fat storage (6, 7). Another
food component of interest associated with metabolic health is dietary protein of which some have
shown an insulinotropic effect, e.g. whey protein, as a major constituent of milk protein, can raise
the postprandial levels of branched-chain amino acid and acutely improve lipid profile in subjects
with MetS (8, 9). Observational studies indicate that the insulinotropic effect of whey protein also
affects postprandial glucose response in both healthy and obese subjects (10-12).
Both DF and protein have been shown have beneficial effects on metabolic health, the underlying
biochemical mechanisms of action have not been clearly identified. Pigs have similar metabolic
features and can response similarly to dietary interventions compared with humans (13). In this
thesis, we use obese minipigs and conventional pigs as models to investigate how diets changing in
DF and protein composition influence intestinal degradation pattern, microbiota composition, SCFA
production and absorption, thereby associate them with metabolic response.

2
2. Background
2.1 Metabolic syndrome
Metabolic syndrome (MetS) is a combination of risk factors for the development of obesity, type 2
diabetes (T2D), cardiovascular disease (CVD) and many cancers. MetS is defined in various ways
over time by different expert groups and organizations. In 2009, International Diabetes Federation
(IDF) and the American Heart Association/National Heart, Lung, and Blood Institute (AHA/NHLBI)
representatives proposed the common definition for the clinical diagnosis of the MetS (Table 1) (14).
Patients who fulfil the criteria of MetS have a two-fold increased risk of CVD, three-fold increased
risk of diabetes and 1.5-fold increased risk of all-cause mortality (15).
Table 1. Criteria for clinical diagnosis of the metabolic syndrome (14).
Measure Categorical cut points
Elevated waist circumference* Population- and country-specific definitions
Elevated triglycerides 150 mg/dL (1.7 mmol/L)
or drug treatment for elevated triglycerides
Reduced HDL 40 mg/dL (1.0 mmol/L) in males;
50 mg/dL (1.3 mmol/L) in females;
or drug treatment for low HDL
Elevated blood pressure Systolic 130 and/or diastolic 85 mm Hg
or drug treatment for hypertension
Elevated fasting glucose 100 mg/ dL (5.5 mmol/L)
or drug treatment for elevated levels
HDL indicates high-density lipoprotein cholesterol.
* It is recommended that the IDF cut points (waist > 94 cm for men or > 80 cm for women) be used for non-
Europeans and either the IDF or AHA/NHLBI cut points (waist > 102 cm for men or > 88 cm for women)
used for people of European origin until more data are available.
2.1.1 Obesity
Obesity is defined as abnormal or excessive fat accumulation that impair health, and it occurs when
fat amount exceeds the holding ability of subcutaneous depots. Since 1980, the prevalence of obesity
has doubled in more than 70 countries and now it is becoming the major world-wide nutritional
challenge, affecting both children and adults (15). The important cause for the rapid increase in
obesity rates is dietary energy intake exceeds energy expenditure with declined physical activity and
increased unhealthy, energy-dense food intake in the modern life (1). Up to 2015, approximately 604
million adults and 108 million children were considered as obese and the incidence of obesity in most
western countries was over 20% (16). Obesity can be evaluated through several different

3
anthropometric indexes such as body mass index (BMI, the weight in kilograms divided by the square
of the height in meters) and further be evaluated in terms of fat distribution through determining waist
circumference and waist-to-hip ratio. According to the World Health Organization (WHO), BMI is
classified as: normal weight (BMI: 18.5–24.9 kg/m2), overweight (BMI: 25.0–29.9 kg/m2), obesity
(BMI: 30.0–34.9 kg/m2), severe obesity (BMI: 35.0–39.9 kg/m2) and for morbid obesity (BMI ≥40
kg/m2) (17). From 1988 to 2010, average BMI in USA increased by 0.37% per year in both men and
women, while waist circumference increased by 0.37% and 0.27% per year in men and women,
respectively (18). The appearance of the MetS phenotype is provoked by accumulation of body fat
in other body compartments rather than subcutaneous tissue, particularly with an increase in
abdominal obesity mirrored by a large waist circumference (19). Obesity is the crucial factor to
induce MetS by showing increased insulin resistance (IR), postprandial lipidemia and low-grade
inflammation, which cause elevated risk of cardiovascular disease, type 2 diabetes (T2D),
dyslipidemia and hypertention (20). However, obesity is not always connected with MetS and some
metabolically healthy obese individuals who have high insulin sensitivity do not have hyperlipidemia
or other characteristics of MetS (18).
2.1.2 Dyslipidemia
Adipocytes and adipose tissue store the greatest amounts of body lipids and are the important for
endocrine and immune response, therefore, adipocyte and adipose tissue dysfunction caused by
obesity may increase the risk of metabolic disease such as dyslipidemia (21). Dyslipidemia is
characterized by numerous disturbances including increased triglyceride, low density lipoprotein
(LDL) cholesterol and apolipoprotein B levels and depressed high density lipoprotein (HDL)
cholesterol (22). Dyslipidemia is a risk factor of atherosclerotic cardiovascular disease and has a
strong correlation with obesity caused by excessive adipose tissue deposition (23). Approximately
60%-70% of obese people are dyslipidemic while 50%-60% of overweight people are dyslipidemic
(21). Surplus dietary intake of fat and glucose provides excessive sources for fat droplet accumulation
in the liver as well as the overproduction of very low density lipoprotein (VLDL), which can transport
triglycerides and contribute to the elevation in plasma triglyceride levels (24). The VLDL undergoes
enzymatic exchanges with LDL and HDL via cholesteryl ester transfer protein, and these triglyceride-
enriched LDL and HDL can be degraded by lipases into small and dense LDL and HDL, respectively
(21). The filtration of small and dense LDL particles into the arterial wall leads to the ultimate
development of atherosclerosis, therefore, the therapeutic target for dyslipidemia and cardiovascular
risk has focused on lowering LDL over the last two decades (25). HDL has been reported as an
athero-protective molecule and a marker of overall cardiovascular risk, every 0.026 mmol/L increase
in HDL is associated with an approximate 2-4% decrease in the risk of CVD (26). In obese subjects

4
with the fatty liver disease, the small and dense HDL induced by surplus VLDL formation can be
easily cleared by the kidney, causing lower HDL cholesterol levels (21). At the same time, high levels
of fatty acids can be released by the hypertrophic adipocytes in obese individuals due to the increased
basal lipolysis, which not only deteriorate the development of non-alcoholic fatty liver disease
(NAFLD) but also result in insulin resistance in peripheral organs (27, 28).
2.1.3 Insulin resistance
Insulin is an anabolic hormone produced by pancreatic β-cells and plays an important role in
carbohydrate metabolism as well as protein and lipid anabolic regulation. Metabolic dysfunction of
the interplay between glucose and insulin is evident in MetS. In the IR state, the inability of insulin
to promote glucose uptake in the muscle and to suppress gluconeogenesis in the liver leads to
hyperglycemia and subsequent compensatory hyperinsulinemia (29). IR has a pivotal role in the
pathogenesis of T2D, which accounted for more than 90% of 415 million patients with diabetes in
2015 (30). Patients with T2D have a 15% increased risk of all-cause mortality than people who do
not have diabetes (31). IR can manifest itself in many peripheral tissues including the liver, skeletal
muscle and adipose tissue. Among them, the liver plays an important role in determining fasting
hyperglycemia, therefore hepatic IR is a prediabetic state. It forces β cells of the pancreas to
continuously secrete insulin and ultimately results in the development of β cell failure of T2D.
Moreover, hepatic IR occurs when the fatty liver increases some lipid such as triglyceride secretion,
which can impair hepatic insulin signaling and result in reduced insulin activation of hepatic glycogen
synthesis and de novo lipogenesis (32). Similarly, the accumulation of intramyocellular lipid content
in skeletal muscle impairs insulin-stimulated glucose transport and glycogen synthesis, ultimately
leading to IR (29). Moreover, in adipocytes, insulin plays a critical role in suppressing lipolysis and
promoting lipid and glucose uptake (32). Therefore, IR in liver, muscle and adipose tissue can result
in increased lipolysis and more fatty acids delivery to liver for triglyceride synthesis, whereas hepatic
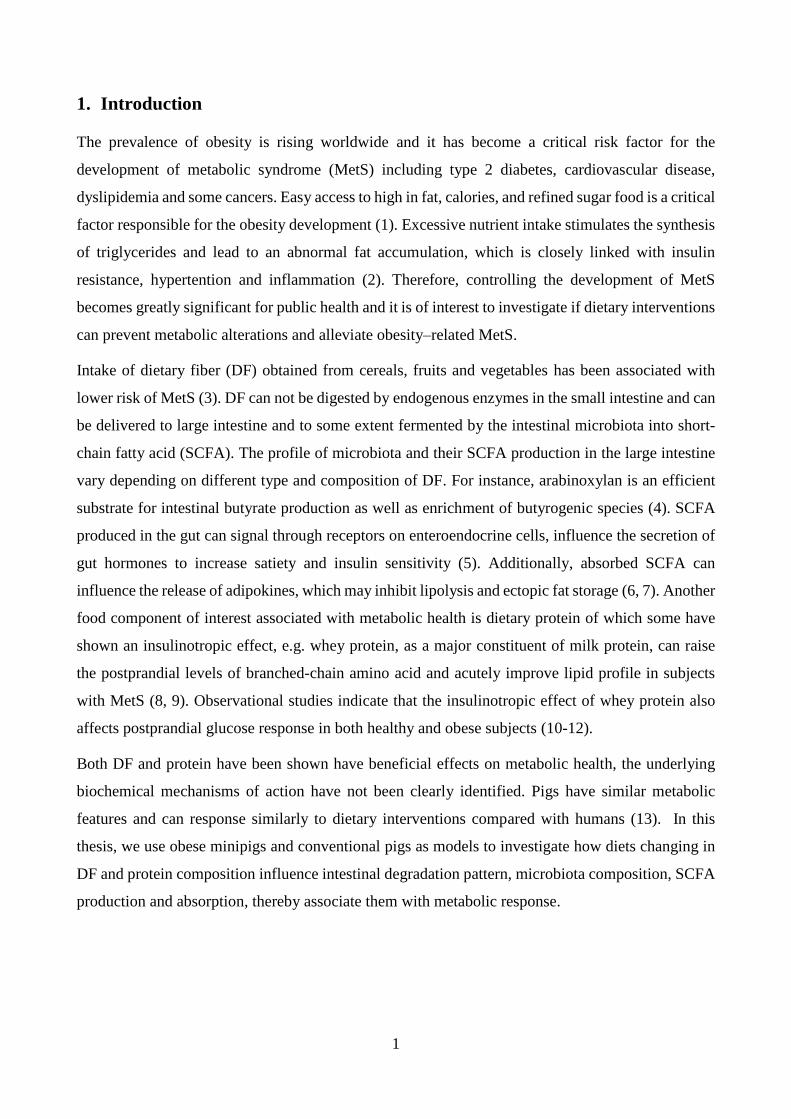
de novo lipogenesis is reduced due to the impaired hepatic insulin signaling (Figure 1).
(A)
5
Figure 1. (A) Insulin sensitive status: insulin regulates lipid metabolism via liver, muscle and adipose insulin
signaling. (B) Insulin resistance status: impaired regulation in lipid metabolism via liver, muscle and adipose
insulin signaling. Dotted lines represent decreased action or deceased flux. DNL, de novo lipogenesis; FA,
fatty acid; TAG, triglycerides; VLDL, very low density lipoprotein. Adapted from Samuel et al. (2016) (32).
2.1.4 Low-grade inflammation
Low-grade inflammation in adipose tissue is a common outcome of the development of obesity.
Increased adipose-derived fatty acids in obese individuals activate inflammatory signaling and
promote activation of macrophages in adipose tissue, which afterward spread to other tissues such as
liver and skeletal muscle (33). In a low grade inflammation state, increased infiltration and activation
of pro-inflammatory macrophages and some other immune cells are observed, resulting in more pro-
inflammatory cytokines and chemokines production and secretion (34). Moreover, low-grade
inflammation in adipose tissue is considered as a critical risk factor for the development of IR and
T2D in obese people. Factors that associated with promotion of IR progression include altered
secretion of adipocytokines and inflammatory cytokines by enlarged adipocytes and microphages
such as adiponectin, leptin, TNF-, interleukins and interferon gamma (IFN-γ), which can disrupt
insulin-receptor signaling and impact fatty acid transcription factors (like PPARγ) (35, 36). These
pro-inflammatory cytokines can activate Nuclear factor kappa B (NF-κB) pathway, which in turn
may exacerbate IR (36). The continuously increased systemic levels of inflammatory cytokines
including TNF, IL-4 and IL-8 is also a risk factor for the progression of inflammatory bowel disease
and colorectal cancer (37, 38).
2.1.5 Gut microbiota change with MetS
The western lifestyle with low DF intake, increased fat and sugar intake and lack of physical activity
may contribute to the development of intestinal disorders (39). Colorectal cancer is predominantly a
disease of western countries, it has become the third most common cancer type among men and the
second most common type among women (40). Moreover, the occurrence of this intestinal disorder
is accompanied by altered gut microbiota composition (41). The human gut is populated by trillions
of microbiota that are important for the host development and physiology such as maturation of
immune system and modulation of host metabolic pathways (42). Species belonging to the phyla
(B)

6
Firmicutes (incl. Clostidium, Eubacterium, Faecalibacterium, Lactobacillus, Roseburia ect.),
Bacteroidetes (i.e., Bacteriodes, Prevotella) and Actinobacteria (i.e., Bifidobacteria) are the most
abundant, which account for approximately 90% of total bacteria in the gut. Notably, the microbiota
has a symbiotic relationship with the host, which plays a crucial role in energy metabolism, metabolic
signaling across organs, gut barrier integrity and immunity (43). A previous study has shown that
compared with lean individuals, obese subjects have different Firmicutes and Bacteroidetes
proportions as well as microbial diversity, which also change with weight loss (44). Moreover,
Turnbaugh et al (2009) also found the obese cohort had higher levels of fecal SCFA which was
associated with a higher Firmicutes to Bacteroidetes ratio than lean cohort (44). However, the higher
Firmicutes to Bacteroidetes ratio is not an eventual biomarker for obesity as many contradictory
results were reported previously. For instance, altered gut microbiota composition occurs in obesity
and T2D showing a reduced abundance of butyrate-producing bacteria including Roseburia and
Faecalibacterium prausnitzii which belong to the phylum Firmicutes (45). An explanation is that the
relative abundance of butyrate-producing bacteria are low in the obese individuals and progressively
replaced by other bacteria belonging to the same phylum (46). Therefore, the changes of microbiota
at family, genus or species level might be more relevant compared with the Firmicutes to
Bacteroidetes ratio.
2.2 Dietary fiber
2.2.1 Definition, sources and classification
Dietary fiber (DF) is defined as a group of carbohydrate oligo- and polymers with a degree of
polymerization of 3-10 or > 10, which are derived from edible plants and cannot be digested by
endogenous enzymes in the small intestine (47). DF has been considered as an important ingredient
of a healthy diet, which can be obtained from cereals, fruits and vegetables ect. The type and
composition of DF vary with source, including cellulose, non-cellulosic polysaccharides (NCP),
resistant starch, lignin and oligosaccharides (48). Generally, fruits contain a large part of digestible
sugars and DF such as pectin, whereas the DF proportion and composition of vegetables can vary a
lot between different plant origins including leaves, stems, roots and tubers (48). In Northern Europe,
cereal grains are a major source of carbohydrate intake. The whole-grain cereals contain abundant
DF components, mainly composed of non-starch polysaccharide (NSP), resistant starch and lignin
(non-carbohydrate plant compounds) (49).
DF can be categorized according to source, solubility, fermentable ability and physiological effects
as shown in Table 2 (50). One of the simple classifications is dividing DF into soluble and insoluble
fiber based on the ability to be fully dispersed when mixed with water (48). Soluble fiber includes β-

7
glucan, guar gum, pectin and arabinoxylan (AX), wherein only a small fraction of AX are water
soluble and highly viscous. The soluble fiber can be further subdivided based on their molecular size
into two subcategories. The polymeric soluble fibers with high molecular weight (HMW) have high
viscosity, whereas low molecular weight (LMW) property makes soluble oligosaccharides not alter
the viscosity or texture of foods but are highly fermentable and could be utilized by the terminal
ileum (51). Insoluble fiber consist of a major part of DF fractions in cereal grains like cellulose, AX
and lignin. As the major component of insoluble DF of plant cell wall, cellulose has a linear polymer
of glucose units linked by β-(1, 4) linkages, which has laxative effect, contributing to regulate
digestive function (50). The insoluble DF can be either rapidly fermented (e.g. from refined flour),
slowly fermented (e.g. resistant starch, wheat bran) or essentially unfermented (e.g. vascular tissue)
(48). Therefore, solubility and fermentability are not always strongly correlated. Notably, DF can
benefit on gut health by acting as prebiotics, which are defined as ‘a non-digestible compound that,
through its metabolization by microorganisms in the gut, modulates composition and/or activity of
the gut microbiota, thus conferring a beneficial physiologic effect on the host’ (52).
Table 2. Properties of some dietary fiber sources (Modified after Bozzetto et al. (2018) (50)).
Fibers Viscosity Solubility Fermentation Physiological
Effects
Cellulose,
heteroxylans,
lignin
Low Low Low Laxative effect
Inulin, dextrin,
oligosaccharides Low High High Prebiotic effect
Pectin, β-glucan,
guar gum High High High
Prebiotic effect,
reduce nutrients
absorption
Psyllium,
methylcellulose High High Low
Laxative effect,
reduce nutrients
absorption
2.2.2 Grain bran
In Northern European countries, cereal grains like rye and wheat are important sources of
carbohydrate and DF. Whole gain of cereals consist of pericarp/testa, aleurone, starchy endosperm
and germ, while the bran of whole grain including pericarp/testa, aleurone layer and varying parts of
endosperm depending on milling efficiency and have a high DF content (49). For instance, the DF
content is 13-17 g/100 g in whole rye grain and 35-49 g/100 g in rye bran (53), while it is 9-17 g/100
g in whole wheat gain and 36-53 g /100 g in wheat bran (49). Moreover, the bran has a complex
structure with variable properties and composition of NSP, but typically approximately 55% AX,
followed by cellulose and mixed linkages β-glucan (54, 55). AX is formed from a linear backbone

8
of xylose residues mainly substituted with arabinose residues to varying degree at the O-2 position,
O-3 position, or both (56). The functional properties of AX are associated with the extent of
substitution and distribution of substituents along the xylan backbone, which is partly reflected by
different ratio of arabinose to xylose (A:X). Recent studies found that AX influenced the digestion
and absorption processes and increased SCFA especially butyrate production in the large intestine (4,
57). Compared with barley and oats, rye and wheat bran has a higher content of soluble and insoluble
DF in the form of AX (58). Most of AX in wheat bran is insoluble (80%) while the proportion of
soluble AX in rye bran is higher and cellulose content is lower than wheat bran (59, 60). Bran can be
treated with enzymes for the transformation into arabinoxylan oligosaccharides (AXOS) particularly
of insoluble AX from the aleurone layer with a low with a lower substitution pattern (61, 62). Besides
AX, cellulose is also found rich in wheat and rye bran and has an ability to bind water, which helps
promote regular bowel movements, reduce gut transit time, and can also be partly fermented by the
colonic microbiota and produce SCFA (63).
2.2.3 Role of dietary fiber in appetite
At present, a high DF intake is accepted as an essential component of a healthy diet. Most countries
recommend a daily intake of dietary fiber of 25–35 g for adults (25–32 g/d for adult women and 30–
35 g/d for adult men) (64). DF has been reported to improve satiation, satiety and reduce food intake,
which is controlled by appetite signaling through a complex system of hormones. A recent systematic
review found different types of DF influenced the outcomes, where DF showing high viscosity could
reduce appetite more often than the less viscous DF (59% vs. 14%) (65). The increased viscosity
induced by high DF intake contributes to an increase in gastric volume and a decrease in gastric
emptying (66). The prolonged presence of nutrients in the gastrointestinal tract increases the
interaction between nutrients and the mucosa of small intestine to stimulate the release of peptides
involved in appetite regulation (67). This is achieved by numerous neurohumoral gut peptides (i.e.,
ghrelin, cholecystokinin (CKK), glucagon-like peptide-1 and 2 (GLP-1, GLP-2) and peptide YY
(PYY)) secreted from enteroendocrine cells, which can in turn modulate gastrointestinal motility by
activating receptors on sensory, vagal and intrinsic afferent neurons (45). However, a previous study
reported that the satiety-enhancing effect of DF might be attributed to a slower absorption of nutrients
rather than gastric emptying (68). The modulating mechanisms are achieved in two ways: one is
through an increased viscosity of digesta caused by soluble fiber which restricts accessibility for the
digestive enzymes and thereby interferes hydrolysis, and also through physical obstruction of
nutrients in the gastrointestinal tract by insoluble fiber; another way is through an increased SCFA
production influencing the secretion of hormones involved in food intake, lipid storage, and energy
homeostasis (69). In agreement with that, a study reported that wheat fiber consumption for one year

9
increased postprandial GLP-1 secretion and plasma butyrate concentration in hyperinsulinemic
humans compared with a low cereal fiber intake (70). Another previous study found that postprandial
GLP-1 and PYY was increased with enzyme-hydrolyzed AXOS from wheat compared with low DF
control without changes in appetite ratings and energy intake, and assigned this to a low viscosity
(71).
2.2.4 Role of dietary fiber in glycemic control
DF is considered as component with a low glycemic index, which is beneficial for diabetic control.
Many studies have reported that DF had favorable impacts on MetS development, which not only
presented by increased satiety, delayed gastric emptying and reduced macronutrients absorption but
also improved insulin sensitivity (72). Moreover, increased GLP-1 secretion induced by DF can
increase pancreatic β-cell growth and improve insulin sensitivity, which can be a therapeutic target
for treating T2D (73). A high fiber rye bread diet reduced insulin and glucose concentrations in
plasma of humans and was associated with a reduced risk of developing T2D (74). Soluble DF has
been found to be very effective at controlling glucose response by reducing rate and extent of nutrient
absorption in the small intestine through forming viscous gels to slower diffusion rate of products
from starch digestion and inhibit enzyme accessibility to them (75). Previous studies from our group
also showed that a high content of DF in the form of AX content reduced acute glucose and insulin
responses in pigs (4, 76) and MetS subjects (57). The mechanisms of these functions are partly
associated with the viscous properties of the fiber by interfering with digestion and absorption,
altering peripheral glucose uptake and gastrointestinal hormone secretion (77). Moreover, a
supplement of 15 g/day of AX-rich fiber derived from wheat was proved to be effective in reducing
2 h-post glucose and insulin concentrations in people with T2D (78). With rye and enzyme-treated
wheat bran in the diet, less insulin was required to clear glucose from the blood stream in pigs (76).
However, the results from intervention studies are inconsistent. For instance, subjects with T2D
consuming 19 g/day DF from wheat bran had no apparent effect on glycemic control after 3 months
(79). Another study found that people who had high total DF or cereal fiber intake had less T2D risk
while the intake of soluble fiber was not associated with diabetes risk (80). Therefore, the
composition and structure of cereal fiber may be an important factor to consider regarding the effect
on glycemic control.
2.2.5 Role of dietary fiber in lipid metabolism
Consumption of adequate DF has been associated with reduced risk of CVD through a regulation of
plasma lipid profile. The intake of whole gain foods was found to reduce triglyceride and LDL levels
whereas a few studies found a significant change in HDL (81). A pooled analysis reported that each
10 g/d increment in total DF intake was associated with 27% of lowered risk of coronary death events
10
(82). Particularly, soluble DF has been found to have a more effectively hypocholesterolemic effect
than insoluble DF (83). According to meta-analyses of clinical studies, European Food Safety
Authority claims ~ 3 g of soluble fiber from oats or barley can reduce cholesterol by 0.13 mmol/L
and reduce LDL by 0.27 mmol/L (84). The potential mechanisms underlying lipid lowering effect of
soluble DF are possibly through many ways: directly reducing absorption of cholesterol induced by
viscosity; decreased enterohepatic pool of bile acid due to increased bile acid excretion in feces,
which can increase bile acid synthesis from cholesterol, and increase hepatic lipid uptake from the
blood; by the synthesis of SCFA to stimulate GLP-1 and PYY secretion and decrease lipid synthesis;
moreover, influencing the release of adipokines such as leptin and TNF-α to reduce the fat uptake in
adipocytes; or reducing glucose absorption and thereby lower insulin secretion, which can attenuate
the activation of enzyme responsible for cholesterol biosynthesis (81). A 3-week high cereal fiber
intake has been reported to reduce fasting plasma cholesterol and LDL in healthy subjects (85).
Compared with a placebo group, the 15 g/d consumption of AX concentrate for 6 weeks lowered the
fasting serum triglycerides in subjects with impaired glucose tolerance (86). For subjects with MetS,
a 12-week whole grain supplementation decreased postprandial triglyceride responses compared with
a refined cereal diet (87). Nevertheless, the results of studies investigating the effects of DF on lipid
profile is conflicting, especially for wheat. Some studies have assessed the effect of cereal fiber with
high wheat bran in the diet on blood lipid profile, showing no significant change in hyperlipidemic
or T2D subjects compared with a low fiber control (79, 88), whereas, surprisingly, a previous study
found that enzyme-treated wheat bran incorporated into bread increased total cholesterol in people
with abdominal obesity after 12 weeks compared with low DF diets (89). Moreover, a previous study
from our group has proven that rye was more efficient in reducing plasma cholesterol than wheat due
to a higher viscosity while wheat showed lower triglyceride levels in fasting plasma than rye (90).
Overall, inconsistent results may be caused by differences in fiber sources and constituents. Hence,
more studies on the long-term specific effects of DF especially from wheat consumption on lipid
profile in obese models are needed.
2.2.6 Role of dietary fiber in attenuating inflammation
DF intake has been found to reduce the risk of inflammatory bowel disease by establishing a healthy
gut environment. A healthy gut microfloral population can positively influence immune responses.
For instance, increased Bifidobacteria promoted by DF can increase IL-10 release and reduce IFN-γ
production by activation of T cells, whereas abundant Faecalibacterium prausnitzii can increase IL-
10 production and decrease IL-12 levels, which has been correlated with protection against
inflammatory bowel disease (91). Importantly, SCFA derived from fiber fermentation by the
intestinal microbiota is important in regulating acute inflammatory responses. Increased acetate and

11
propionate production activates G protein-coupled receptor (GPR) 43 and thereby produces anti-
inflammatory effects by inhibition of NF-κB (92), while butyrate has been thought to be an important
factor in maintaining normal functions of intestinal cells and is generally considered to be protective
against colorectal cancer and colitis (93). Butyrate has been reported to suppress colonic
inflammation in two ways: by inducing T-cell apoptosis to eliminate the source of inflammation, and
by suppressing IFN-γ mediated inflammation (94, 95). A recent study showed that high cereal DF
diets reduced TNF-α in obese adults compared with baseline, but no differences were observed in
inflammatory markers between the low and high DF groups (96). Additionally, a study found whole
grain intake in particular rye was directly linked to the reduction of fasting IL-6 concentration
compared with the refined grain diet (97). Besides systemic inflammation, moderating effects of DF
on intestinal inflammation have been shown and generally accompanied by improved microbiota
profile. Consumption of whole gain diet enriched in AX, β-glucan and cellulose in overweight or
obese subjects resulted in significant decreases in TNF-α which was associated with the change of
microbiota (98). Similarly, another study also found whole grain wheat consumption reduced TNF-
α and increased IL-10 after 8 weeks compared with refined wheat, which was correlated with
increased Bacteroides and Lactobacillus abundance in feces (99). To date, studies on the effects of
cereal fiber on low-grade systemic and intestinal inflammation are still limited, more studies should
be warranted.
2.2.7 Dietary fiber degradation and fermentation by microbiota
The relationship between DF intake, the gastrointestinal tract and host metabolism is complex (Figure
2). The fermentation of DF in the large intestine is a significant part of the beneficial health effects
of DF on the host, which can be used as a target for the MetS management. Beneficial effects of DF
on intestinal functions and on the gut microbiota profile and fermentation are related to the
physicochemical properties of the digesta, including transit time, fermentability, viscosity of the
digesta. Generally, the degradation of DF in the large intestine occurs in a hierarchical way:
oligosaccharides > starch residues > soluble NSP > insoluble NSP (55). Therefore, differences in the
chemical structure of DF can impact the fermentation processes by the gut microbiota. Almost all
undigested sugars, oligosaccharides, starch and soluble DF are degraded in the cecum and proximal
colon while insoluble AX and cellulose are degraded more distally in pigs (55). AXOS belongs to
soluble and non-viscous fiber and can act as prebiotics selectively utilized by microbiota to benefit
on host health [44]. Since the extent of fermentation is dependent on structure and decreases with
increasing structural complexity, AXOS can be fermented more rapidly due to its lower A:X ratio
and molecular weight compared with more substituted long-chain AX (100). After the degradation
of easily fermented AXOS and soluble AX in proximal part of large intestine, AX that has higher

12
A:X ratio and a more complex structure which is difficult to be degraded and persists until the distal
parts of colon. Therefore, rye and wheat milling fractions are different in fermentability due to their
different AX structure and composition. For instance, rye aleurone AX (more soluble, A:X = 0.42)
are fermented more readily and to a greater extent in pigs than pericarp AX (more insoluble, A:X =
1.04) (101), whereas wheat bran has less soluble AX than rye bran and therefore is more difficult to
ferment (59). Enzyme treatment of the bran could efficiently increase the solubility and availability
of some bioactive substances by changing cell wall structures. Enzyme treatment (mix of xylanase,
glucanase and cellulose) can for instance be used for wheat and rye bran to obtain higher AXOS
content, which can make the bran more fermentable (4, 62, 102).
Dietary fiber interventions has been extensively studied in last few decades for their beneficial effects
on maintaining intestinal homeostasis by promoting the growth of beneficial microorganisms and
reducing pathogenic bacteria. In general, Bacteroidetes are the potent producers of acetate and
propionate while butyrate is mainly produced from Firmicutes (46). It has been fund that patients
with diabetes have reduced levels of butyrate-producing species such as Faecalibacterium
prausnitzii, which belong to Firmicutes and have profound anti-inflammatory effects (46). Soluble
AX was reported to be a fermentable fiber source and efficiently increase colonic butyrate production
as well as butyrate-producing microbiota with positive effects on gut health and MetS (103). A
previous study from our group also demonstrated that with consumption of high DF diets, especially
rich in AX, higher number of Faecalibacterium prausnitzii, Roseburia intestinalis, and Lactobacillus
spp. in feces and higher pool size of butyrate were found compared to a western-style control diet in
pig models (4). Additionally, a study in healthy humans indicated that wheat bran enriched in AXOS
had beneficial effects on gut health by increased fecal Bifidobacteria abundance and SCFA
production (104).
Within the large intestine, SCFA is crucial for colonic health as they are involved in energy
homeostasis and enterocytes differentiation, but they also affect nutrient absorption and satiety by
regulating gastrointestinal hormones (105). More than 90% of the SCFA produced from carbohydrate
fermentation is acetate, propionate and butyrate, whereof acetate is the most abundant. In humans,
total SCFA concentration is low in the terminal ileum but high in all regions of the colon with 130
mM in the caecum to with 80 mM in the descending colon (106, 107). In pig models, SCFA
production mostly peaks in the proximal colon and then decline towards the distal colon (4). SCFA
can be utilized by the intestinal epithelium (~90%), and the remainder was either excreted with feces
or absorbed thereby transported to the liver via the portal vein (108). Therefore, increased DF intake
may increase the production and absorption of SCFA with abundant SCFA reaching peripheral
tissues to serve as energy substrates or participate in different host-signaling mechanisms. Butyrate

13
is the preferred energy source for colonocytes and supply 60-70% energy requirements locally which
is important for the prevention of colonic cancer (109). As the principal SCFA fermentation product
in the large intestine, acetate is the most abundant SCFA in the peripheral circulation and, is a
substrate for gluconeogenesis and the synthesis of cholesterol and triglycerides (110). Approximately
90% of absorbed propionate in the portal vein is metabolized by the liver as an efficient
gluconeogenic substrate and thereby only present at low peripheral concentration (111). Additionally,
SCFA have been shown to reduce the NF-κB activity and inhibit histone deacetylases activation by
activating GPR, therefore, profoundly affects inflammatory processes (92).
As the different SCFA play different roles, it can be more appropriate to emphasize the importance
of specific individual SCFA rather than the total SCFA production in relation to obesity. Therefore,
intake of specific DF sources need to increase in order to stimulate the anti-obesogenic SCFA
production. Butyrate, in particular, has received much attention as it contributes to a large part in gut
health and provides further benefits beyond that. Interventions with butyrate or increase butyrate-
producing bacteria abundance have been associated with beneficial effects on insulin sensitivity in
humans and animal models (7). Therefore, increased consumption of AX-enriched fiber such as
cereals and in particular bran could be an effective way to increase butyrate production in the colon
as AX is a butyrogenic substrate (4, 112).
Figure 2. The relationship between dietary fiber intake, the gastrointestinal tract and host metabolism. Solid
lines indicate well-studied effects of dietary fiber, dashed line indicate more controversial findings. SCFA,
short-chain fatty acids; GLP-1, glucagon-like peptide 1; PYY, peptide YY. Adapted from Müller et al. (2018)
(45).

14
2.3 Dietary protein
2.3.1 Sources, composition and properties
A normal daily protein intake accounts for 10-20% of dietary energy intake, with an average daily
amount of 80 g protein per capita from plant and animal sources (113, 114). In Europe, cereals
account for a major portion of plant protein in the form of bread, and the amount of cereal protein
ranges from 8% in rice to 12% in wheat, while legumes have a higher protein content (35%-40%
protein of soy beans) than cereals (115). The animal-based proteins are excellent sources for essential
amino acids and have high digestibility and net protein utilizations (113). Raw meat contains 20-25%
protein, egg proteins comprise ~13% of whole egg content and milk protein, consists of 20% whey
protein and 80% casein (115).
The protein quality is determined by amino acid composition, digestibility and availability, showing
better biological value for animal protein sources than for plant protein sources (116). For instance,
some abundant amino acids in animal-based products such as leucine are inadequate in plant protein,
whereas for cereals, the essential amino acids lysine, isoleucine, threonine and tryptophan are limiting
amino acids, and legumes are a poor source of sulfur amino acids (117). The digestibility of plant
proteins may be decreased if they are not properly processed. The cereal proteins are enclosed in the
cell walls which have complex combination with fiber and contains enzymes including protease
inhibitors, while protein originating from legumes may contain anti-nutritive factors such as trypsin
inhibitors in the soy beans, which can impact the digestion process and affect the nutritional value of
the protein (115). Moreover, a previous study concluded due to the deficiency in certain essential
amino acids of plant protein, other amino acids will not be properly used for protein synthesis in
muscle compared with animal proteins (116). However, there is a debate that processed meat and red
meat may be potential risk factors for chronic disease, whereas the functional properties and health
effects of dairy proteins have been supported by many studies (113).
2.3.2 Whey protein
Whey protein is a side-stream from cheese and casein production by coagulation of milk. The major
components of whey protein are β-lactoglobulin, α-lactalbumin, bovine serum albumin and
immunoglobulins. It is characterized by a high content of essential amino acids particularly branched
chain amino acids (> 20%) and sulfur-containing amino acids (118). There are three different forms
of whey protein: whey protein concentration (30-85% protein), whey protein isolate (> 90% protein)
and whey protein hydrolysates (119), which are composed of 80-90% protein, 0.5-8% fat and 0.5-
10% lactose (120). Whey protein hydrolysates are produced from whey protein by being pre-treated
with heat and proteolytic enzymes to change the complex structure of the polypeptides. As a result,
it can enhance endoprotease access and hydrolysis (121), leading to a faster and more efficient

15
absorption in the gut compared with intact proteins (122). Additionally, the hydrolysis of whey
protein can induce the release of bioactive peptides and amino acids, which have been suggested to
have physiological effects such as antioxidant, antimicrobial and anticancer activities (123).
2.3.3 Role of dietary protein in appetite
High protein diets are commonly used for body weight loss and maintenance due to an improved
satiety sensation than other macronutrients. However, there may be differences in satiating properties
depending on protein sources and digestion processes. Compared with egg and fish proteins, wheat
and pea proteins have been shown to be efficient in stimulating satiety hormones release (CKK and
GLP-1) in duodenal tissue of humans (124). A previous study also found that high protein intake
with whey or soy increased appetite sensation but without improving weight maintenance after
weight loss in humans (125). Whey protein has been found to be efficient in increasing satiety when
given as a preload or incorporated into the diet at normal protein concentration, which is linked with
the increased postprandial amino acid levels in plasma and secretion of satiety hormones compared
with casein or soy (126, 127). The likely mechanism can be that whey protein is digested and
absorbed faster than other proteins, inducing a sudden increase in plasma amino acids, which can
influence the release of satiety hormones (128) (Figure 3). Whey protein has a high BCAA content,
particularly leucine is able to activate mTOR signaling in ghrelin-producing cells leading to reduced
ghrelin secretion after food intake, whereas mTOR activation in intestinal L-cells leads to increased
GLP-1 secretion showing greater satiety and lower hunger scores (129). An acute study where whey
protein was given as a pre-meal to subjects with MetS showed that the pre-meal delayed gastric
emptying (130). Similar results were also observed in a long-term study with whey protein intake for
12 weeks, showing increased satiety in obese subjects (4). As a result, the interdependent relationship
between gastric emptying and secretion of incretin inhibited appetite, and the satiating effect of whey
protein can be used as a therapeutic tool for body weight control and obesity treatment.
2.3.4 Role of dietary protein in glycemic control
With the intake of dietary proteins, postprandial amino acid concentrations in plasma are elevated
and stimulate the secretion of insulin and glucagon and therefore influence the glucose metabolism
in peripheral tissues (115). By increasing the content of protein in the diet (from 15% to 30%) in
place of carbohydrate, a lower blood glucose response was observed in weight-stable persons with
T2D in a 5-week intervention study (131). In contrast, recent meta-analysis studies found no
significant improvement of a high-protein (> 20%) diet in glycemic control in T2D patients (132,
133). Some protein sources may help control blood glucose by influencing the release of gut
hormones. Whey protein has an incretin role, which is associated with pronounced insulin response
equivalent to that induced by eating a same amount of glucose (134). The high solubility and rapid

16
digestion of whey protein results in a rapid increase in plasma amino acid concentrations, especially
BCAA, which exerts a potent insulinotropic effect and plays an important role in glucose homeostasis
by the mTOR pathway as mentioned before (126, 128). Besides the effect of whey protein on insulin,
another mechanism of influencing postprandial glycemia could be that the action of incretin
hormones such as GLP-1 and PYY (135). A pre-meal of whey protein has been demonstrated to
stimulate insulin and glucagon secretion resulting in reduced blood glucose in subjects with MetS
(130) and subjects with or without T2D (136). The efficacy might change in long-term studies as
intake of whey protein for 12 weeks did not affect fasting insulin in overweight and obese subjects
(89). Correspondingly, a recent study suggested that the stimulating effect of high dietary protein on
insulin might be beneficial for insulin-resistant subjects but harmful for healthy subjects since it can
decrease insulin sensitivity in the long term (137).
Figure 3. Mechanism of action of whey protein on hormone release. BCAA, branched-chain fatty acids; GE,
gastric empty; GIP, glucose dependent insulinotropic peptide; GLP-1, glucagon-like polypeptide-1. Adapted
from Adams et al. (2016) (138).
2.3.5 Role of dietary protein in lipid metabolism
The effects of dietary protein on blood lipids are inconclusive. Recent meta-analysis studies have
showed divergent results in plasma lipid profile with a high-protein diet in T2D patients (132, 133).
Moreover, the effects of high protein diets on the regulation of lipid metabolism vary with protein
sources. A previous study reported that CVD risk factors could be reduced with increased intake of
plant protein at the expense of refined carbohydrates and processed meat products (139). Similarly,
a high plant protein, wheat gluten diet was found to induce decreased serum triacylglycerol levels
and reduce cardiovascular disease risk (140). A review concludes that meat products have
inconsistent effects on plasma lipid levels, whereas whey is more efficient in lowering cholesterol
than casein or soy protein (115). Additionally, supplementation of a fat rich mixed meal with whey
protein to individuals with or without T2D lowered postprandial lipemia compared with cod protein
and gluten in acute studies (8, 141), and intake of whey protein in combination with low DF for 12

17
weeks improved the postprandial lipid profile in abdominal obese subjects (89). A recent systematic
review stressed the importance of whey protein on improving multiple CVD risk factors including
blood pressure and cholesterol in overweight and obese subjects (142). The possible underlying
mechanisms of lowering effect of whey protein on lipid profiles seem to occur independent of body
weight change and may be caused by the promoted hepatic lipid metabolism, inhibited absorption of
fatty acids and cholesterol in the intestine induced by some bioactive components such as β-
lactalbumin of whey protein (12) (143, 144). However, studies on whey protein effects on lipid
metabolism have given controversial results. For example, supplementing whey protein to a fat-rich
meal did not affect triglycerides and chylomicron responses in subjects with MetS (130) or T2D
(136). With BCAA upon high fat diet, mice showed reduced body weight at the expense of
nonalcoholic fatty liver (NAFL) disease and injury (145) whereas another study demonstrated the
protective effect of oral whey proteins against NAFL in rats fed on high carbohydrate fat free diet
(146).
2.3.6 Role of dietary protein in low-grade inflammation
Studies of the effects of high protein intake on inflammatory status of obese models are limited.
However, due to the detrimental effects on the gut barrier of protein fermentation products such
hydrogen sulfide and indoles, most studies reveal that high protein consumption is associated with
an increased risk of inflammatory bowel diseases and relapse of ulcerative colitis (147, 148). The
results depend on protein sources; for instance, an energy-restricted high protein diet (30% energy)
specifically with meat protein but not with vegetable or fish protein was associated with higher degree
of inflammation in obese individuals with MetS compared with a control diet (15% energy from
protein) in an 8-week study (149). On other hand, the biologically active constituents of whey protein
such as immunoglobulins and lactoferrin are considered to be involved in maintaining immune
homeostasis and enhancing immune function and antibody synthesis (9, 150). A study found that
whey protein protected against gut inflammation in a rat model, which resulted from the stimulation
of intestinal mucin synthesis and modification of microbiota composition (151). Another study found
that whey protein intake in a high fat diet beneficially altered expression of genes profiles related to
inflammation particularly in adipose tissue of mice (152). Whereas in overweight and obese subjects,
pro-inflammatory markers including IL-6 and TNF-α were not affected by whey protein
supplementation after 12 weeks (153). In general, the effects of high protein content on low-grade
inflammation were inconclusive and dietary interventions of high protein containing whey products
should be further studied in obese models fed with high fat diets in a long-term.

18
2.3.7 Dietary protein degradation and fermentation by microbiota
Dietary proteins that escape digestion in the small intestine are available for protein fermentation and
microbiota growth in the large intestine. The amount of protein entering the colon depends on the
protein content of ingested food and protein digestibility. Generally, digestibility of dairy and animal
proteins exceeds 90%, higher than the digestibility of plant proteins (70-90%) (154). As the chyme
moves through the large intestine, fermentable carbohydrates become deficient in the distal part of
large intestine which results in an increased pH environment and is favorable for protein fermentation
(154). Undigested or endogenous protein in the large intestine can be fermented by many bacteria
such as Bacteroides spp., Popionibacterium spp., Streptococcus and Clostridium (155) into BCFA,
small amount of SCFA and sulfides, amines, ammonia and various phenols and indoles. The BCFA
(iso-butyrate, isocaproic acid and isovaleric acid) are formed by the metabolism of BCAA including
valine, leucine and isoleucine. Some metabolites including BCFA, phenols and indoles can only be
produced from colonic bacteria, considered as a marker for protein fermentation, for other
metabolites, such as ammonia, can be utilized for the metabolism and protein synthesis of
microorganisms (154).
The relative abundance of several species may be altered in high protein diets, for example, a study
found a high protein diet lead to decreased diversity of species of the Firmicutes and increased
diversity of Bacteroidetes species and Proteobacteria in an in vitro model of the proximal colon
(156). Furthermore, this study showed that the ratio of propionate production was increased due to
abundant Bacteroides with a high protein diet compared to a high carbohydrate diet. Another study
found although high protein diets reduced concentrations of butyrate producers in the cecum and
colon of a murine model, butyrate amount did not change due to increased luminal content with high
protein (157). Notably, the intestinal microbiota is sensitive to variations in dietary protein sources,
for instance, the use of highly digestible replacing less digestible protein sources may reduce the
growth of pathogenic species caused by protein fermentation (155). Highly digestible protein sources
such as whey protein can be digested by the hosts’ enzymes in the small intestine and almost not
available for microbial fermentation in the distal part of the large intestine (97% - 100% digestibility)
(158, 159). A previous study demonstrated that intake of whey protein might act as grow factor for
Lactobacillius and Bifidobacterium potentially by an amino acid composition-mediated mechanism,
which played a role in protection against colitis in a rat model (151). Moreover, it specifically
increased Lactobacillus and decreased Clostridium in high fat diet-fed mice (152).
Compared with DF, much less is known about the role of proteolytic fermentation by microbiota in
host health and metabolism. However, it is clear that the effect of protein on gut health is much more
controversial than DF because of the potentially harmful effects of end-products from protein

19
fermentation. Besides the use of high protein in the management of MetS, it is also important to
recognize the potential adverse effects of high protein for long term supplementation. Some protein
fermentation metabolites such as ammonia, phenol and hydrogen sulfide have potential toxicity to
the colonocytes (154). The production of BCFA comprises 5% ~ 10% of the total SCFA due to the
low level of polypeptides and amino acids reaching the colon compared to DF and their effects on
colonic epithelium have been poorly reported (148). With the exception of BCFA, excessive
accumulation of potentially harmful metabolites including ammonia and hydrogen sulfide is linked
with bowel disorders such as colon cancer (160). The excessive protein intake has been found to
stimulate the growth of potential pathogens such as Clostridium perfringens, and to reduce the
beneficial bacteria like Bifidobacteria (155). High protein diets increased BCFA especially high
protein and low carbohydrate diets decreased butyrate and Roseburia levels in obese humans (161).
In spite of insufficient evidence supporting a role of whey protein fermentation in the risk of bowel
disease, balanced diets with whey protein plus pre- or synbiotics are accepted to lessen the risk factors
(154). Slowly fermentable carbohydrates can be used in the diet to shift fermentation process toward
carbohydrate rather than protein and lower the potentially harmful metabolites production (155).
Therefore, abundant supply of DF may be used to influence protein fermentation in the large intestine
and reduce the detrimental effects on gut health (162). For instance, fermentable DF including wheat
bran can improve microbial ecology and reduce putatively toxic metabolites caused by protein
fermentation in pigs (163) and healthy adults (104). In addition, recent studies have found AXOS
consumption may potentially decrease the intestinal protein fermentation (164, 165).

20
3. Aim and hypotheses
This PhD project is part of two large collaborative projects (MERITS and ELIN) which study the
mechanisms of DF and its associated ingredients and dietary protein in mitigating MetS, the risk for
CVD and cancer. The first part of the PhD project was in MERITS to investigate if dietary strategies
based on high DF from AX enriched wheat and high protein from dairy, cereal and fish sources would
ameliorate the risk of MetS in young obese Göttingen Minipigs as a model for humans. In the second
project (ELIN) the aim was to study the effects of DF composition and treatment with antibiotics on
intestinal carbohydrate degradation and fermentation patterns and SCFA absorption in an intact
conventional pig model fed either an AX enriched rye bran based diet with or without antibiotic
treatment compared to a diet at similar DF level but based on cellulose.
Results from previous studies indicate that the beneficial effects of DF and protein on metabolic
abnormalities remain inconclusive and their interactions are still barely known. For a better
understanding of the physiological mechanisms behind the DF and protein on MetS, more studies
should be performed and clearly identified. Therefore, the overall objective of the present PhD project
was to study the underlying mechanisms of how DF associated components and protein affect
metabolic health by investigating intestinal DF degradation, microbiota composition, production and
absorption of SCFA and metabolic biomarkers associated with MetS.
The research hypotheses are:
1. High DF and protein content or a combination hereof can improve plasma insulin
response, lipid profile, inflammatory biomarkers and tissue gene expression associated
with MetS in a young obese Göttingen Minipig model (Paper I)
2. High DF and protein content or a combination hereof can influence the degradation of DF
and fermentation profile in the gut, including selectively stimulate beneficial bacteria
growth, enhance SCFA production especially butyrate and benefit on systemic health in
a young obese Göttingen Minipig model (Paper II)
3. Different DF composition will result in different profiles in nutrient digestion, DF
degradation and fermentation, wherein AX-enriched rye bran diet can reduce nutrient
digestibility, specifically increase butyrate production and absorption in conventional pigs
while antibiotic treatment will interfere with the fermentation pattern (Paper III)

21
4. Methods and methodological considerations
4.1 Experimental diets and design
4.1.1 The MERITS study
The study from the MERITS project described in Paper I and Paper II aimed to investigate the
possible ameliorating effects of DF and protein on MetS biomarkers in a porcine model with juvenile
obesity, which was induced by a long-term western style diet feeding. A total of 60 female Göttingen
Minipigs at 8 weeks of age were received in four separate batches, housed in pairs and fed a standard
chow diet (Special Diet Services, Dietex International, UK) in the first week. In the second week, 45
minipigs were gradually transitioned to a high fat low DF diet containing 20% fructose (LOFLOP),
and 15 minipigs were to a high amylose maize starch diet containing 20% fructose, which were
studied in another dietary intervention (166) and did not constitute the subject of this thesis. The 45
minipigs were fed ad libitum for 20 weeks to induce obesity and 10 minipigs per treatment were
planned for the DF and protein intervention and 5 minipigs were used as backup. Before the DF and
protein intervention, two minipigs died (one by liver biopsy and one by sudden unexpected death)
therefore, 43 minipigs were obtained after obesity development. All the pigs were allocated to one
of four diets for an 8-week intervention in a two by two factorial design to study the effects of low
versus high dietary levels of DF and protein (Figure 3). The four experimental diets were: a diet low
in DF and protein (LOFLOP), a diet low in DF and high in protein (LOFHIP; 6.8% whey protein
hydrolysate added), a diet high in DF and low in protein (HIFLOP; 20% enzyme-treated wheat bran
added) and a diet high in DF and protein (HIFHIP; 6.8% whey protein hydrolysate and 20% enzyme-
treated wheat bran added).
Figure 4. Experimental design and sample collection in the MERITS study. All pigs were fed low fiber low
protein diet (LIFLOP) for 20 weeks to induced obesity then switched to four diets including LOFLOP, low

22
fiber high protein (LOFHIP), high fiber low protein (HIFLOP) and high fiber high protein (HIFHIP) for 8
weeks.
Wheat bran was provided by Lantmӓnnen Cerealia AB (Malmø, Sweden) and was enzymatically
treated with cell wall-degrading enzymes (xylanase, glucanase and cellulase) by DuPont Industrial
Biosciences Aps (Brabrand, Denmark) as described by Nielsen et al (4). The DF composition of
wheat bran before and after the enzymatic treatment is listed in Table 3. A large fraction of AX are
insoluble in native wheat bran while enzymatic treatment highly increases AXOS composition from
insoluble AX.
Table 3. Dietary fiber composition of the wheat bran before and after enzymatic treatment (167).
g/100g DM Native wheat
bran
Enzyme-treated
wheat bran Change (g)
Total dietary fiber 45.0 45.0
HMW AX 22.5 18.1 -4.4
Soluble 4.0 4.4 0.4
Insoluble 18.5 13.7 -4.8
AXOS 1.9 6.8 4.9
Cellulose 8.3 8.6 0.3
β-glucan 3.3 1.2 -2.1
Klason lignin 6.3 8.1 1.8
HMW AX, high molecular weight arabinoxylan; AXOS, arabinoxylan oligosaccharides.
Whey protein hydrolysate (Lacprodan® HYDRO.REBUILD) was provided by Arla Foods
Ingredients Group P/S (Viby J, Denmark) and it contains 84% protein, 1.1% available carbohydrate
and 1.1% fat (167).
By the end of 8th week, anthropometric measurement was performed and backfat thickness was
measured by ultrasound scanning. The pigs were anaesthetized after 16 hours fasting overnight,
fasting blood samples were collected from the jugular vein and urine samples were collected by using
absorbent tampons. The liver, muscle and subcutaneous adipose tissues were collected by using a
biopsy pistol with specialized needle for gene expression analysis. After this 8-week intervention, all
the minipigs were euthanized, blood samples from portal and jugular vein and urine samples from
urinary bladder were collected in a non-fasting state. Then gut contents from ileum, cecum and colon
were collected. Liver, kidney and heart weights were recorded and liver tissues were frozen
immediately for liver fat analysis.
4.1.2 The ELIN study
The animal experiment of the ELIN project described in Paper III included 30 intact female
conventional pigs and was performed over 4 weeks. The animals were fed a standard swine diet
during the first week and a refined wheat fiber diet (Control) in the second week. In week 3, all the

23
animals were allocated to three groups, 10 pigs continued the Control diet and 20 pigs switched to a
rye bran based diet (RB). In week 4, ten of the RB fed pigs had daily intramuscular antibiotic
injections (RB+) with Streptopenprokain Rosco Vet (benzylpenicillinprocain and
dihydrosreptomycin) while the other 10 pigs remained untreated (RB-). The pigs were fed equal
amount of the diet every day based on average body weight. By the end of week 4, all the pigs were
anaesthetized 3 hours after the morning feed and antibiotic injection for RB+, blood samples were
collected from the carotid artery. Then all the pigs were subsequently euthanized, blood samples form
portal and hepatic veins and digesta from ileum, cecum and colon were collected for further analysis.
Figure 5. Experimental design of the study in ELIN project. The pigs (n = 30) were fed standard diet for one
week followed by refined wheat fiber diet (Control) for the second week. In week 3, 10 pigs continued on the
Control diet and 20 pigs were fed rye bran diet (RB) and 10 of them had daily antibiotic injection in week 4.
Adapted from Bolvig Sørensen (2016) (168).
4.2 Pigs as experimental models for humans
It is difficult to perform human studies due to ethical tissues and limitations of invasive procedures
such as strict control of environmental conditions and multiple sample collection. While, under
permission, pigs allow for induction of disease states, nutritional interventions and more invasive
sampling such as gastrointestinal tract. Pigs are omnivorous animal and is considered a suitable
animal model for metabolic and diabetic research due to the similarities in gastrointestinal
physiology, nutritional requirements and metabolism with humans (169). These properties likely
contribute to their comparable digestion and enteric microbiota with humans, which means pigs can
be a good animal model for studying the change of intestinal microbiota with the nutritional
interventions (170, 171). With similar digestive enzyme secretion rate and activity, pigs are often
used in nutrition research such as studies of digestion and absorption (172). However, the distal part
of small intestine of pigs has a much higher microbial density and thus can degrade indigestible
carbohydrates to a higher degree than humans (172). It should also be noticed that pigs have a larger
cecum with extensive fermentation than humans and the total intestinal length of pigs are different
from humans, but the ratio of intestinal length per kilogram body weight (~0.1) and gastrointestinal
fermentation profile (colon fermenter) are actually very similar, which makes the transit time

24
(average 20-30 h for total intestine) (173) and fermentation processes comparable between pigs and
humans (171). In addition, pigs have similar postprandial response profile of satiety-inducing
hormones especially when it comes to the quantitative and qualitative changes of GLP-1 compared
with humans (174). Furthermore, large quantities of digesta and tissue samples as well as multiple
sample collection of blood from different circulation sites of the body can be obtained at slaughter or
by catheterization by using the pig as a model (4, 76), which evidently is not possible in humans.
One of the considerations when using pigs as human models is their bigger size once fully mature,
while the Göttingen Minipig is one type of miniature pigs, which have small body size, are easily
handled and commonly used in biomedical studies such as for the development of metabolic
syndrome (175, 176). Like human beings, pigs are devoid of brown adipose tissue postnatally which
is an important consideration when used as biomedical model for energy metabolism and obesity
(177). Göttingen Minipigs have served as models for biomedical research in the fields of
atherosclerosis, hypertension and obesity, as they have similar metabolic features and cardiovascular
system and proportionally similar organ size with humans (177), and can easily deposit fat tissues
(178). Studies have found that Göttingen Minipigs are more easily to get obese compared with the
conventional pigs when fed ad libitum (179), and female minipigs are more prone to develop more
severe obesity than males (180). Therefore, young Göttingen Minipigs especially the female gender
have been found as a potential model for diet induced childhood/adolescent obesity and metabolic
syndrome by showing increased fat percentage, insulin resistance and plasma lipids (181). However,
it is noteworthy that the primary de novo lipogenesis site of humans is the liver but adipose tissue in
pigs, therefore, pigs do not easily get liver steatosis as humans do (182). Additionally, a high fat meal
does not activate coagulation factor VII in pigs therefore it is hard to develop a pig model with
thrombosis (183).
4.3 Obesity measurement
In humans, BMI is defined as weight divided by height squared (kg/m2). Although BMI is widely
used for obesity classification, it is not linearly related to the percentage of body fat. Skinfold
thickness is the double layer of skin and subcutaneous fat and generally are more highly correlated
with body fatness than BMI (184), whilst waist circumference measurement is linked with the
distribution of body fat and is strongly associated with metabolic risk and increased morbidity and
mortality from metabolic disorders independent of the BMI (185). Pig skin has a fixed subcutaneous
layer and is structurally similar to human (186), and the backfat thickness of pigs can be used to
detect subcutaneous fat deposition which is correlated with metabolic disorders (187). In humans,
the waist circumference is measure at the midpoint between the lower margin of the last palpable rib
and the top of the iliac crest (188). Similarly, anthropometric measurement such as body size (length),

25
abdominal and chest circumferences can be performed in pigs and to calculate porcine obesity index
(POI) based on the three parameters (Paper I) (189). Instead of BMI used in humans, body surface
area (BSA) is considered as an indicator of metabolic mass in pigs, it is calculated on the basis of
BW and height and can be an important parameter for the obesity measurement for miniature pigs
(186).
4.4 Insulin sensitivity assessment
The homeostasis model assessment (HOMA) is a common method used to assess IR (HOMA-IR)
and β-cell function (HOMA-β) on the basis of fasting glucose and insulin concentrations. HOMA is
a relatively simple, invasive and inexpensive assessment that has been shown to strongly predict the
changes in insulin sensitivity after a therapeutic intervention and development of T2D in large-scale
human studies (190, 191). A critical condition and assumption of HOMA is that subjects are strictly
fasting and in a basal steady state and an existing feedback loop between the liver and pancreatic β-
cell response; glucose levels are regulated by insulin-dependent hepatic glucose production and
insulin levels dependent on the pancreatic β-cells’ ability to respond to changes in glucose levels
(192). Therefore, HOMA-IR reflect the suppressive effect of insulin on hepatic glucose production
while HOMA-β reflect the response ability of β-cell to glucose-stimulated insulin secretion, and the
combination of HOMA-IR and HOMA-β represents the glucose-insulin homeostasis state. In the
present study (Paper I), HOMA was used to assess hepatic IR which is considered the major factor
contributing to the pre-diabetic state, impaired fasting glucose (193). However, HOMA can be used
in subjects with normal glucose tolerance, or mild T2D not in subjects with severely impaired β-cell
function as it is unable to secrete sufficient insulin to compensate for IR (194). In addition, secreted
C-peptide is considered to be a reliable representative for determining β-cell secretory function as it
is not extracted by the liver (195) whereas nearly 50% of the insulin secreted by β-cells are extracted
by the liver and has a large insulin inter-assay variation (196).
4.5 Gut microbiota analysis
In order to study the effects of DF and protein on intestinal microbiota profile, digesta samples from
the cecum, mid colon and rectum were collected at slaughter for the microbial analysis (Paper II).
After completing the DNA extractions and purifications of samples, PCR was performed to amplify
the 16S rRNA sequences of the V4 region and sequencing was completed by using Illumina MiSeq.
Operational taxonomic units (OUT) clustering is widely used to identify the bacterial composition of
samples based on the 16S rRNA sequences. In this study, quantitative Insight Into Microbial Ecology
(QIIME) software package was used to categorize microbiota based on OUT picking strategy and
analyze the communities at different taxonomic levels. Alfa diversity rarefaction curves were
generated with the increasing numbers of randomly sampled sequences per sample and beta diversity

26
was analyzed from the calculation of the weighted UniFrac metric in QIIME. Linear discriminant
analysis (LDA) effect size (LEfSe) analysis of microbiota in Paper II was performed with P < 0.05
and LDA > 2.0 using Galaxy (https://huttenhower.sph.harvard.edu/galaxy/). Sequencing of the 16S
rRNA gene is an accurate and faster method widely used for bacterial identification, however, it has
limitations in identifying bacteria to the genus and species levels due to the high sequence similarities
(197). Moreover, it is limited by short read lengths which is the reason that we exclude one sample
from colon when we did the analysis.
4.6 SCFA production and circulation
The SCFA from intestinal fermentation are rapidly absorbed from the gut lumen and a part of them
enters the portal and peripheral circulation, where they can modulate biological responses of the host.
In vitro studies using cell lines or inocula incubation are simple ways determining SCFA production,
however, it does not account for the complicated microbiome and SCFA absorption in the gut thereby
in vivo studies can be more accurate to quantify production and absorption of SCFA (198). Besides
directly measuring intestinal SCFA concentrations in a pig model, pool size are used to estimate the
intestinal production of SCFA which was calculated by the concentration of SCFA and the
corresponding net amount of gut content (Paper II and III). Although this quantification method does
not provide a true reflection of SCFA production since SCFA can be rapidly absorbed and utilized
by the colon epithelial cells, it is less expensed and easily handled than other methods such as the
stable isotope dilution technique which is considered a golden standard measurement (199). To assess
the absorption of SCFA, blood samples from mesenteric artery, portal and hepatic veins were
collected at slaughter to obtain circulating concentrations of SCFA (Paper III). As developing a
multi-catheterized pig model is a very invasive and challenging-handled process, the pigs were not
catheterized and therefore portal plasma blow was not directly determined. Previously, the blood
blow was found independent on dietary treatments and only varied in relation to the time after feeding
(76, 200). Therefore, the quantitative absorption of SCFA in Paper III was calculated by the portal-
arterial differences of SCFA concentrations and a fixed portal plasma flow rate per kg of BW, which
was also used by our previous study (201). The hepatic metabolism of SCFA was calculated by SCFA
concentrations in hepatic vein, portal vein and mesenteric artery, with the corresponded relative
contributions of portal and mesenteric arterial plasma flow to hepatic venous plasma flow (0.86 and
0.14, respectively) (202). The SCFA concentration in the mesenteric artery was assumed identical to
the concentrations in the hepatic artery. However, the plasma flows may be numerically different
among dietary treatments in Paper III, which should be taken into account when interpreting the
outcomes of this study.
27
4.7 Type and administration route of antibiotics
To mimic the influence of antibiotics on plant and enterolignan metabolism in humans, a commonly
used antibiotic in humans and pigs, penicillin was chose (168). Streptopenprokain Rosco Vet used in
Paper III is a cocktail of benzylpenicillinprocain and dihydrosreptomycin, a veterinary medicine
normally used in pigs of Denmark. Although the general administration route of penicillin in humans
is oral, intramuscular injection was performed in this study to ensure the identical dose of antibiotics
of each pigs. Moreover, we detected antibiotic metabolites in gut content which indicated that
intramuscular injection was able to exert its effect on both systemic and intestinal metabolism (203).
4.8 Statistical methods
Before conducting the animal experiment of project MERITS, the sample size was determined based
on power calculations for triglycerides and total cholesterol, and we calculated that 6-8 minipigs per
treatment were expected to give sufficient statistical power of 80% (α < 0.05). Therefore, 10
minipigs per treatment used in this 8-week intervention study was considered sufficient to give
statistical power. For the animal experiment in ELIN, 10 pigs per group were demonstrated to give
sufficient statistical power (α < 0.05; β > 0.80) according to the power calculations for pool size of
total and individual SCFA in the large intestine. In Paper I and Paper II, a MIXED procedure was
applied to assess the treatment effect of DF levels (high vs. low) and protein levels (high vs. low) as
well as the interaction between DF and protein. Moreover, a comparison of AX structure between
diets and ileal digesta was performed by only including the effect of DF levels in the model due to
absence of protein effect and interaction between fiber and protein. The segment effect and
interactions between fiber and/or protein and segment were included in the MIXED model when
analyzing the parameters of different intestinal segments in Paper II. In Paper III, the MIXED
procedure was applied to assess the effects of dietary treatment, intestinal segment or blood sampling
site and their interactions on parameters of gut content and plasma SCFA concentrations.
Furthermore, a simple analysis of variance (ANOVA) was used to analyze the effects of dietary
treatments on ileal carbohydrate composition and intestinal SCFA production in Paper III. When
repeated measurements were performed, pig was included as a random component and modelled with
the covariance structure by using the autoregressive type. Data that were not normally distributed
with homogeneous variance were log-transformed, and results presented as geometric means with
95% confidence intervals. When there was an interaction, pairwise comparison of groups were
performed and adjusted by multiple comparisons of Tukey–Kramer post hoc test. The levels of
significance was reported at P < 0.05 and tendency at P < 0.10. Correlation analysis was performed
by RStudio to study the relations between microbiota and intestinal metabolites including NSP and
SCFA concentrations, pool size and proportions.

28
5. Brief summary of results
Paper I
Dietary fibre and protein do not synergistically influence insulin, metabolic or inflammatory
biomarkers in young obese Göttingen Minipigs. Yetong Xu, Mihai Victor Curtasu, Knud Erik
Bach Knudsen, Mette Skou Hedemann, Peter Kappel Theil and Helle Nygaard Lærke
Manuscript published in British Journal of Nutrition, August 11, 2020.
Unhealthy western lifestyle energy dense diets have been associated with obesity and related
metabolic syndrome, and dietary interventions with healthy ingredients have received increased
attention in recent years. The objective of this study was to evaluate the effects of DF and protein
intake on metabolic responses in a young obese minipig model. A total of 43 obese minipigs (30-
week old) were randomly assigned to one of four diets with low or high levels of DF and protein for
8 weeks with ad libitum feeding. It was hypothesized that increased DF and protein could improve
the glycemic and insulin response, lipid profile and inflammatory status, alleviating the metabolic
abnormalities related to MetS.
In still-growing minipigs, the weight gain was reduced with high DF compared with the low DF
content, and was increased with high dietary protein compared with low protein content. However,
neither high DF nor high protein mitigated the glucose response, lipid profile or inflammatory status
in this obese minipig model. High DF increased C-peptide levels in the non-fasting state which means
that the beta-cell secretory function is improved. Gene expression analysis showed that high protein
upregulated the gene expression of FBP1 related to gluconeogenesis in the liver, whereas high DF
downregulated the gene expression of FASN involved in fatty acid synthesis in adipose tissue and
also upregulated gene expression of LEPR which was associated with leptin sensitivity. Contrast to
our hypothesis, a combination of high DF with high protein did not show any alleviating effects on
markers of metabolic abnormalities. Synergistic effect of high DF and protein was not detected in
the present study, whereas the results confirmed the advantage of high DF as a dietary strategy to
improve the metabolic homeostasis in obesity.

29
Paper II
Effects of dietary fibre and protein content on intestinal fibre degradation, short-chain fatty
acid and microbiota composition in a high-fat fructose-rich diet induced obese Göttingen
Minipig model. Yetong Xu, Mihai Victor Curtasu, Zachary Bendiks, Maria L. Marco, Natalja
Nørskov, Knud Erik Bach Knudsen, Mette Skou Hedemann and Helle Nygaard Lærke
Manuscript submitted to Food & Function. 2020.
The gut environment can be changed with obesity and MetS, and the dietary composition can
modulate metabolic homeostasis by influencing the gut microbiota and its formation of fermentation
products. The present study aimed to investigate the impacts of DF and protein on fiber degradation,
microbiota change, SCFA production as well as their correlations with each other. The study was
performed by using 43 young obese Göttingen Minipigs fed low or high levels of DF and protein ad
libitum for 8 weeks. We hypothesized that DF and dietary protein content can influence the intestinal
DF structure, stimulate the growth of beneficial bacteria and enhance SCFA production especially
butyrate, which can be linked to improved systemic health and attenuated obesity related diseases.
AX in the high DF diets was continuously degraded until the mid colon in this obese Göttingen
Minipig model. In agreement with our hypothesis, we found that high DF intake increased fecal
microbial diversity and the relative abundance of butyrogenic taxa including Blautia and
Faecalibacterium, but reduced SCFA concentrations except for butyrate, and slightly improved
butyrate pool in the large intestine compared to low DF groups. Importantly, high DF content in the
diet attenuated protein fermentation, leading to a reduced proportion of BCFA in gut contents. High
protein intake increased SCFA, acetate, propionate and BCFA concentrations and did not show
prebiotic effects. Moreover, high protein significantly changed circulating SCFA profile associated
with increased gluconeogenesis, whilst high DF increased circulating butyrate concentrations.
According to correlation analysis, AX contents in cecum and colon were positively linked with the
relative abundance of Blautia and body weight of pigs was negatively correlated with the relative
abundance of Ruminococcus. Overall, AX-enriched high DF diets improved intestinal environment
which possibly was linked with modulated metabolic health, and high protein influenced SCFA
profile but did not show beneficial effects on microbial profile.

30
Paper III
The role of rye bran and antibiotics on the digestion, fermentation process and short-chain
fatty acid production and absorption of pigs. Yetong Xu, Anne Katrine Bolvig Sørensen, Brendan
McCarthy-Sinclair, Maria L. Marco, Knud Erik Bach Knudsen, Mette Skou Hedemann and Helle
Nygaard Lærke
Manuscript submitted to British Journal of Nutrition. July, 2020.
SCFA are the main products from microbiota fermentation of DF and have been associated with
improved metabolic health. AX has been demonstrated to be a substrate for butyrate production. The
aim of present study was to explore the changes of nutrient digestion, fermentation pattern and SCFA
absorption in response to differences in DF composition and effects of the use of antibiotics. Thirty
intact conventional pigs were randomly assigned to 3 treatments, which included a cellulose rich
refined wheat fiber diet as Control, and a rye bran (RB) diet with or without antibiotic treatment of
the pigs. It was hypothesized that the RB diet would reduce nutrient digestibility and stimulate
fermentation process, specifically increase butyrate production and absorption compared with the
refined wheat fiber at iso-DF levels in the diets, whereas antibiotic treatment would disrupt this
process.
The AX-rich rye bran based diet reduced protein and fat digestibility, and AX was fermented more
proximally than cellulose in the colon. Furthermore, we found that the production and proportions of
butyrate in cecum and BCFA in colon were increased with AX-rich RB diet without showing
significant change in net portal absorption of butyrate. The refined wheat fiber diet increased total
SCFA, acetate and propionate production as well as absorption, which correlated with the higher
plasma cholesterol and LDL concentrations. In agreement with our hypothesis, the increased butyrate
production and proportion with the RB diet was negated by antibiotic treatment, which was also
reflected by a change of microbiota composition. The results highlights important differences in the
degradation and fermentation pattern of DF depending on sources and structures, which in turn
influenced systematic SCFA circulation and was of importance for plasma lipid profile.

31
6. Paper
6.1 Paper I
Dietary fibre and protein do not synergistically influence insulin, metabolic or inflammatory
biomarkers in young obese Göttingen Minipigs.
Yetong Xu, Mihai Victor Curtasu, Knud Erik Bach Knudsen, Mette Skou Hedemann, Peter Kappel
Theil and Helle Nygaard Lærke
British Journal of Nutrition, August 11, 2020.
In print, DOI: https://doi.org/10.1017/S0007114520003141.
Accepted manuscript
This peer-reviewed article has been accepted for publication but not yet copyedited or
typeset, and so may be subject to change during the production process. The article is
considered published and may be cited using its DOI
10.1017/S0007114520003141
The British Journal of Nutrition is published by Cambridge University Press on behalf of
The Nutrition Society
Dietary fibre and protein do not synergistically influence insulin, metabolic or
inflammatory biomarkers in young obese Göttingen Minipigs
Yetong Xu*, Mihai Victor Curtasu, Knud Erik Bach Knudsen, Mette Skou Hedemann,
Peter Kappel Theil and Helle Nygaard Lærke
Department of Animal Science, Aarhus University, DK-8830 Tjele, Denmark
* Corresponding Author: Yetong Xu; Email: [email protected]; Tel.: +4550641816
Short title: Metabolic effects of fibre and protein in obesity
Keywords: wheat bran; whey protein; obesity; metabolic syndrome; miniature pig model
Dow
nloaded from https://w
ww
.cambridge.org/core . Aarhus U
niversitets Biblioteker , on 31 Aug 2020 at 14:23:37 , subject to the Cambridge Core term
s of use, available at https://ww
w.cam
bridge.org/core/terms . https://doi.org/10.1017/S0007114520003141
32

Accepted manuscript
ABSTRACT
The effects of dietary fibre (DF) and protein on insulin response, lipidemia and
inflammatory biomarkers were studied in a model experiment with juvenile obese
Göttingen Minipigs. After 20 weeks feeding on a high-fat fructose-rich low-DF diet, forty-
three 30-week old minipigs (31.3 ± 4.0 kg body weight) were allocated to low or high DF
and protein diets for 8 weeks in a 2 × 2 factorial design. High DF contents decreased (P =
0.006) while high protein increased (P < 0.001) the daily gain. High protein contents
increased fasting plasma concentrations of glucose (P = 0.008), non-esterified fatty acid
(P =0.015), ghrelin (P = 0.008) and non-fasting LDL:HDL ratios (P = 0.015). High DF
increased ghrelin (P = 0.036) and C-peptide levels (P = 0.011) in the non-fasting state.
High protein increased the gene expression of fructose-bisphosphatase 1 in liver tissue (P
= 0.043), whereas DF decreased fatty acid synthase expression in adipose tissue (P =
0.035). Interactions between DF and protein level were observed in the expression of
leptin receptor in adipose tissue (P = 0.031) and of peroxisome-proliferator activated
receptors-γ in muscle (P = 0.018) and adipose tissue (P = 0.004). In conclusion, high DF
intake reduced weight gain and had potential benefit on beta-cell secretory function, but
without effect on the lipid profile in this young obese model. High dietary protein by
supplementing with whey protein did not improve insulin sensitivity or lipidemia, and
combining high DF with high protein did not alleviate the risk of metabolic abnormalities.
Dow
nloaded from https://w
ww
.cambridge.org/core . Aarhus U
niversitets Biblioteker , on 31 Aug 2020 at 14:23:37 , subject to the Cambridge Core term
s of use, available at https://ww
w.cam
bridge.org/core/terms . https://doi.org/10.1017/S0007114520003141
33

INTRODUCTION
Globally, the obesity epidemic is increasing at an alarming rate and especially the increase
in childhood obesity is of concern(1)
. Although obesity itself is not a disease, the condition
often causes endocrine and metabolic changes clustered into the so called metabolic
syndrome (MetS) that typically arises in parallel with obesity(2-4)
. MetS represents a
complex pathophysiological cluster characterized by excessive ectopic lipid accumulation
causing inflammation, insulin resistance (IR), hypertension and hyperlipidemia leading to
type 2 diabetes (T2D) and cardiovascular disease(5)
.
Lifestyle modifications, especially through a healthy diet, have attracted great interest to
alleviate MetS development. Increased consumption of dietary fibre (DF) has been proven
to ameliorate postprandial dyslipidemia and insulin responses, which could effectively
modulate T2D and cardiovascular disease(6, 7)
. DF can influence digestion and absorption
processes at all sites of the gastrointestinal tract. Thus, DF, depending on its composition,
can delay gastric emptying(8)
, impede the digestion processes in the small intestine(9)
,
influence the metabolic outcome of the microbiota in the large intestine(10)
, and influence
the release of gastrointestinal satiety hormones(11)
, which alone or in combination will
improve postprandial glycaemia and insulin responses(9)
. Although acute intervention
studies have indicated soluble DF as most efficient in regulating glycemia and cholesterol
levels(12, 13)
, controlled intervention studies have indicated that diets high in insoluble cereal
fibre may improve IR(14)
to a larger extent than what is the case with more soluble DF
sources(12, 15)
. Another dietary constituent that is known to influence MetS is content and
quality of protein(16)
. A recent study showed that a diet high in either animal or plant protein
reduced liver fat, IR and hepatic inflammation(17)
. It has also been found that milk protein,
whey protein in particular, has insulinotropic properties by affecting the release of incretin
hormones and insulinotropic amino acids(18)
. Moreover, whey protein provided as a pre-
meal has been found to delay gastric emptying(19)
and reduce glycaemic response after
consuming a carbohydrate-rich diet(20, 21)
.
Although DF and protein have been the subject of many investigations, the interactive
effects of DF and protein are poorly understood. In the present study, we investigated the
possible ameliorating effects on MetS biomarkers in an obese porcine model for childhood
obesity(22)
by the use of enzyme-treated wheat bran as DF supplement and hydrolysed whey
protein as protein supplement alone or combined. Göttingen Minipigs have a small body
size and have previously been used for the development of MetS models because of the
anatomical and physiological similarities with adolescent and adult humans(23, 24)
. We
Dow
nloaded from https://w
ww
.cambridge.org/core . Aarhus U
niversitets Biblioteker , on 31 Aug 2020 at 14:23:37 , subject to the Cambridge Core term
s of use, available at https://ww
w.cam
bridge.org/core/terms . https://doi.org/10.1017/S0007114520003141
34
hypothesised that DF and whey protein and their combinations will have a positive effect
on plasma insulin, lipid biomarkers, inflammatory biomarkers and expression of genes
associated with nutrient metabolism in young obese Göttingen Minipigs.
MATERIALS AND METHODS
Animals and handling
The care and housing of animals were done according to Danish laws and regulations
regarding humane care and use of animals in research (The Danish Ministry of Justice, Act
on Animal Experiments no. 474 of May 15 2014, as stipulated in the executive order no. 12
or January 07 2016) and performed under license obtained from the Danish Animal
Experimentation Inspectorate, Ministry of Food, Agriculture and Fisheries. Animal health
was monitored closely by observing behavior (appetite, activity, interactions with humans
and neighboring pigs) and signs of disease.
A total of forty-three female Göttingen Minipigs (Ellegaard Göttingen Minipigs,
Dalmose, Denmark), raised at Aarhus University, Department of Animal Science, Foulum,
Denmark were used in the study. The minipigs were received at the facilities at eight weeks
of age in four separate blocks over 8 months. At arrival, the minipigs were housed in pairs
and fed a standard minipig chow diet (Special Diet Services, Dietex International, UK)
according to breeders’ recommendations for one week followed by separation and a 1-week
gradual transition to a high-fat low DF diet containing 20% fructose (LOFLOP) for the
following 20 weeks of ad libitum feeding to induce obesity. The minipigs were housed in
individual pens (1.5 m × 2.4 m for pigs < 50 kg, and 3 m × 2.4 m > 50 kg). Water was
provided ad libitum from drinking nipples, and the pens were provided with wood shavings
as bedding material for the first 22 weeks. When entering the intervention of the current
experiment the bedding was removed and replaced with a rubber mattress, and toys were
provided to satisfy the minipigs’ rooting behavior.
At an average body weight (BW) of 31.3 ± 4.0 kg (30-weeks old), the minipigs were
transferred to one of four experimental diets over 3 days to gradually reach 100% of the
experimental diet on day 4 using fixed amounts of feed corresponding to 2.6% of BW. The
four experimental diets were: A diet low in DF and protein (LOFLOP), a diet low in DF
and high in protein (LOFHIP; 6.8% whey protein hydrolysate added), a diet high in DF and
low in protein (HIFLOP; 20% enzyme-treated wheat bran added) and a diet high in DF and
protein (HIFHIP; 6.8% whey protein hydrolysate and 20% enzyme-treated wheat bran
added). Wheat bran was delivered by Lantmӓnnen Cerealia AB (Malmø, Sweden) and was
Dow
nloaded from https://w
ww
.cambridge.org/core . Aarhus U
niversitets Biblioteker , on 31 Aug 2020 at 14:23:37 , subject to the Cambridge Core term
s of use, available at https://ww
w.cam
bridge.org/core/terms . https://doi.org/10.1017/S0007114520003141
35
enzymatically treated with cell wall-degrading enzymes (xylanase, glucanase and cellulase)
by DuPont Industrial Biosciences Aps (Brabrand, Denmark) as described by Nielsen et
al(10)
. Whey protein hydrolysate (Lacprodan®
HYDRO.REBUILD) was provided by Arla
Foods Ingredients Group P/S (Viby J, Denmark). The experimental diets were produced at
the feed mill at Aarhus University and stored at -20 ºC. Ingredients and nutrient
composition of the experimental diets are shown in Table 1.
After the transition to the experimental diets, voluntary feed intake was recorded for a
total of seven weeks (first week, and then for three times every second week ). BW was
measured at baseline, at forth and eighth weeks after starting the intervention to calculate
daily weight gain and weight gain per unit of feed intake. Anthropometric measurements
including length, chest and abdomen circumference (cm), were taken using measuring tape
at the end of the experimental intervention (week 28).
Sample collection
Before (week 20 of ad libitum feeding with LOFLOP) and after the intervention (week 28),
fasting blood and tissue samples were taken as described in detail by Curtasu(22)
. Briefly,
after an overnight fasting (feed removed at 15.00), the minipigs were anesthetised with 0.1
ml/kg body weight of Zolitil-mixture containing 50 mg/mL tiletamine/zolazepam (Vibrac
SA, Carros, France), 2.5 mg/mL butorphanol (Torbugesic® Vet, Scan Vet Animal Health
A/S, Fredensborg, Denmark), 12.5 mg/mL ketamine (Ketaminol Vet, Intervet Denmark,
Skovlunde, Denmark), and 12.5 mg/mL xylazine (Rompun, Bayer Health Care AG,
Leverkusen, Germany) and blood samples were collected from the jugular vein by veno-
puncture. Following, the minipigs were moved into a left recumbent position and a liver
biopsy sample (50 mg) was taken with a biopsy pistol (Pro-MagTM I 2.5, Argon Medical
Devices, Inc.) and a 14G × 10 cm needle (Argon Medical Devices, Inc.) after shaving and
disinfection of the skin with 0.5% chlorhexidine solution in 85% alcohol (Abena A/S,
Denmark) and subcutaneous injection of a local anesthetic (Procamidor VET, 20 mg/ml,
Richter Pharma, AG). Biopsies were supervised by ultrasound scanning by using a 6-18
MHz linear probe (MyLabTM Five VET, Biosound Esaote, Inc.), and the incision closed
with a surgical staple. For sampling of subcutaneous fat and muscle tissue, the right hind
leg of the minipig was cleaned, sterilised and anesthetised locally as described for the liver
biopsy. After a 15-20 mm incision of the skin, approximatively 100 mg of subcutaneous
adipose tissue (sAT) was collected, followed by collection of 50-100 mg muscle tissue from
the semitendinosus muscle by use of the biopsy pistol. The sAT were snap frozen in liquid
Dow
nloaded from https://w
ww
.cambridge.org/core . Aarhus U
niversitets Biblioteker , on 31 Aug 2020 at 14:23:37 , subject to the Cambridge Core term
s of use, available at https://ww
w.cam
bridge.org/core/terms . https://doi.org/10.1017/S0007114520003141
36

N2 and stored at -80ºC until analysis. Muscle and liver tissues were placed in sterile tubes
containing RNAlater (Sigma-Aldrich Co. LLC).
After sampling, a few drops of Streptocillin® vet. (Boehringer Ingelheim Danmark
A/S) were administered to the incision site and closed with surgical staples. Urine was
collected by attaching an absorbent tampon under the tail (covering the urethra) using
Omniplast adhesive fabric tape (Hartmann, Germany) before the minipigs were transferred
back to their pens for recovery.
Following the 8-week intervention, the animals were weighed and euthanised in the 9th
week over 3 days. At euthanasia at the end of the experiment, the minipigs had not had their
feed removed, so samples collected reflect the non-fasting state. For sampling, the minipigs
were weighed and anaesthetised with Zolitil mixture as described above. The pigs were
then fitted with a catheter in the ear vein for possible supplementary anesthesia and put in a
supine position for sampling from the jugular vein. Following, the abdominal cavity was
opened by a midline incision and a blood sample was quickly taken from the portal vein.
The minipigs were then euthanised with an overdose of sodium pentobarbital followed by
exsanguination. The entire gastrointestinal tract was removed, and the small intestine and
colon sections were tied off to keep contents in place while measuring the length. Liver,
kidney and heart weights were recorded, and tissue samples from the right medial liver lobe
were frozen immediately for fat analysis. Urine samples were collected by removing the
urinary bladder and direct puncture to determine pH at room temperature with a pH meter
and a sample was stored at -80ºC for further analysis. Backfat thickness was measured by
ultrasound scanning (MyLabTM Five VET, Biosound Esaote, Inc.) with a 6-18 MHz linear
probe. Measurements were taken in the area of the longissimus dorsi muscle over the last
rib while the animal was in a hanging position. The distance from the skin to the last layer
of fat was measured at each recording and exported for calculation.
Blood samples taken at fasting and at slaughter were collected in Lithium Heparin
(LiHep), K3 ethylene-diamine-tetra acetic acid (EDTA), and K3 EDTA/Aprotinin inhibitor
(10000 KIU/mL blood, Nordic Pharma Ltd.), centrifuged for 12 min at 3300 rpm (1220 rcf)
at 4ºC, and plasma was aliquoted for analyses and stored at -80ºC.
Analytical methods
All chemical analyses of the diets were performed in duplicate on freeze-dried samples and
analysed as previously described(10)
. Liver fat was determined based on Bligh and Dyer’s
method(25)
. Briefly, liver samples were homogenised in double amount of methanol using
Dow
nloaded from https://w
ww
.cambridge.org/core . Aarhus U
niversitets Biblioteker , on 31 Aug 2020 at 14:23:37 , subject to the Cambridge Core term
s of use, available at https://ww
w.cam
bridge.org/core/terms . https://doi.org/10.1017/S0007114520003141
37

an Ultra-Turrax homogeniser (IKA Labortechnik) in an ice bath. Homogenate (600 mg)
was mixed with 1.0 ml water, 1.5 ml methanol and 1.0 ml chloroform, the mixture was
shaken for 1 min and 1.0 ml water and 2.0 ml chloroform was added and shaken for 1 min.
The mixture was centrifuged at 3000 rpm (1220 rcf) for 5 min to get phase separation and
2.00 ml of the lower chloroform phase was taken out, dried and the residue was weighed for
determination of fat content.
Concentrations of glucose, fructosamine, lactate, non-esterified fatty acids (NEFA),
high density lipoproteins (HDL), low density lipoproteins (LDL), total cholesterol,
triglycerides, albumin, AST (aspartate transaminase), ALT (alanine transaminase) and GGT
(gamma-glutamyltransferase) in LiHep plasma were analysed using the ADVIA 1650
Chemistry system (Siemens Diagnostics, Tarrytown, NY, USA) according to the
manufacturer’s instructions (Siemens Diagnostics Clinical Methods for ADVIA 1650).
Urinary glucose, creatinine and total protein analyses were conducted with the same
system. Millipore MILLIPLEX MAP Human Metabolic Hormone bead panel kit
(HMHEMAG-34K, Merck Millipore, Merck KGaA, Darmstadt, Germany) was used to
determine insulin, glucagon, C-peptide and ghrelin (active), GIP and total glucagon-like
peptide-1 (GLP-1)) in in K3 EDTA/Aprotinin inhibitor plasma. Cytokines (IFN-γ, IL-2, IL-
4, IL-10, IL-12, IL-18) in K3 EDTA plasma were measured using a Millipore MILLIPLEX
MAP Porcine bead panel kit (PCYTMAG-23K, Merck Millipore, Merck KGaA, Darmstadt,
Germany). Both kits were run according to the manufacturer’s instructions on a Luminex
MAGPIX system (Luminex Corporation, TX, USA).
Real-time reverse transcriptase polymerase chain reaction (RT-PCR) was performed on
liver, muscle and sAT to analyse gene expression (Table S1). In liver tissue, total RNA
extraction was performed using the NucleoSpin RNA Plus kit (Macherey-Nagel GmbH &
Co., KG., Duren, Germany) according to the manufacturer’s instructions. Total RNA
extraction from muscle and sAT was operated using TRI Reagent® Solution (Ambion,
Applied Biosystems, Stockholm, Sweden) based on the manufacturer’s guidelines. RNA
transcription, cDNA synthesis and RT-PCR quantification were conducted as previously
described(26)
. Glyceraldehyde 3-phosphate dehydrogenase (GAPDH), β-actin and
hypoxanthine phosphoribosyl transferase 1 (HPRT1) were tested as potential housekeeping
genes (HKG). Gene expression data was obtained as Ct values (cycle number for which
logarithmic plots cross a calculated threshold) and used to calculate ΔCt values as the
Dow
nloaded from https://w
ww
.cambridge.org/core . Aarhus U
niversitets Biblioteker , on 31 Aug 2020 at 14:23:37 , subject to the Cambridge Core term
s of use, available at https://ww
w.cam
bridge.org/core/terms . https://doi.org/10.1017/S0007114520003141
38

difference between Ct of the target gene and mean Ct of HKG. Liver GAPDH exhibited
changes with regard to DF and protein interaction whereas sAT GAPDH exhibited changes
with regard to protein effect. As a result, mean of β-actin and HPRT1 was used as HKG for
liver tissue, whereas mean of β-actin and GAPDH was used as HKG for muscle and β-
actin were used as HKG for sAT. Relative gene-expression was determined using the
(1+efficiencies)-ΔΔCt
method, were ΔΔCt = ΔCttreatment – ΔCtLOFLOP. Results were reported
as fold changes. C-reactive protein (CRP) expression in muscle and sAT as well as muscle
leptin receptor (LEPR) expression are not reported due to detection limit.
Calculations
Porcine obesity index (POI) was calculated as previously described(27)
:
POI (L/cm) = (π × (1/3) × BS × (Abr2 + Cr
2 + Ab × Cc))/BS × 10
3, (1)
where BS, Abr, Cr, Ab and Cc are body size (length), abdomen radius, chest radius,
abdomen circumference and chest circumference, respectively.
Body surface area (BSA) was calculated as follows(28)
:
BSA (m2) = 0.121BW
0.575, (2)
Weights of liver, heart and kidney and lengths of small intestine and colon at slaughter
were calculated relative to BW (kg) at slaughter.
Values of fasting blood glucose (mM) and insulin (MIU/L) were used to calculate the
homeostatic model assessment for insulin resistance (HOMA-IR) and beta-cell function
(HOMA-β) as previously described(29)
:
HOMA-IR = (insulin × glucose)/22.5, (3)
HOMA-β = 20 × insulin/(glucose – 3.5). (4)
Statistical analysis
The pig was regarded as the experimental unit. According to the power calculations for
triglycerides and total cholesterol, 6-8 minipigs completing the study were expected to give
sufficient statistical power (α < 0.05; β = 0.80). All data analysis was accomplished using
the MIXED procedure of SAS (SAS Institute, Inc.) based on the normal mixed model:
Dow
nloaded from https://w
ww
.cambridge.org/core . Aarhus U
niversitets Biblioteker , on 31 Aug 2020 at 14:23:37 , subject to the Cambridge Core term
s of use, available at https://ww
w.cam
bridge.org/core/terms . https://doi.org/10.1017/S0007114520003141
39

Yijk = μ + αi + βj + (αβ)ij + tk + εijk, (5)
where Yijk is the dependent variable; μ is the overall mean; αi and βj are the fixed effects
of DF level (i = LOF or HIF), and protein level (j = LOP or HIP); (αβ)ij is the interaction
among fixed effects; tk is the random effect of block (k = 1, 2, 3 or 4), and εijk is the residual
error. If an interaction was detected, we conducted a pairwise comparison of groups
adjusted by multiple comparisons of Tukey–Kramer post hoc test. Values are presented as
least square means with standard error of the means (SEM). A log-transformation was
performed for HOMA-β, ratios of glucose:creatinine and protein:creatinine in urine at the
end of experiment, urinary ratios of glucose:creatinine and protein:creatinine at baseline to
obtain variance homogeneity and values of back-transformed data are presented with a 95%
confidence interval (CI). Pearson correlation of delta values for glucose in the portal vein
and jugular vein against daily starch intake was performed by using GraphPad Prism 8.0
(GraphPad Software Inc.). Effects are reported significant when P < 0.05 while P < 0.10
was considered as a tendency. For the statistical analysis of anthropometric measurements
block 2 was excluded due to absence of data.
RESULTS
Diets, feed intake, body weight, morphometric and organ indices
The diets contained almost equal amounts of fat and gross energy as shown in Table 1. As
planned, the CP content was 56% higher in the two high protein diets and the DF content
was approximately doubled in the two high-DF diets, it was also reflected in the relative
energy contributions from protein and DF. The increase was in form of NSP, AX, AXOS,
and Klason lignin due to the inclusion of enzyme-treated wheat bran in the high DF diets.
Along with the higher CP and DF, the starch content was lower: 150 g/kg DM in the
HIFHIP diet compared to 344 g/kg DM in the LOFLOP diet.
The 43 minipigs that for 20 weeks had been intervened by an energy dense diet (diet
LOFLOP) with baseline characteristics’ as in Table S2, increased their BW from 31.3 ± 4.0
kg before the intervention to 46.8 ± 5.4 kg after 8 weeks with no difference between the
four diets (data not shown; P > 0.10). The daily feed intake recorded in weeks 22-28
showed a significant interaction between DF and protein (P = 0.038) with the lowest feed
intake observed with HIFLOP (Figure 1). The daily weight gain as well as the gain per unit
of feed intake was lower with the high fibre diets (-20%, P = 0.006; -11%, P = 0.036)
compared to low fibre diets and higher with the high protein diets (+36%, P < 0.001; +31%, a
Dow
nloaded from https://w
ww
.cambridge.org/core . Aarhus U
niversitets Biblioteker , on 31 Aug 2020 at 14:23:37 , subject to the Cambridge Core term
s of use, available at https://ww
w.cam
bridge.org/core/terms . https://doi.org/10.1017/S0007114520003141
40

P < 0.001) compared to low protein diets (Figure 1). At the end of intervention, there was
no significant effect of dietary treatment on any of the morphometric measurements of the
pigs either in length, chest circumference, abdomen circumference, POI, or BSA, and
backfat thickness was also not significantly affected by either DF or protein levels (Figure
S1).
The relative weight (% of BW) of liver, heart, kidney, and length (m/kg) of small
intestine and colon as well as liver fat content at slaughter is shown in Figure S2. The
relative weight of the kidney was higher in the protein groups (0.20 vs 0.17% of BW, P =
0.010) whereas none of the other responses were affected by dietary treatment.
Clinical parameters in fasting and non-fasting plasma
Plasma concentrations of clinical parameters in the fasting (jugular vein) and non-fasting
state (jugular and portal vein taken at euthanasia) are shown in Table 2. At fasting, there
were significantly higher plasma glucose concentrations with the high protein diets
compared to low protein diets (6.9 vs 5.8 mM, P = 0.008), and an interaction of DF with
protein in fructosamine (P = 0.022), but no difference between groups by pairwise
comparisons. There were also higher NEFA concentrations (241 vs 161 μM, P = 0.015),
higher albumin (44 vs 40 g/L, P = 0.018) and AST concentrations (28 vs 23 U/L, P = 0.043)
with the high protein compared to low protein diets in fasting plasma. In the non-fasting
samples, a borderline significant increase in LDL concentration was observed with high
protein diets in jugular (1.7 vs 1.2 mM, P = 0.054) and portal venous plasma (1.8 vs 1.3
mM, P = 0.049). Moreover, the higher protein content also resulted in significantly higher
LDL:HDL ratios in plasma from both the jugular vein (0.88 vs 0.65, P = 0.015) and the
portal vein (0.92 vs 0.67, P = 0.014) in the non-fasting state as compared with pigs fed the
low protein diets. For the other responses no significant effects of dietary treatment were
seen. Non-fasting plasma levels of glucose and lactate were not significantly changed by
either DF or protein levels, but, surprisingly, glucose for the HIFHIP diet was higher in the
jugular vein than the portal vein. Overall, the difference in glucose concentration between
the portal and jugular vein was positively related to the intake of starch (r = 0.494, P >
0.001, Figure S3).
Dow
nloaded from https://w
ww
.cambridge.org/core . Aarhus U
niversitets Biblioteker , on 31 Aug 2020 at 14:23:37 , subject to the Cambridge Core term
s of use, available at https://ww
w.cam
bridge.org/core/terms . https://doi.org/10.1017/S0007114520003141
41

Fasting and non-fasting concentrations of plasma hormones and inflammatory
cytokines
Fasting and non-fasting concentrations of hormones and inflammatory cytokines in plasma
from the jugular vein are shown in Table 3. Fasting ghrelin concentrations were
significantly higher with the high dietary protein diets (28 vs 15 pg/ml, P = 0.008) but
higher with the high DF diets in the non-fasting state (21 vs 15 pg/ml, P = 0.036). At
fasting, GIP concentrations were significantly lower (37 vs 60 pg/ml, P = 0.008) by the
high DF diets compared to low fibre diets, whereas an interaction between DF and protein
was observed in the non-fasting state (P = 0.009) with significantly higher values of the
LOFLOP diet than the other three diets. The high DF diets induced a borderline significant
increase in fasting levels of total GLP-1 (P = 0.053), while diets with high protein content
tended to increase it in the non-fasting state (P = 0.055). The C-peptide concentrations in
non-fasting plasma was higher when the minipigs were fed the high DF diets (60 vs 32
pg/ml, P = 0.011) and a tendency (P = 0.076) for higher concentrations with the high
dietary levels of protein. There was no effect of diet on insulin concentrations, HOMA-IR
and HOMA-β in the fasting state, and only a tendency (P = 0.062) for a higher non-fasting
concentration of insulin with high dietary protein content. High DF content gave rise to
higher fasting concentrations of IL-12 (0.75 vs 0.59 ng/ml, P = 0.047) and IFN-γ (5.8 vs
4.3 ng/ml, P = 0.011) compared to low DF diets, whereas an interaction between DF and
protein was seen in fasting concentrations of IL-4 (P = 0.022) but with no differences
between the groups by pairwise comparisons. In the non-fasting state, only IFN-γ levels
were significantly higher with a high content of DF in the diet (2.3 vs 1.6 ng/ml, P = 0.001).
Clinical parameters in urine at fasting and slaughter
In the fasting state, there was a significant interaction between DF and protein level in
creatinine concentrations of the urine (P = 0.036) with LOFLOP having a significantly
higher concentration than the two high DF diets (Table 4). There was no effect of diet on
urinary glucose and protein concentrations and glucose:creatinine and protein:creatinine
ratios (P > 0.10) in the fasting state. At the non-fasting state, where urine was taken
Dow
nloaded from https://w
ww
.cambridge.org/core . Aarhus U
niversitets Biblioteker , on 31 Aug 2020 at 14:23:37 , subject to the Cambridge Core term
s of use, available at https://ww
w.cam
bridge.org/core/terms . https://doi.org/10.1017/S0007114520003141
42

directly from the bladder at euthanasia, a high dietary protein content resulted in a
significantly higher pH of the urine (5.6 vs 5.1, P < 0.001) and higher protein
concentrations (85 vs 46 mM, P = 0.032) compared to the low dietary protein diets. An
interaction of DF and protein was observed in protein:creatinine ratio (P = 0.048) with
higher values of HIFHIP diet than the three other diets.
Relative gene expression of liver, muscle and subcutaneous adipose tissue
Biopsies were taken from the liver, muscle and subcutaneous adipose tissues to study the
relative expression of genes involved in carbohydrate and lipid metabolism, inflammation
and transcription factors (Table 5). No effects were observed in gene expression in the liver
except for an increase in the expression of FBP1 with a high protein content of the diet
(1.27 vs 0.96, P = 0.043). In muscle tissue, there were interactions between DF and protein
in the expression of acetyl-Coenzyme A carboxylase alpha (ACACA, P = 0.020),
peroxisome proliferator-activated receptor gamma (PPARγ, P = 0.004) and tumor necrosis
factor (TNF, P = 0.026), where the LOFHIP induced significantly higher expression of
PPARγ than the other three diets in the post-hoc analysis. In sAT, high DF content reduced
the expression of fatty acid synthase (FASN) (0.70 vs 1.20, P = 0.035), whereas an
interaction between DF and protein was seen in the expression of adiponectin receptor 1
(ADIPOR1) (P = 0.048), LEPR (P = 0.031) and PPARγ (P = 0.018) without differences
between groups after adjustment for multiple comparisons.
DISCUSSION
The current study intended to investigate the possible ameliorating effects of DF and
protein on MetS biomarkers in an obese porcine model for childhood obesity(22)
. The daily
feed intake for 6-9 month old female minipigs is restricted to 300-400 g in order to prevent
obesity(30)
. Although the low protein diets in this study had slightly lower protein content
than recommended standard diet (11% vs 13%), the daily protein intake of these growing
minipigs was covered with the at libitum feeding pattern (104 g with the low protein diets
vs 39-52 g with the standard diet). Obesity was induced in the model by feeding a high-fat-
high-fructose diet (diet LOFILOP) and after 20 weeks the pigs were on average
approximately twice as heavy as Göttingen Minipigs fed according to manufacturers’
Dow
nloaded from https://w
ww
.cambridge.org/core . Aarhus U
niversitets Biblioteker , on 31 Aug 2020 at 14:23:37 , subject to the Cambridge Core term
s of use, available at https://ww
w.cam
bridge.org/core/terms . https://doi.org/10.1017/S0007114520003141
43

recommendations (31 vs 16 kg at 7 months of age)(30)
. The heavy fat accumulation created a
preclinical stage with increased fasting glucose, signs of insulin deregulation and mild signs
of liver inflammation (Table S2). Similar effects have been found in other studies with
Göttingen Minipigs(22, 31, 32)
.
In the current 8 weeks intervention period with diets varying in DF and protein, the
minipigs continued to gain weight although at a different rate depending on the dietary
composition. Thus, the pigs fed the diet high in DF and low in protein consumed less feed
and, consequently gained less weight than the pigs on the other diets. The lower feed intake
of the high DF low protein diet and the contrasting effects of DF and protein on weight gain
is most likely related to: firstly, a lower nutrient digestibility, modified nutrient absorption
and influence of DF on satiety(9, 10)
; and secondly, positive influence of high protein on
growth and modest influence on satiety. In earlier epidemiologically studies(33, 34)
, a positive
effect of high protein in particular of protein of animal origin on weight gain(34)
has also
been observed presumably reflecting that the protein quality plays a crucial role. It should
be noted that the low-DF-low-protein diet used during development of obesity(22)
and
continued to be used in one of the dietary treatment (LOFLOP) in the current intervention
study was specifically designed to provide a reduced protein content in order to redirect
energy from lean tissue accretion to adipose tissue storage in this way diminishing muscle
mass for glucose regulation(35)
. These aspects have to be taken into consideration when
evaluating the effects of the high protein diets on several biomarkers. For instance, the
concentrations of albumin and AST in plasma are most likely a reflection of changed
protein catabolism and turnover rates in the liver with a high dietary protein intake(36)
rather
than a marker for MetS(37)
. To support this view, relative organ weight(30)
, liver fat(35)
and
plasma inflammatory cytokines(22)
were found to be in the normal range.
While we can expect the digestibility to be lower with the high DF diets because of the
insoluble nature of DF making it resistant to microbial degradation(10, 38)
, there are also
indications of satiety induced by gut hormones with DF. GIP was significantly reduced by
high DF both at fasting and at non-fasting but with significantly higher levels during non-
fasting than fasting. GIP stimulates insulin secretion in a manner related to the absorption
of especially glucose and fat(39)
. The lower GIP level with high DF diets and higher GIP
level with the low DF low protein diet is without doubt a reflection of the influx of glucose
being higher for the latter than the former diet. The GLP-1 level also showed borderline
increase with the high DF diets at the fasting stage, indicating an effect of DF on satiety
after overnight fasting; the effect most likely being caused by the slower absorption of
Dow
nloaded from https://w
ww
.cambridge.org/core . Aarhus U
niversitets Biblioteker , on 31 Aug 2020 at 14:23:37 , subject to the Cambridge Core term
s of use, available at https://ww
w.cam
bridge.org/core/terms . https://doi.org/10.1017/S0007114520003141
44
nutrients(40)
and possibly also triggered by fasting levels of short chain fatty acids being
released from slowly fermented DF(41)
. GLP-1 increases rapidly after a meal and plays a
key role in the regulation of insulin secretion and sensitivity thereby reducing post-meal
glucose concentrations and improves beta-cell proliferation(42)
. Overall, although no
significant change was observed in insulin sensitivity with high DF at the fasting state,
GLP-1 secretion induced by a possible slower nutrient absorption could potentially be
protective against β-cell exhaustion. In contrast to GIP and GLP-1, the results on ghrelin
diverges from the general understanding that DF can suppress ghrelin concentrations and
thereby reduce the feeling of hunger(43)
as the non-fasting level ghrelin was higher in the
high DF diets without influencing either feed intake or weight gain. A previous study with
high DF diets also demonstrated that satiety feeling may be unrelated to the ghrelin
response and did not affect the following food intake(6)
. It has also been found that an AX-
enriched meal increases serum ghrelin levels in healthy human subjects with normal
glucose tolerance(44)
. However, given the ad libitum feeding pattern and expected delayed
nutrient absorption with high DF, increased ghrelin levels could also occur earlier in the
low DF groups, and as a result there was no overall influence on either feed intake or
weight gain.
We have previously shown that an AX-rich diet did not change postprandial glucose
responses of pigs but induced a lower postprandial peak in insulin in portal vein, hepatic
vein and mesentery artery compared to a low-DF western-style diet(45)
. In the present study
we did not see any effect of the high DF diets on either glucose or insulin, which is in line
with a study with human subjects with normal glucose tolerance where an AX-rich diet was
found not to influence glucose or insulin responses(44)
. Although we did not observe
significant changes in insulin concentrations, we found higher non-fasting levels of C-
peptide with the high DF diets, which may be an indicator of improved secretory function
of pancreatic beta-cells. However, the higher level of C-peptide occurred without neither
HOMA-IR nor HOMA-β being influenced by DF. Of note, in our comparisons between
species, it needs to be acknowledged that there are indications that C-peptide may have
different functions in minipigs and humans(32, 46)
.
During the progression of obesity in this juvenile model, we did not observe any
relationship between obesity development and IL-12 and IFN-γ(22)
. After 8 weeks of dietary
interventions, however, elevated concentrations of IL-12 in the fasting state and IFN-γ in
the fasting and non-fasting state were observed in pigs fed the high DF diets. These results
are in contrast to our expectations but generally in agreement with a recent study where it
Dow
nloaded from https://w
ww
.cambridge.org/core . Aarhus U
niversitets Biblioteker , on 31 Aug 2020 at 14:23:37 , subject to the Cambridge Core term
s of use, available at https://ww
w.cam
bridge.org/core/terms . https://doi.org/10.1017/S0007114520003141
45
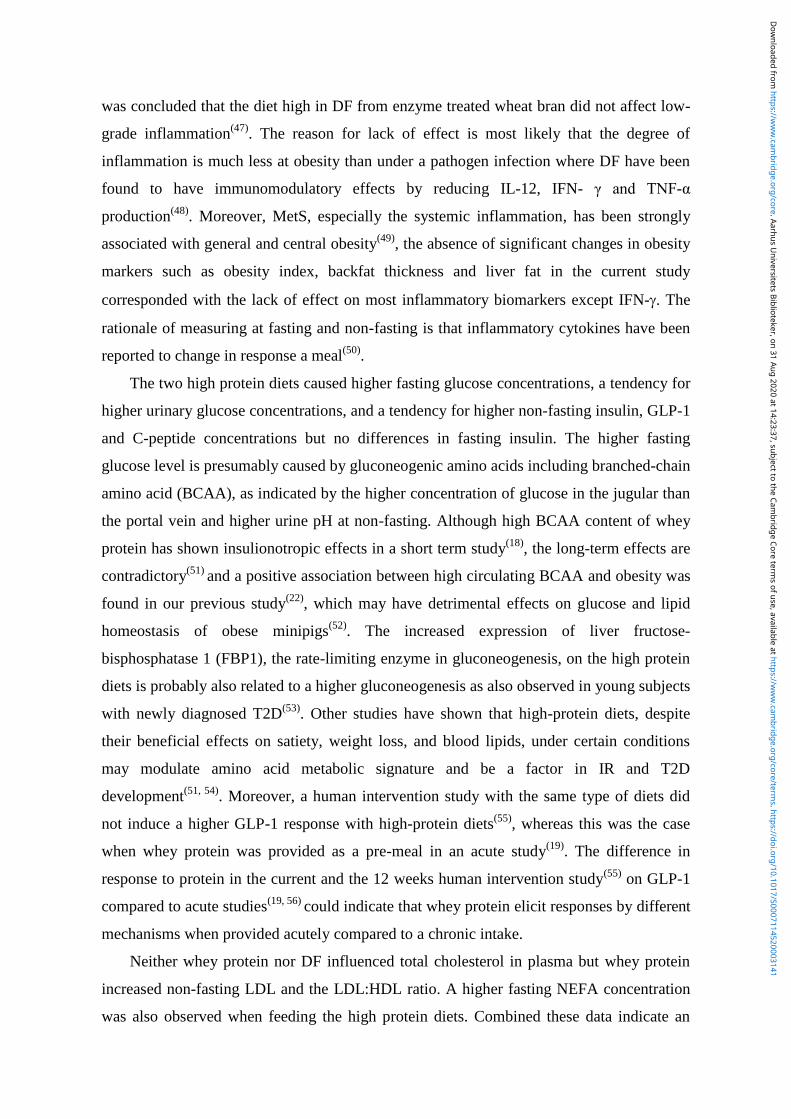
was concluded that the diet high in DF from enzyme treated wheat bran did not affect low-
grade inflammation(47)
. The reason for lack of effect is most likely that the degree of
inflammation is much less at obesity than under a pathogen infection where DF have been
found to have immunomodulatory effects by reducing IL-12, IFN- γ and TNF-α
production(48)
. Moreover, MetS, especially the systemic inflammation, has been strongly
associated with general and central obesity(49)
, the absence of significant changes in obesity
markers such as obesity index, backfat thickness and liver fat in the current study
corresponded with the lack of effect on most inflammatory biomarkers except IFN-. The
rationale of measuring at fasting and non-fasting is that inflammatory cytokines have been
reported to change in response a meal(50)
.
The two high protein diets caused higher fasting glucose concentrations, a tendency for
higher urinary glucose concentrations, and a tendency for higher non-fasting insulin, GLP-1
and C-peptide concentrations but no differences in fasting insulin. The higher fasting
glucose level is presumably caused by gluconeogenic amino acids including branched-chain
amino acid (BCAA), as indicated by the higher concentration of glucose in the jugular than
the portal vein and higher urine pH at non-fasting. Although high BCAA content of whey
protein has shown insulionotropic effects in a short term study(18)
, the long-term effects are
contradictory(51)
and a positive association between high circulating BCAA and obesity was
found in our previous study(22)
, which may have detrimental effects on glucose and lipid
homeostasis of obese minipigs(52)
. The increased expression of liver fructose-
bisphosphatase 1 (FBP1), the rate-limiting enzyme in gluconeogenesis, on the high protein
diets is probably also related to a higher gluconeogenesis as also observed in young subjects
with newly diagnosed T2D(53)
. Other studies have shown that high-protein diets, despite
their beneficial effects on satiety, weight loss, and blood lipids, under certain conditions
may modulate amino acid metabolic signature and be a factor in IR and T2D
development(51, 54)
. Moreover, a human intervention study with the same type of diets did
not induce a higher GLP-1 response with high-protein diets(55)
, whereas this was the case
when whey protein was provided as a pre-meal in an acute study(19)
. The difference in
response to protein in the current and the 12 weeks human intervention study(55)
on GLP-1
compared to acute studies(19, 56)
could indicate that whey protein elicit responses by different
mechanisms when provided acutely compared to a chronic intake.
Neither whey protein nor DF influenced total cholesterol in plasma but whey protein
increased non-fasting LDL and the LDL:HDL ratio. A higher fasting NEFA concentration
was also observed when feeding the high protein diets. Combined these data indicate an
Dow
nloaded from https://w
ww
.cambridge.org/core . Aarhus U
niversitets Biblioteker , on 31 Aug 2020 at 14:23:37 , subject to the Cambridge Core term
s of use, available at https://ww
w.cam
bridge.org/core/terms . https://doi.org/10.1017/S0007114520003141
46

unfavourable progression towards dyslipidaemia when feeding the high protein diets. In a
recent 12 week intervention study with human subjects with abdominal obesity, it was
found that whey protein in combination with a low DF diet reduced total fasting cholesterol
whereas high DF had the opposite effect(16)
.
Obesity-driven insulin resistance in white adipose tissue, liver and skeletal muscle is
the primary cause of T2D and is linked to obesity-associated metabolic abnormalities such
as dyslipidaemia and inflammation(57)
. Therefore, we explored how DF and protein
interventions would affect the expression of key regulatory genes involved in carbohydrate
and lipid metabolism, inflammation and transcription factors in liver, muscle and
subcutaneous adipose tissues. We observed an increased relative gene expression of PPARγ
in muscle tissue in the LOFHIP group, which potentially can be linked to impaired insulin
sensitivity. PPARγ plays an important role in regulating insulin action in skeletal muscle(58)
and mRNA and protein expression of PPARγ has been found to be higher in muscle tissue
of humans with severe insulin resistance(58, 59)
. These data also corroborate the higher
fasting glucose concentrations and tendency for higher non-fasting insulin concentrations in
high protein diets. It appears that DF may attenuate the detrimental effect of protein as
increased gene expression of PPARγ was only found in diet with high protein and low DF
content.
The HIFLOP diet induced a significantly elevated expression of LEPR in the adipose
tissue, the signalling pathway through which leptin controls energy balance(60)
. This may
suggest improved responsiveness to leptin and potentially be associated with the reduced
feed intake and weight gain in this particular group. A lower LEPR mRNA abundance in
the subcutaneous adipose tissue has been associated with morbid obesity when compared to
lean human subjects and strongly correlated with insulin sensitivity(61)
. A previous study
also found that LEPR overexpression in adipose tissue of leptin receptor transgenic mice
could reduce body weight and fat deposition(62)
. As a central enzyme involved in lipid
biosynthesis, FASN gene expression in adipose tissue has been associated with visceral fat
accumulation and impaired insulin sensitivity(63)
. In our study, however, the relative
expression of FASN was suppressed significantly by the high DF content, which potentially
can explain the lower weight gain and improved non-fasting C-peptide concentrations in the
high DF groups.
Our study has several strengths but also some weaknesses. Firstly, we performed a
randomized long-term ad libitum intervention study with well characterised and controlled
diets. Secondly, our sample size based on the power calculation was sufficient to allow a
Dow
nloaded from https://w
ww
.cambridge.org/core . Aarhus U
niversitets Biblioteker , on 31 Aug 2020 at 14:23:37 , subject to the Cambridge Core term
s of use, available at https://ww
w.cam
bridge.org/core/terms . https://doi.org/10.1017/S0007114520003141
47

reliable detection of changes in metabolic biomarkers. Thirdly, we present very
comprehensive clinical parameters both at non-fasting and fasting. Fourthly, we use
innovative ingredients including wheay protein hydrolysate as protein source and enzyme-
reated wheat bran as DF source. The study, however, also has limitations that need to be
acknowledged. Firstly, we can not exclude that the growth of animals may have masked the
effects of DF and protein, thus further studies are needed to clarify whether DF and high
protein can synergistically affect MetS in an adult obese model with stable weight.
Secondly, a lean control group of pigs feeding on regular diet was not included as the
primary purpose of this study was to investigate the effects of DF and protein on obesity.
Thirdly, since whey protein and enzyme-treated wheat bran were the only protein and fiber
source used to increase dietary protein and DF levels, we can not conclude whether the
effects were induced by the specific sources or by the levels of protein and DF, and further
studies on other DF and protein sources are needed. Morever, in this paper, we have only
presented mRNA data and protein expression of the regulatory genes was not analyzed.
Since mRNA expression is not always correlated with protein expression as well as with the
activation or function of corresponding proteins, the gene expression findings need to be
interpreted with caution and warrant further studies.
In conclusion, the present study demonstrates that an eight-week dietary intervention
with DF and protein did not improve glucose and insulin response directly in an obese
minipig model. However, we demonstrated that a diet enriched with DF from enzyme-
treated wheat bran reduced weight gain and had a potential beneficial effect on beta-cell
secretory function but without effects on lipid biomarkers. Diets enriched in whey protein
hydrolysate tended to increase post-meal insulin levels and several markers related to lipid
and carbohydrate metabolism in an unfavourable way. In contrast to our hypothesis, a
combination of high or low DF and protein diets did not show a synergistic effect on insulin
sensitivity, postprandial lipemia, metabolic or inflammatory biomarkers associated with
MetS as it was also found in a recent human intervention study(55)
and concluded in a recent
review on the impact of DF consumption on insulin resistance and the prevention of
T2D(15)
.
Dow
nloaded from https://w
ww
.cambridge.org/core . Aarhus U
niversitets Biblioteker , on 31 Aug 2020 at 14:23:37 , subject to the Cambridge Core term
s of use, available at https://ww
w.cam
bridge.org/core/terms . https://doi.org/10.1017/S0007114520003141
48

Accepted manuscript
ACKNOWLEDGEMENT
The authors thank Winnie Østergaard, Lisbeth Mӓrcher, Stina Greis Handberg, Kasper
Vrangstrup Poulsen, Søren Krogh Jensen, Anette Møjbæk Pedersen and Elsebeth Lyng
Pedersen and staff at the animal facility for excellent technical assistance. We thank Leslie
Foldager for data consultation. Whey protein hydrolysate was kindly provided by Arla
Foods Ingredients Group P/S. Wheat bran was delivered by Lantmӓnnen and enzymatically
heated by DuPont Industrial Bioscience. The work was financially supported by Innovation
Fund Denmark (4105-00002B) and industrial partners involved in the MERITS (Metabolic
Changes by Carbohydrate and Protein Quality in the Development and Mitigation of
Metabolic Syndrome) project. Y.T.X. acknowledges scholarship from China Scholarship
Community.
FINANCIAL SUPPORT
This work was supported by grants from the Danish Dairy Research Foundation and the
Innovation Fund Denmark—MERITS (4105-00002B).
CONFLICT OF INTEREST
The authors declare no conflict of interest.
AUTHORSHIP
K.E.B.K. H.N.L and M.S.H conceived and designed the research; H.N.L. M.V.C. and
M.S.H performed the animal experiments; H.N.L. and Y.T.X analysed the data; P.K.T.
provided data consultation; Y.T.X. wrote the paper; All co-authors contributed to draft
review.
Dow
nloaded from https://w
ww
.cambridge.org/core . Aarhus U
niversitets Biblioteker , on 31 Aug 2020 at 14:23:37 , subject to the Cambridge Core term
s of use, available at https://ww
w.cam
bridge.org/core/terms . https://doi.org/10.1017/S0007114520003141
49

Accepted manuscript
REFERENCES
1. Fryar CD, Carroll MD & Ogden CL (2016) Prevalence of Overweight, Obesity, and
Severe Obesity Among Children and Adolescents Aged 2–19 Years: United States,
1963–1965 Through 2015–2016.:National Center for Health Statistics. Available from:
https://www.cdc.gov/nchs/data/hestat/obesity_child_15_16/obesity_child_15_16.htm.
2. Isomaa B, Almgren P, Tuomi T et al. (2001) Cardiovascular morbidity and mortality
associated with the metabolic syndrome. Diabetes Care 24, 683-689.
3. Balkau B, Charles MA, Drivsholm T et al. (2002) Frequency of the WHO metabolic
syndrome in European cohorts, and an alternative definition of an insulin resistance
syndrome. Diabetes Metab 28(5), 364-376.
4. Alberti KGMM, Zimmet P & Shaw J (2006) Metabolic syndrome—a new world-wide
definition. A Consensus Statement from the International Diabetes Federation. Diabet
Med 23, 469–480.
5. Huang PL (2009) A comprehensive definition for metabolic syndrome. Dis Model Mech
2, 231-237.
6. Hartvigsen ML, Gregersen S, Laerke HN et al. (2014) Effects of concentrated
arabinoxylan and beta-glucan compared with refined wheat and whole grain rye on
glucose and appetite in subjects with the metabolic syndrome: a randomized study. Eur
J Clin Nutr 68(1), 84-90.
7. Hu FB, van Dam RM & Liu S (2001) Diet and risk of Type II diabetes: the role of types
of fat and carbohydrate. Diabetologia 44, 805-817.
Dow
nloaded from https://w
ww
.cambridge.org/core . Aarhus U
niversitets Biblioteker , on 31 Aug 2020 at 14:23:37 , subject to the Cambridge Core term
s of use, available at https://ww
w.cam
bridge.org/core/terms . https://doi.org/10.1017/S0007114520003141
50

8. Wolever TMS, Tosh SM, Spruill SE et al. (2020) Increasing oat beta-glucan viscosity in
a breakfast meal slows gastric emptying and reduces glycemic and insulinemic
responses but has no effect on appetite, food intake, or plasma ghrelin and PYY
responses in healthy humans: a randomized, placebo-controlled, crossover trial. Am J
Clin Nutr 111(2), 319-328.
9. Yu K, Ke MY, Li WH et al. (2014) The impact of soluble dietary fibre on gastric
emptying, postprandial blood glucose and insulin in patients with type 2 diabetes. Asia
Pac J Clin Nutr 23(2), 210-218.
10.Nielsen TS, Laerke HN, Theil PK et al. (2014) Diets high in resistant starch and
arabinoxylan modulate digestion processes and SCFA pool size in the large intestine
and faecal microbial composition in pigs. Br J Nutr 112(11), 1837-1849.
11.Furness JB, Rivera LR, Cho HJ et al. (2013) The gut as a sensory organ. Nat Rev
Gastroenterol Hepatol 10(12), 729-740.
12.Weickert MO & Pfeiffer AFH (2008) Metabolic effects of dietary fiber consumption
and prevention of diabetes. J Nutr 138, 439-442.
13.Russell WR, Baka A, Bjorck I et al. (2016) Impact of Diet Composition on Blood
Glucose Regulation. Crit Rev Food Sci Nutr 56(4), 541-590.
14.Weickert MO, Roden M, Isken F et al. (2011) Effects of supplemented isoenergetic
diets differing in cereal fiber and protein content on insulin sensitivity in overweight
humans. Am J Clin Nutr 94(2), 459-471.
15.Weickert MO & Pfeiffer AFH (2018) Impact of dietary fiber consumption on insulin
resistance and the prevention of type 2 diabetes. J Nutr 148(1), 7-12.
Dow
nloaded from https://w
ww
.cambridge.org/core . Aarhus U
niversitets Biblioteker , on 31 Aug 2020 at 14:23:37 , subject to the Cambridge Core term
s of use, available at https://ww
w.cam
bridge.org/core/terms . https://doi.org/10.1017/S0007114520003141
51

16.Rakvaag E, Fuglsang-Nielsen R, Bach Knudsen KE et al. (2019) Whey protein
combined with low dietary fiber improves lipid profile in subjects with abdominal
obesity: A randomized, controlled trial. Nutrients 11(9).
17.Markova M, Pivovarova O, Hornemann S et al. (2017) Isocaloric diets high in animal or
plant protein reduce liver fat and inflammation in individuals with type 2 diabetes.
Gastroenterology 152(3):571-585.
18.Mikael Nilsson MS, Anders H Frid, Jens J Holst et al. (2004) Glycemia and insulinemia
in healthy subjects after lactoseequivalent meals of milk and other food proteins: the
role of plasma amino acids and incretins. Am J Clin Nutr 80, 1246–1253.
19.Bjornshave A, Holst JJ & Hermansen K (2018) Pre-meal effect of whey proteins on
metabolic parameters in subjects with and without type 2 diabetes: A randomized,
crossover trial. Nutrients 10(2).
20.Frid AH, Nilsson M, Holst JJ et al. (2005) Effect of whey on blood glucose and insulin
responses to composite breakfast and lunch meals in type 2 diabetic subjects. Am J Clin
Nutr 83, 69-75.
21. Nilsson M, Holst JJ & Björck IME (2007) Metabolic effects of amino acid mixtures
and whey protein in healthy subjects: studies using glucose-equivalent drinks. Am J Clin
Nutr 85, 996-1004.
22.Curtasu MV (2019) Obesity and metabolic syndrome in miniature pigs as models for
human disease – metabolic changes in response to ad libitum feeding of high-fat-high-
carbohydrate diets. PhD Thesis, Aahus University, Denmark.
Dow
nloaded from https://w
ww
.cambridge.org/core . Aarhus U
niversitets Biblioteker , on 31 Aug 2020 at 14:23:37 , subject to the Cambridge Core term
s of use, available at https://ww
w.cam
bridge.org/core/terms . https://doi.org/10.1017/S0007114520003141
52
23.Bellinger DA, Merricks EP & Nichols TC (2006) Swine models of type 2 diabetes
mellitus: insulin resistance, glucose tolerance, and cardiovascular complications. ILAR J
47(3), 243-258.
24.Hsu MC, Wang ME, Jiang YF et al. (2017) Long-term feeding of high-fat plus high-
fructose diet induces isolated impaired glucose tolerance and skeletal muscle insulin
resistance in miniature pigs. Diabetol Metab Syndr 9:81.
25.Bligh EG & Dyer WJ (1959) A rapid method of total lipid extraction and purification.
Can J Biochem 37(Number 8).
26.Nielsen DSG, Fredborg M, Andersen V et al. (2017) Administration of Protein Kinase
D1 Induces a Protective Effect on Lipopolysaccharide-Induced Intestinal Inflammation
in a Co-Culture Model of Intestinal Epithelial Caco-2 Cells and RAW264.7 Macrophage
Cells. Int J Inflam, 9273640.
27.Sebert SP, Lecannu G, Kozlowski F et al. (2005) Childhood obesity and insulin
resistance in a Yucatan mini-piglet model: putative roles of IGF-1 and muscle PPARs in
adipose tissue activity and development. Int J Obes (Lond) 29(3), 324-333.
28.Swindle MM, Makin A, Herron AJ et al. (2012) Swine as models in biomedical
research and toxicology testing. Vet Pathol 49(2), 344-356.
29.Levy JC, Matthews DR & Hermans MP (1998) Correct homeostasis model assessment
(HOMA) evaluation uses the computer program. Diabetes Care 21(12), 2191-2192.
30. Ellegaard Göttingen Minipigs. Available online: https://minipigsdk/ (accessed on 03
Jul. 2020).
Dow
nloaded from https://w
ww
.cambridge.org/core . Aarhus U
niversitets Biblioteker , on 31 Aug 2020 at 14:23:37 , subject to the Cambridge Core term
s of use, available at https://ww
w.cam
bridge.org/core/terms . https://doi.org/10.1017/S0007114520003141
53

31.Larsen MO, Rolin B, Wilken M et al. (2002) High-fat high-energy feeding impairs
fasting glucose and increases fasting insulin levels in the Göttingen Minipig. Ann NY
Acad Sci 967, 414–423.
32.Christoffersen B, Golozoubova V, Pacini G et al. (2013) The young göttingen minipig
as a model of childhood and adolescent obesity: Influence of diet and gender. Obesity
21(1), 149-158.
33. Hernandez-Alonso P, Salas-Salvado J, Ruiz-Canela M et al. (2016) High dietary
protein intake is associated with an increased body weight and total death risk. Clin
Nutr 35(2), 496-506.
34. Halkjaer J, Olsen A, Overvad K, et al. (2011) Intake of total, animal and plant protein
and subsequent changes in weight or waist circumference in European men and
women: the Diogenes project. Int J Obes (Lond) 35(8), 1104-1113.
35. Fisher KD, Scheffler TL, Kasten SC et al. (2013) Energy dense, protein restricted diet
increases adiposity and perturbs metabolism in young, genetically lean pigs. PLoS One
8(8), e72320.
36. Thalacker-Mercer AE & Campbell WW (2008) Dietary protein intake affects albumin
fractional synthesis rate in younger and older adults equally. Nutr Rev 66(2), 91-95.
37. Adilah ZN, Liew WPP, Redzwan SM et al. (2018) Effect of high protein diet and
probiotic Lactobacillus casei Shirota supplementation in aflatoxin B1-induced rats.
Biomed Res Int, 9568351.
38. Mudgil D & Barak S (2013) Composition, properties and health benefits of indigestible
carbohydrate polymers as dietary fiber: a review. Int J Biol Macromol 61, 1-6.
Dow
nloaded from https://w
ww
.cambridge.org/core . Aarhus U
niversitets Biblioteker , on 31 Aug 2020 at 14:23:37 , subject to the Cambridge Core term
s of use, available at https://ww
w.cam
bridge.org/core/terms . https://doi.org/10.1017/S0007114520003141
54

39. Baggio LL & Drucker DJ (2007) Biology of incretins: GLP-1 and GIP.
Gastroenterology 132(6), 2131-2157.
40. Warrilow A, Mellor D, McKune A et al. (2019) Dietary fat, fibre, satiation, and satiety-
a systematic review of acute studies. Eur J Clin Nutr 73(3), 333-344.
41. Müller M, Hernández MAG, Goossens GH, et al. (2019) Circulating but not faecal
short-chain fatty acids are related to insulin sensitivity, lipolysis and GLP-1
concentrations in humans. Scientific Reports 9(1), 12515.
42. Wang X, Liu H, Chen J et al. (2015) Multiple factors related to the secretion of
glucagon-like peptide-1. Int J Endocrinol 2015, 651757.
43. Papathanasopoulos A & Camilleri M (2010) Dietary fiber supplements: effects in
obesity and metabolic syndrome and relationship to gastrointestinal functions.
Gastroenterology 138(1), 65-72 e1-2.
44. Möhlig M, Koebnick C, Weickert MO et al. (2005) Arabinoxylan-enriched meal
increases serum ghrelin levels in healthy humans. Horm Metab Res 37(05), 303-308.
45. Ingerslev AK, Theil PK, Hedemann MS et al. (2014) Resistant starch and arabinoxylan
augment SCFA absorption, but affect postprandial glucose and insulin responses
differently. Br J Nutr 111(9), 1564-1576.
46. Chen C, Zeng Y, Xu J et al. (2016) Therapeutic effects of soluble dietary fiber
consumption on type 2 diabetes mellitus. Exp Ther Med 12(2), 1232-1242.
47. Rakvaag E, Fuglsang-Nielsen R, Bach Knudsen KE et al. (2019) The combination of
whey protein and dietary fiber does not alter low-grade inflammation or adipose tissue
gene expression in adults with abdominal obesity. Rev Diabet Stud 15, 83-93.
Dow
nloaded from https://w
ww
.cambridge.org/core . Aarhus U
niversitets Biblioteker , on 31 Aug 2020 at 14:23:37 , subject to the Cambridge Core term
s of use, available at https://ww
w.cam
bridge.org/core/terms . https://doi.org/10.1017/S0007114520003141
55

48. Bermudez-Brito M, Faas MM & de Vos P (2016) Modulation of Dendritic-Epithelial
Cell Responses against Sphingomonas Paucimobilis by Dietary Fibers. Sci Rep 6,
30277.
49. Chung ST, Hsia DS, Chacko SK et al. (2015) Increased gluconeogenesis in youth with
newly diagnosed type 2 diabetes. Diabetologia 58(3), 596-603.
50. Polakof S, Rémond D, Rambeau M et al. (2014) Postprandial metabolic events in mini-
pigs: new insights from a combined approach using plasma metabolomics, tissue gene
expression, and enzyme activity. Metabolomics 11(4), 964-979.
51. Rietman A, Schwarz J, Tome D et al. (2014) High dietary protein intake, reducing or
eliciting insulin resistance? Eur J Clin Nutr 68(9), 973-979.
52. Polakof S, Remond D, David J et al. (2018) Time-course changes in circulating
branched-chain amino acid levels and metabolism in obese Yucatan minipig. Nutrition
50, 66-73.
53. Chung ST, Hsia DS, Chacko SK et al. (2015) Increased gluconeogenesis in youth with
newly diagnosed type 2 diabetes. Diabetologia 58(3), 596-603.
54. Hession M, Rolland C, Kulkarni U et al. (2009) Systematic review of randomized
controlled trials of low-carbohydrate vs. low-fat/low-calorie diets in the management of
obesity and its comorbidities. Obes Rev 10(1), 36-50.
55. Nielsen RF (2019) Long-term effects of whey protein and dietary fiber from wheat on
markers of metabolic risk and bone health in subjects with abdominal obesity. PhD
Thesis, Aarhus University Hospital, Denmark.
Dow
nloaded from https://w
ww
.cambridge.org/core . Aarhus U
niversitets Biblioteker , on 31 Aug 2020 at 14:23:37 , subject to the Cambridge Core term
s of use, available at https://ww
w.cam
bridge.org/core/terms . https://doi.org/10.1017/S0007114520003141
56
56. Veldhorst MAB, Nieuwenhuizen AG, Hochstenbach-Waelen A et al. (2009) Dose-
dependent satiating effect of whey relative to casein or soy. Physiol Behav 96(4):675-
882.
57. Longo M, Zatterale F, Naderi J et al. (2019) Adipose tissue dysfunction as determinant
of obesity-associated metabolic complications. Int J Mol Sci 20(9).
58. Park KS, Ciaraldi TP, Abrams-Carter L et al. (1997) PPAR-y gene expression is
elevated in skeletal muscle of obese and type II diabetic subjects. Diabetes 46, 1230-
1234.
59. Loviscach M, Rehman N, Carter L et al. (2000) Distribution of peroxisome
proliferator-activated receptors (PPARs) in human skeletal muscle and adipose tissue:
relation to insulin action. Diabetologia 43, 304-311.
60. Friedman JM (2019) Leptin and the endocrine control of energy balance. Nat Metab
1(8), 754-764.
61. Seron K, Corset L, Vasseur F et al. (2006) Distinct impaired regulation of SOCS3 and
long and short isoforms of the leptin receptor in visceral and subcutaneous fat of lean
and obese women. Biochem Biophys Res Commun 348(4), 1232-1238.
62. Wang MY, Orci L, Ravazzola M et al. (2005) Fat storage in adipocytes requires
inactivation of leptin’s paracrine activity: Implications for treatment of human obesity.
PNAS 102, 18011–18016.
63. Berndt J, Kovacs P, Ruschke K et al. (2007) Fatty acid synthase gene expression in
human adipose tissue: association with obesity and type 2 diabetes. Diabetologia 50(7),
1472-1480.
Dow
nloaded from https://w
ww
.cambridge.org/core . Aarhus U
niversitets Biblioteker , on 31 Aug 2020 at 14:23:37 , subject to the Cambridge Core term
s of use, available at https://ww
w.cam
bridge.org/core/terms . https://doi.org/10.1017/S0007114520003141
57
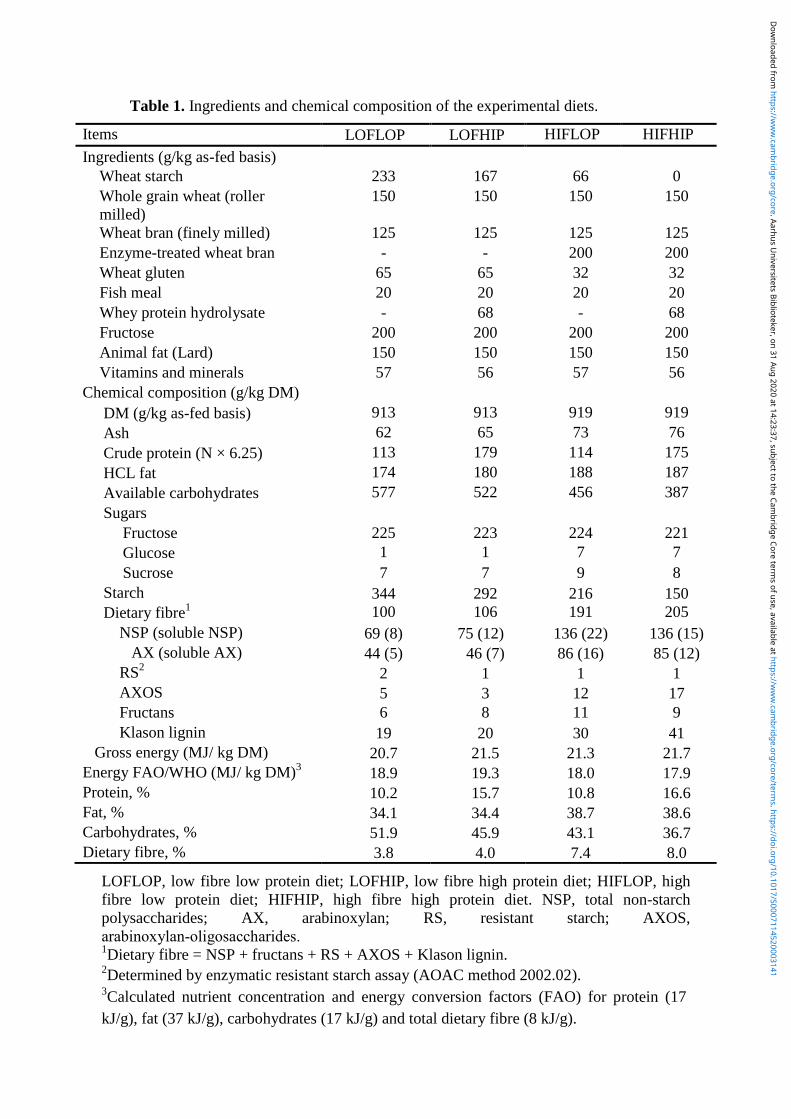
Table 1. Ingredients and chemical composition of the experimental diets.
Items LOFLOP LOFHIP HIFLOP HIFHIP
Ingredients (g/kg as-fed basis)
Wheat starch 233 167 66 0
Whole grain wheat (roller
milled)
150 150 150 150
Wheat bran (finely milled) 125 125 125 125
Enzyme-treated wheat bran - - 200 200
Wheat gluten 65 65 32 32
Fish meal 20 20 20 20
Whey protein hydrolysate - 68 - 68
Fructose 200 200 200 200
Animal fat (Lard) 150 150 150 150
Vitamins and minerals 57 56 57 56
Chemical composition (g/kg DM)
DM (g/kg as-fed basis) 913 913 919 919
Ash 62 65 73 76
Crude protein (N × 6.25) 113 179 114 175
HCL fat 174 180 188 187
Available carbohydrates 577 522 456 387
Sugars
Fructose 225 223 224 221
Glucose 1 1 7 7
Sucrose 7 7 9 8
Starch 344 292 216 150
Dietary fibre1 100 106 191 205
NSP (soluble NSP) 69 (8) 75 (12) 136 (22) 136 (15)
AX (soluble AX) 44 (5) 46 (7) 86 (16) 85 (12)
RS2 2 1 1 1
AXOS 5 3 12 17
Fructans 6 8 11 9
Klason lignin 19 20 30 41
Gross energy (MJ/ kg DM) 20.7 21.5 21.3 21.7
Energy FAO/WHO (MJ/ kg DM)3
18.9 19.3 18.0 17.9
Protein, % 10.2 15.7 10.8 16.6
Fat, % 34.1 34.4 38.7 38.6
Carbohydrates, % 51.9 45.9 43.1 36.7
Dietary fibre, % 3.8 4.0 7.4 8.0
LOFLOP, low fibre low protein diet; LOFHIP, low fibre high protein diet; HIFLOP, high
fibre low protein diet; HIFHIP, high fibre high protein diet. NSP, total non-starch
polysaccharides; AX, arabinoxylan; RS, resistant starch; AXOS,
arabinoxylan‐oligosaccharides. 1Dietary fibre = NSP + fructans + RS + AXOS + Klason lignin.
2Determined by enzymatic resistant starch assay (AOAC method 2002.02).
3Calculated nutrient concentration and energy conversion factors (FAO) for protein (17
kJ/g), fat (37 kJ/g), carbohydrates (17 kJ/g) and total dietary fibre (8 kJ/g).
Dow
nloaded from https://w
ww
.cambridge.org/core . Aarhus U
niversitets Biblioteker , on 31 Aug 2020 at 14:23:37 , subject to the Cambridge Core term
s of use, available at https://ww
w.cam
bridge.org/core/terms . https://doi.org/10.1017/S0007114520003141
58

Accepted manuscript
Table 2. Concentrations of clinical parameters in fasting (jugular vein) and non-fasting
plasma (jugular and portal vein) in Göttingen Minipigs fed diets low or high in dietary
fibre and protein.
Item Diet
1
SEM P-value
LOFLOP LOFHIP HIFLOP HIFHIP Fibre Protein F×P2
Fasting, jugular vein
Glucose (mM) 5.7 6.8 5.8 6.9 0.42 0.771 0.008 0.917
Fructosamine (µM) 261 282 269 261 8.3 0.308 0.325 0.022
NEFA (μM) 166 197 156 284 36 0.275 0.015 0.162
Lactate (mM) 2.0 1.8 1.5 1.6 0.24 0.154 0.779 0.506
Triglycerides (mM) 0.53 0.50 0.62 0.65 0.07 0.072 0.990 0.660
LDL (mM) 1.6 1.9 1.4 1.7 0.25 0.361 0.265 0.888
HDL (mM) 1.7 1.7 1.7 1.6 0.20 0.900 0.359 0.450
LDL:HDL 1.0 1.2 0.84 1.1 0.16 0.320 0.096 0.773
Total cholesterol (mM) 4.2 4.6 4.3 3.9 0.71 0.519 0.925 0.444
Albumin (g/L) 42 45 39 43 1.5 0.097 0.018 0.779
AST (U/L) 30 23 25 23 2.3 0.305 0.043 0.301
ALT (U/L) 25 24 23 23 1.8 0.253 0.737 0.832
GGT (U/L) 61 70 63 64 6.5 0.728 0.357 0.373
Non-fasting, jugular vein
Glucose (mM) 5.6 6.3 6.3 7.8 0.60 0.062 0.065 0.496
Lactate (mM) 1.9 1.7 1.8 1.7 0.27 0.798 0.567 0.763
Triglycerides (mM) 0.64 0.57 0.62 1.2 0.19 0.098 0.119 0.076
LDL (mM) 1.3 1.9 1.1 1.5 0.28 0.177 0.054 0.608
HDL (mM) 1.9 1.8 1.8 1.7 0.18 0.356 0.246 0.854
LDL:HDL 0.66 0.98 0.63 0.79 0.10 0.255 0.015 0.382
Total cholesterol (mM) 4.1 4.2 3.8 3.7 0.61 0.341 0.932 0.798
Non-fasting, portal vein
Glucose (mM) 7.7 7.7 6.9 7.5 0.82 0.516 0.689 0.697
Lactate (mM) 4.4 4.0 4.6 4.5 0.90 0.656 0.777 0.872
Triglycerides (mM) 1.0 0.82 1.2 1.5 0.35 0.088 0.729 0.240
LDL (mM) 1.4 2.0 1.2 1.6 0.29 0.241 0.049 0.636
HDL (mM) 2.0 1.8 1.9 1.8 0.18 0.442 0.280 0.724
LDL:HDL 0.68 1.0 0.66 0.82 0.10 0.279 0.014 0.332
Total cholesterol (mM) 4.3 4.6 3.8 3.9 0.68 0.240 0.693 0.779
NEFA, non-esterified fatty acids; LDL, low density lipoprotein; HDL, high density
lipoprotein; AST, aspartate transaminase; ALT, alanine transaminase; GGT, gamma-
glutamyl transferase. 1Minipigs were regarded as the experimental units, n = 10 for low fibre low protein diet
(LOFLOP), n = 10 for low fibre high protein diet (LOFHIP), n = 12 for high fibre low
protein diet (HIFLOP) and n = 11 for high fibre high protein diet (HIFHIP). Data were
expressed as means ± standard error of means (SEM). 2F×P, interaction between fibre and protein level.
Dow
nloaded from https://w
ww
.cambridge.org/core . Aarhus U
niversitets Biblioteker , on 31 Aug 2020 at 14:23:37 , subject to the Cambridge Core term
s of use, available at https://ww
w.cam
bridge.org/core/terms . https://doi.org/10.1017/S0007114520003141
59

Table 3. Fasting and non-fasting concentrations of circulating hormones and inflammatory
cytokines in Göttingen Minipigs fed diets low or high in dietary fibre and protein.
Item Diet
1 SEM P-value
LOFLOP LOFHIP HIFLOP HIFHIP Fibre Protein F×P2
Fasting
Ghrelin (pg/ml) 14 18 16 38 5.6 0.055 0.008 0.073
GIP (pg/ml) 72 47 40 33 8.8 0.008 0.083 0.286
GLP-1 (pg/ml) 228 258 308 317 38 0.053 0.600 0.769
C-peptide(pg/ml) 28 33 35 38 5.8 0.307 0.468 0.928
Glucagon (pg/ml) 245 266 260 208 29 0.435 0.511 0.180
Insulin (pM) 45 55 57 55 16 0.688 0.815 0.663
HOMA-IR 1.9 2.6 2.4 2.4
0.84
0.891 0.639 0.654
HOMA-β3
62 (36-107) 50 (28-89) 56 (33-95) 50 (29-84)
-
0.858 0.553 0.878
IL-2 (ng/ml) 0.20 0.30 0.35 0.28 0.07 0.186 0.763 0.128
IL-4 (ng/ml) 0.36 1.43 1.32 0.79 0.35 0.605 0.473 0.028
IL-10 (ng/ml) 0.36 0.50 0.49 0.47 0.08 0.418 0.343 0.229
IL-12 (ng/ml) 0.59 0.60 0.71 0.78 0.11 0.047 0.575 0.691
IL-18 (ng/ml) 0.75 0.96 1.08 0.97 0.15 0.178 0.757 0.231
IFN- γ (ng/ml) 4.4 4.1 5.3 6.2 0.59 0.011 0.552 0.292
Non-fasting
Ghrelin (pg/ml) 14 17 20 23 3.0 0.036 0.343 0.997
GIP (pg/ml) 589
a 316
b 248
b 295
b 61 0.003 0.111 0.009
GLP-1 (pg/ml) 258 304 292 354 29.3 0.142 0.055 0.771
C-peptide (pg/ml) 23 41 50 69 11 0.011 0.076 0.945
Dow
nloaded from https://w
ww
.cambridge.org/core . Aarhus U
niversitets Biblioteker , on 31 Aug 2020 at 14:23:37 , subject to the Cambridge Core term
s of use, available at https://ww
w.cam
bridge.org/core/terms . https://doi.org/10.1017/S0007114520003141
60

Glucagon (pg/ml) 234 277 248 264 27 0.977 0.280 0.602
Insulin (pM) 71 76 55 85 9.0 0.668 0.062 0.171
IL-2 (ng/ml) 0.09 0.20 0.22 0.23 0.05 0.131 0.311 0.342
IL-4 (ng/ml) 0.12 0.55 0.58 0.57 0.21 0.248 0.329 0.302
IL-10 (ng/ml) 0.15 0.34 0.31 0.38 0.10 0.264 0.177 0.533
IL-12 (ng/ml) 0.32 0.30 0.35 0.36 0.04 0.278 0.930 0.656
IL-18 (ng/ml) 0.26 0.45 0.46 0.50 0.10 0.209 0.243 0.468
IFN- γ (ng/ml) 1.6 1.6 2.3 2.4 0.21 0.001 0.621 0.732
HOMA-IR, homeostatic model assessment for insulin resistance; HOMA-β, homeostatic
model assessment for beta-cell function; GIP, gastric inhibitory polypeptide; GLP-1,
glucagon-like polypeptide; IL, interleukin; IFN-γ, interferon γ. 1Mnipigs were regarded as the experimental units, n = 10 for low fibre low protein diet
(LOFLOP), n = 10 for low fibre high protein diet (LOFHIP), n = 12 for high fibre low
protein diet (HIFLOP) and n = 11 for high fibre high protein diet (HIFHIP). Data were
expressed as means ± standard error of means (SEM). 2F×P, interaction between fibre and protein level. Different superscript letters in a row are
presented for the significant interaction (P < 0.05) after adjustment for multiple
comparisons by the Tukey–Kramer post hoc test. 3Values are back-transformed after log transformation and are expressed as means with
lower and upper 95% confidence intervals.
Dow
nloaded from https://w
ww
.cambridge.org/core . Aarhus U
niversitets Biblioteker , on 31 Aug 2020 at 14:23:37 , subject to the Cambridge Core term
s of use, available at https://ww
w.cam
bridge.org/core/terms . https://doi.org/10.1017/S0007114520003141
61

Accepted manuscript
Table 4. Clinical parameter concentrations of urine collected at fasting and non-fasting
state of Göttingen Minipigs fed diets low or high in dietary fibre and protein.
Item Diet
1
SEM P-value
LOFLOP LOFHIP HIFLOP HIFHIP Fibre Protein F×P2
Fasting
Creatinine (mM) 17a 9.1
ab 7.1
b 8.4
b 2.4 0.018 0.160 0.036
Glucose (mM) 2.8 21 13 20 8.1 0.530 0.074 0.379
Protein (mM) 360 753 243 435 193 0.239 0.116 0.583
Glucose:creatinine3
0.13
(0.02-0.81)
0.80
(0.14-4.8)
0.69
(0.13-3.7)
1.0
(0.17-5.9)
- 0.163 0.118 0.279
Protein:creatinine4 14 (6.1-34) 35 (16-79) 24 (12-49) 38 (17-85) - 0.465 0.100 0.597
Non-fasting
pH 5.0 5.6 5.1 5.6 0.13 0.707 <0.001 0.896
Creatinine (mM) 10 10 10 7.6 1.6 0.387 0.327 0.416
Glucose (mM) 0.72 0.46 0.37 0.54 0.17 0.422 0.852 0.179
Protein (mM) 43 84 49 87 19 0.788 0.032 0.945
Glucose:creatinine5
0.05
(0.03-0.07)
0.04
(0.03-0.07)
0.03
(0.02-0.05)
0.06
(0.04-0.10)
- 0.815 0.258 0.137
Protein:creatinine6
3.9b
(2.0-7.7)
7.5b
(3.8-15)
4.0b
(2.1-7.6)
24a
(12-46)
- 0.040 <0.001 0.048
1Minipigs were regarded as the experimental units, n = 10 for low fibre low protein diet
(LOFLOP), n = 10 for low fibre high protein diet (LOFHIP), n = 12 for high fibre low
protein diet (HIFLOP) and n = 11 for high fibre high protein diet (HIFHIP). Data were
expressed as means ± standard error of means (SEM). 2F×P, interaction between fibre and protein level. Different superscript letters in a row are
presented for the significant interaction (P < 0.05) after adjustment for multiple
comparisons by the Tukey–Kramer post hoc test. 3-6
Values are back transformed after log transformation and are expressed as means (95%
confidence interval).
Dow
nloaded from https://w
ww
.cambridge.org/core . Aarhus U
niversitets Biblioteker , on 31 Aug 2020 at 14:23:37 , subject to the Cambridge Core term
s of use, available at https://ww
w.cam
bridge.org/core/terms . https://doi.org/10.1017/S0007114520003141
62
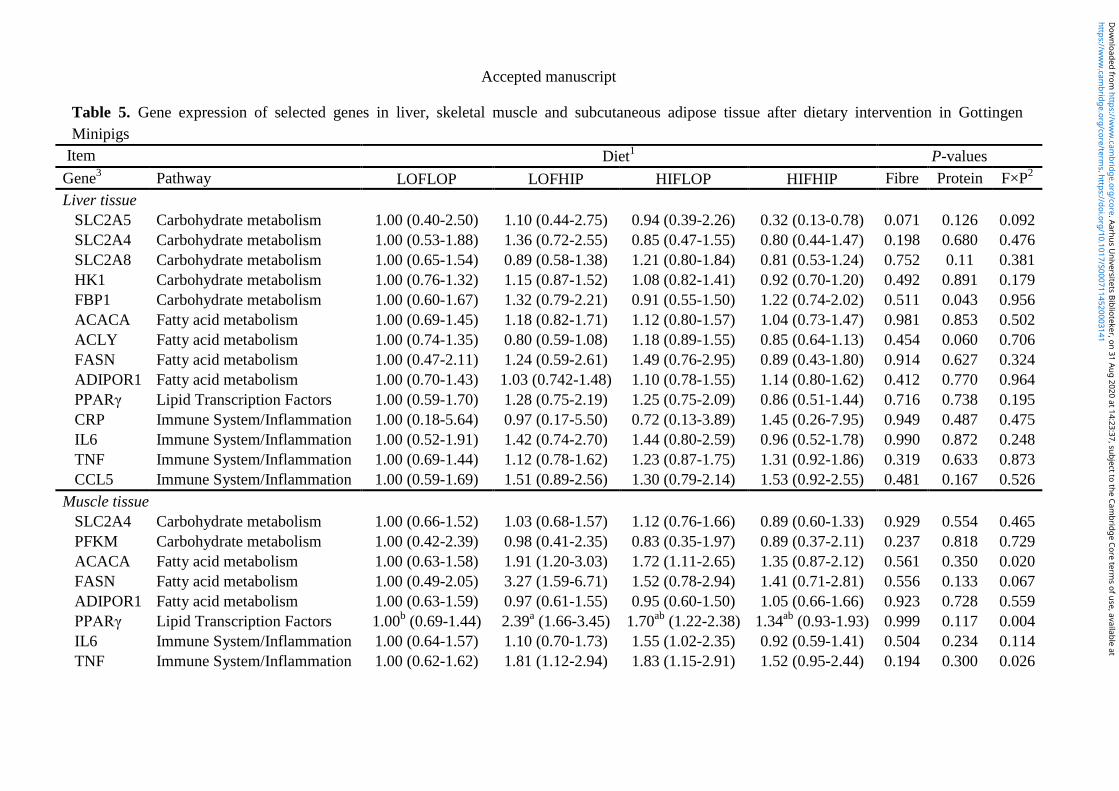
Accepted manuscript
Table 5. Gene expression of selected genes in liver, skeletal muscle and subcutaneous adipose tissue after dietary intervention in Gottingen
Minipigs
Item Diet1 P-values
Gene3 Pathway LOFLOP LOFHIP HIFLOP HIFHIP Fibre Protein F×P
2
Liver tissue
SLC2A5 Carbohydrate metabolism 1.00 (0.40-2.50) 1.10 (0.44-2.75) 0.94 (0.39-2.26) 0.32 (0.13-0.78) 0.071 0.126 0.092
SLC2A4 Carbohydrate metabolism 1.00 (0.53-1.88) 1.36 (0.72-2.55) 0.85 (0.47-1.55) 0.80 (0.44-1.47) 0.198 0.680 0.476
SLC2A8 Carbohydrate metabolism 1.00 (0.65-1.54) 0.89 (0.58-1.38) 1.21 (0.80-1.84) 0.81 (0.53-1.24) 0.752 0.11 0.381
HK1 Carbohydrate metabolism 1.00 (0.76-1.32) 1.15 (0.87-1.52) 1.08 (0.82-1.41) 0.92 (0.70-1.20) 0.492 0.891 0.179
FBP1 Carbohydrate metabolism 1.00 (0.60-1.67) 1.32 (0.79-2.21) 0.91 (0.55-1.50) 1.22 (0.74-2.02) 0.511 0.043 0.956
ACACA Fatty acid metabolism 1.00 (0.69-1.45) 1.18 (0.82-1.71) 1.12 (0.80-1.57) 1.04 (0.73-1.47) 0.981 0.853 0.502
ACLY Fatty acid metabolism 1.00 (0.74-1.35) 0.80 (0.59-1.08) 1.18 (0.89-1.55) 0.85 (0.64-1.13) 0.454 0.060 0.706
FASN Fatty acid metabolism 1.00 (0.47-2.11) 1.24 (0.59-2.61) 1.49 (0.76-2.95) 0.89 (0.43-1.80) 0.914 0.627 0.324
ADIPOR1 Fatty acid metabolism 1.00 (0.70-1.43) 1.03 (0.742-1.48) 1.10 (0.78-1.55) 1.14 (0.80-1.62) 0.412 0.770 0.964
PPARγ Lipid Transcription Factors 1.00 (0.59-1.70) 1.28 (0.75-2.19) 1.25 (0.75-2.09) 0.86 (0.51-1.44) 0.716 0.738 0.195
CRP Immune System/Inflammation 1.00 (0.18-5.64) 0.97 (0.17-5.50) 0.72 (0.13-3.89) 1.45 (0.26-7.95) 0.949 0.487 0.475
IL6 Immune System/Inflammation 1.00 (0.52-1.91) 1.42 (0.74-2.70) 1.44 (0.80-2.59) 0.96 (0.52-1.78) 0.990 0.872 0.248
TNF Immune System/Inflammation 1.00 (0.69-1.44) 1.12 (0.78-1.62) 1.23 (0.87-1.75) 1.31 (0.92-1.86) 0.319 0.633 0.873
CCL5 Immune System/Inflammation 1.00 (0.59-1.69) 1.51 (0.89-2.56) 1.30 (0.79-2.14) 1.53 (0.92-2.55) 0.481 0.167 0.526
Muscle tissue
SLC2A4 Carbohydrate metabolism 1.00 (0.66-1.52) 1.03 (0.68-1.57) 1.12 (0.76-1.66) 0.89 (0.60-1.33) 0.929 0.554 0.465
PFKM Carbohydrate metabolism 1.00 (0.42-2.39) 0.98 (0.41-2.35) 0.83 (0.35-1.97) 0.89 (0.37-2.11) 0.237 0.818 0.729
ACACA Fatty acid metabolism 1.00 (0.63-1.58) 1.91 (1.20-3.03) 1.72 (1.11-2.65) 1.35 (0.87-2.12) 0.561 0.350 0.020
FASN Fatty acid metabolism 1.00 (0.49-2.05) 3.27 (1.59-6.71) 1.52 (0.78-2.94) 1.41 (0.71-2.81) 0.556 0.133 0.067
ADIPOR1 Fatty acid metabolism 1.00 (0.63-1.59) 0.97 (0.61-1.55) 0.95 (0.60-1.50) 1.05 (0.66-1.66) 0.923 0.728 0.559
PPARγ Lipid Transcription Factors 1.00b (0.69-1.44) 2.39
a (1.66-3.45) 1.70
ab (1.22-2.38) 1.34
ab (0.93-1.93) 0.999 0.117 0.004
IL6 Immune System/Inflammation 1.00 (0.64-1.57) 1.10 (0.70-1.73) 1.55 (1.02-2.35) 0.92 (0.59-1.41) 0.504 0.234 0.114
TNF Immune System/Inflammation 1.00 (0.62-1.62) 1.81 (1.12-2.94) 1.83 (1.15-2.91) 1.52 (0.95-2.44) 0.194 0.300 0.026
https://ww
w.cam
bridge.org/core/terms . https://doi.org/10.1017/S0007114520003141
Dow
nloaded from https://w
ww
.cambridge.org/core . Aarhus U
niversitets Biblioteker , on 31 Aug 2020 at 14:23:37 , subject to the Cambridge Core term
s of use, available at
63
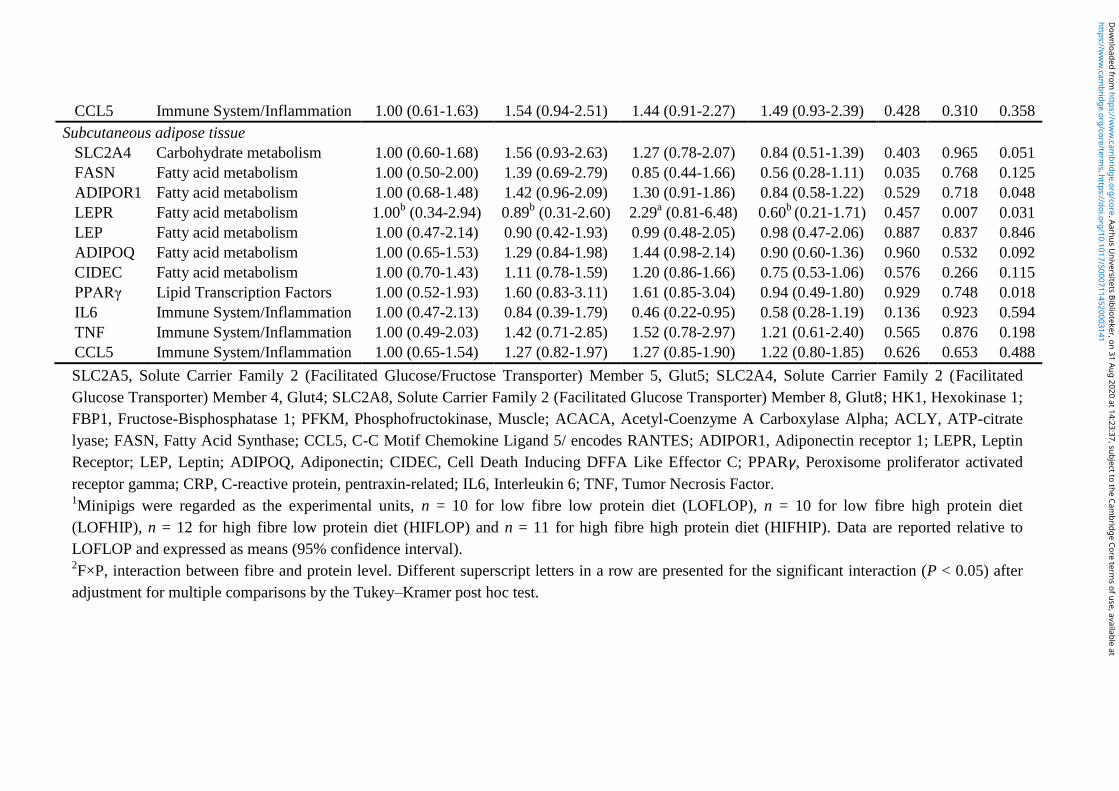
CCL5 Immune System/Inflammation 1.00 (0.61-1.63) 1.54 (0.94-2.51) 1.44 (0.91-2.27) 1.49 (0.93-2.39) 0.428 0.310 0.358
Subcutaneous adipose tissue
SLC2A4 Carbohydrate metabolism 1.00 (0.60-1.68) 1.56 (0.93-2.63) 1.27 (0.78-2.07) 0.84 (0.51-1.39) 0.403 0.965 0.051
FASN Fatty acid metabolism 1.00 (0.50-2.00) 1.39 (0.69-2.79) 0.85 (0.44-1.66) 0.56 (0.28-1.11) 0.035 0.768 0.125
ADIPOR1 Fatty acid metabolism 1.00 (0.68-1.48) 1.42 (0.96-2.09) 1.30 (0.91-1.86) 0.84 (0.58-1.22) 0.529 0.718 0.048
LEPR Fatty acid metabolism 1.00b (0.34-2.94) 0.89
b (0.31-2.60) 2.29
a (0.81-6.48) 0.60
b (0.21-1.71) 0.457 0.007 0.031
LEP Fatty acid metabolism 1.00 (0.47-2.14) 0.90 (0.42-1.93) 0.99 (0.48-2.05) 0.98 (0.47-2.06) 0.887 0.837 0.846
ADIPOQ Fatty acid metabolism 1.00 (0.65-1.53) 1.29 (0.84-1.98) 1.44 (0.98-2.14) 0.90 (0.60-1.36) 0.960 0.532 0.092
CIDEC Fatty acid metabolism 1.00 (0.70-1.43) 1.11 (0.78-1.59) 1.20 (0.86-1.66) 0.75 (0.53-1.06) 0.576 0.266 0.115
PPARγ Lipid Transcription Factors 1.00 (0.52-1.93) 1.60 (0.83-3.11) 1.61 (0.85-3.04) 0.94 (0.49-1.80) 0.929 0.748 0.018
IL6 Immune System/Inflammation 1.00 (0.47-2.13) 0.84 (0.39-1.79) 0.46 (0.22-0.95) 0.58 (0.28-1.19) 0.136 0.923 0.594
TNF Immune System/Inflammation 1.00 (0.49-2.03) 1.42 (0.71-2.85) 1.52 (0.78-2.97) 1.21 (0.61-2.40) 0.565 0.876 0.198
CCL5 Immune System/Inflammation 1.00 (0.65-1.54) 1.27 (0.82-1.97) 1.27 (0.85-1.90) 1.22 (0.80-1.85) 0.626 0.653 0.488
SLC2A5, Solute Carrier Family 2 (Facilitated Glucose/Fructose Transporter) Member 5, Glut5; SLC2A4, Solute Carrier Family 2 (Facilitated
Glucose Transporter) Member 4, Glut4; SLC2A8, Solute Carrier Family 2 (Facilitated Glucose Transporter) Member 8, Glut8; HK1, Hexokinase 1;
FBP1, Fructose-Bisphosphatase 1; PFKM, Phosphofructokinase, Muscle; ACACA, Acetyl-Coenzyme A Carboxylase Alpha; ACLY, ATP-citrate
lyase; FASN, Fatty Acid Synthase; CCL5, C-C Motif Chemokine Ligand 5/ encodes RANTES; ADIPOR1, Adiponectin receptor 1; LEPR, Leptin
Receptor; LEP, Leptin; ADIPOQ, Adiponectin; CIDEC, Cell Death Inducing DFFA Like Effector C; PPARγ, Peroxisome proliferator activated
receptor gamma; CRP, C-reactive protein, pentraxin-related; IL6, Interleukin 6; TNF, Tumor Necrosis Factor. 1Minipigs were regarded as the experimental units, n = 10 for low fibre low protein diet (LOFLOP), n = 10 for low fibre high protein diet
(LOFHIP), n = 12 for high fibre low protein diet (HIFLOP) and n = 11 for high fibre high protein diet (HIFHIP). Data are reported relative to
LOFLOP and expressed as means (95% confidence interval). 2F×P, interaction between fibre and protein level. Different superscript letters in a row are presented for the significant interaction (P < 0.05) after
adjustment for multiple comparisons by the Tukey–Kramer post hoc test.
https://ww
w.cam
bridge.org/core/terms . https://doi.org/10.1017/S0007114520003141
Dow
nloaded from https://w
ww
.cambridge.org/core . Aarhus U
niversitets Biblioteker , on 31 Aug 2020 at 14:23:37 , subject to the Cambridge Core term
s of use, available at
64

Accepted manuscript
https://ww
w.cam
bridge.org/core/terms . https://doi.org/10.1017/S0007114520003141
Dow
nloaded from https://w
ww
.cambridge.org/core . Aarhus U
niversitets Biblioteker , on 31 Aug 2020 at 14:23:37 , subject to the Cambridge Core term
s of use, available at
65
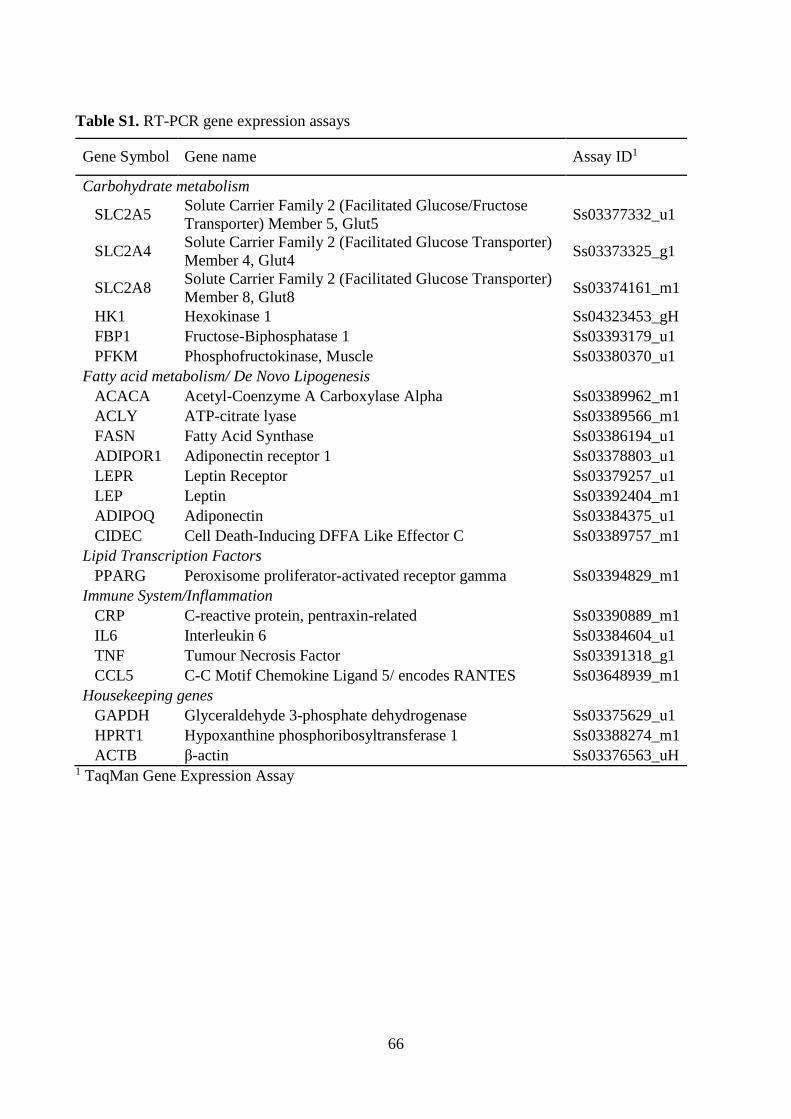
66
Table S1. RT-PCR gene expression assays
Gene Symbol Gene name Assay ID1
Carbohydrate metabolism
SLC2A5 Solute Carrier Family 2 (Facilitated Glucose/Fructose
Transporter) Member 5, Glut5 Ss03377332_u1
SLC2A4 Solute Carrier Family 2 (Facilitated Glucose Transporter)
Member 4, Glut4 Ss03373325_g1
SLC2A8 Solute Carrier Family 2 (Facilitated Glucose Transporter)
Member 8, Glut8 Ss03374161_m1
HK1 Hexokinase 1 Ss04323453_gH
FBP1 Fructose-Biphosphatase 1 Ss03393179_u1
PFKM Phosphofructokinase, Muscle Ss03380370_u1
Fatty acid metabolism/ De Novo Lipogenesis
ACACA Acetyl-Coenzyme A Carboxylase Alpha Ss03389962_m1
ACLY ATP-citrate lyase Ss03389566_m1
FASN Fatty Acid Synthase Ss03386194_u1
ADIPOR1 Adiponectin receptor 1 Ss03378803_u1
LEPR Leptin Receptor Ss03379257_u1
LEP Leptin Ss03392404_m1
ADIPOQ Adiponectin Ss03384375_u1
CIDEC Cell Death-Inducing DFFA Like Effector C Ss03389757_m1
Lipid Transcription Factors
PPARG Peroxisome proliferator-activated receptor gamma Ss03394829_m1
Immune System/Inflammation
CRP C-reactive protein, pentraxin-related Ss03390889_m1
IL6 Interleukin 6 Ss03384604_u1
TNF Tumour Necrosis Factor Ss03391318_g1
CCL5 C-C Motif Chemokine Ligand 5/ encodes RANTES Ss03648939_m1
Housekeeping genes
GAPDH Glyceraldehyde 3-phosphate dehydrogenase Ss03375629_u1
HPRT1 Hypoxanthine phosphoribosyltransferase 1 Ss03388274_m1
ACTB β-actin Ss03376563_uH 1 TaqMan Gene Expression Assay

67
Table S2. Baseline of body weight and clinical parameters in fasting plasma and urine at week 20.
Characteristics Means or
median
SD or interquartile
range
Body weight (kg) 31* 12
Fasting plasma
Glucose (mM) 6.1* 1.7
Fructosamine (µM) 258* 25
NEFA (μM) 179 94
Lactate (mM) 2.2 1.2
Triglycerides (mM) 0.57 0.20
LDL (mM) 1.4 0.70
HDL (mM) 1.9# 0.42
LDL:HDL 0.75 0.31
Total cholesterol (mM) 4.3 1.6
Albumin (g/L) 37 7.3
AST (U/L) 27 9.7
ALT (U/L) 23 5.4
GGT (U/L) 66 21
Ghrelin (pg/ml) 13 7.8
GIP (pg/ml) 59# 30
GLP-1 (pg/ml) 293 150
C-peptide(pg/ml) 32 19
Glucagon (pg/ml) 278* 103
Insulin (pM) 39* 20
HOMA-IR 1.6* 0.9
HOMA-β 55 (26-60)
IL-2 (ng/ml) 0.18 (0.12-0.28)
IL-4 (ng/ml) 0.33 (0.22-0.95)
IL-10 (ng/ml) 0.44 0.38
IL-12 (ng/ml) 0.67# 0.23
IL-18 (ng/ml) 0.82 0.54
IFN- γ (ng/ml) 4.5 1.9
Fasting urine
Creatinine (mM) 11 5.8
Glucose (mM) 2.8* (0.47-29)
Protein (mM) 141 (101-399)
Glucose:creatinine1 0.40 (0.04-3.5)
Protein:creatinine2 13 (7.9-37)
Minipigs were regarded as the experimental units, n = 43 for total groups. Data were expressed as
means with standard deviation (SD) or median with 25th-75th interquartile range. *means characteristic levels increased with time over the 20 weeks’ high fat high fructose feeding. #means characteristic levels decreased with time over the 20 weeks’ high fat high fructose feeding.
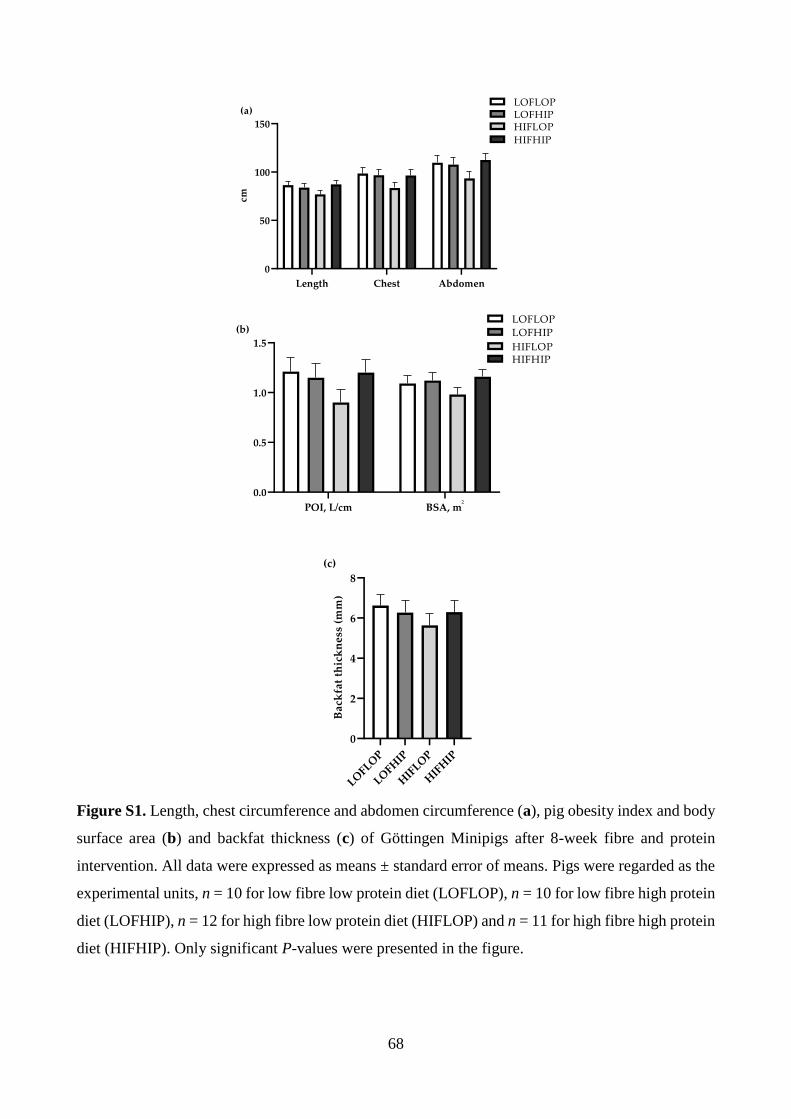
68
Length Chest Abdomen
0
50
100
150
cm
LOFLOPLOFHIPHIFLOP
HIFHIP
(a)
POI, L/cm BSA, m²0.0
0.5
1.0
1.5
LOFLOP
LOFHIP
HIFLOPHIFHIP
(b)
LOFLO
P
LOFH
IP
HIF
LOP
HIF
HIP
0
2
4
6
8
Ba
ckfa
t th
ick
ne
ss (
mm
)
(c)
Figure S1. Length, chest circumference and abdomen circumference (a), pig obesity index and body
surface area (b) and backfat thickness (c) of Göttingen Minipigs after 8-week fibre and protein
intervention. All data were expressed as means ± standard error of means. Pigs were regarded as the
experimental units, n = 10 for low fibre low protein diet (LOFLOP), n = 10 for low fibre high protein
diet (LOFHIP), n = 12 for high fibre low protein diet (HIFLOP) and n = 11 for high fibre high protein
diet (HIFHIP). Only significant P-values were presented in the figure.

69
LOFLO
P
LOFH
IP
HIF
LOP
HIF
HIP
0.0
0.5
1.0
1.5
2.0
2.5
Liv
er
we
igh
t (%
of
BW
)
(a)
LOFLO
P
LOFH
IP
HIF
LOP
HIF
HIP
0.0
0.1
0.2
0.3
0.4
He
art
wei
gh
t (%
of
BW
)
(b)
LOFLO
P
LOFH
IP
HIF
LOP
HIF
HIP
0.00
0.05
0.10
0.15
0.20
0.25
Kid
ne
y w
eig
ht
(% o
f B
W)
Protein: P = 0.008
(c)
LOFLO
P
LOFH
IP
HIF
LOP
HIF
HIP
0.0
0.1
0.2
0.3
Sm
all
in
test
ine
le
ng
th (
m/k
g B
W)
(d)
LOFLO
P
LOFH
IP
HIF
LOP
HIF
HIP
0.00
0.02
0.04
0.06
0.08
Co
lon
len
gth
(m
/kg
BW
)
(e)
LOFLO
P
LOFH
IP
HIF
LOP
HIF
HIP
0.0
0.5
1.0
1.5
Liv
er
fat
(%)
(f)
Figure S2. Relative weight (% of body weight, BW) of liver (a), heart (b) and kidney (c), small
intestine length (m/kg BW) (d) and colon length (m/kg BW) (e) and liver fat percentage (f) at
slaughter. Minipigs were regarded as the experimental units, n = 10 for low fibre low protein diet
(LOFLOP), n = 10 for low fibre high protein diet (LOFHIP), n = 12 for high fibre low protein diet
(HIFLOP) and n = 11 for high fibre high protein diet (HIFHIP). Values are least-squared means with
standard errors represented by vertical bars. Only significant P-values are presented in the figure.

70
100 200 300 400 500
-4
-2
0
2
4
6
De
lta
_g
lu (
mM
)
r = 0.494; P < 0.001
Starch intake (g/d)
Figure S3. Pearson correlation between delta glucose value (portal vein minus jugular vein) and
daily starch intake of Göttingen Minipigs.

71
6.2 Paper II
Effects of dietary fibre and protein content on intestinal fibre degradation, short-chain fatty
acid and microbiota composition in a high-fat fructose-rich diet induced obese Göttingen
Minipig model.
Yetong Xu, Mihai Victor Curtasu, Zachary Bendiks, Maria L. Marco, Natalja Nørskov, Knud Erik
Bach Knudsen, Mette Skou Hedemann and Helle Nygaard Lærke
Manuscript under review in Food & Function. 2020.

72
Effects of dietary fibre and protein content on intestinal fibre degradation, short-chain fatty 1
acid and microbiota composition in a high-fat fructose-rich diet induced obese Göttingen 2
Minipig model 3
Yetong Xu,a, Mihai Victor Curtasu,a Zachary Bendiks,b Maria L. Marco,b Natalja Nørskov,b Knud 4
Erik Bach Knudsen,b Mette Skou Hedemannb and Helle Nygaard Lærkeb 5
a Department of Animal Science, Aarhus University, DK-8830 Tjele, Denmark 6
b Department of Food Science and Technology, University of California, Davis, CA, USA; 7
[email protected]; [email protected] 8
Electronic supplementary information (ESI) available: Information of LC-MS/MS parameters for
plasma short-chain fatty acid (SCFA), Tables S1; dietary ingredients and chemical composition,
Table S2; pool size of SCFA in caecum and colon, Table S3; representative MRM chromatogram of
plasma SCFA standards, Fig. S1; faecal SCFA concentrations and distribution, Fig. S2; alpha and
belta- diversity of microbiota, Fig, S3-S4; significantly different microbiota altered by the diets, Fig
S5. Correspondence: Department of Animal Science, Aarhus University, DK-8830 Tjele, Denmark.
Email: [email protected]; Tel.: +4550641816

73
Abstract: Obesity-related metabolic syndrome has been linked with gut microbiome dysbiosis 9
while dietary fibre (DF) and protein can modify the gut microbial ecosystem and metabolism. After 10
20-weeks’ on a high-fat fructose-rich diet for development of obesity, forty-three 30-week old 11
Göttingen Minipigs (31 ± 4.0 kg body weight) were allocated to one of four diets with low or high 12
DF and protein contents in a two by two factorial design and digesta were collected from the 13
intestinal segments of minipigs after 8 weeks’ at libitum feeding. High DF content increased (P < 14
0.001) while high protein content decreased (P = 0.004) the content of non-starch polysaccharides 15
(NSP) in all intestinal segments. Arabinoxylan (AX) as proportion of NSP was higher with high DF 16
(P < 0.001) but reduced from distal small intestine until to mid colon (P < 0.001). High DF increased 17
the relative abundance of Blautia, Faecalibacterium and Peptococcus in caecum, mid colon and 18
faeces, reduced the intestinal concentrations of total short-chain fatty acids (SCFA) (P = 0.02) and 19
acetate (P = 0.01) but slightly increased butyrate pools in the large intestine compared to low DF. 20
High protein increased SCFA (P = 0.03) and propionate (P = 0.04) concentrations in the gut. High 21
DF induced a lower increase in BCFA concentration and proportion throughout the colon (P < 22
0.001). Butyrate concentrations in plasma from the jugular vein were increased with high DF diets 23
(P = 0.03), whereas propionate concentrations were increased (P < 0.001) and succinate decreased 24
(P = 0.001) with high protein diets compared with low protein. In conclusion, AX in the high DF 25
diets was continuously degraded until mid-colon, associated with enriched butyrate-producing 26
bacteria and slightly improved butyrate production, while protein fermentation was attenuated by 27
high DF and high protein did not show prebiotic effects in this obese minipig model. 28
Keywords: Dietary fibre; Protein; microbiota; SCFA; miniature pig 29

74
1. Introduction
Obesity has become one of the greatest public health challenges, and although not a disease in itself,
it greatly increases metabolic disorders and the risks for premature deaths globally.1 Intestinal
microbiota plays an important role in human health, and recent translational research showed that
unhealthy diets could cause intestinal microbiota dysbiosis, contributing to the development of
obesity and other metabolic disorders.2 It has been shown that dietary interventions intended to
modulate the gut microbiome composition and function, could be a therapeutic approach to alleviate
obesity and the related metabolic syndrome (MetS).3, 4 Importantly, some intestinal bacteria (like
Bifidobacterium and Lactobacillus) and microbiota-derived products such as short-chain fatty acids
(SCFA) have been demonstrated to regulate pathways related to metabolic control and systemic
inflammation.5
Dietary fibre (DF) is the fraction of carbohydrates and lignin that cannot be digested by host
endogenous digestive enzymes.6 Soluble DF and a variable part of insoluble DF are fermented into
SCFA by microbiota mainly harboring the large intestine. The SCFA produced in the large intestine
are mainly acetate, propionate and butyrate, and the ratio of SCFA is dependent on fermentation
substrate, microbiota composition as well as colonic transit time.7 In monogastric species,
carbohydrate fermentation mainly occurs in the caecum and proximal colon, resulting in low amounts
of fermentable substrate in the distal colon.8 Arabinoxylan (AX), a type of DF found in high
concentrations in wheat and rye bran, consist of a linear backbone of xylose units with arabinose
monomers substitution.9 From earlier studies with pigs it is known that fermentation of some fractions
of AX may be relatively slow in the colon10 and with stimulation of butyrate production.11 A dietary
intervention study demonstrated that an AX-enriched diet attenuated insulin secretion which was
thought to be related to increased butyrate or SCFA absorption.12 The underlying mechanisms could
be the influence of SCFA and butyrate on the release of satiety hormones and inhibition of lipolysis
in adipose tissue.13 An AX-rich diet has also shown beneficial effects on modulating gut health and
MetS by increasing the proportion of Bifidobacterium and reducing certain bacteria genera associated
with dysbiotic intestinal communities.14 Consistent with the increased DF fermentation, the microbial
profile in the distal large intestine was altered by diets rich in AX, resulting in promotion of butyrate-
producing bacteria (such as Faecalibacterium prausnitzii).15, 16 Moreover, using cell wall degrading
enzymes during bread making to produce arabinoxylan oligosaccharides (AXOS) resulted in higher
faecal butyrate concentrations and proportions in healthy human subjects.17

75
Fermentation of protein takes place in the more distal part of the colon particularly when
carbohydrate substrates are scarce.18 Whey protein is known as an insulinotropic substance and could
lower gastric emptying in T2D subjects,19 while the role of whey protein on gut microbiota and SCFA
production is poorly studied. A study showed that consumption of whey protein could protect against
colitis by stimulating intestinal mucin secretion and faecal lactobacilli and bifidobacteria growth in a
high fat diet-fed mice model.20 Another study found that intake of whey protein had no influence on
gut microbiota composition in mice fed a high fat diet.21 Moreover, an in vitro study demonstrated
that whey protein supplementation had a potent prebiotic effect and could stimulate SCFA production
in healthy and obese donors, which may contribute to improved intestinal health and reducing
obesity.22 However, a recent review concluded that high protein consumption especially with low
carbohydrate intake, was associated with intestinal inflammation due to the altered fermentation
environment such as increased branched-chain fatty acids (BCFA), ammonia, hydrogen sulfide and
indoles.8 Supplementation with DF, may exert a protective effect against the effect of proteolytic
metabolites by providing more substrate and shifting microbial species abundance.8
We have previously addressed the impacts of DF and whey protein on metabolic biomarkers
related to MetS.23 In the present study, focus is on the effect of DF and protein as well as their
interaction on gut DF structural modification, microbiota and SCFA profiles. We hypothesize that
dietary DF and protein level can influence the intestinal DF structure, selectively stimulate beneficial
bacteria growth, enhance SCFA production, especially butyrate. Göttingen Minipigs were used in this
study as an adolescent obese model for human individuals due to similar physiology and nutritional
requirements.24
2. Materials and methods
Diets, animals and experimental design have been described in detail in our previous paper presenting
the effects of DF and protein on metabolic biomarkers related to MetS.23
2.1. Diets, animals and experimental design
The animal experiment was performed under the Danish laws and regulations regarding humane care
and use of animals in research (The Danish Ministry of Justice, Act on Animal Experiments no 474
of May 15, 2014, as stipulated in the executive order no. 12 or January 07 2016). Animal handling
and experimental procedures were done according to license obtained from the Danish Animal
Experimentation Inspectorate, Ministry of Food, Agriculture, and Fisheries.
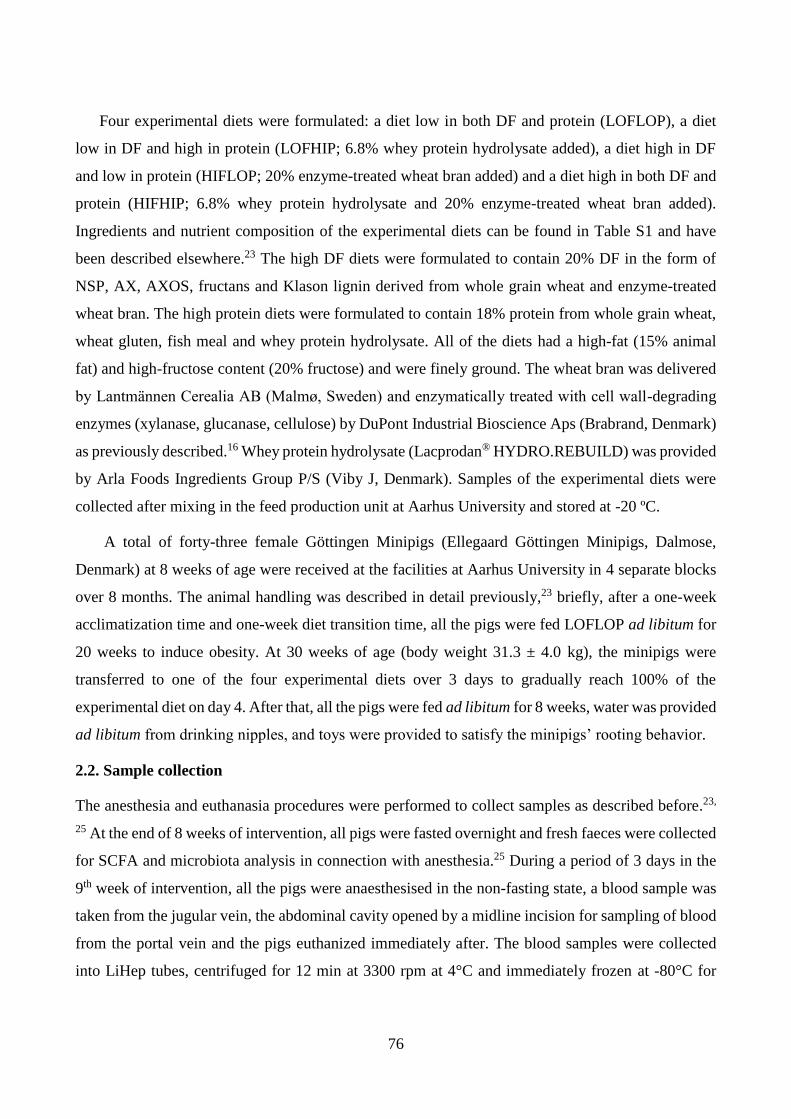
76
Four experimental diets were formulated: a diet low in both DF and protein (LOFLOP), a diet
low in DF and high in protein (LOFHIP; 6.8% whey protein hydrolysate added), a diet high in DF
and low in protein (HIFLOP; 20% enzyme-treated wheat bran added) and a diet high in both DF and
protein (HIFHIP; 6.8% whey protein hydrolysate and 20% enzyme-treated wheat bran added).
Ingredients and nutrient composition of the experimental diets can be found in Table S1 and have
been described elsewhere.23 The high DF diets were formulated to contain 20% DF in the form of
NSP, AX, AXOS, fructans and Klason lignin derived from whole grain wheat and enzyme-treated
wheat bran. The high protein diets were formulated to contain 18% protein from whole grain wheat,
wheat gluten, fish meal and whey protein hydrolysate. All of the diets had a high-fat (15% animal
fat) and high-fructose content (20% fructose) and were finely ground. The wheat bran was delivered
by Lantmӓnnen Cerealia AB (Malmø, Sweden) and enzymatically treated with cell wall-degrading
enzymes (xylanase, glucanase, cellulose) by DuPont Industrial Bioscience Aps (Brabrand, Denmark)
as previously described.16 Whey protein hydrolysate (Lacprodan® HYDRO.REBUILD) was provided
by Arla Foods Ingredients Group P/S (Viby J, Denmark). Samples of the experimental diets were
collected after mixing in the feed production unit at Aarhus University and stored at -20 ºC.
A total of forty-three female Göttingen Minipigs (Ellegaard Göttingen Minipigs, Dalmose,
Denmark) at 8 weeks of age were received at the facilities at Aarhus University in 4 separate blocks
over 8 months. The animal handling was described in detail previously,23 briefly, after a one-week
acclimatization time and one-week diet transition time, all the pigs were fed LOFLOP ad libitum for
20 weeks to induce obesity. At 30 weeks of age (body weight 31.3 ± 4.0 kg), the minipigs were
transferred to one of the four experimental diets over 3 days to gradually reach 100% of the
experimental diet on day 4. After that, all the pigs were fed ad libitum for 8 weeks, water was provided
ad libitum from drinking nipples, and toys were provided to satisfy the minipigs’ rooting behavior.
2.2. Sample collection
The anesthesia and euthanasia procedures were performed to collect samples as described before.23,
25 At the end of 8 weeks of intervention, all pigs were fasted overnight and fresh faeces were collected
for SCFA and microbiota analysis in connection with anesthesia.25 During a period of 3 days in the
9th week of intervention, all the pigs were anaesthesised in the non-fasting state, a blood sample was
taken from the jugular vein, the abdominal cavity opened by a midline incision for sampling of blood
from the portal vein and the pigs euthanized immediately after. The blood samples were collected
into LiHep tubes, centrifuged for 12 min at 3300 rpm at 4°C and immediately frozen at -80°C for

77
SCFA analysis. The entire gastrointestinal tract was ligated at the esophagus and rectum, removed
from the carcass and divided into different intestinal segments: The last third of the small intestine
was termed SI3; The colon was divided into three parts of equal length (proximal, mid and distal)
termed Co1, Co2, and Co3, respectively; SI3, Co1, Co2 and Co3 were tied off and the weight of fresh
digesta and pH of gut contents were recorded. Digesta were collected and kept in a -20°C freezer for
dry matter and carbohydrate analysis. Samples of digesta (1-3 g) from SI3, caecum, Co1, Co2 and
Co3 were collected for SCFA analysis and digesta from SI3 and Co2 were obtained and kept at -80°C
for microbiota analysis.
2.3. Analytical methods
Starch and non-starch polysaccharides (NSP) were measured as described by Bach Knudsen26 except
they were hydrolyzed with 2 M H2SO4 for 1 h instead of 1 M for 2 h during NSP analysis. The soluble
and insoluble NSP of diets and SI3 digesta were acid hydrolyzed and determined as alditol acetates
with derivatization by gas-liquid chromatography. Non-digestible carbohydrate (NDC) in diets and
SI3 digesta was determined by direct acid hydrolysis without starch removal and alcohol
precipitation. Total AX (TAX) was calculated as the sum of arabinose and xylose residues from the
NDC analysis, and soluble and insoluble high-molecular weight AX (SAX and IAX, respectively)
was calculated from the NSP analysis. AXOS were calculated as the difference of AX between NDC
and NSP fractions.
Digesta and faecal samples were subjected to an acid–base treatment followed by diethyl ether
extraction and derivatization to analyse SCFA concentrations as previously described27, and were
determined by GC (HP-6890 Series Gas Chromatograph; Hewlett Packard) using an HP-5 column
(30 m × 0.32 mm × 0.25 µm).
Plasma SCFA concentrations were determined by LC-MS/MS according to Han et al. (2015)28
with modifications. Ten µL of 75 % methanol containing stable isotope internal standards (13C2 acetic
acid, 13C1 propionic acid, 13C2 butyric acid, 13C2 succinic acid and 13C3 valeric acid) were mixed with
10 µL of plasma samples, 10 µL of 200 mM 3-nitrophenylhydrazine hydrochloride (3NPH) and 10
µL of 120 mM N-(3-dimethylaminopropyl)-N’-ethylcarbodiimide hydrochloride (EDC). The mixture
was shaken for 45 min at room temperature and 10 µL of 200 mM of Quinic acid was added to quench
derivatization. The mixture was shaken for 15 min at room temperature and 950 µL of 10 % methanol
was added and mixed, centrifuged for 20 min at 4 ˚C 29,700 × g and 700 µL of supernatant was
transferred into HPLC vail. Samples were analysed on microLC 200 from Eksigent (Framingham,

78
MA, USA) using C18 column (10 cm × 1 mm, 1.2 µm particle size) from Waters (UK). The
chromatographic conditions started at 5 % solvent B (acetonitrile), kept for 1 min, the gradient
increased for 4 min to 27 % solvent B, then increased for 5 min to 30 % solvent B and to 37 % solvent
B during 5 min. Solvent A was pure water. Total chromatographic run was 15 min with flow of 50
µL/min, column oven sat to 30 ˚C and injection volume of 5 µL. MicroLC was interfaced to QTrap
5500 from ABSciex (Framingham, MA, USA) using electro spray ionization (ESI) in negative mode.
The flow injection analysis (FIA) was performed to optimize the turbo V source of the instrument,
where curtain gas was set to 30 psig, nebulizer gas (Gas1) 50 psig, heater gas (Gas2) 50 psig,
temperature was 500 ˚C, ionization spray operated at -4500 eV and collision Gas was set to High.
Deprotonated molecules were detected in Multiple Reaction Monitoring (MRM) mode. The
compound-dependent parameters were optimized by syringe infusion of pure standards and shown in
Table S1. Entrance potential was set to -10 volts and time of MRM scan to 30 msec for all the
compounds. The data analysis was performed in Analyst software 1.6.1 from AB Sciex (Framingham,
MA, USA). The representative chromatogram is presented in Fig. S1.
Bacterial genomic DNA was extracted from caecum, Co2 and faecal samples using a QIAamp
Fast DNA Stoll Mini Kit (Qiagen, Hilden, Germany).14 The samples were homogenized prior to DNA
extractions and purification according to the manufacturer’s instructions. DNA concentrations were
measured by using NanoDrop spectrophotometer (Thermo Scientific, Wilmington, DE) and diluted
to 20 ng/µL. PCR was used to amplify the 16S rRNA V4 regions using the barcoded F515 forward
primer and R806, and Equal volumes of DNA extractions from each sample were combined.29, 30 PCR
products were purified and the pooled amplicons was sequenced using an Illumina MiSeq (PE250)
platform (Illumina Inc., San Diego, CA) at the UC Davis Genome Center (http://dnatech.
genomecenter.ucdavis.edu/), University of California, Davis, California, USA. DNA sequence
analysis was performed using the pipeline Quantitative Insights Into Microbial Ecology (QIIME)
software. The alignment of the paired-end sequencing reads was not done, and R1 and R2 files were
concatenated and the reads were treated as single-ended. After extracting barcodes from the reads,
demultiplexing was performed. The Greengenes 13_8 99% operational taxonomic unit (OTU)
database was used as the reference database during open-reference OTU picking.31 To generate alpha
diversity rarefaction curves, the Chao1 diversity index, Faith’s Phylogenetic Diversity Whole Tree
(faith_pd),32 and observed species were determined by increasing numbers of randomly samples
sequences per sample. The curves became asymptotic at 25322 in caecum, 31787 in colon and 25806
in faecal samples. These numbers of randomly sampled DNA sequences were used to rarefy samples

79
prior to calculation of the of weighted UniFrac distances33 in QIIME. The beta diversity between
treatment groups was visualized using principal coordinates analysis (PCoA) on weighted UniFrac
distances.34
2.4. Calculations
SCFA concentrations were calculated as the sum of formic acid, acetic acid, propionic acid, butyric
acid, isobutyric acid, isovaleric acid and valeric acid concentrations, and BCFA as the sum of the
isobutyric acid, isovaleric acid and isocaproic acid. The pool size of SCFA and BCFA in caecal and
colonic segments were determined by multiplying the concentrations of SCFA by the amount of wet
digesta wherein the SCFA pool size of entire colon was the sum of pool in Co1, Co2 and Co3. The
SCFA distribution (%) in each intestinal segment was calculated as the concentration of the individual
SCFA divided by the total SCFA concentration in the wet digesta and multiplied by 100.
2.5. Statistical analysis
The pig was regarded as the experimental unit. Intestinal carbohydrate composition, SCFA
concentration, net amount, pH values and SCFA distribution of gut content in different segments
were analysed by using the MIXED procedure of SAS (SAS Institute, Inc.).
Yijklm = μ + αi + βj + (αβ)ij + γk + (αγ)ik + (βγ)jk + (αβγ)ijk + Ul + Vm + εijklm, (1)
where Yijklm is the dependent variable; μ is the overall mean; αi, βj and γk are the fixed effects of
dietary fibre levels (i = low or high fibre), protein levels (j = low or high protein) and intestinal
segments (k = SI3, Caecum, Co1, Co2 or Co3), respectively; (αβ)ij is the interaction between fibre
and protein; (αγ)ik is the interaction between fibre and segment; (βγ)jk is the interaction between
protein and segment; and (αβγ)ijk is the interaction for all fixed effects; Ul is the random effect of
block (l = 1, 2, 3 or 4); Vm is the random component related to the pig (m = 1, 2,…, 43). Pig was
included as a random component to account for repeated measurements within pig. The covariance
structure of repeated measurements was modelled using autoregressive type and εijklm is the residual
error. The random effect and residuals were assumed to be independent and normally distributed with
zero expectation.
Arabinoxylan distribution and arabinose:xylose (A:X) ratio of SI3 digesta, pool size of SCFA in
caecum and entire colon, SCFA profile of faeces, SCFA concentrations in plasma, predominant phyla
abundance in caecum, mid-colon and faeces were analysed by a MIXED statistical model without
segment factor where γk, (αγ)ik, (βγ)jk, (αβγ)ijk and Vm components were deleted and no repeated
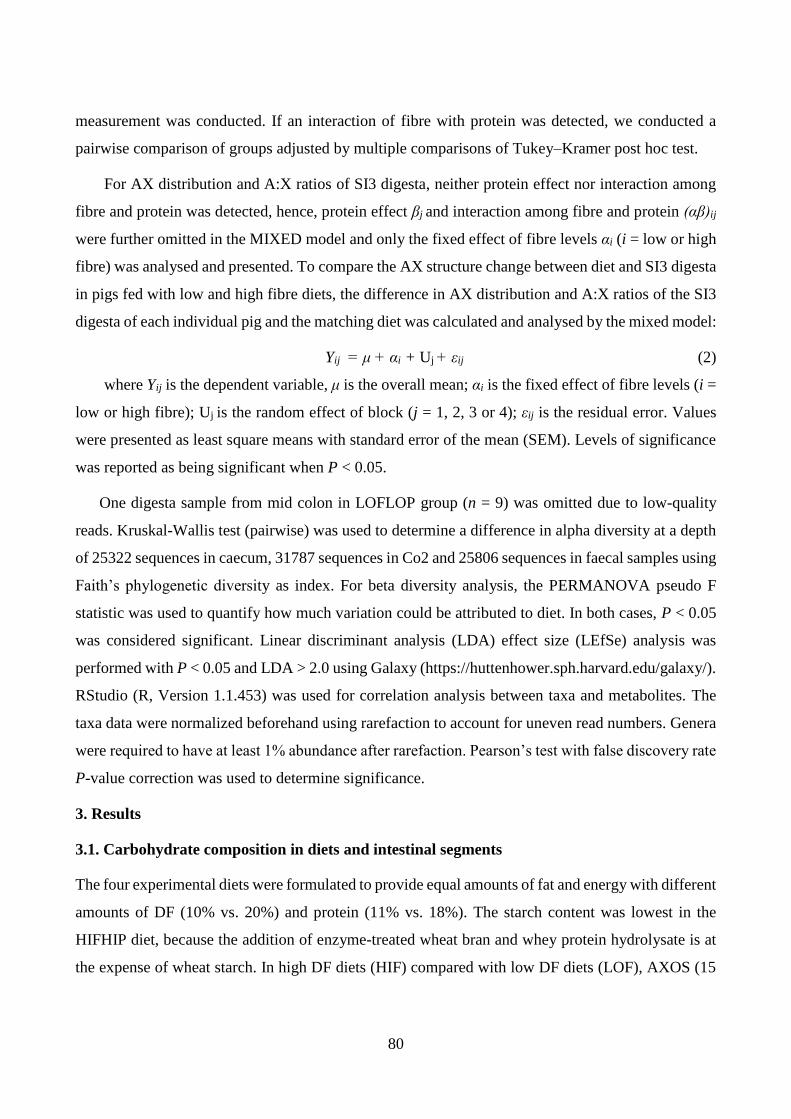
80
measurement was conducted. If an interaction of fibre with protein was detected, we conducted a
pairwise comparison of groups adjusted by multiple comparisons of Tukey–Kramer post hoc test.
For AX distribution and A:X ratios of SI3 digesta, neither protein effect nor interaction among
fibre and protein was detected, hence, protein effect βj and interaction among fibre and protein (αβ)ij
were further omitted in the MIXED model and only the fixed effect of fibre levels αi (i = low or high
fibre) was analysed and presented. To compare the AX structure change between diet and SI3 digesta
in pigs fed with low and high fibre diets, the difference in AX distribution and A:X ratios of the SI3
digesta of each individual pig and the matching diet was calculated and analysed by the mixed model:
Yij = μ + αi + Uj + εij (2)
where Yij is the dependent variable, μ is the overall mean; αi is the fixed effect of fibre levels (i =
low or high fibre); Uj is the random effect of block (j = 1, 2, 3 or 4); εij is the residual error. Values
were presented as least square means with standard error of the mean (SEM). Levels of significance
was reported as being significant when P < 0.05.
One digesta sample from mid colon in LOFLOP group (n = 9) was omitted due to low-quality
reads. Kruskal-Wallis test (pairwise) was used to determine a difference in alpha diversity at a depth
of 25322 sequences in caecum, 31787 sequences in Co2 and 25806 sequences in faecal samples using
Faith’s phylogenetic diversity as index. For beta diversity analysis, the PERMANOVA pseudo F
statistic was used to quantify how much variation could be attributed to diet. In both cases, P < 0.05
was considered significant. Linear discriminant analysis (LDA) effect size (LEfSe) analysis was
performed with P < 0.05 and LDA > 2.0 using Galaxy (https://huttenhower.sph.harvard.edu/galaxy/).
RStudio (R, Version 1.1.453) was used for correlation analysis between taxa and metabolites. The
taxa data were normalized beforehand using rarefaction to account for uneven read numbers. Genera
were required to have at least 1% abundance after rarefaction. Pearson’s test with false discovery rate
P-value correction was used to determine significance.
3. Results
3.1. Carbohydrate composition in diets and intestinal segments
The four experimental diets were formulated to provide equal amounts of fat and energy with different
amounts of DF (10% vs. 20%) and protein (11% vs. 18%). The starch content was lowest in the
HIFHIP diet, because the addition of enzyme-treated wheat bran and whey protein hydrolysate is at
the expense of wheat starch. In high DF diets (HIF) compared with low DF diets (LOF), AXOS (15

81
vs. 3.5 g/kg) and SAX (13 vs. 6.1 g/kg) were 2~4 times higher by the addition of enzyme-treated
wheat bran (Table S1).
IAX was the main contributor to total AX of both diet and SI3 digesta in the LOF or HIF groups
accounting for >70% (Fig. 1A). Compared with LOF, HIF had a higher proportion of AXOS of total
AX both in diet (15% vs. 7.0%) and SI3 digesta (11% vs. 4.7%, P < 0.001), and a lower proportion
of IAX in diet (72% vs. 80%) and SI3 digesta (71% vs. 75%, P = 0.03), while no significant change
was seen for SAX. Compared to the diet, digesta in SI3 contained an insignificantly but numerically
lower proportion of TAX in the form of AXOS (LOF: 4.7% vs. 7.0 %, P = 0.12 and HIF: 11% vs. 15
%, P = 0.08), and a higher proportion of SAX (LOF: 20 % vs. 13 %, P < 0.001 and HIF: 18 % vs.
14%, P < 0.001) but only a lower proportion of IAX for LOF (75% vs. 80%, P < 0.001). In the HIF
groups, the A:X ratio of AXOS in diet (0.40 vs. 0.80) and SI3 digesta (0.38 vs. 0.64, P < 0.001) was
lower than LOF, while the A:X ratio of IAX was higher (diet: 0.70 vs. 0.63; SI3 digesta: 0.71 vs.
0.61, P < 0.001). The A:X ratio of SAX in SI3 did not differ significantly between DF levels (Fig.
1B), but for HIF, the A:X ratio of SAX was significantly higher in SI3 than in the diet (0.59 vs. 0.50,
P = 0.03) without changes in A:X ratios of AXOS and IAX. Compared with the diet, the A:X ratio
of AXOS was lower in digesta from SI3 of the LOF fed pigs (0.64 vs. 0.80, P = 0.01), whereas no
change in A:X ratios was seen for SAX and IAX.
Table 1 shows starch content and NSP content and structure in intestinal segments from SI3 to
Co3. The starch content was not significantly affected by dietary treatments (P > 0.05) and was
gradually reduced from caecum to Co2 (P < 0.001) without further change in Co3 (P = 0.68). The
total NSP and AX contents were higher with the high DF diets than with low DF (P < 0.001), and
slightly lower with high protein than low protein diets (P = 0.004). Total NSP content was reduced
from caecum to Co1 (P < 0.001), while the AX content was gradually reduced from SI3 to Co1 (P <
0.001). Both total NSP and AX contents did not change along the colon (P > 0.10). The contribution
of AX to total NSP declined until Co3 (P < 0.001) and was higher in the high DF groups than low
DF groups (P < 0.001). For A:X ratios, there was a significant interaction between DF and segment,
showing higher ratios in SI3, caecum and Co1 with high DF than with low DF diets (P < 0.001).
Moreover, there was a gradual increase in A:X ratios from SI3 to Co2.
3.2. SCFA profile, pH and net amount of gut content
With the high DF diets, there were small but significantly lower concentrations of SCFA (P = 0.02)
and acetate (P = 0.01) compared with the low DF diets, whereas giving high protein diets to the pigs

82
resulted in higher SCFA (P = 0.03) and propionate concentrations (P = 0.04) and a tendency for
higher acetate (P = 0.06) concentration (Fig. 2). The concentration of SCFA, acetate and propionate
was low in SI3, highest in caecum and decreased subsequently until Co2 (P < 0.001). For butyrate,
higher concentrations were detected in caecum and Co1 (P < 0.001) than in the other segments. There
was a significant interaction between DF and segment in BCFA concentration (P < 0.001), as the
BCFA concentration increased significantly from Co1 to Co3 with the low DF diets (P < 0.001),
whereas it was lower and almost constant with the high DF diets. There was also an interaction
between protein and segment (P = 0.04); for the high protein diets BCFA concentrations gradually
increased from SI3, caecum to Co1 (P < 0.05) with no significant subsequent change in the more
distal parts of the colon. For the low protein diets, BCFA concentrations did not change from caecum
to Co2 but was higher in Co3 compared with the other segments (P < 0.01).
The amount of wet digesta differed between intestinal segments and was dependent on both DF
and dietary protein levels. Co1 had the highest amount of gut content, and HIFHIP lead to
significantly more digesta than the other three diets (P = 0.006, Fig. 3A). Intestinal pH dropped from
6.8 in SI3 to 6.3 in the caecum (P < 0.001) and then gradually increased in Co1 and Co2 (P < 0.01).
A tendency for lower pH values with high DF diets compared with low DF was observed in Co2 (P
= 0.09). In Co3, the pH decreased again (P = 0.05), and high DF diets resulted in a significantly lower
pH than the low DF diets (P = 0.02, Fig. 3B).
In all intestinal segments, acetate was the dominating contributor to SCFA (> 57%), and its
contribution was highest in caecum and declined in the colon (P < 0.001, Table 2). The proportion of
propionate increased steeply from SI3 to caecum (P < 0.001), but was unchanged throughout the
remainder of the large intestine. The low butyrate concentrations with the high DF diets in the distal
small intestine resulted also in lower proportions of butyrate than with the low DF diets (P < 0.001).
The modest change in proportions of butyrate between segments of the large intestine depended on
fibre levels (P < 0.001) where, compared with caecum, the proportion of butyrate was higher in Co2
and Co3 with the high DF diets (P < 0.05) but only significantly higher in Co3 with the low DF diets
(P < 0.001). The proportion of butyrate was slightly increased from caecum to Co3 with a high protein
intake, whereas it was almost constant throughout the large intestine with the low protein diets,
leading to an interaction between protein and segment (P = 0.05). The contribution of BCFA to SCFA
in Co3 was significantly lower for pigs fed the high DF (P = 0.002) compared to the low DF diets.
The pool of butyrate in caecum was higher in pigs with high DF than with low DF diets (P = 0.05,
Table S2). In the colon, there were significant interactions between DF and protein in the pool size

83
of SCFA (P = 0.02) and acetate (P = 0.02), because they were significantly higher for HIFHIP than
the other diets. In addition, the colonic pools of propionate (P = 0.007) and butyrate (P = 0.04) were
significantly higher with the high DF than the low DF diets. The pool size of BCFA was on the other
hand higher in pigs with high compared to low protein intake (P = 0.03).
The SCFA profiles of faeces showed that the high DF diets resulted in a higher concentration (P
= 0.001) and proportion (P < 0.001) of propionate but lead to a lower proportion of BCFA (P < 0.001)
compared with the low DF diets (Fig. S1).
3.3. Microbiota composition
No difference in alpha diversity (faith_pd) was observed either in the caecum or Co2 among the four
diets, whilst the high DF groups showed significantly increased alpha diversity in bacterial
composition in faecal samples compared with low DF (P = 0.02) (Fig. S2). The high DF diets resulted
in significant changes in the beta-diversity of the caecal, colonic and faecal microbiota as shown by
PCoA of the weighted UniFrac distance metric (P = 0.004, P = 0.001 and P = 0.001, respectively)
(Fig. S3).
Firmicutes and Bacteroidetes were the two predominant phyla in the caecum, Co2, and faeces.
Their proportions in the caecum and Co2 were not significantly changed by dietary treatments (Fig.
4). In faecal samples, Bacteroidetes was more abundant (19.3% vs. 8.3%, P < 0.001) while Firmicutes
were less abundant (72% vs. 85%, P < 0.001) in the high DF groups compared with the low DF
groups, resulting in a higher Bacteroidetes:Firmicutes ratio (0.29 vs. 0.11, P < 0.001) in high DF
groups.
A LEfSe analysis was also performed to determine enrichment of taxa in the four dietary groups,
but no significantly enriched taxa were detected in this comparison. However, when looking only at
the main effects, the proportions of numerous taxa were significantly altered by the DF level and also
a few by the protein level (Fig. S4). Fig. 5 shows 10 of the most abundant genera in caecum, mid
colon and faecal samples, including part of taxa that were significantly changed by fiber or protein
levels. Consumption of high DF diets led to increased relative abundance of Blautia,
Faecalibacterium and Peptococcus in all three gut segments, and Prevotella in Co2 and faeces (Fig.
S4 and Fig. 5). Additionally, other taxa including Actinobacteria, Coriobacteriia and Ruminococcus
in Co2, and Phascolarctobacterium, Collinsella, Odoribacter, Mitsuokella, Sutterella and CF231 in
faeces of pigs were found enriched with the high DF diets (Fig. S4). The low DF diets were associated
with higher relative abundance of Turicibacter and Anaerovorax in Co2 and faeces compared to the
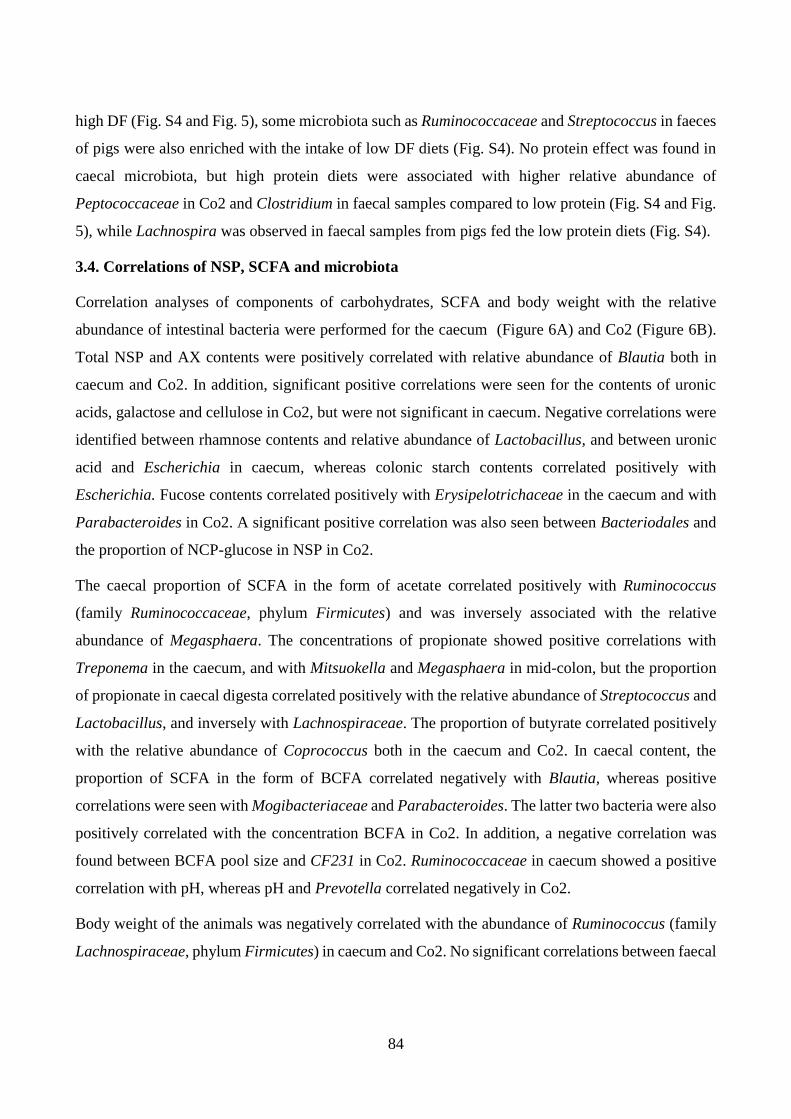
84
high DF (Fig. S4 and Fig. 5), some microbiota such as Ruminococcaceae and Streptococcus in faeces
of pigs were also enriched with the intake of low DF diets (Fig. S4). No protein effect was found in
caecal microbiota, but high protein diets were associated with higher relative abundance of
Peptococcaceae in Co2 and Clostridium in faecal samples compared to low protein (Fig. S4 and Fig.
5), while Lachnospira was observed in faecal samples from pigs fed the low protein diets (Fig. S4).
3.4. Correlations of NSP, SCFA and microbiota
Correlation analyses of components of carbohydrates, SCFA and body weight with the relative
abundance of intestinal bacteria were performed for the caecum (Figure 6A) and Co2 (Figure 6B).
Total NSP and AX contents were positively correlated with relative abundance of Blautia both in
caecum and Co2. In addition, significant positive correlations were seen for the contents of uronic
acids, galactose and cellulose in Co2, but were not significant in caecum. Negative correlations were
identified between rhamnose contents and relative abundance of Lactobacillus, and between uronic
acid and Escherichia in caecum, whereas colonic starch contents correlated positively with
Escherichia. Fucose contents correlated positively with Erysipelotrichaceae in the caecum and with
Parabacteroides in Co2. A significant positive correlation was also seen between Bacteriodales and
the proportion of NCP-glucose in NSP in Co2.
The caecal proportion of SCFA in the form of acetate correlated positively with Ruminococcus
(family Ruminococcaceae, phylum Firmicutes) and was inversely associated with the relative
abundance of Megasphaera. The concentrations of propionate showed positive correlations with
Treponema in the caecum, and with Mitsuokella and Megasphaera in mid-colon, but the proportion
of propionate in caecal digesta correlated positively with the relative abundance of Streptococcus and
Lactobacillus, and inversely with Lachnospiraceae. The proportion of butyrate correlated positively
with the relative abundance of Coprococcus both in the caecum and Co2. In caecal content, the
proportion of SCFA in the form of BCFA correlated negatively with Blautia, whereas positive
correlations were seen with Mogibacteriaceae and Parabacteroides. The latter two bacteria were also
positively correlated with the concentration BCFA in Co2. In addition, a negative correlation was
found between BCFA pool size and CF231 in Co2. Ruminococcaceae in caecum showed a positive
correlation with pH, whereas pH and Prevotella correlated negatively in Co2.
Body weight of the animals was negatively correlated with the abundance of Ruminococcus (family
Lachnospiraceae, phylum Firmicutes) in caecum and Co2. No significant correlations between faecal

85
SCFA and microbiota or between intestinal microbiota and plasma metabolites were observed (data
not shown).
3.5. Plasma SCFA concentrations
There was no dietary effect on the concentrations of SCFA in plasma from the portal vein except that
the concentration of BCFA was higher with the high protein diets (P = 0.007, Table 3). In the jugular
vein, propionate concentrations were higher (P < 0.001) and succinate concentrations were lower (P
= 0.001) with high protein compared to the low protein diets. High DF induced higher butyrate
concentrations compared with low DF in the jugular vein (P = 0.03), but was not significantly affected
in the portal vein (P > 0.25).
4. Discussion
A major purpose of the treatment of wheat bran with cell-wall degrading enzymes was to transform
insoluble AX in the aleurone cells into AXOS.35 Since the enzymes used had a preference for
unsubstituted regions of AX, the outcome was the lower substitution of AXOS than the parent AX.35
This is also found in the present study and the reason for the lower A:X ratio of AXOS and higher
A:X ratio of IAX in diet and SI3 digesta of the high compared to the low DF diets. The structural
characteristics of AX can influence the site for microbial degradation.11, 36 The minor reduction in
AXOS in digesta from the distal third of the small intestine in high DF groups indicates that some
has already been utilized by the microbiota in stomach and small intestine.36 It is also likely that the
increase in the proportion of soluble AX in SI3 compared to the diet is a consequence of the digestion
processes in stomach and small intestine, making more AX soluble and ready for fermentation in the
large intestine.37, 38 The functional properties of AX are associated with the extent of substitution and
distribution of substituents such as arabinose unit and ferulic acid along the xylan backbone, which
is partly reflected by different A:X ratios.39 Our finding that the A:X ratios of soluble AX increased
from diets to SI3 digesta in the high DF groups supported that mainly the less-substituted parts of the
xylan chain were cleaved in the small intestine.36 Similar to a previous study,16 we also found that
some AX was fermented already in the caecum and continued to be fermented in proximal colon,
resulting in an increased degree of arabinose substitution and slightly decreased proportion of AX in
NSP along the colon. However, we observed almost similar A:X ratios between mid and distal colon
most likely because the AX with a high degree of substitution was hardly fermented after mid colon
as also found in other studies.40 A similar pattern has been observed with AX from wheat and rye in
pigs and humans.11
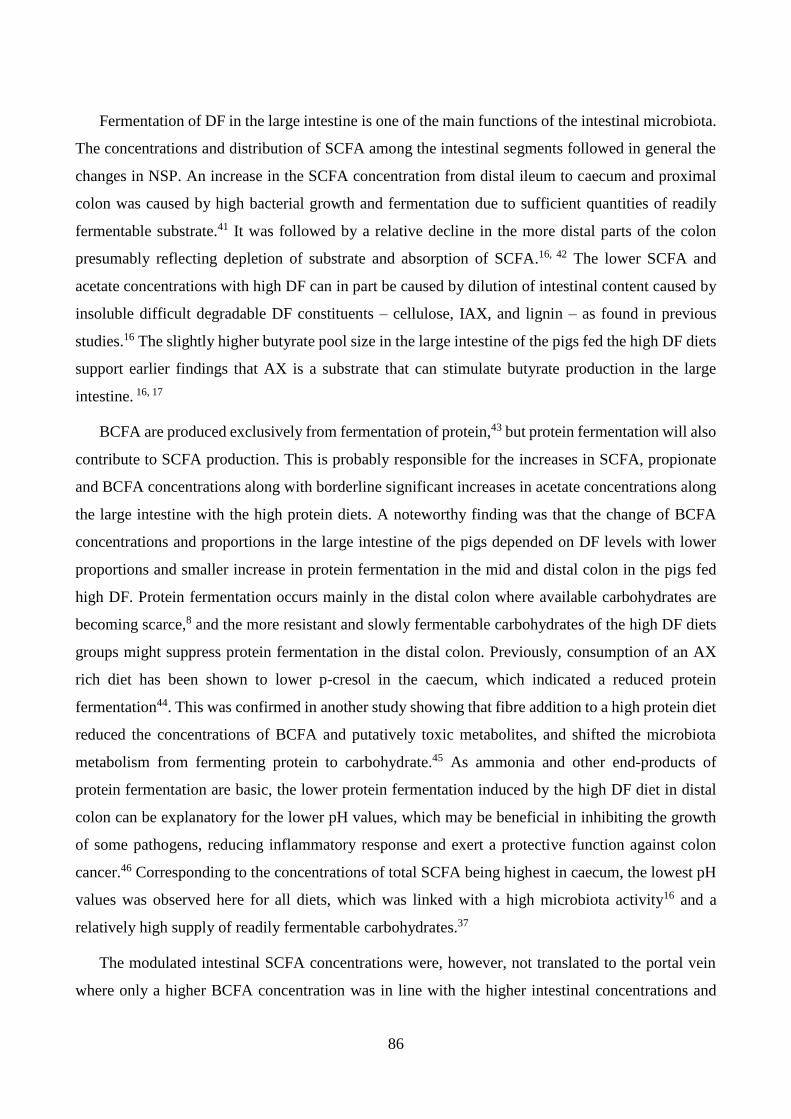
86
Fermentation of DF in the large intestine is one of the main functions of the intestinal microbiota.
The concentrations and distribution of SCFA among the intestinal segments followed in general the
changes in NSP. An increase in the SCFA concentration from distal ileum to caecum and proximal
colon was caused by high bacterial growth and fermentation due to sufficient quantities of readily
fermentable substrate.41 It was followed by a relative decline in the more distal parts of the colon
presumably reflecting depletion of substrate and absorption of SCFA.16, 42 The lower SCFA and
acetate concentrations with high DF can in part be caused by dilution of intestinal content caused by
insoluble difficult degradable DF constituents – cellulose, IAX, and lignin – as found in previous
studies.16 The slightly higher butyrate pool size in the large intestine of the pigs fed the high DF diets
support earlier findings that AX is a substrate that can stimulate butyrate production in the large
intestine. 16, 17
BCFA are produced exclusively from fermentation of protein,43 but protein fermentation will also
contribute to SCFA production. This is probably responsible for the increases in SCFA, propionate
and BCFA concentrations along with borderline significant increases in acetate concentrations along
the large intestine with the high protein diets. A noteworthy finding was that the change of BCFA
concentrations and proportions in the large intestine of the pigs depended on DF levels with lower
proportions and smaller increase in protein fermentation in the mid and distal colon in the pigs fed
high DF. Protein fermentation occurs mainly in the distal colon where available carbohydrates are
becoming scarce,8 and the more resistant and slowly fermentable carbohydrates of the high DF diets
groups might suppress protein fermentation in the distal colon. Previously, consumption of an AX
rich diet has been shown to lower p-cresol in the caecum, which indicated a reduced protein
fermentation44. This was confirmed in another study showing that fibre addition to a high protein diet
reduced the concentrations of BCFA and putatively toxic metabolites, and shifted the microbiota
metabolism from fermenting protein to carbohydrate.45 As ammonia and other end-products of
protein fermentation are basic, the lower protein fermentation induced by the high DF diet in distal
colon can be explanatory for the lower pH values, which may be beneficial in inhibiting the growth
of some pathogens, reducing inflammatory response and exert a protective function against colon
cancer.46 Corresponding to the concentrations of total SCFA being highest in caecum, the lowest pH
values was observed here for all diets, which was linked with a high microbiota activity16 and a
relatively high supply of readily fermentable carbohydrates.37
The modulated intestinal SCFA concentrations were, however, not translated to the portal vein
where only a higher BCFA concentration was in line with the higher intestinal concentrations and

87
pool size of BCFA in pigs fed the high protein diets. We speculate that utilization of SCFA in the
epithelium of colon5 partly abolished the significant differences within dietary treatments in the portal
vein. SCFA can directly influence satiety by modulating intestinal hormones13 and a previous study
indicated that butyrate provided orally reduced adiposity and improved insulin sensitivity by
increasing energy expenditure and fat oxidation in high fat diet-fed mice.47 We also found that the
concentration of butyrate was elevated in peripheral blood with the high DF diets, which potentially
may play a role for the increased C-peptide levels and the downregulated fatty acid synthase gene
expression in adipose tissue observed.23 It could also be a contributing factor for the beneficial effects
of DF on body weight gain seen in the present experiment.23
Intriguingly, the propionate concentration in jugular plasma was significantly higher while
succinate was lower with the high than the low protein. Circulating propionate and butyrate
concentrations have been positively associated with the plasma GLP-1 concentrations,48, 49 suggesting
that higher propionate and butyrate concentrations in jugular vein could contribute to a tendency of
increased plasma GLP-1 concentrations seen in this study.23 The reduced concentrations in peripheral
circulation of succinate, an intermediate of the tricarboxylic acid (TCA) cycle, could be a result of
increased TCA cycle activity with high protein intake indicating more substrate used for
gluconeogenesis, which has been associated with insulin resistance.50 This interpretation is supported
by our previous observation of an upregulated gene expression of the rate-limiting enzyme in
gluconeogenesis (fructose -1,6-bisphosphatase 1) in the liver.23
We observed increased Bacteroidetes:Firmicutes ratios in faecal samples of pigs fed the high DF
diets, which is consistent with a study in mice fed enzyme-treated wheat bran.51 Greater
Bacteroidetes:Firmicutes ratios in lean individuals or animals than in obese ones have also been
reported.52 Moreover, a significant association of increased faecal Bacteroidetes proportion with
weight loss has been found.53 However, it should be noticed that a lower Bacteroidetes:Firmicutes
ratio is not a hallmark of obesity and changed microbial diversity may be a more relevant factor.54
The increased faecal Bacteroidetes abundance corroborated with increased faecal propionate levels
in the pigs fed high DF diets, while a higher alpha diversity could be a result of a better supply of
carbohydrate substrate in distal large intestine. Collectively, these outcomes were possibly linked to
the reduced weight gain with high DF diets in this study.23 The increased abundance of butyrate-
producing bacteria according to the LEfSe analysis in pigs fed the high DF diets may explain the
slightly increased butyrate pool size in caecum and colon. In agreement with this study, a previous
study from our group has shown that an AX rich diet resulted in higher relative abundance of butyrate-

88
producing bacteria such as Faecalibacterium spp. and Blautia spp.16 In line with these findings, whole
grain and bran rich diets may promote a select group of SCFA-producing strains thereby reduce the
risk of obesity and T2D.55 Several studies have demonstrated that inflammatory bowel disease
patients and pre-diabetic human subjects have lower abundance of butyrate-producing bacteria in
faeces than healthy subjects.56, 57 Therefore, the higher relative abundance of butyrogenic microbiota
observed when providing this type of high DF diet could be considered as one of the potential health-
promoting effects of DF on gut ecology. We also found that the high DF diets increased relative
abundance of Prevotella in colon and faeces, which previously was found to play a role in AX
breakdown,44 and associated with the lower pH values in the distal colon of pigs fed the high DF
diets. Interestingly, we found a negative correlation between body weight and Ruminococcus
abundance, possibly revealing the close association of body weight with SCFA produced from this
genus since SCFA plays an important role in lipid turnover and energy homeostasis.5
Although no clear significant correlations between faecal microbiota and SCFA profile were
observed, some bacteria abundant in faeces of the pigs fed high DF such as Phascolarctobacterium
spp. was found to be producer of propionate58 which also was increased in faeces of these pigs. The
faecal samples from the low DF groups were enriched in predominant members of the Firmicutes
phylum including Ruminococcaceae, Streptococcus, Turicibacter and Anaerovorax, the latter two
were also found in high abundance in the colon. Streptococcus and Turicibacter has previously been
reported as lactate-producing bacteria and abundant in low DF diets,59 while Ruminococcaceae might
be responsible for converting lactate to SCFA.60
The increased intestinal propionate concentrations with high protein diets were reflected by minor
alterations of microbiota in mid colon, wherein the growth of propionate-oxidizing bacteria
Peptococcaceae61 was stimulated due to the abundant substrates and partly contributed to the
tendency of increased acetate concentrations. A prebiotic effect of whey protein has previously been
reported, showing increased Lactobacillus and decreased Clostridium with the consumption of whey
protein in high fat diet-fed mice.62 In contrast, abundant Clostridium was observed in faecal samples
of pigs fed high protein diets in this study. The mechanism of the distinct changes of bacteria is not
clear, but both the DF and protein levels, sources and structure could be possible modulating factors.
For instance, high DF may inhibit proteolytic bacteria fermentation processes which was further
reflected in the negative correlation between BCFA proportion and Blautia in caecum as well as
BCFA production and CF231 (member of proteolytic family Paraprevotellaceae) in the mid colon.
Moreover, the absence of major changes of bacteria in the large intestine could be explained by

89
efficient absorption of whey proteins in the small intestine.21 Clostridium can ferment carbohydrate
and besides that, amine-producing species belonging to Clostridium have been previously correlated
with BCFA abundance with high protein diets, which may be an additional risk factor for intestinal
infection.8 However, in the current study the high dietary level of protein was obtained from cereal,
whey and fish proteins, which are thought to have less detrimental effects than other protein sources.63
Additionally, the protein level of high protein diets was only 5% higher than the recommended
standard diets for minipigs (18% vs 13%) and no signs of inflammation showed up with the high
protein diets.23 Therefore, the potentially detrimental effects of high dietary protein on intestinal
function reported previously8 should not be exaggerated in the current study especially when it is
supplemented with abundant DF.
5. Conclusion
The present study supports the hypothesis that high DF intake could alter the intestinal carbohydrate
metabolism with a continuous degradation of AX until the mid-colon in this obese Göttingen Minipig
model. AX rich DF also modestly increased butyrate production, which was further supported by the
enriched butyrogenic genera. Proteolytic fermentation was suppressed by high DF and induced minor
changes in the microbiome profile, showing no prebiotic effects. However, high protein significantly
changed circulating SCFA profile associated with increased gluconeogenesis, whilst high DF
increased circulating butyrate concentrations. Overall, the modulated microbial ecosystem and SCFA
profile triggered by AX-enriched DF diets could be the potential mechanism underlying the positive
effects of DF on weight gain regulation, hormone response and metabolic disorders, while high
protein did not show beneficial effects on metabolic health.
Conflict of interest
The authors declare no conflict of interest.
Acknowledgement
The authors thank Winnie Østergaard, Lisbeth Mӓrcher, Stina Greis Handberg, Kasper Vrangstrup
Poulsen and Thomas Rebsdorf for excellent technical assistance. We thank Leslie Foldager for
consultation on data handling. Whey protein hydrolysate was kindly provided by Arla Foods
Ingredients Group P/S. Wheat bran was delivered by Lantmӓnnen and enzymatically treated by
DuPont Industrial Bioscience. The work was financially supported by Innovation Fund Denmark
(4105-00002B) and industrial partners involved in the MERITS (Metabolic Changes by Carbohydrate
and Protein Quality in the Development and Mitigation of Metabolic Syndrome) project. Y.T.X.

90
acknowledges scholarship from China Scholarship Community and Graduate School for Science and
Technology of Aarhus University.
Reference
1. M. Romani-Perez, A. Agusti and Y. Sanz, Innovation in microbiome-based strategies for
promoting metabolic health, Curr Opin Clin Nutr Metab Care, 2017, 20, 484-491.
2. V. K. Ridaura, J. J. Faith, F. E. Rey, J. Cheng, A. E. Duncan, A. L. Kau, N. W. Griffin, V.
Lombard, B. Henrissat, J. R. Bain, M. J. Muehlbauer, O. Ilkayeva, C. F. Semenkovich, K. Funai,
D. K. Hayashi, B. J. Lyle, M. C. Martini, L. K. Ursell, J. C. Clemente, W. Van Treuren, W. A.
Walters, R. Knight, C. B. Newgard, A. C. Heath and J. I. Gordon. Gut microbiota from twins
discordant for obesity modulate metabolism in mice, Science, 2013, 341, 1241214.
3. J. L. Sonnenburg and F. Backhed, Diet-microbiota interactions as moderators of human
metabolism, Nature, 2016, 535, 56-64.
4. D. K. Dahiya, Renuka, M. Puniya, U. K. Shandilya, T. Dhewa, N. Kumar, S. Kumar, A. K.
Puniya and P. Shukla, Gut Microbiota Modulation and Its Relationship with Obesity Using
Prebiotic Fibers and Probiotics: A Review, Front Microbiol, 2017, 8, 563.
5. D. J. Morrison and T. Preston, Formation of short chain fatty acids by the gut microbiota and
their impact on human metabolism. Gut Microbes, 2016, 7, 189-200.
6. G. O. Phillips and S. W. Cui, An introduction: Evolution and finalisation of the regulatory
definition of dietary fibre, Food Hydrocolloids, 2011, 25, 139-143.
7. M. W. J. Wong, R. de Souza, C. W. C. Kendall, A. Emam and D. J. A. Jenkins, Colonic Health:
Fermentation and Short Chain Fatty Acids, J Clin Gastroenterol, 2006, 40, 235–243.
8. N. E. Diether and B. P. Willing, Microbial Fermentation of Dietary Protein: An Important
Factor in Diet(-)Microbe(-)Host Interaction, Microorganisms, 2019, 7.
9. M. S. Izydorczyk and C. G. Biliaderi. Cereal arabinoxylans: advances in structure and
physicochemical properties, Carbohydrate Polymers, 1995, 28, 33-48.
10. K. E. Bach Knudsen, A. Serena, A. K. Bjørnbak Kjær, H. Jørgensen and R. Engberg, Rye Bread
Enhances the Production and Plasma Concentration of Butyrate but Not the Plasma
Concentrations of Glucose and Insulin in Pigs1, J Nutr, 2005, 135, 1696–1704.
11. H. N. Lærke and K. E. Bach Knudsen, Rye Arabinoxylans: Molecular Structure,
Physicochemical Properties and Physiological Effects in the Gastrointestinal Tract, Cereal
Chem, 2010, 87, 353-362.
12. A. K. Ingerslev, P. K. Theil, M. S. Hedemann, H. N. Laerke and K. E. Bach Knudsen, Resistant
starch and arabinoxylan augment SCFA absorption, but affect postprandial glucose and insulin
responses differently, Br J Nutr, 2014, 111, 1564-1576.
13. F. Brighenti, L. Benini, D. Del Rio, C. Casiraghi, N. Pellegrini, F. Scazzina, D. J. A. Jenkins
and I. Vantini. Colonic fermentation of indigestible carbohydrates contributes to the second-
meal effect, Am J Clin Nutr, 2006, 83, 817-822.
14. S. Hald, A. G. Schioldan, M. .E Moore, A. Dige, H. N. Laerke, J. Agnholt, K. E. Bach Knudsen,
K. Hermansen, M. L. Marial, S. Gregersen and J. F. Dahlerup. Effects of Arabinoxylan and
Resistant Starch on Intestinal Microbiota and Short-Chain Fatty Acids in Subjects with
Metabolic Syndrome: A Randomised Crossover Study, PLoS One, 2016, 11, e0159223.
15. B. A. Williams, D. Zhang, A. T. Lisle, D. Mikkelsen, C. S. McSweeney, S. Kang, W. L. Bryden,
M. J. Gidley, Soluble arabinoxylan enhances large intestinal microbial health biomarkers in pigs
fed a red meat-containing diet, Nutrition, 2016, 32, 491-497.
16. T. S. Nielsen, H. N. Laerke, P. K. Theil, J. F. Sorensen, M. Saarinen, S. Forssten, K. E. Bach
Knudsen. Diets high in resistant starch and arabinoxylan modulate digestion processes and
91
SCFA pool size in the large intestine and faecal microbial composition in pigs, Br J Nutr, 2014,
112, 1837-1849.
17. B. Damen, L. Cloetens, W. F. Broekaert, I. Francois, O. Lescroart, I. Trogh, F. Arnaut, G. W.
Welling, J. Wijffels, J. A. Delcour, K. Verbeke, C. M. Courtin, Consumption of breads
containing in situ-produced arabinoxylan oligosaccharides alters gastrointestinal effects in
healthy volunteers, J Nutr, 2012, 142, 470-477.
18. A. C. Ouwehand, M. Derrien, W. de Vos, K. Tiihonen, N. Rautonen, Prebiotics and other
microbial substrates for gut functionality, Curr Opin Biotechnol, 2005, 16, 212-217.
19. A. Bjornshave, J. J. Holst and K. Hermansen, Pre-Meal Effect of Whey Proteins on Metabolic
Parameters in Subjects with and without Type 2 Diabetes: A Randomized, Crossover Trial,
Nutrients, 2018, 10.
20. R. C. Sprong, A. J. Schonewille and R. van der Meer, Dietary cheese whey protein protects rats
against mild dextran sulfate sodium-induced colitis: role of mucin and microbiota, J Dairy Sci,
2010, 93, 1364-1371.
21. B. Tranberg, L. I. Hellgren, J. Lykkesfeldt, K. Sejrsen, A. Jeamet, I. Rune, M. Ellekilde, D. S.
Nielsen and A. K. Hansen, Whey protein reduces early life weight gain in mice fed a high-fat
diet, PLoS One, 2013, 8, e71439.
22. T. Sanchez-Moya, R. Lopez-Nicolas, D. Planes, C. A. Gonzalez-Bermudez, G. Ros-Berruezo,
C. Frontela-Saseta. In vitro modulation of gut microbiota by whey protein to preserve intestinal
health. Food Funct, 2017, 8, 3053-3063.
23. Y. Xu, M. V. Curtasu, K. E. Bach Knudsen, M. S. Hedemann, P. K. Theil and H. N. Lærke,
Dietary fibre and protein do not synergistically influence insulin, metabolic or inflammatory
biomarkers in young obese Göttingen Minipigs, Br J Nutr, 2020, preprint, DOI:
https://doi.org/10.1017/S0007114520003141.
24. E. Roura, S-J. Koopmans, J-P. Lallès, I. Le Huerou-Luron, N. de Jager, T. Schuurman, D. Val-
Laillet, Critical review evaluating the pig as a model for human nutritional physiology, Nutr
Res Rev, 2016, 29, 60-90.
25. M. V. Curtasu, Obesity and metabolic syndrome in miniature pigs as models for human disease
– metabolic changes in response to ad libitum feeding of high-fat-high-carbohydrate diets, PhD
thesis, Aahus University, 2019.
26. K. E. Bach Knudsen, Carbohydrate and lignin contents of plant materials used in animal
feeding, Anim Feed Sci Technol, 1997, 319-338.
27. M. T. Jensen, R. P. Cox, B. B. Jensen, Microbial production of skatole in the hind gut of pigs
given different diets and its relation to skatole deposition in backfat, Anim Sci, 1995, 61, 293-
304.
28. J. Han, K. Lin, C. Sequeira, C. H. Borchers, An isotope-labeled chemical derivatization method
for the quantitation of short-chain fatty acids in human feces by liquid chromatography-tandem
mass spectrometry, Anal Chim Acta, 2015, 854, 86-94.
29. N. A. Bokulich, C. M. L. Joseph, G. Allen, A. K. Benson, D. A. Mills, Next-Generation
Sequencing Reveals Significant Bacterial Diversity of Botrytized Wine, PLOS ONE, 2012, 7,
e36357.
30. E. A. McInnis, K. M. Kalanetra, D. A. Mills, E. A. Maga, Analysis of raw goat milk microbiota:
Impact of stage of lactation and lysozyme on microbial diversity, Food Microbiol, 2015, 46,
121-131.
31. N. A. Bokulich, B. D. Kaehler, J. R. Rideout, M. Dillon, E. Bolyen, R. Knight, G. A. Huttley
and J. G. Caporaso, Optimizing taxonomic classification of marker-gene amplicon sequences
with QIIME 2's q2-feature-classifier plugin, Microbiome, 2018, 6, 90.
32. D. P. Faith, Conservation evaluation and phylogenetic diversity, Biol Conserv, 1992, 61, 1-10.

92
33. C. Lozupone and R. Knight, UniFrac: a new phylogenetic method for comparing microbial
communities, Appl Environ Microbiol, 2005, 71, 8228-8235.
34. C. Lozupone, M. E. Lladser, D. Knights, J. Stombaugh, R. Knight, UniFrac: an effective
distance metric for microbial community comparison, ISME J, 2011, 5, 169-172.
35. C. T. Vangsøe, J. F. Sørensen and K. E. Bach Knudsen, Aleurone cells are the primary
contributor to arabinoxylan oligosaccharide production from wheat bran after treatment with
cell wall‐degrading enzymes, Int J Food Sci Tech, 2019, 54, 2847-2853.
36. M. M. Kasprzak, H. N. Laerke and K. E. Bach Knudsen, Effects of isolated and complex dietary
fiber matrices in breads on carbohydrate digestibility and physicochemical properties of ileal
effluent from pigs, J Agric Food Chem, 2012, 60, 12469-12476.
37. K. E. Bach Knudsen, B. B. Jensen and H. Inge, Oat bran but not a 0-glucan-enriched oat fraction
enhances butyrate production in the large intestine of pigs1, J Nutr, 1993, 123, 1235-1247.
38. K. E. Bach Knudsen and I. Hansen, Gastrointestinal implications in pigs of wheat and oat
fractions1. Digestibility and bulking properties of polysaccharides and other major constituents,
Br. J Nutr, 1991, 65, 217-232.
39. M. S. Izydorczyk and C. G. Biliaderis, Influence of structure on the physicochemical properties
of wheat arabinoxylan, Carbohydr Polym, 1992, 17, 237-247.
40. L. V. Glitsø, H. Gruppen, H. A. Schols, S. Højsgaard, B. Sandstro¨m and K. E. Bach Knudsen,
Degradation of rye arabinoxylans in the large intestine of pigs, J Sci Food Agric, 1999, 79, 961-
969.
41. D. L. Topping and P. M. Clifton, Short-Chain Fatty Acids and Human Colonic Function: Roles
of Resistant Starch and Nonstarch Polysaccharides, Physiol Rev, 2001, 81, 1031-1064.
42. M. Le Gall, A. Serena, H. Jorgensen, P. K. Theil and K. E. Bach Knudsen, The role of whole-
wheat grain and wheat and rye ingredients on the digestion and fermentation processes in the
gut--a model experiment with pigs, Br J Nutr, 2009, 102, 1590-1600.
43. R. Jha and J. F. D. Berrocoso. Dietary fiber and protein fermentation in the intestine of swine
and their interactive effects on gut health and on the environment: A review, Anim Feed Sci
Technol, 2016, 212, 18-26.
44. D. P. Belobrajdic, A. R. Bird, M. A. Conlon, B. A. Williams, S. Kang, C. S. McSweeney, D.
Zhang, W. L. Bryden, M. J. Gidley and D. L. Topping, An arabinoxylan-rich fraction from
wheat enhances caecal fermentation and protects colonocyte DNA against diet-induced damage
in pigs, Br J Nutr, 2011, 107, 1274-1282.
45. R. Pieper, S. Kroger, J. F. Richter, J. Wang, L. Martin, J. Bindelle, J. K. Htoo, D. von Smolinski,
W. Vahjen, J. Zentek and A. G. Van Kessel, Fermentable fiber ameliorates fermentable protein-
induced changes in microbial ecology, but not the mucosal response, in the colon of piglets, J
Nutr, 2012, 142, 661-667.
46. V. Salvador, C. Cherbut, J-L. Barry, D. Bertrand, C. Bonnet, J. Delort-Laval, Sugar composition
of dietary fibre and short-chain fatty acid production during in vitro fermentation by human
bacteria, Br J Nutr, 1993, 70, 189-197.
47. Z. Gao, J. Yin, J. Zhang, R. E. Ward, R. J. Martin, M. Lefevre, . T. Cefalu and J. Ye, Butyrate
improves insulin sensitivity and increases energy expenditure in mice, Diabetes, 2009, 58,
1509-1517.
48. M. Müller, M. A. G. Hernández, G. H. Goossens, D. Reijnders, J. J. Holst, J. W. E. Jocken, H.
van Eijk, E. E. Canfora and E. E. Blaak, Circulating but not faecal short-chain fatty acids are
related to insulin sensitivity, lipolysis and GLP-1 concentrations in humans, Sci Rep, 2019, 9.
49. K. R. Freeland, C. Wilson and T. M. Wolever. Adaptation of colonic fermentation and
glucagon-like peptide-1 secretion with increased wheat fibre intake for 1 year in
hyperinsulinaemic human subjects, Br J Nutr, 2010, 103, 82-90.

93
50. S. Satapati, N. E. Sunny, B. Kucejova, X. Fu, T. T. He, A. Mendez-Lucas, J. M. Shelton, J. C.
Perales, J. D. Browning and S. C. Burgess, Elevated TCA cycle function in the pathology of
diet-induced hepatic insulin resistance and fatty liver, J Lipid Res, 2012, 53, 1080-1092.
51. D. A. Kieffer, B. D. Piccolo, M. L. Marco, E. B. Kim, M. L. Goodson, M. J. Keenan, T. N.
Dunn, K. E. Bach Knudsen, S. H. Adams and R. J. Martin, Obese Mice Fed a Diet Supplemented
with Enzyme-Treated Wheat Bran Display Marked Shifts in the Liver Metabolome Concurrent
with Altered Gut Bacteria, J Nutr, 2016, 146, 2445-2460.
52. A. Rivera-Piza and S-J. Lee, Effects of dietary fibers and prebiotics in adiposity regulation via
modulation of gut microbiota, Appl Biol Chem, 2020, 63.
53. E. Ruth, P. J. T. Ley, K. Samuel and I. J. Gordon, Human gut microbes associated with obesity,
Nature, 2006, 444, 1022-1023.
54. F. Magne, M. Gotteland, L. Gauthier, A. Zazueta, S. Pesoa, P. Navarrete and R. Balamurugan,
The Firmicutes/Bacteroidetes Ratio: A Relevant Marker of Gut Dysbiosis in Obese Patients?
Nutrients, 2020, 12.
55. M. C. W. Myhrstad, H. Tunsjo, C. Charnock, V. H. Telle-Hansen, Dietary Fiber, Gut
Microbiota, and Metabolic Regulation-Current Status in Human Randomized Trials, Nutrients,
2020, 12.
56. X, Zhang, D. Shen, Z. Fang, Z. Jie, X. Qiu, C. Zhang, Y. Chen and L. J, Human gut microbiota
changes reveal the progression of glucose intolerance, PLoS One, 2013, 8, e71108.
57. R. K. Singh, H. W. Chang, D. Yan, K. M. Lee, D. Ucmak, K. Wong, M. Abrouk, B. Farahnik,
M. Nakamura, T. Zhu, T. Bhutani and W. Liao, Influence of diet on the gut microbiome and
implications for human health, J Transl Med, 2017, 15, 73.
58. P. Louis and H. J. Flint, Formation of propionate and butyrate by the human colonic microbiota,
Environ Microbiol, 2017, 19, 29-41.
59. L. F. Gomez-Arango, H. L. Barrett, S. A. Wilkinson, L. K. Callaway, H. D. McIntyre, M.
Morrison and M. D. Nitert, Low dietary fiber intake increases Collinsella abundance in the gut
microbiota of overweight and obese pregnant women, Gut Microbes, 2018, 9, 189-201.
60. H. J. Flint, K. P. Scott, S. H. Duncan, P. Louis and E. Forano, Microbial degradation of complex
carbohydrates in the gut, Gut Microbes, 2012, 3, 289-306.
61. N. Muller, P. Worm, B. Schink, A. J. Stams, C. M. Plugge, Syntrophic butyrate and propionate
oxidation processes: from genomes to reaction mechanisms, Environ Microbiol Rep, 2010, 2,
489-499.
62. L. McAllan, P. Skuse, P. D. Cotter, P. O'Connor, J. F. Cryan, R. P. Ross, G. Fitzgerald, H. M.
Roche and K. N. Nilaweera, Protein quality and the protein to carbohydrate ratio within a high
fat diet influences energy balance and the gut microbiota in C57BL/6J mice, PLoS One, 2014,
9, e88904.
63. P. Lopez-Legarrea, R. de la Iglesia, I. Abete, S. Navas-Carretero, J. A. Martinez, M. A. Zulet,
The protein type within a hypocaloric diet affects obesity-related inflammation: the RESMENA
project, Nutrition, 2014, 30, 424-429.
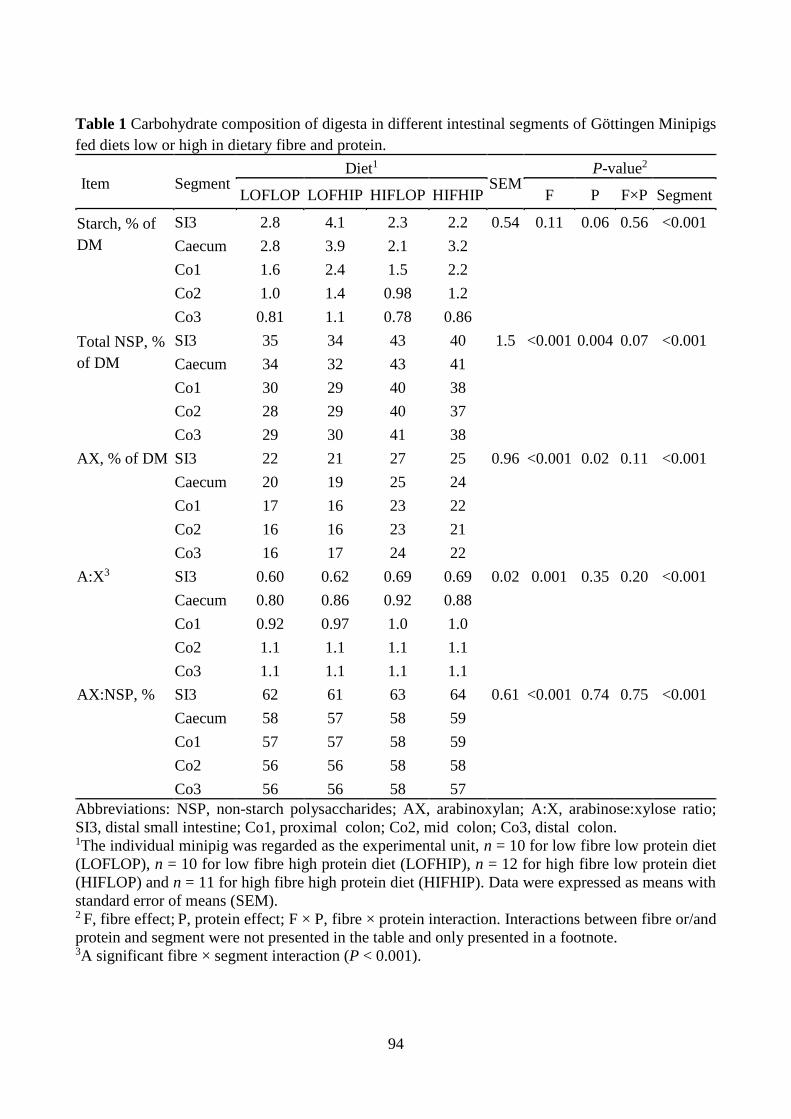
94
Table 1 Carbohydrate composition of digesta in different intestinal segments of Göttingen Minipigs
fed diets low or high in dietary fibre and protein.
Item Segment Diet1
SEM P-value2
LOFLOP LOFHIP HIFLOP HIFHIP F P F×P Segment
Starch, % of
DM
SI3 2.8 4.1 2.3 2.2 0.54 0.11 0.06 0.56 <0.001
Caecum 2.8 3.9 2.1 3.2
Co1 1.6 2.4 1.5 2.2
Co2 1.0 1.4 0.98 1.2
Co3 0.81 1.1 0.78 0.86
Total NSP, %
of DM
SI3 35 34 43 40 1.5 <0.001 0.004 0.07 <0.001
Caecum 34 32 43 41
Co1 30 29 40 38
Co2 28 29 40 37
Co3 29 30 41 38
AX, % of DM SI3 22 21 27 25 0.96 <0.001 0.02 0.11 <0.001 Caecum 20 19 25 24
Co1 17 16 23 22
Co2 16 16 23 21
Co3 16 17 24 22
A:X3 SI3 0.60 0.62 0.69 0.69 0.02 0.001 0.35 0.20 <0.001 Caecum 0.80 0.86 0.92 0.88
Co1 0.92 0.97 1.0 1.0
Co2 1.1 1.1 1.1 1.1
Co3 1.1 1.1 1.1 1.1
AX:NSP, % SI3 62 61 63 64 0.61 <0.001 0.74 0.75 <0.001 Caecum 58 57 58 59
Co1 57 57 58 59
Co2 56 56 58 58
Co3 56 56 58 57
Abbreviations: NSP, non-starch polysaccharides; AX, arabinoxylan; A:X, arabinose:xylose ratio;
SI3, distal small intestine; Co1, proximal colon; Co2, mid colon; Co3, distal colon. 1The individual minipig was regarded as the experimental unit, n = 10 for low fibre low protein diet
(LOFLOP), n = 10 for low fibre high protein diet (LOFHIP), n = 12 for high fibre low protein diet
(HIFLOP) and n = 11 for high fibre high protein diet (HIFHIP). Data were expressed as means with
standard error of means (SEM). 2 F, fibre effect; P, protein effect; F × P, fibre × protein interaction. Interactions between fibre or/and
protein and segment were not presented in the table and only presented in a footnote. 3A significant fibre × segment interaction (P < 0.001).

95
Table 2 Short chain fatty acid distribution (% of total SCFA) in different intestinal segments of
Göttingen Minipigs fed diets low or high in dietary fibre and protein.
% of total
SCFA Segment
Diet1 SEM
P-value2
LOFLOP LOFHIP HIFLOP HIFHIP F P F×P Segment
Acetate SI3 61 62 64 66 3.0 0.56 0.76 0.73 <0.001 Caecum 68 67 65 68
Co1 65 64 62 62
Co2 63 62 61 59
Co3 63 59 60 57
Propionate SI3 1.2 1.0 0.9 1.4 1.3 0.55 0.12 0.42 <0.001 Caecum 17 18 17 18
Co1 17 18 17 19
Co2 17 18 16 19
Co3 16 17 17 19
Butyrate3 SI3 6.5 7.5 1.4 0.7 2.1 0.71 0.75 0.33 <0.001 Caecum 13 12 15 12
Co1 14 14 17 14
Co2 15 15 17 16
Co3 14 18 17 17
BCFA4 SI3 0.4 0.0 0.2 0.1 0.33 0.002 0.33 0.99 <0.001 Caecum 1.2 1.5 0.9 1.0
Co1 1.6 2.0 1.4 1.6
Co2 2.8 3.3 2.3 2.6
Co3 4.3 4.1 2.7 3.0
Abbreviations: SCFA, short-chain fatty acids; BCFA, branched-chain fatty acids; SI3, distal small
intestine; Co1, proximal colon; Co2, mid colon; Co3, distal colon. 1The individual minipig was regarded as the experimental unit, n = 10 for low fibre low protein diet
(LOFLOP), n = 10 for low fibre high protein diet (LOFHIP), n = 12 for high fibre low protein diet
(HIFLOP) and n = 11 for high fibre high protein diet (HIFHIP). Data were expressed as means with
standard error of means (SEM). 2 F, fibre effect; P, protein effect; F × P, fibre × protein interaction. Interactions between fibre or/and
protein and segment are not presented in the table and only presented in footnotes. 3Significant fibre × segment interaction (P < 0.001) and protein × segment interaction (P = 0.050). 4Significant fibre × segment interaction (P = 0.002).

96
Table 3 Plasma short-chain fatty acid, succinate and branched-chain fatty acid concentrations
(μmol/L) in portal and jugular vein of Göttingen Minipigs fed diets low or high in dietary fibre and
protein.
Item Diet1
SEM P-value2
LOFLOP LOFHIP HIFLOP HIFHIP F P F×P
Portal vein
SCFA 426 415 348 347 66 0.26 0.92 0.93
Acetate 322 281 263 273 38 0.38 0.67 0.51
Propionate 54 62 39 35 18 0.21 0.88 0.70
Butyrate 28 33 27 13 10 0.25 0.64 0.27
Valerate 5.7 4.1 2.6 3.0 1.4 0.13 0.69 0.46
Succinate 38 41 33 39 4.7 0.41 0.25 0.73
BCFA 17 27 16 24 3.2 0.48 0.007 0.66
Jugular vein
SCFA 164 157 164 170 17 0.60 0.99 0.61
Acetate 149 137 149 150 17 0.61 0.71 0.62
Propionate 1.2 2.0 1.2 2.1 0.17 0.81 <0.001 0.91
Butyrate 0.82 0.59 1.3 1.1 0.29 0.03 0.40 0.83
Valerate 0.08 0.08 0.10 0.07 0.02 0.59 0.26 0.38
Succinate 17 14 18 13 1.5 0.71 0.001 0.40
BCFA 14 14 12 17 2.4 0.81 0.20 0.36
Abbreviations: SCFA, short-chain fatty acids; BCFA, branched-chain fatty acids. 1Minipigs were regarded as the experimental units, n = 10 for low fibre low protein diet (LOFLOP),
n = 10 for low fibre high protein diet (LOFHIP), n = 12 for high fibre low protein diet (HIFLOP) and
n = 11 for high fibre high protein diet (HIFHIP). Data were expressed as means with standard error
of means (SEM). 2 F, fibre effect; P, protein effect; F × P, fibre × protein interaction.

97
AXOS SAX IAX AXOS SAX IAX
0
20
40
60
80
100
% o
f to
tal
AX
DietSI3 digesta
LOF HIF
*
*§ §
A
*
AXOS SAX IAX AXOS SAX IAX
0.0
0.2
0.4
0.6
0.8
1.0
Ara
bin
ose
:xy
lose
DietSI3 digesta
LOF HIF
*§
§
B
*
Fig. 1 Arabinoxylan oligosaccharides (AXOS), soluble arabinoxylan (SAX) and insoluble
arabinoxylan (IAX) as percentage of total AX (A), and arabinose:xylose ratios of AXOS, SAX and
IAX (B) in diet and distal small intestine (SI3) digesta of Göttingen Minipigs fed low and high fibre
diets. Values are least-squares means with standard errors represented by vertical bars. The individual
minipig was regarded as the experimental unit, n = 20 for low fibre diets (LOF), n = 23 for high fibre
diet (HIF). * indicates the significant difference for the paired test comparison between diet and SI3
digesta (P < 0.05). § indicates significant difference at P < 0.05 in SI3 digesta between LOF and
HIF.

98
SI3 Cecum Co1 Co2 Co3
0
50
100
150
SC
FA
, mm
ol/
kg
LOFLOPLOFHIPHIFLOPHIFHIP
Protein, P = 0.03
Fiber, P = 0.02
Segment, P < 0.001
A
SI3 Cecum Co1 Co2 Co3
0
20
40
60
80
100
Ace
tate
, mm
ol/
kg
LOFLOPLOFHIPHIFLOPHIFHIP
Fiber, P = 0.02Segment, P < 0.001
B
SI3 Cecum Co1 Co2 Co3
0
5
10
15
20
25
Pro
pio
nat
e, m
mo
l/k
g
LOFLOPLOFHIPHIFLOPHIFHIP
Protein, P = 0.04Segment, P < 0.001
C
SI3 Cecum Co1 Co2 Co3
0
5
10
15
20
Bu
tyra
te,
mm
ol/
kg
LOFLOPLOFHIPHIFLOPHIFHIP
Segment, P < 0.001
D
SI3 Cecum Co1 Co2 Co3
0
1
2
3
BC
FA
, m
mo
l/k
g
LOFLOPLOFHIPHIFLOPHIFHIP
EFiber Segment, P < 0.001
Protein Segment, P = 0.04
Fig. 2 Concentrations of total SCFA (A), acetate (B), propionate (C), butyrate (D) and BCFA (E) in
distal small intestine (SI3), caecum, proximal colon (Co1), mid colon (Co2) and distal colon (Co3)
of Göttingen Minipigs. Values are least-squares means with standard errors represented by vertical
bars. The individual minipig was regarded as the experimental unit, n = 10 for low fibre low protein
diet (LOFLOP), n = 10 for low fibre high protein diet (LOFHIP), n = 12 for high fibre low protein
diet (HIFLOP) and n = 11 for high fibre high protein diet (HIFHIP). Only significant P -values are
presented in the figure, main effects were not shown when there was an interaction.
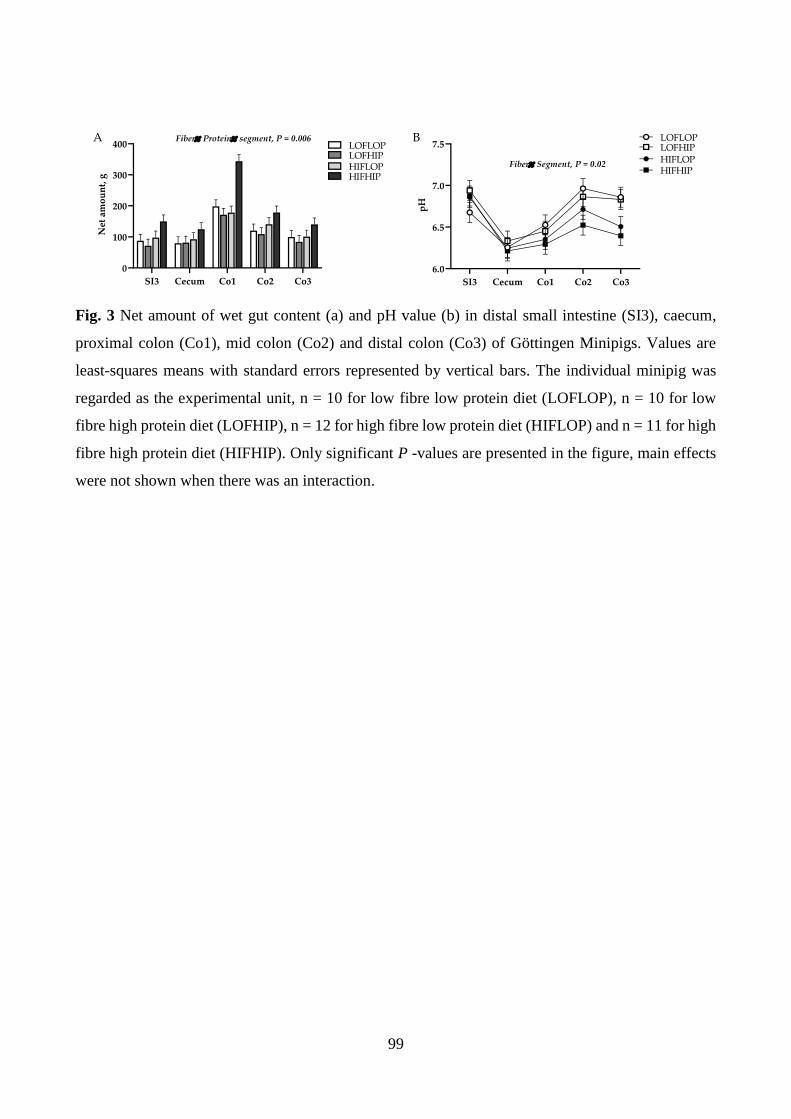
99
SI3 Cecum Co1 Co2 Co3
0
100
200
300
400
Net
am
ou
nt,
g
LOFLOPLOFHIPHIFLOPHIFHIP
Fiber Protein segment, P = 0.006A
SI3 Cecum Co1 Co2 Co3
6.0
6.5
7.0
7.5
pH
LOFLOPLOFHIPHIFLOPHIFHIP
Fiber Segment, P = 0.02
B
Fig. 3 Net amount of wet gut content (a) and pH value (b) in distal small intestine (SI3), caecum,
proximal colon (Co1), mid colon (Co2) and distal colon (Co3) of Göttingen Minipigs. Values are
least-squares means with standard errors represented by vertical bars. The individual minipig was
regarded as the experimental unit, n = 10 for low fibre low protein diet (LOFLOP), n = 10 for low
fibre high protein diet (LOFHIP), n = 12 for high fibre low protein diet (HIFLOP) and n = 11 for high
fibre high protein diet (HIFHIP). Only significant P -values are presented in the figure, main effects
were not shown when there was an interaction.

100
LOFLO
P
LOFH
IP
HIF
LOP
HIF
HIP
0
50
100
%
FirmicutesABacteroidetesProteobacteriaOthers
LOFLO
P
LOFH
IP
HIF
LOP
HIF
HIP
0
50
100
%
FirmicutesBBacteroidetesProteobacteriaOthers
LOFLO
P
LOFH
IP
HIF
LOP
HIF
HIP
0
50
100
%
FirmicutesBacteroidetesProteobacteriaOthers
C*
*
Fig. 4 Abundance of predominant phyla in caecum (A), mid colon (B) and faeces (C) of Göttingen
Minpigs fed diets low or high in dietary fibre and protein. Values are least-squares means with
standard errors represented by vertical bars. The individual minipig was regarded as the experimental
unit, n = 10 for low fibre low protein diet (LOFLOP), n = 10 for low fibre high protein diet (LOFHIP),
n = 12 for high fibre low protein diet (HIFLOP) and n = 11 for high fibre high protein diet (HIFHIP).
One digesta sample from mid colon in LOFLOP group (n = 9) was omitted due to low-quality reads.
* indicates significant fiber effects at P < 0.001 on the relative abundance of Firmicutes and
Bacteroidetes.

101
LOFLO
P
LOFH
IP
HIF
LOP
HIF
HIP
0
50
100
Rel
ativ
e ab
un
dan
ce,
%
g__Ruminococcus
g__Prevotellag__Turicibacterg__Blautiag__Coprococcusg__Lactobacillusg__Oscillospirag__Clostridiumg__Faecalibacterium
A
g__Roseburia
*
*
LOFLO
P
LOFH
IP
HIF
LOP
HIF
HIP
0
50
100
Rel
ativ
e ab
un
dan
ce,
%
g__Ruminococcusg__Roseburiag__Prevotellag__Turicibacter
g__Blautiag__Coprococcusg__Lactobacillusg__Oscillospirag__Clostridiumg__FaecalibacteriumB
*
*
*
*
*
LOFLO
P
LOFH
IP
HIF
LOP
HIF
HIP
0
50
100
Rel
ativ
e ab
un
dan
ce,
%
g__Ruminococcusg__Roseburia
g__Turicibacter
g__Blautia
g__Coprococcusg__Lactobacillusg__Oscillospirag__Clostridiumg__Faecalibacterium
C
g__Prevotella**
*
*
#
Fig. 5 Rarified taxonomy table displaying the 10 most abundant genera in caecum (A), mid colon (B)
and faecal samples (C) in Göttingen Minipigs fed low or high fibre and protein diets. The individual
minipig was regarded as the experimental unit, n = 10 for low fibre low protein diet (LOFLOP), n =
10 for low fibre high protein diet (LOFHIP), n = 12 for high fibre low protein diet (HIFLOP) and n
= 11 for high fibre high protein diet (HIFHIP). One digesta sample from mid colon in LOFLOP group
(n = 9) was omitted due to low-quality reads. * indicates significant fiber effects at P < 0.01 and #
indicates significant protein effects at P < 0.01 on the relative abundance of taxa based on Linear
Discriminant Analysis Effect Size analysis.
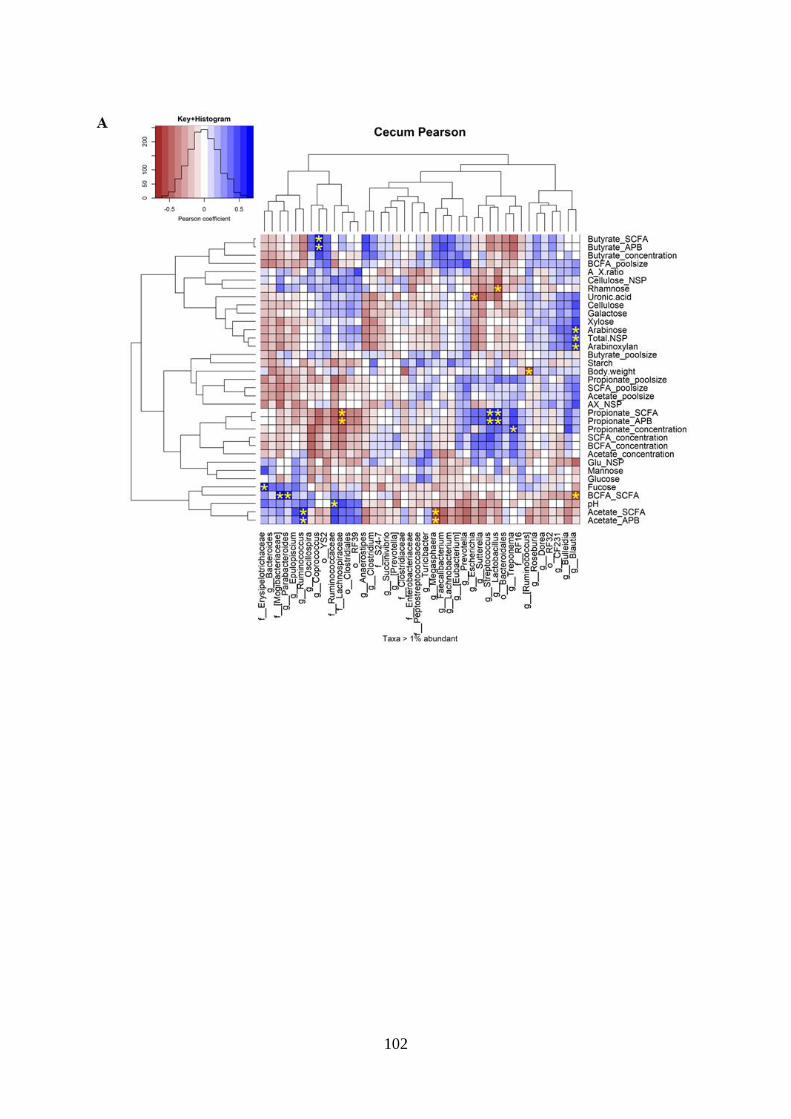
102
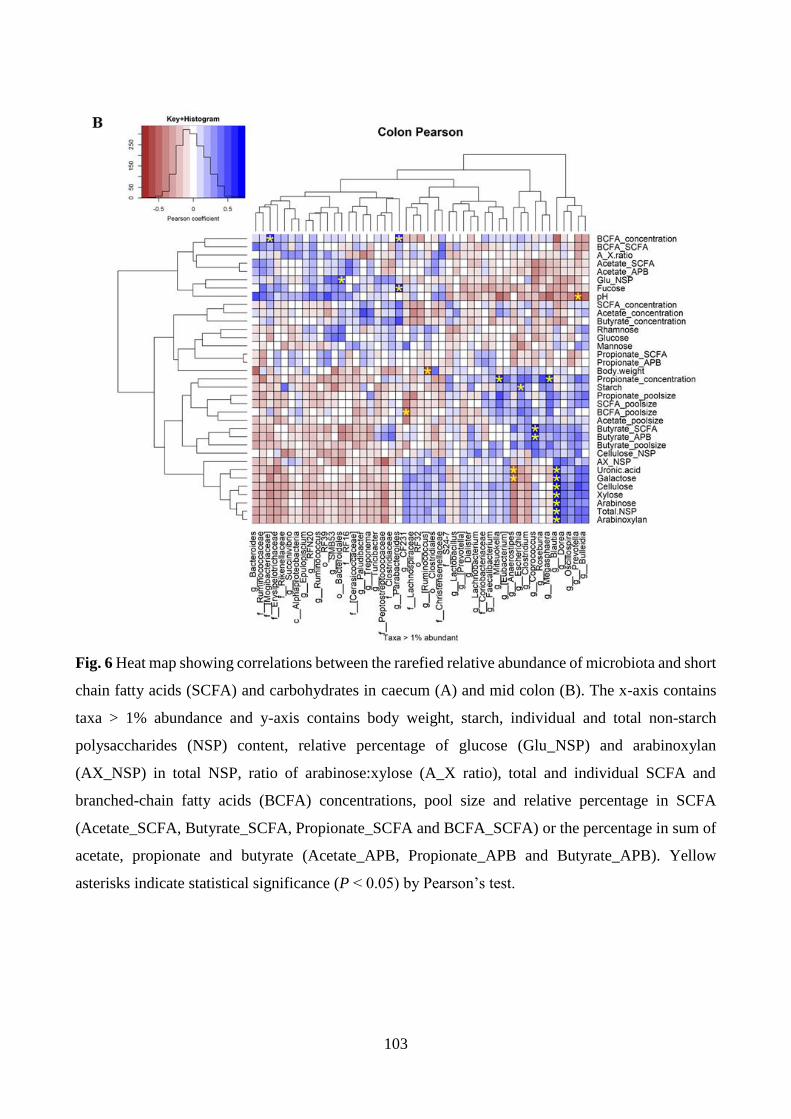
103
Fig. 6 Heat map showing correlations between the rarefied relative abundance of microbiota and short
chain fatty acids (SCFA) and carbohydrates in caecum (A) and mid colon (B). The x-axis contains
taxa > 1% abundance and y-axis contains body weight, starch, individual and total non-starch
polysaccharides (NSP) content, relative percentage of glucose (Glu_NSP) and arabinoxylan
(AX_NSP) in total NSP, ratio of arabinose:xylose (A_X ratio), total and individual SCFA and
branched-chain fatty acids (BCFA) concentrations, pool size and relative percentage in SCFA
(Acetate_SCFA, Butyrate_SCFA, Propionate_SCFA and BCFA_SCFA) or the percentage in sum of
acetate, propionate and butyrate (Acetate_APB, Propionate_APB and Butyrate_APB). Yellow
asterisks indicate statistical significance (P < 0.05) by Pearson’s test.

104
Table S1 Compound-dependent LC-MS/MS parameters, declustering potential (DP), entrance
potential (EP), collision energy (CE) and cell exit potential (CXP).
Item Q1 mass Q3 mass DP EP CE CXP
Acetic acid quantifier 193.8 151.9 -80 -15 -15 -15
Acetic acid qualifier 193.8 46.0 -80 -15 -50 -15 13C2 acetic acid quantifier 196.0 152.0 -100 -15 -24 -13 13C2 acetic acid qualifier 196.0 121.8 -100 -15 -24 -10
Propionic acid quantifier 208.0 136.9 -20 -10 -24 -9
Propionic acid qualifier 208.0 46.0 -20 -10 -50 -20 13C1 propionic acid quantifier 209.0 137.0 -20 -10 -25 -9 13C1 propionic acid qualifier 209.0 165.1 -20 -10 -18 -11
Isobutyric acid quantifier 221.9 178.9 -100 -2 -18 -15
Isobutyric acid qualifier 221.9 42.0 -60 -2 -70 -19
Butyric acid quantifier 221.9 178.9 -100 -2 -18 -15
Butyric acid qualifier 221.9 42.0 -60 -2 -70 -19 13C2 butyric acid quantifier 224.0 205.8 -100 -10 -20 -12
13C2 butyric acid qualifier 224.0 180.0 -100 -10 -18 -15
Succinic acid quantifier 387.1 234.1 -30 -10 -25 -12 13C2 succinic acid qualifier 387.1 97.8 -30 -10 -47 -10 13C2 succinic acid quantifier 389.1 99.9 -145 -10 -40 -10
Succinic acid qualifier 389.1 236.1 -145 -10 -24 -15
Isovaleric acid quantifier 235.9 137.0 -15 -15 -30 -15
Isovaleric acid qualifier 235.9 46.0 -15 -15 -40 -15
Valeric acid quantifier 235.9 137.0 -15 -15 -30 -15
Valeric acid qualifier 235.9 46.0 -15 -15 -40 -15 13C3 valeric acid quantifier 239.0 136.9 -120 -10 -27 -15 13C3 valeric acid qualifier 239.0 151.8 -120 -10 -24 -12

105
Table S2 Ingredients and chemical composition of the experimental diets.
Item LOFLOP LOFHIP HIFLOP HIFHIP
Ingredients (g/kg as-fed basis)
Wheat starch 233 167 66 0
Whole grain wheat (roller milled) 150 150 150 150
Wheat bran (finely milled) 125 125 125 125
Enzyme-treated wheat bran - - 200 200
Wheat gluten 65 65 32 32
Fish meal 20 20 20 20
Whey protein hydrolysate - 68 - 68
Fructose 200 200 200 200
Lard 150 150 150 150
Vitamins and minerals 57 56 57 56
Chemical composition (g/kg DM)
DM (g/kg as-fed basis) 913 913 919 919
Ash 62 65 73 76
Crude protein (N × 6.25) 113 179 114 175
HCL fat 174 180 188 187
Available carbohydrates 577 522 456 387
Sugars
Fructose 225 223 224 221
Glucose 1 1 7 7
Sucrose 7 7 9 8
Starch 344 292 216 150
Dietary fibre1 100 106 191 205
NSP (soluble NSP) 69 (8) 75 (12) 136 (22) 136 (15)
AX (SAX) 44 (5) 46 (7) 86 (16) 85 (12)
AXOS 5 3 12 17
Fructans 6 8 11 9
Klason lignin 19 20 30 41
RS2 2 1 1 1
Gross energy (MJ/ kg DM) 20.7 21.5 21.3 21.7
LOFLOP, low fibre low protein diet; LOFHIP, low fibre high protein diet; HIFLOP, high fibre low
protein diet; HIFHIP, high fibre high protein diet. NSP, total non-starch polysaccharides; AX,
arabinoxylan; RS, resistant starch; A:X, arabinose:xylose; AXOS, low molecular weight
arabinoxylan‐oligosaccharides. 1Dietary fibre = NSP + fructans + RS + AXOS + Klason lignin. 2Determined by enzymatic resistant starch assay (AOAC method 2002.02).

106
Table S3 Pool size (mmol) of short chain fatty acid in caecum and entire colon of Göttingen Minipigs
fed diets low or high in dietary fibre and protein.
Item Diet1
SEM P-value2
LOFLOP LOFHIP HIFLOP HIFHIP F P F×P
Caecum
Total SCFA 9.1 8.1 9.7 13 1.6 0.08 0.29 0.13
Acetate 6.2 5.3 6.3 8.8 1.1 0.09 0.29 0.10
Propionate 1.6 1.5 1.4 2.3 0.31 0.29 0.09 0.08
Butyrate 1.1 0.97 1.4 1.6 0.25 0.05 0.80 0.37
BCFA 0.11 0.11 0.08 0.11 0.02 0.28 0.26 0.33
Entire colon
Total SCFA 29b 27b 29b 50a 5.0 0.02 0.05 0.02
Acetate 18b 17b 18b 30a 3.0 0.03 0.06 0.02
Propionate 5.0 4.7 5.9 10 1.1 0.007 0.09 0.06
Butyrate 4.5 4.3 5.7 7.6 1.2 0.04 0.41 0.32
BCFA 0.68 0.73 0.52 0.98 0.12 0.68 0.03 0.07 1The individual minipig was regarded as the experimental unit, n = 10 for low fibre low protein diet
(LOFLOP), n = 10 for low fibre high protein diet (LOFHIP), n = 12 for high fibre low protein diet
(HIFLOP) and n = 11 for high fibre high protein diet (HIFHIP). Data were expressed as means with
standard error of means (SEM). 2F, fibre effect; P, protein effect; F × P, fibre × protein interaction. Different superscript letters in a
row are presented for the significant interaction (P < 0.05) after adjustment for multiple comparisons
by the Tukey–Kramer post hoc test.

107
Fig. S1 The representative MRM chromatogram of SCFA standards.
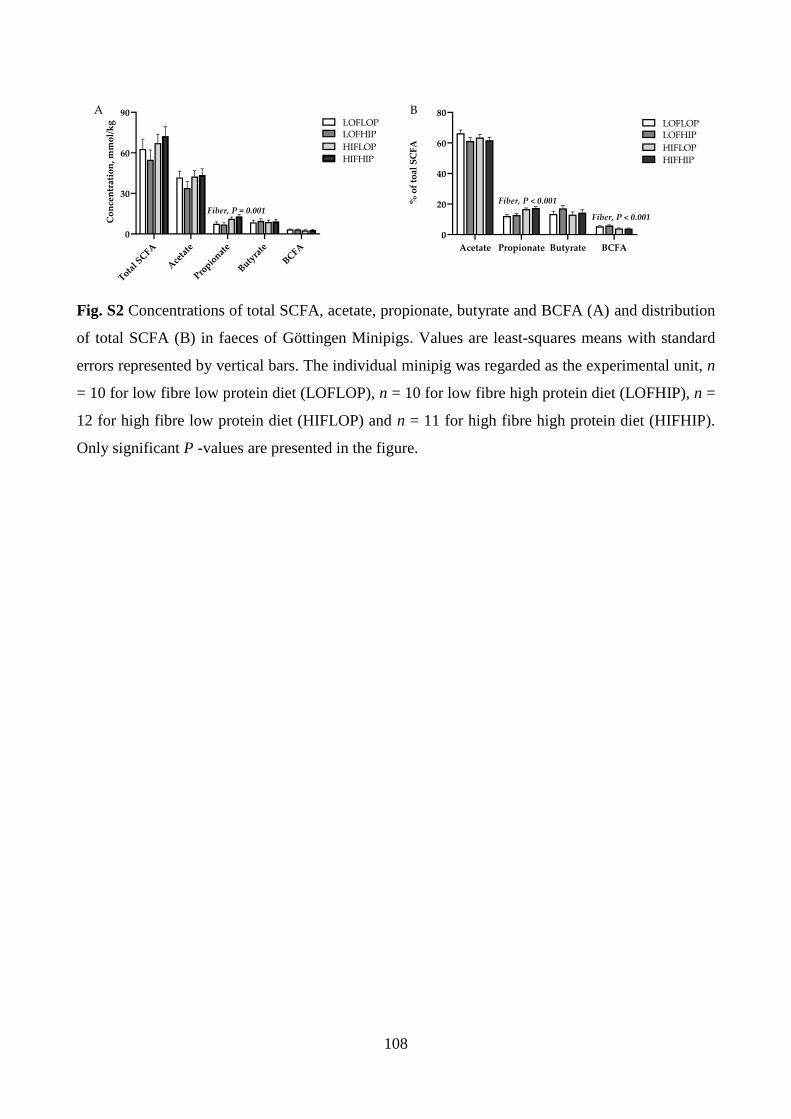
108
Total S
CFA
Ace
tate
Propio
nate
Butyra
te
BCFA
0
30
60
90C
on
cen
trat
ion
, mm
ol/
kg LOFLOP
LOFHIP
HIFLOP
HIFHIP
Fiber, P = 0.001
A
Acetate Propionate Butyrate BCFA
0
20
40
60
80
% o
f to
al S
CF
A
LOFLOPLOFHIP
HIFLOP
HIFHIP
Fiber, P < 0.001
Fiber, P < 0.001
B
Fig. S2 Concentrations of total SCFA, acetate, propionate, butyrate and BCFA (A) and distribution
of total SCFA (B) in faeces of Göttingen Minipigs. Values are least-squares means with standard
errors represented by vertical bars. The individual minipig was regarded as the experimental unit, n
= 10 for low fibre low protein diet (LOFLOP), n = 10 for low fibre high protein diet (LOFHIP), n =
12 for high fibre low protein diet (HIFLOP) and n = 11 for high fibre high protein diet (HIFHIP).
Only significant P -values are presented in the figure.

109
128
6857
3586
02
1146
9
1433
7
1720
4
2007
1
2293
8
2580
6
0
10
20
30
Rerafraction depth
fait
h_p
d
LOFHIP
LOFLOP
HIFLOP
HIFHIP
Fiber, P = 0.02
C
128
1456
2784
41
1125
4
1406
8
1688
1
1969
5
2250
8
2532
2
0
5
10
15
20
25
Rerafraction depth
fait
h_p
d
LOFLOPLOFHIPHIFLOPHIFHIP
A
135
3270
64
1059
6
1412
8
1765
9
2119
1
2472
3
2825
5
3178
7
0
5
10
15
20
25
Rerafraction depth
fait
h_p
d
LOFLOPLOFHIPHIFLOPHIFHIP
B
Fig. S3 Alpha rarefaction curves for each diet, showing the Faith’s phylogenetic diversity (faith_ph)
(y axis) as a function of sequencing depth (x axis). Samples were rarefied to 25322 sequences for
caecum (A), 31787 sequences for mid colon (B) and 25806 for faecal samples (C), which means the
minimum sequence per sample depth in the dataset. The individual minipig was regarded as the
experimental unit, n = 10 for low fibre low protein diet (LOFLOP), n = 10 for low fibre high protein
diet (LOFHIP), n = 12 for high fibre low protein diet (HIFLOP) and n = 11 for high fibre high protein
diet (HIFHIP). One digesta sample from mid colon in LOFLOP group (n = 9) was omitted due to
low-quality reads. Only significant P -values are presented in the figure.

110
C
BA
Fig. S4 Principal coordinate analysis plot of the weighted Unifrac metric. The grey, yellow, red and
blue line with points represented caecum (A), mid colon (B) and faecal (C) communities of individual
minipig after feeding low fibre low protein diet (LOFLOP, n = 10), low fibre high protein diet
(LOFHIP, n = 10), high fibre low protein diet (HIFLOP, n = 12) and high fibre high protein diet
(HIFHIP, n = 11), respectively. One digesta sample from mid colon in LOFLOP group (n = 9) was
omitted due to low-quality reads. Only significant fibre effect was observed in principal coordinate
analysis plot of caecum, colon and faecal communities (P < 0.01).

111
Fig. S5 Identification of the most differentially abundant genera in caecum (A), mid colon (B) and
faecal samples (C) in Göttingen Minipigs fed low or high fibre and protein diets. The plot was
generated from Linear Discriminant Analysis Effect Size (LEfSe) analysis with CSS-normalized
OTU table and displays taxa with LDA scores above 2.0 and P-values below 0.01. Genera enriched
in the samples with low fibre (LOF) or low protein (LOP) are indicated with green bars, and genera
enriched in the samples with high fibre (HIF) or high protein (HIP) are indicated with a red bars. The
individual minipig was regarded as the experimental unit, n = 20 for LOF, n = 23 for HIF, n = 22 for
LOP and n = 21 for HIP. One digesta sample from mid colon in LOFLOP group (n = 19 for LOF)
was omitted due to low-quality reads.

112
6.3 Paper III
The role of rye bran and antibiotics on the digestion, fermentation process and short-chain
fatty acid production and absorption of pigs.
Yetong Xu, Anne Katrine Bolvig Sørensen, Brendan McCarthy-Sinclair, Maria L. Marco, Knud Erik
Bach Knudsen, Mette Skou Hedemann and Helle Nygaard Lærke
Manuscript under review in British Journal of Nutrition. July, 2020.

113
The role of rye bran and antibiotics on the digestion, fermentation process and short-chain fatty 1
acid production and absorption of pigs 2
Yetong Xu1*, Anne Katrine Bolvig1, Brendan McCarthy-Sinclair2, Maria L. Marco2, Knud Erik Bach 3
Knudsen1, Mette Skou Hedemann1 and Helle Nygaard Lærke1 4
1 Department of Animal Science, Aarhus University, DK-8830 Tjele, Denmark 5
2 Department of Food Science and Technology, University of California, Davis, CA, USA 6
* Corresponding Author: Yetong Xu; Email: [email protected]; Tel.: +4550641816 7
Short title: DF and antibiotics on degradation and SCFA 8
Keywords: dietary fibre; antibiotics; degradation; SCFA; pig model 9

114
ABSTRACT 10
The effects of arabinoxylan (AX)-rich rye bran based diet (RB) and antibiotics on digestion, 11
fermentation and short-chain fatty acids (SCFA) absorption were studied compared with an iso-DF 12
cellulose based diet (Control). Thirty female pigs (body weight 72.5 ± 3.9 kg) were fed a standard 13
swine diet in week 1 and the Control as wash-out in week 2, then divided into 3 groups fed either the 14
Control (n=10) or RB (n=20) for 2 weeks, where 10 pigs from RB had daily intramuscular antibiotic 15
injections in week 4. The degradation of AX in the RB groups mainly occurred in caecum and 16
proximal colon (P < 0.01). Cellulose was degraded to a lower degree than AX but to a higher degree 17
in the Control than RB groups (P < 0.01). The colonic concentrations of SCFA, acetate and propionate 18
were lower with the RB diets compared with Control (P < 0.01), whereas the RB diets increased 19
caecal butyrate concentration with a reduction by the antibiotic treatment (P < 0.001). The apparent 20
protein digestibility in the RB groups was lower than Control except for distal colon and gradually 21
increased throughout the large intestine (P < 0.05). Portal plasma concentrations of SCFA and acetate 22
were lower with the RB diet than Control, accompanied by lower daily net absorption (P < 0.01). In 23
conclusion, the RB diet resulted in different DF degradation processes and SCFA production than the 24
Control diet, whereas antibiotic treatment had marginal effects on the intestinal DF structure but 25
inhibited butyrate production.26

115
INTRODUCTION 27
Dietary fibre (DF), the sum of non-digestible carbohydrate and lignin, has been associated with 28
decreased risk for obesity, cardiovascular disease, cancer and type 2 diabetes(1). In most Northern 29
European countries, cereal products are the important sources of DF. Whole grains, especially the 30
bran fractions, are high in DF and other phytochemicals. It has been shown that the presence of DF 31
with different structural composition and physicochemical properties may have different influence 32
on the transit time and nutrient digestibility along the gastrointestinal tract(2). In the small intestine, 33
the luminal viscosity and water binding capacity of digesta are increased by soluble cereal DF, 34
thereby slowing the movement of digesta(3) whereas in the large intestine, DF are fermented by 35
anaerobic microbiota into multiple metabolites such as short chain fatty acids (SCFA)(2, 4). Only about 36
5% of the produced SCFA is excreted in the faeces while some are metabolised within the gut itself 37
but the majority is absorbed and pass via the portal vein to the liver where it is either metabolised or 38
goes into peripheral circulation(5). Butyrate, in particular, is an important energy source for the 39
intestinal epithelium and can improve gut barrier function and alleviate inflammation(6). Besides the 40
beneficial effects of SCFA on intestinal health, increased peripheral SCFA appear to play a critical 41
role in inhibiting lipolysis within adipose tissue(7), improving insulin secretion and glucose 42
homeostasis(8). 43
The main DF constituents of cereals are arabinoxylan (AX), β-glucan, cellulose and lignin present 44
in different proportions in different tissues of the grain(9). Compared to wheat, rye bran (RB) has a 45
higher content of AX, fructans as well as β-glucans(2, 10). The major non-starch polysaccharides (NSP) 46
components in rye bran, AX, consists of xylan backbones with varying degree of substitution with 47
arabinose and ferulic acid residues(11). It has been found that a high degree of substitution makes the 48
polymer less degradable(12). The type and composition of DF affects the composition of intestinal 49
microbiota and profile of metabolites formed during fermentation, especially SCFA(13). It has been 50
demonstrated that AX is a substrate for intestinal butyrate production as well as enrichment of 51
butyrogenic species(14). However, the microbial fermentation processes are likely to be disturbed by 52
antibiotics. The use of antibiotics has been associated with increased metabolic impairments, such as 53
disrupting intestinal homeostasis and integrity of intestinal defenses(15). A previous study has found 54
that antibiotics decreased the caecal concentrations of SCFA accompanied by the change of 55
microbiota composition in mice(16). It also corroborates with an epidemiological study showing that 56
the use of antibiotics reduced the plasma levels of enterolactone, a metabolite of lignans that require 57
116
microbial conversion(17). This was confirmed in our pig study, where we also found that antibiotic 58
treatment affected the microbiota composition and urine metabolome(18). 59
In this paper, we investigated the effects of a rye bran enriched diet high in AX with or without 60
antibiotics on nutrient digestibility, NSP degradation, SCFA production and absorption compared to 61
a diet with similar DF content, but where the DF stems from purified cellulose only. The use of a pig 62
model allowed control of DF intake and antibiotic dosage and to sample at sites not possible in 63
humans(18). We hypothesised that an AX-enriched diet will reduce nutrient digestibility but stimulate 64
fermentation processes, and specifically increase butyrate production and absorption compared with 65
refined wheat fibre, whereas antibiotic treatment will hamper fibre degradation and the production of 66
SCFA. 67
MATERIALS AND METHODS 68
Diets, animals, experimental design and microbiota assessments have been described in detail 69
previously in a paper presenting results on plant- and enterolignan concentrations and LC−MS based 70
metabolomics(18). 71
Experimental diets 72
Two experimental diets with the same DF level were used: a refined wheat fibre added diet (Control) 73
and a rye bran added diet (RB). The Control diet was formulated by white wheat flour supplemented 74
with purified cellulose-rich and lignin-free wheat fibre (Vitacel WF600, J. Rettenmeier and Söhne 75
Gmbh, Rosenberg, Germany), while AX-rich rye bran was used in the RB diet to replace purified 76
wheat fibre and part of the wheat flour (Table 1 and Table S1). The two dietary treatments were 77
balanced with regard to energy, starch, protein, fat and DF, but varied in DF composition. Both diets 78
were added with chromic oxide (Cr2O3), mixed in a feed production unit and cold-pressed into pellets. 79
Animals and handling 80
The animal experiment was performed in accordance with protocols approved by the Danish Animal 81
Experiments Inspectorate, Ministry of Food, Agriculture and Fisheries and in compliance with the 82
guidelines regarding to animal experiments and care of animals under study. Throughout the 83
experimental period, general health of the animals was monitored and no serious illness was observed. 84
Thirty Duroc × Danish Landrace × Yorkshire female pigs (body weight 72.5 ± 3.9 kg) purchased 85
from a local farmer and raised at Aarhus University, Department of Animal Science, Foulum, 86
Denmark were included in this study in two blocks for four consecutive weeks. All pigs were housed 87
individually and fed a standard swine diet during the first week followed by a wash-out period with 88
117
the Control diet for the second week, which aimed to adjust the baseline and to wash out the lignans 89
as required in our previous study(18). In the third and fourth week, 10 pigs continued with the Control 90
diet and 20 pigs switched to the RB diet. In the fourth week, 10 of the RB fed pigs (RB+) had daily 91
antibiotic injections Streptopenprokain Rosco Vet (Boehringer Ingelheim, Copenhagen, Denmark), 92
(benzylpenicillinprocain and dihydrosreptomycin) in connection with the morning meal, while other 93
10 pigs were left untreated (RB-)(18, 19). All pigs had ad libitum access to water and were fed manually 94
three times daily with equal meal size throughout the experimental period, at 9.00, 14.00 and 19.00 95
hours to mimic a typical human meal pattern. The total daily feed allowance for the pigs was 3% of 96
average body weight and adjusted every week based on body weight. 97
Slaughtering and sample collection 98
At the end of experiment, the pigs were anaesthetised with Zolitil mixture 3 h after the morning meal 99
as described before(18, 20). Blood samples from carotid artery were collected using heparinized 100
vacutainers by venipuncture, and the abdominal cavity was opened to collect blood samples from the 101
portal and hepatic veins(18). Immediately after, the pigs were euthanised and the entire gastrointestinal 102
tract was ligated at the esophagus and rectum, removed from the carcass. Both the small intestine and 103
colon were divided into three parts with equal length (from proximal to distal). The distal third of the 104
small intestine (SI3), caecum, proximal (Co1), mid (Co2) and distal colon (Co3) of pigs were tied off 105
and wet digesta were weighted and pH was measured. Blood samples were centrifuged for 12 min at 106
2000 g at 4°C and plasma were obtained and immediately frozen at -80°C for SCFA analysis. 107
Collected digesta were kept in a -80°C freezer for dry matter (DM) and carbohydrate analysis. 108
Samples of digesta (1-3 g) from SI3, caecum, Co1, Co2 and Co3 were collected for the analysis of 109
SCFA. 110
Analytical methods 111
All chemical analysis of the diets and digesta were performed in duplicate on freeze-dried material. 112
DM was determined by drying to constant weight at 103°C, and ash was analysed according to the 113
AOAC method no. 942.05(21). Nitrogen (N) was measured by Dumas(22) and protein was calculated 114
as N × 6.25. Gross energy was analysed on a 6300 Automatic Isoperibol Calorimeter system (Parr 115
Instruments) and fat determined using the Stoldt procedure(23). The dietary content of fructans and 116
sugars (glucose, fructose and sucrose) was determined as described previously(24). The content of 117
starch, low molecular weight (LMW) non-digestible carbohydrate (NDC) and NSP of diets and 118
digesta were measured as described by Bach Knudsen(9) and Kasprzak et al(25). Klason lignin of the 119

118
diets was measured as the sulfuric acid-insoluble residue as described previously(26). Chromic oxide 120
of diets and digesta was determined colorimetrically using the procedure described by Schürch et 121
al(27). 122
For the SCFA analysis, digesta and faecal samples were subjected to an acid–base treatment 123
followed by diethyl ether extraction and derivatisation as previously described(28), and SCFA 124
concentrations analysed by GC (HP-6890 Series Gas Chromatograph; Hewlett Packard) using an HP-125
5 column (30 m × 0.32 mm × 0.25 µm) and a flame ionisation detector(14). Plasma SCFA was 126
measured by GC as described by Brighenti(29) with 2-ethyl butyrate was used as an internal standard 127
instead of isovalerate(8). 128
Calculations 129
The apparent digestibility of nutrients and NSP in the digesta from intestinal segments were 130
calculated relative to Cr2O3 concentrations according to the following equation: 131
Digestibility of X = 1- Cr2O3(Diet) × X(Dig)
Cr2O3(Dig) × X(Diet) , (1)
where X(Diet) and X(Dig) are the concentrations of the macronutrients or NSP component 132
determined in the diets and digesta, respectively, and Cr2O3(Diet) and Cr2O3(Dig) are the Cr2O3 133
concentrations in the diets and digesta. 134
Mean transit time (MTT) in the intestinal segments was calculated by the following equation: 135
MTT = Cr2O3(Dig) × 24
Cr2O3(day) , (2) 136
where Cr2O3(Dig) and Cr2O3(day) is the Cr2O3 concentrations of digesta and Cr2O3 daily intake, 137
respectively. 138
The net absorption of SCFA into the portal vein was calculated by portal-arterial differences and 139
portal flow measurements using Fick’s principle(30) according to the following equation: 140
Q = (cp – ca)F, (3) 141
where cp and ca denotes the concentrations of SCFA in the portal vein and carotid artery, 142
respectively, and F is the plasma flow in the portal vein which was set as a fixed rate of 31.8 mL/kg 143
per min(31). The daily net absorption was calculated by multiplying the minute absorption by 1440 to 144
give 24 hours’ net absorption. 145
Hepatic extraction (HE) was determined as: 146
HE = (-) (1.00 × Ch) - (0.86 × Cp + 0.14 × Ca)
0.86 × Cp + 0.14 × Ca × 100, (4) 147

119
where ch is the SCFA concentration in hepatic vein and ca is the SCFA concentration in the hepatic 148
artery. The values 0.86 and 0.14 were used for the relative contributions of portal and hepatic arterial 149
plasma flow to hepatic venous plasma flow, respectively(32). 150
Total SCFA concentration was calculated as the sum of formic acid, acetic acid, propionic acid, 151
butyric acid, isobutyric acid, isovaleric acid and valeric acid concentrations, and BCFA concentration 152
was calculated as the sum of the isobutyric acid, isovaleric acid and isocaproic acid concentrations. 153
The pool size of SCFA and BCFA in the entire large intestine was calculated as the sum of the 154
concentrations of SCFA multiplied by the amount of wet digesta in each of the intestinal segments. 155
The SCFA distribution (%) in digesta was calculated as the concentration of the individual SCFA 156
divided by the total SCFA concentration in the digesta and multiplied by 100. 157
Statistical analysis 158
According to the power calculations for pool size of total and individual SCFA in the large 159
intestine(14), 10 pigs per group were demonstrated to give sufficient statistical power (α < 0.05; β > 160
0.80). Two types of analysis on data were conducted in the present study. The first type of analysis 161
was performed using the MIXED procedure of SAS (SAS Institute, Inc.) followed by a pairwise 162
comparison of groups adjusted by multiple comparisons of Tukey–Kramer post hoc test. The effects 163
of diet on the apparent digestibility of DM, macronutrients and NSP components, A:X ratio, and net 164
amount, MTT, pH value and SCFA profile of gut content and plasma SCFA concentrations were 165
analysed by the following mixed model: 166
Yijkl = μ + αi + βj + γk + (αγ)ik + vl + εijkl, (4)
where Yijkl is the dependent variable; μ is the overall mean; αi is the treatment (i = Control, RB+ 167
or RB-); βj is the random effect of block (l = 1 or 2); γk is the intestinal segment (k = SI3, caecum, 168
Co1, Co2 or Co3) or blood sampling site (k = portal vein, hepatic vein or carotid artery); (αγ)ik is the 169
interaction between diet and intestinal segment or blood sampling site; vl is the random component 170
related to the pig (m = 1, 2,…, 30). Pig was included as a random component to account for repeated 171
measurements within pigs. The covariance structure of repeated measurements was modelled using 172
autoregressive type and εijkl is the residual error. The random effect and residuals were assumed to be 173
normally distributed and independent, and their expectations were assumed to be zero. 174
The second type of analysis compared the effects of dietary treatments on ileal carbohydrate 175
composition, total net amount, total MTT and pool size of SCFA in the large intestine (caecum + 176
colon). The analysis was accomplished by using a simple ANOVA-based model: 177

120
Yij = μ + αi + βj + εij (5)
where Yij is the dependent variable, μ is the overall mean; αi is the fixed effect of treatment (i = 178
Control, RB+ or RB-); βj is the random effect of block (j = 1 or 2); εij is the residual error. Variables 179
with normal distribution were presented as least square means with standard error of the mean (SEM). 180
A log-transformation was performed for plasma propionate, butyrate and BCFA concentrations to 181
obtain variance homogeneity and results are presented as geometric means with 95% confidence 182
intervals. Level of significance was reported as being significant when P < 0.05. Pearson correlation 183
analyses between the SCFA absorption and plasma lipid concentration were performed by GraphPad 184
Prism 8.0 (GraphPad Software Inc.) using data from this study and our previous publication (Bolvig 185
et al. 2017, S1)(18). Heat map correlation analyses between caecal carbohydrates, SCFA and taxa were 186
performed by R Studio (R, Version 1.1.453) using Operational taxonomic unit (OTU) data from our 187
previous study(18). 188
RESULTS 189
Dietary composition and body weight 190
The two experimental diets were formulated to provide equal amounts of protein, fat, DF and energy 191
but different composition of DF, which was successfully achieved (Table 1). The RB diet contained 192
twice as much soluble NSP (25 vs. 13 g/kg) and total AX (86 vs. 37 g/kg) compared with the Control 193
diet, whereas the cellulose content was much lower (14 vs. 90 g/kg). AX and cellulose contributed 194
with 64% and 63 % of total NSP in RB and Control, respectively. The A:X ratio of total AX was 195
higher in RB (0.55 vs. 0.22) with lower A:X ratio of soluble AX (0.56 vs. 0.95) compared with the 196
Control. The amounts of fructans and lignin were 7.7 and 27 g/kg DM in RB, 0.4 and 19 g/kg DM in 197
Control, respectively. 198
The average body weight of pigs were 95.1 ± 2.8 kg at the end of the experiment with no significant 199
change between dietary treatments (P = 0.621, data not shown). 200
Carbohydrate composition of ileal digesta 201
For pigs fed the RB diet, the concentrations of NDC and insoluble NSP in ileal digesta were 202
significantly lower than for pigs fed the Control diet (P < 0.001), whereas the content of soluble NSP 203
was significantly higher (P < 0.001, Table 2). AX was the main contributor to the total NDC fraction 204
of digesta in the RB groups accounting for 60%, whereas cellulose was the main NDC fraction in 205
ileal digesta of pigs fed Control contributing with 63%. The LMW NDC content in ileal digesta 206
accounted for 7% and 14% of total NDC for the Control and RB diets, respectively, with a 207
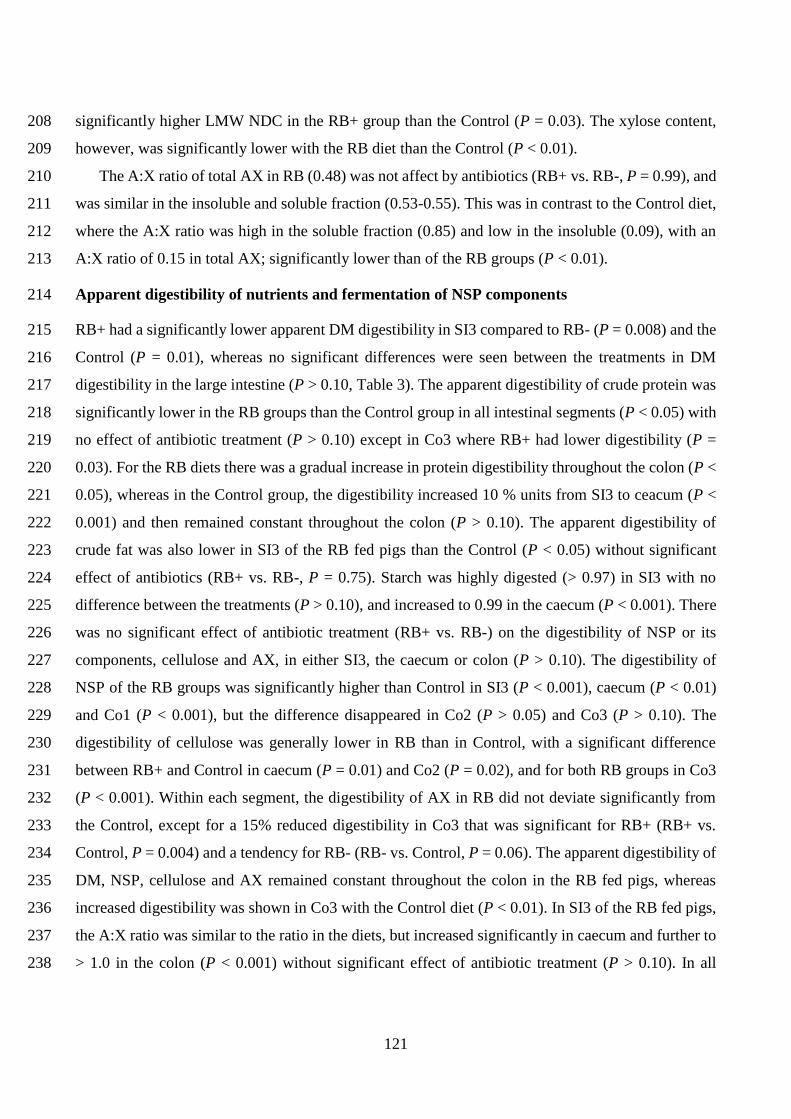
121
significantly higher LMW NDC in the RB+ group than the Control (P = 0.03). The xylose content, 208
however, was significantly lower with the RB diet than the Control (P < 0.01). 209
The A:X ratio of total AX in RB (0.48) was not affect by antibiotics (RB+ vs. RB-, P = 0.99), and 210
was similar in the insoluble and soluble fraction (0.53-0.55). This was in contrast to the Control diet, 211
where the A:X ratio was high in the soluble fraction (0.85) and low in the insoluble (0.09), with an 212
A:X ratio of 0.15 in total AX; significantly lower than of the RB groups (P < 0.01). 213
Apparent digestibility of nutrients and fermentation of NSP components 214
RB+ had a significantly lower apparent DM digestibility in SI3 compared to RB- (P = 0.008) and the 215
Control (P = 0.01), whereas no significant differences were seen between the treatments in DM 216
digestibility in the large intestine (P > 0.10, Table 3). The apparent digestibility of crude protein was 217
significantly lower in the RB groups than the Control group in all intestinal segments (P < 0.05) with 218
no effect of antibiotic treatment (P > 0.10) except in Co3 where RB+ had lower digestibility (P = 219
0.03). For the RB diets there was a gradual increase in protein digestibility throughout the colon (P < 220
0.05), whereas in the Control group, the digestibility increased 10 % units from SI3 to ceacum (P < 221
0.001) and then remained constant throughout the colon (P > 0.10). The apparent digestibility of 222
crude fat was also lower in SI3 of the RB fed pigs than the Control (P < 0.05) without significant 223
effect of antibiotics (RB+ vs. RB-, P = 0.75). Starch was highly digested (> 0.97) in SI3 with no 224
difference between the treatments (P > 0.10), and increased to 0.99 in the caecum (P < 0.001). There 225
was no significant effect of antibiotic treatment (RB+ vs. RB-) on the digestibility of NSP or its 226
components, cellulose and AX, in either SI3, the caecum or colon (P > 0.10). The digestibility of 227
NSP of the RB groups was significantly higher than Control in SI3 (P < 0.001), caecum (P < 0.01) 228
and Co1 (P < 0.001), but the difference disappeared in Co2 (P > 0.05) and Co3 (P > 0.10). The 229
digestibility of cellulose was generally lower in RB than in Control, with a significant difference 230
between RB+ and Control in caecum (P = 0.01) and Co2 (P = 0.02), and for both RB groups in Co3 231
(P < 0.001). Within each segment, the digestibility of AX in RB did not deviate significantly from 232
the Control, except for a 15% reduced digestibility in Co3 that was significant for RB+ (RB+ vs. 233
Control, P = 0.004) and a tendency for RB- (RB- vs. Control, P = 0.06). The apparent digestibility of 234
DM, NSP, cellulose and AX remained constant throughout the colon in the RB fed pigs, whereas 235
increased digestibility was shown in Co3 with the Control diet (P < 0.01). In SI3 of the RB fed pigs, 236
the A:X ratio was similar to the ratio in the diets, but increased significantly in caecum and further to 237
> 1.0 in the colon (P < 0.001) without significant effect of antibiotic treatment (P > 0.10). In all 238

122
segments, this was significantly different from the Control (P < 0.001), where the A:X ratio was < 239
0.2 and hardly changed along the large intestine (P > 0.10). 240
Intestinal bulk and mean transit time 241
The net amount of wet digesta in SI3, caecum, Co2 and Co3 was not affected by dietary treatments 242
(P > 0.10), and it did not differ between SI3 and caecum. The amount was significantly higher for the 243
Control than the RB diet in Co1 (P < 0.001), and significantly reduced from Co1 to the remaining 244
colon segments (P < 0.001, Fig. 1(A)). 245
The MTT was on average 2.8 h in SI3 for all treatments, while the total MTT in the entire large 246
intestine (caecum + colon) was 19 h for the RB groups and 23 h for the Control group (P < 0.01, Fig. 247
1(B)) with no effct of antibiotics (RB- vs. RB+, P = 0.99). The MTT of the RB+ group was 248
significantly lower in Co2 compared with the Control (P = 0.02) and both RB groups had a 249
significantly shorter MTT in Co3 (P < 0.01). The MTT in each segment increased gradually along 250
the length of the large intestine of the Control group (P < 0.01), whereas for RB groups the MTT was 251
about the same in the three colon segments (P > 0.10). 252
Intestinal pH and SCFA parameters 253
The pH dropped from SI3 to caecum for all treatments (P < 0.001) but with no difference between 254
treatments (P > 0.10, Fig. 2). In the colon, the RB groups deviated significantly from the Control (P 255
< 0.001) as pH increased along the colon (P < 0.01), whereas pH was not changed throughout the 256
colon for pigs fed the Control diet (P > 0.10). 257
The concentrations of individual and SCFA were affected differently by diets and antibiotic 258
treatment depending on sites of the gastrointestinal tract (Table 4). The concentrations of SCFA, 259
acetate and propionate in the RB fed pigs were significantly lower than the Control feed pigs (P < 260
0.05) without any effect of antibiotic treatment (RB+ vs. RB-, P > 0.10). Moreover, the concentrations 261
increased from SI3 to caecum for all treatments and did not change in the colon with the Control diet 262
but was reduced in the distal colon with the RB diet (P < 0.01). The RB diet significantly increased 263
butyrate concentrations in caecum compared with the Control diet (P < 0.01). Antibiotic treatment 264
significantly reduced the butyrate concentration (RB+ vs. RB-, P < 0.001). The highest butyrate 265
concentration was found in caecum of RB- which was reduced to half in Co3 (P < 0.001), whereas 266
for the Control, no significant change was seen throughout the colon (P > 0.10). In Co3 the butyrate 267
concentration was higher for the Control group than the RB groups (P < 0.001). RB feeding without 268
antibiotic treatment increased the concentration of BCFA compared to the Control diet in Co1 (P < 269
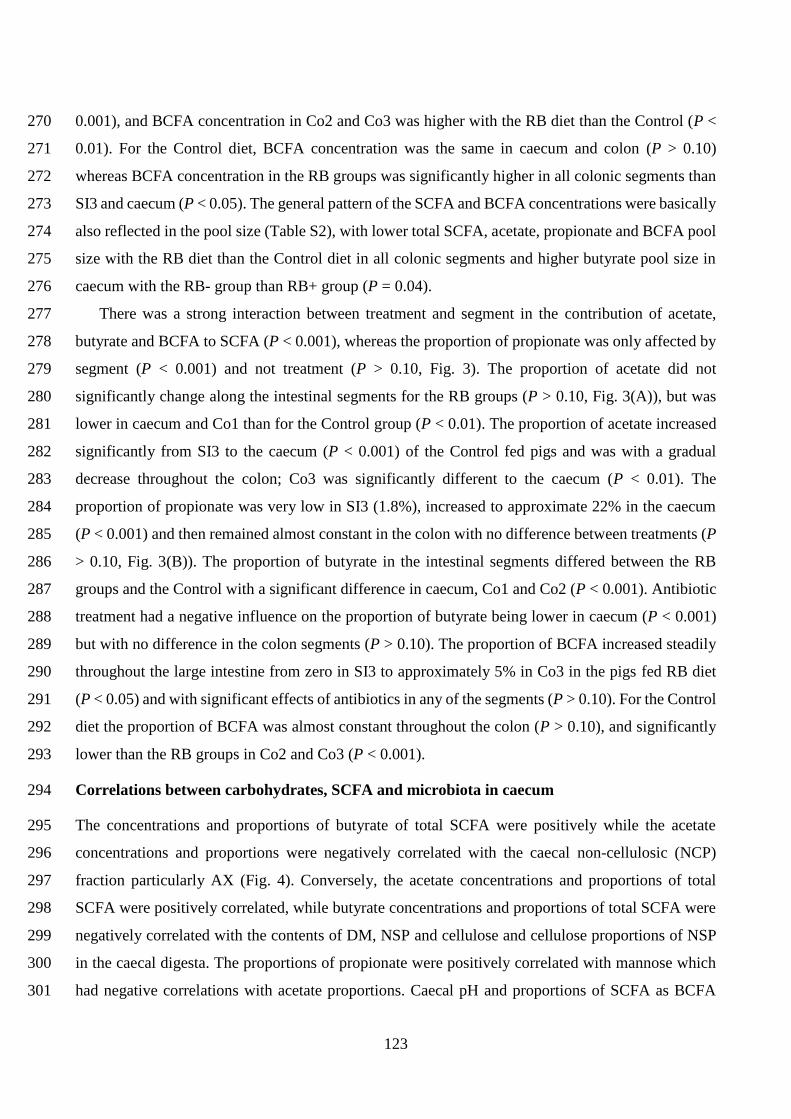
123
0.001), and BCFA concentration in Co2 and Co3 was higher with the RB diet than the Control (P < 270
0.01). For the Control diet, BCFA concentration was the same in caecum and colon (P > 0.10) 271
whereas BCFA concentration in the RB groups was significantly higher in all colonic segments than 272
SI3 and caecum (P < 0.05). The general pattern of the SCFA and BCFA concentrations were basically 273
also reflected in the pool size (Table S2), with lower total SCFA, acetate, propionate and BCFA pool 274
size with the RB diet than the Control diet in all colonic segments and higher butyrate pool size in 275
caecum with the RB- group than RB+ group (P = 0.04). 276
There was a strong interaction between treatment and segment in the contribution of acetate, 277
butyrate and BCFA to SCFA (P < 0.001), whereas the proportion of propionate was only affected by 278
segment (P < 0.001) and not treatment (P > 0.10, Fig. 3). The proportion of acetate did not 279
significantly change along the intestinal segments for the RB groups (P > 0.10, Fig. 3(A)), but was 280
lower in caecum and Co1 than for the Control group (P < 0.01). The proportion of acetate increased 281
significantly from SI3 to the caecum (P < 0.001) of the Control fed pigs and was with a gradual 282
decrease throughout the colon; Co3 was significantly different to the caecum (P < 0.01). The 283
proportion of propionate was very low in SI3 (1.8%), increased to approximate 22% in the caecum 284
(P < 0.001) and then remained almost constant in the colon with no difference between treatments (P 285
> 0.10, Fig. 3(B)). The proportion of butyrate in the intestinal segments differed between the RB 286
groups and the Control with a significant difference in caecum, Co1 and Co2 (P < 0.001). Antibiotic 287
treatment had a negative influence on the proportion of butyrate being lower in caecum (P < 0.001) 288
but with no difference in the colon segments (P > 0.10). The proportion of BCFA increased steadily 289
throughout the large intestine from zero in SI3 to approximately 5% in Co3 in the pigs fed RB diet 290
(P < 0.05) and with significant effects of antibiotics in any of the segments (P > 0.10). For the Control 291
diet the proportion of BCFA was almost constant throughout the colon (P > 0.10), and significantly 292
lower than the RB groups in Co2 and Co3 (P < 0.001). 293
Correlations between carbohydrates, SCFA and microbiota in caecum 294
The concentrations and proportions of butyrate of total SCFA were positively while the acetate 295
concentrations and proportions were negatively correlated with the caecal non-cellulosic (NCP) 296
fraction particularly AX (Fig. 4). Conversely, the acetate concentrations and proportions of total 297
SCFA were positively correlated, while butyrate concentrations and proportions of total SCFA were 298
negatively correlated with the contents of DM, NSP and cellulose and cellulose proportions of NSP 299
in the caecal digesta. The proportions of propionate were positively correlated with mannose which 300
had negative correlations with acetate proportions. Caecal pH and proportions of SCFA as BCFA 301
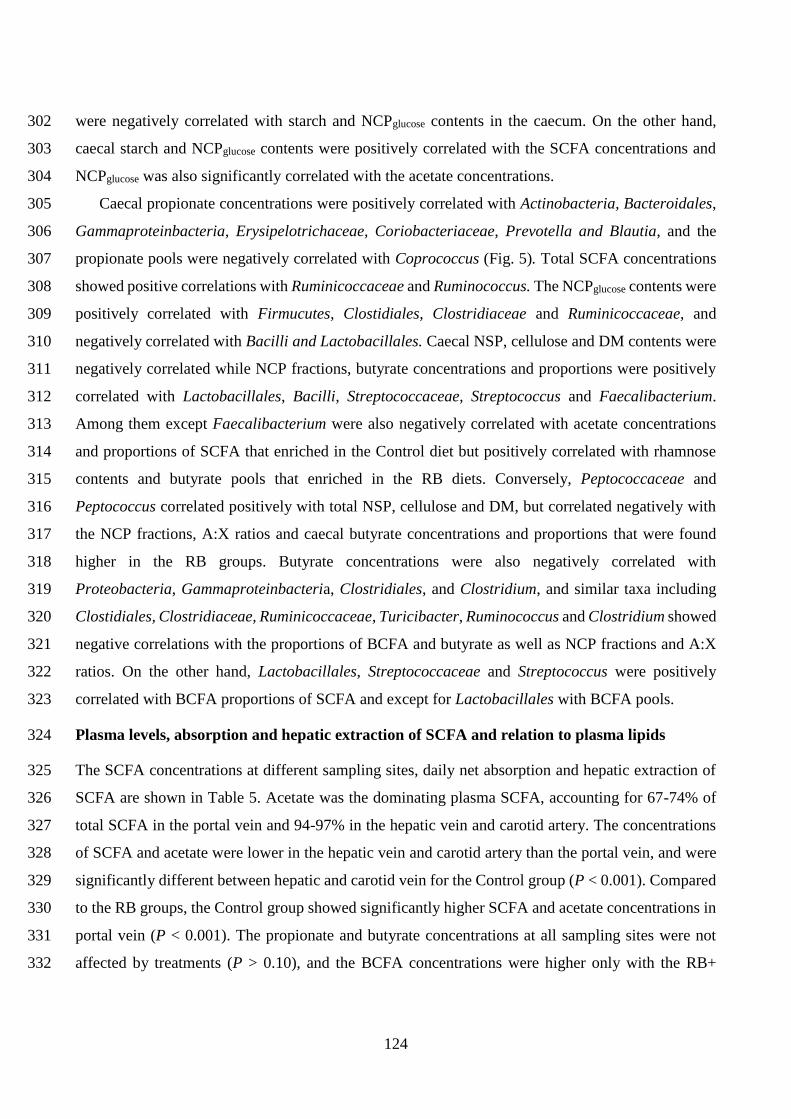
124
were negatively correlated with starch and NCPglucose contents in the caecum. On the other hand, 302
caecal starch and NCPglucose contents were positively correlated with the SCFA concentrations and 303
NCPglucose was also significantly correlated with the acetate concentrations. 304
Caecal propionate concentrations were positively correlated with Actinobacteria, Bacteroidales, 305
Gammaproteinbacteria, Erysipelotrichaceae, Coriobacteriaceae, Prevotella and Blautia, and the 306
propionate pools were negatively correlated with Coprococcus (Fig. 5). Total SCFA concentrations 307
showed positive correlations with Ruminicoccaceae and Ruminococcus. The NCPglucose contents were 308
positively correlated with Firmucutes, Clostidiales, Clostridiaceae and Ruminicoccaceae, and 309
negatively correlated with Bacilli and Lactobacillales. Caecal NSP, cellulose and DM contents were 310
negatively correlated while NCP fractions, butyrate concentrations and proportions were positively 311
correlated with Lactobacillales, Bacilli, Streptococcaceae, Streptococcus and Faecalibacterium. 312
Among them except Faecalibacterium were also negatively correlated with acetate concentrations 313
and proportions of SCFA that enriched in the Control diet but positively correlated with rhamnose 314
contents and butyrate pools that enriched in the RB diets. Conversely, Peptococcaceae and 315
Peptococcus correlated positively with total NSP, cellulose and DM, but correlated negatively with 316
the NCP fractions, A:X ratios and caecal butyrate concentrations and proportions that were found 317
higher in the RB groups. Butyrate concentrations were also negatively correlated with 318
Proteobacteria, Gammaproteinbacteria, Clostridiales, and Clostridium, and similar taxa including 319
Clostidiales, Clostridiaceae, Ruminicoccaceae, Turicibacter, Ruminococcus and Clostridium showed 320
negative correlations with the proportions of BCFA and butyrate as well as NCP fractions and A:X 321
ratios. On the other hand, Lactobacillales, Streptococcaceae and Streptococcus were positively 322
correlated with BCFA proportions of SCFA and except for Lactobacillales with BCFA pools. 323
Plasma levels, absorption and hepatic extraction of SCFA and relation to plasma lipids 324
The SCFA concentrations at different sampling sites, daily net absorption and hepatic extraction of 325
SCFA are shown in Table 5. Acetate was the dominating plasma SCFA, accounting for 67-74% of 326
total SCFA in the portal vein and 94-97% in the hepatic vein and carotid artery. The concentrations 327
of SCFA and acetate were lower in the hepatic vein and carotid artery than the portal vein, and were 328
significantly different between hepatic and carotid vein for the Control group (P < 0.001). Compared 329
to the RB groups, the Control group showed significantly higher SCFA and acetate concentrations in 330
portal vein (P < 0.001). The propionate and butyrate concentrations at all sampling sites were not 331
affected by treatments (P > 0.10), and the BCFA concentrations were higher only with the RB+ 332

125
compared with Control (P = 0.04). Overall, propionate, butyrate and BCFA concentrations were 333
highest in the portal vein, intermediate in the hepatic vein, and lowest in the carotid artery (P < 0.001). 334
The calculated daily absorption of SCFA and acetate was lower for RB diets compared to the 335
Control diet (P < 0.05), whereas the lower absorption of propionate was only significant in the RB- 336
group (P = 0.02). The absorption of butyrate and hepatic extraction of SCFA and BCFA was not 337
affected by treatments (P > 0.10). 338
Based on previously reported postprandial lipid levels of Bolvig et al.(18) we found a positively 339
correlated (r > 0.44, P < 0.05) between SCFA, acetate and propionate absorption and plasma 340
cholesterol and LDL concentrations (Fig. 6). The correlations of individual SCFA absorption and 341
triglyceride or HDL were insignificant as was the correlation between butyrate absorption and plasma 342
lipid levels (data not shown). 343
DISCUSSION 344
In the present study, the most noticeable difference between the two diets was the intended difference 345
in NSP composition; 64 % of NSP in the RB diet was in the form of soluble and insoluble AX, 346
whereas 63 % of NSP in the Control diet was cellulose deriving primarily from the added Vitacel 347
wheat fibre. The structure of AX was influenced by its origin being causative for the higher 348
substituted of AX in the RB diet than Control diet as indicated by the A:X ratios of rye bran and 349
Vitacel and also shown in other studies(2, 14). 350
The dietary difference in DF composition persisted in ileal digesta (SI3), where AX still 351
represented 63% of NSP in the RB groups and cellulose 69% in the Control group. The LMW 352
arabinose and xylose were released during passage of stomach and small intestine probably deriving 353
from the white wheat flour containing low amounts of arabinoxylan oligosaccharides (0.2%)(14). The 354
functional properties of AX are linked to the extent of substitution as reflected by A:X ratios (11) and 355
distribution of arabinose and ferulic acid along the xylan backbone(33, 34). For the RB groups, total AX 356
content in SI3 was distributed between soluble (21%) and insoluble (68%) fractions with similar A:X 357
ratios, which was almost unchanged compared to the diet. In the large intestine, the A:X ratio in RB 358
diets increased from SI3 to caecum and Co1 due to degradation of mostly unsubstituted AX. As a 359
consequence, the A:X ratio increased reflecting high resistance of highly substituted AX in rye(8, 12). 360
For the Control, the A:X ratio in diet was low in insoluble AX (0.09) and high in soluble AX (0.85) 361
which remained almost unchanged in ileal digesta. In the large intestine, however, the A:X ratio 362
decrease significantly between ileum and caecum and with hardly no change in the A:X ratio beyond 363
the caecum. This is most likely, caused by the AX in the wheat flour with higher A:X ratio being 364
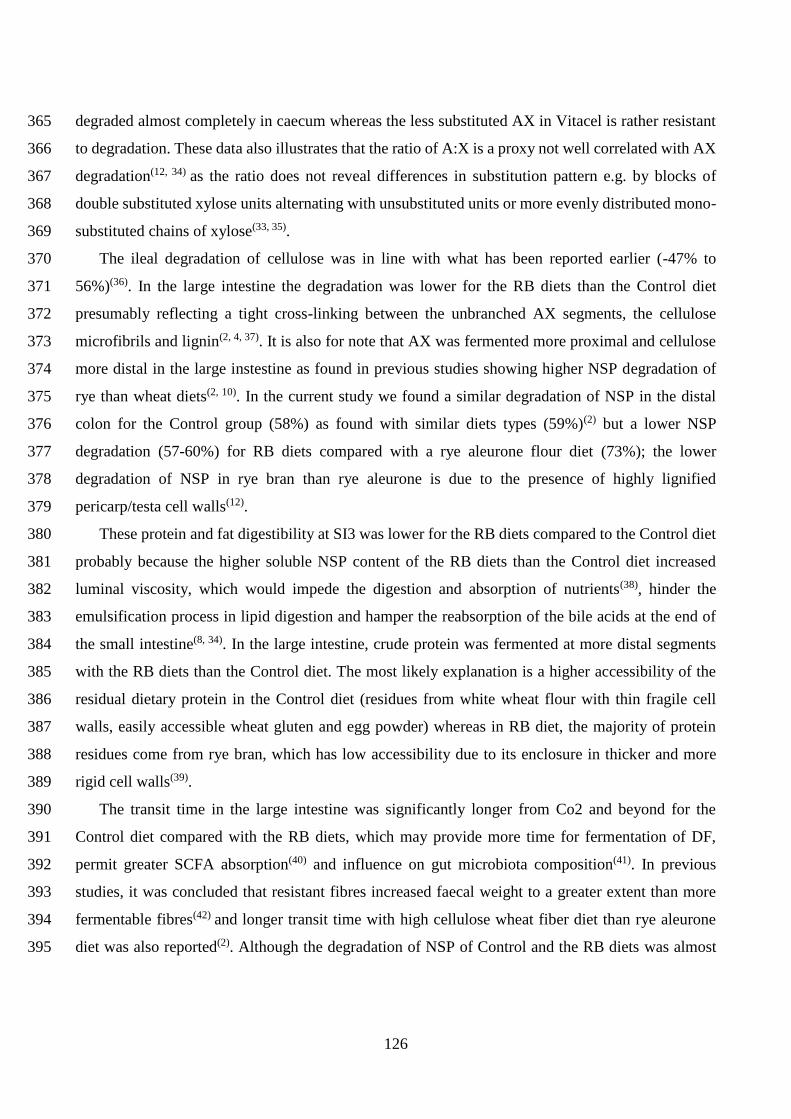
126
degraded almost completely in caecum whereas the less substituted AX in Vitacel is rather resistant 365
to degradation. These data also illustrates that the ratio of A:X is a proxy not well correlated with AX 366
degradation(12, 34) as the ratio does not reveal differences in substitution pattern e.g. by blocks of 367
double substituted xylose units alternating with unsubstituted units or more evenly distributed mono-368
substituted chains of xylose(33, 35). 369
The ileal degradation of cellulose was in line with what has been reported earlier (-47% to 370
56%)(36). In the large intestine the degradation was lower for the RB diets than the Control diet 371
presumably reflecting a tight cross-linking between the unbranched AX segments, the cellulose 372
microfibrils and lignin(2, 4, 37). It is also for note that AX was fermented more proximal and cellulose 373
more distal in the large instestine as found in previous studies showing higher NSP degradation of 374
rye than wheat diets(2, 10). In the current study we found a similar degradation of NSP in the distal 375
colon for the Control group (58%) as found with similar diets types (59%)(2) but a lower NSP 376
degradation (57-60%) for RB diets compared with a rye aleurone flour diet (73%); the lower 377
degradation of NSP in rye bran than rye aleurone is due to the presence of highly lignified 378
pericarp/testa cell walls(12). 379
These protein and fat digestibility at SI3 was lower for the RB diets compared to the Control diet 380
probably because the higher soluble NSP content of the RB diets than the Control diet increased 381
luminal viscosity, which would impede the digestion and absorption of nutrients(38), hinder the 382
emulsification process in lipid digestion and hamper the reabsorption of the bile acids at the end of 383
the small intestine(8, 34). In the large intestine, crude protein was fermented at more distal segments 384
with the RB diets than the Control diet. The most likely explanation is a higher accessibility of the 385
residual dietary protein in the Control diet (residues from white wheat flour with thin fragile cell 386
walls, easily accessible wheat gluten and egg powder) whereas in RB diet, the majority of protein 387
residues come from rye bran, which has low accessibility due to its enclosure in thicker and more 388
rigid cell walls(39). 389
The transit time in the large intestine was significantly longer from Co2 and beyond for the 390
Control diet compared with the RB diets, which may provide more time for fermentation of DF, 391
permit greater SCFA absorption(40) and influence on gut microbiota composition(41). In previous 392
studies, it was concluded that resistant fibres increased faecal weight to a greater extent than more 393
fermentable fibres(42) and longer transit time with high cellulose wheat fiber diet than rye aleurone 394
diet was also reported(2). Although the degradation of NSP of Control and the RB diets was almost 395

127
the same, the higher lignin content and coarser particles of rye bran were the most likely reason for 396
the difference. 397
In the large intestine, the concentrations of total SCFA in the RB groups were lower compared 398
with the Control group and with a gradual decrease throughout all segments of large intestine as also 399
reflected in the pH values. It has earlier been found that AX-rich rye diet induced higher pH values 400
in colon compared with cellulose-rich wheat diet although the SCFA concentrations in colon did not 401
show a significant difference between the two diets(2). We have also previously found that the pH is 402
lowest in the caecum because of high fermentation and rises because of DF depletion throughout the 403
colon with an AX-enriched diet(2). For the Control group, however, the pH profile and SCFA 404
concentration were distinctly different compared with the RB groups. There was also a good 405
agreement between taxa enrichment and SCFA and/or NSP fractions that were significantly altered 406
depending on dietary treatments. For instance, the concentrations and proportions of SCFA in the 407
form of acetate in the caecum were positively correlated with the cellulose contents and abundance 408
of some bacteria (Clostridiales, Ruminococcaceae and Clostridium) that were found in higher 409
abundance with the Control diet(18). The concentrations and proportions of butyrate were positively 410
correlated with features of AX that has been found previously to stimulate butyrate production(14, 34). 411
In line with that, butyrate production and AX fractions in the caecum were positively correlated with 412
the taxa that were significantly enriched in the RB- group (Lactobacillales, Streptococcus and Bacilli) 413
but not in the RB+ group in the prior paper(18), indicating that antibiotic treatment affected butyrate 414
production by affecting the microbiota composition. This was also found by a previous study which 415
demonstrated that antibiotics induced depletion of anaerobic butyrate-producing bacteria, therefore 416
reduced butyrate levels, and was a risk factor for pathogen expansion in mice(43). Although 417
intramuscular injection instead of oral administration of antibiotics was performed in this study, we 418
found antibiotic metabolism also occurred in the gut(18). These observations confirmed our hypothesis 419
that the beneficial effects of AX on intestinal butyrate production would be negatively affected by 420
the use of antibiotics. Overall, the fermentation patterns were in line with earlier findings 421
demonstrating that high loads of cellulose resulted in stimulation of cellulytic bacteria and acetate 422
production(44) whereas fermentation of AX stimulated production of butyrate(10). Cross-feeding from 423
acetate to butyrate(45) probably also occurred, as the bacteria that were positively correlated with 424
butyrate proportions were negatively correlated with acetate proportions. Together with AX in the 425
RB diet, fucose, galactose and rhamnose showed important associations with butyrate production in 426
this study, which has also been found in previous studies(46, 47). 427

128
Although the main substrates for SCFA production in the large intestine are various forms of 428
exogenous carbohydrates, proteins, as well as endogenous sources also contribute(48). The higher 429
concentration and proportion of BCFA in the colon of pigs fed the RB diet compared to the Control 430
diet is well in line with the lower ileal to rectal disappearance of protein. This result confirms previous 431
results showing that consumption of an AX-enriched wheat bran diet increased the portal 432
concentration and flux of BCFA(8) as more protein reached the large intestine compared with a low 433
DF control diet (14). 434
The SCFA concentrations in artery, portal vein and hepatic vein reflect SCFA enrichment from 435
artery to portal vein because of SCFA production in the gut and hepatic clearance from portal vein to 436
hepatic vein(8). Not only the SCFA production in the gut, but also absorbed SCFA is dependent on 437
the fermentation substrate and colonic transit time(49). This is reflected by the higher acetate and 438
SCFA concentrations and productions in the large intestine and higher portal concentration and net 439
absorption when consuming the Control diet compared with the RB diets. The same trend was seen 440
in the hepatic vein and carotid artery although not statistically significant. The differences in SCFA 441
profile between the gut content, portal, hepatic and arterial plasma levels are a result of the different 442
SCFA being metabolised to different degrees at different sites; butyrate in colonocytes and liver, 443
propionate as gluconeogenic substrate primarily in the liver and acetate as substrate for the synthesis 444
of cholesterol in liver and triglycerides in adipose tissue(5). Hence, acetate was the major SCFA found 445
in peripheral circulation with concentrations of several hundred µM while the concentration of 446
propionate and butyrate are very low (below 15 µM)(50). The hepatic extraction of SCFA was not 447
affected by either diets or antibiotics. A constant hepatic extraction of metabolites irrespective of 448
dietary treatment has previously been reported, which was regarded as mass action driven(8). Studies 449
using catheterized pigs have shown that the fermentation of AX is associated with a net absorption 450
of butyrate(8, 10), which has been associated with improved insulin sensitivity in peripheral tissue(8, 51). 451
In contrast, the current study did not find elevated butyrate absorption or concentration in the blood 452
with the RB diet. This may suggest that the enhanced gut production of butyrate has direct effects on 453
the colonocytes as it is the primary energy source for epithelial cells(52) and after hepatic extraction 454
significant differences in the systemic circulation is hard to detect. Acetate has been reported as the 455
primary substrate for cholesterol synthesis(5), and pigs fed the Control diet showed not only increased 456
acetate absorption but also higher plasma concentrations of cholesterol and LDL compared with the 457
RB groups(18). As indicated by the Pearson correlations, increased total SCFA, acetate as well as 458
propionate absorption was associated with higher circulating cholesterol and LDL concentrations, 459
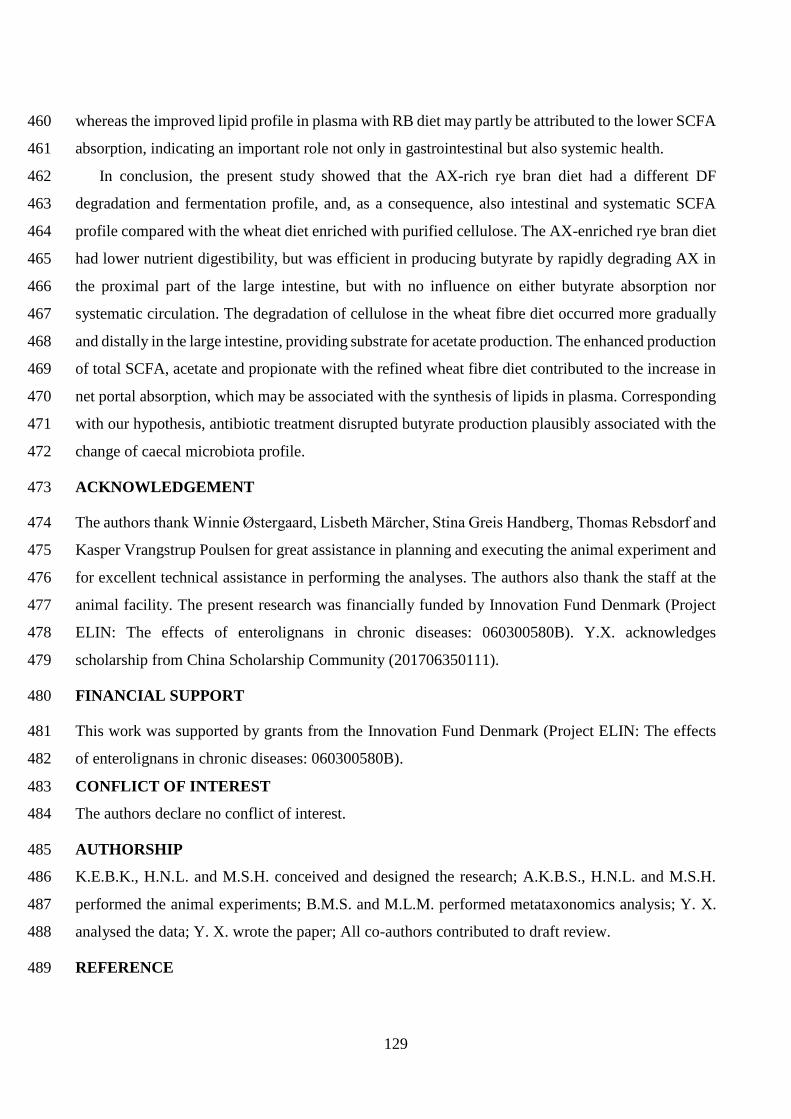
129
whereas the improved lipid profile in plasma with RB diet may partly be attributed to the lower SCFA 460
absorption, indicating an important role not only in gastrointestinal but also systemic health. 461
In conclusion, the present study showed that the AX-rich rye bran diet had a different DF 462
degradation and fermentation profile, and, as a consequence, also intestinal and systematic SCFA 463
profile compared with the wheat diet enriched with purified cellulose. The AX-enriched rye bran diet 464
had lower nutrient digestibility, but was efficient in producing butyrate by rapidly degrading AX in 465
the proximal part of the large intestine, but with no influence on either butyrate absorption nor 466
systematic circulation. The degradation of cellulose in the wheat fibre diet occurred more gradually 467
and distally in the large intestine, providing substrate for acetate production. The enhanced production 468
of total SCFA, acetate and propionate with the refined wheat fibre diet contributed to the increase in 469
net portal absorption, which may be associated with the synthesis of lipids in plasma. Corresponding 470
with our hypothesis, antibiotic treatment disrupted butyrate production plausibly associated with the 471
change of caecal microbiota profile. 472
ACKNOWLEDGEMENT 473
The authors thank Winnie Østergaard, Lisbeth Mӓrcher, Stina Greis Handberg, Thomas Rebsdorf and 474
Kasper Vrangstrup Poulsen for great assistance in planning and executing the animal experiment and 475
for excellent technical assistance in performing the analyses. The authors also thank the staff at the 476
animal facility. The present research was financially funded by Innovation Fund Denmark (Project 477
ELIN: The effects of enterolignans in chronic diseases: 060300580B). Y.X. acknowledges 478
scholarship from China Scholarship Community (201706350111). 479
FINANCIAL SUPPORT 480
This work was supported by grants from the Innovation Fund Denmark (Project ELIN: The effects 481
of enterolignans in chronic diseases: 060300580B). 482
CONFLICT OF INTEREST 483
The authors declare no conflict of interest. 484
AUTHORSHIP 485
K.E.B.K., H.N.L. and M.S.H. conceived and designed the research; A.K.B.S., H.N.L. and M.S.H. 486
performed the animal experiments; B.M.S. and M.L.M. performed metataxonomics analysis; Y. X. 487
analysed the data; Y. X. wrote the paper; All co-authors contributed to draft review. 488
REFERENCE 489

130
1. Ludwig DS, Pereira MA, Kroenke CH et al. (1999) Dietary fiber, weight gain, and cardiovascular 490
disease risk factors in young adults. Jama 282(16), 1539-1546. 491
2. Le Gall M, Serena A, Jorgensen H et al. (2009) The role of whole-wheat grain and wheat and rye 492
ingredients on the digestion and fermentation processes in the gut--a model experiment with pigs. 493
Br J Nutr 102(11), 1590-1600. 494
3. Ellis PR, Roberts FG, Low AG et al. (1995) The effect of high-molecular-weight guar gum on net 495
apparent glucose absorption and net apparent insulin and gastric inhibitory polypeptide production 496
in the growing pig: relationship to rheological changes in jejunal digesta. Br J Nutr 74(4), 539-497
556. 498
4. Glitsø LV, Brunsgaard G, Højsgaard S et al. (1998) Intestinal degradation in pigs of rye dietary 499
fibre with different structural characteristics. Br J Nutr 80(5), 457-468. 500
5. den Besten G, van Eunen K, Groen AK et al. (2013) The role of short-chain fatty acids in the 501
interplay between diet, gut microbiota, and host energy metabolism. J Lipid Res 54(9), 2325-2340. 502
6. Bach Knudsen KE, Laerke HN, Hedemann MS et al. (2018) Impact of Diet-Modulated Butyrate 503
Production on Intestinal Barrier Function and Inflammation. Nutrients 10(10). 504
7. Ferchaud-Roucher V, Pouteau E, Piloquet H et al. (2005) Colonic fermentation from lactulose 505
inhibits lipolysis in overweight subjects. Am J Physiol Endocrinol Metab 289(4), E716-720. 506
8. Ingerslev AK, Theil PK, Hedemann MS et al. (2014) Resistant starch and arabinoxylan augment 507
SCFA absorption, but affect postprandial glucose and insulin responses differently. Br J Nutr 508
111(9), 1564-1576. 509
9. Bach Knudsen KE (1997) Carbohydrate and lignin contents of plant materials used in animal 510
feeding. Anim Feed Sci Technol 67, 319-338. 511
10.Bach Knudsen KE, Serena A, Bjørnbak Kjær AK et al. (2005) Rye Bread Enhances the Production 512
and Plasma Concentration of Butyrate but Not the Plasma Concentrations of Glucose and Insulin 513
in Pigs1. J Nutr 135(7), 1696–1704. 514
11.Izydorczyk MS & Biliaderi CG (1995) Cereal arabinoxylans: advances in structure and 515
physicochemical properties. Carbohydr Polym 28, 33-48. 516
12.Glitsø LV, Gruppen H, Schols HA et al. (1999) Degradation of rye arabinoxylans in the large 517
intestine of pigs. J Sci Food Agr 79, 961-969. 518
13.Bach Knudsen KE (2015) Microbial degradation of whole-grain complex carbohydrates and 519
impact on short-chain fatty acids and health. Adv Nutr 6(2), 206-213. 520
14.Nielsen TS, Laerke HN, Theil PK et al. (2014) Diets high in resistant starch and arabinoxylan 521
modulate digestion processes and SCFA pool size in the large intestine and faecal microbial 522
composition in pigs. Br J Nutr 112(11),1837-1849. 523
15.Wlodarska M, Willing B, Keeney KM et al. (2011) Antibiotic treatment alters the colonic mucus 524
layer and predisposes the host to exacerbated Citrobacter rodentium-induced colitis. Infect Immun 525
79(4), 1536-1545. 526
16.Guinan J, Wang S, Hazbun TR et al. (2019) Antibiotic-induced decreases in the levels of 527
microbial-derived short-chain fatty acids correlate with increased gastrointestinal colonization of 528
Candida albicans. Sci Rep 9(1), 8872. 529
17.Bolvig AK, Kyrø C, Nørskov NP et al. (2016) Use of antibiotics is associated with lower 530
enterolactone plasma concentration. Mol Nutr Food Res 60(12), 2712-2721. 531
18.Bolvig AK, Norskov NP, Hedemann MS et al. (2017) Effect of Antibiotics and Diet on 532
Enterolactone Concentration and Metabolome Studied by Targeted and Nontargeted LC-MS 533
Metabolomics. J Proteome Res 16(6), 2135-2150. 534
19.Bolvig AK, Adlercreutz H, Theil PK et al. Absorption of plant lignans from cereals in an 535
experimental pig model. Br J Nutr 115(10), 1711-1720. 536

131
20.Laerke HN, Mortensen MA, Hedemann MS et al.(2009) Quantitative aspects of the metabolism 537
of lignans in pigs fed fibre-enriched rye and wheat bread. Br J Nutr 102(7), 985-994. 538
21.Association of Official Analytical Chemists (2000) AOAC Official Methods of Analysis of 539
AOAC International, 17th ed. Gaithersburg, MD: AOAC International. 540
22.Hansen B (1989) Determination of Nitrogen as Elementary N, an Alternative to Kjeldahl. Acta 541
Agriculturae Scandinavica 39(2),113-118. 542
23.Stoldt W (1952) Vorschlag zur Vereinheitlichung der Fettbestimmung in Lebensmitteln 543
(Suggestion to standardise the determination of fat in foodstuffs). Fette und Seifen 54(4), 206-207. 544
24.Larsson K & Bengtsson S (1983) Bestlmning av llttilgingeliga kolhydrater i vsxtmaterial 545
(Determination of readily available carbohydrates in plant material). Methods report No. 22. 546
National Laboratory of Agricultural Chemistry, Uppsala. 547
25.Kasprzak MM, Laerke HN & Knudsen KE (2012) Effects of isolated and complex dietary fiber 548
matrices in breads on carbohydrate digestibility and physicochemical properties of ileal effluent 549
from pigs. J Agric Food Chem 60(51), 12469-12476. 550
26.Bach Knudsen KE (1997) Carbohydrate and lignin contents of plant materials used in animal 551
feeding. Anim Feed Sci Technol 67, 319-338. 552
27.Schürch AF, Lloyd LE & Crampton EW (1950) The use of chromic oxide as an index for 553
determining the digestibility of a diet. J Nutr 41(4), 629-636. 554
28.Jensen MT, Cox RP, Jensen BB (1995) Microbial production of skatole in the hind gut of pigs 555
given different diets and its relation to skatole deposition in backfat. Anim Sci 61, 293-304. 556
29.Brighenti F (1998) Summary of the conclusion of the working group on Profibre interlaboratory 557
study on determination of short chain fatty acids in blood. In: Functional Properties of Non-558
digestible Carbohydrates, pp. 150-153. F Gullion R Amadò, M T Amaral-Collaco, H Andersson, 559
N G Asp, K E Bach Knudsen, M Champ, J Mathers, J A Robertson, I Rowland, and J Van Loo, 560
editors. Brussels: European Commission, DG XII, Science, Research and Development, 150–153. 561
30.Rerat AA, Vaissade P & Vaugelade P (1984) Absorption kinetics of some carbohydrates in 562
conscious pigs. 2. Quantitative aspects. Br J Nutr 51(3), 517-529. 563
31.Bach Knudsen KE, Serena A, Jørgensen H et al. (2007) Rye and other natural cereal fibres enhance 564
the production and plasma concentrations of enterolactone and butyrate. Dietary fibre components 565
and functions. Wageningen Academic Publishers, 219-233. 566
32.Kristensen NB, Norgaard JV, Wamberg S et al. (2009) Absorption and metabolism of benzoic 567
acid in growing pigs. J Anim Sci 87(9), 2815-2822. 568
33.Verwimp T, Craeyveld VC, Courtin CM et al. (2007) Variability in the Structure of Rye Flour 569
Alkali-Extractable Arabinoxylans. J Agric Food Chem 55(5), 1985-1992. 570
34.Lærke HN & Bach Knudsen KE (2010) Rye Arabinoxylans: Molecular Structure, 571
Physicochemical Properties and Physiological Effects in the Gastrointestinal Tract. Cereal Chem 572
87, 353-362. 573
35.Cleemput G, van Oort M, Hessing M et al. (1995) Variation in the Degree of D-Xylose 574
Substitution in Arabinoxylans Extracted from a European Wheat Flour. J Cereal Sci 22, 73-84. 575
36.Bach Knudsen KE, Lærke HN & Jørgensen H (2008) The Role of Fibre in Nutrient Utilization 576
and Animal Health. Proceedings of the 29th Western Nutrition Conference. 93. 577
37.Gibeaut NC & Gibeaut DM (1993) Structural models of primary cell walls in flowering plants: 578
consistency of molecular structure with the physical properties of the walls during growth. Plant 579
J 3(1), 1-30. 580
38.Lærke HN, Pedersen C, Mortensen MA et al. (2008) Rye bread reduces plasma cholesterol levels 581
in hypercholesterolaemic pigs when compared to wheat at similar dietary fibre level. J Sci Food 582
Agri 88(8), 1385-1393. 583
132
39.Fardet A (2010) New hypotheses for the health-protective mechanisms of whole-grain cereals: 584
what is beyond fibre? Nutr Res Rev 23(1), 65-134. 585
40.Tannock GW & Liu Y (2019) Guided dietary fibre intake as a means of directing short-chain fatty 586
acid production by the gut microbiota. J Roy Soc New Zeal 1-22. 587
41.Müller M, Canfora EE & Blaak EE (2018) Gastrointestinal Transit Time, Glucose Homeostasis 588
and Metabolic Health: Modulation by Dietary Fibers. Nutrients 10(3). 589
42.de Vries J, Birkett A, Hulshof T et al. (2016) Effects of Cereal, Fruit and Vegetable Fibers on 590
Human Fecal Weight and Transit Time: A Comprehensive Review of Intervention Trials. 591
Nutrients 8(3),130. 592
43.Rivera-Chavez F, Zhang LF, Faber F et al. (2016) Depletion of Butyrate-Producing Clostridia 593
from the Gut Microbiota Drives an Aerobic Luminal Expansion of Salmonella. Cell Host Microbe 594
19(4), 443-454. 595
44.Zhao J, Bai Y, Tao S et al. (2019) Fiber-rich foods affected gut bacterial community and short-596
chain fatty acids production in pig model. J Funct Foods 57, 266-274. 597
45.den Besten G, Lange K, Havinga R et al. (2013) Gut-derived short-chain fatty acids are vividly 598
assimilated into host carbohydrates and lipids. Am J Physiol Gastrointest Liver Physiol 305(12), 599
G900-910. 600
46.Pickard JM & Chervonsky AV (2015) Intestinal fucose as a mediator of host-microbe symbiosis. 601
J Immunol 194(12), 5588-5593. 602
47.Fernández J, Redondo-Blanco S, M. Miguélez E et al.(2015) Healthy effects of prebiotics and 603
their metabolites against intestinal diseases and colorectal cancer. AIMS Microbiol 1(1), 48-71. 604
48.Bach Knudsen KE, Jørgensen H & Canibe N (2000) Quantification of the absorption of nutrients 605
derived from carbohydrate assimilation: model experiment with catheterised pigs fed on wheat- or 606
oat-based rolls. Br J Nutr 84(4), 449-458. 607
49.Wong JMW, de Souza R, Kendall CWC et al. (2006) Colonic Health: Fermentation and Short 608
Chain Fatty Acids. J Clin Gastroenterol 40, 235–243. 609
50.Jakobsdottir G, Jadert C, Holm L et al. (2013) Propionic and butyric acids, formed in the caecum 610
of rats fed highly fermentable dietary fibre, are reflected in portal and aortic serum. Br J Nutr 611
110(9), 1565-1572. 612
51.Nilsson AC, Ostman EM, Knudsen KE et al. (2010) A cereal-based evening meal rich in 613
indigestible carbohydrates increases plasma butyrate the next morning. J Nutr 140(11), 1932-1936. 614
52. Venegas DP, De la Fuente MK, Landskron G et al. (2019) Short Chain Fatty Acids (SCFAs)-615
Mediated Gut Epithelial and Immune Regulation and Its Relevance for Inflammatory Bowel 616
Diseases. Front Immunol 10, 277. 617
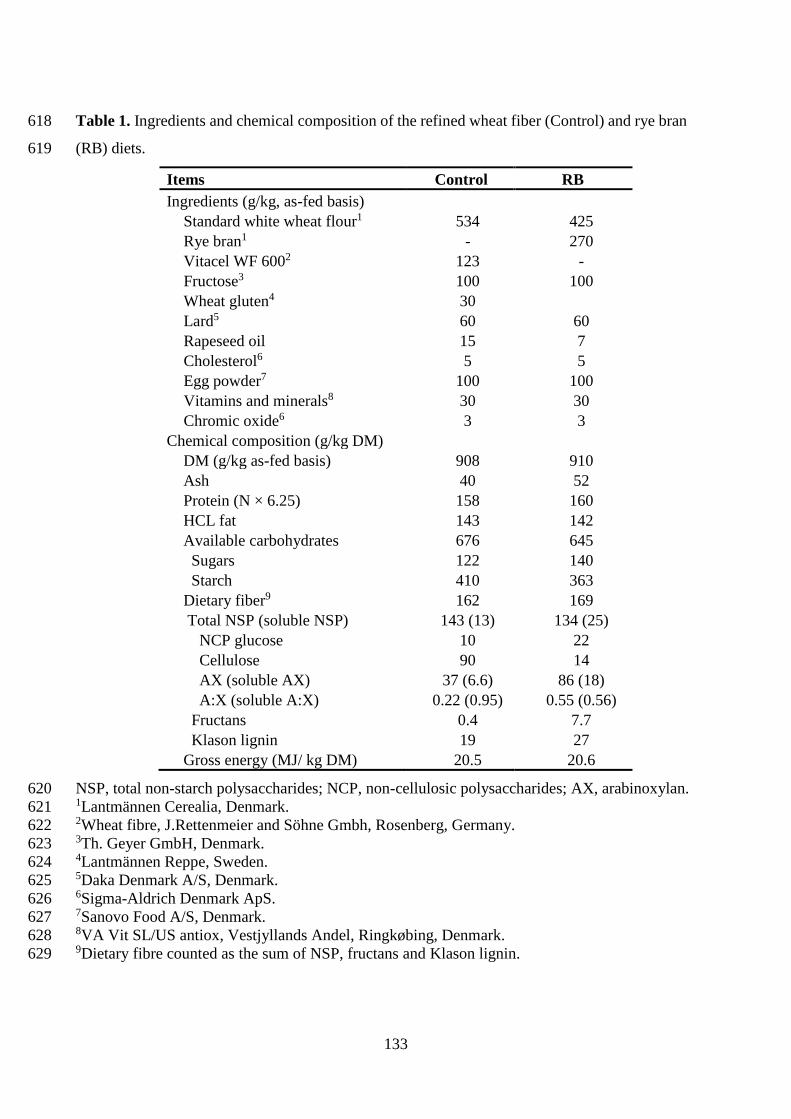
133
Table 1. Ingredients and chemical composition of the refined wheat fiber (Control) and rye bran 618
(RB) diets. 619
Items Control RB
Ingredients (g/kg, as-fed basis)
Standard white wheat flour1 534 425
Rye bran1 - 270
Vitacel WF 6002 123 -
Fructose3 100 100
Wheat gluten4 30
Lard5 60 60
Rapeseed oil 15 7
Cholesterol6 5 5
Egg powder7 100 100
Vitamins and minerals8 30 30
Chromic oxide6 3 3
Chemical composition (g/kg DM)
DM (g/kg as-fed basis) 908 910
Ash 40 52
Protein (N × 6.25) 158 160
HCL fat 143 142
Available carbohydrates 676 645
Sugars 122 140
Starch 410 363
Dietary fiber9 162 169
Total NSP (soluble NSP) 143 (13) 134 (25)
NCP glucose 10 22
Cellulose 90 14
AX (soluble AX) 37 (6.6) 86 (18)
A:X (soluble A:X) 0.22 (0.95) 0.55 (0.56)
Fructans 0.4 7.7
Klason lignin 19 27
Gross energy (MJ/ kg DM) 20.5 20.6
NSP, total non-starch polysaccharides; NCP, non-cellulosic polysaccharides; AX, arabinoxylan. 620 1Lantmännen Cerealia, Denmark. 621 2Wheat fibre, J.Rettenmeier and Söhne Gmbh, Rosenberg, Germany. 622 3Th. Geyer GmbH, Denmark. 623 4Lantmännen Reppe, Sweden. 624 5Daka Denmark A/S, Denmark. 625 6Sigma-Aldrich Denmark ApS. 626 7Sanovo Food A/S, Denmark. 627 8VA Vit SL/US antiox, Vestjyllands Andel, Ringkøbing, Denmark. 628 9Dietary fibre counted as the sum of NSP, fructans and Klason lignin. 629

134
Table 2. Carbohydrate composition of ileal digesta of pigs fed with refined wheat fiber diet (Control), 630
rye bran diet with (RB+) and without antibiotic treatment (RB-). 631
% of DM Diet
SEM P-value Control RB- RB+
Total NDC 60a 45b 44b 0.92 <0.001
AX 15b 27a 26a 0.90 <0.001
A:X 0.15b 0.48a 0.48a 0.01 <0.001
Soluble NSP 4.1b 9.3a 8.4a 0.68 <0.001
AX 2.0b 5.9a 5.3a 0.38 <0.001
A:X 0.85a 0.55b 0.55b 0.04 <0.001
NCP glucose 1.0b 2.0a 1.7ab 0.22 0.016
Insoluble NSP 50a 29b 29b 0.99 <0.001
AX 8.9b 18a 18a 0.58 <0.001
A:X 0.09b 0.53a 0.53a 0.02 <0.001
NCP glucose 2.9b 4.3a 3.8ab 0.42 0.015
Cellulose 38a 5.0b 4.5b 0.61 <0.001
LMW NDC 4.2b 6.2ab 6.6a 1.2 0.028
Arabinose 0.41 0.30 0.06 0.30 0.406
Xylose 4.1a 2.8b 1.9b 0.33 <0.001
DM, dry matter; NDC, non-digestible carbohydrate; AX, arabinoxylan; NSP, non-starch 632
polysaccharides; NCP, non-cellulosic polysaccharides; LMW: low molecular weight. 633
Data were expressed as means with standard error of means (SEM) and n = 10 per group. Mean values 634
within a row with unlike superscript letters were significantly different between the treatments (P < 635
0.05).636

135
Table 3. Digestibility of dry matter (DM), nutrients and non-starch polysaccharides (NSP) 637
components and arabinose:xylose (A:X) ratios in the different intestinal segments of pigs fed with 638
refined wheat fiber diet (Control), rye bran diet with (RB+) and without antibiotic treatment (RB-). 639
Item Segment
Diet
SEM
P-value
Control RB- RB+ Diet Segment Diet ×
Segment
DM SI3 0.68f 0.69f 0.65g 0.007 0.004 <0.001 <0.001 Caecum 0.79de 0.76e 0.77e Co1 0.82cd 0.82bcd 0.81cd Co2 0.85ab 0.83ab 0.82bcd Co3 0.86a 0.84b 0.83abc
Protein SI3 0.76ef 0.71gh 0.69h 0.009 <0.001 <0.001 <0.001
Caecum 0.86ab 0.73fg 0.74fg
Co1 0.87ab 0.79de 0.78de
Co2 0.87a 0.81cd 0.80cde
Co3 0.87a 0.84abc 0.83bc
Fat SI3 0.84a 0.78b 0.77b 0.015 0.004 - -
Starch SI3 0.98 0.97 0.98 0.002 0.815 <0.001 0.542
Caecum 0.99 0.99 0.99
Total NSP SI3 -0.15g 0.11ef 0.04f 0.03 <0.001 <0.001 <0.001
Caecum 0.25e 0.44bcd 0.42cd
Co1 0.36d 0.60a 0.59a
Co2 0.47abc 0.60a 0.57ab
Co3 0.58a 0.60a 0.57ab
Cellulose SI3 -0.27g -0.09defg -0.11defg 0.07 <0.001 <0.001 <0.001 Caecum 0.13cde -0.11efg -0.14fg
Co1 0.25bc 0.15bc 0.13cde
Co2 0.38ab 0.16bc 0.12cde
Co3 0.51a 0.14bcd 0.05cdef
AX SI3 0.11f 0.14f 0.04f 0.03 0.030 <0.001 0.010
Caecum 0.50cde 0.49de 0.47e
Co1 0.60bcd 0.63ab 0.63bc
Co2 0.67ab 0.63ab 0.61bc
Co3 0.75a 0.63abc 0.60bcd
A:X ratio SI3 0.17f 0.53e 0.53e 0.02 <0.001 <0.001 <0.001
Caecum 0.10g 0.84d 0.78d
Co1 0.10fg 1.02bc 1.00c
Co2 0.12fg 1.08abc 1.06abc Co3 0.14fg 1.09a 1.08ab
SI3, distal one-third of the small intestine; Co1, proximal one-third of the colon; Co2, mid one-third 640
of the colon; Co3, distal one-third of the colon; AX, arabinoxylan. 641
Data were expressed as means with standard error of means (SEM) and n = 10 per group. Mean values 642
within a row with unlike superscript letters were significantly different (P < 0.05).643

136
Table 4. Concentrations of total, individual short chain fatty acids (SCFA) and total branched chain 644
fatty acids (BCFA) in different intestinal segments of pigs fed with refined wheat fiber diet (Control), 645
rye bran diet with (RB+) and without antibiotic treatment (RB-). 646
Item Segment
Diet
SEM
P-value
Control RB- RB+ Diet Segment Diet ×
Segment
Concentration (mmol/kg)
SCFA SI3 29f 42ef 30f 5.5 <0.001 <0.001 <0.001
Caecum 132ab 115bc 115bc
Co1 145a 106bcd 102cd
Co2 130ab 86de 83de
Co3 144a 72e 70e
Acetate SI3 17f 26ef 19f 3.4 <0.001 <0.001 <0.001 Caecum 94a 64bc 66b
Co1 98a 61bc 60bc
Co2 85a 50bcd 48cd
Co3 87a 42de 41de
Propionate SI3 0.80f 0.63f 0.38f 1.9 <0.001 <0.001 <0.001 Caecum 29abc 25abc 24bcd Co1 31ab 21cde 21cde Co2 28abc 17de 17de Co3 32a 15e 15e Butyrate SI3 1.1f 2.5ef 0.79f 1.5 0.023 <0.001 <0.001 Caecum 7.0de 22a 14bc
Co1 12bcd 17b 16b
Co2 14bc 13bc 12bcd
Co3 17b 9.1cd 8.7cd
BCFA SI3 0.0g 0.0g 0.0g 0.22 <0.001 <0.001 <0.001 Caecum 1.1f 1.4ef 1.2f
Co1 1.4ef 3.0abc 2.3cde
Co2 1.4ef 3.4abc 2.7bcd
Co3 1.9edf 3.9a 3.3ab
SI3, distal one-third of the small intestine; Co1, proximal one-third of the colon; Co2, mid one-third 647
of the colon; Co3, distal one-third of the colon. 648
Data were expressed as means with standard error of means (SEM) and n = 10 per group. Mean values 649
within a row with unlike superscript letters were significantly different (P < 0.05).650

137
Table 5. Plasma concentrations, hepatic extraction and daily absorption of short chain fatty acids (SCFA) and branched chain fatty acids (BCFA) in
pigs fed with refined wheat fiber diet (Control), rye bran diet with (RB+) and without antibiotic treatment (RB-).
Item Site
Diet
SEM
P-value
Control RB- RB+ Diet Site Diet × Site
Concentration (µmol/L)
SCFA PV 2287a 1442b 1457b 99 <0.001 <0.001 <0.001
HV 825c 608cd 536cd
CA 430d 334d 324d
Acetate PV 1713a 1004b 980b 79 <0.001 <0.001 <0.001
HV 800bc 560cd 507cd
CA 414d 317d 308d
Propionate# PV 420 (273-647) 219(142-337) 275(178-423) - 0.320 <0.001 0.060
HV 7.4 (4.8-11) 5.6 (3.6-8.6) 6.5 (4.2-9.9)
CA 2.4 (1.5-3.6) 2.9 (1.9-4.4) 2.5 (1.6-3.9)
Butyrate# PV 109 (82-145) 129 (97-172) 120 (90-160) - 0.254 <0.001 0.100
HV 8.1 (6.1-11) 8.5 (6.4-11) 13 (9.9-18)
CA 4.9 (3.7-6.5) 7.0 (5.2-9.3) 5.8 (4.3-7.7)
BCFA# PV 33 (26-43) 46 (36-60) 50 (38-64) - 0.020 <0.001 0.882
HV 5.5 (4.2-7.2) 6.2 (4.8-8.1) 7.4 (5.7-9.6)
CA 4.3 (3.3-5.5) 5.8 (4.5-7.6) 6.3 (4.8-8.1)
Net absorption (mol/d)
SCFA 8.0a 4.8b 5.0b 0.72 0.005 - -
Acetate 5.4a 3.0b 2.9b 0.48 0.001 - -
Propionate 1.7a 1.1b 1.3ab 0.18 0.022 - -
Butyrate 0.49 0.60 0.55 0.11 0.629 - -
BCFA 0.14 0.19 0.20 0.02 0.209 - -
Hepatic extraction (%)
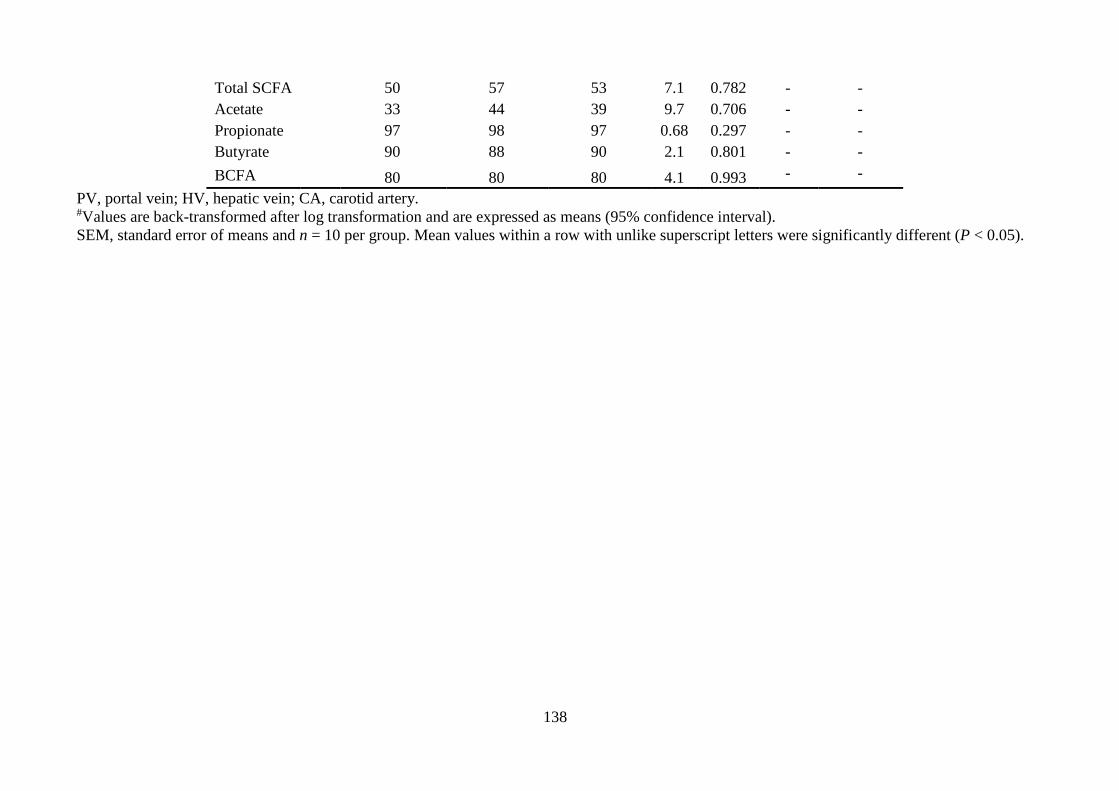
138
Total SCFA 50 57 53 7.1 0.782 - -
Acetate 33 44 39 9.7 0.706 - -
Propionate 97 98 97 0.68 0.297 - -
Butyrate 90 88 90 2.1 0.801 - -
BCFA 80 80 80 4.1 0.993 - -
PV, portal vein; HV, hepatic vein; CA, carotid artery. #Values are back-transformed after log transformation and are expressed as means (95% confidence interval).
SEM, standard error of means and n = 10 per group. Mean values within a row with unlike superscript letters were significantly different (P < 0.05).

139
SI3 Cecum Co1 Co2 Co3
0
500
1000
1500
Ne
t a
mo
un
t, g
Control
RB-
RB+
cde cdee
(A)
cdebcde
e
a
b bc bcdbcde
bcdecdecdede
SI3 Cecum Co1 Co2 Co3
0
2
4
6
8
Me
an
tra
nsi
t ti
me
, h
Control
RB-
RB+cd
a
cd
bbc
bc
(B)
bcdcdcd
eefde
fg gg
Fig. 1. Net amount (A) of wet digesta and mean transit time (B) in the intestinal segments of pigs fed
with refined wheat fiber (Control), rye bran diet with (RB+) and without antibiotic treatment (RB-).
SI3, distal one-third of the small intestine; Co1, proximal one-third of the colon; Co2, mid one-third
of the colon; Co3, distal one-third of the colon. Values are least-squares means with standard errors
represented by vertical bars and n = 10 per group. Different superscript letters mean significant
difference (P < 0.05). There were significant effects of diet ((B), P = 0.001), segment ((A) and (B),
P < 0.001) and diet segment interaction ((A) and (B), P < 0.001).
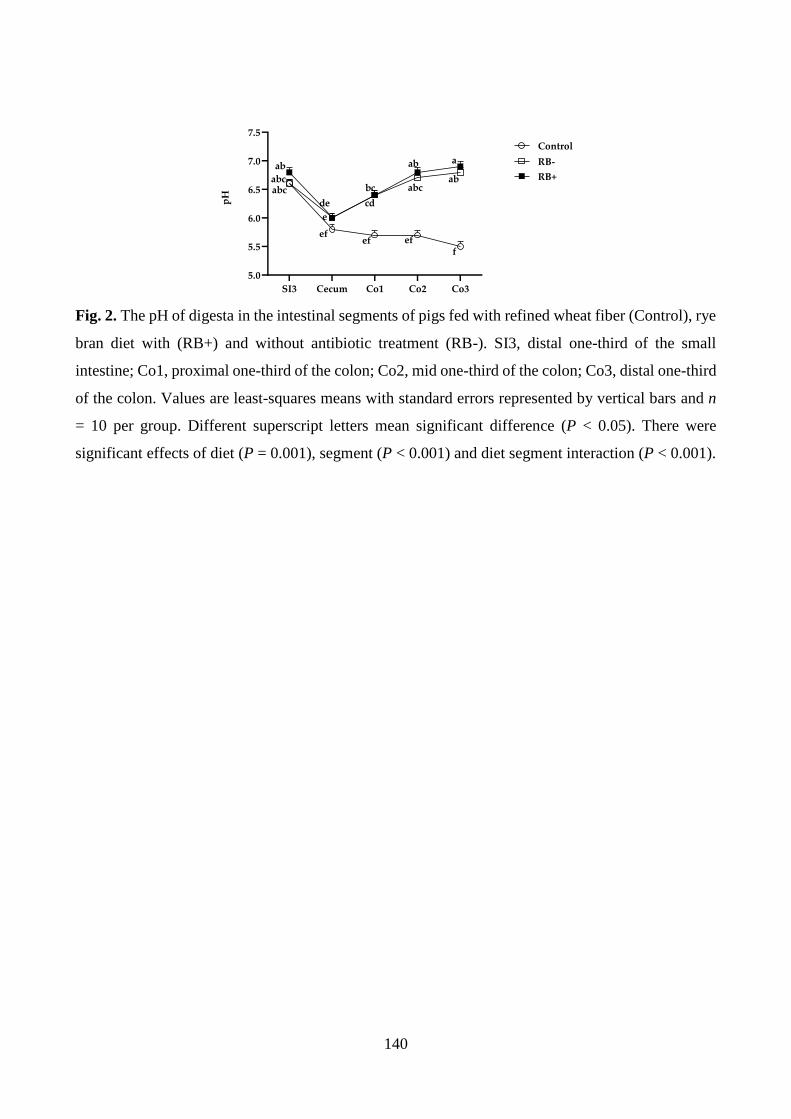
140
SI3 Cecum Co1 Co2 Co3
5.0
5.5
6.0
6.5
7.0
7.5
Control
RB-
RB+bc
cd
ef
abc
ab a
ab
pH
ab
abcabc
de
e
efef
f
Fig. 2. The pH of digesta in the intestinal segments of pigs fed with refined wheat fiber (Control), rye
bran diet with (RB+) and without antibiotic treatment (RB-). SI3, distal one-third of the small
intestine; Co1, proximal one-third of the colon; Co2, mid one-third of the colon; Co3, distal one-third
of the colon. Values are least-squares means with standard errors represented by vertical bars and n
= 10 per group. Different superscript letters mean significant difference (P < 0.05). There were
significant effects of diet (P = 0.001), segment (P < 0.001) and diet segment interaction (P < 0.001).
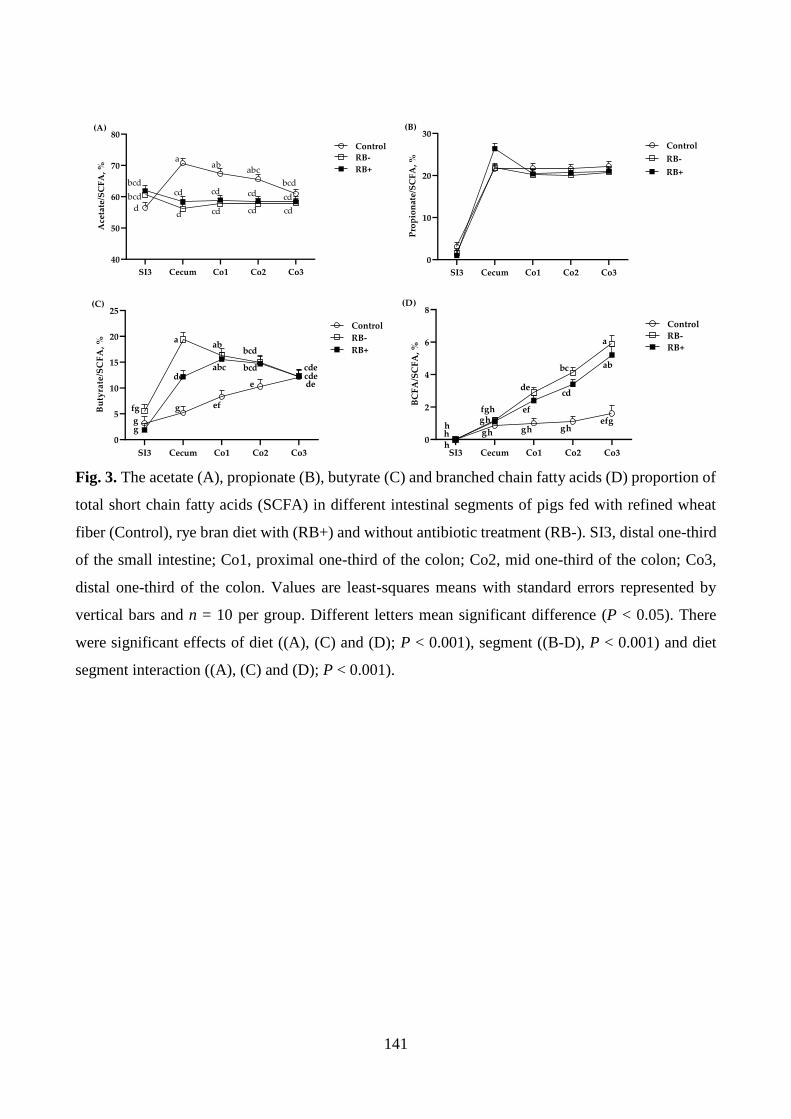
141
SI3 Cecum Co1 Co2 Co3
40
50
60
70
80
Ace
tate
/SC
FA
, %
Control
RB-
RB+a
ab
cd
cd
d
cd
(A)
bcd
bcd
d
abc
cd
cd cd
cd
bcd
SI3 Cecum Co1 Co2 Co3
0
10
20
30
Pro
pio
nat
e/S
CF
A,
%
Control
RB-
RB+
(B)
SI3 Cecum Co1 Co2 Co3
0
5
10
15
20
25
Bu
tyra
te/S
CF
A,
%
Control
RB-
RB+a
de
g ef
abc
ab
e
bcd
bcd
(C)
fg
gg
cdecdede
SI3 Cecum Co1 Co2 Co3
0
2
4
6
8
BC
FA
/SC
FA
, %
Control
RB-
RB+
de
ab
a
bc
cd
(D)
hhh
fghgh
gh gh ghefg
ef
Fig. 3. The acetate (A), propionate (B), butyrate (C) and branched chain fatty acids (D) proportion of
total short chain fatty acids (SCFA) in different intestinal segments of pigs fed with refined wheat
fiber (Control), rye bran diet with (RB+) and without antibiotic treatment (RB-). SI3, distal one-third
of the small intestine; Co1, proximal one-third of the colon; Co2, mid one-third of the colon; Co3,
distal one-third of the colon. Values are least-squares means with standard errors represented by
vertical bars and n = 10 per group. Different letters mean significant difference (P < 0.05). There
were significant effects of diet ((A), (C) and (D); P < 0.001), segment ((B-D), P < 0.001) and diet
segment interaction ((A), (C) and (D); P < 0.001).
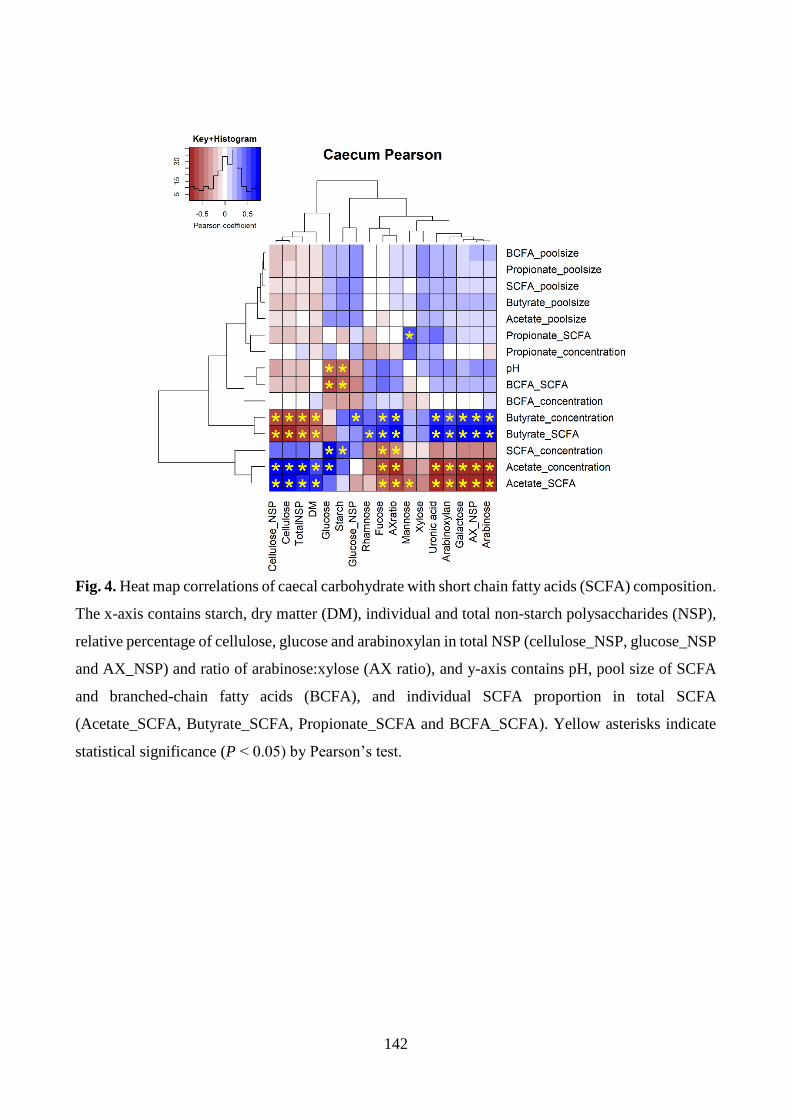
142
Fig. 4. Heat map correlations of caecal carbohydrate with short chain fatty acids (SCFA) composition.
The x-axis contains starch, dry matter (DM), individual and total non-starch polysaccharides (NSP),
relative percentage of cellulose, glucose and arabinoxylan in total NSP (cellulose_NSP, glucose_NSP
and AX_NSP) and ratio of arabinose:xylose (AX ratio), and y-axis contains pH, pool size of SCFA
and branched-chain fatty acids (BCFA), and individual SCFA proportion in total SCFA
(Acetate_SCFA, Butyrate_SCFA, Propionate_SCFA and BCFA_SCFA). Yellow asterisks indicate
statistical significance (P < 0.05) by Pearson’s test.

143
Fig. 5. Heat map correlations of the rarefied relative abundance of caecal microbiota with SCFA and
carbohydrate. The x-axis contains taxa > 1% abundance and y-axis contains starch, dry matter (DM),
individual and total non-starch polysaccharides (NSP), relative percentage of cellulose, glucose and
arabinoxylan in total NSP (cellulose_NSP, glucose_NSP and AX_NSP), ratio of arabinose:xylose
(AX ratio), pH, pool size of SCFA and branched-chain fatty acids (BCFA), and individual SCFA
proportion in total SCFA (Acetate_SCFA, Butyrate_SCFA, Propionate_SCFA and BCFA_SCFA).
Yellow asterisks indicate statistical significance (P < 0.05) by Pearson’s test.

144
Fig. 6. Pearson correlations of total short chain fatty acid (SCFA), acetate and propionate absorption
with plasma cholesterol and LDL of pigs.
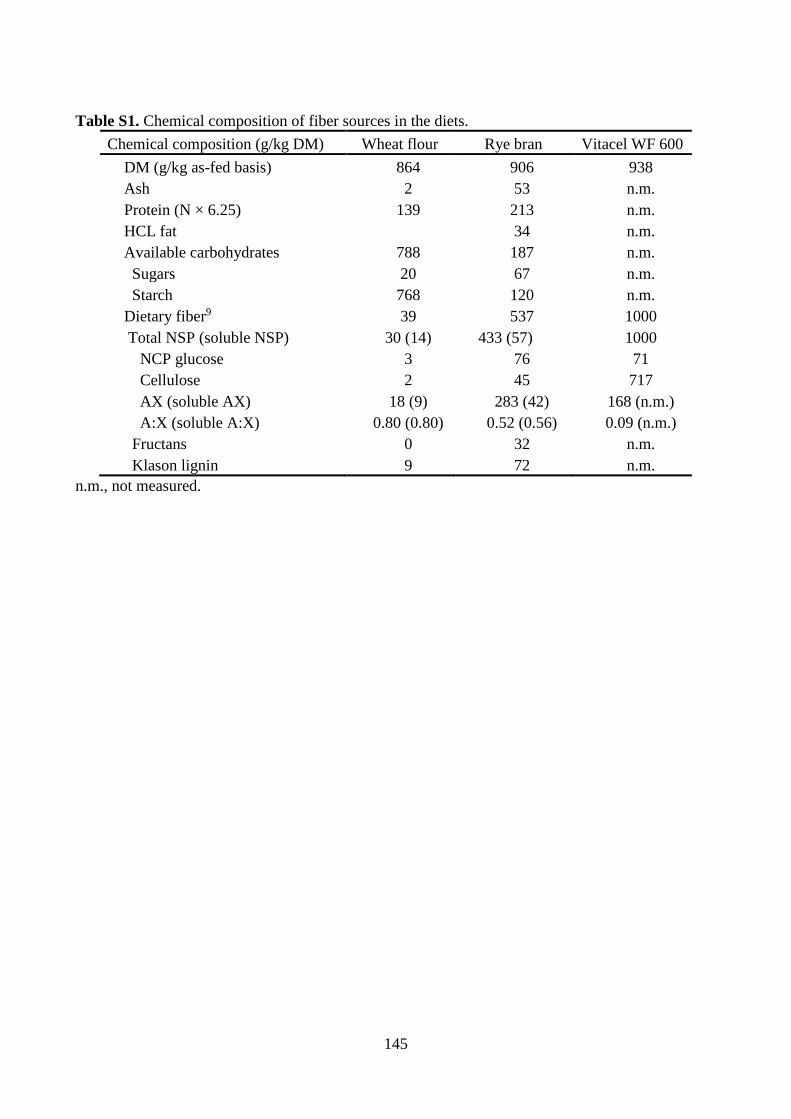
145
Table S1. Chemical composition of fiber sources in the diets.
Chemical composition (g/kg DM) Wheat flour Rye bran Vitacel WF 600
DM (g/kg as-fed basis) 864 906 938
Ash 2 53 n.m.
Protein (N × 6.25) 139 213 n.m.
HCL fat 34 n.m.
Available carbohydrates 788 187 n.m.
Sugars 20 67 n.m.
Starch 768 120 n.m.
Dietary fiber9 39 537 1000
Total NSP (soluble NSP) 30 (14) 433 (57) 1000
NCP glucose 3 76 71
Cellulose 2 45 717
AX (soluble AX) 18 (9) 283 (42) 168 (n.m.)
A:X (soluble A:X) 0.80 (0.80) 0.52 (0.56) 0.09 (n.m.)
Fructans 0 32 n.m.
Klason lignin 9 72 n.m.
n.m., not measured.

146
Table S2. Pool size of total, individual short chain fatty acids (SCFA) and total branched chain fatty
acids (BCFA) in different intestinal segments and large intestine of pigs fed with refined wheat fiber
diet (Control), rye bran diet with (RB+) and without antibiotic treatment (RB-).
Pool size,
mmol Segment
Diet
SEM
P-value
Control RB- RB+ Diet Segment Diet ×
Segment
SCFA SI3 13g 19fg 15fg 7.8 <0.001 <0.001 <0.001
Caecum 45cdef 54cde 38cdefg
Co1 145a 75bc 70bcd
Co2 84b 51cdef 44cdefg
Co3 69bcd 33defg 29efg
Acetate SI3 7.3f 12ef 9.5ef 4.9 <0.001 <0.001 <0.001
Caecum 31cde 31cdef 21cdef
Co1 98a 43bc 41bcd
Co2 55b 30cdef 25cdef
Co3 40bcd 19def 16ef
Propionate SI3 0.40f 0.31f 0.20f 1.7 <0.001 <0.001 <0.001
Caecum 9.8cde 11bcde 8.5cde
Co1 30a 15bc 14bcd
Co2 18b 11bcde 9.0cde
Co3 14bcde 7.0edf 6.2ef
Butyrate SI3 0.47e 1.14e 0.43e 1.2 0.169 <0.001 <0.001
Caecum 2.3de 9.4a 4.3bcde
Co1 12a 11a 11a
Co2 9.0ab 7.7abc 6.4abcd
Co3 8.2abc 4.2bcde 3.4cde
BCFA SI3 0.0 0.0 0.0 0.23 0.004 <0.001 0.265
Caecum 0.36 0.62 0.42
Co1 1.3 2.1 1.6
Co2 0.91 2.0 1.5
Co3 0.86 1.9 1.0
SCFA LI 364a 203b 180b 18 <0.001 - -
Acetate LI 225a 117b 104b 15 <0.001 - -
Propionate LI 74a 42b 41b 6.3 <0.001 - -
Butyrate LI 33 32 25 4.9 0.217 - -
BCFA LI 3.8b 7.1a 5.2ab 0.8 0.021 - -
SI3, distal one-third of the small intestine; Co1, proximal one-third of the colon; Co2, mid one-third
of the colon; Co3, distal one-third of the colon; LI, large intestine (caecum + colon).
Data were expressed as means with standard error of means (SEM) and n = 10 per group. Mean
values with unlike superscript letters were significantly different (P < 0.05).

147
7. Discussion
7.1 Obesity development of minipig models
Göttingen Minipig is a breed that can easily develop obesity than conventional pigs and has
comparable fat distribution with humans (80% subcuteneous adipose tissue and 20% visceral adipose
tissue) (175), therefore we use it as an model to study obesity and phenotype signatures associated
with MetS. The standard chow of Göttingen Minipigs includes 13.8 MJ/kg gross energy, 2.1% fat,
13% protein and 14.5% DF, and is normally fed limited to minipigs to avoid obesity (300-400 g/d
for 6-9 months minipigs). In order to develop obesity in this study, all the minipigs had been provided
a high fructose, high fat western lifestyle diet (20.5 MJ/kg gross energy, 23.3% sugar and 10.5% fat,
11.3% protein and 10% DF) with ad libitum feeding to mimic the excessive energy intake of obese
humans. This was achieved after 20 weeks as body weight doubled compared with the normal
minipigs at the same age (166, 204). Meanwhile, mild characteristics of MetS had been observed,
including increased BSA and POI indices, increased fasting glucose and insulin levels, decreased
HDL levels over the 20 weeks obesity induction (166).
Therefore, in the present study, we aimed to investigate if supplementation of DF and protein alone
or combined would ameliorate MetS biomarkers in this obese porcine model. Besides general
obesity, abdominal obesity is one of the typical characteristics of patients with MetS and means
increased visceral adipose tissue (19). Instead of BMI and waist circumference in humans, obesity
indices including BSA and POI were used to assess the general obesity whilst abdominal
circumference of minipigs was for abdominal obesity in Paper I. After the 8-week dietary
intervention, the development of obesity indices followed the trend of body weight, but the effect of
dietary treatments did not reach a statistical significance. This was in agreement with a previous
intervention in humans, which showed insignificant change in body weight and body composition
after 12 weeks of whey protein and wheat fiber intake (89). Although the high level of dietary fat
aimed to accelerate the development of non-alcoholic fatty liver, a liver fat content (< 1.5%) within
a normal range (205) was seen in the young Göttingen Minipigs model in Paper I, which further
illustrated that it is difficult to develop NAFL in pigs since the primary de novo lipogenesis site is
adipose tissue rather than the liver (182). Since metabolic biomarkers can be influenced by weight
loss (206), our initial aim was to use a weight stable pig model during the intervention. However, it
was hard to obtain full-grown and weight stable minipigs with obesity as it would be overspent and
require a long experimental time. Therefore, we changed the aim to growing minipigs with similar
weight gain during the dietary intervention period, which was seen in this study that minipigs were
still in juvenile period (sexual maturity time is normally 3.7-6.5 months) (204) and did not stop
growing. Therefore, one of the limitations of our study is that the minipigs were still young and

148
continued growing during the intervention, which might have overshadowed the effects of the DF
and protein. It is possible that more obvious signs of MetS would occur if we had used fully matured
and full-grown obese animals instead of young animals. Moreover, instead of ad libitum feeding,
restricted feeding strategy on the body weight basis could be used to maintain weight stable in a fully
matured model with obesity.
7.2 Clinical parameters associated with MetS in minipig models
Instead of directly affecting insulin response, high DF diets increased non-fasting C-peptide secretion
in Paper I, which demonstrated an improved pancreatic function. Accordingly, this was also partly
reflected by the increased GLP-1 secretion in the fasting state, which has been found to play a role
in pancreatic β-cell growth and improved insulin sensitivity (73). Our results also corresponded with
previous studies showing that high cereal fiber intake improved GLP-1 secretion (70) and insulin
response (74, 76) possibly due to slower nutrient absorption and increased SCFA production with
high DF intake. However, it should be kept in mind that some conflicting results exist in previous
studies. For example, high DF content in the form of rye flakes and enzyme-treated wheat bran did
not influence postprandial GLP-1 secretion but lowered insulin secretion and its concentration in the
portal vein of healthy pigs compared with feeding a low DF western lifestyle diet (76, 198). The
reasons for the discrepancy could be different physiological status (lean or obese) of the animal
models but also differences in DF sources and diet composition.
Whey proteins can act as potent secretagogues of enteroendocrine L-cells and enhance GLP-1
secretion (207). In agreement with that, the incretin hormone GLP-1 in the non-fasting state tended
to increase with high protein, but it was not reflected in the differences in feed intake over the 8
weeks (Paper I). It suggested an acute effect of high protein on appetite hormones and satiety 2-4
hours after a meal intake (208), whereas a long term continued intake of high protein may lead to
metabolic adaptation so that the improved satiety in the acute phase did not consequently lead to an
overall reduced energy intake or weight loss in a long-term intervention (209). Along with the
difference in GLP-1, insulin levels in the non-fasting state tended to be stimulated by high protein
diets, which is in line with previous studies showing that whey protein high in BCAA has
insulinotropic potential (126, 130). Surprisingly, we observed increased glucose concentrations in
fasting plasma with no significant change in insulin response and sensitivity with the high protein
diets, which was contrast with our hypothesis. Improved insulin sensitivity with high protein energy-
restricted diets was found in overweight, obese or T2D subjects and partly dependent on weight loss
(137). Hence, unchanged insulin sensitivity with the high protein diets in the current study was
possibly due to the weight gain of the minipigs, the supplementation of energy dense (high sugar
high fat) rather than energy restricted diets as well as an ad libitum feeding pattern. A recent study

149
has found that increased circulating BCAA caused by whey protein intake for a long-term was
detrimental for glucose and lipid homeostasis (210). In the present study, high protein intake
upregulated the gene expression of hepatic FBP1, suggesting increased gluconeogenesis and possibly
would contribute to the development of IR as reported before (211). Given that mild signs of insulin
resistance were seen at baseline, increased glucose responses in the high protein groups indicates
possible progression of IR if the high protein intervention had continued for a longer period as also
observed previously (137).
Weickert et al. (212) pointed out that high protein intake had a tendency to reduce insulin sensitivity,
while high cereal fiber intake could attenuate this negative effect. However, we did not find
significant amelioration of glucose and insulin responses when combining DF with high protein,
possibly because the minipigs still seemed to respond to insulin. Similar observations were seen in a
parallel study with combination of whey protein and wheat fiber provided to abdominal obese
humans (167). The authors explained that the method of insulin sensitivity measurement and physical
conditions of the subjects could also contribute to the different outcomes of insulin sensitivity. It is
possible that other methods such as OGTT might potentially improve the ability to detect changes in
insulin sensitivity. However, measurement of OGTT was not accomplished in the current study
because we did not manage to setup a protocol that ensured satisfactory intake of a fixed amount
glucose in these ad libitum fed minipigs.
In Paper I, high DF diets did not show any improvement in plasma lipid biomarkers which was also
shown in the parallel study with abdominally obese humans fed the a same type of DF (89, 142).
High DF, especially soluble fiber with high viscosity, is generally considered a critical factor to
reduce lipid response (81, 83). Compared with low DF diets, high DF diets added with enzyme-
treated wheat bran contained double soluble NSP wherein soluble AX contributed to a major
proportion (76%), but it might not increase viscosity to the same extent, therefore, the differences of
viscosity between high and low DF diets might be insignificant. Correspondingly, a previous study
from our group showed that rye was more efficient than wheat in reducing plasma cholesterol in pigs
due to the higher viscosity of higher soluble AX content in rye (90). Although high DF did not
improve plasma lipid profile, downregulated gene expression of fatty acid synthase (FASN) in
adipose tissue was observed and indicated potentially beneficial effects of high DF on modulating
fatty acid and cholesterol synthesis. The high protein diets did not significantly change plasma
triglyceride concentrations either, but elevated LDL concentration and LDL:HDL ratios were
observed in the portal and jugular vein in the non-fasting state. Moreover, in the fasting state, more
NEFA was also released to the blood with high protein diets. Studies have reported that non-fasting
triglyceridemia was much closely associated with cardiovascular risk than fasting triglyceridemia (8,

150
213). Therefore, the altered lipid profile with the high protein diets could be an indicator of a
promoted dyslipidemia process and increased CVD risk. This was in contrast to the human study
where intake of whey protein in combination with low DF for 12 weeks improved the postprandial
lipid profile in abdominal obese subjects (89). Notably, high BCAA contents in the high protein diets
of Paper I might even elicit detrimental effects, which were unexpected but reported in recent studies
that a combination of BCAA with high dietary fat content caused injured liver in mice (145) and
increased BCAA accumulation in the circulation may impair lipid homeostasis of obese minipigs
(210). Therefore, it is likely that BCAA-enriched high protein diets in combination with a high fat
content can induce more severe hyperlipidemia on a longer term.
Although we observed mild signs of liver inflammation and upregulated gene expression of lipid
metabolism over the 20 weeks’ obesity development period, that was not reflected in changes of
plasma inflammatory cytokines (166). Surprisingly, high DF resulted in higher INF-γ and IL-12
levels compared with the low DF diets, which was in contrast to previous findings (98, 99). However,
studies on effects of DF on low-grade inflammation are limited and a review reported that lowering
of concentrations of inflammatory were associated with weight loss (206). Thus, a potential
explanation was that the minipigs were still growing therefore the inflammatory cytokines could be
influenced by the growing status. Taken together, although a diet high in fiber is in general considered
as a healthy choice, their role in reducing inflammation needs further investigation.
7.3 Dietary fiber degradation and nutrient digestion
Soluble fiber is generally degraded in proximal part of the large intestine while insoluble fiber can
be fermented in a more distal part of colon (55). Hence, we chose fiber sources from cereal grains
and brans that containing enriched AX in soluble and insoluble forms, to obtain a gradual and
continuous degradation along the large intestine. For the high DF diets in Paper I+II, we used enzyme
treatment of wheat bran to release AXOS fractions from insoluble AX in aleurone cells (62) and
make the wheat bran more fermentable (55). By comparison of the AX structure between diets and
ileal digesta in Paper II, we found that AX degradation already occurred in the small intestine where
the LMW oligosaccharides could be utilized by microbiota as previously reported (214). Similarly,
AX was also slightly degraded in ileum (Control: 11%; RB-: 14%), with a large extent of degradation
in cecum (~50%) and proximal colon (~60%) due to a lower flow rate and higher microbial density
compared with the ileum (Paper III) (215). Corresponding to this observation, a previous study from
our group showed that the ileal digestibility of AX in pigs fed with dark ground rye bread was 27%
(214) and the digestibility of AX in cecum and colon of pigs feeding rye aleurone-based diet were
62% and 74%, respectively (216). The different extent of AX degradation are largely dependent on
the characteristics of AX structure, which was also reflected in the degradation patterns seen in Paper

151
III. Importantly, the degradation of AX was accompanied with changes in A:X ratios and linked with
the degree of substitution and substitution pattern of AX. For instance, in another study it was shown
that AX in the pericarp has a high A:X ratio (> 1.0) with only 17% un-substituted xylose, > 50%
mono-/double-substituted xylose and is difficult to be degraded, while AX in the aleurone layer is
largely unsubstituted (62%) with a lower A:X ratio (~0.40) and was gradually degraded from the
ileum to a large extent in the distal colon(> 60%) (101). This demonstrates that the structure of AX
affects not only the extent but also the site of degradation. These earlier observations were confirmed
in the present studies wherein A:X ratios of the diets were medium (0.63 with added enzyme-treated
wheat bran in Paper II and 0.55 rye bran in Paper III, respectively) and AX was continuously
degraded until mid colon (> 60%). After the AX degradation in mid colon, the A:X ratio increased
(> 1.0 ) and the remainder of AX was difficult to be fermented due to the high degree of substitution
of the xylose backbone. For AX in the refined wheat fiber diet of Paper III, the structure is almost
linear and contained a high proportion of insoluble AX, therefore showing almost unchanged A:X
ratios along the large intestine.
The natural cellulose abundant in cereal bran forms rigid, insoluble and crystalline microfibrils in the
plant cell wall, and is more resistant to enzymatic hydrolysis of microorganisms than refined cellulose
(217). Cellulose fines are in general small particles removed from natural cellulose fiber during a
refining process and can be degraded in a larger extent than cellulose in its natural matrix (218).
These properties can explain the lower extent of cellulose degradation with the RB diets compared
with the cellulose enriched Control diet in Paper III which confirms previous finding in our lab (200,
216). The different degradation patterns between RB diet and the Control diet in Paper III affected
the pH profiles differently wherein the slower degradation of cellulose in the refined wheat fiber diet
led to lower pH values along the large intestine compared with the RB diets.
In Paper III, the protein and fat digestibility was reduced by 6 and 7 percent units with the RB diets
compared with refined wheat fiber diet. This was in correspondence with the findings that the
increased luminal viscosity by DF can hinder the protein hydrolysis by endogenous enzyme and
disturb lipid emulsification in the small intestine (200, 216), therefore can result in reduced
macronutrient digestion and absorption. A large part of protein was presumably entrapped in rye bran
(49) of RB diet and less accessible for the enzymes, thereby showed a lower and slower degradation
along the intestine than the refined wheat fiber diet. The lower digestibility of fat and protein of pigs
fed with RB diets confirms the findings of previous studies in rye-based high DF diets (4, 216).
The effects of antibiotics on DF degradation or fermentation process have previously been poorly
studied. Our study (Paper III) showed only a marginal effect of antibiotic treatment on nutrient
digestion and fiber degradation processes. Although a muscular injection of the antibiotics in pigs

152
allowed us to control the identical antibiotic dosage for each animal, one of the limitations is the
different administration route compared with human studies wherein antibiotics mostly are
administered orally. Therefore, it is likely that the muscular injection of in our study weakened the
efficacy of the antibiotics and may be one of the reasons for the absence of effects on digestion and
degradation processes. If we instead had oral administration and extended the duration of antibiotic
treatment, the efficacy of antibiotics could be increased and effects on digestion and degradation
processes might be more obvious.
7.4 SCFA production and circulation
One of the main mechanisms of action of DF on systemic health is caused by SCFA produced from
the microbial fermentation in the gut (219). Different SCFA distributional profiles are functionally
important; butyrate in particularly, is the principal source of metabolic energy for the colonocytes
and is considered to play an important role in modulating intestinal ecology (110), moreover, may
subsequently alleviate obesity-related metabolic disorders found in humans and animal models (7).
Therefore, we aimed to improve metabolic health through stimulated butyrate production by
providing AX-enriched high DF diets. In Paper II we saw that high DF diets modestly increased the
butyrate pool in the large intestine and the RB diets in Paper III increased butyrate production and
its proportion of SCFA to a greater extent than the Control diet especially in cecum. These
observations demonstrated that DF enriched in AX could improve butyrate production in the large
intestine which fits well with previous findings (4, 54). Moreover, a close relation between AX
content and butyrate concentration or proportion was demonstrated in the correlation heat map of
cecal digesta (Paper III). Besides AX content, some individual sugars that present in rye bran
including galactose, fucose and uronic acid showed positive correlations with butyrate concentration
and proportion in the cecal digesta. However, the treatment with antibiotics in pigs negated the
beneficial effects of AX on butyrate production by showing a reduced butyrate concentration, pool
size and proportion in cecum compared with the un-treated RB group. Similarly, other studies have
demonstrated that antibiotic treatment can adversely affect the microbiome and decrease the SCFA
production in vivo (220) or in vitro (221), highlighting the potential negative effects of antibiotics on
intestinal fermentation process. Differences in DF composition affected the fermentation products,
consumption of the Control diet high in cellulose significantly increased acetate production in Paper
III, reflected by the strong correlations between cellulose content in cecal digesta and acetate
concentration and proportion as also illustrated in another study in pigs (222).
The changes in SCFA profiles along the intestine corresponded with the fermentation activity which
was high in cecum and proximal colon due to high microbial activity and plentiful fermentable
substrates (215). With the depletion of carbohydrates along the large intestine, proteolytic
153
fermentation increased and correspondingly, pH also increased. It was reported that 30% fermented
protein is converted to SCFA, of which BCFA constitutes between 16% and 23% depending on the
type of fermented proteins (223). Therefore, not only BCFA production was increased with high
protein diets in Paper II, increased total SCFA, acetate and propionate were also observed in the
intestinal segments. However, it should be noticed that high protein fermentation can elicit
detrimental effects by producing metabolites such as hydrogen sulfide, ammonia, and p-cresol, ect.
that promotes intestinal inflammatory disease (148). Interestingly, high DF contents limited
proteolytic fermentation in the distal colon by showing a reduced BCFA proportion in comparison
to the low DF groups. Similar findings was also reported in a recent review (148) that high fiber
intake may alter protein fermentation pathways and provide protective effects against gut
inflammation. The decreased protein fermentation in the distal colon of the high DF groups can be
one of the reasons for a lower pH value compared with the low DF groups, which can prevent the
overgrowth of pathogenic bacteria and reduce the risk of bowel disease [61]. In Paper III, the RB
diet increased the concentration of BCFA and their proportion of SCFA, which corresponded with
the decreased protein digestibility thus increasing the delivery of this nutrient to the gut microbiota.
A wide range of metabolites after intestinal fermentation is absorbed by intestinal epithelium to
varying extent and participates in systemic metabolism via blood circulation which plays a role in
metabolic health (105). In Paper III, the higher SCFA, acetate and propionate absorption could be
attributed to a larger intestinal production and a longer transit time in the large intestine with the
Control diet compared to the RB diets, which would provide more time for fermentation of DF and
thereby permit greater SCFA absorption (215). Both acetate and propionate have been reported to
promote lipogenesis (110, 224) which was further reflected in our study, where acetate and
propionate absorption correlated with plasma cholesterol and LDL concentrations in Paper III,
illustrating the beneficial effects of RB diets on plasma lipid profile (203). However, the butyrate
absorption in Paper III was not aligned with the increased intestinal butyrate production, possibly
because it was largely utilized by the epithelial colonocytes (110) and the differences therefore
difficult to detect in the subsequent systematic circulation. Moreover, the changes of intestinal SCFA
concentrations in Paper II were not totally translated into portal circulation where only BCFA
showed significantly increased levels with high protein diets. The mechanism is not clear, but SCFA
can be utilized by colonocytes (110) which could cause a more even SCFA profile among dietary
treatments in portal vein. High propionate and butyrate levels in the blood can induce the
accumulation of TCA intermediates and affect normal cell metabolism (108), hence, the liver clears
the major part of propionate and butyrate from the portal circulation (110, 225). This was also
illustrated in Paper III, where the hepatic clearance of propionate (97%) and butyrate (89%) was high

154
and intermediate for acetate (~40%), irrespective of diets. High hepatic extraction rates of propionate
(94%) and butyrate (82%) were also reported in a previous study and were neither changed with total
DF levels nor AX content (76).
After hepatic extraction, circulating SCFA may have a different profile compared with portal, and
systemic SCFA are also derived from endogenous sources including metabolism of fat, carbohydrate
and amino acids (226). It is therefore reasonable that the SCFA in peripheral circulation has a
different profile compared with the portal vein and intestine. The increased propionate concentrations
in jugular vein of the high protein groups could be due to higher catabolism of BCAA than the low
protein groups, while the increased butyrate concentrations with high DF diets could be partly due to
endogenous fatty acid oxidation that had been indicated by a study (226). A previous study found
that fasting circulating SCFA levels were related to metabolic parameters including GLP-1, lipid and
insulin sensitivity (227). Therefore, the higher butyrate levels in the jugular vein of pigs fed high DF
may potentially contribute to the beneficial effects of DF on beta-cell function and associated with
the increased GLP-1 concentrations in the fasting plasma found in Paper I. Interestingly, we found
higher propionate and lower succinate concentrations in plasma from jugular vein with high protein
intake. As mentioned above that the porcine liver removes ~90% of the net portal absorption of
propionate for gluconeogenesis and circulating propionate at elevated concentrations probably were
toxic (108). However, the plasma propionate concentrations in jugular vein were in a normal range
compared to other human and pig studies (198, 227). Therefore we speculate that the higher
propionate concentrations with the high protein diets may have contributed to the tendency of
increased GLP-1 concentrations in non-fasting plasma found in Paper I. The reduced jugular
concentrations of succinate with the high protein diets could be explained by more succinate
participating in gluconeogenesis corresponding with the upregulated gene expression of the rate-
limiting enzyme (FBP1) involved in gluconeogenesis in the liver.
7.5 Microbiome profile
Diets have both direct and indirect effects on gastrointestinal function of the host. The indirect effect
are mediated by the influence on the composition and activity of the gut microbiota and gut
environment, and changes in microbiome composition are detectable within 24 hours of initiating
dietary intervention (228). After 8-week dietary intervention, higher alpha diversity of microbiota
and Bacteroidetes:Firmicutes ratios were found in fecal samples of pigs fed high DF diets in Paper
III. Actually, lower alpha diversity and Bacteroidetes:Firmicutes ratios were normally found in the
gut or feces of obese humans and animal models (44, 229, 230). However, a previous study showed
that induction of changes of Firmicutes and Bacteroidetes with high DF diets were very variable
between different studies and it is difficult to link certain phyla to particular diets and obesity (231).

155
Likewise, the genera within each phylum did not always present similar changes as phyla (46). For
instance, the high DF diets induced a relative decrease of Firmicutes but relative enrichment of
butyrate-producing genera belonging to the Firmicutes phylum in Paper II. This could be explained
by a relative decrease of other genera in Firmicutes such as Turicibacter and Streptococcus which
were found to be less abundant with the high DF diets. Therefore, it is more important to analyze the
specific microbiota at genus or specie levels rather than only focusing on phyla.
Substrate availability is a major determinant of microbial community and metabolite profile in the
intestine. For instance, whole plant foods normally have protective effects against gut inflammation,
favoring the growth of beneficial fiber-degrading bacteria in the colon (231). Therefore, specific
dietary interventions can be used to change the type of bacterial groups dominating in the large
intestine. In Paper II, AX-rich diets induced an increase in butyrate production with a concomitant
relative increased abundance of Faecalibacterium, Peptococcus and Blautia genera. This
corresponded with our previous studies (4, 76, 216), and is considered beneficial to maintain a healthy
gut environment and negatively associated with inflammatory bowel disease (215, 232). Additionally,
NSP and the individual constituent sugars clustered together and linked with the same group of
genera Blautia in cecum and colon in Paper II. Of note, the close links between NCP fractions and
concentration of butyrate in caecum (Paper III) explains why they also clustered together and
correlated with the same taxa such as Faecalibacterium. Similar trends were found for NSP and
cellulose that correlated positively with acetate and simultaneously drove them in the same direction
in their association with acetate-producing bacteria such as Ruminococcus.
As mentioned before, antibiotic administration by muscular injection were able to act both
systemically and in the intestines demonstrated by detection of metabolites of antibiotics both in
plasma and gut content (168, 203). Although muscular antibiotic injection did not induce a
pronounced change in degradation pattern, the microbiota composition and SCFA production was
sensitive to antibiotic administration. For instance, the abundance of some bacteria (such as
Streptococcus) that found enriched in the non-antibiotic treated RB group were reduced with
antibiotic treatment (102), which could be linked with the reduced butyrate production. Gut
microbiota plays an important role in maintaining the intestinal immune homeostasis, mediated by
SCFA dependent pathways (220). However, oral antibiotic treatment was reported to disrupt gut
microbiota, decrease SCFA production in the large intestine and increase susceptibility to infections
(220). Moreover, a study showed that penicillin can suppress Gram-positive, anaerobic bacteria
growth such as Streptococcus and Clostridium strains (233). Here we demonstrated that
administration of antibiotics reversed the beneficial effects of DF on intestinal environment by
changing microbial profile and butyrate production.
156
In Paper II, the high protein diets induced minor influence on the microbiota profile wherein some
proteolytic taxa abundance including Peptococcaceae and Clostridium were increased with the high
protein intake and associated with increased propionate (234) and BCFA concentrations in the gut
(148). Other studies have reported that intake of whey protein could improve Lactobacillius (151)
(152) and Bifidobaterium growth in mice models (151), which was not observed in the present
studies. However, it is still inconclusive whether whey protein stimulates growth of beneficial or
pathogenic bacteria in the large intestine of pigs and humans as it can be easily and quickly digested
in the small intestine (158) and is found to induce less genetic damage to colonocytes than meat,
casein or soya (235). We speculate that the remainder of proteins that enter the large intestine were
mainly from cereal protein within the plant cell walls and from fish meals, and they can influence the
gut microbiota in different ways. Individuals consuming plant protein (pea protein extract) exhibited
increased abundance of beneficial taxa Bifidobacterium and Lactobacillus, and decreased abundance
of pathogenic species such as Bacteroides fragilis and Clostridium perfringens (236). However, due
to a high fat content in the diet, the bacteria that were mainly increased in response to a high animal
protein diets were typically bile-tolerant microbiota such as Bacteroides and Clostridia (231). Taken
together, the protein source can be a critical factor for the changes in gut microbiota and the use of
highly digestible protein sources may reduce the growth of pathogenic species. Moreover, it is
possible that a high protein content in the diet combined with a high fat content can elicit different
outcomes compared with a diet with a lower fat content and further studies are still needed.
The effect of combination of high DF and protein intake on microbiota composition is less studied.
In this thesis, the combination of high DF and protein did not show significant changes in microbial
profile compared with other dietary treatments, which was partly in accordance with the absence of
interaction of DF and protein on the intestinal SCFA concentrations. Similar results regarding the
deficiency of interaction between dietary protein concentration and fermentable carbohydrates on the
intestinal microbiota have also been reported by other authors (237). They found that a simultaneous
increase in the amount of fiber into high protein diets resulted in a reduction in the protein
fermentation but with no significant effects on the microbiota counts in feces of pigs. It may indicate
that a high DF content incorporated into a high protein diet possibly could act as a tool to reduce the
risk of detrimental effects of protein fermentation by interfering the formation of deleterious
metabolites and altering microbiota composition.
157
8. Conclusion and perspectives
This PhD thesis presents results that contributes with new knowledge on the effects of DF and protein
on degradation and fermentation processes in the gut and metabolic responses in relation to systemic
health and microbial ecology in the lean and obese pig models. The main findings from the present
thesis are summarized below.
Dietary fibre and protein do not synergistically influence insulin, metabolic or inflammatory
biomarkers in young obese Göttingen Minipigs
- In still-growing minipigs, the weight gain was reduced by high DF diets compared with the
low DF, and was increased with high dietary protein compared with low protein content.
- A high DF content in the diet increased the non-fasting C-peptide concentrations with no
changes in glucose or insulin responses whereas high protein increased fasting glucose levels
with no significant change in insulin.
- High DF diets did not attenuate lipid or inflammatory biomarkers compared to the low DF
while high protein content increased the levels of dyslipidemic markers.
- Feeding high DF diets upregulated adipose expression of gene involved in lipid synthesis
(FASN) while high protein upregulated hepatic expression of gene (FBP1) which is a key
regulator of the gluconeogenesis pathway.
Effects of dietary fibre and protein content on intestinal fibre degradation, short-chain fatty
acid and microbiota composition in a high-fat fructose-rich diet induced obese Göttingen
Minipig model
- AX was partly degraded in the distal small intestine and further gradually fermented until to
mid colon.
- High DF intake reduced the intestinal concentrations of total SCFA and acetate and slightly
increased butyrate production in the large intestine while high protein intake elevated the
concentrations of total SCFA, propionate and BCFA in the gut.
- Proteolytic fermentation was reduced by a high DF content in the diet by presenting a lower
BCFA concentrations and proportions of SCFA in the colon than the low DF diets.
- High DF diets increased alpha diversity of fecal microbiota and the relative abundance of
butyrate-producing bacteria in the cecum, mid colon and feces whereas the protein content
only had limited effect on microbial profile.
- High DF increased circulating butyrate concentration while high protein increased
propionate and decreased succinate concentrations, linked with the effects of DF and protein
on hormone response and metabolic disorders.

158
The role of rye bran and antibiotics on the digestion, fermentation process and short-chain
fatty acid production and absorption of pigs
- Differences in DF composition was the main factor for altered degradation and fermentation
processes in the pigs, wherein AX was largely degraded in the cecum and proximal colon,
whereas the cellulose in the Control diet had a slow and gradual degradation along the large
intestine.
- The RB diets reduced protein and fat digestibility and induced a slower protein degradation
in the colon than the Control diet.
- The cellulose contents in cecal digesta correlated positively with acetate concentrations and
proportions, while AX contents positively associated with butyrate concentrations and
proportions.
- Antibiotic treatment had only a limited effect on nutrient digestion and DF degradation, and
significantly interfered with the butyrate concentrations and proportions in the cecum of the
pigs fed RB diets.
- The AX-enriched NCP fractions that clustered together with butyrate concentrations and
proportions were positively correlated with a group of taxa that coincided with the same taxa
enriched in the RB group without antibiotic treatment, whereas cellulose contents and acetate
concentrations and proportions had the same correlations with taxa that were found enriched
in the Control group.
- The RB diets reduced the absorption of total SCFA, acetate and propionate and was associated
with an improved lipid profile compared with the Control diet.
Overall, the results show that different cereal-based DF sources influence degradation and
fermentation patterns. In our pig models, DF from whole grains and cereal brans have positive effects
on systemic and intestinal environment and is suggested to be consumed on a regular basis to mitigate
obesity-related MetS. On the other hand, a high protein intake from whey, cereal and fish meal did
not show beneficial effects on host health and we found that the combination of high DF and protein
did not have synergistic effects on metabolic biomarkers and intestinal environment in young obese
Göttingen Minipigs. The modulated intestinal degradation and fermentation patterns could be linked
to the potential mechanisms underlying the effects of DF and protein on metabolic health.
The minipigs are still growing due to the ad libitum feeding strategy and also because they are not
full-grown during the dietary intervention. This is one of the limitations of the present thesis that
growing lean and obese pig models were used. This continued growth can mask the effects of dietary
intervention. Further studies conducted in an obese pig model with stable body weight and more

159
severe metabolic disturbances may provide more powerful evidence for the roles of DF and protein
in MetS.
A trend of dyslipidemia and pre-diabetic state development with the high protein feeding was
indicated, contrasting the findings in a parallel human study, where whey protein combined with low
DF improved the lipid profile. Moreover, the upregulated gene expression of FBP1 in the liver with
high protein diets raises the question whether high protein intake will have more adverse effects on
lipid metabolism in a longer term of dietary intervention. However, high fat and high sugar content
need to be taken into account when we interpret the effects of high DF and/or protein. We cannot
exclude that a combination of high fat and high protein consumption generate further detrimental
metabolic disorders compared with a lower fat-based diet. Given that only one source of protein or
fiber was used to increase dietary protein and DF level, it is not clear whether the effects were induced
by their specific source or by the level of DF or protein, which should be identified by future studies.
Changes in intestinal and circulating SCFA concentrations with dietary treatments should be noticed
and they may signal through cell surface receptors, like GPR41, GPR43 and GPR109A, to activate
signaling cascades that control physiological functions (238). It would be interesting to explore the
effects of high DF or protein on the gene expression of SCFA receptors and the gene (glucose-6-
phosphate) related to intestinal gluconeogenesis in cecum and colon. Besides for gluconeogenesis,
the reduced succinate levels in systemic circulation also arises a question that if it can be the results
of increased urinary loss of TCA cycle intermediates with high protein intake. High protein intake
may change plasma amino acid profile such as BCAA which may act as indicators for MetS (210).
Therefore, further studies are needed to explore the role of these metabolites in blood and urine and
confirm if they could act as early biomarkers of MetS. We observed increased BCFA concentrations
and pool size in the colon with the high protein diets, but fewer studies have investigated the role of
BCFA compared with carbohydrate-derived SCFA and further research should focus on elucidating
the mechanisms of action of BCFA in health and disease.
This thesis highlights the importance of the gut microbiota and intestinal metabolites on systemic
health. High DF consumption increased the bacterial diversity and richness of beneficial taxa. In this
way, a new state of ecological homeostasis of the gut microbiota may be achieved with beneficial
implications for host health. As the microbial utilization of DF and protein begins already in the small
intestine, it would be of interest to explore the bacterial profile at this site. Moreover, effects of oral
antibiotics intake on nutrient digestion and fiber degradation are still needed.

160
References 1. Schwartz MW, Seeley RJ, Zeltser LM, Drewnowski A, Ravussin E, Redman LM, et al. Obesity
Pathogenesis: An Endocrine Society Scientific Statement. Endocr Rev. 2017;38(4):267-96.
2. Stanhope KL. Role of fructose-containing sugars in the epidemics of obesity and metabolic
syndrome. Annu Rev Med. 2012;63:329-43.
3. Wei B, Liu Y, Lin X, Fang Y, Cui J, Wan J. Dietary fiber intake and risk of metabolic syndrome:
A meta-analysis of observational studies. Clin Nutr. 2018;37(6 Pt A):1935-42.
4. Nielsen TS, Laerke HN, Theil PK, Sorensen JF, Saarinen M, Forssten S, et al. Diets high in
resistant starch and arabinoxylan modulate digestion processes and SCFA pool size in the large
intestine and faecal microbial composition in pigs. Br J Nutr. 2014;112(11):1837-49.
5. Hur KY, Lee MS. Gut Microbiota and Metabolic Disorders. Diabetes Metab J. 2015;39(3):198-
203.
6. Weyer C, Foley JE, Bogardus C, Tataranni PA, Pratley RE. Enlarged subcutaneous abdominal
adipocyte size, but not obesity itself, predicts Type II diabetes independent of insulin resistance.
Diabetologia 2000;43:1498-506.
7. Brahe LK, Astrup A, Larsen LH. Is butyrate the link between diet, intestinal microbiota and
obesity-related metabolic diseases? Obes Rev. 2013;14(12):950-9.
8. Holmer-Jensen J, Mortensen LS, Astrup A, de Vrese M, Holst JJ, Thomsen C, et al. Acute
differential effects of dietary protein quality on postprandial lipemia in obese non-diabetic
subjects. Nutr Res. 2013;33(1):34-40.
9. Sousa GT, Lira FS, Rosa JC, de Oliveira EP, Oyama LM, Santos RV, et al. Dietary whey protein
lessens several risk factors for metabolic diseases: a review. Lipids Health Dis. 2012;11:67.
10. Mikael Nilsson MS, Anders H Frid, Jens J Holst, and Inger ME Björck. Glycemia and
insulinemia in healthy subjects after lactoseequivalent meals of milk and other food proteins:
the role of plasma amino acids and incretins. Am J Clin Nutr. 2004;80:1246–53.
11. Mikael Nilsson JJH, and Inger ME Björck. Metabolic effects of amino acid mixtures and whey
protein in healthy subjects: studies using glucose-equivalent drinks. Am J Clin Nutr.
2007;85:996-1004.
12. Pal S, Ellis V, Dhaliwal S. Effects of whey protein isolate on body composition, lipids, insulin
and glucose in overweight and obese individuals. Br J Nutr. 2010;104(5):716-23.
13. Nielsen KL, Hartvigsen ML, Hedemann MS, Laerke HN, Hermansen K, Bach Knudsen KE.
Similar metabolic responses in pigs and humans to breads with different contents and
compositions of dietary fibers: a metabolomics study. Am J Clin Nutr. 2014;99(4):941-9.
14. Alberti KG, Eckel RH, Grundy SM, Zimmet PZ, Cleeman JI, Donato KA, et al. Harmonizing
the metabolic syndrome: a joint interim statement of the International Diabetes Federation Task
Force on Epidemiology and Prevention; National Heart, Lung, and Blood Institute; American
Heart Association; World Heart Federation; International Atherosclerosis Society; and
International Association for the Study of Obesity. Circulation. 2009;120(16):1640-5.
15. GBD 2015 Obesity Collaborators AA, Forouzanfar MH, Reitsma MB, Sur P, Estep K, et al. .
Health Effects of Overweight and Obesity in 195 Countries over 25 Years. The New England
journal of medicine. 2017;377(1):13-27.
16. Afshin A, Forouzanfar MH, Reitsma MB, Sur P, Estep K, Lee A, et al. Health effects of
overweight and obesity in 195 countries over 25 years. New England Journal of Medicine.
2017;377(1):13-27.
17. Bardou M, Barkun AN, Martel M. Obesity and colorectal cancer. Gut. 2013;62(6):933-47.
18. Saklayen MG. The Global Epidemic of the Metabolic Syndrome. Curr Hypertens Rep.
2018;20(2):12.
19. Han TS, Lean ME. A clinical perspective of obesity, metabolic syndrome and cardiovascular
disease. JRSM Cardiovasc Dis. 2016;5:2048004016633371.

161
20. Al-Mashhadi AL, Poulsen CB, von Wachenfeldt K, Robertson AK, Bentzon JF, Nielsen LB, et
al. Diet-Induced Abdominal Obesity, Metabolic Changes, and Atherosclerosis in
Hypercholesterolemic Minipigs. J Diabetes Res. 2018;2018:6823193.
21. Bays HE, Toth PP, Kris-Etherton PM, Abate N, Aronne LJ, Brown WV, et al. Obesity, adiposity,
and dyslipidemia: a consensus statement from the National Lipid Association. J Clin Lipidol.
2013;7(4):304-83.
22. Lazarte J, Hegele RA. Dyslipidemia Management in Adults With Diabetes. Can J Diabetes.
2020;44(1):53-60.
23. Delma J. Nieves MC, Barbara Retzlaff, Carolyn E. Walden, John D. Brunzell, Robert H. Knopp,
and Steven E. Kahn. The Atherogenic Lipoprotein Profile Associated With Obesity and Insulin
Resistance Is Largely Attributable to Intra-Abdominal Fat. Diabetes 2003;52:172–9.
24. Franssen R, Monajemi H, Stroes ES, Kastelein JJ. Obesity and dyslipidemia. Med Clin North
Am. 2011;95(5):893-902.
25. Berman AN, Blankstein R. Optimizing Dyslipidemia Management for the Prevention of
Cardiovascular Disease: a Focus on Risk Assessment and Therapeutic Options. Curr Cardiol
Rep. 2019;21(9):110.
26. Gordon DJ PJ, Garrison RJ, Neaton JD, Castelli WP, Knoke JD, et al. High-density lipoprotein
cholesterol and cardiovascular disease. Four prospective American studies. . Circulation
1989;79(1):8–15.
27. Heilbronn L, Smith SR, Ravussin E. Failure of fat cell proliferation, mitochondrial function and
fat oxidation results in ectopic fat storage, insulin resistance and type II diabetes mellitus. Int J
Obes Relat Metab Disord. 2004;28 Suppl 4:S12-21.
28. van Dam AD, Boon MR, Berbee JFP, Rensen PCN, van Harmelen V. Targeting white, brown
and perivascular adipose tissue in atherosclerosis development. Eur J Pharmacol. 2017;816:82-
92.
29. Akhtar DH, Iqbal U, Vazquez-Montesino LM, Dennis BB, Ahmed A. Pathogenesis of Insulin
Resistance and Atherogenic Dyslipidemia in Nonalcoholic Fatty Liver Disease. J Clin Transl
Hepatol. 2019;7(4):362-70.
30. International Diabetes Federation. IDF Diabetes Atlas tehwdoaO, 2016).
31. Chatterjee S, Khunti K, Davies MJ. Type 2 diabetes. The Lancet. 2017;389(10085):2239-51.
32. Samuel VT, Shulman GI. The pathogenesis of insulin resistance: integrating signaling pathways
and substrate flux. J Clin Invest. 2016;126(1):12-22.
33. Zatterale F, Longo M, Naderi J, Raciti GA, Desiderio A, Miele C, et al. Chronic Adipose Tissue
Inflammation Linking Obesity to Insulin Resistance and Type 2 Diabetes. Front Physiol.
2019;10:1607.
34. Chawla A, Nguyen KD, Goh YP. Macrophage-mediated inflammation in metabolic disease. Nat
Rev Immunol. 2011;11(11):738-49.
35. Tilg H. The role of cytokines in non-alcoholic fatty liver disease. Dig Dis. 2010;28(1):179-85.
36. Tilg H, Moschen AR. Inflammatory mechanisms in the regulation of insulin resistance. Mol
Med. 2008;14(3-4):222-31.
37. Yamaguchi M, Okamura S, Yamaji T, Iwasaki M, Tsugane S, Shetty V, et al. Plasma cytokine
levels and the presence of colorectal cancer. PLoS One. 2019;14(3):e0213602.
38. Younis N, Zarif R, Mahfouz R. Inflammatory bowel disease: between genetics and microbiota.
Mol Biol Rep. 2020.
39. Kirkegaard H, Johnsen NF, Christensen J, Frederiksen K, Overvad K, Tjonneland A.
Association of adherence to lifestyle recommendations and risk of colorectal cancer: a
prospective Danish cohort study. Bmj. 2010;341(oct26 2):c5504-c.
40. Ferlay J, Soerjomataram I, Dikshit R, Eser S, Mathers C, Rebelo M, et al. Cancer incidence and
mortality worldwide: sources, methods and major patterns in GLOBOCAN 2012. Int J Cancer.
2015;136(5):E359-86.

162
41. Grazioso TP, Brandt M, Djouder N. Diet, Microbiota, and Colorectal Cancer. iScience.
2019;21:168-87.
42. Makki K, Deehan EC, Walter J, Backhed F. The Impact of Dietary Fiber on Gut Microbiota in
Host Health and Disease. Cell Host Microbe. 2018;23(6):705-15.
43. Woting A, Blaut M. The Intestinal Microbiota in Metabolic Disease. Nutrients. 2016;8(4):202.
44. Turnbaugh PJ, Hamady M, Yatsunenko T, Cantarel BL, Duncan A, Ley RE, et al. A core gut
microbiome in obese and lean twins. Nature. 2009;457(7228):480-4.
45. Müller M, Canfora, E. E., Blaak, E. E. Gastrointestinal Transit Time, Glucose Homeostasis and
Metabolic Health: Modulation by Dietary Fibers. Nutrients. 2018;10(3).
46. Magne F, Gotteland M, Gauthier L, Zazueta A, Pesoa S, Navarrete P, et al. The
Firmicutes/Bacteroidetes Ratio: A Relevant Marker of Gut Dysbiosis in Obese Patients?
Nutrients. 2020;12(5).
47. Jones JM. CODEX-aligned dietary fiber definitions help to bridge the ‘fiber gap’. Nutrition
Journal 2014;13:34.
48. Williams BA, Mikkelsen D, Flanagan BM, Gidley MJ. "Dietary fibre": moving beyond the
"soluble/insoluble" classification for monogastric nutrition, with an emphasis on humans and
pigs. J Anim Sci Biotechnol. 2019;10:45.
49. Fardet A. New hypotheses for the health-protective mechanisms of whole-grain cereals: what is
beyond fibre? Nutr Res Rev. 2010;23(1):65-134.
50. Bozzetto L, Costabile G, Della Pepa G, Ciciola P, Vetrani C, Vitale M, et al. Dietary Fibre as a
Unifying Remedy for the Whole Spectrum of Obesity-Associated Cardiovascular Risk.
Nutrients. 2018;10(7).
51. Houdijk JGM, Verstegen MWA, Bosch MW, van Laere KJM. Dietary fructooligosaccharides
and transgalactooligosaccharides can affect fermentation characteristics in gut contents and
portal plasma of growing pigs. Livestock Production Science. 2002;73(2):175-84.
52. Bindels LB, Delzenne NM, Cani PD, Walter J. Towards a more comprehensive concept for
prebiotics. Nat Rev Gastroenterol Hepatol. 2015;12(5):303-10.
53. Karppinen S. Dietary fibre components of rye bran and their fermentation in vitro. Espoo 2003
VTT Publications 500 96 p + app 52 p
https://wwwvttresearchcom/sites/default/files/pdf/publications/2003/P500pdf. 2003.
54. Lærke KEBKaHN. Rye Arabinoxylans: Molecular Structure, Physicochemical Properties and
Physiological Effects in the Gastrointestinal Tract. Cereal Chem. 2010;87:353-62.
55. Bach Knudsen KE, Norskov NP, Bolvig AK, Hedemann MS, Laerke HN. Dietary fibers and
associated phytochemicals in cereals. Mol Nutr Food Res. 2017;61(7).
56. Izydorczyk MS, Biliaderis CG. Cereal arabinoxylans: advances in structure and
physicochemical properties. Carbohydrate Polymers. 1995;28(1):33-48.
57. Hartvigsen ML, Gregersen S, Laerke HN, Holst JJ, Bach Knudsen KE, Hermansen K. Effects
of concentrated arabinoxylan and beta-glucan compared with refined wheat and whole grain rye
on glucose and appetite in subjects with the metabolic syndrome: a randomized study. Eur J Clin
Nutr. 2014;68(1):84-90.
58. Knudsen KEB. Carbohydrate and lignin contents of plant materials used in animal feeding.
Animal Feed Science and Technology 1997:319-38.
59. Knudsen KE. Fiber and nonstarch polysaccharide content and variation in common crops used
in broiler diets. Poult Sci. 2014;93(9):2380-93.
60. Kamal-Eldin A, Laerke HN, Knudsen KE, Lampi AM, Piironen V, Adlercreutz H, et al.
Physical, microscopic and chemical characterisation of industrial rye and wheat brans from the
Nordic countries. Food Nutr Res. 2009;53.
61. Van Craeyveld V, Dornez E, Holopainen U, Selinheimo E, Poutanen K, Delcour JA, and Courtin
CM. Wheat Bran AX Properties and Choice of Xylanase Affect Enzymic Production of Wheat
Bran-Derived Arabinoxylan-Oligosaccharides. Cereal Chem 2010;87(4):283–91.

163
62. Vangsøe CT, Sørensen JF, Bach Knudsen KE. Aleurone cells are the primary contributor to
arabinoxylan oligosaccharide production from wheat bran after treatment with cell wall‐
degrading enzymes. International Journal of Food Science & Technology. 2019;54(10):2847-
53.
63. Mudgil D, Barak S. Composition, properties and health benefits of indigestible carbohydrate
polymers as dietary fiber: a review. Int J Biol Macromol. 2013;61:1-6.
64. Stephen AM, Champ MM, Cloran SJ, Fleith M, van Lieshout L, Mejborn H, et al. Dietary fibre
in Europe: current state of knowledge on definitions, sources, recommendations, intakes and
relationships to health. Nutr Res Rev. 2017;30(2):149-90.
65. Wanders AJ, van den Borne JJ, de Graaf C, Hulshof T, Jonathan MC, Kristensen M, et al. Effects
of dietary fibre on subjective appetite, energy intake and body weight: a systematic review of
randomized controlled trials. Obes Rev. 2011;12(9):724-39.
66. Rebello CJ, O'Neil CE, Greenway FL. Dietary fiber and satiety: the effects of oats on satiety.
Nutr Rev. 2016;74(2):131-47.
67. Kristensen M, Jensen MG. Dietary fibres in the regulation of appetite and food intake.
Importance of viscosity. Appetite. 2011;56(1):65-70.
68. French SJ, Read NW. Effect of guar gum on hunger and satiety after meals of differing fat
content: relationship with gastric emptying. The American Journal of Clinical Nutrition.
1994;59(1):87-91.
69. Warrilow A, Mellor D, McKune A, Pumpa K. Dietary fat, fibre, satiation, and satiety-a
systematic review of acute studies. Eur J Clin Nutr. 2019;73(3):333-44.
70. Freeland KR, Wilson C, Wolever TM. Adaptation of colonic fermentation and glucagon-like
peptide-1 secretion with increased wheat fibre intake for 1 year in hyperinsulinaemic human
subjects. Br J Nutr. 2010;103(1):82-90.
71. Lafond DW, Greaves KA, Maki KC, Leidy HJ, Romsos DR. Effects of two dietary fibers as part
of ready-to-eat cereal (RTEC) breakfasts on perceived appetite and gut hormones in overweight
women. Nutrients. 2015;7(2):1245-66.
72. Weickert MO, Pfeiffer AFH. Impact of Dietary Fiber Consumption on Insulin Resistance and
the Prevention of Type 2 Diabetes. J Nutr. 2018;148(1):7-12.
73. McRorie JW, Fahey GC. A review of gastrointestinal physiology and the mechanisms
underlying the health benefits of dietary fiber: Matching an effective fiber with specific patient
needs. Clinical Nursing Studies. 2013;1(4).
74. Lundin EA, Zhang JX, Lairon D, Tidehag P, Åman P, Adlercreutz H, et al. Effects of meal
frequency and high-fibre rye-bread diet on glucose and lipid metabolism and ileal excretion of
energy and sterols in ileostomy subjects. European Journal Of Clinical Nutrition. 2004;58:1410.
75. Qi X, Al‐Ghazzewi FH, Tester RF. Dietary Fiber, Gastric Emptying, and Carbohydrate
Digestion: A Mini‐Review. Starch - Stärke. 2018;70(9-10).
76. Ingerslev AK, Theil PK, Hedemann MS, Laerke HN, Bach Knudsen KE. Resistant starch and
arabinoxylan augment SCFA absorption, but affect postprandial glucose and insulin responses
differently. Br J Nutr. 2014;111(9):1564-76.
77. Papathanasopoulos A, Camilleri M. Dietary fiber supplements: effects in obesity and metabolic
syndrome and relationship to gastrointestinal functions. Gastroenterology. 2010;138(1):65-72
e1-2.
78. Lu ZX, Walker KZ, Muir JG, O'Dea K. Arabinoxylan fibre improves metabolic control in people
with Type II diabetes. Eur J Clin Nutr. 2004;58(4):621-8.
79. Jenkins DJA, Cyril WCK, Augustin LSA, Martini MC, Axelsen M, Faulkner D, Vidgen E,
Parker T, Lau H, Connelly PW, Teitel J, Singer W, Vandenbroucke AC, Leiter LA, Josse RG.
Effect of Wheat Bran on Glycemic Control and Risk Factors for Cardiovascular Disease in Type
2 Diabetes. Diabetes Care. 2002;25(9):1522–8.
80. Meyer KA, Kushi LH, Jacobs Jr DR, Slavin J, Sellers TA, and Folsom AR. Carbohydrates,
dietary fiber, and incident type 2 diabetes in older women. Am J Clin Nutr. 2000;71:921–30.

164
81. Surampudi P, Enkhmaa B, Anuurad E, Berglund L. Lipid Lowering with Soluble Dietary Fiber.
Curr Atheroscler Rep. 2016;18(12):75.
82. Mark A. Pereira EOR, Katarina Augustsson, Gary E. Fraser, Uri Goldbourt, Berit L. Heitmann,
Goran Hallmans, Paul Knekt, Simin Liu, Pirjo Pietinen, Donna Spiegelman, June Stevens, Jarmo
Virtamo, Walter C. Willett, Alberto Ascherio. Dietary Fiber and Risk of Coronary Heart
Disease: A Pooled Analysis of Cohort Studies. Arch Intern Med 2004;164(4):370-6.
83. Martin O. Weickert aAFHP. Metabolic Effects of Dietary Fiber Consumption and Prevention of
Diabetes. The Journal of Nutrition. 2008;138:439-42.
84. Harland J. 2 - Authorised EU health claims for barley and oat beta-glucans. In: Sadler MJ, editor.
Foods, Nutrients and Food Ingredients with Authorised Eu Health Claims: Woodhead
Publishing; 2014. p. 25-45.
85. Giacco R, Clemente G, Cipriano D, Luongo D, Viscovo D, Patti L, et al. Effects of the regular
consumption of wholemeal wheat foods on cardiovascular risk factors in healthy people.
Nutrition, Metabolism and Cardiovascular Diseases. 2010;20(3):186-94.
86. Garcia AL, Steiniger J, Reich SC, Weickert MO, Harsch I, Machowetz A, et al. Arabinoxylan
fibre consumption improved glucose metabolism, but did not affect serum adipokines in subjects
with impaired glucose tolerance. Horm Metab Res. 2006;38(11):761-6.
87. Giacco R, Costabile G, Della Pepa G, Anniballi G, Griffo E, Mangione A, et al. A whole-grain
cereal-based diet lowers postprandial plasma insulin and triglyceride levels in individuals with
metabolic syndrome. Nutr Metab Cardiovasc Dis. 2014;24(8):837-44.
88. Jenkins DJ, Kendall CW, Vuksan V, Augustin LS, Mehling C, Parker T, et al. Effect of wheat
bran on serum lipids: influence of particle size and wheat protein. J Am Coll Nutr.
1999;18(2):159-65.
89. Nielsen RF. Long-term effects of whey protein and dietary fiber from wheat on markers of
metabolic risk and bone health in subjects with abdominal obesity. PhD Thesis, Aarhus
University Hospital, Denmark. 2019.
90. Lærke HN, Pedersen C, Mortensen MA, Theil PK, Larsen T, Knudsen KEB. Rye bread reduces
plasma cholesterol levels in hypercholesterolaemic pigs when compared to wheat at similar
dietary fibre level. Journal of the Science of Food and Agriculture. 2008;88(8):1385-93.
91. Wong C, Harris PJ, Ferguson LR. Potential Benefits of Dietary Fibre Intervention in
Inflammatory Bowel Disease. Int J Mol Sci. 2016;17(6).
92. Li M, van Esch B, Wagenaar GTM, Garssen J, Folkerts G, Henricks PAJ. Pro- and anti-
inflammatory effects of short chain fatty acids on immune and endothelial cells. Eur J
Pharmacol. 2018;831:52-9.
93. Topping DL, Clifton PM. Short-Chain Fatty Acids and Human Colonic Function: Roles of
Resistant Starch and Nonstarch Polysaccharides. Physiological Reviews. 2001;81(3):1031-64.
94. Zimmerman MA, Singh N, Martin PM, Thangaraju M, Ganapathy V, Waller JL, et al. Butyrate
suppresses colonic inflammation through HDAC1-dependent Fas upregulation and Fas-
mediated apoptosis of T cells. Am J Physiol Gastrointest Liver Physiol. 2012;302(12):G1405-
G15.
95. Klampfer L, Huang J, Sasazuki T, Shirasawa S, Augenlicht L. Inhibition of Interferon γ
Signaling by the Short Chain Fatty Acid Butyrate. Molecular Cancer Research. 2003;1(11):855-
62.
96. Rakvaag E, Fuglsang-Nielsen R, Bach Knudsen KE, Hermansen K, Gregersen S. The
Combination of Whey Protein and Dietary Fiber Does Not Alter Low-Grade Inflammation or
Adipose Tissue Gene Expression in Adults with Abdominal Obesity. Rev Diabet Stud.
2019;15:83-93.
97. Roager HM, Vogt JK, Kristensen M, Hansen LBS, Ibrugger S, Maerkedahl RB, et al. Whole
grain-rich diet reduces body weight and systemic low-grade inflammation without inducing
major changes of the gut microbiome: a randomised cross-over trial. Gut. 2017;0:1-11.
165
98. Kopf JC, Suhr MJ, Clarke J, Eyun SI, Riethoven JM, Ramer-Tait AE, et al. Role of whole grains
versus fruits and vegetables in reducing subclinical inflammation and promoting gastrointestinal
health in individuals affected by overweight and obesity: a randomized controlled trial. Nutr J.
2018;17(1):72.
99. Vitaglione P, Mennella I, Ferracane R, Rivellese AA, Giacco R, Ercolini D, et al. Whole-grain
wheat consumption reduces inflammation in a randomized controlled trial on overweight and
obese subjects with unhealthy dietary and lifestyle behaviors: role of polyphenols bound to
cereal dietary fiber. Am J Clin Nutr. 2015;101(2):251-61.
100. Pollet A, Van Craeyveld V, Van de Wiele T, Verstraete W, Delcour JA, Courtin CM. In vitro
fermentation of arabinoxylan oligosaccharides and low molecular mass arabinoxylans with
different structural properties from wheat (Triticum aestivum L.) bran and psyllium (Plantago
ovata Forsk) seed husk. J Agric Food Chem. 2012;60(4):946-54.
101. Glitsø LV, Gruppen H, Schols HA, Højsgaard S, Sandstro¨m B and Bach Knudsen KE.
Degradation of rye arabinoxylans in the large intestine of pigs. Journal of the Science of Food
and Agriculture. 1999;79:961-9.
102. Bolvig AK, Norskov NP, van Vliet S, Foldager L, Curtasu MV, Hedemann MS, et al. Rye Bran
Modified with Cell Wall-Degrading Enzymes Influences the Kinetics of Plant Lignans but Not
of Enterolignans in Multicatheterized Pigs. J Nutr. 2017;147(12):2220-7.
103. Hald S, Schioldan AG, Moore ME, Dige A, Laerke HN, Agnholt J, et al. Effects of Arabinoxylan
and Resistant Starch on Intestinal Microbiota and Short-Chain Fatty Acids in Subjects with
Metabolic Syndrome: A Randomised Crossover Study. PLoS One. 2016;11(7):e0159223.
104. Francois IE, Lescroart O, Veraverbeke WS, Marzorati M, Possemiers S, Evenepoel P, et al.
Effects of a wheat bran extract containing arabinoxylan oligosaccharides on gastrointestinal
health parameters in healthy adult human volunteers: a double-blind, randomised, placebo-
controlled, cross-over trial. Br J Nutr. 2012;108(12):2229-42.
105. Romani-Perez M, Agusti A, Sanz Y. Innovation in microbiome-based strategies for promoting
metabolic health. Curr Opin Clin Nutr Metab Care. 2017;20(6):484-91.
106. Cummings JH PE, Branch WJ, Naylor CP, Macfarlane GT. . Short chain fatty acids in human
large intestine, portal, hepatic and venous blood. . Gut. 1987;28(10):1221-7.
107. Wong JMW, de Souza R, Kendall CWC, Emam A, and Jenkins DJA. Colonic Health:
Fermentation and Short Chain Fatty Acids. J Clin Gastroenterol. 2006;40:235–43.
108. Kristensen NB, Wu G. Metabolic functions of the porcine liver. Nutritional physiology of pigs
- Online publication ed / Knud Erik Bach Knudsen; Niels Jørgen Kjeldsen; Hanne Damgaard
Poulsen; Bent Borg Jensen Foulum : Videncenter for Svineproduktion. 2012.
109. Robles Alonso V, Guarner F. Linking the gut microbiota to human health. Br J Nutr. 2013;109
Suppl 2:S21-6.
110. den Besten G, van Eunen K, Groen AK, Venema K, Reijngoud DJ, Bakker BM. The role of
short-chain fatty acids in the interplay between diet, gut microbiota, and host energy metabolism.
J Lipid Res. 2013;54(9):2325-40.
111. Illman RJ, Topping DL, McIntosh GH, Trimble RP, Storer GB, Taylor MN, and Cheng BQ.
Hypocholesterolemic effects of dietary propionate: studies in whole animals and perfused rat
liver. Ann Nutr Metab. 1988;32:97-107.
112. Damen B, Cloetens L, Broekaert WF, Francois I, Lescroart O, Trogh I, et al. Consumption of
breads containing in situ-produced arabinoxylan oligosaccharides alters gastrointestinal effects
in healthy volunteers. J Nutr. 2012;142(3):470-7.
113. Henchion M, Hayes M, Mullen AM, Fenelon M, Tiwari B. Future Protein Supply and Demand:
Strategies and Factors Influencing a Sustainable Equilibrium. Foods. 2017;6(7).
114. Pfeiffer AFH, Pedersen E, Schwab U, Riserus U, Aas AM, Uusitupa M, et al. The Effects of
Different Quantities and Qualities of Protein Intake in People with Diabetes Mellitus. Nutrients.
2020;12(2).
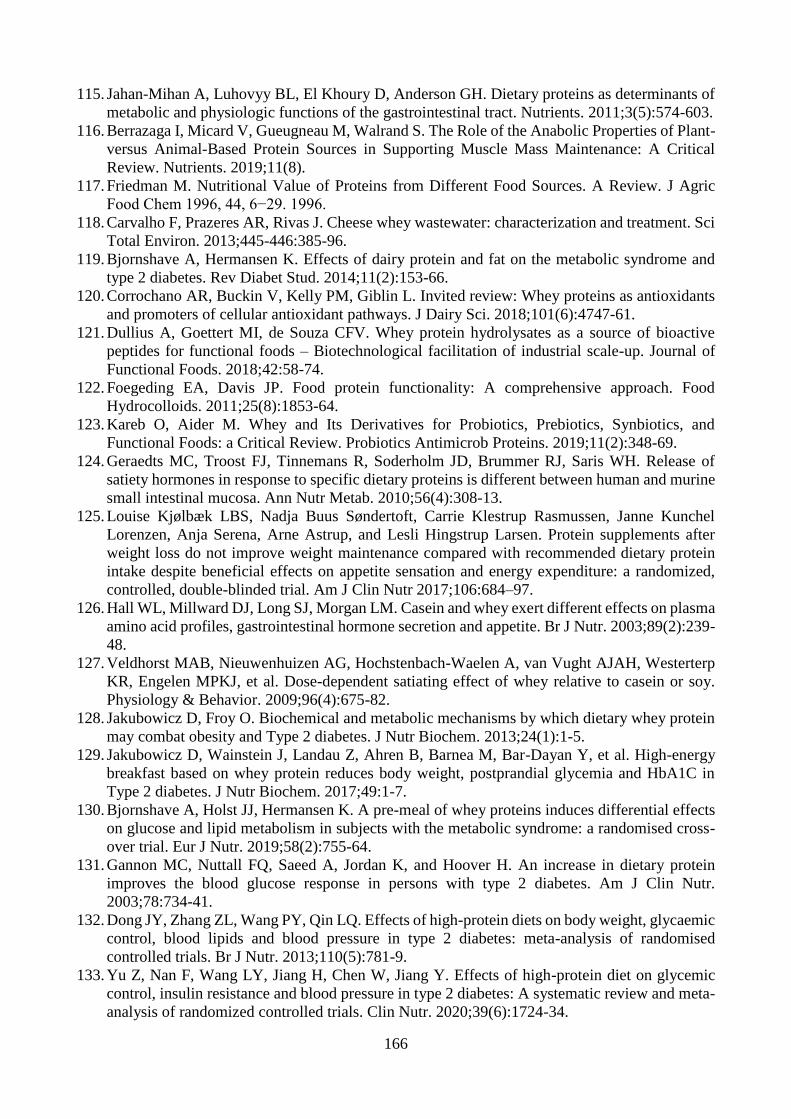
166
115. Jahan-Mihan A, Luhovyy BL, El Khoury D, Anderson GH. Dietary proteins as determinants of
metabolic and physiologic functions of the gastrointestinal tract. Nutrients. 2011;3(5):574-603.
116. Berrazaga I, Micard V, Gueugneau M, Walrand S. The Role of the Anabolic Properties of Plant-
versus Animal-Based Protein Sources in Supporting Muscle Mass Maintenance: A Critical
Review. Nutrients. 2019;11(8).
117. Friedman M. Nutritional Value of Proteins from Different Food Sources. A Review. J Agric
Food Chem 1996, 44, 6−29. 1996.
118. Carvalho F, Prazeres AR, Rivas J. Cheese whey wastewater: characterization and treatment. Sci
Total Environ. 2013;445-446:385-96.
119. Bjornshave A, Hermansen K. Effects of dairy protein and fat on the metabolic syndrome and
type 2 diabetes. Rev Diabet Stud. 2014;11(2):153-66.
120. Corrochano AR, Buckin V, Kelly PM, Giblin L. Invited review: Whey proteins as antioxidants
and promoters of cellular antioxidant pathways. J Dairy Sci. 2018;101(6):4747-61.
121. Dullius A, Goettert MI, de Souza CFV. Whey protein hydrolysates as a source of bioactive
peptides for functional foods – Biotechnological facilitation of industrial scale-up. Journal of
Functional Foods. 2018;42:58-74.
122. Foegeding EA, Davis JP. Food protein functionality: A comprehensive approach. Food
Hydrocolloids. 2011;25(8):1853-64.
123. Kareb O, Aider M. Whey and Its Derivatives for Probiotics, Prebiotics, Synbiotics, and
Functional Foods: a Critical Review. Probiotics Antimicrob Proteins. 2019;11(2):348-69.
124. Geraedts MC, Troost FJ, Tinnemans R, Soderholm JD, Brummer RJ, Saris WH. Release of
satiety hormones in response to specific dietary proteins is different between human and murine
small intestinal mucosa. Ann Nutr Metab. 2010;56(4):308-13.
125. Louise Kjølbæk LBS, Nadja Buus Søndertoft, Carrie Klestrup Rasmussen, Janne Kunchel
Lorenzen, Anja Serena, Arne Astrup, and Lesli Hingstrup Larsen. Protein supplements after
weight loss do not improve weight maintenance compared with recommended dietary protein
intake despite beneficial effects on appetite sensation and energy expenditure: a randomized,
controlled, double-blinded trial. Am J Clin Nutr 2017;106:684–97.
126. Hall WL, Millward DJ, Long SJ, Morgan LM. Casein and whey exert different effects on plasma
amino acid profiles, gastrointestinal hormone secretion and appetite. Br J Nutr. 2003;89(2):239-
48.
127. Veldhorst MAB, Nieuwenhuizen AG, Hochstenbach-Waelen A, van Vught AJAH, Westerterp
KR, Engelen MPKJ, et al. Dose-dependent satiating effect of whey relative to casein or soy.
Physiology & Behavior. 2009;96(4):675-82.
128. Jakubowicz D, Froy O. Biochemical and metabolic mechanisms by which dietary whey protein
may combat obesity and Type 2 diabetes. J Nutr Biochem. 2013;24(1):1-5.
129. Jakubowicz D, Wainstein J, Landau Z, Ahren B, Barnea M, Bar-Dayan Y, et al. High-energy
breakfast based on whey protein reduces body weight, postprandial glycemia and HbA1C in
Type 2 diabetes. J Nutr Biochem. 2017;49:1-7.
130. Bjornshave A, Holst JJ, Hermansen K. A pre-meal of whey proteins induces differential effects
on glucose and lipid metabolism in subjects with the metabolic syndrome: a randomised cross-
over trial. Eur J Nutr. 2019;58(2):755-64.
131. Gannon MC, Nuttall FQ, Saeed A, Jordan K, and Hoover H. An increase in dietary protein
improves the blood glucose response in persons with type 2 diabetes. Am J Clin Nutr.
2003;78:734-41.
132. Dong JY, Zhang ZL, Wang PY, Qin LQ. Effects of high-protein diets on body weight, glycaemic
control, blood lipids and blood pressure in type 2 diabetes: meta-analysis of randomised
controlled trials. Br J Nutr. 2013;110(5):781-9.
133. Yu Z, Nan F, Wang LY, Jiang H, Chen W, Jiang Y. Effects of high-protein diet on glycemic
control, insulin resistance and blood pressure in type 2 diabetes: A systematic review and meta-
analysis of randomized controlled trials. Clin Nutr. 2020;39(6):1724-34.
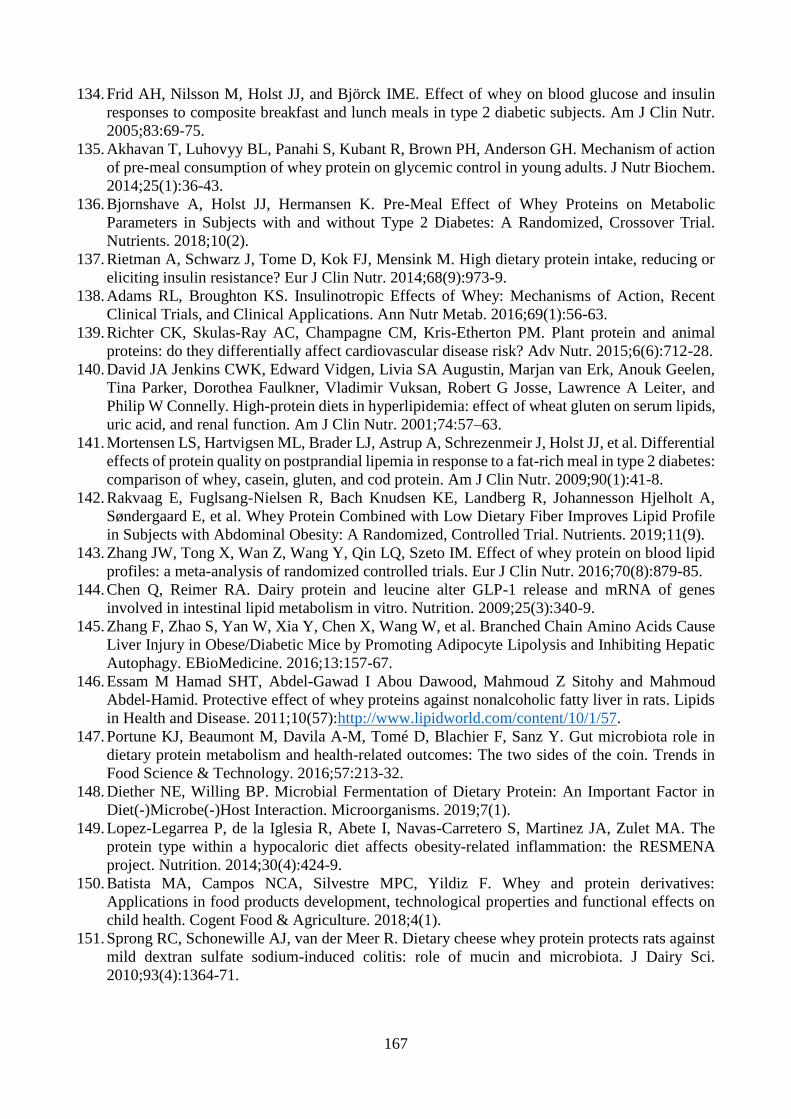
167
134. Frid AH, Nilsson M, Holst JJ, and Björck IME. Effect of whey on blood glucose and insulin
responses to composite breakfast and lunch meals in type 2 diabetic subjects. Am J Clin Nutr.
2005;83:69-75.
135. Akhavan T, Luhovyy BL, Panahi S, Kubant R, Brown PH, Anderson GH. Mechanism of action
of pre-meal consumption of whey protein on glycemic control in young adults. J Nutr Biochem.
2014;25(1):36-43.
136. Bjornshave A, Holst JJ, Hermansen K. Pre-Meal Effect of Whey Proteins on Metabolic
Parameters in Subjects with and without Type 2 Diabetes: A Randomized, Crossover Trial.
Nutrients. 2018;10(2).
137. Rietman A, Schwarz J, Tome D, Kok FJ, Mensink M. High dietary protein intake, reducing or
eliciting insulin resistance? Eur J Clin Nutr. 2014;68(9):973-9.
138. Adams RL, Broughton KS. Insulinotropic Effects of Whey: Mechanisms of Action, Recent
Clinical Trials, and Clinical Applications. Ann Nutr Metab. 2016;69(1):56-63.
139. Richter CK, Skulas-Ray AC, Champagne CM, Kris-Etherton PM. Plant protein and animal
proteins: do they differentially affect cardiovascular disease risk? Adv Nutr. 2015;6(6):712-28.
140. David JA Jenkins CWK, Edward Vidgen, Livia SA Augustin, Marjan van Erk, Anouk Geelen,
Tina Parker, Dorothea Faulkner, Vladimir Vuksan, Robert G Josse, Lawrence A Leiter, and
Philip W Connelly. High-protein diets in hyperlipidemia: effect of wheat gluten on serum lipids,
uric acid, and renal function. Am J Clin Nutr. 2001;74:57–63.
141. Mortensen LS, Hartvigsen ML, Brader LJ, Astrup A, Schrezenmeir J, Holst JJ, et al. Differential
effects of protein quality on postprandial lipemia in response to a fat-rich meal in type 2 diabetes:
comparison of whey, casein, gluten, and cod protein. Am J Clin Nutr. 2009;90(1):41-8.
142. Rakvaag E, Fuglsang-Nielsen R, Bach Knudsen KE, Landberg R, Johannesson Hjelholt A,
Søndergaard E, et al. Whey Protein Combined with Low Dietary Fiber Improves Lipid Profile
in Subjects with Abdominal Obesity: A Randomized, Controlled Trial. Nutrients. 2019;11(9).
143. Zhang JW, Tong X, Wan Z, Wang Y, Qin LQ, Szeto IM. Effect of whey protein on blood lipid
profiles: a meta-analysis of randomized controlled trials. Eur J Clin Nutr. 2016;70(8):879-85.
144. Chen Q, Reimer RA. Dairy protein and leucine alter GLP-1 release and mRNA of genes
involved in intestinal lipid metabolism in vitro. Nutrition. 2009;25(3):340-9.
145. Zhang F, Zhao S, Yan W, Xia Y, Chen X, Wang W, et al. Branched Chain Amino Acids Cause
Liver Injury in Obese/Diabetic Mice by Promoting Adipocyte Lipolysis and Inhibiting Hepatic
Autophagy. EBioMedicine. 2016;13:157-67.
146. Essam M Hamad SHT, Abdel-Gawad I Abou Dawood, Mahmoud Z Sitohy and Mahmoud
Abdel-Hamid. Protective effect of whey proteins against nonalcoholic fatty liver in rats. Lipids
in Health and Disease. 2011;10(57):http://www.lipidworld.com/content/10/1/57.
147. Portune KJ, Beaumont M, Davila A-M, Tomé D, Blachier F, Sanz Y. Gut microbiota role in
dietary protein metabolism and health-related outcomes: The two sides of the coin. Trends in
Food Science & Technology. 2016;57:213-32.
148. Diether NE, Willing BP. Microbial Fermentation of Dietary Protein: An Important Factor in
Diet(-)Microbe(-)Host Interaction. Microorganisms. 2019;7(1).
149. Lopez-Legarrea P, de la Iglesia R, Abete I, Navas-Carretero S, Martinez JA, Zulet MA. The
protein type within a hypocaloric diet affects obesity-related inflammation: the RESMENA
project. Nutrition. 2014;30(4):424-9.
150. Batista MA, Campos NCA, Silvestre MPC, Yildiz F. Whey and protein derivatives:
Applications in food products development, technological properties and functional effects on
child health. Cogent Food & Agriculture. 2018;4(1).
151. Sprong RC, Schonewille AJ, van der Meer R. Dietary cheese whey protein protects rats against
mild dextran sulfate sodium-induced colitis: role of mucin and microbiota. J Dairy Sci.
2010;93(4):1364-71.

168
152. McAllan L, Skuse P, Cotter PD, O'Connor P, Cryan JF, Ross RP, et al. Protein quality and the
protein to carbohydrate ratio within a high fat diet influences energy balance and the gut
microbiota in C57BL/6J mice. PLoS One. 2014;9(2):e88904.
153. Pal S, Ellis V. The chronic effects of whey proteins on blood pressure, vascular function, and
inflammatory markers in overweight individuals. Obesity (Silver Spring). 2010;18(7):1354-9.
154. Windey K, De Preter V, Verbeke K. Relevance of protein fermentation to gut health. Mol Nutr
Food Res. 2012;56(1):184-96.
155. Rist VT, Weiss E, Eklund M, Mosenthin R. Impact of dietary protein on microbiota composition
and activity in the gastrointestinal tract of piglets in relation to gut health: a review. Animal.
2013;7(7):1067-78.
156. Aguirre M, Eck A, Koenen ME, Savelkoul PH, Budding AE, Venema K. Diet drives quick
changes in the metabolic activity and composition of human gut microbiota in a validated in
vitro gut model. Res Microbiol. 2016;167(2):114-25.
157. Liu X, Blouin JM, Santacruz A, Lan A, Andriamihaja M, Wilkanowicz S, et al. High-protein
diet modifies colonic microbiota and luminal environment but not colonocyte metabolism in the
rat model: the increased luminal bulk connection. Am J Physiol Gastrointest Liver Physiol.
2014;307(4):G459-70.
158. Tranberg B, Hellgren LI, Lykkesfeldt J, Sejrsen K, Jeamet A, Rune I, et al. Whey protein reduces
early life weight gain in mice fed a high-fat diet. PLoS One. 2013;8(8):e71439.
159. Gilani GS, Sepehr E. Protein Digestibility and Quality in Products Containing Antinutritional
Factors Are Adversely Affected by Old Age in Rats. The Journal of Nutrition. 2003;133(1):220–
5.
160. Bingham SA. High-meat diets and cancer risk. Proc Nutr Soc. 1999;58(2):243-8.
161. Russell WR, Gratz SW, Duncan SH, Holtrop G, Ince J, Scobbie L, et al. High-protein, reduced-
carbohydrate weight-loss diets promote metabolite profiles likely to be detrimental to colonic
health. Am J Clin Nutr. 2011;93(5):1062-72.
162. George T Macfarlane SM. Bacteria, Colonic Fermentation, and Gastrointestinal Health. Journal
of AOAC INTERNATIONAL. 2012;95(1):50–60.
163. Pieper R, Kroger S, Richter JF, Wang J, Martin L, Bindelle J, et al. Fermentable fiber ameliorates
fermentable protein-induced changes in microbial ecology, but not the mucosal response, in the
colon of piglets. J Nutr. 2012;142(4):661-7.
164. Cloetens L, De Preter V, Swennen K, Broekaert WF, Courtin CM, Delcour JA, et al. Dose-
response effect of arabinoxylooligosaccharides on gastrointestinal motility and on colonic
bacterial metabolism in healthy volunteers. J Am Coll Nutr. 2008;27(4):512-8.
165. Cloetens L, Broekaert WF, Delaedt Y, Ollevier F, Courtin CM, Delcour JA, et al. Tolerance of
arabinoxylan-oligosaccharides and their prebiotic activity in healthy subjects: a randomised,
placebo-controlled cross-over study. Br J Nutr. 2010;103(5):703-13.
166. Curtasu MV. Obesity and metabolic syndrome in miniature pigs as models for human disease –
metabolic changes in response to ad libitum feeding of high-fat-high-carbohydrate diets. PhD
Thesis 2019:Aahus University, Denmark.
167. Rakvaag E. Effects of whey protein and wheat bran on risk factors associated with the metabolic
syndrome in adults with abdominal obesity. PhD Thesis, Aarhus University Hospital, Denmark.
2019.
168. Sørensen AKB. Plant and enterolignans: absorption and kinetics as influenced by dietary factors
and antibiotics. PhD thesis, Aarhus University, Denmark. 2016.
169. Hsu MC, Wang ME, Jiang YF, Liu HC, Chen YC, Chiu CH. Long-term feeding of high-fat plus
high-fructose diet induces isolated impaired glucose tolerance and skeletal muscle insulin
resistance in miniature pigs. Diabetol Metab Syndr. 2017;9:81.
170. Heinritz SN, Mosenthin R, Weiss E. Use of pigs as a potential model for research into dietary
modulation of the human gut microbiota. Nutr Res Rev. 2013;26(2):191-209.

169
171. Gonzalez LM, Moeser AJ, Blikslager AT. Porcine models of digestive disease: the future of
large animal translational research. Transl Res. 2015;166(1):12-27.
172. Guilloteau P, Zabielski R, Hammon HM, Metges CC. Nutritional programming of
gastrointestinal tract development. Is the pig a good model for man? Nutr Res Rev.
2010;23(1):4-22.
173. Kararli TT. COMPARISON OF THE GASTROINTESTINAL ANATOMY, PHYSIOLOGY,
AND BIOCHEMISTRY OF HUMANS AND COMMONLY USED LABORATORY
ANIMALS. BIOPHARMACEUTICS & DRUG DISPOSITION. 1995;16:351-80.
174. Roura E, Koopmans SJ, Lalles JP, Le Huerou-Luron I, de Jager N, Schuurman T, et al. Critical
review evaluating the pig as a model for human nutritional physiology. Nutr Res Rev.
2016;29(1):60-90.
175. Renner S, Blutke A, Dobenecker B, Dhom G, Muller TD, Finan B, et al. Metabolic syndrome
and extensive adipose tissue inflammation in morbidly obese Gottingen minipigs. Mol Metab.
2018;16:180-90.
176. Johansen T, Hansen H, Richelsen B, Malmlöf R. The Obese Gottingen Minipig as a Model of
the Metabolic Syndrome: Dietary Effects on Obesity, Insulin Sensitivity, and Growth Hormone
Profile2001. 150-5 p.
177. Spurlock ME, Gabler NK. The Development of Porcine Models of Obesity and the Metabolic
Syndrome. The Journal of Nutrition. 2008;138:397–402.
178. Thue Johansen HSH, Bjørn Richelsen, and Kjell Malmlöf. The Obese Göttingen Minipig as a
Model of the Metabolic Syndrome: Dietary Effects on Obesity, Insulin Sensitivity, and Growth
Hormone Profile. Comparative Medicine. 2001;51(2):150-5.
179. Kirsten Raun PvV, and Lotte Bjerre Knudsen. Liraglutide, a Once-daily Human Glucagon-like
Peptide-1 Analog, Minimizes Food Intake in Severely Obese Minipigs. OBESITY. 2007;15.
180. Bollen PJA, Madsen LW, Meyer OA, Ritskes-Hoitinga J. Growth differences of male and
female Göttingen minipigs during ad libitum feeding: a pilot study. Laboratory Animals
2005;39:80–93.
181. Christoffersen B, Golozoubova V, Pacini G, Svendsen O, Raun K. The Young Göttingen
Minipig as a Model of Childhood and Adolescent Obesity: Influence of Diet and Gender.
Obesity. 2012.
182. Bergen WG, Mersmann HJ. Comparative Aspects of Lipid Metabolism: Impact on
Contemporary Research and Use of Animal Models. The Journal of Nutrition. 2005;135:2499–
502.
183. Olsen Alstrup AK, Larsen LF, Bladbjerg E-M, Hansen AK, Jespersen J.and Marckmann P. A
high-fat meal does not activate blood coagulation factor VII in minipigs. Blood Coagulation and
Fibrinolysis. 2001;12:117±22.
184. Himes JH. Challenges of accurately measuring and using BMI and other indicators of obesity in
children. Pediatrics. 2009;124 Suppl 1:S3-22.
185. Gurunathan U, Myles PS. Limitations of body mass index as an obesity measure of perioperative
risk. Br J Anaesth. 2016;116(3):319-21.
186. Swindle MM, Makin A, Herron AJ, Clubb FJ, Jr., Frazier KS. Swine as models in biomedical
research and toxicology testing. Vet Pathol. 2012;49(2):344-56.
187. Du ZQ, Fan B, Zhao X, Amoako R, Rothschild MF. Association analyses between type 2
diabetes genes and obesity traits in pigs. Obesity (Silver Spring). 2009;17(2):323-9.
188. Organization. WH. Waist Circumference and Waist-Hip Ratio: Report of a WHO Expert
Consultation Available from
http://apps.who.int/iris/bitstream/10665/44583/1/9789241501491_eng.pdf.
189. Sebert SP, Lecannu G, Kozlowski F, Siliart B, Bard JM, Krempf M, et al. Childhood obesity
and insulin resistance in a Yucatan mini-piglet model: putative roles of IGF-1 and muscle PPARs
in adipose tissue activity and development. Int J Obes (Lond). 2005;29(3):324-33.

170
190. Anwar Borai CLaGAAF. The biochemical assessment of insulin resistanc. Annals of Clinical
Biochemistry. 2007;44:324–42.
191. Vogeser M, Konig D, Frey I, Predel HG, Parhofer KG, Berg A. Fasting serum insulin and the
homeostasis model of insulin resistance (HOMA-IR) in the monitoring of lifestyle interventions
in obese persons. Clin Biochem. 2007;40(13-14):964-8.
192. Muniyappa R, Lee S, Chen H, Quon MJ. Current approaches for assessing insulin sensitivity
and resistance in vivo: advantages, limitations, and appropriate usage. Am J Physiol Endocrinol
Metab. 2008;294(1):E15-26.
193. Anwar Borai CL, Ibrahim Kaddam and Gordon Ferns. Selection of the appropriate method for
the assessment of insulin resistance. Medical Research Methodology 2011;11:158.
194. Chang AM, Smith MJ, Bloem CJ, Galecki AT, Halter JB, Supiano MA. Limitation of the
homeostasis model assessment to predict insulin resistance and beta-cell dysfunction in older
people. J Clin Endocrinol Metab. 2006;91(2):629-34.
195. Saisho Y. Postprandial C-peptide Index: The Best Marker of Beta Cell Function? International
Journal of Diabetes & Clinical Diagnosis. 2014;1(1).
196. Tara M. Wallace JCL, and David R. Matthews. Use and Abuse of HOMA Modeling. Diabetes
Care. 2004;27(6):1487-95.
197. Peker N, Garcia-Croes S, Dijkhuizen B, Wiersma HH, van Zanten E, Wisselink G, et al. A
Comparison of Three Different Bioinformatics Analyses of the 16S-23S rRNA Encoding Region
for Bacterial Identification. Front Microbiol. 2019;10:620.
198. Ingerslev AK. The impact of short-chain fatty acids on metabolic responses - Studies in pigs fed
diets with contrasting sources and levels of dietary fibres. PhD Thesis. 2015.
199. Sakata T. Pitfalls in short-chain fatty acid research: A methodological review. Anim Sci J.
2019;90(1):3-13.
200. Knud Erik Bach Knudsen AS, Anna Kirstin Bjørnbak Kjær, Henry Jørgensen, and Ricarda
Engberg. Rye Bread Enhances the Production and Plasma Concentration of Butyrate but Not the
Plasma Concentrations of Glucose and Insulin in Pigs. J Nutr 2005;135:1696–704.
201. K.E. Bach Knudsen AS, H. Jørgensen, J.L. Peñalvo and H. Adlercreutz. Rye and other natural
cereal fibres enhance the production and plasma concentrations of enterolactone and butyrate.
Dietary fibre components and functions. 2007;Wageningen Academic Publishers:219-33.
202. Kristensen NB, Norgaard JV, Wamberg S, Engbaek M, Fernandez JA, Zacho HD, et al.
Absorption and metabolism of benzoic acid in growing pigs. J Anim Sci. 2009;87(9):2815-22.
203. Bolvig AK, Norskov NP, Hedemann MS, Foldager L, McCarthy-Sinclair B, Marco ML, et al.
Effect of Antibiotics and Diet on Enterolactone Concentration and Metabolome Studied by
Targeted and Nontargeted LC-MS Metabolomics. J Proteome Res. 2017;16(6):2135-50.
204. Peter B, De Rijk EP, Zeltner A, Emmen HH. Sexual Maturation in the Female Gottingen
Minipig. Toxicol Pathol. 2016;44(3):482-5.
205. Fisher KD, Scheffler TL, Kasten SC, Reinholt BM, van Eyk GR, Escobar J, et al. Energy dense,
protein restricted diet increases adiposity and perturbs metabolism in young, genetically lean
pigs. PLoS One. 2013;8(8):e72320.
206. Calder PC, Ahluwalia N, Brouns F, Buetler T, Clement K, Cunningham K, et al. Dietary factors
and low-grade inflammation in relation to overweight and obesity. Br J Nutr. 2011;106 Suppl
3:S5-78.
207. Power-Grant O, Bruen C, Brennan L, Giblin L, Jakeman P, FitzGerald RJ. In vitro bioactive
properties of intact and enzymatically hydrolysed whey protein: targeting the enteroinsular axis.
Food Funct. 2015;6(3):972-80.
208. Bowen J, Noakes M, Clifton PM. Appetite hormones and energy intake in obese men after
consumption of fructose, glucose and whey protein beverages. Int J Obes (Lond).
2007;31(11):1696-703.

171
209. Pal S, Radavelli-Bagatini S, Hagger M, Ellis V. Comparative effects of whey and casein proteins
on satiety in overweight and obese individuals: a randomized controlled trial. Eur J Clin Nutr.
2014;68(9):980-6.
210. Polakof S, Remond D, David J, Dardevet D, Savary-Auzeloux I. Time-course changes in
circulating branched-chain amino acid levels and metabolism in obese Yucatan minipig.
Nutrition. 2018;50:66-73.
211. Chung ST, Hsia DS, Chacko SK, Rodriguez LM, Haymond MW. Increased gluconeogenesis in
youth with newly diagnosed type 2 diabetes. Diabetologia. 2015;58(3):596-603.
212. Weickert MO, Roden M, Isken F, Hoffmann D, Nowotny P, Osterhoff M, et al. Effects of
supplemented isoenergetic diets differing in cereal fiber and protein content on insulin sensitivity
in overweight humans. Am J Clin Nutr. 2011;94(2):459-71.
213. Sandeep Bansal JEB, Nader Rifai, Samia Mora, Frank M. Sacks, Paul M Ridker. Fasting
Compared With Nonfasting Triglycerides and Risk of Cardiovascular Events in Women. JAMA.
2007;298(3):309-16.
214. Kasprzak MM, Laerke HN, Knudsen KE. Effects of isolated and complex dietary fiber matrices
in breads on carbohydrate digestibility and physicochemical properties of ileal effluent from
pigs. J Agric Food Chem. 2012;60(51):12469-76.
215. Tannock GW, Liu Y. Guided dietary fibre intake as a means of directing short-chain fatty acid
production by the gut microbiota. Journal of the Royal Society of New Zealand. 2019:1-22.
216. Le Gall M, Serena A, Jorgensen H, Theil PK, Bach Knudsen KE. The role of whole-wheat grain
and wheat and rye ingredients on the digestion and fermentation processes in the gut--a model
experiment with pigs. Br J Nutr. 2009;102(11):1590-600.
217. Carpita NC, Gibeaut DM. Structural models of primary cell walls in flowering plants:
consistency of molecular structure with the physical properties of the walls during growth. The
Plant Journal. 1993;3(1):1-30.
218. Olejnik K, Skalski B, Stanislawska A, Wysocka-Robak A. Swelling properties and generation
of cellulose fines originating from bleached kraft pulp refined under different operating
conditions. Cellulose. 2017;24(9):3955-67.
219. Xavier-Santos D, Bedani R, Lima ED, Saad SMI. Impact of probiotics and prebiotics targeting
metabolic syndrome. Journal of Functional Foods. 2020;64.
220. Scott NA, Andrusaite A, Andersen P, Lawson M, Alcon-Giner C, Leclaire C, et al. Antibiotics
induce sustained dysregulation of intestinal T cell immunity by perturbing macrophage
homeostasis. Sci Transl Med. 2018;10(464).
221. El Hage R, Hernandez-Sanabria E, Calatayud Arroyo M, Props R, Van de Wiele T. Propionate-
Producing Consortium Restores Antibiotic-Induced Dysbiosis in a Dynamic in vitro Model of
the Human Intestinal Microbial Ecosystem. Front Microbiol. 2019;10:1206.
222. Zhao J, Bai Y, Tao S, Zhang G, Wang J, Liu L, et al. Fiber-rich foods affected gut bacterial
community and short-chain fatty acids production in pig model. Journal of Functional Foods.
2019;57:266-74.
223. G.T. Macfarlane G.R. Gibson E. Beatty J.H. Cummings. Estimation of short-chain fatty acid
production from protein by human intestinal bacteria based on branched-chain fatty acid
measurements. FEMS Microbiology Ecology. 1992;101:81-8.
224. Beaulieu KE, McBurney MI. Changes in Pig Serum Lipids, Nutrient Digestibility and Sterol
Excretion during Cecal Infusion of Propionate. The Journal of Nutrition. 1992;122(2):241-5.
225. Bloemen JG, Venema K, van de Poll MC, Olde Damink SW, Buurman WA, Dejong CH. Short
chain fatty acids exchange across the gut and liver in humans measured at surgery. Clin Nutr.
2009;28(6):657-61.
226. Thomas M.S. Wolever RGJ, Lawrence A. Leiter, and Jean-Louis Chiasson. Time of Day and
Glucose Tolerance Status Affect Serum Short-Chain Fatty Acid Concentrations in Humans.
Metabolism. 1997;46(7):805-11.

172
227. Müller M, Hernández MAG, Goossens GH, Reijnders D, Holst JJ, Jocken JWE, et al. Circulating
but not faecal short-chain fatty acids are related to insulin sensitivity, lipolysis and GLP-1
concentrations in humans. Scientific Reports. 2019;9(1).
228. Wu GD, Chen J, Hoffmann C, Bittinger K, Chen YY, Keilbaugh SA, et al. Linking long-term
dietary patterns with gut microbial enterotypes. Science. 2011;334(6052):105-8.
229. Rivera-Piza A, Lee S-J. Effects of dietary fibers and prebiotics in adiposity regulation via
modulation of gut microbiota. Applied Biological Chemistry. 2020;63(1).
230. Lee CJ, Sears CL, Maruthur N. Gut microbiome and its role in obesity and insulin resistance.
Ann N Y Acad Sci. 2020;1461(1):37-52.
231. Tomova A, Bukovsky I, Rembert E, Yonas W, Alwarith J, Barnard ND, et al. The Effects of
Vegetarian and Vegan Diets on Gut Microbiota. Front Nutr. 2019;6:47.
232. Lavelle A, Sokol H. Gut microbiota-derived metabolites as key actors in inflammatory bowel
disease. Nat Rev Gastroenterol Hepatol. 2020.
233. Brook I, Wexler HM, Goldstein EJ. Antianaerobic antimicrobials: spectrum and susceptibility
testing. Clin Microbiol Rev. 2013;26(3):526-46.
234. Muller N, Worm P, Schink B, Stams AJ, Plugge CM. Syntrophic butyrate and propionate
oxidation processes: from genomes to reaction mechanisms. Environ Microbiol Rep.
2010;2(4):489-99.
235. Toden S, Bird AR, Topping DL, Conlon MA. Differential effects of dietary whey, casein and
soya on colonic DNA damage and large bowel SCFA in rats fed diets low and high in resistant
starch. British Journal of Nutrition. 2007;97(3):535-43.
236. Singh RK, Chang HW, Yan D, Lee KM, Ucmak D, Wong K, et al. Influence of diet on the gut
microbiome and implications for human health. J Transl Med. 2017;15(1):73.
237. Hermes RG, Molist F, Ywazaki M, Nofrarias M, Gomez de Segura A, Gasa J, et al. Effect of
dietary level of protein and fiber on the productive performance and health status of piglets. J
Anim Sci. 2009;87(11):3569-77.
238. Sivaprakasam S, Prasad PD, Singh N. Benefits of short-chain fatty acids and their receptors in
inflammation and carcinogenesis. Pharmacol Ther. 2016;164:144-51.