Validation of the Surrogate Safety Assessment Model for Assessment of Intersection Safety

ww.sciencedirect.com
wat e r r e s e a r c h 4 6 ( 2 0 1 2 ) 6 2 5 7e6 2 7 2
Available online at w
journal homepage: www.elsevier .com/locate/watres
Development of surrogate correlation models to predict traceorganic contaminant oxidation and microbial inactivationduring ozonation
Daniel Gerrity a,b,c,*, Sujanie Gamage c, Darryl Jones d, Gregory V. Korshin e, Yunho Lee f,g,Aleksey Pisarenko c, Rebecca A. Trenholm c, Urs von Gunten g,h, Eric C. Wert c,Shane A. Snyder d
aDepartment of Civil and Environmental Engineering and Construction, University of Nevada, Las Vegas, Box 454015, 4505 S. Maryland
Parkway, Las Vegas, NV 89154-4015, United StatesbTrussell Technologies, Inc., 232 North Lake Avenue, Suite 300, Pasadena, CA 91101, United StatescApplied Research and Development Center, Southern Nevada Water Authority, River Mountain Water Treatment Facility, P.O. Box 99954,
Las Vegas, NV 89193-9954, United StatesdDepartment of Chemical and Environmental Engineering, University of Arizona, 1133 E. James E. Rogers Way, Harshbarger 108, Tucson,
AZ 85721-0011, United StateseCivil & Environmental Engineering, University of Washington, 201 More Hall, Box 352700, Seattle, WA 98195-2700, United Statesf School of Environmental Science and Engineering, Gwangju Institute of Science and Technology (GIST), 123, Oryong-dong, Buk-gu,
Gwangju 500-712, Republic of KoreagEawag, Swiss Federal Institute of Aquatic Science and Technology, Ueberlandstrasse 133, P.O. Box 611, 8600 Duebendorf, Switzerlandh School of Architecture, Civil, and Environmental Engineering (ENAC), Ecole Polytechnique Federale de Lausanne, CH-1015 Lausanne,
Switzerland
a r t i c l e i n f o
Article history:
Received 2 May 2012
Received in revised form
21 August 2012
Accepted 24 August 2012
Available online 13 September 2012
Abbreviations: AFU, arbitrary fluorescencTreatment Plant; BAC, biological activated caCalifornia Department of Public Health; CFUDEET, N,N-diethyl-meta-toluamide; EDC, enmatter; FAT, full advanced treatment; GCGApotable reuse; KOWWTP, KloteneOpfikon WLausanne Wastewater Treatment Plant; MMWRDGC, Metropolitan Water ReclamationPinellas County Utilities; PEG, polyethyleneRWWTP, Regensdorf (Wueri) Wastewater Torganic carbon; TOrCs, trace organic contamWBMWD, West Basin Municipal Water Distr* Corresponding author. Department of Civi
454015, 4505 S. Maryland Parkway, Las VegaE-mail address: [email protected] (
0043-1354/$ e see front matter ª 2012 Elsevhttp://dx.doi.org/10.1016/j.watres.2012.08.037
a b s t r a c t
The performance of ozonation in wastewater depends on water quality and the ability to
form hydroxyl radicals (�OH) to meet disinfection or contaminant transformation objec-
tives. Since there are no on-line methods to assess ozone and �OH exposure in wastewater,
many agencies are now embracing indicator frameworks and surrogate monitoring for
regulatory compliance. Two of the most promising surrogate parameters for ozone-based
treatment of secondary and tertiary wastewater effluents are differential UV254 absorbance
e unit; AOP, advanced oxidation process; AWWTP, Australian (anonymous) Wastewaterrbon; BDF, buffered demand free; CCWRD, Clark County Water Reclamation District; CDPH,, colony forming unit; CLV, City of Las Vegas; CT, concentration � time (as in disinfection);docrine disrupting compound; EEM, excitationeemission matrix; EfOM, effluent organic, Gwinnett County Georgia; GCeMS, gas chromatography mass spectrometry; IPR, indirectastewater Treatment Plant; LCeMS, liquid chromatography mass spectrometry; LWWTP,BR, membrane bioreactor; MPN, most probable number; MRL, method reporting limit;District of Greater Chicago; pCBA, para-chlorobenzoic acid; IPR, indirect potable reuse; PCU,glycol; PFU, plaque forming unit; PPCPs, pharmaceuticals and personal care products;reatment Plant; TCEP, tris-(2-chloroethyl)-phosphate; TF, total fluorescence; TOC, totalinants; TSA, tryptic soy agar; TSB, tryptic soy broth; U.S., United States; UV, ultraviolet;
ict.l and Environmental Engineering and Construction, University of Nevada, Las Vegas, Boxs, NV 89154-4015, United States. Tel.: þ1 (702) 895 3955; fax: þ1 (702) 895 3936.D. Gerrity).ier Ltd. All rights reserved.

wat e r r e s e a r c h 4 6 ( 2 0 1 2 ) 6 2 5 7e6 2 7 26258
Keywords:
Advanced oxidation process (AOP)
Indirect potable reuse (IPR)
Ozone
Trace organic contaminant (TOrC)
Pharmaceutical
UV absorbance
Fluorescence
Disinfection
Indicator
(DUV254) and total fluorescence (DTF). In the current study, empirical correlations for
DUV254 and DTF were developed for the oxidation of 18 trace organic contaminants (TOrCs),
including 1,4-dioxane, atenolol, atrazine, bisphenol A, carbamazepine, diclofenac, gemfi-
brozil, ibuprofen, meprobamate, naproxen, N,N-diethyl-meta-toluamide (DEET), para-
chlorobenzoic acid (pCBA), phenytoin, primidone, sulfamethoxazole, triclosan, trimetho-
prim, and tris-(2-chloroethyl)-phosphate (TCEP) (R2 ¼ 0.50e0.83) and the inactivation of
three microbial surrogates, including Escherichia coli, MS2, and Bacillus subtilis spores
(R2 ¼ 0.46e0.78). Nine wastewaters were tested in laboratory systems, and eight waste-
waters were evaluated at pilot- and full-scale. A predictive model for �OH exposure based
on DUV254 or DTF was also proposed.
ª 2012 Elsevier Ltd. All rights reserved.
1. Introduction pathogens is a costly and time-consuming proposition. As
Trace organic contaminants (TOrCs) pose a challenge for
wastewater treatment facilities due to an increased aware-
ness of their ubiquity, the ambiguity of public and aquatic
health implications, the high costs associated with their
quantification, and the paucity of regulatory guidance. The
use of ozone for the transformation of TOrCs, including
pharmaceuticals and personal care products (PPCPs) and
endocrine disrupting compounds (EDCs), has been studied
extensively in the literature (Huber et al., 2003, 2004; Buffle
et al., 2006; Lee et al., 2008; Dodd et al., 2009; von Sonntag
and von Gunten, 2012). Studies specifically addressing the
efficacy of ozone for TOrC elimination, reductions in estro-
genicity, and the effects on toxicity have also been performed
in pilot- and full-scale systems (Huber et al., 2005; Hollender
et al., 2009; Wert et al., 2009a; Stalter et al., 2010a, 2010b;
Gerrity et al., 2011a; Gerrity and Snyder, 2011; Zimmermann
et al., 2011). Ozone is also effective for the inactivation of
a wide range of microbial indicators and pathogens (Driedger
et al., 2001; Burns et al., 2007; Gerrity et al., 2011a).
This demonstrated efficacy for TOrC mitigation and
disinfection has established ozone as a viable option for
wastewater treatment. Ozone-based treatment trains are also
becoming increasingly popular in indirect potable reuse (IPR)
applications as an alternative to membrane filtration, reverse
osmosis, and UV/H2O2, which is described as full advanced
treatment (FAT) by the California Department of Public Health
(CDPH) in the United States (U.S.) (CDPH, 2011). By combining
ozone with downstream biological filtration, this alternative
treatment train is capable of providing a finishedwater quality
similar to that of FAT, albeit at potentially reduced costs
(Hollender et al., 2009; Reungoat et al., 2010; Stalter et al.,
2010a, 2010b; Gerrity et al., 2011a; Reungoat et al., 2012;
Zimmermann et al., 2011).
In wastewater applications, particularly when supple-
mented with hydrogen peroxide, ozonation can be considered
an advanced oxidation process (AOP) due to its rapid decom-
position into hydroxyl radicals (�OH). In contrast with drinking
water applications (Kaiser et al., submitted for publication),
there are no on-line methods to measure ozone and �OH
exposure in wastewater so the “CT” approach typically asso-
ciated with chlorine disinfection (i.e., the product of oxidant
concentration and time) cannot be applied to estimate treat-
ment performance. Also, frequent monitoring for TOrCs and
a result, many agencies are embracing indicator frameworks
and highlighting the need for surrogate monitoring
(Dickenson et al., 2009). For example, CDPH recently published
a revised set of draft regulations for groundwater replenish-
ment, which outlines required removals for indicator
compounds based on their chemical structures and functional
groups (e.g., hydroxyl aromatic, saturated aliphatic). Although
these specified removals apply only to advanced oxidation in
FAT applications (i.e., reverse osmosis permeate), the frame-
work can be applied more broadly as a TOrC mitigation
baseline. In addition to the specified removals, CDPH also
requires FAT facilities to identify at least one surrogate
parameter that can be monitored continuously, predict the
level of oxidation for the indicator compounds, and alert
operators to process inefficiencies and failures. Several
common water quality parameters associated with bulk
organic matter, specifically differential UV absorbance (DUV)
and total fluorescence (DTF), offer particularly promising
solutions for this type of application.
Currently, there are few studies that describe the rela-
tionships between changes in bulk organic matter, contami-
nant destruction, and microbial inactivation. Studies using
fluorescence as part of an analytical method to detect TOrCs
are becoming more common (Camacho-Munoz et al., 2009),
but the goal of these studies is inherently different than using
changes in bulk organic matter to estimate oxidation efficacy.
Although the high sensitivity of fluorometers offers a prom-
ising tool for detection of individual contaminants, this
method is hindered by interferences from background
effluent organic matter (EfOM) in wastewater applications
(Fig. S1). Therefore, DUVdmore specifically, DUV254dand DTF
currently offer the most promising tools to supplement
existing analytical methods based on liquid or gas chroma-
tography and mass spectrometry (LCeMS or GCeMS).
Buffle et al. (2006) proposed the use of DUV to determine
ozone exposure in wastewater applications after observing
a first-order kinetic relationship between the two parameters.
Based on this concept, Bahr et al. (2007),Wert et al. (2009b), and
Nanaboina and Korshin (2010) developed preliminary correla-
tions between DUV254 and several indicator compounds and
microbes. Bahr et al. (2007) presented the linear regression
parameters in relation to second-order ozone and �OH rate
constants. Wert et al. (2009b) indicated that ozone-susceptible
target compounds (i.e., kO3 > 103 M�1 s�1) demonstrated strong

wat e r r e s e a r c h 4 6 ( 2 0 1 2 ) 6 2 5 7e6 2 7 2 6259
linear correlationswith0e50%reductions inUV254absorbance,
whereas slower-reacting compounds (i.e., kO3 < 103 M�1 s�1)
correlatedwellwith15e65%reductions inUV254absorbance. In
addition to developing individual correlations for six phar-
maceuticals, the study indicated that the empirical
correlations were consistent between different wastewater
qualities. Rosario-Ortiz et al. (2010) extended this concept to
the UV/H2O2 advanced oxidation process and confirmed
that these correlations were also consistent between
different water qualities. These preliminary studies indicate
that DUV254 correlations offer powerful, robust, and straight-
forward tools that can easily be incorporated into full-scale
applications.
Several studies have expanded on this preliminary
research to incorporate both commercially available and
innovative technologies. Pisarenko et al. (2012) developed a set
of TOrC correlations based on DUV254 and DTF using a pilot-
scale O3/H2O2 reactor (HiPOx�, APTwater, Long Beach, CA),
while Gerrity et al. (2010) illustrated how the DUV254 correla-
tion concept can be applied to novel forms of advanced
oxidation, specifically nonthermal plasma (AquaPure, Petach-
Tikva, Israel). Therefore, the existing literature offers the
following conclusions: (1) DUV and DTF are strongly correlated
with the elimination of aromatic and non-aromatic TOrCs, (2)
each compound has a unique set of regression parameters
related to its second-order rate constants for reactions with
various oxidants, (3) unit processes with different oxidation
mechanisms (e.g., ozone/H2O2 vs. UV/H2O2) also have unique
sets of correlations, and (4) the correlations for specific
contaminants and oxidation processes are consistent
between different secondary or tertiary effluents.
The objective of the current study was to expand on this
foundation by developing a more comprehensive database of
Table 1 e Summary of average water quality data for the benc
Sample ID Location pH TOCmg/L
UV254
cm�1TFAF
Secondary effluents for bench-scale experiments (after laboratory filtration)
CCWRD Nevada 6.9 7.6 0.146 38,8
MWRDGC Illinois 7.6 6.9 0.131 37,7
WBMWD California 7.3 18.0 0.268 94,8
PCU Florida 7.3 7.2 0.187 53,9
GCGA Georgia 7.3 6.3 0.130 34,7
LWWTP Switzerland 7.2 6.0 0.099 27,2
RWWTP Switzerland 7.2 4.7 0.129 N/A
KOWWTP Switzerland 7.0 4.7 0.110 N/A
AWWTP Australia 7.2 7.0 0.201 51,6
Tertiary effluents for pilot-scale experiments
Lit. 1a Nevada 8.2 6.6 0.140 N/A
Lit. 2a Florida 7.6 10.3 0.260 N/A
Lit. 3a Colorado 7.1 10.3 0.171 N/A
Reno 1b Nevada 6.9 5.9 0.120 32,6
Reno 2b Nevada 6.9 6.6 0.140 31,5
Tucson Arizona N/A 5.6 0.157 46,4
CLVc Nevada 7.3 6.0 0.130 26,9
Tertiary effluent for full-scale sampling
Springfield Missouri 7.9 4.9 0.116 28,7
a Wert et al., 2009b (sand-filtered tertiary effluents).
b Gerrity et al., 2011a (Reno 1 ¼ ultrafiltration effluent; Reno 2 ¼ sand-fil
c Pisarenko et al., 2012 (MBR pilot).
bench-scale correlations (i.e., increase the number of
contaminants and matrices), validating those same correla-
tions at pilot- and full-scale, and illustrating how the concept
can be integrated into an actual treatment train to provide
real-time, on-line monitoring of process performance. This
study incorporated 18 trace organic contaminants, three
microbial surrogates, nine sets of bench-scale experiments,
four independent pilot-scale validations, and one full-scale
validation. A commercially available on-line UV absorbance
analyzer was also integrated into the study. Ultimately, this
database can be integrated into the software of emerging
absorbance and fluorescence technologies to allow for opti-
mization of dosing conditions and to provide real-time esti-
mates of contaminant oxidation and disinfection.
2. Materials and methods
2.1. Bench-scale experiments
Unfiltered secondary effluent was collected from nine waste-
water treatment facilities, as described in Table 1. For the five
wastewaters from the U.S., a portion of the secondary effluent
was filtered in series through 10-mm and 0.5-mm (nominal)
polypropylene spiral-wound cartridge filters (MicroSentry�,
Shelco Filters, Middletown, CT). The four remaining waste-
waters were filtered in the laboratory with 0.45-mm cellulose
acetate filters. Differences in oxidation efficacy for unfiltered
versus filtered secondary effluents were evaluated during the
bench-scale phase. Each matrix was analyzed for a variety of
general water quality parameters (Table 1) to characterize the
matrices and determine the appropriate ozone and H2O2
dosing conditions.
h- (filtered), pilot-, and full-scale experiments.
UAlkalinity
mg/L as CaCO3
NH3
mg-N/LNO3
mg-N/LNO2
mg-N/L
74 123 0.09 14.0 0.06
12 134 0.07 9.10 <0.05
07 332 46.9 0.11 0.17
96 205 0.02 7.70 <0.05
95 169 5.80 8.60 0.30
38 65 0.11 24.0 0.16
220 0.03 12.0 0.01
145 0.02 13.2 0.07
42 105 0.09 18.0 0.05
128 <0.20 13.0 <0.05
269 6.98 0.07 0.77
101 1.28 9.70 0.40
08 90 N/A N/A <0.05
05 90 N/A N/A <0.05
96 N/A N/A N/A N/A
88 99 <0.50 13.8 <0.10
82 N/A <0.10 11.0 N/A
tered tertiary effluent).
wat e r r e s e a r c h 4 6 ( 2 0 1 2 ) 6 2 5 7e6 2 7 26260
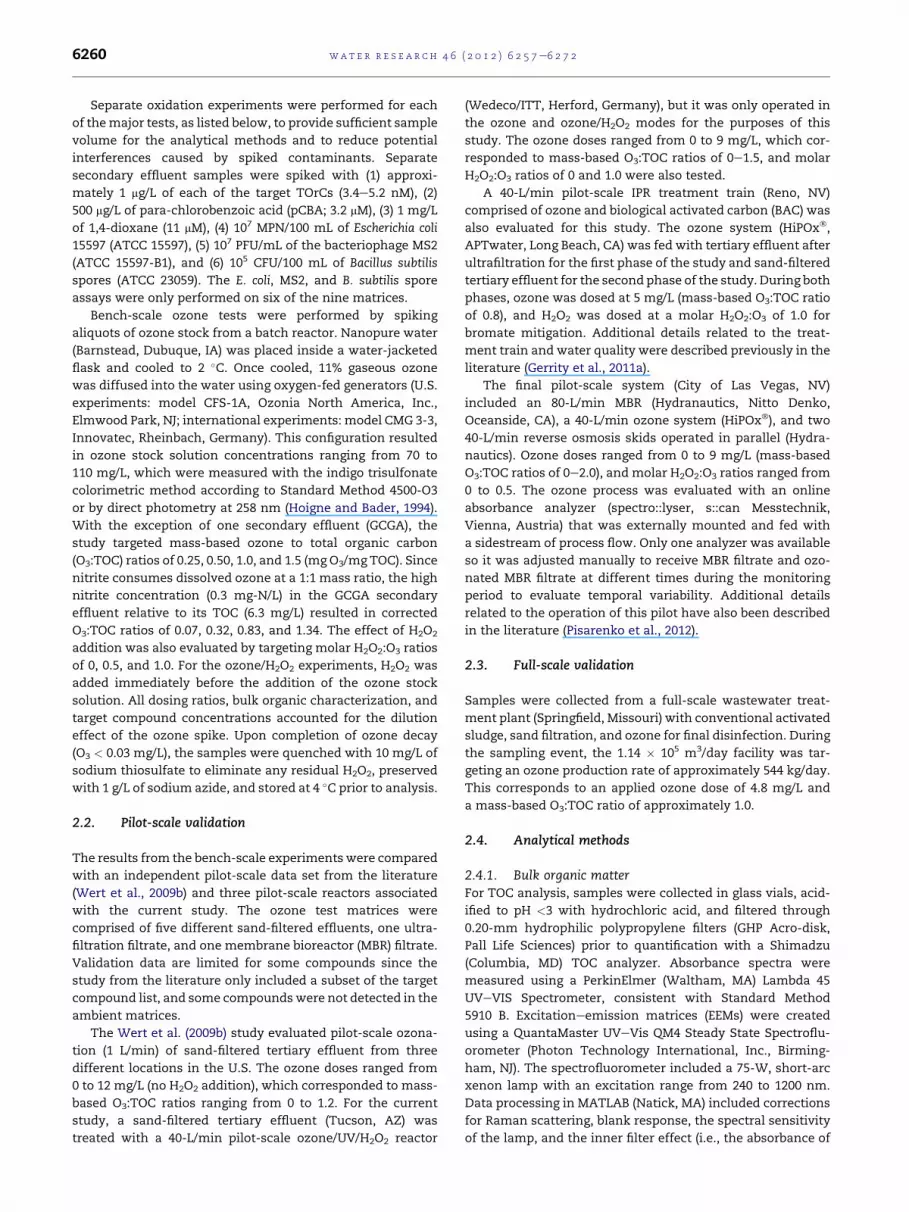
Separate oxidation experiments were performed for each
of themajor tests, as listed below, to provide sufficient sample
volume for the analytical methods and to reduce potential
interferences caused by spiked contaminants. Separate
secondary effluent samples were spiked with (1) approxi-
mately 1 mg/L of each of the target TOrCs (3.4e5.2 nM), (2)
500 mg/L of para-chlorobenzoic acid (pCBA; 3.2 mM), (3) 1 mg/L
of 1,4-dioxane (11 mM), (4) 107 MPN/100 mL of Escherichia coli
15597 (ATCC 15597), (5) 107 PFU/mL of the bacteriophage MS2
(ATCC 15597-B1), and (6) 105 CFU/100 mL of Bacillus subtilis
spores (ATCC 23059). The E. coli, MS2, and B. subtilis spore
assays were only performed on six of the nine matrices.
Bench-scale ozone tests were performed by spiking
aliquots of ozone stock from a batch reactor. Nanopure water
(Barnstead, Dubuque, IA) was placed inside a water-jacketed
flask and cooled to 2 �C. Once cooled, 11% gaseous ozone
was diffused into the water using oxygen-fed generators (U.S.
experiments: model CFS-1A, Ozonia North America, Inc.,
Elmwood Park, NJ; international experiments: model CMG 3-3,
Innovatec, Rheinbach, Germany). This configuration resulted
in ozone stock solution concentrations ranging from 70 to
110 mg/L, which were measured with the indigo trisulfonate
colorimetric method according to Standard Method 4500-O3
or by direct photometry at 258 nm (Hoigne and Bader, 1994).
With the exception of one secondary effluent (GCGA), the
study targeted mass-based ozone to total organic carbon
(O3:TOC) ratios of 0.25, 0.50, 1.0, and 1.5 (mg O3/mg TOC). Since
nitrite consumes dissolved ozone at a 1:1 mass ratio, the high
nitrite concentration (0.3 mg-N/L) in the GCGA secondary
effluent relative to its TOC (6.3 mg/L) resulted in corrected
O3:TOC ratios of 0.07, 0.32, 0.83, and 1.34. The effect of H2O2
addition was also evaluated by targeting molar H2O2:O3 ratios
of 0, 0.5, and 1.0. For the ozone/H2O2 experiments, H2O2 was
added immediately before the addition of the ozone stock
solution. All dosing ratios, bulk organic characterization, and
target compound concentrations accounted for the dilution
effect of the ozone spike. Upon completion of ozone decay
(O3 < 0.03 mg/L), the samples were quenched with 10 mg/L of
sodium thiosulfate to eliminate any residual H2O2, preserved
with 1 g/L of sodium azide, and stored at 4 �C prior to analysis.
2.2. Pilot-scale validation
The results from the bench-scale experimentswere compared
with an independent pilot-scale data set from the literature
(Wert et al., 2009b) and three pilot-scale reactors associated
with the current study. The ozone test matrices were
comprised of five different sand-filtered effluents, one ultra-
filtration filtrate, and one membrane bioreactor (MBR) filtrate.
Validation data are limited for some compounds since the
study from the literature only included a subset of the target
compound list, and some compoundswere not detected in the
ambient matrices.
The Wert et al. (2009b) study evaluated pilot-scale ozona-
tion (1 L/min) of sand-filtered tertiary effluent from three
different locations in the U.S. The ozone doses ranged from
0 to 12 mg/L (no H2O2 addition), which corresponded to mass-
based O3:TOC ratios ranging from 0 to 1.2. For the current
study, a sand-filtered tertiary effluent (Tucson, AZ) was
treated with a 40-L/min pilot-scale ozone/UV/H2O2 reactor
(Wedeco/ITT, Herford, Germany), but it was only operated in
the ozone and ozone/H2O2 modes for the purposes of this
study. The ozone doses ranged from 0 to 9 mg/L, which cor-
responded to mass-based O3:TOC ratios of 0e1.5, and molar
H2O2:O3 ratios of 0 and 1.0 were also tested.
A 40-L/min pilot-scale IPR treatment train (Reno, NV)
comprised of ozone and biological activated carbon (BAC) was
also evaluated for this study. The ozone system (HiPOx�,
APTwater, Long Beach, CA) was fed with tertiary effluent after
ultrafiltration for the first phase of the study and sand-filtered
tertiary effluent for the second phase of the study. During both
phases, ozone was dosed at 5 mg/L (mass-based O3:TOC ratio
of 0.8), and H2O2 was dosed at a molar H2O2:O3 of 1.0 for
bromate mitigation. Additional details related to the treat-
ment train and water quality were described previously in the
literature (Gerrity et al., 2011a).
The final pilot-scale system (City of Las Vegas, NV)
included an 80-L/min MBR (Hydranautics, Nitto Denko,
Oceanside, CA), a 40-L/min ozone system (HiPOx�), and two
40-L/min reverse osmosis skids operated in parallel (Hydra-
nautics). Ozone doses ranged from 0 to 9 mg/L (mass-based
O3:TOC ratios of 0e2.0), and molar H2O2:O3 ratios ranged from
0 to 0.5. The ozone process was evaluated with an online
absorbance analyzer (spectro::lyser, s::can Messtechnik,
Vienna, Austria) that was externally mounted and fed with
a sidestream of process flow. Only one analyzer was available
so it was adjusted manually to receive MBR filtrate and ozo-
nated MBR filtrate at different times during the monitoring
period to evaluate temporal variability. Additional details
related to the operation of this pilot have also been described
in the literature (Pisarenko et al., 2012).
2.3. Full-scale validation
Samples were collected from a full-scale wastewater treat-
ment plant (Springfield, Missouri) with conventional activated
sludge, sand filtration, and ozone for final disinfection. During
the sampling event, the 1.14 � 105 m3/day facility was tar-
geting an ozone production rate of approximately 544 kg/day.
This corresponds to an applied ozone dose of 4.8 mg/L and
a mass-based O3:TOC ratio of approximately 1.0.
2.4. Analytical methods
2.4.1. Bulk organic matterFor TOC analysis, samples were collected in glass vials, acid-
ified to pH <3 with hydrochloric acid, and filtered through
0.20-mm hydrophilic polypropylene filters (GHP Acro-disk,
Pall Life Sciences) prior to quantification with a Shimadzu
(Columbia, MD) TOC analyzer. Absorbance spectra were
measured using a PerkinElmer (Waltham, MA) Lambda 45
UVeVIS Spectrometer, consistent with Standard Method
5910 B. Excitationeemission matrices (EEMs) were created
using a QuantaMaster UVeVis QM4 Steady State Spectroflu-
orometer (Photon Technology International, Inc., Birming-
ham, NJ). The spectrofluorometer included a 75-W, short-arc
xenon lamp with an excitation range from 240 to 1200 nm.
Data processing in MATLAB (Natick, MA) included corrections
for Raman scattering, blank response, the spectral sensitivity
of the lamp, and the inner filter effect (i.e., the absorbance of

wat e r r e s e a r c h 4 6 ( 2 0 1 2 ) 6 2 5 7e6 2 7 2 6261
the matrix). Regional integration was performed according to
published literature (Chen et al., 2003) with slight modifica-
tions (Gerrity et al., 2011a) to calculate the regional and total
fluorescence intensities (in arbitrary fluorescence units) for
each sample.
2.4.2. Trace organic contaminantsIn addition to pCBA and 1,4-dioxane, the following TOrCswere
targeted in this study: atenolol, atrazine, bisphenol A, carba-
mazepine, N,N-diethyl-meta-toluamide (DEET), diclofenac,
gemfibrozil, ibuprofen, meprobamate, musk ketone, nap-
roxen, phenytoin, primidone, sulfamethoxazole, tris-(2-
chloroethyl)-phosphate (TCEP), triclosan, and trimethoprim.
Due to its high volatility, musk ketone was subsequently
omitted from the study.
Table 2 e Summary of target compounds and rate constants.
Compounda MRL (ng/L) kO3 (M�1 s�1), pH ¼Group 1 e High reactivity with both ozone and �OH
Bisphenol Ah,i 50 7 � 105
Carbamazepinec 10 3 � 105
Diclofenacc 25 1 � 106
Naproxend,s 25 2 � 105
Sulfamethoxazolec 25 3 � 106
Triclosane,j 25 4 � 107
Trimethoprimf 10 3 � 105
Group 2 e Moderate reactivity with ozone and high reactivity with �OH
Atenololg 25 2 � 103
Gemfibrozilj,k 10 5 � 104
Group 3 e Moderate reactivity with both ozone and �OH
DEETj,l 25 <10
Ibuprofenc 25 10
pCBAp 10,000 <0.1
Phenytoinj,m 10 <10
Primidoner,j 10 1
Group 4 e Low reactivity with ozone and moderate reactivity with �OH
1,4-Dioxaneq 500 <1
Atrazinen 10 6
Meprobamatej 10 <1
Group 5 e Low reactivity with both ozone and �OH
Musk Ketonej 100 <1
TCEPj,o 200 <1
a Superscripts refer to sources of O3 (pH ¼ 7) and �OH rate constants, res
b CDPH, 2011; Groups AeG require 0.5-log removal and Groups HeI requ
c Huber et al. (2003).
d Huber et al. (2005).
e Suarez et al. (2007).
f Dodd et al. (2006).
g Benner et al. (2008).
h Deborde et al. (2005).
i Rosenfeldt and Linden (2004).
j Lee and von Gunten (2012)
k Razavi et al. (2009).
l Song et al. (2009).
m Yuan et al. (2009).
n Acero et al. (2000).
o Watts and Linden (2009).
p Katsoyiannis et al. (2011).
q Bowman et al. (2001).
r Real et al. (2009).
s Packer et al. (2003).
These target compounds were analyzed using a Symbiosis
(Spark Holland, Emmen, the Netherlands) automated on-line
solid phase extractor and a 4000 QTRAP triple quadrupole-
linear ion trap hybrid mass spectrometer (ABSCIEX, Foster
City, CA, USA). Full method descriptions and parameters,
including acquisition and preparation of the TOrC spike and
standard solutions, have been described previously (Trenholm
et al., 2009; Gerrity et al., 2011b). The 1,4-dioxane sampleswere
processed and analyzed by Weck Laboratories (Industry, CA)
using EPA Methods 3520C and 8270M, respectively. The pCBA
samples were analyzed by LCeMS/MS according to previously
publishedmethods (Vanderford et al., 2007).
The method reporting limits (MRLs) and second-order
ozone and �OH rate constants for the reactions with these
compounds are summarized in Table 2. The compounds were
7 k�OH (M�1 s�1) CDPH Classificationb
1 � 1010 A. Hydroxy Aromatic
9 � 109 C. Nonaromatic with carbon
double bonds
8 � 109 D. Deprotonated amine
1 � 1010 E. Alkoxy polyaromatic
6 � 109 B. Amino/acylamino aromatic
1 � 1010 A. Hydroxy aromatic
7 � 109 D. Deprotonated amine
8 � 109 D. Deprotonated amine
1 � 1010 F. Alkoxy aromatic
5 � 109 G. Alkyl aromatic
7 � 109 G. Alkyl aromatic
5 � 109 G. Alkyl aromatic
6 � 109 G. Alkyl aromatic
7 � 109 G. Alkyl aromatic
3 � 109 Alternative criterion
(0.5-log removal)
3 � 109 D. Deprotonated amine
4 � 109 H. Saturated aliphatic
2 � 108 I. Nitro aromatic
6 � 108 H. Saturated aliphatic
pectively.
ire 0.3-log removal.
wat e r r e s e a r c h 4 6 ( 2 0 1 2 ) 6 2 5 7e6 2 7 26262
divided into five groups according to their relative reactivity
with ozone and �OH, and they were also classified according
to the recently revised CDPH Groundwater Replenishment
Reuse regulations (CDPH, 2011). For context, the advanced
oxidation process in every FAT facility in the State of Cal-
ifornia must demonstrate 0.5-log (groups AeG) and 0.3-log
(groups HeI) removal of at least one indicator compound in
each group. Alternatively, the facility may demonstrate 0.5-
log removal of 1,4-dioxane in accordance with the previous
draft regulations. In the context of this study, the CDPH
regulations can generally be achieved by demonstrating 0.5-
log removal for groups 1e3 and 0.3-log removal for groups
4e5. It is important to note that this CDPH classification
scheme specifically applies to RO permeate, but it is included
in this study for oxidation of secondary and tertiary effluents
as a treatment baseline.
2.4.3. Microbial surrogatesE. coli samples were assayed with the 24-h Colilert (Idexx,
Westbrook, ME) method using the Quanti-Tray 2000 quantifi-
cation protocol. E. coli 15597 spiking stocks were propagated in
log phase in tryptic soy broth (TSB). The concentrated stocks
were then centrifuged, washed, and resuspended in buffered
demand-free (BDF) water (Thurston-Enriquez et al., 2003). The
final stocks generally contained w1010 CFU/100 mL.
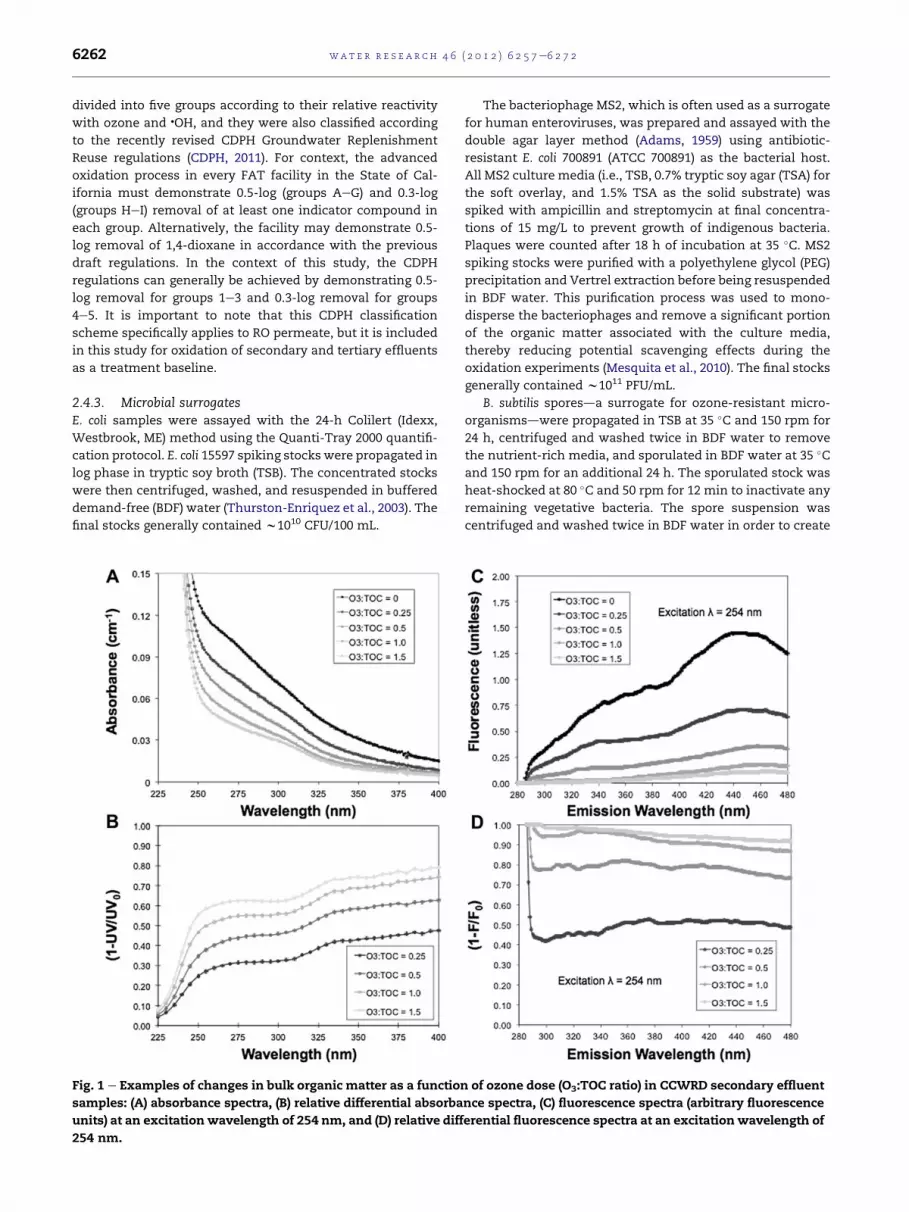
Fig. 1 e Examples of changes in bulk organic matter as a functio
samples: (A) absorbance spectra, (B) relative differential absorba
units) at an excitation wavelength of 254 nm, and (D) relative diff
254 nm.
The bacteriophage MS2, which is often used as a surrogate
for human enteroviruses, was prepared and assayed with the
double agar layer method (Adams, 1959) using antibiotic-
resistant E. coli 700891 (ATCC 700891) as the bacterial host.
All MS2 culture media (i.e., TSB, 0.7% tryptic soy agar (TSA) for
the soft overlay, and 1.5% TSA as the solid substrate) was
spiked with ampicillin and streptomycin at final concentra-
tions of 15 mg/L to prevent growth of indigenous bacteria.
Plaques were counted after 18 h of incubation at 35 �C. MS2
spiking stocks were purified with a polyethylene glycol (PEG)
precipitation and Vertrel extraction before being resuspended
in BDF water. This purification process was used to mono-
disperse the bacteriophages and remove a significant portion
of the organic matter associated with the culture media,
thereby reducing potential scavenging effects during the
oxidation experiments (Mesquita et al., 2010). The final stocks
generally contained w1011 PFU/mL.
B. subtilis sporesda surrogate for ozone-resistant micro-
organismsdwere propagated in TSB at 35 �C and 150 rpm for
24 h, centrifuged and washed twice in BDF water to remove
the nutrient-rich media, and sporulated in BDF water at 35 �Cand 150 rpm for an additional 24 h. The sporulated stock was
heat-shocked at 80 �C and 50 rpm for 12 min to inactivate any
remaining vegetative bacteria. The spore suspension was
centrifuged and washed twice in BDF water in order to create
n of ozone dose (O3:TOC ratio) in CCWRD secondary effluent
nce spectra, (C) fluorescence spectra (arbitrary fluorescence
erential fluorescence spectra at an excitation wavelength of

wat e r r e s e a r c h 4 6 ( 2 0 1 2 ) 6 2 5 7e6 2 7 2 6263
the final spiking stock. The final stocks generally contained
w108 CFU/100 mL in the sporulated form. All spore samples
were heat-shocked at 80 �C (�5 �C) and 50 rpm for 12min prior
to plating. Samples with higher anticipated concentrations of
spores (i.e.,>20/mL) were assayedwith the pour platemethod
using molten nutrient agar (1%) supplemented with trypan
blue. Lower concentrations of spores were assayed with
membrane filtration using 0.45-mm filters and nutrient agar
plates supplemented with trypan blue. Plates were counted
after 24 h of incubation at 35 �C.
3. Results and discussion
3.1. Selection of surrogate parameters
Analysis of the full absorbance spectra for each sample indi-
cated that ozone and ozone/H2O2 resulted in prominent and
monotonic decreases in absorbance at all wavelengths. An
example is provided for CCWRD in Fig. 1A. These decreases
were also highly reproducible with other secondary effluents.
Themaximum differentials occurred at wavelengths between
250 and 270 nm, and the relative differentials (Fig. 1B; i.e.,
DUV) offered easily decipherable plateaus between 250 and
300 nm.With respect to fluorescence, all major constituents of
EfOM (i.e., microbial biopolymers, fulvic-like, and humic-like
species) experienced significant reductions in fluorescence,
although the rates of transformation differed between the
major groups (data not shown). The fluorescence spectra at an
excitation wavelength of 254 nm for ozonated CCWRD
samples are illustrated in Fig. 1C, and the corresponding
relative differential fluorescence spectra (i.e., DTF) are illus-
trated in Fig. 1D. These observations confirm that changes in
absorbance and fluorescence reflect the behavior of the entire
ensemble of compounds comprising EfOM. Furthermore,
these observations support the conclusion that treatment
efficacy can theoretically be evaluated based on measure-
ments at practically any wavelength, or in the case of
Fig. 2 e Relative reductions in (A) UV254 absorbance (DUV254) and
after ozonation (H2O2:O3 [ 0e1.0) in the laboratory systems.
fluorescence, using any reasonable combination of excitation
and emission wavelengths.
One issue that has not been addressed in the literature is
the effect of TOrC-specific properties on correlationmodels. In
order to explore this concept in greater detail, the absorbance
and fluorescence fingerprints of individual target compounds
spiked in deionized water (w10 mg/L) were evaluated
(Supplementary Information Appendix 1; SI-A1). Preliminary
correlations were developed for compound-specific properties
(e.g., maximum absorbance wavelength, excitation and
emission wavelengths corresponding to maximum fluores-
cence), but these correlations did not provide any significant
benefits over DUV254 or DTF. Based on these observations,
there was insufficient evidence to justify selection of
compound-specific parameters. Therefore, the empirical
correlations described below were based on the bulk organic
parameters most commonly discussed in practice (DUV254)
and research (DTF).
After aggregating the DUV254 and DTF data from the nine
sets of bench-scale experiments (Fig. 2), the reductions in
UV254 absorbance and total fluorescence were described by
the equations below. The models based on a specific H2O2:O3
ratio sometimes provide stronger correlations than the
generic model.
AllH2O2: O3: DUV254ð%Þ ¼ 100 �0:46ðO3 :TOCÞ0:53 R2 ¼ 0:87 (1)
All H2O2: O3: DTFð%Þ ¼ 100 � 0:83ðO3 : TOCÞ0:35 R2 ¼ 0:77 (2)
H2O2:O3 ¼ 0 : DUV254ð%Þ¼ 100�0:51ðO3 :TOCÞ0:63 R2 ¼0:92 (3)
H2O2: O3 ¼ 0 : DTFð%Þ ¼ 100 �0:85ðO3 :TOCÞ0:37 R2 ¼ 0:78 (4)
H2O2:O3¼0:5: DUV254ð%Þ¼100�0:45ðO3 :TOCÞ0:48 R2¼0:90 (5)
H2O2: O3 ¼ 0:5: DTF ð%Þ ¼ 100 �0:84ðO3 :TOCÞ0:33 R2 ¼ 0:77 (6)
H2O2:O3 ¼ 1:0 : DUV254ð%Þ¼ 100�0:42ðO3 :TOCÞ0:45R2 ¼0:86 (7)
(B) total fluorescence (DTF) for the nine secondary effluents
wat e r r e s e a r c h 4 6 ( 2 0 1 2 ) 6 2 5 7e6 2 7 26264
H2O2: O3 ¼ 1:0 : DTFð%Þ ¼ 100 � 0:81ðO3 : TOCÞ0:35 R2 ¼ 0:77 (8)
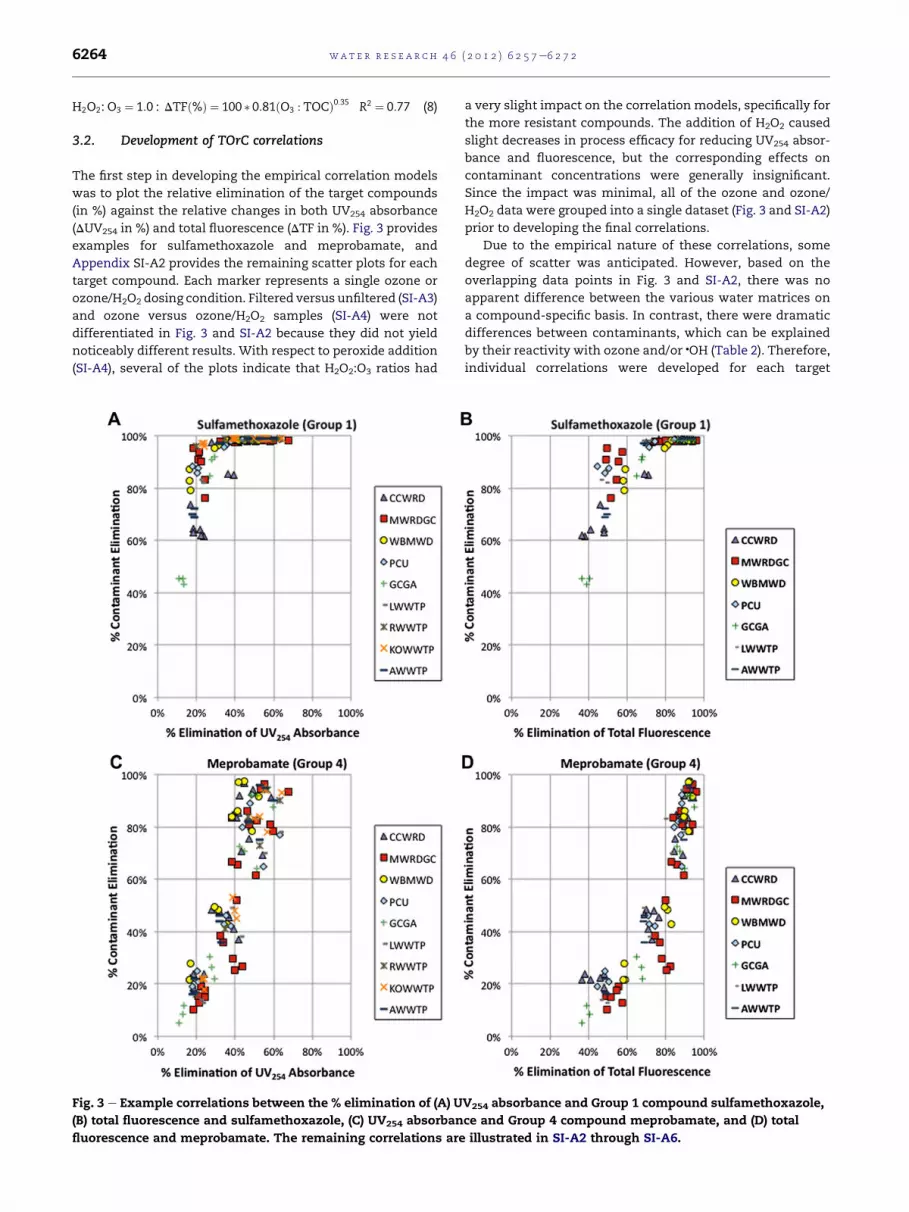
3.2. Development of TOrC correlations
The first step in developing the empirical correlation models
was to plot the relative elimination of the target compounds
(in %) against the relative changes in both UV254 absorbance
(DUV254 in %) and total fluorescence (DTF in %). Fig. 3 provides
examples for sulfamethoxazole and meprobamate, and
Appendix SI-A2 provides the remaining scatter plots for each
target compound. Each marker represents a single ozone or
ozone/H2O2 dosing condition. Filtered versus unfiltered (SI-A3)
and ozone versus ozone/H2O2 samples (SI-A4) were not
differentiated in Fig. 3 and SI-A2 because they did not yield
noticeably different results. With respect to peroxide addition
(SI-A4), several of the plots indicate that H2O2:O3 ratios had
Fig. 3 e Example correlations between the % elimination of (A) U
(B) total fluorescence and sulfamethoxazole, (C) UV254 absorban
fluorescence and meprobamate. The remaining correlations are
a very slight impact on the correlation models, specifically for
the more resistant compounds. The addition of H2O2 caused
slight decreases in process efficacy for reducing UV254 absor-
bance and fluorescence, but the corresponding effects on
contaminant concentrations were generally insignificant.
Since the impact was minimal, all of the ozone and ozone/
H2O2 data were grouped into a single dataset (Fig. 3 and SI-A2)
prior to developing the final correlations.
Due to the empirical nature of these correlations, some
degree of scatter was anticipated. However, based on the
overlapping data points in Fig. 3 and SI-A2, there was no
apparent difference between the various water matrices on
a compound-specific basis. In contrast, there were dramatic
differences between contaminants, which can be explained
by their reactivity with ozone and/or �OH (Table 2). Therefore,
individual correlations were developed for each target
V254 absorbance and Group 1 compound sulfamethoxazole,
ce and Group 4 compound meprobamate, and (D) total
illustrated in SI-A2 through SI-A6.

wat e r r e s e a r c h 4 6 ( 2 0 1 2 ) 6 2 5 7e6 2 7 2 6265
compound according to Eq. (9), and the corresponding
regression parameters are summarized in Table 3.
These correlations focus on the linear portion of the decay
curves due to practical treatment limitations for most
compounds (i.e., maximum practical removal < 99%). For the
fast-reacting compounds, the concentrations rapidly
approached their respective MRLs even at the lowest O3:TOC
ratio (i.e., nearly vertical lines). Since the data that were
<MRL would distort the linear regression analyses, some of
the data points were excluded, as indicated by the “NUV” or
“NTF” parameter for each compound. The compounds within
the same group were treated similarly in order to reduce any
artificial biases.
�1� ½C�
½C0��� 100ð%Þ ¼ Slope �
��1� UV or TF
UV0 or TF0
�� 100�%��
þ Intercept (9)
The target compounds were separated into five groups
based on their reactivity with ozone and �OH. These differ-
ences in reactivity affected themagnitudes of their slopes and
vertical intercepts, which will be described below. Table 3
Table 3 e Summary of regression parameters.
Contaminant NUV j NTF UV254 absor
Slope Interce
Group 1a
Bisphenol A 30 j 26 N/A
Carbamazepine 30 j 26 N/A
Diclofenac 30 j 26 N/A
Naproxen 30 j 26 N/A
Sulfamethoxazole 30 j 26 N/A
Triclosan 30 j 26 N/A
Trimethoprim 30 j 26 N/A
Indicator 210 j 182 N/A
Group 2a
Atenolol 60 j 52 2.37 �4
Gemfibrozil 60 j 52 1.80 31
Indicator 120 j 104 2.08 13
Group 3a
DEET 60 j 52 1.59 �2
Ibuprofen 60 j 52 1.62 5
pCBA 42 j 42 1.31 3
Phenytoin 60 j 52 1.72 2
Primidone 60 j 52 1.54 �1
Indicator 282 j 250 1.58 1
Group 4a
1,4-Dioxane 40 j 40 1.57 �18
Atrazine 124 j 104 1.79 �21
Meprobamate 124 j 104 1.87 �16
Indicator 288 j 248 1.80 �19
Group 5a
TCEP 121 j 101 0.57 �7
Microbial inactivationb
E. coli 95 j 95 0.13 �1.2
MS2 94 j 94 0.14 �0.1
Bacillus Spores 15 j 15 N/A N/A
NUV and NTF refer to the number of data point used in the development o
a % compound elimination vs. % organic surrogate elimination (see Eq. (
b Log inactivation vs. % organic surrogate elimination (see Eq. (19)).
also provides regression parameters for a representative
“Indicator” in each group based on all of the constituent
compounds combined. Finally, Table 4 summarizes the
required removals of the organic surrogate parameters to
achieve various treatment thresholds (i.e., 90% removal or the
relevant CDPH requirement).
For Group 1, the contaminant degradation profiles were so
steep, as illustrated in Fig. 3A, that it was not possible to
describe the removal rate based on DUV254 (i.e., R2 < 0.2).
Although it was possible to develop correlation models with
DTF, the correlationswere relatively weak (i.e., R2< 0.57).With
respect to the DTF models in Table 3, the Group 1 compounds
were generally characterized by high slopes (>1.6) with low
vertical intercepts (<10) or low slopes (<1.6) with high vertical
intercepts (>10). The high slopes indicate rapid reaction rates,
as would be expected for these compounds, and the low
vertical intercepts indicate that elimination of these particular
compounds started at the same time as the elimination of
UV254 absorbance and total fluorescence. In contrast, the
fastest reacting compounds, including triclosan, bisphenol A,
and diclofenac, had lower slopes because their oxidation
started quicker than that of UV254 absorbance and total
bance Total fluorescence
pt R2 Slope Intercept R2
1.33 22 0.56
1.72 �3 0.53
1.48 12 0.56
1.74 �4 0.55
1.66 �6 0.54
1.00 41 0.57
1.60 4 0.50
1.51 10 0.47
0.79 1.55 �33 0.83
0.62 1.32 0 0.77
0.59 1.43 �17 0.68
0.67 1.07 �24 0.76
0.64 1.15 �20 0.77
0.48 0.86 �15 0.54
0.60 1.16 �22 0.66
0.65 1.05 �22 0.74
0.58 1.06 �20 0.65
0.69 1.29 �57 0.70
0.76 1.46 �61 0.80
0.64 1.53 �59 0.82
0.74 1.46 �59 0.76
0.56 0.44 �19 0.56
0.47 0.10 �3.6 0.46
0.71 0.11 �3.4 0.78
f the regression parameters.
9)).

Table 4 e Required elimination of organic surrogates toachieve treatment thresholds.
Contaminant CDPHGroupand
objective
CDPH objective 90% elimination
UV254 TF UV254 TF
Group 1
Bisphenol A A j 69% w20% 35% w20% 51%
Carbamazepine C j 69% w20% 42% w20% 54%
Diclofenac D j 69% w20% 39% w20% 53%
Naproxen E j 69% w20% 42% w20% 54%
Sulfamethoxazole B j 69% w20% 45% w20% 58%
Triclosan A j 69% w20% 28% w20% 49%
Trimethoprim D j 69% w20% 41% w20% 54%
Group 2
Atenolol D j 69% 31% 66% 40% 79%
Gemfibrozil F j 69% 21% 52% 33% 68%
Group 3
DEET G j 69% 45% 87% 58% >100%
Ibuprofen G j 69% 40% 77% 52% 96%
pCBA G j 69% 50% 98% 66% >100%
Phenytoin G j 69% 39% 78% 51% 97%
Primidone G j 69% 45% 87% 59% >100%
Group 4
1,4-Dioxane e j 69% 55% 98% 69% >100%
Atrazine D j 69% 50% 89% 62% >100%
Meprobamate H j 50% 35% 71% 57% 97%
Group 5
TCEP H j 50% >100% >100% >100% >100%
wat e r r e s e a r c h 4 6 ( 2 0 1 2 ) 6 2 5 7e6 2 7 26266
fluorescence, which translated into vertical shifts in the
regressions.
The degradation profiles for the Group 2 compounds were
different from the other compound groups, thereby justifying
a unique classification, but the reaction rates for the constit-
uent compounds (gemfibrozil and atenolol) also differed by an
order of magnitude. This was apparent in the different
regression properties in Table 3, but the models still indicated
fast reaction rates by either a high slope or vertical intercept.
Fewer data points were excluded from the Group 2 analysis
due to the greater resistance of these compounds to oxidation.
Due to the reduced reactivity, regression analyses for both
DUV254 and DTF were possible.
For the Group 3 compounds, the DUV254 models consis-
tently had slopes of 1.7 or lower and vertical intercepts <5
(Table 3). Again, this indicates that contaminant oxidation
initiated at the same time as the changes in UV254 absorbance
but at a much faster rate. For the total fluorescence models,
the slopes were generally <1.1, while the vertical intercepts
were consistently negative (Table 3). Therefore, the Group 3
compounds experienced a lag in oxidation in comparison to
reductions in total fluorescence, but the changes then occur at
approximately the same rate.
The Group 4 compounds demonstrated significant lags in
oxidation compared to elimination of UV254 absorbance and
total fluorescence, as indicated by the negative vertical
intercepts (Table 3), and the fluorescence models were also
characterized by slightly exponential trends (Fig. 3). This is
consistent with the group’s low to moderate reactivity with
ozone and �OH.
Aswould be expected, TCEP (Group 5) was characterized by
extremely small slopes and negative intercepts (Table 3),
which indicate that TCEP oxidation starts much later and at
a much slower rate than changes in UV254 absorbance and
total fluorescence. TCEP also had one of the weaker correla-
tions, presumably due to its resistance to oxidation. In fact,
the oxidation of TCEP failed to reach 40%with the target ozone
doses, thereby providing a limited range of reduction to
evaluate with linear regression. It is important to note that
musk ketone would also be included in Group 5, but it was not
possible to quantify this compound during the bench-scale
experiments (see Materials and methods). Since musk
ketone and TCEP are characterized by similar resistance to
oxidation, the regression parameters for musk ketone would
likely be similar to those of TCEP. Therefore, DUV254 and DTF
are poor surrogates for TCEP and musk ketone in relation to
the CDPH framework and the 90% threshold since the
required elimination of UV254 absorbance and total fluores-
cence exceeded the bounds of the model (i.e., >100%).
3.3. Modeling �OH exposure with correlations
In addition to estimating transformation of the target
compounds, the aforementioned correlations can also be used
to estimate overall �OH exposure with ozone or ozone/H2O2.
Eq. (10) represents the linear correlation model for pCBA
(regression parameters from Table 3), and Eq. (11) illustrates
the process for calculating overall �OH exposure based on
changes in pCBA concentrations during advanced oxidation.
By combining Eqs. (10) and (11), the �OH exposure models in
Eqs. (12) and (13) can be derived.
�1� ½pCBA�
½pCBA�0
��100ð%Þ ¼Slope�
��1� UVorTF
UV0 or TF0
��100�%��
þ Intercept ð10Þ
Z½�OH�dtðMsÞ ¼
ln
� ½pCBA�½pCBA�0
�
�5� 109M�1s�1(11)
DUV254 Model :Z
½�OH�dtðMsÞ
¼ln
�� 0:0131 �
��1� UV
UV0
�� 100�%��þ 0:97
�
�5� 109ð12Þ
DTFModel :Z
½�OH�dtðMsÞ
¼ln
��0:0086�
��1� TF
TF0
��100�%��þ1:15
�
�5�109ð13Þ
Therefore, instead of spiking and analyzing for changes in
pCBA concentration, one can use DUV254 or DTF to develop
a rough estimate of overall �OH exposure. This method for
calculating �OH exposures can then be used to estimate the
elimination of recalcitrant TOrCs (i.e., contribution from
ozone assumed to be negligible) based on kinetics, particularly
for compounds that do not have established correlation
models. For example, a 35% reduction in UV254 absorbance
during ozonation of secondary effluent corresponds to an �OH

wat e r r e s e a r c h 4 6 ( 2 0 1 2 ) 6 2 5 7e6 2 7 2 6267
exposure of 1.34 � 10�10 Ms based on the aforementioned
pCBA model (Eq. (14)).
DUV254 ¼35% :
Z½�OH�dtðMsÞ ¼ lnð�0:0131 � 35þ 0:97Þ
�5� 109
¼ 1:34� 10�10 Ms ð14Þ
The corresponding elimination of meprobamate can be
estimated directly from its DUV254 correlation (49%; Table 3
and Eq. (15)) or from kinetics (42%; Eq. (16)e(18)) using
a combination of the estimated �OH exposure and the �OH
reaction rate constant (4.0� 109M�1 s�1; see Table 2). Since the
reactivity between meprobamate and ozone is low, this
reaction can be ignored.
DUV254 ¼ 35% :
�1� ½C�
½C0��� 100ð%Þ ¼ 1:87 � 35� 16¼ 49% (15)
ln ðC=C0Þ ¼ �ðk$OHÞ�Z
½$OH�dt�; (16)
where the contribution from ozone is assumed to be
negligible.
ln ðC=C0Þ ¼ ��4:0� 109M�1s�1
��1:34� 10�10Ms
�¼�0:54 (17)
�1� ½C�
½C0��� 100ð%Þ ¼ ð1� expð�0:54ÞÞ�100ð%Þ ¼ 42% (18)
These estimates can be compared to the experimental
observations for meprobamate in Fig. 3. The models proposed
in Eqs. (12) and (13) represent a first approximation to assess�OH exposure using on-line instrumentation. Additional
studies are needed to further validate this approach in pilot-
and full-scale systems.
3.4. Development of microbial correlations
The DUV254 and DTF correlations for the target microbes
are provided in Table 3 and SI-A2 through SI-A4. In contrast
with the target compounds for which the upper bound of
Fig. 4 e Validation of the (A) DUV254 and (B) DTF correlations for
sites. The validation of the data from the s::can spectro::lyser is
illustrated in SI-A5 and SI-A6.
elimination was generally <99%, the microbial correlations
were based on log inactivation rather than percent reductions
in concentrations, as described in Eq. (19):
�Log
�NN0
�¼Slope�
��1� UVorTF
UV0orTF0
��100ð%Þ
�þIntercept (19)
Therefore, the slopes and intercepts cannot be compared
directly to those of the target compounds. In addition, the
correlations for the surrogate microbes generally exhibited
greater variability than those of the target compounds, which
was also observed in Bahr et al. (2007). It is interesting to note
that the inactivation of E. coli and MS2 was quite comparable,
which indicates that E. coli could possibly be used as a surrogate
for some viruses, but MS2 demonstrated stronger correlations
than E. coli (Table 3). With respect to B. subtilis, the spores
required extended exposure to ozone before any inactivation
was observed (SI-A2 through SI-A4), which is consistent with
the lag phase described by Driedger et al. (2001). Therefore, it
was not possible to accurately correlate B. subtilis spore inacti-
vation with DUV254 or DTF. In fact, nearly 50% and 90% reduc-
tions in UV254 absorbance and total fluorescence, respectively,
were required before any inactivation was observed, but the
inactivation was very rapid after that threshold was achieved.
3.5. Pilot-scale validation
As shown in Fig. 4A, Fig. 4B, and SI-A5, there was relatively
good agreement between the bench- (indicated by WRF-09-10
markers) and pilot-scale correlations, which highlights the
widespread applicability of this concept to diverse water
qualities and treatment scales. As with the bench-scale data,
the contaminant correlations proved to be much stronger
than the microbial correlations, particularly in the case of E.
coli. Therefore, the use of DUV254 or DTF may be limited to
general process performance and contaminant oxidation,
while disinfection may still require more traditional frame-
works (e.g., the CT concept) to describe expected levels of
inactivation.
phenytoin based on grab samples at the various pilot-scale
illustrated in (C). The remaining pilot-scale validations are

Fig. 5 e (A) Influent and effluent UV254 absorbance grab samples from the ozone process at the CLV pilot. (B) Comparison of
grab samples and online analyzer data for UV254 absorbance at the CLV pilot. The ozone dosing conditions (i.e., 1e15) are
described in Table S1.
wat e r r e s e a r c h 4 6 ( 2 0 1 2 ) 6 2 5 7e6 2 7 26268
With respect to the CLV pilot, a series of grab samples was
collected to evaluate the continuous operation of the ozone
pilot and validate the data from the online UV254 absorbance
analyzer. Fig. 5A illustrates the temporal variability in UV254
absorbance prior to and after ozonation in addition to the cor-
responding differentials. Although the UV254 absorbance prior
to ozonation fluctuated over time, the constant ozone dose
applied during this period (1.5mg/L; O3:TOC¼ 0.25; H2O2:O3¼ 0)
resulted in a consistent DUV254 of approximately 30%.
In addition to the grab samples in Fig. 5A, Fig. S2A illus-
trates the fluctuation in UV254 absorbance for the MBR filtrate
prior to ozonation, which was continuously monitored from
May 21st through May 31st of 2011 with the online analyzer.
The grab sample toward the end of the monitoring period was
used as a preliminary validation between the online analyzer
and laboratory data. Fig. S2B illustrates the continuous
monitoring data for the ozonated MBR filtrate from May 31st
to July 4th of 2011. In contrast with the relatively stable signal
before ozonation, the signal after ozonation experienced rapid
fluctuations due to analyzer interference. In order to improve
the clarity of the data, any erroneous values>0.100 cm�1 were
removed from the data set and attributed to the following
reasons: unexpected or planned shutdowns of the pilot
systems, scaling or biological fouling of the analyzer, and
periodic spikes in turbidity or air bubbles that interrupted the
light path in the flow cell. Ensuring continuous flow through
the analyzer and implementing a routine cleaning and
maintenance schedule (e.g., daily instead of weekly) would
likely be required to mitigate these problems in the future.
However, this preliminary data set indicates that online

wat e r r e s e a r c h 4 6 ( 2 0 1 2 ) 6 2 5 7e6 2 7 2 6269
monitoring of UV254 absorbance is a promising operational
tool.
In addition to the long-term monitoring data, a one-day,
variable ozone dose experiment was also performed to vali-
date the empirical TOrC correlations. Fig. 5B illustrates the
resulting data from both grab and continuous monitoring
samples, where the numbered boxes represent different
dosing conditions (O3 ¼ 0.6e9.0 mg/L; O3:TOC ¼ 0.1e2.0; see
Table S1 for details). During the short timeframeof the variable
dose experiment, the influent water quality (shaded circles)
was relatively stable, and the data demonstrate good consis-
tency between the online (empty triangles) versus grab sample
(black squares) data. Fig. 4CandSI-A6 illustrate theuseof these
grab samples andonlinedata to validate theTOrCcorrelations.
With the exception of ibuprofen and TCEP, the predictive
model based on the online absorbance readings and the actual
levels of transformation based on the grab samples were
consistent. This was particularly true for the highly suscep-
tible Group 1 compounds, which were almost always <MRL
after oxidation, but the data were also relatively consistent for
the Group 2, 3, and 4 compounds. It is unclear exactly why the
actual data and the predictive model for ibuprofen and TCEP
were dissimilar. However, the bench-scale TCEP data that
were used to develop the correlations also showed more
variability than the other compounds. In general, the predic-
tive model tended to overestimate the level of oxidation for
some compounds.
3.6. Full-scale validation
The full-scale samples indicated that the reductions in UV254
absorbance, total fluorescence, and many of the target
compounds at the full-scale facility were similar to the
Table 5 e Full-scale validation of UV254 absorbance and total fl
Parameter Ozone influent Ozone effluent
Organic Surrogates
UV254 Absorbance 0.116 cm�1 0.059 cm�1
Total Fluorescence 28,782 (unitless) 4546 (unitless)
Group 1
Carbamazepine 220 ng/L <10 ng/L
Diclofenac 47 ng/L <25 ng/L
Naproxen 26 ng/L <25 ng/L
Sulfamethoxazole 2200 ng/L < 25 ng/L
Trimethoprim 21 ng/L < 10 ng/L
Group 2
Atenolol 190 ng/L <25 ng/L
Gemfibrozil 72 ng/L <10 ng/L
Group 3
DEET 100 ng/L 55 ng/L
Phenytoin 150 ng/L 17 ng/L
Primidone 210 ng/L 45 ng/L
Group 4
Meprobamate 350 ng/L 110 ng/L
Group 5
TCEP 410 ng/L 340 ng/L
Microbes
E. coli 3.5 � 103 MPN/100 mL 12 MPN/100 mL
a % elimination or log inactivation limited by MRL.
predicted values (Table 5). Exclusions include compounds that
were not detected in the ozone influent sample, which were
omitted from Table 5; compounds that reached their respec-
tive MRLs during ozonation, which limited the quantifiable
range; and two specific outliers (DEET and E. coli).
Ozonation only achieved 45% elimination of DEET, but it is
unclear what caused this deviation from the bench-scale
correlation. With respect to E. coli, the potential level of inac-
tivation was limited to only 3.5 logs since the ozone influent
sample only contained 3.5 � 103 MPN/100 mL. It is easier to
achieve several orders of magnitude of inactivation when the
initial E. coli level is high, such as in a spiked bench-scale
experiment, but it becomes increasingly difficult to inacti-
vate bacteria as the numbers approach the detection limit of
the assay, possibly due to shielding. This may be one possible
explanation for the discrepancy between the maximum level
of inactivation (3.5 logs) and the observed level of inactivation
(2.5 logs). With the exception of these two outliers, themodels
provided relatively accurate predictions of process perfor-
mance, which highlights the utility of this surrogate frame-
work as an alternative to frequent TOrC monitoring.
4. Conclusions
One of the critical components of treatment plant operation is
real-time monitoring of process performance that allows for
subsequent operational adjustments. As such, the primary
goal of this study was to provide operators with tools to
predict treatment efficacy and identify breakdowns and inef-
ficiencies in the performance of oxidation processes that rely
heavily on fast reacting oxidants, such as ozone and �OH. In
order to better integrate ozonation and other AOPs into water
uorescence correlations.
Actual elimination DUV254 prediction DTF prediction
49% 51% N/A
84% N/A 85%
<MRLa >99% >99%
<MRLa >99% >99%
<MRLa >99% >99%
<MRLa >99% >99%
<MRLa >99% >99%
<MRLa >99% 96%
<MRLa >99% >99%
45% 76% 65%
89% 86% 74%
79% 74% 65%
69% 76% 68%
17% 21% 18%
2.5 logsa 5.2 logs 4.7 logs

wat e r r e s e a r c h 4 6 ( 2 0 1 2 ) 6 2 5 7e6 2 7 26270
and wastewater treatment, a more comprehensive under-
standing of the available technologies in addition to tools that
make them amenable to the current regulatory framework are
required. Equipping utilities and operators with quick and
simple proxies to assess oxidation and disinfection efficacy
will reduce the analytical demand related to continuous
monitoring of trace organic contaminants and microorgan-
isms, allow for rapid adjustments to operational variables
(e.g., ozone and/or H2O2 dose), and provide a basis for
awarding removal credits for various contaminants.
This study provides quantitative information that can be
used to tailor a surrogate framework for indicator compounds
to an individual system, similar towhat is now required by the
California Department of Public Health. Differential UV254
absorbance and total fluorescence were correlated with trace
organic contaminant oxidation and microbial inactivation to
provide estimates of treatment efficacy in 17 different
wastewater matrices from the U.S., Switzerland, and
Australia. The results of this study indicate that DUV254 and
DTF can be used as surrogates for target compound elimina-
tion. The primary benefit of this strategy is that it requires
minimal equipment, expertise, time, and cost compared to
full-scale monitoring of target compounds and pathogens.
Automated online analyzers are available for UV absorbance
and fluorescence so full-scale implementation of the empir-
ical models developed in this study is entirely feasible.
Although there is a certain amount of inherent variability in
themodels, the pilot- and full-scale validation efforts indicate
that the models are robust. As mentioned earlier, similar
models can be applied to other forms of advanced oxidation,
such as UV/H2O2, so expanded model databases are also
warranted for other forms of treatment. Future research
should also attempt to develop empirical models based on
reaction rate constants with ozone and �OH.
With respect to microbial inactivation, the correlations
may not yet be strong enough to warrant disinfection credits,
particularly for microbes with significant lag phases (e.g., B.
subtilis spores and Cryptosporidium oocysts), but the models
still provide a useful estimate of expected log inactivation for
some bacteria and viruses. Additional studies would be
necessary to further refine the microbial inactivation models
and integrate them into a regulatory framework.
Acknowledgments
The authors would like to thank members of the Applied
Research and Development Center at the Southern Nevada
Water Authority for all of their efforts during this study. The
authors would also like to thank the technology partners,
particularly APTwater, Hydranautics, s::can Messtechnik, and
Wedeco/ITT, for their generous contributions to the project.
Thepersonnelat thevarious studysiteswerealso instrumental
in the design, scheduling, and implementation of the sampling
efforts.This studywasmadepossible throughfunding fromthe
WateReuse Research Foundation (WRF-08-05, WRF-08-08, and
WRF-09-10) and the Swiss Federal Office of the Environment.
The comments and views detailed herein may not necessarily
reflect the views of these funding agencies, their officers,
directors, employees, affiliates or agents.
Appendix A. Supplementary data
Supplementary data related to this article can be found at
http://dx.doi.org/10.1016/j.watres.2012.08.037.
r e f e r e n c e s
Acero, J.L., Stemmler, K., von Gunten, U., 2000. Degradationkinetics of atrazine and its degradation products with ozoneand OH radicals: a predictive tool for drinking watertreatment. Environmental Science and Technology 34,591e597.
Adams, M., 1959. Bacteriophages. Book Bacteriophages.Interscience Publishers, New York.
Bahr, C., Schumacher, J., Ernst, M., Luck, F., Heinzman, B.,Jekel, M., 2007. SUVA as control parameter for the effectiveozonation of organic pollutants in secondary effluent. WaterScience and Technology 55, 267e274.
Benner, J., Salhi, E., Ternes, T., von Gunten, U., 2008. Ozonation ofreverse osmosis concentrate: kinetics and efficiency of betablocker oxidation. Water Research 42, 3003e3012.
Bowman, R.H., Miller, P., Purchase, M., Schoellerman, R., 2001.Ozone-peroxide Advanced Oxidation Water TreatmentSystem for Treatment of Chlorinated Solvents and 1,4-dioxane. American Chemical Society National Meeting, SanDiego, CA.
Buffle, M., Schumacher, J., Meylan, S., Jekel, M., von Gunten, U.,2006. Ozonation and advanced oxidation of wastewater: effectof O3 dose, pH, DOM and HO� scavengers on ozonedecomposion and HO� generation. Ozone Science &Engineering 28, 247e259.
Burns, N., Hunter, G., Jackman, A., Hulsey, B., Coughenour, J.,Walz, T., 2007. The return of ozone and the hydroxyl radical towastewater disinfection. Ozone Science & Engineering 29,303e306.
Camacho-Munoz, D., Martin, J., Santos, J.L., Aparicio, I., Alonso, E.,2009. An affordable method for the simultaneousdetermination of the most studied pharmaceuticalcompounds as wastewater and surface water pollutants.Journal of Separation Science 32, 3064e3073.
CDPH, 2011. Groundwater Replenishment Reuse. DraftRegulations. Title 22 California Code of Regulations. CaliforniaDepartment of Public Health.
Chen, W., Westerhoff, P., Leenheer, J.A., Booksh, K., 2003.Fluorescence excitation-emission matrix regionalintegration to quantify spectra for dissolved organicmatter. Environmental Science and Technology 37,5701e5710.
Deborde, M., Rabouan, S., Duguet, J., Legube, B., 2005. Kinetics ofaqueous ozone-induced oxidation of some endocrinedisruptors. Environmental Science and Technology 39,6086e6092.
Dickenson, E.R.V., Drewes, J.E., Sedlak, D.L., Wert, E.C.,Snyder, S.A., 2009. Applying surrogates and indicators toassess removal efficiency of trace organic chemicals duringchemical oxidation of wastewaters. Environmental Scienceand Technology 43, 6242e6247.
Dodd, M.C., Buffle, M., von Gunten, U., 2006. Oxidation ofantibacterial molecules by aqueous ozone: moiety-specificreaction kinetics and application to ozone-based wastewatertreatment. Environmental Science and Technology 40,1969e1977.
Dodd, M.C., Kohler, H.P.E., von Gunten, U., 2009. Oxidation ofantibacterial compounds by ozone and hydroxyl radical:elimination of biological activity during aqueous ozonation

wat e r r e s e a r c h 4 6 ( 2 0 1 2 ) 6 2 5 7e6 2 7 2 6271
processes. Environmental Science and Technology 43,2498e2504.
Driedger, A., Staub, E., Pinkernell, U., Marinas, B., Koster, W., vonGunten, U., 2001. Inactivation of Bacillus subtilis spores andformation of bromate during ozonation. Water Research 35,2950e2960.
Gerrity, D., Gamage, S., Holady, J.C., Mawhinney, D.B.,Quinones, O., Trenholm, R.A., Snyder, S.A., 2011a. Pilot-scaleevaluation of ozone and biological activated carbon for traceorganic contaminant mitigation and disinfection. WaterResearch 45, 2155e2165.
Gerrity, D., Snyder, S., 2011. Review of ozone for water reuseapplications: toxicity, regulations, and trace organiccontaminant oxidation. Ozone Science & Engineering 33,253e266.
Gerrity, D., Stanford, B.D., Trenholm, R.A., Snyder, S.A., 2010. Anevaluation of a pilot-scale nonthermal plasma advancedoxidation process for trace organic compound degradation.Water Research 44, 493e504.
Gerrity, D., Trenholm, R.A., Snyder, S.A., 2011b. Temporalvariability of pharmaceuticals and illicit drugs in wastewaterand the effects of a major sporting event. Water Research 45,5399e5411.
Hoigne, J., Bader, H., 1994. Characterization of water qualitycriteria for ozonation processes. Part II: lifetime of addedozone. Ozone Science & Engineering 16, 121e134.
Hollender, J., Zimmermann, S.G., Koepke, S., Krauss, M.,McArdell, C.S., Ort, C., Singer, H., von Gunten, U., Siegrist, H.,2009. Elimination of organic micropollutants in a municipalwastewater treatment plant upgraded with a full-scale post-ozonation followed by sand filtration. Environmental Scienceand Technology 43, 7862e7869.
Huber, M.M., Canonica, S., Park, G.Y., von Gunten, U., 2003.Oxidation of pharmaceuticals during ozonation and advancedoxidation processes. Environmental Science and Technology37, 1016e1024.
Huber, M.M., Gobel, A., Joss, A., Hermann, N., Loffler, D.,McArdell, C.S., Ried, A., Siegrist, H., Ternes, T.A., vonGunten, U., 2005. Oxidation of pharmaceuticals duringozonation of municipal wastewater effluents: a pilotstudy. Environmental Science and Technology 39,4290e4299.
Huber, M.M., Ternes, T.A., von Gunten, U., 2004. Removal ofestrogenic activity and formation of oxidation products duringozonation of 17a-ethinylestradiol. Environmental Science andTechnology 38, 5177e5186.
Kaiser, H.P., Koster, O., Gresch, M., Perissef, P. Jaggi, P., Salhi, E.,von Gunten, U. Process control of ozonation systems: a novelreal-time approach. Ozone: Science and Engineering,submitted for publication.
Katsoyiannis, I.A., Canonica, S., von Gunten, U., 2011. Efficiencyand energy requirements for the transformation of organicmicropollutants by ozone, ozone/H2O2 and UV/H2O2. WaterResearch 45, 3811e3822.
Lee, Y., Escher, B.I., von Gunten, U., 2008. Efficient removal ofestrogenic activity during oxidative treatment of waterscontaining steroid estrogens. Environmental Science andTechnology 42, 6333e6339.
Lee, Y., von Gunten, U., 2012. Quantitative Structure-ActivityRelationships (QSARs) for the transformation of organicmicropollutants during oxidative water treatment. WaterResearch 46, 6177e6195.
Mesquita, M.M.F., Stimson, J., Chae, G.-T., Tufenkji, N.,Ptzcek, C.J., Blowes, D.W., Emelko, M.B., 2010. Optimalpreparation and purification of PRD1-like bacteriophages foruse in environmental fate and transport studies. WaterResearch 44, 1114e1125.
Nanaboina, V., Korshin, G.V., 2010. Evolution of absorbancespectra of ozonated wastewater and its relationship with thedegradation of trace-level organic species. EnvironmentalScience and Technology 44, 6130e6137.
Packer, J.L., Werner, J.J., Latch, D.E., McNeill, K., Arnold, W.A.,2003. Photochemical fate of pharmaceuticals in theenvironment: Naproxen, diclofenac, clofibric acid, andibuprofen. Aquatic Science 65, 342e351.
Pisarenko, A.N., Stanford, B.D., Yan, D., Gerrity, D., Snyder, S.A.,2012. Effects of ozone and ozone/peroxide on trace organiccontaminants and NDMA in drinking water and water reuseapplications. Water Research 46, 316e326.
Razavi, B., Song, W., Cooper, W.J., Greaves, J., Jeong, J., 2009. Free-radical-induced oxidative and reductive degradation of fibratepharmaceuticals: kinetic studies and degradationmechanisms.The Journal of Physical Chemistry A 113, 1287e1294.
Real, F.J., Javier Benitez, F., Acero, J.L., Sagasti, J.J.P., Casas, F.,2009. Kinetics of the chemical oxidation of thepharmaceuticals primidone, ketoprofen, and diatrizoate inultrapure and natural waters. Industrial and EngineeringChemistry Research 48, 3380e3388.
Reungoat, J., Escher, B.I., Macova, M., Argaud, F.X., Gernjak, W.,Keller, J., 2012. Ozonation and biological activated carbonfiltration of wastewater treatment plant effluents. WaterResearch 46, 863e872.
Reungoat, J., Macova, M., Escher, B.I., Carswell, S., Mueller, J.F.,Keller, J., 2010. Removal of micropollutants and reduction ofbiological activity in a full scale reclamation plant usingozonation and activated carbon filtration. Water Research 44,625e637.
Rosario-Ortiz, F.L., Wert, E.C., Snyder, S.A., 2010. Evaluation ofUV/H2O2 treatment for the oxidation of pharmaceuticals inwastewater. Water Research 44, 1440e1448.
Rosenfeldt, E.J., Linden, K.G., 2004. Degradation of endocrinedisrupting chemicals bisphenol A, ethinyl estradiol, andestradiol during UV photolysis and advanced oxidationprocesses. Environmental Science and Technology 38,5476e5483.
Song, W., Cooper, W.J., Peake, B.M., Mezyk, S.P., Nickelsen, M.G.,O’Shea, K.E., 2009. Free-radical induced oxidative andreductive degradation of N, N-diethyl-meta-toluamide (DEET):kinetic studies and degradation pathways. Water Research 43,635e642.
Stalter, D., Magdeburg, A., Oehlmann, J., 2010a. Comparativetoxicity assessment of ozone and activated carbon treatedsewage effluents using an in vivo test battery. Water Research44, 2610e2620.
Stalter, D., Magdeburg, A., Weil, M., Knacker, T., Oehlmann, J.,2010b. Toxication or detoxication? In vivo toxicity assessmentof ozonation as advanced wastewater treatment with therainbow trout. Water Research 44, 439e448.
Suarez, S., Dodd, M.C., Omil, F., von Gunten, U., 2007. Kinetics oftriclosan oxidation by aqueous ozone and consequent loss ofantibacterial activity: relevance to municipal wastewaterozonation. Water Research 41, 2481e2490.
Thurston-Enriquez, J.A., Haas, C.N., Jacangelo, J., Riley, K.,Gerba, C.P., 2003. Inactivation of feline calicivirus andadenovirus type-40 by UV radiation. Applied andEnvironmental Microbiology 69, 577e582.
Trenholm, R.A., Vanderford, B.J., Snyder, S.A., 2009. On-line solidphase extraction LC-MS/MS analysis of pharmaceuticalindicators in water: a green alternative to conventionalmethods. Talanta 79, 1425e1432.
Vanderford, B.J., Rosario-Ortiz, F.L., Snyder, S.A., 2007. Analysis ofp-chlorobenzoic acid in water by liquid chromatography-tandem mass spectrometry. Journal of Chromatography 1164,219e223.

wat e r r e s e a r c h 4 6 ( 2 0 1 2 ) 6 2 5 7e6 2 7 26272
von Sonntag, C., von Gunten, U., 2012. Chemistry of ozone inwater and wastewater treatment: From basic principles toapplications. IWA Publishing, London.
Watts, M.J., Linden, K.G., 2009. Advanced oxidation kinetics ofaqueous trialkyl phosphate flame retardants and plasticizers.Environmental Science and Technology 43, 2937e2942.
Wert, E.C., Rosario-Ortiz, F.L., Snyder, S.A., 2009a. Effect of ozoneexposure on the oxidation of trace organic contaminants inwastewater. Water Research 43, 1005e1014.
Wert, E.C., Rosario-Ortiz, F.L., Snyder, S.A., 2009b. Usingultraviolet absorbance and color to assess pharmaceutical
oxidation during ozonation of wastewater. EnvironmentalScience and Technology 43, 4858e4863.
Yuan, F., Hu, C., Hu, X., Qu, J., Yang, M., 2009. Degradation ofselected pharmaceuticals in aqueous solution with UV andUV/H2O2. Water Research 43, 1766e1774.
Zimmermann, S.G., Wittenwiler, M., Hollender, J., Krauss, M.,Ort, C., Siegrist, H., von Gunten, U., 2011. Kineticassessment and modeling of an ozonation step for full-scale municipal wastewater treatment: micropollutantoxidation, by-product formation and disinfection. WaterResearch 45, 605e617.
Copyright © 2022 FDOKUMEN