Determining Sociability, Social Space, and Social Presence in (A)synchronous Collaborative Groups
19
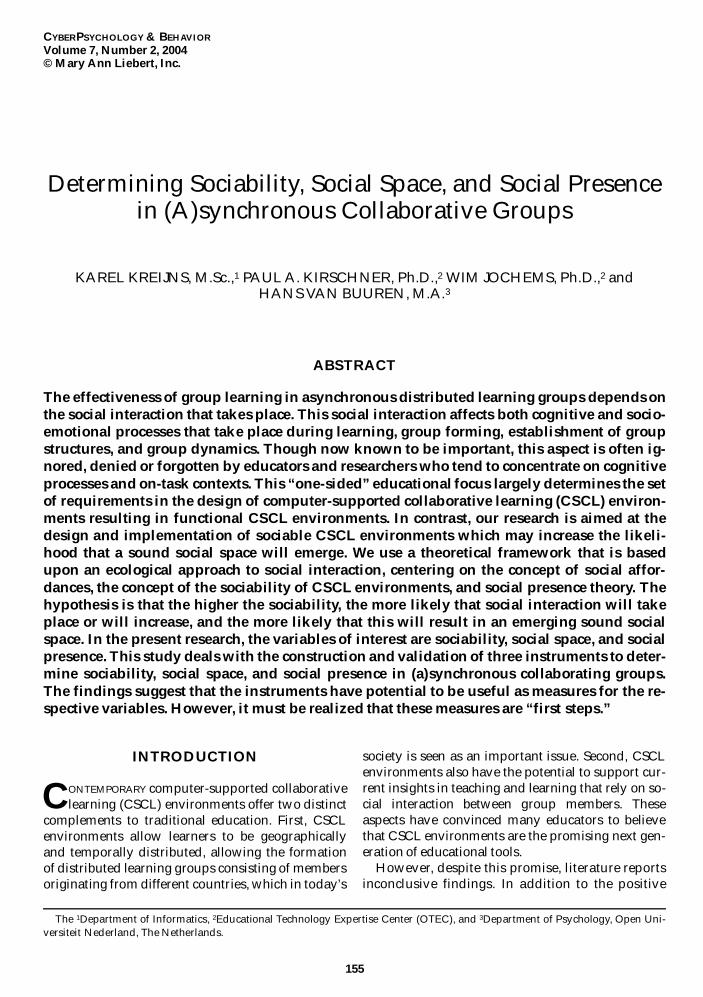
Determining Sociability, Social Space, and Social Presence in (A)synchronous Collaborative Groups KAREL KREIJNS, M.Sc., 1 PAUL A. KIRSCHNER, Ph.D., 2 WIM JOCHEMS, Ph.D., 2 and HANS VAN BUUREN, M.A. 3 ABSTRACT The effectiveness of group learning in asynchronous distributed learning groups depends on the social interaction that takes place. This social interaction affects both cognitive and socio- emotional processes that take place during learning, group forming, establishment of group structures, and group dynamics. Though now known to be important, this aspect is often ig- nored, denied or forgotten by educators and researchers who tend to concentrate on cognitive processes and on-task contexts. This “one-sided” educational focus largely determines the set of requirements in the design of computer-supported collaborative learning (CSCL) environ- ments resulting in functional CSCL environments. In contrast, our research is aimed at the design and implementation of sociable CSCL environments which may increase the likeli- hood that a sound social space will emerge. We use a theoretical framework that is based upon an ecological approach to social interaction, centering on the concept of social affor- dances, the concept of the sociability of CSCL environments, and social presence theory. The hypothesis is that the higher the sociability, the more likely that social interaction will take place or will increase, and the more likely that this will result in an emerging sound social space. In the present research, the variables of interest are sociability, social space, and social presence. This study deals with the construction and validation of three instruments to deter- mine sociability, social space, and social presence in (a)synchronous collaborating groups. The findings suggest that the instruments have potential to be useful as measures for the re- spective variables. However, it must be realized that these measures are “first steps.” 155 CYBERPSYCHOLOGY & BEHAVIOR Volume 7, Number 2, 2004 © Mary Ann Liebert, Inc. INTRODUCTION C ONTEMPORARY computer-supported collaborative learning (CSCL) environments offer two distinct complements to traditional education. First, CSCL environments allow learners to be geographically and temporally distributed, allowing the formation of distributed learning groups consisting of members originating from different countries, which in today’s society is seen as an important issue. Second, CSCL environments also have the potential to support cur- rent insights in teaching and learning that rely on so- cial interaction between group members. These aspects have convinced many educators to believe that CSCL environments are the promising next gen- eration of educational tools. However, despite this promise, literature reports inconclusive findings. In addition to the positive The 1 Department of Informatics, 2 Educational Technology Expertise Center (OTEC), and 3 Department of Psychology, Open Uni- versiteit Nederland, The Netherlands.
-
Upload
independent -
Category
Documents
-
view
2 -
download
0
Transcript of Determining Sociability, Social Space, and Social Presence in (A)synchronous Collaborative Groups
Determining Sociability, Social Space, and Social Presencein (A)synchronous Collaborative Groups
KAREL KREIJNS, M.Sc.,1 PAUL A. KIRSCHNER, Ph.D.,2 WIM JOCHEMS, Ph.D.,2 and HANS VAN BUUREN, M.A.3
ABSTRACT
The effectiveness of group learning in asynchronous distributed learning groups depends onthe social interaction that takes place. This social interaction affects both cognitive and socio-emotional processes that take place during learning, group forming, establishment of groupstructures, and group dynamics. Though now known to be important, this aspect is often ig-nored, denied or forgotten by educators and researchers who tend to concentrate on cognitiveprocesses and on-task contexts. This “one-sided” educational focus largely determines the setof requirements in the design of computer-supported collaborative learning (CSCL) environ-ments resulting in functional CSCL environments. In contrast, our research is aimed at thedesign and implementation of sociable CSCL environments which may increase the likeli-hood that a sound social space will emerge. We use a theoretical framework that is basedupon an ecological approach to social interaction, centering on the concept of social affor-dances, the concept of the sociability of CSCL environments, and social presence theory. Thehypothesis is that the higher the sociability, the more likely that social interaction will takeplace or will increase, and the more likely that this will result in an emerging sound socialspace. In the present research, the variables of interest are sociability, social space, and socialpresence. This study deals with the construction and validation of three instruments to deter-mine sociability, social space, and social presence in (a)synchronous collaborating groups.The findings suggest that the instruments have potential to be useful as measures for the re-spective variables. However, it must be realized that these measures are “first steps.”
155
CYBERPSYCHOLOGY & BEHAVIOR
Volume 7, Number 2, 2004© Mary Ann Liebert, Inc.
INTRODUCTION
CONTEMPORARY computer-supported collaborativelearning (CSCL) environments offer two distinct
complements to traditional education. First, CSCLenvironments allow learners to be geographicallyand temporally distributed, allowing the formationof distributed learning groups consisting of membersoriginating from different countries, which in today’s
society is seen as an important issue. Second, CSCLenvironments also have the potential to support cur-rent insights in teaching and learning that rely on so-cial interaction between group members. Theseaspects have convinced many educators to believethat CSCL environments are the promising next gen-eration of educational tools.
However, despite this promise, literature reportsinconclusive findings. In addition to the positive
The 1Department of Informatics, 2Educational Technology Expertise Center (OTEC), and 3Department of Psychology, Open Uni-versiteit Nederland, The Netherlands.

findings, mixed and negative findings5 are reportedregarding the learning process itself,1–4 and regard-ing the group forming and group dynamics.6–9
These disappointing results can be traced down tothe impediment of social interaction and of thegroup dynamics in (a)synchronous distributedlearning groups which are usually taken forgranted by teachers, instructors, (distance) educa-tors, and researchers.10 Kreijns et al.11 state that thecomputer-mediated communication (CMC) sub-systems embedded in the CSCL environments raisebarriers that—when not recognized—will impedesocial interaction both for cognitive processesand for socio-emotional processes underlying thegroup dynamics. These barriers are:
1. There is no suitable CSCL pedagogy. Brandonand Hollingshead12 point that CSCL “seeks toprovide classroom-based collaborative learningtheory with theory and research on CMC inorder to provide a foundation for understandinghow CMC-based group projects can enhancelearning” (p. 110).
2. CMC-typed media is text-based leaving out thenon-verbal (visual and audio) and back-channeling cues which hampers impression for-mation and, thus, forming of groups and groupdynamics,13–15 the coordination of conversationsand task accomplishment,16 and grounding.17
3. CSCL environments may not meet the criteria ofinteraction design18 and usability.19
Consequently, if the barriers are not overcome,the effectiveness of group learning may decrease.Recently, a number of educational researchers haverecognized that the effectiveness of a (a)synchro-nous distributed group for collaborative learninglargely depends on whether a sound social spacehas emerged indicating the establishment of a com-munity of learning. In a sound social space, opendialogue and social interaction are possible, en-abling cognitive processes such as elaborating,questioning, and defining to take place, all of whichare necessary for the social construction of knowl-edge and competence building.5,20,21 Inherent tomany (a)synchronous distributed learning groups—especially those consisting of learners from differ-ent countries—is that they contain members withdifferent cultural backgrounds who do not knoweach other. The group as a whole has no historyand it is very unlikely that group members willever meet each other face-to-face. Group formingand group dynamics have yet to take place.
However, contemporary CSCL environments arepredominantly functional CSCL environments be-
cause their design is guided by pure educationalconstraints without paying any attention to the so-cial (psychological) aspects of collaboratingthrough CMC. Cutler22 remarked that “currentliterature surrounding CMC is almost entirely task-based and focused on cost, efficiency, and produc-tivity with little attention given either to thechanges effected on the people or to the social rela-tions created from using the communication tech-nologies” (p. 320).
This paper starts with presenting a theoreticalframework aimed at the design of sociable CSCL en-vironments eliciting three key variables: sociability,social presence, and social space. We proceed bypresenting three instruments for measuring the re-spective variables and discuss their validation inthe methods section. Finally, we present conclu-sions and future work.
Theoretical framework
Our research on fostering and enhancing socialinteraction in (asynchronous) distance learninggroups is aimed at the design and implementationof sociable CSCL environments. The research isbased upon a theoretical framework encompassing:
1. The ecological approach to social interaction23–25
2. The concept of the sociability of CSCL envi-ronments26
3. Social presence theory5,13,27– 30
Ecological approach to social interaction: social affordances
The ecological approach to social interaction usesthe concept of social affordances as its central theme.Social affordances are the “properties of a CSCL en-vironment that act as social-contextual facilitatorsrelevant for the learner’s social interactions”.26 Thisdefinition emphasizes the unique relationship be-tween the CSCL environment and the learners withrespect to social interaction as does the definition ofBradner, Kellog, and Ericson31 namely, as “the rela-tionship between the properties of an object andthe social characteristics of a group that enable par-ticular kinds of interaction among members of thatgroup.” Social affordances can be realized by inde-pendent devices (as suggested by the Bradner, Kel-log, and Ericson definition) augmenting the CSCLenvironment; hence these devices are designatedsocial affordances devices. A typical example of asocial affordances device in real-life settings is thecoffee machine around which people may gatherand have informal conversations about anything
156 KREIJNS ET AL.

from task-related problems, last night’s footballgame, or information about oneself (self-disclosure).Thus, these conversations contain fragments of task-oriented as well as socio-emotional content. Here, wesee the social dynamics in action.
Proximity is an important dimension of social af-fordances. In our research we have operationalizedsocial affordances devices by grounding them onthe concept of tele-proximity,32 that is, proximitythat is artificially created with the aid of computersand networks with the goal of the creation of groupawareness: up-to-the-minute knowledge about theothers in their activities whether on-task or off-task.33 Social affordance devices based upon mech-anisms for group awareness and tightly coupledwith a set of communication media are calledgroup awareness widgets (GAWs), tools aimed atincreasing impromptu encounters (rather thanplanned encounters) and increasing informal com-munication (rather than formal communication)both in on-task and off-task settings. GAWs arecomplementary to workspace awareness widgets34
that provide awareness about the on-task activitiesof the other while performing a specific task; for ex-ample, the positions of the cursors of all the othersin a shared editor application. In asynchronous dis-tributed learning groups, social affordance devicesalso aim at bridging the time gap imposed by learn-ing and working in a time-deferred mode.
Mechanisms for providing group awareness in-formation may vary. Xerox PARC and EuroPARCresearchers use media spaces.35 A media space isformed by the combination of audio, video, andcomputer networking technologies to providegroup awareness about people working in collabo-rative groups. Our implementation of a GAW dis-plays group awareness information graphicallytogether with history information along a time-axis,thereby providing history. Other implementationsof mechanisms for group awareness informationmay include abstract video images36 or sound.37
The set of communication media may includeasynchronous as well as synchronous media. Gen-erally, a default set of CMC typed media is used:chat, computer conferencing, and e-mail. It may,however, be questioned whether such a set is opti-mal.11 Gay and Lettini38 suggest that the set shouldhave a “sufficient” variety of communication media.Research is needed to determine the right set ofcommunication media in group awareness widgets.
The sociability of CSCL environments
The sociability of CSCL environments refers tohow CSCL environments can differ in their ability
to facilitate the emergence of a social space; thehuman network of social relationships betweengroup members which is embedded in group struc-tures of norms and values, rules and roles, beliefs,and ideals. To express the differences in ability inthe creation of a social space, the term sociability isintroduced. Kreijns et al.26 define sociability “to bethe extent the CSCL environment is able to give riseto . . . a social space.” Or more precisely, the extentto which a CSCL environment is able to facilitate theemergence of a social space. No CSCL environmentis in or of itself capable of creating a social space;people (i.e. the learners/group members) and theiractivities (i.e., the learning tasks) are needed to rec-ognize and exploit this sociability potential of theCSCL environment. We hypothesize that the greaterthe sociability of an environment, the more likelythat it will result in the emergence of a sound socialspace. We designate a social space to be “sound” ifthe social space is characterized by effective workrelationships, strong group cohesiveness, trust, re-spect and belonging, satisfaction, and a strong senseof community. A sound social space determines, re-inforces, and sustains the social interaction that istaking place among the group members.
Social presence theory
Short et al.13 characterize communication mediain terms of their potential to communicate socio-emotional cues in such a way that the other personin the communication is perceived as “physically”present. They define social presence as the “degreeof salience of the other person in the interactionand the consequent salience of the interpersonal re-lationships.” Social presence is thus the degree ofillusion that the other in the communication ap-pears to be a “real” physical person. Social pres-ence affects the degree of social interaction takingplace in CSCL environments.5,27–30 Tu,28 linking so-cial learning theory with social presence theory,concluded that “Social presence is required to en-hance and foster online social interaction, which isthe major vehicle of social learning,” and “if socialpresence is low, the foundation of social learning,social interaction, does not occur.” Garrison39 con-tends that social presence is an important conceptfor understanding the social context and for creat-ing a social climate in computer conferences.
Relationships between sociability, social presence, and social space
Our framework suggests a number of relation-ships between the variables sociability, social
DETERMINING SOCIABILITY, SOCIAL SPACE, AND SOCIAL PRESENCE 157

presence, social space, and social interaction.These relationships are subsumed in a model ofrelationships, as seen in Figure 1. Because theframework emphasizes the promotion of social in-teraction in the social (psychological) dimension, itcomplements pedagogical techniques that empha-size social interaction in the educational dimen-sion. Adding pedagogical techniques as a variablein the model acknowledges that in order to create asound social space, the environment (i.e., the CSCLenvironment), the people “inhabiting” the environ-ment (i.e., the learners/group members), and theactivities they carry out (i.e., those learning activi-ties that are determined by the pedagogical tech-niques) are all equally important.
Our research encompasses the following hy-potheses implicated by our framework and (partly)depicted in the model:
H1: Social affordance devices contribute to thedegree of perceived sociability of CSCLenvironments.
H2: CSCL environments higher in perceived so-ciability will increase the likelihood of theestablishment of a sound social space.
H3: CSCL environments higher in perceived so-ciability will increase the degree of per-ceived social presence.
H4: A higher perceived social presence will in-crease the likelihood of the establishment ofa sound social space.
A discussion of the model and testing the hy-potheses is, however, beyond the scope of thispaper.
Instruments for sociability, social presence, and social space
Existing instruments. A number of existing in-struments purport to measure social climate/socialpresence. Rourke and Anderson40 measure thesocial climate of computer conferencing by usingsix, 5-point bipolar (semantic differential) scaleitems: personal–impersonal, warm–cold, trusting–untrusting, disinhibiting–inhibiting, close–distant,and friendly–unfriendly. These bipolar scale itemsare commonly used to measure the degree of socialpresence. Short, Williams, and Christie13 used four,7-point bipolar scale items: personal–impersonal,sociable–unsociable, sensitive–insensitive, and warm–cold, for measuring social presence. These fourscale items were, and still are, the dominant socialpresence measure for many researchers. Gunawar-dena5 extended these four scale items with 13 newscale items, resulting in a questionnaire of 17, 5-point bipolar scale items. She uses the scale, herereferred to as Social Presence Indicators, for solicit-ing the students’ reactions on a range of feelings to-ward the medium of CMC. Gunawardena andZittle41 developed an alternative social presencemeasure, called the Social Presence Scale, consist-ing of 14, 5-point Likert-scale items (e.g., “Themoderators created a feeling of an on-line commu-nity” and “I felt that my point of view was ac-knowledged by other participants in GlobalEd”;GlobalEd is a listserv based discussion board).They contend that the Social Presence Indicatorsmeasure the “intimacy” dimension43 of social pres-ence,42 whilst, in contrast, the Social Presence Scalemeasures the “immediacy” dimension. Tu44 devel-oped a measure that assesses five dimensions of so-
158 KREIJNS ET AL.
FIG. 1. Model of relationships between the variables sociability, social presence, pedagogical techniques, social in-teraction, and social space. Variables in the gray rectangles are those for which an instrument is developed.

cial presence: social context (five items; e.g., “Com-puter-Mediated Communication messages aresocial forms of communications”), online commu-nication (five items; e.g., “The language used to ex-press oneself in online communicating ismeaningful”), interactivity (four items; e.g., “I amcomfortable participating, if I am familiar with thetopics”), system privacy (seven items; e.g., “Whatis the likelihood that someone else might readand/or re-post messages sent to or from you?”),and feelings of privacy (six items; e.g., “How SE-CURE/SECRET is your online participation?”) fore-mail, bulletin board and real-time discussion re-spectively. All items are 5-point Likert-scale items,except for one system privacy item.
From this discussion we conclude that it is un-clear what all these instruments are actually mea-suring since they show overlap in test items or testitems are not within the space of interest associatedwith the construct (Gunawardena and Zittle’s So-cial Presence Scale include items such as “Discus-sions using the medium of CMC tend to be moreimpersonal than face-to-face discussions”). Thus,the question arises whether these instruments mea-sure social climate, social presence, feelings of thelearners toward CMC, and/or the intimacy or im-mediacy dimension of social presence.
The authors themselves also add to the confu-sion. Rourke and Anderson40 are not consistent inusing the term social climate. They also use theterm “social environment” and, when referring tothe instrument measuring social climate, they usethe term social presence (we also have to take intoaccount that their definition of social presence isdifferent than that of Short et al.13 Gunawardena5
stated that the 17, 5-point bipolar scale items (theSocial Presence Indicators) measures the students’perception of CMC as a social medium althoughshe defined social presence as “the degree to whicha person is perceived as a ‘real person’ in mediatedcommunication” (p. 151). This is not the same thing!Gunawardena also suggested a relationship betweensocial climate and social presence, yet this relation-ship is not clearly described. Finally, Gunawardenaand Zittle41 stated, for example, that their SocialPresence Scale measures the immediacy dimensionof social presence. However they also state that theSocial Presence Scale measures the “perceived senseof ‘online community,’ the degree of social comfortwith CMC” (p. 14).
In sum, we conclude that these existing instru-ments measure varying degrees of aspects of anamorphous set of variables, including social space,social climate, social environment, social presence,
sociability, feelings toward CMC, privacy, socialcontext, and the effects of using certain pedagogicaltechniques. Moreover, not all the measurements in-struments have construct validity nor do they pres-ent data (if any exists) as to their internal reliability.This confounding situation led us to the convictionthat we need to develop our own measures for so-ciability, social presence, and sociability. Thesemeasures are presented in the next sub-sections.
The Sociability Scale is a self-reporting question-naire in Dutch for measuring the perceived socia-bility of a CSCL environment. The construction ofthe test items of Sociability Scale is based upongroup awareness, communication, and potentialfor facilitating the creating a community of learn-ing. Consequently, the Sociability Scale is com-posed of test items addressing these elements.Table 1 depicts the (refined) sociability scale. Themethods section will explain in more detail the re-finement process and the meaning of the last threecolumns.
The Social Presence Scale. Like the SociabilityScale, the Social Presence Scale is a self-reportingquestionnaire in Dutch that measures the per-ceived degree of social presence in a CSCL envi-ronment. The construction of the test-items isinspired by telepresence research. According toSheridan,45 telepresence means that the operatorreceives sufficient information about the teleopera-tor and the task environment displayed in a suf-ficiently natural way, that the operator feelsphysically present at the remote site. This defini-tion reflects the original purpose of telepresenceresearch, namely that of a teleoperation in (e.g.,hazardous) physical environments. Today, tele-presence research also encompasses virtual pres-ence research: the experience of being in acomputer generated environment. These environ-ments can be text-based like MOOs and MUDs orgraphical 3D environments. Questionnaires mea-suring virtual presence are sometimes fairly sim-ple. For example, Towell and Towell46 use only asingle 5-point Likert-scale item: “I feel a sense ofactually being in same room with others when Iam connected to a MOO.” In the same vein, wehave developed a social presence scale. Table 2 de-picts the (refined) Social Presence Scale. Detailsabout the refinement process are discussed in themethods section.
The Social Space Scale The Social Space Scale is aself-reporting two-part measure in Dutch for as-sessing the perceived quality of social space in
DETERMINING SOCIABILITY, SOCIAL SPACE, AND SOCIAL PRESENCE 159

160 KREIJNS ET AL.
TABLE 1. THE SOCIABILITY SCALE
No. Factoritem Item M SD sociability
Q1 This CSCL environment enables me to 3.29 1.03 0.77easily contact my team mates
Q2 I do not feel lonely in this CSCL environment 2.90 1.18 0.69Q3 This CSCL environment enables me to get a 2.58 0.98 0.80
good impression of my team matesQ4 This CSCL environment allows spontaneous 2.75 1.14 0.68
informal conversationsQ5 This CSCL environment enables us to develop 2.76 1.05 0.80
into a well performing teamQ6 This CSCL environment enables me to develop 3.19 1.05 0.84
good work relationships with my team matesQ7 This CSCL environment enables me to identify 2.96 1.07 0.79
myself with the teamQ8 I feel comfortable with this CSCL environment 3.44 1.06 0.83Q9 This CSCL environment allows for non task- 3.61 0.99 0.69
related conversationsQ10 This CSCL environment enables me to make 2.49 1.13 0.73
close friendships with my team mates
Judgments were made on five-point Likert scales (1 = not applicable at all; 2 = rarely applicable; 3 = moder-ately applicable; 4 = largely applicable; 5 = totally applicable).
TABLE 2. THE SOCIAL PRESENCE SCALE
No. Factoritem Item M SD social presence
Q1 When I have real-time conversations in this 2.15 1.17 0.80CSCL environment, I have my communication partner in my mind’s eye
Q2 When I have asynchronous conversations in this 2.75 1.16 0.70CSCL environment, I also have my communication partner in my mind’s eye
Q3 When I have real-time conversations in this 2.90 1.50 0.79CSCL environment, I feel that I deal with very real persons and not with abstract anonymous persons
Q4 When I have asynchronous conversations in this 3.56 1.21 0.79CSCL environment, I also feel that I deal with very real persons and not with abstract anonymous persons
Q5 Real-time conversations in this CSCL environment 1.81 1.01 0.69can hardly be distinguished from face-to-face conversations
Judgments were made on five-point Likert scales (1 = not applicable at all; 2 = rarely applicable; 3 = moder-ately applicable; 4 = largely applicable; 5 = totally applicable).

distributed learning groups. The construction ofthe test items of Social Space Scale is based uponliterature on collaborative learning with respect topsychological health and well being in the group,47
and on social psychology (e.g., effects of trust, mak-ing friends). The first part (Q1–Q12) assesses theapplicability of feelings regarding their own or agroup members’ behavior in the CSCL environ-ment. The second part (Q13–Q20) assesses per-ceived frequencies of social behavior in the CSCL(Table 3).
MATERIALS AND METHODS
Participation
Data was collected from students in three dis-tance education courses at the Open UniversiteitNederland (OUNL). The first “course” is the Vir-tual Environmental Consultancy (VEC) of the De-partment of Natural Sciences (n = 35, 25 males,10 females from four higher education institutions).Students were assigned to one of eight groups.
DETERMINING SOCIABILITY, SOCIAL SPACE, AND SOCIAL PRESENCE 161
TABLE 3. THE SOCIAL SPACE SCALE
Factors
Positive NegativeNo. group groupitem Item M SD behavior behavior
Q1 Group members felt free to criticize the ideas, statements, 3.29 1.03 0.69and/or opinions of others
Q2 We reached a good understanding on how we had to function 2.44 1.32 0.75Q3 Group members ensured that we kept in touch with each other 3.10 1.11 0.79Q4 We worked hard on the group assignment 2.90 1.30 0.76Q5 I maintained contact with all other group members 2.78 1.31 0.76Q6 Group members gave personal information on themselves 2.82 1.07 0.62Q7 The group conducted open and lively conversations and/ 2.59 1.15 0.85
or discussionsQ8 Group members took the initiative to get in touch with others 2.84 1.11 0.87Q9 Group members spontaneously started conversations with others 2.66 1.10 0.72Q10 Group members asked others how the work was going 3.15 1.12 0.70Q11 Group members felt that they were attacked personally when 3.99 0.94 0.74
their ideas, statements and/or opinions were criticizedªQ12 Group members were suspicious of othersª 4.37 0.72 0.79Q13 Group members grew to dislike othersª 4.22 1.09 0.66Q14 I did the lion’s share of the workª 4.00 0.97 0.57Q15 Group members obstructed the progress of the workª 3.94 1.09 0.60Q16 Group members were unreasonableª 4.37 0.89 0.90Q17 Group members disagreed amongst each otherª 4.47 0.81 0.69Q18 The group had conflictsª 4.49 0.85 0.66Q19 Group members gossiped about each otherª 4.72 0.70 0.68Q20 Group members did not take others seriouslyª 4.72 0.58 0.60
aThese items were reverse coded for analysis.For items (refined Social Space Scale) Q1–Q12: Judgments were made on five-point Likert scales
(1 = not applicable at all; 2 = rarely applicable; 3 = moderately applicable; 4 = largely applicable; 5 = totally applica-ble). For items (refined Social Space Scale) Q13–Q20: Judgements were made on five-point Likert scales (1 = very rarely or never (on the average less than once a month), 2 = rarely (on the average once a month),3 = sometimes (on the average a few times a month), 4 = often (on the average a few times a week), 5 = al-ways or very often (on the average a few times a day).

Group size was between three and eight members.Groups could choose a case from a pool of 13 cases(e.g., “Criteria for sustainability in spatial interven-tions”) and had to produce an Environmental Ad-vice Report. Students used eRoom version 5.4(www.eroom.com) as their CSCL environment.
The two other courses were taken from theStatistics Education Innovation Project48 at the De-partment of Psychology. Thirty-eight adult under-graduates (all Dutch OUNL students, 6 males and32 females) enrolled in the first course (in this studydesignated as “Stat 1”) and were assigned to one ofseven groups consisting of five or six memberseach. However, the group sizes changed becausetwo female students were non-starters and duringthe course ten students (2 males, 8 females)dropped out. All groups had to study the samestudy-material emphasizing practicing psychologi-cal experimentation and the use of ANOVA. Groupshad to produce a prototype of a research paper. Thegroups made use of Studynet, the CSCL environ-ment of the OUNL. In Studynet, asynchronouscommunication occurred through newsgroups, andreal-time communication via Microsoft Netmeeting.Telephone and e-mail use were prohibited.
One hundred and thirteen adult undergraduates(all Dutch OUNL students, 34 males and 79 females)enrolled in the second course (in this study desig-nated as “Stat 2”). Students were assigned to one ofeight “slow” groups, eight “fast” groups, or two“free” groups. Slow and free groups had approxi-mately twice the time than fast groups to completethe course. Collaboration was compulsory for theslow and fast groups, and voluntary for the freegroups. Half of the slow groups and half of the fastgroups had four members; the remaining slow andfast groups had eight members. The group sizesof the two free groups were respectively 5 and12 members. However, this course had six femalestudents that were non-starters. During the course,14 students (4 males, 10 females) dropped out and18 students moved to another group. In addition,one slow group discontinued and one free groupwas formed. All groups had to study the same ma-terial emphasizing the use of questionnaires, mod-eration analysis with ANOVA, and regressionmethods. The groups of the second statisticalcourse used the Studynet CSCL environment aswell. Here, too, e-mail and telephone use were pro-hibited.
Procedure
VEC lasted 14 weeks in which there were threeface-to-face meetings, namely a kick-off meeting at
the start of the course, an evaluation meetinghalfway through the course, and a closing meetingat the end of the course. The questionnaire includ-ing all the measures, was administered electroni-cally (using Dipolar Professional Quest software,release 2.2, www.dipolar.com.au) just after the sec-ond face-to-face meeting. From the total of 35 stu-dents only 11 students (31.4%) responded to thequestionnaire from which 9 students (25.7%) re-sponded to all items. All respondents were merelyfrom two higher education institutions. Stat 1lasted 18 weeks in which three face-to-face meet-ings were organized. The same electronic question-naire was launched. From the number of studentsthat actually participated (26 students; 38 initialstudents less two non-starters and less 10 drop-outs), 18 (69.2%) students responded to the ques-tionnaire. Stat 2 had a variable length. Slow andfree groups had ten months to complete the coursewhile fast groups had six. At the time of the datacollection, slow and free groups were still studyingwhile the fast groups have completed the course.From the number of students that actually partici-pated (93 students; 113 initial students less six non-starters and less 14 drop-outs), 50 (53.8%) studentsresponded. Two students who dropped-out also re-turned the questionnaire. The total number of re-spondents is, therefore, 52.
Instruments
In order to validate the Sociability Scale, the So-cial Presence Scale, and the Social Space Scale, fourmeasures dealing with constructs related to socia-bility, social presence, and social space—or to as-pects of them—were selected as reference measures:
1. Social Presence Indicators5
2. Social Presence Scale41
3. Work-Group Cohesiveness Index49
4. Group Atmosphere Scale50, 51
For validation we used Campbell and Fiske’s52
criterion that related constructs in a nomologicalnetwork53 should exhibit moderate to high correla-tions, but not too high since extreme correlationcould be interpreted as equivalency.
The Gunawardena Social Presence Indicators.Gunawardena5 used a questionnaire of 17, 5-pointbipolar scale items to assess a range of feelingsstudents have toward CMC: stimulating–dull, personal–impersonal, sociable–unsociable, sensitive–insensitive, warm–cold, colorful–colorless,interesting–boring, appealing–not appealing,
162 KREIJNS ET AL.

interactive–non-interactive, active–passive, reli-able–unreliable, humanizing–dehumanizing, im-mediate–non-immediate, easy–difficult, efficient–inefficient, unthreatening–threatening, and help-ful–hindering. In this paper, we refer to these bi-polar scale items as the Social PresenceIndicators. In our study, we have translated theseitems into Dutch.
We believe the test items of the Social PresenceIndicators measure, amongst other things, many ofthe sociability aspects of CSCL environments (see,for instance, the item “sociable–unsociable”), lessof the social presence aspects, and even lesser onthe social space aspects. We therefore expect a highcorrelation between this measure and the Sociabil-ity Scale, a moderate correlation with the SocialPresence Scale, and a low to moderate correlationwith the Social Space Scale with respect to the Posi-tive Group Behavior dimension.
It is difficult to pronounce upon the correlationbetween the Social Presence Indicators and theNegative Group Behavior dimension of the SocialSpace Scale. It is unclear what the effects of a CSCLenvironment low in sociability and in social pres-ence are on group behavior in the negative dimen-sion. On the one hand, past research on socialpresence theory has suggested that CMC low insocial presence may cause deindividuation and de-personalization effects, possibly leading to unin-hibited behavior.54,55 On the other hand, Walther’s15
social information processing (SIP) theory rebutsthese suggestions. Therefore, we leave this correla-tion aside for the moment.
The Gunawardena and Zittle Social Presence Scale.The Gunawardena and Zittle41 Social Presence Scale(from here on referred to as the GZ Social PresenceScale for avoiding confusion with our Social Pres-ence Scale) is, according to Gunawardena and Zit-tle, an alternative scale for measuring social presencewhich can be used interchangeably with the SocialPresence Indicators. The GZ Social Presence Scaleconsists of 14, 5-point Likert-scale items. In ourstudy, we did not consider items 9, 10, and 11, be-cause these test-items ask to compare CMC with re-spectively face-to-face, audio teleconference, andvideo teleconference with regard to the imperson-ality of discussions. We also slightly adapted theGZ Social Presence Scale to better fit our particularsetting and translated it into Dutch.
Based on the test-items of the GZ Social PresenceScale, we believe that, like the Social Presence Indi-cators, this scale measures many of the sociabilityaspects and less of the social presence and socialspace aspects. We expect the magnitudes of the cor-
relations between this scale and our scales to be ap-proximately of the same magnitudes as the correla-tions between the Social Presence Indicators andour scales. With respect to the correlation betweenthe GZ Social Presence Scale and the NegativeGroup Behavior dimension of the Social SpaceScale, the same considerations as with the SocialPresence Indicators on this aspect, are applicablehere. Thus, we here also leave this correlation forthe moment aside.
The Price and Mueller Work Group Cohesion Index.Price and Mueller49 developed their Work GroupCohesion Index to measure work-group cohesionin an organizational context. The Work Group Co-hesion Index consists out of five, 5-point Likertscale items: “To what extent were the other teammates friendly?,” “To what extent were the otherteam mates helpful?,” “To what extent did theother team mates take a personal interest in you?,”“To what extent did you trust the other teammates?,” and “To what extent do you look forwardto working again with the same team mates?” Allitems were translated into Dutch.
Sociability is affecting social space, and an at-tribute of social space is social cohesiveness. There-fore, we expect a moderate correlation between theWork Group Cohesion Index and the SociabilityScale. Since social cohesiveness is an attribute of so-cial space, we expect a high correlation between theWork Group Cohesion Index and the PositiveGroup Behavior dimension of the Social SpaceScale. If social cohesiveness is low, then this mayindicate, for example, that a sense of community isfailing or that affective relationships could not de-velop. One reason could be negative behavior inthe group, for example, trust is violated by groupmembers. Based upon this reasoning, we expect a(very) low correlation with the Work Group Cohe-sion Index and the Negative Group Behavior di-mension of the Social Space Scale. The correlationbetween the Work Group Cohesion Index and theSocial Presence Scale is expected to be moderate,because social presence and social cohesivenessmutually affect each other.56
Fiedler’s Group Atmosphere Scale. Fiedler51 devel-oped the Group Atmosphere Scale, which made usenine 8-point bipolar scale items for assessing the at-mosphere in a group as perceived by the group:warm–cold, interesting–boring, accepting– rejecting,satisfying–frustrating, enthusiastic– unenthusiastic,productive–non-productive, cooperative–uncooper-ative, supportive–hostile, and successful–unsuccess-ful. Instead of using 8-point scales we used 5-point
DETERMINING SOCIABILITY, SOCIAL SPACE, AND SOCIAL PRESENCE 163

scales to concur with the other scales used. All itemswere translated into Dutch.
The correlation between the Group AtmosphereScale and the Social Space Scale in the PositiveGroup Behavior dimension is expected to be mod-erate because a sound social space is contributingto a positive group atmosphere (i.e., social climate)and vice versa. If the group atmosphere is low, thenthis is possibly due to problems within the groupand we therefore expect a (very) low correlation be-tween the Group Atmosphere scale and the SocialSpace Scale in the Negative Group Behavior di-mension. Sociability, as well as social presence, af-fects social space and thus indirectly contributes togroup atmosphere. Consequently, we expect mod-erate correlations between the Group AtmosphereScale and the two scales for sociability and socialpresence.
However, the Group Atmosphere Scale is verysimilar to the Social Presence Indicators; therefore,we actually expect the correlations to be somewhathigher, but lower than the magnitudes of the corre-lations between the Social Presence Indicators andeach of our scales.
Our expectations with regard to the correlationsbetween the scales involved are summarized inTable 4.
Refinement of the scales
The process of refining the raw Sociability Scale,Social Presence Scale, and Social Space Scaleevolved in two phases. In the first phase we ap-plied a factor analysis (Principal ComponentAnalysis, no rotation) on the scores of all 174 testitems of the questionnaire. Except for the rawscales, the questionnaire also contained, amongstothers, the Social Presence Indicators, the GZ SocialPresence Scale, the Work Group Cohesion Index,and the Group Atmosphere Scale. The total samplewas 79 students, which is low considering a total of
174 items on the questionnaire. This means that re-sults should be interpreted with some reservation.
The analysis revealed 37 components possessingeigenvalues of 1.0 or greater (Kaiser-Gutman Rule).However, according to Hofstee57 the criterion of 1.0is too liberal and argued that only components pos-sessing eigenvalues of 4.0 should be considered(pp. 126–127). That latter criterion revealed sixcomponents. A scree test58 revealed a clear breakafter the third component. We therefore concludedthat there are at least three factors.
The actual refinement process happens in thesecond phase in a number of steps; that numbermay differ per scale. The following subsections dis-cuss the refinement process for each scale.
Refining the raw Sociability Scale
The raw Sociability Scale was refined in threesteps. In the first step, 24 items from the 34 initialtest items were removed because they either ad-dressed a utility aspect (feature) such as “ThisCSCL environment enabled me to see who of thegroup members are logged in” or a usability aspectsuch as “This CSCL environment has easy access tothe communication media.” Although these itemscan be associated with sociability, they are gener-ally used for assessing the usefulness19 of a CSCLenvironment. Therefore, we decided not to includethe items in the Sociability Scale.
In the second step, a factor analysis (PrincipalComponent Analysis, no rotation) was performedon the remaining test items. This step revealed thatthe Sociability Scale is one-dimensional (using thescree test of Catell58). The step was also used to re-move the few test items that did not load higherthan 0.40 (see for this criterion, Stevens59) exclu-sively on the first factor (removed zero items). Thethird and last step was to reduce the remaining testitems further to ten without losing too much of ex-
164 KREIJNS ET AL.
TABLE 4. SUMMARY OF THE EXPECTED CORRELATIONS BETWEEN THE SCALES
Social space scale
Social Positive NegativeSociability presence group group
Measure scale scale behavior behavior
Social presence indicators High Moderate Low/moderate ?GZ social presence scale High Moderate Low/moderate ?Work group cohesion index Moderate Moderate High Very low/lowGroup atmosphere scale Moderate/high Moderate Low/moderate Very low/low

plained total variance (removed zero items, we al-ready had 10 items).
The resulting refined Sociability Scale is depictedin Table 1. The last three columns show respec-tively mean M, standard deviation SD, and loadingon the first and only factor (a new factor analysis(Principal Component Analysis, no rotation) wasperformed on the ten final test items). The factorexplained 58.52% of the total variance.
Refining the raw Social Presence Scale
The raw Social Presence Scale initially consistedof eight initial test items which we reduced to fiveitems. Our objective was to derive a one-dimensional measure (the screeplot58 suggestedthis dimensionality). Two items were removed thatdid not directly assess the feeling of the “trans-portation of the communication partner from thereto here” (see Lombard and Ditton60). Factor analy-sis (Principal Component Analysis, no rotation) onthe remaining six test items revealed two factors,one item loaded equally strong on both factors; thisitem was removed.
Table 3 depicts the refined Social Presence Scale.A second factor analysis (Principal ComponentAnalysis, no rotation) was performed on the fivetest items of the refined scale to obtain the factorloadings on the first and only factor. The factor ex-plained 57.17% of the total variance.
Refining the raw Social Space Scale
The raw Social Space Scale contained 44 initialtest items and was refined in the following foursteps. In the first step, a factor analysis (PrincipalComponent Analysis, Varimax rotation) was per-formed on these test items and all other items of thequestionnaire encompassing all the other scales.The majority of initial test items of the raw SocialSpace Scale loaded higher than 0.4059 exclusivelyon factor two or three. This means that the socialspace construct is not one-dimensional but two-dimensional. These two factors are interpreted asPositive Group Behavior (factor two) and NegativeGroup Behavior (factor three) and can be consid-ered as dimensions of the social space construct. Inthis step, test items were also removed whose loadon the two factors were less than 0.40 (five items),or that did load higher on the other factors than onthe two factors (two items). The second step was acareful semantic examination on the items. Testitems that show similarities with or were (semanti-cally) identical to items on the other scales were re-moved (11 items). The third step was removal of
test items not associated with positive or negativegroup behavior (four items), or almost semanticallyidentical to another item within the raw SocialSpace Scale (one item). The fourth and final stepwas aimed to balance the items in the dimensionsPositive Group Behavior and Negative Group Be-havior with no more than ten items in each dimen-sion (removed one item). The refined Social SpaceScale is depicted in Table 3. With respect to theloadings, a new factor analysis (Principal Compo-nent Analysis using Varimax rotation) was per-formed on the final 20 test items thereby focusingon a two factor solution. Both factors show strongloadings. The two factor solution explained 54.59%of the total variance (the first factor explained30.14% and the second factor 24.45%).
RESULTS
Internal consistency and validity of the scales
Cronbach’s alphas for the Sociability Scale andthe Social Presence Scale are, respectively, 0.92 and0.81, revealing a high internal consistency for bothscales. Cronbach’s alpha for the Social Space Scaleis 0.91; Cronbach’s alphas for the factors represent-ing the Positive Group Behavior dimension and theNegative Group Behavior dimension are, respec-tively, 0.92 and 0.87. These values show that the So-cial Space Scale has a high internal consistency aswell.
The content validity of the scales was establishedvia face-validity. The items were developed basedupon a search in the literature regarding social in-teraction via CMC, group development and groupdynamics, social presence, trust building, and cre-ating sense of community. Items were then as-sessed by the authors of this paper.
Pearson bi-variate correlations
First we applied a Pearson bi-variate correlation(2-tailed) analysis on the aggregate scores of thetest items of the different scales involving Sociabil-ity Scale, Social Presence Scale, and Social SpaceScale on the one-hand, and each of the measures ofSocial Presence Indicators, GZ Social PresenceScale, Work Group Cohesion Index, and Group At-mosphere Scale on the other hand. Table 5 depictsthe correlations.
As can be seen, correlations are as expected withrespect to both the strength and the direction(Table 4). The correlations between the Social Pres-ence Indicators and the Negative Group Behavior
DETERMINING SOCIABILITY, SOCIAL SPACE, AND SOCIAL PRESENCE 165
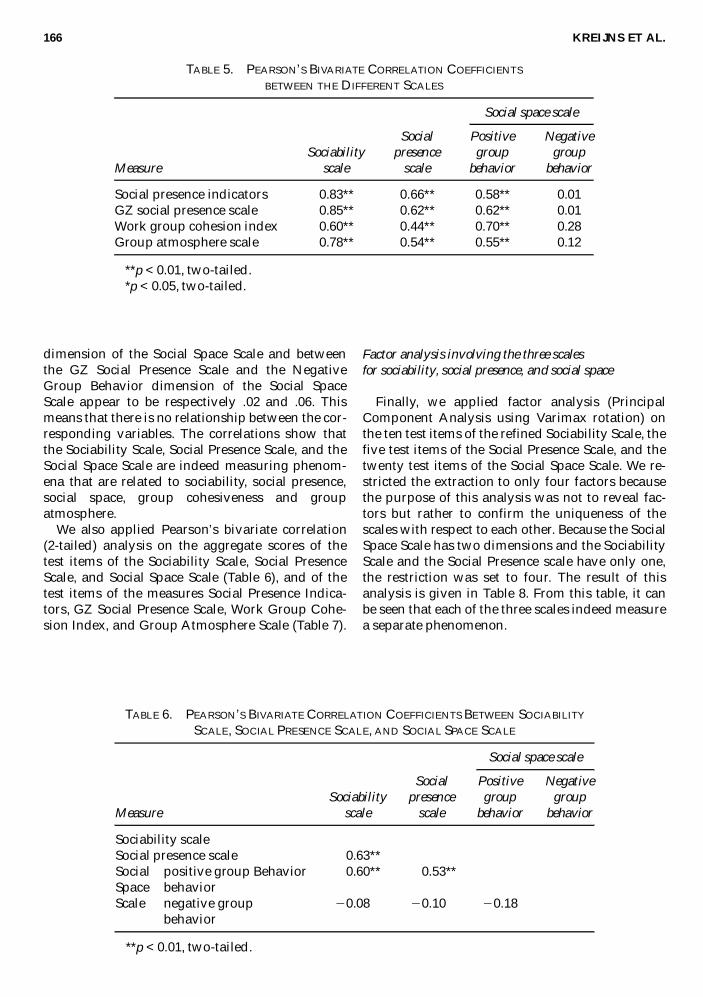
dimension of the Social Space Scale and betweenthe GZ Social Presence Scale and the NegativeGroup Behavior dimension of the Social SpaceScale appear to be respectively .02 and .06. Thismeans that there is no relationship between the cor-responding variables. The correlations show thatthe Sociability Scale, Social Presence Scale, and theSocial Space Scale are indeed measuring phenom-ena that are related to sociability, social presence,social space, group cohesiveness and groupatmosphere.
We also applied Pearson’s bivariate correlation (2-tailed) analysis on the aggregate scores of thetest items of the Sociability Scale, Social PresenceScale, and Social Space Scale (Table 6), and of thetest items of the measures Social Presence Indica-tors, GZ Social Presence Scale, Work Group Cohe-sion Index, and Group Atmosphere Scale (Table 7).
Factor analysis involving the three scales for sociability, social presence, and social space
Finally, we applied factor analysis (PrincipalComponent Analysis using Varimax rotation) onthe ten test items of the refined Sociability Scale, thefive test items of the Social Presence Scale, and thetwenty test items of the Social Space Scale. We re-stricted the extraction to only four factors becausethe purpose of this analysis was not to reveal fac-tors but rather to confirm the uniqueness of thescales with respect to each other. Because the SocialSpace Scale has two dimensions and the SociabilityScale and the Social Presence scale have only one,the restriction was set to four. The result of thisanalysis is given in Table 8. From this table, it canbe seen that each of the three scales indeed measurea separate phenomenon.
166 KREIJNS ET AL.
TABLE 5. PEARSON’S BIVARIATE CORRELATION COEFFICIENTS
BETWEEN THE DIFFERENT SCALES
Social space scale
Social Positive NegativeSociability presence group group
Measure scale scale behavior behavior
Social presence indicators 0.83** 0.66** 0.58** 0.01GZ social presence scale 0.85** 0.62** 0.62** 0.01Work group cohesion index 0.60** 0.44** 0.70** 0.28Group atmosphere scale 0.78** 0.54** 0.55** 0.12
**p < 0.01, two-tailed.*p < 0.05, two-tailed.
TABLE 6. PEARSON’S BIVARIATE CORRELATION COEFFICIENTS BETWEEN SOCIABILITY
SCALE, SOCIAL PRESENCE SCALE, AND SOCIAL SPACE SCALE
Social space scale
Social Positive NegativeSociability presence group group
Measure scale scale behavior behavior
Sociability scaleSocial presence scale 0.63**Social positive group Behavior 0.60** 0.53**Space behaviorScale negative group 20.08 20.10 20.18
behavior
**p < 0.01, two-tailed.

DETERMINING SOCIABILITY, SOCIAL SPACE, AND SOCIAL PRESENCE 167
TABLE 7. PEARSON’S BIVARIATE CORRELATION COEFFICIENTS BETWEEN THE MEASURES
SOCIAL PRESENCE INDICATORS, GZ SOCIAL PRESENCE SCALE, WORK GROUP COHESION
INDEX, AND GROUP ATMOSPHERE SCALE
Social GZ social Work group Grouppresence presence cohesion atmosphere
Measure indicators scale index scale
Social presence indicatorsGZ social presence scale 0.85**Work group cohesion index 0.59** 0.66**Group atmosphere scale 0.92** 0.82** 0.66**
**p < 0.01, two-tailed.
TABLE 8. FACTOR ANALYSIS ON THE SCORES OF THE ITEMS OF THE SOCIABILITY SCALE, SOCIAL PRESENCE SCALE,AND THE SOCIAL SPACE SCALE
Factors
Positive NegativeNo. Social group group
Measure item Item Sociability presence behavior behavior
Sociability Q1 This CSCL environment enables 0.74scale me to easily contact my team
matesQ2 I do not feel lonely in this CSCL 0.76
environmentQ3 This CSCL environment enables 0.71
me to get a good impression of myteam mates
Q4 This CSCL environment allows 0.70spontaneous informalconversations
Q5 This CSCL environment enables us 0.56 0.45to develop into a well performingteam
Q6 This CSCL environment enables 0.70me to develop good workrelationships with my team mates
Q7 This CSCL environment enables 0.55 0.46me to identify myself with theteam
Q8 I feel comfortable with this CSCL 0.73environment
Q9 This CSCL environment allows for 0.68non task-related conversations
Q10 This CSCL environment enables 0.69me to make close friendships withmy team mates
Social Q1 When I have real-time 0.69presence conversations in this CSCLscale environment, I have my
communication partner in mymind’s eye
continued

168 KREIJNS ET AL.
Q2 When I have asynchronous 0.44 0.65conversations in this CSCLenvironment, I also have mycommunication partner in mymind’s eye
Q3 When I have real-time 0.56conversations in this CSCLenvironment, I feel that I deal with very real persons and notwith abstract anonymous persons
Q4 When I have asynchronous 0.62conversations in this CSCLenvironment, I also feel that I dealwith very real persons and not withabstract anonymous persons
Q5 Real-time conversations in this 0.48CSCL environment can hardly bedistinguished from face-to-faceconversations
Positive Q1 Group members felt free to 0.74group criticize the ideas, statements,behavior and/or opinions of others
Q2 We reached a good understanding 0.76on how we had to function
Q3 Group members ensured that we 0.77kept in touch with each other
Q4 We worked hard on the group 0.77assignment
Q5 I maintained contact with all other 0.69group members
Q6 Group members gave personal 0.42 0.49information on themselves
Q7 The group conducted open and 0.79lively conversations and/ordiscussions
Q8 Group members took the initiative 0.80to get in touch with others
Q9 Group members spontaneously 0.51 0.53started conversations with others
Q10 Group members asked others how 0.60the work was going
Negative Q11 Group members felt that they were 0.73group attacked personally when theirbehavior ideas, statements, and/or opinions
were criticizeda
Q12 Group members were suspicious 0.78of othersa
TABLE 8. CONTINUED
Factors
Positive NegativeNo. Social group group
Measure item Item Sociability presence behavior behavior

DISCUSSION
The validation of the three instruments havesome weak points that limit the study. First, thenumber of cases was 79. A general rule of thethumb is that there must be at least 10 cases peritem. The raw Social Space Scale contained themost initial test items, namely 44 items, meaningthat we actually needed 440 cases to derive thismeasure. Second, there were three samples (VEC,Stat 1, and Stat 2) that have been collapsed in orderto obtain the 79 cases. We agree the samples havedifferent characteristics (e.g., time aspects, CSCLenvironments, task type) which mean that they ac-tually can not be collapsed into one big sample.Third, we used the same cases for the factor analy-sis on the test items of the refined Sociability Scale,the Social Presence Scale, and the Social SpaceScale. This implicates that the result (Table 8) mighttake advantage of the chance characteristic of the79 cases from which these scales were derived.Fourth, some items do load more than 0.40 on theother factors.
Taking these weak points together, we muststress that the findings in this paper only suggestthat the instruments have potential to be useful asmeasures for the respective variables.
CONCLUSION
Socio-emotional processes underlie group form-ing, group dynamics, and the building of groupstructures, leading to the establishment of a soundsocial space. Such sound social space is importantsince it facilitates and reinforces social interactionand, in turn, influences the effectiveness of collabora-tive learning. Though this is true in both contiguousand distributed learning groups, socio-emotionalprocesses in the latter are far more difficult to achieveand to sustain than in contiguous groups due to itsmediation via computer-supported collaborativelearning (CSCL) environments.
In order to examine socially enhanced environ-ments there is also a need for instruments that mea-sure a variety of variables. This paper presentsthree of these instruments: a Sociability Scale, a So-cial Presence scale, and a Social Space Scale. How-ever, it must be realized that these measures arepreliminary “first steps.” More experiments areneeded for corroborating the findings in this paper.In fact, we are just doing content analysis on thepostings of a discussion board of the course Stat 1using the community of inquiry model developedby Garrison, Anderson, and Archer61 and relatedinstruments for assessing teaching presence,
DETERMINING SOCIABILITY, SOCIAL SPACE, AND SOCIAL PRESENCE 169
Q13 Group members grew to dislike 0.66othersa
Q14 I did the lion’s share of the worka 0.56Q15 Group members obstructed the 0.41 0.58
progress of the worka
Q16 Group members were 0.90unreasonablea
Q17 Group members disagreed amongst 0.69each othera
Q18 The group had conflictsa 0.67Q19 Group members gossiped about 0.69
each othera
Q20 Group members did not take others 0.60seriouslya
aThese items were reverse coded for analysis.
TABLE 8. CONTINUED
Factors
Positive NegativeNo. Social group group
Measure item Item Sociability presence behavior behavior

cognitive presence, and in particular social presence(see Rourke et al.62). It would go beyond the scopeof this article to discuss this model and relate thethree kinds of presences with social space. How-ever, future articles will report on this issue andpresent results.
ACKNOWLEDGMENTS
We thank Hans van der Vleugel and Rolf vanGeel for their comments on the methodological andstatistical sections of the draft version of this arti-cle, which have contributed to its quality.
REFERENCES
1. Gregor, S.D., & Cuskelly, E.F. (1994). Computer me-diated communication in distance education. Journalof Computer Assisted Learning 10:168–181.
2. Hallet, K., & Cummings, J. (1997). The virtual class-room as authentic experience: Collaborative,problem-based learning in a WWW environment.In: Proceedings of the annual conference on distance teach-ing and learning: competition-connection-collaboration.Madison, WI: University of Wisconsin–Madison, pp.103–107.
3. Heath, E.F. (1998). Two cheers and a pint of worry: anon-line course in political and social philosophy.Journal of Asynchronous Learning Networks 2:15–33.
4. Mason, R. (1991). Analyzing computer conferencinginteractions. International Journal of Adult Educationand Training 2:161–173.
5. Gunawardena, C.N. (1995). Social presence theoryand implications for interaction and collaborativelearning in computer conferences. International Jour-nal of Educational Telecommunications 1:147–166.
6. Hiltz, S.R. (1998). Collaborative learning in asyn-chronous learning networks: building learning com-munities. Presented at the WEB98, Orlando, Florida.Available: http://eies.njit.edu/~hiltz/collaborativelearning in asynch.htm.
7. Hobaugh, C.F. (1997). Interactive strategies for col-laborative learning. In: Proceedings of the annualconference on distance teaching and learning: competi-tion-connection-collaboration. Madison, WI: Universityof Wisconsin–Madison, pp. 121–125.
8. Hughes, C., & Hewson, L. (1998). Online interac-tions: developing a neglected aspect of the virtualclassroom. Educational Technology 38:48–55.
9. Taha, L.H., & Caldwell, B.S. (1993). Social isolationand intergration in electronic environments. Behav-iour & Information Technology 12:276–283.
10. Kreijns, K., Kirschner, P.A., & Jochems, W. (2003a).Identifying the pitfalls for social interaction incomputer-supported collaborative learning environ-
ments: a review of the research. Computers in HumanBehavior 19:335–353.
11. Kreijns, K., Kirschner, P.A., & Jochems, W. (2003).Supporting social interaction for group dynamicsthrough social affordances in CSCL: Group aware-ness widgets. Presented at the 10th Biennial Euro-pean Conference for Research on Learning andInstruction (EARLI), Padova, Italy.
12. Brandon, D.P., & Hollingshead, A.B. (1999). Collabo-rative learning and computer-supported groups.Communication Education 18:109–126.
13. Short, J., Williams, E., & Christie, B. (1976). The socialpsychology of telecommunications. London: John Wiley& Sons.
14. Wallace, P. (1999). The psychology of the internet.Cambridge, United Kingdom: Cambridge UniversityPress.
15. Walther, J.B. (1992). Interpersonal effects in com-puter-mediated interaction: a relation perspective.Communication Research 19:52–90.
16. Whittaker, S., & O’Conail, B. (1997). The role of vi-sion in face-to-face and mediated communication. In:K.E. Finn, A.J. Sellen, & S.B. Wilbur (eds.), Video-mediated communication. Mahwah, NJ: Lawrence Erl-baum, pp. 23–49.
17. Clark, H.H., & Brennan, S.E. (1991). Grounding incommunication. In: L.B. Resnick, J.M. Levine, & S.D.Teasley (eds.), Perspectives on socially shared cognition.Washington, DC: American Psychological Associa-tion, pp. 127–149.
18. Alben, L. (1997). At the heart of interaction design.Design Management Journal 8:9–26.
19. Shneiderman, B. (1998). Designing the user interface:strategies for effective human–computer interaction, 3rded. New York: Addison-Wesley.
20. Rourke, L. (2000). Operationalizing social interactionin computer conferencing. In: Proceedings of the 16thannual conference of the Canadian Association for Dis-tance Education. Quebec City, Canada.
21. Wegerif, R. (1998). The social dimension of asynchro-nous learning networks. Journal of AsynchronousLearning Networks 2:34–49.
22. Cutler, R.H. (1996). Technologies, relations, andselves. In: L. Strate, R. Jacobson, & S.B. Gibson (eds.),Communication and cyberspace: social interaction in anelectronic environment. Cresskill, NJ: Hampton Press,pp. 317–333.
23. Gaver, W.W. (1996). Situating action II: affordancesfor interaction: the social is material for design. Eco-logical Psychology 8:111–129.
24. Gibson, J.J. (1977). The theory of affordances. In: R.Shaw & J. Bransford (eds.), Perceiving, acting, andknowing. Hillsdale, NJ: Erlbaum, pp. 67–82.
25. Gibson, J.J. (1986). The ecological approach to visual per-ception. Hillsdale, NJ: Lawrence Erlbaum.
26. Kreijns, K., Kirschner, P.A., & Jochems, W. (2002).The sociability of computer-supported collaborativelearning environments. Journal of Education Technol-ogy & Society 5:8–22.
170 KREIJNS ET AL.

27. Tammelin, M. (1998). From telepresence to socialpresence: the role of presence in a network-basedlearning environment. In: S. Tella (ed.), Aspects ofmedia education. Volume 8. Strategic imperatives in theinformation age. Helsinki, Finland: Media EducationCentre, University of Helsinki, Media EducationPublications, pp. 219–231.
28. Tu, C.H. (2000). On-line learning migration: from so-cial learning theory to social presence theory in aCMC environment. Journal of Network and ComputerApplications 23:27–37.
29. Tu, C,H. (2002). The impacts of text-based CMC ononline social presence. The Journal of Interactive On-line Learning 1:1–24.
30. Tu, C.H., & Isaacs, M. (2002). An examination of so-cial presence to increase interaction in online classes.American Journal of Distance Education 16:131–150.
31. Bradner, E., Kellogg, W., & Erickson, T. (1999). Theadoption and use of “Babble”: a field study of chatin the workplace. In: S. Bødker, M. Kyng, & K.Schmidt (eds.), Proceedings of the 6th [European confer-ence on computer-supported cooperative work. Dor-drecht, The Netherlands: Kluwer Academic Press,pp. 139–158.
32. Tang, J.C., & Rua, M. (1994). Montage: providingteleproximity for distributed groups. In: B. Adelson,S. Dumais, & J.S. Olson (eds.), Conference proceedingson human factors in computing systems: celebrating in-terdependence. New York: ACM Press, pp. 17–43.
33. Borning, A., & Travers, M. (1991). Two approaches tocasual interaction over computer and video net-works. In: S.P. Robertson, G.M. Olson, & J.S. Olson(eds.), Conference proceedings on human factors in com-puting systems: reaching through technology. New York:ACM Press, pp. 13–19.
34. Gutwin, C., Roseman, M., & Greenberg, S. (1996). Ausability study of awareness widgets in a sharedworkspace groupware system. In: M.J. Tauber, V. Be-lotti, R. Jeffries, et al. (eds.), Conference proceeding onhuman factors in computing systems: common ground.New York: ACM Press, pp. 258–268.
35. Bly, S.A., Harrison, S.R., & Irwin, S. (1993). Mediaspaces: bringing people together in a video, audio,and computing environment. Communications of theACM 36:28–47.
36. Pedersen, E.R., & Sokoler, T. (1997). AROMA: ab-stract representation of presence supporting mutualawareness. In: S. Pemberton (ed.), Conference proceed-ings on human factors in computing systems: looking tothe future. New York: ACM Press, pp. 51–58.
37. Ackerman, M.S., Starr, B., Hindus, D., et al. (1997).Hanging on the “wire”: a field study of an audio-only media space. ACM Transactions on Computer–Human Interaction 4:39–66.
38. Gay, G., & Lentini, M. (1995). Use of collaborative re-sources in a networked collaborative design environ-ment. Journal of Computer Mediated Communication[On-line]. Available: www.ascusc.org/jcmc/vol1/issue1/IMG JCMC/ResourceUse.html.
39. Garrison, R.D. (1997). Computer conferences: thepost-industrial age of distance education. OpenLearning 12:3–11.
40. Rourke, L., & Anderson, T. (2002). Exploring socialcommunication in asynchronous, text-based com-puter conferencing. Journal of Interactive Learning Re-search 13:259–275.
41. Gunawardena, C.N., & Zittle, F. (1997). Social pres-ence as a predictor of satisfaction within a computermediated conferencing environment. American Jour-nal of Distance Education 11:8–25.
42. Argyle, M., & Dean, J. (1965). Eye contact, distanceand affiliation. Sociometry 28:289–304.
43. Wiener, M., & Mehrabian, A. (1968). Language withinlanguage: immediacy, a channel in verbal communication.New York: Appleton-Century-Crofts.
44. Tu, C.H. (2002). The measurement of social presencein an online learning environment. International Jour-nal on E-learning April-June:34–45.
45. Sheridan, T.B. (1992) Musings on telepresence andvirtual presence. Presence: Teleoperators and VirtualEnvironments 1:120–126.
46. Towell, J., & Towell, E. (1997). Presence in text-basednetworked virtual environments or “MUDS.” Pres-ence: Teleoperators and Virtual Environments 6:590–595.
47. Johnson, D.W., & Johnson, R.T. (1994). Learning to-gether and alone: cooperative, competitive, and individu-alistic learning, 4th ed. Needham Heights, MA: Allyn& Bacon.
48. Van Buuren, H., & Giesbertz, W. (1999). Naar eenvirtueel onderzoekcentrum: innovatie van het on-derwijs in methoden en technieken van onderzoek[Towards a virtual research center: innovation of re-search methods and statistics education]. In: K.Schlusmans, R. Slotman, C. Nagtegaal, et al. (eds.),Competentiegerichte leeromgevingen. Utrecht, TheNetherlands: Lemma, pp. 137–150.
49. Price, J.L., & Mueller, C.W. (1986). Handbook of organi-zational measurement. Marshfield, MA: Pitman Pub-lishing Inc.
50. Fiedler, F.E. (1962). Leader attitudes, group climate,and group creativity. Journal of Abnormal and SocialPsychology 65:308–318.
51. Fiedler, F.E. (1967). A theory of leadership effectiveness.New York: McGraw-Hill.
52. Cambell, D.T., & Fiske, D.W. (1959). Convergent anddiscriminant validation by the multi-trait-multimethod matrix. Psychological Bulletin 56:81–105.
53. Cronbach, L.J., & Meehl, P.E. (1955). Construct valid-ity in psychological tests. Psychological Bulletin52:281–302.
54. Connolly, T., Jessup, L.M., & Valacich, J.S. (1990). Ef-fects of anonymity and evaluative tone on idea gen-eration in computer-mediated groups. ManagementScience 36:97–120.
55. Lea, M., & Spears, R. (1991). Computer mediatedcommunication, de-individuation and group deci-sion making. International Journal of Man-MachineStudies 31:283–301.
DETERMINING SOCIABILITY, SOCIAL SPACE, AND SOCIAL PRESENCE 171

56. Yoo, Y., & Alavi, M. (2001). Media and group cohe-sion: Relative influences on social presence, task par-ticipation, and group cohesiveness, MIS Quarterly25:371–390.
57. Hofstee, W.K.B. (1999). Principes van beoordeling:methodiek en ethiek van selectie, examinering en evaluatie[Principles of assessment: methods and ethics of selec-tions, testing and evaluation]. Lisse, The Netherlands:Swets & Zeitlinger BV.
58. Cattell, R.B. (1966). The scree test for number of fac-tors. Multivariate Behavioral Research 1:245–276.
59. Stevens, J.P. (1992). Applied multivariate statistics forthe social sciences, 2nd ed. Hillsdale, NJ: LawrenceErlbaum.
60. Lombart, M., & Ditton, T. (1997). At the heart of it all:the concept of presence. Journal of Computer-MediatedCommunication [On-line]. Available: www.ascusc.org/-jcmc/vol3/issue2/lombard.html.
61. Garrison, D.R., Anderson, T., & Archer, W. (2000).Critical thinking in a text-based environment: com-puter conferencing in higher education. Internet andHigher Education 11:1–14.
62. Rourke, L., Anderson, T., Garrison, D.R., et al. (1999).Assessing social presence in asynchronous text-based computer conferencing. Journal of Distance Ed-ucation 14:50–71.
Address reprint requests to:Karel Kreijns
Open Universiteit NederlandP.O. Box 2960
6401 DL Heerlen, The Netherlands.
E-mail: [email protected]
172 KREIJNS ET AL.