Determination of the effective geometrical features of the ...
18
The International Journal of Advanced Manufacturing Technology (2019) 104:315–332 https://doi.org/10.1007/s00170-019-03746-7 ORIGINAL ARTICLE Determination of the effective geometrical features of the piercing punch for polymer composite belts Dominik Wojtkowiak 1 · Krzysztof Tala´ ska 1 Received: 21 December 2018 / Accepted: 14 April 2019 / Published online: 31 May 2019 © The Author(s) 2019 Abstract Punch optimization is important in improving the technological process of belt perforation. Research about this process can rarely be found in the scientific literature. The objective of this paper is to determine the effective geometry of the piercing punches with a spherical bowl used for polymer composite belts. In order to fulfill this goal, the complex research of the influence of the geometrical features of the piercing punch on the perforation force, the hole quality, and the tool life has been conducted. For derivation of the proposed model, the authors have used the combination of analytical and FEM analyses, along with the experimental tests validation. Based on the results, there are clear correlations between the depth of the spherical bowl punch and the perforation force or the hole diameter deviation. By analyzing the ratio of the perforation and transverse force, we are able to evaluate how the tool life will change for different sets of geometrical parameters. All these correlations have been used to derive the indicators of the perforation force, tool life, and hole quality. Based on those, the optimization function has been specified. Finding the minimum value of this function makes it possible to define the optimal tool geometry. The design of effective tools for belt perforation with diameters D = 5, 6, 8, and 10 mm has been presented, but the obtained characteristic makes it possible to find an optimal solution for any diameter which lays in the range from 3 to 10 mm. Since the model has been built based on the indicators, it is easy to adjust it to match any specific requirements of the belt manufacturers, which makes it useful for tool designers. Keywords Belt perforation · Punching · Tool optimization · Polymer composites Nomenclature Δ Hole diameter deviation mm δ Ovality factor − μ Friction coefficient − A Area of transverse compression mm 2 D Diameter of a piercing punch mm D L Hole diameter in longitudinal direction mm D N Nominal diameter of the hole mm D T Hole diameter in transverse direction mm E Young’s modulus MPa F F Inside surface of the spherical bowl friction N F FO Side surface of the piercing punch fricition N F i Force of the spring in the point i N F M Resistance force of the material N F R Radial force N Dominik Wojtkowiak [email protected] 1 Chair of Basics of Machine Design, Poznan University of Technology, ul. Piotrowo 3, 60-965 Pozna´ n, Poland F P Perforation force N F T Transverse force N H Depth of a spherical bowl mm h Depth of the penetration mm k i Constant of the spring in the point i N/mm L Clearance between a punch and a die mm l 0 Length of the undeformed material mm n Number of points on the penetration length − p T Transverse punch-belt pressure MPa p V Vertical punch-belt pressure MPa R Radius of a spherical bowl mm r Radius of the cutting edge mm x Width of the ring of the punch penetration mm x F Perforation force indicator − x L Tool life indicator − x Q Hole quality indicator − 1 Introduction Perforation of the conveyor belts, due to the variety of mate- rials used for manufacturing multilayer composite belts and
-
Upload
khangminh22 -
Category
Documents
-
view
3 -
download
0
Transcript of Determination of the effective geometrical features of the ...

The International Journal of Advanced Manufacturing Technology (2019) 104:315–332https://doi.org/10.1007/s00170-019-03746-7
ORIGINAL ARTICLE
Determination of the effective geometrical features of the piercingpunch for polymer composite belts
Dominik Wojtkowiak1 · Krzysztof Talaska1
Received: 21 December 2018 / Accepted: 14 April 2019 / Published online: 31 May 2019© The Author(s) 2019
AbstractPunch optimization is important in improving the technological process of belt perforation. Research about this processcan rarely be found in the scientific literature. The objective of this paper is to determine the effective geometry of thepiercing punches with a spherical bowl used for polymer composite belts. In order to fulfill this goal, the complex researchof the influence of the geometrical features of the piercing punch on the perforation force, the hole quality, and the tool lifehas been conducted. For derivation of the proposed model, the authors have used the combination of analytical and FEManalyses, along with the experimental tests validation. Based on the results, there are clear correlations between the depth ofthe spherical bowl punch and the perforation force or the hole diameter deviation. By analyzing the ratio of the perforationand transverse force, we are able to evaluate how the tool life will change for different sets of geometrical parameters. Allthese correlations have been used to derive the indicators of the perforation force, tool life, and hole quality. Based on those,the optimization function has been specified. Finding the minimum value of this function makes it possible to define theoptimal tool geometry. The design of effective tools for belt perforation with diameters D = 5, 6, 8, and 10 mm has beenpresented, but the obtained characteristic makes it possible to find an optimal solution for any diameter which lays in therange from 3 to 10 mm. Since the model has been built based on the indicators, it is easy to adjust it to match any specificrequirements of the belt manufacturers, which makes it useful for tool designers.
Keywords Belt perforation · Punching · Tool optimization · Polymer composites
Nomenclature
Δ Hole diameter deviation mm
δ Ovality factor −μ Friction coefficient −A Area of transverse compression mm2
D Diameter of a piercing punch mm
DL Hole diameter in longitudinal direction mm
DN Nominal diameter of the hole mm
DT Hole diameter in transverse direction mm
E Young’s modulus MPa
FF Inside surface of the spherical bowl friction N
FFO Side surface of the piercing punch fricition N
Fi Force of the spring in the point i N
FM Resistance force of the material N
FR Radial force N
� Dominik [email protected]
1 Chair of Basics of Machine Design, Poznan Universityof Technology, ul. Piotrowo 3, 60-965 Poznan, Poland
FP Perforation force N
FT Transverse force N
H Depth of a spherical bowl mm
h Depth of the penetration mm
ki Constant of the spring in the point i N/mm
L Clearance between a punch and a die mm
l0 Length of the undeformed material mm
n Number of points on the penetration length −pT Transverse punch-belt pressure MPa
pV Vertical punch-belt pressure MPa
R Radius of a spherical bowl mm
r Radius of the cutting edge mm
x Width of the ring of the punch penetration mm
xF Perforation force indicator −xL Tool life indicator −xQ Hole quality indicator −
1 Introduction
Perforation of the conveyor belts, due to the variety of mate-rials used for manufacturing multilayer composite belts and

316 Int J Adv Manuf Technol (2019) 104:315–332
the range of their mechanical properties, became a seri-ous issue for manufacturers worldwide. Conventional toolsare no longer suitable for the punching process, consid-ering its efficiency, durability, and quality of the holes.Wojtkowiak et al. [1] stated that using the non-mechanicalmodern methods, like laser cutting or abrasive water jet(AWJ), is limited due to the heat influence or generatesvery high costs. This indicates that the simplest mechani-cal method of belt perforation—punching with two cuttingedges (a piercing punch which cooperates with a die)—maybe considered as an optimal one, if the effective geometryof the piercing punch will be determined. Based on the pre-vious research presented in [2], the concave piercing pun-ches, especially the one with spherical bowl, may greatlyreduce the perforation force.
According to Talaska and Wojtkowiak [3], polymercomposite belts may be divided into three groups: elasticlight belts reinforced with fabrics, rigid belts with increasedstrength with thick films as their cores, and durable flexiblebelts reinforced with cords. The structure of the beltsmay be either multilayer or fibre-reinforced. Among thematerials of which separate layers are made of mostcommon are polyamide, polyester, polyurethane, rubber,PVC, and aramid or carbon fibers. The main focus in thepresented research is put on the rigid belts with increasedstrength whose core is made of polyamide film coveredby polyamide fabric protective gaskets and nitrile rubber(NBR) covers. According to the previous research presentedin [4], this type of belts needs the highest perforation forceand the quality of the hole strictly depends on the geometryand wear of the cutting edge, due to the combination offabrics and rigid film in their structure.
As far as tool optimization performed for such tools astwist drills, mills, turning tools, or punches is concerned,research can be widely found in the scientific literature;however, there is no research connected with belt perfora-tion tools. Abele and Fujara [5] presented a new holisticmethod of using computing power for twist drill design andoptimization. Li et al. [6] showed a three-dimensional finiteelement method of milling process for solid carbide end milldesign and optimization, where such geometrical parame-ters as helix angle, rake angle, and number of flutes wereoptimized based on the target of low cutting forces and tem-perature. Zong et al. [7] used the FE model to simulatediamond turning process in order to consider the influenceof cutting edge radius, rake angle, and clearance on theresidual stresses and established an optimal value of rakeangle at 15◦ and clearance angle at 10◦. Jensen et al. [8] pre-sented an optimization of the shape of the draw-die profilewith regard to the tool wear using conventional optimiza-tion method and explicit FE method, which led to improvingthe tool life almost twice. Performing the tool optimiza-tion based only on the experimental research requires to
manufacture a series of tool sets with variable geometries,which is very expensive. This is why computer-aided design(CAD) along with the FEM analyses is widely used for thetool optimization. Based on the analyses, we can choose afew sets of geometrical features, which will be later manu-factured and tested to validate the model used and the resultsobtained. This approach will greatly reduce the costs andwill expand the range of tested parameters.
During the tool optimization, various objective functions,designs, and state variables may be used. Venkata Rao andSavsani [9] presented in their work multiple advanced opti-mization techniques, which was explained on few examplesof the optimization of different mechanical designs (geartrain, robot gripper, etc.). In general, we can distinguishthree main groups of objective functions for tools: exploita-tion parameters (tool life or wear, process efficiency, toolstiffness, etc.), dynamic parameters (generated forces orstress), and quality parameters (roughness of the surface,deviations, etc.). If we consider the belt punching process,the most important objectives are the lowest perforationforce, the longest tool life, and the best quality of the holes.As design variables, the geometrical features like bowlradius, punch-die clearance, punch diameter, or tool anglewill be used. Based on the chosen tool geometry, the statevariables (equivalent stress, strain, or frictional work) canbe obtained and used to determine the objective functions.
Among the searched parameters, the hardest to determineis the tool life. Experimental tests, which will make itpossible to specify the tool life, could take a few yearsand millions of cycles before any usable results areobtained. Because of that, it is necessary to use modelsfor tool life prediction, based on the above-mentionedstate variables. In the scientific literature, we can findthe correlations between the tool life and the followingparameters: cutting edge stress, lateral to normal force ratio,cutting force, temperature, tool wear after low-cycle tests,or some stochastic or genetic algorithms based on previouspopulation of results for specific types of tool. Ko andKim [10] described an analytical scheme for the predictionof the tool wear by using reformulated Archard’s wearmodel in an incremental form, which is using the normalpressure over the contact area. Oraby and Hayhurst [11]used the ratio of force components acting at the tool tip(radial and feed component of the force) in order to developthe models for tool wear and life estimation. Zhang andGuo [12] proposed a tool wear model, which uses theprediction of the cutting force and the energy consumptionin the turning process and validated this model withthe experimental results available in scientific literature.Yen et al. [13] stated that in metal cutting, tool wearis strongly influenced by the cutting temperature, contactstresses, and relative sliding velocities at the interface. Theyclaimed that using the FEM simulations to determine the

Int J Adv Manuf Technol (2019) 104:315–332 317
above-mentioned variables, it is possible to predict the toolwear evolution and tool life with acceptable accuracy. Huet al. [14] proposed a novel friction/wear model, whichcharacterizes the evolutions of friction coefficient and theremaining thickness of the coating layer, which can be usedto predict the life of coated tools for sheet metal formingprocess and can be applied to the FE simulation. Salonitisand Kolios [15] presented a methodology for the efficientreliability assessment of cutting tool wear based on thecombination of stochastic response surface and surrogatemodeling methods combined with Monte Carlo simulationsand first-order reliability methods for the estimation ofreliability indices taking into an account cutting speed andfeed rate. They claimed that the proposed techniques havepotential for determining optimal tool life with reducedexperimental testing in comparison with pure experimentalmethods. Kovac et al. [16] also proposed a method, whichthe main profit is minimizing the number of experimentsnecessary for acquiring enough input data and they gained itby using genetic algorithms. All above-mentioned tool lifeestimation models cannot be directly used for an estimationof the punch wear. The important difference between thebelt punching process and machining is the magnitude ofthe tool life. In belt punching, the tool life may exceed1,000,000 holes, which takes hours and a lot of wastedmaterial, while in machining, the tool life is measuredin minutes. Because of that, for the punch optimization,we should use methods based strictly on FEM analyses,which will provide as results to the perforation force totransverse force ratio or the contact pressure on the cuttingedge.
The main goal of the presented research is to deter-mine the effective geometry of the piercing punches witha spherical bowl used in the belt perforation process. Anyadditionally derived characteristics should enable to simplyadjust the optimization model to match specific require-ments of the manufacturers worldwide. In Section 2, theauthors present a brief description of the methodology usedin experimental research. In the three following sections, theauthors have widely discussed the influence of the punchgeometry on the quality of the holes (Section 3), perfo-ration force necessary to perform the process (Section 4),and tool life (Section 5). All these results were combinedand used in the punch optimization presented in Section 6and closed with main conclusions presented in summary(Section 7).
2Methodology of research
In the presented research, the combination of analyticalderivations, FEM simulations, and experimental researchwas used in order to determine the effective geometry of
the piercing punch. All presented results were obtainedusing the test stand designed by authors (Fig. 1), whichconsists of the punching die with replaceable tools. Itsconstruction was described in details in [2]. The mainadvantage of the test stand is the zero backlash linear guide,which makes it possible to use a very small clearancebetween the punch and the die (down to 0.05 mm). Allthe experimental tests were performed on the MTS Insighttesting system with load capacity 50 kN, where traversespeed 0.5 mm/s provided the quasi-static nature of theanalyzed process. In order to check a wide spectrum of beltproperties, ten different types of belts were tested, in whichwe can distinguish eight representatives of strong rigidbelts with polyamide core (SG500, TTA500N, TTA1000N,M500, TFL7S, TFL10S, TFL15S, XH500-6) and onerepresentative from the two remaining groups of moreflexible belts (polyester fabric–reinforced polyurethane beltLAB12E and aramid fiber cord–reinforced polyurethanetoothed belt T10K). For each belt, the rectangular specimens30×150 mm were cut, in which five holes were punchedwith 20-mm spacing, and the force in function of displace-ment during punching was measured for various sets of tools(punches and dies).
In order to derive the optimization model, only onetype of belt (TFL10S) will be used. This type of belt waschosen because it has a combination of the most difficultproperties for a perforated belt manufacturers—it is veryrigid and has increased strength, which indicates it needsone of the highest perforation forces and the tool wearduring its processing should be the worst. Additionally, ithas protective gaskets made of the polyamide fabrics whichimplies that it should be subjected to the tool sharpnessand almost all defects common for the belt perforation willoccur for this type of belt.
3 Influence of the geometrical featuresof the punch on the quality of the hole
The quality of the punched holes may be evaluated usingboth quantity and quality criteria. The first parameter usedfor the quantity analysis of the effect of the punchingprocess is the diameter deviation Δ, which defines thedifference between the nominal diameter DN of the punchand the diameter of the hole. Since the diameters measuredin perpendicular dimensions differ due to the orthotropicproperties of the polymer composite belts and much moreelasticity is visible in the longitudinal direction of thebelt than the transverse one, the diameter DL measuredin the longitudinal direction will be taken into accountduring further analysis. Based on the obtained results, thedeviations in the longitudinal directions are 10 times higherthan those in the transverse direction, which means that

318 Int J Adv Manuf Technol (2019) 104:315–332
Fig. 1 Punching die and the set of tools used in presented tests withtheir geometrical parameters: 1—base, 2—head block, 3—guidingcolumn, 4—sleeve, 5—ball bushing, 6—punch plate, 7—punch chuck,
8—piercing punch, 9—piercing die, 10—belt specimen, 11—pressureplate, D—diameter of the piercing punch, H—depth of the sphericalbowl, L—punch-die clearance, R—radius of the piercing punch
slight ovality of the holes is present. In order to grade it, theovality factor δ was introduced as a ratio of both diameters.
To determine the correlation between the depth of thepiercing punch bowl H and the punch-die clearance L withthe above-mentioned quantity criteria, the measurement ofthe hole diameters was taken with a slide caliper withaccuracy of 0.01 mm. For each geometry, five holes were
measured in both directions and then the average wasderived. The obtained results are presented in Table 1 andthe characteristics are shown in Fig. 2a–c. The methodologyof the measurement is presented in Fig. 2d.
Based on the results, there is a negative linear correlationbetween both analyzed parameters and the depth of thepunch bowl H . This indicates that the sharper the cutting
Table 1 Measurement results of the hole diameter for TFL10S belt using tool with nominal diameter D = 10 mm: PD - flat punch and die,PDSB - punch with spherical bowl and die, R - radius of the bowl [mm], L - punch-die clearance [mm]
Diameters of the holes measured in perpendicular directions [mm]
Tool set DL1 DT1 DL2 DT2 DL3 DT3 DL4 DT4 DL5 DT5 DLavg DTavg
PD10-L0.05 9.62 9.3 9.6 9.35 9.6 9.33 9.6 9.39 9.51 9.33 9.586 9.34
PD10-L0.1 9.88 9.44 9.88 9.46 9.89 9.6 9.77 9.51 9.8 9.49 9.844 9.5
PD10-L0.15 9.82 9.46 9.81 9.34 9.84 9.37 9.81 9.42 9.86 9.35 9.828 9.388
PD10-L0.2 9.67 9.31 9.62 9.41 9.62 9.37 9.57 9.29 9.61 9.46 9.618 9.368
PDSB10-R10-L0.1 10.33 10.01 10.33 10.01 10.23 9.98 10.17 10 10.25 10.1 10.262 10.02
PDSB10-R8.5-L0.1 10.27 10 10.25 9.95 10.19 9.99 10.2 9.98 10.2 10.03 10.222 10.03
PDSB10-R7.25-L0.05 10.08 10.02 10.17 9.99 10.12 10.03 10.17 9.99 10.18 10.03 10.144 10.012
PDSB10-R7.25-L0.1 10.18 10.03 10.17 10.04 10.23 10.01 10.12 10 10.23 10.03 10.186 10.022
PDSB10-R7.25-L0.15 10.18 9.99 10.2 10.03 10.22 10.03 10.22 10.06 10.16 10.04 10.196 10.03
PDSB10-R7.25-L0.20 10.23 10.03 10.18 10.02 10.14 10.03 10.23 10.01 10.23 10 10.202 10.018
PDSB10-R6.5-L0.1 10.13 10 10.19 10.01 10.14 10.02 10.07 10.01 10.11 9.98 10.128 10.004
PDSB10-R5.5-L0.05 10 10.02 10.01 10.02 9.99 9.99 10 10.03 10.02 10.02 10.004 10.016
PDSB10-R5.5-L0.1 10.02 10.01 10.05 10 10.02 10 10.03 10 10.03 10.02 10.03 10.006
PDSB10-R5.5-L0.15 10.08 10.02 10.07 10.01 10.06 10.01 10.07 10.02 10.04 10.02 10.064 10.016
PDSB10-R5.5-L0.20 10.07 10.02 10.04 10.03 10.05 10 10.05 10.02 10.07 10 10.056 10.014

Int J Adv Manuf Technol (2019) 104:315–332 319
edge, the better the quality of the hole we can obtain.Analyzing the influence of the punch-die clearance, we canobserve that by increasing the gap between two cuttingedges, diameter deviations rise nonlinearly. On the otherhand, changing the punch-die clearance has no effect on theovality of the hole.
As can be observed, the hole diameter for the flat punchesis always lower than the nominal value, since the belt isextended during the process and shrinks after the punchgoes back to its initial position. On the other hand, forthe spherical bowl punches, the holes have slightly greaterdiameters than the tool. Because some correlations betweenthe hole deviation and the geometry of the tool are present,it could be possible to determine the nominal diameterof the piercing punch, which would compensate the holedeviation. Thanks to that, we would be able to obtain perfectdiameter of the holes in the belt, even with less sharp tools.The problem with this approach is the fact that presentedcorrelations are specific for a single type of the belt andmay slightly differ for another one. In order to adjust theequipment of the perforating machine for various belts, itwill be necessary to use not only different piercing punchesbut also the dies. It would generate very high cost ofexploitation. Using the effective geometry of the tool, whichshould be properly designed for a universal application,can greatly reduce that cost. Even if the tool life of thesharper piercing punch will be shorter, the wear of the die ismuch lower than the punch. Applying the constant nominaldiameter of the piercing punch will make it possible to useone die for the multiple types of punches.
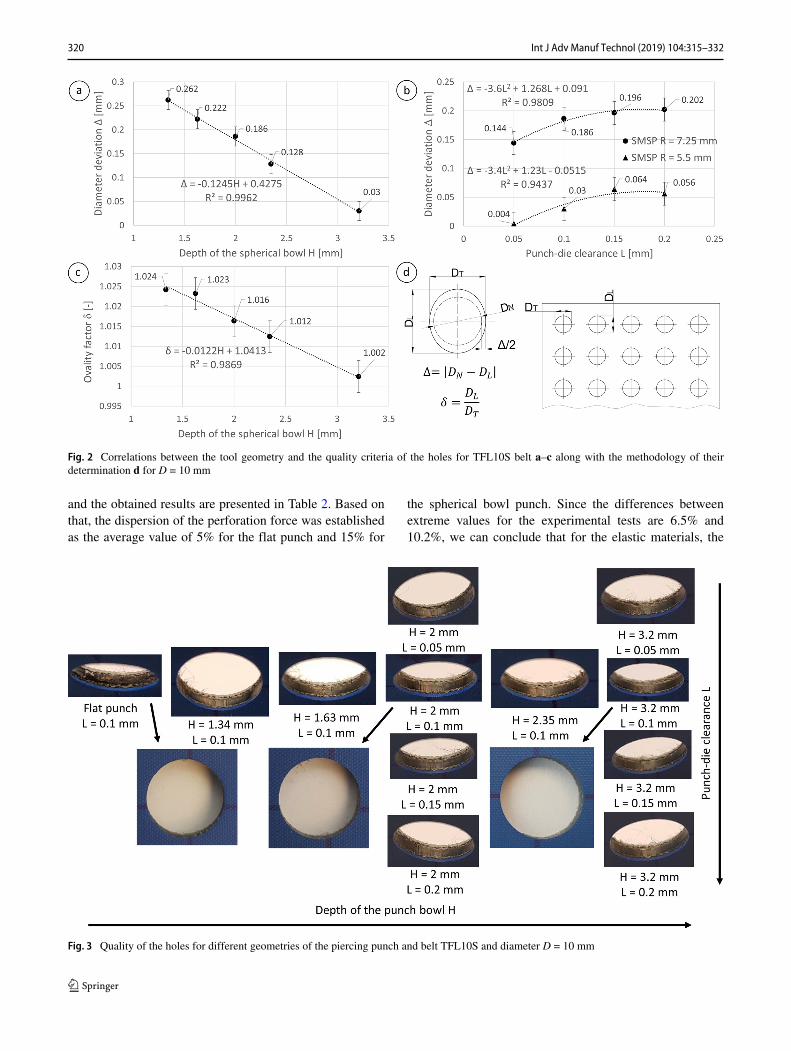
For the quality analysis, the most important factor takeninto account is the presence or absence of the typical defectsthat occur in the perforated belts. Based on the previousresearch [2] as the common defects of belt perforation,we can distinguish: conicity or ovality of the holes, fiberpull-out, uneven edge or side surface, and deformationof the covers of the belt. In Fig. 3, selected holes fordifferent geometries of the piercing punch are presented.Comparing the flat punch with all spherical bowl punches,it can be clearly observed that the roughness of the sidesurface and the shape of the hole contour are greatlyimproved regardless of the depth of the bowl and clearance.Analyzing the correlation between these parameters and theoverall quality of the holes, we can observe that increasingthe clearance has a negative effect since the pulled-outfibers occur much more often. Increasing the depth of thebowl should theoretically reduce the fiber pull-out as itmakes the punches sharper, but the surface finish and toolcondition may affect the quality as well. This means thatthe theoretically sharper tool may give worse results due tothe machining errors (as can be seen for holes made withtools with H = 2 mm and H = 2.35 mm) and it should beconsidered in the results analysis.
Based on the above-mentioned analysis and the overallexperience of the authors obtained by the contact with theindustry, the map of hole quality was made (Fig. 4). Onthis map, the quality of the hole was evaluated in the rangeof 0–1, where 1 means 100% fulfilling the requirementsof the belt manufacturers and customers. It should bementioned that the presented data should be used more forunderstanding the tendency of how the hole quality varieswhen using different tool sets rather than for a quantityanalysis of the perforation process.
4 Influence of the geometrical featuresof the punch and die on the perforation force
One can find a lot of research that presents an influence ofthe punch-die clearance on the punching process parametersin metal stamping, such as maximum force, tool wear,and hole quality. Soares et al. [17] reported that the idealclearance range for thick ductile materials is between 2 and10% and that for the values below 5% the smaller peak ofmaximum punch force and lower fracture angle is obtained.However, they also mentioned that for very small clearances(0.2%), the maximum force increases. On the other hand,they stated that larger punch-die clearance (15%) acceptablefracture angle profile is gained, but a large burr heightoccurs. Subramonian et al. [18] reported that the correlationbetween the punch-die clearance and the contact stress isthe “V” or “U” shaped curve since increasing the clearancechanges the shearing-bending ratio in the punching process,which means that there is a range in which the contactstress reaches its minimum. They also stated that this stresslevel may be used as an indicator of a punch wear andtogether with the geometry curve can be used to improvethe tool life. Lo et al. [19] investigated the effects ofpunch-die clearance on the burr width of shearing cornerand established an analytical model of the dimensionaltolerance between punch and punch base, which can be usedto predict the burr width and the tool life. However, theabove-mentioned correlation for more elastic materials, likepolymer composite belts, was not specified.
In Fig. 5, the results for two punches with radiusof the bowl 5.5 and 7.25 mm are presented. Based onthe experimental results, a slight difference in the forcemagnitude is visible, but no explicit nature of the correlationmay be determined. The reason for varying perforation forceis the tool condition, as was mentioned in Section 3, andsince the tests were performed for the two with the bestsurface finish, the influence of this parameter should beminimized. In order to check the possible dispersion of theresults, measurement was made before and after the diesharpening (because the surface milling does not changethe geometry of the tool) for eight different types of belts
320 Int J Adv Manuf Technol (2019) 104:315–332
Fig. 2 Correlations between the tool geometry and the quality criteria of the holes for TFL10S belt a–c along with the methodology of theirdetermination d for D = 10 mm
and the obtained results are presented in Table 2. Based onthat, the dispersion of the perforation force was establishedas the average value of 5% for the flat punch and 15% for
the spherical bowl punch. Since the differences betweenextreme values for the experimental tests are 6.5% and10.2%, we can conclude that for the elastic materials, the
Fig. 3 Quality of the holes for different geometries of the piercing punch and belt TFL10S and diameter D = 10 mm

Int J Adv Manuf Technol (2019) 104:315–332 321
Fig. 4 Map of the quality of theholes for different geometries ofthe piercing punch and beltTFL10S and diameter D = 10mm
punch-die clearance has an insignificant influence on theperforation force.
This thesis is also proved by FEM analyses results.Although the differences between the perforation forcevalues were visible, no trend was observed. The valuesfluctuate around the avarage values of 2163 N for tool withradius 7.25 mm and 1681.5 N for the punch with radius 5.5mm. All results, either empirical or simulational, lie within15% from the average values. Only for the sharpest tooland the biggest punch-die clearance the value of the forceexceeds this limit. The differences are mainly caused by thevarious mesh in the belt, because the element size on thepartition between the edge of the punch and die changesalong with the clearance. Since the error of the resultscorresponds with the later established model accuracy, wecan conclude that for modelling the perforation force fortool optimization, the punch-die clearance is negligible.
In order to determine the influence of the punch geometryon the perforation force, a series of tests which consist ofboth experimental and simulation research were performed.
The obtained results for flat and spherical bowl punchesare presented in Table 3. Since the clearance influencewas neglected, only three geometrical parameters of thespherical bowl punch are considered in the analyses:punch diameter D, bowl radius R, and depth of the bowlH (Fig. 1). Because determining two of the parametersfully defines the geometry of the punch and due to thetechnological aspect of choosing the proper tool for thegrinding process of the punches, the radius of the bowlwill be specified and the depth will be calculated. Thediameter of the punch has to be specified because it strictlycorresponds with the hole size and cannot be treated as aresult value.
Taking into consideration the effect of the tool conditionon the perforation force value, it is almost impossibleto determine the force characteristics strictly on theexperimental results. It would require a set of preciselymanufactured tools with various geometrical features,which covers a whole range of possible bowl depth(maximum depth of the punch has to be lower than 0.5D).
Fig. 5 Correlation between thepunch-die clearance and theperforation force obtained fromboth FEM and experimentaltests for TFL10S belt anddiameter D = 10 mm

322 Int J Adv Manuf Technol (2019) 104:315–332
Table 2 Comparison of the experimental tests results before and after the die sharpening for various types of belts, diameter D = 10 mm and bowlradius R = 7.25 mm
Punch type M500 SG500 TFL7S TFL10S TFL15S TTA500N TTA1000N XH500-6
Perforation force before the die was sharpened [N]
Flat 3558 2713 4143 5086 6168 3191 4401 3471
Spherical bowl 1413 1136 1682 2138 2810 1181 1780 3677
Perforation force after the die was sharpened [N]
Flat 3497 2759 3987 4633 5821 3177 4392 3592
Spherical bowl 1240 939 1498 1863 2502 1013 1598 3024
Percentage difference of the force value [%]
Flat 1.16 1.7 3.77 8.91 5.63 0.44 0.2 3.49
Spherical bowl 13.95 20.98 12.28 14.76 12.31 16.58 11.39 21.59
Although the punches with spherical bowl make it possibleto achieve better performance of the perforation process,their manufacturing is much more complicated comparedwith the simple flat punches. The main technical issuesare the grinding process of the punch bowl (sharpening)and maintaining proper tolerances on the geometricalparameters of the punch. One of the reason for above-mentioned issues is the necessity of using HSS steel withhardness 64 HRC. Because of this, the machining has tobe performed after a heat treatment (hardening), whichindicates that special tools have to be used. Additionally, thecomplex shape of the punch requires specific kinematics ofthe tool drive. All these issues may be solved by proposing
the construction of the machine for piercing punch sphericalbowl precision grinding, which may be considered byauthors as a future design and research objective. But fornow, the cost of machining a set of these tools is too high toperform the whole research based on the experimental tests.
For that reason, the authors have built the FEM modelin ABAQUS/Explicit, which makes it possible to analyzedifferent combinations of the geometrical parameters andobtain necessary characteristics for the tool optimizationprocess. The construction of the FEM model is presentedin Fig. 6. The assembly consists of four instances: TFL10Sbelt, the piercing punch, die, and blank holder. Beside thebelt, all the instances were modelled as steel elements and
Table 3 Comparison of the experimental tests and FEM analyses results for belt TFL10S
Punch type D [mm] R [mm] L [mm] H [mm] FPexp [N] FPFEM [N] δFP [%]
Flat 10 – 0.1 – 4633 4723 1.9
8 3485 4244 21.8
6 2643 3511 32.8
5 2155 2926 35.8
Spherical bowl 10 7.25 0.05 2 1898 1980 4.3
10 7.25 0.15 2 1781 2380 33.6
10 7.25 0.2 2 1849 2169 17.3
10 5.5 0.05 3.2 1637 1458 10.9
10 5.5 0.15 3.2 1446 1707 18
10 5.5 0.2 3.2 1461 2082 44.5
10 10 0.1 1.34 2458 2412 1.9
10 8.5 0.1 1.63 2680 2376 11.3
10 7.25 0.1 2 1863 2054 10.3
10 6.5 0.1 2.35 2122 1935 8.8
10 5.5 0.1 3.2 1437 1685 17.3
8 7.25 0.1 1.2 2109 1986 5.8
6 7.25 0.1 0.65 2429 2073 14.7
6 7.25 0.1 0.45 2140 1837 14.2

Int J Adv Manuf Technol (2019) 104:315–332 323
Fig. 6 Construction of the FEMmodel
treated as rigid bodies using a proper constrain betweenan instance and selected reference points RP1, RP2, orRP3. The kinematic extortion of the piercing punch wascreated by applying the boundary condition BC1 to RP1point. This BC sets V3 value as −0.0005 m/s and resetsother angular or linear velocities as 0, leaving only oneactive degree of freedom. The remaining points RP2 andRP3 were fixed with ENCASTRE boundary condition,which blocked all the degrees of freedom. The belt wasmodelled as a deformable part and its properties weredefined according to Table 4. Plastic properties of thematerial were assumed as isotropic and were obtained astabular values from the experimental stress-strain curve,where plastic strain 0 occurs at 112 MPa. The damage of thematerial was modelled with the simplified Johnson-Cookmodel [3], where the deformation rate and temperatureare insignificant (d4 and d5 equal 0). The remaining J-Cparameters are shown in Table 4. Damage evolution wasspecified by the displacement at failure parameter and variesdepending on the geometry of the piercing punch. Theinteraction in the model was made as a general contact andits properties were defined with tangential behavior frictioncoefficient 0.6 and normal behavior of “hard” contact. Thedie, belt, and blank holder were meshed with hexahedral, 3Dstress, linear C3D8R explicit elements. The belt was dividedfor partition that both cutting edges have a contact withthe same element. The cutting edges along were dividedinto 100 elements on its circumference. Due to the complexgeometry, the grip part of the punch was meshed withtetrahedral C3D10M elements. Mesh control used in the
model was set to obtain 10 elements on the thickness beltof size 0.00026 m each and the diameter of the hole wasdivided into 50 elements. Although it may be consideredas a coarse mesh, the authors realized that increasing thenumber of elements on the thickness of the belt does notchange the obtained results more than a few percent, butgreatly increases the computational time and the problemswith element distortion occur more often. In order to modelthe fracture of the belt instance, element deletion wasenabled. The results of the reaction force RF3 were takenfrom the history output for RP1 point. The time period of theanalysis was 10 s. In order to reduce the computational time,a mass scaling was used with target time increment 0.001.It was possible due to the low velocity and quasi-staticcharacter of the test.
The validation of the presented FEM model wasmade based on the comparison of the experimental andsimulational results. The example comparison for a TFL10Sbelt and punch with diameter 10 mm and radius 7.25 mmis presented in Fig. 7. All the experimental results usedfor a model validation are presented in Table 3 along withits simulational equivalent and the obtained error. Basedon the results obtained for a spherical bowl punches, the
Table 4 Parameters used in the FEM analysis
ρ E ν d1 d2 d3
[kg/m3] [MPa] [-] [-] [-] [-]
1140 235 0.2 -0.24 0.32 2.6
324 Int J Adv Manuf Technol (2019) 104:315–332
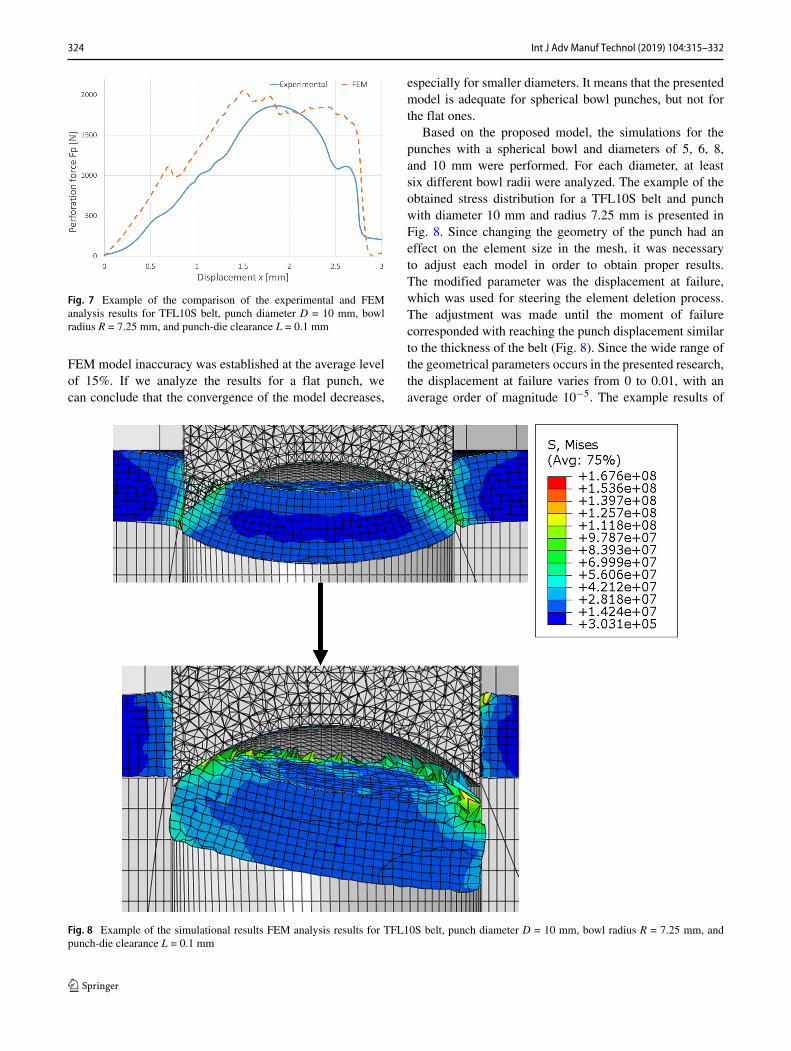
Fig. 7 Example of the comparison of the experimental and FEManalysis results for TFL10S belt, punch diameter D = 10 mm, bowlradius R = 7.25 mm, and punch-die clearance L = 0.1 mm
FEM model inaccuracy was established at the average levelof 15%. If we analyze the results for a flat punch, wecan conclude that the convergence of the model decreases,
especially for smaller diameters. It means that the presentedmodel is adequate for spherical bowl punches, but not forthe flat ones.
Based on the proposed model, the simulations for thepunches with a spherical bowl and diameters of 5, 6, 8,and 10 mm were performed. For each diameter, at leastsix different bowl radii were analyzed. The example of theobtained stress distribution for a TFL10S belt and punchwith diameter 10 mm and radius 7.25 mm is presented inFig. 8. Since changing the geometry of the punch had aneffect on the element size in the mesh, it was necessaryto adjust each model in order to obtain proper results.The modified parameter was the displacement at failure,which was used for steering the element deletion process.The adjustment was made until the moment of failurecorresponded with reaching the punch displacement similarto the thickness of the belt (Fig. 8). Since the wide range ofthe geometrical parameters occurs in the presented research,the displacement at failure varies from 0 to 0.01, with anaverage order of magnitude 10−5. The example results of
Fig. 8 Example of the simulational results FEM analysis results for TFL10S belt, punch diameter D = 10 mm, bowl radius R = 7.25 mm, andpunch-die clearance L = 0.1 mm

Int J Adv Manuf Technol (2019) 104:315–332 325
Fig. 9 Example of the comparison of the experimental and FEManalysis results for TFL10S belt, punch diameter D = 10 mm, bowlradius R = 7.25 mm, and punch-die clearance L = 0.1 mm
the analysis in a form of perforated belt TFL10S and thescrap are presented in Fig. 9.
The standard result of the FEM analysis is the determinedstate of stress and strain in the considered material [20].Depending on the specificity of the analyzed process, thestress state may be key information and for another ones, thestrain state may be more important. The example may be thedetailed analysis of the strain distribution in the process ofdeep drawing [21, 22]. For the authors, the key informationobtained from the FEM analyses is the peak perforationforce. The divergence between the force characteristicsobtained from simulations and experiments is caused bythe simplification of using an isotropic approach to beltmaterial modelling, which is in reality the compositewith orthotropic mechanical properties. Additionally, themultilayer composite is modelled as a homogenous materialand the damage model does not take into account thefracture between the layers. Nevertheless, if we considerthat the peak value of the perforation force is crucialinformation in the punch optimization, we can considerthe presented model as useful enough. This approach was
previously presented in [2, 3] and the obtained results haveproved that considering the composite as an equivalenthomogenous material in FEM analyses may be used in thisapplication and it was supported with multiple examplesfound in scientific literature [23–31]. However, using onlyFEM analyses may give some false results connected withthe mesh or poorly chosen failure parameters, which is whyauthors used a combination of both methods of researchin which the experimental tests results are used for modelverification.
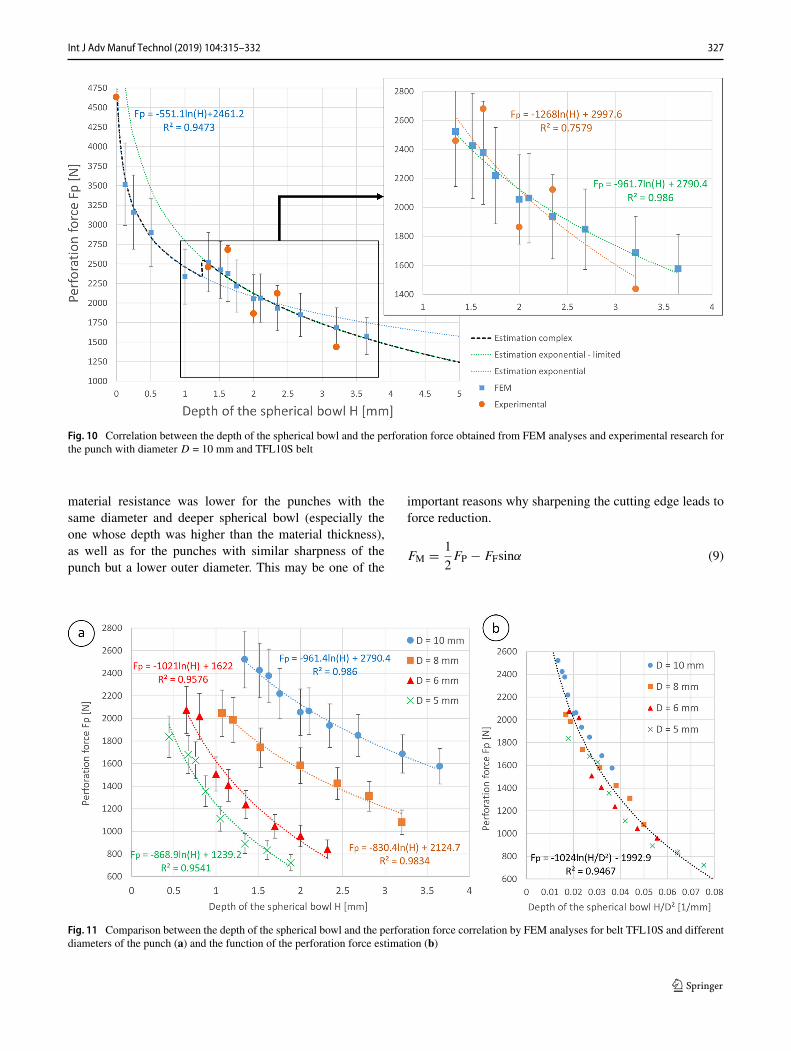
In Fig. 10, the obtained results for the punch withdiameter 10 mm are presented along with determined force-bowl depth characteristic. On the chart, the upper limit ofthe perforation force (which corresponds with the valuesobtained for a flat punch) was marked for H = 0 aswell as other experimental results. As can be observed,using the exponential estimation gives proper results onlyin the limited range of bowl depth (lower than 2 mm)and the error increases for sharper tools. Although thecharacteristic is going to infinity but for a very small bowldepth, it corresponds with the marked limit, which provesthe correctness of the approximation in that range. On theother hand, using the exponential estimation in the limitedrange, in which the effective depth of the bowl should lie(1.33 < H < 3.65 for D = 10 mm), will not provideproper results for very flat tools. That is why the authorsdecided to use the complex estimation function, which isthe combination of both exponential estimations and may bedefined as follows:
FP ={ −551.1ln(H) + 2461.2 if H ≤ 1.25 mm,
−961.7ln(H) + 2790.4 if H > 1.25 mm.(1)
As can be observed, the trends derived from theexperimental and FEM results may slightly differ. Thecurve fitting is much better for the FEM results, since theinfluence of the tool machining precision is here neglected.However, it can be seen that all the results lie within thearea established from the experimental points, which provesthe appropriate quality of the model. It also shows thatdepending strictly on the experimental research may lead tomore inadequate results than using the combination of bothexperimental and simulational methods.
The same analyses were performed for the punch withdiameters 5, 6, and 8 mm and the results for all theFEM simulations are presented in Fig. 11a. The obtainedcharacteristics may be useful for the optimization of thepunches with the exact same diameter, but for a differentone, it is necessary to find the correlation between bothgeometrical features of the tools. As can be analyzed fromthe Fig. 11a, punches with the same bowl depth H , butsmaller diameter D provide more force reduction, becausethey are much sharper than their equivalent with a higherdiameter. Additionally, a positive linear correlation between

326 Int J Adv Manuf Technol (2019) 104:315–332
the diameter D and perforation force for the flat punch isvisible (Table 3), because increasing the diameter extendsthe cutting edge, which leads to increasing the shearingarea and as a result decreasing the shearing stress for thesame force value. Based on that, the correlation of the bowldepth to the punch area indicator (H/D2) was found andpresented in Fig. 11b. Thanks to that equation, it is possibleto estimate the perforation force value not only for a discretesets of geometrical features of the piercing punch, but alsofor a continuous range of parameters, which is crucial in thetool optimization process.
5 Influence of the geometrical featuresof the punch and die on the tool life
The last and the hardest part of the punch optimization isto estimate the tool life and to find its correlation with itsgeometry. As was stated in Section 1, the most adequatemethod is using analysis of the forces. In the literature, onecan find multiple examples which present the correlationbetween the tool wear and the cutting forces [32–36]. Forthat reason, the load distribution for a spherical bowl punchwas analyzed and the obtained model is presented in Fig. 12.Since the life of the tool depends on the frictional wear,which can be evaluated by measuring the radius of thecutting edge r , it was assumed that higher friction forcewill cause faster wear and will shorten the tool life. Thisassumption was made based on [37], who reported thatincreased flank wear results in the increased area of contactand increased coefficient of friction and presented the flankwear modelling method based on the friction.
In order to analyze the forces in the perforation process,the axial cross-section of the punch has to be considered.The force FP is the force necessary to perform the cuttingand is applied axially to the punch. Its value depends onthe sum of all resistances which occur in the process. If weanalyze the whole 360◦ model of the punch, the transverseforces FT will equilibrate each other. To analyze the ratioof both of these forces, the infinitesimal radial slice shouldbe considered. Since the cross-section is symmetrical, theforce which will be generating the vertical pressure of thepiercing punch on the perforated belt pV on each side of theaxis equals 0.5FP. Because the bowl is spherical, the resultforce of both these forces can be considered as radial forceFR. Based on that assumption, the following correlationbetween above-mentioned forces can be derived.
FR =√
FT2 +
(1
2FP
)2
(2)
If we introduce the α angle as shown in the Fig. 12, theradial force can be also derived with the following equation:
FR = 1
2FP cos α. (3)
Based on Eqs. 2 and 3, the α angle can be derived as thefunction of the ratio of perforation force FP and transverseforce FT.
α = arctan
(2
(FP
FT
)−1)
(4)
In the presented model, the authors have found thepositive correlation between the tool life and the ratio ofperforation force FP (which can be obtained from FEManalyses) and transverse force FT (which can be calculatedanalytically). The friction force FF, which is responsible fora tool wear, can be derived in a single discretized point thatis the tangential force to the spherical bowl of the punch.Because of that, the radial force FR is treated as its normalforce. Using the Coulomb friction law, the force can bederived as shown in Eq. 5:
FF = FR · μ, (5)
where μ is the friction coefficient.Because the friction and radial forces are perpendicular
to each other, the angle between the transverse force FT andthe friction one equals α. This indicates that the verticalcomponent of the friction force FFV can be derived basedon the following equation:
FFV = FF sin α. (6)
Based on the above-mentioned correlations, three resis-tant forces can be distinguished: resistance of the axiallycompressed material FM, vertical component of the frictionforce FFV, and friction on the inside surface of the sphericalbowl FFO. It can be induced that following force sum willbe present:
1
2FP = FM + FFO + FFsinα (7)
Because of the high stiffness of the punch and axiallysymmetrical load, the friction on the outer surface FFO
of the model is negligible and in the real conditions, thisresistance will be a result of uneven surface of the cross-section separated from the scrap.
FFO � FFV (8)
This means that if we subtract the vertical projection ofthe friction force inside the bowl FFV, we will obtainthe value of the material resistance FM in the punchingprocess. However, the value will not be constant, becausethe pressure area changes in a nonlinear way during furtherpenetration. It was observed that the peak value of the
Int J Adv Manuf Technol (2019) 104:315–332 327
Fig. 10 Correlation between the depth of the spherical bowl and the perforation force obtained from FEM analyses and experimental research forthe punch with diameter D = 10 mm and TFL10S belt
material resistance was lower for the punches with thesame diameter and deeper spherical bowl (especially theone whose depth was higher than the material thickness),as well as for the punches with similar sharpness of thepunch but a lower outer diameter. This may be one of the
important reasons why sharpening the cutting edge leads toforce reduction.
FM = 1
2FP − FFsinα (9)
Fig. 11 Comparison between the depth of the spherical bowl and the perforation force correlation by FEM analyses for belt TFL10S and differentdiameters of the punch (a) and the function of the perforation force estimation (b)

328 Int J Adv Manuf Technol (2019) 104:315–332
Fig. 12 Load distribution for the spherical bowl punch during perfo-ration: pV—vertical pressure of the piercing punch on the perforatedbelt, pT—transverse pressure of the piercing punch on the perforatedbelt, FTi, FMi—force of the spring used for material modelling in thepoint i, ki , kxi—constant of the spring used for material modelling in
the point i, x—distance between the outer surface of the punch andthe contact point of the inner surface of the spherical bowl with per-forated belt, h—depth of the penetration, D—diameter of the punch,R—radius of the spherical bowl, r—radius of the cutting edge
In the applied methodology, deriving FT was performedby assuming that the belt consists of a set of parallel springs(Fig. 12) and the total transverse force for a penetration ofthe cutting edge h can be calculated as an average of theforces in each spring.
FT =∑n
i=1 FTi
n, (10)
FTi = ki · xi, (11)
ki = EA
l0= E · D · h
12D
= 2E · h, (12)
where n—number of discretized points on the penetrationlength [–] E—Young’s modulus [MPa], A—area of trans-verse compression [mm2], l0—length of the undeformed
Fig. 13 Comparison between the depth of the spherical bowl and the tool life correlation for TFL10S belt and different diameters of the punch (a)and the function of the tool life estimation (b)
Int J Adv Manuf Technol (2019) 104:315–332 329
material [mm]. Since deeper penetration increases the num-ber of parallel springs in the material model, the springconstant increases as a linear function of the depth of pene-tration. The displacement of each elemental spring changesaccording to the function x(h).
x(h) = 1
2D −
√1
4D2 − 2h
√R2 − 1
4D2 − h2 (13)
The same methodology can be used to derive theresistance of the compressed material FM, as shown inFig. 12 and Eqs. 14–16:
FM =∑n
i=1 FMi
n, (14)
FMi = kxi · hi, (15)
kxi = EA
lx0= E · πD · x
t(16)
where lx0—length of the undeformed material [mm], t—thickness of the belt [mm].
Taking into consideration the performed force analysis,if the perforation force to transverse force ratio FP/FT rises,the α angle decreases, as can be seen in Eq. 4. This leads toincreasing the radial force FR according to the Eq. 3. Thefollowing changes result in increasing the frictional forceFF. As was stated previously, this force is responsible forthe tool cutting edge wear, which implicates that based onthe value of the perforation force to transverse force ratio,we can estimate the tool life of the piercing punch.
Based on the presented methodology, the characteristicsof the perforation to transverse force ratio were determinedfor punches with diameters 5, 6, 8, and 10 mm and arepresented in Fig. 13a. In order to perform the optimization ina continuous range and considering that the sharpness of thepunch (which depends on the bowl depth to punch diameterratio H/D, as was stated in Section 4) has an influence onthe tool life, universal correlation was derived and presentedin Fig. 13b. It is worth mentioning that the obtained valueof the force ratio does not define the exact tool life, andit is used only as an indicator, which makes it possible tocompare the tool life for punches with different geometries.
6 Optimization of the punch geometry
The results presented in Sections 3, 4, and 5 made it possibleto specify the objective functions for the punch optimizationconnected with:
– perforation force
FP
(H
D2
)= −1024ln
(H
D2
)− 1992.9 (17)
– perforation to transverse force ratio
FP
FT
(H
D
)= 907.89
(H
D
)3
− 537.43
(H
D
)2
+113.15
(H
D
)− 1.577 (18)
– hole diameter deviation
Δ(H, D) = −12.445H + 4.2748D (19)
Since the sharpness of the punch has a linear correlationwith the punch diameter and a huge influence on the holediameter deviations (as was proved in Sections 3 and 4),the authors were able to estimate the objective functionconnected with the quality of the hole (Eq. 19) by using theequation from Fig. 2a and treat it as a relative deviation. Thegoal of the tool optimization is to find the set of geometricalfeatures for which all the objective functions reach theirminimum. Based on the geometrical and technologicalrestrictions, the depth of the spherical bowl has to be lowerthan 0.5D, which determines the range of the optimizationas:
H ∈ (0; 0.5D) ∧ D ∈ (3; 10) (20)
In order to create the optimization function, three indicatorsof force—xF, tool life —xL, and hole quality xQ—have tobe calculated based on the objective functions (Eqs. 21–23).
xF =FP
(H
D2
)
min(FP
(H
D2
)) for 0 <H
D2< 0.1 mm−1 (21)
xL =FPFT
(HD
)max
(FPFT
(HD
)) for 0 <H
D< 0.5 (22)
xQ ={
1 if Δ ≤ 0.01D
1 + Δ − 0.01D if Δ > 0.01D(23)
Based on these indicators, the optimization has the finalform:
f
(FP,
FP
FT, Δ
)= xF · xL · xQ (24)
If the optimization function f reaches its minimum,it indicates that the obtained solution gives the bestcombination of low perforation force with maintaining along enough tool life and the small hole diameter deviation.Also, the set of geometrical features which it represents canbe considered as optimal ones. In Fig. 14a, the results forthe punch geometry optimization for the punch diameters5, 6, 8, and 10 mm are presented. In this case, the authorsused the correlations derived for a specific punch diameterfrom Figs. 11a and 13a. For each point which representsthe minimum value of the optimization function, the propertool was designed and presented in Fig. 14a. Since theradius of the bowl is a technological parameter, it was

330 Int J Adv Manuf Technol (2019) 104:315–332
Fig. 14 a–c Optimization results and the effective geometry of a spherical bowl piercing punches for belt perforation of TFL10S belt
necessary to choose the values that provide the closestapproximation to the optimal depth of the spherical bowl.In Fig. 14b, the same analysis was performed using theuniversal correlations from Figs. 11b and 13b, which alsomakes it possible to determine the optimal geometry fordifferent punch diameters. Comparing both methods, theobtained results were identical. However, for very smallpunch diameters, the range of the derived model may notcover the optimal set of parameters, because the characterof the process changes from punching to piercing. The
correlation between the optimal depth of the spherical bowlfor punching is presented in Fig. 14c.
By analyzing the solutions in the neighborhood ofthe optimal one, we can see that slightly increasing theperforation force and hole diameter deviations may extendthe tool life and the other way around. The results of thisanalysis are presented in Table 5.
Based on the results, it is visible that adding some extrarestrictions to one of the indicators may lead to slightlydifferent solutions. For some applications, the hole diameter
Table 5 Sensitivity analysis results for the neighbouring solutions to the optimal ones: δ—relative error
D H xF xL xQ f δF δL δQ δf
10 mm 2.6 mm 1.482 0.204 1.038 0.314 1.98% −3.48% 3.8% 2.17%
2.7 mm 1.453 0.211 1 0.307 0% 0% 0% 0%
2.8 mm 1.426 0.220 1 0.314 −1.90% 4.14% 0% 2.16%
8 mm 2.1 mm 1.55 0.226 1.01 0.354 2.63% −2.19% 0.8% 1.8%
2.2 mm 1.51 0.232 1 0.350 0% 0% 0% 0%
2.3 mm 1.472 0.238 1 0.351 −2.51% 2.97% 0% 0.39%
6 mm 1.6 mm 1.66 0.355 1 0.591 5.73% −3.41% 0% 2.12%
1.7 mm 1.574 0.368 1 0.578 0% 0% 0% 0%
1.8 mm 1.489 0.389 1 0.579 −5.4% 5.91% 0% 0.18%
5 mm 1.3 mm 1.59 0.411 1.039 0.678 6.8% −4.44% 3.91% 6.05%
1.4 mm 1.489 0.43 1 0.639 0% 0% 0% 0%
1.5 mm 1.392 0.463 1 0.645 −6.33% 7.71% 0% 0.89%

Int J Adv Manuf Technol (2019) 104:315–332 331
deviation or the estimated tool life may be different fromthe extreme values. Moreover, if we are designing toolsfor a machine with specific drive force FD, we are ableto consider not the minimal value of the force, but onewhich can be provided by the used drive. Because of that,the advantageous property of the optimization model is thepossibility of adjustment to the specific requirements. It can
be achieved by using the critical values of tool life(
FPFT
)cr
,
hole diameter deviation Δcr or the maximum drive force FD
and the expanded model is presented as Eqs. 25–27.
xF =
⎧⎪⎨⎪⎩
1 if FP
(H
D2
)≤ FD
1 + FP
(H
D2
)FD
if FP
(H
D2
)> FD
(25)
xL =
⎧⎪⎪⎨⎪⎪⎩
1 if FPFT
(HD
) ≤(
FPFT
)cr
1 +FPFT
(HD
)(
FPFT
)cr
if FPFT
(HD
)>
(FPFT
)cr
(26)
xQ ={
1 if Δ(H, D) ≤ Δcr
1 + Δ − Δcr if Δ(H, D) > Δcr(27)
Additionally, by performing the sensitivity analysis, weare able to determine in which way the tolerance ofmachining should be directed. It may also be very useful tochoose the solution from the neighboring solutions based onthe technological restrictions, which are not considered inthe optimization model.
7 Summary
The results presented in the paper show that the geometricalfeatures of the piercing punch have a strong influence onthe maximum perforation force, the tool life, and the qualityof the holes. Increasing the depth of the spherical bowlpunch and as a result its sharpness reduces the perforationforce and provides better quality of the holes, but alsoshortens the tool life. In order to find the optimal geometryof the piercing punch, it is necessary to find a compromisebetween all these parameters. The model proposed bythe authors, which was derived based on the combinationof analytical calculations, FEM analyses, and a series ofexperimental tests, makes it possible to determine theeffective geometry for the punches with different diameters.Additionally, its construction makes it possible to easilyadjust it to any specific requirements, which makes it veryuseful for manufacturers of the perforated belts around theworld. In further research, the authors plan to machine afew sets of effective tools and test them for various processparameters (punch velocity and the tool temperature) inorder to improve the belt perforation process.
One of the main assets of the optimization modelproposed by authors is the possibility to adjust it to the
specific requirements by using some critical values ofthe analyzed parameters. By analyzing the solutions inthe neighborhood of the optimal one, we can see thatslightly increasing the perforation force and hole diameterdeviations may extend the tool life and the other wayaround. Additionally, based on that kind of analyses, we areable to take into consideration aspects which were neglectedduring the modelling process, like technological issues ormachining precision, which should be an important factorfor industrial application of the presented research.
Open Access This article is distributed under the terms of theCreative Commons Attribution 4.0 International License (http://creativecommons.org/licenses/by/4.0/), which permits unrestricteduse, distribution, and reproduction in any medium, provided you giveappropriate credit to the original author(s) and the source, provide alink to the Creative Commons license, and indicate if changes weremade.
References
1. Wojtkowiak D, Talaska K, Malujda I, Domek G (2017) Vacuumconveyor belts perforation – methods, materials and problems.Mechanik, https://doi.org/10.17814/mechanik.2017.12.192
2. Wojtkowiak D, Talaska K, Malujda I, Domek G (2018) Estimationof the perforation force for polymer composite conveyor beltstaking into consideration the shape of the piercing punch. Int JAdv Manuf Technol 98:9-12:2539–2561. https://doi.org/10.1007/s00170-018-2381-3
3. Talaska K, Wojtkowiak D (2018) Modelling a mechanicalproperties of the multilayer composite materials with thepolyamide core. MATEC Web of Conferences 157:02052
4. Wojtkowiak D, Talaska K, Malujda I, Domek G (2018) Analysisof the influence of the cutting edge geometry on parameters of theperforation process for conveyor and transmission belts. MATECWeb of Conferences 157:01022
5. Abele E, Fujara M (2010) Simulation-based twist drill design andgeometry optimization. CIRP Annals 59:1:145–150. https://doi.org/10.1016/j.cirp.2010.03.063
6. Li A, Zhao J, Pei Z, Zhu N (2014) Simulation-based solid carbideend mill design and geometry optimization. Int J Adv Manuf Tech-nol 71:1889–1900. https://doi.org/10.1007/s00170-014-5638-5
7. Zong WJ, Sun T, Li D, Cheng K, Liang YC (2006) FEMOptimization of tool geometry based on the machined nearsurface’s residual stresses generated in diamond turning. JMater Process Technol 180:271–278. https://doi.org/10.1016/j.jmatprotec.2006.07.004
8. Jensen MR, Damborg FF, Nielsen KB, Danckert J (1998)Optimization of the draw-die design in conventional deep-drawingin order to minimise tool wear. J Mater Process Technol 83:106–114
9. Venkata Rao R, Savsani VJ (2012) Mechanical design optimiza-tion using advanced optimization techniques. Springer, London
10. Ko D-C, Kim B-M (2000) Development of an analytical schemeto predict the need for tool regrinding in shearing processes. Int JMachine Tools & Manuf 40:1329–1349. https://doi.org/10.1016/S0890-6955(99)00125-X
11. Oraby SE, Hayhurst DR (2004) Tool life determination basedon the measurement of wear and tool force ratio variation. Int JMachine Tools & Manuf 44:1261–1269. https://doi.org/10.1016/j.ijmachtools.2004.04.018

332 Int J Adv Manuf Technol (2019) 104:315–332
12. Zhang G, Guo C (2016) Modeling flank wear progression basedon cutting force and energy prediction in turning process. ProcediaManufacturing 5:536–545. https://doi.org/10.1016/j.promfg.2016.08.044
13. Yen Y-C, Sohner J, Lilly B, Altan T (2004) Estimation of toolwear in orthogonal cutting using the finite element analysis. JMater Process Technol 146:82–91
14. Hu Y, Yuan X, Ma G, Masen MA, Wang L (2015) Tool-lifeprediction under multi-cycle loading during metal forming: afeasibility study. Manuf Rev 2:28:1–7. https://doi.org/10.1051/mfreview/201503111
15. Salonitis K, Kolios A (2014) Reliability assessment of cuttingtool life based on surrogate approximation methods. Int JAdv Manuf Technol 71:5-8:1197–1208. https://doi.org/10.1007/s00170-013-5560-2
16. Kovac P, Pucovsky V, Gostimirovic M, Savkovic B, Rodic D(2014) Influence of data quantity on accuracy of predictions inmodelling tool life by the use of genetic algorithms. Int J IndustrialEng 21:2:14–21
17. Soares JA, Gipela ML, Lararin SF, Marcondes PVP (2013) Studyof the punch-die clearance influence on the sheared edge qualityof thick sheets. Int J Adv Manuf Technol 65:451–457. https://doi.org/10.1007/s00170-012-4184-2
18. Subramonian S, Altan T, Ciocirlan B, Campbell C (2013)Optimum selection of variable punch-die clearance to improvetool life in blanking non-symmetric shapes. Int J Machine ToolsManuf 75:63–71
19. Lo S-P, Chang D-Y, Lin Y-Y (2010) Relationship between thePunch–Die clearance and shearing quality of progressive shearingdie. Mat Manuf Process 25:786–792. https://doi.org/10.1080/10426910903447295
20. Ueda T, Iizuka T, Enoki S (2016) FEM analysis of punching-process in consideration of micro die wear. MATEC Web ofConferences 80:15006
21. Esmaeilpour R, Kim H, Park T, Pourboghrat F, Xu Z, MohammedB, Abu-Farha F (2018) Calibration of barlat Yld2004-18P yieldfunction using CPFEM and 3D RVE for the simulation of singlepoint incremental forming (SPIF) of 7075-O aluminum sheet. IntJ Mech Sci 145:24–41. https://doi.org/10.1016/J.IJMECSCI.2018.05.015
22. Esmaeilpour R, Kim H, Park T, Pourboghrat F, MohammedB (2017) Comparison of 3D yield functions for finite elementsimulation of single point incremental forming (SPIF) ofaluminum 7075. Int J Mech Sci 133:544–554. https://doi.org/10.1016/j.ijmecsci.2017.09.019
23. Holmberg S, Persson K, Petersson H (1999) Nonlinear mechanicalbehaviour and analysis of wood and fibre materials. Comput andStruct 72:459–480
24. Pal B, Haseebuddin MR (2012) Analytical estimation of elasticproperties of polypropylene fiber matrix composite by finiteelement analysis. Adv in Mat Phys and Chem 2:23–30
25. Shetty N, Shahabaz SM, Sharma SS, Shetty SD (2017) A reviewon finite element method for machining of composite materials.Composite Struct 176:790–802
26. Dandekar CR, Shin YC (2012) Modeling of machining ofcomposite materials: a review. Int J Mach Tools & Manuf 57:102–121
27. Garcia JJ, Rangel C, Ghavami K (2012) Experiments with rings todetermine the anisotropic elastic constants of bamboo. Constr andBuild Mat 31:52–57
28. Vasic S, Smith I, Landis E (2005) Finite element techniques andmodels for wood fracture mechanics. Wood Sci Technol 39:3–17
29. Torres LA, Ghavami K, Garcia JJ (2007) A transversely isotropiclaw for the determination of the circumferential young’s modulusof bamboo with diametric compression tests. Latin Americ AppRes 37:255–260
30. Dandekar CR, Shin YC (2009) Multi-step 3D finite element mod-eling of subsurface damage in machining particulate reinforcedmetal matrix composites. Compos Part A 40(8):1231–1239
31. Zhou L, Huang ST, Wang D, Yu XL (2011) Finite element andexperimental studies of the cutting process of SiCp/Al compositeswith PCD tools. Int J of Adv Manuf Technol 52:619–626
32. Ventura CEH, Hassui A (2013) Evaluation of static cutting forcesand tool wear in HSM process applied to pocket milling. Int J AdvManuf Technol 65:1681–1689
33. Voss BM, Pereira MP, Rolfe BF, Doolan MC (2017) Usingstamping punch force variation for the identification of changesin lubrication and wear mechanism. IOP Conf Series: Journal ofPhysics: Conf Series 896:012028
34. Choudhury SK, Kishore KK (2000) Tool wear measurement inturning using force ratio. Int J Mach Tools Manuf 40:899–909
35. Akyurek F, Yaman K, Tekiner Z (2017) An ExperimentalWork onToolWear affected by die clearance and punch hardness. Arab JSci Eng 42:4683–4692
36. Gouarir A, Martınez-Arellano G, Terrazas G, Benardos P, RatchevS (2018) In-process tool wear prediction system based on machinelearning techniques and force analysis. Procedia CIRP 77:501–504
37. Siddhpura A, Paurobally R (2012) A study of the effects offriction on flank wear and the role of friction in tool wearmonitoring. Australian J Mech Eng 10:141–156. https://doi.org/10.7158/M12-027.2012.10.2
Publisher’s note Springer Nature remains neutral with regard tojurisdictional claims in published maps and institutional affiliations.