Measurement of the geometrical features and surface color of rapeseeds using digital image analysis
10
Measurement of the geometrical features and surface color of rapeseeds using digital image analysis Małgorzata Tan ´ska * , Daniela Rotkiewicz, Witold Kozirok, Iwona Konopka Chair of Food Plant Chemistry and Processing, University of Warmia and Mazury in Olsztyn, Pl. Cieszyn ´ ski 1, 10-957 Olsztyn, Poland Received 16 July 2004; accepted 21 January 2005 Abstract Digital image analysis was applied to determine the geometrical features and color of rape seeds surface, and to discriminate some impurities, that are difficult to separate in the cleaning process. The paper notices on methodological aspects, and the experiment described constitutes the first stage of studies on the possibility of applying digital image analysis to rapeseed quality estimation, so the results obtained should be treated as preliminary. The geometrical features of seeds and their color were analyzed using the LUCIA G ver. 4.8 software. It was found that variation in geometrical dimensions of seeds was much lower than in color of their surface, so minimum sample size utilized for color measurements should be larger. The surface color of seeds was feature that insufficiently differ- entiates seeds of different dimensions. Only small seeds were characterized by somewhat changed distribution of color on their surface. An analysis of color of rape and stickywilly seeds in RGB (red/green/blue) model showed distinct differences in value ranges, enabling to distinguish between these seeds. Surface color of mature, immature and broken seeds cannot be used to distinguish these fractions. Ó 2005 Elsevier Ltd. All rights reserved. Keywords: Rapeseed; Digital image analysis; Seed size; Geometrical features; Color surface 1. Introduction Rape (canola) is the most common oil plant in the world. The technological value of its seeds is the major factor determining the quality of rapeseed/canola prod- ucts, especially oils and meals. In Poland, the quality standards for rapeseeds are based on physical and chem- ical factors such as the contents of moisture, impurities and glucosinolates, erucic acid concentration, the acid value of oil and the presence of pests in seeds (Polish Standard PN-90/R-66151). It is a well-known fact that the content of impurities is one of the major factors affecting rapeseed quality. Their proportion in bulk mass depends on harvesting, drying, cleaning and stor- age conditions (Tys & Rybacki, 2001). The percentage of impurities is one of main quality criteria, e.g., in Can- ada the total content of impurities decides the grade of rapeseed/canola (Official Grain Grading Guide, 2003). The content of impurities is determined by visual inspec- tion, followed by manual elimination and weighting of different types of impurities separated from either 10 g samples (PN-91/R-66160) or 5–500 g samples (Official Grain Grading Guide, 2003). The group of useful impu- rities also includes immature and bin-heated seeds, eval- uated on the basis of the color of their interior. Such determinations require great precision, and the assess- ment is a subjective process associated with errors re- lated to the competence, and mental and physical condition of the licensed seed grader. Furthermore, this kind of analysis is both labor- and time-consuming, as the minimum time required for grading is about 90 min. Seed dimensions and shape also considerably affect the end-use quality of rapeseed meal and oil (Rotkiewicz, Tan ´ska, & Konopka, 2002). These parameters are taken into account while modeling the cleaning process 0963-9969/$ - see front matter Ó 2005 Elsevier Ltd. All rights reserved. doi:10.1016/j.foodres.2005.01.008 * Corresponding author. Tel./fax: +48 89 523 34 66. E-mail address: [email protected] (M. Tan ´ ska). www.elsevier.com/locate/foodres Food Research International 38 (2005) 741–750
-
Upload
independent -
Category
Documents
-
view
2 -
download
0
Transcript of Measurement of the geometrical features and surface color of rapeseeds using digital image analysis
www.elsevier.com/locate/foodres
Food Research International 38 (2005) 741–750
Measurement of the geometrical features and surface color ofrapeseeds using digital image analysis
Małgorzata Tanska *, Daniela Rotkiewicz, Witold Kozirok, Iwona Konopka
Chair of Food Plant Chemistry and Processing, University of Warmia and Mazury in Olsztyn, Pl. Cieszynski 1, 10-957 Olsztyn, Poland
Received 16 July 2004; accepted 21 January 2005
Abstract
Digital image analysis was applied to determine the geometrical features and color of rape seeds surface, and to discriminate someimpurities, that are difficult to separate in the cleaning process. The paper notices on methodological aspects, and the experimentdescribed constitutes the first stage of studies on the possibility of applying digital image analysis to rapeseed quality estimation, sothe results obtained should be treated as preliminary. The geometrical features of seeds and their color were analyzed using the LUCIAG ver. 4.8 software. It was found that variation in geometrical dimensions of seeds was much lower than in color of their surface, sominimum sample size utilized for color measurements should be larger. The surface color of seeds was feature that insufficiently differ-entiates seeds of different dimensions. Only small seeds were characterized by somewhat changed distribution of color on their surface.Ananalysis of color of rape and stickywilly seeds inRGB (red/green/blue)model showeddistinct differences in value ranges, enabling todistinguish between these seeds. Surface color of mature, immature and broken seeds cannot be used to distinguish these fractions.� 2005 Elsevier Ltd. All rights reserved.
Keywords: Rapeseed; Digital image analysis; Seed size; Geometrical features; Color surface
1. Introduction
Rape (canola) is the most common oil plant in theworld. The technological value of its seeds is the majorfactor determining the quality of rapeseed/canola prod-ucts, especially oils and meals. In Poland, the qualitystandards for rapeseeds are based on physical and chem-ical factors such as the contents of moisture, impuritiesand glucosinolates, erucic acid concentration, the acidvalue of oil and the presence of pests in seeds (PolishStandard PN-90/R-66151). It is a well-known fact thatthe content of impurities is one of the major factorsaffecting rapeseed quality. Their proportion in bulkmass depends on harvesting, drying, cleaning and stor-age conditions (Tys & Rybacki, 2001). The percentageof impurities is one of main quality criteria, e.g., in Can-
0963-9969/$ - see front matter � 2005 Elsevier Ltd. All rights reserved.
doi:10.1016/j.foodres.2005.01.008
* Corresponding author. Tel./fax: +48 89 523 34 66.
E-mail address: [email protected] (M. Tanska).
ada the total content of impurities decides the grade ofrapeseed/canola (Official Grain Grading Guide, 2003).The content of impurities is determined by visual inspec-tion, followed by manual elimination and weighting ofdifferent types of impurities separated from either 10 gsamples (PN-91/R-66160) or 5–500 g samples (OfficialGrain Grading Guide, 2003). The group of useful impu-rities also includes immature and bin-heated seeds, eval-uated on the basis of the color of their interior. Suchdeterminations require great precision, and the assess-ment is a subjective process associated with errors re-lated to the competence, and mental and physicalcondition of the licensed seed grader. Furthermore, thiskind of analysis is both labor- and time-consuming, asthe minimum time required for grading is about 90 min.
Seed dimensions and shape also considerably affectthe end-use quality of rapeseed meal and oil (Rotkiewicz,Tanska, & Konopka, 2002). These parameters are takeninto account while modeling the cleaning process
Table 1Discriminates of rapeseeds quality
Discriminate Type of sample
Fraction I Fraction II Fraction III
Share of fraction (%) 16.96a 70.22b 12.82c
Seeds moisture (%) 6.10a 6.02a 7.01b
Mass of 1000 seeds (g) 5.42a 4.62b 2.85c
Use impurities (%)
742 M. Tanska et al. / Food Research International 38 (2005) 741–750
(Choszcz, Konopka, & Wierzbicki, 1998; Choszcz &Wierzbicki, 1994) or designing machines and devicesfor seed separation and sowing (Tylek, 1995). They alsoaffect the storage process (Tys & Rybacki, 2001). Thisconfirms that their precise determination is indispensablefor making proper technological decisions.
Digital image analysis (DIA) enables full automatiza-tion of measurement of impurity content and seeddimensions/shape. Numerous studies are being con-ducted currently on the possibility of using this techniquefor cereal grain quality estimation. They are aimed atdetermining the geometry and color of kernels for thepurpose of identification of species and varieties(Majumdar & Jayas, 1999; Sakai, Yonekawa,Matsuzaki, & Morishima, 1996; Shouche, Rastogi,Bhagwat, & Sainis, 2001; Utku & Koksel, 1998), typesof microbiological contamination (Wiwart, 2000), andmechanical and/or thermal damage (Gunasekaran, Coo-per, & Berlage, 1987; Luo, Jayas, & Symons, 1999; Pali-wal, Visen, Jayas, & White, 2003). Examples of DIAapplication to oil plant seeds, including rapeseeds, arefew (Cober, Voldeng, & Fregeau-Reid, 1997; Keefe,1999; Paulsen, Wgger, Litchfield, & Sinclair, 1989). Insuch investigations rapeseeds usually serve only as com-parative material for cereal kernels, due to their differentmorphological and geometrical features (Jayas, Murray,& Bulley, 1999; Shatadal, Jayas, Hehn, & Bulley, 1995).
DIA makes it possible to determine the geometricalfeatures and color of seeds, as well as the content of var-ious impurities in cereal grains. It seems that it could bean equally efficient and useful tool in the case of rape-seeds. The presented paper tests the possibility of apply-ing digital image analysis to rapeseed quality estimation,including the determination of the geometrical features,color of seeds surface, and also identification impuritiesthat are difficult to separate in the cleaning process(Choszcz et al., 1998; Choszcz & Wierzbicki, 1994).
Total 1.96b 3.43b 8.03c
Green seeds 0.00a 0.00a 0.00a
Sprouted seeds 0.72a 0.17b 0.83c
Others 1.24a 3.26b 7.20c
Useless impurities (%)Total 4.84a 3.39b 13.36c
Moldy seeds 2.45a 2.56a 6.40b
Weed seeds 2.39a 0.83b 5.90c
Minerals 0.00a 0.00a 1.06b
Fat content (% dry matter) 43.42a 43.42a 35.96b
Phenolic compounds(% in oil-free dry matter)
3.66a 3.77b 4.00c
Chlorophyll pigments (ppm) 4.19a 6.17b 8.48c
Absorbance forCarotenoids in oil (A442) 0.628a 0.660b 0.799c
Chlorophylls in oil (A668) 0.223a 0.117b 0.231a
Total oil color (B) 851a 776b 1030c
Carotenoids in oil (ppm) 32.4a 36.98b 38.0c
Acid value of oil(mg KOH/g fat)
1.19a 1.96b 2.85c
Means with the same letter in the same line are not significantly dif-ferent (p = 0.05).
2. Materials and methods
2.1. Materials – rapeseed samples
The experimental material was commercial bulk massof seeds grown in the year 2002 in Central Poland. Theseed mass was cleaned in a sieve separator, removingmineral matter (stones), cereal grains, stems and dusts.Then, the sample was sifted through a set of sievesand three fractions were received:
Fraction I – overtails of a 2.0 mm sieve,Fraction II – overtails of a 1.6 mm sieve,Fraction III – screening through a 1.6 mm.
Each fraction was characterized by its share in bulkmass, moisture content (PN-62/R-66163), 1000 seeds
weight, the contents of impurities (PN-91/R-66160),fat (PN-73/R-66164), phenolic compounds (Ribereau-Gayon, 1972) and chlorophyll pigment concentration(Ward, Scarth, Daun, & Thorsteinson, 1994). In ex-tracted oils (Soxhlet method with petroleum ether) weremeasured: color as absorbance for carotenoids and chlo-rophylls (PN-A-86934:1995), carotenoid content (Toro-Vazquez, 1991) and acid value (PN-60/A-86921). Thesemeasurements were made in triplicate and mean valuesare showed in Table 1.
2.2. Image analysis
The measurements of seed geometrical features andcolor of their surface were performed using a customizedpersonal computer-based digital image analysis system.The digital image analyses were performed for the sur-face of whole seeds. Before analyses the calibration toa standard white reflective plate was done. The imageswere acquired by a high resolution, low-noise CCD Ni-kon DXM-1200 color camera and analyzed using theLUCIA G (Laboratory Universal Computer ImageAnalysis) ver. 4.8 software. The frame grabber boardresolution was 1280 · 1024 pixels. The seeds were exam-ined from a distance (lens to object) of 2.5 cm. The lightsource were BOB OM 100 · 1 (BOB Manufacture, Po-land) with 4 · 100 W (60 kLx) halogen (color tempera-ture about 3000 K) fiber lamps (OSRAM).
M. Tanska et al. / Food Research International 38 (2005) 741–750 743
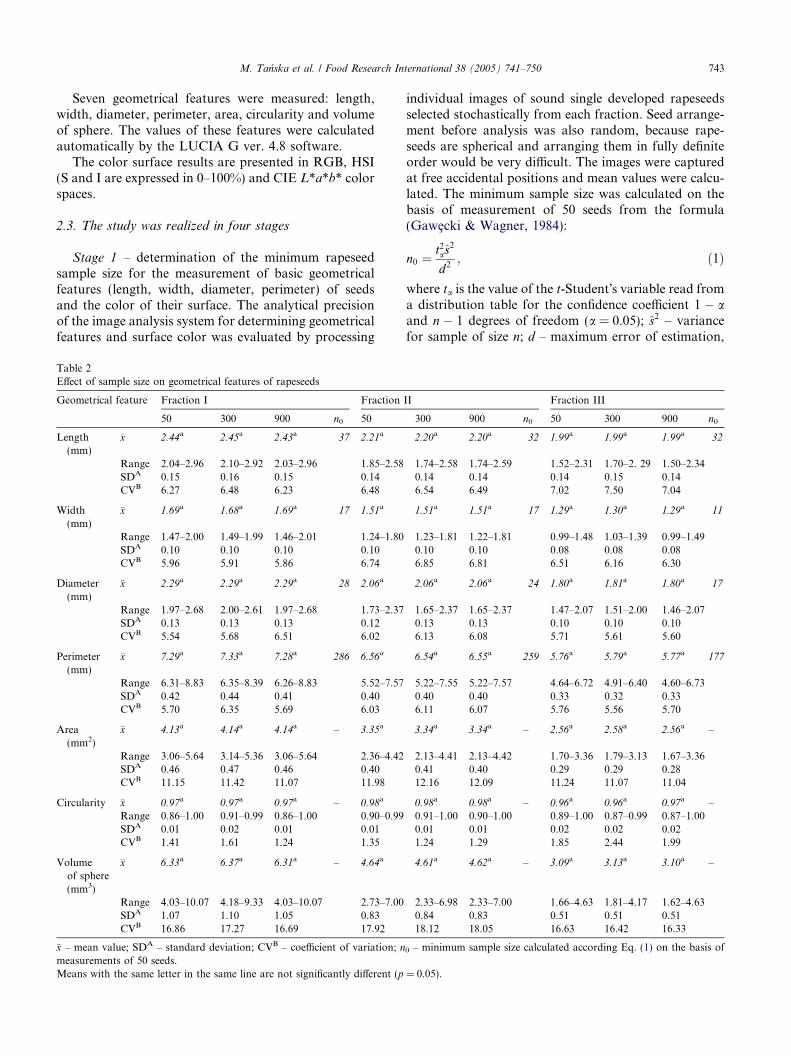
Seven geometrical features were measured: length,width, diameter, perimeter, area, circularity and volumeof sphere. The values of these features were calculatedautomatically by the LUCIA G ver. 4.8 software.
The color surface results are presented in RGB, HSI(S and I are expressed in 0–100%) and CIE L*a*b* colorspaces.
2.3. The study was realized in four stages
Stage 1 – determination of the minimum rapeseedsample size for the measurement of basic geometricalfeatures (length, width, diameter, perimeter) of seedsand the color of their surface. The analytical precisionof the image analysis system for determining geometricalfeatures and surface color was evaluated by processing
Table 2Effect of sample size on geometrical features of rapeseeds
Geometrical feature Fraction I Fraction
50 300 900 n0 50
Length(mm)
�x 2.44a 2.45a 2.43a 37 2.21a
Range 2.04–2.96 2.10–2.92 2.03–2.96 1.85–2.58SDA 0.15 0.16 0.15 0.14CVB 6.27 6.48 6.23 6.48
Width(mm)
�x 1.69a 1.68a 1.69a 17 1.51a
Range 1.47–2.00 1.49–1.99 1.46–2.01 1.24–1.80SDA 0.10 0.10 0.10 0.10CVB 5.96 5.91 5.86 6.74
Diameter(mm)
�x 2.29a 2.29a 2.29a 28 2.06a
Range 1.97–2.68 2.00–2.61 1.97–2.68 1.73–2.37SDA 0.13 0.13 0.13 0.12CVB 5.54 5.68 6.51 6.02
Perimeter(mm)
�x 7.29a 7.33a 7.28a 286 6.56a
Range 6.31–8.83 6.35–8.39 6.26–8.83 5.52–7.57SDA 0.42 0.44 0.41 0.40CVB 5.70 6.35 5.69 6.03
Area(mm2)
�x 4.13a 4.14a 4.14a – 3.35a
Range 3.06–5.64 3.14–5.36 3.06–5.64 2.36–4.42SDA 0.46 0.47 0.46 0.40CVB 11.15 11.42 11.07 11.98
Circularity �x 0.97a 0.97a 0.97a – 0.98a
Range 0.86–1.00 0.91–0.99 0.86–1.00 0.90–0.99SDA 0.01 0.02 0.01 0.01CVB 1.41 1.61 1.24 1.35
Volumeof sphere(mm3)
�x 6.33a 6.37a 6.31a – 4.64a
Range 4.03–10.07 4.18–9.33 4.03–10.07 2.73–7.00SDA 1.07 1.10 1.05 0.83CVB 16.86 17.27 16.69 17.92
�x – mean value; SDA – standard deviation; CVB – coefficient of variation; nmeasurements of 50 seeds.Means with the same letter in the same line are not significantly different (p
individual images of sound single developed rapeseedsselected stochastically from each fraction. Seed arrange-ment before analysis was also random, because rape-seeds are spherical and arranging them in fully definiteorder would be very difficult. The images were capturedat free accidental positions and mean values were calcu-lated. The minimum sample size was calculated on thebasis of measurement of 50 seeds from the formula(Gawe�cki & Wagner, 1984):
n0 ¼t2as
2
d2; ð1Þ
where ta is the value of the t-Student�s variable read froma distribution table for the confidence coefficient 1 � aand n � 1 degrees of freedom (a = 0.05); s2 – variancefor sample of size n; d – maximum error of estimation,
II Fraction III
300 900 n0 50 300 900 n0
2.20a 2.20a 32 1.99a 1.99a 1.99a 32
1.74–2.58 1.74–2.59 1.52–2.31 1.70–2. 29 1.50–2.340.14 0.14 0.14 0.15 0.146.54 6.49 7.02 7.50 7.04
1.51a 1.51a 17 1.29a 1.30a 1.29a 11
1.23–1.81 1.22–1.81 0.99–1.48 1.03–1.39 0.99–1.490.10 0.10 0.08 0.08 0.086.85 6.81 6.51 6.16 6.30
2.06a 2.06a 24 1.80a 1.81a 1.80a 17
1.65–2.37 1.65–2.37 1.47–2.07 1.51–2.00 1.46–2.070.13 0.13 0.10 0.10 0.106.13 6.08 5.71 5.61 5.60
6.54a 6.55a 259 5.76a 5.79a 5.77a 177
5.22–7.55 5.22–7.57 4.64–6.72 4.91–6.40 4.60–6.730.40 0.40 0.33 0.32 0.336.11 6.07 5.76 5.56 5.70
3.34a 3.34a – 2.56a 2.58a 2.56a –
2.13–4.41 2.13–4.42 1.70–3.36 1.79–3.13 1.67–3.360.41 0.40 0.29 0.29 0.2812.16 12.09 11.24 11.07 11.04
0.98a 0.98a – 0.96a 0.96a 0.97a –0.91–1.00 0.90–1.00 0.89–1.00 0.87–0.99 0.87–1.000.01 0.01 0.02 0.02 0.021.24 1.29 1.85 2.44 1.99
4.61a 4.62a – 3.09a 3.13a 3.10a –
2.33–6.98 2.33–7.00 1.66–4.63 1.81–4.17 1.62–4.630.84 0.83 0.51 0.51 0.5118.12 18.05 16.63 16.42 16.33
0 – minimum sample size calculated according Eq. (1) on the basis of
= 0.05).
744 M. Tanska et al. / Food Research International 38 (2005) 741–750
i.e., measurement accuracy for particular parameters(d = 0.05 mm – measurement of geometrical features;d = 1 – measurement of the R, G and B attributes).
In that part of work, we analyzed also how samplesize influences on discrimination of seeds fractions.For analyses of 50, 300 and 900 seeds dispersion statis-tics (standard deviation, coefficient of variance andcurve for a normal distribution) is presented.
Stage 2 – choice of geometrical features or shapecoefficients determined on their basis, allowing to distin-guish between particular rapeseed fractions. At thisstage sample size was 900 seeds of each fraction.
Stage 3 – choice of a surface color measurement sys-tem, allowing to distinguish between particular rapeseedfractions. At this stage sample size was 900 seeds of eachfraction.
Stage 4 – determination of the best color attribute inthe RGB model, allowing differentiating mature rape-seeds and impurities, such as broken and immaturerapeseeds and stickywilly seeds. Particular groups ofseeds were manually separated from the initial material.
2.4. Statistical analyses
The experimental results were analyzed statisticallyusing the STATISTICA 6.0 software. The calculationswere performed at the significance level p = 0.05.
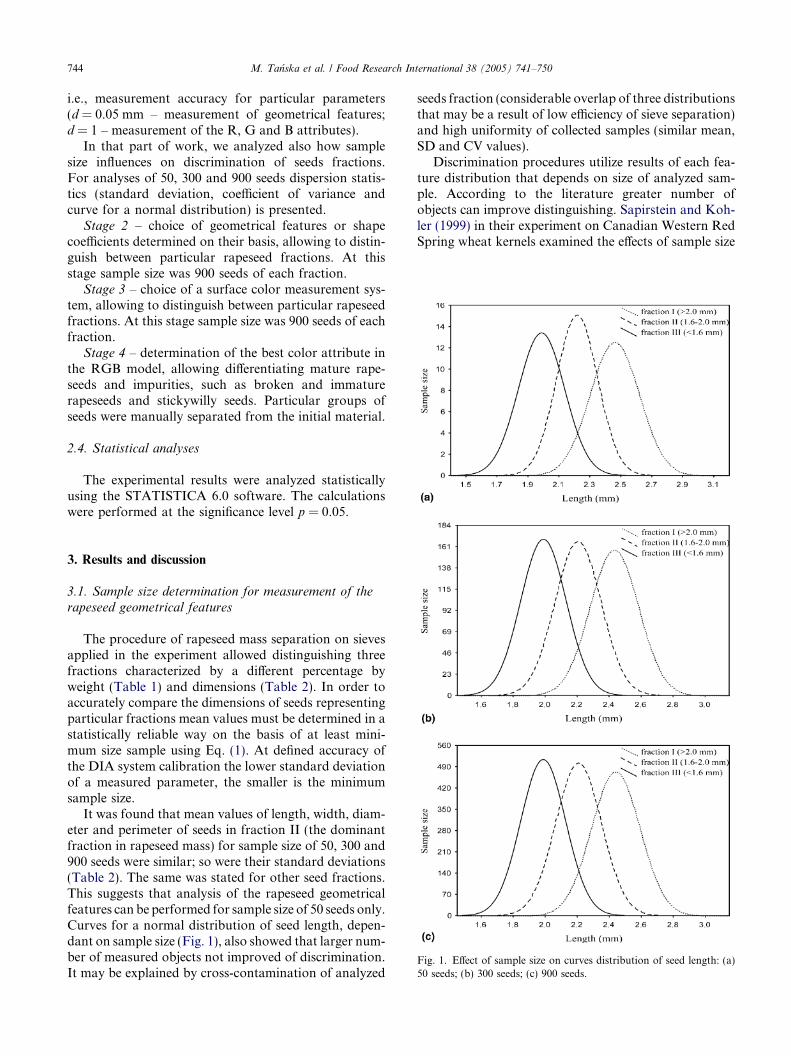
Fig. 1. Effect of sample size on curves distribution of seed length: (a)50 seeds; (b) 300 seeds; (c) 900 seeds.
3. Results and discussion
3.1. Sample size determination for measurement of the
rapeseed geometrical features
The procedure of rapeseed mass separation on sievesapplied in the experiment allowed distinguishing threefractions characterized by a different percentage byweight (Table 1) and dimensions (Table 2). In order toaccurately compare the dimensions of seeds representingparticular fractions mean values must be determined in astatistically reliable way on the basis of at least mini-mum size sample using Eq. (1). At defined accuracy ofthe DIA system calibration the lower standard deviationof a measured parameter, the smaller is the minimumsample size.
It was found that mean values of length, width, diam-eter and perimeter of seeds in fraction II (the dominantfraction in rapeseed mass) for sample size of 50, 300 and900 seeds were similar; so were their standard deviations(Table 2). The same was stated for other seed fractions.This suggests that analysis of the rapeseed geometricalfeatures can be performed for sample size of 50 seeds only.Curves for a normal distribution of seed length, depen-dant on sample size (Fig. 1), also showed that larger num-ber of measured objects not improved of discrimination.It may be explained by cross-contamination of analyzed
seeds fraction (considerable overlap of three distributionsthat may be a result of low efficiency of sieve separation)and high uniformity of collected samples (similar mean,SD and CV values).
Discrimination procedures utilize results of each fea-ture distribution that depends on size of analyzed sam-ple. According to the literature greater number ofobjects can improve distinguishing. Sapirstein and Koh-ler (1999) in their experiment on Canadian Western RedSpring wheat kernels examined the effects of sample size
M. Tanska et al. / Food Research International 38 (2005) 741–750 745
on the variation in results. They reported that LSD (thelowest significant difference) was approximately sixfoldlower for a sample size of 1200 kernels, compared witha sample size of 30 kernels. They also observed consid-erable differences in means of geometrical features andstandard deviations for a sample size smaller than 200kernels. According to these authors, the minimum num-ber of kernels necessary for obtaining accurate and reli-able results is 376–514, depending on wheat qualityclass. Analysis of such a large sample and precise deter-mination of mean values is especially important for dis-crimination of wheat quality class. This indicates thatdeterminations made for a very small sample size or
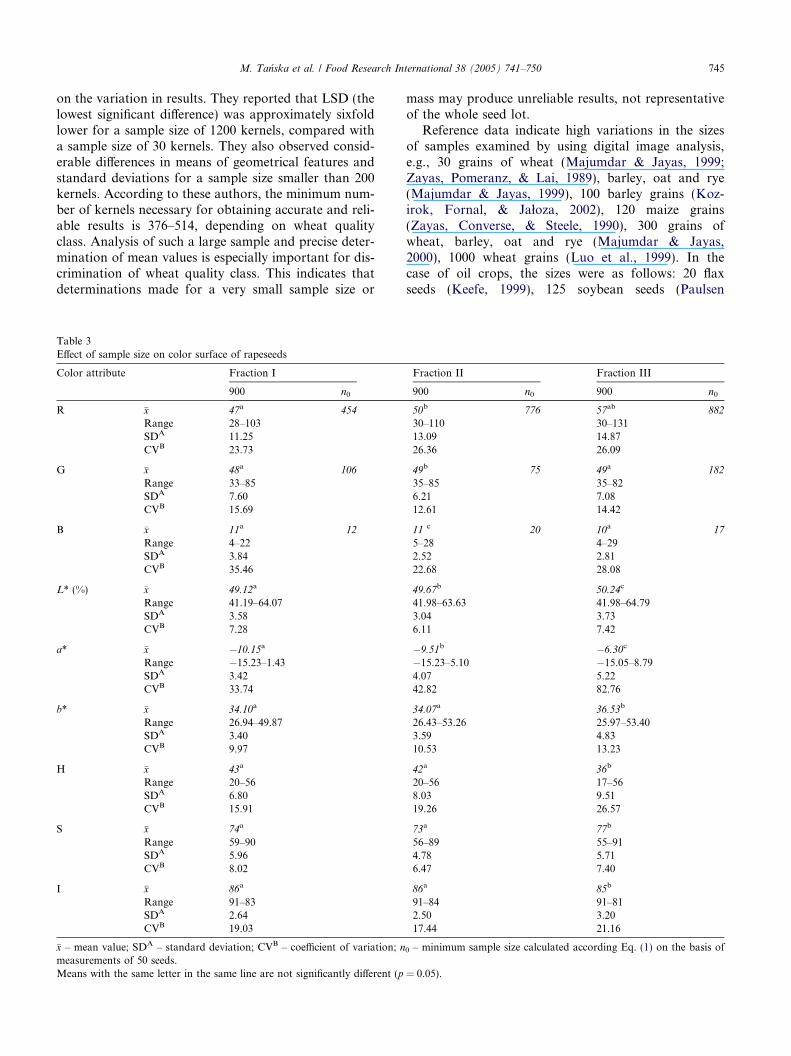
Table 3Effect of sample size on color surface of rapeseeds
Color attribute Fraction I
900 n0
R �x 47a 454
Range 28–103SDA 11.25CVB 23.73
G �x 48a 106
Range 33–85SDA 7.60CVB 15.69
B �x 11a 12
Range 4–22SDA 3.84CVB 35.46
L* (%) �x 49.12a
Range 41.19–64.07SDA 3.58CVB 7.28
a* �x �10.15a
Range �15.23–1.43SDA 3.42CVB 33.74
b* �x 34.10a
Range 26.94–49.87SDA 3.40CVB 9.97
H �x 43a
Range 20–56SDA 6.80CVB 15.91
S �x 74a
Range 59–90SDA 5.96CVB 8.02
I �x 86a
Range 91–83SDA 2.64CVB 19.03
�x – mean value; SDA – standard deviation; CVB – coefficient of variation; nmeasurements of 50 seeds.Means with the same letter in the same line are not significantly different (p
mass may produce unreliable results, not representativeof the whole seed lot.
Reference data indicate high variations in the sizesof samples examined by using digital image analysis,e.g., 30 grains of wheat (Majumdar & Jayas, 1999;Zayas, Pomeranz, & Lai, 1989), barley, oat and rye(Majumdar & Jayas, 1999), 100 barley grains (Koz-irok, Fornal, & Jałoza, 2002), 120 maize grains(Zayas, Converse, & Steele, 1990), 300 grains ofwheat, barley, oat and rye (Majumdar & Jayas,2000), 1000 wheat grains (Luo et al., 1999). In thecase of oil crops, the sizes were as follows: 20 flaxseeds (Keefe, 1999), 125 soybean seeds (Paulsen
Fraction II Fraction III
900 n0 900 n0
50b 776 57ab 882
30–110 30–13113.09 14.8726.36 26.09
49b 75 49a 182
35–85 35–826.21 7.0812.61 14.42
11 c 20 10a 17
5–28 4–292.52 2.8122.68 28.08
49.67b 50.24c
41.98–63.63 41.98–64.793.04 3.736.11 7.42
�9.51b �6.30c
�15.23–5.10 �15.05–8.794.07 5.2242.82 82.76
34.07a 36.53b
26.43–53.26 25.97–53.403.59 4.8310.53 13.23
42a 36b
20–56 17–568.03 9.5119.26 26.57
73a 77b
56–89 55–914.78 5.716.47 7.40
86a 85b
91–84 91–812.50 3.2017.44 21.16
0 – minimum sample size calculated according Eq. (1) on the basis of
= 0.05).
746 M. Tanska et al. / Food Research International 38 (2005) 741–750
et al., 1989). The effects of sample size on the resultsof analysis were disregarded.
3.2. Geometrical features analysis of rapeseeds from
particular fractions
The highest mean values of length, width, diameterand perimeter (Table 2) were stated for the seeds offraction I, and the lowest – for the seeds of fractionIII. However, the range of variation of these parame-ters was similar for all fractions (5.51–7.04%). The re-sults show limited efficiency of seed separation onsieves. The presence of seeds that are longer than2 mm and thinner than 1.6 mm in fraction II indicatesits ‘‘contamination’’ with larger and smaller seeds,respectively. It suggests that shape of seeds is not uni-form and it decides about their allocation to a givenfraction.
According to Shatadal et al. (1995), seeds of rape/ca-nola plants grown in Canada are characterized by lengthin range 1.1–2.2 mm, width in 0.8–2.1 mm, perimeter in3.3–7.0 mm and surface area in 1.2–4.2 mm2. Accordingto Thakor, Sokhansanj, Sosulski, and Yannacopoulos(1999), canola seed diameter is 1.89 ± 0.09 mm. A com-
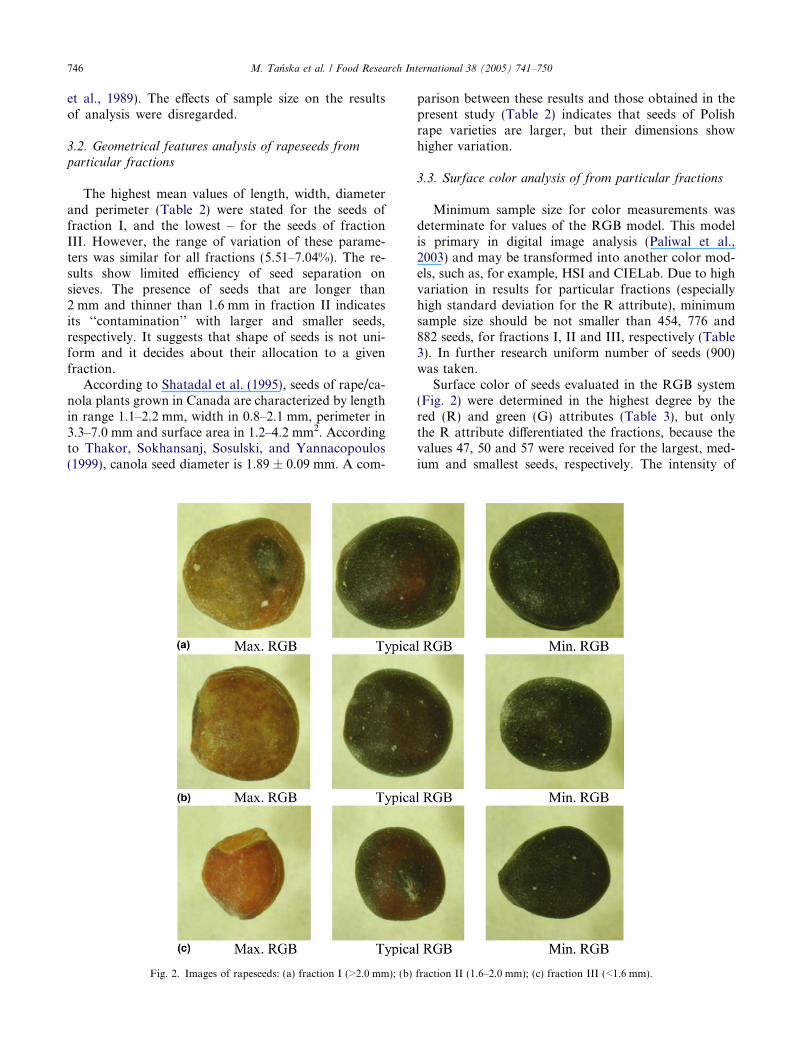
Fig. 2. Images of rapeseeds: (a) fraction I (>2.0 mm); (b)
parison between these results and those obtained in thepresent study (Table 2) indicates that seeds of Polishrape varieties are larger, but their dimensions showhigher variation.
3.3. Surface color analysis of from particular fractions
Minimum sample size for color measurements wasdeterminate for values of the RGB model. This modelis primary in digital image analysis (Paliwal et al.,2003) and may be transformed into another color mod-els, such as, for example, HSI and CIELab. Due to highvariation in results for particular fractions (especiallyhigh standard deviation for the R attribute), minimumsample size should be not smaller than 454, 776 and882 seeds, for fractions I, II and III, respectively (Table3). In further research uniform number of seeds (900)was taken.
Surface color of seeds evaluated in the RGB system(Fig. 2) were determined in the highest degree by thered (R) and green (G) attributes (Table 3), but onlythe R attribute differentiated the fractions, because thevalues 47, 50 and 57 were received for the largest, med-ium and smallest seeds, respectively. The intensity of
fraction II (1.6–2.0 mm); (c) fraction III (<1.6 mm).
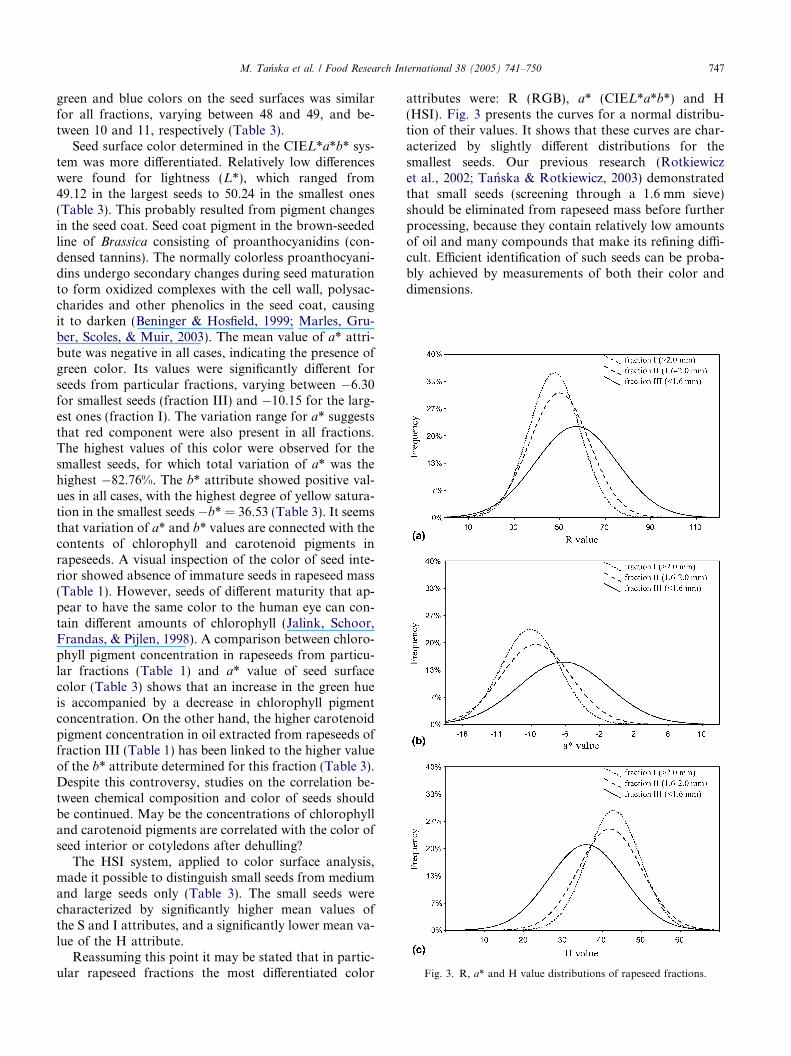
Fig. 3. R, a* and H value distributions of rapeseed fractions.
M. Tanska et al. / Food Research International 38 (2005) 741–750 747
green and blue colors on the seed surfaces was similarfor all fractions, varying between 48 and 49, and be-tween 10 and 11, respectively (Table 3).
Seed surface color determined in the CIEL*a*b* sys-tem was more differentiated. Relatively low differenceswere found for lightness (L*), which ranged from49.12 in the largest seeds to 50.24 in the smallest ones(Table 3). This probably resulted from pigment changesin the seed coat. Seed coat pigment in the brown-seededline of Brassica consisting of proanthocyanidins (con-densed tannins). The normally colorless proanthocyani-dins undergo secondary changes during seed maturationto form oxidized complexes with the cell wall, polysac-charides and other phenolics in the seed coat, causingit to darken (Beninger & Hosfield, 1999; Marles, Gru-ber, Scoles, & Muir, 2003). The mean value of a* attri-bute was negative in all cases, indicating the presence ofgreen color. Its values were significantly different forseeds from particular fractions, varying between �6.30for smallest seeds (fraction III) and �10.15 for the larg-est ones (fraction I). The variation range for a* suggeststhat red component were also present in all fractions.The highest values of this color were observed for thesmallest seeds, for which total variation of a* was thehighest �82.76%. The b* attribute showed positive val-ues in all cases, with the highest degree of yellow satura-tion in the smallest seeds �b* = 36.53 (Table 3). It seemsthat variation of a* and b* values are connected with thecontents of chlorophyll and carotenoid pigments inrapeseeds. A visual inspection of the color of seed inte-rior showed absence of immature seeds in rapeseed mass(Table 1). However, seeds of different maturity that ap-pear to have the same color to the human eye can con-tain different amounts of chlorophyll (Jalink, Schoor,Frandas, & Pijlen, 1998). A comparison between chloro-phyll pigment concentration in rapeseeds from particu-lar fractions (Table 1) and a* value of seed surfacecolor (Table 3) shows that an increase in the green hueis accompanied by a decrease in chlorophyll pigmentconcentration. On the other hand, the higher carotenoidpigment concentration in oil extracted from rapeseeds offraction III (Table 1) has been linked to the higher valueof the b* attribute determined for this fraction (Table 3).Despite this controversy, studies on the correlation be-tween chemical composition and color of seeds shouldbe continued. May be the concentrations of chlorophylland carotenoid pigments are correlated with the color ofseed interior or cotyledons after dehulling?
The HSI system, applied to color surface analysis,made it possible to distinguish small seeds from mediumand large seeds only (Table 3). The small seeds werecharacterized by significantly higher mean values ofthe S and I attributes, and a significantly lower mean va-lue of the H attribute.
Reassuming this point it may be stated that in partic-ular rapeseed fractions the most differentiated color
attributes were: R (RGB), a* (CIEL*a*b*) and H(HSI). Fig. 3 presents the curves for a normal distribu-tion of their values. It shows that these curves are char-acterized by slightly different distributions for thesmallest seeds. Our previous research (Rotkiewiczet al., 2002; Tanska & Rotkiewicz, 2003) demonstratedthat small seeds (screening through a 1.6 mm sieve)should be eliminated from rapeseed mass before furtherprocessing, because they contain relatively low amountsof oil and many compounds that make its refining diffi-cult. Efficient identification of such seeds can be proba-bly achieved by measurements of both their color anddimensions.
748 M. Tanska et al. / Food Research International 38 (2005) 741–750
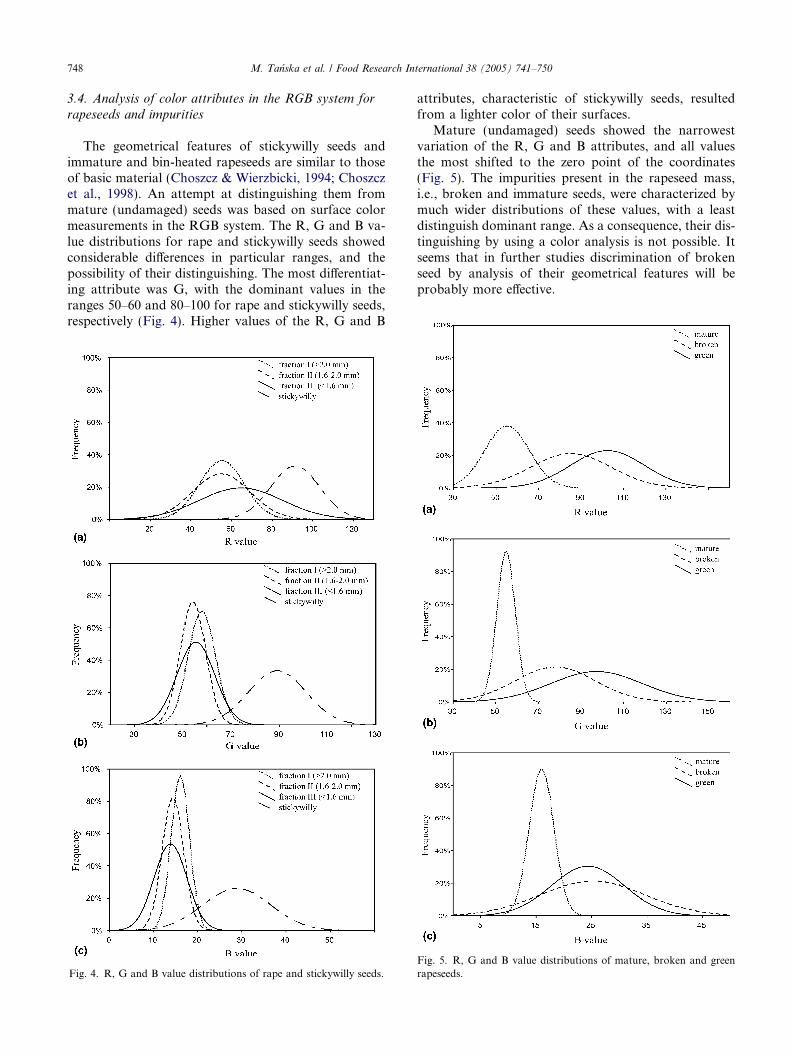
3.4. Analysis of color attributes in the RGB system for
rapeseeds and impurities
The geometrical features of stickywilly seeds andimmature and bin-heated rapeseeds are similar to thoseof basic material (Choszcz & Wierzbicki, 1994; Choszczet al., 1998). An attempt at distinguishing them frommature (undamaged) seeds was based on surface colormeasurements in the RGB system. The R, G and B va-lue distributions for rape and stickywilly seeds showedconsiderable differences in particular ranges, and thepossibility of their distinguishing. The most differentiat-ing attribute was G, with the dominant values in theranges 50–60 and 80–100 for rape and stickywilly seeds,respectively (Fig. 4). Higher values of the R, G and B
Fig. 4. R, G and B value distributions of rape and stickywilly seeds.
attributes, characteristic of stickywilly seeds, resultedfrom a lighter color of their surfaces.
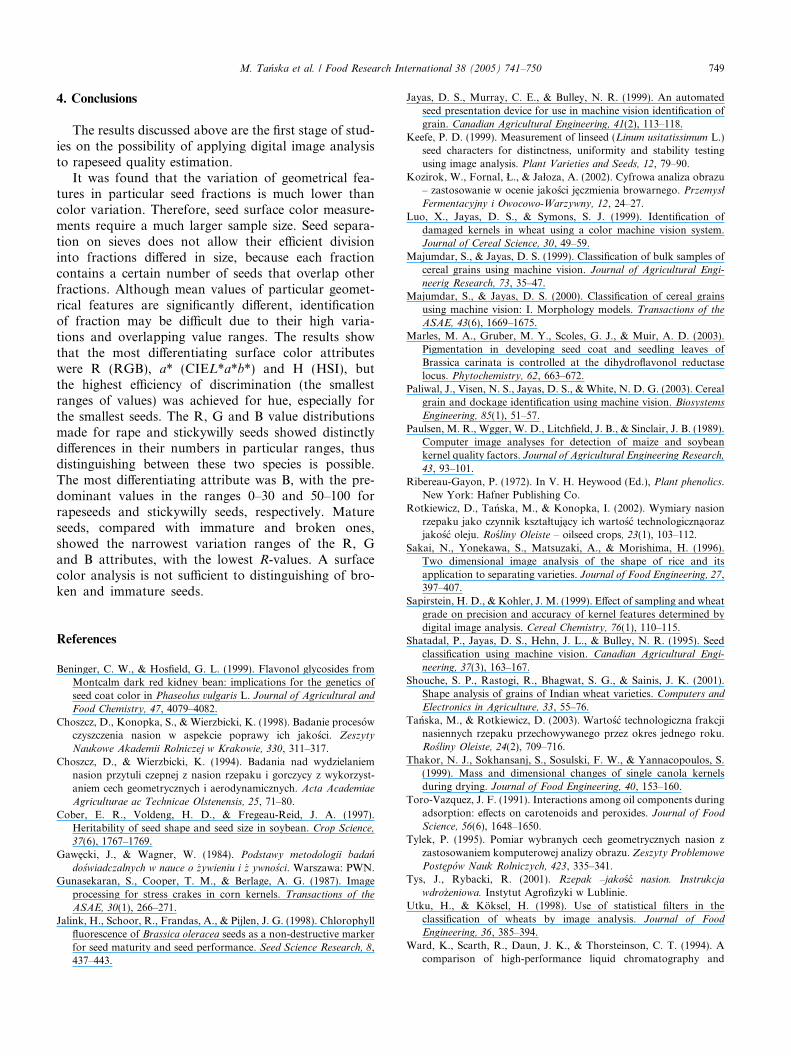
Mature (undamaged) seeds showed the narrowestvariation of the R, G and B attributes, and all valuesthe most shifted to the zero point of the coordinates(Fig. 5). The impurities present in the rapeseed mass,i.e., broken and immature seeds, were characterized bymuch wider distributions of these values, with a leastdistinguish dominant range. As a consequence, their dis-tinguishing by using a color analysis is not possible. Itseems that in further studies discrimination of brokenseed by analysis of their geometrical features will beprobably more effective.
Fig. 5. R, G and B value distributions of mature, broken and greenrapeseeds.
M. Tanska et al. / Food Research International 38 (2005) 741–750 749
4. Conclusions
The results discussed above are the first stage of stud-ies on the possibility of applying digital image analysisto rapeseed quality estimation.
It was found that the variation of geometrical fea-tures in particular seed fractions is much lower thancolor variation. Therefore, seed surface color measure-ments require a much larger sample size. Seed separa-tion on sieves does not allow their efficient divisioninto fractions differed in size, because each fractioncontains a certain number of seeds that overlap otherfractions. Although mean values of particular geomet-rical features are significantly different, identificationof fraction may be difficult due to their high varia-tions and overlapping value ranges. The results showthat the most differentiating surface color attributeswere R (RGB), a* (CIEL*a*b*) and H (HSI), butthe highest efficiency of discrimination (the smallestranges of values) was achieved for hue, especially forthe smallest seeds. The R, G and B value distributionsmade for rape and stickywilly seeds showed distinctlydifferences in their numbers in particular ranges, thusdistinguishing between these two species is possible.The most differentiating attribute was B, with the pre-dominant values in the ranges 0–30 and 50–100 forrapeseeds and stickywilly seeds, respectively. Matureseeds, compared with immature and broken ones,showed the narrowest variation ranges of the R, Gand B attributes, with the lowest R-values. A surfacecolor analysis is not sufficient to distinguishing of bro-ken and immature seeds.
References
Beninger, C. W., & Hosfield, G. L. (1999). Flavonol glycosides fromMontcalm dark red kidney bean: implications for the genetics ofseed coat color in Phaseolus vulgaris L. Journal of Agricultural andFood Chemistry, 47, 4079–4082.
Choszcz, D., Konopka, S., & Wierzbicki, K. (1998). Badanie procesowczyszczenia nasion w aspekcie poprawy ich jakosci. Zeszyty
Naukowe Akademii Rolniczej w Krakowie, 330, 311–317.Choszcz, D., & Wierzbicki, K. (1994). Badania nad wydzielaniem
nasion przytuli czepnej z nasion rzepaku i gorczycy z wykorzyst-aniem cech geometrycznych i aerodynamicznych. Acta Academiae
Agriculturae ac Technicae Olstenensis, 25, 71–80.Cober, E. R., Voldeng, H. D., & Fregeau-Reid, J. A. (1997).
Heritability of seed shape and seed size in soybean. Crop Science,
37(6), 1767–1769.Gawe�cki, J., & Wagner, W. (1984). Podstawy metodologii badan
doswiadczalnych w nauce o _zywieniu i _z ywnosci. Warszawa: PWN.Gunasekaran, S., Cooper, T. M., & Berlage, A. G. (1987). Image
processing for stress crakes in corn kernels. Transactions of the
ASAE, 30(1), 266–271.Jalink, H., Schoor, R., Frandas, A., & Pijlen, J. G. (1998). Chlorophyll
fluorescence of Brassica oleracea seeds as a non-destructive markerfor seed maturity and seed performance. Seed Science Research, 8,437–443.
Jayas, D. S., Murray, C. E., & Bulley, N. R. (1999). An automatedseed presentation device for use in machine vision identification ofgrain. Canadian Agricultural Engineering, 41(2), 113–118.
Keefe, P. D. (1999). Measurement of linseed (Linum usitatissimum L.)seed characters for distinctness, uniformity and stability testingusing image analysis. Plant Varieties and Seeds, 12, 79–90.
Kozirok, W., Fornal, Ł., & Jałoza, A. (2002). Cyfrowa analiza obrazu– zastosowanie w ocenie jakosci je�czmienia browarnego. Przemysł
Fermentacyjny i Owocowo-Warzywny, 12, 24–27.Luo, X., Jayas, D. S., & Symons, S. J. (1999). Identification of
damaged kernels in wheat using a color machine vision system.Journal of Cereal Science, 30, 49–59.
Majumdar, S., & Jayas, D. S. (1999). Classification of bulk samples ofcereal grains using machine vision. Journal of Agricultural Engi-
neerig Research, 73, 35–47.Majumdar, S., & Jayas, D. S. (2000). Classification of cereal grains
using machine vision: I. Morphology models. Transactions of the
ASAE, 43(6), 1669–1675.Marles, M. A., Gruber, M. Y., Scoles, G. J., & Muir, A. D. (2003).
Pigmentation in developing seed coat and seedling leaves ofBrassica carinata is controlled at the dihydroflavonol reductaselocus. Phytochemistry, 62, 663–672.
Paliwal, J., Visen, N. S., Jayas, D. S., & White, N. D. G. (2003). Cerealgrain and dockage identification using machine vision. Biosystems
Engineering, 85(1), 51–57.Paulsen, M. R., Wgger, W. D., Litchfield, J. B., & Sinclair, J. B. (1989).
Computer image analyses for detection of maize and soybeankernel quality factors. Journal of Agricultural Engineering Research,43, 93–101.
Ribereau-Gayon, P. (1972). In V. H. Heywood (Ed.), Plant phenolics.New York: Hafner Publishing Co.
Rotkiewicz, D., Tanska, M., & Konopka, I. (2002). Wymiary nasionrzepaku jako czynnik kształtujacy ich wartosc technologicznaorazjakosc oleju. Rosliny Oleiste – oilseed crops, 23(1), 103–112.
Sakai, N., Yonekawa, S., Matsuzaki, A., & Morishima, H. (1996).Two dimensional image analysis of the shape of rice and itsapplication to separating varieties. Journal of Food Engineering, 27,397–407.
Sapirstein, H. D., & Kohler, J. M. (1999). Effect of sampling and wheatgrade on precision and accuracy of kernel features determined bydigital image analysis. Cereal Chemistry, 76(1), 110–115.
Shatadal, P., Jayas, D. S., Hehn, J. L., & Bulley, N. R. (1995). Seedclassification using machine vision. Canadian Agricultural Engi-
neering, 37(3), 163–167.Shouche, S. P., Rastogi, R., Bhagwat, S. G., & Sainis, J. K. (2001).
Shape analysis of grains of Indian wheat varieties. Computers and
Electronics in Agriculture, 33, 55–76.Tanska, M., & Rotkiewicz, D. (2003). Wartosc technologiczna frakcji
nasiennych rzepaku przechowywanego przez okres jednego roku.Rosliny Oleiste, 24(2), 709–716.
Thakor, N. J., Sokhansanj, S., Sosulski, F. W., & Yannacopoulos, S.(1999). Mass and dimensional changes of single canola kernelsduring drying. Journal of Food Engineering, 40, 153–160.
Toro-Vazquez, J. F. (1991). Interactions among oil components duringadsorption: effects on carotenoids and peroxides. Journal of FoodScience, 56(6), 1648–1650.
Tylek, P. (1995). Pomiar wybranych cech geometrycznych nasion zzastosowaniem komputerowej analizy obrazu. Zeszyty Problemowe
Poste�pow Nauk Rolniczych, 423, 335–341.Tys, J., Rybacki, R. (2001). Rzepak –jakosc nasion. Instrukcja
wdro_zeniowa. Instytut Agrofizyki w Lublinie.Utku, H., & Koksel, H. (1998). Use of statistical filters in the
classification of wheats by image analysis. Journal of Food
Engineering, 36, 385–394.Ward, K., Scarth, R., Daun, J. K., & Thorsteinson, C. T. (1994). A
comparison of high-performance liquid chromatography and

750 M. Tanska et al. / Food Research International 38 (2005) 741–750
spectrophotometry to measure chlorophyll in canola seed and oil.Journal of the American Oil Chemist�s Society, 71(9), 931–934.
Wiwart, M. (2000). Komputerowa analiza obrazu ziarna pszen_zytapochodzacego z kłosow infekowanych przez Fusarium culmorum
(W.G. Smith) (Sacc). Folia Universitatis Agriculturae Stetinensis.
Agricultura, 82, 325–330.
Zayas, I., Converse, H., & Steele, J. (1990). Discrimination of wholefrom broken corn kernels with image analysis. Transactions of theASAE, 33(5), 1642–1646.
Zayas, I., Pomeranz, Y., & Lai, F. S. (1989). Discrimination of wheatand nonwheat components in grain samples by image analysis.Cereal Chemistry, 66(3), 233–237.