DETERMINATION OF ISOORIENTIN IN ASPHODELUS ...
73
T.R.N.C. NEAR EAST UNIVERSITY INSTITUTE OF HEALTH SCIENCES DETERMINATION OF ISOORIENTIN IN ASPHODELUS RAMOSUS L. BY HIGH-PERFORMANCE LIQUID CHROMATOGRAPHY MANASSEH TACHIA BWANKWOT ANALYTICAL CHEMISTRY MASTER OF SCIENCE THESIS NICOSIA 2017
-
Upload
khangminh22 -
Category
Documents
-
view
1 -
download
0
Transcript of DETERMINATION OF ISOORIENTIN IN ASPHODELUS ...
i
T.R.N.C.
NEAR EAST UNIVERSITY
INSTITUTE OF HEALTH SCIENCES
DETERMINATION OF ISOORIENTIN IN ASPHODELUS
RAMOSUS L. BY HIGH-PERFORMANCE LIQUID
CHROMATOGRAPHY
MANASSEH TACHIA BWANKWOT
ANALYTICAL CHEMISTRY
MASTER OF SCIENCE THESIS
NICOSIA
2017
ii
T.R.N.C.
NEAR EAST UNIVERSITY
INSTITUTE OF HEALTH SCIENCES
DETERMINATION OF ISOORIENTIN IN ASPHODELUS
RAMOSUS L. BY HIGH-PERFORMANCE LIQUID
CHROMATOGRAPHY
MANASSEH TACHIA BWANKWOT
ANALYTICAL CHEMISTRY
MASTER OF SCIENCE THESIS
SUPERVISOR
ASSIST. PROF. DR. USAMA ALSHANA
CO-SUPERVISOR
PROF. DR. İHSAN ÇALIŞ
NICOSIA
2017

iii
APPROVAL
Insert Approval Page here
iv
DECLARATION
I hereby declare that all information in this document has been obtained and
presented in accordance with academic rules and ethical conduct. I also declare that,
as required by these rules and conduct, I have fully cited and referenced all material
and results that are not original to this work.
Name, Last Name : MANASSEH TACHIA BWANKWOT
Signature :
Date : 05 June 2017
v
ACKNOWLEDGEMENTS
My heart-felt and honest gratitude to my supervisor Assist Prof. Dr. Usama
Alshana, who worked tirelessly and gave all he could to make this study possible.
You are not only a teacher, but also a father, a mentor, friendly and humble, I am
humbled by you sir.
To my co-supervisor, the Dean of the Faculty of Pharmacy at Near East
University Prof. Dr. İhsan Çalış, who despite his tight schedule made himself
available and provided us with the standards used for the success of this study. I
admire your humility, resourcefulness and integrity, and I take this opportunity to say
thank you.
My appreciation also goes to Azmi Hanoğlu, who made himself available
through all the help he gave and assisted me in getting the samples from the field as
well as providing tangible advices. I will not forget to appreciate Assoc. Prof. Dr.
Hayati Çelik for mentorship and providing information.
To my colleague and friend Jude Caleb, who worked alongside with me in
the laboratory, my honest gratitude.
I appreciate you Mum, and also my siblings; Ben, Grace, JB, Bob, and Fati,
for your enormous support and prayers. To my friends; housemates and the post-
graduate students in Analytical Chemistry, Near East University, I appreciate your
help and support.
This research was possible because of the financial support from Kaduna
State Government; I want to use this platform to show my immense gratitude.
Permit me again to thank Assist. Prof. Dr. Usama Alshana, I do not know
how to express my gratitude for his intense impartation upon my life, I am grateful
and honored.

vi
DEDICATION
To my father, Lord Jesus and my dear mum Hannatu Bwankwot
vii
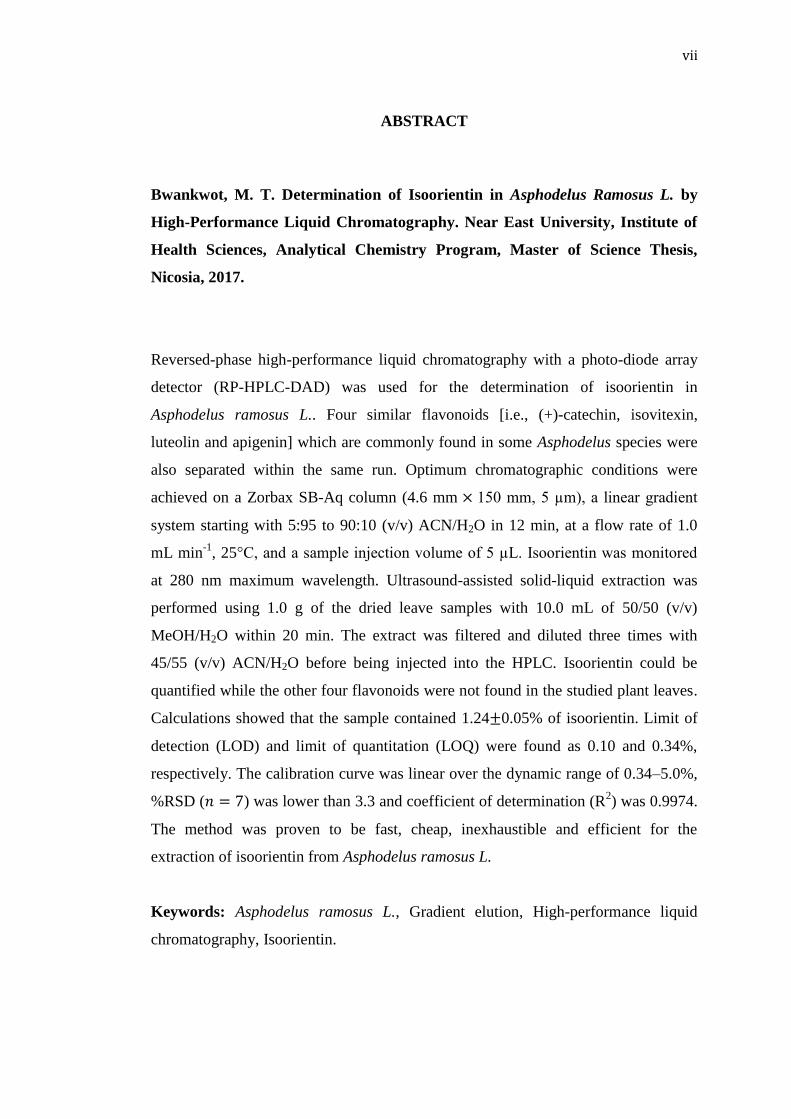
ABSTRACT
Bwankwot, M. T. Determination of Isoorientin in Asphodelus Ramosus L. by
High-Performance Liquid Chromatography. Near East University, Institute of
Health Sciences, Analytical Chemistry Program, Master of Science Thesis,
Nicosia, 2017.
Reversed-phase high-performance liquid chromatography with a photo-diode array
detector (RP-HPLC-DAD) was used for the determination of isoorientin in
Asphodelus ramosus L.. Four similar flavonoids [i.e., (+)-catechin, isovitexin,
luteolin and apigenin] which are commonly found in some Asphodelus species were
also separated within the same run. Optimum chromatographic conditions were
achieved on a Zorbax SB-Aq column (4.6 mm 150 mm, 5 µm), a linear gradient
system starting with 5:95 to 90:10 (v/v) ACN/H2O in 12 min, at a flow rate of 1.0
mL min-1
, 25°C, and a sample injection volume of 5 µL. Isoorientin was monitored
at 280 nm maximum wavelength. Ultrasound-assisted solid-liquid extraction was
performed using 1.0 g of the dried leave samples with 10.0 mL of 50/50 (v/v)
MeOH/H2O within 20 min. The extract was filtered and diluted three times with
45/55 (v/v) ACN/H2O before being injected into the HPLC. Isoorientin could be
quantified while the other four flavonoids were not found in the studied plant leaves.
Calculations showed that the sample contained 1.24 0.05% of isoorientin. Limit of
detection (LOD) and limit of quantitation (LOQ) were found as 0.10 and 0.34%,
respectively. The calibration curve was linear over the dynamic range of 0.34–5.0%,
%RSD ( ) was lower than 3.3 and coefficient of determination (R2) was 0.9974.
The method was proven to be fast, cheap, inexhaustible and efficient for the
extraction of isoorientin from Asphodelus ramosus L.
Keywords: Asphodelus ramosus L., Gradient elution, High-performance liquid
chromatography, Isoorientin.
viii
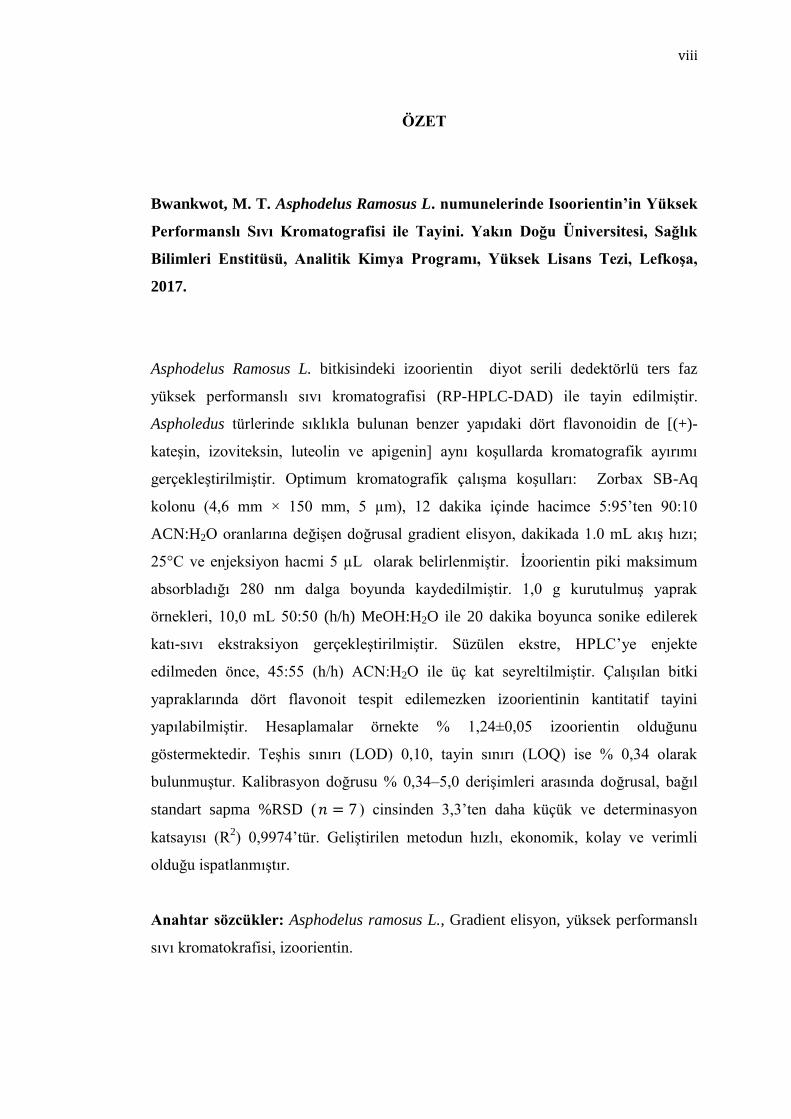
ÖZET
Bwankwot, M. T. Asphodelus Ramosus L. numunelerinde Isoorientin’in Yüksek
Performanslı Sıvı Kromatografisi ile Tayini. Yakın Doğu Üniversitesi, Sağlık
Bilimleri Enstitüsü, Analitik Kimya Programı, Yüksek Lisans Tezi, Lefkoşa,
2017.
Asphodelus Ramosus L. bitkisindeki izoorientin diyot serili dedektörlü ters faz
yüksek performanslı sıvı kromatografisi (RP-HPLC-DAD) ile tayin edilmiştir.
Aspholedus türlerinde sıklıkla bulunan benzer yapıdaki dört flavonoidin de [(+)-
kateşin, izoviteksin, luteolin ve apigenin] aynı koşullarda kromatografik ayırımı
gerçekleştirilmiştir. Optimum kromatografik çalışma koşulları: Zorbax SB-Aq
kolonu (4,6 mm × 150 mm, 5 µm), 12 dakika içinde hacimce 5:95’ten 90:10
ACN:H2O oranlarına değişen doğrusal gradient elisyon, dakikada 1.0 mL akış hızı;
25°C ve enjeksiyon hacmi 5 µL olarak belirlenmiştir. İzoorientin piki maksimum
absorbladığı 280 nm dalga boyunda kaydedilmiştir. 1,0 g kurutulmuş yaprak
örnekleri, 10,0 mL 50:50 (h/h) MeOH:H2O ile 20 dakika boyunca sonike edilerek
katı-sıvı ekstraksiyon gerçekleştirilmiştir. Süzülen ekstre, HPLC’ye enjekte
edilmeden önce, 45:55 (h/h) ACN:H2O ile üç kat seyreltilmiştir. Çalışılan bitki
yapraklarında dört flavonoit tespit edilemezken izoorientinin kantitatif tayini
yapılabilmiştir. Hesaplamalar örnekte % 1,24±0,05 izoorientin olduğunu
göstermektedir. Teşhis sınırı (LOD) 0,10, tayin sınırı (LOQ) ise % 0,34 olarak
bulunmuştur. Kalibrasyon doğrusu % 0,34–5,0 derişimleri arasında doğrusal, bağıl
standart sapma %RSD ( ) cinsinden 3,3’ten daha küçük ve determinasyon
katsayısı (R2) 0,9974’tür. Geliştirilen metodun hızlı, ekonomik, kolay ve verimli
olduğu ispatlanmıştır.
Anahtar sözcükler: Asphodelus ramosus L., Gradient elisyon, yüksek performanslı
sıvı kromatokrafisi, izoorientin.
ix
TABLE OF CONTENTS
APPROVAL ................................................................................................................ iii
DECLARATION ........................................................................................................ iv
ACKNOWLEDGEMENTS ......................................................................................... v
DEDICATION ............................................................................................................ vi
ABSTRACT ............................................................................................................... vii
ÖZET......................................................................................................................... viii
TABLE OF CONTENTS ............................................................................................ ix
LIST OF FIGURES ................................................................................................... xii
LIST OF TABLES .................................................................................................... xiii
LIST OF ABBREVIATIONS ................................................................................... xiv
1 CHAPTER 1: INTRODUCTION ........................................................................ 1
Phenolics ....................................................................................................... 1 1.1
Flavonoids ..................................................................................................... 2 1.2
1.2.1 Chemistry and Classification ................................................................. 2
1.2.2 Occurrence in Food ................................................................................ 3
1.2.3 Flavonols ................................................................................................ 3
1.2.4 Flavanones ............................................................................................. 3
1.2.5 (+)-Catechins .......................................................................................... 3
1.2.6 Flavones ................................................................................................. 4
1.2.7 Anthocyanidins ...................................................................................... 4
1.2.8 Isoflavonoids .......................................................................................... 4
1.2.9 Isoorientin .............................................................................................. 4
1.2.10 Isovitexin ................................................................................................ 5
1.2.11 Luteolin .................................................................................................. 5
x
1.2.12 Apigenin ................................................................................................. 6
1.2.13 (+)-Catechin ........................................................................................... 6
Asphodelus ramosus L. .................................................................................. 7 1.3
Sample Preparation and Characterization ..................................................... 8 1.4
1.4.1 Extraction ............................................................................................... 8
1.4.2 Analysis and Quantification of Phenolics ............................................ 11
1.4.3 Chromatography ................................................................................... 12
1.4.4 Liquid Chromatography ....................................................................... 12
1.4.5 High-Performance Liquid Chromatography (HPLC) .......................... 13
Modes of HPLC ........................................................................................... 14 1.5
Method Development in RP-HPLC ............................................................ 15 1.6
Components of HPLC System .................................................................... 17 1.7
1.7.1 Quaternary Pump ................................................................................. 17
1.7.2 Degasser ............................................................................................... 18
1.7.3 Autosampler ......................................................................................... 18
1.7.4 Thermostated Column Compartment ................................................... 19
1.7.5 Diode-Array Detector (DAD) .............................................................. 19
Benefits of This Study ................................................................................. 20 1.8
Objectives of This Work ............................................................................. 20 1.9
2 CHAPTERT 2: EXPERIMENTAL ................................................................... 21
Instrumentation ............................................................................................ 21 2.1
Reagents and Solutions ............................................................................... 21 2.2
Equipment ................................................................................................... 21 2.3
Sampling and Sample Pre-treatment ........................................................... 22 2.4
Preparation of Standards ............................................................................. 22 2.5
Procedure ..................................................................................................... 23 2.6
xi
3 CHAPTER 3: RESULTS AND DISCUSSION ................................................. 24
Systematic Method Development ............................................................... 24 3.1
3.1.1 Initial Chromatographic Conditions ..................................................... 26
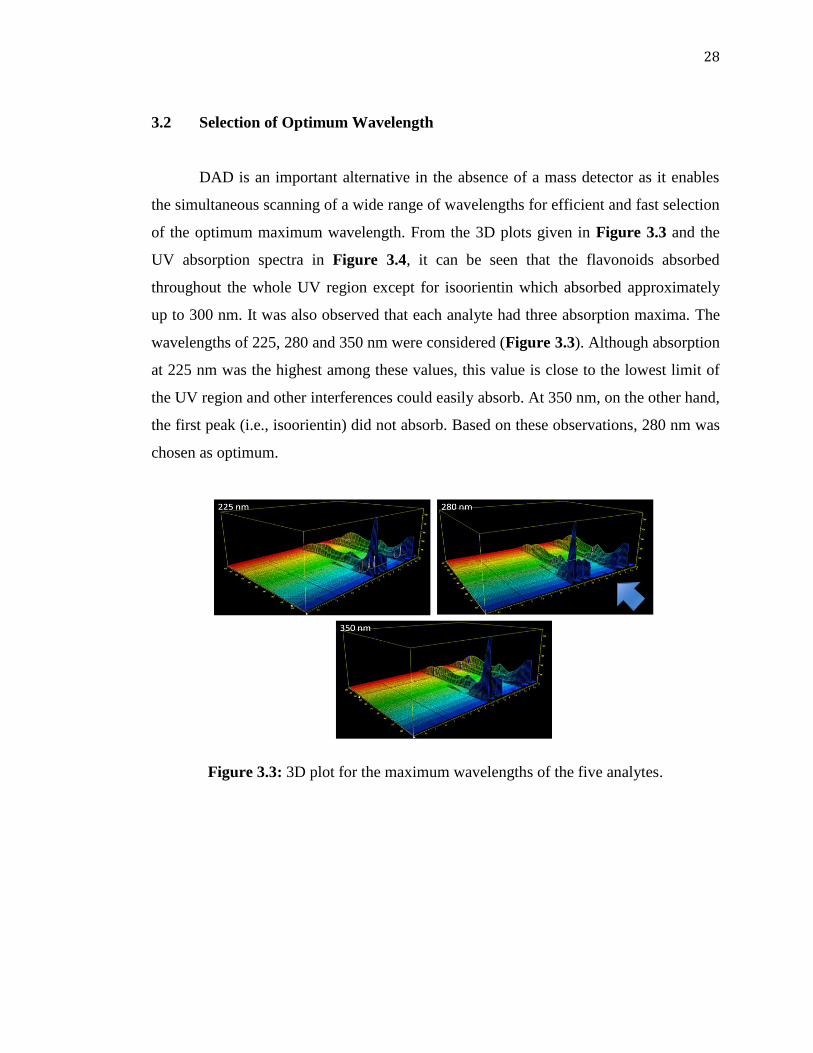
Selection of Optimum Wavelength ............................................................. 28 3.2
3.2.1 Peak Characterization........................................................................... 29
Optimization of HPLC Conditions .............................................................. 31 3.3
3.3.1 Is Isocratic Elution Possible? ............................................................... 31
3.3.2 Effect of Gradient Time ....................................................................... 32
3.3.3 Effect of Initial Mobile Phase Composition......................................... 33
3.3.4 Effect of Final Mobile Phase Composition .......................................... 35
3.3.5 Effect of Flow Rate .............................................................................. 36
Identification of Isoorientin in A. ramosus .................................................. 38 3.4
Analytical Performance and Figures of Merit ............................................. 39 3.5
3.5.1 External Aqueous Calibration Graph ................................................... 39
Quantification of Isoorientin in A. ramosus Leaves .................................... 41 3.6
4 CHAPTER 4: CONCLUSIONS AND RECOMMENDATIONS ..................... 43
REFERENCES ........................................................................................................... 44
APPENDICES ........................................................................................................... 54
xii
LIST OF FIGURES
Figure 1.1: Systematic HPLC method development. .......................................................... 16
Figure 3.1: Plot of microspecies distribution versus pH for isoorientin. ...................... 26
Figure 3.2: Chromatogram showing the separation of five standards; Peaks: 1, (+)-
catechin; 2, isoorientin, 3, isovitexin, 4, luteolin and 5, apigenin. .................................. 27
Figure 3.3: 3D plot for the maximum wavelengths of the five analytes. ...................... 28
Figure 3.4: Absorption spectra of the five analytes. ............................................................ 29
Figure 3.5: Chromatogram of five standards, matching each standard to its retention
time as compared with the mixture. Peaks: 1, (+)-catechin; 2, isoorientin, 3,
isovitexin, 4, luteolin and 5, apigenin. .................................................................................... 30
Figure 3.6: UV Spectra of the studied analytes. 1, (+)-catechin; 2, isoorientin, 3,
isovitexin, 4, luteolin and 5, apigenin. .................................................................................... 30
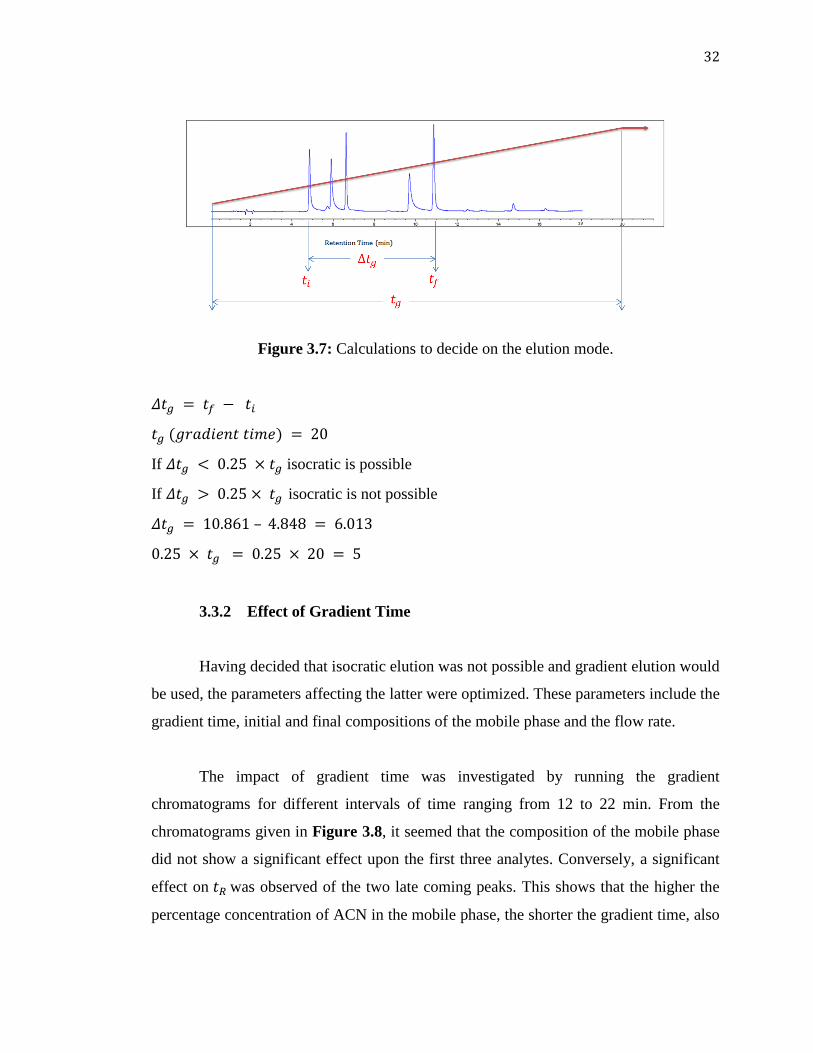
Figure 3.7: Calculations to decide on the elution mode. .................................................... 32
Figure 3.8: Chromatograms showing the effect of gradient time. ................................... 33
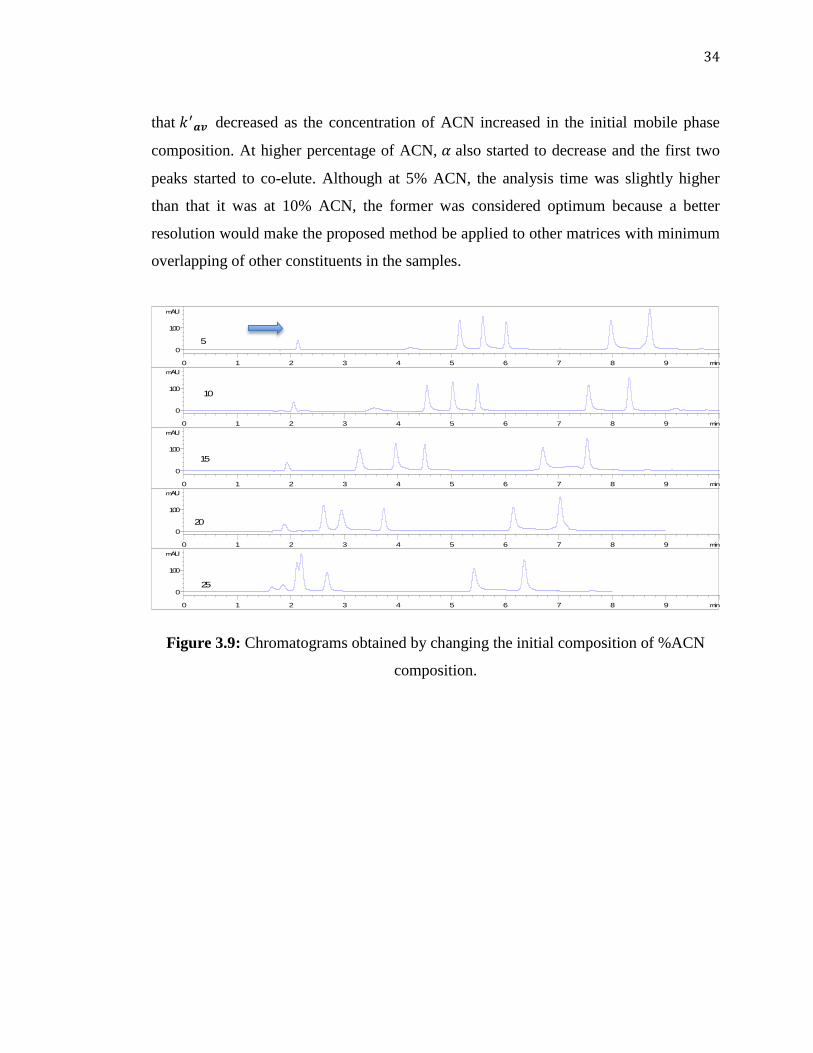
Figure 3.9: Chromatograms obtained by changing the initial composition of %ACN
composition. .................................................................................................................................... 34
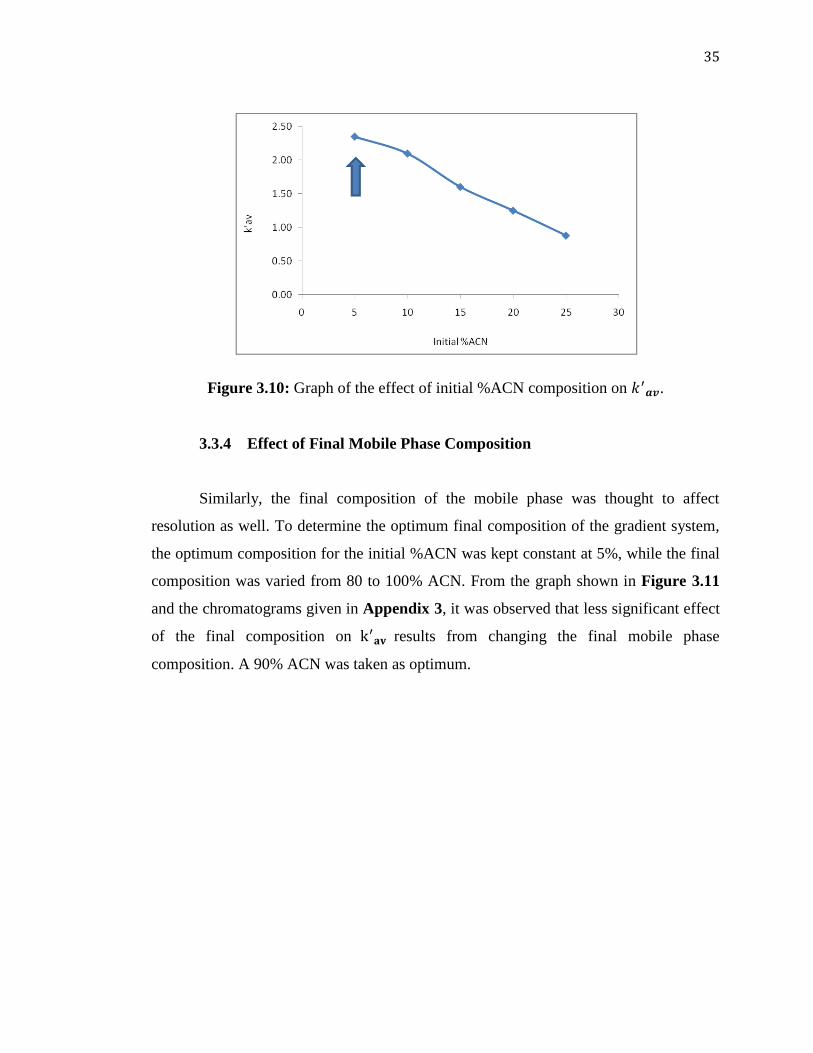
Figure 3.10: Graph of the effect of initial %ACN composition on . ..................... 35
Figure 3.11: A graph of the final composition of % ACN against . ...................... 36
Figure 3.12: Effect of flow rate on . ..................................................................................... 37
Figure 3.13: Effect of flow rate on back-pressure. .............................................................. 37
Figure 3.14: Effect of flow rate on analysis time. ................................................................ 38
Figure 3.15: A chromatogram of the real sample. ............................................................... 39
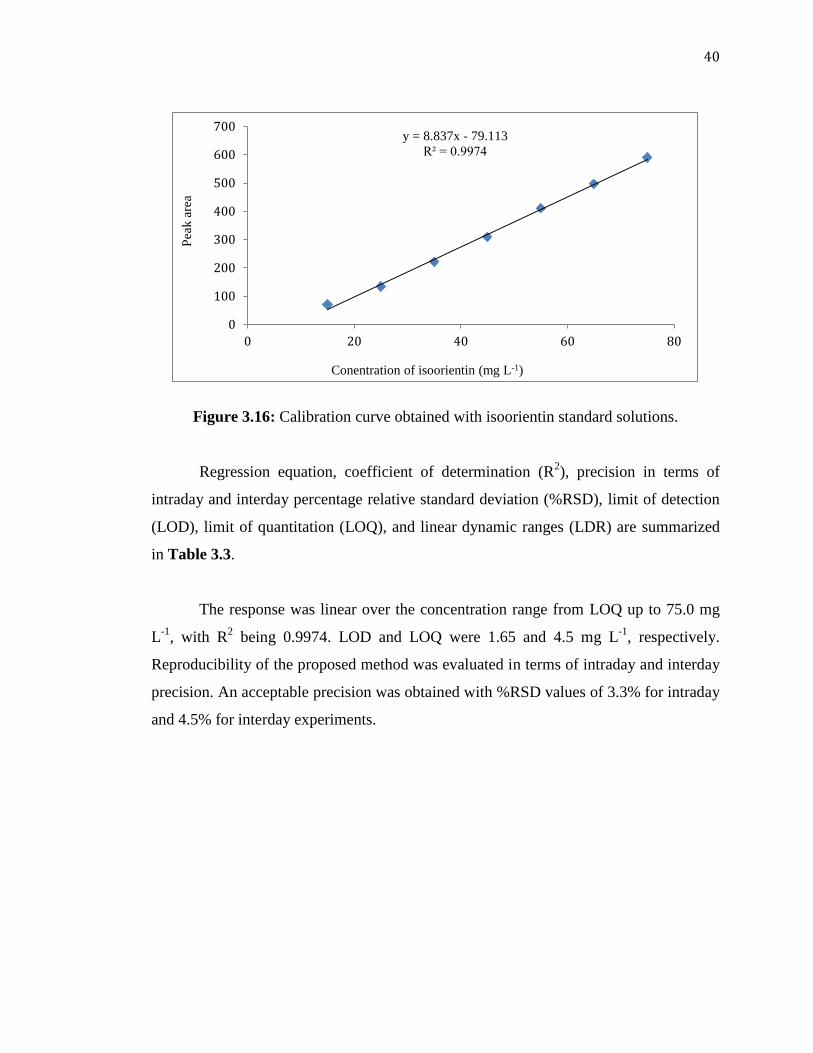
Figure 3.16: Calibration curve obtained with isoorientin standard solutions. ............. 40
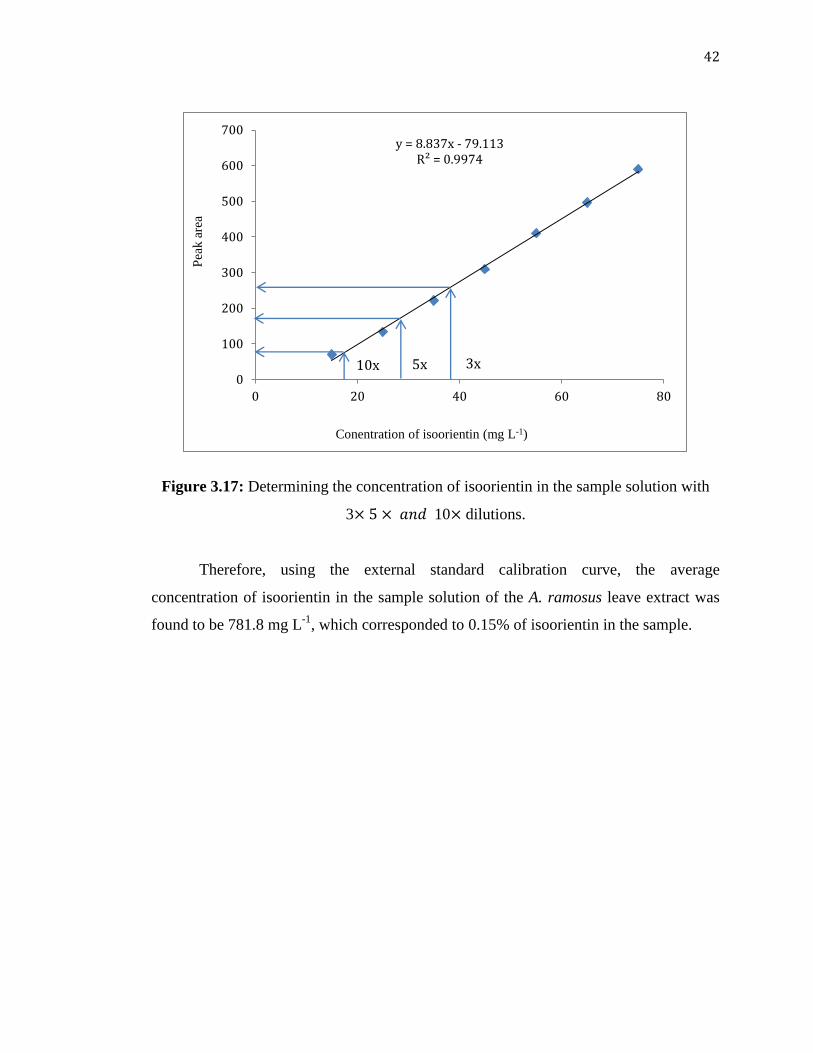
Figure 3.17: Determining the concentration of isoorientin in the sample solution with
3 10 dilutions. ....................................................................................................... 42
xiii
LIST OF TABLES
Table 1.1: Chemical structures of the studied analytes. ............................................... 8
Table 1.2. Important relationships in HPLC [79]. .................................................... 17
Table 3.1: Gradient elution program [83]. ................................................................. 26
Table 3.2: Initial HPLC Conditions. .......................................................................... 27
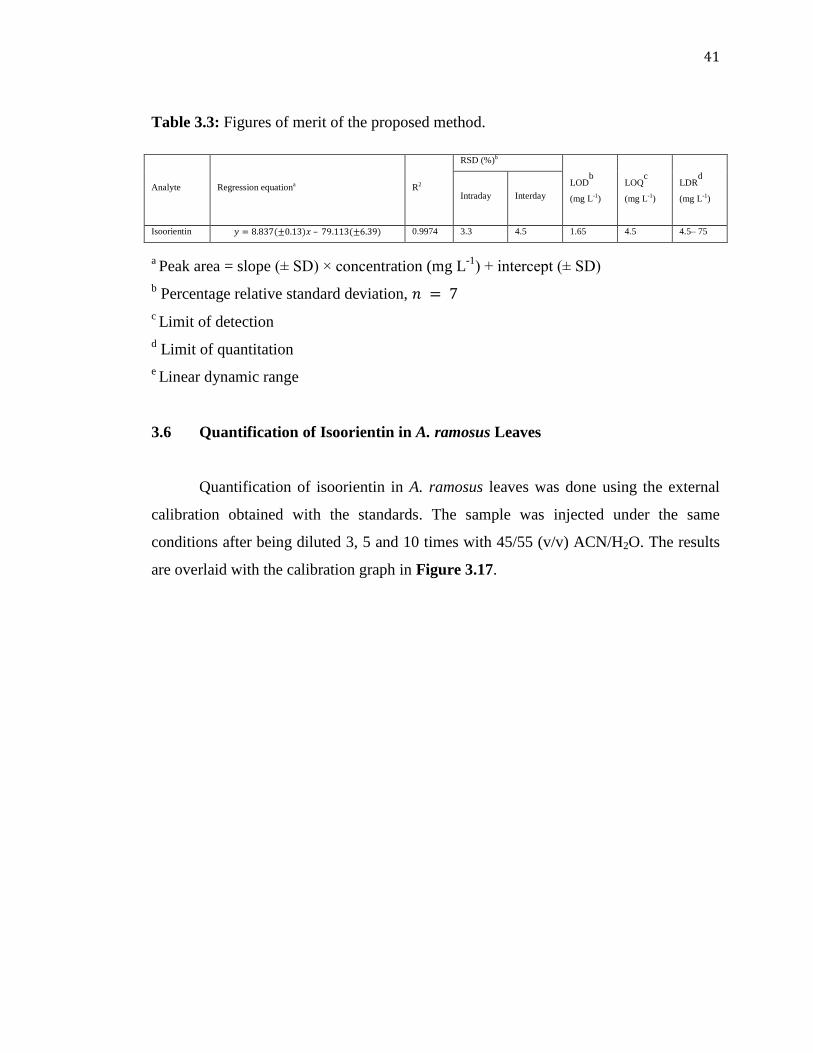
Table 3.3: Figures of merit of the proposed method. ................................................. 41
xiv
LIST OF ABBREVIATIONS
Abbreviation Definition
ACN Acetonitrile
ASE Accelerated solvent Extraction
CCC Counter current chromatography
CPC Centrifugal partition chromatography
DAD Diode-array detector
EGC Epigallo-catechin
EGCG Epigallocatechin-3-gallate
GC Gas chromatography
HPLC High performance liquid chromatography
LC Liquid chromatography
LDR Linear dynamic range
LOD Limit of detection
LOQ Limit of quantitation
MAE Microwave-assisted Extraction
MeOH Methanol
NEU Near East University
NMR Nuclear magnetic resonance
NP Normal phase
PFE Pressurized Fluid Extraction
PLE Pressurized liquid Extraction
Ppm Parts Per Million
PRC People Republic of China
RP Reversed phase
RP-HPLC Reversed-phase high-performance liquid chromatography
RSD Relative standard deviation
RT Room temperature
SB–Aq Stable bond – Aqueous
SFE Subcritical Fluid Extraction
xv
SPE Solid phase Extraction
SWE Subcritical water Extraction
SWNIR Short-wave near-infrared
TLC Thin-layer chromatography
TRNC Turkish Republic of Northern Cyprus
UAE Ultrasound-assisted Extraction
UV Ultraviolet
VIS Visible
1
1 CHAPTER 1: INTRODUCTION
CHAPTER 1
INTRODUCTION
Phenolics 1.1
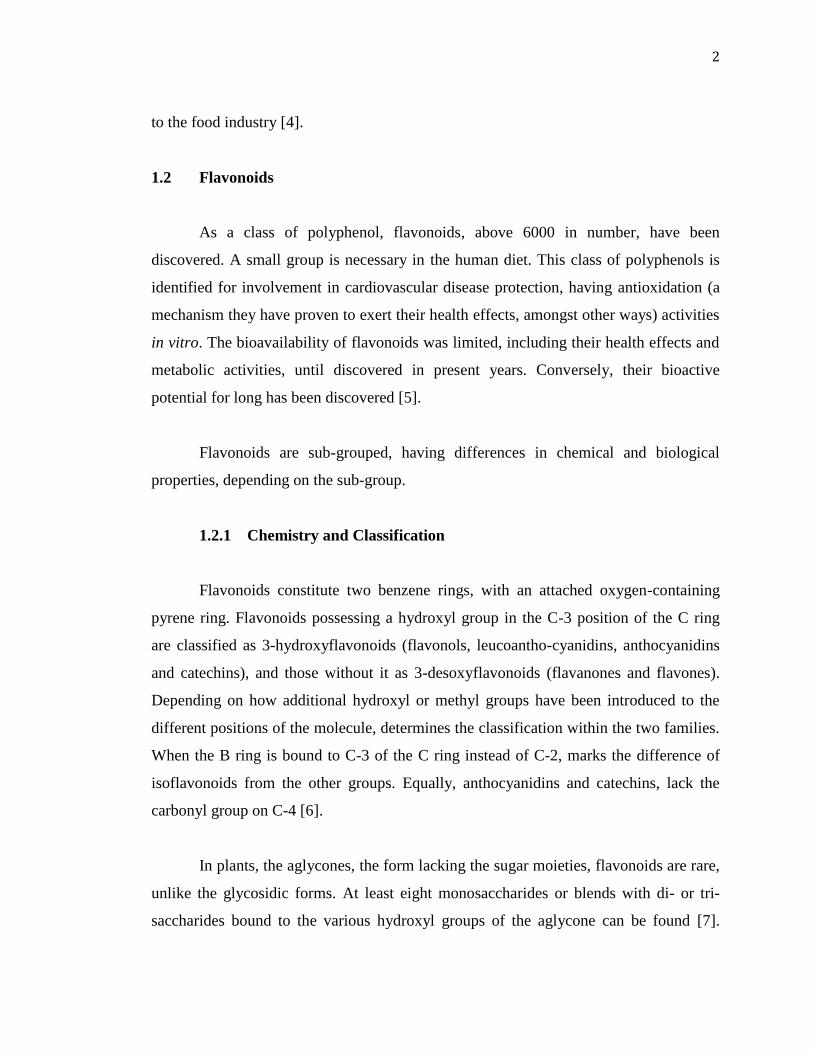
Phenolics are compounds possessing one or more aromatic rings with one or
more hydroxyl groups attached to these rings. A wide range of phenolic structures are
presently available, over 8000 spanning from light weight molecules to highly
polymerized ones like phenolic acids and tannins respectively. These classes of
substances are mostly used for inhibiting parasites, predators and shield against
ultraviolet radiation or belligerence by pathogens, also for manifesting the colors of
plants. These compounds are prevalent in fruits and vegetables, incorporated in human
diet [1].
Phenolic compounds are ubiquitous parts of plant foods like olive, chocolate,
vegetables, legumes, cereals, tea, and coffee, among others. They contribute to the
general organoleptic properties of foods. As a major compound found in coffee, caffeic
acid is mostly esterified with chlorogenic and quinic acids in many fruits and vegetables.
Ferulic acid esterified to hemicellulose located in the cell, is often found in cereals.
Phenolic compounds can be found free, although very commonly in free and/or bound
forms, their corresponding methyl and ethyl esters and glycosides occur. Phenolic acids
can be categorized as: derivatives of benzoic acid such as gallic acid, and derivatives of
cinnamic acid such as coumaric, ferulic and caffeic acid [2].
With their abilities to scavenge free radicals, donate hydrogen, chelate metals,
break radical chain reactions and react with singlet oxygen in vitro and in vivo, phenolic
compounds have strong antioxidant activities associated with these properties [3]. The
synthetic antioxidants have restricted use in food as they are suspected to be
carcinogenic. Therefore, natural antioxidant sources of plant origin are of great interest
2
to the food industry [4].
Flavonoids 1.2
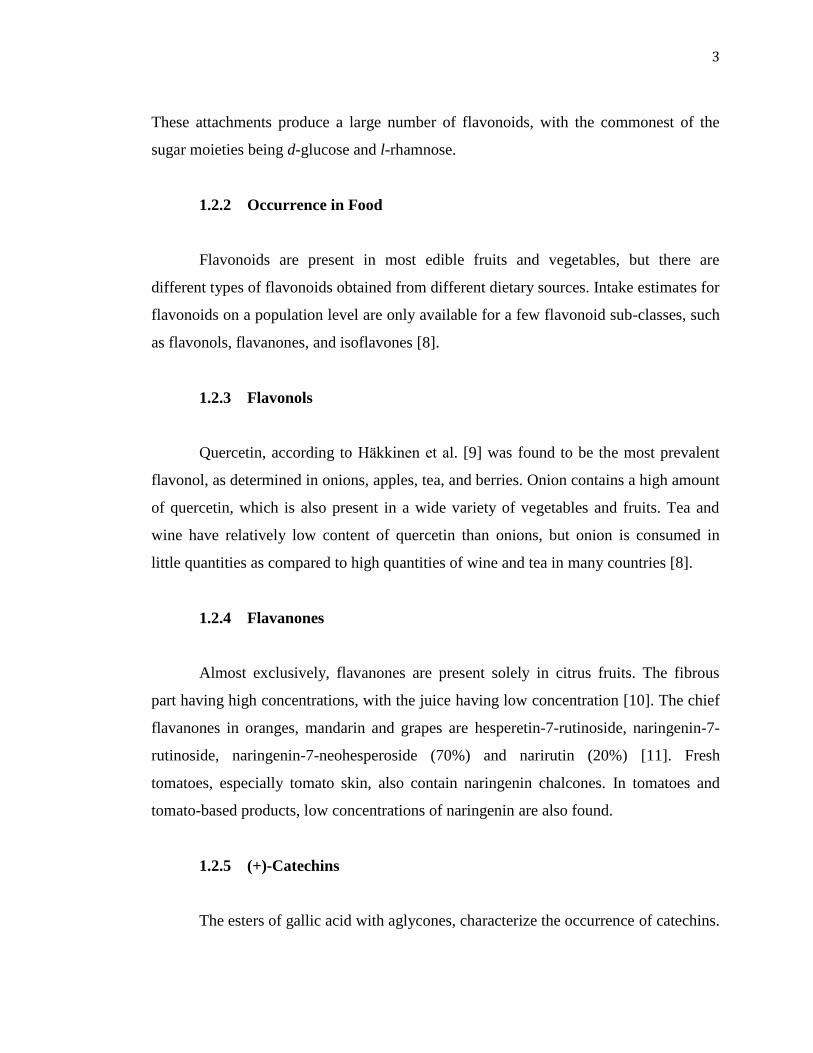
As a class of polyphenol, flavonoids, above 6000 in number, have been
discovered. A small group is necessary in the human diet. This class of polyphenols is
identified for involvement in cardiovascular disease protection, having antioxidation (a
mechanism they have proven to exert their health effects, amongst other ways) activities
in vitro. The bioavailability of flavonoids was limited, including their health effects and
metabolic activities, until discovered in present years. Conversely, their bioactive
potential for long has been discovered [5].
Flavonoids are sub-grouped, having differences in chemical and biological
properties, depending on the sub-group.
1.2.1 Chemistry and Classification
Flavonoids constitute two benzene rings, with an attached oxygen-containing
pyrene ring. Flavonoids possessing a hydroxyl group in the C-3 position of the C ring
are classified as 3-hydroxyflavonoids (flavonols, leucoantho-cyanidins, anthocyanidins
and catechins), and those without it as 3-desoxyflavonoids (flavanones and flavones).
Depending on how additional hydroxyl or methyl groups have been introduced to the
different positions of the molecule, determines the classification within the two families.
When the B ring is bound to C-3 of the C ring instead of C-2, marks the difference of
isoflavonoids from the other groups. Equally, anthocyanidins and catechins, lack the
carbonyl group on C-4 [6].
In plants, the aglycones, the form lacking the sugar moieties, flavonoids are rare,
unlike the glycosidic forms. At least eight monosaccharides or blends with di- or tri-
saccharides bound to the various hydroxyl groups of the aglycone can be found [7].
3
These attachments produce a large number of flavonoids, with the commonest of the
sugar moieties being d-glucose and l-rhamnose.
1.2.2 Occurrence in Food
Flavonoids are present in most edible fruits and vegetables, but there are
different types of flavonoids obtained from different dietary sources. Intake estimates for
flavonoids on a population level are only available for a few flavonoid sub-classes, such
as flavonols, flavanones, and isoflavones [8].
1.2.3 Flavonols
Quercetin, according to Häkkinen et al. [9] was found to be the most prevalent
flavonol, as determined in onions, apples, tea, and berries. Onion contains a high amount
of quercetin, which is also present in a wide variety of vegetables and fruits. Tea and
wine have relatively low content of quercetin than onions, but onion is consumed in
little quantities as compared to high quantities of wine and tea in many countries [8].
1.2.4 Flavanones
Almost exclusively, flavanones are present solely in citrus fruits. The fibrous
part having high concentrations, with the juice having low concentration [10]. The chief
flavanones in oranges, mandarin and grapes are hesperetin-7-rutinoside, naringenin-7-
rutinoside, naringenin-7-neohesperoside (70%) and narirutin (20%) [11]. Fresh
tomatoes, especially tomato skin, also contain naringenin chalcones. In tomatoes and
tomato-based products, low concentrations of naringenin are also found.
1.2.5 (+)-Catechins
The esters of gallic acid with aglycones, characterize the occurrence of catechins.
4
In a wide variety of plant foods, (+)-catechin and (+)-epicatechin are present in varying
concentrations specially higher in tea and red wine and also in fruits and vegetables,
such as apples, peaches, grapes and pears [12].
1.2.6 Flavones
Flavones, popularly known to be in high concentrations in the diet are apigenin
and luteolin. They are found most predominantly in red pepper and celery, with dietary
intake in low concentrations, having a little variety of plant foods which contain them
[8].
1.2.7 Anthocyanidins
The obvious red, violet or blue colors as exhibited by edible fruits such as apples
among other fruits, is due to the presence of anthocyanins (or anthocyanidin glycosides).
Malvidin, pelargonidin, cyanidin and delphinidin are commonly found anthocyanidins
[13].
1.2.8 Isoflavonoids
Soybean and soy products are the major sources of isoflavonoids, with genistein
and daidzein as the prevalent isoflavonoids in legumes. They are in relatively lower
concentrations in other food products and legumes, than in soybean and soy products
[14].
1.2.9 Isoorientin
Isoorientin a C-glycosylflavones (6-C-glucosyl luteolin) has a wide range of
activity profile, which has made it to attract attention within the scientific community in
drug discovery and development, and also in the development of new and potent
5
therapeutic agents. Its discovery was mostly from natural sources, which is paramount,
though there are recent methods to synthesize it in the laboratory [15]. In an in vivo
bioassay-guided fractionation study, isoorientin was isolated as the main active
component responsible for the control of blood sugar in Type II diabetes [16].
Isoorientin is a C-glucosylflavonoid, and the earlier investigations have revealed that
isoorientin also displayed in vivo and dose-dependent analgesic, anti-inflammatory,
antihyperlipidemic, antioxidant and hepatoprotective activities, in addition to its
hypoglycemic effects [17, 18].
1.2.10 Isovitexin
Isovitexin (6-C-glucosyl apigenin), which is an isomer of vitexin (8-C-glucosyl
apigenin) found alongside in plants like pigeon pea [19, 20] has antioxidant properties
[21]. It also possess anti-inflammatory [22], anti-bacteria [23], memory modulation [24],
and anti-pathogenic [25] properties. It has been reported that isovitexin has a measurable
interaction with the human serum albumin (which carries a wide variety of drugs in
blood plasma) [26], as also experimented on rats, which were administered some herbal
plants (i.e., santalum album L. leaves extract) [27]. There are few reports on the side
effects, metabolic process and tissue distribution of isovitexin in rats, when administered
as a single substance [28].
1.2.11 Luteolin
Luteolin (2-(3,4-Dihydroxyphenyl)-5,7-dihydroxy-4H-chromen-4-one), a
member of the flavonoid family, is found in many vegetables, fruits and herbs. It is
found at high concentrations in thyme, peppermint, parsley, celery, green pepper, perilla
leaves and chamomile tea [29]. It is well known that luteolin has antioxidant, anti-
inflammatory, anticancer, anti-allergic, antiplatelet and anti-ulcer properties [30].
Luteolin has also been reported to reduce the neurotoxicity induced by neurotoxic agents
in cell culture systems. In addition, it has been used for antiviral activities, cataract
6
prevention, and antithrombotic action [31].
1.2.12 Apigenin
Apigenin is a 4,5,7-trihydroxy flavone, belonging to a less toxic and non-
mutagenic flavones subclass of flavonoids. It is derived from Cosmos bipinnatus and
many other plants. It has a variety of pharmacological activities, including antioxidant
[32], anti-tumor [33], anti-inflammatory [34], ant-bacterial [35], and induced apoptosis
[36]. It has protective effect on radiation-induced chromosomal damage in the human
lymphocytes [37]. Apigenin is one of the very important secondary metabolites
produced by C. bipinnatus. In traditional herbal medicine, C. bipinnatus has been used
as a remedy for various diseases such as jaundice and intermittent fever [38]. Apigenin
was suggested as a useful anticancer candidate for chemotherapy and cancer prevention
[34]. In another study, anti-proliferative effects of apigenin on human breast cancer cell
lines have been demonstrated. It strongly inhibited tumor cell invasion in estrogen-
insensitive breast tumor cell line [35], reporting that apigenin inhibited the growth of
human cervical carcinoma HeLa cells through an apoptotic pathway.
1.2.13 (+)-Catechin
The main flavonoids present in green tea include catechins (flavan-3-ols). Green
tea also contains phenolic acids (such as gallic acid, caffeic acid, etc.) and flavonols
(such as quercetin and myricetin, etc.). The beneficial effects associated with green tea
have been attributed to its polyphenols, particularly catechins such as epigallocatechin-
3-gallate (EGCG) and epigallo-catechin (EGC or (+)-catechin), which are the first and
second major catechins that are in vivo strong antioxidants [39]. It has been shown that
green tea catechins enhance the liver functions [40], reduce body fat and decrease body
weight after long-term consumption (usually 12 weeks) [39]. Green tea catechins exhibit
high-level antioxidant activity, even more than vitamins C and D [41].
7
In view of these beneficial effects, the development of a simple, inexpensive and
rapid analytical method for the simultaneous separation and determination of such
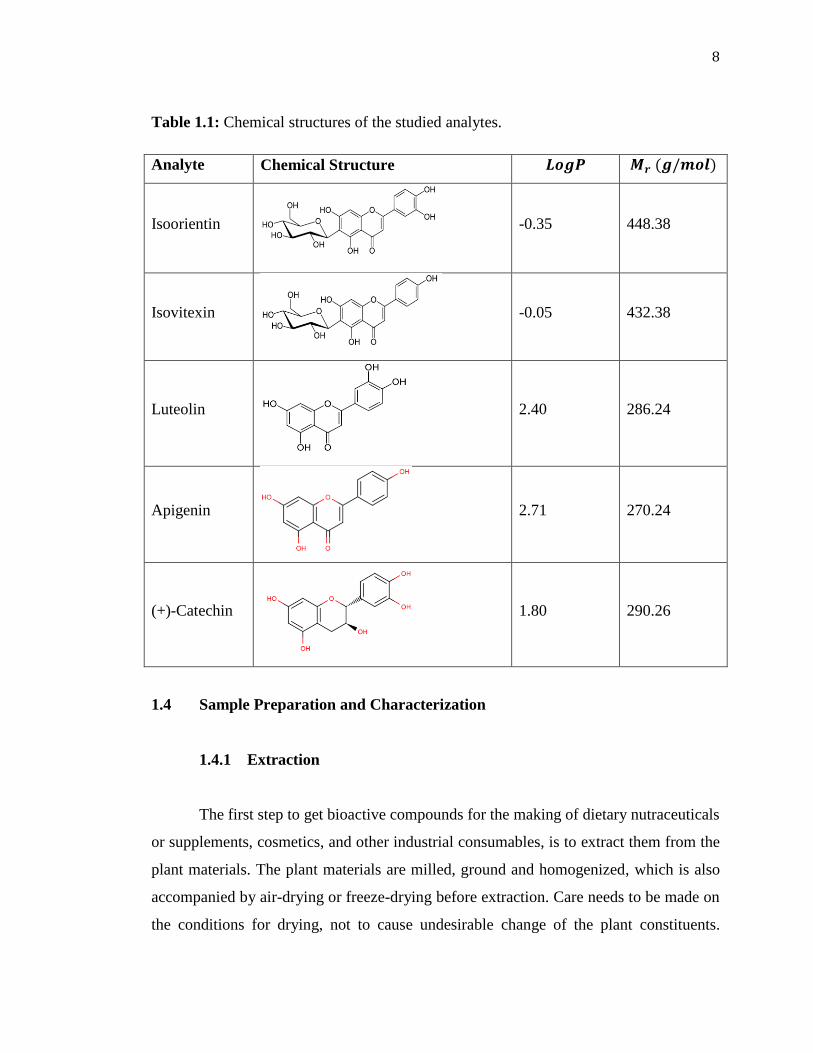
compounds in plant material sources is necessary. The chemical structures, and
values of the studied analytes, i.e., isoorientin, isovitexin, luteolin, apigenin and (+)-
catechin are given in Table 1.1.
Asphodelus ramosus L. 1.3
In this study, isoorientin and four other flavonoids (i.e., catechin isovitexin,
luteolin and apigenin) were simultaneously separated using HPLC and their presence in
Asphodelus ramosus (A. ramosus) was investigated. The genus Asphodelus comprises
187 genera and 2500 species. It is a circum-mediterranean genus, which includes five
sections and is represented by 16 species [42].
A. ramosus is a robust erect perennial plant which can be 1 m high or more. It is
rhizome compact, the clustered fleshy roots bearing large fusiform tubers, with strap-
shaped leaves; flat, slightly keeled, glabrous, and glaucous about 20–60 cm long (or
more), 1-3 cm wide (or more) [43]. In February till the end of March, A. ramosus
flowers during spring and cold times in the eastern Mediterranean. Its flowers open
upwardly, characterizing the ephemeral of A. ramosus [44].
To the best of our knowledge, scarce data is still available on the determination
of flavonoids in Asphodelus ramosus using HPLC.
8
Table 1.1: Chemical structures of the studied analytes.
Analyte Chemical Structure
Isoorientin
-0.35 448.38
Isovitexin
-0.05 432.38
Luteolin
2.40 286.24
Apigenin
2.71 270.24
(+)-Catechin
1.80 290.26
Sample Preparation and Characterization 1.4
1.4.1 Extraction
The first step to get bioactive compounds for the making of dietary nutraceuticals
or supplements, cosmetics, and other industrial consumables, is to extract them from the
plant materials. The plant materials are milled, ground and homogenized, which is also
accompanied by air-drying or freeze-drying before extraction. Care needs to be made on
the conditions for drying, not to cause undesirable change of the plant constituents.
9
Therefore, the physicochemical properties of the analytes must be considered [45].
A widely used method to prepare plant material extracts, which is efficient and
easy to perform, is solvent extraction, also known as solid-liquid extraction (SLE). The
polarities of different types of solvents are considered, extraction temperature, sample-
to-solvent quantities and extraction time. These parameters generally determine the yield
of the analyte obtained after extraction. The polarity of the solvents used, as well as the
physicochemical nature of the analyte such as its solubility in the given extraction
solvent determine how efficient its extraction is. Contained in different quantities are
phenolics varying from simple (e.g., phenolic acids, anthocyanins) to highly
polymerized substances (e.g., tannins) in plant materials. Some phenolics may be found
in their associated form with other components in the plant like carbohydrates and
proteins [46] which changes their polarities. In addition, phenolics and other non-
phenolic substances with similar polarities may be extracted with the same solvent.
Thus, SLE can be considered as a general non-specific method, which makes hydrolysis,
sample clean-up procedures and/or more specific extraction protocols necessary to
handle these situations in some case.
Popularly, solvents, such as acetonitrile, ethyl acetate, ethanol, acetone,
methanol, and their combinations in the same or different volumes, have been used for
the extraction of phenolics from plant materials, usually with different proportions of
water. Selecting the right solvent plays a major role in the yield of polyphenols extracted
and extraction rate [47]. Of these solvents, methanol, ethanol, acetonitrile and acetone
were generally found efficient for extraction of phenolic compounds [48, 49]. Numerous
factors must be considered while selecting the appropriate extraction conditions, which
include extraction solvent, extraction temperature, stirring/agitation rate, toxicity, cost
and solubility of the target analytes in the extraction solvent.
Generally, extraction efficiency increases with extraction time and temperature.
However, extra care must be taken in order to avoid hydrolysis of the polyphenols at
10
prolonged extraction time and high temperatures. For example, anthocyanins have been
shown to degrade at temperatures above 70 C and that 20–50 C to be an optimum
temperature for their extraction [48]. Hence, selecting an efficient extraction
procedure/method is critical, so as to maintain the stability of phenolic compounds.
Microwave-assisted extraction (MAE) [50], pressurized fluid extraction (PFE)
[51], supercritical fluid extraction (SFE) [52], subcritical water extraction (SWE) [53]
and accelerated solvent extraction (ASE) [54] have recently been proven to be efficient
techniques for the extraction of phenolic compounds. Although Soxhlet extraction is
commonly used for this purpose [55-57], the former have the advantage of using lower
solvent volumes and providing a good yield within a shorter extraction time.
Ultrasound-assisted extraction (UAE) has recently gained a wide acceptance
among scientists as an efficient extraction technique of different compounds from a
variety of samples as it offers many advantages over conventional extraction techniques.
These advantages include higher extraction efficiency at a significantly reduced time,
energy, chemicals consumed, thus less cost and chemical waste produced. The
mechanisms for ultrasonic enhancement involve the shear force created by the collapse
of cavitation bubbles upon the propagation of the acoustic waves in the kHz range [58].
Bubbles collapse can produce interesting chemical, physical and mechanical effects
[59]. Surface peeling, erosion, particle breakdown and fragmentation of the matrix
during irradiation and an enhanced hydration of the matrix due to ultrasound are among
the mechanisms proposed to explain better extraction efficiencies through the use of
ultrasound [60]. The extraction of various phenolic compounds from different parts of
plants such as leaves, stalks, fruits and plant seeds has been widely achieved through the
use of UAE [48, 61].
Homogenization of plant material into finely divided particles has the ability to
improve extraction yield due to larger surface area. Also, affecting the extraction yield is
the volume of solvent used for extracting a weighed amount of sample which has to be
11
optimized [62, 63].
1.4.2 Analysis and Quantification of Phenolics
Various analytical techniques have been attempted for the determination of
flavonoids. Capillary electrophoresis (CE) with its different modes [64] and gas
chromatography (GC) [65] have been utilized, but the challenge with using GC is the
need for derivatization of the flavonoids to turn them into a volatile form which is
compactable with the instrument. Nuclear magnetic resonance (NMR) [66] has also been
used. Thin-layer chromatography (TLC) chemical screening is fast, simple, and of low
cost in identification of chemical ingredient from plant extracts. Many papers about TLC
chemical screening have been published in recent years [67]. More recently, the use of
countercurrent separation techniques such as countercurrent chromatography (CCC) [68]
and centrifugal partition chromatography (CPC) found application primarily as
purification methods for natural products including phenolic compounds [69].
Owing to its suitability with many detectors (e.g., UV-VIS, MS, fluorescence,
electrochemical, etc.), high reproducibility, high accuracy, suitability with volatile,
semi-volatile and non-volatile analytes, suitability for thermally fragile analytes and
applicability to substances of prime interest in industry, HPLC remains the first choice
for the determination of phenolic compounds. The hyphenation of HPLC with
fluorescence [70], MS [71] and electrochemical detectors [72].
DAD is the most commonly used one among these hyphenated techniques for the
determination of phenolic compounds [73-75] due to its lower price and availability in
many analytical laboratories.
In this study, gradient elution-HPLC with a DAD detector was used to separate
five common flavonoids and to determine isoorientin in Asphodelus ramosus.
12
1.4.3 Chromatography
Chromatography, first described by Tswett1in 1906, is a method in which the
components of a mixture are separated on an adsorbent material filled in column making
use of a “flowing system”. The adsorbent material (basically a solid), or stationary phase
has transformed over the years, including paper, thin layers of solids attached to glass
plates, immobilized liquids, gels, and solid particles packed in columns. Fluids, either a
liquid or a gas are the flowing components of the system, or mobile phase. Concurrent
with development of the different adsorbent materials has been the development of
methods more specific to particular classes of analytes. In general, however, the trend in
development of chromatography has been toward faster, more efficient and
environmentally friendly systems [76].
1.4.4 Liquid Chromatography
The principle for the separation of analytes in liquid chromatography is based on
the mechanism of retention of the analytes in the column. This mechanism classified
into adsorption, partition, ion-exchange and size exclusion defines the different types or
modes of liquid chromatography bearing the same principle. Two basic modes that are
generally recognized for the elution of analytes from the column are isocratic and
gradient elution. Isocratic elution keeps a constant elution composition of the mobile
phase, while the gradient elution has a changing composition of the mobile phase with
time; this is mostly utilized for the partition chromatography (in the reversed-phase
mode), with analytes having varying retention factor values.
Chromatographic conditions have to be optimized for a better separation of the
analytes in the column, and also to avoid peak broadening, with the column being able
to retain the analytes by varying strength. The factors that dictate a better resolution are
the efficiency of the column ( ), selectivity factor ( ) and the retention factor ( ). The
selectivity factor, α, can be altered by changing the column and/or mobile phase type,
13
which can completely change the interaction of analytes in the column, due to great
differences in polarity. The retention factor, , is influenced by the pH and composition
of the mobile phase, the presence of a modifier in the mobile phase and the column
temperature. The higher , the better the resolution. However, between 2 and 10 is
generally considered ideal for resolution. The efficiency of the column, , is affected by
physical properties such as column length, diameter and particle size, and also the
mobile phase flow rate. Resolution, defined as the measure of a method to separate two
adjacent components, can be achieved as a result of optimization of the different
chromatographic parameters. A resolution greater than 1.5 (baseline resolution) is
generally required for good quantitation [76].
1.4.5 High-Performance Liquid Chromatography (HPLC)
HPLC is based upon the principle of distribution or partitioning of the sample
mixture between two phases in the chromatographic bed. The stationary phase is the
column which is packed with a solid, porous, surface active material in a small-particle
nature. While, the mobile phase is a liquid, which is used to elute the sample material,
with different interaction that can be detected and quantified with the detector. Each
sample component appears as a peak signal as it passes through the detector.
Qualitatively, under similar chromatographic conditions, the retention time of a
component is always almost constant. These chromatographic conditions are sample
size/volume, mobile phase composition, flow rate, separation temperature, column type,
among others. The time interval required by a component to travel through the column
from injection to the appearance of the signal is the retention time ( ).
Quantitatively, a graph called calibration graph is drawn from various
concentrations to obtain different peak areas or heights. A comparison of the unknown’s
peak height/ area can be used for determining the concentration of an analyte with an
unknown concentration in the sample [77].
14
Modes of HPLC 1.5
With frequency in use of partition chromatography, makes it popular amongst
the different procedures of liquid chromatographic procedures. Base on relative
polarities between the stationary phase and the mobile phase, partition chromatography
operates in two modes. Initially used was the normal-phase chromatography (NP),
characterized by the usage of highly polar columns, with packing material materials
such as silica and alumina, with a relatively non polar elution solvent like hexane. In
reversed-phase chromatography (RP), the stationary phase is non-polar, often a C-18
hydrocarbon, and the mobile phase is relatively polar (such as water, methanol,
acetonitrile or tetrahydrofuran). The least polar components of the sample are eluted
first, being the most soluble in the non-polar mobile phase; increasing the polarity of the
mobile phase has the effect of increasing the retention time of the polar components in
normal-phase chromatography. In contrast, in the reversed-phase chromatography, the
most polar components of the sample are eluted first, and increasing the mobile phase
polarity decreases the retention time of these components [78].
Adsorption chromatography has a similar principle to normal-phase
chromatography. Adsorption–displacement process characterizes the retention. The
adsorption characteristics are based on the polarity of the molecules, the active sites of
the stationary phase interact with the solute molecules. The more polar analyte displaces
the other in the stationary phase, the adsorption characteristics of the two solute
molecules parallel one another. The two stationary phases normally used are silica and
alumina. Silica has a higher sample capacity, which makes it the most preferred one
[79].
Ion-exchange chromatography utilizes charged surfaces (stationary phase) to
separate charged species. There are two modes of ion-exchange chromatography;
suppressor-based and single-bond ion-exchange chromatography.
15
Size-exclusion chromatography is applied for the separation of high-molecular-
weight species like proteins and fats in biological samples. Silica or polymer particles of
small sizes (~10 μm) are used as the packing material, with a network of uniform pores,
through which the mobile phase and solute can diffuse [79].
Method Development in RP-HPLC 1.6
Often, in choosing a column for a partition chromatographic separation, the
polarity of the stationary phase is roughly matched with that of the analytes; a mobile
phase of a considerably different polarity is then used for elution. In choosing the mobile
phase, polarity, UV transparency, purity, inertness toward the sample components,
toxicity and price are considered. In a liquid mobile phase, the sample components
interact with both the mobile phase and the stationary phase, making method
development to be more complex in liquid chromatography than in gas chromatography.
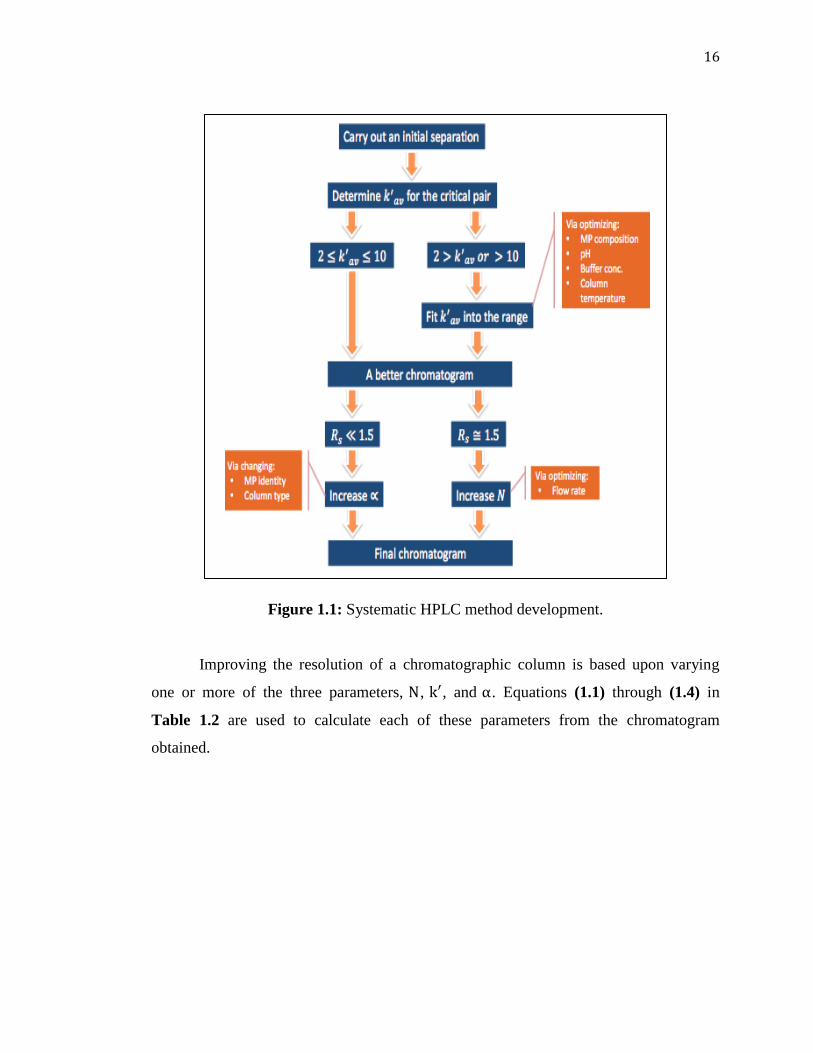
Figure 1.1 describes the steps towards a systematic approach for developing an efficient
and fast HPLC method.
16
Figure 1.1: Systematic HPLC method development.
Improving the resolution of a chromatographic column is based upon varying
one or more of the three parameters, , , and . Equations ( 1.1) through ( 1.4) in
Table 1.2 are used to calculate each of these parameters from the chromatogram
obtained.
17
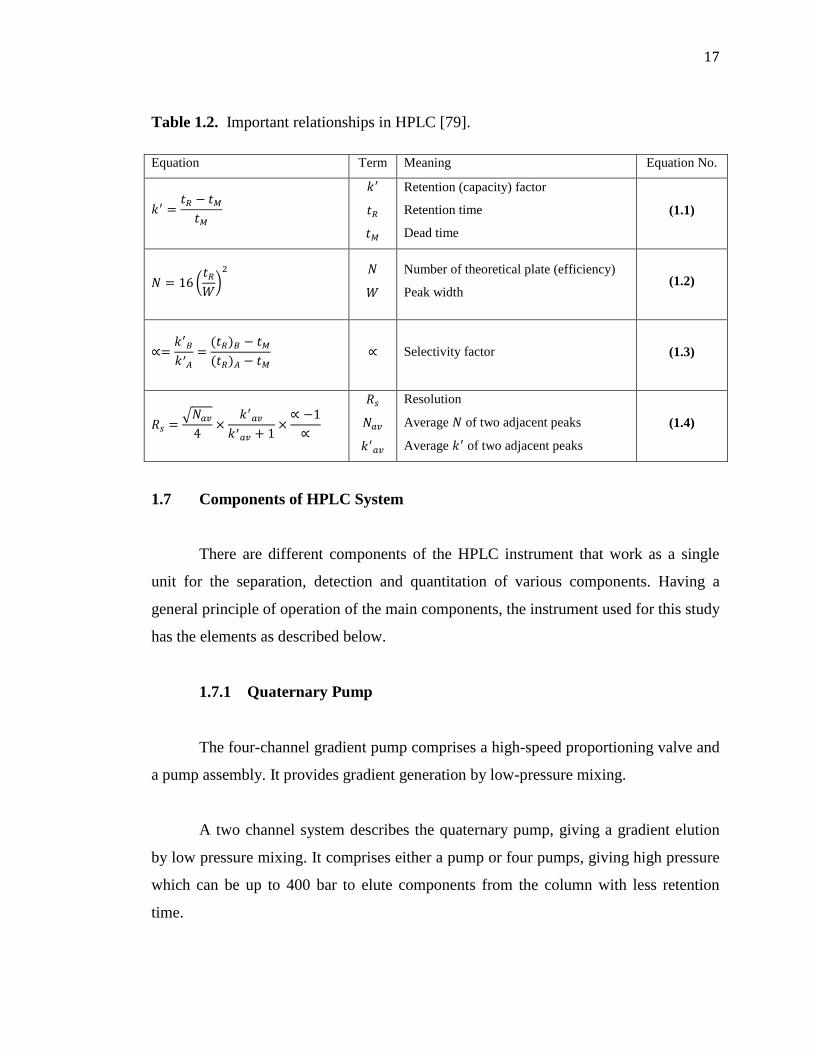
Table 1.2. Important relationships in HPLC [79].
Equation Term Meaning Equation No.
Retention (capacity) factor
Retention time
Dead time
( 1.1)
(
)
Number of theoretical plate (efficiency)
Peak width ( 1.2)
Selectivity factor ( 1.3)
√
Resolution
Average of two adjacent peaks
Average of two adjacent peaks
( 1.4)
Components of HPLC System 1.7
There are different components of the HPLC instrument that work as a single
unit for the separation, detection and quantitation of various components. Having a
general principle of operation of the main components, the instrument used for this study
has the elements as described below.
1.7.1 Quaternary Pump
The four-channel gradient pump comprises a high-speed proportioning valve and
a pump assembly. It provides gradient generation by low-pressure mixing.
A two channel system describes the quaternary pump, giving a gradient elution
by low pressure mixing. It comprises either a pump or four pumps, giving high pressure
which can be up to 400 bar to elute components from the column with less retention
time.
18
In this type of pumps, a process consisting of aspiration, compression and
discharge of the mobile phase is continuously repeated. The operation of the step motor
is converted, through a cam, to reciprocating motion of the plunger (piston). A material
such as sapphire or a special ceramic is usually used for the plunger.
The eluent is aspirated and discharged by the motion of this plunger. The benefit
of having a reciprocating pump is that; it has small internal volume (35-400 µL),
therefore, low dead volume. It also offers high output pressure (up to 10,000 psi). It is
readily adaptable to gradient elution and provides a constant flow rate that is
independent of column back-pressure and solvent viscosity.
1.7.2 Degasser
Degassing comprises a 4-channel vacuum container, including 4 tubular plastic
membranes, and a vacuum pump. As the eluent passes through the vacuum tubes as
pumped from the solvent reservoirs, the dissolved gas will almost be completely
removed, upon leaving the vacuum degasser.
Bubble formation while mixing the solvents can lead to a number of problems in
HPLC analysis, which can be prevented by degassing of the mobile phase. These
problems include unstable and noisy baselines, air bubbles passing through detectors
lead to fake peaks, and excessive pressure can develop which can lead to eventual pump
failure.
1.7.3 Autosampler
The autosampler ensures that the specified sample is injected onto the column,
and that the mixing unit and injection needle are always free from any sample residues
before the next sampling sequence begins. All the injection valves have different stator
heads and different rotor seals. The volume of each valve is different.
19
The major advantage of the autosampler entails accurate injected volume; needle
clean up after injection to prevent carry over. The software regulates the sequence of
samples in the autosampler for injecting from the vials according to arranged positions.
However, feeding the vial number correctly on the autosampler rack and listing out the
sequence correctly in the software is very important.
1.7.4 Thermostated Column Compartment
The temperature of the column can be controlled to obtain a more robust method.
With the control or regulation of the temperature of the column, high separation
temperatures can be applied which can, in general, cause the analytes to be eluted faster.
As temperature increases, viscosity decreases, which also decrease back-pressure,
because diffusion coefficient increases, leading to higher theoretical plate number (N).
Notwithstanding, temperature must be controlled to avoid deterioration of the column
with temperatures used between 40 to 60 C.
1.7.5 Diode-Array Detector (DAD)
Its illumination source is a combination of a deuterium-arc-discharge lamp for
the ultraviolet (UV) wavelength range and a tungsten lamp for the visible (Vis) and
short-wave near-infrared (SWNIR) wavelength range. The achromat (source lens) forms
a single, focused beam of light through the flow cell.
Using DAD, light from the lamps is shone directly onto the flow cell; light that
passes through the flow cell is dispersed by the diffraction grating, and the amount of the
dispersed light is estimated for each wavelength by the photodiode arrays.
20
Benefits of This Study 1.8
Over the years, determination and characterization of many compounds
including flavonoids have improved. In the past, UV/VIS spectrophotometry and thin
layer chromatography (TLC) were the main techniques used for their characterization.
However, with the advent of more sophisticated techniques like DAD detectors,
infrared, mass spectroscopy and nuclear magnetic resonance, more detailed information
can be obtained to better characterize these organic compounds.
Some analytical methods have been carried out to determine isoorientin,
isovitexin, luteolin, apigenin, and (+)-catechin in species of Asphodelus plant materials.
(+)-catechin, isoorientin and isovitexin were determined in A. aestivus [80, 81] while
luteolin and apigenin in were determined in A. tenuifolius [82]. It was speculated that the
development of an efficient HPLC method by which the five commonly found analytes
in species of asphodelus simultaneously separated would be beneficial. Such a method
would offer several advantages such as cost-effectiveness, rapidness, reduction of toxic
chemicals, time, labor and energy.
Objectives of This Work 1.9
The aim of this research is to determine isoorientin and investigate four other
flavonoids (isovitexin, luteolin, apigenin and catechin) in Asphodelus ramosus leaf
extract. The aims can be listed as follows:
To separate some flavonoids commonly found in Asphodelus leaf extract.
To determine isoorientin in A. ramosus leaf extract.
To establish an efficient and robust methods for determining these
compounds within the shortest possible time.
21
2 CHAPTERT 2: EXPERIMENTAL
CHAPTER 2
EXPERIMENTAL
Instrumentation 2.1
An Agilent 1200 series HPLC system (Agilent Technologies Co., USA),
compacted with G1311A quaternary pump, G1316A column temperature controller,
G1329B ALS, G1322A on-line degasser and G1315 B photodiode-array detector,
controlled by Agilent ChemStation for LC 3D systems software (Rev. B. 03.01) was
used. Separation was performed usıng a Zorbax SB–Aq column (4.6 x 150 mm, 5 µm)
from (Agilent Technologies Co., USA).
Reagents and Solutions 2.2
Methanol CHROMASOLV® gradient grade, for HPLC ≥ 99.9% was obtained
from Sigma-Aldrich (St. Louis, USA). Acetonitrile CHROMASOLV® gradient grade,
for HPLC ≥ 99.9% was from Honeywell (Seelze, Germany). Deionized water DI water
(18.2 ) was obtained using a water purification system at Near East University
Hospital (Nicosia, TRNC). The five authentic standards were kindly provided by Prof.
Dr. İhsan ÇALIŞ previously extracted, purified and characterized by his group
(unpublished work).
Equipment 2.3
The centrifuge machine used for centrifugation was from Hettich Zentrifuge D-
78532 (Tuttlingen, Germany). A Schwabach vortex with REAX top (Walpersdorfer Str.,
Germany) was used for shaking and mixing. A Bandelin Sonorex Digitec ultrasonicator
22
(Germany) was used for ultrasonication. The weighing balance used was from Mettler
Toledo classic plus AB204 – S/FACT (Greifensee, Switzerland). The oven used for
drying the samples was from Binder (Germany). A kitchen blender with stainless steel
blades used for homogenization of the sample into fine particles was from Sinbo (SCM
2927) (P.R.C).
Sampling and Sample Pre-treatment 2.4
The season for A. ramosus in Northern Cyprus is between January and April.
The samples were collected on 7th
of April 2017. The fresh plant of A. ramosus (both
leaves and tubers) was collected on campus behind the Near East University Hospital.
The fresh plant material was washed with distilled water several times, cut with a
stainless steel knife into small sizes and dried in the laboratory at room temperature for
two days, then transferred into the oven for 48 hours at 35 C. It was then blended into
finely homogenized particles using the blender, put into glass bottles, sealed tightly and
stored in a dry place at room temperature till analysis.
Preparation of Standards 2.5
To prepare stock solutions of the analytes, the solid standards were dissolved in
methanol to make 1000 mg L-1
each of the various standards. A 50 mg L-1
mixed
working standard solution of the five analytes was prepared by pipetting 50 μL of each
stock solution into an HPLC vial and making up the solution to 1000 μL with 45:55 (%,
v/v) of ACN/H2O. Individual standard solutions were also prepared at 50 mg L-1
in the
same way. Both individual standard and mixture solutions were injected to the HPLC
instrument.
23
Procedure 2.6
1.0 g of the dry sample was accurately weighed using an electronic balance into
a 50-mL beaker and 10 mL of methanol/water (50:50, % v/v) were added to the solid
material. The mixture was ultrasonicated for 10 min. The extract was filtered with a
cotton wool into a 10 mL volumetric flask and the filtrate was completed to the mark
with the same extraction solvent. The sample solution was transferred into a falcon tube
and centrifuged for 3 min at 6000 rpm. 50 μL of the sample solution was diluted three,
five or ten times with 45:55 (v/v) of the mobile phase and injected into the HPLC
instrument.
24
3 CHAPTER 3: RESULTS AND DISCUSSION
CHAPTER 3
RESULTS AND DISCUSSION
Systematic Method Development 3.1
The choice of chromatographic method and procedure were done considering the
chemistry of the analytes and sample to be analyzed. The following were put into
consideration to decide on the chromatographic method to determine these compounds;
For molecules with Mr < 104
adsorption, partition or ion-exchange
chromatography are preferable.
For molecules with Mr > 10
4 size-exclusion chromatography is preferable.
For water-insoluble analyte, adsorption or partition chromatography is
preferred.
For water-soluble analytes that are also ionic, ion-exchange chromatography
is preferred.
For water-soluble analytes that are also nonionic, partition (NP- or RP-)
chromatography is preferred.
If one of the solvents is water and the other is a non-polar solvent, then the
value is a measure of lipophilicity or hydrophobicity of the analyte distributed in the
solvents. The partition coefficient, , is defined as the ratio of the concentrations of a
solute between two immiscible solvents, and the logarithm of this ratio is thus .
This value is defined in Equation (3.1) for the common biphasic system of n-octanol
and water.
logPo/w = log [analyte]octanol/[analyte]water (3.1)
25
Considering that for the analytes Mr < 10
4, size-exclusion is not appropriate and
since the analytes are water-soluble, adsorption chromatography is not appropriate.
values for (+)-catechin, isoorientin, isovitexin, luteolin and apigenin are 1.80, -0.35, -
0.05, 2.40 and 2.71, respectively, showing high and intermediate polarity. These values
indicate that isovitexin and isoorientin are highly polar, while the others have an
intermediate polarity. Thus, they may all be extracted into an aqueous solution. This also
proposes that the analytes would favor the aqueous mobile phase more than a reversed-
phase column. Thus, the separation can be done using partition chromatography.
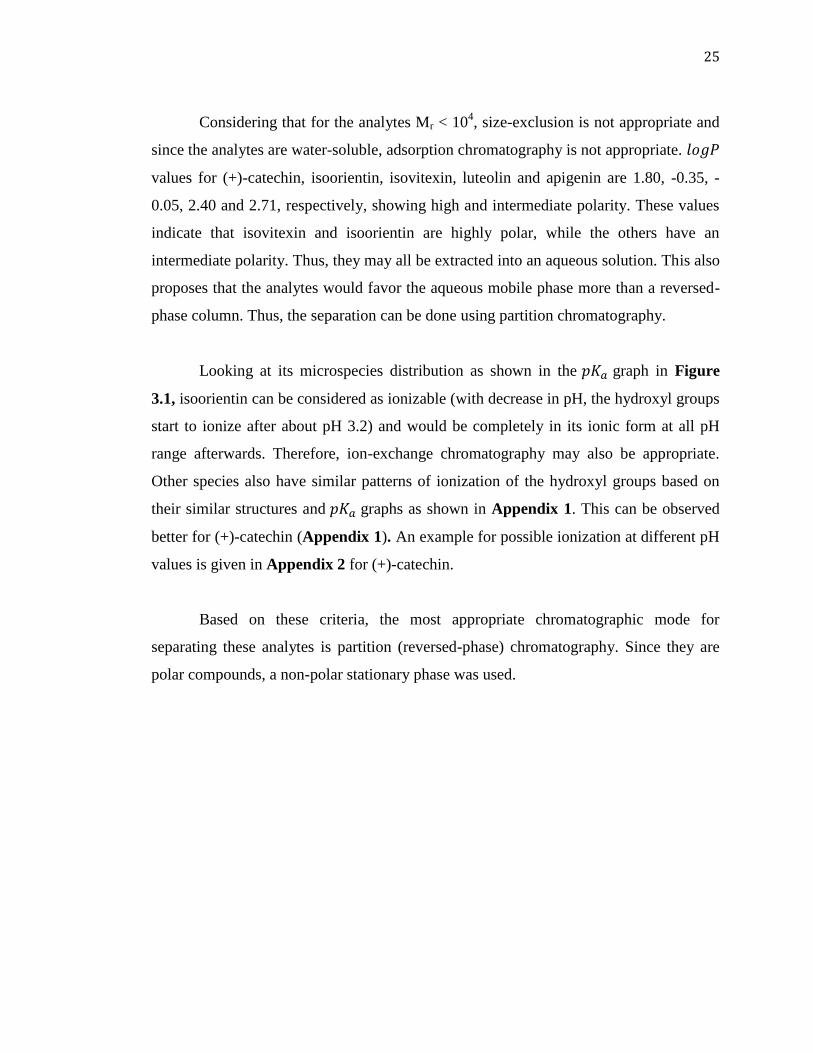
Looking at its microspecies distribution as shown in the graph in Figure
3.1, isoorientin can be considered as ionizable (with decrease in pH, the hydroxyl groups
start to ionize after about pH 3.2) and would be completely in its ionic form at all pH
range afterwards. Therefore, ion-exchange chromatography may also be appropriate.
Other species also have similar patterns of ionization of the hydroxyl groups based on
their similar structures and graphs as shown in Appendix 1. This can be observed
better for (+)-catechin (Appendix 1). An example for possible ionization at different pH
values is given in Appendix 2 for (+)-catechin.
Based on these criteria, the most appropriate chromatographic mode for
separating these analytes is partition (reversed-phase) chromatography. Since they are
polar compounds, a non-polar stationary phase was used.
26
Figure 3.1: Plot of microspecies distribution versus pH for isoorientin.
3.1.1 Initial Chromatographic Conditions
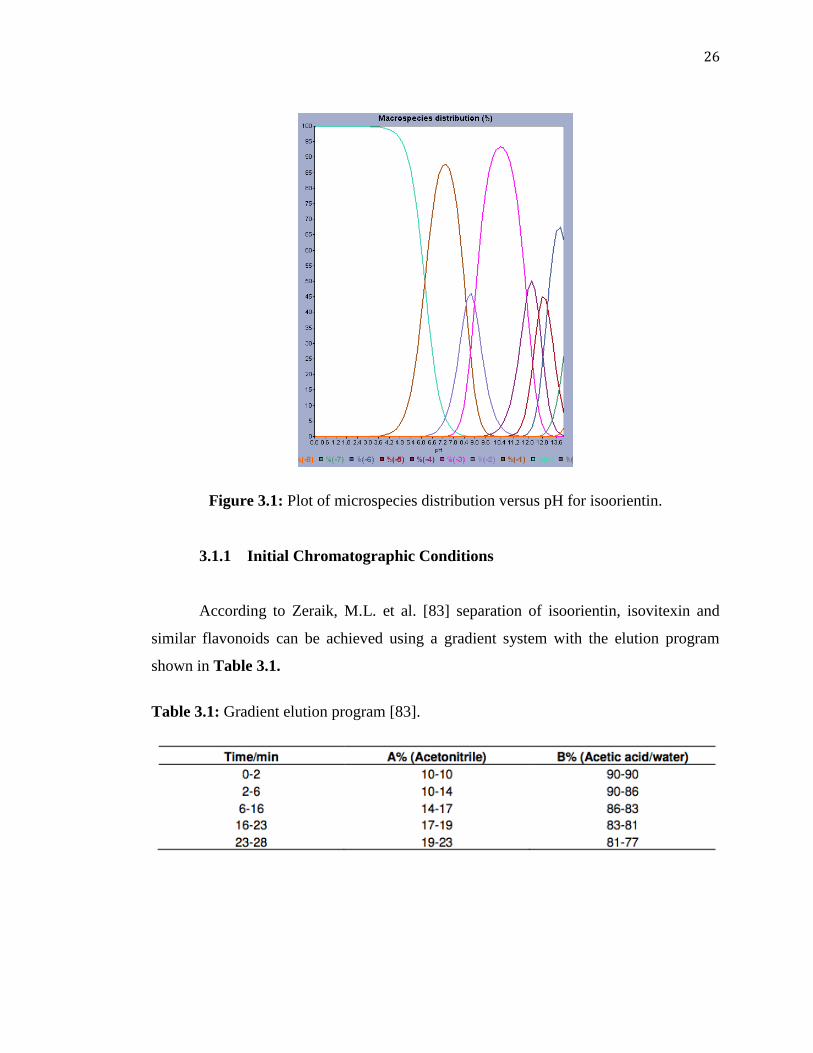
According to Zeraik, M.L. et al. [83] separation of isoorientin, isovitexin and
similar flavonoids can be achieved using a gradient system with the elution program
shown in Table 3.1.
Table 3.1: Gradient elution program [83].
27
The relatively wide range of of the studied analytes and similar studies
from the literature led to the preference of gradient elution of these compounds.
Therefore, the initial chromatographic conditions started with a gradient scan with
ACN/H2O system. Initial chromatographic conditions were as shown in Table 3.2.
Table 3.2: Initial HPLC Conditions.
Physical
parameters
Column ZORBAX SB-Aq, 4.6 mm ID x 150 mm (5
µm)
Flow Rate 1.0 mL/min
Temperature RT
Detector/wavelength DAD 225 nm (BW16). Reference: none
Injection volume 5.0 µL
Chemical
parameters
Mobile phase ACN (C):H2O (A)
Gradient 90:10 A:C from 0 min to 10:90
A:C within 20 min
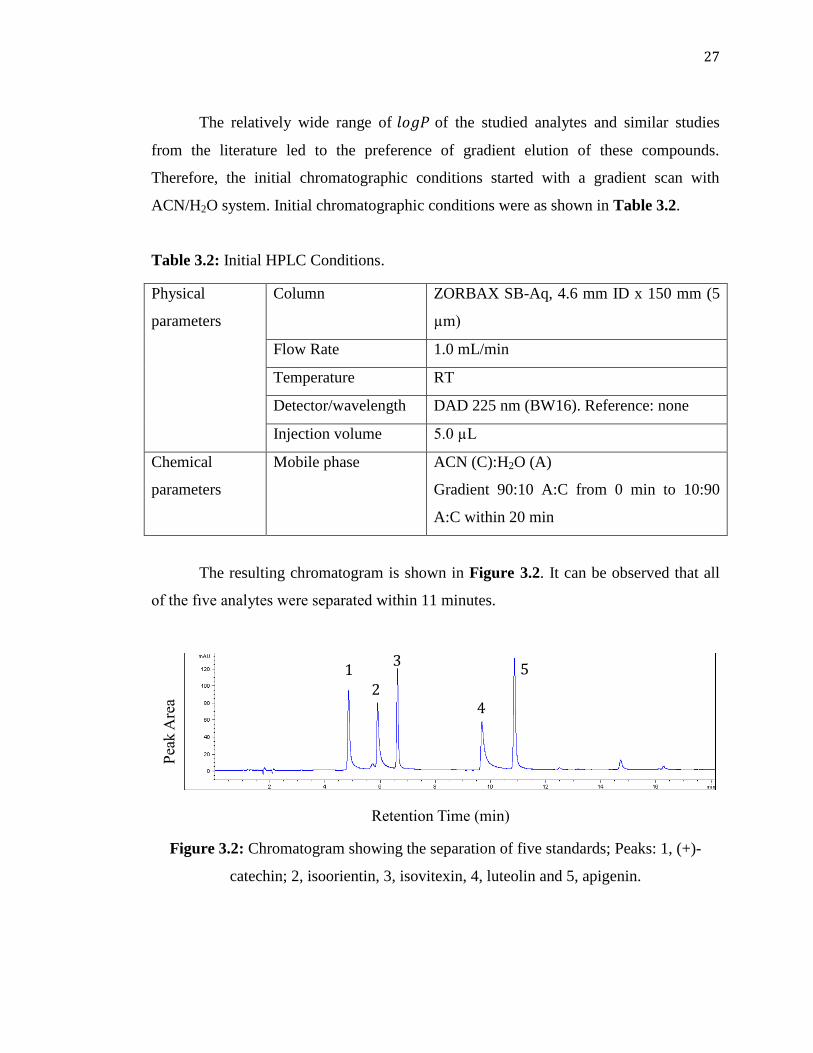
The resulting chromatogram is shown in Figure 3.2. It can be observed that all
of the fıve analytes were separated within 11 minutes.
Figure 3.2: Chromatogram showing the separation of five standards; Peaks: 1, (+)-
catechin; 2, isoorientin, 3, isovitexin, 4, luteolin and 5, apigenin.
Retention Time (min)
1
2
3
4
5
Pea
k A
rea
28
Selection of Optimum Wavelength 3.2
DAD is an important alternative in the absence of a mass detector as it enables
the simultaneous scanning of a wide range of wavelengths for efficient and fast selection
of the optimum maximum wavelength. From the 3D plots given in Figure 3.3 and the
UV absorption spectra in Figure 3.4, it can be seen that the flavonoids absorbed
throughout the whole UV region except for isoorientin which absorbed approximately
up to 300 nm. It was also observed that each analyte had three absorption maxima. The
wavelengths of 225, 280 and 350 nm were considered (Figure 3.3). Although absorption
at 225 nm was the highest among these values, this value is close to the lowest limit of
the UV region and other interferences could easily absorb. At 350 nm, on the other hand,
the first peak (i.e., isoorientin) did not absorb. Based on these observations, 280 nm was
chosen as optimum.
Figure 3.3: 3D plot for the maximum wavelengths of the five analytes.
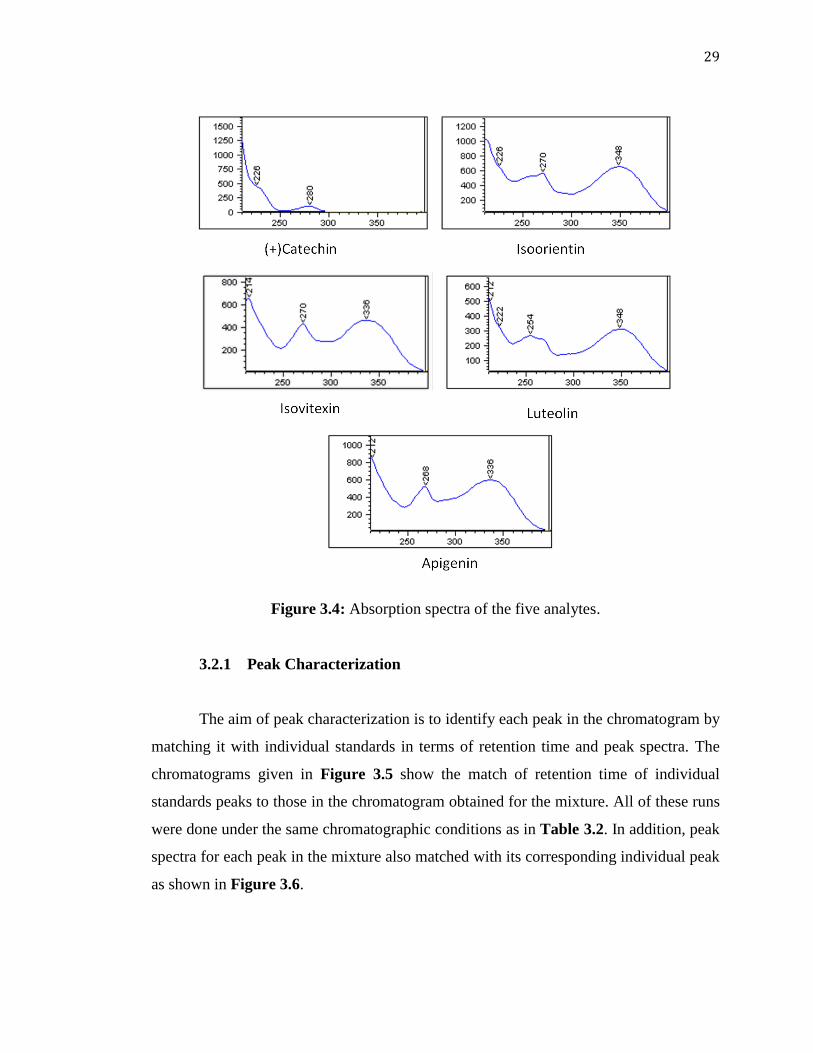
29
Figure 3.4: Absorption spectra of the five analytes.
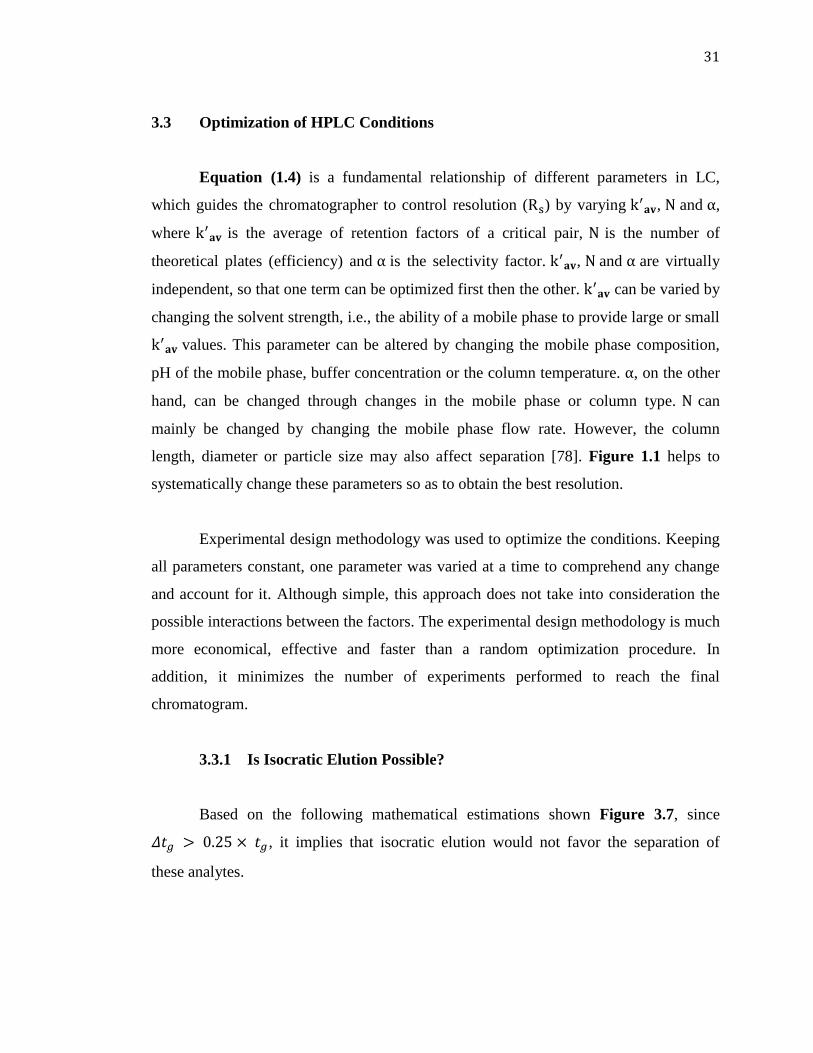
3.2.1 Peak Characterization
The aim of peak characterization is to identify each peak in the chromatogram by
matching it with individual standards in terms of retention time and peak spectra. The
chromatograms given in Figure 3.5 show the match of retention time of individual
standards peaks to those in the chromatogram obtained for the mixture. All of these runs
were done under the same chromatographic conditions as in Table 3.2. In addition, peak
spectra for each peak in the mixture also matched with its corresponding individual peak
as shown in Figure 3.6.
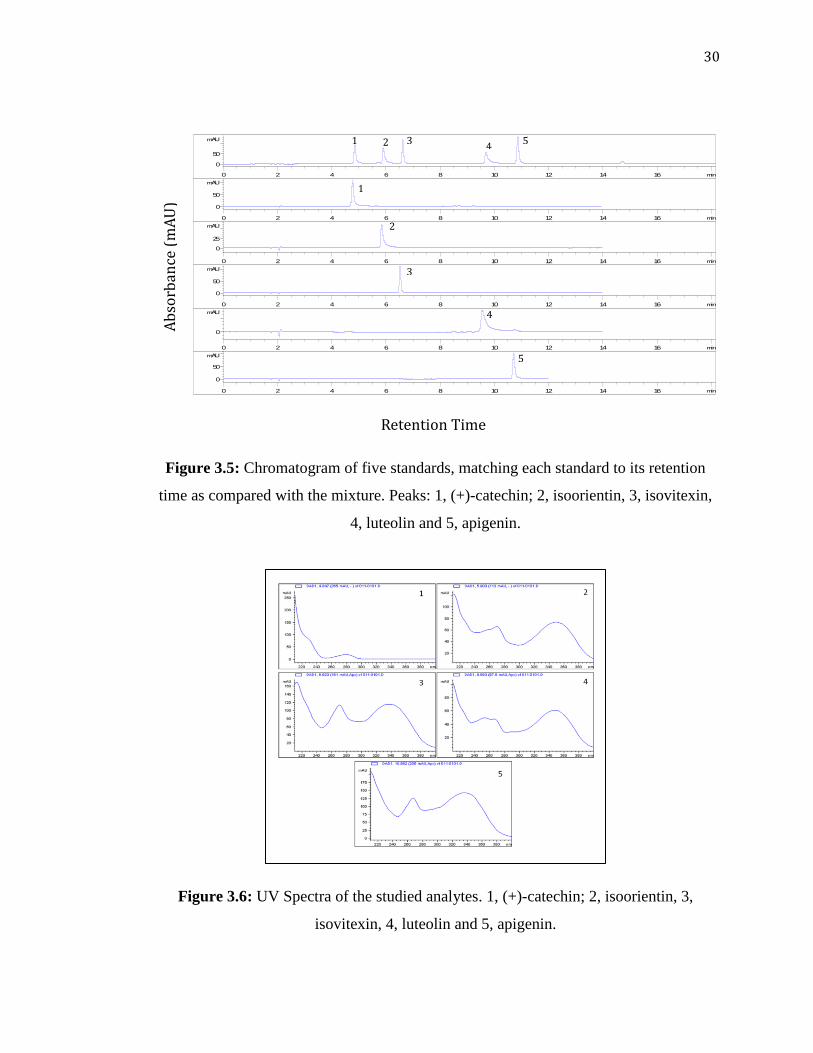
30
Figure 3.5: Chromatogram of five standards, matching each standard to its retention
time as compared with the mixture. Peaks: 1, (+)-catechin; 2, isoorientin, 3, isovitexin,
4, luteolin and 5, apigenin.
Figure 3.6: UV Spectra of the studied analytes. 1, (+)-catechin; 2, isoorientin, 3,
isovitexin, 4, luteolin and 5, apigenin.
min0 2 4 6 8 10 12 14 16
mAU
0
50
min0 2 4 6 8 10 12 14 16
mAU
0
50
min0 2 4 6 8 10 12 14 16
mAU
0
25
min0 2 4 6 8 10 12 14 16
mAU
0
50
min0 2 4 6 8 10 12 14 16
mAU
0
min0 2 4 6 8 10 12 14 16
mAU
0
50
1 2 3 4 5
1
2
3
4
5
Ab
sorb
ance
(m
AU
)
Retention Time (min)
31
Optimization of HPLC Conditions 3.3
Equation ( 1.4) is a fundamental relationship of different parameters in LC,
which guides the chromatographer to control resolution ( ) by varying , and ,
where is the average of retention factors of a critical pair, is the number of
theoretical plates (efficiency) and is the selectivity factor. , and are virtually
independent, so that one term can be optimized first then the other. can be varied by
changing the solvent strength, i.e., the ability of a mobile phase to provide large or small
values. This parameter can be altered by changing the mobile phase composition,
pH of the mobile phase, buffer concentration or the column temperature. , on the other
hand, can be changed through changes in the mobile phase or column type. can
mainly be changed by changing the mobile phase flow rate. However, the column
length, diameter or particle size may also affect separation [78]. Figure 1.1 helps to
systematically change these parameters so as to obtain the best resolution.
Experimental design methodology was used to optimize the conditions. Keeping
all parameters constant, one parameter was varied at a time to comprehend any change
and account for it. Although simple, this approach does not take into consideration the
possible interactions between the factors. The experimental design methodology is much
more economical, effective and faster than a random optimization procedure. In
addition, it minimizes the number of experiments performed to reach the final
chromatogram.
3.3.1 Is Isocratic Elution Possible?
Based on the following mathematical estimations shown Figure 3.7, since
, it implies that isocratic elution would not favor the separation of
these analytes.
32
Figure 3.7: Calculations to decide on the elution mode.
If isocratic is possible
If isocratic is not possible
3.3.2 Effect of Gradient Time
Having decided that isocratic elution was not possible and gradient elution would
be used, the parameters affecting the latter were optimized. These parameters include the
gradient time, initial and final compositions of the mobile phase and the flow rate.
The impact of gradient time was investigated by running the gradient
chromatograms for different intervals of time ranging from 12 to 22 min. From the
chromatograms given in Figure 3.8, it seemed that the composition of the mobile phase
did not show a significant effect upon the first three analytes. Conversely, a significant
effect on was observed of the two late coming peaks. This shows that the higher the
percentage concentration of ACN in the mobile phase, the shorter the gradient time, also
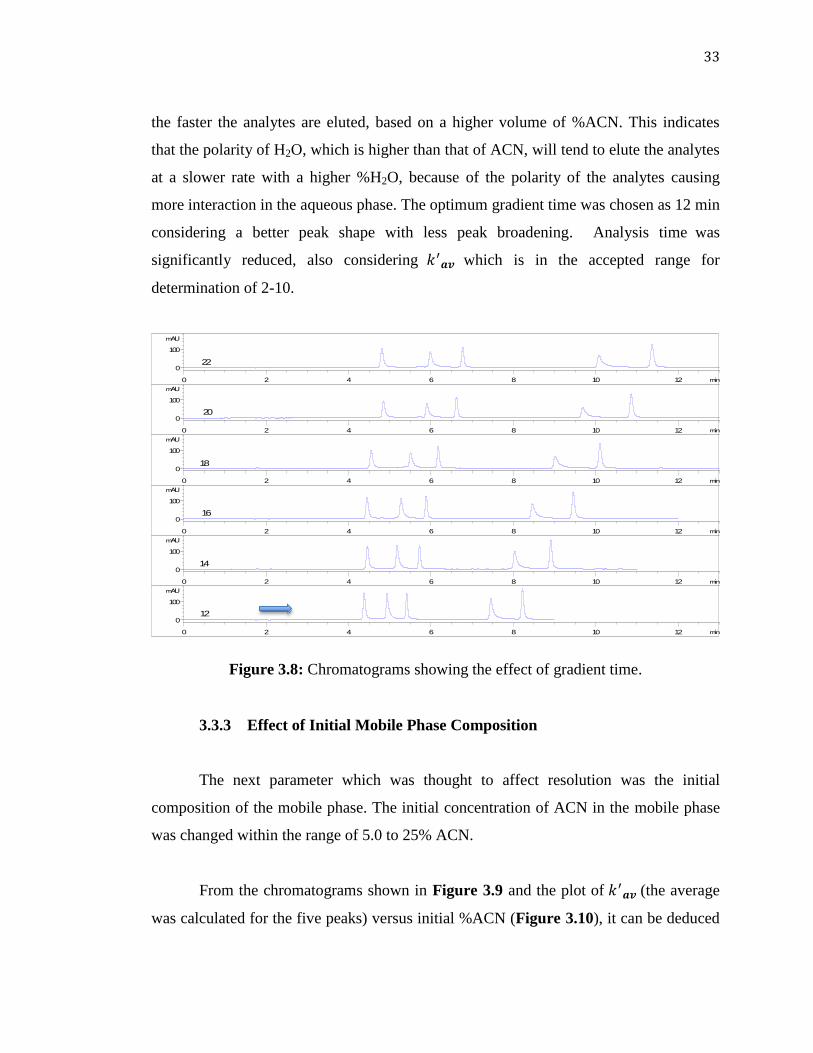
33
the faster the analytes are eluted, based on a higher volume of %ACN. This indicates
that the polarity of H2O, which is higher than that of ACN, will tend to elute the analytes
at a slower rate with a higher %H2O, because of the polarity of the analytes causing
more interaction in the aqueous phase. The optimum gradient time was chosen as 12 min
considering a better peak shape with less peak broadening. Analysis time was
significantly reduced, also considering which is in the accepted range for
determination of 2-10.
Figure 3.8: Chromatograms showing the effect of gradient time.
3.3.3 Effect of Initial Mobile Phase Composition
The next parameter which was thought to affect resolution was the initial
composition of the mobile phase. The initial concentration of ACN in the mobile phase
was changed within the range of 5.0 to 25% ACN.
From the chromatograms shown in Figure 3.9 and the plot of (the average
was calculated for the five peaks) versus initial %ACN (Figure 3.10), it can be deduced
min0 2 4 6 8 10 12
mAU
0
100
22
min0 2 4 6 8 10 12
mAU
0
100
20
min0 2 4 6 8 10 12
mAU
0
100
18
min0 2 4 6 8 10 12
mAU
0
100
16
min0 2 4 6 8 10 12
mAU
0
100
14
min0 2 4 6 8 10 12
mAU
0
100
12
34
that decreased as the concentration of ACN increased in the initial mobile phase
composition. At higher percentage of ACN, also started to decrease and the first two
peaks started to co-elute. Although at 5% ACN, the analysis time was slightly higher
than that it was at 10% ACN, the former was considered optimum because a better
resolution would make the proposed method be applied to other matrices with minimum
overlapping of other constituents in the samples.
Figure 3.9: Chromatograms obtained by changing the initial composition of %ACN
composition.
min0 1 2 3 4 5 6 7 8 9
mAU
0
100
5
min0 1 2 3 4 5 6 7 8 9
mAU
0
10010
min0 1 2 3 4 5 6 7 8 9
mAU
0
100
15
min0 1 2 3 4 5 6 7 8 9
mAU
0
100
20
min0 1 2 3 4 5 6 7 8 9
mAU
0
100
25
35
Figure 3.10: Graph of the effect of initial %ACN composition on .
3.3.4 Effect of Final Mobile Phase Composition
Similarly, the final composition of the mobile phase was thought to affect
resolution as well. To determine the optimum final composition of the gradient system,
the optimum composition for the initial %ACN was kept constant at 5%, while the final
composition was varied from 80 to 100% ACN. From the graph shown in Figure 3.11
and the chromatograms given in Appendix 3, it was observed that less significant effect
of the final composition on results from changing the final mobile phase
composition. A 90% ACN was taken as optimum.
36
Figure 3.11: A graph of the final composition of % ACN against .
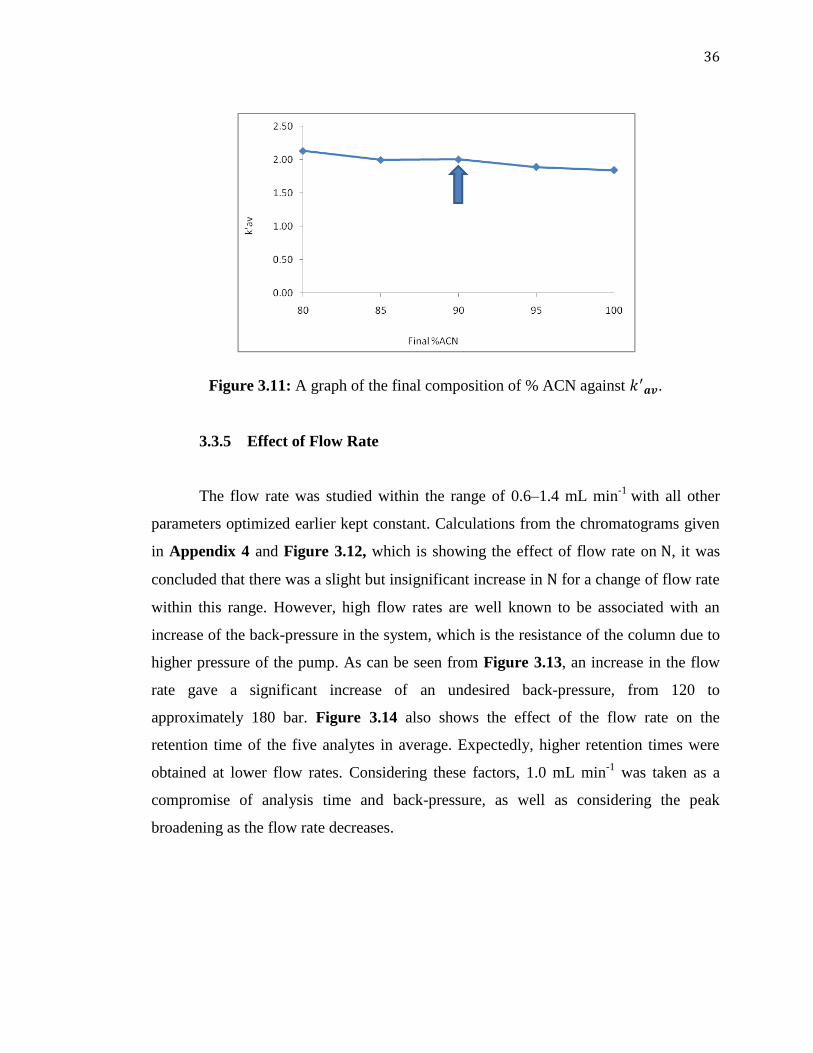
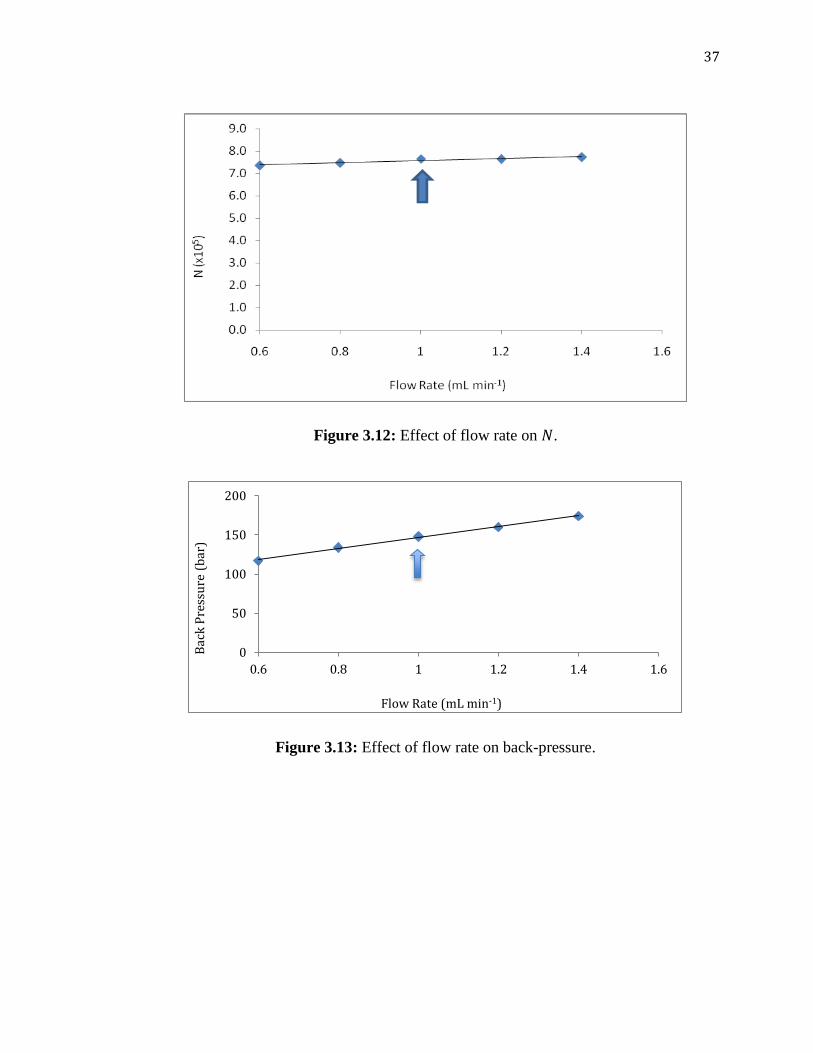
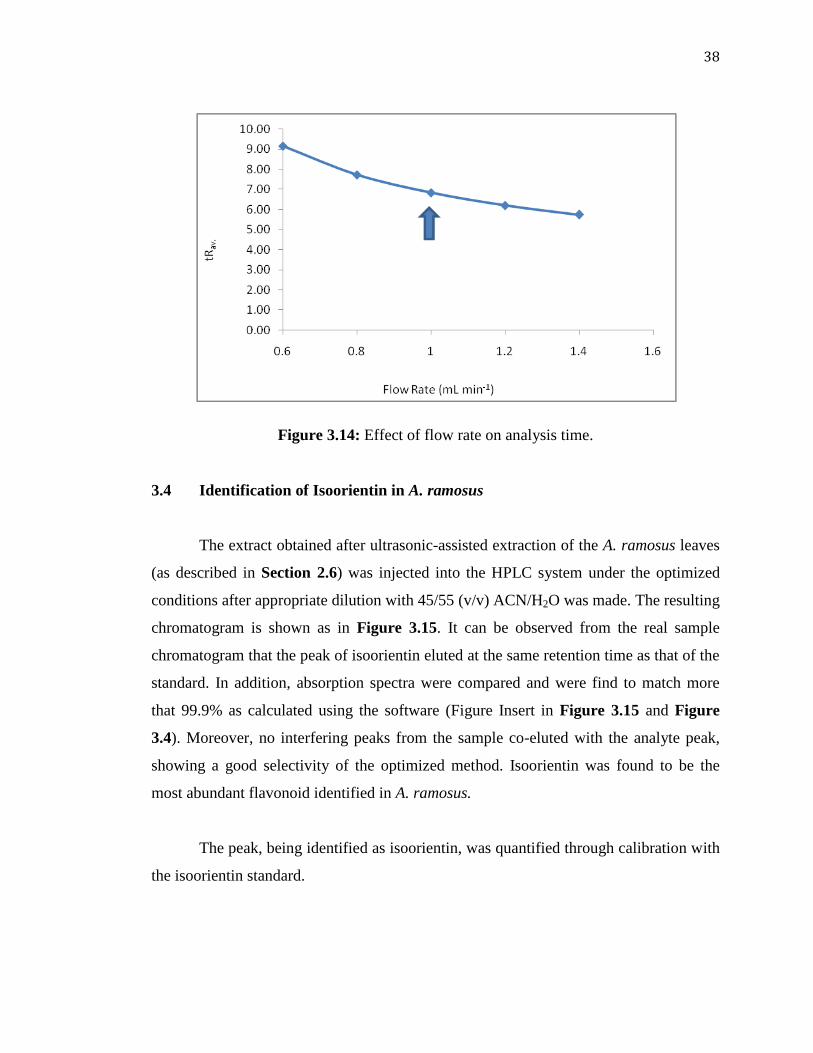
3.3.5 Effect of Flow Rate
The flow rate was studied within the range of 0.6–1.4 mL min-1
with all other
parameters optimized earlier kept constant. Calculations from the chromatograms given
in Appendix 4 and Figure 3.12, which is showing the effect of flow rate on , it was
concluded that there was a slight but insignificant increase in for a change of flow rate
within this range. However, high flow rates are well known to be associated with an
increase of the back-pressure in the system, which is the resistance of the column due to
higher pressure of the pump. As can be seen from Figure 3.13, an increase in the flow
rate gave a significant increase of an undesired back-pressure, from 120 to
approximately 180 bar. Figure 3.14 also shows the effect of the flow rate on the
retention time of the five analytes in average. Expectedly, higher retention times were
obtained at lower flow rates. Considering these factors, 1.0 mL min-1
was taken as a
compromise of analysis time and back-pressure, as well as considering the peak
broadening as the flow rate decreases.
37
Figure 3.12: Effect of flow rate on .
Figure 3.13: Effect of flow rate on back-pressure.
0
50
100
150
200
0.6 0.8 1 1.2 1.4 1.6
Bac
k P
ress
ure
(b
ar)
Flow Rate (mL min-1)
38
Figure 3.14: Effect of flow rate on analysis time.
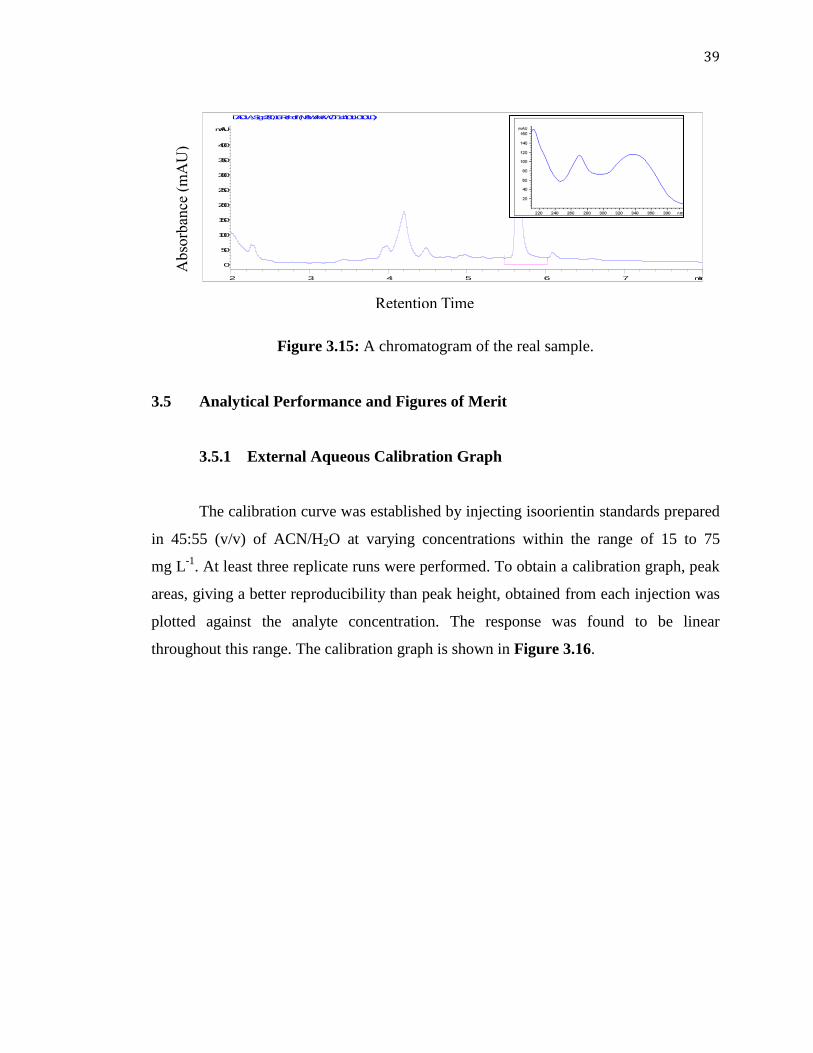
Identification of Isoorientin in A. ramosus 3.4
The extract obtained after ultrasonic-assisted extraction of the A. ramosus leaves
(as described in Section 2.6) was injected into the HPLC system under the optimized
conditions after appropriate dilution with 45/55 (v/v) ACN/H2O was made. The resulting
chromatogram is shown as in Figure 3.15. It can be observed from the real sample
chromatogram that the peak of isoorientin eluted at the same retention time as that of the
standard. In addition, absorption spectra were compared and were find to match more
that 99.9% as calculated using the software (Figure Insert in Figure 3.15 and Figure
3.4). Moreover, no interfering peaks from the sample co-eluted with the analyte peak,
showing a good selectivity of the optimized method. Isoorientin was found to be the
most abundant flavonoid identified in A. ramosus.
The peak, being identified as isoorientin, was quantified through calibration with
the isoorientin standard.
39
Figure 3.15: A chromatogram of the real sample.
Analytical Performance and Figures of Merit 3.5
3.5.1 External Aqueous Calibration Graph
The calibration curve was established by injecting isoorientin standards prepared
in 45:55 (v/v) of ACN/H2O at varying concentrations within the range of 15 to 75
mg L-1
. At least three replicate runs were performed. To obtain a calibration graph, peak
areas, giving a better reproducibility than peak height, obtained from each injection was
plotted against the analyte concentration. The response was found to be linear
throughout this range. The calibration graph is shown in Figure 3.16.
min2 3 4 5 6 7
mAU
0
50
100
150
200
250
300
350
400
DAD1 A, Sig=280,16 Ref=off (MBWANKWOT 144\011-0101.D)
5.639
Retention Time
(min)
Abso
rban
ce (
mA
U)
40
Figure 3.16: Calibration curve obtained with isoorientin standard solutions.
Regression equation, coefficient of determination (R2), precision in terms of
intraday and interday percentage relative standard deviation (%RSD), limit of detection
(LOD), limit of quantitation (LOQ), and linear dynamic ranges (LDR) are summarized
in Table 3.3.
The response was linear over the concentration range from LOQ up to 75.0 mg
L-1
, with R2 being 0.9974. LOD and LOQ were 1.65 and 4.5 mg L
-1, respectively.
Reproducibility of the proposed method was evaluated in terms of intraday and interday
precision. An acceptable precision was obtained with %RSD values of 3.3% for intraday
and 4.5% for interday experiments.
y = 8.837x - 79.113
R² = 0.9974
0
100
200
300
400
500
600
700
0 20 40 60 80
Pea
k a
rea
Conentration of isoorientin (mg L-1)
41
Table 3.3: Figures of merit of the proposed method.
Analyte Regression equationa R2
RSD (%)b
LODb
(mg L-1)
LOQc
(mg L-1)
LDRd
(mg L-1) Intraday Interday
Isoorientin 0.9974 3.3 4.5 1.65 4.5 4.5– 75
a Peak area = slope (± SD) × concentration (mg L
-1) + intercept (± SD)
b Percentage relative standard deviation,
c Limit of detection
d Limit of quantitation
e Linear dynamic range
Quantification of Isoorientin in A. ramosus Leaves 3.6
Quantification of isoorientin in A. ramosus leaves was done using the external
calibration obtained with the standards. The sample was injected under the same
conditions after being diluted 3, 5 and 10 times with 45/55 (v/v) ACN/H2O. The results
are overlaid with the calibration graph in Figure 3.17.
42
Figure 3.17: Determining the concentration of isoorientin in the sample solution with
3 10 dilutions.
Therefore, using the external standard calibration curve, the average
concentration of isoorientin in the sample solution of the A. ramosus leave extract was
found to be 781.8 mg L-1
, which corresponded to 0.15% of isoorientin in the sample.
y = 8.837x - 79.113 R² = 0.9974
0
100
200
300
400
500
600
700
0 20 40 60 80
Pea
k a
rea
Conentration of isoorientin (mg L-1)
10x 5x 3x
43
4 CHAPTER 4: CONCLUSIONS AND RECOMMENDATIONS
CHAPTER 4
CONCLUSIONS AND RECOMMENDATIONS
Reversed-phase high-performance liquid chromatography with a photo-diode
array detector (RP-HPLC-DAD) as a reliable instrument was used for the separation of
five flavonoids (+)-catechin, isoorientin, isovitexin, luteolin and apigenin and the
quantitation of isoorientin in leaves of A. ramosus. The conditions optimized showed
that this method is fast, efficient, inexhaustible and cheap. Considering the wide range of
flavonoids and their similarity in structure, this method was proven to be able to separate
these five important flavonoids. The method can be applied to determine these
flavonoids in other Asphodelus species, which were commonly found in different
Asphodelus species in the literature. Further studies should focus on extraction methods
that would be able to preconcentrate these analytes to make them detectable and
quantifiable at lower concentrations in the plants.
44
REFERENCES
1 Visioli F, De La Lastra CA, Andres-Lacueva C, Aviram M, Calhau C, Cassano
A et al. Polyphenols and human health: a prospectus. Critical Reviews in Food
Science and Nutrition 2011;51:524-46.
2 Heim KE, Tagliaferro AR and Bobilya DJ. Flavonoid antioxidants: chemistry,
metabolism and structure-activity relationships. Journal of Nutritional
Biochemistry 2002;13:572-84.
3 Duthie GG, Duthie SJ and Kyle JAM. Plant polyphenols in cancer and heart
disease: implications as nutritional antioxidants. Nutrition Research Reviews
2000;13:79-106.
4 Johnson I and Williamson G. Phytochemical functional foods. Cambridge,
England: Woodhead Publishing Ltd.: 2003.
5 Harborne JB and Williams CA. Advances in flavonoid research since 1992.
Phytochemistry 2000;55:481-504.
6 Croft KD. The chemistry and biological effects of flavonoids and phenolic acids.
Towards prolongation of the healthy life span: Practical approaches to
intervention 1998;854:435-42.
7 Waksmundzka-Hajnos M and Sherma J. High performance liquid
chromatography in phytochemical analysis, vol. 102. Florida, USA: CRC Press,
Taylor & Francis Group: 2011.
8 Hertog MGL, Hollman PCH and Katan MB. Content of potentially
anticarcinogenic flavonoids of 28 vegetables and 9 fruits commonly consumed in
the netherlands. Journal of Agricultural and Food Chemistry 1992;40:2379-83.
9 Hakkinen SH, Karenlampi SO, Heinonen IM, Mykkanen HM and Torronen AR.
Content of the flavonols quercetin, myricetin, and kaempferol in 25 edible
berries. Journal of Agricultural and Food Chemistry 1999;47:2274-9.
45
10 Tomas-Barberan FA and Clifford MN. Dietary hydroxybenzoic acid derivatives -
nature, occurrence and dietary burden. Journal of the Science of Food and
Agriculture 2000;80:1024-32.
11 Kawaii S, Tomono Y, Katase E, Ogawa K and Yano M. Quantitation of
flavonoid constituents in Citrus fruits. Journal of Agricultural and Food
Chemistry 1999;47:3565-71.
12 Arts ICW, van de Putte B and Hollman PCH. Catechin contents of foods
commonly consumed in The Netherlands. 2. Tea, wine, fruit juices, and
chocolate milk. Journal of Agricultural and Food Chemistry 2000;48:1752-7.
13 Ali HM, Almagribi W and Al-Rashidi MN. Antiradical and reductant activities
of anthocyanidins and anthocyanins, structure-activity relationship and synthesis.
Food Chemistry 2016;194:1275-82.
14 Mazur WM, Duke JA, Wahala K, Rasku S and Adlercreutz H. Isoflavonoids and
lignans in legumes: Nutritional and health aspects in humans. Journal of
Nutritional Biochemistry 1998;9:193-200.
15 Kumazawa T, Minatogawa T, Matsuba S, Sato S and Onodera J. An effective
synthesis of isoorientin: the regioselective synthesis of a 6-C-glucosylflavone.
Carbohydrate Research 2000;329:507-13.
16 Toker G, Kupeli E, Memisoglu M and Yesilada E. Flavonoids with
antinociceptive and anti-inflammatory activities from the leaves of Tilia argentea
(silver linden). Journal of Ethnopharmacology 2004;95:393-7.
17 Kupeli E, Aslan M, Gurbuz I and Yesilada E. Evaluation of in vivo biological
activity profile of isoorientin. Zeitschrift Fur Naturforschung C-a Journal of
Biosciences 2004;59:787-90.
18 Orhan DD, Aslan M, Aktay G, Ergun E, Yesilada E and Ergun F. Evaluation of
hepatoprotective effect of Gentiana olivieri herbs on subacute administration and
isolation of active principle. Life Sciences 2003;72:2273-83.
19 Fu YJ, Zu YG, Liu W, Hou CL, Chen LY, Li SM et al. Preparative separation of
vitexin and isovitexin from pigeonpea extracts with macroporous resins. Journal
of Chromatography A 2007;1139:206-13.
46
20 Fu YJ, Zu YG, Liu W, Zhang L, Tong MH, Efferth T et al. Determination of
vitexin and isovitexin in pigeonpea using ultrasonic extraction followed by LC-
MS. Journal of Separation Science 2008;31:268-75.
21 Zhang J, Yuan K, Zhou WL, Zhou JA and Yang P. Studies on the active
components and antioxidant activities of the extracts of Mimosa pudica Linn.
from southern China. Pharmacognosy Magazine 2011;7:35-9.
22 Lin CM, Huang ST, Liang YC, Lin MS, Shih CM, Chang YC et al. Isovitexin
suppresses lipopolysaccharide-mediated inducible nitric oxide synthase through
inhibition of NF-kappa B in mouse macrophages. Planta Medica 2005;71:748-
53.
23 Awolola GV, Koorbanally NA, Chenia H, Shode FO and Baijnath H.
Antibacterial and anti-biofilm activity of flavonoids and triterpenes isolated from
the extracts of ficus sansibarica warb. subsp sansibarica (moraceae) extracts.
African Journal of Traditional Complementary and Alternative Medicines
2014;11:124-31.
24 de Oliveira DR, Zamberlam CR, Gaiardo RB, Rego GM, Cerutti JM, Cavalheiro
AJ et al. Flavones from Erythrina falcata are modulators of fear memory. Bmc
Complementary and Alternative Medicine 2014;14.
25 Brango-Vanegas J, Costa GM, Ortmann CF, Schenkel EP, Reginatto FH, Ramos
FA et al. Glycosylflavonoids from Cecropia pachystachya Trecul are quorum
sensing inhibitors. Phytomedicine 2014;21:670-5.
26 Caruso IP, Vilegas W, de Souza FP, Fossey MA and Cornelio ML. Binding of
antioxidant flavone isovitexin to human serum albumin investigated by
experimental and computational assays. Journal of Pharmaceutical and
Biomedical Analysis 2014;98:100-6.
27 Sun BX, Dong LH, Guo PP, Yan WY, Wang CY and Zhang ZJ. Simultaneous
determination of four flavonoids and one phenolic acid in rat plasma by LC-
MS/MS and its application to a pharmacokinetic study after oral administration
of the Herba Desmodii Styracifolii extract. Journal of Chromatography B-
Analytical Technologies in the Biomedical and Life Sciences 2013;932:66-73.
47
28 Li YX, Zhang YQ, Yang T, Li H, Guo J, Zhao QQ et al. Pharmacokinetics and
tissue distribution study of Isovitexin in rats by HPLC-MS/MS. Journal of
Chromatography B-Analytical Technologies in the Biomedical and Life Sciences
2015;991:13-20.
29 Haminiuk CWI, Maciel GM, Plata-Oviedo MSV and Peralta RM. Phenolic
compounds in fruits - an overview. International Journal of Food Science and
Technology 2012;47:2023-44.
30 Pandurangan AK and Esa NM. Luteolin, a bioflavonoid inhibits colorectal
cancer through modulation of multiple signaling pathways: A review. Asian
Pacific Journal of Cancer Prevention 2014;15:5501-8.
31 Middleton E. Effect of plant flavonoids on immune and inflammatory cell
function. Flavonoids in the Living System 1998;439:175-82.
32 Hougee S, Sanders A, Faber J, Graus YMF, van den Berg WB, Garssen J et al.
Decreased pro-inflammatory cytokine production by LPS-stimulated PBMC
upon in vitro incubation with the flavonoids apigenin, luteolin or chrysin, due to
selective elimination of monocytes/macrophages. Biochemical Pharmacology
2005;69:241-8.
33 Kim DI, Lee TK, Lim IS, Kim H, Lee YC and Kim CH. Regulation of IGF-I
production and proliferation of human leiomyomal smooth muscle cells by
Scutellaria barbata D. Don in vitro: isolation of flavonoids of apigenin and
luteolon as acting compounds. Toxicology and Applied Pharmacology
2005;205:213-24.
34 Martini ND, Katerere DRP and Eloff JN. Biological activity of five antibacterial
flavonoids from Combretum erythrophyllum (Combretaceae). Journal of
Ethnopharmacology 2004;93:207-12.
35 Danafar H and Hamidi M. Simple and sensitive high-performance liquid
chromatography (HPLC) method with UV detection for mycophenolic acid assay
in human plasma. application to a bioequivalence study. Advanced
Pharmaceutical Bulletin 2015;5:563-8.
48
36 Abate A, Yang G, Wong RJ, Schroder H, Stevenson DK and Dennery PA.
Apigenin decreases hemin-mediated heme oxygenase-1 induction. Free Radical
Biology and Medicine 2005;39:711-8.
37 Hirano T, Higa S, Arimitsu J, Naka T, Ogata A, Shima Y et al. Luteolin, a
flavonoid, inhibits AP-1 activation by basophils. Biochemical and Biophysical
Research Communications 2006;340:1-7.
38 Khan TH and Sultana S. Apigenin induces apoptosis in Hep G2 cells: Possible
role of TNF-alpha and IFN-gamma. Toxicology 2006;217:206-12.
39 Kajimoto O, Kajimoto Y, Yabune M, Nakamura T, Kotani K, Suzuki Y et al.
Tea catechins with a galloyl moiety reduce body weight and fat. Journal of
Health Science 2005;51:161-71.
40 Thielecke F and Boschmann M. The potential role of green tea catechins in the
prevention of the metabolic syndrome - A review. Phytochemistry 2009;70:11-
24.
41 Kim DO, Lee KW, Lee HJ and Lee CY. Vitamin C equivalent antioxidant
capacity (VCEAC) of phenolic phytochemicals. Journal of Agricultural and Food
Chemistry 2002;50:3713-7.
42 Lifante ZD and Aguinagalde I. The use of random amplified polymorphic DNA
(RAPD) markers for the study of taxonomical relationships among species of
Asphodelus sect Verinea (Asphodelaceae). American Journal of Botany
1996;83:949-53.
43 D. MR. Flora of Cyprus, vol. 2: Bentham Moxon Trust, Royal Botanic Gardens:
1985.
44 Apostolos A. On the colour of flowers’ petals (PhD thesis) Athens,
Greece National and Kapodistrian University of Athens 2009.
45 Abascal K, Ganora L and Yarnell E. The effect of freeze-drying and its
implications for botanical medicine: A review. Phytotherapy Research
2005;19:655-60.
46 Ozdal T, Capanoglu E and Altay F. A review on protein-phenolic interactions
and associated changes. Food Research International 2013;51:954-70.
49
47 Xu BJ and Chang SKC. A comparative study on phenolic profiles and
antioxidant activities of legumes as affected by extraction solvents. Journal of
Food Science 2007;72:S159-S66.
48 Dai J and Mumper RJ. Plant phenolics: extraction, analysis and their antioxidant
and anticancer properties. Molecules 2010;15:7313-52.
49 Shi J, Nawaz H, Pohorly J, Mittal G, Kakuda Y and Jiang YM. Extraction of
polyphenolics from plant material for functional foods - engineering and
technology. Food Reviews International 2005;21:139-66.
50 Carniel N, Dallago RM, Dariva C, Bender JP, Nunes AL, Zanella O et al.
Microwave-assisted extraction of phenolic acids and flavonoids from physalis
angulata. Journal of Food Process Engineering 2017;40.
51 Solana M, Boschiero I, Dall'Acqua S and Bertucco A. A comparison between
supercritical fluid and pressurized liquid extraction methods for obtaining
phenolic compounds from Asparagus officinalis L. Journal of Supercritical
Fluids 2015;100:201-8.
52 Mushtaq M, Sultana B, Anwar F, Adnan A and Rizvi SSH. Enzyme-assisted
supercritical fluid extraction of phenolic antioxidants from pomegranate peel.
Journal of Supercritical Fluids 2015;104:122-31.
53 Ahmadian-Kouchaksaraie Z, Niazmand R and Najafi MN. Optimization of the
subcritical water extraction of phenolic antioxidants from Crocus sativus petals
of saffron industry residues: Box-Behnken design and principal component
analysis. Innovative Food Science & Emerging Technologies 2016;36:234-44.
54 Gomes SVF, Portugal LA, dos Anjos JP, de Jesus ON, de Oliveira EJ, David JP
et al. Accelerated solvent extraction of phenolic compounds exploiting a Box-
Behnken design and quantification of five flavonoids by HPLC-DAD in
Passiflora species. Microchemical Journal 2017;132:28-35.
55 Karami Z, Emam-Djomeh Z, Mirzaee HA, Khomeiri M, Mahoonak AS and
Aydani E. Optimization of microwave assisted extraction (MAE) and soxhlet
extraction of phenolic compound from licorice root. Journal of Food Science and
Technology-Mysore 2015;52:3242-53.
50
56 Rodriguez-Solana R, Salgado JM, Dominguez J and Cortes-Dieguez S.
Comparison of soxhlet, accelerated solvent and supercritical fluid extraction
techniques for volatile (GC-MS and GC/FID) and phenolic compounds (HPLC-
ESI/MS/MS) from Lamiaceae species. Phytochemical Analysis 2015;26:61-71.
57 Helaleh MIH, Tanaka K, Fujii SI and Korenaga T. GC/MS determination of
phenolic compounds in soil samples using Soxhlet extraction and derivatization
techniques. Analytical Sciences 2001;17:1225-7.
58 Laborde JL, Bouyer C, Caltagirone JP and Gerard A. Acoustic cavitation field
prediction at low and high frequency ultrasounds. Ultrasonics 1998;36:581-7.
59 Mason TJ, Paniwnyk L and Lorimer JP. The uses of ultrasound in food
technology. Ultrasonics Sonochemistry 1996;3:S253-S60.
60 Chemat F, Rombaut N, Sicaire AG, Meullemiestre A, Fabiano-Tixier AS and
Abert-Vian M. Ultrasound assisted extraction of food and natural products.
Mechanisms, techniques, combinations, protocols and applications. A review.
Ultrasonics Sonochemistry 2017;34:540-60.
61 Espada-Bellido E, Ferreiro-Gonzalez M, Carrera C, Palma M, Barroso CG and
Barbero GF. Optimization of the ultrasound-assisted extraction of anthocyanins
and total phenolic compounds in mulberry (Morus nigra) pulp. Food Chemistry
2017;219:23-32.
62 Pinelo M, Arnous A and Meyer AS. Upgrading of grape skins: Significance of
plant cell-wall structural components and extraction techniques for phenol
release. Trends in Food Science & Technology 2006;17:579-90.
63 Nepote V, Grosso NR and Guzman CA. Optimization of extraction of phenolic
antioxidants from peanut skins. Journal of the Science of Food and Agriculture
2005;85:33-8.
64 Marti R, Valcarcel M, Herrero-Martinez JM, Cebolla-Cornejo J and Rosello S.
Simultaneous determination of main phenolic acids and flavonoids in tomato by
micellar electrokinetic capillary electrophoresis. Food Chemistry 2017;221:439-
46.
51
65 Farajzadeh MA and Mogaddam MRA. Low-density-solvent-based air-assisted
liquid-liquid microextraction followed by gas chromatography with flame
ionization detection for the determination of synthetic phenolic antioxidants in
milk samples. Journal of Separation Science 2016;39:1160-7.
66 Christophoridou S and Dais P. Detection and quantification of phenolic
compounds in olive oil by high resolution H-1 nuclear magnetic resonance
spectroscopy. Analytica Chimica Acta 2009;633:283-92.
67 Holloway G, Maheswaran R, Leeks A, Bradby S and Wahab S. Screening
method for ethylene glycol and diethylene glycol in glycerin-containing
products. Journal of Pharmaceutical and Biomedical Analysis 2010;51:507-11.
68 Shaheen N, Lu YZ, Geng P, Shao Q and Wei Y. Isolation of four phenolic
compounds from Mangifera indica L. flowers by using normal phase combined
with elution extrusion two-step high speed countercurrent chromatography.
Journal of Chromatography B-Analytical Technologies in the Biomedical and
Life Sciences 2017;1046:211-7.
69 Trabelsi N, Oueslati S, Henry-Vitrac C, Waffo-Teguo P, Medini F, Merillon JM
et al. Phenolic contents and biological activities of Limoniastrum guyonianum
fractions obtained by Centrifugal Partition Chromatography. Industrial Crops
and Products 2013;49:740-6.
70 Farajmand B, Esteki M, Koohpour E and Salmani V. Reversed-phase single drop
microextraction followed by high-performance liquid chromatography with
fluorescence detection for the quantification of synthetic phenolic antioxidants in
edible oil samples. Journal of Separation Science 2017;40:1524-31.
71 Nzeuwa IBY, Xia YY, Qiao ZU, Feng F, Bian JX, Liu WY et al. Comparison of
the origin and phenolic contents of Lycium ruthenicum Murr. by high-
performance liquid chromatography fingerprinting combined with quadrupole
time-of-flight mass spectrometry and chemometrics. Journal of Separation
Science 2017;40:1234-43.
72 Sun Z, Wang M, Cheng N, Gao H, Deng JJ, Zhao J et al. Determination of
synthetic phenolic antioxidants in vegetable oil and oil-enriched foods by high-
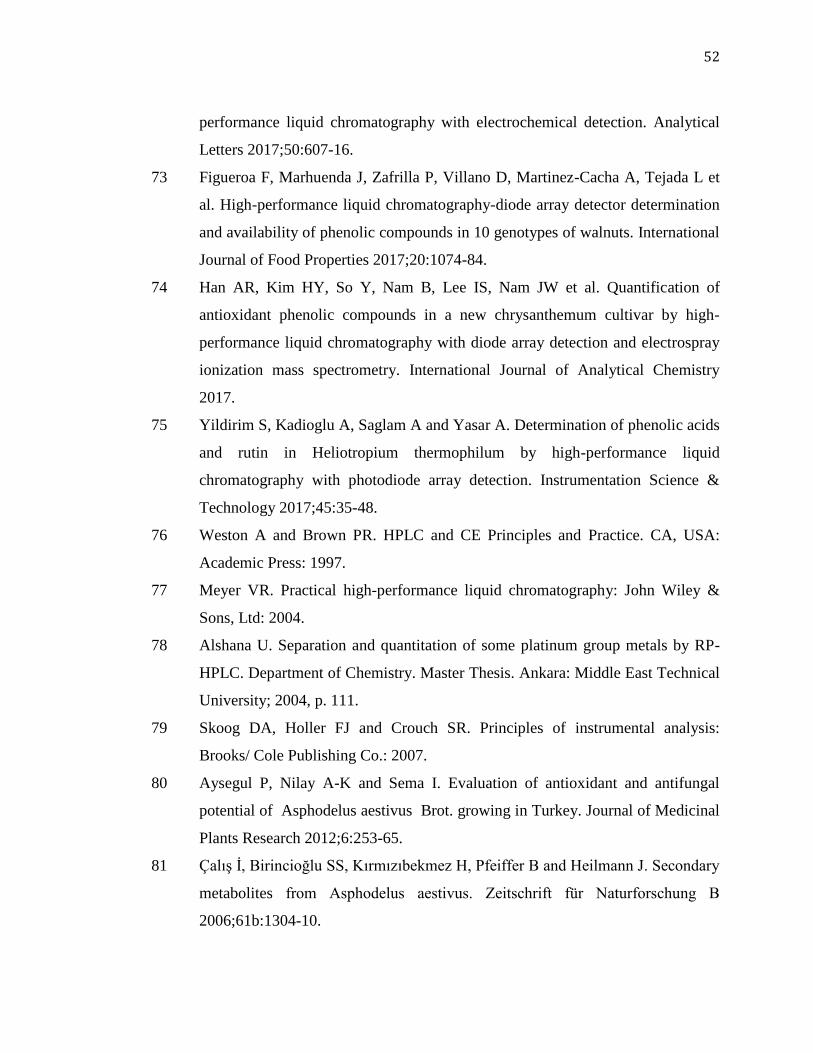
52
performance liquid chromatography with electrochemical detection. Analytical
Letters 2017;50:607-16.
73 Figueroa F, Marhuenda J, Zafrilla P, Villano D, Martinez-Cacha A, Tejada L et
al. High-performance liquid chromatography-diode array detector determination
and availability of phenolic compounds in 10 genotypes of walnuts. International
Journal of Food Properties 2017;20:1074-84.
74 Han AR, Kim HY, So Y, Nam B, Lee IS, Nam JW et al. Quantification of
antioxidant phenolic compounds in a new chrysanthemum cultivar by high-
performance liquid chromatography with diode array detection and electrospray
ionization mass spectrometry. International Journal of Analytical Chemistry
2017.
75 Yildirim S, Kadioglu A, Saglam A and Yasar A. Determination of phenolic acids
and rutin in Heliotropium thermophilum by high-performance liquid
chromatography with photodiode array detection. Instrumentation Science &
Technology 2017;45:35-48.
76 Weston A and Brown PR. HPLC and CE Principles and Practice. CA, USA:
Academic Press: 1997.
77 Meyer VR. Practical high-performance liquid chromatography: John Wiley &
Sons, Ltd: 2004.
78 Alshana U. Separation and quantitation of some platinum group metals by RP-
HPLC. Department of Chemistry. Master Thesis. Ankara: Middle East Technical
University; 2004, p. 111.
79 Skoog DA, Holler FJ and Crouch SR. Principles of instrumental analysis:
Brooks/ Cole Publishing Co.: 2007.
80 Aysegul P, Nilay A-K and Sema I. Evaluation of antioxidant and antifungal
potential of Asphodelus aestivus Brot. growing in Turkey. Journal of Medicinal
Plants Research 2012;6:253-65.
81 Çalış İ, Birincioğlu SS, Kırmızıbekmez H, Pfeiffer B and Heilmann J. Secondary
metabolites from Asphodelus aestivus. Zeitschrift für Naturforschung B
2006;61b:1304-10.
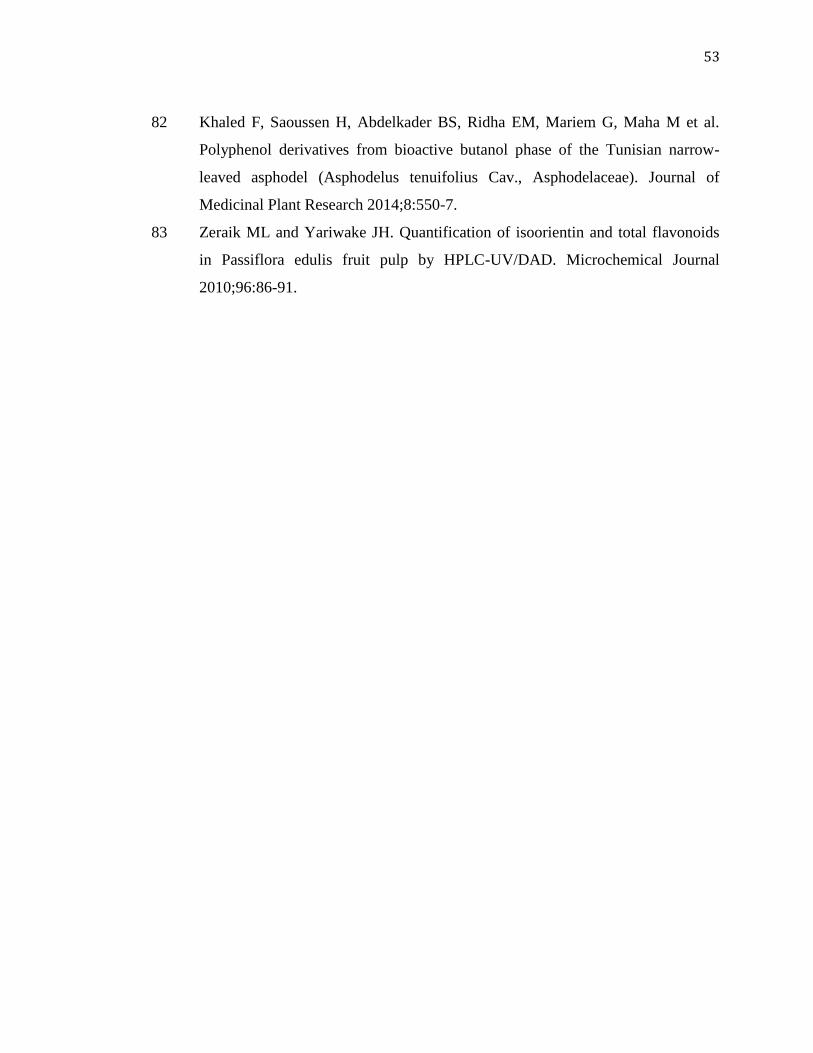
53
82 Khaled F, Saoussen H, Abdelkader BS, Ridha EM, Mariem G, Maha M et al.
Polyphenol derivatives from bioactive butanol phase of the Tunisian narrow-
leaved asphodel (Asphodelus tenuifolius Cav., Asphodelaceae). Journal of
Medicinal Plant Research 2014;8:550-7.
83 Zeraik ML and Yariwake JH. Quantification of isoorientin and total flavonoids
in Passiflora edulis fruit pulp by HPLC-UV/DAD. Microchemical Journal
2010;96:86-91.
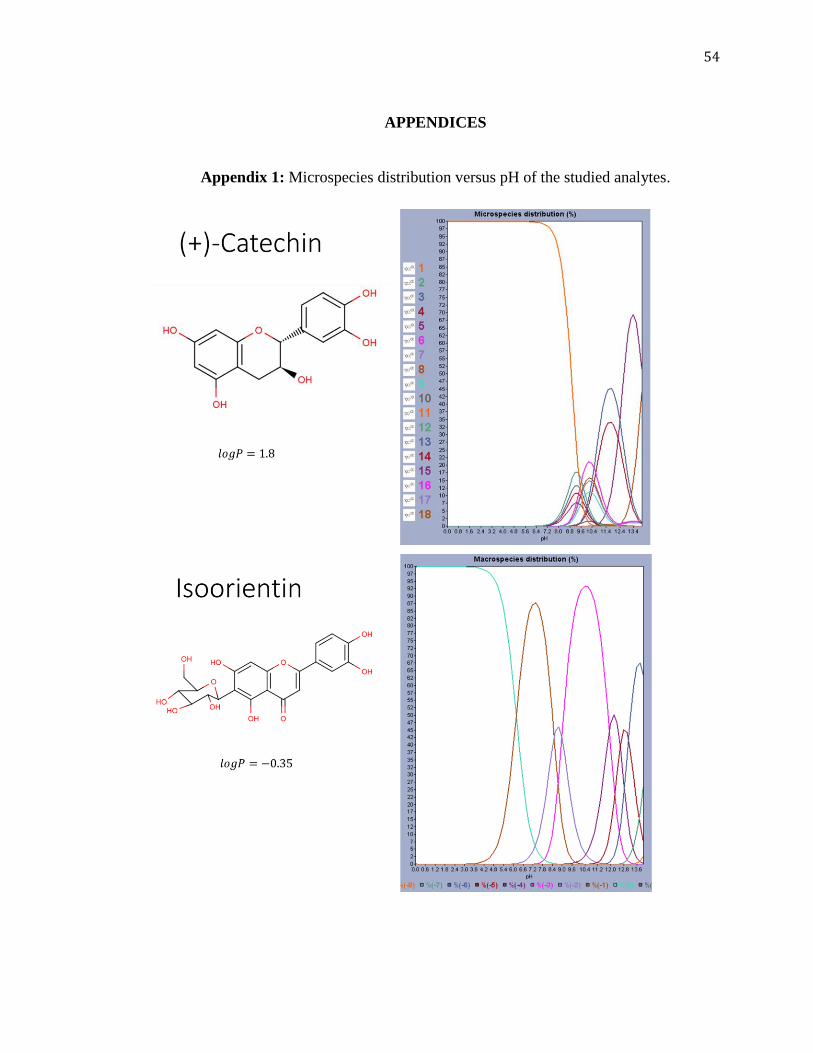
54
APPENDICES
Appendix 1: Microspecies distribution versus pH of the studied analytes.
55
Appendix 1: Cont’d.
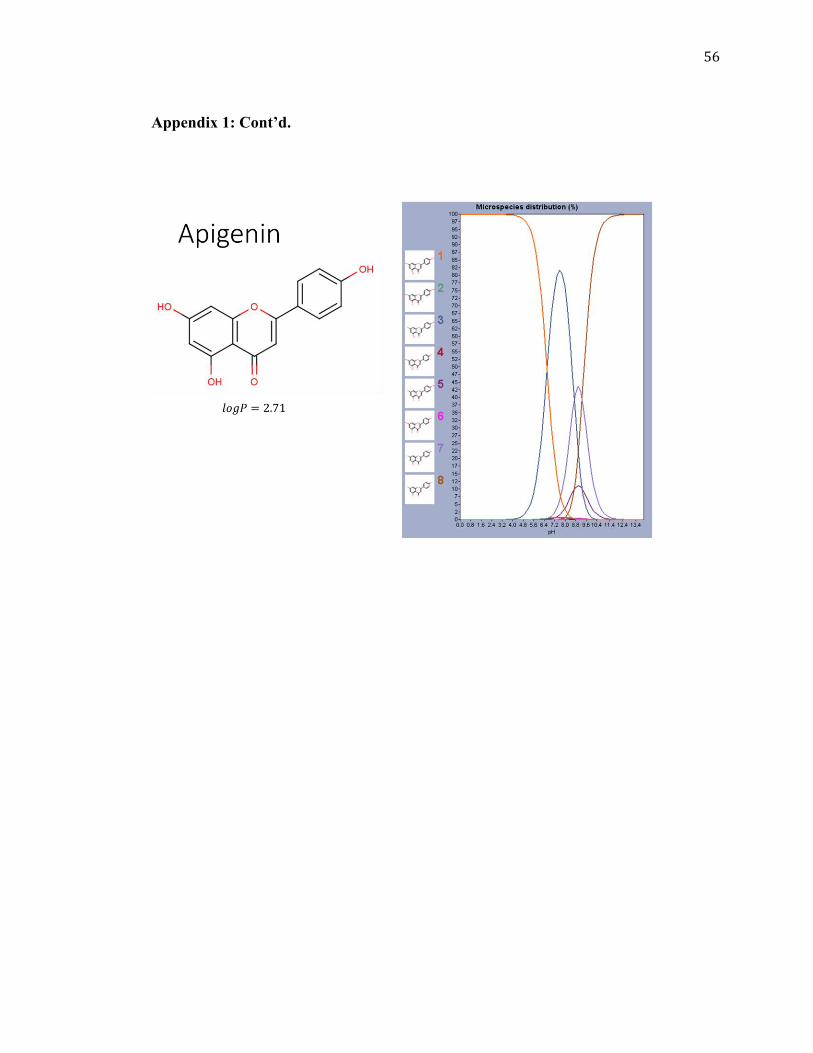
56
Appendix 1: Cont’d.
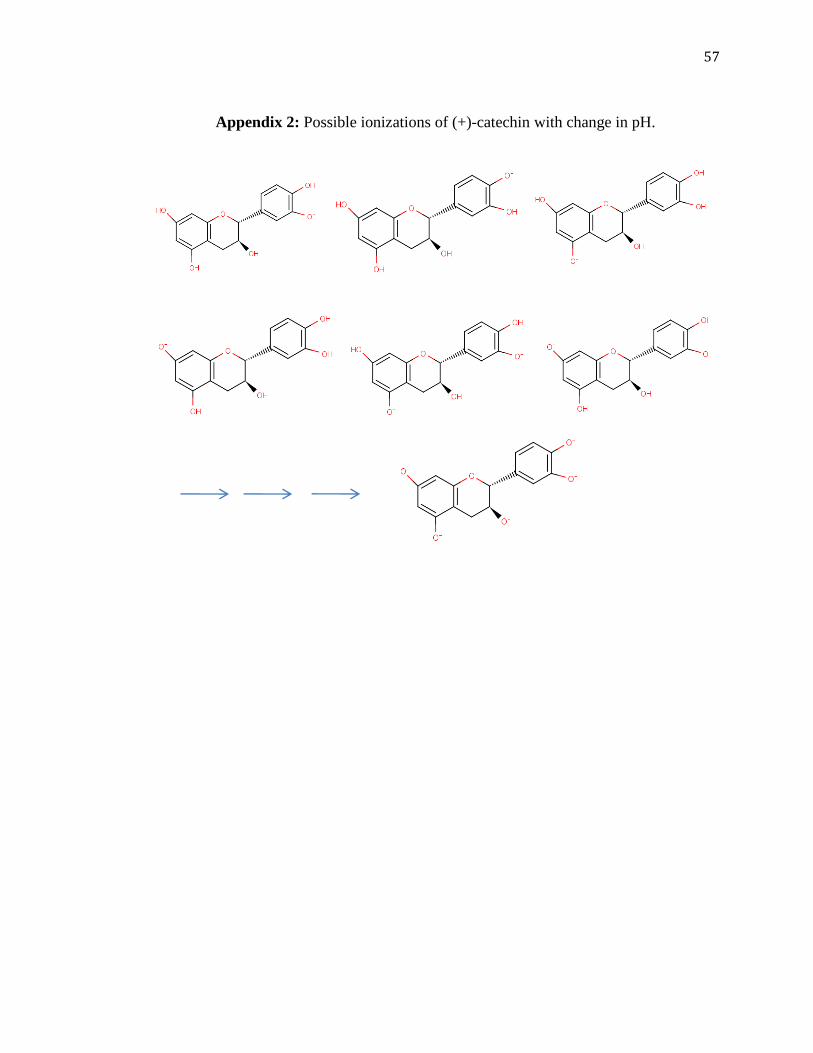
57
Appendix 2: Possible ionizations of (+)-catechin with change in pH.
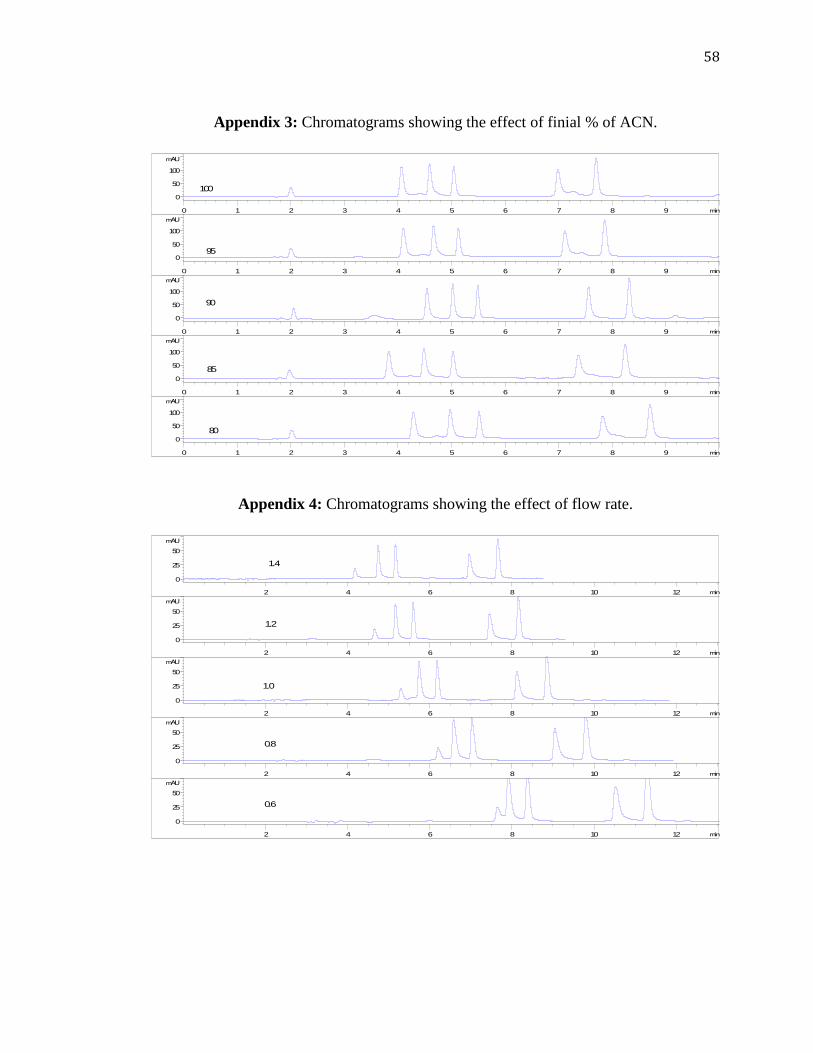
58
Appendix 3: Chromatograms showing the effect of finial % of ACN.
Appendix 4: Chromatograms showing the effect of flow rate.
min0 1 2 3 4 5 6 7 8 9
mAU
0
50
100
100
min0 1 2 3 4 5 6 7 8 9
mAU
0
50
100
95
min0 1 2 3 4 5 6 7 8 9
mAU
0
50
100
90
min0 1 2 3 4 5 6 7 8 9
mAU
0
50
100
85
min0 1 2 3 4 5 6 7 8 9
mAU
0
50
100
80
min2 4 6 8 10 12
mAU
0
25
50
1.4
min2 4 6 8 10 12
mAU
0
25
50
1.2
min2 4 6 8 10 12
mAU
0
25
50
1.0
min2 4 6 8 10 12
mAU
0
25
50
0.8
min2 4 6 8 10 12
mAU
0
25
50
0.6