Determination of Coxiella burnetii seroprevalence in macropods in Australia
7
Determination of Coxiella burnetii seroprevalence in macropods in Australia Alanna Cooper a, *, Tamsin Barnes b , Abbey Potter c , Natkunam Ketheesan a , Brenda Govan a a Department of Microbiology and Immunology, School of Veterinary and Biomedical Sciences, James Cook University, Douglas 4811, Queensland, Australia b School of Veterinary Science, University of Queensland, Gatton 4343, Queensland, Australia c School of Veterinary and Biomedical Sciences, Murdoch University, Murdoch 6150, Western Australia, Australia 1. Introduction Coxiella burnetii is an obligate intracellular pathogen with worldwide distribution and a wide host range (Babudieri, 1959). In the natural lifecycle of the organism, it is transmitted between wild animals and their ticks. Many serological surveys and bacterial isolations have indicated the extent of wildlife coxiellosis worldwide. In Australia, bandicoots (Smith and Derrick, 1939; Smith, 1942) and macropods (Pope et al., 1960; Banazis et al., 2010) have been identified as potential reservoirs. Macro- pods are marsupials belonging to the family Macropodi- dae, which includes kangaroos, wallabies, pademelons and bettongs. The bacterium can also be transmitted to livestock and other domestic animals via ticks. Once in livestock, C. burnetii primarily infects the female repro- ductive tract, resulting in the shedding of a spore-like form of the organism in parturient fluids and milk (Lang, 1990). Q fever is more commonly contracted following exposure to infected livestock such as cattle, sheep and goats. Studies conducted in Queensland found that many Q fever patients had no known contact with the typical animal reservoirs. Two patients reported contact with wallabies (Chong et al., 2003; Gale et al., 2007). In Q fever patients, seroconversion to the various antigens post-infection is relatively well characterised, with an initial rise in antibodies to phase II antigen generally followed by antibodies to phase I antigen (Maurin and Raoult, 1999). Differences in titres of immunoglobulin isotypes to phase II or phase I antigen also form the basis for diagnosis of acute or chronic Q fever. Antibodies to phase II and I antigens of IgM isotype, and antibodies to phase II of IgG and IgA isotypes are associated with acute Q fever; whereas, antibodies to phase I of IgG and IgA isotypes are associated with chronic Q fever (Capo et al., 1998; Fournier and Raoult, 1999; Camacho et al., 2000). However, the process of seroconversion is not well characterised in animals and seropositivity to either or Veterinary Microbiology 155 (2012) 317–323 A R T I C L E I N F O Article history: Received 9 June 2011 Received in revised form 22 August 2011 Accepted 24 August 2011 Keywords: Zoonoses Coxiella burnetii Q fever Serology Macropods Australia A B S T R A C T Many animal species, including macropods, have the potential to act as atypical reservoirs of the causative agent of Q fever, Coxiella burnetii. The objective of this study was to determine the seroprevalence of C. burnetii in various macropod species in Australia. Competitive and indirect ELISAs were developed for the testing of macropod sera for antibodies to phase II and I C. burnetii antigens separately. A total of 500 macropod serum samples from selected species sampled in eastern and western coastal states of Australia were screened for the presence of anti-C. burnetii antibodies. An overall seroprevalence of 20.8% (95% CI 20.8–20.9%) was observed with 30.4% (30.2–30.9%) in northern Queensland, 13.0% (12.9–13.1%) in southern Queensland, 7.1% (7.1–8.0%) in western Queensland and 22.8% (22.7–22.9%) in south-western Western Australia. These data indicated that macropods represented a potential reservoir for zoonotic transmission of C. burnetii to domestic animals and the human population. ß 2011 Elsevier B.V. All rights reserved. * Corresponding author. Tel.: +61 0747 816 915; fax: +61 0747 791 526. E-mail address: [email protected] (A. Cooper). Contents lists available at SciVerse ScienceDirect Veterinary Microbiology jo u rn al ho m epag e: ww w.els evier.c o m/lo cat e/vetmic 0378-1135/$ – see front matter ß 2011 Elsevier B.V. All rights reserved. doi:10.1016/j.vetmic.2011.08.023
Transcript of Determination of Coxiella burnetii seroprevalence in macropods in Australia

DeAu
Alaa Deb Schc Sch
1. I
wit(Bait iMaindAus194201poddaebetliveliveduc
Veterinary Microbiology 155 (2012) 317–323
A R
Artic
Rece
Rece
Acce
Keyw
Zoo
Coxi
Q fe
Sero
Mac
Aus
*
037
doi:
termination of Coxiella burnetii seroprevalence in macropods instralia
nna Cooper a,*, Tamsin Barnes b, Abbey Potter c, Natkunam Ketheesan a, Brenda Govan a
partment of Microbiology and Immunology, School of Veterinary and Biomedical Sciences, James Cook University, Douglas 4811, Queensland, Australia
ool of Veterinary Science, University of Queensland, Gatton 4343, Queensland, Australia
ool of Veterinary and Biomedical Sciences, Murdoch University, Murdoch 6150, Western Australia, Australia
ntroduction
Coxiella burnetii is an obligate intracellular pathogenh worldwide distribution and a wide host rangebudieri, 1959). In the natural lifecycle of the organism,s transmitted between wild animals and their ticks.ny serological surveys and bacterial isolations haveicated the extent of wildlife coxiellosis worldwide. Intralia, bandicoots (Smith and Derrick, 1939; Smith,2) and macropods (Pope et al., 1960; Banazis et al.,0) have been identified as potential reservoirs. Macro-s are marsupials belonging to the family Macropodi-, which includes kangaroos, wallabies, pademelons andtongs. The bacterium can also be transmitted tostock and other domestic animals via ticks. Once instock, C. burnetii primarily infects the female repro-tive tract, resulting in the shedding of a spore-like form
of the organism in parturient fluids and milk (Lang, 1990).Q fever is more commonly contracted following exposureto infected livestock such as cattle, sheep and goats.Studies conducted in Queensland found that many Q feverpatients had no known contact with the typical animalreservoirs. Two patients reported contact with wallabies(Chong et al., 2003; Gale et al., 2007).
In Q fever patients, seroconversion to the variousantigens post-infection is relatively well characterised,with an initial rise in antibodies to phase II antigengenerally followed by antibodies to phase I antigen(Maurin and Raoult, 1999). Differences in titres ofimmunoglobulin isotypes to phase II or phase I antigenalso form the basis for diagnosis of acute or chronic Q fever.Antibodies to phase II and I antigens of IgM isotype, andantibodies to phase II of IgG and IgA isotypes are associatedwith acute Q fever; whereas, antibodies to phase I of IgGand IgA isotypes are associated with chronic Q fever (Capoet al., 1998; Fournier and Raoult, 1999; Camacho et al.,2000). However, the process of seroconversion is not wellcharacterised in animals and seropositivity to either or
T I C L E I N F O
le history:
ived 9 June 2011
ived in revised form 22 August 2011
pted 24 August 2011
ords:
noses
ella burnetii
ver
logy
ropods
tralia
A B S T R A C T
Many animal species, including macropods, have the potential to act as atypical reservoirs
of the causative agent of Q fever, Coxiella burnetii. The objective of this study was to
determine the seroprevalence of C. burnetii in various macropod species in Australia.
Competitive and indirect ELISAs were developed for the testing of macropod sera for
antibodies to phase II and I C. burnetii antigens separately. A total of 500 macropod serum
samples from selected species sampled in eastern and western coastal states of Australia
were screened for the presence of anti-C. burnetii antibodies. An overall seroprevalence of
20.8% (95% CI 20.8–20.9%) was observed with 30.4% (30.2–30.9%) in northern Queensland,
13.0% (12.9–13.1%) in southern Queensland, 7.1% (7.1–8.0%) in western Queensland and
22.8% (22.7–22.9%) in south-western Western Australia. These data indicated that
macropods represented a potential reservoir for zoonotic transmission of C. burnetii to
domestic animals and the human population.
� 2011 Elsevier B.V. All rights reserved.
Corresponding author. Tel.: +61 0747 816 915; fax: +61 0747 791 526.
E-mail address: [email protected] (A. Cooper).
Contents lists available at SciVerse ScienceDirect
Veterinary Microbiology
jo u rn al ho m epag e: ww w.els evier .c o m/lo cat e/vetmic
8-1135/$ – see front matter � 2011 Elsevier B.V. All rights reserved.
10.1016/j.vetmic.2011.08.023
A. Cooper et al. / Veterinary Microbiology 155 (2012) 317–323318
both antigenic phase of C. burnetii has been shown to varybetween species (Enright et al., 1971; Marrie et al., 1985,1993). Some studies have suggested that the presence ofantibodies to phase II antigen in animal sera is indicative ofrecent infection (Lackman et al., 1962; Sidwell and Gebhardt,1962). The current study aimed to determine the potentialfor native Australian macropods to act as reservoirs of Qfever in Australia using two ELISA methods for the detectionof antibodies to C. burnetii in macropod sera.
2. Materials and methods
2.1. Sample collection
2.1.1. Study populations
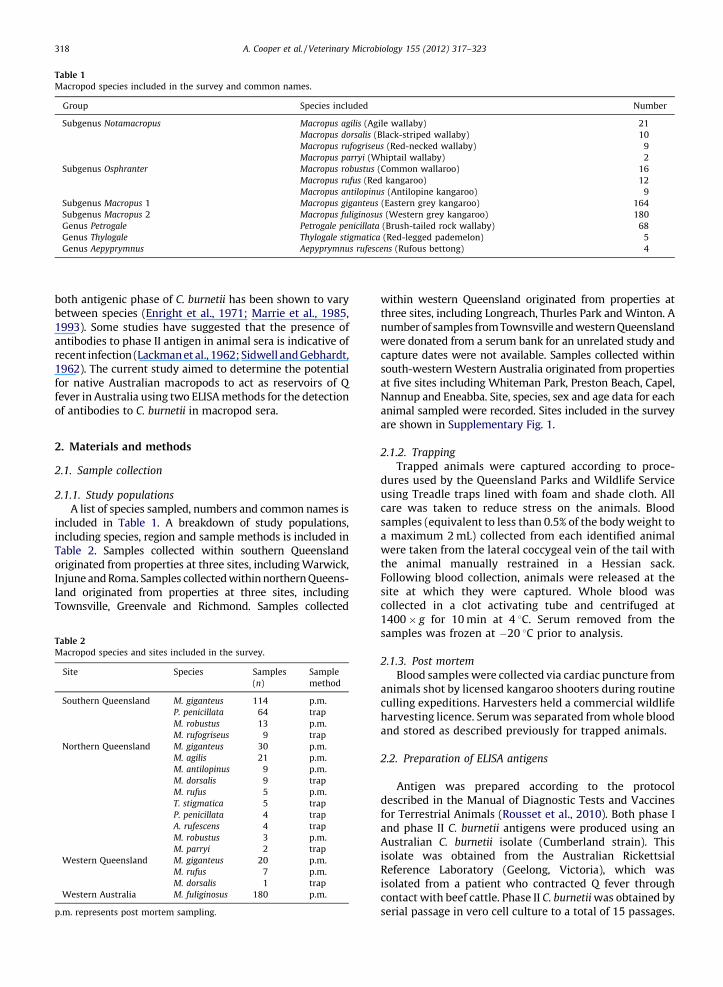
A list of species sampled, numbers and common names isincluded in Table 1. A breakdown of study populations,including species, region and sample methods is included inTable 2. Samples collected within southern Queenslandoriginated from properties at three sites, including Warwick,Injune and Roma. Samples collected within northern Queens-land originated from properties at three sites, includingTownsville, Greenvale and Richmond. Samples collected
within western Queensland originated from properties atthree sites, including Longreach, Thurles Park and Winton. Anumber of samples from Townsville and western Queenslandwere donated from a serum bank for an unrelated study andcapture dates were not available. Samples collected withinsouth-western Western Australia originated from propertiesat five sites including Whiteman Park, Preston Beach, Capel,Nannup and Eneabba. Site, species, sex and age data for eachanimal sampled were recorded. Sites included in the surveyare shown in Supplementary Fig. 1.
2.1.2. Trapping
Trapped animals were captured according to proce-dures used by the Queensland Parks and Wildlife Serviceusing Treadle traps lined with foam and shade cloth. Allcare was taken to reduce stress on the animals. Bloodsamples (equivalent to less than 0.5% of the body weight toa maximum 2 mL) collected from each identified animalwere taken from the lateral coccygeal vein of the tail withthe animal manually restrained in a Hessian sack.Following blood collection, animals were released at thesite at which they were captured. Whole blood wascollected in a clot activating tube and centrifuged at1400 � g for 10 min at 4 8C. Serum removed from thesamples was frozen at �20 8C prior to analysis.
2.1.3. Post mortem
Blood samples were collected via cardiac puncture fromanimals shot by licensed kangaroo shooters during routineculling expeditions. Harvesters held a commercial wildlifeharvesting licence. Serum was separated from whole bloodand stored as described previously for trapped animals.
2.2. Preparation of ELISA antigens
Antigen was prepared according to the protocoldescribed in the Manual of Diagnostic Tests and Vaccinesfor Terrestrial Animals (Rousset et al., 2010). Both phase Iand phase II C. burnetii antigens were produced using anAustralian C. burnetii isolate (Cumberland strain). Thisisolate was obtained from the Australian RickettsialReference Laboratory (Geelong, Victoria), which wasisolated from a patient who contracted Q fever throughcontact with beef cattle. Phase II C. burnetii was obtained byserial passage in vero cell culture to a total of 15 passages.
Table 2
Macropod species and sites included in the survey.
Site Species Samples
(n)
Sample
method
Southern Queensland M. giganteus 114 p.m.
P. penicillata 64 trap
M. robustus 13 p.m.
M. rufogriseus 9 trap
Northern Queensland M. giganteus 30 p.m.
M. agilis 21 p.m.
M. antilopinus 9 p.m.
M. dorsalis 9 trap
M. rufus 5 p.m.
T. stigmatica 5 trap
P. penicillata 4 trap
A. rufescens 4 trap
M. robustus 3 p.m.
M. parryi 2 trap
Western Queensland M. giganteus 20 p.m.
M. rufus 7 p.m.
M. dorsalis 1 trap
Western Australia M. fuliginosus 180 p.m.
p.m. represents post mortem sampling.
Table 1
Macropod species included in the survey and common names.
Group Species included Number
Subgenus Notamacropus Macropus agilis (Agile wallaby) 21
Macropus dorsalis (Black-striped wallaby) 10
Macropus rufogriseus (Red-necked wallaby) 9
Macropus parryi (Whiptail wallaby) 2
Subgenus Osphranter Macropus robustus (Common wallaroo) 16
Macropus rufus (Red kangaroo) 12
Macropus antilopinus (Antilopine kangaroo) 9
Subgenus Macropus 1 Macropus giganteus (Eastern grey kangaroo) 164
Subgenus Macropus 2 Macropus fuliginosus (Western grey kangaroo) 180
Genus Petrogale Petrogale penicillata (Brush-tailed rock wallaby) 68
Genus Thylogale Thylogale stigmatica (Red-legged pademelon) 5
Genus Aepyprymnus Aepyprymnus rufescens (Rufous bettong) 4

CelcenweHossep20 825%Thereswit20 8cell
pasCdhsacwit7 dbacBacina
mephaGerantinitwhagaobtantinitexpnegrantionbur
as cmu
2.3.
50
carbatpostemdiluincser(prthephawehorbovincafte6-s37
A. Cooper et al. / Veterinary Microbiology 155 (2012) 317–323 319
l suspensions and supernatants were pooled andtrifuged at 1000 � g at 20 8C for 10 min. Supernatantsre discarded and the cells resuspended in PBS, pH 7.4.t cells were disrupted by sonication and bacteria werearated from cell debris by centrifugation at 550 � g atC for 10 min. The resultant supernatant was layered over
sucrose and centrifuged at 4500 � g at 20 8C for 20 min. supernatant was discarded and the purified C. burnetii
uspended in PBS, pH 7.4. The bacteria were inactivatedh 1% formalin for 48 h at 4 8C, pelleted at 10,000 � g atC for 10 min and washed three times. The inactivateds were resuspended in sterile ddH2O.Phase I C. burnetii antigen was produced via animalsage in A/J mice (Inbred albino: Tyrc, Tyrp1b, a,23ahl, H-2a) followed by a single passage in the yolk
of embryonated chicken eggs. Mice were inoculatedh 1 � 104 C. burnetii intra peritoneal and maintained forays at which time the spleens were removed forterial extraction as described above for phase II antigen.teria were separated from egg yolk and formalin-ctivated as described above for phase II antigen.Phase II and I antigenicity was confirmed by comple-nt block titration using commercial anti-C. burnetii
se II and I control sera and antigens (Virion/Serion,many). Commercially available phase II and I C. burnetii
igens and control sera (Virion/Serion, Germany) wereially used for comparison and standardisation of theole cell antigen. Absorbance values for control serainst commercial antigen were comparable to thoseained with control sera against prepared whole celligen. Both the competitive and indirect ELISAs wereially optimised and validated using serum from miceerimentally infected with C. burnetii and PBS inoculatedative controls. A total of 30 macropod samples weredomly selected and screened using reagent concentra-s determined using murine optimisation to identify C.
netii-positive and negative samples for subsequent useontrol sera. Positive thresholds were validated againstrine and canine C. burnetii-positive and negative sera.
Competitive ELISA
NUNCTM 96-well Maxisorp plates were coated withmL of phase II or phase I antigen at 25 mg mL�1 inbonate/bicarbonate coating buffer, pH 9.0 and incu-ed overnight at 37 8C. Plates were coated with 50 mLt-coating buffer (Tropbio, Australia), incubated at roomperature for 2 h then dried. Test sera were applied at ation of 1:10 in 50 mL aliquots in duplicate and
ubated at 37 8C for 1 h. Positive and negative controla were also included in duplicate. Indicator serumeviously defined, C. burnetii-positive bovine sera) wasn applied at a dilution of 1:200 for both antigenicses and incubated at 37 8C for a further 1 h. The wells
re washed three times with PBS-T after which 50 mLse-radish peroxidase (HRP)-conjugated rabbit anti-ine Ig (Serotec, UK) at 1:1000 was applied and
ubated at 37 8C for 1 h. The wells were washed again,r which 50 mL 2,20-azino-bis-3-ethylbenzothiazoline-
ulphonic acid (ABTS) was applied and incubated at8C for 30 min. Optical density readings were obtained
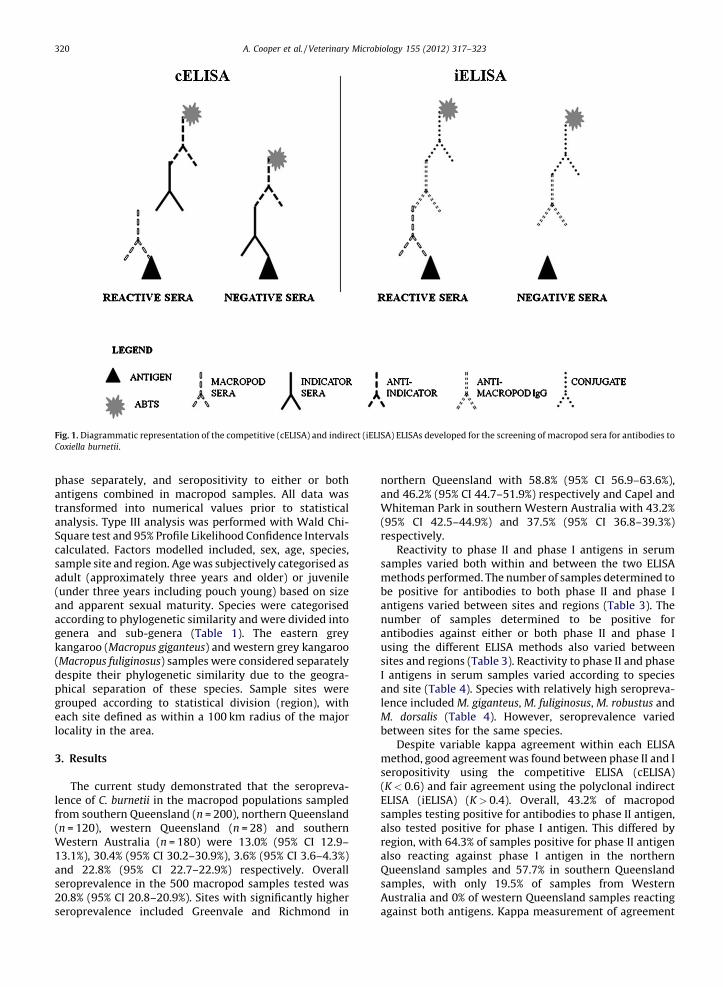
using a Multiskan Ascent plate reader at 414/494 nm. Areduction in optimal density of �70% from that of theindicator serum alone was considered to be a positiveresult. Results of duplicates for each sample were averagedto produce a mean result for each animal. A diagrammaticrepresentation of the competitive ELISA is included inFig. 1. A distribution of optical density values for the cELISAis included in Supplementary Fig. 2.
2.4. Indirect ELISA
NUNCTM 96-well Maxisorp plates were coated withphase II or phase I antigen and stabilised as describedpreviously for the competitive ELISA (cELISA). Test serawere applied at a dilution of 1:100 in 50 mL aliquots induplicate and incubated at 37 8C for 1 h. Positive andnegative control sera were also included in duplicate. Thewells were washed three times with PBS-T after which50 mL of chicken anti-macropod IgG polyclonal antibody(in-house production) was applied at a dilution of 1:250 forboth antigenic phases and incubated at 37 8C for a further1 h. The wells were then washed four times with PBS-Tafter which 50 mL HRP-conjugated rabbit anti-chicken IgY(Jackson, USA) at 1:2000 was applied and incubated at37 8C for 1 h. The wells were washed again, after which50 mL ABTS was applied and incubated at 37 8C for 30 min.Optical density readings were obtained using a MultiskanAscent plate reader at 414/494 nm. The Sample/PositiveRatio (S/P%) was calculated for each sample using thefollowing formula: S/P% = (OD sample � OD negative con-trol)/(OD positive control � OD negative control) � 100.Sera with an S/P% less than 50% were considered to benegative. Samples with an S/P% of between 50% and 75%were considered to be positives; those greater than 75%were considered strongly positive. Results of duplicates foreach sample were averaged to produce a mean result foreach animal. A diagrammatic representation of the indirectELISA is included in Fig. 1. A distribution of optical densityvalues for the cELISA is included in Supplementary Fig. 2.Chicken anti-macropod IgG polyclonal antibodies wereproduced following immunisation of white leghornchickens with purified macropod IgG according tostandard protocols.
2.5. Statistical analyses
Percentage seropositivity was calculated by dividingthe number of positive samples by the total number ofsamples and multiplying by 100. Comparison of seropo-sitivity between sites and regions was performed usingsingle factor ANOVA tests. Agreement between (cELISA andiELISA) and within ELISAs (phase II and phase I) wasdetermined by kappa measurement of agreement. A kappa(K) value of 1 indicates perfect agreement and a value of 0indicates no agreement. Excellent agreement is indicatedby values greater than 0.75, fair to good agreementby values of 0.4–0.75 and poor agreement by values lessthan 0.4.
An ordinal logistic generalised linear model wasconstructed using SPSS Statistics 19 (IBM, USA) to identifyfactors associated with seropositivity for each antigenic
A. Cooper et al. / Veterinary Microbiology 155 (2012) 317–323320
phase separately, and seropositivity to either or bothantigens combined in macropod samples. All data wastransformed into numerical values prior to statisticalanalysis. Type III analysis was performed with Wald Chi-Square test and 95% Profile Likelihood Confidence Intervalscalculated. Factors modelled included, sex, age, species,sample site and region. Age was subjectively categorised asadult (approximately three years and older) or juvenile(under three years including pouch young) based on sizeand apparent sexual maturity. Species were categorisedaccording to phylogenetic similarity and were divided intogenera and sub-genera (Table 1). The eastern greykangaroo (Macropus giganteus) and western grey kangaroo(Macropus fuliginosus) samples were considered separatelydespite their phylogenetic similarity due to the geogra-phical separation of these species. Sample sites weregrouped according to statistical division (region), witheach site defined as within a 100 km radius of the majorlocality in the area.
3. Results
The current study demonstrated that the seropreva-lence of C. burnetii in the macropod populations sampledfrom southern Queensland (n = 200), northern Queensland(n = 120), western Queensland (n = 28) and southernWestern Australia (n = 180) were 13.0% (95% CI 12.9–13.1%), 30.4% (95% CI 30.2–30.9%), 3.6% (95% CI 3.6–4.3%)and 22.8% (95% CI 22.7–22.9%) respectively. Overallseroprevalence in the 500 macropod samples tested was20.8% (95% CI 20.8–20.9%). Sites with significantly higher
northern Queensland with 58.8% (95% CI 56.9–63.6%),and 46.2% (95% CI 44.7–51.9%) respectively and Capel andWhiteman Park in southern Western Australia with 43.2%(95% CI 42.5–44.9%) and 37.5% (95% CI 36.8–39.3%)respectively.
Reactivity to phase II and phase I antigens in serumsamples varied both within and between the two ELISAmethods performed. The number of samples determined tobe positive for antibodies to both phase II and phase Iantigens varied between sites and regions (Table 3). Thenumber of samples determined to be positive forantibodies against either or both phase II and phase Iusing the different ELISA methods also varied betweensites and regions (Table 3). Reactivity to phase II and phaseI antigens in serum samples varied according to speciesand site (Table 4). Species with relatively high seropreva-lence included M. giganteus, M. fuliginosus, M. robustus andM. dorsalis (Table 4). However, seroprevalence variedbetween sites for the same species.
Despite variable kappa agreement within each ELISAmethod, good agreement was found between phase II and Iseropositivity using the competitive ELISA (cELISA)(K < 0.6) and fair agreement using the polyclonal indirectELISA (iELISA) (K > 0.4). Overall, 43.2% of macropodsamples testing positive for antibodies to phase II antigen,also tested positive for phase I antigen. This differed byregion, with 64.3% of samples positive for phase II antigenalso reacting against phase I antigen in the northernQueensland samples and 57.7% in southern Queenslandsamples, with only 19.5% of samples from WesternAustralia and 0% of western Queensland samples reacting
Fig. 1. Diagrammatic representation of the competitive (cELISA) and indirect (iELISA) ELISAs developed for the screening of macropod sera for antibodies to
Coxiella burnetii.
against both antigens. Kappa measurement of agreement
seroprevalence included Greenvale and Richmond in
A. Cooper et al. / Veterinary Microbiology 155 (2012) 317–323 321
between ELISA methods was minimal, with only 7 of the500 samples (1.4%) determined to be positive using bothELISA methods (K < 0.4). Overall seropositivity in macro-pod samples in the various regions tested, as determinedusing both ELISA methods is displayed in Table 3.
Statistically significant factors associated with seropo-sitivity to phase II antigen using both ELISAs included sex(P < 0.05), site (P < 0.01) and region (P < 0.01) with maleanimals, animals from Greenvale, Whiteman Park andanimals from northern Queensland found more likely to bepositive (Table 5). Both site and region were significantlyassociated with seropositivity to phase I antigen using bothELISAs (P < 0.01). Specifically, animals from Richmond,Greenvale and animals from northern Queensland werefound more likely to be positive (Table 5). Statisticallysignificant factors associated with seropositivity to eitheror both C. burnetii antigens were similar to those for eachantigen individually. These factors included site (P < 0.01)and region (P < 0.01). Within these it was found thatanimals from Greenvale, Capel, Whiteman Park andanimals from northern Queensland were more likely tohave antibodies to C. burnetii (Table 5). No significantassociations were found between seropositivity and age orspecies.
4. Discussion
Seropositivity rates found in the current study aresimilar to those reported in previous studies in Queensland(Pope et al., 1960) and Western Australia (Banazis et al.,2010). Several sites were found to have higher thanexpected numbers of seropositive macropods. Theseincluded Greenvale (QLD), Richmond (QLD), Capel (WA)and Whiteman Park (WA). Northern Queensland as awhole also had higher than expected numbers ofseropositive animals. The relatively high seroprevalencefound at Whiteman Park is noteworthy due to its locationin an urban area.
Seropositivity varied for phase II and phase I antigensdepending on the ELISA method used. Combined seropo-sitivity for either or both phase II and I antigens also variedbetween ELISA methods. In the current study, seroposi-tivity was generally higher for phase II antigen than phase Iantigen, with the exception of the northern Queenslandmacropod cohort.
Seropositivity was similar for phase II and phase Iantigens using the cELISA for all species tested, with manyof these samples testing positive for both antigens (K = 0.6).This ELISA method also resulted in the highest seroposi-tivity values for the various species. The greater number ofpositive samples detected by the cELISA is thought to bedue to the choice of indicator sera and conjugate. Stronglyreacting bovine sera was used as the indicator, combinedwith anti-bovine Ig conjugate, as bovine sera was found tohave no cross-reactivity with the IgG of other speciestested. As the conjugate was not immunoglobulin isotypespecific, it would be able to detect bovine immunoglobulinof all potential isotypes. It is hypothesised that due to thisfactor, prevention of the indicator sera from binding to C.
burnetii antigens by the test sera would indicate thepresence of any potential immunoglobulin isotypes in theT
ab
le3
Se
rop
rev
ale
nce
of
an
ti-C
oxi
ella
bu
rnet
iia
nti
bo
die
sin
ma
cro
po
ds
usi
ng
two
ELI
SA
me
tho
ds.
Re
gio
ns
(sit
es)
Sa
mp
les
(n)
Se
rop
rev
ale
nce
%(9
5%
CI)
Ph
ase
IIP
ha
seI
Ph
ase
IIA
ND
/OR
I
cELI
SA
iELI
SA
Bo
thcE
LIS
AiE
LIS
AB
oth
cELI
SA
iELI
SA
Bo
th
So
uth
ern
Qu
ee
nsl
an
d(S
Q)
(Wa
rwic
k,
Inju
ne
,R
om
a)
20
08
.0(7
.9–
8.1
)5
.5(5
.5–
5.6
)1
3.0
(12
.9–
13
.1)
6.5
(6.3
–6
.6)
1.0
(1.0
–1
.0)
7.5
(7.5
–7
.6)
8.5
(7.5
–9
.5)
5.5
(5.5
–5
.6)
13
.0
(12
.9–
13
.1)
No
rth
ern
Qu
ee
nsl
an
d(N
Q)
(To
wn
svil
le,
Gre
en
va
le,
Ric
hm
on
d)
92
16
.3
(16
.2–
16
.6)
7.6
(7.6
–7
.8)
21
.7
(21
.6–
22
.1)
20
.7
(20
.5–
21
.0)
9.8
(9.7
–1
0.0
)
28
.3
(28
.0–
31
.2)
22
.8
(22
.7–
23
.2)
10
.9
(10
.8–
11
.1)
30
.4
(30
.2–
30
.9)
We
ste
rnQ
ue
en
sla
nd
(WQ
)
(Lo
ng
rea
ch,
Th
url
es
Pa
rk,
Win
ton
)
28
0.0
(0.0
–0
.4)
3.6
(3.6
–4
.3)
3.6
(3.6
–4
.3)
0.0
(0.0
–0
.4)
0.0
(0.0
–0
.4)
0.0
(0.0
–0
.4)
0.0
(0.0
–0
.4)
3.6
(3.6
–4
.3)
3.6
(3.6
–4
.3)
So
uth
-we
ste
rnW
est
ern
Au
stra
lia
(WA
)
(Pre
sto
nB
ea
ch,
Ca
pe
l,N
an
nu
p,
Wh
ite
ma
nP
ark
,E
ne
ab
ba
)
18
08
.3
(8.3
–8
.4)
16
.8
(16
.6–
16
.8)
17
.8
(17
.7–
17
.9)
5.0
(5.0
–5
.1)
5.0
(5.0
–5
.1)
9.4
(9.4
–9
.5)
11
.7
(11
.6–
11
.8)
18
.4
(18
.3–
18
.5)
22
.8
(22
.7–
22
.9)
To
tal
50
09
.2
(9.1
9–
9.2
2)
9.8
(9.7
9–
9.8
3)
15
.8
(15
.77
–1
5.8
4)
8.2
(8.1
9–
8.2
2)
4.0
(4.0
–4
.01
)
11
.6
(11
.58
–1
1.6
3)
9.8
(9.7
9–
9.8
3)
11
.0
(10
.98
–1
1.0
3)
20
.8
(20
.8–
20
.9)

A. Cooper et al. / Veterinary Microbiology 155 (2012) 317–323322
test sera. Immunoglobulin isotypes associated with Q feverin human serology include IgM and IgG predominately,and also IgA (Angelakis and Raoult, 2010). Therefore, it isthought that the seropositivity determined using thecELISA, may represent antibodies to C. burnetii from thesethree immunoglobulin isotypes. However, the only anti-bodies that would be detected in the test sera using cELISAare those that bind to the same epitopes in the antigenpreparation as the indicator sera. Conversely, it is thoughtthat the positive samples detected by the iELISA maymainly represent IgG1 antibody as this would have beenthe predominant isotype present in the inoculum used toproduce the polyclonal antibody. The poor kappa agree-
ment between the ELISA methods is also thought to be dueto epitope differences, as IgG1 is protein specific and IgG2
carbohydrate specific. As whole cell antigen preparationswere used in the ELISAs, both protein and lipopolysacchar-ide antigens would be present.
Two ELISA methods were developed for the detectionof antibodies to C. burnetii in native Australian marsu-pials. As can be seen in the current study, the choice ofELISA method and conjugate greatly affects the detectionof antibodies. Antibody responses to C. burnetii in theanimals tested were highly heterogeneous, a findingwhich was consistent with human Q fever serology. Asimilar discrepancy in the estimation of seroprevalence ina population was demonstrated in a recent human studyusing two different serological assays (Blaauw et al.,2011). The heterogeneity of the antibody response toC. burnetii infection complicates serological investigationand epidemiological studies. The development of diag-nostic tests for native wildlife is complicated by a lack ofdiagnostic reagents for these animals. In serosurveys, thecELISA developed in the current study would be ofgreatest advantage, whereas, in isotype specific studiesthe iELISA may be of greater worth. Further work wouldbe required in animal serology in order to determine thepattern of antibody production in response to C. burnetii.Such patterns may differ between species and mayindicate relative recentness of infection and whetheranimals are chronically infected. Additional work wouldalso be required to establish the identity of theimmunoglobulin subsets detected in the current study,
Table 4
Seroprevalence of anti-C. burnetii antibodies in macropod species sampled.
Site Species Samples (n) Positive (n) Seroprevalence (95% CI)
Warwick (SQ) P. penicillata 64 7 10.9% (10.9–11.3%)
M. robustus 13 3 23.1% (22.7–27.2%)
M. rufogriseus 9 0 0.0% (0–3.8%)
M. giganteus 8 2 25.0% (24.6–33.1%)
Injune (SQ) M. giganteus 83 12 14.5% (14.4–14.7%)
Roma (SQ) M. giganteus 23 2 8.7% (8.6–9.9%)
Townsville (NQ) M. agilis 16 1 6.3% (6.2–8.1%)
M. giganteus 13 5 38.5% (37.4–43.7%)
M. antilopinus 9 1 11.1% (11.1–16.4%)
M. dorsalis 8 2 25.0% (24.6–33.1%)
T. stigmatica 5 2 40.0% (38.9–57.0%)
P. penicillata 4 0 0.0% (0.0–15.1%)
A. rufescens 4 0 0.0% (0.0–15.1%)
M. parryi 2 0 0.0% (0.0–42.1%)
Richmond (NQ) M. giganteus 5 2 40.0% (38.9–57.0%)
M. rufus 5 1 20.0% (19.9–34.3%)
M. robustus 3 2 66.7% (63.5–99.7%)
M. dorsalis 1 1 100% (97.5–100%)
Greenvale (NQ) M. giganteus 12 7 58.3% (56.0–65.4%)
M. agilis 5 3 60.0% (57.1–78.9%)
Longreach (WQ) M. giganteus 17 1 5.9% (5.9–7.6%)
M. dorsalis 1 0 0.0% (0.0–97.5%)
Thurles park (WQ) M. rufus 7 0 0.0% (0.0–5.9%)
M. giganteus 1 0 0.0% (0.0–97.5%)
Winton (WQ) M. giganteus 2 0 0.0% (0.0–42.1%)
Preston Beach (WA) M. fuliginosus 60 10 16.7% (16.5–17.2%)
Capel (WA) M. fuliginosus 37 16 43.2% (42.5–44.9%)
Nannup (WA) M. fuliginosus 34 3 8.8% (8.8–9.5%)
Whiteman Park (WA) M. fuliginosus 32 12 37.5% (36.8–39.3%)
Eneabba (WA) M. fuliginosus 17 0 0.0% (0.0–1.1%)
Table 5
Factors associated with seropositivity to C. burnetii in macropods.
Factor Risk ratio Odds ratio P
Seropositivity to phase II antigen
Greenvale origin 2.7 3.9 <0.05
Whiteman Park origin 2.3 3.0 <0.05
Northern Queensland origin 1.5 1.6 <0.01
Male 1.5 1.6 <0.05
Seropositivity to phase I antigen
Greenvale origin 9.2 20.8 <0.01
Richmond origin 6.5 11.1 <0.05
Northern Queensland origin 7.7 10.3 <0.01
Seropositivity to either/both phase II/I antigen
Greenvale origin 3.4 6.8 <0.01
Capel origin 2.6 3.8 <0.05
Whiteman Park origin 2.1 2.8 <0.05
Northern Queensland origin 1.9 2.3 <0.01

as
curHowinfea paniproin
detclasinfe
westupotTheconbe amareshabincnorinccomtheevipub
Con
Rol
TecDefdesscripub
Ack
of
ana
A. Cooper et al. / Veterinary Microbiology 155 (2012) 317–323 323
isotype-specific and subclass-specific regents are notrently available for native Australian marsupials.
ever, this work would require the experimentalction of Australian native marsupials with C. burnetii,
rocess that is unlikely to be approved under existingmal ethics regulations. Ultimately, the aim of thisject was to detect circulating antibodies to C. burnetii
native Australian marsupials and the subsequentection of antibodies of multiple isotypes and sub-ses, while confusing, provides evidence of priorction with C. burnetii in these species.
In conclusion, it was found that antibodies to C. burnetii
re detected in all native macropod species tested in thisdy. This result indicates that these animals areential and highly probable reservoirs of C. burnetii.
increasing incidence of human Q fever cases where notact with more typical reservoir species is present mayttributable to contact with atypical reservoirs, such as
rsupials. Housing shortages in Queensland haveulted in residential areas expanding into wildlifeitats throughout the State. There has also been an
rease in demand for semi-rural housing estates inthern Queensland. These developments wouldrease the exposure of the human population and
panion animals to wildlife. The close association ofse species with human habitation, combined with thedence of exposure to C. burnetii may have importantlic health implications.
flicts of interest
No competing financial interests exist.
e of the funding source
This study was funded by the Defence, Science andhnology Organisation; Australian Department ofence. The study sponsors had no involvement in studyign, data collection, analysis and interpretation; manu-pt writing or decision to submit this manuscript forlication.
nowledgements
The authors would like to acknowledge the assistanceAssociate Professor Leigh Owens with the statisticallyses.
Appendix A. Supplementary data
Supplementary data associated with this article can befound, in the online version, at doi:10.1016/j.vetmic.2011.08.023.
References
Angelakis, E., Raoult, D., 2010. Q fever. Vet. Microbiol. 140, 3–4.Babudieri, B., 1959. Q fever: a zoonosis. Adv. Vet. Sci. 5, 180.Banazis, M., Bestall, A., Reid, S., Fenwick, S., 2010. A survey of Western
Australian sheep, cattle and kangaroos to determine the prevalence ofC. burnetii. Vet. Microbiol. 143, 2–4.
Blaauw, G., Notermans, D., Schimmer, B., Meekelenkamp, J., Reimerink, J.,Teunis, P., Schneeberger, P., 2011. The application of an enzyme-linked immunosorbent assay or an immunofluorescent assay testleads to different estimates of seroprevalence of Coxiella burnetii inthe population. Epidemiol. Infect., doi:10.1017/S0950268811000021.
Camacho, M., Outshoorn, I., Kovacova, E., Tellez, A., 2000. Distribution ofimmunoglobulin G (IgG) and A (IgA) subclasses following Q fevervaccination with soluble phase I Coxiella burnetii extract. Vaccine 18,1773–1777.
Capo, C., Iorgulescu, I., Mutillod, M., Mege, J., Raoult, D., 1998. Increases inthe levels of Coxiella burnetii-specific immunoglobulin G1 and G3antibodies in acute Q fever and chronic Q fever. Clin. Diagn. Lab.Immunol. 5, 814–816.
Chong, A., La Brooy, J., Norton, R., Masson, J., 2003. Q fever: a recent‘outbreak’ in Townsville. Intern. Med. J. 33, 208–210.
Enright, J., Franti, C., Behymer, D., Longhurst, W., Dutson, V., Wright, M.,1971. Coxiella burnetii in a wildlife-livestock environment: Distribu-tion of Q fever in wild mammals. Am. J. Epidemiol. 94, 79–90.
Fournier, P., Raoult, D., 1999. Predominant immunoglobulin A response tophase II antigen of Coxiella burnetii in acute Q fever. Clin. Diagn. Lab.Immunol. 2, 173–177.
Gale, M., Ketheesan, N., Govan, B., Kennedy, R., Norton, R., 2007. Q fevercases at a North Queensland centre during 1994–2006. Intern. Med. J.37, 644–646.
Lackman, D., Frommhagen, L., Jensen, F., Lennette, E., 1962. Q fever studiesXXIII: antibody patterns against Coxiella burnetii. Am. J. Hyg. 75, 158–167.
Lang, D., 1990. Coxiellosis (Q fever) in animals. In: Marrie, T. (Ed.), Q fever,vol 1. Boca Raton, CRC Press.
Marrie, T., Van Buren, J., Fraser, J., Haldane, E., Faulkner, R., Williams, J.,Kwan, C., 1985. Seroepidemiology of Q fever among domestic animalsin Nova Scotia. Am. J. Public Health 75, 763–766.
Marrie, T., Embil, J., Yates, L., 1993. Seroepidemiology of Coxiella burnetiiamong wildlife in Nova Scotia. Am. J. Trop. Med. Hyg. 49, 613–615.
Maurin, M., Raoult, D., 1999. Q fever. Clin. Microbiol. Rev. 12, 518–553.Pope, J., Scott, W., Dwyer, R., 1960. Coxiella burnetii in kangaroos and
kangaroo ticks in western Queensland. Aust. J. Exp. Biol. Med. Sci. 38,17–27.
Rousset, E., Sidi-Boumedine, K., Thiery, R., 2010. Q fever. In: Manual ofDiagnostic Tests and Vaccines for Terrestrial Animals: Chapter 2.1.12,World Organisation for Animal Health, Paris.
Sidwell, R., Gebhardt, L., 1962. Q fever antibody response in experimen-tally infected wild rodents and laboratory animals. J. Immunol. 89,318–322.
Smith, D., Derrick, E., 1939. Studies in the epidemiology of Q fever I: theisolation of six strains of Rickettsia burnetii from the tick Haemaphy-salis humerosa. Aust. J. Exp. Biol. Med. Sci. 18, 1–8.
Smith, D., 1942. Studies in the epidemiology of Q fever X: the transmis-sion of Q fever by the tick Ixodes holocyclus. Aust. J. Exp. Biol. Med. Sci.20, 213–217.