Determination of Capsaicin and Dihydrocapsaicin in ... - MDPI
11
Molecules 2011, 16, 8919-8929; doi:10.3390/molecules16108919 molecules ISSN 1420-3049 www.mdpi.com/journal/molecules Article Determination of Capsaicin and Dihydrocapsaicin in Capsicum Fruit Samples using High Performance Liquid Chromatography Zeid Abdullah Al Othman, Yacine Badjah Hadj Ahmed *, Mohamed Abdelaty Habila and Ayman Abdel Ghafar Department of Chemistry, College of Science, King Saud University, P.O. Box 2455, Riyadh 11451, Saudi Arabia * Author to whom correspondence should be addressed; E-Mail: [email protected]; Tel.: +96614677126; Fax: +96614675992. Received: 22 August 2011; in revised form: 14 October 2011 / Accepted: 15 October 2011 / Published: 24 October 2011 Abstract: The aim of the present study was to determine the content of capsaicin and dihydrocapsaicin in Capsicum samples collected from city markets in Riyadh (Saudi Arabia), calculate their pungency in Scoville heat units (SHU) and evaluate the average daily intake of capsaicin for the population of Riyadh. The investigated samples consisted of hot chillies, red chillies, green chillies, green peppers, red peppers and yellow peppers. Extraction of capsaicinoids was done using ethanol as solvent, while high performance liquid chromatography (HPLC) was used for separation, identification and quantitation of the components. The limit of detection (LOD) of the method was 0.09 and 0.10 μg/g for capsaicin and dihydrocapsaicin, respectively, while the limit of quantification (LOQ) was 0.30 and 0.36 μg/g for capsaicin and dihydrocapsaicin, respectively. Hot chillies showed the highest concentration of capsaicin (4249.0 ± 190.3 μg/g) and the highest pungency level (67984.60 SHU), whereas green peppers had the lowest detected concentration (1.0 ± 0.9 μg/g); green peppers, red peppers and yellow peppers were non pungent. The mean consumption of peppers for Riyadh city population was determined to be 15.5 g/person/day while the daily capsaicin intake was 7.584 mg/person/day. Keywords: Capsicum; capsaicin; chilli; pepper; daily capsaicin intake; Scoville heat units OPEN ACCESS
-
Upload
khangminh22 -
Category
Documents
-
view
3 -
download
0
Transcript of Determination of Capsaicin and Dihydrocapsaicin in ... - MDPI

Molecules 2011, 16, 8919-8929; doi:10.3390/molecules16108919
molecules ISSN 1420-3049
www.mdpi.com/journal/molecules
Article
Determination of Capsaicin and Dihydrocapsaicin in Capsicum Fruit Samples using High Performance Liquid Chromatography
Zeid Abdullah Al Othman, Yacine Badjah Hadj Ahmed *, Mohamed Abdelaty Habila and
Ayman Abdel Ghafar
Department of Chemistry, College of Science, King Saud University, P.O. Box 2455, Riyadh 11451,
Saudi Arabia
* Author to whom correspondence should be addressed; E-Mail: [email protected];
Tel.: +96614677126; Fax: +96614675992.
Received: 22 August 2011; in revised form: 14 October 2011 / Accepted: 15 October 2011 /
Published: 24 October 2011
Abstract: The aim of the present study was to determine the content of capsaicin and
dihydrocapsaicin in Capsicum samples collected from city markets in Riyadh (Saudi
Arabia), calculate their pungency in Scoville heat units (SHU) and evaluate the average
daily intake of capsaicin for the population of Riyadh. The investigated samples consisted
of hot chillies, red chillies, green chillies, green peppers, red peppers and yellow peppers.
Extraction of capsaicinoids was done using ethanol as solvent, while high performance
liquid chromatography (HPLC) was used for separation, identification and quantitation of
the components. The limit of detection (LOD) of the method was 0.09 and 0.10 µg/g for
capsaicin and dihydrocapsaicin, respectively, while the limit of quantification (LOQ) was
0.30 and 0.36 µg/g for capsaicin and dihydrocapsaicin, respectively. Hot chillies showed
the highest concentration of capsaicin (4249.0 ± 190.3 µg/g) and the highest pungency
level (67984.60 SHU), whereas green peppers had the lowest detected concentration
(1.0 ± 0.9 µg/g); green peppers, red peppers and yellow peppers were non pungent. The
mean consumption of peppers for Riyadh city population was determined to be
15.5 g/person/day while the daily capsaicin intake was 7.584 mg/person/day.
Keywords: Capsicum; capsaicin; chilli; pepper; daily capsaicin intake; Scoville heat units
OPEN ACCESS

Molecules 2011, 16 8920
1. Introduction
Capsaicinoids are the compounds responsible for the pungency of pepper fruits and their products.
Peppers are the fruits of plants from the genus Capsicum and belong to the family Solanaceae. There
are several domesticated species of chili peppers, among them Capsicum annuum, C. frutescens and
C. chinense, which include many common varieties. These various peppers are widely used in many
parts of the world for their valued and characteristic sensory properties: color, pungency and aroma.
Pungency, a commercially important attribute of peppers, is due to the presence of chemicals from the
characteristic capsaicinoids group [1]. The two most abundant capsaicinoids in peppers are capsaicin
(8-methyl-N-vanillyl-trans-6-nonenamide) and dihydrocapsaicin, both constituting about 90%, with
capsaicin accounting for ~71% of the total capsaicinoids in most of the pungent varieties [2]. Capsaicin
content of peppers is one of the major parameters that determine its commercial quality [3-6].
Capsaicin is also considered as an active principle which accounts for the pharmaceutical properties
of peppers. It has been used as an analgesic against arthritis pain and inflammation [7]. It has also been
reported to show anticancer effect [8] and to be active against neurogenic inflammation (burning and
stinging of hands, mouth and eyes) [9]. The latter property is the basis for the use of capsaicin in
defensive pepper sprays. Capsaicin has also been reported to show protective effects against haigh
cholesterol levels and obesity [10]. Capsaicin and other members of the capsaicinoids group produce a
large number of physiological and pharmacological effects on the gastrointestinal tract, the
cardiovascular and respiratory system as well as the sensory and thermoregulation systems. These
effects result principally from the specific action of capsaicinoids on primary afferent neurons of the
C-fiber type. This specific influence provides the rationale for their use to treat some peripheral painful
states, such as rheumatoid arthritis [11-18]. However, high levels of capsaicin lead to negative health
impacts. In a case-control study in Mexico-City which included 220 cases of gastric cancer and 752
controls randomly selected from the general population, chili pepper consumers were at a 5.5-fold
greater risk for gastric cancer than non-consumers. Persons who rated themselves as heavy consumers
of chili peppers were at an even higher 17-fold greater risk. However, when chili pepper consumption
was measured as frequency per day, no significant dose to response relationship was observed [19].
The amount of capsaicin in a given variety can vary depending on the light intensity and
temperature at which the plant is grown, the age of the fruit, and the position of the fruit on the plant.
The first test developed to measure pungency was the Scoville test, first developed in 1912 by Wilbur
Scoville [20]. There are five levels of pungency classified using Scoville heat units (SHU): non-pungent
(0–700 SHU), mildly pungent (700–3,000 SHU), moderately pungent (3,000–25,000 SHU), highly
pungent (25,000–70,000 SHU) and very highly pungent (>80,000 SHU) [21]. Nowadays, however, the
Scoville organoleptic test has been largely replaced by chromatographic methods which are considered
to be more reliable and accurate [22]. Capsaicinoids are mainly ingested as naturally occurring
pungency-producing components of Capsicum spices (chili, cayenne pepper, red pepper). Their
concentrations typically range from 0.1 mg/g in chili pepper to 2.5 mg/g in red pepper and 60 mg/g in
oleoresin red pepper [23]. Pepper varieties from Capsicum annuum, C. frutescens and C. chinense
were found to contain 0.22–20 mg total capsaicinoids/g of dry weight [24]. In another study, cayenne
pepper samples had mean capsaicin and dihydrocapsaicin contents of 1.32 and 0.83 mg/g dry weight,
respectively [25]. The mean consumption of Capsicum spices was reported to be 2.5 g/person/day in

Molecules 2011, 16 8921
India, 5 g/person/day in Thailand [26] and 20 g/person (corresponding to one chili pepper) per day in
Mexico [19]. Assuming a content of capsaicinoids in these spices of about 1%, the daily intake of
capsaicinoids in these countries has been estimated to 25–200 mg/person/day, which corresponds in
the case of a person with 50 kg body weight to 0.5–4 mg/kg bw/day [27]. The maximum daily intake
of capsaicin in the U.S. and Europe from mild chilies and paprika was estimated to be roughly
0.025 mg/kg bw/day [28], which is equivalent to 1.5 mg/person/day. According to a recent estimation,
the mean and maximum intakes of capsaicin from industrially prepared food products containing the
recommended general limit of 5 µg/g, would be 0.77 and 2.64 mg/day, respectively [29].
Kingdom of Saudi Arabia (KSA) imports a lot of foodstuffs from several countries. These food
products may be grown in different areas and exposed to different environmental conditions: soil
composition, irrigation water and light density; so the objective of this work was to estimate the levels
of capsaicin and dihydrocapsaicin that may be present in some pepper samples available in local
markets in Riyadh city. These concentrations should allow us to calculate the Scoville heat units
(SHU), determine the pungency level of each type of pepper analyzed, evaluate the Riyadh population
daily intake of capsaicin, then compare the results with other studies carried out around the world to
know whether these levels exceed the accepted international range.
2. Results and Discussion
Extraction and quantitation steps were carried-out in duplicate for each sample. The standard
solutions used for the calibration curve were regularly injected at intervals between sample injections
to confirm the retention times. The chromatograms shown in Figures 1 and 2 correspond to a standard
and extracted solution, respectively; they reveal that capsaicin (a) and dihydrocapsaicin (b) are eluted
at 4.69 and 6.51 min, respectively.
Figure 1. Chromatogram of the standard solution corresponding to 100 µg/g of capsaicin
and dihydrocapsaicin (conditions: column Betasil C18 (150 × 4.6 mm × 3 μm), mobile
phase: H2O/CH3CN, 50:50 v/v, flow rate: 1.5 mL/min, UV detection at 222 nm).
0 1 2 3 4 5 6 7 (min)
c
a
b
(a) capsaicin(b) dihydrocapsaicin(c) nordihydrocapsaicin
0 1 2 3 4 5 6 7 (min)0 1 2 3 4 5 6 7 (min)
c
a
b
(a) capsaicin(b) dihydrocapsaicin(c) nordihydrocapsaicin
Molecules 2011, 16 8922
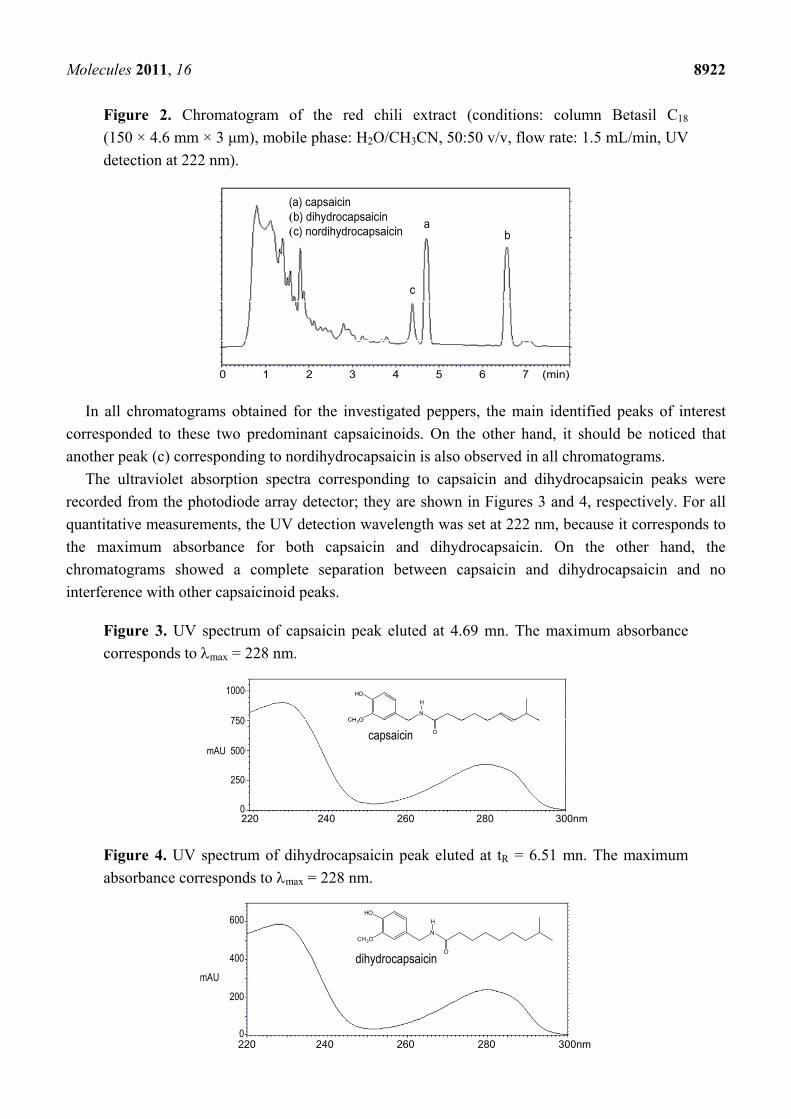
Figure 2. Chromatogram of the red chili extract (conditions: column Betasil C18
(150 × 4.6 mm × 3 μm), mobile phase: H2O/CH3CN, 50:50 v/v, flow rate: 1.5 mL/min, UV
detection at 222 nm).
0 1 2 3 4 5 6 7 (min)
c
ab
(a) capsaicin(b) dihydrocapsaicin(c) nordihydrocapsaicin
0 1 2 3 4 5 6 7 (min)0 1 2 3 4 5 6 7 (min)
c
ab
(a) capsaicin(b) dihydrocapsaicin(c) nordihydrocapsaicin
In all chromatograms obtained for the investigated peppers, the main identified peaks of interest
corresponded to these two predominant capsaicinoids. On the other hand, it should be noticed that
another peak (c) corresponding to nordihydrocapsaicin is also observed in all chromatograms.
The ultraviolet absorption spectra corresponding to capsaicin and dihydrocapsaicin peaks were
recorded from the photodiode array detector; they are shown in Figures 3 and 4, respectively. For all
quantitative measurements, the UV detection wavelength was set at 222 nm, because it corresponds to
the maximum absorbance for both capsaicin and dihydrocapsaicin. On the other hand, the
chromatograms showed a complete separation between capsaicin and dihydrocapsaicin and no
interference with other capsaicinoid peaks.
Figure 3. UV spectrum of capsaicin peak eluted at 4.69 mn. The maximum absorbance
corresponds to max = 228 nm.
220 240 260 280 300nm
1000
750
mAU 500
250
0
CH3ON
O
H
HO
capsaicin
220 240 260 280 300nm
1000
750
mAU 500
250
0220 240 260 280 300nm220 240 260 280 300nm
1000
750
mAU 500
250
0
CH3ON
O
H
HO
capsaicin
Figure 4. UV spectrum of dihydrocapsaicin peak eluted at tR = 6.51 mn. The maximum
absorbance corresponds to max = 228 nm.
220 240 260 280 300nm
600
400
mAU
200
0
dihydrocapsaicin
CH3ON
O
H
HO
220 240 260 280 300nm
600
400
mAU
200
0
dihydrocapsaicin
CH3ON
O
H
HO

Molecules 2011, 16 8923
The analytical method was validated by evaluating standard deviation, relative standard deviation,
the limit of detection (LOD) and the limit of quantification (LOQ) for both capsaicinoids. The obtained
results presented in Table 1 showed that the %RSD values were 1.01 and 0.57 for capsaicin and
dihydrocapsaicin, respectively. The limits of detection (LODs) of the proposed method were 0.09 and
0.1 µg/g for capsaicin and dihydrocapsaicin, respectively; while the limits of quantification (LOQs)
were 0.3 and 0.36 µg/g.
Table 1. Relative standard deviation, limits of detection (LOD) and quantitation (LOQ) for
capsaicin and dihydrocapsaicin.
Parameter Capsaicin Dihydrocapsaicin
Average peak area 2221184.0 1617453.4 SD 22485.5 9286.3
%RSD 1.01 0.57 LOD 0.09 0.1 LOQ 0.3 0.36
The data presented in Table 2 show the concentrations of capsaicin and dihydrocapsaicin, as well as
the pungency expressed in Scoville heat units (SHU) in the analyzed pepper samples. The mean
concentration of capsaicin in hot chili, red chili, green chili and green pepper was 4,249.0 ± 190.3,
309.3 ± 4.2, 138.5 ± 5.2, and 0.99 ± 0.9 µg/g respectively. On the other hand, the mean concentration
of dihydrocapsaicin was 4,482.2 ± 35.6, 238.2 ± 2.6, 146.4 ± 4.2 in the first three samples, and it was
not detected in green pepper. The highest pungency level evaluated in Scoville heat units (SHU) was
observed with hot chili, while green pepper, red pepper and yellow pepper showed lower values. As
shown in Table 3, the average daily capsaicin intake calculated for the population of Riyadh city was
7.584 mg/person/day.
Effective separation, identification and quantitation of the main characteristic capsaicinoids
extracted from the different investigated pepper samples were possible by HPLC, as shown in Table 2.
As mentioned in previous studies, the two most abundant capsaicinoids in peppers are capsaicin and
dihydrocapsaicin [2].
Table 2. Concentrations of capsaicin, dihydrocapsaicin and Scoville heat units (SHU) in
the analyzed pepper samples.
Pepper type Capsaicin
(µg/g) Dihydrocapsaicin
(µg/g) Scoville heat units (SHU)
Levels of pungency
Hot chili 4249.0 ± 190.3 4482.2 ± 35.6 67984.60 highly pungent Red chili 309.3 ± 4.2 238.2 ± 2.6 4949.08 moderately pungent
Green chili 138.5 ± 5.2 146.4 ± 4.2 2216.58 mildly pungent Green pepper 1.0 ± 0.9 ND 15.83 non-pungent Red pepper ND ND 0 non-pungent
Yellow pepper ND ND 0 non-pungent
ND: not detected.

Molecules 2011, 16 8924
Table 3. Average capsaicin daily intake in correlation with questionnaire.
Pepper type Capsaicin
(µg/g) Daily consumption
(g) Capsaicin daily intake
(mg/person/day)
Hot chili 4249.0 1.5 6.374 Red chili 309.3 3 0.928
Green chili 138.5 2 0.277 Green pepper 0.99 5 0.005 Red pepper 0 2 0
Yellow pepper 0 2 0
Average daily intake (mg/person/day) 7.584 Average daily intake (mg/kg body wt/day) 0.108
The corresponding pepper contents obtained in µg/g were converted to Scoville heat units (Table 2)
in order to classify them according to their various pungency levels. The results obtained showed that
the concentrations of both capsaicin and dihydrocapsaicin in the peppers used for this study varied in
the 0–4 mg/g range. The Capsicum green pepper, red pepper and yellow pepper had the lowest
capsaicinoids content and the lowest pungency, as compared to hot chili and red chili. The contents of
capsaicin and dihydrocapsaicin found in the present work for the different pepper varieties are in good
agreement with those found by other authors who reported that a variation in capsaicin concentration is
observed in the different peppers [30].
The results obtained in this study show that the contents of capsaicin (4,249.0 ± 190.3 µg/g) and
dihydrocapsaicin (4,482.2 ± 35.6µg/g) in hot chili were higher than those recorded for cayenne pepper
samples which had mean capsaicin and dihydrocapsaicin contents of 1,320 and 830 µg/g dry weight,
respectively [25]. The use of the SHU parameter is the recommended method for pepper evaluation as
it provides a better indicator of the pungency level, but it is considered less precise [31]. As shown in
Table 2, our results showed that the pungency of the analyzed samples is in the following order: hot
chili (highly pungent) > red chili (moderately pungent) > green chili (mildly pungent) > green pepper
(non pungent) > red pepper and yellow pepper (non pungent).
The estimated pepper consumption by the population of Riyadh city (15.5 g/person/day) was higher
than the values reported for India (2.5 g/person/day) and Thailand (5 g/person/day) [19] but lower than
that calculated in Mexico (20 g/person/day) [19]. The daily capsaicin intake was 7.584 mg/person/day,
which is higher than that for United States and Thailand, but lower than the value estimated for
Mexico. Finally, there could be a risk for the population of Riyadh city from the consumption of the
different peppers found in the local markets, as the daily capsaicin intake exceeds the maximum intake
of capsaicin which was estimated to 2.64 mg/day [29].
3. Experimental
3.1. Samples, Chemicals and Solvents
Food samples, including hot chili, red chili, green chili, green pepper, red pepper and yellow
pepper, were purchased from local markets in Riyadh city (Figure 5). All these pepper types are
varieties of Capsicum annuum L. and were imported fron India; the samples are preserved for any

Molecules 2011, 16 8925
further investigation. Capsaicin and dihydrocapsaicin standards were purchased from Fluka Chemical
Co. (Buchs, Switzerland). All solvents used as mobile phase were of HPLC grade and supplied by
Aldrich (Steinheim, Germany).
Figure 5. Pepper samples.
3.2. Extraction of Capsaicinoids
All samples were first dried, then extracted using the method of Collins et al. [30] with slight
modifications. For capsaicinoid extraction, each dried pepper sample (5 g) was placed in ethanol
(5 mL) in a 120 mL glass bottle equipped with a Teflon lined lid. Bottles were capped and placed in a
water bath at 80 °C for 4 hours, then swirled manually every hour. Samples were removed from the
water bath and cooled to room temperature. The supernatant layer of each sample (5 mL) was filtered
through 0.45 µm filter paper into a HPLC sample vial using a 5 mL disposable syringe (Millipore,
Bedford, MA, USA). The vial was capped and stored at 5 °C in a refrigerator until analysis.
3.3. Liquid Chromatographic Analysis
The HPLC analyses were carried out on a Thermo HPLC system equipped with a Finnigan
Surveyor Auto Sampler Plus, a Finnigan Surveyor LC Plus quaternary pump and a Surveyor
photodiode array (PDA) detector. The chromatographic conditions were as follows:
Betasil C18 column (particle size 3 μm, dimension 150 × 4.6 mm) from Thermo Electron (USA),
column temperature: 60 °C, sample temperature: 20 °C, sample volume: 5 μL,
UV detection wavelength at 222 nm,
mobile phase: binary mixture water-acetonitrile (CH3CN) at a 50:50 ratio, flow rate: 1.5 mL/min.
Figure 6. Calibration curve for capsaicin.
hot chili red chili green chili green pepper red pepper yellow pepper

Molecules 2011, 16 8926
Figure 7. Calibration curve for dihydrocapsaicin.
The following standard solutions were prepared from a stock solution of capsaicin and
dihydrocapsaicin using serial dilutions at 800, 600, 400, 200, 100, 50, 10, 1 and 0.5 µg/g. The standard
solutions were run on the high performance liquid chromatograph and the obtained standard curve
plots of peak area against concentration are shown on Figures 6 and 7.
During HPLC sample analyses, a standard solution was injected every 10 samples in order to
evaluate the retention time reproducibility and instrument calibration.
3.4. Capsaicinoids Quantitation
The major capsaicinoids in peppers, capsaicin and dihydrocapsaicin, were determined by
comparison to external reference standards injected under the same conditions. Their identification
was based on the retention times measured under identical HPLC conditions while their quantitative
determination in the different peppers samples was carried out using the peak areas. The ratio between
these capsaicinoids was calculated by dividing capsaicin and dihydrocapsaicin contents to the total
capsaicinoids [22]. The capsaicinoid concentrations in samples are expressed as µg/g pepper.
3.5. Scoville Heat Unit Conversions
According to the commonly accepted Scoville organoleptic test, the spicy strength of the
investigated samples was calculated by converting the capsaicin content expressed in grams of
capsaicin per gram of pepper. This conversion to Scoville heat units was done by multiplying the
capsaicin content in pepper dry weight by the coefficient corresponding to the heat value for pure
capsaicin, which is 1.6 × 10⁷ [32].
3.6. Estimation of Dietary Capsaicin Intake
The average capsaicin intake per person per day was estimated from a 24 hrs food questionnaire
which was distributed among two hundred and fifty families living in Riyadh city. The answers on the
quantities of food they consumed regularly were collected and the mean values were calculated by
multiplying the amount of each consumed pepper type by its mean capsaicin concentration; then the
average daily intake was calculated as explained in the following example.

Molecules 2011, 16 8927
Supposing a daily consumption of two types of pepper of 2 and 3 grams, with a corresponding
capsaicin concentration estimated to 1,000 µg/g and 500 µg/g, respectively; then the daily intake from
each type will be obtained by multiplying the weight of each consumed pepper by its mean capsaicin
concentration as follows:
daily intake from type 1 = 1,000 × 2 = 2,000 µg/day = 2 mg/day
daily intake from type 2 = 500 × 3 = 1,500 µg/day = 1.5 mg/day
The average daily intake of capsaicin (expressed in mg/person/day) will thus be:
= (2 + 1.5) = 3.5 mg/person/day
Assuming an average body weight of 70 kg, the daily capsaicin intake expressed in mg/kg body
wt/day will be:
= 3.5/70 = 0.05 mg/kg body wt/day
4. Conclusions
Six Capsicum samples were investigated in order to determine their capsaicinoids composition.
After extraction, the HPLC analyses allowed identification and determination of capsaicin and
dihydrocapsaicin which were the main capsaicinoids in the different chili and pepper samples. Hot
chili obtained from the local markets in Riyadh was the most pungent (67,984.60 SHU) among the
peppers studied. The pungency of analyzed samples decreased as follows: hot chili (highly pungent),
red chili (moderately pungent), green chili (mildly pungent), green pepper (non pungent), red pepper
and yellow pepper (non pungent). The average pepper consumption by the population of Riyadh city
and the corresponding daily capsaicin intake were 15.5 g/person/day and 7.584 mg/person/day,
respectively.
Conflict of Interest
The authors declare no conflict of interest.
Acknowledgments
The Authors extend their appreciation to the Deanship of Scientific Research at King Saud
University for funding the work through the research group project No RGP-VPP-043.
References
1. Perucka, I.; Materska, M. Phenylalanine ammonia-lyase and antioxidant activities of lipophilic
fraction of fresh pepper fruits Capsicum annuum L. Innovat. Food Sci. Emerg. Tech. 2001, 2,
189-192.
2. Kosuge, S.; Furuta, M. Studies on the pungent principle of Capsicum. Part XIV: Chemical
constitution of the pungent principle. Agric. Biol. Chem. 1970, 34, 248-256.

Molecules 2011, 16 8928
3. Kawabata, F.; Inoue, N.; Yazawa, S.; Kawada, T.; Inoue, K.; Fushiki, T. Effects of CH-19 sweet,
a non-pungent cultivar of red pepper, in decreasing the body weight and suppressing body fat
accumulation by sympathetic nerve activation in humans. Biosci. Biotechnol. Biochem. 2006, 70,
2824-2835.
4. Hachiya, S.; Kawabata, F.; Ohnuki, K.; Inoue, N.; Yoneda, H.; Yazawa, S.; Fushiki, T. Effects of
CH-19 Sweet, a non-pungent cultivar of red pepper, on sympathetic nervous activity, body
temperature, heart rate, and blood pressure in humans. Biosci. Biotechnol. Biochem. 2007, 71,
671-676.
5. Ohnuki, K.; Moritani, T.; Ishihara, K.; Fushiki, T. Capsaicin increases modulation of sympathetic
nerve activity in rats: measurement using power spectral analysis of heart rate fluctuations. Biosci.
Biotechnol. Biochem. 2001, 65, 638-643.
6. Zhang, L.L.; Liu, D.Y.; Ma, L.Q.; Luo, Z.D.; Cao, T.B.; Zhong, J.; Yan, Z.C.; Wang, L.J.;
Zhao, Z.G.; Zhu, S.J.; Schrader, M.; Thilo, F.; Zhu, M.Z.; Tepel, M. Activation of transient
receptor potential vanilloid type-1 channel prevents adipogenesis and obesity. Circ. Res. 2007,
100, 1063-1070.
7. Deal, C.L.; Schnitzer, T.J.; Lipstein, E.; Seibold, J.R.; Stevens, R.M.; Levy, M.D.; Albert, D.;
Renold, F. Treatment of arthritis with topical capsaicin: A double-blind trial. Clin. Ther. 1999, 13,
383-395.
8. Moore, D.J.; Moore, D.M. Synergistic Capsicum-tea mixtures with anticancer activity. J. Pharm.
Pharmacol. 2003, 55, 987-994.
9. Szolcsanyi, J. Forty years in capsaicin research for sensory pharmacology and physiology.
Neuropeptides 2004, 38, 377-384.
10. Kempaiah, R.K.; Manjunatha, H.; Srinivasan, K. Protective effect of dietary capsaicin on induced
oxidation of low-density lipoprotein in rats. Mol. Cell. Biochem. 2005, 275, 7-13.
11. Iida, T.; Moriyama, T.; Kobata, K. TRPV1 activation and induction of nociceptive response by a
non-pungent capsaicin-like compound, capsiate. Neuropharmacology 2003, 44, 958-967.
12. Inoue, N.; Matsunaga, Y.; Satoh, H.; Takahashi, M. Enhanced energy expenditure and fat
oxidation in humans with high BMI scores by the ingestion of novel and non-pungent capsaicin
analogues (capsinoids). Biosci. Biotechnol. Biochem. 2007, 71, 380-389.
13. Mozsik, G.; Szolcsanyi, J.; Racz, I. Gastroprotection induced by capsaicin in healthy human
subjects. World J. Gastroenterol. 2005, 11, 5180-5184.
14. Backonja, M.M.; Malan, T.P.; Vanhove, G.F.; Tobias, J.K. NGX-4010, a high-concentration
capsaicin patch, for the treatment of postherpetic neuralgia: A randomized, double-blind,
controlled study with an open-label extension. Pain Med. 2010, 11, 600-608.
15. Tesfaye, S. Advances in the management of diabetic peripheral neuropathy. Curr. Opin. Support.
Palliat. Care 2009, 3, 136-143.
16. Sawynok, J. Topical analgesics in neuropathic pain. Curr. Pharm. Des. 2005, 11, 2995-3004.
17. Derry, S.; Lloyd, R.; Moore, R.A.; McQuay, H.J. Topical capsaicin for chronic neuropathic pain
in adults. Cochrane Database Syst. Rev. 2009, 7, CD007393.
18. Reyes-Escogido, M.L.; Gonzalez-Mondragon, E.G.; Vazquez-Tzompantzi, E. Chemical and
Pharmacological Aspects of Capsaicin. Molecules 2011, 16, 1253-1270.

Molecules 2011, 16 8929
19. Lopez-Carrillo, L.; Avila, H.M.; Dubrow, R. Chili pepper consumption and gastric cancer in
Mexico: A case-control study. Am. J. Epidemiol. 1994, 139, 263-271.
20. Scoville, W.L. Note on Capsicum. J. Am. Pharm. Assoc. 1912, 1, 453-454.
21. Weiss, E.A. Spice Crops; CABI Publishing International: New York, NY, USA, 2002; p. 411.
22. Nwokem, C.O.; Agbaji, E.B.; Kagbu, J.A.; Ekanem, E.J. Determination of capsaicin content and
pungency level of five different peppers grown in Nigeria. NY Sci. J. 2010, 3, 17-21.
23. Parrish, M. Liquid chromatographic method of determining capsaicinoids in capsicums and their
extractives: collaborative study. J. Assoc. Off. Anal. Chem. 1996, 79, 738-745.
24. Thomas, B.V.; Schreiber, A.A.; Weisskopf, C.P. Simple method for quantitation of capsaicinoids
in peppers using capillary gas chromatography. J. Agric. Food Chem. 1998, 46, 2655-2663.
25. Lopez-Hernandez, J.; Oruna-Concha, M.J.; Simal-Lozano, J.; Gonzales-Castro, M.J.;
Vazquez-Blanco, M.E. Determination of capsaicin and dihydrocapsaicin in cayenne pepper and
padron peppers by HPLC. Dtsch. Lebensmitt. Rundsch. 1996, 92, 393-395.
26. Monsereenusorn, Y. Subchronic toxicity studies of capsaicin and capsicum in rats. Res. Commun.
Chem. Pathol. Pharmacol. 1983, 41, 95-110.
27. Council of Europe. Committee of experts on flavouring substances. Datasheet on Capsaicin; 2001.
28. Govindarajan, V.S.; Sathyanarayana, M.N. Capsicum: Production, technology, chemistry, and
quality. Part V. Impact on physiology, pharmacology, nutrition, and metabolism; structure,
pungency, pain, and desensitization sequences. Crit. Rev. Food Sci. Nutr. 1991, 29, 435-473.
29. CREDOC/OCA (Observatoire des Consommations Alimentaires). Estimation des niveaux
d’ingestion de substances aromatisantes safrole, estragole, coumarine et capsaicine. Note
Technique No. 98, 1998, 25.
30. Collins, M.D.; Mayer-Wasmund, L.; Bosland, P.W. Improved method for quantifying
capsaicinoids in Capsicum using high performance liquid chromatography. HortScience 1995, 30,
137-139.
31. Todd, P.; Bensinger, M.; Biftu, T. Determination of pungency due to Capsicum by gas-liquid
chromatography. J. Food Sci. 1977, 42, 660-665.
32. Sanatombi, K.; Sharma, G.J. Capsaicin content and pungency of different Capsicum spp.
cultivars. Not. Bot. Hort. Agrobot. Cluj. 2008, 36, 89-90.
Sample Availability: Samples of the compounds are available from the authors.
© 2011 by the authors; licensee MDPI, Basel, Switzerland. This article is an open access article
distributed under the terms and conditions of the Creative Commons Attribution license
(http://creativecommons.org/licenses/by/3.0/).