
Identification and Determination of 1,3-Thiazinane-4 ... - MDPI
19
Citation: Piechocka, J.; Litwicka, N.; Glowacki, R. Identification and Determination of 1,3-Thiazinane-4-carboxylic Acid in Human Urine—Chromatographic Studies. Int. J. Mol. Sci. 2022, 23, 598. https://doi.org/10.3390/ ijms23020598 Academic Editor: Hartmut Schlüter Received: 2 November 2021 Accepted: 4 January 2022 Published: 6 January 2022 Publisher’s Note: MDPI stays neutral with regard to jurisdictional claims in published maps and institutional affil- iations. Copyright: © 2022 by the authors. Licensee MDPI, Basel, Switzerland. This article is an open access article distributed under the terms and conditions of the Creative Commons Attribution (CC BY) license (https:// creativecommons.org/licenses/by/ 4.0/). International Journal of Molecular Sciences Article Identification and Determination of 1,3-Thiazinane-4-carboxylic Acid in Human Urine—Chromatographic Studies Justyna Piechocka * , Natalia Litwicka and Rafal Glowacki * Department of Environmental Chemistry, Faculty of Chemistry, University of Lodz, 163 Pomorska Str., 90-236 Lód´ z, Poland; [email protected] * Correspondence: [email protected] (J.P.); [email protected] (R.G.); Tel.: +48-42-635-58-46 (J.P.); +48-42-635-58-35 (R.G.) Abstract: It is well established that homocysteine (Hcy) and its thiolactone (HTL) are reactive towards aldehydes in an aqueous environment, forming substituted thiazinane carboxylic acids. This report provides evidence that Hcy/HTL and formaldehyde (FA) adduct, namely 1,3-thiazinane-4-carboxylic acid (TCA) is formed in vivo in humans. In order to provide definitive proof, a gas chromatography– mass spectrometry (GC–MS) based method was elaborated to identify and quantify TCA in human urine. The GC–MS assay involves chemical derivatization with isobutyl chloroformate (IBCF) in the presence of pyridine as a catalyst, followed by an ethyl acetate extraction of the obtained isobutyl derivative of TCA (TCA-IBCF). The validity of the method has been demonstrated based upon United States Food and Drug Administration recommendations. The assay linearity was observed within a 1–50 μmol L -1 range for TCA in urine, while the lowest concentration on the calibration curve was recognized as the limit of quantification (LOQ). Importantly, the method was successfully applied to urine samples delivered by apparently healthy volunteers (n = 15). The GC–MS assay may provide a new analytical tool for routine clinical analysis of the role of TCA in living systems in the near future. Keywords: derivatization; formaldehyde; gas chromatography–mass spectrometry; homocysteine; homocysteine thiolactone; human urine; isobutyl chloroformate; liquid–liquid extraction; 1,3-thiazinane-4-carboxylic acid 1. Introduction Population aging is undoubtedly one of the most dominant phenomena of our cen- tury. In parallel, civilization diseases, to which neurodegenerative diseases, cardiovascular diseases (CVD) and metabolic disorders belong, among others, are increasing in global prevalence. They seriously threaten developing nations as they are one of the most frequent causes of the morbidity and mortality of humans. Despite sustained efforts to research as many diseases as possible, the way to quickly diagnose, prevent, cure or even slow unde- sirable changes in the human body, resulting in disease, remains substantially unknown. Among other things, it has been recognized that sulfur-containing compounds, to which homocysteine (Hcy) and its metabolite Hcy thiolactone (HTL) belong, and formalde- hyde (FA) are implicated in a number of civilization diseases [1–10]. In particular, their excess has been recognized as either an initiator or a marker of serious pathogenic processes, despite the fact that Hcy, HTL and FA are found in living systems as normal products [2,11]. For instance, the rise in plasma/urine Hcy and HTL levels is considered to be a risk predictor for morbidity and mortality in CVD, Alzheimer’s disease (AD) and diabetes mellitus (DM) [1–5]. At the same time, it was found that FA levels were elevated in the urine and blood of aging populations, and that these elevations were more prominent in patients suffering from CVD, AD events and DM [6–10]. Therefore, it seems reasonable to assume that factor(s) contributing to Hcy, HTL and FA depletion; factor(s) capable of depleting the precursors of these compounds; or even factors that affect the whole bio- chemical pathway might be desirable for living organisms. In particular, the possibility of Int. J. Mol. Sci. 2022, 23, 598. https://doi.org/10.3390/ijms23020598 https://www.mdpi.com/journal/ijms
-
Upload
khangminh22 -
Category
Documents
-
view
2 -
download
0
Transcript of Identification and Determination of 1,3-Thiazinane-4 ... - MDPI
�����������������
Citation: Piechocka, J.; Litwicka, N.;
Głowacki, R. Identification and
Determination of
1,3-Thiazinane-4-carboxylic Acid in
Human Urine—Chromatographic
Studies. Int. J. Mol. Sci. 2022, 23, 598.
https://doi.org/10.3390/
ijms23020598
Academic Editor: Hartmut Schlüter
Received: 2 November 2021
Accepted: 4 January 2022
Published: 6 January 2022
Publisher’s Note: MDPI stays neutral
with regard to jurisdictional claims in
published maps and institutional affil-
iations.
Copyright: © 2022 by the authors.
Licensee MDPI, Basel, Switzerland.
This article is an open access article
distributed under the terms and
conditions of the Creative Commons
Attribution (CC BY) license (https://
creativecommons.org/licenses/by/
4.0/).
International Journal of
Molecular Sciences
Article
Identification and Determination of 1,3-Thiazinane-4-carboxylicAcid in Human Urine—Chromatographic StudiesJustyna Piechocka * , Natalia Litwicka and Rafał Głowacki *
Department of Environmental Chemistry, Faculty of Chemistry, University of Lodz, 163 Pomorska Str.,90-236 Łódz, Poland; [email protected]* Correspondence: [email protected] (J.P.); [email protected] (R.G.);
Tel.: +48-42-635-58-46 (J.P.); +48-42-635-58-35 (R.G.)
Abstract: It is well established that homocysteine (Hcy) and its thiolactone (HTL) are reactive towardsaldehydes in an aqueous environment, forming substituted thiazinane carboxylic acids. This reportprovides evidence that Hcy/HTL and formaldehyde (FA) adduct, namely 1,3-thiazinane-4-carboxylicacid (TCA) is formed in vivo in humans. In order to provide definitive proof, a gas chromatography–mass spectrometry (GC–MS) based method was elaborated to identify and quantify TCA in humanurine. The GC–MS assay involves chemical derivatization with isobutyl chloroformate (IBCF) in thepresence of pyridine as a catalyst, followed by an ethyl acetate extraction of the obtained isobutylderivative of TCA (TCA-IBCF). The validity of the method has been demonstrated based upon UnitedStates Food and Drug Administration recommendations. The assay linearity was observed within a1–50 µmol L−1 range for TCA in urine, while the lowest concentration on the calibration curve wasrecognized as the limit of quantification (LOQ). Importantly, the method was successfully applied tourine samples delivered by apparently healthy volunteers (n = 15). The GC–MS assay may provide anew analytical tool for routine clinical analysis of the role of TCA in living systems in the near future.
Keywords: derivatization; formaldehyde; gas chromatography–mass spectrometry; homocysteine;homocysteine thiolactone; human urine; isobutyl chloroformate; liquid–liquid extraction;1,3-thiazinane-4-carboxylic acid
1. Introduction
Population aging is undoubtedly one of the most dominant phenomena of our cen-tury. In parallel, civilization diseases, to which neurodegenerative diseases, cardiovasculardiseases (CVD) and metabolic disorders belong, among others, are increasing in globalprevalence. They seriously threaten developing nations as they are one of the most frequentcauses of the morbidity and mortality of humans. Despite sustained efforts to research asmany diseases as possible, the way to quickly diagnose, prevent, cure or even slow unde-sirable changes in the human body, resulting in disease, remains substantially unknown.
Among other things, it has been recognized that sulfur-containing compounds, towhich homocysteine (Hcy) and its metabolite Hcy thiolactone (HTL) belong, and formalde-hyde (FA) are implicated in a number of civilization diseases [1–10]. In particular, theirexcess has been recognized as either an initiator or a marker of serious pathogenic processes,despite the fact that Hcy, HTL and FA are found in living systems as normal products [2,11].For instance, the rise in plasma/urine Hcy and HTL levels is considered to be a riskpredictor for morbidity and mortality in CVD, Alzheimer’s disease (AD) and diabetesmellitus (DM) [1–5]. At the same time, it was found that FA levels were elevated in theurine and blood of aging populations, and that these elevations were more prominent inpatients suffering from CVD, AD events and DM [6–10]. Therefore, it seems reasonableto assume that factor(s) contributing to Hcy, HTL and FA depletion; factor(s) capable ofdepleting the precursors of these compounds; or even factors that affect the whole bio-chemical pathway might be desirable for living organisms. In particular, the possibility of
Int. J. Mol. Sci. 2022, 23, 598. https://doi.org/10.3390/ijms23020598 https://www.mdpi.com/journal/ijms
Int. J. Mol. Sci. 2022, 23, 598 2 of 19
the conversion of Hcy, HTL and FA into a relatively inert compound in vivo is not withoutpractical consideration.
In general, it is well established that amino acids and their cyclic thioesters are highlyreactive towards aldehydes in an aqueous environment, forming substituted thiazoli-dine/thiazinane carboxylic acids. Interestingly, it has been shown that naturally occur-ring FA undergoes simple, non-enzymatic condensation with Hcy and HTL producing1,3-thiazinane-4-carboxylic acid (TCA) (see Section 2, Figure 1a) [12–14]. Nevertheless, itshould be emphasized that very little is known about TCA thus far. Only three reportson TCA are available at present indicating that a relatively stable product, containing thesix-membered thiazinane ring from Hcy or its thioester, and FA, is formed in aqueousmedia over a 5–10 pH range, especially in alkaline solutions representing physiologicalconditions [12,14]. Additionally, it has been identified that the speed of the reversibleequilibrium between Hcy/HTL and FA at a constant temperature is dependent on thepH [14]; while the presence of a mitochondrial preparation [12] and Aerobacter aerogenes [13]was found not to affect the rate of the condensation reaction. Interestingly, the problemconcerning the presence and determination of Hcy/HTL and FA-derived 1,3-thiazinanes inliving systems has received no attention, as yet. Given the fact that such reactions occurin vitro and Hcy/HTL and FA are ubiquitous in human biofluids, one would reasonablyexpect that TCA would also be present. However, it has not yet been established whetherTCA is present in vivo. On the other hand, there is evidence that some thiazolidinesare formed in vivo, e.g., cysteine (Cys), a homolog of Hcy, and pyridoxal 5’-phosphateadduct, namely 2-(3-hydroxy-5-phosphonooxymethyl-2-methyl-4-pyridyl)-1,3-thiazolidine-4-carboxylic acid have been shown to be present in human plasma [15]; while 2-methyl-1,3-thiazolidine-4-carboxylic acid, a condensation product of Cys and acetaldehyde, producedas a first intermediate in oxidative ethanol metabolism, has been demonstrated to be presentin human plasma and urine as a consequence of alcohol (ethanol) consumption [16].
As a result, the present paper aims to validate findings regarding in vivo formationand presence of TCA in the human body. We selected urine as the matrix of choice, as it iseasily accessible and can be obtained in a non-intrusive and non-invasive way; and becauseit has been demonstrated that in rats injected intraperitoneally with radiolabeled TCA,55% of the administered dose was excreted in urine and only 6% was expired as carbondioxide [12]. On the one hand, it may be surprising that our efforts focused on the searchfor TCA instead of Cys and FA adduct as the concentration of urinary Cys is about 50-timesas high as Hcy/HTL in total [17,18]. However, such approach should come as no surprisebecause W.B. Neely [13] demonstrated that Hcy is much more reactive toward FA than Cyswhich is reflected in the ease of formation of the less taut six-membered thiazinane ringfrom Hcy and FA. Important milestones in the validation of the assumption included (1)development of an effective analytical tool based on gas chromatography coupled with amass spectrometry technique (GC–MS) for the determination of urinary TCA, and (2) theapplication of the assay to real samples in order to confirm or exclude the performance ofthe method as well as the presence of TCA in humans. Importantly, the GC–MS techniquewas assumed to be suitable for this purpose due to its high-throughput potential, sensitivity,specificity, and excellent resolution, along with high degrees of reproducibility and accuracy.This article discusses the essential steps, with some justification, that were taken to achievethe intended objective. Moreover, the advantages, pitfalls, and limitations of the GC–MSassay are mentioned.
2. Results and Discussion
Nowadays, civilization diseases are perceived as one of humanity’s most pressingproblems. As a result, it has become crucial to identify new biomarkers and put efforts intodeveloping new analytical tools to facilitate large-scale screening of them. In relation toassays based on separation techniques, it is generally known that proper sample handlingand management combined with separation and detection conditions play a pivotal rolein the quality of generated results. Therefore, detailed experiments were conducted in

Int. J. Mol. Sci. 2022, 23, 598 3 of 19
order to establish that the reported method is reliable for analyte determination purposes.Considerable attention was given to optimizing the procedures and conditions connectedwith the selective extraction and detection of the analyte. The following sections of thearticle provide the reader with all necessary information regarding the development,validation, and in-study use of the GC–MS based method for the determination of the newlyrecognized metabolite of sulfur metabolism, namely TCA, in human urine. Importantly, therole of the HTL/Hcy and FA-derived adduct in the human body still remains substantiallyunknown. So far, only one piece of evidence can be found in the literature that suggeststhat facile formation of TCA may diminish toxic Hcy, HTL and FA content in biofluids,providing a beneficial effect on human health. Based on data provided by J. Wristonand C. Mackenzie in the late 1950s [12], it seems reasonable to assume that Hcy, HTLand FA may be disposed of in the form of metabolically inactive TCA, as rats injectedintraperitoneally with radiolabeled TCA largely excreted the administered dose in urine.
2.1. Sample Preparation
In the presented study, the GC–MS method was designed to determine TCA in humanurine. Sample preparation involved chemical derivatization with isobutyl chloroformate(IBCF) in the presence of pyridine, acting as a catalyst, followed by ethyl acetate extraction ofthe isobutyl derivative of TCA (TCA-IBCF), and immediate analysis. The sequence of eventsleading up to the preparation of the sample to be analyzed was not accidental since it wasassumed that increasing the hydrophobicity of the relatively polar TCA before transferringthe molecule into the organic solvent would be valuable for improving extraction efficiency.Firstly, preliminary studies were carried out using the method developed by V. Dufkováet al. [19], enabling GC–MS analysis of perfluorinated organic acids in samples of riverwater. Then, the chemical and flow variables influencing chemical derivatization and theextraction processes were optimized in detail taking account of the different matrix. Ingeneral, these experiments were performed using the described procedures herein basedon GC–MS measurements (see Sections 3.5 and 3.6). In each case, the appearance of aproduct peak on the chromatogram and a comparison of its area was used to determine theparticular process efficiency.
2.1.1. Derivatization
As it was envisioned, TCA did not possess the desired physicochemical properties tomeet the requirements of the implemented technique. Therefore, chemical modificationwas a necessary part of the sample preparation process. Interestingly, a wide variety ofderivatization methods have been developed to overcome the above-mentioned constraints.Among others, four types of derivatization reactions preceding a GC analysis are mostcommonly used, namely silylation, acylation, alkylation and esterification methods, toenable analysis of organic compounds with inadequate volatility or thermal stability;as well as to improve their chromatographic behavior or detectability [20–22]. In thepresented study, considerable attention was paid to the chemical reactions proceedingin media with high water content at room temperature in order to simplify the samplepretreatment procedure and improve batch to batch reproducibility; apart from increasingTCA hydrophobicity before the extraction step, as stated previously. Based on our previousexperience with the development of the GC–MS method for urinary HTL determination [23],the use of IBCF was evaluated. It was demonstrated that with the proper use of theabove-mentioned derivatization reagent, a successful analysis of a wide range of organiccompounds from environmental samples can be achieved [19,24].
Int. J. Mol. Sci. 2022, 23, 598 4 of 19
Int. J. Mol. Sci. 2022, 23, x FOR PEER REVIEW 4 of 19
[23], the use of IBCF was evaluated. It was demonstrated that with the proper use of the above-mentioned derivatization reagent, a successful analysis of a wide range of organic compounds from environmental samples can be achieved [19,24].
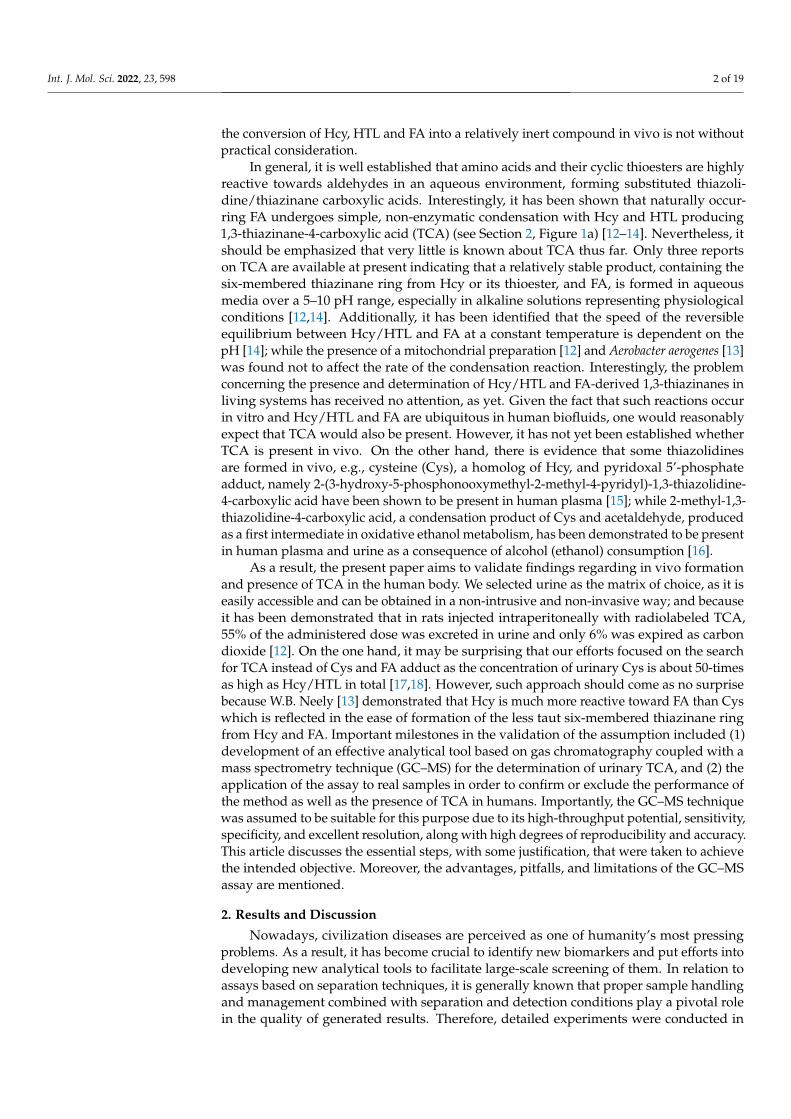
Figure 1. Research project objectives. (a) The reaction equation of homocysteine (Hcy) with formal-dehyde (FA) providing 1,3-thiazinane-4-carboxylic acid (TCA); (b) The chemical derivatization re-action of TCA with isobutyl chloroformate (IBCF) in the presence of pyridine, resulting in formation of an isobutyl derivative of TCA (TCA-IBCF). Abbreviations: FA, formaldehyde; Hcy, homocyste-ine; IBCF, isobutyl chloroformate; RT, room temperature; TCA, 1,3-thiazinane-4-carboxylic acid; TCA-IBCF, isobutyl derivative of 1,3-thiazinane-4-carboxylic acid; Tris-HCl, tris(hydroxyme-thyl)aminomethane-hydrochloride acid buffer.
Firstly, it was shown that upon derivatization TCA was converted into its corre-sponding isobutyl derivative, namely TCA-IBCF which produced intense specific frag-ment ion peaks, suitable for the analyte monitoring (see Section 2.2, Figure 6). In addition, it was found that chemical modification was also valuable for increasing the molecular weight of the analyte which helped separate the GC sample peaks from the solvent front. TCA possessed two potential places accessible to IBCF, provided by the amine functional group and carboxyl group [24]. However, fragmentation ions, found during the study, indicated that the carboxyl group in the molecule remained unmodified under set condi-tions (see Section 3.5). Importantly, such circumstances did not affect the effective separa-tion and detection of TCA. In relation to TCA, the IBCF-mediated derivatization generally involved the replacement of the active hydrogen on the amine group with the isobutyl formate moiety, followed by hydrochloric acid release under pyridine catalysis, yielding less polar, more volatile and a relatively thermally stable TCA-IBCF derivative. Thus, the most probable schematic of the derivatization reaction of TCA with IBCF is shown in Fig-ure 1b.
Since the preliminary research results were promising, subsequently the influence of several factors on derivatization efficiency were carefully studied. Firstly, it was recog-nized that the yield of the IBCF-mediated acylation was highly dependent on the compo-sition of the reaction medium. Several buffer solutions, including phosphate (PB), borate, tris(hydroxymethyl)aminomethane-hydrochloride (Tris-HCl), and Davies buffer were
Figure 1. Research project objectives. (a) The reaction equation of homocysteine (Hcy) with formalde-hyde (FA) providing 1,3-thiazinane-4-carboxylic acid (TCA); (b) The chemical derivatization reactionof TCA with isobutyl chloroformate (IBCF) in the presence of pyridine, resulting in formation of anisobutyl derivative of TCA (TCA-IBCF). Abbreviations: FA, formaldehyde; Hcy, homocysteine; IBCF,isobutyl chloroformate; RT, room temperature; TCA, 1,3-thiazinane-4-carboxylic acid; TCA-IBCF,isobutyl derivative of 1,3-thiazinane-4-carboxylic acid; Tris-HCl, tris(hydroxymethyl)aminomethane-hydrochloride acid buffer.
Firstly, it was shown that upon derivatization TCA was converted into its correspond-ing isobutyl derivative, namely TCA-IBCF which produced intense specific fragment ionpeaks, suitable for the analyte monitoring (see Section 2.2, Figure 6). In addition, it wasfound that chemical modification was also valuable for increasing the molecular weightof the analyte which helped separate the GC sample peaks from the solvent front. TCApossessed two potential places accessible to IBCF, provided by the amine functional groupand carboxyl group [24]. However, fragmentation ions, found during the study, indicatedthat the carboxyl group in the molecule remained unmodified under set conditions (seeSection 3.5). Importantly, such circumstances did not affect the effective separation and de-tection of TCA. In relation to TCA, the IBCF-mediated derivatization generally involved thereplacement of the active hydrogen on the amine group with the isobutyl formate moiety,followed by hydrochloric acid release under pyridine catalysis, yielding less polar, morevolatile and a relatively thermally stable TCA-IBCF derivative. Thus, the most probableschematic of the derivatization reaction of TCA with IBCF is shown in Figure 1b.
Since the preliminary research results were promising, subsequently the influence ofseveral factors on derivatization efficiency were carefully studied. Firstly, it was recog-nized that the yield of the IBCF-mediated acylation was highly dependent on the com-position of the reaction medium. Several buffer solutions, including phosphate (PB),borate, tris(hydroxymethyl)aminomethane-hydrochloride (Tris-HCl), and Davies bufferwere tested. Among them, the Tris-HCl buffer was found to be superior with regard toderivatization and extraction efficiency since the signal intensity of the TCA-IBCF deriva-tive was greater than that registered when other buffer solutions, at the given pH and total

Int. J. Mol. Sci. 2022, 23, 598 5 of 19
buffer concentration, were used (Figure 2a). As a result, Tris-HCl was chosen to adjust thesample pH regardless of the fact that it contained functional groups, namely hydroxyl andamino groups, that might react with the derivatizing agent of choice [24]. As shown inFigure 5 (see Section 2.2), no interference at the retention time of the analyte originatingfrom Tris-HCl buffer was registered, indicating that the particular buffer was suitable asthe derivatization reaction medium.
In parallel, the influence of the pH of the reaction medium on derivatization efficiencywas evaluated, as the molecule of TCA can exist in different ionization states, which mayhave an impact on its reactivity. In addition, it was recognized that the reaction mediumpH may not only have an effect on the analyte’s reactivity but also on the efficiency of thesubsequent sample preparation step, namely extraction. In the presented study, the effectof pH within the range of 4 to 8 was thus evaluated, corresponding to the expected pH ofurine under normal conditions. An universal buffer solution of Davies, which has beendemonstrated to be suitable for use over the pH range 2 to 12 [25], was utilized to controlthe pH level. When analyzing Figure 2b, a moderate pH dependence on process efficiencycan be noticed, suggesting that slightly acidic or even neutral conditions are essential toprovide the best results. However, a pH lower than 4 or greater than 7, for the solution, mayhave a negative effect on the derivatization efficiency as the peak area of the TCA-IBCFderivative decreased with decreasing/increasing pH, respectively (Figure 2b). In this way,the limited stability of the obtained derivative in strongly acidic/alkaline aqueous mediamust be considered. Since the useful pH range of the preselected buffering medium is 7 to9, Tris-HCl buffer, with a pH of 7 was chosen for further experiments.
Next, experiments were conducted in order to optimize the ionic strength of the buffersolution, which was the next factor affecting the particular processes yield. DifferentTris-HCl buffer solutions were prepared at five concentration levels, ranging from 0.2to3 mol L−1. As shown in Figure 2c, a progressive increase in the peak area of the TCA-IBCF derivative was observed in parallel with the rise in concentration of Tris-HCl from0.2 to 3 mol L−1. In addition, the improvement of the precision of the experiment wasconcomitantly noticed. As a result, a further 3 mol L−1 solution of the buffer was used.
Additional experimental work was undertaken to establish the optimal ratio of urineto 3 mol L−1 Tris-HCl buffer, pH 7. Taking into account that the pH of the reaction mediumaffected the chemical derivatization and extraction processes yield, as well as the factthat urine pH can range from 4 to 8 under normal conditions according to the AmericanAssociation for Clinical Chemistry, an adjustment to the pH of the particular sample wasnecessary to minimize its contribution to the recovery losses in this method. In orderto evaluate the optimal ratio of urine to the buffer solution of choice, a series of threemeasurements were performed using pooled urine samples, made up of small pools of thespecimens from all donations, that were produced in our laboratory for this purpose. Firstly,the pH of the particular sample was adjusted to a specific pH within the pH range of 4 to8 by adding a few drops of either diluted hydrochloric acid or sodium hydroxide solutionto the sample until the desired pH was achieved. Next, experiments were performed toestablish the optimal amount of the buffer by mixing urine samples with different volumesof 3 mol L−1 Tris-HCl buffer, pH 7. Finally, it was established that a minimum ratio of1:4, urine to buffer was necessary to achieve a pH for the mixture at the same level as thepH of the buffer added to the sample, regardless of the initial pH of the particular sampleor its source. As described in the following sections of the paper, the most satisfactoryresults were obtained when 50 µL of urine were mixed with 200 µL of 3 mol L−1 Tris-HClbuffer, pH 7.

Int. J. Mol. Sci. 2022, 23, 598 6 of 19Int. J. Mol. Sci. 2022, 23, x FOR PEER REVIEW 6 of 19
(a) (b) (c)
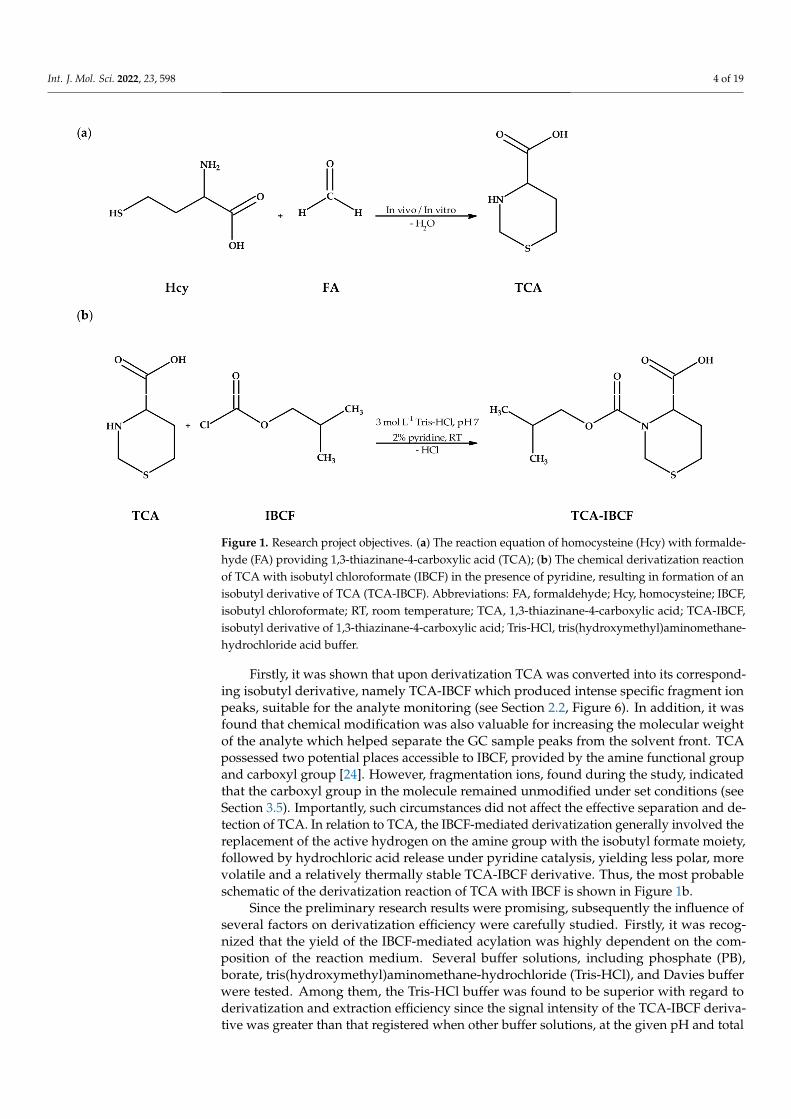
Figure 2. Derivatization reaction yield as a function of (a) the type of derivatization buffer; (b) pH of the reaction medium; (c) tris(hydroxymethyl)aminomethane-hydrochloride buffer (Tris-HCl) pH 7 concentration, expressed as the peak area of the isobutyl derivative of 1,3-thiazinane-4-carboxylic acid (TCA-IBCF). Samples were analyzed according to the procedure described in Section 3.6. Error bars refer to the standard deviation (SD) of the data (n = 3). Abbreviations: Tris-HCl, tris(hy-droxymethyl)aminomethane-hydrochloride acid buffer.
According to the literature [24], alkyl chloroformates are not only influenced by the solvent system, but also by the addition of a catalyst and optional alcohol. In particular, a basic catalyst acting as an acid scavenger is required to neutralize hydrochloric acid, lib-erated by the derivatization process, in order to drive the reaction forward and/or increase the reactivity of the reagent itself. In parallel, the presence of an auxiliary agent, namely alcohol, in the reaction medium is not prerequisite although it could easily enhance the derivatization yield by means of dispersing the sedimental (cloudy) phase which appears as a result of IBCF and catalyst addition.
In the presented study, one of the most commonly used catalysts, namely pyridine, was employed to facilitate the IBCF assisted reactions. Since pyridine is considered to be toxic, preliminary experiments were conducted to check whether its presence was indis-pensable for the derivatization. Two sets of samples were prepared; one was treated with IBCF and pyridine, the other with the derivatizing agent itself. Importantly, in the absence of pyridine the outcome of the reaction was rather disappointing. These studies thus have confirmed that the transformation of TCA to the N-acylated product with IBCF is pro-moted by the use of pyridine as an acid-binding agent [24]. Therefore, the influence of the concentration of the catalyst of choice in the study samples on derivatization efficiency was evaluated afterwards. In particular, the effect of the pyridine concentration within the range 0.06 to 0.37 mol L−1 was tested, corresponding to the addition of 1.5–9 µL of pyridine per 300 µL of reaction mixture. It was found that the derivatization efficiency was en-hanced in parallel with an increase in concentration of the catalyst from 0.06 to 0.25 mol L−1 (0.5–2%), and then the peak area of the TCA-IBCF derivative decreased with the further increasing its concentration. Interestingly, the phenomenon of progressive alkyl chlo-roformate decomposition along with the diminished efficiency of the derivatization pro-cess in the presence of excess pyridine seemed to be characteristic for the course of the reaction [24]. As a result, 6 µL of pyridine was found to be optimal and was taken for further experiments. Moreover, it is worth mentioning that higher volumes of the catalyst were excluded as they gave rise to excessive baseline noise.
Subsequently, additional experiments were undertaken to determine whether the presence of alcohol was essential for the derivatization reaction or had a negligible effect
Figure 2. Derivatization reaction yield as a function of (a) the type of derivatization buffer; (b) pH ofthe reaction medium; (c) tris(hydroxymethyl)aminomethane-hydrochloride buffer (Tris-HCl) pH 7concentration, expressed as the peak area of the isobutyl derivative of 1,3-thiazinane-4-carboxylicacid (TCA-IBCF). Samples were analyzed according to the procedure described in Section 3.6.Error bars refer to the standard deviation (SD) of the data (n = 3). Abbreviations: Tris-HCl,tris(hydroxymethyl)aminomethane-hydrochloride acid buffer.
According to the literature [24], alkyl chloroformates are not only influenced by thesolvent system, but also by the addition of a catalyst and optional alcohol. In particular,a basic catalyst acting as an acid scavenger is required to neutralize hydrochloric acid,liberated by the derivatization process, in order to drive the reaction forward and/orincrease the reactivity of the reagent itself. In parallel, the presence of an auxiliary agent,namely alcohol, in the reaction medium is not prerequisite although it could easily enhancethe derivatization yield by means of dispersing the sedimental (cloudy) phase whichappears as a result of IBCF and catalyst addition.
In the presented study, one of the most commonly used catalysts, namely pyridine,was employed to facilitate the IBCF assisted reactions. Since pyridine is considered tobe toxic, preliminary experiments were conducted to check whether its presence wasindispensable for the derivatization. Two sets of samples were prepared; one was treatedwith IBCF and pyridine, the other with the derivatizing agent itself. Importantly, in theabsence of pyridine the outcome of the reaction was rather disappointing. These studiesthus have confirmed that the transformation of TCA to the N-acylated product with IBCF ispromoted by the use of pyridine as an acid-binding agent [24]. Therefore, the influence ofthe concentration of the catalyst of choice in the study samples on derivatization efficiencywas evaluated afterwards. In particular, the effect of the pyridine concentration withinthe range 0.06 to 0.37 mol L−1 was tested, corresponding to the addition of 1.5–9 µL ofpyridine per 300 µL of reaction mixture. It was found that the derivatization efficiencywas enhanced in parallel with an increase in concentration of the catalyst from 0.06 to0.25 mol L−1 (0.5–2%), and then the peak area of the TCA-IBCF derivative decreased withthe further increasing its concentration. Interestingly, the phenomenon of progressive alkylchloroformate decomposition along with the diminished efficiency of the derivatizationprocess in the presence of excess pyridine seemed to be characteristic for the course ofthe reaction [24]. As a result, 6 µL of pyridine was found to be optimal and was taken forfurther experiments. Moreover, it is worth mentioning that higher volumes of the catalystwere excluded as they gave rise to excessive baseline noise.
Subsequently, additional experiments were undertaken to determine whether thepresence of alcohol was essential for the derivatization reaction or had a negligible effect
Int. J. Mol. Sci. 2022, 23, 598 7 of 19
on the course of the reaction. Two sets of samples were prepared; the samples were treatedwith IBCF and pyridine in the presence or absence of the corresponding alkyl alcohol.Importantly, the same process yield was achieved even without alcohol in the reactionmedium. For this reason, we decided not to use a dispersant in order to reduce chemicalconsumption, and instead, we chose to shake the sample to achieve dispersion. Indeed, itwas recognized that gently shaking samples by hand was sufficient to effectively modify theanalyte. In addition, it needs to be emphasized that when samples were shaken violently,vigorously stirred/vortexed or placed in an ultrasonic bath, it resulted in an explosion andthe subsequent loss of the sample.
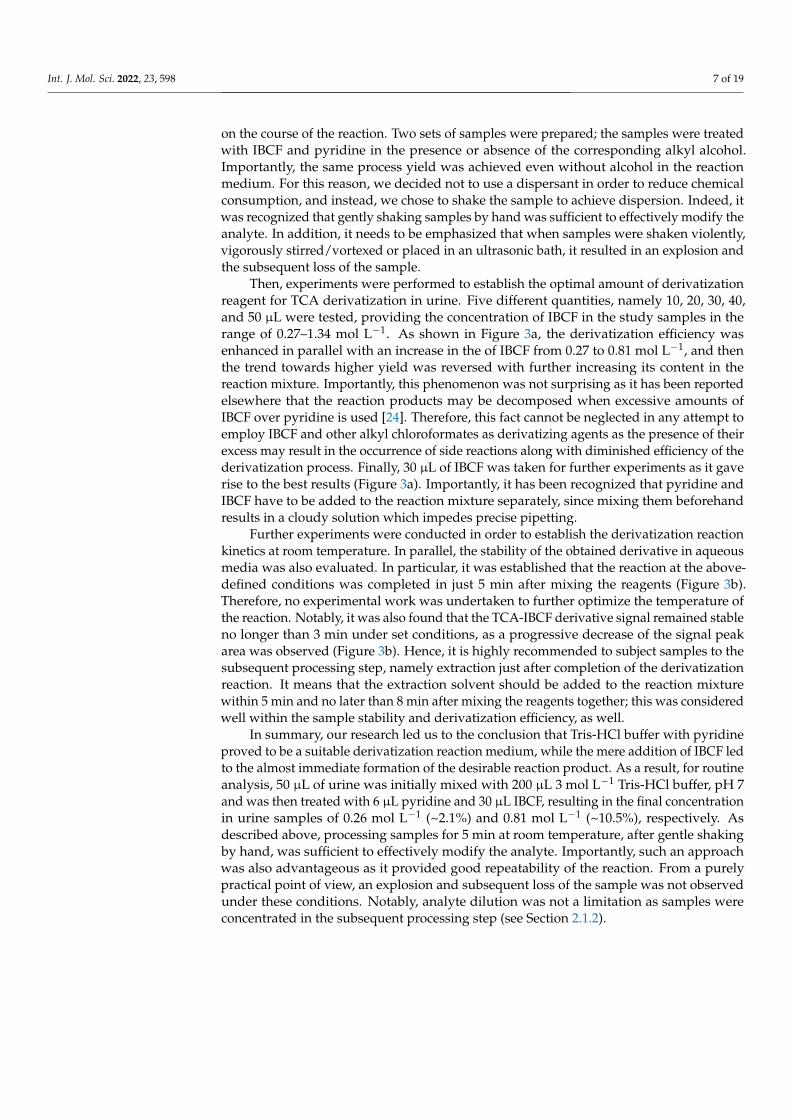
Then, experiments were performed to establish the optimal amount of derivatizationreagent for TCA derivatization in urine. Five different quantities, namely 10, 20, 30, 40,and 50 µL were tested, providing the concentration of IBCF in the study samples in therange of 0.27–1.34 mol L−1. As shown in Figure 3a, the derivatization efficiency wasenhanced in parallel with an increase in the of IBCF from 0.27 to 0.81 mol L−1, and thenthe trend towards higher yield was reversed with further increasing its content in thereaction mixture. Importantly, this phenomenon was not surprising as it has been reportedelsewhere that the reaction products may be decomposed when excessive amounts ofIBCF over pyridine is used [24]. Therefore, this fact cannot be neglected in any attempt toemploy IBCF and other alkyl chloroformates as derivatizing agents as the presence of theirexcess may result in the occurrence of side reactions along with diminished efficiency of thederivatization process. Finally, 30 µL of IBCF was taken for further experiments as it gaverise to the best results (Figure 3a). Importantly, it has been recognized that pyridine andIBCF have to be added to the reaction mixture separately, since mixing them beforehandresults in a cloudy solution which impedes precise pipetting.
Further experiments were conducted in order to establish the derivatization reactionkinetics at room temperature. In parallel, the stability of the obtained derivative in aqueousmedia was also evaluated. In particular, it was established that the reaction at the above-defined conditions was completed in just 5 min after mixing the reagents (Figure 3b).Therefore, no experimental work was undertaken to further optimize the temperature ofthe reaction. Notably, it was also found that the TCA-IBCF derivative signal remained stableno longer than 3 min under set conditions, as a progressive decrease of the signal peakarea was observed (Figure 3b). Hence, it is highly recommended to subject samples to thesubsequent processing step, namely extraction just after completion of the derivatizationreaction. It means that the extraction solvent should be added to the reaction mixturewithin 5 min and no later than 8 min after mixing the reagents together; this was consideredwell within the sample stability and derivatization efficiency, as well.
In summary, our research led us to the conclusion that Tris-HCl buffer with pyridineproved to be a suitable derivatization reaction medium, while the mere addition of IBCF ledto the almost immediate formation of the desirable reaction product. As a result, for routineanalysis, 50 µL of urine was initially mixed with 200 µL 3 mol L−1 Tris-HCl buffer, pH 7and was then treated with 6 µL pyridine and 30 µL IBCF, resulting in the final concentrationin urine samples of 0.26 mol L−1 (~2.1%) and 0.81 mol L−1 (~10.5%), respectively. Asdescribed above, processing samples for 5 min at room temperature, after gentle shakingby hand, was sufficient to effectively modify the analyte. Importantly, such an approachwas also advantageous as it provided good repeatability of the reaction. From a purelypractical point of view, an explosion and subsequent loss of the sample was not observedunder these conditions. Notably, analyte dilution was not a limitation as samples wereconcentrated in the subsequent processing step (see Section 2.1.2).

Int. J. Mol. Sci. 2022, 23, 598 8 of 19Int. J. Mol. Sci. 2022, 23, x FOR PEER REVIEW 8 of 19
(a) (b)
Figure 3. Derivatization reaction yield as a function of (a) the amount of the reagent; (b) time com-bined with examination of the isobutyl derivative of 1,3-thiazinane-4-carboxylic acid (TCA-IBCF) stability in the aqueous phase, expressed as a peak area of the derivative. Samples were analyzed according to the procedure described in Section 3.6.
2.1.2. Sample Purification It has long been known that water-containing samples cannot be directly injected into
a GC–MS system without purification prior to analysis. According to the literature, a num-ber of chemical and physical purification methods have been identified, and the most commonly used techniques to adapt sample matrices to be more compatible with the tar-get chromatographic method involve extraction [26].
In the presented study, an approach utilizing simple liquid–liquid extraction was used. Firstly, several immiscible solvents with lower density than water, including n-hex-ane, n-heptane, n-octane, nonane, n-decane, cyclohexane, ethyl acetate, 1-octanol, and bu-tyl alcohol were tested. In general, the selection of extractants was made on the basis of findings that the upper organic (acceptor) phase is easier to collect for a GC–MS analysis than the bottom one. As shown in Figure 4, the application of ethyl acetate resulted in the highest extraction efficiency, among other preselected organic solvents. In addition, it was identified that its application resulted in less complex chromatograms in comparison with those registered when other organic solvents were used. Therefore, ethyl acetate was se-lected.
Then, experiments were performed to establish the optimal amount of the organic solvent of choice. Six different volumes, namely 50, 100, 150, 200, 250 and 300 µL, were tested that amounted to 1 to 6-times the volume of the urine specimen. In particular, it was found that the extraction efficiency decreased with the increase in the extractant vol-ume, due to a substantial dilution of the sample (analyte). Indeed, an efficient extraction was achieved by mixing the resulting mixture with just 50 µL of ethyl acetate, while a minimum volume of 100 µL extractant was found to be necessary to provide both efficient extraction, and sufficiently large enough volume of acceptor phase to enable easy collec-tion for the GC–MS analysis. Thus, 100 µL of ethyl acetate was selected as it was consid-ered satisfactory for ensuring sample handling convenience.
Further experiments were conducted to obtain information about the extraction con-ditions that promoted the process. In parallel, the stability of the TCA-IBCF derivative in organic media was examined. In particular, it was established that shaking/vortexing the samples followed by centrifugation did not markedly affect operational efficiency, which was beneficial for workflow simplification. Nevertheless, centrifugation was pointed out to be a necessary part of the sample preparation process as signals were higher by about
Figure 3. Derivatization reaction yield as a function of (a) the amount of the reagent; (b) timecombined with examination of the isobutyl derivative of 1,3-thiazinane-4-carboxylic acid (TCA-IBCF)stability in the aqueous phase, expressed as a peak area of the derivative. Samples were analyzedaccording to the procedure described in Section 3.6.
2.1.2. Sample Purification
It has long been known that water-containing samples cannot be directly injectedinto a GC–MS system without purification prior to analysis. According to the literature, anumber of chemical and physical purification methods have been identified, and the mostcommonly used techniques to adapt sample matrices to be more compatible with the targetchromatographic method involve extraction [26].
In the presented study, an approach utilizing simple liquid–liquid extraction was used.Firstly, several immiscible solvents with lower density than water, including n-hexane,n-heptane, n-octane, nonane, n-decane, cyclohexane, ethyl acetate, 1-octanol, and butylalcohol were tested. In general, the selection of extractants was made on the basis offindings that the upper organic (acceptor) phase is easier to collect for a GC–MS analysisthan the bottom one. As shown in Figure 4, the application of ethyl acetate resulted inthe highest extraction efficiency, among other preselected organic solvents. In addition, itwas identified that its application resulted in less complex chromatograms in comparisonwith those registered when other organic solvents were used. Therefore, ethyl acetatewas selected.
Then, experiments were performed to establish the optimal amount of the organicsolvent of choice. Six different volumes, namely 50, 100, 150, 200, 250 and 300 µL, weretested that amounted to 1 to 6-times the volume of the urine specimen. In particular, it wasfound that the extraction efficiency decreased with the increase in the extractant volume,due to a substantial dilution of the sample (analyte). Indeed, an efficient extraction wasachieved by mixing the resulting mixture with just 50 µL of ethyl acetate, while a minimumvolume of 100 µL extractant was found to be necessary to provide both efficient extraction,and sufficiently large enough volume of acceptor phase to enable easy collection for theGC–MS analysis. Thus, 100 µL of ethyl acetate was selected as it was considered satisfactoryfor ensuring sample handling convenience.
Further experiments were conducted to obtain information about the extraction con-ditions that promoted the process. In parallel, the stability of the TCA-IBCF derivative inorganic media was examined. In particular, it was established that shaking/vortexing thesamples followed by centrifugation did not markedly affect operational efficiency, whichwas beneficial for workflow simplification. Nevertheless, centrifugation was pointed out tobe a necessary part of the sample preparation process as signals were higher by about 60%

Int. J. Mol. Sci. 2022, 23, 598 9 of 19
under the discussed conditions in comparison with those registered when the extractionwas not accelerated by spinning the samples in solution around an axis at high speed.Notably, it was also found that the extraction under the above-defined conditions wascompleted in just 1 min after mixing the reagents and immediately placing the samples inthe centrifuge. In parallel, it was established that the TCA-IBCF derivative signal remainedstable no longer than subsequent 4 min under the set conditions, and then the extractionefficiency decreased dramatically with the prolonged processing time, which was testedin the range of 5–10 min. Equally importantly, the same observations were made whenthe stability of the study samples in the autosampler, prepared according to the proceduredescribed in Section 3.5, were evaluated. As a result, we were able to conclude from thisstudy that the obtained derivative is fairly unstable under these set conditions, indicatingthe necessity of subjecting the samples to the GC–MS analysis just after their preparationin order to produce meaningful results. On the other hand, it was important to recognizethat the TCA-IBCF derivative did not undergo thermal decomposition in the GC systemunder optimized conditions (see Section 3.6) and produced a single symmetrical peak(see Section 2.2, Figure 5), although high thermal processing temperatures during GC–MSanalysis may potentially lead to the formation of degradation products [27]. Finally, forroutine analysis, 286 µL of the resulting mixture and 100 µL of ethyl acetate were mixedtogether, and then placed in the centrifuge at 6000 rpm for 1 min at room temperature.Under these conditions, the cloudy (upper) organic phase was obtained, which was thencollected and injected into the GC–MS system immediately.
Int. J. Mol. Sci. 2022, 23, x FOR PEER REVIEW 9 of 19
60% under the discussed conditions in comparison with those registered when the extrac-tion was not accelerated by spinning the samples in solution around an axis at high speed. Notably, it was also found that the extraction under the above-defined conditions was completed in just 1 min after mixing the reagents and immediately placing the samples in the centrifuge. In parallel, it was established that the TCA-IBCF derivative signal re-mained stable no longer than subsequent 4 min under the set conditions, and then the extraction efficiency decreased dramatically with the prolonged processing time, which was tested in the range of 5–10 min. Equally importantly, the same observations were made when the stability of the study samples in the autosampler, prepared according to the procedure described in Section 3.5, were evaluated. As a result, we were able to con-clude from this study that the obtained derivative is fairly unstable under these set condi-tions, indicating the necessity of subjecting the samples to the GC–MS analysis just after their preparation in order to produce meaningful results. On the other hand, it was im-portant to recognize that the TCA-IBCF derivative did not undergo thermal decomposi-tion in the GC system under optimized conditions (see Section 3.6) and produced a single symmetrical peak (see Section 2.2, Figure 5), although high thermal processing tempera-tures during GC–MS analysis may potentially lead to the formation of degradation prod-ucts [27]. Finally, for routine analysis, 286 µL of the resulting mixture and 100 µL of ethyl acetate were mixed together, and then placed in the centrifuge at 6000 rpm for 1 min at room temperature. Under these conditions, the cloudy (upper) organic phase was ob-tained, which was then collected and injected into the GC–MS system immediately.
Figure 4. Extraction efficiency of the isobutyl derivative of 1,3-thiazinane-4-carboxylic acid (TCA-IBCF) as a function of the type of extraction solvent expressed as a peak area of the derivative. Sam-ples were analyzed according to the procedure described in Section 3.6. Error bars refer to the stand-ard deviation (SD) of the data (n = 3).
In summary, these experiments established an optimal procedure, in which urine was treated with a derivatizing agent, namely IBCF in the presence of pyridine, and sub-jected to the GC–MS system without delay after ethyl acetate extraction. Importantly, this is a simple one-pot sample processing method for urinary TCA determination, in which the overall sample preparation time was estimated to be 10 min, taking into account all the operations that need to be performed, including derivatization, extraction, centrifuga-tion, and pipetting etc. Furthermore, the process was accompanied by consumption of 336 µL of inexpensive chemicals. In our opinion, the GC–MS assay can thus be considered
Figure 4. Extraction efficiency of the isobutyl derivative of 1,3-thiazinane-4-carboxylic acid (TCA-IBCF) as a function of the type of extraction solvent expressed as a peak area of the derivative.Samples were analyzed according to the procedure described in Section 3.6. Error bars refer to thestandard deviation (SD) of the data (n = 3).
In summary, these experiments established an optimal procedure, in which urine wastreated with a derivatizing agent, namely IBCF in the presence of pyridine, and subjectedto the GC–MS system without delay after ethyl acetate extraction. Importantly, this isa simple one-pot sample processing method for urinary TCA determination, in whichthe overall sample preparation time was estimated to be 10 min, taking into account allthe operations that need to be performed, including derivatization, extraction, centrifu-gation, and pipetting etc. Furthermore, the process was accompanied by consumption of336 µL of inexpensive chemicals. In our opinion, the GC–MS assay can thus be consideredenvironmentally-friendly thanks to the possibility of carrying out the chemical analysis on

Int. J. Mol. Sci. 2022, 23, 598 10 of 19
a very small scale combined with low consumption of hazardous chemicals and laboratorydisposable plasticware. Nevertheless, it needs to be emphasized that a successful analysisusing the proposed method can only be achieved when the recommended sample handlingand management procedures, described herein, are followed.
2.2. GC Separation and MS Detection
Careful optimization of separation and detection conditions were performed in thenext stage of the method development process, while the initial experiments were con-ducted with the use of a GC–MS method dedicated to urinary HTL measurements [23].As it was recognized that the target compound peak was not well-resolved under theseconditions, a standard approach was employed to specify optimal conditions by assessingthe influence of many operating parameters of the GC–MS system on the method’s perfor-mance. During the study, crucial rules have been pointed out to be followed in order toperform a successful analysis. Particularly, it was recognized that an initial temperatureno higher than 100 ◦C, as well as temperature programmable conditions accompanied byincreasing temperature in a maximum ramp rate estimated as 15 ◦C per hold-up time, wereessential to maintain the efficient resolution of the TCA-IBCF derivative peak from othersample components. In addition, it was found that a ramp to 300 ◦C followed by slowcooling down was necessary to properly equilibrate the GC–MS system between analyses.This standard procedure, which went along with five sample washes and five syringeprimes prior to the injection, was also essential to reduce carryover to the minimum level.Under optimized conditions (see Section 3.6), providing the baseline separation, the peakof the TCA-IBCF derivative eluted within 14.3 min and was easy to distinguish from theresponses of all the concomitant matrix components. Equally importantly, each time theelution profile of blank samples was free from any interference at the retention time of theanalyte (Figure 5).
Int. J. Mol. Sci. 2022, 23, x FOR PEER REVIEW 10 of 19
environmentally-friendly thanks to the possibility of carrying out the chemical analysis on a very small scale combined with low consumption of hazardous chemicals and labor-atory disposable plasticware. Nevertheless, it needs to be emphasized that a successful analysis using the proposed method can only be achieved when the recommended sample handling and management procedures, described herein, are followed.
2.2. GC Separation and MS Detection Careful optimization of separation and detection conditions were performed in the
next stage of the method development process, while the initial experiments were con-ducted with the use of a GC–MS method dedicated to urinary HTL measurements [23]. As it was recognized that the target compound peak was not well-resolved under these conditions, a standard approach was employed to specify optimal conditions by assessing the influence of many operating parameters of the GC–MS system on the method’s per-formance. During the study, crucial rules have been pointed out to be followed in order to perform a successful analysis. Particularly, it was recognized that an initial temperature no higher than 100 °C, as well as temperature programmable conditions accompanied by increasing temperature in a maximum ramp rate estimated as 15 °C per hold-up time, were essential to maintain the efficient resolution of the TCA-IBCF derivative peak from other sample components. In addition, it was found that a ramp to 300 °C followed by slow cooling down was necessary to properly equilibrate the GC–MS system between analyses. This standard procedure, which went along with five sample washes and five syringe primes prior to the injection, was also essential to reduce carryover to the mini-mum level. Under optimized conditions (see Section 3.6), providing the baseline separa-tion, the peak of the TCA-IBCF derivative eluted within 14.3 min and was easy to distin-guish from the responses of all the concomitant matrix components. Equally importantly, each time the elution profile of blank samples was free from any interference at the reten-tion time of the analyte (Figure 5).
(a) (b)
Figure 5. Representative chromatograms of standard solutions and human urine prepared accord-ing to the procedure described in Section 3.5. Chromatographic conditions were as described in Section 3.6. (a) Blank standard solution (black line) and standard solution of 1,3-thiazinane-4-car-boxylic acid (TCA) (50 µmol L−1 in urine) (grey line); (b) normal human urine sample (black line) and the same sample spiked with the analyte (50 µmol L−1 in urine) (grey line). Under these condi-tions, the peak of the isobutyl derivative of TCA (TCA-IBCF) appears at 14.3 min.
The identification and confirmation of the target compound were performed by ana-lyzing the standard solution of TCA (60 µmol L−1) processed according to the procedure
Figure 5. Representative chromatograms of standard solutions and human urine prepared accordingto the procedure described in Section 3.5. Chromatographic conditions were as described in Section 3.6.(a) Blank standard solution (black line) and standard solution of 1,3-thiazinane-4-carboxylic acid(TCA) (50 µmol L−1 in urine) (grey line); (b) normal human urine sample (black line) and the samesample spiked with the analyte (50 µmol L−1 in urine) (grey line). Under these conditions, the peakof the isobutyl derivative of TCA (TCA-IBCF) appears at 14.3 min.
The identification and confirmation of the target compound were performed by ana-lyzing the standard solution of TCA (60 µmol L−1) processed according to the proceduredescribed in Section 3.5. The analyses were carried out by the GC–MS system which was

Int. J. Mol. Sci. 2022, 23, 598 11 of 19
initially set to acquire data in scan mode and subsequently in selected ion monitoring mode(SIM). The electron ionization (EI) mass spectra were recorded by setting the instrument togather data, stepping the mass filter within m/z 50–450 range. Three ions, namely m/z 102.0,m/z 146.0 and m/z 202.1 were preselected as suitable for analyte monitoring (Figure 6).
Int. J. Mol. Sci. 2022, 23, x FOR PEER REVIEW 11 of 19
described in Section 3.5. The analyses were carried out by the GC–MS system which was initially set to acquire data in scan mode and subsequently in selected ion monitoring mode (SIM). The electron ionization (EI) mass spectra were recorded by setting the instru-ment to gather data, stepping the mass filter within m/z 50–450 range. Three ions, namely m/z 102.0, m/z 146.0 and m/z 202.1 were preselected as suitable for analyte monitoring (Figure 6).
(a) (b)
Figure 6. (a) Electron ionization (EI) mass spectrum of 1,3-thiazinane-4-carboxylic acid (TCA) iso-butyl derivative (TCA-IBCF) obtained by analyzing a standard solution of TCA (60 µmol L−1) pre-pared according to the procedure described in Section 3.5; (b) Proposed fragment ion structures in the EI mass spectrum of TCA-IBCF derivative.
In order to increase sensitivity and selectivity in the trace analysis, further analyses were conducted with SIM MS mode, using m/z 102.0 and m/z 146.0 to identify the target compound as well as m/z 202.1 as a quantification ion. The confirmation of the origin of the 14.3 min peak and quantification of the compound of interest in real samples were based upon comparison of retention time and specific ions with a corresponding set of data obtained by analyzing an authentic compound. Finally, satisfactory method selectiv-ity was achieved by means of selecting the oven temperature program and the specific ions monitored by a MS detector. As shown in Figure 5a,b, representing SIM-chromato-grams registered under optimized GC–MS conditions (see Section 3.6), the TCA-IBCF de-rivative produced a single symmetrical peak which was well-resolved from other peaks on the capillary column coated with a HP-5MS phase. Equally importantly, potentially existing thermal effects at elevated temperatures on the study samples’ components within the GC system, which is a well-known but accepted problem [27], did not detri-mentally affect the accuracy, precision or sensitivity of the method, as it was demonstrated during the validation and implementation of the proposed GC–MS assay (see Section 2.3). Therefore, no experimental work was undertaken to evaluate the thermal effects of par-ticular heated GC–MS system elements on the stability of the TCA-IBCF derivative.
2.3. Validation of the Method In order to prove that the optimized method was suited to the analysis of the study
samples, full validation of the new method for the analysis of urinary TCA was conducted. In general, the same approach was used for this purpose as was reported in our earlier papers [15,28]. The elements and acceptance criteria of the method development and val-idation were selected based on the United States Food and Drug Administration guidance for bioanalytical methods validation [29]. In particular, essential parameters, measured in
Figure 6. (a) Electron ionization (EI) mass spectrum of 1,3-thiazinane-4-carboxylic acid (TCA) isobutylderivative (TCA-IBCF) obtained by analyzing a standard solution of TCA (60 µmol L−1) preparedaccording to the procedure described in Section 3.5; (b) Proposed fragment ion structures in the EImass spectrum of TCA-IBCF derivative.
In order to increase sensitivity and selectivity in the trace analysis, further analyseswere conducted with SIM MS mode, using m/z 102.0 and m/z 146.0 to identify the targetcompound as well as m/z 202.1 as a quantification ion. The confirmation of the origin ofthe 14.3 min peak and quantification of the compound of interest in real samples werebased upon comparison of retention time and specific ions with a corresponding set ofdata obtained by analyzing an authentic compound. Finally, satisfactory method selectivitywas achieved by means of selecting the oven temperature program and the specific ionsmonitored by a MS detector. As shown in Figure 5a,b, representing SIM-chromatogramsregistered under optimized GC–MS conditions (see Section 3.6), the TCA-IBCF derivativeproduced a single symmetrical peak which was well-resolved from other peaks on thecapillary column coated with a HP-5MS phase. Equally importantly, potentially existingthermal effects at elevated temperatures on the study samples’ components within the GCsystem, which is a well-known but accepted problem [27], did not detrimentally affectthe accuracy, precision or sensitivity of the method, as it was demonstrated during thevalidation and implementation of the proposed GC–MS assay (see Section 2.3). Therefore,no experimental work was undertaken to evaluate the thermal effects of particular heatedGC–MS system elements on the stability of the TCA-IBCF derivative.
2.3. Validation of the Method
In order to prove that the optimized method was suited to the analysis of the studysamples, full validation of the new method for the analysis of urinary TCA was conducted.In general, the same approach was used for this purpose as was reported in our earlierpapers [15,28]. The elements and acceptance criteria of the method development and vali-dation were selected based on the United States Food and Drug Administration guidancefor bioanalytical methods validation [29]. In particular, essential parameters, measuredin combined experiments, such as selectivity, linearity, the limit of quantification (LOQ),accuracy, and precision were evaluated. In parallel, the matrix effect was investigated dur-
Int. J. Mol. Sci. 2022, 23, 598 12 of 19
ing the validation and implementation of the GC–MS assay. In addition, system suitabilitywas assessed.
2.3.1. System Suitability
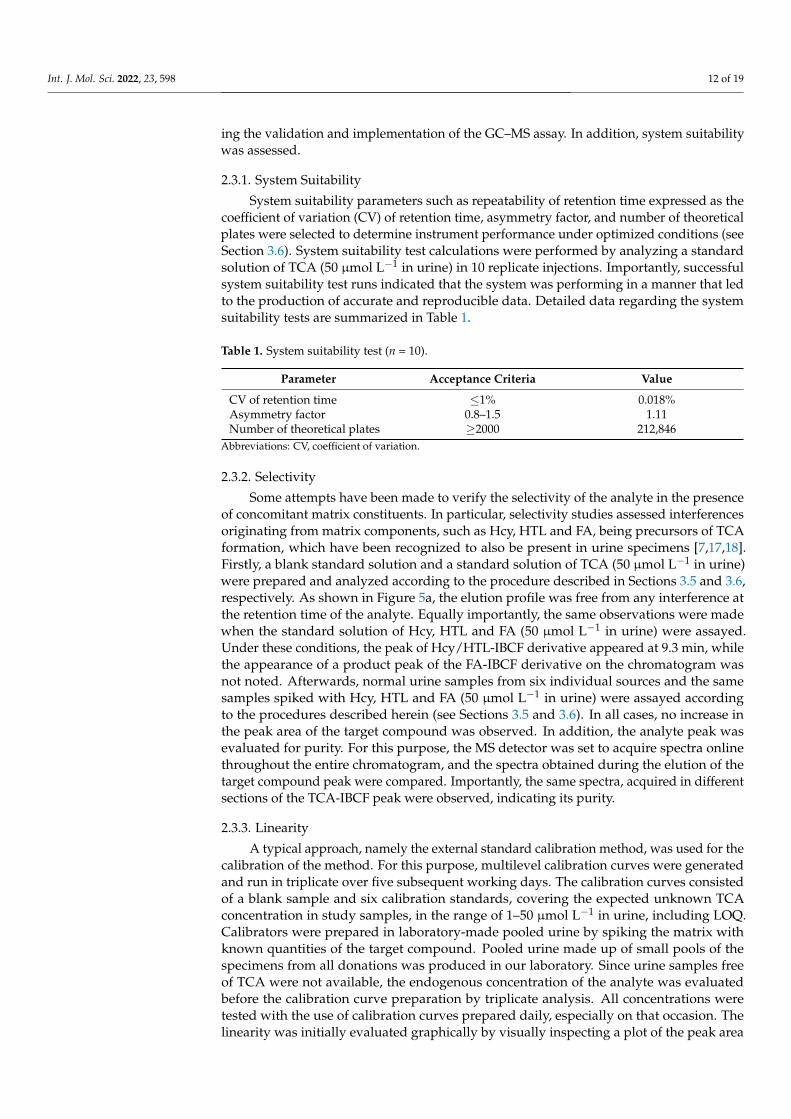
System suitability parameters such as repeatability of retention time expressed as thecoefficient of variation (CV) of retention time, asymmetry factor, and number of theoreticalplates were selected to determine instrument performance under optimized conditions (seeSection 3.6). System suitability test calculations were performed by analyzing a standardsolution of TCA (50 µmol L−1 in urine) in 10 replicate injections. Importantly, successfulsystem suitability test runs indicated that the system was performing in a manner that ledto the production of accurate and reproducible data. Detailed data regarding the systemsuitability tests are summarized in Table 1.
Table 1. System suitability test (n = 10).
Parameter Acceptance Criteria Value
CV of retention time ≤1% 0.018%Asymmetry factor 0.8–1.5 1.11Number of theoretical plates ≥2000 212,846
Abbreviations: CV, coefficient of variation.
2.3.2. Selectivity
Some attempts have been made to verify the selectivity of the analyte in the presenceof concomitant matrix constituents. In particular, selectivity studies assessed interferencesoriginating from matrix components, such as Hcy, HTL and FA, being precursors of TCAformation, which have been recognized to also be present in urine specimens [7,17,18].Firstly, a blank standard solution and a standard solution of TCA (50 µmol L−1 in urine)were prepared and analyzed according to the procedure described in Sections 3.5 and 3.6,respectively. As shown in Figure 5a, the elution profile was free from any interference atthe retention time of the analyte. Equally importantly, the same observations were madewhen the standard solution of Hcy, HTL and FA (50 µmol L−1 in urine) were assayed.Under these conditions, the peak of Hcy/HTL-IBCF derivative appeared at 9.3 min, whilethe appearance of a product peak of the FA-IBCF derivative on the chromatogram wasnot noted. Afterwards, normal urine samples from six individual sources and the samesamples spiked with Hcy, HTL and FA (50 µmol L−1 in urine) were assayed accordingto the procedures described herein (see Sections 3.5 and 3.6). In all cases, no increase inthe peak area of the target compound was observed. In addition, the analyte peak wasevaluated for purity. For this purpose, the MS detector was set to acquire spectra onlinethroughout the entire chromatogram, and the spectra obtained during the elution of thetarget compound peak were compared. Importantly, the same spectra, acquired in differentsections of the TCA-IBCF peak were observed, indicating its purity.
2.3.3. Linearity
A typical approach, namely the external standard calibration method, was used for thecalibration of the method. For this purpose, multilevel calibration curves were generatedand run in triplicate over five subsequent working days. The calibration curves consistedof a blank sample and six calibration standards, covering the expected unknown TCAconcentration in study samples, in the range of 1–50 µmol L−1 in urine, including LOQ.Calibrators were prepared in laboratory-made pooled urine by spiking the matrix withknown quantities of the target compound. Pooled urine made up of small pools of thespecimens from all donations was produced in our laboratory. Since urine samples freeof TCA were not available, the endogenous concentration of the analyte was evaluatedbefore the calibration curve preparation by triplicate analysis. All concentrations weretested with the use of calibration curves prepared daily, especially on that occasion. Thelinearity was initially evaluated graphically by visually inspecting a plot of the peak area
Int. J. Mol. Sci. 2022, 23, 598 13 of 19
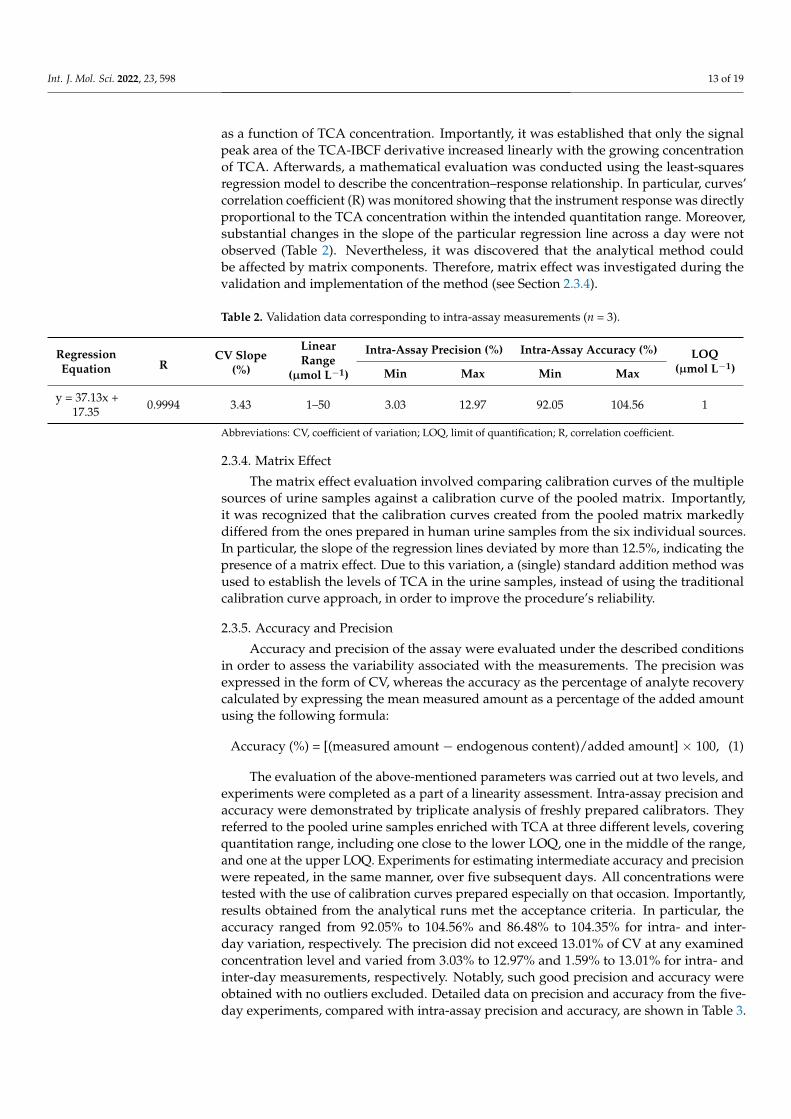
as a function of TCA concentration. Importantly, it was established that only the signalpeak area of the TCA-IBCF derivative increased linearly with the growing concentrationof TCA. Afterwards, a mathematical evaluation was conducted using the least-squaresregression model to describe the concentration–response relationship. In particular, curves’correlation coefficient (R) was monitored showing that the instrument response was directlyproportional to the TCA concentration within the intended quantitation range. Moreover,substantial changes in the slope of the particular regression line across a day were notobserved (Table 2). Nevertheless, it was discovered that the analytical method couldbe affected by matrix components. Therefore, matrix effect was investigated during thevalidation and implementation of the method (see Section 2.3.4).
Table 2. Validation data corresponding to intra-assay measurements (n = 3).
RegressionEquation R
CV Slope(%)
LinearRange
(µmol L−1)
Intra-Assay Precision (%) Intra-Assay Accuracy (%) LOQ(µmol L−1)Min Max Min Max
y = 37.13x +17.35 0.9994 3.43 1–50 3.03 12.97 92.05 104.56 1
Abbreviations: CV, coefficient of variation; LOQ, limit of quantification; R, correlation coefficient.
2.3.4. Matrix Effect
The matrix effect evaluation involved comparing calibration curves of the multiplesources of urine samples against a calibration curve of the pooled matrix. Importantly,it was recognized that the calibration curves created from the pooled matrix markedlydiffered from the ones prepared in human urine samples from the six individual sources.In particular, the slope of the regression lines deviated by more than 12.5%, indicating thepresence of a matrix effect. Due to this variation, a (single) standard addition method wasused to establish the levels of TCA in the urine samples, instead of using the traditionalcalibration curve approach, in order to improve the procedure’s reliability.
2.3.5. Accuracy and Precision
Accuracy and precision of the assay were evaluated under the described conditionsin order to assess the variability associated with the measurements. The precision wasexpressed in the form of CV, whereas the accuracy as the percentage of analyte recoverycalculated by expressing the mean measured amount as a percentage of the added amountusing the following formula:
Accuracy (%) = [(measured amount − endogenous content)/added amount] × 100, (1)
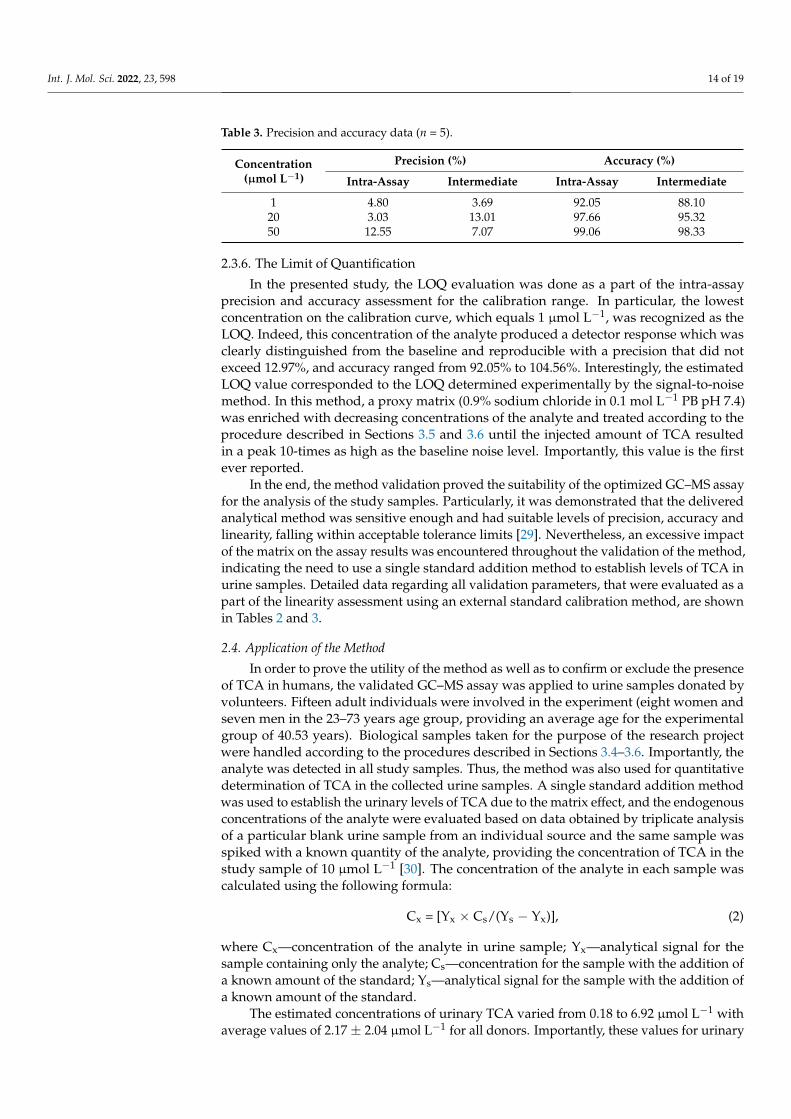
The evaluation of the above-mentioned parameters was carried out at two levels, andexperiments were completed as a part of a linearity assessment. Intra-assay precision andaccuracy were demonstrated by triplicate analysis of freshly prepared calibrators. Theyreferred to the pooled urine samples enriched with TCA at three different levels, coveringquantitation range, including one close to the lower LOQ, one in the middle of the range,and one at the upper LOQ. Experiments for estimating intermediate accuracy and precisionwere repeated, in the same manner, over five subsequent days. All concentrations weretested with the use of calibration curves prepared especially on that occasion. Importantly,results obtained from the analytical runs met the acceptance criteria. In particular, theaccuracy ranged from 92.05% to 104.56% and 86.48% to 104.35% for intra- and inter-day variation, respectively. The precision did not exceed 13.01% of CV at any examinedconcentration level and varied from 3.03% to 12.97% and 1.59% to 13.01% for intra- andinter-day measurements, respectively. Notably, such good precision and accuracy wereobtained with no outliers excluded. Detailed data on precision and accuracy from the five-day experiments, compared with intra-assay precision and accuracy, are shown in Table 3.
Int. J. Mol. Sci. 2022, 23, 598 14 of 19
Table 3. Precision and accuracy data (n = 5).
Concentration(µmol L−1)
Precision (%) Accuracy (%)
Intra-Assay Intermediate Intra-Assay Intermediate
1 4.80 3.69 92.05 88.1020 3.03 13.01 97.66 95.3250 12.55 7.07 99.06 98.33
2.3.6. The Limit of Quantification
In the presented study, the LOQ evaluation was done as a part of the intra-assayprecision and accuracy assessment for the calibration range. In particular, the lowestconcentration on the calibration curve, which equals 1 µmol L−1, was recognized as theLOQ. Indeed, this concentration of the analyte produced a detector response which wasclearly distinguished from the baseline and reproducible with a precision that did notexceed 12.97%, and accuracy ranged from 92.05% to 104.56%. Interestingly, the estimatedLOQ value corresponded to the LOQ determined experimentally by the signal-to-noisemethod. In this method, a proxy matrix (0.9% sodium chloride in 0.1 mol L−1 PB pH 7.4)was enriched with decreasing concentrations of the analyte and treated according to theprocedure described in Sections 3.5 and 3.6 until the injected amount of TCA resultedin a peak 10-times as high as the baseline noise level. Importantly, this value is the firstever reported.
In the end, the method validation proved the suitability of the optimized GC–MS assayfor the analysis of the study samples. Particularly, it was demonstrated that the deliveredanalytical method was sensitive enough and had suitable levels of precision, accuracy andlinearity, falling within acceptable tolerance limits [29]. Nevertheless, an excessive impactof the matrix on the assay results was encountered throughout the validation of the method,indicating the need to use a single standard addition method to establish levels of TCA inurine samples. Detailed data regarding all validation parameters, that were evaluated as apart of the linearity assessment using an external standard calibration method, are shownin Tables 2 and 3.
2.4. Application of the Method
In order to prove the utility of the method as well as to confirm or exclude the presenceof TCA in humans, the validated GC–MS assay was applied to urine samples donated byvolunteers. Fifteen adult individuals were involved in the experiment (eight women andseven men in the 23–73 years age group, providing an average age for the experimentalgroup of 40.53 years). Biological samples taken for the purpose of the research projectwere handled according to the procedures described in Sections 3.4–3.6. Importantly, theanalyte was detected in all study samples. Thus, the method was also used for quantitativedetermination of TCA in the collected urine samples. A single standard addition methodwas used to establish the urinary levels of TCA due to the matrix effect, and the endogenousconcentrations of the analyte were evaluated based on data obtained by triplicate analysisof a particular blank urine sample from an individual source and the same sample wasspiked with a known quantity of the analyte, providing the concentration of TCA in thestudy sample of 10 µmol L−1 [30]. The concentration of the analyte in each sample wascalculated using the following formula:
Cx = [Yx × Cs/(Ys − Yx)], (2)
where Cx—concentration of the analyte in urine sample; Yx—analytical signal for thesample containing only the analyte; Cs—concentration for the sample with the addition ofa known amount of the standard; Ys—analytical signal for the sample with the addition ofa known amount of the standard.
The estimated concentrations of urinary TCA varied from 0.18 to 6.92 µmol L−1 withaverage values of 2.17 ± 2.04 µmol L−1 for all donors. Importantly, these values for urinary

Int. J. Mol. Sci. 2022, 23, 598 15 of 19
TCA are the first ever reported. To the best of our knowledge, no reference method thusfar has been available to estimate TCA content in human biofluids, in particular urine.The presented GC–MS assay is the first one dealing with the above-mentioned issue. Thedetailed data on the experimental group and results of the TCA concentration in all assayedsamples are shown in Table 4.
Table 4. Concentration of 1,3-thiazinane-4-carboxylic acid (TCA) in human urine (n = 15).
VolunteerTCA Concentration ± SD (µmol L−1)
No. Gender Age (Year)
1 Female 23 0.49 ± 0.04 a
2 Female 32 1.76 ± 0.053 Male 30 0.86 ± 0.01 a
4 Male 36 2.40 ± 0.025 Female 51 0.80 ± 0.10 a
6 Female 50 2.28 ± 0.027 Female 23 0.61 ± 0.02 a
8 Male 23 0.34 ± 0.05 a
9 Female 23 3.37 ± 0.4610 Male 50 0.58 ± 0.07 a
11 Female 49 0.18 ± 0.03 a
12 Male 50 2.11 ± 0.1213 Female 68 5.27 ± 0.0714 Male 73 4.51 ± 0.1415 Male 27 6.92 ± 0.72
a Concentration below limit of quantification (LOQ). Abbreviations: TCA, 1,3-thiazinane-4-carboxylic acid; SD,standard deviation of the data (n = 3).
3. Materials and Methods3.1. Reagents and Materials
All chemicals used throughout this study were commercially available and of analyti-cal reagent grade. TCA, Tris, sodium hydrogen phosphate dihydrate, sodium dihydrogenphosphate dihydrate, sodium tetraborate, citric acid monohydrate, potassium dihydro-gen phosphate, potassium chloride, IBCF, anhydrous pyridine, sodium chloride, nonane,n-octane, organic solvents suitable for high performance liquid chromatography (HPLC),namely methanol (MeOH), n-hexane, n-heptane, cyclohexane, ethyl acetate, and 1-octanolwere from Sigma-Aldrich, (St. Louis, MO, USA). Hydrochloric acid, boric acid, and sodiumhydroxide were from J.T. Baker (Deventer, The Netherlands), while organic solvents suit-able for GC, namely, n-decane and butyl alcohol were purchased from Honeywell Fluka(Darmstadt, Germany). Deionized water was produced in our laboratory.
3.2. Instrumentation
An Agilent 7820A GC system equipped with automated sample injector model 7693Aand MS detector 5977B (Agilent Technologies, Waldbronn, Germany) was used for theGC experiments. The GC apparatus was equipped with a split/splitless inlet, working ina split ratio of 10:1 mode to a 60 m × 0.25 mm HP-5MS quartz capillary column with a0.25 µm film thickness (Agilent Technologies, Waldbronn, Germany). Data acquisition andanalysis were performed using a MassHunter 5977B MSD Bundle with 7820 GC softwareNIST MS Spectral Library version 2.3.
For sample shaking, Multi-Speed Vortex MSV-3500 (Biosan, Riga, Latvia) was used.During the study, a Mikro 220R centrifuge with fast cool function (Hettich Zentrifugen, Tut-tlingen, Germany), and a FiveEasy F-20 pH-meter (Mettler Toledo, Greifensee, Switzerland)were also used. Samples were stored in an ultra-low-temperature freezer (Panasonic Health-care Co., Ltd., Sakata, Japan). Water was purified using a Milli-QRG system (Millipore,Vienna, Austria).

Int. J. Mol. Sci. 2022, 23, 598 16 of 19
3.3. Stock Solution of TCA
The stock solution of TCA (0.1 mol L−1) was prepared daily by dissolving an appro-priate amount of TCA powder in HPLC-gradient grade MeOH. Then, the solution waskept at 4 ◦C for no longer than 24 h. The working solutions of TCA were prepared freshlyby dilution of a standard solution with HPLC-gradient grade MeOH as needed and wereprocessed without delay.
3.4. Urine Samples Collection
First, early morning urine samples (about 5 mL) were collected from individuals afterovernight fasting using a standard method [31]. Samples of urine “mid-stream” wereobtained by asking donors to put fluid into a sterile container. Then, samples were cooledon ice and delivered to the laboratory. Importantly, obtained samples were processedwithout delay using the procedure described in Section 3.5.
A group of fifteen apparently healthy individuals, belonging to an ethnically homo-geneous group, was studied. Donors were not supplemented with the analyte, neitherHcy, HTL and/or FA before sample collection. In addition, no medications were allowed.The study was approved by the Ethics Committee of the University of Lodz (decisionidentification code 4/KBBN-UŁ/III/2020-21, date of approval 27 April 2021). All subjectsgave their written informed consent.
3.5. Urine Samples Preparation for TCA Quantification by GC–MS
The urine sample (50 µL) was mixed with 200 µL of 3 mol L−1 Tris-HCl buffer, pH 7.Then, 6 µL of pyridine, serving as a catalyst, and 30 µL of IBCF were added to the resultingmixture. Thereafter, the mixture was shaken by hand and incubated at room temperaturefor 5 min. In the next step, the TCA-IBCF derivative was extracted from the samplewith 100 µL of ethyl acetate by keeping it in a centrifuge at 6000 rpm for 1 min at roomtemperature. After centrifugation, the cloudy organic phase (upper layer) was transferredto a vial, and 1 µL of the sample was injected into the GC–MS system without delay.Each sample was analyzed according to the procedure described in Section 3.6. Cautions:Vigorous stirring/vortexing is not recommended to avoid an explosion.
3.6. GC–MS Conditions
Helium (99.9999%) was used as the carrier gas with a constant flow rate of 1 mL min−1.The injection port temperature was set to 270 ◦C. The chromatographic separation of theTCA-IBCF derivative was accomplished under thermal gradient conditions. The initialoven temperature was set to 100 ◦C and increased to 300 ◦C in steps of 15 ◦C min-1, thenheld at 300 ◦C for 3 min. Afterwards, the oven was slowly cooled down in steps of 55 ◦Cmin−1. The MS detector was operated in the EI mode at 70 eV. The ion source temperaturewas set at 230 ◦C, the temperature of quadrupole was set at 150 ◦C, while the MS interfacewas set to 250 ◦C. The multiple ion detector was focused on ions that represented only theportion of the TCA-IBCF derivative with masses of m/z 102.0, m/z 146.0 and m/z 202.1to identify the target compound, while m/z 202.1 was preselected as a quantification ion.The instrument was set to acquire data within a 8–20 min range of time, with a dwell timethat yielded 15 to 20 scans across the chromatographic peak. Cautions: The derivatizingagent is toxic and corrosive, thus five syringe washes with 3 µL of ethyl acetate prior andafter each injection, are highly recommended for corrosion protection for the metal part ofthe syringe.
4. Conclusions
Based on a thorough review of existing publications, it can be reasonably stated thatthis report generates brand new information on a novel product of sulfur metabolismin humans, namely TCA. In particular, the experiments produced credible evidence thatHTL/Hcy and FA adduct was present in human urine. Furthermore, the analytical knowl-edge of 1,3-thiazinane derivatives was extended. A new method for the assessment of
Int. J. Mol. Sci. 2022, 23, 598 17 of 19
TCA content in human biofluids, namely urine has notably been provided. In parallel,valuable information on the essential stages of the analytical process during 1,3-thiazinanederivative determination has been delivered. In addition, some preliminary conclusionsconcerning TCA content in apparently healthy donors regardless of sex, age, general stateof health etc., were reached. Now, it remains to be investigated and to find an answeras to whether TCA plays a key role in living systems and what kind of role it might be.In fact, the proposed GC–MS approach is not free from restrictions (see Section 2) andthe rules described herein should be followed in order to produce meaningful results. Inparticular, it is highly recommended to quantify the samples using the single standardaddition method, which limits the number of samples analyzed per day and assay themwithout delay due to the limited stability of the TCA-IBCF derivative under experimentalconditions. Nonetheless, we hope that the elaborated method will be suitable for meetingthis objective as these results are undoubtedly desirable from the standpoint of humanwell-being. Hopefully, the obtained data will feature in further research in the field, inparticular involving biostatistical analysis of medical data in near future.
Author Contributions: Conceptualization, J.P. and R.G.; methodology, J.P.; validation, J.P., formalanalysis, J.P.; investigation, J.P. and N.L.; data curation, J.P.; writing—original draft preparation, J.P.;writing—review and editing, J.P. and R.G.; visualization, J.P.; supervision, J.P.; project administration,J.P.; resources, J.P. and R.G.; funding acquisition, J.P. and R.G. All authors have read and agreed to thepublished version of the manuscript.
Funding: The research received funding from the University of Lodz within the University of LodzInitiative of Excellence Research University (IDUB) grants for young researchers (decision number10/K/739ML/2020; agreement number 13/IDUB/MLOD/2021, project number B2111101000020.07),while the publication costs were covered by the University of Lodz (project number B2111100000234.01).
Institutional Review Board Statement: The study was conducted according to the guidelines of theDeclaration of Helsinki, and approved by the Ethics Committee of the University of Lodz (decisionidentification code 4/KBBN-UŁ/III/2020-21, date of approval 27 April 2021).
Informed Consent Statement: Written informed consent was obtained from all subjects involved inthe study.
Data Availability Statement: Data is contained within the article. In addition, any obtained datawhich contributed to the article can be made available by the corresponding author (J.P.) upon requestas long as the request does not compromise intellectual property interests.
Acknowledgments: The authors are grateful to all the volunteers, from the Faculty of Chemistry, theUniversity of Lodz, for the donation of urine samples. We also gratefully acknowledge Anna Zawiszafor her help in determining fragment ion structures in the EI mass spectrum of TCA-IBCF derivative.
Conflicts of Interest: The authors declare no conflict of interest. In addition, the authors declare thatthe funders had no role in the design of the study; in the collection, analyses, or interpretation of data;in the writing of the manuscript; or in the decision to publish the results.
Abbreviations
AD Alzheimer’s diseaseCys cysteineCV coefficient of variationCVD cardiovascular diseaseDM diabetes mellitusEI electron ionizationFA formaldehydeGC gas chromatographyHcy homocysteineHPLC high performance liquid chromatography
Int. J. Mol. Sci. 2022, 23, 598 18 of 19
HTL homocysteine thiolactoneIBCF isobutyl chloroformateLOQ limit of quantificationMeOH methanolMS mass spectrometryPB phosphate bufferR correlation coefficientRT room temperatureSD standard deviationSIM selected ion monitoring modeTCA 1,3-thiazinane-4-carboxylic acidTCA-IBCF isobutyl derivative of 1,3-thiazinane-4-carboxylic acidTris-HCl tris(hydroxymethyl)aminomethane-hydrochloride acid buffer
References1. Moretti, R.; Caruso, P. The controversial role of homocysteine in neurology: From labs to clinical practice. Int. J. Mol. Sci. 2019, 20,
231. [CrossRef]2. Perła-Kaján, J.; Jakubowski, H. Dysregulation of epigenetic mechanisms of gene expression in the pathologies of hyperhomocys-
teinemia. Int. J. Mol. Sci. 2019, 20, 3140. [CrossRef]3. Oliveira, P.; Laurindo, F. Implications of plasma thiol redox in disease. Clin. Sci. 2018, 132, 1257–1280. [CrossRef]4. Chrysant, S.G.; Chrysant, G.S. The current status of homocysteine as a risk factor for cardiovascular disease: A mini review.
Expert Rev. Cardiovasc. Ther. 2018, 16, 559–565. [CrossRef]5. Muzurovic, E.; Kraljevic, I.; Solak, M.; Dragnic, S.; Mikhailidis, D.P. Homocysteine and diabetes: Role in macrovascular and
microvascular complications. J. Diabetes Complicat. 2021, 35, 107834. [CrossRef] [PubMed]6. Wang, F.; Chen, D.; Wu, P.; Klein, C.; Jin, C. Formaldehyde, Epigenetics, and Alzheimer’s Disease. Chem. Res. Toxicol. 2019, 32,
820–830. [CrossRef] [PubMed]7. He, R. Formaldehyde and Cognition, 1st ed.; Springer: Dordrecht, The Netherlands, 2017; ISBN 978-94-024-1175-1.8. Pietzke, M.; Meiser, J.; Vazquez, A. Formate metabolism in health and disease. Mol. Metab. 2020, 33, 23–37. [CrossRef] [PubMed]9. Zhang, Y.; Yang, Y.; He, X.; Yang, P.; Zong, T.; Sun, P.; Sun, R.; Yu, T.; Jiang, Z. The cellular function and molecular mechanism of
formaldehyde in cardiovascular disease and heart development. J. Cell. Mol. Med. 2021, 25, 5358–5371. [CrossRef] [PubMed]10. Tan, T.; Zhang, Y.; Luo, W.; Lv, J.; Han, C.; Hamlin, J.N.R.; Luo, H.; Li, H.; Wan, Y.; Yang, X.; et al. Formaldehyde induces
diabetes-associated cognitive impairments. FASEB J. 2018, 32, 3669–3679. [CrossRef] [PubMed]11. Kalász, H. Biological Role of Formaldehyde, and Cycles Related to Methylation, Demethylation, and Formaldehyde Production.
Mini-Rev. Med. Chem. 2003, 3, 175–192. [CrossRef] [PubMed]12. Wriston, J.; Mackenzie, C. Synthesis and metabolism of 1, 3-thiazane-4-carboxylic acid derived from formaldehyde and homocys-
teine. J. Biol. Chem. 1957, 225, 607–614. [CrossRef]13. Neely, W.B. Action of formaldehyde on microorganisms II.: Formation of 1, 3-thiazane-4-carboxylic acid in Aerobacter Aerogenes
treated with formaldehyde. J. Bacteriol. 1963, 85, 1420–1422. [CrossRef]14. Jakubowski, H. Mechanism of the condensation of homocysteine thiolactone with aldehydes. Chem. Eur. J. 2006, 12, 8039–8043.
[CrossRef] [PubMed]15. Piechocka, J.; Wronska, M.; Głowacka, I.E.; Głowacki, R. 2-(3-hydroxy-5-phosphonooxymethyl-2-methyl-4-pyridyl)-1,3-
thiazolidine-4-carboxylic acid, novel metabolite of pyridoxal 5′-phosphate and cysteine is present in human plasma-chromatographic investigations. Int. J. Mol. Sci. 2020, 21, 3548. [CrossRef] [PubMed]
16. Reischl, R.J.; Bicker, W.; Keller, T.; Lamprecht, G.; Lindner, W. Occurrence of 2-methylthiazolidine-4-carboxylic acid, a condensationproduct of cysteine and acetaldehyde, in human blood as a consequence of ethanol consumption. Anal. Bioanal. Chem. 2012, 404,1779–1787. [CrossRef]
17. Stachniuk, J.; Kubalczyk, P.; Furmaniak, P.; Głowacki, R. A versatile method for analysis of saliva, plasma and urine for totalthiols using HPLC with UV detection. Talanta 2016, 155, 70–77. [CrossRef]
18. Piechocka, J.; Wronska, M.; Chwatko, G.; Jakubowski, H.; Głowacki, R. Quantification of homocysteine thiolactone in humansaliva and urine by gas chromatography-mass spectrometry. J. Chromatogr. B 2020, 1149, 122155. [CrossRef]
19. Dufková, V.; Cabala, R.; Maradová, D.; Štícha, M. A fast derivatization procedure for gas chromatographic analysis of perfluori-nated organic acids. J. Chromatogr. A 2009, 1216, 8659–8664. [CrossRef]
20. Halket, J.; Zaikin, V. Derivatization in mass spectrometry-1. Silylation. Eur. J. Mass Spectrom. 2003, 9, 1–21. [CrossRef]21. Zaikin, V.; Halket, J. Derivatization in mass spectrometry-2. Acylation. Eur. J. Mass Spectrom. 2003, 9, 421–434. [CrossRef]22. Halket, J.M.; Zaikin, V.G. Derivatization in mass spectrometry-3. Alkylation (arylation). Eur. J. Mass Spectrom. 2004, 10, 1–19.
[CrossRef] [PubMed]23. Wronska, M.; Chwatko, G.; Borowczyk, K.; Piechocka, J.; Kubalczyk, P.; Głowacki, R. Application of GC–MS technique for the
determination of homocysteine thiolactone in human urine. J. Chromatogr. B 2018, 1099, 18–24. [CrossRef] [PubMed]
Int. J. Mol. Sci. 2022, 23, 598 19 of 19
24. Hušek, P.; Šimek, P. Alkyl chloroformates in sample derivatization strategies for GC analysis. Review on a decade use of thereagents as esterifying agents. Curr. Pharm. Anal. 2006, 2, 23–43. [CrossRef]
25. Davies, M.T. A universal buffer solution for use in ultra-violet spectrophotometry. Analyst 1959, 84, 248–251. [CrossRef]26. Švarc-Gajic, J. General principles of extraction. In Sampling and Sample Preparation in Analytical Chemistry; Nova Science Publishers,
Inc.: New York, NY, USA, 2012; pp. 63–75. ISBN 978-1-62100-269-7.27. Tsochatzis, E.D.; Nebel, C.; Danielsen, M.; Sundekilde, U.K.; Kastrup Dalsgaard, T. Thermal degradation of metabolites in
urine using multiple isotope-labelled internal standards for off-line GC metabolomics-effects of injector and oven temperatures.J. Chromatogr. B 2021, 1181, 122902. [CrossRef]
28. Piechocka, J.; Wieczorek, M.; Głowacki, R. Gas Chromatography–Mass Spectrometry Based Approach for the Determination ofMethionine-Related Sulfur-Containing Compounds in Human Saliva. Int. J. Mol. Sci. 2020, 21, 9252. [CrossRef]
29. FDA. Bioanalytical Method Validation Guidance for Industry; FDA: Rockville, MD, USA, 2018.30. Cuadros-Rodríguez, L.; Gámiz-Gracia, L.; Almansa-López, E.M.; Bosque-Sendra, J.M. Calibration in chemical measurement
processes. II. A methodological approach. TrAC-Trends Anal. Chem. 2001, 20, 620–636. [CrossRef]31. González-Domínguez, R.; González-Domínguez, Á.; Sayago, A.; Fernández-Recamales, Á. Recommendations and best practices
for standardizing the pre-analytical processing of blood and urine samples in metabolomics. Metabolites 2020, 10, 229. [CrossRef][PubMed]
![ChemInform Abstract: Competing Regiodirecting Effects of Ester and Aryl Groups in [3 + 3] Cyclocondensations of 1,3-Bis(trimethylsilyloxy)-1,3-butadienes: Regioselective Synthesis](https://static.fdokumen.com/doc/165x107/6323a25a4d8439cb620d0030/cheminform-abstract-competing-regiodirecting-effects-of-ester-and-aryl-groups-in.jpg)


![Competing Regiodirecting Effects of Ester and Aryl Groups in [3+3] Cyclocondensations of 1,3-Bis(trimethylsilyloxy)-1,3-butadienes: Regioselective Synthesis of 3-Hydroxyphthalates](https://static.fdokumen.com/doc/165x107/6323a23503238a9ff60a8549/competing-regiodirecting-effects-of-ester-and-aryl-groups-in-33-cyclocondensations.jpg)


![4,4′-Difluoro-2,2′-{[(3a RS ,7a RS )-2,3,3a,4,5,6,7,7a-octahydro-1 H -1,3-benzimidazole-1,3-diyl]bis(methylene)]}diphenol](https://static.fdokumen.com/doc/165x107/63258a217fd2bfd0cb03842e/44-difluoro-22-3a-rs-7a-rs-233a45677a-octahydro-1-h-13-benzimidazole-13-diylbismethylenediphenol.jpg)

