DETERMINATION OF HEAVY METALS IN DIFFERENT ...
60
DETERMINATION OF HEAVY METALS IN DIFFERENT INDUSTRIAL SITES OF SAVAR UPAZILA OF DHAKA M.GOLAM RABBI TANVEER DEPARTMENT OF AGROFORESTRY AND ENVIRONMENTAL SCIENCE SHER-E-BANGLA AGRICULTURAL UNIVERSITY DHAKA-1207 JUNE 2017
-
Upload
khangminh22 -
Category
Documents
-
view
1 -
download
0
Transcript of DETERMINATION OF HEAVY METALS IN DIFFERENT ...

DETERMINATION OF HEAVY METALS IN DIFFERENT INDUSTRIAL SITES
OF SAVAR UPAZILA OF DHAKA
M.GOLAM RABBI TANVEER
DEPARTMENT OF AGROFORESTRY AND ENVIRONMENTAL SCIENCE
SHER-E-BANGLA AGRICULTURAL UNIVERSITY
DHAKA-1207
JUNE 2017

DETERMINATION OF HEAVY METALS IN DIFFERENT INDUSTRIAL
SITES OF SAVAR UPAZILA OF DHAKA
A THESIS
BY
M.GOLAM RABBI TANVEER
Registration: 11-04513
Semester: January-June 2017
Session: 2015-16
MASTER OF SCIENCE
IN
AGROFORESTRY AND ENVIRONMENTAL SCIENCE
DEPARTMENT OF AGROFORESTRY AND ENVIRONMENTAL SCIENCE
SHER-E-BANGLA AGRICULTURAL UNIVERSITY
DHAKA-1207
JUNE 2017

DETERMINATION OF HEAVY METALS IN DIFFERENT INDUSTRIAL
SITES OF SAVAR UPAZILA OF DHAKA
BY
M.GOLAM RABBI TANVEER
REGISTRATION NO: 11-04513
A Thesis
Submitted to the Faculty of Agriculture,
Sher-e-Bangla Agricultural University,
Dhaka, in partial fulfillment
of the requirements
for the degree
of
MASTER OF SCIENCE
IN
AGROFORESTRY AND ENVIRONMENTAL SCIENCE
SEMESTER: JANUARY-JUNE, 2017
Approved By:
Dr.Ferzana Islam Professor
Supervisor
Dr. Forhad Hossain Professor
Co-Supervisor
Prof. Dr. NazmunNaher Chairman
Examination Committee

i
ACKNOWLEDGEMENTS
The Author of the paper is ever indebted and grateful to the Merciful Allah,
the Supreme authority of this planet for creatingan opportunity to compete the
research program and for filing the result.
The author express the heartiest gratitude indebtness, appreciation and mostly
regards to his honorable and beloved teacher and Supervisor Dr. Ferzana
Islam, professor, Department of Agroforestry and Environmental Science,
Faculty of Agriculture Sher-e-Bangla Agriculture, University (SAU), Dhaka-
1207 for her program oriented guidance, inspiration and assistance in all
phases of conduction of this study and manuscript preparation.
The author is immensely showing obligations to his honorable and respected co-
supervisor Dr. Forhad Hossain, Professor, Department of Agroforestry and
Environment Science, Sher-e-Bangla Agriculture University, Dhaka-1207, for
his proper guideline valuable working plan, suggestions, advice and
supervision for the completion of the study.
The profound gratitude and respect are expressed to honorable teachers
Professor Nazmun Naher, Professor Dr. Md. Kawsar Hossain, Md. Shahriar
Jaman Mishu, Jubayer-Al-Mahmud, G.J Helal and others for their nice
cooperation, motivational suggestion and step taking suggestions, cordial helps
during period of study.
The author would like to express all his grateful thanks to Dr. MohidulAlam,
Upazilla agriculture officer, Savar Upazila, Dhaka, Md. Liakat Hossain,
Chief Scientific officer, SRDI, Local and District office,
Dhaka,MuhammadNurul Amin Asgar,Upazila Medical officer,Savar
Upazila,Dhaka. For their cordial help to complete the analysis of water ,soil ,
plant sample in the Laboratory and for providing the data of various items,
those helped me in my study.
Author expresses hiss indebtness to the lab technician and all staffs of the
Department of AgroForestry and Environment Science (SAU), Dhaka &
Applied Chemistry Lab, BUET, Dhaka for their help and collaboration
towards the completion of study work.
A cordial thanks to Mr. HedayatullahRasel (AEO, Savar), Md. Memaymot
Karim (Livestock Officer, Savar), Md. SiddiquallahRatan (SSO, SRDI) for

ii
their cordial help in completion of research work. Author also like to thank
Sadiaafrin, AfsanaLithi, Zian, Tushi, Niloy, Sharif, Bipasha for their
valuable suggestions and reinforcement in the study.
The author feels his profound respect to his father Md. Abdur Rob and also
mother Mst. ShireenAkter, Brother Md. Golam Are-fin Tuhin for their
sacrifice and positive attitude in his higher study, The author feels indebted
thanks to his grand-father and mother, rest of the kith-kin, friends and all
sorts of well-wishers for their conveying and support throughout whole
academic life.
The Author
July,2018

iii
DETERMINATION OF HEAVY METALS IN DIFFERENT
INDUSTRIAL SITES OF SAVAR UPAZILA OF DHAKA
By
M. GOLAM RABBI TANVEER
ABSTRACT
Bangladesh is a low lying area covered country with a huge number of populations.
Most of the population depends upon the agricultural land and cultivation of soil.
But with rapid industrialization, land especially nearside of Dhaka are going too
covered with industries. As expected task, industries are polluting the surrounding
environment with their discharge. The study was carried out to find out the impact
of the Industrial discharge on surrounding environment and agricultural
productivity. During the study a total number of 40 soil samples were collected from
different target location (Tannery, pharmaceuticals, textile, dyeing, food and
beverage Industry prone area) of Ashulia, Savar, Amin Bazar, Dhamsona union of
Savar upazila. Later, Different parameter like pH, P, Fe, Mn, Cd, Cr, As, Pb, DO
were analyzed from the collected sample. The mean value of pH, P, Fe, Mn, Pb, As
in the soil sample of target area in Ashulia was 6.88, 28.27mg/kg, 122.42 mg/kg,
55.56 mg/kg, 27.88 mg/kg, 5.03 mg/kg. In savar it was 7.01, 25.98 mg/kg, 85.67
mg/kg, 44.96 mg/kg, 30.3 mg/kg, 5.39 mg/kg. In Amin Bazar it was 5.94, 24.75
mg/kg, 88.4 mg/kg, 52.62 mg/kg, 38.06 mg/kg and 5.80 mg/kg. In Dhamsona it was
6.90, 25.24 mg/kg, 94.04 mg/kg, 46.21 mg/kg, 30.67 mg/kg, 5.23 mg/kg. Soil of
Amin Bazar was more acidic (5.94 pH) and soil of savar (pH 7.01) and Dhamsona
(pH 6.98) union, It was almost in neutral in condition. Mean P was higher in
Ashulia soil (28.24 mg/kg). Pb (38.06 mg/kg) and As (5.81 mg/kg) was higher in
Amin Bazar soil. Industrial waste must not be discharged to any of the open field,
River, Canal or any other water bodies before recycling. Therefore, Industrial
waste is a great concern to ecosystem and environment. It destroys the ecosystem
function, environment balance and health hazards. Further study should be carried
out to carry out multiple variables related to waste and metal discharge to
investigate the crisis so that clear and deeper information of impact may found.

iv

ix
LIST OF CONTENTS
CHAPTER TITLE PAGE
ACKNOWLEDGEMENT i-ii
ABSTRACT iii
LIST OF CONTENTS iv-vi
LIST OF TABLES vii
LIST OF FIGURES vii
LIST OF ABBREVIATIONS ix
CHAPTER
I
INTRODUCTION
01 – 05
CHAPTER
II
REVIEW OF LITERATURE 06-12
2.1 Chemical Properties of soil 06
2.2 Nutrient status of available phosphorus 06
2.3 Heavy metal status in soil 07
2.4 Lead availability 08
2.5 Heavy Metals contamination in soil 08
2.6 Consequence of Industrial effluents 09-10
2.7 Effect of Industrial waste water on soil 11-12
CHAPTER
III
MATERIALS AND METHODS 13-25
3.1 Location Description 13
3.2 Demographic characters 14
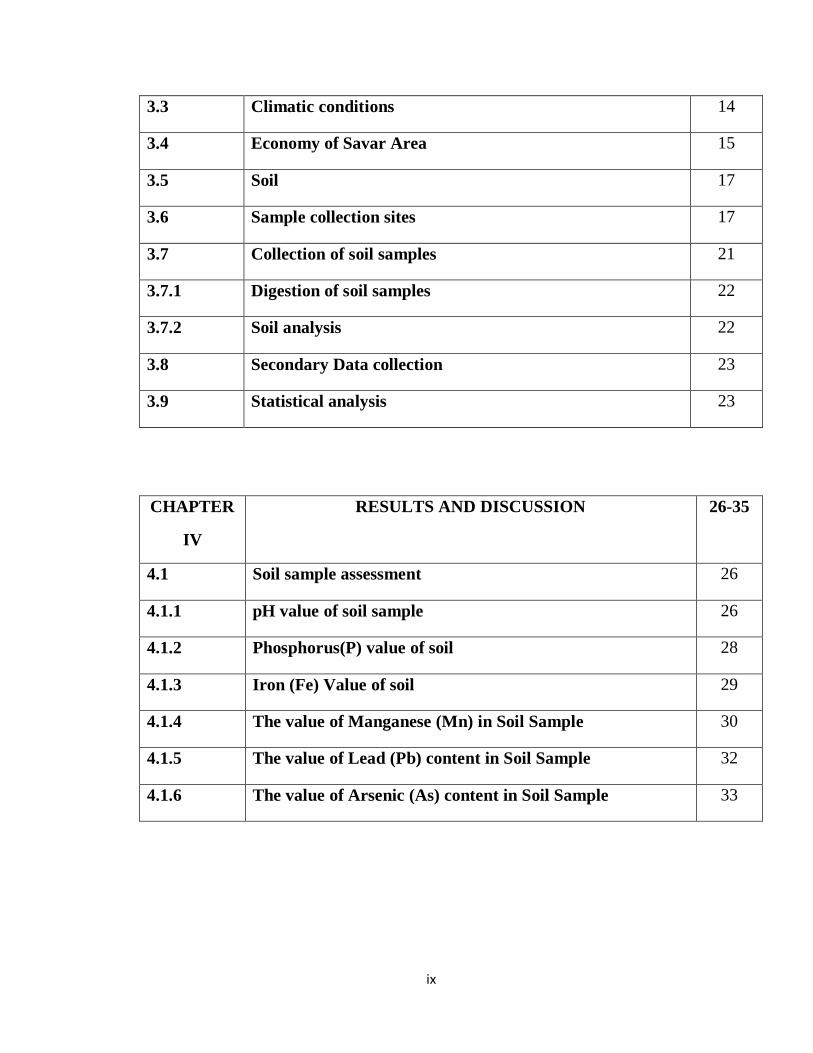
ix
3.3 Climatic conditions 14
3.4 Economy of Savar Area 15
3.5 Soil 17
3.6 Sample collection sites 17
3.7 Collection of soil samples 21
3.7.1 Digestion of soil samples 22
3.7.2 Soil analysis 22
3.8 Secondary Data collection 23
3.9 Statistical analysis 23
CHAPTER
IV
RESULTS AND DISCUSSION 26-35
4.1 Soil sample assessment 26
4.1.1 pH value of soil sample 26
4.1.2 Phosphorus(P) value of soil 28
4.1.3 Iron (Fe) Value of soil 29
4.1.4 The value of Manganese (Mn) in Soil Sample 30
4.1.5 The value of Lead (Pb) content in Soil Sample 32
4.1.6 The value of Arsenic (As) content in Soil Sample 33

ix
CHAPTER
V
SUMMARY, CONCLUSION 36-38
CHAPTER
VI
RECOMMENDATIONS 39
CHAPTER
VII
REFERENCES 40-45
CHAPTER
VIII
APPENDICES 46-47

ix
LIST OF TABLES
TABLE TITLE PAGE
NO.
3.1 Major industries in the sampling sites of soil sample collection
that are source of contamination
20
3.2 Methods used designing soil analysis 23
4.1 The value of pH in different industrial sites Savar upazila 26
4.2 The value of P (mg/kg) in different industrial sites Savar
upazila
28
4.3 The value of Fe (mg/kg) in different industrial sites Savar
upazila
29
4.4 The value of Mn (mg/kg) in different industrial sites Savar
upazila
31
4.5 The value of Pb (mg/kg) in different industrial sites Savar
upazila
32
4.6 The value of As (mg/kg) in different industrial sites Savar
upazila
34

ix
LIST OF FIGURES
FIGURE TITLE PAGE
NO.
1 Map showing locale of the study area at Savar upazila
16
2 Figure of Sampling area (Dhamsona union) 18
3 Figure of sampling area (Savar union) 18
4 Figure of Sampling site (Amin bazar union) 19
5 Figure of sampling site (Ashulia union) 19
6 Sampling site contaminating near textile wastage disposal
area, Ashulia
24
7 Soil collection from the industrial area crop field, Aminbazar 24
8 Soil sampling sites in dhamsona union, Savar 25
9 Usage of contaminated by human in Amin bazar of savar
upazila
25
10 Mean value of pH in the collected soil sample 27
11 Mean value of Phosphorus (P) in the collected soil sample 28
12 Mean value of iron (Fe) in the collected soil sample 30
13 Mean value of Manganese (Mn) in the collected soil sample 31
14 Mean value of Lead (Pb) in the collected soil sample 33
15 Mean value of Arsenic (As) in the collected soil sample 34

ix
LIST OF ABBREVIATIONS
AEZ : Agro-ecological zone
ADB : Asian development bank
BAU : Bangladesh Agricultural University
BBS : Bangladesh Bureau of Statistics
DoF : Department of forestry
et al. : and others
FAO : Food and Agriculture Organization
VS : Veterinary Surgeon
AEO : Agriculture Extension Officer
UAO : Upazila Agriculture Officer
MoH : Ministry of Health
SRDI : Soil Resource Development Institute
LGED : Local Government and Engineering Department
Wikipedia : A site of information

1
INTRODUCTION
In particular of Bangladesh and world, pollution through heavy metals are one of
the most severe tricky in soil, water and plants. Therefore it is much more likely to
cause the contamination of soil. It has become a serious issue for the next
generation to face the challenges of the metals effect that is causing by the rapid
urbanization and the large scale industrialization. Heavy metals contamination is
one of the great issues as these have the toxicity and ability to accumulate in the
biota. Industrial or municipal waste water irrigation is a common example in
almost three fourth of the cities in Asia, Africa, and Latin America (Gupta et al.,
2008). Investigations on the accumulation of heavy metals from vegetables grown
around the industrial sites have revealed high levels of Ni, Pb and Cd in
vegetables.
“Heavy metals’’ may be termed as the metals that have the character of toxicity
and poisonous effect in a low concentration, relatively high in density (Lenntech,
2004). Heavy metals are the compounds that have specific gravity greater than 5
parts. The “heavy metals” is generally a collective term, which applies to the
group of metals and metalloids with atomic absorption density greater than 4 g
cm-3 or 5 times or more, greater than water (Huton and Symon, 2005 ; Hawkes,
1997). Generally heavy metals are termed as the trace elements, microelements,
micronutrients, trace inorganic elements and minor elements. So far, it has been
identified that there are 38 elements known as the heavy metals, meanwhile most
industries discharge with more than thirteen elements (Rizwana,2016) like as -
copper (Co), iron (Fe), mercury (Hg), molybdenum (Mo), cadmium (Cd),
chromium (Cr), cobalt (Co), nickel (Ni), lead (Pb), arsenic (As), tin (Sn) and zinc
(Zn). In addition to say that mostly some of the heavy metals are insignificant both
human and health. But some of these heavy metals are essential in trace amounts,
namely Cobalt (Co), Copper (Cu), Iron (Fe), Manganese (Mn), Molybdenum (Mo)
and Zinc (Zn) to plants and Nickel (Ni), Chromium (Cr) and Tin (Sn) to animals

2
but Cadmium (Cd), Arsenic (As), Mercury (Hg) and lead (Pb) either not proven
essential both for plants or animals. Heavy metals are such a topic to emergence
due to their capability to bind on both organic and inorganic colloids. Few of the
sources of heavy metals contamination in both soil; and water are referred as the
pesticides, fossil fuels, fertilizers, manure, municipal wastes, industrial discharge,
sewage-sludge, mining wastes, animal wastes, contaminated water etc. (Arora et
al., 2008). These discharged element have a final fate of the soil sink. Kabata and
Pendias showed that Soil is the final sink or goal for all the trace elements, and
the elements. It was expected that the residence time of Cd in the soil might be in
the range of 75 - 380 years and more strongly sorbet elements like As, Cu, Ni, Pb
and Zn ranged from 1500 - 3000 years (Butt, 2005). In recent times in the nearside
of Dhaka metro it has been showed that the cultivation of the vegetables are more
rapidly increasing in number matched to the cereal cultivation. A significant use of
the waste water in cultivation in these area are more common as there is a great
lack of pure water in the rabi season and almost all year round .Therefore there can
be great opportunity of passing heavy meats in human food chain.
In the recent times, wastes are considered as the most described topics. Industrial
waste is one of them that is describing as issue of most imperative. In all
environments industrial wastes are considered as the main source of effluence
those of which urges a on spot treatment before positioning in a sewage systems
(Imorgor et al., 2005). The environment of soil and water are in much pressure
discharge of effluents of rapidly expanded industries. A progressive increase in
industry wastes are seen as there is a rapid increase in industrialization, in
Bangladesh. Such products are causing soil, air and water contamination and
polluting the environment thus.
A agro-based country like Bangladesh with a mass pollution of more than 1077
(BBS’16) are in great threat to it. Pharmaceuticals, textile, sugar, fertilizer and

3
leathers are the main industries in Bangladesh. Unfortunately the processing of
production and raw materials are polluting the environment of these industries. As
Bangladesh is a developing country of third world and is in a vulnerable position.
About 30,000 industrial units of which about 24,000 were small and cottage
industry is present in Bangladesh (Nuruzzaman et al., 2008).
Production has increased by 46 percent since 1981. Also a group of Tannery,
industrial chemicals, pharmaceuticals and garments products is increasing by 200
to 4000 percent over last ten to fifteen years (DoE, 2008). About 1200 industries
those are polluting in huge with no treatment facilities of wastes (DoE, 2008).
These effluents that are coming out of these industries are discharging either to
soil or river (Khan, 2006). As global environment are polluting fast, also causes
are inter-connected. It has become a important issue. Few cases like, lack in
logistic support, rapid industrialization, poor waste treatment, monitoring
inequality and unplanned urbanization modified the situation greatly. Environment
has become hostile in recent time; health and welfare due to these pollutants of
industries are in a threat (The Daily Star, 2016). The environment of water and soil
contamination with various pollutants has been increased considerably in most of
the part of the world. Discharged effluent of the industries and urban sewage finds
its own way to water bodies and soil surface via surface run-off and rivers.
Pollutants are receiving by the water bodies like lagoons, ponds and lakes, out
becoming vulnerable. A profound contribution of heavy metals to the soil is
carried out by the wastewater. This all things are causing a rapid health hazards as
plants are absorbing the effluents rapid. Human as well as Livestock are the main
receiver o the crops that are absorbing the metals form these effluents. Now it’s a
matter of great concern of soil and water contamination with heavy metals over
the world. So, Metals like, Mn, Zn, Fe, Cu and Mo are essential for plants but like
4
by Ni, Cr and Sr. for animals but few like Cd, Hg, Pb and As appears to be toxic to
plant and animals (Hayes and Green land, 2008).
Water and soil are considered as the two major resources of Bangladesh. A rapid
and unplanned urbanization are causing a higher degree of water and soil
contamination in the areas especially where industries are grown in fungal – birth.
In the resource evaluation, quantity and quality are demanded. Thus, soil and
water quality assessment turn a crying issue in context of its use for the production
of crop. A high amount of heavy metals like, Cu, Cr, As, Cd, Fe, Hg, Mn, Ni, Pb,
and Zn are found in the industrial effluents and waste disposal. (Arora et al., 2008
and Larson et al., 1975). This gradual accumulation of metals causes a higher
toxicities and leads to hazards in plants, animals, and human health (Rizwana,
2016).
Most of the industrial effluents are using for irrigation in crop in Bangladesh.
Providing some helpful nutrients, it also contains some other plant harmful
particles. These in particular reducing the normal activity. Rapid up taking of
heavy metals in plants causing the efficiency loss in absorption in plant nutrient
(Rahman, 2011). Soil has a property of heavy metal sinking that helps in
accumulation at a higher rate or large volume ascends some other delinquent in the
long run. Contamination of Agricultural soil may also occur through industrial
solid waste, municipally pollutants, fertilizers, sewage sledges etc. The total
amount of heavy metals in living tissue is usually low and it need to maintain in a
range up to optimum biological performance. Only mean or the simple way for
better yield and crop quality is the avoidance of using this water and use of
manure that can increase total absorption capacity of plant nutrients (Rizwana,
2016). Bangladesh is a largely populated country with a Limited space.
Meanwhile its most of the people are depended on agriculture that is about 60-
80% directly and indirectly. Bangladesh had to support this huge population with

5
this limited supply of resources. Therefore, a limited reduce in the production may
cause a huge change in the national index. Health support from country is not
adequate too. Therefore Bangladesh has to go further careful. A limited increase in
health hazards are helping a large scale change in the National index. Higher crop
output level is desired and that can be achieved by intensive use of present land.
Water bodies and Agricultural field are highly damaging with the unplanned and
expanded industries. Majority of these pollutants discharged by the industries are
reported in the low areas resulting from industrial operations and causing crop
productivity, food quality and soil quality ceasing. So it is time to evaluate these
industrial wastes for their toxicity level investigation and fertilizer value.
Ashulia, Savar, Aminbazar and Dhamsona of Savar Upazila are important
industrial area of Savar upazila. Textile, pharmaceuticals, tannery, dyeing, food
and beverage industries are available in these areas of Saver that is surrounded by
the river Turag and Buriganga’s part, Also River Dhawleshari runs across the area
and a huge number of agricultural land are inside this areas that are cultivated
highly with the polluted water as irrigation also. In the last few years, productivity
faced serious problem and reduced by the influence of wastage that caused lower
rice yield, reduced production of livestock and fish culture.
Thus, the present study aims to achieve the under mentioned objectives:
1. To investigate the actual level of contamination of soil in some specific
area of Saver upazila.
2. To measure the concentration of major/important heavy metals in soil in
some industrial area of Saver upazila.
3. To identify the effect of industrial waste in soils of contaminated study
area.

6
REVIEW OF LITERATURE
This piece will signify a total review of research information in esteems to
evaluate the industrial left-over disposal impact. A few research works relevant to
this study have been cited below.
2.1 Chemical Properties of soil
SRDI (2013) stated that pH values of Saver ranged from 4.5 to 7.5. pH of
Saver municipal area ranges from 4.10 to 8.9.
Adrianoo (2006) stated that the availability of Cu, Fe and Mn are reduced as the
time is added to the soil causing pH increase. Generally, soil fixation capacity of
some trace elements increases with a increase in pH.
Brogher and Hermees (2005) described that increase of acidity increases the
mobility of Cd, Pb, Cu, Cr, Hg, Zn and Ni are increased with pH of soil in increase
but in Alkaline condition the immobile state is in effective.
2.2 Nutrient status of available phosphorus
Bhuiyan (2012) observed phosphorus availability of few soils of Bangladesh
ranges from 2.2 to 140mg.g-1 with the mean value of 21.24 mg.g-1 soil the content
of available phosphorus found to be different in different areas, different soil
profiles in different layers.
Cheng (2003) reported that about 43% soils of Bangladesh contained
phosphorus under level of critical and 30-40% in near optimum level.
7
Chojancki and Slusarczyk (2000) stated that soil of Tangail, Mirzapur contains a
level of phosphorus below the critical level. About 45% of Mirzapur’s soil contain
a low phosphors and 35% of soil below critical level.
SRDI (2010) reported that available P content in Savar ranges from 0.00 to
0.16 mg. g-1 soil.
SRDI (2011) represent a result of a Phosphorous content in Rupganj Dohar
Upazila, Dhaka soil ranged 0.00 – 0.16 mg g-1.
2.3 Heavy metal status in soil
Different heavy metals such as Ni, Cr, Fe, Co, Zn, Pd, Cd that is known as trace
element were studied in some soil samples. Some of the related work that is also
analyzed in this study.
Mishra (2008) stated that soil that has been polluted with these metals
causes the death of plant in a premature stage.
Muniruzzaman et al. (2014) stated that about 18 percent soil that is polluted
are in great risk that cannot be used by plant at any state in Narayanganj.
Atiqur (2011) observed that the availability of heavy metals are much in
the tannery compared to the basic dyeing industries.
Maldonado (2008) suggested that the metallic in soil that is in little uptake
by the plant.
G. Herms (1980) stated, by the accumulation soil pollution by heavy
metals Causes the pollution in a great context. A metal that shows a specific
graving greater than about 1.5 g/ cm3 is called as heavy metals.

8
2.4 Lead Availability
Cao et al. (2003) reported that contamination of Pb in the Shooting
Ranges for plants and soils is a concern for environment. A total Pb concentration
in Bermuda grass (806 mg/kg) and surface water (289 ug/L) were observed in the
same range.
Cheng (2003) reported that it was found that about 705-850 mg/ kg of Pb
may present in the above ground part of plant and in below ground part it may
about 850-950 mg/kg.
H. Huton et al. (2005) studied that the transport of Pb as one of fine
particulate and through mixed into the surface or in deeper layer in case of land of
cultivation.
Olaisoye et al. (2013) stated that usually metals are in range of 18 to 132
mg.kg-1 for lead. European Union estimated the level of tolerance for lead in plant
is usually about 200 mg.kg-1. In most of the polluted soil contains a higher degree
than its recommended level and this are entering into the food chain through
feeding materials mostly abuses health problems.
Hernandez (2005) stated that usually lead is transported to the foliar parts
of the plants. In most of the soils, usually heave meats are found within the first 20
cm of the soil layer.
2.5 Heavy Metals contamination in soil:
Satter et al. (1998) stated the association of some elements as Co, Zn, Cu,
Ni, Fe, Al in soil samples. The author also stated the loading of Co, Zn, Cu and Ni
with Clay, Al and Fe, indicate that Fe and Al Hydroxides and clay content play
significant roles in the sorption and distribution of these metals in soil. This state

9
of metals enters into food chain and poses a human hazards and Animal health in
the area.
Havorak et al. (2006) explored the Pb/Zn smelter for heavy metal
contamination and observed that area of arnoldestion soil (Karnnten, Austria) were
heavily metal polluted by the lead and Zinc smelting while plant took Pb in low
amount. Plant toxicity by Zn was in normal range and for animal feedings,
Cadmium exited the threshold level.
Villini et al. (1992) stated that environmental quality was adversely
affected with the heavy metals in soil. Subsequent acidity by Cd exchange to pH,
removed in-between 65-95% to total Cd, Zn, Cu and Pb from the contaminated
soils.
Huy et al. (2003) reported that from untreated water of sewage used in
Irrigation was one of the major causes of increasing crops and soil metals and
shorter periods of sewage water in irrigation go high of individual metals in soils
by 2-80% and increased metals in crops by 14-209%.
Dolly and Ford (2001) stated that the greatest common sources of urban
environment area from atmospheric testimony of lead ensuing from the blister of
lead petrol, Removal of Pb successions and dye of makeover work. The flashing
and washer’s used corrugated iron roots, Metallic wheel, past practices of waste
are the least common sources.
2.6 Consequence of industrial effluents
As the increase in population along with urination and country’s industrialization,
industrial effluents and wastes are also increasing.

10
DoE (2011) stated that there is a deleterious implication for water and soil
quality due to increasing in dye industrialization and urbanization in Bangladesh.
A public health implication area present as pollution are causing by the
agrochemicals, inorganic and organic substances that enter into food chain.
Daily star (2016) reported that much of industrialization in Savar are
based on the river and canals with the continuously adherence to waste, color of
water and soil of those rivers and canals have been changed. DoE (1998) reported
industrial until in Savar, Ashulia and Amin bazar are the sources of pollution.
Adriano (2006) reported usually heavy metals have two main ways to
enter into the agro ecosystem via- non-aerial and aerial, Aerials includes aerosols,
suspended matters, Air borne Dusts and Non-aerial comprise pesticides, fertilizers,
industrial waste and effluents and other soil amendments.
Valinni et al. (1992) stated that Environment pollution is caused by the
sludge of various tannery treating procedure.
Kifan et al. (2003) reported that the tannery not only causing the
availability/ of Cr but also the metals like- Cd, As, Cu, Pb and Zn, in a great
extent. The investigation found that in the top soil the factory that uses wastes, are
high exposed to the metals.
Nuruzzaman et al. (2012) observed that concentration of N (2.7%) below
120 cm in tannery waste.
Thomas et al. (1992) stated that- Chromium is much immobile in soil the
form that is highly added with the tannery is trivalent chromium. Sludge compost
and vermi-compost that is affected by tannery on qualitative and quantitative
composition of soil organic substance. In many countries, many of them uses the
factory effluents and wastes as manure in soil, but it in turns add the metals to the
soil.
11
Elahi (2008) stated that Municipal waste water usually high in
concentration of several metals like as, Ni, Pb Cr and Cd. Their unlikely use in
Agricultural and land for irrigation may lead to result in accumulation in the
surface soil (Gupta et al., 2008).
Jarvis and Jones (2001) stated about the trace elements of soil that was
increasing as industrial waste water, sewage sludge were applying.
Bahasha (2001) stated that, to overcome the salinity problem ideal
solution may be rhizobia strains that is isolated from environments and tannery
effluents- Polluted soil with enrichment of soil with symbiotic nitrogen fixing.
Zaman et al. (2011) stated that few of metal ion enters the food chain and
are capable of causing cancer. These effluents requires like- Zn and Cu in
significant amount but Cd and Pb is in trace amount.
2.7 Effect of Industrial waste water in Soil
It has been showed that metals like Pb and As present within the waste water are
highly toxic to the plant growth. Cl- and SO42- that have known for his adverse
effect are usually in the limit at paper and pulp waste water.
In some of the courtiers of world tannery industries effluents and waste water are
also concern environment hazard. As tannery industries has a field of
manufacturing that is concerned to soil pollution and fresh water.
Elahi (2008) reported that industrial waste and effluent have a higher
range of persistent capacity to any waste ecosystem. Specially Pb, Cr Ni and Cd
have more than two decades and have their Continuous power of accumulation in
soil.

12
Vallini (1992) reported in the meanwhile a number of suggestion for
tannery byproduct purification is provided but waste water for environment is still
a concern.
The study of textile pollutants effect on collected soil of agricultural land
that is adjacent to textile effluents outlet in Jodhpur shows high build – up of Na
(289.5 mg/ 100g), Moderate P (35.8 kg ha-1) and high K (308.2 kgh-1). Also
showed that effluents collected directly was more toxic to the one collected from
various points of mixing in irrigation water bodies (Cheng et al., 2003).

13
CHAPTER III
MATERIALS AND METHODS
A study was conducted during January 2016 - June 2017 to determine the impact
of Industrial waste in Savar, Ashulia, and Aminbazar and Dhamsona. The
acceptable facts of materials and methods for the study are offered in this section.
3.1 Location Description
Savar is an upazila of dhaka district in the division of dhaka, Bangladesh. It is
located at a distance of about 24 kilometers (15 miles) to the northwest
of Dhaka city. Savar is located at 23.8583°N 90.2667°E longitude and latitude.
Savar has 13 Unions/Wards, 350 Mauzas/Mahallas, and 321 villages. The
municipal area (Savar Town) consists of 9 wards and 55 mahallas. The area of the
town is 24.1 km². It has a population of 124,885; male 53.03%, female 46.97%;
population density per km² of 5182. It has 66,956 units of household and a total
area of 280.13 square kilometres (108.16 sq mi). The whole area is bounded by
Kaliakair and GazipurSadarupazilas on the north, Keraniganjupazila on the south,
Mirpur, Mohammadpur, Pallabi and Uttarathanas of Dhaka City on the east, and
Dhamrai and Singairupazilas on the west. The land of the upazila is composed of
alluvium soil of the Pleistocene period. The height of the land gradually increases
from the east to the west. The southern part of the upazila is composed of the
alluvium soil of the Bangshi and Dhalashwari rivers. Main rivers are Bangshi,
Turag, Buriganga and Karnatali. The Bangshi River has become polluted due to
industrial waste disposal. The total cultivable land measures 16,745.71 hectares
(41,379.6 acres), in addition to fallow land of 10,551.18 hectares (26,072.5 acres),
(Ministry of Local Government, 2017).

14
3.2 Demographic characters
As of the 2011 Bangladesh census, Savar upazila had a population of 1,387,426.
Males constituted 54.20% of the population, and females are 45.80%. This
Upazila's eighteen-up population was 207,401. Savar had an average literacy
rate of 58.16% (7+ years), and the national average of 54.4% literate. Male
literacy was 64% and female was 51%. The religious breakdown
was muslim 88.59%, hindu 10.41%, christian 0.93%, buddhist 0.03% and others
0.04%, and ethnic minority group nationals numbered 319
including Buno, Garo, Chakma (Sangma), and Burman. The main occupations are
Agriculture 24.34%, agricultural labourer 12.84%, wage labourer 4.44%, cattle
breeding, forestry and fishing 1.90%, industry 1.37%, commerce 17.35%, service
20.68%, construction 1.66%, transport 3.96% and others 11.46% .
3.3 Climatic conditions
Savar is generally marked with monsoon climate with moderate temperature,
considerable humidity and moderate rainfall. The rainy season starts from mid-
May and continues up to the month of mid-September. The annual rainfall is
1580mm. The highest mean temperature of about 19-22°C during the month of
November- December and minimum mean temperature about 17°C. The
maximum mean temperature is about 15-16°C during January and minimum mean
temperature about 13.6°C. Maximum relative humidity recorded of about 58%
(November to December) and minimum of about 49%. Maximum relative
humidity was about 52% (January) and minimum about 49%.
15
3.4 Economy of Savar Area
Agriculture and manufacturing are the two major economic sectors at Savar. The
main crops grown here are paddy, jute, peanut, onion, garlic, chili and other
vegetables. The extinct or nearly extinct crops in the region are aus paddy,
AshaKumari paddy, sesame, linseed, kali mator, randhunisaj, mithasaj, kaun and
mas kalai. The main fruits cultivated here are Jackfruit, mango, olive, papaya,
guava, kamranga, berry and banana. There are 181 combined fisheries, dairies and
poultries dairy, 5 hatcheries, 209 poultries, and 139 fisheries. Manufacturing
facilities include Ceramic industry, beverage industry, press and publication,
garments industry, foot ware, jute mills, textile mills, printing and dying factory,
transformer industry, automobile industry, biscuit and bread factory,
pharmaceutical industry, soap factory, brick field, cold storage, welding, plant
nursery, etc. Bangladesh Export Processing Zone is located in this upazila. The
Main industries includes 86 small and medium tannery factories,129 small and
large garments factories,103 dyeing factories,13 food and beverage factories,8
weaving, 100 goldsmith and 29 others workshops. The main exports are Jackfruit,
papaya, flower, sapling, dairy products, meat, transformer, fabrics, dye, medicine,
readymade garments, electronics and electric goods, shoe, brick, sweetmeat etc.
There are 62 km of pucca (first-class), 56 km of semi pucca, 562 km of mud road;
and 50 km of highway. Transports used here include the traditional (and extinct or
nearly extinct) Palanquin, bullock cart and horse carriage as well as modern day
vehicles (Wikipedia, 2018).

16
Figure 1: Map showing locale of the study area at Savar Upazila
17
3.5 Soil
Generally a loamy-clay loam, red colored soil is the dominant types of soil in this
region. A complex mixture of calcareous sandy with the soil of clayey and
siltyalluvium are profound in this region. A low organic matter and slightly acidic
condition observed (SRDI, 2017).
3.6 Sample collection sites
A Total of twenty 40 soil samples, 10 from each of the four union were collected
from four union of savar upazila (Amin bazar, Ashulia, Dhamsona and
Savarsadar) that areas are highly covered with the industries like tannery,
pharmaceuticals, food and beverage, dyeing etc. and twenty from each of the
industrial areas; SavarSadar (23.891°N-90.423°E), Ashulia (24.483°N-89.124°E),
Aminbazar (24.993°N-90.114°E) and Dhamsona (23.938°N-90.112°E) union of
savar upazila of Dhaka district. From the mentioned union of savar upazila soils
were collected near from side of the industries, closely cultivation plot near
industries bus stands, drains and road side.

18
Figure 2 : Sampling Area (Dhamsona Union)
Figure 3: Sampling Area (Savar Union)

19
Figure 4: Sampling Site (Amin Bazar Union)
Figure 5: Sampling Site (Ashulia Union)

20
Table 3.1 Major industries in the sampling sites of soils sample collection that
are source of contamination
Selected
Unions
Location of Sampling Actual sources of
contamination in
these area
Savar
Union
1.NearAkijGroup,Ulail.
2.NearArapara lake area.
3.Syntec Garments,Madhakhar
4 Near Marksman phamrmaceuticals,
Industries
5.Near BaddaBatpara,Badda
6.Near Roadside to porabari field
7.Roadside of Mollickertek Bazar
8.Roadside of Indiatec ,Sadahpur
9.Near Apex Gum industries, Genda
10.Near S.M tannery,Savar
Garments and Textile
Factories,
Dyeing Factories,
Tannery Industries,
Food and Beverage
Industries,
Pharmaceuticals
Amin
Bazar
1.Near Borodeshi Bazar
2. Adjacent to Motaleb Enterprise
3.Near AlifTextile,Bordha
4. Near Amin Md. Garments ltd.
5. Close to Uttara Food Industries.
6.Close to Showkhin Food Ltd.
7.Near India-Herbal pharmaceuticals ltd.
8. Near Kazi Tannery Industries Ltd.
9. Near Factors dyeing Ind.
10. Near Transcom beverage Ind.
Garments and Textile
Factories,
Dyeing Factories,
Tannery Industries,
Food and Beverage
Industries,
Pharmaceuticals

21
Ashulia
Union
1.Near Italian Tannery Industries
2.Close to Ashuli-Dhaka Highway Crop
Field.
3.Near Natural Denims Knitwear Ind.
4.Close field to Ashulia bazar.
5.Crop Field of Modolpara.
6.Near Electro Food Ind.
7.Close to MP’s pond
8.Near Incepta Pharmaceuticals
9.ArounIdrisSarak.
10.Rabiba Dyeing Industries.
Garments and Textile
Factories,
Dyeing Factories,
Tannery Industries,
Food and Beverage
Industries,
Pharmaceuticals
Dhamsona
Union
1.Dhawleshari River point
2.Uralkandacanal,Ranasthal.
3.Desinger Fashion Ltd.
4.Adjacent crop field of Ghoailbari
5.Roadsde field of Dhamsona Bazar.
6.Akh Food products industries.
7.Indursindghicanal,Goailbari.
8.Crop field of Unilpara
9.Roadside of Gourichanda
10.Westernside Point of Dhawleshari.
Garments and Textile
Factories,
Dyeing Factories,
Tannery Industries,
Food and Beverage
Industries,
Pharmaceuticals
3.7 Collection of soil samples
Soil samples were collected from the surface layer at a depth of 0-15 cm from
fields of each location with an auger using auger sampler method. Plant roots and
other extraneous materials were removed from the collected soil samples, air-
dried, grinded and passed through 2-mesh sieve. The samples that were collected
kept in plastic bags. All the soil samples were put into the individual polythene

22
bag with distinct marking and tagging and labeling, were brought to the Soil
research Lab, Soil Resources Development Institute (SRDI), Regional Office,
Farmgate, Dhaka for soil and water analysis.
3.7.1 Digestion of soil samples:
The collected soil samples weighing 1.0 g were transferred into a dry clean
digestion vessel. Then 5 ml of Nitric acid (HNO3) was added to the vessel and
allowed to stand it overnight with covering the vessel to vapor recovery device.
On the following day, the digestion vessel was placed on a heating block and was
heated at a temperature slowly raised to 120° C for 2 hours. After cooling, 2 ml of
hydrogen per oxide (H2O2) was added into it and kept for few minutes. Again, the
vessel was heated at 120°C. Heating was momentarily stopped when the dense
white fumes occurred, after which the volume was reduced to 3-4 ml. The digest
was cooled, diluted to 50 ml with de-ionized water and filtered through Whitman
No.#42 filter paper into plastic bottle. The soil samples were digested at digestion
laboratory, Soil research wing, Soil Resource Development Institute (SRDI),
regional office, Farm gate, Dhaka.
3.7.2 Soil analysis
Collected soil samples were analyzed for both physical and chemical properties
and the soil samples were analyzed using the standard techniques as follows:
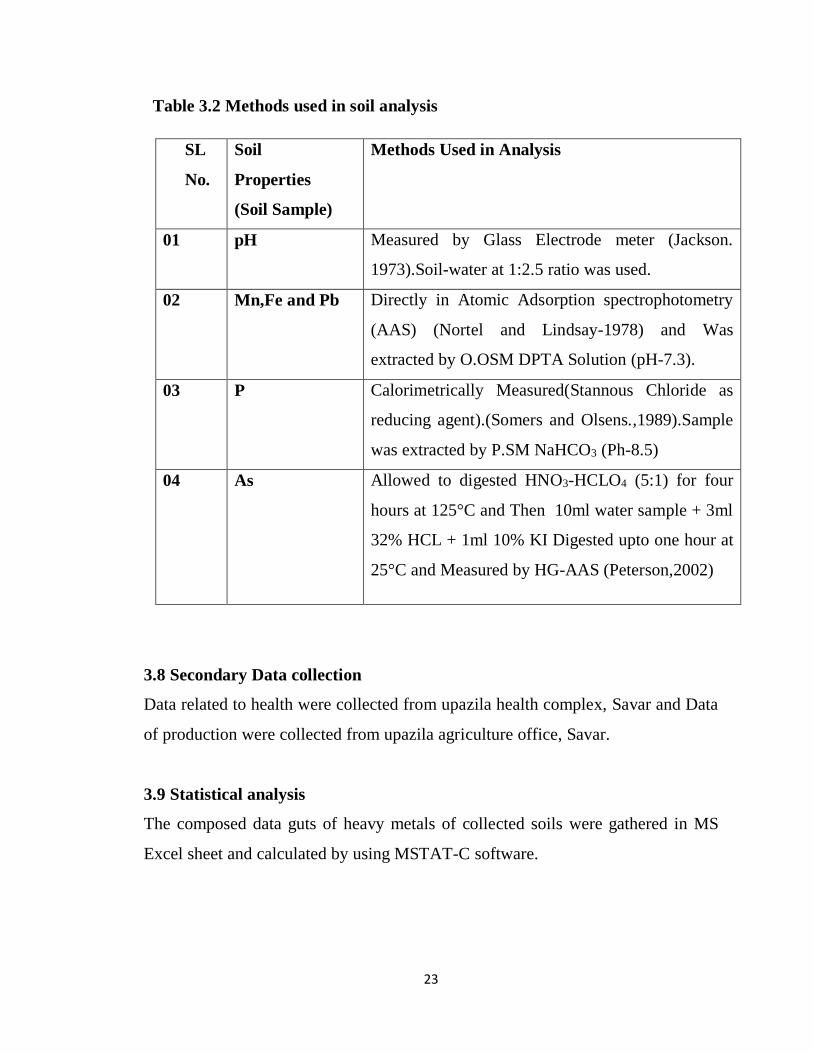
23
Table 3.2 Methods used in soil analysis
SL
No.
Soil
Properties
(Soil Sample)
Methods Used in Analysis
01
pH Measured by Glass Electrode meter (Jackson.
1973).Soil-water at 1:2.5 ratio was used.
02 Mn,Fe and Pb Directly in Atomic Adsorption spectrophotometry
(AAS) (Nortel and Lindsay-1978) and Was
extracted by O.OSM DPTA Solution (pH-7.3).
03 P Calorimetrically Measured(Stannous Chloride as
reducing agent).(Somers and Olsens.,1989).Sample
was extracted by P.SM NaHCO3 (Ph-8.5)
04 As Allowed to digested HNO3-HCLO4 (5:1) for four
hours at 125°C and Then 10ml water sample + 3ml
32% HCL + 1ml 10% KI Digested upto one hour at
25°C and Measured by HG-AAS (Peterson,2002)
3.8 Secondary Data collection
Data related to health were collected from upazila health complex, Savar and Data
of production were collected from upazila agriculture office, Savar.
3.9 Statistical analysis
The composed data guts of heavy metals of collected soils were gathered in MS
Excel sheet and calculated by using MSTAT-C software.

24
Figure 6: Sampling site contaminating near textile wastage disposal area, Ashulia
Fig 7: Soil collection from the industrial area crop field, Aminbazar

25
Figure 8: Soil sampling sites in dhamsona union, Savar
Figure 9: Usage of contaminated by human in Amin bazar of savar upazila

26
4.1 SOIL SAMPLE ASESSMENT
4.1.1 pH value of soil sample
The value of pH is significant in the study area; therefore there is an impact of pH
value in the study area. The value of pH in the soil ranges from 7.66 to 5.35 (Table
4.1-4.4) in the sapling area. In the analysis the highest value of pH (7.66) found in
the Tannery area of savar upazila. Also the lowest value of pH was found in the
Food and Beverage area of Aminbazar area (5.35). In the study it was found that
most soil are highly composed of acidic condition that is below the mark 7.0,
meanwhile the value of pH above 7.0 were found in some of the soil .
Table 4.1 The value of pH in different industrial sites of Savar upazila.
Industries Types of
collected soil sample Ashulia Savar
Amin
Bazar Dhamsona
Tannery 7.18 7.66 5.51 7.09
Pharmaceuticals 7.10 7.47 6.05 5.99
Textile 6.79 6.45 6.06 6.40
Food and Beverage 6.37 7.28 5.35 7.37
Dyeing 6.77 6.75 6.21 7.00
SD 0.28 0.45 0.46 0.51
CV (%) 5.97 7.25 7 5.66
The average value of pH ranges are in the Tannery> Dyeing> Textile>
Pharmaceuticals> Food and Beverage area. The value ranges at Ashulia from
7.18-6.37, in the area of Dhamsona it ranges from 7.37-5.99, In Aminbazar it was
6.75-5.35 and at Savar ranged 7.66-6.21.

27
Figure 10: Mean value of pH in the collected soil sample
The desirable pH range for optimum plant growth varies among crops. While
some crops grow best in the 6.0 to 7.0 range, others grow well under slightly
acidic conditions. Soil properties that influence the need for and response to lime
vary by region. Knowledge of the soil and the crop is important in managing soil
pH for the best crop performance (Soil pH guide, 2013). The value of standard
Deviation ranges from 0.51 to 0.28 and also CV value was less than 7.25 in all
cases.
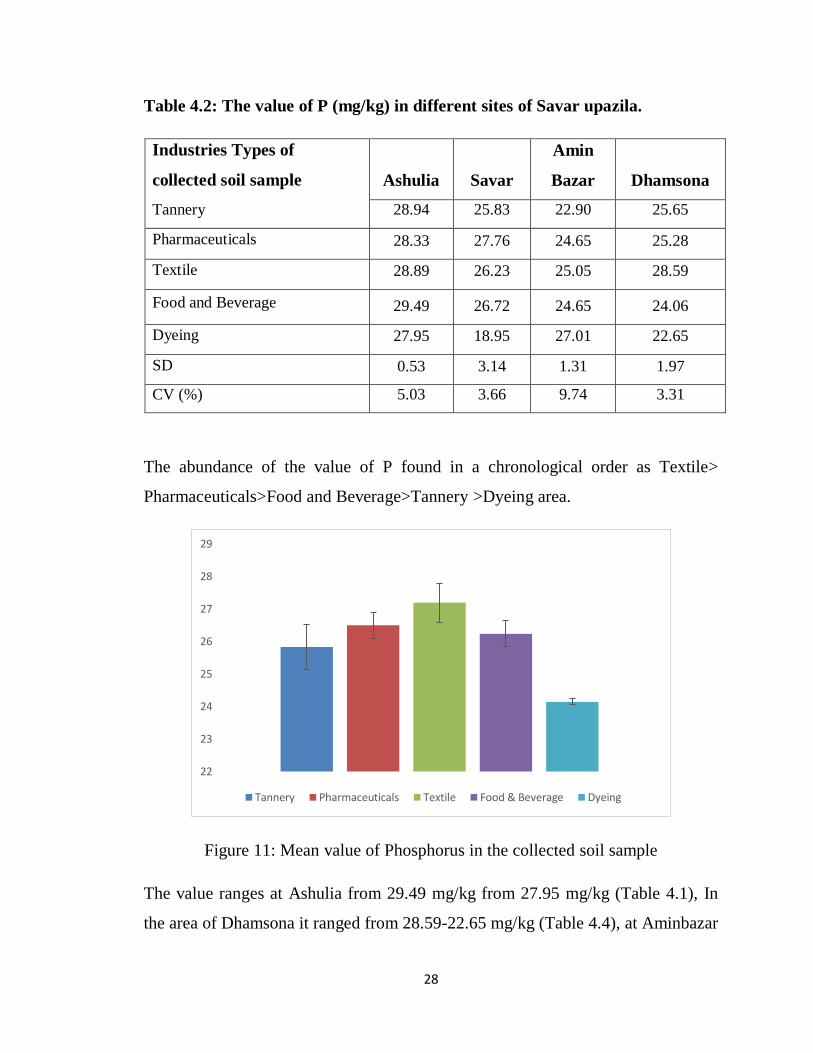
4.1.2 Phosphorus value of soil:
As previous, phosphorus value is significant in the study area; therefore there is a
impact of phosphorus value in the study area. The value of phosphorus in the
sampled soil was in the range of 18.95mg/Kg to 28.94 mg/Kg. In the analysis the
top value of phosphorus in the soil were found in the soil of Tannery area of
Ashulia (28.94mg/kg), Meanwhile the lowest value of phosphorus were found in
the soil of Dyeing area of savar (18.95mg/kg).
6.4
6.5
6.6
6.7
6.8
6.9
7
1Tannery Pharmaceuticals Textile Food & Beverage Dyeing
28
Table 4.2: The value of P (mg/kg) in different sites of Savar upazila.
Industries Types of
collected soil sample Ashulia Savar
Amin
Bazar Dhamsona
Tannery 28.94 25.83 22.90 25.65
Pharmaceuticals 28.33 27.76 24.65 25.28
Textile 28.89 26.23 25.05 28.59
Food and Beverage 29.49 26.72 24.65 24.06
Dyeing 27.95 18.95 27.01 22.65
SD 0.53 3.14 1.31 1.97
CV (%) 5.03 3.66 9.74 3.31
The abundance of the value of P found in a chronological order as Textile>
Pharmaceuticals>Food and Beverage>Tannery >Dyeing area.
Figure 11: Mean value of Phosphorus in the collected soil sample
The value ranges at Ashulia from 29.49 mg/kg from 27.95 mg/kg (Table 4.1), In
the area of Dhamsona it ranged from 28.59-22.65 mg/kg (Table 4.4), at Aminbazar
22
23
24
25
26
27
28
29
Tannery Pharmaceuticals Textile Food & Beverage Dyeing

29
it was 27.01-22.90 mg/kg and at Savar ranged 27.76-18.95 mg/kg (Table 4.4). The
P Value was enriched in the soil sampled area as it shows that there is higher
opportunity of having contamination as of different activity. The value of standard
Deviation ranges from 1.97 to 0.53 and also CV value was less than 5.03 in all
cases.
4.1.3 Iron (Fe) Value of soil
In the study area, the value of Fe is significant; therefore there is an impact of Fe
value in the study area. The value was significant in the samples collected from
Aminbazar. Fe value in the analyzed soil sample was in the range of 140.6 mg/kg
to 78.0 mg/kg. The top value were found in the soil area that was collected from
the Pharmaceuticals arena of Ashulia union of Savar upazila. Again the lowest
value was found in the arena of food and Beverage arena of Savar union of Savar
upazila.
Table 4.3: The value of Fe (mg/kg) in different sites of Savar upazila.
Industries Types of collected
soil sample Ashulia Savar
Amin
Bazar Dhamsona
Tannery 122.2 88.75 92.53 105.9
Pharmaceuticals 140.6 94.00 84.03 101.1
Textile 124.8 85.00 92.12 94.39
Food and Beverage 115.5 78.40 85.31 89.88
Dyeing 109.0 82.20 88.05 79.10
SD 9.83 5.30 3.44 9.2
CV (%) 9.69 7.25 7.24 5.93

30
The availability of these content of Fe were in a chronological order of
pharmaceuticals>Tannery>Textile>Food and Beverage>Dyeing area.
Figure 12: Mean value of iron (Fe) in the collected soil sample
The value ranges in Ashulia from 140.6 mg/kg from 109.0 mg/kg, in the area of
Dhamsona it ranges from (79.10-105.9) mg/kg, In Aminbazar it was (92.53-88.05)
mg/kg and In Savar ranged 94.00-78.0mg/kg. The value of standard Deviation
ranges from 9.83 to 3.44 and also CV value was less than 9.69 in all cases.
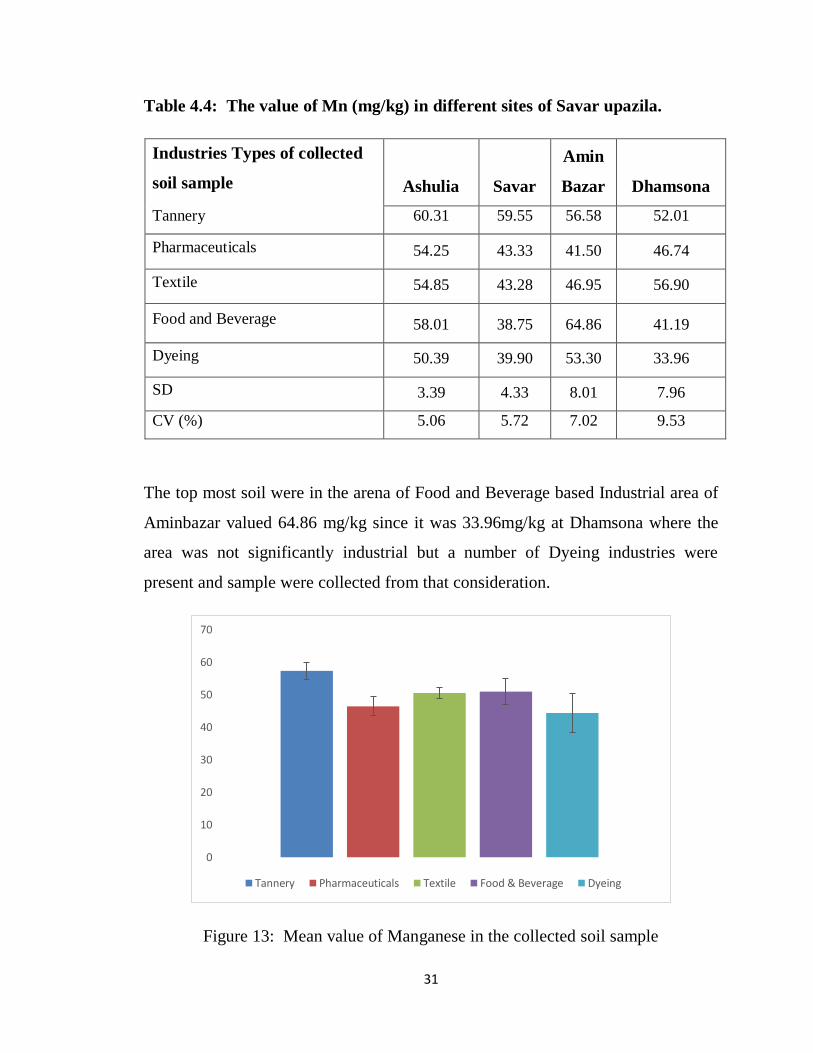
4.1.4 Manganese (Mn) value in Soil Sample
It was found that the value of Manganese is significant in the study area, Therefore
there is a impact of Manganese value in the study area. The content was in the
range of 64.86-33.96mg/kg.
.
0
20
40
60
80
100
120
1Tannery Pharmaceuticals Textile Food & Beverage Dyeing
31
Table 4.4: The value of Mn (mg/kg) in different sites of Savar upazila.
Industries Types of collected
soil sample Ashulia Savar
Amin
Bazar Dhamsona
Tannery 60.31 59.55 56.58 52.01
Pharmaceuticals 54.25 43.33 41.50 46.74
Textile 54.85 43.28 46.95 56.90
Food and Beverage 58.01 38.75 64.86 41.19
Dyeing 50.39 39.90 53.30 33.96
SD 3.39 4.33 8.01 7.96
CV (%) 5.06 5.72 7.02 9.53
The top most soil were in the arena of Food and Beverage based Industrial area of
Aminbazar valued 64.86 mg/kg since it was 33.96mg/kg at Dhamsona where the
area was not significantly industrial but a number of Dyeing industries were
present and sample were collected from that consideration.
Figure 13: Mean value of Manganese in the collected soil sample
0
10
20
30
40
50
60
70
Tannery Pharmaceuticals Textile Food & Beverage Dyeing

32
The analyzed soil sample were in the context of Mn as following chronological
order as Tannery>Textile>Food and Beverage>Pharmaceuticals >Dyeing area.
The value ranged at Ashulia from 60.31 mg/kg from 50.39 mg/kg, in the area of
Dhamsona it ranged from 56.90-33.96 mg/kg, In Aminbazar it was 64.86-41.50
mg/kg and at Savar ranged 59.55-38.75 mg/kg. The value of standard Deviation
ranges from 7.96 to 3.39 and also CV value was less than 9.53 in all cases.
4.1.5 The value of Lead (Pb) content in Soil Sample
The value of lead is significant in the study area, Therefore there is an impact of
Lead value in the study area .The content were in the range of 41.58-24.55 mg/kg.
Table 4.5: The value of Pb (mg/kg) in different sites of Savar upazila.
Industries Types of
collected soil sample Ashulia Savar
Amin
Bazar Dhamsona
Tannery 31.52 33.00 41.58 37.00
Pharmaceuticals 28.41 32.30 38.09 33.01
Textile 26.39 29.20 37.20 28.51
Food and Beverage 25.67 26.54 35.71 24.55
Dyeing 27.43 30.46 37.72 30.31
SD 2.04 2.30 1.77 3.99
CV (%) 7.49 8.03 1.96 6.53
The top most soil were in the arena of Tannery based Industrial area of Amin
bazar valued 41.58 mg/kg since it was 24.55 mg/kg in Dhamsona where the area

33
was not significantly industrial but a number of Food and Beverage industries
were present and sample were collected from that consideration.
Figure 14: Mean value of Lead (Pb) in the collected soil sample
The analyzed soil sample were in the context of following chronological order as
Pharmaceuticals>Tannery> Dyeing >Textile>Food and Beverage area. The value
ranged in Ashulia from 31.52 mg/kg from 25.67 mg/kg, in the area of Dhamsona it
ranged from 37.0-24.55 mg/kg, At Aminbazar it was 41.58-35.71 mg/kg and At
Savar ranged 33.0-26.54 mg/kg. The value of standard Deviation ranges from 3.99
to 2.04 and also CV value was less than 8.03 in all cases.
4.1.6 The value of Arsenic content in Soil Sample
Arsenic was found in significantly, therefore there is an impact of Arsenic value in
the study area. The value ranged from 6.26-4.50 mg/kg. The value that was found
analyzing the collected soil sample were in the top most range in the soil that was
collected from Tannery areas of Aminbazar 6.26mg/kg and the lowest value was
in the soil of Food and Beverage area of Dhamsona 4.50mg/kg.
0
5
10
15
20
25
30
35
40
Tannery Pharmaceuticals Textile Food & Beverage Dyeing

34
Table 4.6: The value of As (mg/kg) in different sites of Savar upazila.
Industries Types of
collected soil sample Ashulia Savar
Amin
Bazar Dhamsona
Tannery 5.53 6.10 6.26 5.75
Pharmaceuticals 5.06 5.60 6.11 5.60
Textile 4.90 5.10 5.39 4.77
Food and Beverage 4.67 4.85 5.21 4.50
Dyeing 5.02 5.30 6.05 5.53
SD 0.27 0.43 0.42 0.49
CV (%) 4.74 6.64 4.35 5.24
The value of these sample were in upmost in the following order Tannery>
Pharmaceuticals> Dyeing> Textile> Food and Beverage area soil.
Figure 15: Mean value of Arsenic (As) in the collected soil sample
0
1
2
3
4
5
6
7
Tannery Pharmaceuticals Textile Food & Beverage Dyeing
35
The value ranged at Ashulia from 5.53-4.67 mg/kg, In the area of savar it ranged
from 6.10-4.85 mg/kg, at Aminbazar it was 6.26-5.21mg/kg and at Dhamsona
ranged from 5.75-4.50 mg/kg. The value of CV was in between 4.35 to 6.64.

36
SUMMARY
Soil is one of the most important factors of environment. During the conduction of
the study soil samples were collected from different selected areas of savar upazila
(Savar, Amin bazar, Ashuilia and Dhamsona union) to assess the impact of these
industrial waste that is discharged by the industries located in theses region on
environment and agricultural productivity. A total number of 40 soil samples were
collected from the target site (Tannery, Pharmaceuticals, Textile, Food and
beverage and Dyeing industries) in the selected area. Later, the collected samples
were analyzes targeting the parameter like pH, DO, P, As, Fe, Mn, Pb, Cr and Cd.
The pH value in the soil sample was range from 5.51 to 7.66 that indicates the soil
of that arena is slightly acidic to neutral. Top value of pH was found in the tannery
area of savar that is 7.66 and minimum value was found at Amin bazar area and
the value was 5.51 that’s indicates the soil is slightly acidic at Amin bazar. The
average value of pH ranges are in the order of Tannery> Dyeing> Textile>
Pharmaceuticals> Food and Beverage area.
Phosphorus value was in a range of 29.49 mg/kg to 18.95 mg/kg at Ashulia. Soil
of food and beverage site was enriched with P content and soil of savar Dyeing
region is in moderately enriched with Phosphorus. But overall P is higher in the
soil of Ashulia. The abundance of the value of P found in a chronological order as
Textile > Pharmaceuticals> Food and Beverage> Tannery > Dyeing area.
The value of Ferrous (Fe) was found 140.6 mg/kg to 78.0 mg/kg. The mean value
of Fe at Ashulia, Savar, Amin bazar, Dhamsona was 122.2 mg/kg, 85.06 mg/kg,
88.40 mg/kg and 94.07 mg/kg. The value was higher in the soil of Ashulia. The
availability of these content were in a chronological order of
pharmaceuticals>Tannery>Textile>Food and Beverage>Dyeing area.
Mn value was ranged from 64.03 mg/kg to 33.96 mg/Kg. The mean value of Mn at
Ashulia, Savar, Amin bazar, Dhamsona was 55.56 mg/kg, 44.96 mg/kg, 52.63

37
mg/kg, 46.21 mg/kg. The analyzed soil sample were in the context of following
chronological order as Tannery>Textile>Food and Beverage >Pharmaceuticals
>Dyeing area.
Pb (Lead) value in soil was in a range of 38.09 mg/kg to 25.67 mg/kg. The mean
value of Pb at Ashulia, Savar, Amin bazar, Dhamsona was 27.88mg/kg, 30.3
mg/kg, 38.06 mg/kg, 30.67mg/kg. The analyzed soil sample were in the context of
Pb in following chronological order as Pharmaceuticals>Tannery> Dyeing
>Textile>Food and Beverage area.
The value of Arsenic (As) was in the range of 6.26 mg/kg to 4.50 mg/kg. Mean
value of As at Ashulia, Savar, Amin bazar, Dhamsona was 5.03mg/kg, 5.39mg/kg,
5.8mg/kg, and 5.26 mg/kg. The value of these sample of As value were in upmost
in the following order Tannery>Pharmaceuticals>Dyeing>Textile>Food and
Beverage area soil.

38
CONCLUSION
In each cases the soils of Savar, Amin Bazar, Ashulia was challenging as an
agricultural soil as they exceeded the value of normal soil. Meanwhile the soil of
Dhamsona found comparatively good to others sampled arena. pH was high
comparatively in tannery arena, Phosphorus was higher in the textile porn arena
while Fe, Pb, As was high in Tannery and pharmaceuticals arena. The study also
revealed that study area more or less equally contaminated with heavy metals like
Cadmium, Chromium, Lead, Arsenic and Manganese etc. that are discharging with
the byproduct of the industries. Which are causing uptake in plant through soil.
Point to be note that, there has a low opportunity to define the daily vegetables
produced soil is contaminant or not! This may be the cycle of human health
hazards that are ultimately causing by the Industrial waste discharge in adjacent
environment.

39
RECOMMENDATIONS
Author’s recommends is-
1. Industries must have required capacity to recycling their byproducts and
discharges.
2. Law must be implemented to the groups those who are involved in this type
of action so that in future, people thinks further before doing this types of
job.
3. In every cases of industry implementation, Ministry of Environment must
give a certificate to regulate and proper investigation should be done to
define that authority are doing the same task for that they are issued the
certificate.
4. AEO, UAO can play a vital role to stop the usage of waste water in
irrigation, rendering the impact to the farmers and United Nations health
organization can play the role to stop the usage of this water in daily need.
5. Authority must do the proper monitoring and sampling, later test should be
done to control the environment pollution.
6. Further study should be done investigate the crisis so that clear and more
deep information of impact may found.
40
REFERENCES
ADB (Asian Development Bank) Training Manual for Environmental
Monitoring Engineering Science, INC, USA, P 2-16.
Adriano, D.C. (Ed.) (2006). Trace Elements in the Terrestrial Environment.
Atiqur, M. (2011). Impact of Industrial Discharge on Environment in Gazipur.
M.S. Thesis, Department of Env. Science, Bangladesh Agricultural
University, Mymensingh, Bangladesh.
Ayenew, A., Biryani, G. and Engidawork, E., (2014). Levels of essential and
lethal metals in Ethiopian Khat, (Catha edulisForsk.) Ethiopian J. of Env.
Studies and Management,7(3):289-297, 2014.
BBS (2016). Report of Health and Demographic Survey (2016), Bangladesh
Bureau of Statistics, Ministry of Planning, Dhaka, Bangladesh.
BBS (2016). Report of Health and Demographic Survey (2016), Bangladesh
Bureau of Statistics, Ministry of Health and Family Welfare, Dhaka,
Bangladesh.
Bhasha, M.G. and Vivekananden, M. (2001). Saline tolerance in rhizoidal isolates
from extreme environments. Philippine J. of Sci. 130(2) 135-138.
Bhuiyan, M.A.H., Survui, N.L., Damparc, S.B., Islam, M.A., Quraishi, S.B
Clanvaglo, S. and Suzuki, S. (2012). Investigation of the possible source of
heavy metal contamination in lagoon and canal water in the tannery
Industrial area in Dhaka. Bangladesh Environmental Monitor and
Assessment, (accepted article in online). DOI 10.1007/s 10661-010215576
Borgher, S. M. and Hermes, S. (2005). Environmental study on discharged
wastewater of Albourz industrial city. Iranian J. on Public Health 34 (1):
62-68.
41
Butt, M.S., Sharif, K., Bajwa, E.B and Aziz. A.(2005) Hazardous effects of
sewage water on the environment Focus on heavy metals and chemical
composition of soil and vegetables Management of Environmental Quality.
An In.l J. 16(4): 338-346.
Cao, X., D., Ma. I., Q., Chen. M., Hardson, D. W. and Harns. W. G (2003).
Weathering of lead bullers and their environmental effects at outdoor
shooting range. J Env. Qual., 32(2) 526-534.
Cheng, S. and Cheng, S.P (2003). Heavy metal pollution in China Origin Patten
and control J. of Env. Sci. and Pol. Res. 10(3) 192-198.
Chojnacki, A. and Slusarczyk, K. (2000). Content and losses of some mineral
constituents in drainage wastes from the fields of the experiment steation at
Osiny. Polland. 78: 49-62.
Daily Star, Editorial. (2016) (26 Nov). The Chemistry of Soil Processes (Eds.),
John Wily and Sons Ltd. PP. 5-7.
DoE (Department of Environment) (2007). Bangladesh State of the Environment,
Department Environ and Ministry of Environ and Forest Pub. UNEP. P O
Box-4 Klone, Luang. Pathaumthani, 12120. Thailand PP. 17-26.
DOE (Department of Environment). (2010). Bangladesh State of the Environment
Ministry of Environment and Forest Pub. UNEP, PP 1-96.
DOE (Department of Environment) (2011). Bangladesh State of the Environment
Ministry of Environment and Forest Pub. UNEP, PP 1-74.
Dolly, H. and Ford, M.(2001). The fate of metals in soil and water, UN. PP 1-74.
DPCe,(HermanMiller).(1995).www.doreader.com/meterreading/agrotech/gross.

42
Elahi, A. M. (2008). Study on water quality of turag and its impact on Health.
M.S. Thesis, Department of DVM, Bangladesh Agricultural University,
Mymensingh, Bangladesh
Emongor, V., E Nkegbc, B. Kealotswe. I Koorapetse, S Sankwasa and S
Kekanetswe. (2005). Pollution Indicators in Gaborone Industrial Effluent J.
of App. Sci. 5(1): 147-150.
Gupta, A. P., Antil, R.S. and Singh, A. (2008). Composition of some sewerage
waters and their effects on soil properties. In Proc. Natl. Semin.
Environmental Pollution (Control and Monitoring: 419).
Havorak, O., Friesl, W. and Zwerger, I. (2006). Heavy metal contamination in the
surroundings of a former Pb/ Zn smelter in Arnoldstein (Austria)
Monitoring of bio available metal fractions in soils, Trace elements in the
food chain. Proceedings of an international symposium on trace elements in
the food chain, Budapest, Hungary PP: 191-195.
Hayes, A.C. and Grindlays, C.P (2008). Ellvial sediment as river contamination
index by heavy metals. Resista-de-ciencian-Agarias. Barazil39(1) 173182.
Herms. U., and Brummer, G. (1980). EinfliubderBodentraktionaufloslicket and
tolerierabereGessamtgehalte and Nicke, Kupfer, Zink, Kupfer, Zink,
Cadmium and Blei in Boden Und KompostiertenSiedlungsabfallen.
LandwForsch. 33: 408-423.
Hibben, R., Craig, S., Silas, P. and Charles, P. M. (1984). Comparison of cadmium
Hoque, M. E. 2003. Arsenic and other heavy metal status in soils and
vegetables in ChapaiNawabganj. MS. Thesis, Department of Soil Science,
Bangladesh Agricultural University, Mymensingh, Bangladesh.
Hutton, M. and Symon, C. (2005). The quantities of Cd, Pb and Hg entering the
UK environment from human activities. J. Env. Sci, 57: 128-150.

43
Huy, N.Q., Luyen, T. V., Phe, T. M. and Mai, N.V. (2003). Toxic elements and
heavy metals in sediments in ThamLuong Canal. Ho Chi Minh City,
Vitenam. Env. Eco. 43(7): 836.841.
Imongor, V., E Nkegbc, B. Kealotswe. I Koorapetse, S Sankwasa and S
Kekanetswe. (2005). Pollution Indicators in Gaborone Industrial Effluent J.
of App.Sci. 5(1): 147-150.
Kfian, M.H. and Yasmin, N. (2003) Study of metallic pollutants in water and food
items of an industrial city by atomic absorption spectrophotometer Pakistan
J. of Bio. and Sci., 6(14). 1276-1281.
Khan, H. R. (2008). Assessment of SPWAC (Soil-Plant-Water-Air Containment)
Quality within and around Dhaka City Report Submitted to the Doctor of
the Centre for Advanced Studies and Research in Biotechnological
Sciences University of Dhaka, Bangladesh.
Lenetech, G.S. (2004). Effects of Cd2+ and DTPA on young sugar beets (Beta
vegans), I. Cd2+ uptake and sugar accumulation. Plant Physiologist.3: 66-
69-74.
Kothlhao, K., Ngila, C. and Emongor V.E (2005), Metal determination in
secondary tracted sewage water for crop Hrigation in CaboroneBostwana.
International proceeding of the 4th Waternet/ Warisa symposium Water.
Science, Technology and Policy Coverage and Action. 11-15 October.
Larson, W. E., Gilley, J. R. and Linden, D. R. (1975). Consequences of waste
disposal on land, Soil Water Conserv. 2:68.
MAC (Maximum Acceptable Concentration), KabataPendias A., Sadurski
W.(2004). Elements and their compounds in the environment, 2 ed. 79–99,
Wiley-VCH, Weinheim; Chen Z.-S. 1999. Selecting indicators to evaluate
soil quality.

44
Maldonado, V. M., Rubio Arias, H. O., Quintana, R., Saucedo, R. A. Guterrez M.,
Ortega, J. A. and Nevarez, G. V (2008). Heavy metal content in soils under
different wastewater irrigation patterns in Chihuahua, Mexico 5(5) :441-
449.
Mali, R. (2002). Possible adverse effect of chromium in occupational exposure of
tannery workers, Industrial Health Inst. de Investigations Medicas
mexcio,40(2) 207-213.
Mishra, A. and Tripathi, D.B (2008). Heavy metal contamination of soil and
bioaccumulation in vegetables irrigated with treated waste water in the
tropical city of Varanasi, India. I. J. of Env. Pro., 43: 337-342.
Muniruzzaman, M. (2014). Study on soil quality of Gazipur and its impact. M.S.
Thesis, Department of Soil Science, Bangladesh Agricultural University,
Mymensingh, Bangladesh. .
Naser, H. M., Sultana, S.,Gomes, R . And Noor, S. (2012). Heavy metal pollution
of soil and vegetable grown near roadside at Gazipur, Bangladesh J. Agril.
Res.37(1):9-17.
Nuruzzaman, M. (2012). Effect of Long-term Groundwater Irrigation on soil
Properties in MadhupurUpazilla. M. Sc. (Ag.) Thesis. Department of
Agricultural Chemistry. Bangladesh Agricultural University, Mymensingh.
Olaisoye, O.B., Adefisoye, T. and Osibote, O. A.(2013). Heavy metals
contamination of water, soil and plants around an Electric Waste
Dumpsite. Pol. J. Env. Stu.22(5): 1431-1439.
pH Guide (Larson), (2016). Value of pH in solution.
Rahman, S. N. (2011). Treatment and reuse of wastes of a vegetable oil refinery.
National Environ. Engin. Reg. Inst. Nagpur, India. 37(2): 101-117.
Rizwana, H. (2016). Effects of industrial waste on soil properties and crop growth.
Regional workshop on “Environmental impacts from fertilizers,
45
Agrochemicals and industrial wastes. Under the project Chemical Research
and Environmental Needs (REN)”.
Sattar, M. A. And Blume, H. P. (1998). Trace metal contaminaton in Bangladesh
soils. Bangladesh J. of Env. Sci. 4: 1-12.
Sattar, M. A. and Blume, H. P. (2000). Trace metal contamination in Bangladesh
soils. Bangladesh J. of Soil Sci. 26: 15 – 21.
Shaid-ul-llah, M. (1995). Impact of Industrial Discharge on Environment in
Gazipur. M.S. Thesis, Department of Env. Science, Bangladesh
Agricultural University, Mymensingh, Bangladesh.
SRDI (Soil Resource Development Institute), Dhaka.2010-2013. Major character
of soil in Bangladesh.
Thomas,B., Roughan, J. A. and Waters, E. D. (1992). Lead and cadmium contents
of some vegetable foodstuffs. J. of Sci. Res. 23: 1493 - 1498.
Vllini, S. W. and Khalek. H. (1992). Effect of toxic heavy metals (Cd, Pb) from
tannery on growth and mineral nutrition of breech (FagusSylvatica L)
Vegetation 101: 43-53.
WHO (World Health Organization). (1971). Level of permissible water
phosphorus acceptable limits.
Zaman, M. M.A.K. (2011). Potential Pb Cd, Zn and B concentration of sandy sotls
after different irrigation periods with sewage effluents. Water, Air, Soil
Pollution. 66(3-4):239-249.

46
Appendix I. Ranges of Maximum Allowable Concentrations (MAC) fortrace
metals in agricultural Soils (mg kg-1).
SL. No. Metal MACa
1.
Cd 1–5
2.
Cr 50-200
3.
Ni 20–60
4.
Pb 20–300
5. Mn
1500-3000

47
Appendix II: Guidelines for contaminated soils – suggested range of values
(mg kg-1 on air dried soils, except for pH).
Parameter Typical values for
uncontaminated soil
Slight
contamination
contaminated
Cadmium
0-1 1-3 3-10
Chromium
0-100 100-200 200-500
Lead
0-500 500-1000 1000-2000
Nickel
0-20 20-50 50-200
Manganese 0-500 100-200 200-500
Source: information compiled from the text book, “A textbook of
environmental science” (part 1). Sattar, M.A. 1996. Mymensingh.