Identification Of Heavy Metals In Cosmetic Powder Using ...
99
ن الرحيم الر بسم اIdentification Of Heavy Metals In Cosmetic Powder Using Inductively Coupled Plasma - Optical Emission Spectroscopy Technique ثقيلةدن العاديد ا يل بإستخدامحيق التجم مشا تقهيةنةقزدوجة اشتحثة ا ازمافية الب مطياA thesis submitted for the fulfillment of the requirements for the degree of Doctor of Philosophy in physics By: HASSNA MOHAMMED ALI MOHAMMED SALIH Supervisor: Dr. Mubarak Elmahal Ahmed Co Supervisor:Dr Ahmed Hassan Elfaki
-
Upload
khangminh22 -
Category
Documents
-
view
5 -
download
0
Transcript of Identification Of Heavy Metals In Cosmetic Powder Using ...

I
بسم اهلل الرمحن الرحيم
Identification Of Heavy Metals In Cosmetic
Powder Using Inductively Coupled Plasma -
Optical Emission Spectroscopy Technique
تقهية مشاحيق التجميل بإستخدام حتديد املعادن الثقيلة يف
مطيافية البالزما املشتحثة املزدوجة املقرتنة
A thesis submitted for the fulfillment of the requirements for the
degree of Doctor of Philosophy in physics
By:
HASSNA MOHAMMED ALI MOHAMMED SALIH
Supervisor:
Dr. Mubarak Elmahal Ahmed
Co Supervisor:Dr Ahmed Hassan Elfaki


I
اآلية
ٱٹٱٹٱ
مث هت مت خت حت جت هبمب خب حب جب هئ مئخئ حئ جئ يي ىي ني مي ٱ
مظ حط مضخض حض جض مص خص حص مسخس حس جس مخ جخ مح جح مجحج
خل حل جلمك لك خك حكجك مق حق مف خفحف جف مغ جغ مع جع
ٱ هل مل ٥٢٢االية ابلقرة: سورة

II
DEDICATION
To my Mother
my Father
My Husband
Sisters and Brothers
My son
My daughter

III
Acknowledgement
I need to thank my supervisor Professor Mubarak
. Almahal for his help and support throughout the
entire time we’ve worked together. I am also very
thankful to Professor Ahmed Hassan for his help
and support. I am grateful to all the staff of the
Institute of laser in Sudan University of Science
and Technology I need to send special thanks to
my family and to my mother and my husband
for their support and help all the time.

IV
Abstract
This study aimed to identify the heavy metals in cosmetics powder using
the Inductively Coupled Plasma / Optical Emission Spectroscopy
technique (ICP-OES). This method gives a clear picture of the powder
ingredients of cosmetics. The emission spectra were analyzed using the
Atomic Spectrometer Database, published by the National Institute of
Standards and Technology. (NIST)
In this technique, liquid samples are injected into the argon plasma using
one of the sampling techniques and the sample spray that quickly reaches
the plasma is quickly dried and activated. The emission from the plasma
is then seen and collected by a lens or mirror and photographed to the
input of the wavelength selection device . The principle used in the
inductively coupled Plasma Optical Emission Spectroscopy is When
plasma energy is given to an analysis sample from outside, the
component elements (atoms) are excited. When the excited atoms return
to low energy position, emission rays (spectrum rays) are released and the
emission rays that correspond to the photon wavelength are measured.
The element type is determined based on the position of the photon rays,
and the content of each element is determined based on the rays intensity.
A total of nineteen cosmetic samples marketed under different brand
names and widely used by Sudanese women for cosmetic purposes (ICP-
OES) were analyzed. The results showed that the samples contain the
following elements: Barium, boron, manganese, iron, copper, aluminum,
calcium, erbium and zinc. The results also showed no mercury, lead,
nickel and cadmium in the test samples Where the results for the first
group showed that the common metal in the test samples is calcium.
Samples 1 and 2 contain iron, barium, manganese and copper back only
in sample 1. The boron appeared only in sample 2, whereas the arbium
only appeared in sample 3.
For the second group the results showed that the heavy metals found in
some cosmetics are zinc and calcium. While iron is common in samples
1, 2 and 3, samples 1 and 3 cont ain barium, while samples 2 and 3
contain manganese, aluminum is shown only in the third sample.
In summary, this study showed the presence of heavy metals in the
cosmetics used in Sudan, which poses a danger to the health of the user
must be corrected.

V

VI

VII
Contents
Title
I اآلية
II Dedication
III Acknowledgement
IV Abstract
V المستخلص
VII The contents
X List of Tables
XII List of Figures
CHAPTER ONE
Spectroscopy, Basic Concept
1 1-1 Introduction
2 1-2 The Study Objectives
2 1-3 Thesis Structure
2 1-4 Spectroscopy
3 1-5 Spectrometry
3 1-5-1Measurement process
4 1-6 Common types
6 1-7 Types of spectroscopy
6 1-7-1 Molecular Spectroscopy
6 1-7-2 Atomic Spectroscopy
8 1-7-3Laser-Induced Fluorescence (LIF)
10 1-7-4 Laser-Raman Spectroscopy
12 1-7-4-1 Characteristics of Raman spectroscopy
13 1-7-5 Laser Induced Break Down Spectroscopy
15 1-8 Plasma Emission Spectroscopy

VIII
Chapter Two
Spectroscopic Analysis of Cosmetic Solid Powder
18 2-1General Characteristics Of Inductively coupled plasma /optical emission spectroscopy ICP-OES
19 2-2 The IC discharge
21 2-2-1Detection of Emission
21 2-3 Basic ICP spectrometric system
22 2-3-1 Suitability of the ICP as an emission source
24 2-3-2 Optical Emission Spectroscopy (OES):
25 2-4plasma fundamentals
25 2-4-1 Definition of a Plasma
25 2-4-2 Plasma as the Fourth State of Matter
26 2-4-3 Plasma Production
27 2-4-4 Particle Interactions and Collective Effects
28 2-5 Advantages/disadvantages
29 2-6 ICP-OES APPLICATIONS
33 2-7 Cosmetics 34 2-7-1TYPES of cosmetics
36 2-8Literature Review 36 2-8-1 ICP – OES investigations of heavy metal contents
in cosmetic products
37 2-8-2 Inductively Coupled Plasma –Optical Emission
Spectroscopy: A Review
37 2-8-3 A Review on Inductively Coupled Plasma Optical
Emission Spectrometry (Icp-Oes) with a Special Emphasis on its Application
38 2-8-4 Inductively Coupled Plasma Optical-Emission
Spectroscopy Determination of Major and Minor Elements in Vinegar
IX
CHAPTER THREE
MATER IAL and METHODES
40 3-1 Materials 40 3-2 Instrumentation 41 3-3 the experimental setup 41 3-3-1 An Overview of ICP-OES Methodology 44 3-3-2 ICP-OES Methodology 44 3-3-3 Sample introduction 46 3-4 the procedure 46 3-4-1Wavelength Selection 47 3-4-2 Emission Measurement 48 3-4-3 production of emission 49 3-4-4 Computers and Processors 49 3-4-5 Software
CHAPTER FOUR
RESULTS and DISCUSSION
50 4-1 Introduction
50 4-2 The Result 70 4-3 Analysis of the results 70 4-3-1 The result of ICP/OES Analysis of Some
Conditioners Marketed in Sudan for Heavy Metal Content
72 4-3-2 The result ICP/OES Analysis of Some
Moisturizers Marketed in Sudan for Heavy Metal Content
76 4-4 Discussion 78 4-5 Conclusion 79 4-6 Future work 80 References 83 Appendixes

X
LIST OF FIGURES
Page No. Title of Figure
9 Fig (1.1): The Setup of LIF 12 Fig (1.2): Energy-level diagram for spontaneous
Raman scattering 13 Fig. (1.3) Laser-induced breakdown spectroscopy 20 Fig.( 2.1) The ICP torch
22 Fig.( 2.2) Basic ICP spectrometry system 24 Fig.( 2.3) Coalitional excitation and radiative
relaxation 41 Fig(3-1): Shows the major components and layout of
a typical ICP-OES instrument 43 Fig( 3-2). Flow chart showing the methodology for a
typical ICP-OES analysis
45 Fig(3-3): Shows Babington nebulizer
51 Fig.(4-1): Sample 1 : ICP/OES chromatograms
52 Fig.(4-2): Sample 2 : ICP/OES chromatograms
53 Fig.(4-3): Sample 3 : ICP/OES chromatograms
54 Fig.(4-4): Sample 4 : ICP/OES chromatograms
55 Fig.(4-5): Sample 5 : ICP/OES chromatograms
56 Fig.(4-6): Sample 6 : ICP/OES chromatograms
57 Fig.(4-7): Sample 7 : ICP/OES chromatograms
58 Fig.(4-8): Sample 8 : ICP/OES chromatograms
59 Fig.(4-9): Sample 9 : ICP/OES chromatograms
60 Fig.(4-10): Sample 10 : ICP/OES chromatograms
61 Fig.(4-11): Sample 11 : ICP/OES chromatograms
62 Fig.(4-12): Sample 12 : ICP/OES chromatograms
63 Fig.(4-13): Sample 13 : ICP/OES chromatograms
XI
64 Fig.(4-14): Sample 14 : ICP/OES chromatograms
65 Fig.(4-15): Sample 15 : ICP/OES chromatograms
66 Fig.(4-16): Sample 16 : ICP/OES chromatograms
67 Fig.(4-17): Sample 17 : ICP/OES chromatograms
68 Fig.(4-18): Sample 18 : ICP/OES chromatograms
69 Fig.(4-19): Sample 19 : ICP/OES chromatograms
70 Fig.(4-20): Sample 1 : ICP/OES chromatograms
71 Fig.(4-21): Sample 2 : ICP/OES chromatograms
71 Fig.(4-22): Sample 3 : ICP/OES chromatograms
73 Fig.(4-23): Sample ICP/OES chromatograms
73 Fig.(4-24): Sample ICP/OES chromatograms
74 Fig.(4-25): Sample ICP/OES chromatograms
74 Fig.(4-26): Sample ICP/OES chromatograms

XII
List of Tables
Page No. Title of Table 51 Table (4.1): The analyzed data of sample collected from
different locations in Khartoum(Sudan)
52 Table (4.2): The analyzed data of sample collected from
different locations in Khartoum(Sudan)
53 Table (4.3): The analyzed data of sample collected from
different locations in Khartoum(Sudan)
54 Table (4.4): The analyzed data of sample collected from
different locations in Khartoum(Sudan)
55 Table (4.5): The analyzed data of sample collected from
different locations in Khartoum(Sudan)
56 Table (4.6): The analyzed data of sample collected from
different locations in Khartoum(Sudan)
57 Table (4.7): The analyzed data of sample collected from
different locations in Khartoum(Sudan)
58 Table (4.8): The analyzed data of sample collected from
different locations in Khartoum(Sudan)
59 Table (4.9): The analyzed data of sample collected from
different locations in Khartoum(Sudan)
60 Table (4.10): The analyzed data of sample collected from
different locations in Khartoum(Sudan)
61 Table (4.11): The analyzed data of sample collected from
different locations in Khartoum(Sudan)
62 Table (4.12): The analyzed data of sample collected from
different locations in Khartoum(Sudan)
63 Table (4.13): The analyzed data of sample collected from
different locations in Khartoum(Sudan)

XIII
Table (4.14): The analyzed data of sample collected from
different locations in Khartoum(Sudan)
65 Table (4.15): The analyzed data of sample collected from
different locations in Khartoum(Sudan)
66 Table (4.16): The analyzed data of sample collected from
different locations in Khartoum(Sudan)
67 Table (4.17): The analyzed data of sample collected from
different locations in Khartoum(Sudan)
68 Table (4.18): The analyzed data of sample collected from
different locations in Khartoum(Sudan)
69 Table (4.19): The analyzed data of sample collected from
different locations in Khartoum(Sudan)
72 Table (4.20): Heavy metals in test analysis samples
75 Table(4.21): Heavy metals in test analysis samples
66

1
Chapter One
Spectroscopy, Basic Concept
1-1 Introduction:
Spectroscopy is the chief experimental technique of atomic and molecular
physics and involves determining the energy states of atoms or molecules
by looking at the light absorbed or emitted when they change states.
Inductively coupled plasma/optical emission spectroscopy(ICP/OES) is a
powerful tool for the determination of metals in a variety of different
sample matrices. The analytical performance of such systems is
competitive with most other inorganic analysis techniques, especially
with regards to sample throughput and sensitivity. (Ghosh et al., 2013)
The principle used in the inductively coupled Plasma Optical Emission
Spectroscopy is When plasma energy is given to an analysis sample from
outside, the component elements (atoms) are excited. When the excited
atoms return to low energy position, emission rays (spectrum rays) are
released and the emission rays that correspond to the photon wavelength
are measured. The element type is determined based on the position of
the photon rays, and the content of each element is determined based on
the rays intensity. To generate plasma, first, argon gas is supplied to torch
coil, and high frequency electric current is applied to the work coil at the
tip of the torch tube. Using the electromagnetic field created in the torch
tube by the high frequency current, argon gas is ionized and plasma is
generated. This plasma has high electron density and temperature
(10000K) and this energy is used in the excitation-emission of the
sample. Solution samples are introduced into the plasma in an atomized
state through the narrow tube in the center of the torch tube.(Ghosh et al.,
2013)

2
1-2 The Study Objectives:
The objectives of this Study are:
The Usage of Inductively coupled plasma/optical emission
spectroscopy(ICP/OES) to characterize the components of different
types of cosmetic powder, collected from different locations in Sudan.
The comparison between the types of cosmetic powder after the
characterization.
1-3 Thesis Structure:
This thesis consists of four chapters. Chapter one presents an overview
of spectroscopy and the objectives of this work. In chapter two,
description of Inductively coupled plasma/optical emission
spectroscopy(ICP/OES) ; Principles, capabilities, instrumentation and
literature review are presented. Experimental setup, components of
ICP-OES setup, and the procedure are presented in chapter three. In
chapter four results, discussion, conclusions, and Appendixes are
presented
1-4 Spectroscopy:
Optical emission spectroscopy, which measures the light emitted from a
plasma as a function of wavelength, time, and location, is the most
commonly used plasma diagnostic probe for microelectronics fabrication
processes. The rate at which such transitions occur is determined by the
quantum mechanical similarity of the states. This similarity leads to
selection rules that indicate the allowed transitions. The energy of the
photons emitted by the plasma, therefore, is characteristic of the
composition and energy state of species within the plasma. The spectra
can be used to analyze both the chemical species that make up the plasma
and their state of excitation. Because it is non-intrusive, inexpensive,
and can be easily incorporated into an existing plasma reactor, it quickly

3
gains popularity in the microelectronics industry for monitoring the
plasma processing. However, the large information content makes the
interpretation of the spectra difficult. For this reason, it is primarily used
as a "fingerprint" that is compared with spectra taken while a process is
working well to identify the state or drift of the plasma. As a research and
development tool, it can be very useful in understanding the basic
processes within the plasma. It can be quite effective and
quantitative if combined with other measurements.(Samukawa et al.,
2012)
1-5 Spectrometry:
The spectroscopic technique used to assess the concentration or amount
of a given species. In those cases, the instrument that performs such
measurements is a spectrometer or spectrograph.
Spectroscopy/spectrometry is often used in physical and analytical
chemistry for the identification of substances through the spectrum
emitted from or absorbed by them.
Spectroscopy/spectrometry is also heavily used in astronomy and remote
sensing. Most large telescopes have spectrometers, which are used either
to measure the chemical composition and physical properties of
astronomical objects or to measure their velocities from the Doppler shift
of their spectral lines.
1-5-1Measurement Process:
Most spectroscopic methods are differentiated as either atomic or
molecular based on whether or not they apply to atoms or molecules.
Along with that distinction, they can be classified on the nature of their
interaction:
• Absorption spectroscopy uses the range of the electromagnetic spectra
in which a substance absorbs. This includes → atomic absorption

4
spectroscopy and various molecular techniques, such as infrared
spectroscopy in that region and nuclear magnetic resonance (NMR)
spectroscopy in the radio region.
• Emission spectroscopy uses the range of electromagnetic spectra in
which a substance radiates (emits). The substance first must absorb
energy. This energy can be from a variety of sources, which determines
the name of the subsequent emission, like luminescence. Molecular
luminescence techniques include spectrofluorimetry.
• Scattering spectroscopy measures the amount of light that a substance
scatters at certain wavelengths, incident angles, and polarization angles.
The scattering process is much faster than the absorption/emission
process. One of the most useful applications of light scattering
spectroscopy is → Raman spectroscopy.
1-6 Common Types:
•Absorption
Absorption spectroscopy is a technique in which the power of a beam of
light measured before and after interaction with a sample is compared.
When performed with tunable diode laser, it is often referred to as
Tunable diode laser absorption spectroscopy (TDLAS).
It is also often combined with a modulation technique, most often
wavelength modulation spectrometry (WMS) and occasionally frequency
modulation spectrometry (FMS) in order to reduce the noise in the
system.
•Fluorescence
Spectrum of light from a fluorescent lamp showing prominent mercury
peaks Fluorescence spectroscopy uses higher energy photons to excite a
sample, which will then emit lower energy photons. This technique has
become popular for its biochemical and medical applications, and can be
5
used for confocal microscopy, fluorescence resonance energy transfer,
and fluorescence lifetime imaging.
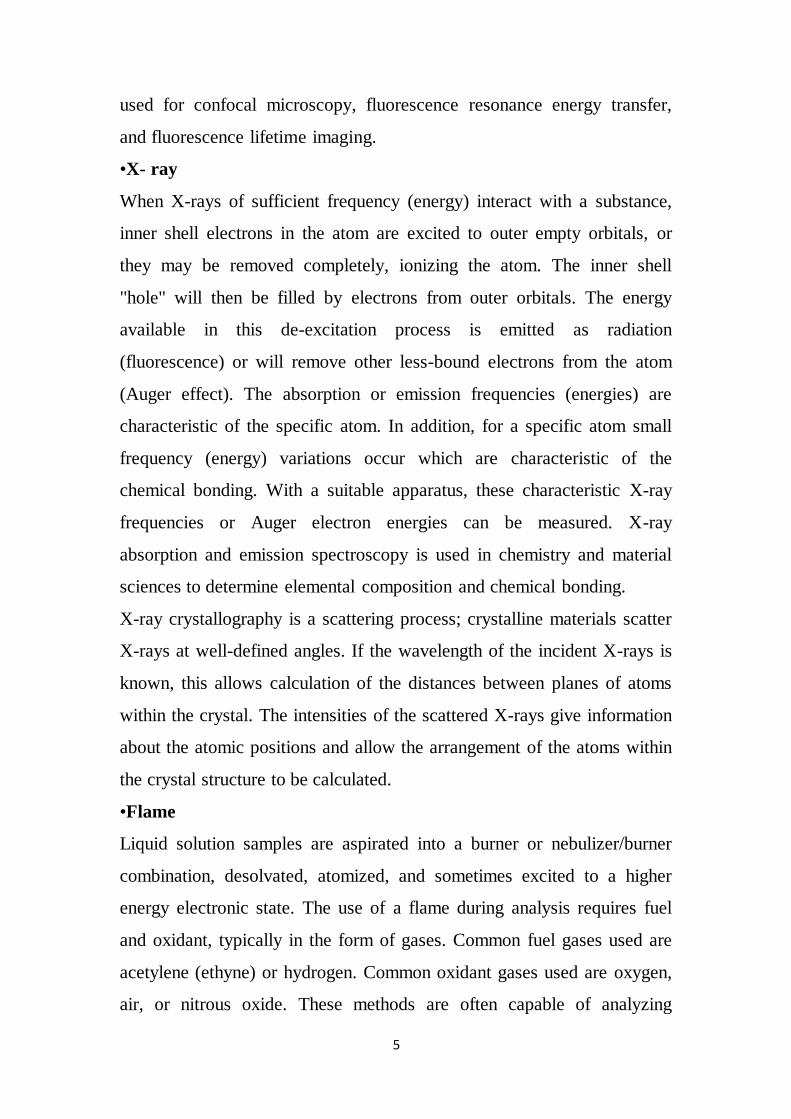
•X- ray
When X-rays of sufficient frequency (energy) interact with a substance,
inner shell electrons in the atom are excited to outer empty orbitals, or
they may be removed completely, ionizing the atom. The inner shell
"hole" will then be filled by electrons from outer orbitals. The energy
available in this de-excitation process is emitted as radiation
(fluorescence) or will remove other less-bound electrons from the atom
(Auger effect). The absorption or emission frequencies (energies) are
characteristic of the specific atom. In addition, for a specific atom small
frequency (energy) variations occur which are characteristic of the
chemical bonding. With a suitable apparatus, these characteristic X-ray
frequencies or Auger electron energies can be measured. X-ray
absorption and emission spectroscopy is used in chemistry and material
sciences to determine elemental composition and chemical bonding.
X-ray crystallography is a scattering process; crystalline materials scatter
X-rays at well-defined angles. If the wavelength of the incident X-rays is
known, this allows calculation of the distances between planes of atoms
within the crystal. The intensities of the scattered X-rays give information
about the atomic positions and allow the arrangement of the atoms within
the crystal structure to be calculated.
•Flame
Liquid solution samples are aspirated into a burner or nebulizer/burner
combination, desolvated, atomized, and sometimes excited to a higher
energy electronic state. The use of a flame during analysis requires fuel
and oxidant, typically in the form of gases. Common fuel gases used are
acetylene (ethyne) or hydrogen. Common oxidant gases used are oxygen,
air, or nitrous oxide. These methods are often capable of analyzing

6
metallic element analytes in the part per million, billion, or possibly
lower concentration ranges.
Light detectors are needed to detect light with the analysis information
coming from the flame.
1-7 Types of Spectroscopy:
The spectroscopy mainly classified into two categories these are:
1-7-1 Molecular Spectroscopy:
It deals with the interaction of electromagnetic radiation with molecules.
The results in transition between rotational and vibration energy levels in
addition to electronic transitions. Molecular spectra may involve
transitions between rotational vibration energy levels in addition to
electronic transitions. Thus, if an isolated molecule is originally in the
ground state electronic energy level (the zero point vibration energy level
and in a particular rotational energy level) absorption of a photon may
excite the molecule to a higher electronic vibration and / or rotational
energy level. There are many transitions that might give rise to
absorption, but only those that satisfy certain selection rules are
allowed.(Xu et al., 2009)
1-7-2 Atomic Spectroscopy:
The study of transitions, in absorption or emission between electronic
states of an atom, is atomic spectroscopy. It deals with the interaction of
electromagnetic radiation with atoms which are most commonly in their
lowest energy state. Atomic spectra involve only transitions of electrons
from one electronic energy level to another(Demirbas, 2004). The atomic
spectroscopy categorized into two types:
(1) Atomic Absorption Spectroscopy (AAS):
The quantity of interest in atomic absorption measurements is the amount
of light at the resonant wavelength which is absorbed as the light passes

7
through a cloud of atoms. As the number of atoms in the light path
increases, the amount of light absorbed increases in a predictable way. By
measuring the amount of light absorbed, a quantitative determination of
the amount of analytic element present can be made. The use of special
light sources and careful selection of wavelength allow the specific
quantitative determination of individual elements in the presence of
others. The atom cloud required for atomic absorption measurements is
produced by supplying enough thermal energy to the sample to dissociate
the chemical compounds into free atoms. Aspirating a solution of the
sample into a flame aligned in the light beam serves this purpose. Under
the proper flame conditions, most of the atoms will remain in the ground
state form and are capable of absorbing light at the analytical wavelength
from a source lamp. The ease and speed at which precise and accurate
determinations can be made with this technique have made atomic
absorption one of the most popular methods for the determination of
metals (Demirbas, 2004).
(2) Atomic Emission Spectroscopy (AES):
The purpose of atomic emission spectroscopy (AES) is to determine the
elemental composition of a sample (solid, liquid, or gas). The analysis
can range from a simple identification of the atomic constituents of the
sample to a more detailed determination of relative concentrations or
absolute masses. (Ryan and Deci, 2000).This method uses flame
excitation; atoms are excited from the heat of the flame to emit light. This
method commonly uses a total consumption burner with a round burning
outlet. A higher temperature flame than atomic absorption spectroscopy
(AA) is typically used to produce excitation of analytic atoms. Since
analytic atoms are excited by the heat of the flame, no special elemental
lamps to shine into the Flame are needed. A high resolution

8
polychromatic can be used to produce emission intensity. wavelength
spectrum over a range of wavelengths showing multiple element
excitation lines, meaning multiple elements can be detected in one run.
Alternatively, a monochromator can be set at one wavelength to
concentrate on the analysis of a single element at a certain emission line.
Plasma emission spectroscopy is a more modern version of this
method.(Demirbas, 2004)
(3)Atomic Fluorescence Spectroscopy:
This method commonly uses a burner with a round burning outlet. The
flame is used to solvate and atomize the sample, but a lamp shines light at
a specific wavelength into the flame to excite the analyte atoms in the
flame. The atoms of certain elements can then fluoresce emitting light in
a different direction. The intensity of this fluorescing light is used for
quantifying the amount of analyte element in the sample. A graphite
furnace can also be used for atomic fluorescence spectroscopy. This
method is not as commonly used as atomic absorption or plasma emission
spectroscopy.
1-7-3 Laser-Induced Fluorescence (LIF):
The phenomenon when the light is absorbed and then re-emitted at
another wavelength is called fluorescence; Fluorescence is very often
used in practical spectroscopy because of its high sensitivity. Since a
wavelength shift occurs, the detection can be made without any
disturbance of the excitation light. This is an important feature in contrast
to absorption measurements, where scattered light can cause problems,
which are due to an Increase of the background signal.(Page and Gautier,
2012).The diagnosis of hydrogen atoms was a typical aim of the laser-
induced fluorescence (LIF) technique at the initial stage of its
applications to plasma experiments. LIF-technique used to the

9
investigation of the plasma–surface interaction. Measurements of metal
atom fluxes, the density of sputtered
particles near plasma facing components, and the velocity distribution of
sputtered atoms have been successfully investigated; for most metal
atoms in the plasma boundary the LIF-technique can be applied if the
density is higher than ~1012 m–3 . Figure (1.3) shows the Setup of
fluorescence.
Fig (1.1): The setup of LIF
In the technique of laser-induced fluorescence or LIF, a laser is tuned so
that its frequency matches that of an absorption line of some atom or
molecule of interest. The absorption of the laser photons by this species
produces an electronically excited state which then radiates. The
fluorescent emission detected using a filter or a monochromatic followed
by a photomultiplier. Because a particular absorption line is selected, the
excited state as definite and identifiable vibration, Rotational and fine
structure quantum numbers. This clean state has significant advantages
for spectroscopic and collision studies, in contrast to the congestion often
found in ordinary emission spectra from, for example, a discharge. Since

11
the lower state responsible for the absorption is also definite, considerable
selectivity is provided by LIF when used as a diagnostic tool. In addition,
its high degree of sensitivity, the spatial and temporal resolution,
availability, and its non-intrusive nature is important attributes for this
method not possible in non-laser spectroscopy ;, such as two-photon
excitation, yield new information and make possible new diagnostic
probes. LIF as a whole has had a tremendous impact on the study of the
electronic spectra of small molecules,' and it should be noted that the
experiments discussed here form but a tiny portion of the many ways LIF
has been used to further our knowledge of molecular structure and
behavior. None the less, it is hoped that the highly personal selection
presented will serve to describe some of the important aspects of this
exciting and rapidly progressing technique.(Rideout et al., 2003). Laser-
induced fluorescence spectroscopy is based on the electronic excitation of
an atom or molecule by laser irradiation. When the electron returns to a
lower-lying energy level, the energy maybe released in the form of a
photon. This forms the basic principle of fluorescence. The LIF technique
is well established, and theoretical, mathematical .(Lui et al., 2008)
1-7-4 Laser-Raman Spectroscopy:
The main spectroscopic methods employed to detect vibrations in
molecules are based on the processes of infrared absorption and Raman
scattering. They are widely used to provide information on chemical
structures and physical forms, to identify substances from the
characteristic spectral patterns (‘fingerprinting’), and to determine
quantitatively or semi-quantitatively the amount of a substance in a
sample. Samples can be examined in a whole range of physical states; for
example, as solids, liquids or vapours, in hot or cold states, in bulk, as
microscopic particles, or as surface layers. The techniques are very wide
ranging and provide solutions to a host of interesting and challenging

11
analytical problems. Raman scattering is less widely used than infrared
absorption, largely due to problems with sample degradation and
fluorescence. However, recent advances in instrument technology have
simplified the equipment and reduced the problems substantially. These
advances, together with the ability of Raman spectroscopy to examine
aqueous solutions, samples inside glass containers and samples without
any preparation; have led to a rapid growth in the application of the
technique.
In practice, modern Raman spectroscopy is simple. Variable instrument
Parameters are few, spectral manipulation is minimal and a simple
interpretation of the data may be sufficient. Raman scattering is an
underdeveloped technique, with much important information, often not
used or recognized.(Smith and Dent, 2005) The Raman Effect is a
spectroscopic technique used to study vibrational, rotational, and other
low-frequency modes in a system. It relies on inelastic scattering, or
Raman scattering, of monochromatic light, usually from a laser in the
visible, near infrared, or near ultraviolet range. The laser light interacts
with molecular vibrations, phonons or other excitations in the system,
resulting in the energy of the laser photons being shifted up or down. The
shift in energy gives information about the phonon modes in the system
(Der Radiology, et.al. 2009).
When the emitted photon is of lower frequency than the absorbed photon
the process is termed stokes scattering, if the emitted photon is of higher
frequency the process called anti-stokes scattering (the light has gained
energy from the vibrational or rotational state). These two processes are
schematically represented in the energy diagrams shown in fig(1.2).

12
Fig (1.2): Energy-level diagram for spontaneous Raman scattering
The bold arrows indicate the excitation photons at a frequency, ωL while
the thin arrows represent the in elastically scattered photon, at frequency
ωS or ωAS. Raman spectroscopy is carried out using visible or near UV
excitation frequencies. The characteristics of the Raman signal yield a
signature dependent on the molecular species, the temperature, and the
pressure.
1-7-4-1 Characteristics of Raman Spectroscopy:
Raman spectroscopy is characterized by the following features:
1. Raman spectroscopy permits acquisition of the spectra in situ.
Monitoring of a reaction in a flask online, for example, can simply be
accomplished by irradiating laser light directly upon the reactant from
outside the flask.
2. Raman spectra can be measured irrespective of the state of a substance,
that is, regardless of whether the substance is gas, liquid, solution, solid,
crystal, fiber, or film. In addition, by measuring spectra of substances in

13
various states one can obtain information about different molecular
structures of the given substance in various phases.
3. As lasers are used for exciting the sample and due to high sensitivity of
modern detectors, it is possible to obtain Raman spectra from very small
amounts of material. This feature is of importance for local analyses and
also for instruments equipped with microscopes.
4. Raman experiments can be conducted with optical fibers, which allow
the spectrometer to be separated from the sample that might be, say, in a
dangerous environment. This feature is very important with respect to
Raman spectroscopy as a means of online or outdoor analysis.
5. A valuable application of Raman spectroscopy in fundamental research
is for examination of ultrahigh speed phenomena. Raman spectroscopy is,
therefore, frequently used to study the excited states of molecules and the
structures of reaction intermediates.(McCreery, 2005)
1-7-5 Laser Induced Break Down Spectroscopy:
LIBS is a sensitive technique for analyzing the chemical or atomic
compositions of solid or liquid materials. Here a laser pulse is focused
onto the surface
Fig. (1.3) Laser-induced breakdown spectroscopy
of a solid or liquid material. Due to the high peak intensity, fast
evaporation of a small volume in the focus of the laser pulse occurs. The

14
gaseous plume ejected from the surface contains molecules, atoms and
ions contained in the focal volume.
The fluorescence emitted by the excited species is collected by a lens,
focused into an optical fiber and sent to the entrance slit of a spectrograph
(Fig. 1.3). If the detector at the exit of the spectrograph is time-gated, the
spectra can be recorded at specific times after the generation of the
plume. Since the plume cools during its expansion, the ions recombine to
excited states of neutral atoms or molecules and the emission from these
states is a measure of the concentration of the atoms in the sample.
An important application of LIBS is the analysis of samples from a steel
converter during the melting process. A small sample is taken from the
liquid steel, rapidly cooled and then inspected by LIBS in order to get
information on the relative concentrations of the different components in
the steel. The whole process takes only a few minutes and therefore the
composition of the liquid steel can be corrected before the molten metal
solidifies.
LIBS has been also successfully applied to the analysis of geochemical
samples. The most accurate information can be obtained for the relative
concentrations of different elements in a sample. This is important, for
example, for the classification of minerals on earth or in meteorites when
it is not clear whether two different samples come from the same source.
Also for archeological samples the precise knowledge of elemental
composition is very helpful for the exact dating and assignment. The
applications of LIBS has benefitted from the use of fiber optics which
allows remote sensing, where the laser and detection systems are far
away. (Anh Tuan Phungd, 2013)

15
1-8 Plasma Emission Spectroscopy:
In some ways similar to flame atomic emission spectroscopy, it has
largely replaced it.
• Direct-current plasma (DCP)
A direct-current plasma (DCP) is created by an electrical discharge
between two electrodes.
A plasma support gas is necessary, and Ar is common. Samples can be
deposited on one of
the electrodes, or if conducting can make up one electrode.
• Glow discharge-optical emission spectrometry (GD-OES)
• Inductively coupled plasma-atomic emission spectrometry (ICP-AES)
• Laser Induced Breakdown Spectroscopy (LIBS) (LIBS), also called
Laser-induced plasma
spectrometry (LIPS)
• Microwave-induced plasma (MIP)
Spark or Arc (Emission) Spectroscopy :
Is used for the analysis of metallic elements in solid samples. For non-
conductive materials, a sample is ground with graphite powder to make it
conductive. In traditional arc spectroscopy methods, a sample of the solid
was commonly ground up and destroyed during analysis. An electric arc
or spark is passed through the sample, heating the sample to a high
temperature to excite the atoms in it. The excited analyte atoms glow
emitting light at various wavelengths which could be detected by
common spectroscopic methods. Since the conditions producing the arc
emission typically are not controlled quantitatively, the analysis for the
elements is qualitative.

16
Nowadays, the spark sources with controlled discharges under an argon
atmosphere allow that this method can be considered eminently
quantitative, and its use is widely expanded worldwide through
production control laboratories of foundries and steel mills.
•Visible
Many atoms emit or absorb visible light. In order to obtain a fine line
spectrum, the atoms must be in a gas phase. This means that the
substance has to be vaporised. The spectrum is studied in absorption or
emission. Visible absorption spectroscopy is often combined with UV
absorption spectroscopy in UV/Vis spectroscopy. Although this form
may be uncommon as the human eye is a similar indicator, it still proves
useful when distinguishing colours.
•Ultraviolet
All atoms absorb in the Ultraviolet (UV) region because these photons
are energetic enough to excite outer electrons. If the frequency is high
enough, photo ionization takes place. UV spectroscopy is also used in
quantifying protein and DNA concentration as well as the ratio of protein
to DNA concentration in a solution. Several amino acids usually found in
protein, such as tryptophan, absorb light in the 280 nm range and DNA
absorbs light in the 260 nm range. For this reason, the ratio of 260/280
nm absorbance is a good general indicator of the relative purity of a
solution in terms of these two macromolecules. Reasonable estimates of
protein or DNA concentration can also be made this way using Beer's
law.
•Infrared
Infrared spectroscopy offers the possibility to measure different types of
inter atomic bond vibrations at different frequencies. Especially in
organic chemistry the analysis of IR absorption spectra shows what type

17
of bonds are present in the sample. It is also an important method for
analyzing polymers and constituents like fillers, pigments and
plasticizers.
•Near Infrared (NIR)
The near infrared NIR range, immediately beyond the visible wavelength
range, is especially important for practical applications because of the
much greater penetration depth of NIR radiation into the sample than in
the case of mid IR spectroscopy range. This allows also large samples to
be measured in each scan by → NIR spectroscopy, and is currently
employed for many practical applications such as: rapid grain analysis,
medical diagnosis pharmaceuticals/medicines, biotechnology, genomics
analysis, proteomic analysis, interactomics research, inline textile
monitoring, food analysis and chemical imaging/hyper spectral imaging
of intact organisms, plastics, textiles, insect detection, forensic lab
application, crime detection, various military applications, and so on.

18
Chapter Two
Spectroscopic Analysis of Cosmetic Solid Powder
2-1General Characteristics Of Inductively coupled plasma
/optical emission spectroscopy ICP-OES:
Inductively coupled plasma/optical emission spectroscopy(ICP/OES) is a
powerful tool for the determination of metals in a variety of different
sample matrices. With this technique, liquid samples are injected into -
induced argon plasma using one of a variety of nebulizers or sample
introducing techniques.
The sample mist reaching the plasma is quickly dried, vaporized, and
energized through collision excitation at high temperature. The atomic
emission emanating from the plasma is viewed, collected with a lens or
mirror, and imaged onto the entrance slit of a wavelength selection
device. Single element measurements can be per for cost effectively with
a simple monochromatic / photomultiplier tube (PMT) combination, and
simultaneous multi element determinations are performed for up to 70
elements with the combination of a polychromatic and an array detector).
The analytical performance of such systems is competitive with most
other inorganic analysis techniques, especially with regards to sample
throughput and sensitivity.(Ghosh et al., 2013)
The principle used in the inductively coupled Plasma Optical Emission
Spectroscopy is When plasma energy is given to an analysis sample from
outside, the component elements (atoms) are excited When the excited
atoms return to low energy position, emission rays (spectrum rays) are
released and the emission rays that correspond to the photon wavelength
are measured. The element type is determined based on the position of
the photon rays, and the content of each element is determined based on
the rays intensity. To generate plasma, first, argon gas is supplied to torch
coil, and high frequency electric current is applied to the work coil at the
tip of the torch tube. Using the electromagnetic field created in the torch
tube by the high frequency current, argon gas is ionized and plasma is
generated. This plasma has high electron density and temperature
(10000K) and this energy is used in the excitation-emission of the
sample. Solution samples are introduced into the plasma in an atomized
19
state through the narrow tube in the center of the torch tube.(Ghosh et al.,
2013)
Since the dawn of civilization, cosmetics have constituted a part
of routine body care by all set of people. Past few decades has
witnessed a rapid growth in cosmetic industries, through
production of various types of cosmetics which are needed for
care and beautification of skin, hair, nails, teeth and body.
Although beauty consciousness of people has set the demand for
cosmetics in market, the side effects as well as health
consciousness of people have attracted the health practiticians and
researchers to find out the probable reason for unusual side
effects. Heavy metal contamination is one of the most important
reasons addressing problem. Heavy metals like Barium ,Boron
,Aluminum, Manganese ,Copper, Iron ,Zinc, Calcium and
Europium are common contaminants in various cosmetic products.
This chapter focuses on the analysis of heavy metals using
Inductively Coupled Plasma- Optical Emission Spectroscopy
(ICP-OES) used in cosmetics and its adverse effects.(Mayildurai
et al., 2015)
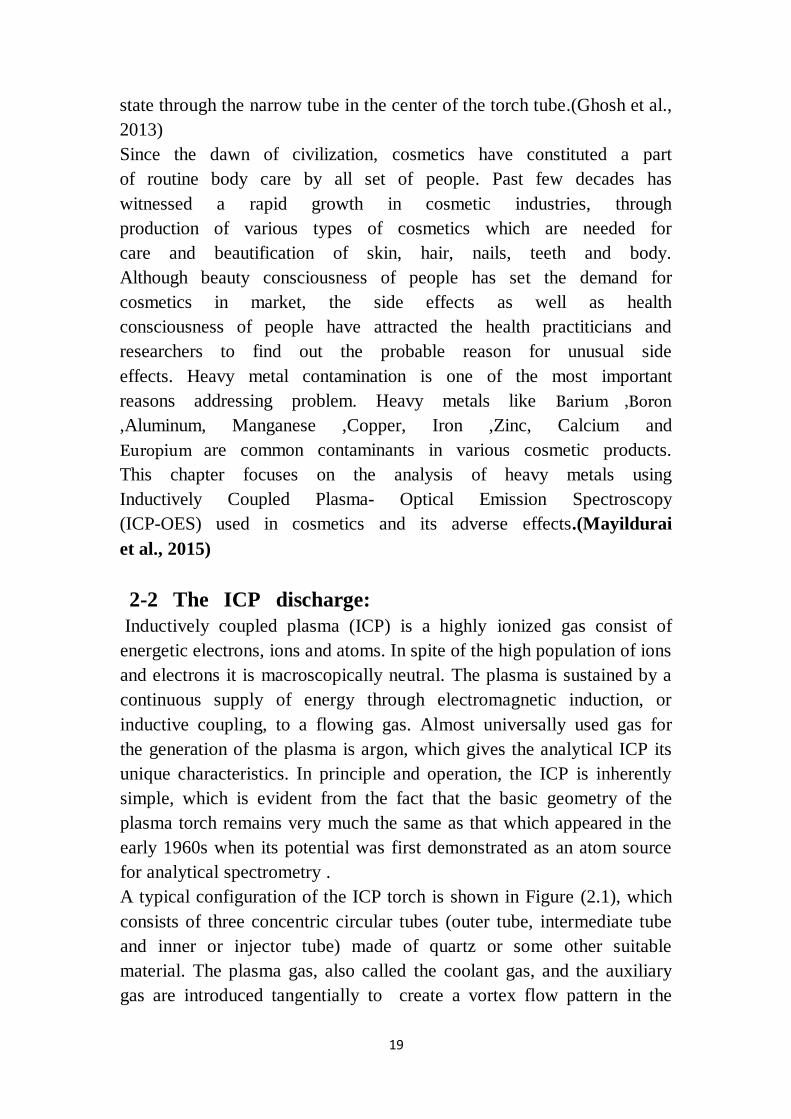
2-2 The ICP discharge:
Inductively coupled plasma (ICP) is a highly ionized gas consist of
energetic electrons, ions and atoms. In spite of the high population of ions
and electrons it is macroscopically neutral. The plasma is sustained by a
continuous supply of energy through electromagnetic induction, or
inductive coupling, to a flowing gas. Almost universally used gas for
the generation of the plasma is argon, which gives the analytical ICP its
unique characteristics. In principle and operation, the ICP is inherently
simple, which is evident from the fact that the basic geometry of the
plasma torch remains very much the same as that which appeared in the
early 1960s when its potential was first demonstrated as an atom source
for analytical spectrometry .
A typical configuration of the ICP torch is shown in Figure (2.1), which
consists of three concentric circular tubes (outer tube, intermediate tube
and inner or injector tube) made of quartz or some other suitable
material. The plasma gas, also called the coolant gas, and the auxiliary
gas are introduced tangentially to create a vortex flow pattern in the

21
region where the plasma is generated.
The auxiliary gas, which is not essential to maintain a stable plasma, can
be used to make slight adjustments in the position of the base of the
plasma relative to the quartz torch or the load coil. The central gas flow,
which enters through the 'injector tube', is used to transport the analytic
into the plasma, commonly as fine aerosol droplets. The same central gas
flow typically is used for nebulization of the sample solution to generate
the aerosol. A two- or three-turn copper coil (3 mm o.d.), called the
load coil,surrounds the top end of the torch, which is water-cooled and
carries the
Fig.( 2.1) The ICP torch.

21
alternating current supplied by the radiofrequency (RF) power generator.
The most commonly used frequencies are 27.12 or 40.68 MHz. When the
RF power is applied typically at 600-1500 W to the load coil, it inducesan
oscillating magnetic field inside the torch, which in turn induces an
oscillating intense electric field in the vicinity of the load coil. With the
argon gas flowing through the torch some electrons are momentarily
'seeded' into the gas by an electrical spark using external means such as a
Tesla coil. These electrons get accelerated by the alternating magnetic
field and become highly energetic. The collisions between the energetic
electrons and argon atoms generate argon ions and more electrons. The
process continues as a chain reaction until the gas becomes highly
conductive and reaches a steady state where most of the RF energy
supplied to the coil is transferred to the gas to self-sustain a high-
temperature plasma highly populated with electrons and argon ions. This
ignition process takes only a fraction of a second.
2-2-1Detection of Emission:
In ICP-OES, the light emitted by the excited atoms and ions in the plasma
is measured to obtain information about the sample. Because the excited
species in the plasma emit light at several different wavelengths, the
emission from the plasma is polychromatic. This polychromatic radiation
must be separated into individual wavelengths so the emission from each
excited species can be identified and its intensity can be measured
without interference from emission at other wavelengths.
The separation of light according to wavelength is generally done using a
monochromator, which is used to measure light at one wavelength at a
time, or a polychromator, which can be used to measure light at several
different wavelengths at once. The actual detection of the light, once it
has been separated from other wavelengths, is done using a
photosensitive detector such as a photo-multiplier tube (PMT) or
advanced detector techniques such as a charge-injection device (CID) or a
charge-coupled device (CCD).
2-3 Basic ICP spectrometric system:
A spectrometric system can be divided into three basic components:
(a) sample processor, (b) signal generator and (c) signal processor, as
shown in Fig.( 2.2). The primary function of the sample processor is to
convert the sample into a form that can conveniently be handled by the

22
signal generator. For conventional solution analysis, the sample processor
may consist of auto sampler, pump, nebulizer and spray chamber. The
signal generator, essentially the plasma, generates photons of specific
wavelengths, or ions of specific masses, characteristic to each analytic
element from the aerosol droplets. For photon measurement, i.e. in optical
emission spectrometry (ICP-ES), the signal processor disperses and
separates the photons according to their wavelength and quantitatively
measures their intensity. In mass spectrometry (ICP-MS) the ions
generated by the plasma are separated according to m/e (mass-to-charge
ratio) and the intensity of ions of a desired mass is measured
quantitatively.
Even though, in principle, the ICP can also be used as an atom
source for atomic absorption and atomic fluorescence, because of its
high excitation and ionization efficiency of producing excited atoms
and ions, it is primarily used as a source for optical emission and
mass spectrometry.(Alfassi, 2012)
Fig.( 2.2) Basic ICP spectrometry system.
2-3-1 Suitability of the ICP as an emission source:
In emission spectrometry the sample is subjected to high enough
temperature to dissociate the matrix into atoms or ions and to cause their
electronic excitation by collision. The excited atoms or ions relax from
the excited state to the ground state by collision with other particles
(coalitional relaxation) or by emitting radiation (radiative relaxation)
(Figure 2.3). The energy difference between the two energy states, and
therefore the wavelength of emitted radiation, is discrete and
characteristic to the element.
The intensity of the light emitted at the characteristic wavelength is

23
proportional to the concentration of the particular element
One of the main advantages of the high excitation efficiency of the ICP
is that it can populate a large number of different excited energy states for
a number of elements at the same time under the same set of experimental
conditions. This endows the ICP-ES its most notable feature, the
capability of simultaneous multi-element determinations. However, by
the same token, the emission spectra can also be quite rich in spectral
lines and structure, thereby increasing the probability of spectral
overlaps, which would demand an optical spectrometer with a high
resolving power.
The emission lines can be in the vacuum-ultraviolet (VUV, 120- 190nm),
ultraviolet (UV, 190-400 nm), visible (VIS, 400-700 nm) and near-
infrared(NIR, 700-850 nm). For practical reasons, the most commonly
used spectral regions are UV and VIS. Spectrometers used in the VUV
region need to be maintained at a vacuum to avoid absorption of VUV
radiation by air, and are used for specialized applications such as
sensitive determination of halogens, phosphorus and sulfur. Owing to the
high efficiency of matrix decomposition and its inertness, the ICP is
virtually free from sample-matrix-induced interferences, which means
that calibration can be quickly and easily performed with simple multi-
element aqueous standards. It is a constant emission source and its
stability is unexcelled, making it capable of performing all day routine
determinations with a very few straightforward calibrations. Finally,
because it is an optically thin source, ICP has exceptional linearity over
a wide range of concentration without being affected by self-absorption.

24
Fig.( 2.3) Coalitional excitation and radiative relaxation
This large dynamic range, typically over six orders of magnitude, permits
the determination of trace, minor, and major elements in the same sample
simultaneously, without the need for serial dilution.
In general these attributes make ICP emission spectroscopy a nearly
universal technique for elemental analysis in a variety of applications
ranging from geological to clinical fields. (Alfassi, 2012)
2-3-2 Optical Emission Spectroscopy (OES):
This technique is based on the principle that when an element is
converted into atoms and ions (atomized), light characteristic for that
particular element is emitted; recognition of this phenomenon led to the
early development of the technique.
Optical emission spectroscopy (OES) was first applied to archaeological
materials in the 1930s. In order to perform this type of analysis, it is
necessary for the sample to be either a liquid or in solution; solid samples
are often dissolved in a strong Inductively Coupled Plasma-Atomic
Emission Spectroscopy (ICP-AES). The next step is nebulization, where
the sample solution is converted into an aerosol and then the tiny
droplets are sprayed into a heat source, which is often a flame. Depending
upon the oxidant and fuel used, flame temperatures between 1700 and
3000◦C can be achieved. At these relatively low temperatures, a portion
of the sample is atomized; furnaces sparks, and arcs can be used to
produce higher temperatures than flames. Sample atoms are excited
through collisions and outer electrons are temporarily lifted to higher
energy levels. In order to return to ground
state, energy characteristic of the particular element is released. This
energy is a well-defined wavelength in the near ultraviolet or visible
light range.
(Malainey, 2011)

25
2-4plasma fundamentals:
2-4-1 Definition of a Plasma:
The word plasma is used to describe a wide variety of macroscopically
neutral substances containing many interacting free electrons and ionized
atoms or molecules, which exhibit collective behavior due to the long-
range coulomb forces. Not all media containing charged particles,
however, can be classified as plasmas. For a collection of interacting
charged and neutral particles to exhibit plasma behavior it must satisfy
certain conditions, or criteria, for plasma existence. These criteria will
be discussed in some detail in the next section.
The word plasma comes from the Greek and means something molded.
It was applied for the first time by Tonks and Langmuir, in 1929, to
describe the inner region, remote from the boundaries, of a glowing
ionized gas produced by electric discharge in a tube, the ionized gas as
a whole remaining electrically neutral. (Bittencourt, 2004) 2-4-2 Plasma as the Fourth State of Matter:
From a scientific point of view, matter in the known universe is
often classified in terms of four states: solid, liquid, gaseous, and plasma.
The basic distinction among solids, liquids, and gases lies in the
difference between the strength of the bonds that hold their constituent
particles together. These binding forces are relatively strong in a solid,
weak in a liquid, and essentially almost absent in the gaseous state.
Whether a given substance is found in one of these states depends on the
random kinetic energy (thermal energy) of its atoms or molecules, i.e., on
its temperature. The equilibrium between this particle thermal energy and
the inter particle binding forces determines the state.
By heating a solid or liquid substance, the atoms or molecules acquire
more thermal kinetic energy until they are able to overcome the binding
potential energy. This leads to phase transitions, which occur at a
constant temperature for a given pressure.
The amount of energy required for the phase transition is called
the latent heat.
If sufficient energy is provided, a molecular gas will gradually dissociate
into an atomic gas as a result of collisions between those particles whose
thermal kinetic energy exceeds the molecular binding energy.

26
At sufficiently elevated temperatures an increasing fraction of the atoms
will possess enough kinetic energy to overcome, by collisions, the
binding energy of the outermost orbital electrons, and an ionized gas or
plasma results.
However, this transition from a gas to a plasma is not a phase
transition in the thermodynamic sense, since it occurs gradually with
increasing temperature. (Bittencourt, 2004)
2-4-3 Plasma Production:
A plasma can be produced by raising the temperature of a substance
until a reasonably high fractional ionization is obtained. Under
thermodynamic equilibrium conditions, the degree of ionization and the
electron temperature are closely related. Although plasmas in local
thermodynamic equilibrium are found in many places in nature, as is
the case for many astrophysical plasmas, they are not very common in the
laboratory.
Plasmas can also be generated by ionization processes that raise the
degree of ionization much above its thermal equilibrium value. There
are many different methods of creating plasmas in the laboratory and,
depending on the method, the plasma may have a high or low density,
high or low temperature, it may be steady or transient, stable or unstable,
and so on. In what follows, a brief description is presented of the most
commonly known processes of photo ionization and electric discharge in
gases.
In the photoionization process, ionization occurs by absorption of
incident photons whose energy is equal to, or greater than, the ionization
potential of the absorbing atom. The excess energy of the photon is
transformed into kinetic energy of the electron-ion pair formed. For
example, the ionization potential energy for the outermost electron of
atomic oxygen is 13.6 eV, which can be supplied by radiation of
wavelength smaller than about 91 nm, i.e., in the far ultraviolet.
Ionization can also be produced by x-rays or gamma rays, which have
much smaller wavelengths.
The Earth's ionosphere, for example, is a natural photo ionized plasma.
In a gas discharge, an electric field is applied across the ionized gas,
which accelerates the free electrons to energies sufficiently high to ionize
other atoms by collisions. One characteristic of this process is that the

27
applied electric field transfers energy much more efficiently to the light
electrons than to the relatively heavy ions. The electron temperature in
gas discharges is therefore usually higher than the ion temperature, since
the transfer of thermal energy from the electrons to the heavier particles
is very slow.
When the ionizing source is turned off, the ionization decreases
gradually because of recombination until it reaches an equilibrium value
consistent with the temperature of the medium. In the laboratory the
recombination usually occurs so fast that the plasma completely
disappears in a small fraction of a second.(Bittencourt, 2004)
2-4-4 Particle Interactions and Collective Effects:
The properties of a plasma are markedly dependent upon the particle
interactions. One of the basic features that distinguish the behavior
of plasmas from that of ordinary fluids and solids is the existence of
collective effects. Due to the long range of electromagnetic forces, each
charged particle in the plasma interacts simultaneously with a
considerable number of other charged particles, resulting in important
collective effects that are responsible for the wealth of physical
phenomena that take place in a plasma.
The particle dynamics in a plasma is governed by the internal fields
due to the nature and motion of the particles themselves, and by
externally applied fields. The basic particle interactions are
electromagnetic in character. Quantum effects are negligible, except for
some cases of close collisions.
In a plasma we must distinguish between charge-charge and charge
neutral interactions. A charged particle is surrounded by an electric field
and interacts with the other charged particles according to the coulomb
force law, with its dependence on the inverse of the square of the
separation distance. Furthermore, a magnetic field is associated with a
moving charged particle, which also produces a force on other moving
charges. The charged and neutral particles interact through electric
polarization fields produced by distortion of the neutral particle's
electronic cloud during a close passage of the charged particle The field
associated with neutral particles involves short-range forces, such that
their interaction is effective only for inter atomic distances sufficiently
small to perturb the orbital electrons. It is appreciable when the distance
28
between the centers of the interacting particles is of the order of their
diameter, but nearly zero when they are farther apart. Its characteristics
can be adequately described only by quantum-mechanical
considerations. In many cases this interaction involves permanent or
induced electric dipole moments.
A distinction can be made between weakly ionized and strongly ionized
plasmas in terms of the nature of the particle interactions. In a weakly
ionized plasma the charge-neutral interactions dominate over the multiple
coulomb interactions. When the degree of ionization is such that the
multiple coulomb interactions become dominant, the plasma is
considered strongly ionized.
As the degree of ionization increases, the coulomb interactions become
increasingly important so that in a fully ionized plasma all particles are
subjected to the multiple coulomb interactions.(Bittencourt, 2004)
2-5 Advantages/disadvantages:
The primary advantage of optical emission analysis is that it is non-
intrusive and can be implemented on an existing apparatus with little
or no modification. It provides spatial and temporal resolution of the
plasma emission spectra and has very large information content which
yields much valuable information about the plasma if analyzed properly.
Moreover, it IS relatively inexpensive and can be used on more than one
reactor However, its complex spectrum is often difficult to
interpret. Therefore, typically only the atomic lines are
used in plasma process analysis. Molecular lines of
unknown origin are often used to monitor species whose
emission changes significantly upon the end point in
plasma etching processes. It is reasonably effective as a
trouble-shooting tool to identify contamination as water in
the process or an air leak, as long as the "normal"
processing spectra haven been recorded. One of the most
limiting factors of OES as a process diagnostic tool is the
maintenance of the optical window. Deposition and/or
etching of the window can significantly modify and
attenuate the OES signal. (Francis, 2003)

29
2-6 ICP-OES APPLICATIONS: The versatility of ICP-OES makes it a good analytical technique for a
wide variety of applications. This versatility is due not only to the large
number of elements that can be determined rapidly at trace levels but also
to the wide variety of sample types that can be analyzed using the ICP-
OES technique. In this chapter, ICP-OES applications have been grouped
into six generalized categories: Agricultural and Foods, Biological and
Clinical, Geological, Environmental and Waters, Metals, and Organics.
While an exhaustive review of each of these application areas is beyond
the scope of this book, some examples of ICP-OES applications are
discussed to give the reader an idea of the types of analyses where this
technique has been used successfully. Information regarding general
application areas and specific applications can be obtained from a number
of sources. Unfortunately, there is no one source that contains all the
information needed to perform any and all ICP-OES analyses. For
general discussions of applications.(Fredeen, 2004) .
Agricultural and Foods
The ICP-OES technique has been applied to the analysis of a large variety
of agricultural and food materials. Types of samples include soils,
fertilizers, plant materials, feedstuffs, foods, animal tissues, and body
fluids. Analyses of these materials are required to determine levels of
essential nutrients as well as levels of toxic elements in the materials.
Most agricultural and food materials are generally not in the form of
dilute aqueous solutions nor are they readily soluble in distilled water.
Therefore, analyses of these materials by ICP-OES often requires that
rigorous sample preparation procedures be carried out prior to analysis.
Fortunately for the analyst, the use of modern microwave sample
digestion techniques is helping to simplify the sample preparation steps
for agricultural and food materials as well as many other sample types.
Some typical applications of ICP-OES in this area include determination
of trace metals in beer and wine; analysis of infant formula for Ca, Cu,
Fe, Mg, Mn, P, K, Na and Zn; determination of country origin of orange
juice through trace element analysis; determination of 14 elements in
peanuts; and analysis of soils for toxic metal contamination.

31
Biological and Clinical
As research reveals more information regarding the roles and behaviors
of trace elements in biological systems, ICP-OES has become an
important tool in the area of biological and clinical applications.
Determinations by ICP-OES of essential, toxic and therapeutic trace
elements are important in the medical research laboratories
as well as in the clinical and forensic lab environments.
Of significant concern regarding trace element determinations in the
biological and clinical fields is the contamination of samples prior to their
analysis. While it is always important to consider sources of
contamination when performing trace determinations in any field, the
biological and clinical area is particularly susceptible to errors
due to contamination originating in the sample collection and sample
preparation steps. The use of surgical equipment, such as scalpels,
needles, scissors, and forceps, often contaminates the sample with trace
quantities of the very elements being determined in the sample. Many
biological and clinical samples are either too small or contain elemental
concentrations too low for ICP-OES analysis using conventional
pneumatic sample introduction. In these cases, it is often necessary to
turn to alternate sample introduction techniques such as ultrasonic
nebulization, electro thermal vaporization, or hydride generation, or pre
concentration techniques such as ion exchange or solvent extraction.
Examples of ICP-OES analyses of biological and clinical samples include
determinations of Cr, Ni and Cu in urine; Al in blood; Cu in brain tissue;
Se in liver; Cr in feces; Ni in breast milk; B, P and S in bone; and trace
elements in oyster and tuna tissues.
Geological
Geological applications of ICP-OES involve determinations of major,
minor and trace compositions of various rocks, soils, sediments, and
related materials. The major use of ICP-OES in this field is for
prospecting purposes. The technique is also used for applications such as
determining origins of rock formations and for marine geochemistry.
Preparation of geological samples for analysis by ICP-OES often
involves the use of lithium meta borate fusion reactions, especially for
materials containing high levels of silica. Acid dissolutions are also

31
commonly used for many geological materials. Of major concern for
geological applications of ICP-OES is the elimination of residues that
may be present following acid digestion or dissolution of a fusion bead.
Careful selection of the nebulizer used with the ICP instrument can help
to reduce problems caused by high salt and residue concentrations.
Typical applications of ICP-OES for analysis of geological samples
include determination of U in ore grade material; analysis of river
sediments for several metals; analysis of carbonate drill cores for major,
minor and trace elements; determination of rare earth elements in rock
formations; and analysis of plankton for several elements.
Environmental and Waters
The area of environmental analysis is quite a broad topic, covering many
different types of ICP-OES applications. Many of these applications, such
as analyses of soils, sediments, and animal and plant tissues, overlap
areas covered previously in this chapter and will not be addressed in this
section. This still leaves a number of important environmental ICP-OES
applications, not the least of which are the analyses of various types of
water. Other important environmental ICP-OES applications include
analyses of sewage sludge, domestic and industrial refuge, coal and
coal fly ash, and dust and other airborne particulates.
The analysis of water can be the simplest of all ICP-OES applications,
depending on the type of water being analyzed and the required
measurement levels and protocols. Fresh waters generally require only
that the sample be stabilized wit a mineral acid before analysis by ICP-
OES. Some waters may require filtering to remove particulates. For
analyses requiring very low detection levels, it may be
necessary to perform some kind of pre concentration step prior to
analysis. Ultrasonic nebulizers are also useful for improving sensitivity
for such analyses. Analyses of sewage sludge, various refuses, and coal
and coal fly ash require more rigorous sample preparation while
collection of airborne particulates requires use of air filtering techniques.
Examples of environmental ICP-OES applications include various water
quality analyses as required by the U.S. Environmental Protection
Agency; determination of Fe, Cd, Cu, Mo, Ni, V, and Zn in seawater;
determination of phosphorus in municipal wastewater; determination of

32
heavy metals in inner-city dust samples; and trace metal analysis of coal
fly ash.
Metals
ICP-OES is used widely for the determination of major, minor and trace
elemental constituents in metals and related materials. The technique is
used for analysis of raw materials, production control, and quality control
for final products as well as in the developmental lab environment.
Sample preparation is generally through acid digestions, except for oxide
materials which often require use of fusion techniques. Analysis of metals
is also the most likely use of solid sampling techniques such as spark or
laser ablation with ICP-OES instruments .A particular difficulty
associated with metals analysis by ICP-OES is the potential for a large
number of spectral interferences since many metals exhibit very complex
emission spectra. Use of a high-resolution spectrometer and spectral
interference correction techniques are often required for metals analyses
by ICP-OES.Some representative applications of ICP-OES for the
analysis of metals and related materials include determination of toxic,
trace and major constituents in coal and slags; analysis of low alloy steels
for As, B, Bi, Ce, La, P, Sn and Ta; high-precision determination of Si in
steels; determination of contaminants in high-purity Al; and analysis of
superconducting materials for trace contaminants.(Fredeen, 2004)
Organics
Analysis of organic solutions by ICP-OES is important not only for
analyzing organic-based materials such as petroleum products but also for
a wide variety of other applications. For many of the analyses from the
other application categories discussed in this chapter, it is necessary to
perform sample preparation in which the final form of the analytic is
contained in an organic solvent. For example, solvent extraction for the
purpose of pre concentrating analytic species is a widely used
sample preparation technique for ICP-OES. Also considered under the
category of organic analyses would be introduction of organic effluents
and vapors from high performance liquid chromatography (HPLC) and
gas chromatography (GC) separations. While analysis of organics by
ICP-OES is generally straightforward, there are often some special
requirements. For example, introduction of organic matrices into
the ICP discharge usually requires that the ICP be operated at a higher RF
33
power than is normally required for aqueous samples. Sometimes it is
also necessary to use special nebulizers or torch injector tubes. When a
peristaltic pump is used to transport the sample to the nebulizer, special
consideration must be made regarding the chemical resistance of the
pump tubing used with respect to the organic solvent The analysis of
used lubricating oils for trace metal content is one of the more popular
applications for organics analysis by ICP-OES. Some other applications
include analysis of solvent-extracted geological materials for trace
elemental composition; determination of lead in gasoline; determination
of Cu, Fe, Ni, P, Si and V in cooking oils; analysis of organophosphates
for trace contaminants; and determination of major and trace elements in
antifreeze. (Fredeen, 2004)
2-7 Cosmetics :
Cosmetics are products applied to the body for the purpose of
beautifying, cleansing or improving appearance and enhancing attractive
features . They include a range of products such as tooth paste, shampoo,
conditioners, mascara, after shave lotion, styling gel, creams, lotions,
powders, perfumes, lipsticks, fingernail and toenail polish, eye and facial
make-ups, permanent waves, hair colours, hair sprays and deodorants.
They are articles intended to be rubbed, poured, sprinkled or sprayed on,
introduced into, or otherwise applied to the human body or any part
thereof for promoting attractiveness, cleansing, beautifying or altering the
appearance without affecting the body structure or functions.
The use of cosmetics dates back to around 10000BC .
Many of the present-day beauty rituals such as hair coloration, depilation
and exfoliation find their roots in ancient Egyptian culture . In the olden
days, the Romans, Greeks and Egyptians used various cosmetics which
contain white Lead and Mercury . Scented oils and ointments were used
to clean and soften the skin and mask body odour while dyes and natural
paints were used to colour the face, mainly for ceremonial and religious
occasions . According to, there is a common ancient belief that eye
makeup could ward off evil spirits and improve sight. The use of
cosmetics today cuts across people of all spheres of life. Facial cosmetics
are a necessity in the entertainment industry where hundreds of new
recruits are daily added to the huge number of cosmetics users with little

34
or no knowledge of their side effects. Some of the cosmetics used contain
different compounds like zincite, cuprite goethite, amorphous carbon,
elemental silicon or talc hematite, minimum organic compounds, and
even heavy metals such as Lead . Black Antimony which was used as
eyeliner in ancient Egypt . Black Antimony, applied to the eyes as
ground, fine crystalline powder with the aid of thin stick, is used to draw
a straight line on the eyes. The application of these mineral locally to the
eyes is believed to serve as treatment of ophthalmologic infections and as
an eye cleanser . The use of the local eye liner has been reported as a
suspected source of Lead exposure to the ocular system in children and
adults .
Cosmetic products contain varieties of different harmful or toxic
chemicals capable of attacking the skin. Manufacturers of skincare
products do not only use synthetic ingredients but also natural products,
such as Shea butter, Rose extract, and cane sugar which are sustainable,
cheap and less harmful to the consumer .(Udebuani et al., 2015)
2-7-1TYPES of cosmetics:
The general category of cosmetics includes skin care products. These are
creams and lotions to moisturize the face and body, sunscreens to protect
the skin from damaging UV radiation, and treatment products to repair or
hide skin imperfections (acne, wrinkles, dark circles under eyes, etc.).
Cosmetics can be described by the form of the product, as well as the area
for application. Cosmetics can be liquid or cream emulsions; powders,
both pressed and loose; dispersions; and anhydrous creams or sticks . The
various forms of makeup include: Lipstick, lip gloss, lip liner, lip
plumper, lip balm, lip luster, lip conditioner and lip boosters; Foundation,
used to color the face and conceal flaws to produce an impression of
health and youth, usually a liquid, cream, powder or mousse; Powder, or
face illuminator used to set the foundation, giving a matte finish; Rouge,
blush or blusher cheek stain used to color the cheeks and emphasize the
cheekbones that comes in powder, cream and gel forms; Bronzer, used to
create a more tanned or sun-kissed look; Mascara and lash extender, lash
conditioner used to enhance the eyelashes can be of different colors and
even waterproof; Eye liner and eye shadow, eye shimmer and glitter eye
pencils as well as different color pencils used to color and emphasize the
eyelids (larger eyes are a sign of youth); Eyebrow pencils, creams, waxes,

35
gels and powders are used to fill in and define the brows; Nail polish,
used to color the fingernails and toenails; Concealer, a type of thick
opaque makeup used to cover pimples, various spots and inconsistencies
in the skin .
The term "mineral makeup" applies to a category of face makeup,
including foundation, eye shadow, blush, and bronzer, made with loose,
dry mineral powders. These powders are often mixed with oil-water
emulsions. Lipsticks, liquid foundations, and other liquid cosmetics, as
well as compressed make ups such as eye shadow and blush in compacts,
are often called mineral makeup if they have the same primary
ingredients as dry mineral wakeups. However, liquid makeups must
contain preservatives and compressed makeups must contain binders,
which dry mineral makeups do not. Mineral makeup usually does not
contain synthetic fragrances, preservatives, parabens, mineral oil, and
chemical dyes. For this reason, dermatologists may consider mineral
makeup to be gentler to the skin than makeup that contains those
ingredients . Some minerals are nacreous or pearlescent, giving the skin a
shining or sparking appearance. One example is Bi oxychloride .(Ben-
Nun)

36
2-8 Literature Review:
2-8-1 ICP – OES Investigations of Heavy Metal Contents in
Cosmetic Products:
Rajagopal Mayildurai1, Alagunambi Ramasubbu2*, Nanjan Velmani2
In 2015 used Inductively Plasma Optical Emission Spectroscopy In a
variety of chemicals especially heavy metals used in cosmetics as
ingredients has different health effects. The level of heavy elements
present viz., arsenic, cadmium, chromium, mercury, nickel, lead, cobalt,
copper and zinc in twenty different cosmetic samples. All the samples
were digested by suitable protocols and the composition of heavy metals
analyzed, quantified on an ICP-OES.
Since the dawn of civilization, cosmetics have constituted a part of
routine body care by all set of people1. Past few decades has witnessed a
rapid growth in cosmetic industries, through production of various types
of cosmetics which are needed for care and beautification of skin, hair,
nails, teeth and body2. Although beauty consciousness of people has set
the demand for cosmetics in market, the side effects as well as health
consciousness of people have attracted the health practiticians and
researchers to find out the probable reason for unusual side effects3.
Heavy metal contamination is one of the most important reasons
addressing problem. Heavy metals
like Lead, Arsenic, Chromium, Nickel, Mercury and Cadmium are
common contaminants in various cosmetic products4. This paper focuses
on the analysis of heavy metals using Inductively Coupled Plasma-
Optical Emission Spectroscopy (ICP-OES) used in cosmetics and its
adverse effects.(Mayildurai et al., 2015)

37
2-8-2 Inductively Coupled Plasma –Optical Emission
Spectroscopy: A Review:
Somsubhra Ghosh1*, V. Laxmi Prasanna1, B. Sowjanya1, P. Srivani1,
M. Alagaraja1, Dr. David Banji .In 2013 Reviewed Inductively Coupled
Plasma –Optical Emission Spectroscopy is the chief experimental
technique of atomic and molecular physics and involves determining the
energy states of atoms or molecules by looking at the light absorbed or
emitted when they change states. Measuring the frequency of light
absorbed or emitted which is determined by the energy difference
between the two states, can provide a sensitive probe of interactions
which perturb those energy states. Among those in this review we
revealed that the principle, instrumentation and applications of
inductively coupled plasma optical emission spectroscopy. In this sample
is usually transported into the instrument as a stream of liquid sample.
Inside the instrument, the liquid is converted into an aerosol through a
process known as nebulisation. The sample aerosol is then transported to
the plasma where it is desolvated, vaporized, atomized, and excited
and/or ionized by the plasma. The excited atoms and ions emit their
characteristic radiation which is collected by a device that sorts the
radiation by wavelength. The radiation is detected and turned into
electronic signals that are converted into concentration information for
the analyst.
2-8-3 Determination of Residual Carbon by Inductively-
Coupled Plasma Optical Emission Spectrometry with Axial
and Radial View Configurations:
In this work it was evaluated the performance of inductively-coupled
plasma optical emission spectrometers (ICP-OESs) with axial and radial
view configurations for residual carbon content (RCC) determination.

38
The effects of carbon compound source (urea, l-cysteine, and glucose),
sample medium, and internal standards on RCC determination were
systematically evaluated. All measurements were carried out with two
ICP spectrometers using the carbon atomic emission lines: 247.857 and
193.025 nm. The results obtained using axial and radial configurations
showed that both the carbon source and the sample medium did not affect
significantly the emission intensities. The sample medium only caused
drastic influence when H2SO4 was employed probably due to transport
interference that can be corrected employing Y as internal standard. The
sensitivity attained using axial view ICP-OES was 20-fold better than that
reached using radial view ICP-OES based on the slopes of the analytical
curves at the most sensitive wavelength (193.025 nm). Using radial and
axial ICP-OESs, high concentrations of Fe (>100 mg l−1) interfered at
247.857 nm wavelength. An addition-recovery experiment was made by
adding urea to an acid-digested sample and all recoveries were in the
100±5% range for axial and radial measurements. At this wavelength,
R.S.D. <2.0% (n=10) and detection limits of 33 and 34 μg ml−1 C, were
measured for ICP-OESs with radial and axial configurations,
respectively. Biological samples were acid-digested using a closed-vessel
microwave-assisted procedure and RCC was determined using both ICP-
OES configurations.(Gouveia et al., 2001)
2-8-4 Inductively Coupled Plasma Optical-Emission
Spectroscopy Determination of Major and Minor Elements
in Vinegar:
Arzu AKPINAR-BAYIZIT1), Murat Ali TURAN2), Lutfiye YILMAZ-
ERSAN1), Nilgun TABAN3) in 2010 used Inductively Coupled Plasma
Optical-Emission Spectroscopy for Determination of Major and Minor
Elements in Vinegar Minerals play an important role in human nutrition,

39
because they are not synthesized in the body. They can be divided into
the following groups: macro-minerals (major elements), such as sodium,
potassium, magnesium, calcium and phosphorus, micro-minerals
(minor/trace elements) such as iron, copper, zinc and manganese; and
ultra-trace elements, such as aluminum, bromine and cadmium. Some
elements such as lead, cadmium and mercury, can produce toxic effects at
high concentrations. Therefore, in recent years, there has been increasing
interest in evaluating the macro- and micro- elements in a variety of food
samples.
This study characterizes the mineral content of vinegar samples. The
concentrations of Na, K, Ca, Mg and P (major elements) as well as Fe,
Mn, Sn, Cu, Ni, Zn, Pb and Cd (minor elements) were determined in 35
commercial vinegar samples using inductively coupled plasma optical-
emission spectrometry (ICP-OES). The elements with the highest
concentrations were K, Na, Ca, Mg and P. The concentrations of heavy
metals in the vinegar samples, including Cd, Ni, Sn and Pb, were n ot
considered a health risk.(Akpinar-Bayizit et al., 2010)

41
Chapter three
Material and methods
3-1Materials:
Some 0.5% cosmetic powder was taken from the sample and burned at a
temperature of 800 ° C for three hours and then dissolved in 10 mL of
10% HCl. The sample was administered in a 500 mL flask and was
supplemented by volume with deionized water. The sample was injected
into the device.
A total of nineteen cosmetic samples marketed in Khartoum(Sudan )
under different commercial names and extensively used by Sudanese
women for beautification purposes were purchased from the local market-
Khartoum, Sudan.
3-2Instrumentation:
In inductively coupled plasma-optical emission spectrometry, the sample
is usually transported into the instrument as a stream of liquid sample.
Inside the instrument, the liquid is converted into an aerosol through a
process known as nebulisation. The sample aerosol is then transported to
the plasma where it is desolvated, vaporized, atomized, and excited
and/or ionized by the plasma. The excited atoms and ions emit their
characteristic radiation which is collected by a device that sorts the
radiation by wavelength. The radiation is detected and turned into
electronic signals that are converted into concentration information for
the analyst. A representation of the layout of a typical ICP-OES
instrument is shown in fig(3-1)

41
Fig(3-1): Shows the major components and layout of a
typical ICP-OES instrument.
3-3the experimental setup:
3-3-1An Overview of ICP-OES Methodology:
Fig( 3-2) shows a flow chart for the steps in a typical ICP-OES analysis.
The first decision required in developing the methodology for an ICP-
OES analysis is which elements are to be determined in the sample. Much
of the subsequent methodology is based upon this first decision. Other
than making sure that the elements can be determined on the user’s
instrument, the selection of elements is determined by the user’s own
requirements for trace elemental analyses. Once that decision has been
made, the analyst’s goal is to determine the best way to carry out the
analysis.
The first step in an analysis is to prepare the samples and standards for
introduction to the ICP. This step depends on the physical and chemical
characteristics of the samples and runs the gamut from simple dilution to
a complex series of chemical reactions and other preparation steps. The
next step in the analysis concerns the sample introduction method and
hardware to be used. For most ICP-OES analyses, the standard sample
introduction system provided with the instrument will suffice.
An example of when a nonstandard system might be used is when the
solutions to be analyzed contain high levels of particulates or dissolved
solids.

42
The next step in the development of an analysis methodology is to
program the instrument, using the computer software provided with the
instrument, to perform the data collection and processing steps. To do
this, decisions must be made concerning the operating conditions,
wavelength selection, instrument calibration, emission measurement, and
the actual sample analysis. For many analyses, the default conditions
recommended by the instrument manufacturer will provide satisfactory
results.
Before making analytical measurements using the instrument, the analyst
should take the necessary steps to determine that the instrument is set up
and functioning properly. Valuable time and effort, not to mention
irreplaceable samples, may be wasted by running an analysis on an
instrument that is not set up properly.
Appendix contains some information regarding instrument maintenance
and performance verification. The analyst may find this information
helpful in assuring that an ICP-OES instrument will provide acceptable
analytical results.
Once the samples and standards are prepared, the hardware is set up
properly, and the computer is programmed, the analysis may begin. The
analyst usually starts by introducing the first standard solution to the
plasma and pressing a key on the computer.

43
Fig( 3-2). Flow chart showing the methodology for a typical
ICP-OES analysis
Assuming everything is found to be working properly, the analyst
continues by introducing further standards (if used) and a blank solution
to complete the calibration of the instrument. If no other calibrations or
checks are required, the calibration is followed by introduction of
samples. Intertwined throughout the analysis may be various solutions
used for quality control purposes. Once the analysis of samples is
completed, the results can be tabulated and reported as One of the biggest
advantages of the general simplicity of ICP-OES methodology is that
once a method is developed, the ICP-OES technique lends itself very well
to the use of automation. Even for sample preparation, there are a few
automated sample preparation systems available. But once analysis
begins, relatively little user interaction is generally required. In fact,
automation techniques have been developed to the point that the analyst
can simply load the unprocessed samples onto a tray, press a few keys on

44
a computer keyboard, walk away from the instrument, and return to find
the analysis completed.
3-3-2ICP-OES Methodology:
For most ICP-OES analyses, the standard sample introduction system
provided with the instrument will be sufficient. The next step in the
development of an analysis methodology is to program the instrument,
using the computer software provided with the instrument, to perform the
data collection and processing steps. To do this, decisions must be made
concerning the operating conditions, wavelength selection, instrument
calibration, emission measurement, and the actual sample analysis. For
many analyses, the default conditions recommended by the instrument
manufacturer will provide satisfactory results. Once the samples and
standards are prepared, the hardware is set up properly, and the computer
is programmed, the analysis may begin. The analyst usually starts by
introducing the first standard solution to the plasma and pressing a key on
the computer. Assuming everything is found to be working properly, the
analyst continues by introducing further standards (if used) and a blank
solution to complete the calibration of the instrument. If no other
calibrations or checks are required, the calibration is followed by
introduction of samples. Once the analysis of samples is completed, the
results can be tabulated and reported as necessary.
3-3-3Sample introduction:
Nebulizers:
Nebulizers are devices that convert a liquid into an aerosol that can be
transported to the plasma. The nebulization process is one of the critical
steps in ICP-OES. The ideal sample introduction system would be one
that delivers all of the sample to the plasma in a form that the plasma
could reproducibly desolvate, vaporize, atomize and ionize, and excite.
Because only small droplets are useful in the ICP, the ability to produce
small droplets for a wide variety of samples largely determines the utility
of a nebulizer for ICP-OES.
Many forces can be used to break up a liquid into an aerosol; however,
only two have been used successfully with an ICP, pneumatic forces and
ultrasonic mechanical forces .
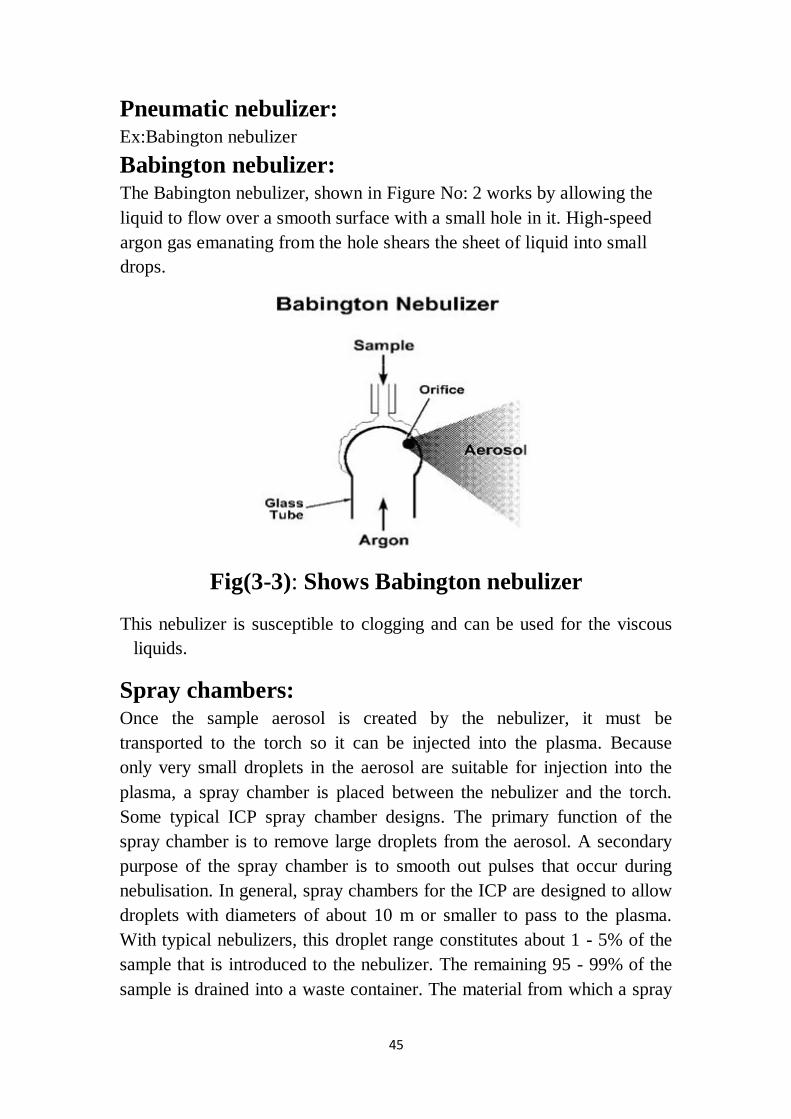
45
Pneumatic nebulizer: Ex:Babington nebulizer
Babington nebulizer: The Babington nebulizer, shown in Figure No: 2 works by allowing the
liquid to flow over a smooth surface with a small hole in it. High-speed
argon gas emanating from the hole shears the sheet of liquid into small
drops.
Fig(3-3): Shows Babington nebulizer
This nebulizer is susceptible to clogging and can be used for the viscous
liquids.
Spray chambers: Once the sample aerosol is created by the nebulizer, it must be
transported to the torch so it can be injected into the plasma. Because
only very small droplets in the aerosol are suitable for injection into the
plasma, a spray chamber is placed between the nebulizer and the torch.
Some typical ICP spray chamber designs. The primary function of the
spray chamber is to remove large droplets from the aerosol. A secondary
purpose of the spray chamber is to smooth out pulses that occur during
nebulisation. In general, spray chambers for the ICP are designed to allow
droplets with diameters of about 10 m or smaller to pass to the plasma.
With typical nebulizers, this droplet range constitutes about 1 - 5% of the
sample that is introduced to the nebulizer. The remaining 95 - 99% of the
sample is drained into a waste container. The material from which a spray
46
chamber is constructed can be an important characteristic of a spray
chamber. Spray chambers made from corrosion-resistant materials allow
to introduce samples containing hydrofluoric acid which could damage
glass spray chambers.
Drains: The drain carries excess sample from the spray chamber to a waste
container can have an impact on the performance of the ICP instrument.
Besides carrying away excess sample, the drain system provides the
backpressure necessary to force the sample aerosol-carrying nebulizer gas
flow through the torch’s injector tube and into the plasma discharge. If
the drain system does not drain evenly or if it allows bubbles to pass
through it, the injection of sample into the plasma may be disrupted and
noisy emission signals can result.
Drains for ICP-OES sample introduction systems come in many forms
loops, blocks, U-tubes, or even tubing connected to a peristaltic pump.
For proper performance, it is important to keep the liquid level within the
drain system at the recommended position. Also, when introducing
organic-based samples into the ICP, it may be necessary to use drain
tubing designated for use with organic solvents.(Ghosh et al., 2013)
3-4the procedure:
3-4-1Wavelength Selection:
Wavelength Selection The selection of wavelengths for measurement of
the emission from the analytic elements is done using several criteria.
First of all, the wavelengths must be accessible with the instrument being
used. In the case of classical PMT-based polychromatic ICP-OES
instruments, the wavelength selection may be compromised because of
space restrictions, i.e., the juxtaposition of exit slits and PMTs, within the
spectrometer. For instruments whose spectrometers do not have vacuum
and/or purging capabilities, wavelengths below 190 nm cannot be used.
The second criterion for selection of wavelengths is that the wavelengths
selected be appropriate for the concentrations of the elements to be
determined. When the analyze concentration falls outside the working
range of an emission line, a different emission line should be used. For
example, if the manganese concentration in a sample is expected to be

47
about 200 mg/L, then the most sensitive emission line, at 257.610 nm,
should not be used since the upper end of its working range is about
50 mg/L. In this case, a less sensitive line, such as the line at 294.920 nm,
would be more appropriate.
The final criterion is that the wavelengths be free from spectral
interferences.
Because the ICP is so proficient at causing almost any element to emit
numerous emission lines, this criterion is sometimes difficult to meet.
When freedom from spectral interferences is not possible, lines whose
emission intensities can be corrected for spectral interferences should be
used. Because correction of spectral interferences is such an important
part of ICP-OES methodology.
3-4-2Emission Measurement:
Emission Measurement The method used for the measurement of
emission is usually built into the instrument itself and cannot be easily
modified by the user. Knowing how the instrument measures emission
can be important and may help the analyst to avoid certain problems that
may be encountered. The most common two ways to measure emission
are to scan the spectrometer over a small wavelength region surrounding
the expected emission lines, making a measurement at each step, or to set
the spectrometer to a specific wavelength and make measurements only at
that wavelength.
With advanced detector methodology, hundreds of ICP-OES emission
wavelengths with their associated background are obtained
simultaneously. Not only does this permit background correction and
spectral interference corrections to be easily applied, the corrections may
be made at a later time than the actual analyses which is called post-
processing of the data. Because all the spectral information is stored,it is
even possible to apply the use of internal standardization at some future
time if the internal standard lines were included in the method.
While the method of emission measurement is usually fixed for a given
instrument, there are certain parameters associated with the emission
measurement that can usually be modified to fit the analyst’s
needs.(Fredeen, 2004)

48
3-4-3production of emission:
Torches: the torches contain three concentric tubes for argon flow and
aerosol injection. The spacing between the two outer tubes is kept narrow
so that the gas introduced between them emerges at high velocity. This
outside chamber is also designed to make the gas spiral tangentially
around the chamber as it proceeds upward. One of the functions of this
gas is to keep the quartz walls of the torch cool and thus this gas flow was
originally called the coolant flow or plasma flow but is now called the
"outer" gas flow. For argon ICPs, the outer gas flow is usually about 7 -
15 litters per minute. The chamber between the outer flow and the inner
flow sends gas directly under the plasma toroid. This flow keeps the
plasma discharge away from the intermediate and injector tubes and
makes sample aerosol introduction into the plasma easier. In normal
operation of the torch, this flow, formerly called the auxiliary flow but
now the intermediate gas flow, is about 1.0 L/min. The intermediate flow
is usually introduced to reduce carbon formation on the tip of the injector
tube when organic samples are being analyzed.
At present, the most popular torches are of the demountable type. These
torches can be taken apart so that the tubes can be modified or replaced
without replacing the entire torch.
The main advantages of the demountable torch lie in the lower torch
replacement costs and the ability to use a variety of injector tubes. Such
injectors include corrosion resistant ceramic injectors, narrow-bore
injectors for analyses involving organic solvents, and wide-bore injectors
for introducing samples with high dissolved solids contents.
Radio Frequency Generators: The radio frequency (RF) generator is
the device that provides the power for the generation and sustainment of
the plasma discharge. This power ranging from about 700 to 1500 watts,
is transferred to the plasma gas through a load coil surrounding the top of
the torch. The load coil, which acts as an antenna to transfer the RF
power to the plasma, is usually made from copper tubing and is cooled by
water or gas during operation. Most RF generators used for ICP-OES
operate at a frequency between 27 and 56 MHz. The specific frequency
used for an ICP-OES instrument is partially determined by those
frequencies that the U. S. Federal Communications Commission (FCC)
and similar agencies worldwide have designated for scientific and
industrial use. Earlier most of the ICP generators were operated at 27.12
MHz. However, an increasing number of instruments now operate at
40.68 MHz because of improvements in coupling efficiency and

49
reductions in background emission intensity realized at this frequency.
Frequencies greater than 40 MHz also have been used but have not been
as successful commercially.
There are two general types of RF generators used in ICP instruments.
Crystal-controlled generators use a piezoelectric quartz crystal to produce
an RF oscillating signal that is amplified by the generator.
(Ghosh et al., 2013)
3-4-4 Computers and Processors :
An important part of any ICP-OES instrument is the computer control
incorporated into the instrument. The majority of automated functions of
an ICP-OES instrument are directly controlled by an on-board computer.
At the simplest level of multi element ICP-OES instrumentation, a
computer is needed to handle the massive amounts of data that such an
instrument generates. While virtually every commercial ICP-OES
instrument available today uses some type of computer to control the
spectrometer and to collect, manipulate, and report analytical data, the
amount of computer control over other functions of the instrument varies
widely from model to model.
3-4-5 Software
ICP-OES instrument would be that it could prepare the standards and
samples, develop the analytical method, analyze the samples, report the
results, and make decisions based on those results all from a single
keystroke.
The objective of a good software package is not only to control the
automated features of the instrument during collection of analytical data
but to simplify the overall operation of the instrument. Areas in which
this is important include not only running an analysis but developing
analytical methods and reporting results. The methods development task
involves selecting proper operating parameters for an analysis, such as
wavelengths, PMT voltages, background correction points, and standards
concentrations. The ability to view spectral data displayed graphically
with a minimum of effort is indispensable during the selection of these
parameters.(Ghosh et al., 2013)

51
Chapter four
Results and discussion
4-1 Introduction :
Cosmetics industry has grown rapidly over the past decades . Cosmetics
refer to those products used by humans to attain attractive features i.e.
they are products used for beautification.(Amasa However, beside the
expansion in cosmetics market ,which is influence by continual
consumers demand , safety in cosmetics has recently become a major
concern et al., 2012).(Draelos, 2012)In cosmetics , the most common
ingredients are: fragrances , preservatives, ultraviolet absorbers,
humectants, emulsifiers and a crylates. (Hamilton and de Gannes,
2011)Such additives are risk factors in many adverse reactions. Some of
these fragrances and preservatives are toxic and overexposure is a risk
factor in mutation, cancer and endocrine disruption.(Amasa et al., 2012)
Beside fragrances and preservatives , heavy metals are sometimes
incorporated to cosmetics .Some of these metals can cause potential
damage to the human internal organs. Heavy metals are also associated
with various mammalian disorders like respiratory diseases, cancer ,
kidney failure and intellectual retardation.(Ayenimo et al., 2010)
It is known that the presence of heavy metals as impurities in cosmetics is
almost unavoidable due to their ubiquitous nature.(Al-Dayel et al.,
2011)Some heavy metal are incorporated in some cosmetics due to their
vital fuction.(Volpe et al., 2012) Among heavy metals : lead , mercury,
cadmim , nickel, copper and chromium are frequently found in cosmetics.
Though , heavy metals occur in cosmetics in trace amount , but due to
their long half life, they act as cumulative poison.
In continuation of our interest in safety of cosmetics used by Sudanese
women, this study was aimed to analyze some cosmetic articles marketed
in Sudan for heavy metal content.
4-2 The Result
In this study a total of nineteen samples of moisturizers marketed in
Khartoum and used by Sudanese women for improving appearance have
been analyzed by inductively coupled plasma/optical emission
spectroscopy(ICP/OES) for heavy metals content. Such metals could be
absorbed through the skin causing serious adverse reactions.
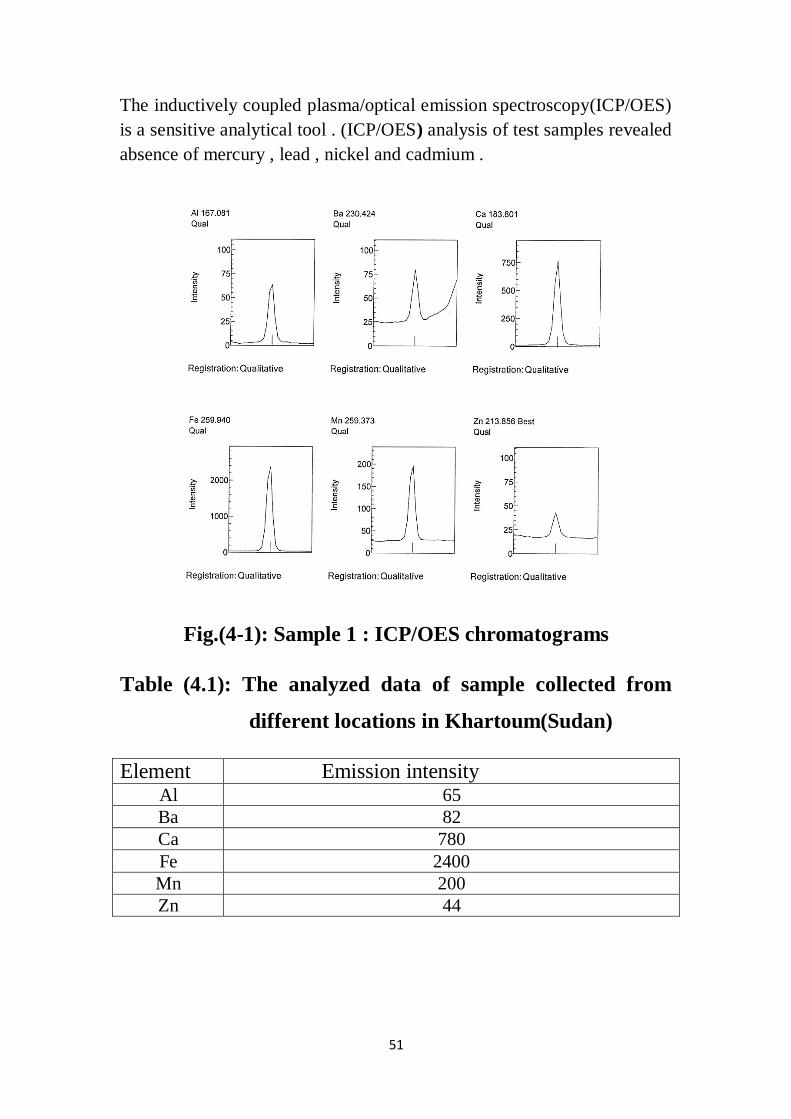
51
The inductively coupled plasma/optical emission spectroscopy(ICP/OES)
is a sensitive analytical tool . (ICP/OES) analysis of test samples revealed
absence of mercury , lead , nickel and cadmium .
Fig.(4-1): Sample 1 : ICP/OES chromatograms
Table (4.1): The analyzed data of sample collected from
different locations in Khartoum(Sudan)
Emission intensity Element 65 Al
82 Ba
780 Ca
2400 Fe
200 Mn
44 Zn

52
Fig.(4-2): Sample 2 : ICP/OES chromatograms
Table (4.2): The analyzed data of sample collected from
different locations in Khartoum(Sudan)
Emission intensity Element 59 Ba
580 Ca
1470 Fe
122 Mn
82 Cu
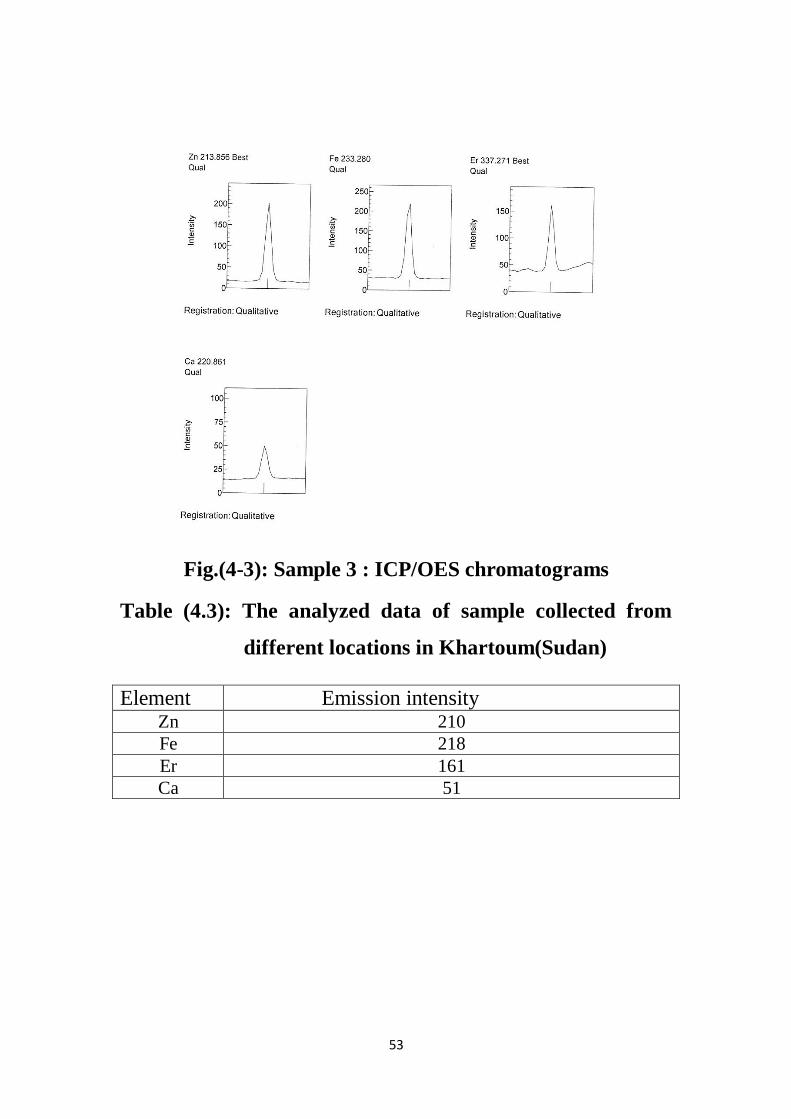
53
Fig.(4-3): Sample 3 : ICP/OES chromatograms
Table (4.3): The analyzed data of sample collected from
different locations in Khartoum(Sudan)
Emission intensity Element 210 Zn
218 Fe
161 Er
51 Ca

54
Fig.(4-4): Sample 4 : ICP/OES chromatograms
Table (4.4): The analyzed data of sample collected from
different locations in Khartoum(Sudan)
Emission intensity Element 46 Al
348 Ca
41 Ba
77 Cu
119 Mn

55
Fig.(4-5): Sample 5 : ICP/OES chromatograms
Table (4.5): The analyzed data of sample collected from
different locations in Khartoum(Sudan)
Emission intensity Element 62 Ca
60 B
5800 Fe

56
Fig.(4-6): Sample 6 : ICP/OES chromatograms
Table (4.6): The analyzed data of sample collected from
different locations in Khartoum(Sudan)
Emission intensity Element 332 Mn
65 Ca
7400 Fe
45 Zn

57
Fig.(4-7): Sample 7 : ICP/OES chromatograms
Table (4.7): The analyzed data of sample collected from
different locations in Khartoum(Sudan)
Emission intensity Element 600 Mn
470 Zn
320 Fe
2100 Ca
88 Er
47 Al

58
Fig.(4-8): Sample 8 : ICP/OES chromatograms
Table (4.8): The analyzed data of sample collected from
different locations in Khartoum(Sudan)
Emission intensity Element 244 Zn
1900 Fe
740 Ca
58 Al
45 Ba
280 Mn

59
Fig.(4-9): Sample 9 : ICP/OES chromatograms
Table (4.9): The analyzed data of sample collected from
different locations in Khartoum(Sudan)
Emission intensity Element 14400 Zn
980 Ca
380 Ba
1340 Fe

61
Fig.(4-10): Sample 10 : ICP/OES chromatograms
Table (4.10): The analyzed data of sample collected from
different locations in Khartoum(Sudan)
Emission intensity Element 4200 Zn
360 Ca
24 Al
30 B
68 Er

61
Fig.(4-11): Sample 11 : ICP/OES chromatograms
Table (4.11): The analyzed data of sample collected from
different locations in Khartoum(Sudan)
Emission intensity Element 730 Ca
292 Er
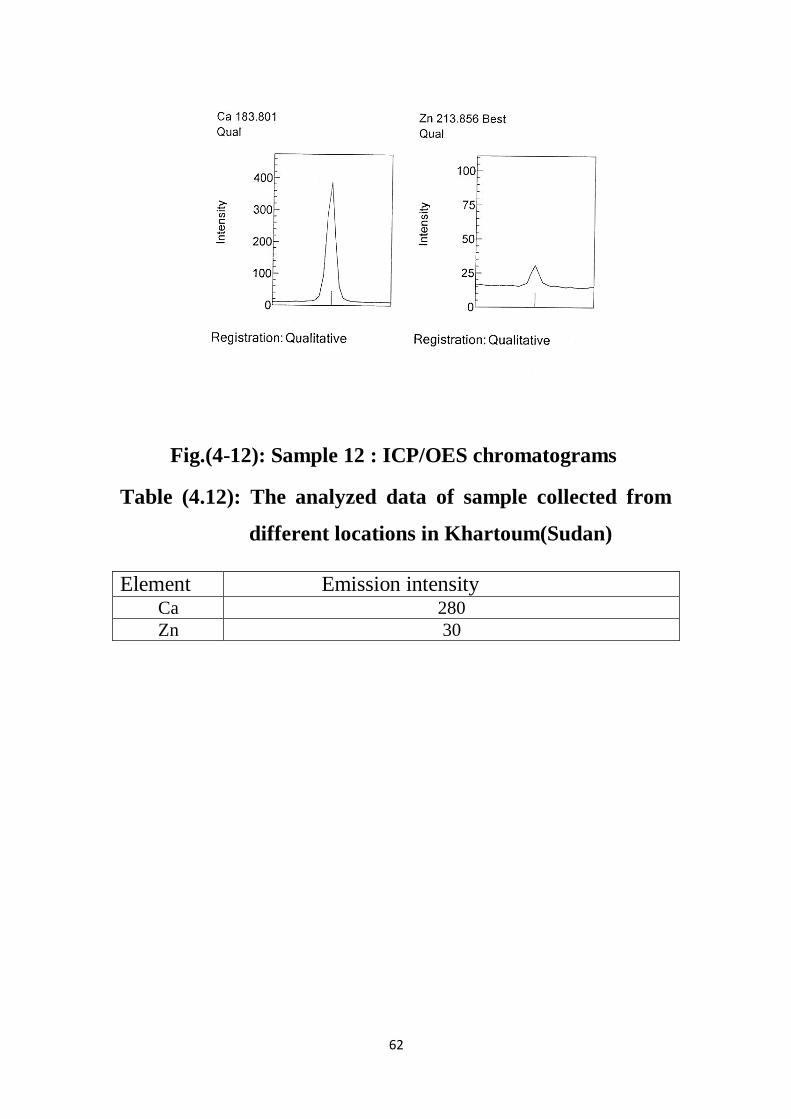
62
Fig.(4-12): Sample 12 : ICP/OES chromatograms
Table (4.12): The analyzed data of sample collected from
different locations in Khartoum(Sudan)
Emission intensity Element 280 Ca
30 Zn

63
Fig.(4-13): Sample 13 : ICP/OES chromatograms
Table (4.13): The analyzed data of sample collected from
different locations in Khartoum(Sudan)
Emission intensity Element 700 Ca
5100 Zn
45 Fe

64
Fig.(4-14): Sample 14 : ICP/OES chromatograms
Table (4.14): The analyzed data of sample collected from
different locations in Khartoum(Sudan)
Emission intensity Element 152 Ca
1400 Zn
48 Mn
320 Fe
256 Er
65 Al

65
Fig.(4-15): Sample 15 : ICP/OES chromatograms
Table (4.15): The analyzed data of sample collected from
different locations in Khartoum(Sudan)
Emission intensity Element 1200 Ca
256 Mn
1950 Fe
252 Er
102 Al

66
Fig.(4-16): Sample 16 : ICP/OES chromatograms
Table (4.16): The analyzed data of sample collected from
different locations in Khartoum(Sudan)
Emission intensity Element 750 Ca
150 Mn
540 Fe
150 Er
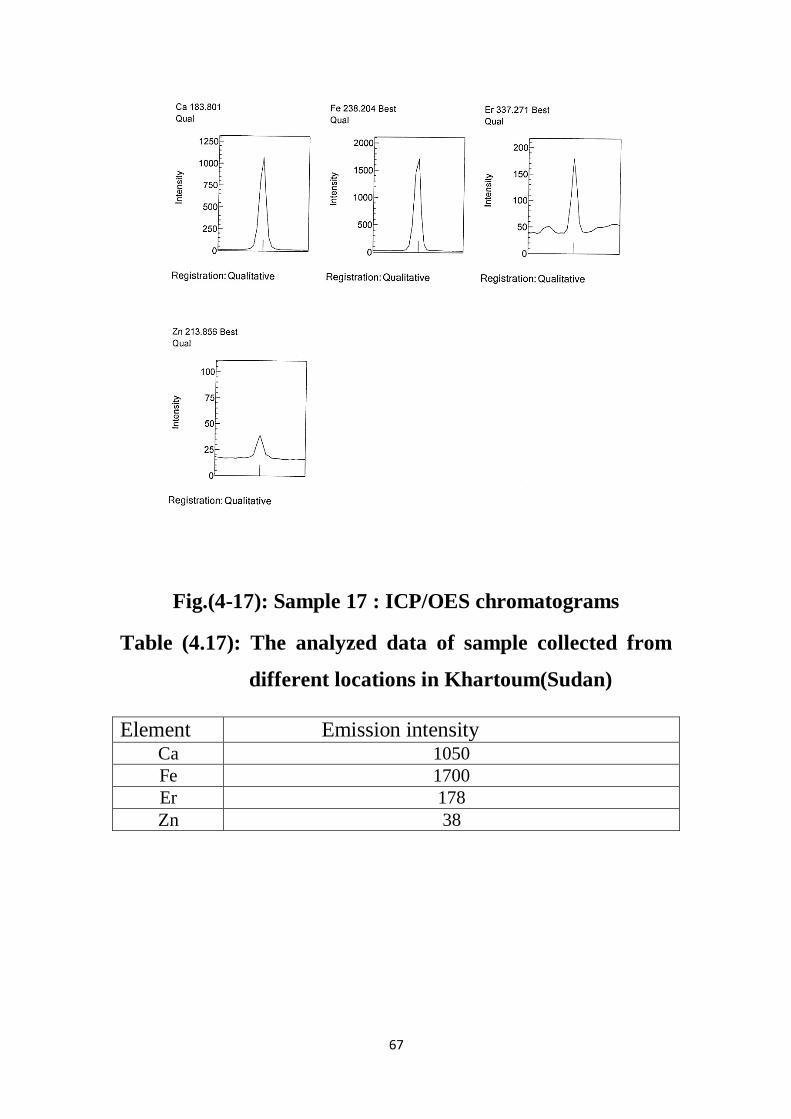
67
Fig.(4-17): Sample 17 : ICP/OES chromatograms
Table (4.17): The analyzed data of sample collected from
different locations in Khartoum(Sudan)
Emission intensity Element 1050 Ca
1700 Fe
178 Er
38 Zn

68
Fig.(4-18): Sample 18 : ICP/OES chromatograms
Table (4.18): The analyzed data of sample collected from
different locations in Khartoum(Sudan)
Emission intensity Element 680 Ca
1500 Fe
380 Er
1800 Zn

69
Fig.(4-19): Sample 19 : ICP/OES chromatograms
Table (4.19): The analyzed data of sample collected from
different locations in Khartoum(Sudan)
Emission intensity Element 698 Ca
1560 Fe
390 Er
1800 Mn
126 Zn

71
4-3 Analysis of the results:
4-3-1 The result of ICP/OES Analysis of Some Conditioners
Marketed in Sudan for Heavy Metal Content:
In this study 3 cosmetic samples marketed in Khartoum(Sudan) as
conditioners and used extensively by young Sudanese women for
improving appearance have been analyzed for heavy metals content using
the inductively coupled plasma/optical emission spectroscopy(ICP/OES) .
Such heavy metals are classified as cumulative poison.
The inductively coupled plasma/optical emission spectroscopy(ICP/OES)
is a sensitive analytical tool . (ICP/OES) analysis of test samples revealed
absence of mercury , lead , nickel and cadmium . However it showed that
a common metal in test samples is calcium. Samples 1 and 2 contained
iron. Barium , manganese and copper appeared only in sample 1. Boron
appeared only in sample 2 ,while europium appeared only in 3 (see Table
20 and Figures 20-22).
Fig.(4-20): Analysis Sample 1 : ICP/OES
chromatograms

71
Fig.(4-21): Analysis Sample 2 : ICP/OES
chromatograms
Fig.(4-22): Analysis Sample 3 : ICP/OES
chromatograms

72
Table 20: Heavy metals in test analysis samples
Heavy metal
Sample No.
- - Cu Mn Fe Ca Ba 1
- B - - Fe Ca - 2
Er - - - - Ca - 3
4-3-2 The result ICP/OES Analysis of Some
Moisturizers Marketed in Sudan for Heavy Metal Content
:
In this study a total of four samples of moisturizers marketed in
Khartoum and used by Sudanese women for improving appearance have
been analyzed by inductively coupled plasma/optical emission
spectroscopy(ICP/OES) for heavy metals content. Such metals could be
absorbed through the skin causing serious adverse reactions.
The inductively coupled plasma/optical emission
spectroscopy(ICP/OES) is a powerful analytical tool. (ICP/OES) analysis
of test samples revealed absence of mercury , lead , nickel and cadmium .
However it showed that common heavy metals in test samples are: zinc
and calcium. whereas iron is common in samples 1,2 and 3.Samples 1
and 3 contained barium , while samples 2 and 3 contained manganese.
Aluminum appeared only in sample 3(see Table 21 and Figures 23-26).

73
Fig.(4-23): Analysis Sample 1 ICP/OES
chromatograms
Fig.(4-24): Analysis Sample 2 ICP/OES chromatograms

74
Fig.(4-25): Analysis Sample 3 ICP/OES chromatograms
Fig.(4-26): Analysis Sample 4 ICP/OES chromatograms

75
Table 21: Heavy metals in test analysis samples
Sample No.
1 Zn Fe Ba Ca - -
2 Zn Fe - Ca Mn -
3 Zn Fe Ba Ca Mn Al
4 Zn - - Ca - -

76
4-4 Discussion:
The health hazards associated with heavy metal-containing cosmetics
have been outlined. The accumulation of heavy metals in human body is
a risk factor in cancer, reproductive disorders, cardiovascular diseases
and kidney failure. Heavy metals can cause vomiting, nausea, brittle hair,
lung damage, headache and contact dermatitis. They could be absorbed
through the skin and over-exposure can cause serious adverse reactions.
The health hazards associated with heavy metal-containing cosmetics
have been outlined.(Popoola et al., 2013) It is known that the
accumulation of heavy metals in human body is a risk factor in
reproductive disorders, cardiovascular diseases, cancer, kidney and liver
damage.(Sainio et al., 2000) Cadmium, lead, mercury and nickel
implicated in some cosmetics are classified as known carcinogenic
agents. They are absorbed via dermal contact and are stored in liver and
kidney. High levels of lead in human may cause severe contact
dermatitis.(Fisher et al., 2013) Lead is associated with increased blood –
lead level in women using leaded eye-powders. Lead overexposure is a
risk factor in menstrual irregularities, reduced fertility, and hormonal
changes. (Demtröder, 2015)Some cosmetics contain nickel . Nickel and
its alloys which are incorporated in some cosmetics are classified as
possible carcinogenic agents. On the other hand , mercury-containing
cosmetics may cause kidney damage . It has been reported that mercury
can reduce skin resistance towards microbial infections.
Europium is a soft metal possessing the lowest density among all
lanthanides . It is the most reactive rare earth element. Though, europium
salts could be mildly toxic by ingestion, the toxicity of europium has not
been fully investigated. (Kassem et al., 2016)
Copper is an essential trace element, but excessive intake of copper
is associated with gastrointestinal problems, anemia and allergic
dermatitis.(Ababneh et al., 2013) There is a limited data on the toxicity of
boron .The limited data on this topic has only been obtained from human
poisoning cases and toxicity studies on animals However , clinical
symptons of boron toxicity have been outlined.(Bakirdere et al., 2010)
Manganes toxicity is evidenced primarily in the central nervous system and in
lung tissue following inhalation exposure, cardiovascular and liver, as well as
reproductive and developmental.
77
Barium is an alkaline earth metal with wide industrial applications.
However, accumulation of barium in human body poses serious health
hazards including : pulmonary edema , respiratory paralysis, gastric
hemorrhages, cardiac failure and kidney damage. (Kravchenko et al.,
2014) Many reports addressed the adverse effects associated with
ingestion of aluminum in humans. The accmulation of this metal in the
body has been linked with Alzheimer and Parkinsson diseases.(Shaw and
Tomljenovic, 2013) Also the effect of manganese in the central nervous
system has been studied. (Crossgrove and Zheng, 2004)
Iron is found in human body and it is an essential trace element . As far as
excessive amount of iron is avoided, this metal does not pose serious
adverse effects.(Martin and Griswold, 2009) Also zinc is an essential
trace element , but zinc over-exposure can maintain homeostasis .
(Plum et al., 2010)
Cadmium, lead, mercury and nickel implicated in some cosmetics
are absorbed via dermal contact and are stored in liver and kidney. Such
heavy metals are classified as known carcinogenic agents. Lead is a
constituent of leaded eye-powders and is associated with increased blood
–lead level in women using such products. Accmalation of lead in human
body is a risk factor in reduced fertility, menstrual irregularities and
hormonal changes. Some cosmetics contain nickel . Nickel and its alloys
are classified as possible carcinogenic agent. High levels of lead may
cause severe contact dermatitis.
In skin-lightening agents , mercury is a common ingredient. The major
adverse effect of mercury-containing cosmetics is kidney damage .This
metal can reduce skin resistance towards microbial infections.(Biebl and
Warshaw, 2006)

78
4-5 Conclusions:
The result of this work showed agreement with the standard sample
in National Institute of Standard and Technology (NIST). The results
showed that heavy metals by using inductively coupled plasma optical
emission spectroscopy (ICPOES)technique . were toxic even if were
present in small quantities. However, it is feared that the continued use of
cosmetics products contaminated with these heavy metals may cause
these minerals to enter the human body and cause harmful effects to
consumers over time. The widespread use of such metals should be
avoided until the situation is fully clarified.

79
4-6 Future work:
By the end of research we can suggest the following:
1-The usage of inductively coupled plasma optical emission spectroscopy
(ICPOES)technique to determine the concentration in cosmetics powder.
2-Applying of inductively coupled plasma optical emission spectroscopy
(ICPOES)technique in all production manufacture in Sudan
3- The usage of inductively coupled plasma optical emission spectroscopy
(ICPOES)technique to determine the Cadmium, lead, mercury and nickel.

81
Reference
ABABNEH, F. A., ABU-SBEIH, K. A. & AL-MOMANI, I. F. 2013. Evaluation of
allergenic metals and other trace elements in personal care products.
AL-DAYEL, O., HEFNE, J. & AL-AJYAN, T. 2011. Human exposure to heavy
metals from cosmetics. Oriental Journal of Chemistry, 27, 1-11.
AMASA, W., SANTIAGO, D., MEKONEN, S. & AMBELU, A. 2012. Are
cosmetics used in developing countries safe? Use and dermal irritation of body
care products in Jimma Town, Southwestern Ethiopia. Journal of toxicology,
2012.
AYENIMO, J., YUSUF, A., ADEKUNLE, A. & MAKINDE, O. 2010. Heavy metal
exposure from personal care products. Bulletin of environmental
contamination and toxicology, 84, 8-14.
BAKIRDERE, S., ORENAY, S. & KORKMAZ, M. 2010. Effect of boron on human
health. The Open Mineral Processing Journal, 3.
BIEBL, K. A. & WARSHAW, E. M. 2006. Allergic contact dermatitis to cosmetics.
Dermatologic clinics, 24, 215-32, vii.
CROSSGROVE, J. & ZHENG, W. 2004. Manganese toxicity upon overexposure.
NMR in Biomedicine: An International Journal Devoted to the Development
and Application of Magnetic Resonance In Vivo, 17, 544-553.
DEMTRöDER, W. 2015. Laser Spectroscopy 2 Experimental Techniques 5th Edition.
Springer-Verlag Berlin Heidelberg.
DRAELOS, Z. D. 2012. Are cosmetics safe? Journal of cosmetic dermatology, 11,
249-250.
FISHER, M., ARBUCKLE, T. E., WADE, M. & HAINES, D. A. 2013. Do
perfluoroalkyl substances affect metabolic function and plasma lipids?—
analysis of the 2007–2009, Canadian Health Measures Survey (CHMS) Cycle
1. Environmental research, 121, 95-103.
HAMILTON, T. & DE GANNES, G. C. 2011. Allergic contact dermatitis to
preservatives and fragrances in cosmetics. dermatitis, 14, 16.
KASSEM, M. A., ALTHAGAFI, I. I. & AHMED, S. A. 2016. Sensitive
Spectrofluorimetric Study of the Interaction between Europium (III) and 1, 2-
Phenylenebis (azan-1-yl-1-ylidene) bis (methan-1-yl-1-ylidene) diphenol
Schiff Base. Journal of fluorescence, 26, 2087-2093.
KRAVCHENKO, J., DARRAH, T. H., MILLER, R. K., LYERLY, H. K. &
VENGOSH, A. 2014. A review of the health impacts of barium from natural
and anthropogenic exposure. Environmental geochemistry and health, 36,
797-814.
MARTIN, S. & GRISWOLD, W. 2009. Human health effects of heavy metals.
Environmental Science and Technology briefs for citizens, 15, 1-6.
PLUM, L. M., RINK, L. & HAASE, H. 2010. The essential toxin: impact of zinc on
human health. International journal of environmental research and public
health, 7, 1342-1365.

81
POPOOLA, O., BISI-JOHNSON, M., ABIODUN, A. & IBEH, O. 2013. Heavy metal
content and antimicrobial activities of some naturally occurring facial
cosmetics in Nigeria. Ife Journal of Science, 15, 637-644.
SAINIO, E. L., JOLANKI, R., HAKALA, E. & KANERVA, L. 2000. Metals and
arsenic in eye shadows. Contact Dermatitis, 42, 5-10.
SHAW, C. & TOMLJENOVIC, L. 2013. Aluminum in the central nervous system
(CNS): toxicity in humans and animals, vaccine adjuvants, and autoimmunity.
Immunologic research, 56, 304-316.
VOLPE, M., NAZZARO, M., COPPOLA, R., RAPUANO, F. & AQUINO, R. 2012.
Determination and assessments of selected heavy metals in eye shadow
cosmetics from China, Italy, and USA. Microchemical Journal, 101, 65-69.
AKPINAR-BAYIZIT, A., TURAN, M. A., YILMAZ-ERSAN, L. & TABAN, N. 2010. Inductively
coupled plasma optical-emission spectroscopy determination of major and minor elements
in vinegar. Notulae Botanicae Horti Agrobotanici Cluj-Napoca, 38, 64-68.
ALFASSI, Z. B. 2012. Instrumental multi-element chemical analysis, Springer Science &
Business Media.
BEN-NUN, L. MEDICAL EFFECTS OF COSMETICS.
BITTENCOURT, J. A. 2004. Fundamentals of Plasma Physics Third Edition. Springer
Science+Business Media New York.
FRANCIS, J. 2003. Lecture Notes On Principles Of Plasma Procissing. Springer
Science+Business Media.
FREDEEN, C. B. B. A. K. J. 2004. Concepts, Instrumentation and Techniques in Inductively
Coupled Plasma Optical Emission Spectrometry. 2004 PerkinElmer, Inc.
GHOSH, S., PRASANNA, V. L., SOWJANYA, B., SRIVANI, P., ALAGARAJA, M. & BANJI, D. 2013.
Inductively coupled plasma–optical emission spectroscopy: a review. Asian J. Pharm.
Ana, 3, 24-33.
GOUVEIA, S. T., SILVA, F. V., COSTA, L. C. M., NOGUEIRA, A. R. A. & NóBREGA, J. A. 2001.
Determination of residual carbon by inductively-coupled plasma optical emission
spectrometry with axial and radial view configurations. Analytica Chimica Acta, 445,
269-275.
MALAINEY, M. E. 2011. Atomic and Emission Spectroscopy. A Consumer's Guide to
Archaeological Science. Springer.
MAYILDURAI, R., RAMASUBBU, A. & VELMANI, N. 2015. ICP—OES investigations of heavy
metal contents in cosmetic products. J. Pharm. Res, 9, 27-30.
UDEBUANI, A., EZEJI, E., OBASI, K. & NNOLI, M. 2015. Possible Health Implications Associated
with Cosmetics: A. Science, 3, 58-63.
DEMIRBAS, A. 2004. Combustion characteristics of different biomass fuels. Progress in
energy and combustion science, 30, 219-230.
GHOSH, S., PRASANNA, V. L., SOWJANYA, B., SRIVANI, P., ALAGARAJA, M. & BANJI, D. 2013.
Inductively coupled plasma–optical emission spectroscopy: a review. Asian J. Pharm.
Ana, 3, 24-33.

82
RYAN, R. M. & DECI, E. L. 2000. Self-determination theory and the facilitation of intrinsic
motivation, social development, and well-being. American psychologist, 55, 68. SAMUKAWA, S., HORI, M., RAUF, S., TACHIBANA, K., BRUGGEMAN, P., KROESEN, G.,
WHITEHEAD, J. C., MURPHY, A. B., GUTSOL, A. F. & STARIKOVSKAIA, S. 2012. The
2012 plasma roadmap. Journal of Physics D: Applied Physics, 45, 253001. XU, D. M., VAN DER ZAAG-LOONEN, H. J., OUDKERK, M., WANG, Y., VLIEGENTHART, R.,
SCHOLTEN, E. T., VERSCHAKELEN, J., PROKOP, M., DE KONING, H. J. & VAN
KLAVEREN, R. J. 2009. Smooth or attached solid indeterminate nodules detected at
baseline CT screening in the NELSON study: cancer risk during 1 year of follow-up.
Radiology, 250, 264-272.

83
Appendixes
1- ICP/OES analysis of some conditioners marketed in Sudan
for heavy metal content
Hassna M1, Mubark M2, Ahmed H3, Abdel Karim M4*
1-4 Faculty of Science, Sudan University of Science and
Technology, Sudan
Abstract
The safety of cosmetics is becoming nowadays a current issue. This study
was designed to detect heavy metals in some conditioners marketed in
Sudan for beautification. Three cosmetic articles marketed under different
commercial names and extensively used by Sudanese women were
analyzed by inductively coupled plasma/optical emission spectroscopy
(ICP/OES). (ICP/OES) analysis of test samples revealed absence of
potentially harmful mercury, lead, nickel and cadmium. However it
showed that a common metal in test samples is calcium. Samples 1 and 2
contained iron. Barium, manganese and copper appeared only in sample
1. Boron appeared only in sample 2, while europium appeared only in 3.
Keywords: health hazards, cosmetics, conditioners, ICP/OES analysis,
heavy metals.

84
2-ICP/OES ANALYSIS OF SOME MOISTURIZERS
MARKETED IN SUDAN FOR HEAVY METAL CONTENT
Mubark M., Ahmed H., Hassna M. and Prof. Abdel Karim M.*
Sudan University of Science and Technology, Faculty of Science
ABSTRACT
This study was designed to detect heavy metals in some moisturizers
marketed in Khartoum(Sudan) for beautification purposes. A total of four
cosmetic samples marketed under different commercial names and
extensively used by Sudanese women for beautification purposes were
analyzed by inductively coupled plasma/optical emission spectroscopy
(ICP/OES). The analysis revealed absence of the potentially harmful
mercury, lead, nickel and cadmium in test samples. However it showed
that common heavy meals in test samples are: zinc and calcium. whereas
iron is common in samples 1, 2 and 3. Samples 1 and 3 contained barium,
while samples 2 and 3 contained manganese. Aluminium appeared only
in sample 3.
KEYWORDS: Health hathards, Cosmetics, Moisturizers, Analysis,
Heavy metals