
Determination of 129I in Arctic snow by a novel analytical approach using IC-ICP-SFMS
8
Determination of 129 I in Arctic snow by a novel analytical approach using IC-ICP-SFMS ˇ Zilvinas E ˇ zerinskis, * a Andrea Spolaor, bc Torben Kirchgeorg, b Giulio Cozzi, c Paul Vallelonga, d Helle A. Kjær, d Justina ˇ Sapolait ˙ e, a Carlo Barbante bc and R ¯ uta Druteikien ˙ e a The environmental radiation background has increased in the last century due to human nuclear activities and in this context 129 I may be used to evaluate the anthropogenic contribution to global nuclear contamination. We present a fast and novel method for iodine-129 measurements. Coupling ion chromatography and inductively coupled plasma sector field mass spectrometry (IC-ICP-SFMS) allows the determination of iodine-129 at picogram per gram levels. The capability of the Dionex IONPAC® AS16 column to retain iodine species in the absence of NaOH has been used to pre-concentrate 5 mL samples. Although 129 I suffers from isobaric spectral interference due to the presence of 129 Xe, the IC- ICP-SFMS technique allows 129 I to be determined by removing all other isobaric interferents. Furthermore, the 129 Xe interference is sufficiently small and stable to be treated as a background correction. This strategy permits the evaluation of 129 I speciation at sub-picogram per gram levels with a limit of detection (LOD) of 0.7 pg g 1 . Thus the range of possible applications of this technique is expanded to low-concentration environmental samples such as polar snow. Preliminary results obtained from Greenland (NEEM) snow pit samples confirm its applicability in environmental research. 1. Introduction The behaviour and occurrence of iodine isotopes, and in particular radioactive iodine-129 ( 129 I, half-life (t 1/2 ) ¼ 1.57 10 7 years) in natural systems are widely studied. Due to its extremely high solubility in water and rather high concentra- tions in many cases iodine is used as an oceanographic tracer for studying transport and exchange of water masses, 1 as well as a useful environmental tracer for investigating geochemical cycling of stable iodine. 2 In water pollution monitoring 129 I is measured in aquatic plants. 3–6 129 I is naturally produced in small quantities, due to the spontaneous ssion of natural uranium as well as by cosmic ray spallation of trace levels of xenon in the atmosphere. Anthropogenic sources are primarily formed from the ssion of uranium and plutonium in nuclear reactors. 7 The isotope 129 I is one of the main radionuclides of long-term medium waste (e.g. operational waste) and high activity radioactive waste (spent nuclear fuel) storage facilities, and can be released during nuclear accidents. On 11 March 2011 a nuclear disaster occurred in the Fukushima Daiichi Nuclear Power Plant (FDNPP). Several studies have assessed the amount and distribution of radionuclides 129 I, 131 I, 137 Cs and 134 Cs released by the accident. 7–10,12 Paatero et al. 7 investigated the distribution of radionuclides in the atmosphere of the Arctic region and determined that the radioactivity released from the FDNPP reached Svalbard in the middle of spring. SILAM model 7 calculations show that greater deposition may have occurred in Greenland and especially in the Northwest. A SILAM model scenario shows concentrations above 3000 mBq m 3 for 131 I at a height of 1 km above sea level for late March 2011. 7 Few studies of 129 I have been reported due to the sub-pg g 1 concentrations of 129 I present in environmental samples. Neutron activation and accelerator mass spectrometry tech- niques reach detection limits in the range of 10 18 gg 1 which is sufficiently sensitive to determine 129 I but these instruments may be costly and slow to access. 11–13 In turn, beta, gamma and X-ray spectrometric methods are commonly used for 129 I measurements but suffer from interference and shielding phenomena and may require a long counting time for samples with low activities. An alternative approach for 129 I measure- ments is to use inductively coupled plasma mass spectrometry (ICP-MS) 14–16 which is 1000 times more sensitive 17 than the aforementioned spectrometric methods. The aim of this study is to develop a method combining ion chromatography (IC) and inductively coupled plasma sector eld mass spectrometry (ICP-SFMS) for the determination of 129 I. Online preconcentration 18 allows the LOD to be decreased a State Research Institute, Center for Physical Sciences and Technology, Savanoriu ˛ ave. 231, LT-02300 Vilnius, Lithuania. E-mail: zilvinas.ezerinskis@mc.lt b Department of Environmental Sciences, Informatics and Statistics, Ca'Foscari University of Venice, Dorsoduro 2137, 30123, Italy c Institute for the Dynamics of Environmental Processes-CNR, Venice, 30123, Italy d Centre for Ice and Climate, Niels Bohr Institute, Juliane Maries Vej 30, 2100 Copenhagen, Denmark Cite this: J. Anal. At. Spectrom. , 2014, 29, 1827 Received 4th June 2014 Accepted 11th July 2014 DOI: 10.1039/c4ja00179f www.rsc.org/jaas This journal is © The Royal Society of Chemistry 2014 J. Anal. At. Spectrom. , 2014, 29, 1827–1834 | 1827 JAAS PAPER Published on 11 July 2014. Downloaded by CNR on 18/09/2014 11:22:38. View Article Online View Journal | View Issue
-
Upload
independent -
Category
Documents
-
view
0 -
download
0
Transcript of Determination of 129I in Arctic snow by a novel analytical approach using IC-ICP-SFMS
JAAS
PAPER
Publ
ishe
d on
11
July
201
4. D
ownl
oade
d by
CN
R o
n 18
/09/
2014
11:
22:3
8.
View Article OnlineView Journal | View Issue
Determination o
aState Research Institute, Center for Physical
231, LT-02300 Vilnius, Lithuania. E-mail: zbDepartment of Environmental Sciences,
University of Venice, Dorsoduro 2137, 3012cInstitute for the Dynamics of EnvironmentadCentre for Ice and Climate, Niels Bohr
Copenhagen, Denmark
Cite this: J. Anal. At. Spectrom., 2014,29, 1827
Received 4th June 2014Accepted 11th July 2014
DOI: 10.1039/c4ja00179f
www.rsc.org/jaas
This journal is © The Royal Society of C
f 129I in Arctic snow by a novelanalytical approach using IC-ICP-SFMS
Zilvinas Ezerinskis,*a Andrea Spolaor,bc Torben Kirchgeorg,b Giulio Cozzi,c
Paul Vallelonga,d Helle A. Kjær,d Justina Sapolaite,a Carlo Barbantebc
and Ruta Druteikienea
The environmental radiation background has increased in the last century due to human nuclear activities
and in this context 129I may be used to evaluate the anthropogenic contribution to global nuclear
contamination. We present a fast and novel method for iodine-129 measurements. Coupling ion
chromatography and inductively coupled plasma sector field mass spectrometry (IC-ICP-SFMS) allows
the determination of iodine-129 at picogram per gram levels. The capability of the Dionex IONPAC®
AS16 column to retain iodine species in the absence of NaOH has been used to pre-concentrate 5 mL
samples. Although 129I suffers from isobaric spectral interference due to the presence of 129Xe, the IC-
ICP-SFMS technique allows 129I to be determined by removing all other isobaric interferents.
Furthermore, the 129Xe interference is sufficiently small and stable to be treated as a background
correction. This strategy permits the evaluation of 129I speciation at sub-picogram per gram levels with a
limit of detection (LOD) of 0.7 pg g�1. Thus the range of possible applications of this technique is
expanded to low-concentration environmental samples such as polar snow. Preliminary results obtained
from Greenland (NEEM) snow pit samples confirm its applicability in environmental research.
1. Introduction
The behaviour and occurrence of iodine isotopes, and inparticular radioactive iodine-129 (129I, half-life (t1/2) ¼ 1.57 �107 years) in natural systems are widely studied. Due to itsextremely high solubility in water and rather high concentra-tions in many cases iodine is used as an oceanographic tracerfor studying transport and exchange of water masses,1 as well asa useful environmental tracer for investigating geochemicalcycling of stable iodine.2 In water pollution monitoring 129I ismeasured in aquatic plants.3–6 129I is naturally produced insmall quantities, due to the spontaneous ssion of naturaluranium as well as by cosmic ray spallation of trace levels ofxenon in the atmosphere. Anthropogenic sources are primarilyformed from the ssion of uranium and plutonium in nuclearreactors.7 The isotope 129I is one of the main radionuclides oflong-term medium waste (e.g. operational waste) and highactivity radioactive waste (spent nuclear fuel) storage facilities,and can be released during nuclear accidents. On 11 March2011 a nuclear disaster occurred in the Fukushima Daiichi
Sciences and Technology, Savanoriu ave.
Informatics and Statistics, Ca'Foscari
3, Italy
l Processes-CNR, Venice, 30123, Italy
Institute, Juliane Maries Vej 30, 2100
hemistry 2014
Nuclear Power Plant (FDNPP). Several studies have assessed theamount and distribution of radionuclides 129I, 131I, 137Cs and134Cs released by the accident.7–10,12 Paatero et al.7 investigatedthe distribution of radionuclides in the atmosphere of the Arcticregion and determined that the radioactivity released from theFDNPP reached Svalbard in the middle of spring. SILAMmodel7
calculations show that greater deposition may have occurred inGreenland and especially in the Northwest. A SILAM modelscenario shows concentrations above 3000 mBq m�3 for 131I at aheight of 1 km above sea level for late March 2011.7
Few studies of 129I have been reported due to the sub-pg g�1
concentrations of 129I present in environmental samples.Neutron activation and accelerator mass spectrometry tech-niques reach detection limits in the range of 10�18 g g�1 whichis sufficiently sensitive to determine 129I but these instrumentsmay be costly and slow to access.11–13 In turn, beta, gamma andX-ray spectrometric methods are commonly used for 129Imeasurements but suffer from interference and shieldingphenomena and may require a long counting time for sampleswith low activities. An alternative approach for 129I measure-ments is to use inductively coupled plasma mass spectrometry(ICP-MS)14–16 which is 1000 times more sensitive17 than theaforementioned spectrometric methods.
The aim of this study is to develop a method combining ionchromatography (IC) and inductively coupled plasma sectoreld mass spectrometry (ICP-SFMS) for the determination of129I. Online preconcentration18 allows the LOD to be decreased
J. Anal. At. Spectrom., 2014, 29, 1827–1834 | 1827

Table 1 Instrumental parameters for IC-ICP-SFMS
ICP-SFMS
Plasma power 1350 WCool gas 16.00 L min�1
Auxiliary gas 1.00 L min�1
Sample gas 1.377 L min�1
Additional gas 0.372 L min�1
Accurate mass 128.9042Mass range 128.689 O 129.119Sample time (mass 129 a.u.) 0.05 sSpray chamber Cyclonic Peltier (2 �C)Nebulizer X type, 400 mL min�1
Scan type EScanSensitivity (direct measurement) 300 000 cps (1 ng g�1 of In)
IC
Column AS 16 (2 mm � 250 mm)Guard column AG 16 (2 mm � 50 mm)Column temperature 30 �CFlow speed 350 mL min�1
Suppressor ASRS 300 (2 mm)Suppressor current 50 mAInjection volume 5 mLEluent NaOH 35 mMTotal runtime 35 min
JAAS Paper
Publ
ishe
d on
11
July
201
4. D
ownl
oade
d by
CN
R o
n 18
/09/
2014
11:
22:3
8.
View Article Online
to low pg g�1 levels as well as helps to discriminate betweeninorganic iodine species and reduce isobaric and molecularinterferents (129Xe, 89Y40Ar, 115In14N, 113Cd16O, 97Mo16O2
+),hydride 127IH2 formation and matrix effects. We apply this newanalytical method to determine 129I in six snow pit samplesfrom the Arctic NEEM ice core drilling camp located in North-west Greenland.
2. Materials and method2.1 Chemicals
All reagent solutions and samples were prepared in a particle-free laboratory. The laboratory consists of a series of over-pressured working spaces with air qualities ranging from class10 to 100 (US Fed. Std 209E, equivalent to ISO 4 to 5) supplied bymodular HEPA fan-lter units (Envirco, Sanford NC, USA). Allsolutions were prepared using ultrapure water (UPW, 18.2 MU,ELGA Pure Lab, Marlow, United Kingdom). NaOH eluent solu-tion was automatically produced by using an eluent generator(Dionex ICS 5000 EG, Thermo Scientic). The nal NaOH eluentconcentration was 35 mM. To test the memory effect andwashout time of the ICP-SFMS eluents were prepared from tet-ramethylammonium hydroxide (TMAOH) solution (25%) andsuprapure nitric acid (HNO3 65%) purchased from Merck.
Chromatographic data analysis soware (Xcalibur, ThermoScientic, Bremen, Germany) was used for peak integration.
2.2 Standard solutions127I� and 129I� standards were used to test the applicability ofthe method by dilution of stock solutions. 127I� standards wereprepared by diluting 1000 mg L�1 stock IC standard solutions(TraceCERT® purity grade, Sigma-Aldrich, MO, USA) in UPW.129I� standards were prepared from a stock solution of I-129purchased from the PTB (Physikalisch Technische Bundesan-stalt, Braunschweig, Germany). This standard presented acertied specic activity of 1.01 kBq g�1 � 3% (154 mg g�1 129I).The concentrations of the prepared standards were: 0.9, 2.9, 4.5,9.3, 25.3, 42.7 and 93.3 pg g�1. No 129IO3
� impurities weredetected in the 129I standard.
2.3 Sample description and preparation
In 2012 surface snow samples were collected from a 2 m deepsnow pit at the North Greenland Eemian ice drilling (NEEM) site(77.45� N; 51.06� W, 2480 m a.s.l.) covering the period 2010–2012. Model simulation of FDNPP7 fallout and depositionsuggests that the contamination due to the FDNPP disastershould have reached the Greenland ice sheet. The snow pitwalls were rst scraped using a polyethylene bar, to remove anysections that were potentially contaminated during the diggingand glaciological measurements. Sampling was conducted byplunging 5 mL low-density polyethylene (LDPE) vials perpen-dicularly into the snow-pit wall. The sampling has been per-formed from the surface down to the bottom of the snow-pit,with a spatial resolution of 5 cm which is suitable for sub-seasonal resolution. The bottles were capped and packed indouble LDPE bags. Samples were kept frozen during transport
1828 | J. Anal. At. Spectrom., 2014, 29, 1827–1834
and storage, and thenmelted at room temperature under a class100 clean bench. The melted samples were combined to obtainsix samples (as described in Table 3) with sufficient volume for129I determination. Aer collection, the samples were protectedfrom sunlight to avoid photoactivation of iodine.
3. Apparatus and procedure
Measurements were carried out on an ion chromatographicsystem (Dionex ICS 5000, Thermo Scientic, Waltham, US)coupled to an inductively coupled plasma sector eld massspectrometer (ELEMENT2 Thermo Scientic, Germany) equip-ped with a Peltier-cooled spray chamber (ESI, Omaha, US). Allparameters regarding the ICP-SFMS and the sample introduc-tion system are shown in Table 1. Since the interference ofxenon remains the main problem we adopted an approachusing IC-ICP-SFMS to identify and isolate the peak of the inor-ganic species of 129I� above the 129Xe background.
The ion chromatographic system was equipped with an AS16 anion exchange column (2 mm � 250 mm, Thermo Scien-tic) and in addition we used an AG 16 guard column (2 � 50mm). It is known that the AS16 column can be used for theseparation of anion species as well as for iodine species pre-concentration.18 This is because the use of UPW as a carrierallows the column to have the capacity to retain anioniccompounds, including 129I in the form of iodide (I�) and iodate(IO3
�). In this context we injected a large sample volume of 5mLto pre-concentrate 129I on the column. Samples were injectedwith a 5 mL injection loop. Pre-cleaned 5 mL plastic syringesand a syringe pump (11 Plus, Harvard Apparatus, Holliston, MA,
This journal is © The Royal Society of Chemistry 2014

Paper JAAS
Publ
ishe
d on
11
July
201
4. D
ownl
oade
d by
CN
R o
n 18
/09/
2014
11:
22:3
8.
View Article Online
US) were used to ll the sample loop. A gradient program usingUPW and NaOH was necessary to pre-concentrate 129I. NaOHwas generated by using an eluent generator (Dionex ICS 5000EG, Thermo Scientic) to avoid any external contamination.
In the rst step 129I� was pre-concentrated on the columnusing only UPW (0–15 min) followed by elution with 35 mMNaOH (15–30 min) and a nal re-conditioning step (30–35 min,UPW). The ow speed was 0.35 mL min�1. The NaOH wasremoved by a suppressor (ASRS 300, 2 mm, 50 mA, ThermoScientic) before entering the MS source. The ion chromato-graphic system was controlled using Chromeleon 6.8 (ThermoScientic).
4. Results and discussion4.1 Linearity, blanks, and detection limits
The method was validated by using external calibration curvesof 129I (in the form of iodide) in the range of concentrationsbetween 1 and 100 pg g�1. Calibration curves of 129I had acorrelation coefficient greater than 0.99 (Fig. 1a) and decreasedto 0.97 when evaluating only the standards from 0.9 to 4.5 pgg�1 (Fig. 1b). Considering the environmental concentrations of129I in polar samples from Greenland (in soil samples concen-trations are in the low pg g�1 range), care was taken to evaluatethe procedural blanks. The estimation was achieved by 10repeat analyses of UPW and the limit of detection was denedas 3 times the standard deviation of the procedural blank,
Fig. 1 External calibration curve of iodine-129 (a) for standardconcentrations between 0.9 and 97 pg g�1 (b) considering standardconcentrations between 0.9 and 4.5 pg g�1.
This journal is © The Royal Society of Chemistry 2014
calculated to be 0.7 pg g�1. The detection limits obtained arelower than previous published methods using a collisionreaction cell (CRC-ICP-MS, 1.1 pg g�1)19 but an order ofmagnitude higher than triple quadrupole ICP-MS in MS/MSmode (0.07 pg g�1).20 Our approach requires a longer analysistime (35 min per sample) compared to direct injectionmeasurements (3 min per sample) but this is required to ensurethe removal of most spectral interference on 129I. Although thevolume introduced is 5 mL the proposed method offers lowresidual standard deviations (%RSD) with the advantage ofdiscriminating between the different 129I inorganic species andwithout requiring sample pre-treatment.
4.2 Recovery, accuracy, reproducibility and internalstandard
No certied reference material is available for 129I in a polar icematrix17 so we adopted the method of analysing melted Arcticsamples spiked with different concentrations of 129I in order toevaluate the accuracy and recovery of the technique. Theconcentrations tested ranged between 1 and 10 pg g�1 (Table 2).129I had a recovery of 80% at a concentration of 1 pg g�1
compared with 77% recovery at 10 pg g�1. Similar recoveries forsamples with 127I concentrations below 10 pg g�1 were obtainedby Spolaor et al.18 using a 0.3 mL volume loop instead of a 5 mL.Considering that there are no standard procedures to calculatethe 129I recovery we use the external calibration equationobtained from the UPW standard where we have a slope of 1967area per pg g�1 and an intercept of 2500. We choose to proceedin this way because the matrix effect is minimized by using thechromatographic ion suppressor that removes all cations fromthe ice matrix. Furthermore, different anions, including iodine,have different retention times thereby minimizing the possi-bility of competing ions in the plasma. The specications of theDionex AS16® column clearly show that the major anionspresent in polar snow (such as chloride and sulphate) are elutedfaster than iodide. Therefore we can consider that the instru-mental matrix effect is minimized and the most likely expla-nation for the decreased recovery of real samples is due to theefficiency of the chromatographic column. It is possible that thehigher concentrations of ions such as chloride, sulphate andbromide could cause a lower retention of iodide in the columnthereby decreasing the nal recovery.
Reproducibility was evaluated by repeating three measure-ments for each individual standard (concentrations of tested
Table 2 Recovery and accuracy of 129I� in Arctic (NEEM) snow pitsamples compared to ultra pure water (UPW). Recovery results areobtained using the regression line equation from Fig. 1 (slope: 1967area per pg g�1; intercept 2500). Standard deviation was obtained fromrepetition measurements (n ¼ 3) of each sample
Concentrationadded Area 129I� (UPW) Area 129I� (Arctic) Recovery
0 pg g�1 2610 � 287 2700 � 212 —1 pg g�1 5465 � 832 3977 � 147 80%10 pg g�1 20 785 � 415 16 751 � 608 77%
J. Anal. At. Spectrom., 2014, 29, 1827–1834 | 1829

Fig. 2 127IH and 127IH2 hydride formation graph. Squares indicate 127IHhydride formation as the 128Xe/131Xe isotope ratio changes with 127Iconcentration and circles show 127IH2 hydride formation as the129Xe/131Xe isotope ratio changes with 127I concentration.
JAAS Paper
Publ
ishe
d on
11
July
201
4. D
ownl
oade
d by
CN
R o
n 18
/09/
2014
11:
22:3
8.
View Article Online
standards were: 0.9, 2.9, 4.5, 25.1 and 42.7 pg g�1). The resultsdemonstrate low %RSDs between 10% and 2.5% for the lowestand highest concentrations of the standard solutions, respec-tively. Additionally the precision has been evaluated in a 10 pgg�1 129I� spiked NEEM sample. The %RSD calculated is in thesame range as the value obtained for the standard tested (5%).
To ensure the quality of measurements and estimate matrixeffects, the use of an internal standard is the most commonmethod. The principle of the internal standard is that theanalyte and the internal standard should have the samebehaviour during all steps of the analyses. In the literaturedifferent internal standards have been used for iodine analysis:Te, Re and Cs.21,22 The use of Cs as an internal standard isdoubtful because of its different chemical and physical prop-erties compared to iodine. Caesium is unsuitable not only dueto its different behaviour in alkali solutions,6 but also because ofits extremely low rst ionization potential of 3.8 eV compared toiodine (10.4 eV).22 The rst ionization potential of I appears onthe slope of the curve which makes iodine sensitive to matrixeffects whereas Cs is completely ionized and almost indepen-dent of concomitant elements in plasma.23 The quite differentmass of Re, compared to I, also limits its suitability as aninternal standard. Tellurium would be more suitable because ofits similar mass and ionization potential, but there is a risk ofisobaric interference arising from the formation of 128TeH.Therefore the internal standard was not used.
In the case of ICP-SFMS xenon is present as a trace impurityin the argon carrier gas and hence cannot be easily reduced oreliminated. Consequently we have evaluated the stability of thexenon signal to evaluate if a reliable background-correction canbe applied. Xenon isotopes 128Xe, 131Xe and 132Xe were moni-tored to check argon gas during the various measurementsessions and furthermore we tested the xenon background levelfor 6 hours from one argon cylinder (50 L, 200 bar, purity99.996%). The results of this experiment showed that during theperiod of time usually required for a measurement (3–35 min)the xenon background was stable, with a precision of 15% (%RSD) for 0.01 s sampling time and less than 5% for 0.05 ssampling time. The xenon signal was observed to be stable evenwhen the tank was nearly empty. Monitoring of xenon isotopeswas also required to compensate for the presence of polyatomicinterference on 129I, as described below.
4.3 Interference of iodine hydride and polyatomic ions
Another problem of 129I analysis by ICP-SFMS is 127IH2 forma-tion. This has to be taken into account, due to high abundanceof 127I in soil (around 2 mg g�1) and marine systems.24 Fig. 2depicts xenon isotope ratio changes based on the concentrationof 127I. In Fig. 2 (open squares) we can see that the ratio of thesignal begins to increase at 127I concentrations of approximately100 ng g�1. Thus as iodine concentrations increase, more IH isformed and eventually exceeds the 128Xe background. Thishypothesis was also tested for 129Xe because of the potential forisobaric interference on 129I.16 Fig. 2 shows that 127IH2
(open circles) is not detectable below 127I concentrations of5000 ng g�1.
1830 | J. Anal. At. Spectrom., 2014, 29, 1827–1834
Hydride formation strongly depends on the equipment usedand its parameters, such as the sample uptake rate, sample gasow rate and plasma temperature, among others.25 Theparameters of the present work are given in Table 1. Accordingto these estimates we can be sure that in this study hydride ofiodine-127 does not interfere with our target analyte because themaximum abundance of 127I in Greenland polar ice systemsreaches 50–80 pg g�1.26,27
Polyatomic interferents such as 97Mo16O2+, 115In14N+ and
113Cd16O+ can affect the signal of I129 especially in direct ICP-SFMS measurements. However an advantage of coupling ionchromatography with ICP-SFMS is the separation of Mo, In andCd from 129I. In polar samples, Mo, In and Cd are present at lowpg g�1 concentrations however the capability of the resin tocollect anions allows the separation of these elements from 129I.Additionally these elements in the free form are positivelycharged and can therefore be removed by the ion suppressorbefore entering the ICP-SFMS. Even if these elements arepresent in insoluble dust particles, the guard column shouldtrap such particles before entering the analytical column ordetector. Therefore, when the iodine is eluted from the columnthese interfering elements are not present.
On-line desolvation systems are oen used to minimizeinterference derived from oxide and hydride formation.28 In thiscase one such system (Apex-Q, Elemental Scientic, USA) wastested. With the Apex-Q, we were able to increase the sensitivityof our target analyte by three times but at the same time weincreased the background of xenon by ten times, because of thenitrogen carrier gas required by the system. Consequently,
This journal is © The Royal Society of Chemistry 2014
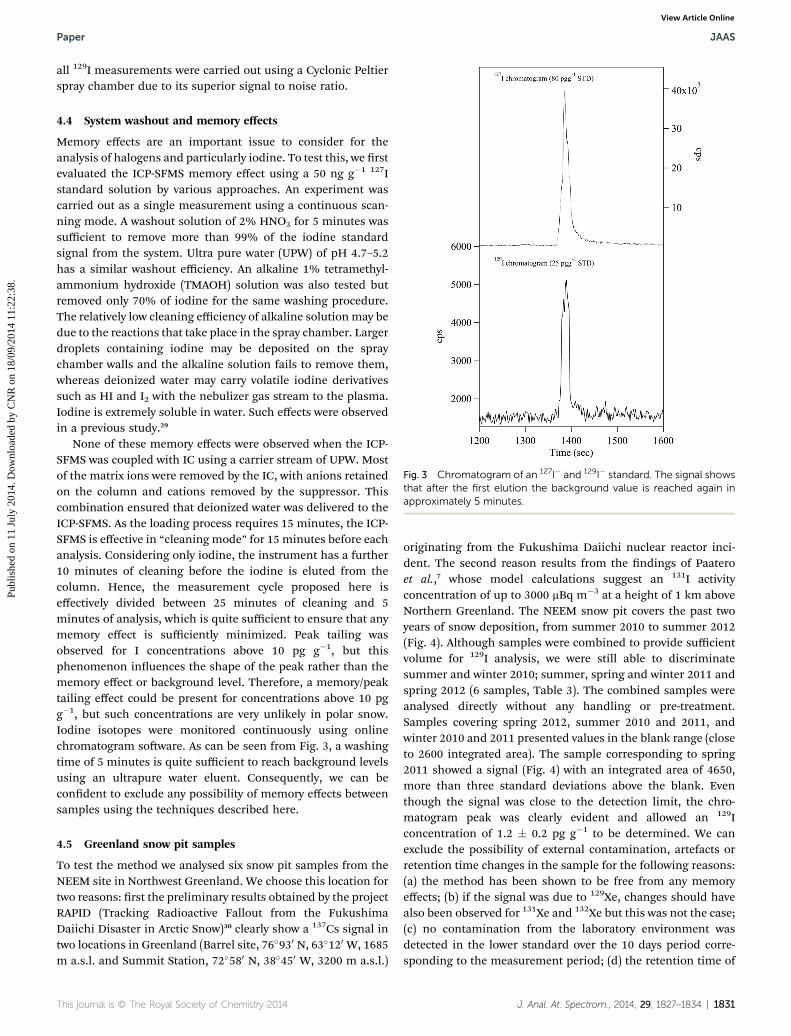
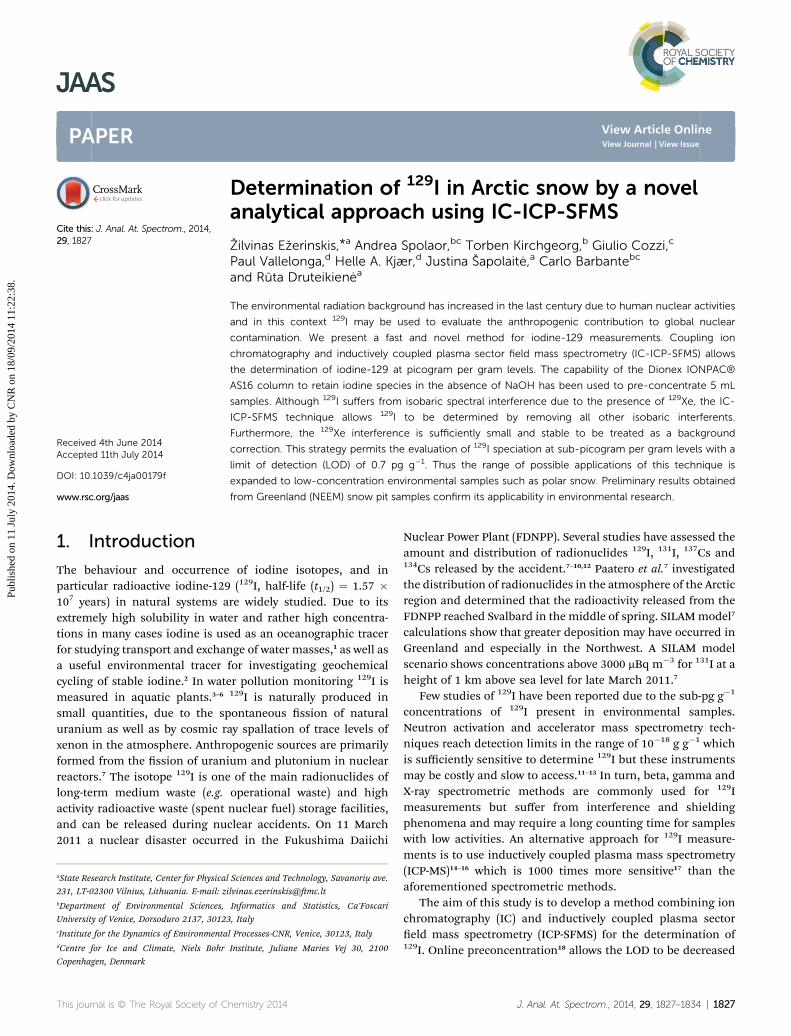
Fig. 3 Chromatogram of an 127I� and 129I� standard. The signal showsthat after the first elution the background value is reached again inapproximately 5 minutes.
Paper JAAS
Publ
ishe
d on
11
July
201
4. D
ownl
oade
d by
CN
R o
n 18
/09/
2014
11:
22:3
8.
View Article Online
all 129I measurements were carried out using a Cyclonic Peltierspray chamber due to its superior signal to noise ratio.
4.4 System washout and memory effects
Memory effects are an important issue to consider for theanalysis of halogens and particularly iodine. To test this, we rstevaluated the ICP-SFMS memory effect using a 50 ng g�1 127Istandard solution by various approaches. An experiment wascarried out as a single measurement using a continuous scan-ning mode. A washout solution of 2% HNO3 for 5 minutes wassufficient to remove more than 99% of the iodine standardsignal from the system. Ultra pure water (UPW) of pH 4.7–5.2has a similar washout efficiency. An alkaline 1% tetramethyl-ammonium hydroxide (TMAOH) solution was also tested butremoved only 70% of iodine for the same washing procedure.The relatively low cleaning efficiency of alkaline solutionmay bedue to the reactions that take place in the spray chamber. Largerdroplets containing iodine may be deposited on the spraychamber walls and the alkaline solution fails to remove them,whereas deionized water may carry volatile iodine derivativessuch as HI and I2 with the nebulizer gas stream to the plasma.Iodine is extremely soluble in water. Such effects were observedin a previous study.29
None of these memory effects were observed when the ICP-SFMS was coupled with IC using a carrier stream of UPW. Mostof the matrix ions were removed by the IC, with anions retainedon the column and cations removed by the suppressor. Thiscombination ensured that deionized water was delivered to theICP-SFMS. As the loading process requires 15 minutes, the ICP-SFMS is effective in “cleaning mode” for 15 minutes before eachanalysis. Considering only iodine, the instrument has a further10 minutes of cleaning before the iodine is eluted from thecolumn. Hence, the measurement cycle proposed here iseffectively divided between 25 minutes of cleaning and 5minutes of analysis, which is quite sufficient to ensure that anymemory effect is sufficiently minimized. Peak tailing wasobserved for I concentrations above 10 pg g�1, but thisphenomenon inuences the shape of the peak rather than thememory effect or background level. Therefore, a memory/peaktailing effect could be present for concentrations above 10 pgg�1, but such concentrations are very unlikely in polar snow.Iodine isotopes were monitored continuously using onlinechromatogram soware. As can be seen from Fig. 3, a washingtime of 5 minutes is quite sufficient to reach background levelsusing an ultrapure water eluent. Consequently, we can becondent to exclude any possibility of memory effects betweensamples using the techniques described here.
4.5 Greenland snow pit samples
To test the method we analysed six snow pit samples from theNEEM site in Northwest Greenland. We choose this location fortwo reasons: rst the preliminary results obtained by the projectRAPID (Tracking Radioactive Fallout from the FukushimaDaiichi Disaster in Arctic Snow)30 clearly show a 137Cs signal intwo locations in Greenland (Barrel site, 76�930 N, 63�120 W, 1685m a.s.l. and Summit Station, 72�580 N, 38�450 W, 3200 m a.s.l.)
This journal is © The Royal Society of Chemistry 2014
originating from the Fukushima Daiichi nuclear reactor inci-dent. The second reason results from the ndings of Paateroet al.,7 whose model calculations suggest an 131I activityconcentration of up to 3000 mBq m�3 at a height of 1 km aboveNorthern Greenland. The NEEM snow pit covers the past twoyears of snow deposition, from summer 2010 to summer 2012(Fig. 4). Although samples were combined to provide sufficientvolume for 129I analysis, we were still able to discriminatesummer and winter 2010; summer, spring and winter 2011 andspring 2012 (6 samples, Table 3). The combined samples wereanalysed directly without any handling or pre-treatment.Samples covering spring 2012, summer 2010 and 2011, andwinter 2010 and 2011 presented values in the blank range (closeto 2600 integrated area). The sample corresponding to spring2011 showed a signal (Fig. 4) with an integrated area of 4650,more than three standard deviations above the blank. Eventhough the signal was close to the detection limit, the chro-matogram peak was clearly evident and allowed an 129Iconcentration of 1.2 � 0.2 pg g�1 to be determined. We canexclude the possibility of external contamination, artefacts orretention time changes in the sample for the following reasons:(a) the method has been shown to be free from any memoryeffects; (b) if the signal was due to 129Xe, changes should havealso been observed for 131Xe and 132Xe but this was not the case;(c) no contamination from the laboratory environment wasdetected in the lower standard over the 10 days period corre-sponding to the measurement period; (d) the retention time of
J. Anal. At. Spectrom., 2014, 29, 1827–1834 | 1831
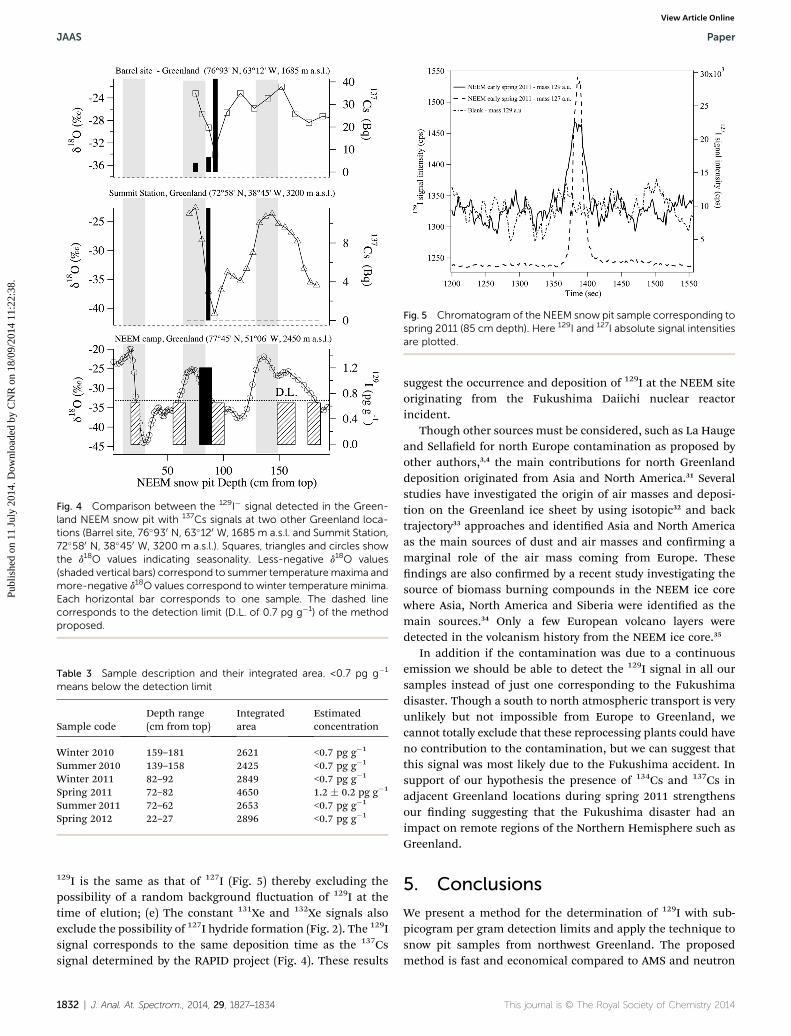
Fig. 4 Comparison between the 129I� signal detected in the Green-land NEEM snow pit with 137Cs signals at two other Greenland loca-tions (Barrel site, 76�930 N, 63�120 W, 1685 m a.s.l. and Summit Station,72�580 N, 38�450 W, 3200 m a.s.l.). Squares, triangles and circles showthe d18O values indicating seasonality. Less-negative d18O values(shaded vertical bars) correspond to summer temperaturemaxima andmore-negative d18O values correspond to winter temperature minima.Each horizontal bar corresponds to one sample. The dashed linecorresponds to the detection limit (D.L. of 0.7 pg g�1) of the methodproposed.
Table 3 Sample description and their integrated area. <0.7 pg g�1
means below the detection limit
Sample codeDepth range(cm from top)
Integratedarea
Estimatedconcentration
Winter 2010 159–181 2621 <0.7 pg g�1
Summer 2010 139–158 2425 <0.7 pg g�1
Winter 2011 82–92 2849 <0.7 pg g�1
Spring 2011 72–82 4650 1.2 � 0.2 pg g�1
Summer 2011 72–62 2653 <0.7 pg g�1
Spring 2012 22–27 2896 <0.7 pg g�1
Fig. 5 Chromatogram of the NEEM snow pit sample corresponding tospring 2011 (85 cm depth). Here 129I and 127I absolute signal intensitiesare plotted.
JAAS Paper
Publ
ishe
d on
11
July
201
4. D
ownl
oade
d by
CN
R o
n 18
/09/
2014
11:
22:3
8.
View Article Online
129I is the same as that of 127I (Fig. 5) thereby excluding thepossibility of a random background uctuation of 129I at thetime of elution; (e) The constant 131Xe and 132Xe signals alsoexclude the possibility of 127I hydride formation (Fig. 2). The 129Isignal corresponds to the same deposition time as the 137Cssignal determined by the RAPID project (Fig. 4). These results
1832 | J. Anal. At. Spectrom., 2014, 29, 1827–1834
suggest the occurrence and deposition of 129I at the NEEM siteoriginating from the Fukushima Daiichi nuclear reactorincident.
Though other sources must be considered, such as La Haugeand Sellaeld for north Europe contamination as proposed byother authors,3,4 the main contributions for north Greenlanddeposition originated from Asia and North America.31 Severalstudies have investigated the origin of air masses and deposi-tion on the Greenland ice sheet by using isotopic32 and backtrajectory33 approaches and identied Asia and North Americaas the main sources of dust and air masses and conrming amarginal role of the air mass coming from Europe. Thesendings are also conrmed by a recent study investigating thesource of biomass burning compounds in the NEEM ice corewhere Asia, North America and Siberia were identied as themain sources.34 Only a few European volcano layers weredetected in the volcanism history from the NEEM ice core.35
In addition if the contamination was due to a continuousemission we should be able to detect the 129I signal in all oursamples instead of just one corresponding to the Fukushimadisaster. Though a south to north atmospheric transport is veryunlikely but not impossible from Europe to Greenland, wecannot totally exclude that these reprocessing plants could haveno contribution to the contamination, but we can suggest thatthis signal was most likely due to the Fukushima accident. Insupport of our hypothesis the presence of 134Cs and 137Cs inadjacent Greenland locations during spring 2011 strengthensour nding suggesting that the Fukushima disaster had animpact on remote regions of the Northern Hemisphere such asGreenland.
5. Conclusions
We present a method for the determination of 129I with sub-picogram per gram detection limits and apply the technique tosnow pit samples from northwest Greenland. The proposedmethod is fast and economical compared to AMS and neutron
This journal is © The Royal Society of Chemistry 2014

Paper JAAS
Publ
ishe
d on
11
July
201
4. D
ownl
oade
d by
CN
R o
n 18
/09/
2014
11:
22:3
8.
View Article Online
activation techniques as it requires neither sample pre-concentration nor access to specialized accelerator facilities.The detection limit has been calculated as 0.7 pg g�1 with aprecision of better than 90%. The recovery of the method is72% for concentrations close to the detection limit butincreases to 81% for concentrations above 1 pg g�1. Althoughthe injected sample volume was 5 mL, no memory effect wasdetected and the accuracy of the technique is comparable toresults reported for 0.3 mL injection volumes.20 The precisionobtained here is less than the method reported for 127I but thisis due to the presence of Xe-129 which increases the back-ground noise level.
The method was developed for snow samples or similarclean matrices and has been employed to investigate possibleradioactive contamination of remote locations such as theArctic. Testing this in Greenland snow pit samples, our resultsconrm the deposition of radioactive compounds emitted fromthe Fukushima Daiichi nuclear reactor incident on 11 March2011. We found 129I (1.2 pg g�1) above detection limits (0.7 pgg�1) in one of the six snow samples analysed, covering theperiod of early spring of 2011. This approach could be thestarting point for investigation of harmful radioactive elementsin other glaciated regions such as the Himalayas, Andes andAlps, which are the sources of potable water to large, denselypopulated areas.
Acknowledgements
This project was funded by European Union Structural Fundsproject ”Postdoctoral Fellowship Implementation in Lith-uania” within the framework of the Measure for EnhancingMobility of Scholars and Other Researchers and the Promotionof Student Research (VP1-3.1-SMM-01) of the Program ofHuman Resources Development Action Plan. In addition wewould like to thank Elga Lab water, High Wycombe, UK, forsupplying the pure water systems used in this study. We wouldalso like to thank the three anonymous reviewers for theirvaluable comments which helped us to improve themanuscript.
References
1 P. H. Santschi and K. a. Schwehr, Sci. Total Environ., 2004,321, 257–271.
2 X. Hou, J. Radioanal. Nucl. Chem., 2004, 262, 67–75.3 G. M. Raisbeck and F. Yiou, Sci. Total Environ., 1999, 237–238, 31–41.
4 S. M. Keogh, a. Aldahan, G. Possnert, L. L. Vintro,P. I. Mitchell, K. J. Smith and P. McGinnity, Nucl. Instrum.Methods Phys. Res., Sect. B, 2010, 268, 1232–1235.
5 S. Persson, a. Aldahan, G. Possnert, V. Almov and X. Hou,Nucl. Instrum. Methods Phys. Res., Sect. B, 2007, 259, 508–512.
6 J. Zheng, H. Takata, K. Tagami, T. Aono, K. Fujita andS. Uchida, Microchem. J., 2012, 100, 42–47.
7 J. Paatero, J. Vira, M. Siitari-Kauppi, J. Hatakka, K. Holmenand Y. Viisanen, J. Environ. Radioact., 2012, 114, 41–47.
This journal is © The Royal Society of Chemistry 2014
8 S. Otosaka, K. A. Schwehr, D. I. Kaplan, K. A. Roberts,S. Zhang, C. Xu, H.-P. Li, Y.-F. Ho, R. Brinkmeyer,C. M. Yeager and P. H. Santschi, Sci. Total Environ., 2011,409, 3857–3865.
9 X. Hou, P. P. Povinec, L. Zhang, K. Shi, D. Biddulph,C.-C. Chang, Y. Fan, R. Golser, Y. Hou, M. Jeskovsky,a. J. T. Jull, Q. Liu, M. Luo, P. Steier and W. Zhou, Environ.Sci. Technol., 2013, 47, 3091–3098.
10 S. C. Liu, C.-A. Huh, F.-J. Lin, C.-Y. Chan, S.-H. Lin andS.-C. Hsu, Geophys. Res. Lett., 2012, 39, 1–6.
11 E. Robens and D. C. Aumann, J. Environ. Radioact., 1988, 7,159–175.
12 X. Hou, H. Dahlgaard, B. Rietz, U. Jacobsen, S. P. Nielsen andA. Aarkrog, Analyst, 1999, 124, 1109–1114.
13 F. P. Brauer, Conference: 11. Annual DOE Low Level WasteManagement Conference, Pittsburgh, PA, USA, Aug 1989, pp.22–24.
14 R. J. Cox, C. J. Pickford and M. Thompson, J. Anal. At.Spectrom., 1992, 7, 635–640.
15 O. T. Farmer, C. J. Barinaga and D. W. Koppenaal, J.Radioanal. Nucl. Chem., 1998, 234, 153–157.
16 P. Bienvenu, E. Brochard, E. Excoffier and M. Piccione, Can.J. Anal. Sci. Spectrosc., 2004, 49, 423–428.
17 X. Hou and P. Roos, Anal. Chim. Acta, 2008, 608, 105–139.18 A. Spolaor, P. Vallelonga, J. Gabrieli, N. Kehrwald, C. Turetta,
G. Cozzi, L. Poto, J. M. C. Plane, C. Boutron and C. Barbante,Anal. Bioanal. Chem., 2013, 405, 647–654.
19 Y. Shikamori, N. Sugiyama, and S. Kakuta, Agil. Technol.Appl. note, 2012.
20 T. Ohno, Y. Muramatsu, Y. Shikamori, C. Toyama,N. Okabe and H. Matsuzaki, J. Anal. At. Spectrom., 2013,28, 1283.
21 Y. Muramatsu, Y. Takada, H. Matsuzaki and S. Yoshida,Quat. Geochronol., 2008, 3, 291–297.
22 H. Yamada, T. Kiriyama and K. Yonebayashi, Soil Sci. PlantNutr., 2012, 37–41.
23 P. Serapinas, J. Salkauskas, Z. Ezerinskis and A. Acus,Spectrochim. Acta, Part B, 2010, 65, 15–23.
24 L. Y. Zhang and X. L. Hou, Radiochim. Acta, 2013, 540,130729000243004.
25 J. A. C. Broekaert, Analytical Atomic Spectrometry with Flamesand Plasmas, Wiley-VCH, 2005.
26 A. Spolaor, P. Vallelonga, J. M. C. Plane, N. Kehrwald,J. Gabrieli, C. Varin, C. Turetta, G. Cozzi, R. Kumar,C. Boutron and C. Barbante, Atmos. Chem. Phys., 2013, 13,6623–6635.
27 A. Spolaor, J. Gabrieli, T. Martma, J. Kohler, M. B. Bjorkman,E. Isaksson, C. Varin, P. Vallelonga, J. M. C. Plane andC. Barbante, The Cryosphere, 2013, 7, 1645–1658.
28 Mass Spectrometry Handbook, ed. M. S. Lee, John Wiley &Sons, 2012.
29 F. Hans Vanhoe and F. Allemeersch, Analyst, 1993, 118,1015–1019.
30 Proj. RAPID Track. Radioact. Fallout from Fukushima Dai-ichiDisaster Arct. Snow.
31 A. J. M. Bory, P. E. Biscaye and F. E. Groussett, Geophys. Res.Lett., 2003, 30, 16.
J. Anal. At. Spectrom., 2014, 29, 1827–1834 | 1833

JAAS Paper
Publ
ishe
d on
11
July
201
4. D
ownl
oade
d by
CN
R o
n 18
/09/
2014
11:
22:3
8.
View Article Online
32 M. Lupker, S. M. Aciego, B. Bourdon, J. Schwander andT. F. Stocker, Earth Planet. Sci. Lett., 2010, 295, 277–286.
33 D. W. Kahl, A. Martinez, I. Davidson, M. Harris and O. Ax,Geophys. Res. Lett., 1997, 102, 26861–26875.
34 P. Zennaro, N. Kehrwald, J. R. McConnell, S. Schupbach,O. Maselli, J. Marlon, P. Vallelonga, D. Leuenberger,R. Zangrando, A. Spolaor, M. Borrotti, E. Barbaro,
1834 | J. Anal. At. Spectrom., 2014, 29, 1827–1834
A. Gambaro and C. Barbante, Climate of the Past, 2014, 10,809–857.
35 M. Sigl, J. R. McConnell, L. Layman, O. Maselli, D. Pasteris,K. McGwire, D. Dahl-Jensen, J. P. Steffensen, B. M. Vinther,R. Edwards, R. Mulvaney and S. Kipfstuhl, Geophys. Res.Lett., 2012, 118, 1151–1169.
This journal is © The Royal Society of Chemistry 2014