Biomolecule-mediated synthesis of selenium nanoparticles using dried Vitis vinifera (raisin) extract
Upload
independentCategory
view
1download
0
RAPID COMMUNICATIONS IN MASS SPECTROMETRY
Rapid Commun. Mass Spectrom. 2010; 24: 335–342
) DOI: 10.1002/rcm.4395
Published online in Wiley InterScience (www.interscience.wiley.comDetermination and imaging of metabolites from Vitisvinifera leaves by laser desorption/ionisation time-of-
flight mass spectrometry
Gregory Hamm1, Vincent Carre1*, Anne Poutaraud2, Benoıt Maunit1, Gilles Frache1,
Didier Merdinoglu2 and Jean-Francois Muller1*1Laboratoire de Spectrometrie de Masse et de Chimie Laser, Institut Jean Barriol – Federation de Recherche 2843, Universite Paul Verlaine –
Metz, 1 Boulevard Arago, 57078 Metz technopole Cedex 03, France2INRA, Laboratoire de genetique et d’amelioration de la vigne, UMR1131, 28 rue de Herrlisheim, B.P. 20507, 68021 Colmar Cedex, France
Received 8 September 2009; Revised 20 November 2009; Accepted 20 November 2009
*CorrespoSpectromVerlaineCedex 03E-mail: c
Analysis of grapevine phytoalexins at the surface of Vitis vinifera leaves has been achieved by laser
desorption/ionisation time-of-flight mass spectrometry (LDI-ToFMS) without matrix deposition.
This simple and rapid sampling method was successfully applied to map small organic compounds
at the surface of grapevine leaves. It was also demonstrated that the laser wavelength is a highly
critical parameter. Both 266 and 337nm laser wavelengths were used but the 266nmwavelength gave
increased spatial resolution and better sensitivity for the detection of the targeted metabolites
(resveratrol and linked stilbene compounds). Mass spectrometry imaging of grapevine Cabernet
Sauvignon leaves revealed specific locations with respect to Plasmopara viticola pathogen infection
or light illumination. Copyright # 2010 John Wiley & Sons, Ltd.
In response to biotic or abiotic stresses, grapevines – like
other plants – synthesise defense compounds.1 Stilbenes are
one of the secondary metabolites, also known as phytoalex-
ines, involved in plant defense mechanisms. The relationship
between plant stilbene content and grapevine disease
resistance was first highlighted by Langcake.2 Stilbenes
have been recognised to prevent the proliferation and the
reproduction of pathogens3 such as downy mildew
(Plasmopara viticola) on which numerous studies have been
performed,4,5 a major grapevine disease likely to cause the
loss of much of the crop. When downy mildew affects the
leaves of grapevines, oily lesions are observed on the upper
surface while the under side is covered with a white cottony
layer. Leaf death occurs shortly after and leads to the general
weakening of the plant. The major stilbenes (Fig. 1) identified
in infected grapevine are resveratrol (a) (3,5,40-trihydroxy-
stilbene) and its derivatives: pterostilbene (b) (3,5-
dimethoxy-40-hydroxystilbene),6 piceid (resveratrol 3-O-b-
D-glucoside), e-viniferin and d-viniferin (resveratrol dimers).
Other factors may also induce stilbene synthesis such as UV
irradiation,7 aluminium chloride exposure,8 or gray mold
(Botritys cinerea) infection.9
The study of plant/pathogen interactions requires tech-
niques that allow the acquisition of data on micrometer scale of
the characterised metabolites. Several techniques have been
used to analyse stilbenes from organic solvent extracts of fresh
leaves. These experiments require a preliminary separation
step using chromatographic methods: high-performance
ndence to: V. Carre, and J. Muller, Laboratoire deetrie de Masse et de Chimie Laser, Universite Paul– Metz, 1 Boulevard Arago, F-57078 Metz technopole, [email protected]; [email protected]
liquid chromatography (HPLC) in normal or inverse phase10
or gas chromatography with or without a derivatisation step.11
Liquid chromatography techniques are easily coupled with a
diode-array detector (DAD) to quantify stilbene and related
compounds, and mass spectrometric analysers are used to
provide elemental composition and structural data. To define
the structures and stereochemistry of theses compounds,
Huang et al. identified some novel tetramers of resveratrol in
Vitis amurensis roots by two-dimensional nuclear magnetic
resonance (2D NMR).12 However, the leaf extracts studied by
these techniques have generally been obtained from only a few
square centimeters of tissue and thus cannot provide
information on the precise localisation of secondary metab-
olites on the leaf. This approach leads to a dilution of the local
response induced by pathogens.
Local assessment of stilbene contents on the surface of
leaves may be also obtained by fluorescence spectroscopy,13
as stilbenes display intense blue fluorescence under UV
illumination. The fluorescence of the major stilbene content
has been also correlated with HPLC-DAD measurements.
Fluorescence spectroscopy allows the global stilbene fluor-
escence per square millimeter on the leaf to be evaluated but
does not achieve the separation of signals from different
stilbenes. Imaging mass spectrometry (IMS) appears to be an
interesting alternative to fluorescence mapping and liquid or
gas chromatographic techniques. IMS allows a molecular
map of all species to be achieved simultaneously. Further-
more, this technique allows micrometer scale analysis to be
obtained which is consistent with the size of stomata
(�20mm), the site of infection by downy mildew.
One of the first studies by imaging matrix-assisted laser
desorption/ionisation time-of-flight mass spectrometry
(MALDI-ToFMS) was published by Caprioli et al. in
Copyright # 2010 John Wiley & Sons, Ltd.
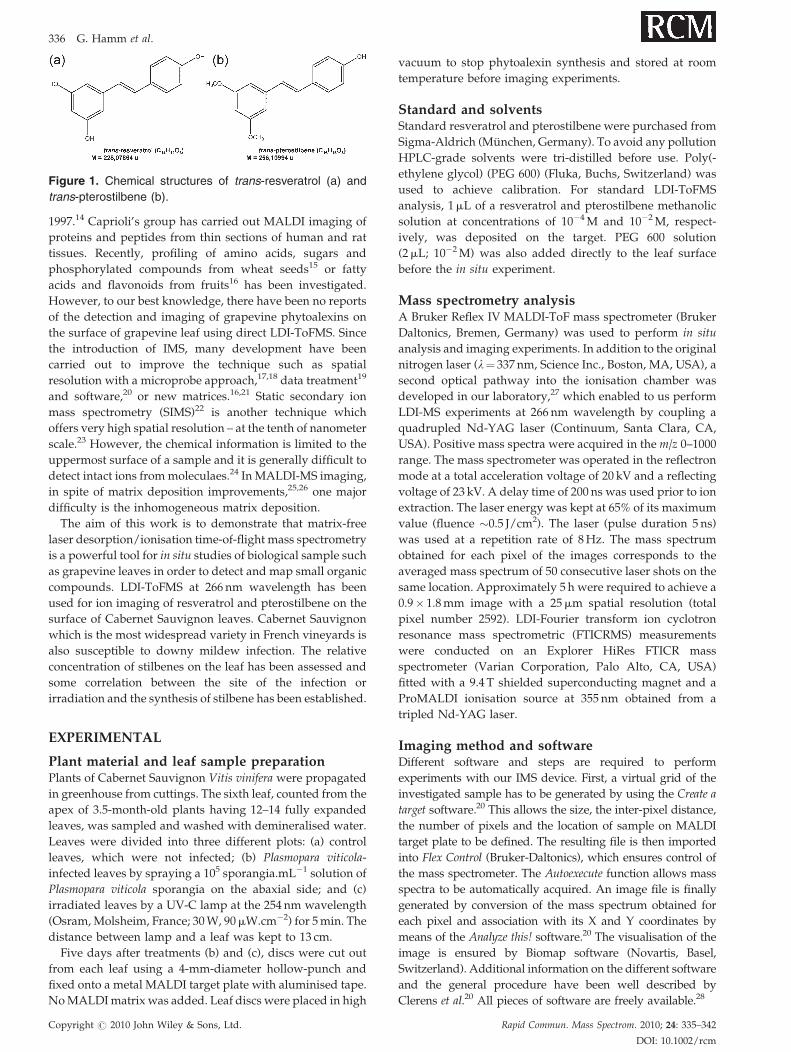
Figure 1. Chemical structures of trans-resveratrol (a) and
trans-pterostilbene (b).
336 G. Hamm et al.
1997.14 Caprioli’s group has carried out MALDI imaging of
proteins and peptides from thin sections of human and rat
tissues. Recently, profiling of amino acids, sugars and
phosphorylated compounds from wheat seeds15 or fatty
acids and flavonoids from fruits16 has been investigated.
However, to our best knowledge, there have been no reports
of the detection and imaging of grapevine phytoalexins on
the surface of grapevine leaf using direct LDI-ToFMS. Since
the introduction of IMS, many development have been
carried out to improve the technique such as spatial
resolution with a microprobe approach,17,18 data treatment19
and software,20 or new matrices.16,21 Static secondary ion
mass spectrometry (SIMS)22 is another technique which
offers very high spatial resolution – at the tenth of nanometer
scale.23 However, the chemical information is limited to the
uppermost surface of a sample and it is generally difficult to
detect intact ions from moleculaes.24 In MALDI-MS imaging,
in spite of matrix deposition improvements,25,26 one major
difficulty is the inhomogeneous matrix deposition.
The aim of this work is to demonstrate that matrix-free
laser desorption/ionisation time-of-flight mass spectrometry
is a powerful tool for in situ studies of biological sample such
as grapevine leaves in order to detect and map small organic
compounds. LDI-ToFMS at 266 nm wavelength has been
used for ion imaging of resveratrol and pterostilbene on the
surface of Cabernet Sauvignon leaves. Cabernet Sauvignon
which is the most widespread variety in French vineyards is
also susceptible to downy mildew infection. The relative
concentration of stilbenes on the leaf has been assessed and
some correlation between the site of the infection or
irradiation and the synthesis of stilbene has been established.
EXPERIMENTAL
Plant material and leaf sample preparationPlants of Cabernet Sauvignon Vitis vinifera were propagated
in greenhouse from cuttings. The sixth leaf, counted from the
apex of 3.5-month-old plants having 12–14 fully expanded
leaves, was sampled and washed with demineralised water.
Leaves were divided into three different plots: (a) control
leaves, which were not infected; (b) Plasmopara viticola-
infected leaves by spraying a 105 sporangia.mL�1 solution of
Plasmopara viticola sporangia on the abaxial side; and (c)
irradiated leaves by a UV-C lamp at the 254 nm wavelength
(Osram, Molsheim, France; 30 W, 90mW.cm�2) for 5 min. The
distance between lamp and a leaf was kept to 13 cm.
Five days after treatments (b) and (c), discs were cut out
from each leaf using a 4-mm-diameter hollow-punch and
fixed onto a metal MALDI target plate with aluminised tape.
No MALDI matrix was added. Leaf discs were placed in high
Copyright # 2010 John Wiley & Sons, Ltd.
vacuum to stop phytoalexin synthesis and stored at room
temperature before imaging experiments.
Standard and solventsStandard resveratrol and pterostilbene were purchased from
Sigma-Aldrich (Munchen, Germany). To avoid any pollution
HPLC-grade solvents were tri-distilled before use. Poly(-
ethylene glycol) (PEG 600) (Fluka, Buchs, Switzerland) was
used to achieve calibration. For standard LDI-ToFMS
analysis, 1mL of a resveratrol and pterostilbene methanolic
solution at concentrations of 10�4 M and 10�2 M, respect-
ively, was deposited on the target. PEG 600 solution
(2mL; 10�2 M) was also added directly to the leaf surface
before the in situ experiment.
Mass spectrometry analysisA Bruker Reflex IV MALDI-ToF mass spectrometer (Bruker
Daltonics, Bremen, Germany) was used to perform in situ
analysis and imaging experiments. In addition to the original
nitrogen laser (l¼ 337 nm, Science Inc., Boston, MA, USA), a
second optical pathway into the ionisation chamber was
developed in our laboratory,27 which enabled to us perform
LDI-MS experiments at 266 nm wavelength by coupling a
quadrupled Nd-YAG laser (Continuum, Santa Clara, CA,
USA). Positive mass spectra were acquired in the m/z 0–1000
range. The mass spectrometer was operated in the reflectron
mode at a total acceleration voltage of 20 kV and a reflecting
voltage of 23 kV. A delay time of 200 ns was used prior to ion
extraction. The laser energy was kept at 65% of its maximum
value (fluence �0.5 J/cm2). The laser (pulse duration 5 ns)
was used at a repetition rate of 8 Hz. The mass spectrum
obtained for each pixel of the images corresponds to the
averaged mass spectrum of 50 consecutive laser shots on the
same location. Approximately 5 h were required to achieve a
0.9� 1.8 mm image with a 25mm spatial resolution (total
pixel number 2592). LDI-Fourier transform ion cyclotron
resonance mass spectrometric (FTICRMS) measurements
were conducted on an Explorer HiRes FTICR mass
spectrometer (Varian Corporation, Palo Alto, CA, USA)
fitted with a 9.4 T shielded superconducting magnet and a
ProMALDI ionisation source at 355 nm obtained from a
tripled Nd-YAG laser.
Imaging method and softwareDifferent software and steps are required to perform
experiments with our IMS device. First, a virtual grid of the
investigated sample has to be generated by using the Create a
target software.20 This allows the size, the inter-pixel distance,
the number of pixels and the location of sample on MALDI
target plate to be defined. The resulting file is then imported
into Flex Control (Bruker-Daltonics), which ensures control of
the mass spectrometer. The Autoexecute function allows mass
spectra to be automatically acquired. An image file is finally
generated by conversion of the mass spectrum obtained for
each pixel and association with its X and Y coordinates by
means of the Analyze this! software.20 The visualisation of the
image is ensured by Biomap software (Novartis, Basel,
Switzerland). Additional information on the different software
and the general procedure have been well described by
Clerens et al.20 All pieces of software are freely available.28
Rapid Commun. Mass Spectrom. 2010; 24: 335–342
DOI: 10.1002/rcm

Figure 2. Example of 200 mesh nickel grid imaging in
positive ion detection mode. (a) Optical image of imaging
region. (b) LDI-ToF image of m/z 57.935 corresponding to
the nickel 58Niþ ion.
Imaging of metabolites from Vitis vinifera leaves 337
Development of LDI-MS imagingThe critical parameter in LDI-MS especially in microprobe
LDI-IMS is the laser wavelength. Images and analyses were
mainly acquired in this work at 266 nm wavelength for two
main reasons. The first is the increased sensitivity for the
detection of the investigated metabolite compounds and the
second is the ability to significantly decrease the laser spot
diameter at this wavelength compared with what it may be
obtained at 337 nm with a nitrogen laser. This parameter has
to be carefully tuned to get reproducible images. Different
devices have to be added to the 266 nm laser pathway to
increase the homogeneity of the laser beam.27 These consist
mainly of high optical quality telescope, lenses and prisms. In
addition, a pinhole is used to select only the central
homogeneous part (Gaussian profile) of the laser beam.
Analysis of the laser impacts by optical microscopy allows
the quality of the laser matter interaction to be checked and
the size of the laser impact to be evaluated. As previously
reported by Spengler et al. the size of the laser impact was
measured after interaction of a laser shot with red ink placed
on the MALDI sample holder.29 The laser fluence used is
identical to that required to perform IMS on grapevine
leaves. A laser spot diameter in the 10mm range was typically
obtained.
The decrease in laser spot diameter also ensures an
improvement of the mass resolution without significant loss
of sensitivity. For example, a resolving power up to 15 000 for
the m/z 578.527 ion was achieved. A small size as well as a
more homogeneous laser beam explained this behavior as
the kinetic energy distribution is sharper than that obtained
with a N2 laser beam.30 Under these conditions, the typical
mass accuracy is better than 25 ppm in the m/z range of 20 to
1000. To ensure higher laser output energy stability over the
time required for the acquisition of an image, a 15 min warm-
up step was added.
To investigate the ability of the proposed protocol, an
image of a 200 mesh nickel microscopic grid fixed on the
MALDI sample holder was acquired by LDI-MS (Fig. 2). The
image was constructed after the acquisition of 40� 40 mass
spectra corresponding to a 0.8� 0.8 mm investigated area.
The image was built using the m/z 57.935 signal, which
corresponds to the most abundant nickel isotope. The
resulting image was compared with an optical image of
the same area obtained with a digital camera (CCD DXC-
107P, Sony, Tokyo, Japan) connected to a Wild M3Z
microscope (Wild Heerbrugg, Heerbrugg, Switzerland).
The same contrasts were observed with both imaging
techniques. The contours of the microscopic grid were
found to be clearly highlighted on the m/z 57.935 mass
spectrometry image. In the figure the color varies from black
to white with respect to the 58Niþ ion signal. Mass spectra
were acquired from left to right and from top to bottom. The
decrease in contrast results from a slow drop in the laser
output energy over time, which induced a decrease in the
production of the 58Niþ. Although this behavior may appear
to be a drawback, the contrast is still sufficient to clearly
highlight the contours of the nickel microscopic grid.
Moreover, the IMS experiments were repeated several times
on different nickel grids, and the results showed that the
inter-day image quality was reproducible.
Copyright # 2010 John Wiley & Sons, Ltd.
RESULTS AND DISCUSSION
The main objective of this work is to efficiently localise,
identify, and differentiate metabolites produced by Plasmo-
para viticola infection at the surface of grapevines leaves.
Three steps were undertaken to succeed in this objective.
First, the experimental analytical conditions were optimised
by considering standards of resveratrol and pterostilbene. In
the second step these compounds were detected on the
surface of a grapevine leaf. Finally, different metabolites
were localised by LDI-IMS on the surface of a grapevine leaf.
Analysis of standard resveratrol andpterostilbene compounds by LDI-MSAfter deposition at the surface of the sample holder both
resveratrol and pterostilbene were analysed by LDI-MS.
These compounds were chosen because of their importance
for grapevine leaves when plants react to biotic and abiotic
stresses. LDI-MS at 266 nm wavelength was preferred to
MALDI analysis to avoid interferences between resveratrol
and pterostilbene and ions produced by laser irradiation at
377 nm wavelength of commonly used matrices such as 2,5-
dihydroxybenzoic acid (DHB) or 4-hydroxycyanocinnamic
acid (HCCA). In addition, both these compounds are also
known to be metabolites or constituents of plants. Finally, a
restricted number of pretreatment steps is also important in
IMS to ensure quick analysis and to avoid sample alteration –
i.e. delocalisation of compounds of interest.
Both negative and positive mass spectra have been
acquired. The positive ion mode appeared to be more
suitable and allowed the detection of ions associated with
both resveratrol and pterostilbene. The positive LDI-ToF
mass spectra of both stilbenes, reported in Fig. 3, yielded
molecular radical ions at m/z 228.078 and 256.108 for
resveratrol and pterostilbene, respectively. The signal-to-
noise (S/N) ratio appeared to be higher for resveratrol. No
ions corresponding to proton, sodium or potassium adducts
of the stilbenes molecules were detected under the
experimental conditions used. The 266 nm LDI mass
spectrum of pterostilbene also yielded an intense signal at
m/z 254.094, which was assigned to the [M–2H]þ.
ion. LDI-
MS of pterostilbene was also conducted at the 337 nm
wavelength, where the absorption of pterostilbene in
methanol is greater than is generally reported at 266 nm.
Rapid Commun. Mass Spectrom. 2010; 24: 335–342
DOI: 10.1002/rcm

Figure 3. LDI-ToF mass spectra of (a) resveratrol and (b)
pterostilbene; in insert, expansion around molecular cation
peaks.
338 G. Hamm et al.
The S/N ratio observed for the m/z 256.108 ion decreased by a
factor of 40 at 337 nm compared with what was obtained at
266 nm. This may be explained by considering both the
theoretical calculations and the REMPI experiments per-
formed on resveratrol. Unfortunately, no data were found for
pterosilbene. The vertical ionisation energy of resveratrol
was found to be close to 6.76 eV.31 Consequently, vertical
ionisation may be a one-color two-photon process at both 266
and 337 nm wavelengths for which the energy per photon is
4.66 and 3.68 eV, respectively. Nevertheless, REMPI exper-
iments32 have demonstrated that photoionisation in the gas
phase is optimum at the 302.1 nm wavelength, which seems
Figure 4. Photoisomerisation and phot
Copyright # 2010 John Wiley & Sons, Ltd.
to indicate that the S1 excited level is 4.10 eV above the S0
ground state. Consequently, ionisation of resveratrol and to
some respect of pterostilbene is definitely more efficient at
266 nm than at 337 nm because of the inefficient S0!S1
transition at the latter wavelength.33 Consequently, 266 nm
appeared to be the more suitable desorption wavelength for
the investigation of both metabolite stilbene compounds by
mass spectrometry. Moreover, this wavelength also increases
the sensitivity for the detection of other leaf cuticle-related
compounds.34 Another interesting difference in the exper-
iments performed on pterostilbene at 266 and 337 nm is the
behavior of the [M–2H]þ.
ion detected at m/z 254.094, which
was found to be predominant at 266 nm and absent at the
337 nm wavelength. The formation of this fragment ion can
be explained by a two-step photochemical process, which
involves the conversion of a methoxylated stilbene com-
pound into a phenanthrene-like species as was observed for
tetra-methoxylated stilbene.35 In a first step, 266 nm UV
irradiation leads to a trans-cis isomerisation of pterostilbene.
Elimination of two hydrogen atoms and cyclisation of the
resulting cis-stilbene yields a polysubstituted phenanthrene
compound, which is detected at m/z 254.094 in 266 nm LDI
experiments (see Fig. 4). This process appears to be highly
wavelength- and compound-dependent, and this behavior
was never observed with resveratrol or with pterostilbene at
337 nm. A difference in the activation energy required to
induce trans-cis isomerisation as well as hydrogen atom
elimination may rationalise the experimental evidence. This
aspect is still under study.
In situ analysis of resveratrol and pterostilbenemetabolites on grapevine leavesAfter the identification of the ions detected by LDI-MS of
standard resveratrol and pterostilbene under the exper-
imental conditions used, analysis of the leaves was under-
taken. It has been reported that stilbene biosynthesis is
mainly located on the abaxial side of the leaf.13 Con-
sequently, in situ LDI-ToF experiments were conducted on
this area of the leaf. It should be noted that high laser power
densities are required in these experiments to yield a
representative mass spectrum of the species present at the
surface of the leaf. When experiments were conducted below
a given laser energy, no species were ejected from the surface
of the leaf and no ions were detected.
Figure 5 shows three mass spectra obtained with grape-
vine leaves which have undergone different treatments.
Figure 5(a) is the typical mass spectrum of a standard (no
treatment) grapevine leaf. Figures 5(b) and 5(c) report the
ocyclisation of trans-pterostilbene.
Rapid Commun. Mass Spectrom. 2010; 24: 335–342
DOI: 10.1002/rcm

Figure 5. LDI-ToF mass spectra in positive ion mode of Cabernet Sauvignon leaves (a) without treatment, (b) Plasmopara
viticola-infected, and (c) irradiated. The insert shows the distribution of ions related to resveratrol (left) and pterostilbene (right).
Imaging of metabolites from Vitis vinifera leaves 339
mass spectra of a leaf after biotic (Plasmopara viticola) or
abiotic (UV-C irradiation) stress, respectively. No signals
associated with either resveratrol or pterostilbene phytoa-
lexins were observed in the no-treatment standard (Fig. 5(a)).
Copyright # 2010 John Wiley & Sons, Ltd.
By contrast, significant amounts of these compounds are
highlighted in Figs. 5(b) and 5(c) by the detection of the
m/z 228.078 and 254.094 ions associated (vide supra) with
resveratrol and pterostilbene, respectively. The obtained
Rapid Commun. Mass Spectrom. 2010; 24: 335–342
DOI: 10.1002/rcm

340 G. Hamm et al.
results confirm previously published studies, which report
the formation of these metabolites after abiotic36 or biotic37
stress. Depending on the nature of the stress the relative
distribution of both of these compounds is different.
Plasmopara viticola treatment appeared to yield less resver-
atrol metabolite than UV-C illumination, according to the
relative abundances of the m/z 228.078 and 254.094 ions in the
mass spectra reported in Figs. 5(b) and 5(c). Comparison of
mass spectra obtained in the study of leaf with or without
UV-C irradiation clearly indicated that resveratrol and
pterostilbene phytoalexin are not produced and accumulated
in vineyards under the effect of sunlight irradiation. The S/N
ratio of the m/z 228.078 and 254.094 ions should be
interpreted with great caution as indicative of the amounts
of studied phytoalexins. The sample-to-sample S/N vari-
ation may also be invoked to explain the observed
differences, when the mass spectra in Figs. 5(b) and 5(c)
are compared. Nevertheless, additional studies have demon-
strated that stilbene synthesis is more important after UV-C
illumination than during interaction with a pathogen.37 In
some respects, the relative ion signal (S/N ratio) may
consequently be used to compare two leaves, which have
undergone different stress or treatment before the LDI-MS
analysis. More precisely, the MS image reflects the variation
in concentration of a specific molecule in a leaf. Although
absolute quantification is not possible, the variation of
relative ion signal is reproducible and thus it allows the
comparison between two leaves. This approach also
rationalises the use of LDI instead of MALDI in which an
ion suppression effect was often reported in the mass range
close to the m/z values of the MALDI matrix ions. It should
also be noted that detection of both resveratrol and
pterostilbene on leaves submitted to biotic and abiotic stress
is not indicative of their direct or indirect implication in plant
resistance. However, a correlation between stilbene levels
Figure 6. LDI-ToF mass spectrum obtained directly from i
400. The insert shows an enlarged view of them/z 530–640
as internal calibrants.
Copyright # 2010 John Wiley & Sons, Ltd.
and pathogen resistance has been established by previous
works.36
In situ analysis of leaves by LDI-MS also led to the detection
of ions at higher m/z values. More specifically, ions in the m/z
400–700 and 900–1100 ranges were clearly present. As an
example, Fig. 6 reports the mass spectrum obtained when an
untreated grapevine leaf was analysed by 266 nm LDI-MS. To
increase the level of accuracy of the mass measurements,
internal calibration was carried out with the potassium adduct
ions of PEG 600 (starred ions in the mass spectrum reported in
Fig. 6). The relative measured error was in the 1–9 ppm range.
Under these conditions, the m/z 400 to 700 ions were found to
be well described by the formulae CnH2n-4Oþ:4 (see Table 1)
which are consistent with acylium ions. The formulae are
reinforced by FTICRMS data. The observation of these
acylium ions suggests the presence of glycerides.
IMS of grapevine leavesLDI-MS allowed ions related to resveratrol and pterostilbene
to be identified. These results have been used to investigate
by LDI-IMS the spatial distribution of these secondary
metabolites in or at the surface of different kinds of grapevine
leaves. All the IMS experiments were performed using the
optimised experimental conditions defined in the previous
section. Figure 7 reports the optical and the m/z 228.078 and
254.094 LDI-MS images of control, inoculated and UV-C
irradiated grapevine leaves. Depending on the investigated
sample the size of the image varies from 0.9� 1.8 mm
(36� 72 pixels) for the infected and control leaf to 0.5� 1 mm
(19� 39 pixels) for the irradiated leaf.
The m/z 228.078 and 254.094 image of the control leaf
confirmed the results obtained by in situ LDI-MS analysis
(see Fig. 7). Indeed, no signals are observed at m/z values
associated with either the resveratrol or the dehydrogenated
pterosilbene ions. Before considering the results obtained by
noculated Cabernet Sauvignon leaf coated with PEG
region. Peaks labeled with stars are polymer ions used
Rapid Commun. Mass Spectrom. 2010; 24: 335–342
DOI: 10.1002/rcm

Table 1. Main ions observed during LDI-ToFMS and LDI-FTICRMS analysis in positive ionmode of grapevine leaves and possible
elemental formula assignments. (x) denotes not detected
m/z valueAccurate mass
value (exp.)Exact mass
value (theor.)Difference
TOFMS (ppm)Difference
FTICRMS (ppm)Elementalformula
228 228.078 228.0781 0.4 � C14H12Oþ:3
254 254.094 254.09375 0.2 � C16H14Oþ:3
550 550.494 550.49556 2.3 0.5 C35H66Oþ:4
564 564.516 564.51121 8.8 �0.5 C36H68Oþ:4
578 578.527 578.52686 0.2 �1.0 C37H70Oþ:4
592 592.540 592.54251 4.7 �0.6 C38H72Oþ:4
606 606.558 606.55816 0.8 �1.5 C39H74Oþ:4
620 620.579 620.57381 8.0 3.3 C40H76Oþ:4
634 634.591 634.58946 2.7 0.1 C41H78Oþ:4
973 972.928 972.92941 1.5 �0.5 C63H120Oþ:6
1001 1000.939 1000.93924 0.1 �2.1 C65H124Oþ:6
1029 1028.971 1028.97058 0.1 �1.9 C67H128Oþ:6
Figure 7. (a) Optical images of Cabernet Sauvignon leaves irradiated, inoculated and
without treatment. MS images of two stilbenes (b) resveratrol (m/z 228.078) and (c)
pterostilbene (m/z 254.094). (For both control and inoculated leaves, image contrast scale
is the same and normalised to the highest intensity of the ion concerned. Irradiated sample
has its own contrast scale because of the very high signal intensity compared with those of
the two other samples.) Circle represents pathogen attack area.
Imaging of metabolites from Vitis vinifera leaves 341
IMS of stressed grapevine leaves, some mention has to be
made of the Plasmopara viticola pathogen infection mode.
Downy mildew is propagated under leaf tissue and passes
through stomata apertures on the abaxial side of leaf to
exhibit aerial mycelium. It is composed of sporangiophores
and sporangia which are mainly responsible for pathogen
propagation. The amounts of phytoalexins are directly
Copyright # 2010 John Wiley & Sons, Ltd.
related to the degree of pathogen contamination. Optical
microscopy images obtained on a grapevine leaf inoculated
with Plasmopara viticola (Fig. 7(a), center) allowed us to
localise (circle) the aerial mycelium of the pathogen after
downy mildew attack. At this same place the m/z 228.078 and
254.094 ion images (Figs. 7(b) and 7(c), center) contrast
revealed significant amounts of resveratrol and, to a lesser
Rapid Commun. Mass Spectrom. 2010; 24: 335–342
DOI: 10.1002/rcm

342 G. Hamm et al.
extent, pterostilbene. Their spatial distribution may also give
some information on the intra-propagation of pathogen in
tissue. Indeed, the distribution of the ions at m/z 228.078 and
254.094 allows the development of the mycelium near the
sporulation area to be followed.
The m/z 228.078 and 254.094 images of the UV-C-irradiated
leaf highlighted that large amounts of both investigated
stilbenes were detected on the whole surface (Figs. 7(b)
and 7(c), right). In spite of a homogeneous UV-C irradiation,
resveratrol and pterostilbene were not found to be homo-
geneously localised. Difference in their contrasts appeared
and the pterostilbene species was mainly found near or on
the veins on the abaxial surface of the leaf.
As already observed by in situ analysis, some differences in
the response of stilbene-targeted compounds at the surface of
the leaf after abiotic and biotic stress have been found.
Depending on the location, the ion signal is more intense (up
to 5500 arbitrary units) for UV-C-irradiated leaves than for
infected leaves (800 arbitrary units). However, Schmidlin
et al. reported that amounts of pterostilbene produced by
UV-C irradiation were lower than after Plasmopara viticola
infection.37 Their results are consistent with some of the IMS
results (Fig. 7(c)). Pterostilbene, which is mainly concen-
trated in the cell walls or veins of leaves after irradiation, is
thought to be more easily extracted by solvent prior to HPLC
analysis.
CONCLUSIONS
In the field of grapevine studies, the original proposed
imaging approach to directly analyse grapevine leaves by
LDI-ToFMS allows information on the nature and localis-
ation of metabolites induced by biotic (Plasmopara viticola) or
abiotic (UV-C light) stresses to be collected. Simple sample
preparation and ability to easily generate several images
with good spatial resolution (25mm) on a small leaf surface
(0.9� 1.8 mm) are the main advantages of this approach. It
was demonstrated that both resveratrol and pterostilbene
metabolites (two main compounds generated by leaves
against a stress) can be detected in situ and characterised. IMS
allows the localisation of these two compounds to be
accurately defined. After the attack by downy mildew,
LDI-ToFMS images of inoculated Cabernet Sauvignon leaf
revealed a co-localisation of resveratrol and pterostilbene
near the downy mildew lesion. When the leaf was
illuminated by UV-C light, pterostilbene was found to be
localised near or on the veins on the abaxial surface of the
leaf. Resveratrol seemed to be less well localised. Thus,
the proposed analytical protocol allows easy recognition of
the interaction between grapevine leaves and biotic or abiotic
stress to be obtained. Further works will be dedicated to
trying to identify a specific marker of downy mildew
pathogen. This work will simultaneously follow the
propagation of the pathogen and the production of defense
molecules at different stages of the infection, more particu-
larly when Plasmopara viticola has not still sporulated and is
not visible on the surface of the leaf.
Copyright # 2010 John Wiley & Sons, Ltd.
AcknowledgementsThis work received financial support from the Conseil Inter-
professionnel du Vin de Bordeaux (CIVB, Bordeaux, France).
The authors thank Dr Frederic Aubriet and Pr. Patrick
Chaimbault for fruitful discussions. We are grateful to the
team of INRA Colmar laboratory for assistance with plant
material, Dr Lionel Vernex-Loset for technical assistance and
Stefen Clerens for his help on software support.
REFERENCES
1. Dixon RA, Blyden ER, Ellis JS. Origin of phytoalexin. InBiochemical Aspects of Crop Improvement. CRC Press: BocaRaton, 1991; 179.
2. Langcake P. Physiol. Plant Pathol. 1981; 18: 213.3. Dercks W, Creasy LL. Physiol. Mol. Plant Pathol. 1989; 34: 189.4. Dai GH, Andary C, Mondolot-Cosson L, Boubals D. Eur. J.
Plant Pathol. 1995; 101: 541.5. Langcake P, Lovell P. A. Vitis 1980; 19: 321.6. Langcake P, Cornford CA, Pryce RJ. Phytochemistry 1979; 18:
1025.7. Adrian M, Jeandet P, Douillet-Breuil AC, Tesson L, Bessis R.
J. Agric. Food Chem. 2000; 48: 6103.8. Adrian M, Jeandet P, Bessis R, Joubert JM. J. Agric. Food
Chem. 1996; 44: 1979.9. Langcake P, McCarthy W. Vitis 1979; 18: 244.
10. Jean-Denis JB, Pezet R, Tabacchi R. J. Chromatogr. A 2006;1112: 263.
11. Barlass M, Miller RM, Douglas TJ.Am. J. Enol. Vitic. 1987; 38: 65.12. Huang K-S, Lin M, Cheng G-F. Phytochemistry 2001; 58: 357.13. Poutaraud A, Latouche G, Martins S, Meyer S, Merdinoglu
D, Cerovic ZG. J. Agric. Food Chem. 2007; 55: 4913.14. Caprioli RM, Farmer TB, Gile J. Anal. Chem. 1997; 69: 4751.15. Burrell M, Earnshaw C, Clench M. J. Exp. Bot. 2007; 58: 757.16. Zhang H, Cha S, Yeung ES. Anal. Chem. 2007; 79: 6575.17. Luxembourg SL, Mize TH, McDonnell LA, Heeren RMA.
Anal. Chem. 2004; 76: 5339.18. Klerk LA, Altelaar AFM, Froesch M, McDonnell LA, Heeren
RMA. Int. J. Mass Spectrom. 2009; 285: 19.19. Norris JL, Cornett DS, Mobley JA, Andersson M, Seeley EH,
Chaurand P, Caprioli RM. Int. J. Mass Spectrom. 2007; 260: 212.20. Clerens S, Ceuppens R, Arckens L. Rapid Commun. Mass
Spectrom. 2006; 20: 3061.21. Liu Q, Guo Z, He L. Anal. Chem. 2007; 79: 3535.22. Brunelle A, Touboul D, Laprevote O. J. Mass Spectrom. 2005;
40: 985.23. McDonnell LA, Heeren RMA.Mass Spectrom. Rev. 2007; 26: 606.24. Heeren RMA, McDonnell LA, Amstalden E, Luxembourg
SL, Altelaar AFM, Piersma SR. Appl. Surf. Sci. 2006; 252: 6827.25. Bunch J, Clench MR, Richards DS. Rapid Commun. Mass
Spectrom. 2004; 18: 3051.26. Heeren RMA, Kukrer-Kaletas B, Taban IM, MacAleese L,
McDonnell LA. Appl. Surf. Sci. 2008; 255: 1289.27. Bour J, Frache G, Maunit B, Lourette N, Vernex-Loset L,
Krier G, Muller J-F. Proc. 51st ASMS Conf. Mass Spectrometryand Allied Topics. Montreal, 2003.
28. Available: www.maldi-msi.org.29. Spengler B, Hubert M. J. Am. Soc. Mass Spectrom. 2002; 13: 735.30. Guilhaus M. J. Mass Spectrom. 1995; 30: 1519.31. Queiroz AN, Gomes BAQ, Moraes WM Jr, Borges RS. Eur. J.
Med. Chem. 2009; 44: 1644.32. Orea JM, Montero C, Jimenez JB, Gonzalez-Urena A. Anal.
Chem. 2001; 73: 5921.33. Montero C, Orea JM, Munoz MS, Lobo RFM, Urena AG.
Appl. Phys. B-Lasers Optics 2000; V71: 601.34. Sluszny C, Yeung ES, Nikolau BJ. J. Am. Soc. Mass Spectrom.
2005; 16: 107.35. Momotake A, Uda M, Arai T. J. Photochem. Photobiol. A 2003;
158: 7.36. Jeandet P, Douillet-Breuil A-C, Bessis R, Debord S, Sbaghi M,
Adrian M. J. Agric. Food Chem. 2002; 50: 2731.37. Schmidlin L, Poutaraud A, Claudel P, Mestre P, Prado E,
Santos-Rosa M, Wiedemann-Merdinoglu S, Karst F, Merdi-noglu D, Hugueney P. Plant Physiol. 2008; 148: 1630.
Rapid Commun. Mass Spectrom. 2010; 24: 335–342
DOI: 10.1002/rcm
Copyright © 2022 FDOKUMEN