
Physiological tools for irrigation scheduling in grapevine (Vitis vinifera L.)
Upload
independentCategory
view
1download
0
CORRECTION Open Access
Correction: High throughput approaches revealsplicing of primary microRNA transcripts andtissue specific expression of mature microRNAs inVitis viniferaErica Mica1,2†, Viviana Piccolo1†, Massimo Delledonne3, Alberto Ferrarini3, Mario Pezzotti4, Cesare Casati1,
Cristian Del Fabbro5, Giorgio Valle6, Alberto Policriti7, Michele Morgante5,7, Graziano Pesole8,9, M Enrico Pè2,
David S Horner1*
Abstract
The version of this article published in BMC Genomics 2009, 10:558, contains data in Table 1 which are now known
to be unreliable, and an illustration, in Figure 1, of unusual miRNA processing events predicted by these unreliable
data. In this full-length correction, new data replace those found to be unreliable, leading to a more straightfor-
ward interpretation without altering the principle conclusions of the study. Table 1 and associated methods have
been corrected, Figure 1 deleted, supplementary file 1 added, and modifications made to the sections “Deep
sequencing of small RNAs from grapevine leaf tissue” and “Microarray analysis of miRNA expression”. The editors
and authors regret the inconvenience caused to readers by premature publication of the original paper.
Background: MicroRNAs are short (~21 base) single stranded RNAs that, in plants, are generally coded by specific
genes and cleaved specifically from hairpin precursors. MicroRNAs are critical for the regulation of multiple
developmental, stress related and other physiological processes in plants. The recent annotation of the genome of
the grapevine (Vitis vinifera L.) allowed the identification of many putative conserved microRNA precursors, grouped
into multiple gene families.
Results: Here we use oligonucleotide arrays to provide the first indication that many of these microRNAs show
differential expression patterns between tissues and during the maturation of fruit in the grapevine. Furthermore
we demonstrate that whole transcriptome sequencing and deep-sequencing of small RNA fractions can be used
both to identify which microRNA precursors are expressed in different tissues and to estimate genomic coordinates
and patterns of splicing and alternative splicing for many primary miRNA transcripts.
Conclusions: Our results show that many microRNAs are differentially expressed in different tissues and during
fruit maturation in the grapevine. Furthermore, the demonstration that whole transcriptome sequencing can be
used to identify candidate splicing events and approximate primary microRNA transcript coordinates represents a
significant step towards the large-scale elucidation of mechanisms regulating the expression of microRNAs at the
transcriptional and post-transcriptional levels.
* Correspondence: [email protected]
† Contributed equally1Dipartimento di Scienze Biomolecolari e Biotecnologie, Università degli
Studi di Milano, Milano, Italy
Mica et al. BMC Genomics 2010, 11:109
http://www.biomedcentral.com/1471-2164/11/109
© 2010 Mica et al; licensee BioMed Central Ltd. This is an Open Access article distributed under the terms of the Creative CommonsAttribution License (http://creativecommons.org/licenses/by/2.0), which permits unrestricted use, distribution, and reproduction inany medium, provided the original work is properly cited.

Background
This article has been published as a correction for [1].
MicroRNAs (miRNAs) are small (19-24 nt) non-cod-
ing RNAs that play important roles in the regulation of
various cellular processes by inhibiting gene expression
at the post-transcriptional level [2-4]. Many miRNAs
interact with target mRNAs, leading to degradation or
sequestration from the translational apparatus [5,6];
some miRNAs target other non-coding transcripts and
are required for the generation of trans-acting small
interfering RNAs (ta-siRNAs) [7]. miRNAs have been
implicated in the regulation of key developmental, stress
response and other physiological processes. While in
animals many miRNAs are derived from introns or
untranslated regions of coding messages, plant miRNAs
are typically specified by dedicated MIR genes. These
genes are, at least for the most part, transcribed by RNA
polymerase II to yield capped and polyadenylated pri-
mary transcripts (pri-miRNA) [8]. The RNAse III
enzyme Dicer-like-1 (DCL1) mediates the specific exci-
sion of mature miRNAs from the pri-miRNA via the
initial generation of imperfect hairpin precursors (pre-
miRNAs) and the subsequent excision of a duplex con-
sisting of the mature microRNA and its complementary
region (miRNA*) [9,10]. Most, if not all plant miRNAs
then undergo methylation of the 2’ hydroxyl group at
the 3’ ends of this duplex [11] and are subsequently
exported to the cytosol, where one strand, the mature
miRNA, is selectively incorporated into the RNA
Induced Silencing Complex (RISC) which mediates
interactions with target mRNAs [12].
The same, or highly similar mature miRNAs are often
specified by different genomic loci within a species, and
many, but by no means all, miRNAs show broad phyloge-
netic conservation - similar miRNAs are grouped into
families. Several computational methods have been devel-
oped to identify putative pre-miRNAs by evaluating the
capacity of the genomic context of sequences similar to
known mature miRNAs to form hairpin structures exhibit-
ing structural and thermodynamic features consistent with
known pre-miRNAs (e.g. [13]). Purely ab-initio
approaches to the prediction of non-conserved (lineage-
specific) miRNAs have also yielded some notable successes
(e.g. [14]), although such approaches are often plagued by
an excess of false positive results. The most reliable
method to identify putative novel pre-miRNAs remains
the sequencing of small RNA fractions [11,15-21] coupled
with the identification of plausible hairpin structures in
flanking genomic sequences (e.g. [22]).
Once mature miRNA sequences have been identified,
their expression in different tissues, developmental
stages or environmental conditions can be studied
through experimental approaches such as northern
blotting, oligonucleotide arrays or deep-sequencing of
isolated small RNA fractions. However, the fact that
identical or highly similar mature miRNAs can derive
from multiple loci within a single genome limits the
capacity of such approaches to determine which geno-
mic precursor loci are truly expressed.
Meaningful insight into the regulation of miRNA
expression at the transcriptional and other levels is
undoubtedly desirable in the context of post-genomic and
systems biology initiatives. However, large scale and in-
silico studies of the regulation of transcription of miRNAs
require accurate definition of primary transcript coordi-
nates on a genomic sequence, or at the very least, fairly
accurate estimates of transcriptional start sites. Owing to
their typically short physiological half-life, relatively few
pri-miRNAs have been found in EST and large-scale full-
length cDNA sequencing projects in plants. For the same
reasons, manual cloning and characterization of primary
miRNAs is a laborious process, and has been performed
for relatively few plant miRNAs [8,23-25].
To date, large-scale analysis of expression of plant
miRNAs and associated prediction of precursor
sequences have been restricted to relatively few species
and the paucity of complete plant genome sequences
limits the possibilities for studies incorporating extensive
genomic information. The recently published genome
sequence of the grapevine (Vitis vinifera L.) [26] pro-
vides the first opportunity to study the potential roles of
miRNAs in fruit maturation and other physiological pro-
cesses of a commercially important species in the con-
text of a complete genome sequence.
We have previously used comparative methods to pre-
dict 140 putative pre-miRNAs (representing 28 con-
served miRNA families) in the grapevine genome [26].
Here we present experimental validation of a large num-
ber of these predictions using several high throughput
methodologies. Oligonucleotide arrays reveal that several
of these families show significant changes in expression
levels in different tissues and during fruit maturation.
Small RNA deep-sequencing allowed the precise defini-
tion of boundaries of mature miRNA sequences where
comparative predictions left some ambiguity. Addition-
ally, we demonstrate that deep sequencing of the polyA+
transcriptome permits the precise identification of
which candidate precursors are expressed in different
tissues and shows that, in many cases, fairly precise esti-
mates of primary transcript coordinates may be inferred
from such data. Finally, we show that patterns of spli-
cing and alternative splicing of pri-miRNAs may be elu-
cidated from whole transcriptome deep sequencing data
and confirm that a significant proportion of grapevine
pri-miRNAs are subjected to such processes, consistent
with the suggestion that post-transcriptional regulation
Mica et al. BMC Genomics 2010, 11:109
http://www.biomedcentral.com/1471-2164/11/109
Page 2 of 15

might play a widespread role in the regulation of plant
miRNA maturation.
Results and Discussion
In the previous description of 8.4 fold coverage assembly
of the grapevine (Vitis vinifera L.) genome [26] we iden-
tified 164 candidate conserved miRNAs. Here we pre-
sent a comprehensive characterization of conserved
miRNAs in grapevine including a refinement of mature
miRNA sequences and important information regarding
pattern of expression of both mature miRNAs and pre-
cursors. Three complementary approaches were fol-
lowed to characterize the expression pattern of both the
mature miRNAs and their precursors. To allow a com-
parison between methods, all technologies were applied
to leaf tissue. Whole transcriptome deep sequencing was
performed on all tissues available from the highly homo-
zygote sequenced clone PN40024. To maximize the cov-
erage of tissues studied, microarray and 454
transcriptomic analyses were performed on berries -
organs of particular agronomic importance - from other
clones as they cannot be easily obtained from the very
weak PN40024 clone.
Comparative prediction of microRNA precursors
We previously used the MicroHarvester software [13]
with all plant miRNAs present in release 9.1 of miRBase
[27] to identify 164 candidate conserved miRNAs and
their precursors in the 8.4 fold coverage assembly of the
genome of the grapevine (Vitis vinifera L.) [26]. Manual
refinement of these predictions provided 140 high-confi-
dence candidate pre-miRNAs classified in 28 conserved
families (79 unique predicted mature microRNA
sequences).
For the most part, we confirm existing patterns of
miRNA family conservation with respect to completely
sequenced plant genomes for which extensive analyses
of miRNAs have been performed (Arabidopsis thaliana,
Populus trichocarpa, Oryza sativa and Physcomitrella
patens). Of the 28 families for which we identified puta-
tive precursor sequences in Vitis vinifera (Table 1), 9
are represented in all four of these species and a further
10 have been characterized in all three magnoliophytes.
One family (miR403) is present in both of the previously
sequenced Dicots, while two previously Arabidopsis-spe-
cific families (miR828 and miR845) were predicted in
grapevine (suggesting their loss or - as yet - undetected
presence in poplar), while miR479 and miR482 (anno-
tated only in poplar and grapevine) are likely to have
evolved in a common ancestor of these organisms after
its divergence from the Arabidopsis lineage [26].
miR477 precursors have been characterized only in
poplar, grapevine and P. patens, while a series of
miR535 precursors represent the first members of this
family to be identified in core eudicots, having been
identified only in P. patens, rice and more recently in
the California poppy (Eschscholzia californica) [28]. The
only families tested for which members have been iden-
tified in poplar and at least one other of the aforemen-
tioned genomes but for which microHarvester failed to
identify candidate precursors in the grapevine genome
were miR472, miR530 and miR827.
With respect to the reference annotation of protein
coding genes in the Vitis vinifera genome, 127 putative
pre-miRNAs were intergenic in location (17 overlapped
with annotated genes but on the non-coding strand).
Four precursor predictions fell within or overlapped
annotated coding or UTR exons although homology
searches and transcriptomics data generated subse-
quently to the initial annotations call into question the
validity of all but two of these exon annotations. miRNA
156 h is probably an incorrect prediction derived from a
coincidentally plausible hairpin structure formed by the
opposite strand to the presumed target (a Squamosa-
promoter Binding Protein (SBP) box gene). A similar
situation is observed for miR171g which falls on the
opposite strand to to a GRAS domain transcription fac-
tor gene. Nine precursor predictions were apparently
intronic in location. Manual checks of the automated
annotations suggested that all of the introns putatively
containing pre-miRNAs were likely to be erroneous pre-
dictions, being atypically long (over 13 kb) and inter-
rupting putative retroelement derived genes or obvious
fusion gene predictions (not shown).
Deep sequencing of small RNAs from grapevine leaf
tissue
We generated 13,078,222 reads with Illumina sequen-
cing of small RNA isolated from Vitis vinifera L. clone
PN40024 leaves. 2,585,821 individual small RNA reads
of 18-27 bases (19.8% of the total reads generated)
yielded at least one perfect match to the draft genome
after removal of adapter sequences and allowing for
post transcriptional oligoadenylation of reads. After
exclusion of reads mapping to annotated structural
RNAs, Over 7% of the total mapped sequences were of
length 21 bases and accounted for 7.8% of the genomic
loci represented by the mapped data (mean redundancy
of 4.38 reads/locus). 15% of loci represented were of
length 24 (10.7% of tags sequenced) with a mean redun-
dancy of 3.08 reads/locus, suggesting, in accord with
other studies [29,30], that miRNAs in our sample tend
to be expressed at higher levels or processed more spe-
cifically than the more heterogeneous 24 base small
RNAs.
Mapping of the short tags onto the genome sequence
revealed that of the 28 families predicted by our com-
parative analysis, 23 showed at least one sequence tag
Mica et al. BMC Genomics 2010, 11:109
http://www.biomedcentral.com/1471-2164/11/109
Page 3 of 15
either in exact or very close correspondence to the posi-
tion of one of the predicted mature sequences (the
exceptions being miR395, miR396, miR477, miR828 and
miR845). In some cases, the most commonly observed
sequences were identical to the predicted mature
sequences while for other families, the predominant
mature miRNA sequenced exhibited small variations
(shifts or differences of length of one or two bases) with
respect to the predicted mature sequences. This finding
was not unexpected given the variation in mature
miRNA lengths within families observed in other plant
species and the nature of the comparative method used
to generate the initial predictions. For predicted precur-
sors for which matching small RNA reads were recov-
ered, the vast majority of reads conform to the
sequences indicated in Table 1 [see also Additional File
1: Supplemental figure S2], consistent with the primary
requirement for the annotation of plant miRNA
sequences [31].
We recovered a number of reads that include an addi-
tional 3’ base that does not correspond to any genomic
locus, this tendency has been observed in other species
(e.g. [29]). Furthermore, a low but notable proportion of
mapped small RNA sequences show mismatches to the
genomic sequence while preferentially mapping only to
putative miRNA precursor loci. This is probably due to
errors in sequencing or during reverse transcription or
amplification and particularly to the higher error rate of
the Illumina sequencing strategy in GC rich sequences
[32]. During the course of these analyses it became clear
that two precursors (miR172a and 172b) were likely to
derive from the opposite strand from that initially pre-
dicted. Where appropriate, corrected mature sequences
have been deposited in miRBase.
Due to identity or similarity among mature miRNAs
belonging to the same family, deep sequencing of small
RNAs does not allow consistent unambiguous assign-
ment of mature miRNAs to their genomic loci of origin.
Nevertheless our analysis provided indications of the
presence and relative abundance of 36 distinct mature
miRNAs from conserved families in leaves - correspond-
ing to up to 65 distinct precursor loci (see Table 1 for
summary and Additional File 1: Supplemental figure S2
for detailed maps of all small RNA reads mapping to
predicted precursors).
Oligonucleotide arrays
A 12 K CombiMatrix custom array was developed to
validate our in-silico miRNA predictions and to profile
miRNAs expression in different tissues.
Slides were hybridized with low molecular weight
RNA (LMW-RNA), extracted from six grapevine (V.
vinifera L. cv Corvina) tissues: ripening berries (three
stages analyzed), roots, leaves and young inflorescences.
Each hybridization and LMW-RNA extraction was per-
formed twice.
In addition to the mature miRNA sequences, the
probe set included probes shifted 5 or 10 bases 3’ or 5’
with respect to the central base of the corresponding
mature miRNAs as well as probes derived from regions
of the stem not predicted to overlap with the mature
miRNA sequence and controls containing maximally
destabilizing substitutions with respect to probe
sequences [see Additional File 2: Supplemental figure
S5]. Except for probes shifted 5 nucleotides towards the
5’ end of the miRNA precursor, for more than 90% of
the probes a signal drop-off greater than 90% was
observed - indicating no significant hybridization for
these probes occurred. On the contrary, for probes
shifted 5 nucleotide towards the 5’ end of the miRNA
precursor the lack of signal drop-off might be due to
the fact that probes were synthesized with their 3’ ter-
mini towards the slide, and that no “spacer” oligonu-
cleotide was used (according to CombiMatrix
protocols). As a consequence, steric effects might reduce
the specificity determined by the 3’-most five bases of
the probes.
Other than for 26 out of 140 pre-miRNAs (Table 1),
no detectable signals were recorded for the probes
designed on the precursor loop regions - likely due to
size fractionation of RNA samples and the relatively
short half-life of pre-miRNAs. We conclude that our
miRNA expression data are principally derived from
mature miRNAs molecules, without appreciable pre-
miRNA contamination.
Finally, it should be noted that recent studies have
demonstrated appreciable levels of cross-hybridization
between closely related miRNAs and probes differing by
only one or two bases [33]. It is therefore difficult to
exclude the possibility that cross-hybridization within
miRNA families causes a distortion of quantitative esti-
mates of expression levels of some individual mature
miRNA sequences.
Microarray analysis of miRNA expression
Of the mature miRNA sequences considered, 56 (corre-
sponding to 23 different families), showed significant
expression in at least one tissue tested (Table 1 and
Additional File 1: Supplemental Figure S1), and another
6 showed a borderline signal. Specifically, 41 different
miRNAs showed significant signal in roots, 47 in leaves,
49 in young inflorescences, 53 in green berries, 42 in
berries at veraison (the point where growth ends and
maturation begins) and 40 in mature berries.
To evaluate the statistical significance of the differen-
tial expression of mature miRNAs in the six tissue con-
sidered, we set up two distinct comparisons: one among
the three developmental stages of the ripening berries
Mica et al. BMC Genomics 2010, 11:109
http://www.biomedcentral.com/1471-2164/11/109
Page 4 of 15

Table 1 Expression of mature- and pre-miRNAs in Vitis vinifera
miRNA Sequence Expression data miRNA Sequence Expression data
A B C D A B C D
MIR156A UGACAGAAGAGAGGGAGCAC 0* ____ N __I___ MIR171G UUGAGCCGAACCAAUAUCACC 0 __RC N R*L*I*___
MIR156B UGACAGAAGAGAGUGAGCAC 34 ___C N ______ MIR172A UGAGAAUCUUGAUGAUGCUGCAUC 4 _S_C N ______
MIR156C UGACAGAAGAGAGUGAGCAC 34 ____ N ______ MIR172B UGAGAAUCUUGAUGAUGCUGCAUC 4 ____ N ______
MIR156D UGACAGAAGAGAGUGAGCAC 34* LSRC N ______ MIR172D AGAAUCUUGAUGAUGCUGCAU 0 ____ N _LIBgBv_
MIR156E UGACAGAGGAGAGUGAGCAC 0 ____ N ______ MIR172C GGAAUCUUGAUGAUGCUGCAG 0 ____ N _LIBgBv_
MIR156F UUGACAGAAGAUAGAGAGCAC 926 _S__ N RLIBgBvBm MIR319B UUGGACUGAAGGGAGCUCCCU 1 ____ N RLIBgBvBm
MIR156G UUGACAGAAGAUAGAGAGCAC 923* LS_C N RLIBgBvBm* MIR319C UUGGACUGAAGGGAGCUCCCU 1 _S__ N RLIBgBvBm
MIR156I UUGACAGAAGAUAGAGAGCAC 923* _S__ N RLIBg*BvBm MIR319E UUUGGACUGAAGGGAGCUCCU 0 _S_C Y RLIBgBvBm
MIR156H UGACAGAAGAGAGAGAGCAU 0 LS__ Y ______ MIR319G UUGGACUGAAGGGAGCUCCCA 2 ___C N RLIBgBvBm
MIR159A CUUGGAGUGAAGGGAGCUCUC 0 ____ N RLIBgBvBm MIR319F UUGGACUGAAGGGAGCUCCCU 1 _S__ N RLI*BgBv*Bm*
MIR159B CUUGGAGUGAAGGGAGCUCUC 0 ____ N RLIBgBvBm MIR390 AAGCUCAGGAGGGAUAGCGCC 1 _S__ N RLIBgBvBm
MIR159C UUUGGAUUGAAGGGAGCUCUA 173 LSRC N RLIBgBvBm MIR393A UCCAAAGGGAUCGCAUUGAUC 1 ____ Y RLIBgBvBm
MIR160A UGCCUGGCUCCCUGAAUGCCAUC 1 ____ N RLI*BgBv*Bm* MIR393B UCCAAAGGGAUCGCAUUGAUC 1 LS__ Y RLIBgBvBm
MIR160B UGCCUGGCUCCCUGAAUGCCAUC 1 ____ Y RLIBgBvBm MIR394A UUGGCAUUCUGUCCACCUCCAU 1 _S__ N ______
MIR160E UGCCUGGCUCCCUGAAUGCCAUC 1 ____ Y RLIBgBvBm MIR394B UUGGCAUUCUGUCCACCUCC 0 LS_C N ______
MIR160C UGCCUGGCUCCCUGUAUGCCA 2* _SRC N RLIBgBvBm* MIR394C UUGGCAUUCUGUCCACCUCCAU 2 ____ N ______
MIR160D UGCCUGGCUCCCUGUAUGCCA 2 ____ N RLIBgBvBm MIR395A CUGAAGUGUUUGGGGGAACUC 0 ____ N RLIBgBvBm
MIR160F UGCCUGGCUCCCUGUAUGCCA 2 ____ N RL*IBg*Bv*Bm MIR395B CUGAAGUGUUUGGGGGAACUC 0 ____ N RLIBgBvBm
MIR162 UCGAUAAACCUCUGCAUCCAG 5 LS_C Y RLIBgBvBm MIR395C CUGAAGUGUUUGGGGGAACUC 0 ____ N RLI*BgBvBm
MIR164A UGGAGAAGCAGGGCACGUGCA 7 ____ N RLIBg__ MIR395D CUGAAGUGUUUGGGGGAACUC 0 ____ N RLIBgBvBm
MIR164C UGGAGAAGCAGGGCACGUGCA 7 L___ N RLIBg__ MIR395E CUGAAGUGUUUGGGGGAACUC 0 ____ N RLIBgBvBm
MIR164D UGGAGAAGCAGGGCACGUGCA 7 ____ N RLIBg__ MIR395F CUGAAGUGUUUGGGGGAACUC 0 ____ N RLIBgBvBm
MIR164B UGGAGAAGCAGGGCACAUGCU 0 ____ N _LI*Bg__ MIR395L CUGAAGUGUUUGGGGGAACUC 0 ____ N RLIBgBvBm
MIR166A UCGGACCAGGCUUCAUUCC 43* LSRC Y RLIBgBvBm MIR395M CUGAAGUGUUUGGGGGAACUC 0 ____ N RLIBgBvBm
MIR166B UCGGACCAGGCUUCAUUCC 43* LS__ N RLIBgBvBm MIR395G CUGAAGUGUUUGGGGGAACUC 0 ____ N RLIBgBvBm
MIR166C UCGGACCAGGCUUCAUUCCCC 63* LSRC N RLIBgBvBm MIR395H CUGAAGUGUUUGGGGGAACUC 0 ____ N RLIBgBvBm
MIR166D UCGGACCAGGCUUCAUUCCCC 63 _S__ N RLIBgBvBm MIR395I CUGAAGUGUUUGGGGGAACUC 0 ____ N RLIBgBvBm
MIR166E UCGGACCAGGCUUCAUUCCCC 63* _SRC N R*LI*Bg*Bv*Bm* MIR395J CUGAAGUGUUUGGGGGAACUC 0 _S__ N RLIBgBvBm
MIR166F UCGGACCAGGCUUCAUUCCCC 63* ____ N RLIBgBvBm MIR395K CUGAAGUGUUUGGGGGAACUC 0 ____ N RLIBgBvBm
MIR166G UCGGACCAGGCUUCAUUCCCC 63* ____ N RLIBgBvBm* MIR395N CUGAAGAGUCUGGAGGAACUC 0 ____ N _L____
MIR166H UCGGACCAGGCUUCAUUCCCC 63 _S_C N RLIBgBvBm MIR396B UUCCACAGCUUUCUUGAACU 0* LS_C N RL_Bg__
MIR167A UGAAGCUGCCAGCAUGAUCUG 0* L_RC N RLIBgBvBm MIR396A UUCCACAGCUUUCUUGAACUA 0 _S__ N RL_Bg__
MIR167B UGAAGCUGCCAGCAUGAUCUA 25 L__C Y RL*IBg*BvBm MIR396C UUCCACAGCUUUCUUGAACUG 0 ____ N RL_Bg__
MIR167C UGAAGCUGCCAGCAUGAUCUC 0 ____ N RLIBgBvBm MIR396D UUCCACAGCUUUCUUGAACUG 0 _S_C N RL_Bg__
MIR167D UGAAGCUGCCAGCAUGAUCUA 6 LS__ N RLIBgBvBm MIR397A UCAUUGAGUGCAGCGUUGAUG 2* LS_C N R__Bg__
MIR167E UGAAGCUGCCAGCAUGAUCUA 30 ____ N RLIBgBvBm MIR397B UCAUUGAGUGCAGCGUUGAUG 2* ____ N R__Bg__
MIR168 UCGCUUGGUGCAGGUCGGGAA 3* LSRC Y RLIBgBvBm MIR398A UGUGUUCUCAGGUCACCCCUU 0 _SRC N RL_Bg__
Mica
etal.BMCGenomics
2010,11:109
http
://www.biomedcentra
l.com/1471-2164/11/109
Page5of15

Table 1: Expression of mature- and pre-miRNAs in Vitis vinifera (Continued)
MIR169B UGAGCCAAGGAUGGCUUGCCG 0 ____ N _L__BvBm MIR398B UGUGUUCUCAGGUCGCCCCUG 2 LSRC N R__Bg__
MIR169H UGAGCCAAGGAUGGCUUGCCG 0 ____ N _L__ BvBm MIR398C UGUGUUCUCAGGUCGCCCCUG 2* LSRC N R__Bg__
MIR169A CAGCCAAGGAUGACUUGCCGG 0 ____ N _LIBgBvBm MIR399A UGCCAAAGGAGAAUUGCCCUG 0 L___ N R_I___
MIR169C CAGCCAAGGAUGACUUGCCGG 0 ____ N _LIBgBvBm MIR399H UGCCAAAGGAGAAUUGCCCUG 0 L___ N R_I___
MIR169J CAGCCAAGGAUGACUUGCCGG 0 ____ N _LIBgBvBm MIR399B UGCCAAAGGAGAGUUGCCCUG 0 ____ N R__Bg_Bm
MIR169K CAGCCAAGGAUGACUUGCCGG 0 ____ N _LIBgBvBm MIR399C UGCCAAAGGAGAGUUGCCCUG 0 ____ N R__Bg_Bm
MIR169S CAGCCAAGGAUGACUUGCCGG 0 ____ N _LI*BgBvBm MIR399I CGCCAAAGGAGAGUUGCCCUG 1 L_RC N R__Bg_Bm
MIR169W CAGCCAAGGAUGACUUGCCGG 0 ____ N _LIBgBvBm MIR399D UGCCAAAGGAGAUUUGCUCGU 0 ____ N ______
MIR169L GAGCCAAGGAUGACUUGCCGU 0 ____ N _LIBgBvBm MIR399E UGCCAAAGGAGAUUUGCCCGG 0 ___C N ______
MIR169M GAGCCAAGGAUGACUUGCCGG 0 ____ N _LI*BgBv*Bm* MIR399F UGCCGAAGGAGAUUUGUCCUG 0 ____ N ______
MIR169N GAGCCAAGGAUGACUUGCCGG 0 ____ N _L*I*Bg*Bv*Bm* MIR399G UGCCAAAGGAGAUUUGCCCCU 0 ____ N R_I__Bm
MIR169O GAGCCAAGGAUGACUUGCCGC 0 ____ N _LIBgBvBm MIR403A UUAGAUUCACGCACAAACUCG 4* ____ N RLIBgBvBm
MIR169P GAGCCAAGGAUGACUUGCCGG 0 ____ N _LIBgBvBm MIR403B UUAGAUUCACGCACAAACUCG 4 ____ N RLIBgBvBm
MIR169Q GAGCCAAGGAUGACUUGCCGG 0 ____ N _LIBgBvBm MIR403C UUAGAUUCACGCACAAACUCG 4* ___C N RLI*BgBvBm*
MIR169E UAGCCAAGGAUGACUUGCCUGC 1 L___ N _LIBgBvBm MIR403D UUAGAUUCACGCACAAACUCG 4 ____ N RLIBgBvBm
MIR169F CAGCCAAGGAUGACUUGCCGA 0 ___C N _LIBgBvBm* MIR403E UUAGAUUCACGCACAAACUCG 4* ____ N RLIBgBvBm
MIR169G CAGCCAAGGAUGACUUGCCGA 0 _S__ N _LIBgBvBm MIR403F UUAGAUUCACGCACAAACUCG 4* _SRC N RLIBgBvBm
MIR169R UGAGUCAAGGAUGACUUGCCG 0 ____ N _LI*BgBv*Bm* MIR408 AUGCACUGCCUCUUCCCUGGC 6* LSRC Y RLIBgBvBm
MIR169T CGAGUCAAGGAUGACUUGCCG 0 ____ N _L*I*Bg*Bv*Bm* MIR477 AUCUCCCUCAAAGGCUUCCAA 0 ____ N ___BgBvBm
MIR169U UGAGUCAAGGAUGACUUGCCG 0 ____ N _L*I*Bg*Bv*Bm* MIR479 UGUGGUAUUGGUUCGGCUCAUC 2* ____ N ______
MIR169V aAGCCAAGGAUGAAUUGCCGG 0 ____ N __IBg__ MIR482 UCUUUCCUACUCCUCCCAUUCC 5* LSRC Y ______
MIR169X UAGCCAAGGAUGACUUGCCUA 0 ____ Y _LIBgBvBm MIR535A UGACAACGAGAGAGAGCACGC 42* ____ Y RLIBgBvBm
MIR169Y UAGCGAAGGAUGACUUGCCUA 0 ____ N __I___ MIR535B UGACAACGAGAGAGAGCACGC 80* ____ Y RLIBgBvBm
MIR169I GAGCCAAGGAUGACUGGCCGU 0 ____ N _L_Bg__ MIR535C UGACAACGAGAGAGAGCACGC 80* ____ Y RLI*BgBv*Bm
MIR169D CAGCCAAGAAUGAUUUGCCGG 0 ____ N ______ MIR535D UGACAACGAGAGAGAGCACGC 80* ____ Y RLIBgBvBm
MIR171B UGAUUGAGCCGCGUCAAUAUC 0 ____ N R_____ MIR535E UGACAACGAGAGAGAGCACGC 80* ____ Y RLIBgBvBm
MIR171C UGAUUGAGCCGUGCCAAUAUC 4 ____ N RLIBg__ MIR828A UCUUGCUCAAAUGAGUAUUCCA 0 ____ N ______
MIR171D UGAUUGAGCCGUGCCAAUAUC 4 ____ N RLIBg__ MIR828B UCUUGCUCAAAUGAGUGUUCCA 0 ____ N ______
MIR171A UGAUUGAGCCGUGCCAAUAUC 4 _SRC Y RLIBg__ MIR845A UAGCUCUGAUACCAAUUGAUA 0 ____ N ______
MIR171I UGAUUGAGCCGUGCCAAUAUC 4 ____ N RLIBg__ MIR845B UAGCUCUGAUACCAAUUGAUA 0 ____ N ______
MIR171E UGAUUGAGCCGCGCCAAUAUC 0 ___C N RLI*BgBv*Bm* MIR845C AGGCUCUGAUACCAAUUGAUG 0 ____ N ______
MIR171H UGGUUGAGCCGCGCCAAUAUC 0 ____ N RLIBgBvBm MIR845D UGGCUCUGAUACCAAUUGAUG 0 ____ N ______
MIR171F UUGAGCCGCGCCAAUAUCACU 0 _S__ N RLIBgBv_ MIR845E UGGCUCUGAUACCAAUUGAUG 0 ____ N ______
For each predicted pre-miRNA the table reports: the mature sequence, the number of perfect matching or oligoadenylated short RNA reads observed in leaf, asterisks indicate that corresponding miRNA* sequences
were also recovered by deep sequencing (column A), tissues in which significant expression of the precursor was observed by Illumina whole transcriptome sequencing (column B, where L = leaf, R = root, S = stem,
C = callus), the presence of 454 reads including the precursor sequence in leaf (column C, where Y = yes, N = no), and tissues where the Combimatrix oligoarray showed significant expression of the mature
sequence (column D, where L = leaf, I = inflorescence, R = root, Bg = immature berry, Bv = veraison, Bm = mature berry). Asterisks indicate signal detected for precursor in that tissue. Mature miRNAs are ordered to
reflect expected cases of crosshybridization for oligonucleotide arrays. For all microRNAs, chromosome, strand and coordinates of the precursor miRNA are provided (scaffold coordinates indicate that the miRNA was
situated on a scaffold not incorporated into the 8.4× genome assembly).
Mica
etal.BMCGenomics
2010,11:109
http
://www.biomedcentra
l.com/1471-2164/11/109
Page6of15

and the other one among leaves, roots and inflores-
cences. ANOVA analyses were performed with a P-
value threshold of 0.05 and subsequently a Scheffè test
was used to assess which of the three tissues showed
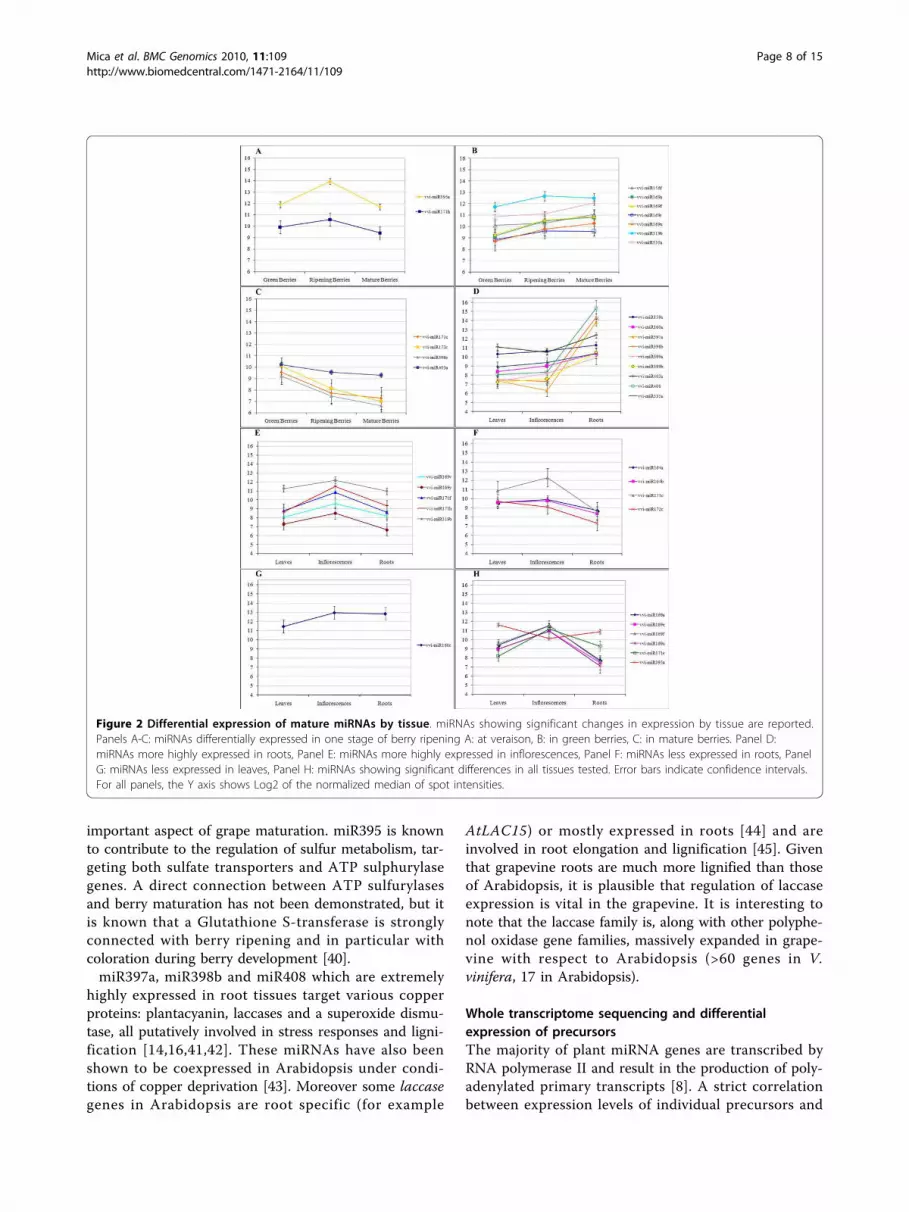
significant differences. Thirteen different mature miR-
NAs showed a statistically significant change in signal
between the ripening stages of the berry (Figure 2A-C),
and 27 miRNAs showed significant changes in their
expression when comparing three different tissues
(leaves, roots and inflorescences)(Figure 2D-H).
miR395a and miR171h show a distinctive pattern of
expression - being highly expressed at veraison with
respect to the other two stages (4.4 and 2.3 fold changes
of expression level respectively) (Figure 2A). Seven miR-
NAs (miR156f, miR169a, miR169f, miR169r, miR169x,
miR319b and miR535a) are more expressed in mature
berries than in green berries (Figure 2B). Four miRNAs
(miR171c, miR172c, miR396c, miR403a) are, on the con-
trary, more expressed in green berries, their expression
decreasing during ripening (Figure 2C).
Clear patterns also emerge from analyses of differen-
tial expression between roots, leaves and young inflores-
cences. Thirteen miRNAs are significantly differentially
expressed in roots, showing a similar expression in the
other tissues. In particular miR397a, miR398b and
miR408 all show at least 100 fold higher expression in
root than either leaf or early inflorescences, while
miR159a, miR160a, miR399a, miR399b, miR403a and
miR535 show more modest, but still significant, changes
in the same comparisons (Figure 2D). On the contrary
miR164a, miR164b, miR171c and miR172c show a sig-
nificantly lower level of expression in roots (Figure 2F).
Five miRNAs (miR169v, miR169y, miR171f, miR171h
and miR319b) yield significantly higher signals in young
inflorescences than both leaves and roots (between 2
and 7.2 fold higher levels in this tissue)(Figure 2E). Only
one miRNA, miR160c, shows a leaf-specific expression
profile (2.5 fold lower level in leaves with respect to
other tissues) (Figure 2G). Finally, six miRNAs
(miR169a, miR169e, miR169f, miR169x, miR171e and
miR395a) exhibit significant differences in expression
levels in all comparisons between leaf, root and
inflorescences (Figure 2H). Five of these miRNAs (169a,
169e, 169f, 169x and 171e) show the highest expression
in young inflorescences and the lowest in roots.
Following the widespread assumption that many
miRNA/target interactions are conserved between
related species [2,3], our data regarding differential
expression of mature miRNA sequences raise some
intriguing possibilities particularly with respect to the
potential importance of miRNA in the regulation of
fruit maturation.
Li et al. [34] recently showed that the transcription
factor NFYA5 is targeted by miR169 and that overex-
pression of miR169 leads to excessive water loss through
leaves and hypersensitivity to drought stress in A. thali-
ana. In this light, the preponderance of miR169 family
members in the group of miRNAs upregulated in
mature berries is striking and might reflect a mechanism
to protect maturing fruit from dehydration. We also
note that miR535 family, identified so far only in O.
sativa and P. patens [35] is upregulated during berry
maturation. This is a first indication of a possible func-
tion of miR535 for which no information was previously
available. miR396c shows 6 fold decrease in expression
during ripening. The mir396 family targets seven
Growth Regulating Factor (GRF) genes in Arabidopsis
[14]. GRF genes encode putative transcription factors
associated with cell expansion in leaf and other tissues
in A. thaliana and O. sativa [36,37]. A potential role for
miR396 in the regulation of cell expansion during fruit
maturation is an intriguing hypothesis. In addition,
recent data also link miR396 to responses to abiotic
stresses including drought [38], again suggesting the
importance of water homeostasis during berry ripening.
miR172, downregulated during berry maturation, targets
Apetala 2 (AP2) -like transcription factors, regulators of
flowering time, organ identity and of vegetative phase
change [39]. In grapevine, genes related to AP2 are
upregulated at veraison, being involved in berry matura-
tion [40] and putatively connected with abiotic and bio-
tic stress resistance. This evidence fits well with our
findings. The sharp up-regulation of miR395 at veraison
suggests a further role for miRNAs in an agronomically
Figure 1 Oligonucleotide design strategy for Combimatrix custom oligonucleotide array. Probes were designed complementary to the
predicted mature miRNA (green line) and miRNA* (thick black line) sequences. Additional probes were designed to the loop region (thin black
line) as well as probes shifted 5 nucleotides (red lines) and 10 nucleotides (blue lines) with respect to the miRNA and miRNA* sequences.
Mica et al. BMC Genomics 2010, 11:109
http://www.biomedcentral.com/1471-2164/11/109
Page 7 of 15
important aspect of grape maturation. miR395 is known
to contribute to the regulation of sulfur metabolism, tar-
geting both sulfate transporters and ATP sulphurylase
genes. A direct connection between ATP sulfurylases
and berry maturation has not been demonstrated, but it
is known that a Glutathione S-transferase is strongly
connected with berry ripening and in particular with
coloration during berry development [40].
miR397a, miR398b and miR408 which are extremely
highly expressed in root tissues target various copper
proteins: plantacyanin, laccases and a superoxide dismu-
tase, all putatively involved in stress responses and ligni-
fication [14,16,41,42]. These miRNAs have also been
shown to be coexpressed in Arabidopsis under condi-
tions of copper deprivation [43]. Moreover some laccase
genes in Arabidopsis are root specific (for example
AtLAC15) or mostly expressed in roots [44] and are
involved in root elongation and lignification [45]. Given
that grapevine roots are much more lignified than those
of Arabidopsis, it is plausible that regulation of laccase
expression is vital in the grapevine. It is interesting to
note that the laccase family is, along with other polyphe-
nol oxidase gene families, massively expanded in grape-
vine with respect to Arabidopsis (>60 genes in V.
vinifera, 17 in Arabidopsis).
Whole transcriptome sequencing and differential
expression of precursors
The majority of plant miRNA genes are transcribed by
RNA polymerase II and result in the production of poly-
adenylated primary transcripts [8]. A strict correlation
between expression levels of individual precursors and
Figure 2 Differential expression of mature miRNAs by tissue. miRNAs showing significant changes in expression by tissue are reported.
Panels A-C: miRNAs differentially expressed in one stage of berry ripening A: at veraison, B: in green berries, C: in mature berries. Panel D:
miRNAs more highly expressed in roots, Panel E: miRNAs more highly expressed in inflorescences, Panel F: miRNAs less expressed in roots, Panel
G: miRNAs less expressed in leaves, Panel H: miRNAs showing significant differences in all tissues tested. Error bars indicate confidence intervals.
For all panels, the Y axis shows Log2 of the normalized median of spot intensities.
Mica et al. BMC Genomics 2010, 11:109
http://www.biomedcentral.com/1471-2164/11/109
Page 8 of 15

levels of mature miRNAs should not be expected.
Mature miRNAs are likely to be, in general, more stable
than their corresponding primary transcripts and may
derive from more than one genomic locus. Furthermore,
recent data in plants [46] and animals [47] suggest that
a variety of mechanisms, including alternative splicing
and the specific binding of protein factors, can regulate
the efficiency with which pri- or pre-miRNAs are pro-
cessed. High levels of primary transcript can thus be
associated with low levels of mature miRNAs and vice-
versa. These considerations notwithstanding, it is rea-
sonable to presume that sequences derived from highly
expressed pri-miRNA transcripts should be represented
in whole transcriptome “deep sequencing” experiments.
To investigate this hypothesis, we have analyzed whole
polyA+ transcriptome data generated with the Illumina
Solexa technology [48] and Roche 454 next generation
sequencing platforms.
A total of 135,047,735 Illumina sequences (33-35
bases in length) derived from polyA+ RNA isolated from
4 tissues (in vitro cultivated juvenile leaf (29,829,113
sequences), in vitro cultivated juvenile stem (30,785,175
sequences), in vitro cultivated juvenile root (29,254,635
sequences) and embryonic callus (45,178,812 sequences)
were mapped to the grapevine genome and coordinates
compared to those for predicted pre-miRNAs.
The statistical significance of the number of reads
mapping within a predicted pre-miRNA was evaluated
(see Materials and Methods) and 52 predicted precur-
sors show significant expression in at least one tissue
(25 in leaf, 38 in stem, 17 in root, 33 in callus)(Table 1).
Many predicted precursors show a wide expression
(miR156d, miR159c, miR166a and c, miR168, miR171a,
miR398a, miR398b and c, miR408, miR482). In some
families, when expressed, precursors show overlapping
patterns. For example, miR319c, miR319e and miR319f
are all expressed in stem, while miR319c and miR319g
are expressed in callus, no expression of miR319 was
detected in leaf or root. A similar situation is observed
for the miR396 family. In other cases, different precur-
sors seem to be predominantly expressed in different
tissues. For example miR171e transcripts are detected
only in callus, miR171f is only transcribed in stem while
miR171g is observed in callus and root - a similar situa-
tion can be observed for several families including
miR166, miR167 and miR169). These data suggest that
tissue specific expression of different precursors within
single families is widespread in the grapevine.
454 sequencing generated 613,098 and 581,655 reads
respectively from leaf and berry polyA+ RNA. The
expression of 15 unique predicted precursor sequences
received ulterior support from these data (Table 1).
With the exception of miR160b and the miR535 family
the expression of all precursors detected by 454
sequencing in leaf was also strongly supported by Illu-
mina data. Interestingly, given the lack of detectable
expression of the mature sequence in leaf or berry,
miR482 precursors were detected at high levels both by
Illumina and 454 sequencing, suggesting post-transcrip-
tional regulation of processing of this transcript.
Estimation of primary microRNA transcripts and splice
sites
For a number of predicted microRNAs the density of
coverage of the corresponding genomic loci was suffi-
cient to attempt to estimate primary transcript coordi-
nates as well as patterns of splicing and alternative
splicing.
We constructed Position Specific Scoring Matrices
(PSSMs) of experimentally validated grapevine canonical
splice donor and acceptor contexts (French-Italian Con-
sortium for Characterization of the Grapevine Genome,
unpublished data) and used these matrices to evaluate
all possible canonical splice donors and acceptors from
3 kb upstream to 3 kb downstream of predicted micro-
RNA precursors showing extensive coverage by Illumina
RNA-Seq reads. The positions and flanking exonic
sequences of all possible splice donor/acceptor pairs
were used to combinatorially generate possible splice
junctions. RNA-Seq reads which did not map perfectly
to the genome sequence were compared to these com-
putationally generated splice junctions and pairs provid-
ing perfect matches (with at least 8 bases on either side
of the splice junction) were recorded along with the tis-
sue distribution of reads supporting each splice event.
Additionally, for each supported splice event, we
recorded the ratio of base coverage by RNA-Seq of the
flanking 40 putatively exonic bases and the coverage of
flanking 40 putatively intronic bases (not including
reads previously identified as covering the putative splice
junction). Three fold greater coverage of exonic regions
was considered as additional support for the presence of
a functional splice junction. Introns inferred from map-
ping of 454 transcriptome reads were also recorded.
Visual examination of RNA-Seq coverage of regions
upstream and downstream of miRNA precursor loci was
used to provide initial estimates of transcript start and
end positions. This step was complicated by the known
propensity of RNA-Seq to provide uneven coverage of
transcript termini - presumably due to the dynamics the
nebulization step in sample preparation and to issues
associated with differential recovery of fragments during
sample preparation. Accordingly, we subjected the 6 kb
interval centered on predicted precursors to promoter
prediction analysis by TSSP-TCM [49] in order to
attempt to provide support for manually identified tran-
scription start sites. Estimated transcript coordinates,
putative intron coordinates quality scores for each
Mica et al. BMC Genomics 2010, 11:109
http://www.biomedcentral.com/1471-2164/11/109
Page 9 of 15

donor/acceptor, frequencies of splice junction-covering
reads, and TSS proposed by TSSP-TCM are reported in
Additional File 1: Supplemental Table S4.
Figure 3 shows the transcriptional landscape for the
genomic region from 3 Kbp upstream to 3 Kbp down-
stream of three exemplar predicted miRNA precursors,
including introns inferred from 454 and Illumina
sequence data, the concordance of splicing events iden-
tified by 454 and Illumina reads is notable and consis-
tent with the reliability of the Illumina data to infer
splicing events. Detailed genomic alignments of all reads
supporting splices indicated in Figure 3 are available in
Additional File 1: Supplemental Figure S4. We note that
relative numbers of tags representing different regions
of putative primary miRNA transcripts vary but tend to
be consistent between different tissues. The GC content
of 100 base windows centered on each genomic position
are also shown and illustrate, within the proposed pri-
mary transcripts, an apparent correspondence between
depth of coverage and GC content [32].
Figure 3A shows the transcriptional context of
miR394b and the presence of a canonical intron sup-
ported by 14 Illumina reads (7 distinct sequences). This
intron was also easily detectable through RACE experi-
ments (see Additional File 1: Supplemental Table S3).
We note that the position of the intron corresponds
well to a region of low, or undetectable levels of Illu-
mina transcriptome coverage, and that tissue specific
differences in Illumina reads mapping to this region are
quite apparent. These data suggest that our approach is
capable of identifying introns in pri-miRNA transcripts
and differences in steady state levels of pri-miRNA tran-
scripts between tissues. Additionally, 3’ RACE
experiments indicated a transcript 3’ end within 20 bp
of the position predicted from RNA-Seq read coverage
(see Additional File 1: Supplemental Table S3).
The miR162 precursor (Figure 3B) is of particular
interest in that it covers a region including several
potential canonical introns that are supported by multi-
ple Illumina and 454 reads. All tissues indicate that the
transcriptional start site falls between positions
4,714,680 - 4,714,687 on chromosome 17. The postu-
lated canonical introns imply alternative splicing of the
nascent primary transcript from this locus, as does the
coverage of the region by 454 contigs (whose map posi-
tions are also consistent with the Illumina data with
respect to the overall coordinates of the nascent primary
transcript). Several of these introns, and the alternative
splicing of this transcript were also supported by preli-
minary RACE experiments (see Additional File 1: Sup-
plemental Table S3). Indeed, while the boundaries of
proposed introns correspond to “shoulders” of falling
transcript coverage, significant levels of reads mapping
within the introns are observed. Interestingly, Hirsch et
al. [46] recently demonstrated that the primary miR162a
transcript of Arabidopsis is subjected to complex pattern
of alternative splicing, similar to that proposed for the
grapevine miR162 transcript. In Arabidopsis, only
unspliced isoforms are capable of yielding mature miR-
NAs. Our findings therefore suggest conservation of
alternative splicing as a key regulatory mechanism in
miR162 expression and indicate that Illumina and 454
transcript data can also be used to identify alternatively
spliced plant pri-miRNAs.
Figure 3C shows evidence for expression of the
miR168 locus. Analogously to miR162, our data suggest
Figure 3 Transcription and splicing of pri-miRNAs in Vitis vinifera. A summary of transcription of genomic loci containing predicted pre-
miRNAs is provided. Illumina whole transcriptome reads per base are reported for four tissues as log(number of reads/expected number of
reads under random distribution of reads). Local GC content, position and strand of predicted pre-miRNA as also shown along with coordinates
of: canonical introns inferred from non-contiguous mapping of Illumina reads (blue bars), 454 reads (black bars) and assembled 454 sequence
contigs (green bars). Predicted genes where present are represented by red bars. Panel A refers to miR394B, panel B to miR162 and panel C to
miR168.
Mica et al. BMC Genomics 2010, 11:109
http://www.biomedcentral.com/1471-2164/11/109
Page 10 of 15

alternative splicing of the pri-mRNA, while the distribu-
tion of 454 contigs is highly consistent with the Illumina
data. Vaucheret et al. [50] showed that AGO1, the target
of miR168 is involved in the regulation of miR168 stabi-
lity. Our data may hint at yet another mechanism of
regulation of this intriguing miRNA.
Of 25 precursor loci chosen on the basis of extensive
RNA-Seq coverage (see Additional File 1: Supplemental
Table S3), 18 showed evidence of transcript splicing and
8 of alternative splicing, suggesting that post-transcrip-
tional modification of miRNA transcripts is likely to be
widespread. It is possible that some splicing events fre-
quently identified by deep sequencing approaches could
be associated with regulation of downstream processing
of transcripts as has been shown for the miR162 tran-
script of Arabidopsis [46]. For miR162 and miR168, this
hypothesis might be consistent with the low levels of
mature microRNA observed by deep-sequencing, in
contrast to the apparently high spliced transcript levels.
For several pre/pri-miRNA loci (notably miR162 and
miR168) we infer several closely related canonical
introns (shared splice donors with splice acceptor sites
shifted by a few tens of bases or vice-versa). We specu-
late that this phenomenon might be due, in part, to the
incapacity of the Nonsense Mediated Decay pathway
(which is dependent on ribosomal scanning of mRNAs
[51] to monitor “erroneous” splicing of non-coding
transcripts.
The estimation of primary transcript coordinates, and
in particular transcription start sites is a critical step
towards the elucidation of specific mechanisms regulat-
ing the expression of miRNAs at the transcriptional
level. Our Illumina transcript reads are non-directional -
it is not possible to establish from which strand of the
genome a transcript is derived. However, we show else-
where that both concomitant transcription of both
genomic strands at single loci and transcription of inter-
genic regions are rare in grapevine (French-Italian Con-
sortium for Characterization of the Grapevine Genome,
unpublished data). Thus, evidence of transcription of
intergenic pre-miRNAs can reasonably be considered as
validation of transcription of the precursor.
The finding that relative depth of coverage of different
regions of primary transcripts is consistent between tis-
sues suggest the presence of systematic biases in either
the procedure used to fragment the cDNA, in amplifica-
tion of fragments for sequencing, or in sequencing effi-
ciency. Dohm et al. [32] observed a strong relationship
between local GC content and depth of coverage with
Illumina genome resequencing. Indeed, we observe a
relationship between local GC content and depth of
coverage - even within regions that show contiguous
coverage and are unlikely to represent introns (correla-
tion between log coverage for positions represented by
at least one sequence and GC content of 100 base win-
dow centered on that position for all bases within 3 kb
of a predicted precursor is >0.25 for all tissues, p = 0).
However, grapevine introns between both coding and
non-coding exons show a low GC content (34.7 and
32.3% respectively) with respect to coding and non-cod-
ing exons (44 and 37.3% respectively) [26]. Thus, it may
be difficult to differentiate between introns and regions
where low coverage is a result of low GC content in
exonic regions on the basis of Illumina transcriptome
data - particularly where levels of template are likely to
be low and a-priori gene models are not available. How-
ever, the discovery that putative splice junctions for pri-
miRNAs can be identified by discontiguous mapping of
illumina reads may help to ameliorate this problem for
plant pri-miRNAs. The fact that we recovered evidence
of alternative splicing of miR162, is consistent with data
from A. thaliana [46] and validates our basic approach.
Indeed, other putative pri-miRNAs, including miR394b
show evidence of splicing from both transcript coverage
and discontiguous mapping of whole transcriptome
reads.
Conclusions
We have used a combination of high throughput
approaches to show highly tissue specific expression of
mature miRNAs in the grapevine Vitis vinifera including
the first evidence of differential expression of miRNAs
during fruit maturation in this species. We have shown
that, for plants at least, whole transcriptome sequence
data can be applied to the detection of differential tran-
scription of putative precursor miRNA loci and to the
detection and definition of pri-miRNAs as well as to the
tentative definition of patterns of splicing in such pre-
cursors. It is probable that similar analyses performed in
lines carrying mutations in genes involved in miRNA
processing (in particular DCL1- plants) will allow more
extensive and accurate definition of miRNA transcripts
on a large scale, eventually facilitating detailed analyses
of promoter sequences and a deeper understanding of
mechanisms of transcriptional regulation of miRNA
genes. Our analyses also suggest that splicing (and alter-
native splicing) of pri-miRNAs may be widespread and
might constitute a general mechanism for the regulation
of miRNAs.
Methods
Plant materials
Grapevine (Vitis vinifera L.) clone PN40024 plants and
callus tissue were cultivated in vitro under standard con-
ditions. For oligonucleotide array analyses, fresh tissues,
with exception of roots (where in vitro cultivated plants
were used), were collected from field-grown V. vinifera
L. cv Corvina. Grape berries were harvested 5, 9 and 15
Mica et al. BMC Genomics 2010, 11:109
http://www.biomedcentral.com/1471-2164/11/109
Page 11 of 15

weeks after flowering, while leaves were collected from
pre-flowering plants, inflorescence samples were col-
lected 3 weeks before flowering.
RNA extraction and deep sequencing
For Illumina deep sequencing, total RNA from PN40024
was extracted with the Spectrum Plant Total RNA Kit
(SIGMA) as directed by the manufacturer. RNA was
DNase treated with RQ1 RNAse-Free DNAse (Promega)
and RNA integrity was checked using an Agilent Tech-
nologies 2100 Bioanalyzer.
Total RNA samples from leaf, root, stem and callus
were processed using proprietary kits at Illumina, Inc. in
Hayward (CA, USA). Briefly, PolyA+ RNA was isolated
from total RNA fragmented using Ambion RNA frag-
mentation buffer. cDNA synthesis was performed with
Invitrogen random hexamer primers and cDNA was
purified using QIAquick PCR spin column (Qiagen).
Ends were blunted and 3’ A overhangs introduced using
T4 DNA polymerase and E. coli DNA polymerase I Kle-
now fragment. cDNAs were ligated to adapters with a
single ‘T’ base overhang. After selection of 150-200 bp
fragments from 2% low-range agarose gel, samples were
amplified by 18 PCR cycles to enrich cDNAs with cor-
rectly ligated adapters and to amplify the amount of
DNA in the library. Samples were loaded on Cluster
Station to create flow cells of CSMA (Clonal Single
Molecular Array) and sequenced on the Illumina plat-
form. RNA-Seq data are available from http://www.
genoscope.cns.fr/externe/gmorse/raw_data/.
Small RNAs (20-30 nt) were isolated from leaf total
RNA by a denaturing PAGE gel. Samples were prepared
for sequencing using proprietary kits at Illumina, Inc
(CA, USA). Briefly, 5’ and 3’-adapters were ligated to
small RNAs. After reverse transcription, a low number
of PCR cycles were used to create a sufficient amount of
cDNA constructs. cDNA sample was then loaded on the
Cluster Station and sequenced at ultra-high throughput
on the Illumina platform. Small RNA sequencing data
are available from the Short Reads Archive (SRA) under
accession number SRS005164.
For 454 transcriptome analysis, polyA+ RNA was iso-
lated from V. vinifera L. cv Corvina leaf and berry tis-
sues by according to Rezaian and Krake [52]. After
reverse transcription using an oligo(dT)-adapter primer
for first strand synthesis, cDNAs were amplified with 18
(leaf) and 17 (berry) cycles of LA-PCR [53]. Normaliza-
tion was carried out by one cycle of denaturation and
reassociation of the cDNA. Reassociated ds-cDNA was
separated from the remaining ss-cDNA (normalized
cDNA) by passing the mixture over a hydroxylapatite
column. After hydroxylapatite chromatography, the ss-
cDNA was amplified with 9 LA-PCR cycles using phos-
phorylated primers. cDNAs were finally purified using
the NucleoSpin ExtractII kit from Macherey & Nagel
and subjected to sequencing on the ROCHE 454 GS
FLX platform according to manufacturer’s instructions.
For oligonucleotide array analyses, total RNA was
extracted from V. vinifera L. cv Corvina tissues and
size fractioned, following the procedure [54] with
minor modifications. Before extracting RNA from ber-
ries, seeds were separated from the rest of the fruit.
Low molecular weight (LMW) RNA was checked for
quality and quantity using the NanoDrop Spectrometer
(ND 1000, Celbio SpA) and the Agilent 2100
Bioanalyazer.
Oligonucleotide arrays
Predicted grapevine miRNA precursor sequences have
been published elsewhere (Jaillon et al., 2007). A Combi-
Matrix 12 K CustomArray was synthesized with 1947
miRNA-specific probes synthesized to test grapevine
miRNA expression profiles.
For each grapevine miRNA precursor, we designed a
set of 20 -22 nt probes specific for the mature miRNA,
the miRNA* and their complementary sequences, as
well as a probe specific for the non mature microRNA
stem/loop region and probes designed on the miRNA
and miRNA* sequences but shifted of five or ten nt, for-
ward and backward in order to test probe specificity.
snRNA U6 and four grapevine tRNA probes were used
as positive controls. Fourteen distinct negative and
mRNA degradation control probes were included. Addi-
tionally, for each specific probe, a mismatch control
with 2 maximally destabilizing substitutions was
included. Each probe was present on the final array in
three replicates. All probe sequences are available in
Additional File 2: Supplemental Table S6.
Slides were hybridized with 3 g of LMW RNA labeled
with Cy5 (Mirus LabelIT miRNA labeling Kit (Mirus
Bio Corp.)). Hybridization and washing were performed
as indicated by CombiMatrix. Slides were scanned with
a Perkin Elmer Scanarray 4000 XL raw data was
extracted with Scanarray Express 4.0 and Microarray
Imager (CombiMatrix) software. After each hybridiza-
tion, slides were stripped according to manufacturer’s
instructions and re-used 5 to 6 times.
Two hybridizations were performed with indepen-
dently extracted LMW RNAs, for each sample. Back-
ground level was defined as the average signal of the
negative and degradation controls plus two times their
standard deviation. The ratio between intensities of the
perfect match probe and its mismatch probe (referred to
as PM/MM) was also used to estimate the reliability of
each signal. Probes with a median signal higher than
background and with PM/MM value higher than 1.2
were called as present. The normalization between
arrays was performed using the quantile normalization
Mica et al. BMC Genomics 2010, 11:109
http://www.biomedcentral.com/1471-2164/11/109
Page 12 of 15

method [55] using the BLIST software, provided by
Combimatrix.
Normalized signals were Log2 transformed and probes
with a low PM/MM ratio (<1.2) were discarded. Differ-
entially expressed genes in various tissues were identi-
fied with a one-way ANOVA test (p-value < 0.05).
Significant results were further investigated with Scheffè
test, a post hoc test to define which tissues showed sig-
nificant differences.
The use of short RNA probes has not proven to be
effective to distinguish between miRNAs that have few
differences, in particular at the first or last nucleotide
[33], therefore microarray data from closely related miR-
NAs have been treated as replicated data. Thus different
miRNA precursors that give rise to almost identical
mature products have been clustered as single entities.
Complete oligonucleotide array experimental design
and data are available from the Gene Expression Omni-
bus [GEO: GSE13801].
RACE experiments
Total RNA was extracted from V. vinifera L. cv Cor-
vina leaves, using a rapid CTAB method, as described
[56], with minor modifications, and DNAse treated
(DNase I from Sigma). The FirstChoice RLM-RACE kit
(Ambion) was used to perform classic 3’ and 5’ RACE
protocols, following manufacturer’s instructions. PCR
products, obtained with gene specific primers
(miR482-5’-Rout-CGGCATAGGATCTGAGTCCAC,
miR482-3’-Finn-AGGAAGAATGGTGGATTCATTA,
miR394b-5’-Rout-CCTCTTTTGTGGCTGTGAGATG,
miR394b-5’-Rinn-TGAAAGAGGCAAAGAGGAGGAG,
miR394b-3’-Fout-CAATCTCTCTCGCTCTTCCACT,
miR394b-3’-Finn-ACATCTCACAGCCACAAAAGAG,
miR162-5’-Rout-GAATTTGGCGTTGTGATGCTAC,
miR162-5’-Rinn-AGAAGAACACAGGGCGGATCT,
miR162-3’-Fout-AGACTCTGGTAGCATCACAACG,
miR162-3’-Finn-GGTTTATCTTCCGATGGAGAAC),
were subsequently cloned in pGEM-T Easy vector (Pro-
mega) and sequenced.
Bioinformatics methods
For small RNA deep sequencing, initial reads of length 33
bases were scanned for the presence of the 5’ part of the
3’ linker sequence 5’-TCGTATGCCGTCTTCTGCTTG-
3’ allowing 2 mismatches. Raw sequences whose last 9-14
bases represented the first 9-14 bases of the 3’ cloning
primer were mapped to the draft genome sequence after
removal of adaptor sequences using the software SOAP
[57]. Whole transcriptome Illumina reads were mapped
to the Vitis vinifera genome using the software SOAP.
Counts of reads mapping to defined genomic loci and
all statistical analyses of cluster densities were per-
formed using custom scripts written in PYTHON.
For Illumina transcriptome data, we estimate the
probability that at least the observed number of reads
should be clustered in the genomic interval defined by
the precursor using the Poisson distribution. Thus, we
exclude all reads mapping to predicted genes, and
search for significant violations (at the 1% confidence
interval) of the null-hypothesis that remaining reads
should be distributed randomly among intergenic
regions. We consider only reads mapping uniquely to a
single genomic locus. Given the expected short half-life
of most primary miRNA transcripts, we believe that
these criteria constitute an extremely conservative test
of precursor expression.
For the genomic regions containing predicted miRNA
precursors, we used ad-hoc PYTHON scripts exploiting
the MatPlotLib library to plot, for each base the log of
the coverage (normalized to the expected coverage
under a null model of random distribution). Thus only
values above zero reflect higher than expected numbers
of transcript-derived matches.
Python scripts were used to generate PSSMs for U2
splice donors and acceptors (3 exonic bases, 14 intronic
bases) and aggregate log scores were used to assign
scores to all possible canonical splice donors and accep-
tors. Custom PYTHON scripts were used to combinato-
rially generate putative splice junctions and SOAP was
employed to map RNA-Seq reads that did not provide
contiguous perfect matches to the genome sequence to
such junctions.
454 and RACE reads were mapped to the Vitis vini-
fera L. genome sequence using preliminary Blast
searches and fine mapping of splice junctions was per-
formed using SPIDEY [58] with default settings for
plant sequences. Only reads where over 85% of the read
length was aligned at over 95% identity were considered.
Additional file 1: Expression data for Vitis vinifera miRNAs.
Supplemental Figure S1: Log expression levels of all predicted miRNAs
in all tissues as detected by oligonucleotide array. Supplemental Figure
S2: Detailed alignments and frequencies of all small RNA reads mapping
to miRNA precursors. Supplemental Table S3: transcript data for 25 Vitis
vinifera miRNAs. Supplemental Figure S4: Splice junction read coverage
for Vvi-miR394b, Vvi-miR162 and Vvi-miR168.
Click here for file
[ http://www.biomedcentral.com/content/supplementary/1471-2164-11-
109-S1.PDF ]
Additional file 2: Oligonucleotide Array probes for analysis of Vitis
vinifera miRNA expression. Supplemental Table S5: All
oligonucleotide array probe sequences.
Click here for file
[ http://www.biomedcentral.com/content/supplementary/1471-2164-11-
109-S2.PDF ]
Acknowledgements
This work was conducted within a scientific cooperation agreement
between the French and Italian Ministries of Agriculture and involving:
Mica et al. BMC Genomics 2010, 11:109
http://www.biomedcentral.com/1471-2164/11/109
Page 13 of 15

Consiglio per la Ricerca e Sperimentazione in Agricoltura (CRA), Regione
Friuli Venezia Giulia and l’Institut National de la Recherche Agronomique
(INRA). This work was financially supported mainly by the Ministero Politiche
Agricole e Forestali, Friuli Innovazione, Federazione BCC, Fondazione CRUP,
Fondazione Carigo, Fondazione CRT, Vivai Cooperativi Rauscedo, Eurotech,
Livio Felluga, Marco Felluga, Venica e Venica, Le Vigne di Zamò (IGA).
Additional financial support was provided by Fondazione Cariverona Project
“Centro di Genomica Funzionale Vegetale”, Fondazione Monte dei Paschi di
Siena and Fondazione Cassa di Risparmio di Lucca.
Author details1Dipartimento di Scienze Biomolecolari e Biotecnologie, Università degli
Studi di Milano, Milano, Italy. 2Scuola Superiore Sant’Anna, Pisa, Italy.3Dipartimento di Biotecnologie, Università degli Studi di Verona, Verona,
Italy. 4Dipartimento di Scienze Tecnologie e Mercati della Vite e Vino,
Università degli Studi di Verona, Verona, Italy. 5Dipartimento di Scienze
Agrarie ed Ambientali, Università degli Studi di Udine, Udine, Italy. 6CRIBI
Biotechnology Centre, Dipartimento di Biologia, Università degli Studi di
Padova, Padova, Italy. 7Istituto di Genomica Applicata, Udine, Italy. 8Istituto
Tecnologie Biomediche, Consiglio Nazionale delle Ricerche, Bari, Italy.9Dipartimento di Biochimica e Biologia Molecolare “E. Quagliariello”,
Università di Bari, Bari, Italy.
Authors’ contributions
EM Extracted RNA for oligonucleotide arrays, performed oligonucleotide
array experiments and analyses of oligonucleotide array data and
contributed to drafting the manuscript. VP designed the oligonucleotide
array, performed analyses of deep sequencing data and contributed to
drafting the manuscript. MEP conceived the project, provided technical
support and contributed to drafting of the manuscript, MD and AF
performed oligonucleotide array experiments and data extraction, MP
provided plant biomass, CC performed analyses of oligonucleotide data, GV
provided 454 sequence data, CDF and AP provided software for mapping of
splice junctions, MM provided Illumina short sequence data, GP supervised
the project, provided technical support and contributed to drafting the
manuscript. DSH provided software for data analyses, performed data
analyses, supervised the project and contributed to drafting the manuscript.
All authors have read and approved the final manuscript.
Received: 12 February 2010
Accepted: 12 February 2010 Published: 12 February 2010
References
1. Mica E, Piccolo V, Delledone M, Ferrarini A, Pezzotti M, Casati C, Del
Fabbro C, Valle G, Policriti A, Morgante M, Pesole G, Pe ME, Horner DS:
High throughput approaches reveal splicing of primary microRNA
transcripts and tissue specific expression of mature microRNAs in Vitis
vinifera. BMC Genomics 2009, 10(1):558.
2. Bartel DP: MicroRNAs: Genomics, Biogenesis, Mechanism, and Function.
Cell 2004, 116(2):281-297.
3. Jones-Rhoades MW, Bartel DP, Bartel B: MicroRNAs and their regulatory
roles in plants. Annual Review of Plant Biology 2006, 57(1):19-53.
4. Mallory AC, Vaucheret H: Functions of microRNAs and related small RNAs
in plants. Nat Genet 2006, 38(Suppl):S31-36.
5. Chen X: A microRNA as a translational repressor of APETALA2 in
Arabidopsis flower development. Science (New York, NY) 2004,
303(5666):2022-2025.
6. Dugas DV, Bartel B: MicroRNA regulation of gene expression in plants.
Current opinion in plant biology 2004, 7(5):512-520.
7. Allen E, Xie Z, Gustafson AM, Carrington JC: microRNA-directed phasing
during trans-acting siRNA biogenesis in plants. Cell 2005, 121(2):207-221.
8. Xie Z, Allen E, Fahlgren N, Calamar A, Givan SA, Carrington JC: Expression
of Arabidopsis miRNA genes. Plant Physiol 2005, 138(4):2145-2154.
9. Han MH, Goud S, Song L, Fedoroff N: The Arabidopsis double-stranded
RNA-binding protein HYL1 plays a role in microRNA-mediated gene
regulation. Proc Natl Acad Sci USA 2004, 101(4):1093-1098.
10. Kurihara Y, Watanabe Y: Arabidopsis micro-RNA biogenesis through Dicer-
like 1 protein functions. Proc Natl Acad Sci USA 2004, 101(34):12753-12758.
11. Park W, Li J, Song R, Messing J, Chen X: CARPEL FACTORY, a Dicer
Homolog, and HEN1, a Novel Protein, Act in microRNA Metabolism in
Arabidopsis thaliana. Curr Biol 2002, 12(17):1484-1495.
12. Vaucheret H, Vazquez F, Crete P, Bartel DP: The action of ARGONAUTE1 in
the miRNA pathway and its regulation by the miRNA pathway are
crucial for plant development. Genes Dev 2004, 18(10):1187-1197.
13. Dezulian T, Remmert M, Palatnik JF, Weigel D, Huson DH: Identification of
plant microRNA homologs. Bioinformatics 2006, 22(3):359-360.
14. Jones-Rhoades MW, Bartel DP: Computational Identification of Plant
MicroRNAs and Their Targets, Including a Stress-Induced miRNA.
Molecular Cell 2004, 14(6):787-799.
15. Llave C, Kasschau KD, Rector MA, Carrington JC: Endogenous and
Silencing-Associated Small RNAs in Plants. Plant Cell 2002,
14(7):1605-1619.
16. Lu S, Sun Y-H, Shi R, Clark C, Li L, Chiang VL: Novel and Mechanical Stress-
Responsive MicroRNAs in Populus trichocarpa That Are Absent from
Arabidopsis. Plant Cell 2005, 17(8):2186-2203.
17. Reinhart BJ, Weinstein EG, Rhoades MW, Bartel B, Bartel DP: MicroRNAs in
plants. Genes Dev 2002, 16(13):1616-1626.
18. Sunkar R, Girke T, Jain PK, Zhu J-K: Cloning and Characterization of
MicroRNAs from Rice. Plant Cell 2005, 17(5):1397-1411.
19. Sunkar R, Girke T, Zhu J-K: Identification and characterization of
endogenous small interfering RNAs from rice. Nucl Acids Res 2005,
33(14):4443-4454.
20. Sunkar R, Zhou X, Zheng Y, Zhang W, Zhu JK: Identification of novel and
candidate miRNAs in rice by high throughput sequencing. BMC Plant Biol
2008, 8:25.
21. Yao Y, Guo G, Ni Z, Sunkar R, Du J, Zhu JK, Sun Q: Cloning and
characterization of microRNAs from wheat (Triticum aestivum L.).
Genome biology 2007, 8(6):R96.
22. Friedlander MR, Chen W, Adamidi C, Maaskola J, Einspanier R, Knespel S,
Rajewsky N: Discovering microRNAs from deep sequencing data using
miRDeep. Nature biotechnology 2008, 26(4):407-415.
23. Megraw M, Baev V, Rusinov V, Jensen ST, Kalantidis K, Hatzigeorgiou AG:
MicroRNA promoter element discovery in Arabidopsis. RNA 2006,
12(9):1612-1619.
24. Warthmann N, Das S, Lanz C, Weigel D: Comparative Analysis of the
MIR319a MicroRNA Locus in Arabidopsis and Related Brassicaceae.
Molecular biology and evolution 2008, 25(5):892-902.
25. Szarzynska B, Sobkowiak L, Pant BD, Balazadeh S, Scheible WR, Mueller-
Roeber B, Jarmolowski A, Szweykowska-Kulinska Z: Gene structures and
processing of Arabidopsis thaliana HYL1-dependent pri-miRNAs. Nucleic
Acids Res 2009, 37(9):3083-3093.
26. Jaillon O, Aury JM, Noel B, Policriti A, Clepet C, Casagrande A, Choisne N,
Aubourg S, Vitulo N, Jubin C, et al: The grapevine genome sequence
suggests ancestral hexaploidization in major angiosperm phyla. Nature
2007, 449(7161):463-467.
27. Griffiths-Jones S, Saini HK, van Dongen S, Enright AJ: miRBase: tools for
microRNA genomics. Nucl Acids Res 2008, 36(suppl_1):D154-158.
28. Barakat A, Wall K, Leebens-Mack J, Wang YJ, Carlson JE, Depamphilis CW:
Large-scale identification of microRNAs from a basal eudicot
(Eschscholzia californica) and conservation in flowering plants. Plant
Journal 2007, 51:991-1003.
29. Moxon S, Jing R, Szittya G, Schwach F, Rusholme Pilcher RL, Moulton V,
Dalmay T: Deep sequencing of tomato short RNAs identifies microRNAs
targeting genes involved in fruit ripening. Genome Res 2008,
18:1602-1609.
30. Vaucheret H: Post-transcriptional small RNA pathways in plants:
mechanisms and regulations. Genes & Development 2006, 20(7):759-771.
31. Meyers BC, Axtell MJ, Bartel B, Bartel DP, Baulcombe D, Bowman JL, Cao X,
Carrington JC, Chen X, Green PJ, et al: Criteria for Annotation of Plant
MicroRNAs. Plant Cell 2008, 20(12):3186-3190.
32. Dohm JC, Lottaz C, Borodina T, Himmelbauer H: Substantial biases in
ultra-short read data sets from high-throughput DNA sequencing.
Nucleic Acids Research 2008, 36(16):e105.
33. Barad O, Meiri E, Avniel A, Aharonov R, Barzilai A, Bentwich I, Einav U,
Gilad S, Hurban P, Karov Y, et al: MicroRNA expression detected by
oligonucleotide microarrays: system establishment and expression
profiling in human tissues. Genome Research 2004, 14(12):2486-2494.
34. Li WX, Oono Y, Zhu J, He XJ, Wu JM, Iida K, Lu XY, Cui X, Jin H, Zhu JK: The
Arabidopsis NFYA5 transcription factor is regulated transcriptionally and
posttranscriptionally to promote drought resistance. Plant Cell 2008,
20:2238-2251.
Mica et al. BMC Genomics 2010, 11:109
http://www.biomedcentral.com/1471-2164/11/109
Page 14 of 15

35. Arazi T, Talmor-Neiman M, Stav R, Riese M, Huijser P, Baulcombe DC:
Cloning and characterization of micro-RNAs from moss. The Plant Journal
2005, 43(6):837-848.
36. Choi D, Kim JH, Kende H: Whole genome analysis of the OsGRF gene
family encoding plant-specific putative transcription activators in rice
(Oryza sativa L.). Plant & Cell Physiology 2004, 45(7):897-904.
37. Kim JH, Choi D, Kende H: The AtGRF family of putative transcription
factors is involved in leaf and cotyledon growth in Arabidopsis. Plant
Journal 2003, 36(1):94-104.
38. Liu H-H, Tian X, Li Y-J, Wu C-A, Zheng C-C: Microarray-based analysis of
stress-regulated microRNAs in Arabidopsis thaliana. RNA 2008,
14(5):836-843.
39. Lauter N, Kampani A, Carlson S, Goebel M, Moose SP: microRNA172 down-
regulates glossy15 to promote vegetative phase change in maize. Proc
Natl Acad Sci USA 2005, 102(26):9412-9417.
40. Terrier N, Glissant D, Grimplet J, Barrieu F, Abbal P, Couture C, Ageorges A,
Atanassova R, Leon C, Renaudin JP, et al: Isogene specific oligo arrays
reveal multifaceted changes in gene expression during grape berry
(Vitis vinifera L.) development. Planta 2005, 222(5):832-847.
41. Sunkar R, Zhu J-K: Novel and Stress-Regulated MicroRNAs and Other
Small RNAs from Arabidopsis. Plant Cell 2004, 16(8):2001-2019.
42. Sunkar R, Kapoor A, Zhu J-K: Posttranscriptional Induction of Two Cu/Zn
Superoxide Dismutase Genes in Arabidopsis Is Mediated by
Downregulation of miR398 and Important for Oxidative Stress Tolerance.
Plant Cell 2006, 18(8):2051-2065.
43. Abdel-Ghany SE, Pilon M: MicroRNA-mediated systemic down-regulation
of copper protein expression in response to low copper availability in
Arabidopsis. Journal of Biological Chemistry 2008, 283(23):15932-15945.
44. McCaig BC, Meagher RB, Dean JF: Gene structure and molecular analysis
of the laccase-like multicopper oxidase (LMCO) gene family in
Arabidopsis thaliana. Planta 2005, 221(5):619-636.
45. Liang M, Davis E, Gardner D, Cai X, Wu Y: Involvement of AtLAC15 in
lignin synthesis in seeds and in root elongation of Arabidopsis. Planta
2006, 224(5):1185-1196.
46. Hirsch J, Lefort V, Vankersschaver M, Boualem A, Lucas A, Thermes C,
d’Aubenton-Carafa Y, Crespi M: Characterization of 43 non-protein-coding
mRNA genes in Arabidopsis, including the MIR162a-derived transcripts.
Plant Physiology 2006, 140(4):1192-1204.
47. Rybak A, Fuchs H, Smirnova L, Brandt C, Pohl EE, Nitsch R, Wulczyn FG: A
feedback loop comprising lin-28 and let-7 controls pre-let-7 maturation
during neural stem-cell commitment. Nature cell biology 2008,
10(8):987-993.
48. Denoeud F, Aury JM, Da Silva C, Noel B, Rogier O, Delledonne M,
Morgante M, Valle G, Wincker P, Scarpelli C, et al: Annotating genomes
with massive-scale RNA sequencing. Genome biology 2008, 9(12):R175.
49. Shahmuradov IA, Solovyev VV, Gammerman AJ: Plant promoter prediction
with confidence estimation. Nucleic Acids Res 2005, 33(3):1069-1076.
50. Vaucheret H, Mallory AC, Bartel DP: AGO1 homeostasis entails
coexpression of MIR168 and AGO1 and preferential stabilization of
miR168 by AGO1. Molecular Cell 2006, 22(1):129-136.
51. Amrani N, Sachs MS, Jacobson A: Early nonsense: mRNA decay solves a
translational problem. Nature Reviews Molecular Cell Biology 2006,
7(6):415-425.
52. Rezaian MA, Krake LR: Nucleic acid extraction and virus detection in
grapevine. Journal of Virological Methods 1987, 17(3-4):277-285.
53. Barnes WM: PCR amplification of up to 35-kb DNA with high fidelity and
high yield from lambda bacteriophage templates. Proceedings of the
National Academy of Sciences of the United States of America 1994,
91(6):2216-2220.
54. Carra A, Gambino G, Schubert A: A cetyltrimethylammonium bromide-
based method to extract low-molecular-weight RNA from
polysaccharide-rich plant tissues. Analytical Biochemistry 2007,
360(2):318-320.
55. Bolstad BM, Irizarry RA, Astrand M, Speed TP: A comparison of
normalization methods for high density oligonucleotide array data
based on variance and bias. Bioinformatics 2003, 19(2):185-193.
56. Gambino G, Perrone I, Gribaudo I: A Rapid and effective method for RNA
extraction from different tissues of grapevine and other woody plants.
Phytochem Anal 2008, 19(6):520-525.
57. Li R, Li Y, Kristiansen K, Wang J: SOAP: short oligonucleotide alignment
program. Bioinformatics 2008, 24(5):713-714.
58. Wheelan SJ, Church DM, Ostell JM: Spidey: a tool for mRNA-to-genomic
alignments. Genome Research 2001, 11(11):1952-1957.
doi:10.1186/1471-2164-11-109Cite this article as: Mica et al.: Correction: High throughput approachesreveal splicing of primary microRNA transcripts and tissue specificexpression of mature microRNAs in Vitis vinifera. BMC Genomics 201011:109.
Submit your next manuscript to BioMed Centraland take full advantage of:
• Convenient online submission
• Thorough peer review
• No space constraints or color figure charges
• Immediate publication on acceptance
• Inclusion in PubMed, CAS, Scopus and Google Scholar
• Research which is freely available for redistribution
Submit your manuscript at www.biomedcentral.com/submit
Mica et al. BMC Genomics 2010, 11:109
http://www.biomedcentral.com/1471-2164/11/109
Page 15 of 15
Copyright © 2022 FDOKUMEN