Extraction of phenolics from Vitis vinifera wastes using non-conventional techniques
6
Extraction of phenolics from Vitis vinifera wastes using non-conventional techniques Alessandro A. Casazza a , Bahar Aliakbarian a , Stefano Mantegna b , Giancarlo Cravotto b, * , Patrizia Perego a, ** a Department of Chemical and Process Engineering ‘‘G.B. Bonino”, University of Genoa, Via Opera Pia 15, 16145 Genoa, Italy b Dipartimento di Scienza e Tecnologia del Farmaco, University of Turin, Via Pietro Giuria 9, 10125 Turin, Italy article info Article history: Received 12 January 2010 Received in revised form 15 March 2010 Accepted 17 March 2010 Available online 28 March 2010 Keywords: Extraction Ultrasound Microwaves Phenolic compounds Grape seeds and skins abstract Polyphenols, the well known naturally occurring antioxidants, are the most abundant secondary metab- olites in grape wastes. Herein we investigate several non-conventional extraction methods vs classic solid–liquid extraction (SLE) to obtain phenolic compounds from grape seeds and skins. We compared SLE, ultrasound-assisted extraction (UAE), microwave-assisted extraction (MAE) and high pressure and temperature extraction (HPTE) in term of extraction yield and antioxidant power of the extract. Solvent of choice between methanol and ethanol was the former, both for skins and seeds. Quali-quantitative analyses were performed using colorimetric and HPLC methods. The highest content in total polyphenols, o-diphenols and flavonoids, both for seeds (108.3, 47.0 mg GAE g DW 1 , 47.2 mg CE g DW 1 ) and skins (34.2, 10.1 mg GAE g DW 1 , 21.6 mg CE g DW 1 ) was obtained with HPTE working in a Parr reactor. While the highest antiradical power was determined in seeds extracts from MAE (78.6 ll extract lg DPPH 1 ). Prolonged extrac- tion times (over 30 min) further increased the amount of total polyphenols, while progressively decreased the amount of flavonoids and the antiradical power. Ó 2010 Elsevier Ltd. All rights reserved. 1. Introduction Over the past few years a big effort was done for the valorisa- tion of food and agricultural residues and wastes by creating added-value bio-products, bio-fuels or food ingredients (Makris et al., 2007). Grape (Vitis vinifera) is one of the world’s largest fruit crops with a global production of around 55 million tonnes in 2008 and 26 million tonnes of wine (OIV, 2009). This also generates an enormous amount of waste, including grape skins and seeds (OIV, 2009). Grape marc has a heavy environmental impact for the high content of phenols that considerably increase chemical and biochemical oxygen demands (Spigno et al., 2007). Polyphenols exhibit a wide range of biological effects as antiox- idants, antimicrobials, and modulators of various enzyme systems. Beneficial effects for human health have been demonstrated in experimental studies on LDL-cholesterol oxidation, on platelet aggregation, and on cardiovascular diseases (Leifert and Abeywar- dena, 2008; Anastasiadi et al., 2009; Iriti and Faoro, 2010). Grape’s polyphenols include flavonoids and non-flavonoids such as trans-resveratrol (Van de Wiel et al., 2001). Plants produce this t-stilbene polyphenol in response to fungus infections or to other abiotic factors, such as the presence of metallic ions, hydric stress, or exposure to UV light, acting therefore like phytoalexins (Gehm et al., 1997). Resveratrol has a large number of health ben- efits such as protection against atherosclerosis, coronary heart dis- eases and cancer (Della Ragione et al., 1998; Pascual Marti et al., 2001; Stervbo et al., 2007). In the literature few papers deal with grape marc polyphenols extraction using non-conventional techniques such as UAE and MAE (Palma and Barroso, 2002; Pan et al., 2003; Bozan et al., 2008; Novak et al., 2008; Ghafoor et al., 2009; Anastasiadi et al., 2009). Ultrasound (US) and microwaves (MW) are recognized as outstanding energy sources to promote extraction, cutting down extraction times and increasing yields as well as often the quality of the extract. UAE and MAE are chiefly exploited on the laboratory scale and both have already found some industrial applications (Cravotto et al., 2008). UAE is much faster than traditional meth- ods, because of the high contact surface area between solid and li- quid phase, due to the fine reduction of particles size. Acoustic cavitation of power US (frequencies range 18–40 kHz), cause cell walls disruption, enhancing mass transfer and facilitating solvent access to the cell content (Novak et al., 2008). Furthermore, it was well established that for the preparation of polyphenol-rich plant extracts with high antioxidant activity (DPPH and ORAC tests); UAE is one of the techniques of choice (Ghafoor et al., 2009; Khan et al., 2010). Few studies compared UAE and MAE with classic methods (Pas- tor et al., 1997) with promising perspective for industrial process- ing (Palma and Barroso, 2002). Extraction under MW has been used for the extraction of bioac- tive compounds and essential oils from the leaves of rosemary and 0260-8774/$ - see front matter Ó 2010 Elsevier Ltd. All rights reserved. doi:10.1016/j.jfoodeng.2010.03.026 * Corresponding author. Tel.: +39 011 670 7684; fax: +39 011 670 7687 (G. Cravotto). ** Corresponding author. E-mail address: [email protected] (G. Cravotto). Journal of Food Engineering 100 (2010) 50–55 Contents lists available at ScienceDirect Journal of Food Engineering journal homepage: www.elsevier.com/locate/jfoodeng
-
Upload
independent -
Category
Documents
-
view
4 -
download
0
Transcript of Extraction of phenolics from Vitis vinifera wastes using non-conventional techniques

Journal of Food Engineering 100 (2010) 50–55
Contents lists available at ScienceDirect
Journal of Food Engineering
journal homepage: www.elsevier .com/locate / j foodeng
Extraction of phenolics from Vitis vinifera wastes using non-conventional techniques
Alessandro A. Casazza a, Bahar Aliakbarian a, Stefano Mantegna b, Giancarlo Cravotto b,*, Patrizia Perego a,**
a Department of Chemical and Process Engineering ‘‘G.B. Bonino”, University of Genoa, Via Opera Pia 15, 16145 Genoa, Italyb Dipartimento di Scienza e Tecnologia del Farmaco, University of Turin, Via Pietro Giuria 9, 10125 Turin, Italy
a r t i c l e i n f o a b s t r a c t
Article history:Received 12 January 2010Received in revised form 15 March 2010Accepted 17 March 2010Available online 28 March 2010
Keywords:ExtractionUltrasoundMicrowavesPhenolic compoundsGrape seeds and skins
0260-8774/$ - see front matter � 2010 Elsevier Ltd. Adoi:10.1016/j.jfoodeng.2010.03.026
* Corresponding author. Tel.: +39 011 670 7684;Cravotto).
** Corresponding author.E-mail address: [email protected] (G. Cra
Polyphenols, the well known naturally occurring antioxidants, are the most abundant secondary metab-olites in grape wastes. Herein we investigate several non-conventional extraction methods vs classicsolid–liquid extraction (SLE) to obtain phenolic compounds from grape seeds and skins. We comparedSLE, ultrasound-assisted extraction (UAE), microwave-assisted extraction (MAE) and high pressure andtemperature extraction (HPTE) in term of extraction yield and antioxidant power of the extract. Solventof choice between methanol and ethanol was the former, both for skins and seeds. Quali-quantitativeanalyses were performed using colorimetric and HPLC methods. The highest content in total polyphenols,o-diphenols and flavonoids, both for seeds (108.3, 47.0 mgGAE gDW
�1, 47.2 mgCE gDW�1) and skins (34.2,
10.1 mgGAE gDW�1, 21.6 mgCE gDW
�1) was obtained with HPTE working in a Parr reactor. While the highestantiradical power was determined in seeds extracts from MAE (78.6 llextract lgDPPH
�1). Prolonged extrac-tion times (over 30 min) further increased the amount of total polyphenols, while progressivelydecreased the amount of flavonoids and the antiradical power.
� 2010 Elsevier Ltd. All rights reserved.
1. Introduction
Over the past few years a big effort was done for the valorisa-tion of food and agricultural residues and wastes by creatingadded-value bio-products, bio-fuels or food ingredients (Makriset al., 2007). Grape (Vitis vinifera) is one of the world’s largest fruitcrops with a global production of around 55 million tonnes in 2008and 26 million tonnes of wine (OIV, 2009). This also generates anenormous amount of waste, including grape skins and seeds(OIV, 2009). Grape marc has a heavy environmental impact forthe high content of phenols that considerably increase chemicaland biochemical oxygen demands (Spigno et al., 2007).
Polyphenols exhibit a wide range of biological effects as antiox-idants, antimicrobials, and modulators of various enzyme systems.Beneficial effects for human health have been demonstrated inexperimental studies on LDL-cholesterol oxidation, on plateletaggregation, and on cardiovascular diseases (Leifert and Abeywar-dena, 2008; Anastasiadi et al., 2009; Iriti and Faoro, 2010).
Grape’s polyphenols include flavonoids and non-flavonoidssuch as trans-resveratrol (Van de Wiel et al., 2001). Plants producethis t-stilbene polyphenol in response to fungus infections or toother abiotic factors, such as the presence of metallic ions, hydricstress, or exposure to UV light, acting therefore like phytoalexins
ll rights reserved.
fax: +39 011 670 7687 (G.
votto).
(Gehm et al., 1997). Resveratrol has a large number of health ben-efits such as protection against atherosclerosis, coronary heart dis-eases and cancer (Della Ragione et al., 1998; Pascual Marti et al.,2001; Stervbo et al., 2007).
In the literature few papers deal with grape marc polyphenolsextraction using non-conventional techniques such as UAE andMAE (Palma and Barroso, 2002; Pan et al., 2003; Bozan et al.,2008; Novak et al., 2008; Ghafoor et al., 2009; Anastasiadi et al.,2009). Ultrasound (US) and microwaves (MW) are recognized asoutstanding energy sources to promote extraction, cutting downextraction times and increasing yields as well as often the qualityof the extract. UAE and MAE are chiefly exploited on the laboratoryscale and both have already found some industrial applications(Cravotto et al., 2008). UAE is much faster than traditional meth-ods, because of the high contact surface area between solid and li-quid phase, due to the fine reduction of particles size. Acousticcavitation of power US (frequencies range 18–40 kHz), cause cellwalls disruption, enhancing mass transfer and facilitating solventaccess to the cell content (Novak et al., 2008). Furthermore, itwas well established that for the preparation of polyphenol-richplant extracts with high antioxidant activity (DPPH and ORACtests); UAE is one of the techniques of choice (Ghafoor et al.,2009; Khan et al., 2010).
Few studies compared UAE and MAE with classic methods (Pas-tor et al., 1997) with promising perspective for industrial process-ing (Palma and Barroso, 2002).
Extraction under MW has been used for the extraction of bioac-tive compounds and essential oils from the leaves of rosemary and
A.A. Casazza et al. / Journal of Food Engineering 100 (2010) 50–55 51
peppermint (Bousbia et al., 2009; Dai et al., 2010), extraction oftaxanes from Taxus biomass (Mattina et al., 1997), extraction ofergosterol and fatty acids from fungal hyphae and spores, mush-rooms, filtered air, artificially contaminated corn, naturally con-taminated grain dust, and soil and the extraction of azadirachtin-related limonoids from neem seed kernel (Young 1995; Dai et al.,1999). MAE was successfully applied in laboratory scale becausefaster, ecocompatible (less solvent required), repeatable and veryeffective (Pérez-Serradilla et al., 2007). It has been reported thatMAE is well suited for the extraction of phenolics although per-formed at relatively high temperatures (110–150 �C), a critical fea-ture to handle antioxidants without degradation (Grigonis et al.,2005). In a phenomenological study, it emerged that MAE allowedhigher polyphenols recoveries compared to conventional tech-nique, without altering the antioxidant potential of the extracts(Spigno and De Faveri, 2009).
We found many papers describing HPTE processes in differentfields. Beside the extraction, high pressure and temperature per-turb bacterial growth (Miller et al., 1988); promote hydrothermalsynthesis of graphite tubes (Libera and Gogotsi, 2001) and the syn-thesis of several compounds (Awana et al., 2007; Marre et al.,2009). To the best of our knowledge HPTE has not been systemat-ically used for polyphenols extraction.
The aim of this study was the quali-quantitative optimization ofpolyphenol extraction from grape seeds and skins. To this purposewe compared UAE, MAE and HPTE with classic solid–liquid extrac-tion. The extracts were analyzed to quantify total polyphenols andflavonoids, o-diphenols contents and their antiradical power.
2. Materials and methods
2.1. Chemicals
Ethanol (analytic grade), methanol (analytical and HPLC grade),Folin–Ciocalteau reagent and authentic standards of phenolic com-pounds, were purchased from Sigma Chemical Co (St. Louis, MO).Standard stock solutions were prepared with methanol, wrappedin aluminium foil and stored at �20 �C.
2.2. Raw material
Skins and seeds of Pinot Noir cultivar from white-vinificationwere used in this work. The grape marc was kindly furnished bya company located in the Trentino region (northern Italy). Themarc, composed of skins, seeds and stalks, was rapidly frozen to�20 �C.
Before the extraction all the matrices were defrosted and driedin a laboratory oven (D-82152, MMM Medcenter, München, Ger-many) to a constant moisture of about 4–5%. The dried marc wasthen separated manually into its components namely seeds, skinsand stalks, by means of suitable sieves. The skins and seeds, thatwould have been finally extracted, were milled by a mortar to ob-tain a fine powder with a medium particle size of 0.8 mm.
2.3. Extraction processes
Skins and seeds were extracted using solid–liquid ratio 0.20 g ofdried waste per millilitres of solvent (gDW mlS
�1), with the followdifferent methods:
� solid–liquid extraction (SLE). Two sets of dried and milled marcsamples, placed in test tubes with screw caps on a magneticshaker (Heidolph Mr. 2002, Kelheim, Germany) were extractedwith ethanol or with methanol for 19 h. The extraction was per-formed in the dark and at room temperature (25 �C). After
extraction the liquid was separated from solids by centrifuga-tion (6000�g for 10 min) (ALC PK131 Centrifuges, Alberta, Can-ada) and frozen to �20 �C (Spigno et al., 2007).� MAE in a closed vessel. The extraction was carried out in a pro-
fessional multimode oven operating at 2.45 GHz (MicroSYNTH,Milestone, Italy). The temperature was monitored by optic–fibre thermometer directly inserted into the pressure-resistantreaction vessel (100 ml, max 100 bar) made in PTFE (polytetra-fluoroethylene) and provided by Milestone. Grape marc wasextracted with methanol at 110 �C under nitrogen atmosphereand MW irradiation (60 W) for 60 min.� UAE in high-power cavitating tube. This extraction was con-
ducted in a commercially available device developed in our lab-oratories in collaboration with Danacamerini sas (Torino, Italy).The US reactor consists of a cavitating tube, an innovative cup-horn-like system (a thin titanium cylinder – 160 ml – whosebase is fixed on a booster) working at 21.5 kHz. A thermostatfluid was circulated through the outer polytetrafluoroethylene(PTFE) jacket. Grape marc was extracted with methanol at25 �C under US irradiation (60 W) for 60 min (Cravotto et al.2008).� HPTE in Parr reactor. For this method was used a high pressure/
temperature reactor (Parr reactor, model 350 M – 4650 Series –made of 316 stainless steel). The reactor is equipped with a spe-cial mechanical stirrer with magnetic dragging and a high tem-perature fabric heating mantels housed in sturdy aluminiumshells. The reactor works up to 350 �C and 200 bar. Extractionconditions: 60 min at 110 �C under nitrogen atmosphere.
Experiments with different extraction times (from 15 to90 min) were carried out for HPTE and MAE, in order to evaluatethe effect of this parameter on the polyphenols extraction usinggrape seeds as a matrix. All extractions were performed in dupli-cate or triplicate.
2.4. Analytical methods
The content of total polyphenols (TP) in the extracts was deter-mined with a colorimetric method using the Folin–Ciocalteau as-say (Swain and Hillis, 1959). The calibration curve was madewith standard solutions of gallic acid in the range 0.01–1.00 mg ml�1 and measures were carried out at 725 nm using aUV–Vis spectrophotometer, (model Lambda 25, Perkin Elmer,Wellesley, MA). All analyses were performed in triplicate. TP yieldwas expressed as milligrams of equivalent gallic acid per gram ofdried waste (mgGAE gDW
�1). The method response was describedby the linear equation:
ABS725 ¼ 0:0017TP ð1Þ
with R2 = 0.9940.The yield of total flavonoids (TF) in the ethanolic and methano-
lic extracts, expressed as:mgCE gDW�1 (milligrams of equivalent
catechin per gram of dried waste) was determined using the color-imetric method described by Jia et al. (1999) modified by Yanget al. (2009). Measures were carried out at 510 nm with the samespectrophotometer as above. The calibration curve was made withstandard solutions of catechin in the range 0.01–0.50 mg ml�1
resulting in the linear equation (R2 = 0.9908):
ABS510 ¼ 0:0021TF ð2Þ
The yield of o-diphenols (OD) in the extracts, also expressed asmgGAE gDW
�1, was determined by the molybdate method (Gutfin-ger, 1981). Measures were carried out at 350 nm using the abovementioned instrument. The calibration curve was made with stan-dard solutions of gallic acid in the range 0.01–0.25 mg ml�1 result-ing in the linear equation (R2 = 0.9891):

52 A.A. Casazza et al. / Journal of Food Engineering 100 (2010) 50–55
ABS350 ¼ 0:0010OD ð3Þ
The antiradical power (ARP) of the extracts was measured interms of hydrogen-donating or radical-scavenging ability bymeans of the radical 2,2-diphenyl-1-picrylhydrazyl (DPPH_) and ex-pressed as llextract lgDPPH
�1, according to Brand-Williams et al.(1995) methodology, modified by Aliakbarian et al. (2009). Briefly,for each extract, 0.1 ml of nine different dilutions in methanol (inthe range 1:2–1:128) were prepared and mixed with 3.9 ml ofDPPH_ methanolic solution (9.15 � 10�5 mol l�1). The reaction mix-tures were shaken and incubated for 1 h in the dark at room tem-perature, and afterwards, the DPPH_ concentration in the reactionmedium (CDPPH) was calculated from a calibration curve, whoseequation, determined by linear regression using standard solutionsof DPPH_ in the range 0.003–0.044 mgDPPH ml�1 was:
ABS515 ¼ 0:0023CDPPH ð4Þ
with R2 = 0.999. The absorbance was read at 515 nm.The phenolic compounds’ analysis was carried out using a HPLC
Hewlett Packard, 1100 Series, Palo Alto, CA equipped with a C18 re-verse-phase column (Model 201TP54, Vydac, Hesperia, CA) cou-pled with a UV–Vis detector, using the methodology described byDe Faveri et al. (2008). The mobile phase was water/acetic acid
Table 1SLE of grape seeds and skins using ethanol and methanol as solvents. Yields expressed in
Solvent Matrix TP yield (mgGAE gDW�1)
Ethanol Seeds 55.98 ± 0.58Skins 5.60 ± 0.20
Methanol Seeds 67.88 ± 1.22Skins 7.33 ± 0.25
0
20
40
60
80
100
120
HPTE UAE
Yie
ld (
mg
GA
E g
DW
-1)
a
0
5
10
15
20
25
30
35
40
HPTE UAE
Yie
ld (
mg
GA
E g D
W-1
)
b
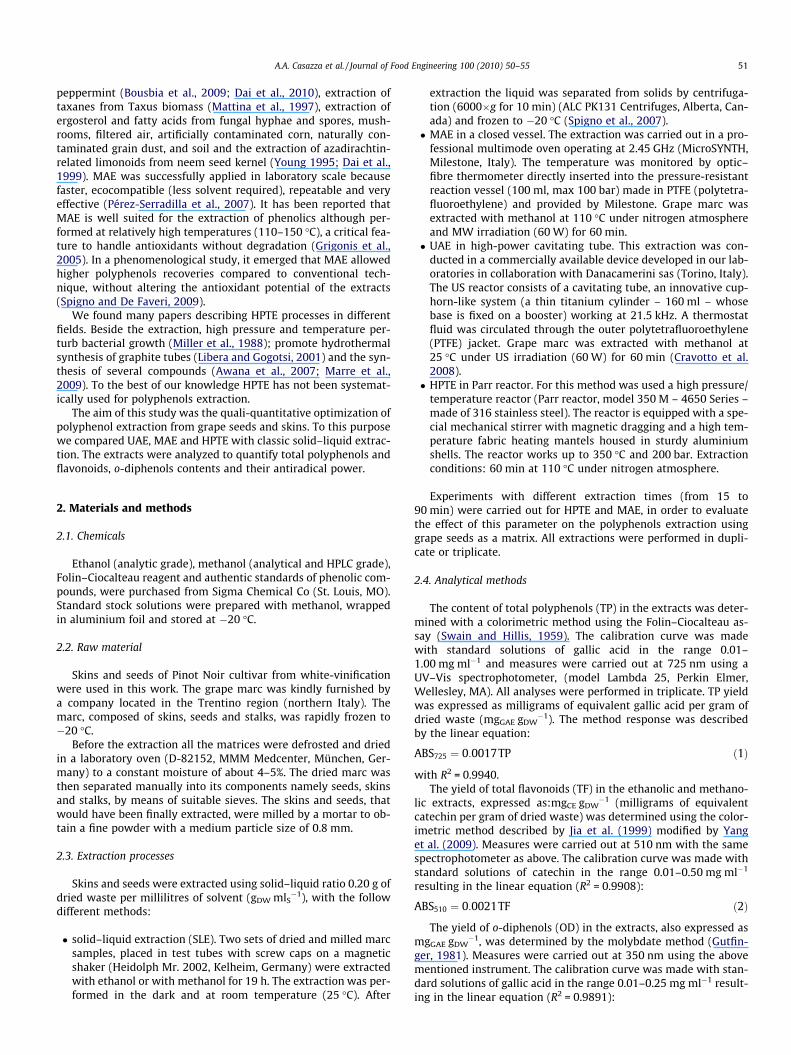
Fig. 1. Total polyphenols (h), o-diphenols ( ) and total flavonoids ( ) yie
(99:1%, v/v) (solvent A) and methanol/acetonitrile (50:50%, v/v)(solvent B), while the solvent gradient changed according to thefollowing conditions: from 5% to 30% B in 25 min, from 30% to40% B in 10 min, from 40% to 48% B in 5 min, from 48% to 70% Bin 10 min, from 70% to 100% B in 5 min, isocratic at 100% B for5 min, followed by returning to the initial conditions (10 min)and the column equilibration (12 min). A flow rate of 1 ml min�1
was used at 30 �C, and samples (20 ll) were detected at 280 nm.Before injection, samples were filtered through a 0.20 lm mem-brane filter.
3. Results and discussion
3.1. Role of the solvent
After a preliminary set of experiments under conventional SLEwith ethanol and methanol, we chose the latter as solvent for allthe other extractions. Results of SLE with ethanol and methanolare reported in Table 1.
Higher yields of total polyphenols (TP) were detected in meth-anol extracts rather than in ethanol (yield 21.3% and 30.9% higher,for seeds and skins, respectively). The same trend was determinedfor TF and OD in seeds and skins. In all samples the TP content in
total polyphenol, flavonoid and o-diphenol.
OD yield (mgGAE gDW�1) TF yield (mgCE gDW
�1)
21.33 ± 1.95 19.36 ± 1.523.97 ± 0.90 3.25 ± 0.56
44.18 ± 5.17 41.25 ± 2.554.92 ± 0.15 4.58 ± 0.68
MAE
0
20
40
60
80
100
120
Yie
ld (
mg
CA g
DW
-1)
MAE
0
5
10
15
20
25
30
35
40
Yie
ld (
mg
CA g
DW
-1)
ld for seeds (a) and skins (b) with different extraction methodologies.

A.A. Casazza et al. / Journal of Food Engineering 100 (2010) 50–55 53
seeds was one order of magnitude higher than in skins, this is inagreement with results reported by Shrikhande (1999) and Xuet al. (2010). For seeds, o-diphenols were most influenced (107%increase) by the extraction solvent when compared with totalpolyphenols and flavonoids, while for skins TF were increased41% when using methanol.
3.2. Comparison between MAE, UAE and HPTE techniques
Following the results obtained for the study on methanol andethanol extractions, Pinot Noir seeds and skins were extracted withthe selected solvent (methanol) using the abovementioned non-conventional techniques: MAE, UAE and HPTE. Fig. 1a shows thetrend of TP, OD and TF yield for seeds extracts.
As illustrated in Fig. 1a, an increasing trend was found for TPextraction yield when using UAE (55.9 mgGAE gDW
�1), MAE(86.2 mgGAE gDW
�1) and HPTE (108.3 mgGAE gDW�1). The OD con-
tent showed a less marked trend respect to TP. The yield in OD de-clined from 47.0 mgGAE gDW
�1 to 36.5 mgGAE gDW�1 using HPTE and
UAE, respectively. The highest TF contents were obtained usingHPTE (47.2 mgCE gDW
�1) followed by MAE (46.8 mgCE gDW�1) and
UAE (39.5 mgCE gDW�1).
In the case of skins, different extraction techniques notablyinfluenced phenolics extraction when compared with those ob-tained from seeds (Fig. 1b). Using HPTE resulted to an increase of375%, 390% and 206% when compared with UAE and only 88%,59% and 33% when using MAE for TP, OD and TF extraction yield,respectively.
In addition, among all the non-conventional extraction tech-niques, HPTE vs classic SLE (19 h, methanol) of seeds gave muchhigher yield in TP, OD and TF (59%, 6% and 14%, respectively). In
0
20
40
60
80
100
120
15 30
Time (m
a
Yie
ld (
mg
GA
E g
DW
-1)
0
20
40
60
80
100
120
15 30
Time (m
b
Yie
ld (
mg
GA
E g
DW
-1)
Fig. 2. Total polyphenols (h), o-diphenols ( ) and total flavonoids ( ) yield for
skins extraction, HPTE vs classic SLE, dramatically affected TP(511%), OD (444%) and TF (211%) yields.
3.3. Effect of extraction time for MAE and HPTE
From results discussed in the previous paragraph we selectedthe most efficient techniques for phenolics extraction (MAEand HPTE) to investigate the effect of extraction time (from 15 to90 min) on TP, OD and TF extraction yield. Only seeds werechosen for this part of the study due to their higher phenoliccontents.
As illustrated in Fig. 2a, using MAE, TP increased from 70.4 to101.1 (mgGAE gDW
�1) when extraction time was increased from15 to 90 min. Instead, OD yield, with longer extraction times (over30 min), was negatively affected. For TF, from 15 to 30 min yieldraised only 4% while, prolonging contact time from 30 to 90 minresulted to a significant decrease of 41%. The observed effect con-firms that TF could have been more sensitive to the degradationcaused by high temperature and extraction time.
The results shown in Fig. 2b demonstrate a trends similar tothose obtained by MAE (Fig. 2a).
Prolonging the extraction time from 15 to 90 min, the TP con-tent increased from 90.4 to 110.4 (mgGAE gDW
�1). In the case ofOD unlike using HPTE, almost total o-diphenol compounds wereextracted in 60 min (47.0 mgGAE gDW
�1). This may derive fromthe possible phenolics degradation caused by MW (Liazid et al.,2007). A parabolic trend was observed for TF contents with a max-imum value of 63.1 (mgGAE gDW
�1) at 30 min. An increase in thecontact time from 15 to 30 min leads to TF content increase of13% while, passing from 30 to 90 min of extraction time resultedto TF decrease of 39%.
60 90
in)
0
20
40
60
80
100
120
Yie
ld (
mg
CA g
DW
-1)
60 90
in)
0
20
40
60
80
100
120
Yie
ld (
mg
CA g
DW
-1)
Pinot Noir seeds using different extraction times in MAE (a) and HPTE (b).

Table 2Content (mg 100 gDW
�1) of main phenolic compounds in Pinot Noir skin and seed extracts analyzed by HPLC.
Extraction technology Matrix Extraction time (min) Phenolic compounds yield (mg 100 gDW�1)
GAa HMFb HTc PAd p-HBAe CAf VAAg SAh VAi CUAj t-RESk QEl total
SLE ethanol Seeds 1140 43.3 10.6 0.8 4.3 53.4 145.0 28.8 14.2 67.2 16.6 9.1 138.6 531.8SLE methanol Seeds 1140 38.8 12.8 – – 46.5 158.3 28.1 – 63.7 18.6 10.7 138.6 516.2HPTE Seeds 15 43.5 8.5 7.5 10.5 77.4 228.9 260.6 55.2 141.7 27.3 57.6 145.8 1064.7HPTE Seeds 30 44.5 8.3 8.3 10.8 81.9 184.2 252.6 55.6 129.3 30.2 58.2 133.7 997.7HPTE Seeds 60 46.9 6.8 4.7 11.7 85.9 151.0 222.3 57.3 112.0 31.5 58.7 124.8 913.6HPTE Seeds 90 48.8 5.3 3.9 12.1 90.3 136.8 190.7 71.2 101.1 32.2 58.8 120.8 872.1UAE Seeds 60 37.8 9.0 1.4 22.6 32.8 190.3 33.6 16.6 46.9 9.3 18.3 154.5 573.1MAE Seeds 15 23.1 4.4 3.5 9.9 66.9 250.7 51.5 20.2 61.2 16.4 18.7 163.7 690.3MAE Seeds 30 25.3 4.1 3.5 10.8 73.5 361.4 55.1 33.7 84.4 23.7 30.3 157.4 862.9MAE Seeds 60 26.9 4.1 3.5 10.5 76.5 313.0 35.8 35.7 82.4 25.1 29.1 154.1 796.8MAE Seeds 90 28.5 4.0 3.4 10.6 78.9 291.6 33.1 36.2 79.9 25.5 26.9 148.6 767.3SLE ethanol Skins 1140 23.0 11.8 – – – 30.0 – – 4.5 4.8 2.2 28.7 105.1SLE methanol Skins 1140 25.2 5.9 0.6 0.4 – 21.5 – 4.2 5.0 3.5 2.4 34.4 103.1HPTE Skins 60 23.1 7.8 1.3 3.1 – 58.3 6.2 13.8 14.3 2.5 11.8 66.1 208.2MAE Skins 60 11.3 0.9 2.0 5.3 – 43.0 5.1 15.3 8.3 2.1 5.3 39.3 137.9UAE Skins 60 10.2 1.0 0.9 4.0 – 23.4 2.0 7.7 7.7 2.0 3.1 28.1 90.0
a Gallic acid.b 5-Hydroxymethylfurfural.c Hydroxytyrosol.d Protocatechuic acid.e para-Hydroxybenzoic acid.f Catechin.g Vanillic acid.h Syringic acid.i Vanillic acid.j Cumaric acid.k trans-Resveratrol.l Quercetin.
54 A.A. Casazza et al. / Journal of Food Engineering 100 (2010) 50–55
In particular, the results from Fig. 2a and b confirmed that HPTElead to higher phenolics yield TP (9% in 90 min), OD (6% in 90 min)and TF (11% in 30 min) when compared with MAE.
Table 3Pinot Noir seed and skin extracts antiradical power (ARP).
Extractiontechnique
Matrix Extractiontime (min)
ARP (llextract lgDPPH�1)
SLE ethanol Seeds 1140 14.6 ± 0.4SLE methanol Seeds 1140 21.3 ± 1.3HPTE Seeds 15 75.2 ± 0.5HPTE Seeds 30 75.5 ± 0.7HPTE Seeds 60 73.9 ± 0.6HPTE Seeds 90 69.4 ± 0.8MAE Seeds 15 78.2 ± 0.5MAE Seeds 30 78.6 ± 0.7MAE Seeds 60 77.7 ± 0.7MAE Seeds 90 74.3 ± 0.9UAE Seeds 60 53.5 ± 0.4SLE ethanol Skins 1140 1.1 ± 0.3SLE methanol Skins 1140 3.7 ± 0.3HPTE Skins 60 10.1 ± 0.2MAE Skins 60 9.0 ± 0.1UAE Skins 60 7.5 ± 0.1
3.4. HPLC analyses
The amounts of different individual phenolic compounds areshown in Table 2. The RP-HPLC was employed to separate and toquantify phenolic compounds.
The main phenolic compound was catechin in seeds whichreached the maximum value of 361.4 mg 100 gDW
�1 using MAEand 30 min of extraction time.
High levels of t-resveratrol for seeds (from 9.0 mg 100 gDW�1
using SLE and ethanol (1140 min) to 58.8 mg 100 gDW�1 using
HPTE and methanol (90 min) were found, while lower quantityof this compound was detected in skins with the maximum yieldof 11.8 mg 100 gDW
�1 using HPTE (60 min). The latest value is inaccordance with the value of 15.8 mg 100 gDW
�1 for reported byRomero-Perez et al. (2001), whom used ethanol: water (80:20) at60 �C (30 min).
Gallic acid was individualized in all extracts reaching the max-imum yield at 90 min and extracting with HPTE for seeds(48.8 mg 100 gDW
�1).No trace of p-HBA was identified for skins using different
extraction techniques while, notable amount of this compoundwas detected in all extracts from seeds. Like Gallic acid, p-HBAwas extracted at maximum level of 90.3 mg 100 gDW
�1 when usingHPTE (90 min).
Total amounts of individual phenolics quantified by HPLC ismaximum (1064.7 mg 100 gDW
�1) using HPTE (15 min) for seeds.This value did not correspond with the maximum value(110.4 mgGAE gDW
�1) obtained with the Folin–Ciocalteau colorimet-ric method which was reached at 90 min by using HPTE. This resultwas predictable due to the weak selectivity of the Folin–Ciocalteureagent, as it reacts positively with different antioxidant com-pounds (phenolic and non-phenolic substances) (Que et al., 2006).
3.5. Antiradical power
DPPH_ test was used for antioxidant power determination of allextracts (Table 3).
Methanol gave higher polyphenols yields meanwhile comparedwith ethanolic extracts, also gave extracts with stronger antioxi-dant activity. This findings were observed both for seeds and skins.
ARP value of skins extracts from HPTE was 173% of the valuefrom SLE while for seeds extract the MAE gave the highest value(78.6 llextract lgDPPH
�1) and only 4% lower that from HPTE. In gen-eral prolonged extraction times over 30 min and up to 90 minshowed a partial loss of antioxidants activity (5% and 8% reductionfor MAE and HPTE, respectively).
UAE has given extracts with less ARP when compared with theother non-conventional techniques, both for skins and seeds (7.5and 53.5 llextract lgDPPH
�1, respectively).

A.A. Casazza et al. / Journal of Food Engineering 100 (2010) 50–55 55
4. Conclusions
In the search of the optimal cost-effective extraction conditionfor polyphenols from grape seeds and skins we compared three dif-ferent non-conventional methods vs. classic solid–liquid extraction(SLE). We investigated UAE, MAE and HPTE and extracts were de-fined on the base of extraction yield and antioxidant power. SLEand UAE were performed at 25 �C, while MAE and HPTE at 110 �C.
Significant levels of catechin, quercetin and t-resveratrol werequantified by HPLC. The results of this study confirms the effi-ciency of HPTE and MAE for phenolics and in particular for t-resve-ratrol extraction.
References
Aliakbarian, B., Dehghani, F., Perego, P., 2009. The effect of citric acid on the phenoliccontents of olive oil. Food Chemistry 116, 617–623.
Anastasiadi, M., Pratsinis, H., Kletsas, D., Skaltsounis, A.L., Haroutounian, S.A., 2009.Bioactive non-coloured polyphenols content of grapes, wines and vinificationby-products. Evaluation of the antioxidant activities of their extracts. FoodResearch International. doi:10.1016/j.foodres.2009.11.017.
Awana, V.P.S., Ubaldini, A., Balamurugan, S., Kishan, H., Takayama-Muromachi, E.,2007. High pressure high temperature (HPHT) synthesis and magnetism of Cr-12s2 copper oxides with fluorite-structured layers between CuO2 planes.Physica C: Superconductivity 460–462 (1), 456–457.
Bousbia, N., Vian, M.A., Ferhat, M.A., Petitcolas, E., Meklati, B.Y., Chemat, F., 2009.Comparison of two isolation methods for essential oil from rosemary leaves:hydrodistillation and microwave hydrodiffusion and gravity. Food Chemistry114 (1), 355–362.
Bozan, B., Tosun, G., Ozcan, D., 2008. Study of polyphenol content in the seeds of redgrape (Vitis vinifera L.) varieties cultivated in Turkey and their antiradicalactivity. Food Chemistry 109, 426–430.
Brand-Williams, W., Cuvelier, M.E., Berset, C., 1995. Use of free radical method toevaluate antioxidant activity. Lebensmittel-Wissenschaft und -Technologie 28(1), 25–30.
Cravotto, G., Boffa, L., Mantegna, S., Perego, P., Avogadro, M., Cintas, P., 2008.Improved extraction of vegetable oils under high-intensity ultrasound and/ormicrowaves. Ultrasonics Sonochemistry 15, 898–902.
Dai, J., Yaylayan, V.A., Raghavan, G.S.V., Pare, J.R., 1999. Extraction and colorimetricdetermination of azadirachtin-related limonoids in neem seed kernel. Journal ofAgricultural and Food Chemistry 47, 3738–3742.
Dai, J., Orsat, V., Raghavan, G.S.V., Yaylayan, V., 2010. Investigation of various factorsfor the extraction of peppermint (Mentha piperita L.) leaves. Journal of FoodEngineering 96 (4), 540–543.
De Faveri, D., Aliakbarian, B., Avogadro, M., Perego, P., Converti, A., 2008.Improvement of olive oil phenolics content by means of enzymeformulations: effect of different enzyme activities and levels. BiochemicalEngineering Journal 41 (2), 149–156.
Della Ragione, F., Cucciolla, V., Borriello, A., Della Pietra, V., Racioppi, L., Soldati, G.,Manna, C., Galletti, P., Zappia, V., 1998. Resveratrol arrests the cell division cycleat S/G2 phase transition. Biochemical and Biophysical ResearchCommunications 250, 53–58.
Gehm, B.D., Joanne, J.M., Chien, P., Jameson, J.L., 1997. Resveratrol, a polyphenoliccompound found in grapes and wine, is an agonist for the estrogen receptor.Proceedings of the National Academy of Sciences 94, 14138–14143.
Ghafoor, K., Choi, Y.H., Jeon, J.Y., Jo, I.H., 2009. Optimization of ultrasound-assistedextraction of phenolic compounds, antioxidants, and anthocyanins from grape(Vitis vinifera) seeds. Journal of Agricultural and Food Chemistry 57, 4988–4994.
Grigonis, D., Venskutonis, P.R., Silvik, B., Sandahl, M., Eskilsson, C.S., 2005.Comparison of different extraction techniques for isolation of antioxidantsfrom sweet grass (Hierochloe odorata). The Journal of Supercritical Fluids 33,223–233.
Gutfinger, T., 1981. Polyphenols in olive oil. Journal of the American Oil Chemists’Society 58, 966–968.
Iriti, M., Faoro, F., 2010. Bioactive chemicals and health benefits of grapevineproducts. Bioactive Foods in Promoting Health 581, 620.
Jia, Z., Tang, M., Wu, J., 1999. The determination of flavonoid contents in mulberry andtheir scavenging effects on superoxide radicals. Food Chemistry 64, 555–559.
Khan, M.K., Abert-Vian, M., Fabiano-Tixier, A.S., Dangles, O., Chemat, F., 2010.Ultrasound-assisted extraction of polyphenols (flavanone glycosides) fromorange peel (Citrus sinensis L.). Food Chemistry 119, 851–858.
Leifert, W.R., Abeywardena, M.Y., 2008. Cardioprotective actions of grapepolyphenols. Nutrition Research 28, 729–737.
Liazid, A., Palma, M., Brigui, J., Barroso, C.G., 2007. Investigation on phenoliccompounds stability during microwave-assisted extraction. Journal ofChromatography A 1140, 29–34.
Libera, J., Gogotsi, Y., 2001. Hydrothermal synthesis of graphite tubes using Nicatalyst. Carbon 39, 1307–1318.
Makris, D.P., Boskou, G., Andrikopoulos, N.K., 2007. Polyphenolic content andin vitro antioxidant characteristics of wine industry and other agri-food solidwaste extracts. Journal of Food Composition and Analysis 20, 125–132.
Marre, S., Baek, J., Park, J., Bawendi, M.G., Jensen, K.F., 2009. High-pressure/high-temperature microreactors for nanostructure synthesis. Journal of theAssociation for Laboratory Automation 14 (6), 367–373.
Mattina, M.J.I., Berger, W.A.I., Denson, C.L., 1997. Microwave assisted extraction oftaxanes from Taxus biomass. Journal of Agricultural and Food Chemistry 45,4691–4696.
Miller, J.F., Almond, E.L., Shah, N.N., Ludlow, J.M., Zollweg, J.A., Streett, W.B., Zinder,S.H., Clark, D.S., 1988. High pressure–temperature bioreactor for studyingpressure–temperature relationships in bacterial growth and productivity.Biotechnology and Bioengineering 31, 407–413.
Novak, I., Janeiro, P., Seruga, M., Oliveira-Brett, A.M., 2008. Ultrasound extractedflavonoids from four varieties of Portuguese red grape skins determined byreverse-phase high-performance liquid chromatography with electrochemicaldetection. Analytica Chimica Acta 630, 107–115.
OIV (2009). Organisation internationale de la vigne et du vin. <http://www.oiv.int>.Palma, M., Barroso, C.G., 2002. Ultrasound-assisted extraction and determination of
tartaric and malic acids from grapes and winemaking by-products. AnalyticaChimica Acta 458, 119–130.
Pan, X., Niu, G., Liu, H., 2003. Microwave-assisted extraction of tea polyphenols andtea caffeine from green tea leaves. Chemical Engineering and Processing 42,129–133.
Pascual Marti, M.C., Salvador, A., Chafer, A., Berna, A., 2001. Supercritical fluidextraction of resveratrol from grape skin of Vitis vinifera and determination byHPLC. Talanta 54, 735–740.
Pastor, A., Vázquez, E., Ciscar, R., de la Guardia, M., 1997. Efficiency of themicrowave-assisted extraction of hydrocarbons and pesticides from sediments.Analytica Chimica Acta 344 (3), 241–249.
Pérez-Serradilla, J.A., Japon-Lujan, R., Luque de Castro, M.D., 2007. Simultaneousmicrowave-assisted solid–liquid extraction of polar and nonpolar compoundsfrom alperujo. Analytica Chimica Acta 602, 82–88.
Que, F., Mao, L., Pan, X., 2006. Antioxidant activities of five Chinese rice wines andthe involvement of phenolic compounds. Food Research International 39, 581–587.
Romero-Perez, A.I., Lamuela-Ravento, R.M., Andres-Lacueva, C., Carmen de la Torre-Boronat, M., 2001. Method for the quantitative extraction of resveratrol andpiceid isomers in grape berry skins: effect of powdery mildew on the stilbenecontent. Journal of Agricultural and Food Chemistry 49, 210–215.
Shrikhande, A.J., 1999. Wine by-products with health benefits. Food ResearchInternational 33, 469–474.
Spigno, G., Tramelli, L., De Faveri, M., 2007. Effects of extraction time, temperatureand solvent on concentration and antioxidant activity of grape marc phenolics.Journal of Food Engineering 81, 200–208.
Spigno, G., De Faveri, M., 2009. Microwave-assisted extraction of tea phenols: aphenomenological study. Journal of Food Engineering 93, 210–217.
Stervbo, U., Vang, O., Bonnesen, C., 2007. A review of the content of the putativechemopreventive phytoalexin resveratrol in red wine. Food Chemistry 101,449–457.
Swain, T., Hillis, W.E., 1959. The phenolic constituents of Prunus domestica. Thequantitative analysis of phenolic constituents. Journal of the Science of Foodand Agriculture 10, 63–68.
Van de Wiel, A., Van Golde, P.H.M., Hart, H.C., 2001. Blessing of the grape. EuropeanJournal of Internal Medicine 12, 484–489.
Xu, C., Zhang, Y., Cao, L., Lu, J., 2010. Phenolic compounds and antioxidantproperties of different grape cultivars grown in China. Food Chemistry119, 1557–1565.
Yang, J., Martinson, T.E., Liu, R.H., 2009. Phytochemical profiles and antioxidantactivities of wine grapes. Food Chemistry 116, 332–339.
Young, J.C., 1995. Microwave-assisted extraction of the fungal metabolite ergosteroland total fatty acids. Journal of Agricultural and Food Chemistry 43, 2904–2910.