In-vivo assessment of antidiabetic and antioxidant activities of grapevine leaves ( Vitis vinifera)...
7
Journal of Ethnopharmacology 108 (2006) 280–286 In-vivo assessment of antidiabetic and antioxidant activities of grapevine leaves (Vitis vinifera) in diabetic rats Nil¨ ufer Orhan ∗ , Mustafa Aslan, Didem Deliorman Orhan, Fatma Ergun, Erdem Yes ¸ilada Department of Pharmacognosy, Faculty of Pharmacy, Gazi University, Hipodrom 6330, Ankara, Turkey Received 7 February 2006; received in revised form 9 May 2006; accepted 13 May 2006 Available online 20 May 2006 Abstract The acute and the subacute (15 days) hypoglycaemic and antihyperglycaemic effect of the two different doses (250, 500 mg/kg) of the aqueous extract from the leaves of Vitis vinifera L. were evaluated in this study. The aqueous extract was further fractionated through successive solvent extractions and the acute effect of different doses of its subfractions, 25 mg/kg for ethylacetate fraction, 80 mg/kg for n-butanol fraction and 375 mg/kg for remaining aqueous fraction were investigated using normal, glucose-hyperglycaemic and streptozotocin-induced diabetic rats. Blood glucose levels were measured according to the glucose oxidase method. Tolbutamide was used as a reference drug at a dose of 100mg/kg. The antioxidant activity of the test samples was studied in the liver, kidney and heart tissues of diabetic rats by measuring malondialdehyde (MDA) and glutathion (GSH) levels. All results were compared to the diabetic control groups. The results showed that EtOAc Fr. was rich in polyphenolics and possessed a significant antihyperglycaemic and antioxidant activity equipotent with the reference hypoglycaemic agent (tolbutamide), when evaluated in diabetic rats. © 2006 Elsevier Ireland Ltd. All rights reserved. Keywords: Vitis vinifera; Antidiabetic; Antioxidant; Gluthathion; Lipid peroxidation; Malondialdehyde; Streptozotocin-induced diabetic rats 1. Introduction Diabetes is a serious illness with multiple complications and premature mortality, accounting for at least 10% of total health care expenditure in many countries (King et al., 1998). The prevalence of diabetes for all age-groups worldwide is projected to rise from 171 million in 2000 to 366 million in 2030 (Amos et al., 1997). According to a recent report, nearly 2.6 million adults in Turkey suffer from diabetes, of whom 0.8 million may be unaware of their disease and furthermore, 2.4 million may have impaired glucose tolerance (IGT) (Satman et al., 2002). Persons with undiagnosed diabetes or IGT are known at high risk of cardiovascular disease (WHO, 2003). Vitis vinifera L. (common grapevine, European grape) has been used as a food and a beverage, as well as a remedy against various complaints in traditional medicine worldwide since ancient times. Leaves of the plant have been used to stop bleed- ing and to treat inflammatory disorders and pain (Bombardelli ∗ Corresponding author. Fax: +90 312 223 50 18. E-mail address: [email protected] (N. Orhan). and Morazzonni, 1995; Baytop, 1999). Leaves are also recorded to reduce blood glucose levels in diabetics as a folk remedy in Turkey (personal note). The chemical composition and bio- logical activities of the fruit and seed of the grape have been extensively investigated (Bombardelli and Morazzonni, 1995; Gabetta et al., 2000; Delaunay et al., 2002; Di´ eguez et al., 2003; Fan et al., 2004). The leaves of plant are rich in tan- nins, flavonoids, procyanidins and also contain organic acids, lipids, enzymes and vitamins (Bombardelli and Morazzonni, 1995; Hebash et al., 1991; Hmamouchi et al., 1997; Felicio et al., 2001). Furthermore, the quantitative analysis of compounds found in leaves has also been evaluated by Monagas et al. (2006). Although chemical composition of Vitis vinifera leaves is known very well, the studies conducted on biological effects of the leaves are limited. Additionally, antihyperglycaemic and hypo- glycaemic effects of Vitis vinifera leaves have not been evaluated so far. In the light of these findings, we carried out this study to evaluate both the antidiabetic activity of the aqueous extract of Vitis vinifera leaves and its fractions on normoglycaemic, hyperglycaemic, streptozotocin-induced diabetic rats and the antioxidant activity by measuring the levels of non-protein 0378-8741/$ – see front matter © 2006 Elsevier Ireland Ltd. All rights reserved. doi:10.1016/j.jep.2006.05.010
-
Upload
kunfeyekun -
Category
Documents
-
view
0 -
download
0
Transcript of In-vivo assessment of antidiabetic and antioxidant activities of grapevine leaves ( Vitis vinifera)...

A
ee3BTaae©
K
1
pcpteabhPr
bvai
0d
Journal of Ethnopharmacology 108 (2006) 280–286
In-vivo assessment of antidiabetic and antioxidant activitiesof grapevine leaves (Vitis vinifera) in diabetic rats
Nilufer Orhan ∗, Mustafa Aslan, Didem Deliorman Orhan, Fatma Ergun, Erdem YesiladaDepartment of Pharmacognosy, Faculty of Pharmacy, Gazi University, Hipodrom 6330, Ankara, Turkey
Received 7 February 2006; received in revised form 9 May 2006; accepted 13 May 2006Available online 20 May 2006
bstract
The acute and the subacute (15 days) hypoglycaemic and antihyperglycaemic effect of the two different doses (250, 500 mg/kg) of the aqueousxtract from the leaves of Vitis vinifera L. were evaluated in this study. The aqueous extract was further fractionated through successive solventxtractions and the acute effect of different doses of its subfractions, 25 mg/kg for ethylacetate fraction, 80 mg/kg for n-butanol fraction and75 mg/kg for remaining aqueous fraction were investigated using normal, glucose-hyperglycaemic and streptozotocin-induced diabetic rats.lood glucose levels were measured according to the glucose oxidase method. Tolbutamide was used as a reference drug at a dose of 100 mg/kg.he antioxidant activity of the test samples was studied in the liver, kidney and heart tissues of diabetic rats by measuring malondialdehyde (MDA)
nd glutathion (GSH) levels. All results were compared to the diabetic control groups. The results showed that EtOAc Fr. was rich in polyphenolicsnd possessed a significant antihyperglycaemic and antioxidant activity equipotent with the reference hypoglycaemic agent (tolbutamide), whenvaluated in diabetic rats.2006 Elsevier Ireland Ltd. All rights reserved.
ation
atileG2nl1afAvl
eywords: Vitis vinifera; Antidiabetic; Antioxidant; Gluthathion; Lipid peroxid
. Introduction
Diabetes is a serious illness with multiple complications andremature mortality, accounting for at least 10% of total healthare expenditure in many countries (King et al., 1998). Therevalence of diabetes for all age-groups worldwide is projectedo rise from 171 million in 2000 to 366 million in 2030 (Amost al., 1997). According to a recent report, nearly 2.6 milliondults in Turkey suffer from diabetes, of whom 0.8 million maye unaware of their disease and furthermore, 2.4 million mayave impaired glucose tolerance (IGT) (Satman et al., 2002).ersons with undiagnosed diabetes or IGT are known at highisk of cardiovascular disease (WHO, 2003).
Vitis vinifera L. (common grapevine, European grape) haseen used as a food and a beverage, as well as a remedy against
arious complaints in traditional medicine worldwide sincencient times. Leaves of the plant have been used to stop bleed-ng and to treat inflammatory disorders and pain (Bombardelli∗ Corresponding author. Fax: +90 312 223 50 18.E-mail address: [email protected] (N. Orhan).
gs
eoha
378-8741/$ – see front matter © 2006 Elsevier Ireland Ltd. All rights reserved.oi:10.1016/j.jep.2006.05.010
; Malondialdehyde; Streptozotocin-induced diabetic rats
nd Morazzonni, 1995; Baytop, 1999). Leaves are also recordedo reduce blood glucose levels in diabetics as a folk remedyn Turkey (personal note). The chemical composition and bio-ogical activities of the fruit and seed of the grape have beenxtensively investigated (Bombardelli and Morazzonni, 1995;abetta et al., 2000; Delaunay et al., 2002; Dieguez et al.,003; Fan et al., 2004). The leaves of plant are rich in tan-ins, flavonoids, procyanidins and also contain organic acids,ipids, enzymes and vitamins (Bombardelli and Morazzonni,995; Hebash et al., 1991; Hmamouchi et al., 1997; Felicio etl., 2001). Furthermore, the quantitative analysis of compoundsound in leaves has also been evaluated by Monagas et al. (2006).lthough chemical composition of Vitis vinifera leaves is knownery well, the studies conducted on biological effects of theeaves are limited. Additionally, antihyperglycaemic and hypo-lycaemic effects of Vitis vinifera leaves have not been evaluatedo far.
In the light of these findings, we carried out this study to
valuate both the antidiabetic activity of the aqueous extractf Vitis vinifera leaves and its fractions on normoglycaemic,yperglycaemic, streptozotocin-induced diabetic rats and thentioxidant activity by measuring the levels of non-protein
opha
sl
2
2
icwtme
2
arwwe(r
isbtrF
ta0Foo(n
2
fFb(tAs
2
L
(ullPbeA
2
uBw
2
tfCsco
2g
t(ic2
2(
2
(Si2dggca
2
N. Orhan et al. / Journal of Ethn
ulphydryl groups (GSH) and malondialdehyde (MDA) in theiver, kidney and heart tissues of the diabetic rats.
. Materials and methods
.1. Materials
Leaves of Vitis vinifera which has red fruits, were collectedn June from the Viticultural Research Institute, Faculty of Agri-ulture, Ankara University (Kalecik) before blooming. The plantas identified and a voucher specimen (GUEF 2320) is stored in
he Herbarium of Gazi University, Faculty of Pharmacy. Plantaterials were dried under shade and coarsely powdered for
xtraction.
.2. Preparation of extract and fractions
Extracts of the plant used in the experiments were preparedccording to the informant who uses leaves of Vitis vinifera toeduce blood glucose levels. Powdered plant material (500 g)as extracted with distilled water (10 L) by stirring in a 45 ◦Cater bath for 8 h. The extract was filtrated, the resudue was
xtracted by the same procedure with distilled water again5 L). The filtrates were pooled and evaporated to dryness undereduced pressure (aqueous extract, yield 19.06%).
The concentrated aqueous extract (95.3 g) was redissolvedn distilled water (500 mL) and fractionated through successiveolvent extractions with ethylacetate (18 mL × 500 mL) and n-utanol saturated with water (28 mL × 500 mL). Fractions andhe remaining aqueous phase were concentrated to dryness undereduced pressure. The yields were obtained as follows: (EtOAcr.) 5.06%, (n-BuOH Fr.) 15.58%, (R-H2O Fr.) 75.32%.
EtOAc, n-BuOH and R-H2O fractions were subjected tohin layer chromatography (TLC) using ethylacetate:formiccid:water (90:5:5) as the mobile phase (Kieselgel 60 F254,.2 mm., Merck Art. 5554). After spraying the TLC plate witheCl3 reagent (3%), green coloured spots revealed the presencef the condensed tannins. On the other hand, spots of flavonoidsn TLC plates developed in chloroform:methanol:water61:32:7) as mobile phase were visualized by exposing to ammo-ia vapour and then examined under UV-light.
.3. Preparation of test samples
The dried aqueous extract (250, 500 mg/kg body weight),ractions (EtOAc Fr. 25 mg/kg, n-BuOH Fr. 80 mg/kg, R-H2Or. 375 mg/kg) and the reference drug Tolbutamide (100 mg/kgody weight) were suspended in 0.5% carboxymethyl celluloseCMC) prepared in distilled water prior to oral administrationo experimental animals (10 mL/kg b.w. [b.w. body weight]).nimals in the control group were only administered 0.5% CMC
uspension.
.4. Animals
Male Wistar–Albino rats (150–200 g) purchased from theaboratories of Refik Saydam Central Institute of Health
a
ta
rmacology 108 (2006) 280–286 281
Ankara, TURKEY) and FUTDAM (Elazig, TURKEY) weresed in the experiments. They were kept for 1 week in ouraboratories before the experiments for acclimatization to theaboratory conditions and fed with standard pellet diet and water.rior to experimental treatments, animals were fasted overnightut were allowed free access to water. Six animals were used forach group of study. The study was approved by the Institutionalnimal Ethical Committee of Gazi University.
.5. Determination of the blood glucose levels
Blood glucose concentrations (mg/100 mL) were determinedsing an Ascensia-Elite commercial test (Serial No. 9123232,ayer), based on the glucose oxidase method. Blood samplesere collected from the tip of tail.
.6. Effect in normoglycaemic animals
Fasting blood sugar level of each animal was determined athe beginning of the experiment, after overnight fasting withree access to water. Animals in control group received 0.5%MC only. The test groups of animals were treated with the test
amples suspended in the same vehicle. Blood samples wereollected at 30, 60, 120 and 240 min after the oral administrationf test samples.
.7. Effect in glucose-hyperglycaemic animals (orallucose tolerance test, OGTT)
Fasting blood sugar level of each rat was determined at zero-ime, after overnight fasting with free access to water. Glucose2 g/kg b.w.) was orally administered 30 min after the oral admin-stration of the test sample or vehicle (for control). Blood glucoseoncentrations were measured just before and 30, 60, 120 and40 min after the oral administration of the test samples.
.8. Effects on streptozotocin-induced diabetic ratsnon-insulin dependent diabetes model-NIDDM)
.8.1. Induction of diabetesDiabetes was induced in rats by the intraperitoneal
i.p.) injection of streptozotocin (STZ) (Catalog No.:S0130,igma–Aldrich, Germany) at a dose of 55 mg/kg b.w. dissolved
n citrate buffer (1 M, pH 4.5) (1 mL/kg) (Aslan et al., 2000,003). In order to stave off the hypoglycaemia during the firstay after the STZ administration, diabetic rats were given 5%lucose solution orally. Seven days after the injection, the bloodlucose levels were measured and the animals with blood glu-ose levels above 250 mg/dL was considered to be diabetic. Inll experiments, rats were fasted for 16 h prior to STZ injection.
.8.2. Determination of hypoglycaemic activity on acute
dministrationTest samples were given orally using oral gastric gavageso the fasted animals. The blood glucose concentrations of thenimals were measured at the beginning of the study and the
2 opha
mi
2s
B1BOhM
2a
aede0etbtt(1Ldir
Tca(cTohTc
2l
siuiotn1
(sah(
2
C2moeee
2
ebSpc
3
diu
waieg4gro
oT5poied
82 N. Orhan et al. / Journal of Ethn
easurements were repeated 30, 60, 120 and 240 min after thenitial of the experiment.
.8.3. Determination of hypoglycaemic activity onubacute administration
The aqueous extract was administered 15 days consecutively.lood glucose level of each animals was determined at 1st, 5th,0th and 15th days after the administration of the test samples.ody weight of animals was also monitored on the same days.n 15th day, all animals were sacrificed and the kidney, liver andeart of each animal were removed for measurement of tissueDA and GSH levels.
.9. Determination of the lipid peroxidation in liver, kidneynd heart tissues
The method of Ohkawa et al. (1979) as modified by Jamallnd Smith (1985) was used to determine lipid peroxidation lev-ls in tissue samples. Rats were sacrificed with an overdose ofiethylether. Their liver, heart and kidneys were immediatelyxcised and chilled in ice-cold 0.9% NaCl. After washing with.9% NaCl, 0.5 g of wet tissue was weighed exactly and homog-nized in 4.5 mL of 0.25 M sucrose using a Teflon homogenizero obtain a 10% suspension. The cytosolic fraction was obtainedy a two-step centrifugation first at 1000 × g for 10 min andhen at 2000 × g for 30 min at 4 ◦C. A 0.2 mL homogenate wasransferred to a vial and was mixed with 0.2 mL of a 8.1%w/v) sodium dodecyl sulphate solution (Merck, 8.22050.1000),.5 mL of a 0.8% (w/v) solution of TBA (0.375%, Merck,383580 847) and the final volume was adjusted to 4.0 mL withistilled water. Each vial was tightly capped and heated in boil-ng water bath for 60 min. The vials were then cooled underunning water.
Equal volume of tissue blank or test sample and 10%CA (15%, w/v, Merck, K18326610) were transferred into aentrifuge tube and centrifuged at 1000 × g for 10 min. Thebsorbance of the supernatant fraction was measured at 532 nmBeckman DU 650 Spectrometer). The control experiment wasarried out using the same experimental protocol except theBA solution was replaced with distilled water due to the per-xidative effect of streptozotocin on tissue: livers, kidneys andearts of STZ-diabetic rats were used as positive control. 1,1,3,3-etraethoxypropan was used as standard for calibration of theurve.
.10. Non-protein sulfhydryl groups (Cellular GSH) iniver, kidney and heart tissues
Liver (200 mg), heart (400 mg) and kidney (400 mg) tis-ue samples were homogenized in 8.0 mL of 0.02 M EDTAn an ice bath. The homogenates were kept in the ice bathntil used. Aliquots of 5.0 mL of the homogenates were mixedn 15.0 mL test tubes with 4.0 mL distilled water and 1.0 mL
f 50% trichloroacetic acid (TCA). The tubes were cen-rifuged for 15 min at approximately 3000 × g, 2.0 mL of super-atant was mixed with 4.0 mL of 0.4 M Tris buffer (Merck,.08219.0100), pH 8.9, 0.1 mL Ellman’s reagent [5,5′-dithiobis-rhee
rmacology 108 (2006) 280–286
2-nitro-benzoic acid)] (DTNB, Sigma, D-8130) added and theample shaken. The absorbance was read within 5 min of theddition of DTNB at 412 nm against a reagent blank with noomogenate. Results were expressed as �mol GSH/g tissueSedlak and Lindsay, 1968).
.11. Determination of total phenols
The fractions (100 �L) were mixed with 0.2 mL Folin–iocalteu reagent (Sigma, F9252, Batch # 103K3600, 100 mL),mL of H2O and 1 mL of 15% Na2CO3 and the mixture waseasured at 765 nm after 2 h at room temperature. The mean
f three readings was used and the total phenolic content wasxpressed in milligrams of gallic acid equivalents per 1 g ofxtract. The coefficient of determination was r2 = 0.9958 (Gaot al., 2000).
.12. Statistical analysis
Values are presented as means ± S.E.M. Statistical differ-nces between the treatments and the controls were testedy one-way analysis of variance (ANOVA) followed by thetudent–Newman–Keuls test using the “Instat” statistic com-uter program. A difference in the mean values of p < 0.05 wasonsidered to be statistically significant.
. Results
Within the context of present study, antidiabetic and antioxi-ant activities of the aqueous extract from the grape leaves werenvestigated by using in vivo assay techniques in order to eval-ate folk medicine practices in Turkey.
As a preliminary activity assessment, the aqueous extractas prepared following the method described by the informant
nd administrated to normal, glucose-hyperglycaemic and STZ-nduced diabetic rats at two dose levels to determine the acuteffects on blood glucose concentrations. Changes in the bloodlucose level of each group of animals was followed during ah period. Consequently, the extract showed significant hypo-lycaemic activity in glucose-hyperglycaemic and STZ-diabeticats (8.4–21.5% inhibition), while no remarkable effect wasbserved on normoglycaemic rats (Table 1).
In order to determine the subacute effects, two doses of aque-us extract were administered throughout 15 days consecutively.he blood glucose level of each animal was monitored on 1st,th, 10th and 15th days after the administration of the test sam-les. As shown in Table 2, the initial antidiabetic activity wasbserved on 5th day and continued to increase in all groups dur-ng the experimental period. The observed effect with aqueousxtract was more pronounced (32.4%) than that of referencerug, tolbutamide (28.0%).
The dose-depended antidiabetic activity experiments
evealed that the aqueous extract possessed a remarkableypoglycaemic effect at 500 mg/kg dose in diabetic rats. Thisxtract was further fractionated through successive solventxtractions to yield EtOAc Fr., n-BuOH Fr. and R-H2O Fr.
N. Orhan et al. / Journal of Ethnopharmacology 108 (2006) 280–286 283
Table 1Acute hypoglycaemic effect of Vitis vinifera aqueous extract
Test model Group Dose (mg/kg) Mean blood glucose concentration (mg/dL) ±S.E.M. (inhibition %)
0 h 1/2 h 1 h 2 h 4 h
NG
Control – 72.0 ± 3.2 97.7 ± 2.0 145.0 ± 2.9 107.0 ± 2.5 82.0 ± 2.7Tolb. 100 80.0 ± 1.5 76.0 ± 4.6* (22.2) 103.5 ± 3.1*** (28.6) 70.5 ± 2.5*** (34.1) 61.0 ± 5.1*** (25.6)Aqueous extract 250 72.4 ± 2.7 95.4 ± 1.7 (2.4) 133.1 ± 6.6 (8.2) 89.1 ± 4.7 (16.7) 94.0 ± 4.3Aqueous extract 500 77.9 ± 5.9 99.6 ± 7.1 139.3 ± 4.0 (3.9) 121.6 ± 6.8 84.4 ± 4.4
OGTTAqueous extract 250 81.5 ± 4.8 89.0 ± 2.9 (8.9) 134.0 ± 6.0 (7.6) 84.0 ± 1.6*** (21.5) 80.5 ± 2.0 (1.8)Aqueous extract 500 84.0 ± 4.9 96.0 ± 4.0 (1.7) 137.0 ± 3.9 (5.5) 98.0 ± 2.5* (8.4) 84.0 ± 3.7
Diabetic
Control – 384.5 ± 14.9 406.8 ± 13.3 398.3 ± 7.4 376.0 ± 6.5 287.0 ± 7.2Tolb. 100 394.5 ± 32.2 347.0 ± 9.9 (14.7) 347.0 ± 8.9 (12.9) 209.8 ± 7.8*** (44.2) 126.0 ± 5.2*** (56.1)Aqueous extract 250 389.8 ± 27.9 389.3 ± 26.7 (4.3) 402.5 ± 23.6 392.5 ± 31.9 335.3 ± 3.3Aqueous extract 500 381.8 ± 21.8 397.8 ± 20.7 (2.2) 412.8 ± 21.4 325.0 ± 3.3 (13.6) 209.3 ± 9.5*** (27.1)
Tolb., tolbutamide; NG, normoglycaemic; OGTT, oral glucose tolerance test. * p < 0.05, *** p < 0.001 significant from control animals.
Table 2Subacute hypoglycaemic effect of Vitis vinifera aqueous extract on STZ-induced diabetic rats
Test sample Dose (mg/kg) Mean blood glucose concentration (mg/dL) ±S.E.M. (inhibition %)
1st Day 5th Day 10th Day 15th Day
Control – 384.5 ± 14.9 379.3 ± 11.5 375.8 ± 11.6 370.8 ± 6.3Tolbutamide 100 394.5 ± 32.2 309.3 ± 9.5*** (18.5) 270.8 ± 6.3*** (28.0) 273.0 ± 6.4*** (26.4)Aqueous extract 250 389.8 ± 27.9 268.3 ± 7.9*** (29.3) 265.0 ± 7.7*** (29.4) 250.8 ± 10.0*** (32.4)
500 381.8 ± 21.8 281.5 ± 5.6*** (25.8) 260.5 ± 4.3*** (30.7) 267.8 ± 8.8*** (27.8)
S.E.M.: mean standard error.*** p < 0.001 significant from control animals.
Table 3Effects of the aqueous extract’s fractions of Vitis vinifera leaves in glucose-loaded hyperglycaemic (OGTT) rats
Test sample Dose (mg/kg) Mean blood glucose concentration (mg/dL) ±S.E.M. (inhibition %)
0 h 1/2 h + Gl 1 h 2 h 4 h
Control – 80.0 ± 3.1 105.2 ± 3.0 129.6 ± 3.5 110.0 ± 3.3 91.0 ± 2.9Tolbutamide 100 82.2 ± 3.0 67.9 ± 4.2*** (35.5) 77.5 ± 2.8*** (40.2) 55.6 ± 1.5*** (49.4) 50.9 ± 1.9*** (44.1)EtOAc Fr. 50 84.0 ± 1.6 83.6 ± 1.4*** (20.5) 103.0 ± 2.6*** (20.6) 78.9 ± 4.0*** (28.2) 71.8 ± 2.4*** (21.1)n *** *
R
G om co
tBhi
b(
TE
T
CTEnR
S
-BuOH Fr. 160 81.2 ± 2.0 106.0 ± 4.4-H2O Fr. 750 79.0 ± 1.3 102.3 ± 2.8
l: glucose; S.E.M.: mean standard error. * p < 0.05, *** p < 0.001 significant fr
As showed in Table 3, the EtOAc Fr. was the most effec-ive (20.0–28.2%) among the fractions obtained. Whereas n-
uOH Fr. showed a weak effect in the second and fourthours, R-H2O Fr. did not possess any remarkable activ-ty on OGTT. Tolbutamide had an outstanding effect onfn
able 4ffects of the aqueous extract fractions of Vitis vinifera leaves on blood glucose level
est sample Dose (mg/kg) Mean blood glucose concentration (mg/dL) ±0 h 1/2 h
ontrol – 375.0 ± 9.9 376.5 ± 8.9olbutamide 100 379.0 ± 9.1 278.8 ± 6.1*** (25.9)tOAc Fr. 50 381.3 ± 13.2 312.7 ± 9.7*** (16.9)-BuOH Fr. 160 369.1 ± 6.0 347.9 ± 7.9 (7.6)-H2O Fr. 750 375.6 ± 8.3 360.4 ± 8.9 (4.3)
.E.M.: mean standard error. * p < 0.05, ** p < 0.01, *** p < 0.001 significant from con
130.5 ± 7.4 92.2 ± 2.8 (16.2) 82.0 ± 1.9 (9.9)121.2 ± 2.1 105.2 ± 2.8 98.5 ± 3.0
ntrol animals.
lood glucose levels of the glucose-hyperglycaemic animals35.5–49.4%).
In STZ-induced diabetic rats, the effect of EtOAc Fr. wasound as potent as that of the reference drug (Table 4). In fact,-BuOH Fr. was also found to be effective (15.0–20.6%) during
s in STZ-induced diabetic rats
S.E.M. (inhibition %)
1 h 2 h 4 h
326.8 ± 14.9 329.8 ± 9.5 268.8 ± 8.4273.2 ± 3.4** (16.4) 214.34 ± 7.1*** (35.0) 166.0 ± 6.8*** (38.2)285.6 ± 8.3* (12.6) 217.1 ± 10.3*** (34.1) 172.9 ± 8.7*** (36.6)311.4 ± 8.0 (4.7) 280.8 ± 9.3** (15.0) 213.2 ± 9.6*** (20.6)312.2 ± 8.4 (4.5) 315.4 ± 9.4 (4.4) 240.6 ± 9.8 (10.5)
trol animals.

284 N. Orhan et al. / Journal of Ethnopharmacology 108 (2006) 280–286
FS
tes
dttwatg
eoS
iaHpoTmaoIgoll
r(dpted
Ritto
yde
(MD
A)
and
glut
athi
one
(GSH
)co
nten
tsin
the
tissu
esof
STZ
-ind
uced
diab
etic
rats
afte
rsu
bacu
tead
min
istr
atio
n
Dos
e(m
g/kg
)T
issu
eM
DA
(nm
ol/g
wet
wt)
and
GSH
leve
ls(�
mol
/g)±S
.E.M
.(C
hanc
e%
)a
Liv
erK
idne
yH
eart
MD
AG
SHM
DA
GSH
MD
AG
SH
–32
6.7
±13
.578
.7±
1.2
227.
1±
22.6
84.9
±1.
416
9.4
±22
.947
.2±
1.7
rolb
–37
1.1
±6.
2**(+
13.6
)72
.1±
7.8
(−8.
4)42
6.3
±8.
2***
(+87
.7)
78.5
±1.
4(−
7.6)
285.
3±
3.3**
*(+
68.4
)44
.7±
1.4
(−5.
3)ac
tc25
041
9.0
±6.
7***
(+12
.9)
67.2
±1.
3(−
6.8)
303.
6±
6.7**
*(−
28.8
)71
.0±
1.8
(−9.
5)25
8.1
±6.
8**(−
9.5)
27.1
±0.
4***
(−39
.4)
500
348.
8±
5.8*
(−6.
0)12
1.7
±2.
6***
(+68
.8)
349.
4±
5.5**
*(−
18.0
)81
.5±
4.9
(+3.
8)29
2.9
±6.
5(+
2.7)
50.0
±1.
8*(+
11.9
)
stan
dard
erro
r.*
p<
0.05
,**p
<0.
01,**
*p
<0.
001
sign
ifica
ntfr
omco
ntro
lani
mal
s.en
tspe
rcen
tage
ofin
crea
sean
d(−
)re
pres
ents
decr
ease
inea
chva
lue
whe
nco
mpa
red
toei
ther
cont
rolo
rdi
abet
icco
ntro
l.d
tove
hicl
eco
ntro
l(0.
5%C
MC
).d
todi
abet
icco
ntro
l.
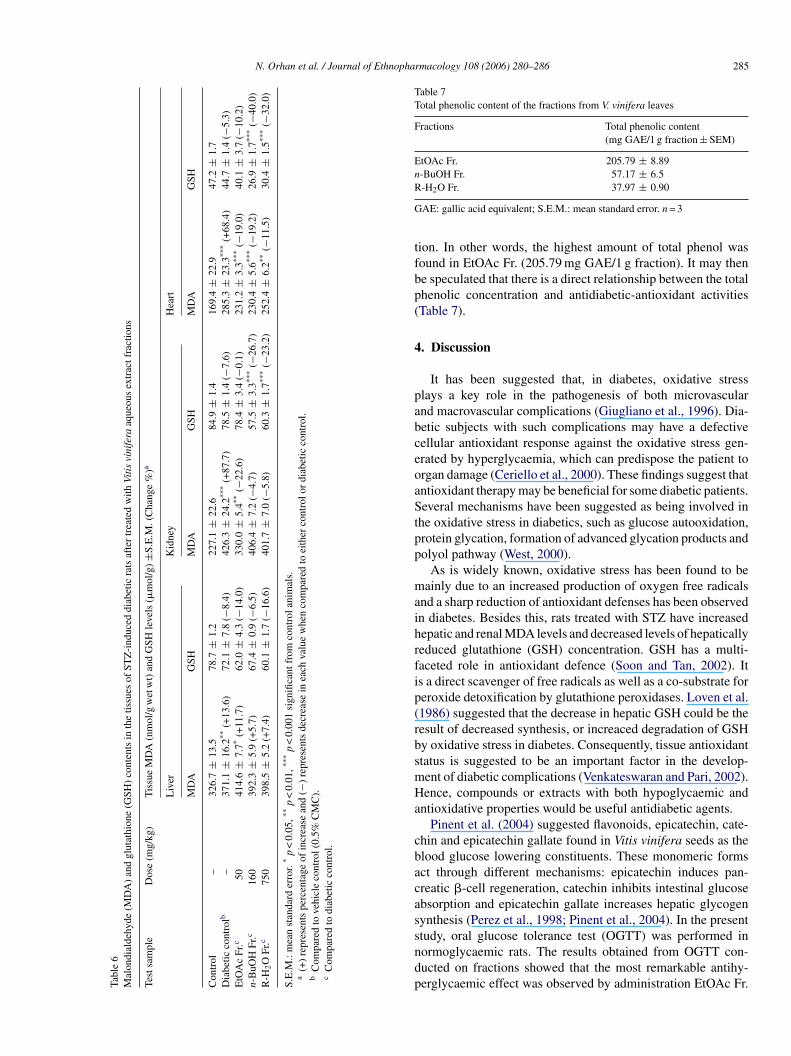
ig. 1. Effect of the aqueous extract of Vitis vinifera leaves on body weight inTZ-induced diabetic rats.
he second and the fourth hour measurements. Although a weakffect was found with R-H2O Fr., this was not statisticallyignificant.
Polyuria is known as one of the common complications iniabetics and induces a loss in body weight. In order to monitorhe effect of grape extract on body weight in diabetic rats duringhe subacute administration, the body weight of each animalas also recorded on 1st, 5th, 10th and 15th days. Vitis vinifera
queous extract was found more active in increasing body weighthan tolbutamide when both were compared with the controlroup (Fig. 1).
In order to evaluate in vivo antioxidant effect of aqueousxtract and its fractions, animals were sacrificed at the endf experiments and tissues were removed as described inection 2.1.
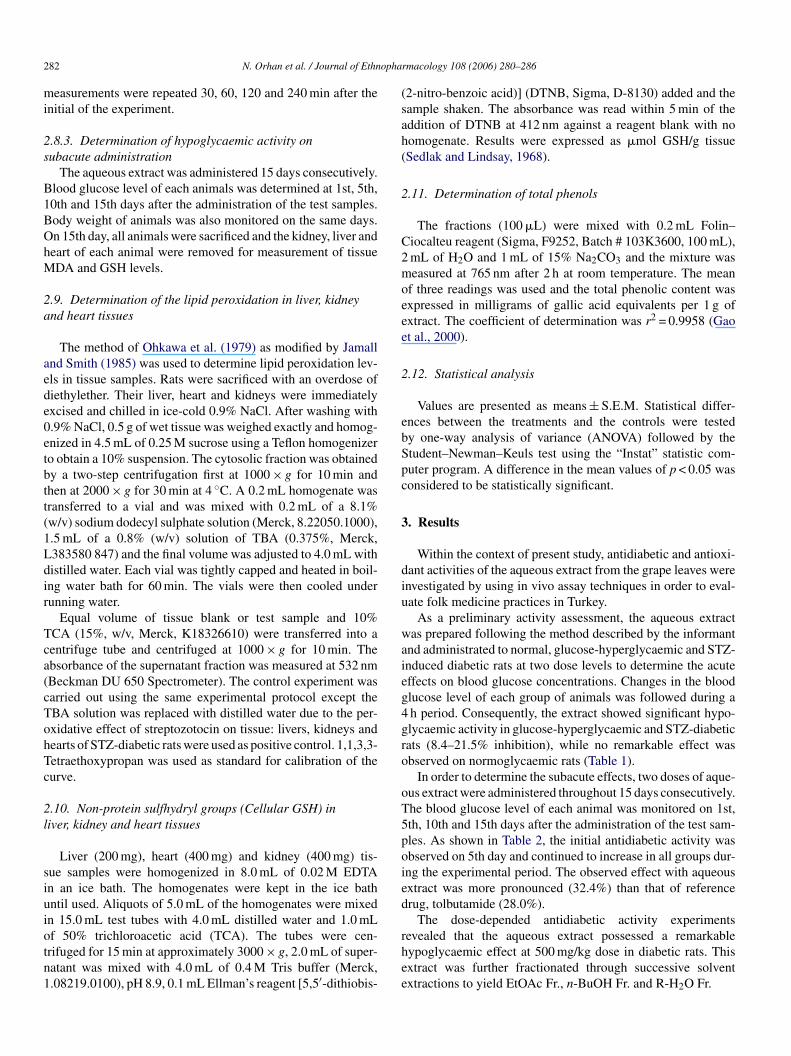
As shown in Table 5, MDA content increased significantlyn liver, kidney and heart tissues of STZ-induced diabetic ratsfter subacute administration, as compared to the control group.owever, the values for heart and kidney tissues were morerominent. By contrast, a small decrease in the GSH levels wasbserved in the liver, kidney and heart tissues of diabetic rats.he GSH contents of liver, kidney and heart tissues were aug-ented by the administration of Vitis vinifera aqueous extract atdose of 500 mg/kg. However, the most pronounced activity wasbserved in liver GSH content, which was increased by 68.8%.n contrast, GSH levels of all tissues decreased when extract wasiven at a dose of 250 mg/kg under the same conditions. On thether hand, both doses of the aqueous extract reduced the MDAevels in kidney tissue significantly, while the effect on the MDAevels in the liver and heart was insignificant.
On acute administration, fractions from grape leavesemained inactive against the increment in tissue GSH levelTable 6). While the MDA level of heart tissues was significantlyecreased by all fractions, only EtOAc Fr. showed a significantrotection on kidney MDA level. This finding suggests that longerm consumption of Vitis vinifera leaves might be more ben-ficial for people who suffer from chronic diseases especiallyiabetes, kidney failure, liver and heart diseases.
Following the biological activity assays, EtOAc, n-BuOH and-H2O fractions were analyzed by TLC to evaluate their chem-
cal characterization. Among these, the EtOAc Fr. was foundo be the richest in condensed tannins and flavonoids. Actually,his evidence is supported by data obtained from measurementf the total phenolic content which is conducted on each frac- Ta
ble
5M
alon
dial
deh
Test
sam
ple
Con
trol
Dia
betic
cont
Aqu
eous
extr
S.E
.M.:
mea
na
(+)
repr
esb
Com
pare
cC
ompa
re
N. Orhan et al. / Journal of Ethnopharmacology 108 (2006) 280–286 285
Tabl
e6
Mal
ondi
alde
hyde
(MD
A)
and
glut
athi
one
(GSH
)co
nten
tsin
the
tissu
esof
STZ
-ind
uced
diab
etic
rats
afte
rtr
eate
dw
ithVi
tis
vini
fera
aque
ous
extr
actf
ract
ions
Test
sam
ple
Dos
e(m
g/kg
)T
issu
eM
DA
(nm
ol/g
wet
wt)
and
GSH
leve
ls(�
mol
/g)±S
.E.M
.(C
hang
e%
)a
Liv
erK
idne
yH
eart
MD
AG
SHM
DA
GSH
MD
AG
SH
Con
trol
–32
6.7
±13
.578
.7±
1.2
227.
1±
22.6
84.9
±1.
416
9.4
±22
.947
.2±
1.7
Dia
betic
cont
rolb
–37
1.1
±16
.2**
(+13
.6)
72.1
±7.
8(−
8.4)
426.
3±
24.2
***
(+87
.7)
78.5
±1.
4(−
7.6)
285.
3±
23.3
***
(+68
.4)
44.7
±1.
4(−
5.3)
EtO
Ac
Fr.c
5041
4.6
±7.
7*(+
11.7
)62
.0±
4.3
(−14
.0)
330.
0±
5.4**
(−22
.6)
78.4
±3.
4(−
0.1)
231.
2±
3.3**
*(−
19.0
)40
.1±
3.7
(−10
.2)
n-B
uOH
Fr.c
160
392.
3±
5.9
(+5.
7)67
.4±
0.9
(−6.
5)40
6.4
±7.
2(−
4.7)
57.5
±3.
3***
(−26
.7)
230.
4±
5.6**
*(−
19.2
)26
.9±
1.7**
*(−
40.0
)R
-H2O
Fr.c
750
398.
5±
5.2
(+7.
4)60
.1±
1.7
(−16
.6)
401.
7±
7.0
(−5.
8)60
.3±
1.7**
*(−
23.2
)25
2.4
±6.
2**(−
11.5
)30
.4±
1.5**
*(−
32.0
)
S.E
.M.:
mea
nst
anda
rder
ror.
*p
<0.
05,**
p<
0.01
,***
p<
0.00
1si
gnifi
cant
from
cont
rola
nim
als.
a(+
)re
pres
ents
perc
enta
geof
incr
ease
and
(−)
repr
esen
tsde
crea
sein
each
valu
ew
hen
com
pare
dto
eith
erco
ntro
lor
diab
etic
cont
rol.
bC
ompa
red
tove
hicl
eco
ntro
l(0.
5%C
MC
).c
Com
pare
dto
diab
etic
cont
rol.
Table 7Total phenolic content of the fractions from V. vinifera leaves
Fractions Total phenolic content(mg GAE/1 g fraction ± SEM)
EtOAc Fr. 205.79 ± 8.89n-BuOH Fr. 57.17 ± 6.5R
G
tfbp(
4
pabceoaStpp
maihrfip(rbsmHa
cbacassndp
-H2O Fr. 37.97 ± 0.90
AE: gallic acid equivalent; S.E.M.: mean standard error. n = 3
ion. In other words, the highest amount of total phenol wasound in EtOAc Fr. (205.79 mg GAE/1 g fraction). It may thene speculated that there is a direct relationship between the totalhenolic concentration and antidiabetic-antioxidant activitiesTable 7).
. Discussion
It has been suggested that, in diabetes, oxidative stresslays a key role in the pathogenesis of both microvascularnd macrovascular complications (Giugliano et al., 1996). Dia-etic subjects with such complications may have a defectiveellular antioxidant response against the oxidative stress gen-rated by hyperglycaemia, which can predispose the patient torgan damage (Ceriello et al., 2000). These findings suggest thatntioxidant therapy may be beneficial for some diabetic patients.everal mechanisms have been suggested as being involved in
he oxidative stress in diabetics, such as glucose autooxidation,rotein glycation, formation of advanced glycation products andolyol pathway (West, 2000).
As is widely known, oxidative stress has been found to beainly due to an increased production of oxygen free radicals
nd a sharp reduction of antioxidant defenses has been observedn diabetes. Besides this, rats treated with STZ have increasedepatic and renal MDA levels and decreased levels of hepaticallyeduced glutathione (GSH) concentration. GSH has a multi-aceted role in antioxidant defence (Soon and Tan, 2002). Its a direct scavenger of free radicals as well as a co-substrate foreroxide detoxification by glutathione peroxidases. Loven et al.1986) suggested that the decrease in hepatic GSH could be theesult of decreased synthesis, or increaced degradation of GSHy oxidative stress in diabetes. Consequently, tissue antioxidanttatus is suggested to be an important factor in the develop-ent of diabetic complications (Venkateswaran and Pari, 2002).ence, compounds or extracts with both hypoglycaemic and
ntioxidative properties would be useful antidiabetic agents.Pinent et al. (2004) suggested flavonoids, epicatechin, cate-
hin and epicatechin gallate found in Vitis vinifera seeds as thelood glucose lowering constituents. These monomeric formsct through different mechanisms: epicatechin induces pan-reatic �-cell regeneration, catechin inhibits intestinal glucosebsorption and epicatechin gallate increases hepatic glycogenynthesis (Perez et al., 1998; Pinent et al., 2004). In the present
tudy, oral glucose tolerance test (OGTT) was performed inormoglycaemic rats. The results obtained from OGTT con-ucted on fractions showed that the most remarkable antihy-erglycaemic effect was observed by administration EtOAc Fr.
2 opha
(tda
al3gedfaeopbtgalebs
A
oDw
R
A
A
A
B
BC
D
D
E
F
F
G
G
G
H
H
J
K
L
M
O
P
P
S
S
S
V
W
86 N. Orhan et al. / Journal of Ethn
28.2–21.1%) throughout the experimental period. This suggestshat the possible mechanism of action for EtOAc Fr. could beue to a direct stimulation of insulin secretion or delayed glucosebsorption.
In a recent study (Monagas et al., 2006), the chemical char-cterization of water and ethanolic extracts of Vitis viniferaeaves have been studied using HPLC method and peonidin--O-glucoside, quercetin-3-O-glucuronide and quercetin-3-O-lucoside have been found as major components of the waterxtract. Flavanols and flavanol oligomers and proanthocyani-ins (condensed tannins) have been proven to possess power-ul antioxidant activities, i.e., free radical scavenging activitynd lipid peroxidation inhibition. The radical scavenging prop-rties of condensed tannins have been demonstrated in vitron different biochemical models mimicking preconditions ofathological situations such as ischemia, inflammation and dia-etic conditions (Elstner and Kleber, 1990). Consequently, inhis study, mainly condensed tannins and flavonoids were sug-ested to contribute to the antidiabetic and antilipidperoxidantctivities of Vitis vinifera leaves. For hundreds of years, grapeeaves have been used as a popular food material in Anatolia,ither as fresh or marinated; in the light of our findings, it maye viewed as a safe alternative medicine for controlling bloodugar level in diabetics.
cknowledgements
This study was financially supported by the Research Fundf Gazi University (02/2004-14). We are acknowledged toROGSAN Tic. A.S. and Ilsan-Iltas Ilaclari for providing usith experimental animals.
eferences
mos, A.F., McCarty, D.J., Zimmet, P., 1997. The rising global burden of dia-betes and its complications: estimates and projections to the year 2010.Diabetic Medicine 14, 1–85.
slan, M., Sezik, E., Yesilada, E., 2000. Antihyperglycaemic effect of Cannabissativa L. fruits. Journal of Faculty of Pharmacy of Gazi University-GUEDE17, 89–93.
slan, M., Sezik, E., Yesilada, E., 2003. Effect of Hibiscus esculentus L. seedson blood glucose levels in normoglycaemic, glucose-hyperglycaemic andstreptozotocin induced diabetic rats. Journal of Faculty of Pharmacy of GaziUniversity-GUEDE 20, 1–7.
aytop, T., 1999. Bitkiler Ile Tedavi (Gecmiste ve Bugun). Nobel Tıp Kitabev-leri, Istanbul, pp. 357–358.
ombardelli, E., Morazzonni, P., 1995. Vitis vinifera L. Fitoterapia 66, 291–317.eriello, A., Morocutti, A., Mercuri, L., Quagliaro, L., Moro, M., Damante, G.,
Viberti, G.C., 2000. Defective intracellular antioxidant enzyme productionin type 1 diabetic patients with nephropathy. Diabetes 49, 2170–2177.
elaunay, J.C., Castagnıno, C., Cheze, C., Vercauteren, J., 2002. Prepar-ative isolation of polyphenolic compounds from Vitis vinifera by cen-
trifugal partion chromatography. Journal of Chromatography A 964,123–128.ieguez, S.C., Lois, L.C., Gomez, E.F., Pena, M.L.G., 2003. Aromatic composi-tion of the Vitis vinifera grape Albarino. LWT-Food Science and Technology36, 580–890.
W
rmacology 108 (2006) 280–286
lstner, E.F., Kleber, E., 1990. Flavonoids in biology and medicine III: currentissues in flavanoid research. National University of Singapore, 227–235.
an, P., Lou, H., Yu, W., Ren, D., Ma, B., Ji, M., 2004. Novel flavanol derivativesfrom grape seeds. Tetrahedron Letters 45, 3163–3166.
elicio, J.D., Santos, R., Goncalez, E., 2001. Chemical Constituents from Vitisvinifera (Vitaceae), 68. Arquivos Do Instituto Biologico, Sao Paulo, pp.47–50.
abetta, B., Fuzatti, N., Griffinni, A., Lolla, E., Pace, R., Ruffilli, T., Peter-longo, F., 2000. Characterization of proanthocyanidins from grape seeds.Fitoterapia 71, 162–175.
ao, X., Ohlander, M., Jeppsson, N., Bjork, L., Trajkovski, V., 2000. Changesin antioxidant effects and their relationship to phytonutrients in fruits ofsea buckthorn (Hippophae rhamnoides L.) during maturation. Journal ofAgricultural Food Chemistry 48, 1485–1490.
iugliano, D., Ceriello, A., Paolisso, G., 1996. Oxidative stress and diabeticvascular complications. Diabetes Care 19, 257–267.
ebash, K.A.H., Fadel, H.M., Solıman, M.M.A., 1991. Volatile components ofgrape leaves. Journal of Islamic Academy of Sciences 4, 26–28.
mamouchi, M., Es-Safi, N., Essassi, E.M., 1997. Oligomeric and polymericproanthocyanidins from Moroccan grapewine (Vitis vinifera) leaves. Fitoter-apia 68, 332–337.
amall, I.S., Smith, J.C., 1985. Effects of cadmium on glutathione peroxidase,superoxide dismutase, and lipid peroxidation in the rat heart a possible mech-anism of cadmium cardiotoxicity. Toxicology and Applied Pharmacology80, 33–42.
ing, H., Aubert, R.E., Herman, W.H., 1998. Global burden of diabetes,1995–2025: prevalence, numerical stimates, and projections. Diabetes Care21, 1414–1431.
oven, D., Schedl, H., Wilson, H., Daabees, T.T., Stegink, L.D., Diekus, M.,Oberley, L., 1986. Effect of insulin and oral glutathione on glutathione levelsand superoxide dismutase activities in organs of rats with streptozotocininduced diabetes. Diabetes 35, 503–507.
onagas, M., Hernandez-Ledesma, B., Gomez-Cordoves, C., Bartalome, B.,2006. Commercial dietary ingredients from Vitis vinifera L. leaves and grapeskins: antioxidant and chemical characterization. Journal of Agricultural andFood Chemistry 54, 319–327.
hkawa, H., Ohishi, N., Yagi, K., 1979. Assay for lipid peroxides in animaltissues by thiobarbituric acid reaction. Analytical Biochemistry 95, 351–358.
erez, R.M., Zavala, G.M.A., Perez, S.G., Perez, C.G., 1998. Antidiabetic effectof compounds isolated from plants. Phytomedicine 5, 55–75.
inent, M., Blay, M., Blade, M.C., Salvado, M.J., Arola, L., Ardevol, A.,2004. Grape seed-derived procyanidins have an antihyperglycaemic effect instreptozotocin-induced diabetic rats and insulinomimetic activity in insulin-sensitive cell lines. Endocrinology 145, 4985–4990.
atman, I., Yilmaz, T., Sengul, A., Salman, S., Salman, F., Uygur, S., Bastar, I.,Tutuncu, Y., Sargin, M., Dinccag, N., Karsidag, K., Kalaca, S., Ozcan, C.,King, H., 2002. Population-based study of diabetes and risk characteristicsin Turkey: results of the Turkish diabetes epidemiology study (TURDEP).Diabetes Care 25, 1551–1556.
edlak, J., Lindsay, R.H., 1968. Estimation of total protein-band and non-proteinsulfhydryl group in tissue with Ellman’s reagent. Analytical Biochemistry25, 192–205.
oon, Y.Y., Tan, B.K.H., 2002. Evaluation of the hypoglycaemic and antioxidantactivities of Morinda officinalis in streptozotocin-induced. Diabetic Rats,Singapore Medical Journal 43, 77–85.
enkateswaran, S., Pari, L., 2002. Antioxidant effect of Phaseolus vulgaris instreptozotocin-induced diabetic rats. Asia Pacific Journal of Clinical Nutri-tion 11, 206–209.
est, I.C., 2000. Radicals and oxidative stress in diabetes. Diabetic Medicine
17, 171–180.HO, 2003. Screening for type 2 diabetes report of a World Health Orga-nization and International Diabetes Federation Meeting. Report of WorldHealth Organization Department of Non-communicable Disease Manage-ment. Geneva.