
Profitability and Labor Productivity in Indonesian Agriculture
Upload
khangminh22Category
view
2download
0
“Determinants of bank profitability for the selected private commercial banks inBangladesh: a panel data analysis”
AUTHORSMd. Ariful Islam
Rezwanul Hasan Rana
ARTICLE INFO
Md. Ariful Islam and Rezwanul Hasan Rana (2017). Determinants of bank
profitability for the selected private commercial banks in Bangladesh: a panel
data analysis. Banks and Bank Systems, 12(3), 179-192. doi:10.21511/bbs.12(3-
1).2017.03
DOI http://dx.doi.org/10.21511/bbs.12(3-1).2017.03
RELEASED ON Wednesday, 18 October 2017
RECEIVED ON Wednesday, 19 April 2017
ACCEPTED ON Tuesday, 08 August 2017
LICENSE
This work is licensed under a Creative Commons Attribution-NonCommercial 4.0
International License
JOURNAL "Banks and Bank Systems"
ISSN PRINT 1816-7403
ISSN ONLINE 1991-7074
PUBLISHER LLC “Consulting Publishing Company “Business Perspectives”
FOUNDER LLC “Consulting Publishing Company “Business Perspectives”
NUMBER OF REFERENCES
34
NUMBER OF FIGURES
12
NUMBER OF TABLES
8
© The author(s) 2021. This publication is an open access article.
businessperspectives.org

179
Banks and Bank Systems, Volume 12, Issue 3, 2017
Abstract
This study aims to investigate the determinants of profitability of fifteen selected private commercial banks in Bangladesh over the period 2005‒2015. The study emphasizes on the internal factors that affect bank profitability. This research uses panel data to ex-plore the impact of the nonperforming loan, cost to income ratio, loan to deposit ratio, commission fees, cost of fund and operating expenses on the profitability indicators of banks like return on asset and return on equity. The experimental outcomes have found strong evidence that nonperforming loan (NPL) and operating expenses have a significant effect on the profitability. Moreover, the results have shown that higher NPL may lead to less profit due to the provision of classified loans. Again, higher loan to deposit (LD) ratio and cost of fund contribute towards profitability, but their impacts are not significant in the private commercial banks of Bangladesh.
Md. Ariful Islam (Bangladesh), Rezwanul Hasan Rana (Australia)
BUSINESS PERSPECTIVES
LLC “СPС “Business Perspectives” Hryhorii Skovoroda lane, 10, Sumy, 40022, Ukraine
www.businessperspectives.org
Determinants of bank
profitability for the
selected private commercial
banks in Bangladesh: a panel
data analysis
Received on: 19th of April, 2017Accepted on: 8th of August, 2017
INTRODUCTION
The bank is a financial institution authorized to get deposits and make loans. A strong banking sector can deal with negative shocks and con-tribute to the stability of the financial system. The profitability of fi-nancial institutions like the bank is affected by numerous factors (Ani et al., 2012). Determinants of bank profitability can be divided into in-ternal and external factors. Internal determinants of bank profitability can be characterized by variables that impact bank’s administrative choices and policy objectives (Staikouras & Wood, 2011). These vari-ables incorporate internal components to each financial institution and a few essential external forces. The fundamental conclusion rising up out of previous studies is that internal factors clarify an extensive proportion of banks’ productivity. Operational efficiency is the major point in deciding performance of the banks (Oral & Yolalan, 1990). The internal components are controllable variables which are cost effi-ciency, liquidity, asset quality, and capital adequacy. Previous studies used some internal variables to measure profitability (Almazari, 2014). We used the latest data of past ten years about private commercial banks of Bangladesh thus the result of this study depicts the current scenario of bank profitability in Bangladesh.
© Md. Ariful Islam, Rezwanul Hasan Rana, 2017
Md. Ariful Islam, DBA Candidate, University of Dhaka, Banker of Mutual Trust Bank Ltd, Bangladesh.
Rezwanul Hasan Rana, Ph.D. Сandidate, University of Southern Queensland, Australia
This is an Open Access article, distributed under the terms of the Creative Commons Attribution-Non-Commercial 4.0 International license, which permits re-use, distribution, and reproduction, provided the materials aren’t used for commercial purposes and the original work is properly cited.
bank, NPL, ROA, ROE, profitability, Bangladesh, operating expenses, panel data.
Keywords
JEL Classification C23, E44, F60, G01, G21
180
Banks and Bank Systems, Volume 12, Issue 3, 2017
Measures of after-expense rate of return, like the return on average total assets (ROA) and the return on total equity (ROE), are broadly used for assessing the performance of the banks. Banks have strong significance in terms of the strength of a financial system and assurance of its sound financial structure of a country. Among the controllers in money related framework of a country, banks have capacities to finance, utilize assets and render administrative services. However, the profit-making objective of the banks separates them from other money-related organizations.
Unlike some previous studies which measured the factors of bank profitability (Duraj & Moci, 2015), we have used both ROA & ROE as dependent variables in the model. Major emphasis has been given to determining the impact of non-performing loans (NPL). This study may add new conclusion to the finance literature on the profitability of banking systems.
In this research, two crucial questions will be asked to find out the determinants of banks’ profitability. They are:1. what determines the bank profitability of the selected private commercial banks in Bangladesh?2. how NPL affects the profitability of private commercial banks in Bangladesh?
So the main objectives of the study are: • to determine the profitability of private commercial banks in Bangladesh;• to understand the effect of NPL on banks’ profitability in Bangladesh.
1. LITERATURE REVIEW
This section presents the overview of previous stud-ies related to the determinants of banks’ profitability in Bangladesh. Earlier studies were country specific and others considered panel of countries for review-ing the determinants of bank profitability (Ani et al., 2012). These studies used return on assets (ROA) and return on equity (ROE) as the dependent vari-ables. The internal factors NPL, cost to income ratio, LD ratio, cost of fund, commission and operating expenses were considered as control variables.
Sufian (2011) studied the profitability of banks in Korea. He found that Korean banks with lower liquidity levels tend to show higher profitability. Again, Dietrich et al. (2011) studied the profit-ability of Swiss banks and concluded that equity to total assets ratio, cost to income ratio, deposit growth rate, funding cost, interest income, effec-tive tax rate and ownership structure negatively af-fect banking profitability in Switzerland.
Likewise, Smith et al. (2003) studied profitability of the European banks, and their results showed that among bank-specific determinants loan to as-sets ratio, the loan loss provisions have inverse ef-fect, but the level of equity and funding gap posi-tively affect banks’ profit. Similarly, Athanasoglu
et al. (2006) studied the banking profitability de-terminants of Greek banking. The results indicate that equity level, productivity, inflation and cycli-cal output have significant positive relationship, while loan loss provision and operating expenses have the significantly negative relationship with banks’ profitability.
Furthermore, Pasiouras et al. (2007) in a study of fifteen EU countries found a significant posi-tive relationship between banking profit, equity level, liquidity position, concentration, inflation and GDP growth rate. They also concluded that cost of fund and size variables negatively impact banking profitability. Chantapong (2005) studied the performance of domestic and foreign banks in Thailand during the period 1995‒2000. He found that financial restructuring program improved the profitability of both foreign and domestic banks. In another study, Sufian and Habibullah (2009) studied the profitability of the Chinese banking sector during the period 2000‒2005. They have found that liquidity, credit risk, and capital-ization are the top three determinants that have the positive impact on the state-owned commer-cial banks’ profitability.
It is noticeable that previous studies have either used ROA or ROE as the predictor variable to de-termine the bank’s profitability. But in this study,
181
Banks and Bank Systems, Volume 12, Issue 3, 2017
we have used both ROA and ROE to assess the profitability of selected private commercial banks of Bangladesh. Return on assets (ROA) reflects the ability of a company to generate profits from its assets and it’s very important for bank’s man-agement to know about the bank’s ROA. ROA is primarily an indicator of managerial efficiency, as well as it indicates the return to shareholders on their equity.
For example, Gottard et al. (2004) employed re-turn on equity (ROE) as a measure of profitability. In many European banks, the off-balance-sheet business makes a major contribution to total prof-it. The earnings generated from these activities are excluded from the denominator of ROA. ROE
has been used as the key ratio for the evaluation of bank profitability. In another study, Swamy (2012) used panel data techniques to study the de-terminants of bank asset quality and profitability. He used robust datasets for the period 1997‒2009. The findings of the study revealed some interest-ing inferences opposing the established opinions. Priority sector credit was found insignificant to affect the nonperforming assets, contrary to the general perception.
According to the Global Financial Stability Report of International Monetary Fund (2009), to im-prove profitability, banks should focus on manag-ing their asset quality along with determinants of profitability. The increasing incidence of poor bank asset quality requires attention at the elements that affect the performance of a bank’s profitabil-ity and asset management. Similar to the previous conclusions, Demirguc-Kunt (1989) and Barr and Siems (1994) have also stated that asset quality is a major predictor of insolvency. Therefore, high level of nonperforming loans has been found as a major cause of failures of the banking institu-tions. Additionally, the problem of nonperforming assets (NPAs) has become identical to functional effectiveness of financial intermediaries and the major cause of the economic problems.
Barseghyan (2004) identified the relationship between the Japanese government’s unwilling-ness to solve the bad loan problem and the eco-nomic slowdown. He concluded that the gov-ernment’s reluctant behavior deteriorated the economic situation in Japan. Again, Lis et al.
(2001) used an equation model to explain the bank loan losses in Spain using some major in-dicators like GDP growth rate, debt-equity ratio, regulations, loan growth, bank branch growth rates, size of the bank (assets over total size), collateral loans, net interest margin, capital-as-set ratio and market power of the default com-panies in the market.
Ranjan and Dhal (2003) analyzed the NPAs of public sector banks in India in terms of credit, bank size and macroeconomic condition. In this empirical analysis, they have shown that terms of credit have a significant influence on the banks’ NPAs in the presence of bank size and macroeco-nomic shocks. However, Bhattacharya (2001) has pointed that increasing interest rate push the qual-ity borrowers over to other opportunities such as capital markets, internal accruals for their neces-sity of funds.
Additionally, Carter et al. (2004) and Carter and McNulty (2005) suggested that monitoring may be an influential factor to contribute small bank’s financial performance because risk-adjusted loan’s yield and spread are greater for small banks. According to their research, the most important reason for the positive relationship between moni-toring and performance is the ability of the small banks to discover economically valuable informa-tion. It helped to have an idea about a firm’s finan-cial condition by monitoring the firm’s demand deposit account. Again, Kaya (2002) examined the determinants of productivity for Turkish banks for the 1997-2000. He found that that capital, li-quidity, personal expenditures, advances, nonper-forming loans, and deposits are the determinants of bank profitability.
The above discussions validate a strong linkage between bank’s profitability and internal factors like; NPL and operating expenses. According to the nature and use of each study mentioned in the literature review, a number of explanatory vari-ables have been proposed in this study as determi-nants of private commercial bank’s profitability in Bangladesh. We have taken nonperforming loans (NPLs), cost to income ratio, cost of fund, loan-de-posit ratio, commission and operating expenses to find the relationship with return on assets (ROA) and return on equity (ROE).
182
Banks and Bank Systems, Volume 12, Issue 3, 2017
2. BANKING PERFORMANCE
INDICATORS
The private commercial banks have been play-ing a vital role in achieving the economic growth of Bangladesh in the past few years. All the banks in Bangladesh are divided in to private commer-cial banks (PCBs), state-owned commercial banks (SCBs), development financing institutions (DFIs) and foreign commercial banks (FCBs). In this sec-tion, we provide a brief discussion of the existing state of banking sector in Bangladesh. All the graphs are authors’ own calculations, generated from the data of Bangladesh banks annual reports from 2005 to 2015.
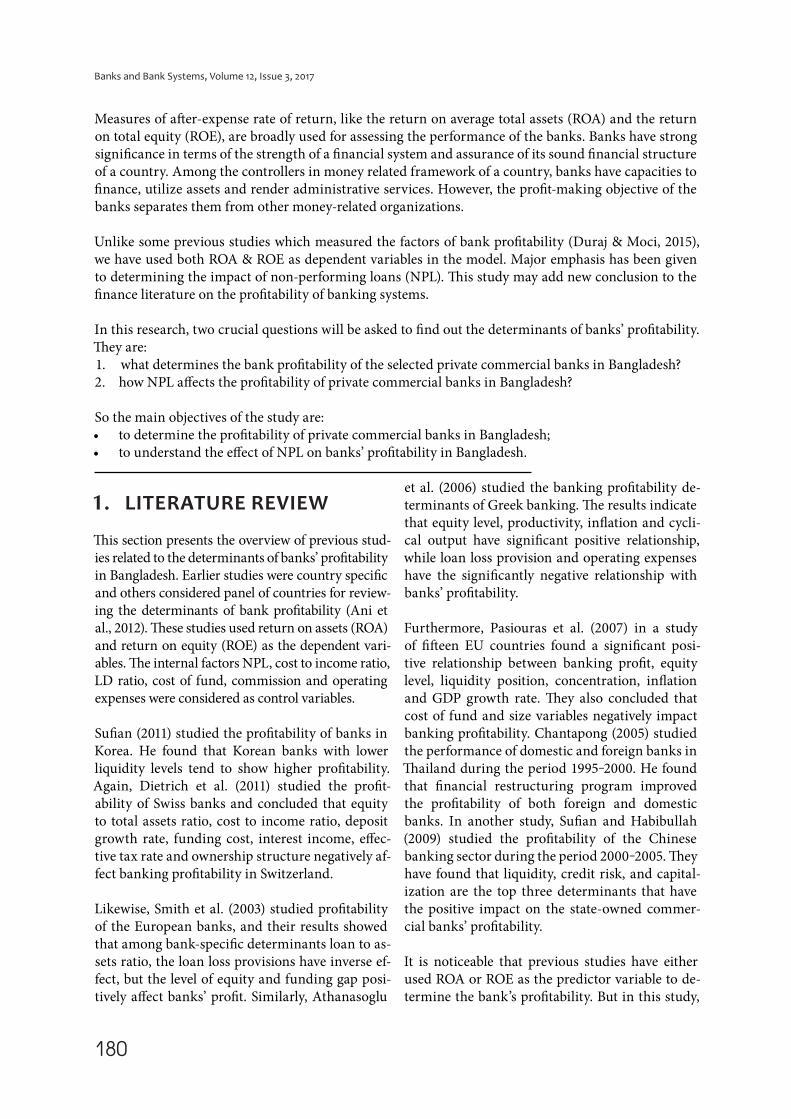
NPL to total loans has a downward trend for most of the banks like SCB, PCB, whereas it’s the up-ward trend in case of DFI and FCB. For PCB, NPL has a decline of 42.86% in the year 2014 compared to 2007. However, for DFI and FCB have growth of 34.21% and 52.63%, respectively.
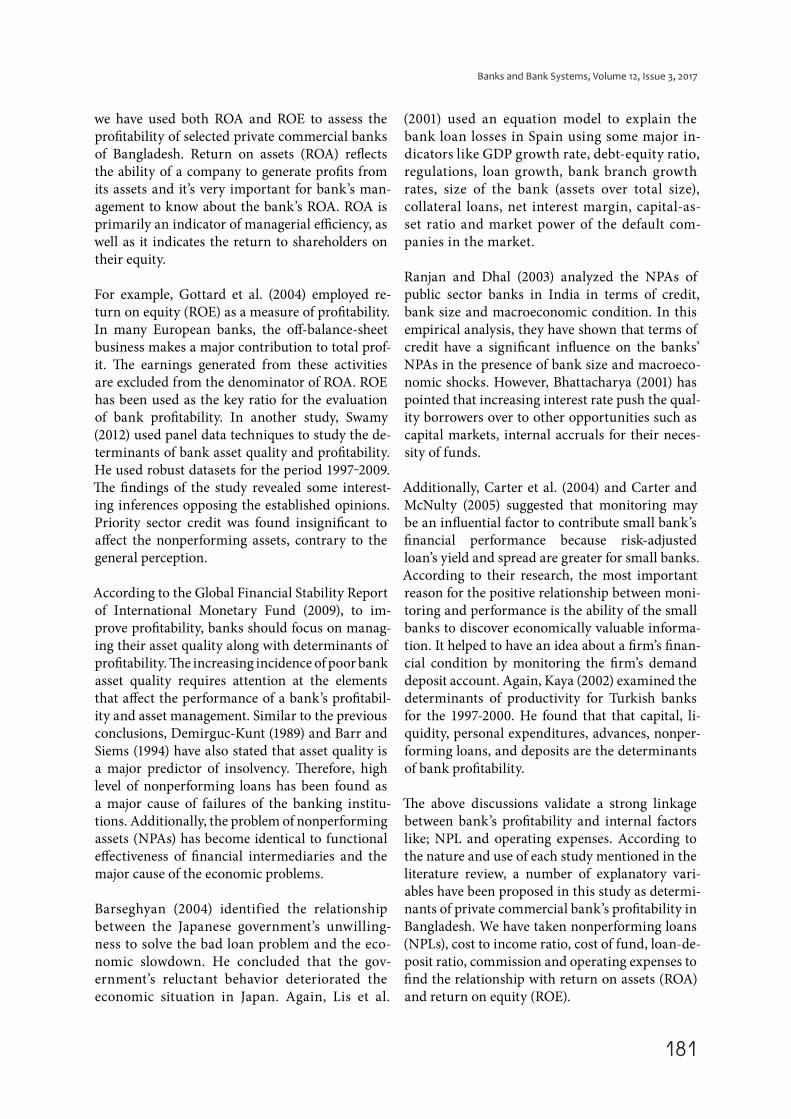
There is an increase in the amount of NPL for PCB over the period of time and in 2014, the number goes at BDT 184.3 billion, which can refer to the poor managerial capacity to manage the loans properly. There might be so many reasons behind these classified loans which work for all other above mentioned types of banks.
The above graph shows the amount of the NPLs for all the banks from the year 2007 to 2014 along with provision required for the NPLs, ex-cess or shortfall and the provision maintained by the banks. There is an increasing trend of NPLs amount and required provision over the period of times. But the maintained provision didn’t show the mirror picture accordingly and there is increased movement of provision maintained ration from 2007 to 2008 and 2009, whereas the ratio has fallen from 103.04% to 78.3% in the year 2011 and 97.20% in 2014 from 99% (2013).
Figure 1. Ratio of net NPL to total loans by type of banks
-4,0
6,0
16,0
26,0
2007 2008 2009 2010 2011 2012 2013 2014
Ratio of net NPL to total loans by type of banks
SCBs DFIs PCBs FCBs
Figure 2. Amount of NPL to total loans by type of banks
0,0
50,0
100,0
150,0
200,0
2007 2008 2009 2010 2011 2012 2013 2014
Amount of NPLs
SCBs DFIs PCBs FCBs

183
Banks and Bank Systems, Volume 12, Issue 3, 2017
PCB has maintained the provision required to maintain over the three consecutive years (2012‒2014), which has not maintained by the peer type of banks in such a managed way.
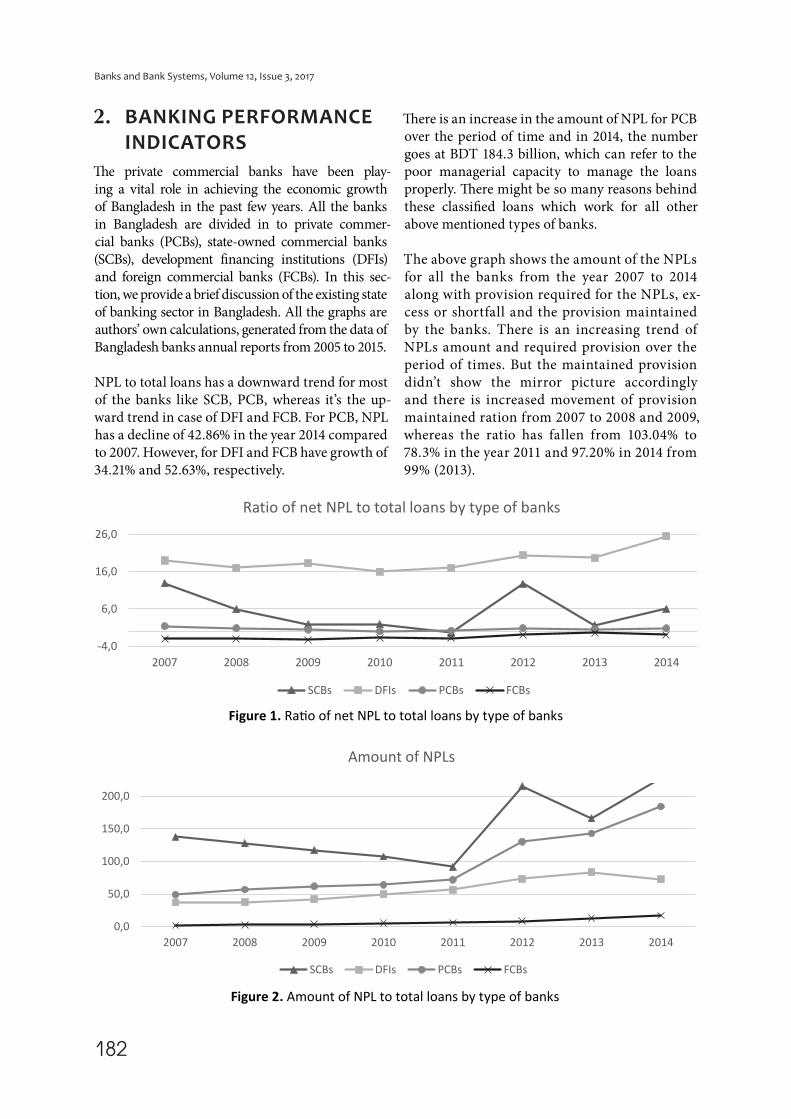
Private commercial banks play a great role in the banking industry and we can see this in the graph since in every category the number exceeds all peer type of banks. There are 39 banks which consist of 3,982 branches. Total assets and depos-its are more than any other type of banks in the country.
RWA is one of the most important things to be considered by the banks to maintain MCR (min-imum capital requirement) and this has an up-ward trend over the period of time for all bank types, since they are having more assets which are quite risky. For PCBs, it’s 10% to 13% from 2007 to 2014.
NPL ratio is lower than any other type of banks for each and every year from 2011 to 2014 and in the year 2007‒2010 it has a little higher percentage of ratios. The NPL ratio is the highest for SCBs.
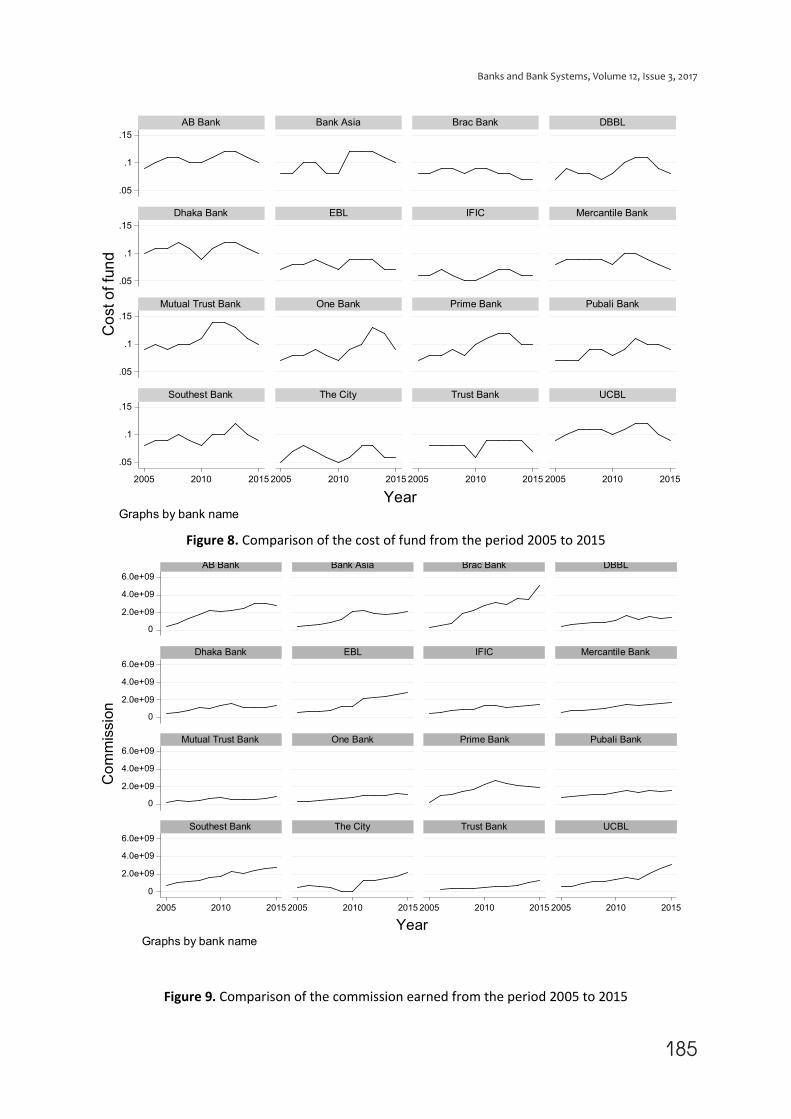
Again, it is also imperative to compare the current financial position of the fifteen commercial banks whose data has been used to conduct this study. These graphical presentations are authors own calculation using the data collected from all the fifteen banks. The comparison shows only those variables which we have found significant in our study. The data of the graphs includes the period from 2005 to 2015.
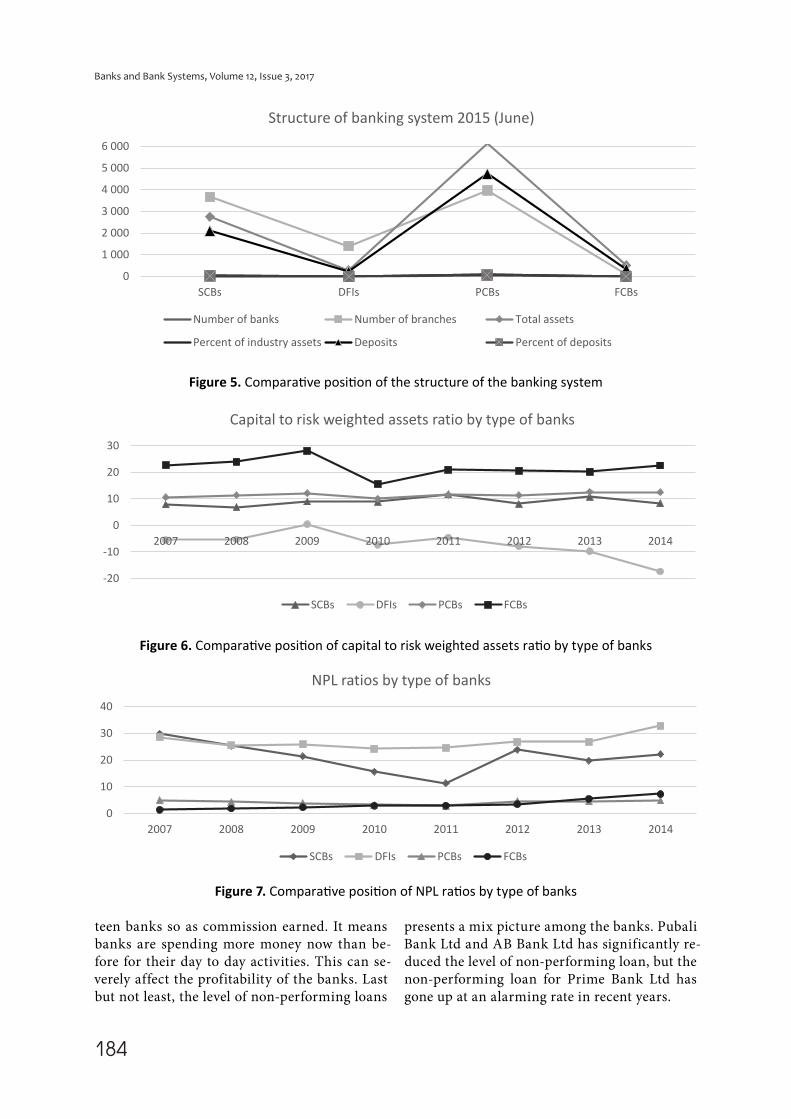
The variable cost of fund shows volatility for all the banks during 2010, but interestingly for most of the banks, the cost of deposit went up slightly in 2015 compared to 2005. On the other hand, the operating expenses depict a rising trend for all fif-
Figure 3. Required provision and provision maintained by all banks
-2
198
398
2007 2008 2009 2010 2011 2012 2013 2014
Required provision and provision maintained all banks
Amount of NPLs Required provision
Provision maintained Excess (+)/ shortfall(-)
Provision maintenance ratio (%)
Figure 4. Comparative position of provision adequacy all banks
1030507090
110130
Re
qu
ire
d
pro
vis
ion
Pro
vis
ion
ma
inta
ine
d
Pro
vis
ion
ma
inte
na
nce
(%)
Re
qu
ire
d
pro
vis
ion
Pro
vis
ion
ma
inta
ine
d
Pro
vis
ion
ma
inte
na
nce
(%)
Re
qu
ire
d
pro
vis
ion
Pro
vis
ion
ma
inta
ine
d
Pro
vis
ion
ma
inte
na
nce
(%)
2012 2012 2012 2013 2013 2013 2014 2014 2014
Comparative position of provision adequacy
SCBs SBs PCBs FCBs
184
Banks and Bank Systems, Volume 12, Issue 3, 2017
Figure 5. Comparative position of the structure of the banking system
0
1 000
2 000
3 000
4 000
5 000
6 000
SCBs DFIs PCBs FCBs
Structure of banking system 2015 (June)
Number of banks Number of branches Total assets
Percent of industry assets Deposits Percent of deposits
Figure 6. Comparative position of capital to risk weighted assets ratio by type of banks
-20
-10
0
10
20
30
2007 2008 2009 2010 2011 2012 2013 2014
Capital to risk weighted assets ratio by type of banks
SCBs DFIs PCBs FCBs
Figure 7. Comparative position of NPL ratios by type of banks
0
10
20
30
40
2007 2008 2009 2010 2011 2012 2013 2014
NPL ratios by type of banks
SCBs DFIs PCBs FCBs
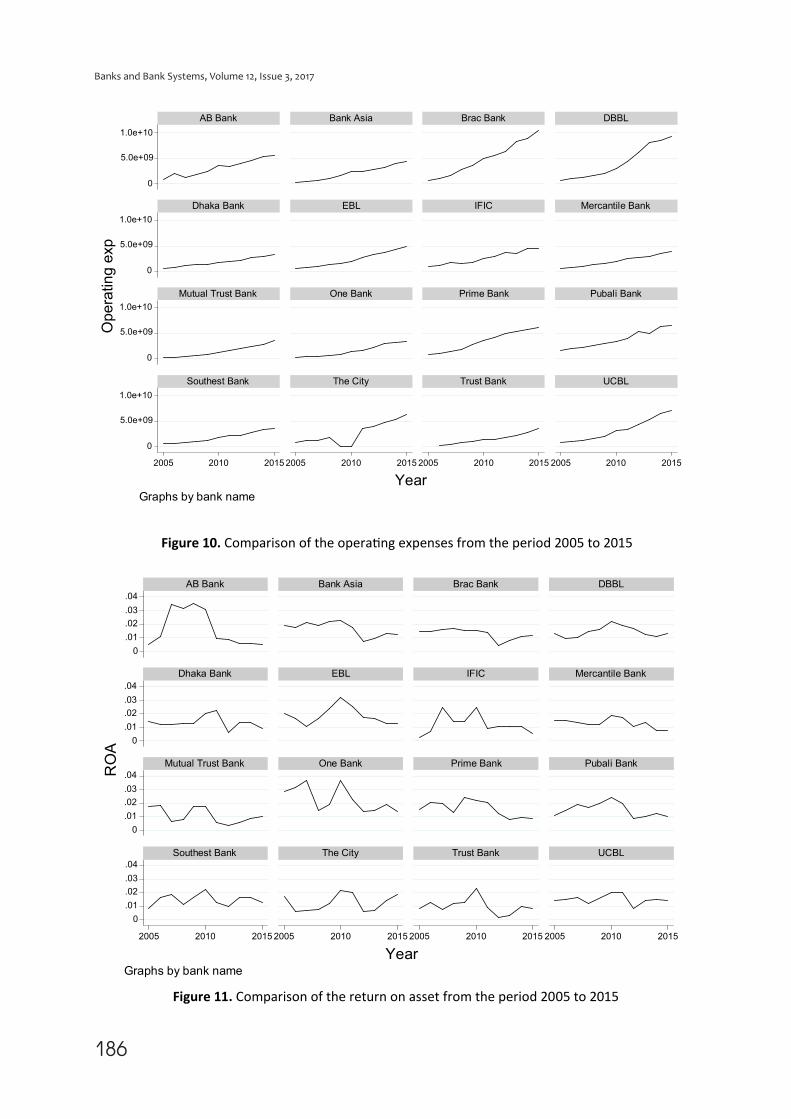
teen banks so as commission earned. It means banks are spending more money now than be-fore for their day to day activities. This can se-verely affect the profitability of the banks. Last but not least, the level of non-performing loans
presents a mix picture among the banks. Pubali Bank Ltd and AB Bank Ltd has significantly re-duced the level of non-performing loan, but the non-performing loan for Prime Bank Ltd has gone up at an alarming rate in recent years.
185
Banks and Bank Systems, Volume 12, Issue 3, 2017
Figure 8. Comparison of the cost of fund from the period 2005 to 2015
.05
.1
.15
.05
.1
.15
.05
.1
.15
.05
.1
.15
2005 2010 2015 2005 2010 2015 2005 2010 2015 2005 2010 2015
AB Bank Bank Asia Brac Bank DBBL
Dhaka Bank EBL IFIC Mercantile Bank
Mutual Trust Bank One Bank Prime Bank Pubali Bank
Southest Bank The City Trust Bank UCBL
Сo
st o
f fu
nd
YearGraphs by bank name
Figure 9. Comparison of the commission earned from the period 2005 to 2015
0
2.0e+09
4.0e+09
6.0e+09
0
2.0e+09
4.0e+09
6.0e+09
0
2.0e+09
4.0e+09
6.0e+09
0
2.0e+09
4.0e+09
6.0e+09
2005 2010 2015 2005 2010 2015 2005 2010 2015 2005 2010 2015
AB Bank Bank Asia Brac Bank DBBL
Dhaka Bank EBL IFIC Mercantile Bank
Mutual Trust Bank One Bank Prime Bank Pubali Bank
Southest Bank The City Trust Bank UCBL
Co
mm
issio
n
YearGraphs by bank name
186
Banks and Bank Systems, Volume 12, Issue 3, 2017
Figure 10. Comparison of the operating expenses from the period 2005 to 2015
Figure 11. Comparison of the return on asset from the period 2005 to 2015
0
5.0e+09
1.0e+10
0
5.0e+09
1.0e+10
0
5.0e+09
1.0e+10
0
5.0e+09
1.0e+10
2005 2010 2015 2005 2010 2015 2005 2010 2015 2005 2010 2015
AB Bank Bank Asia Brac Bank DBBL
Dhaka Bank EBL IFIC Mercantile Bank
Mutual Trust Bank One Bank Prime Bank Pubali Bank
Southest Bank The City Trust Bank UCBL
Op
era
tin
g e
xp
YearGraphs by bank name
0
.01
.02
.03
.04
0
.01
.02
.03
.04
0
.01
.02
.03
.04
0
.01
.02
.03
.04
2005 2010 2015 2005 2010 2015 2005 2010 2015 2005 2010 2015
AB Bank Bank Asia Brac Bank DBBL
Dhaka Bank EBL IFIC Mercantile Bank
Mutual Trust Bank One Bank Prime Bank Pubali Bank
Southest Bank The City Trust Bank UCBL
RO
A
YearGraphs by bank name

187
Banks and Bank Systems, Volume 12, Issue 3, 2017
3. DATA
DESCRIPTION
The study is based only on secondary data. For this research, we have used the data published in an-nual reports of selected PCBs of Bangladesh for the years 2005‒2015 and Bangladesh Bank.
3.1. NPL
Nonperforming loan (NPL) is a loan on which borrower does not make any interest and prin-cipal payments for at least 90 days (Bangladesh Bank, 2016). Banks generally set back up mon-ey to cover potential losses on loans (loan loss provisions) and write off bad debt in their profit and loss account. In some countries, banks can sell NPLs at a discount - to specially established asset management companies (AMCs), which attempt to recover at least some of the money repaid (Scardovi, 2015).
3.2. Cost to
income ratio
Cost to income ratio is one of the key financial measures, particularly important in measure-ment of productivity, efficiency and valuing in company. It shows the cost of the company in relation to its income. To get the ratio, divide the operating costs by operating income. It gives investors a clear view of how efficiently the firm is being run. It is also known as efficiency ratio. It covers both operating expenses and all types of provision (Vittas, 1991).
3.3. Loan deposit ratio
The loan to deposit ratio is the commonly used sta-tistic for assessing bank’s liquidity by dividing the bank’s total loans by its total deposits. High ratio refers to the bank’s inadequate liquidity to cover
0
.05
.1
.15
0
.05
.1
.15
0
.05
.1
.15
0
.05
.1
.15
2005 2010 2015 2005 2010 2015 2005 2010 2015 2005 2010 2015
AB Bank Bank Asia Brac Bank DBBL
Dhaka Bank EBL IFIC Mercantile Bank
Mutual Trust Bank One Bank Prime Bank Pubali Bank
Southest Bank The City Trust Bank UCBL
NP
L
YearGraphs by bank name
Figure 12. Comparison of the nonperforming loans from the period 2005 to 2015
188
Banks and Bank Systems, Volume 12, Issue 3, 2017
any unforeseen fund requirements. Conversely, if the ratio is too low, may be indicate that inadequate lending opportunities or reluctance to accept the available lending risks. So the bank may not be earning as much as it could be (McNaughton & Barltrop, 1992).
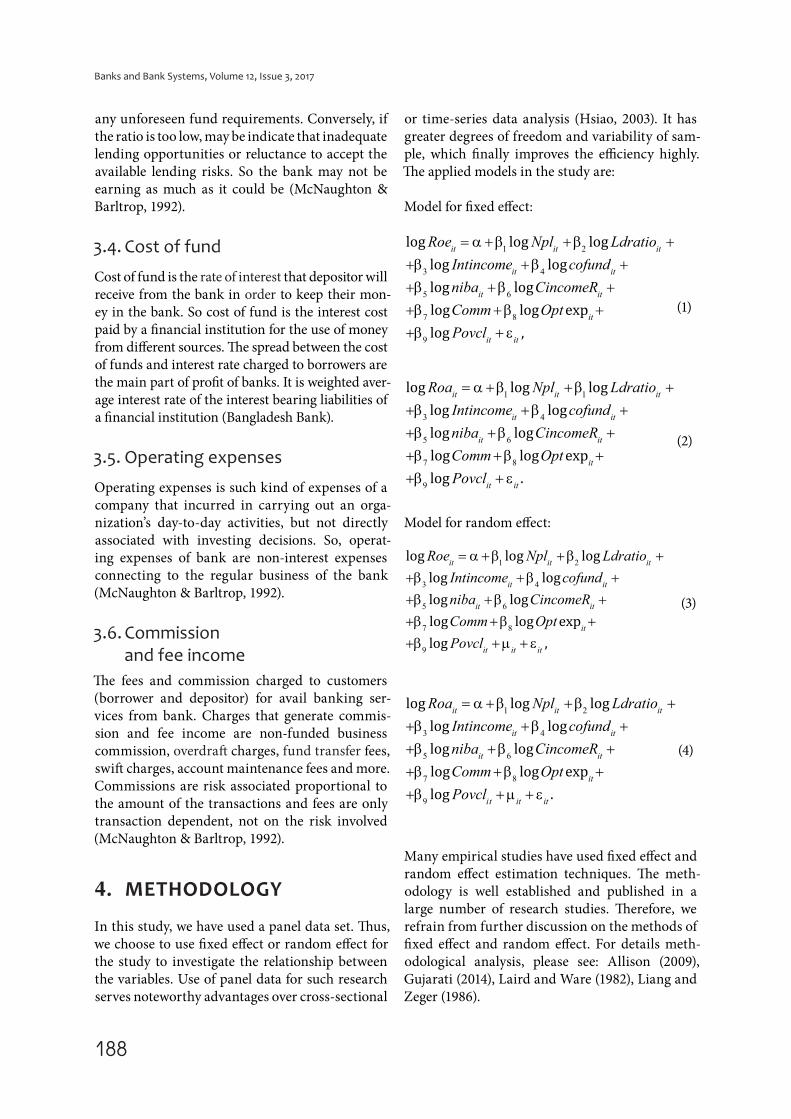
3.4. Cost of fund
Cost of fund is the rate of interest that depositor will receive from the bank in order to keep their mon-ey in the bank. So cost of fund is the interest cost paid by a financial institution for the use of money from different sources. The spread between the cost of funds and interest rate charged to borrowers are the main part of profit of banks. It is weighted aver-age interest rate of the interest bearing liabilities of a financial institution (Bangladesh Bank).
3.5. Operating expenses
Operating expenses is such kind of expenses of a company that incurred in carrying out an orga-nization’s day-to-day activities, but not directly associated with investing decisions. So, operat-ing expenses of bank are non-interest expenses connecting to the regular business of the bank (McNaughton & Barltrop, 1992).
3.6. Commission
and fee income
The fees and commission charged to customers (borrower and depositor) for avail banking ser-vices from bank. Charges that generate commis-sion and fee income are non-funded business commission, overdraft charges, fund transfer fees, swift charges, account maintenance fees and more. Commissions are risk associated proportional to the amount of the transactions and fees are only transaction dependent, not on the risk involved (McNaughton & Barltrop, 1992).
4. METHODOLOGY
In this study, we have used a panel data set. Thus, we choose to use fixed effect or random effect for the study to investigate the relationship between the variables. Use of panel data for such research serves noteworthy advantages over cross-sectional
or time-series data analysis (Hsiao, 2003). It has greater degrees of freedom and variability of sam-ple, which finally improves the efficiency highly. The applied models in the study are:
Model for fixed effect:
1 2
3 4
5 6
7 8
9
it it it
it
it it
it
it it
it
Npl Ldratio
Intincome cofund
niba CincomeR
Comm Opt
Povc
e
l
Ro log log
log log
log log
log log exp
lo
l
g
og
,
= α +β +β ++β +β ++β +β ++β +β ++β + ε
(1)
1 1
3 4
5 6
7 8
9
it it it
it it
it it
it
it it
Npl Ldratio
Intincome cofund
niba CincomeR
Comm Opt
Povc
a
l
Ro log log
log log
log log
log log exp
lo
l
g
og
.
= α +β +β ++β +β ++β +β ++β +β ++β + ε
(2)
Model for random effect:
1 2
3 4
5 6
7 8
9
it it it
it it
it it
it
it it it
Npl Ldratio
Intincome cofund
niba CincomeR
Comm Op
Ro
t
P cl
e
ov
log log
log log
log log
log log ex
l
p
o
g ,
g
lo
= α +β +β ++β +β ++β +β ++β +β ++β +µ + ε
(3)
1 2
3 4
5 6
7 8
9
it it
it it
it it
it
it it it
itNpl Ldratio
Intincome cofund
niba CincomeR
Comm Op
Ro
t
P cl
a
ov
log log
log log
log log
log log ex
l
p
o
g .
g
lo
= α +β +β ++β +β ++β +β ++β +β ++β +µ + ε
(4)
Many empirical studies have used fixed effect and random effect estimation techniques. The meth-odology is well established and published in a large number of research studies. Therefore, we refrain from further discussion on the methods of fixed effect and random effect. For details meth-odological analysis, please see: Allison (2009), Gujarati (2014), Laird and Ware (1982), Liang and Zeger (1986).

189
Banks and Bank Systems, Volume 12, Issue 3, 2017
5. ANALYSIS
AND DISCUSSION
Table 1. Summary statistics
Variable Obs Mean Std. Dev. Min Max
ROA 175 .014 .007 0 .04
ROE 140 .32 1.61 .03 19.19
Interest income 175 9.02 5.58 1.46 2.30
Commission 175 1.32 8.15 1.39 5.14
Operating exp 175 2.71 2.02 0.737 1.04
NPL 175 .039 .019 0 .14
Cost of fund 175 .090 .018 .05 .14
Cost to income ratio 112 .46 .135 .26 .82
Ld ratio 175 .84 .074 .66 1.09
To determine which of the models is appropriate for the study, we run the Hausman Test developed by Hausman (1978) (Table 2) that suggests that random effect regression is appropriate for both the models.
Table 2. Hausman test to find the appropriate model
Hausman test Prob>chi2
For model 1 (ROA) 0.1989
For model 2 (ROE) 0.0519
Note: Ho: difference in coefficients is not systematic.
The Hausman test has finally shown that for both dependent variable ROA and ROE the random ef-fect model is appropriate. We now further pro-ceeds to estimate the models. The result of the es-timation is presented in Tables 3 and 4.
Table 3. Model 3 (Determinants of return on asset, robust estimation)
Dependent variables Coef. Robust std. err. z P>|z|
log_npl -.2906928 .087322 -3.33 0.001***
log_ldratio .5460527 .3851468 1.42 0.156
log_interestincome -.1784071 .1286135 -1.39 0.165
log_costoffund .0526888 .048989 1.08 0.282
log_noninterestbearingasset .0675524 .0497277 1.36 0.174
log_costtoincomeratio -.6030709 .171317 -3.52 0.000***
log_commission .3144528 .136196 2.31 0.021**
log_operatingexp -.1909235 .0754647 -2.53 0.011**
Cons -5.520707 1.513708 -3.65 0.000
Note: *** indicates significance at 1 percent, ** at 5 percent and * at 10 percent level.
Table 4. Model 4 (determinants of return on equity, robust estimation)
Dependent variables Coef. Robust std. err. z P>|z|
log_npl -.3673757 .1501876 -2.45 0.014**
log_ldratio .3306842 .9399965 0.35 0.725
log_costoffund .1291257 .0820427 1.57 0.116
log_noninterestbearingasset -.0955065 .1450555 -0.66 0.510
log_costtoincomeratio .0044549 .2481902 0.02 0.986
log_commission .4267675 .2256536 1.89 0.059*
log_operatingexp -.2985147 .0948495 -3.15 0.002***
_cons -2.935774 2.100382 -1.40 0.162
Note: *** indicates significance at 1 percent, ** at 5 percent and * at 10 percent level.

190
Banks and Bank Systems, Volume 12, Issue 3, 2017
For model 3, most of the explanatory variables show anticipated sign. Among them, nonperform-ing loan and cost to income ratio are significant at 1% level. On the other hand, commission and op-erating expenses are significant at 5% level. The re-sults of the study indicate that a 1% increase in the non-performing loan of the selected banks reduc-es the growth in return on assets by 0.29%. Non-performing loans amount of the bank have to pro-vision or deducted from profit as Bangladesh Bank regulation based on classification status. Thus non-performing loan reduces profit by a signifi-cant amount. Similarly, a 1% growth in the cost to income ratio and 1% growth in the operating expenses reduce the growth in return on assets by 0.60% and 0.19%, respectively. On the other hand, growth in commission earning has positive and significant relationship with growth in return on assets. According to the result, a 1% growth in commission earning increases the growth in return on assets by 0.31%. although loan and de-posit ratio, cost of acquiring fund and non-interest bearing assets all have positive relationship with the growth of return of assets, their results are statically insignificant.
From the results, we can see that for model 4 NPL as has significant negative relationship (at 5% lev-el) with return on equity. The random effect es-timation (robust) results show that a 1% growth in the NPL reduces the growth in return on eq-uity by 0.37%. In addition, the results of commis-sion and operating expenses also show significant results at 5% and 1%, respectively, with expected signs. When the earnings from commission goes
up by 1% the return on equity increases by 0.43%. However, a 1% growth in the operating expenses reduces the growth in return on equity by 0.30%. Interestingly, although loan to deposit ratio, cost of fund, cost to income ratio shows expected signs that their results are not significant. Similar re-sults were also found by other literatures such as Demirguc-Kunt (1989) and Barr and Siems (1994).
6. OTHER DIAGNOSTIC TESTS
In this study, we have conducted the Hausman test in Table 2 to decide between using the ran-dom fixed effect and random effect model. The results of the test presented in Table 2 shows that both ROA and ROE random effect model are ap-propriate. The random effect model considers the constant for each section as random parameters. That means it assumes that each bank in this study differs in its error term as the sample contains lim-ited observations of cross-sectional unit here the random effect model is more appropriate. We have also conducted Wooldridge test for autocorrela-tion. The results in Table 5 suggest that no signifi-cant serial correlation exist in any of the models. Moreover, a modified Wald test for model 1 and 2 shows that both the model contains heteroscedas-ticity thus we use a robust standard error to coun-ter the problem of heteroscedasticity (see Table 6). We consider our data as micro panel as N is greater than > T. That means here we have 10 years data for 15 banks thus we assume no cross-section de-pendence. That means the residuals across the en-tities are not correlated.
Table 5. Wooldridge test for autocorrelation
Wooldridge test for autocorrelation Prob> F
For model 1 (ROA) 0.0530
For model 2 (ROE) 0.2132
Note: Ho: no first-order autocorrelation.
Table 6. Modified Wald test for group wise heteroscedasticity
Modified Wald test for group wise heteroscedasticity Prob>chi2
For model 1 (ROA) 0.000
For model 2 (ROE) 0.000
Note: Ho: homoscedasticity or constant variance.

191
Banks and Bank Systems, Volume 12, Issue 3, 2017
CONCLUSION
From the empirical results, it is evident that NPLs and operating expenses play a pivotal role in deter-mining the profitability of the private commercial banks of Bangladesh. The analysis shows that high NPLs are the main threat to bank’s profitability. This outcome is predictable because previous studies also indicated that NPLs reduce the expected returns of the commercial banks. Bank’s high NPLs not only affect its profitability, but also affect the country economy. The study also finds that over the last 10 years in amount commercial banks NPLs are increasing, although average percentages of NPLs are decreasing. The analysis also shows that high operating expenses also reduces the profitability of the banks. It is evident from the previous literature that smaller banks often find it difficult to cut operating expenses significantly. Again, commercial banks should focus on evaluating the bank efficiency ratio in order to maintain the operating expenses at an acceptable margin. Table 3 validates the argument as the cost to income ratio shows a significant negative relationship with return on asset for the private commercial banks of Bangladesh.
Table 7. Correlation matrix model (ROA)log_roa log_npl log_ld~o log_in~e log_co~d log_no~t log_co~o log_co~n log_op~p
log_roa 1.0000
log_npl -0.352 1.0000
log_ldratio 0.4161 -0.174 1.0000
log_intere~e -0.058 0.223 0.0658 1.0000
log_costof~d 0.0983 0.031 -0.0257 0.0194 1.0000
log_nonint~t -0.069 0.2030 -0.1135 0.8059 0.0744 1.0000
log_costto~o -0.550 0.050 -0.3329 -0.1698 -0.0816 -0.1295 1.0000
log_commis~n 0.1007 0.149 0.2752 0.6380 0.1750 0.4767 -0.2747 1.0000
log_operat~p -0.070 0.129 0.1074 0.5320 0.1579 0.4451 -0.1088 0.9185 1.0000
Table 8. Correlation matrix model (ROE)log_roe log_npl log_ld~o log_in~e log_co~d log_no~t log_co~o log_co~n log_op~p
log_roe 1.0000
log_npl -0.261 1.0000
log_ldratio 0.1941 -0.179 1.0000
log_intere~e -0.259 0.2342 0.0576 1.0000
log_costof~d 0.0717 0.0238 -0.0250 0.0138 1.0000
log_nonint~t -0.168 0.1954 -0.0513 0.6465 0.0648 1.0000
log_costto~o -0.108 0.0637 -0.3508 -0.1544 -0.0851 -0.1550 1.0000
log_commis~n -0.044 0.1584 0.2845 0.6374 0.1700 0.4211 -0.275 1.0000
log_operat~p -0.138 0.1391 0.1024 0.5362 0.1542 0.3669 -0.1021 0.9152 1.0000
REFERENCES
1. Allison, P. D. (2009). Fixed effects regression models, 160. SAGE publications. Retrieved from https://us.sagepub.com/en-us/nam/fixed-effects-regression-models/book226025
2. Almazari, A. A. (2014). Impact of internal factors on bank profit-ability: Comparative study between Saudi Arabia and Jordan. Journal of Applied Finance and Banking, 4(1), 125. Retrieved from http://www.sci-
enpress.com/Upload/JAFB/Vol%204_1_7.pdf
3. Ani, W. U., Ugwunta, D. O., Ezeudu, I. J., & Ugwuanyi, G. O. (2012). An empirical assessment of the determinants of bank profitability in
192
Banks and Bank Systems, Volume 12, Issue 3, 2017
Nigeria: Bank characteristics panel evidence. Journal of Accounting and Taxation, 4(3), 38. Retrieved from http://academicjournals.org/article/article1379422336_Ani%20et%20al.pdf
4. Athanasoglou, P. Delis. M., & Staikouras, C. (2006). Determinants of bank profitability in the Southern Eastern European region (MPRA Paper No. 10274). Retrieved from https://mpra.ub.uni-muenchen.de/10274/
5. Bangladesh Bank (2015). Banking Performance Indicators Appendix IV. Retrieved from https://www.bb.org.bd/pub/annual/anreport/ar1415/index1415.php
6. Barr, R. S., & Siems, T. F. (1994). Predicting bank failure using DEA to quantify management quality (No. 94-1). Federal Reserve Bank of Dallas.
7. Barseghyan, L. (2004). Non-performing Loans, Prospective Bailouts, and Japan’s Slowdown. Cornell University, New York, NY, USA.
8. Bhattacharya, U., & Ravikumar, B. (2001). Capital markets and the evolution of family businesses. The Journal of Business, 74(2), 187-219.
9. Carter, D. A., & McNulty, J. E. (2005). Deregulation, technological change, and the business-lending performance of large and small banks. Journal of Banking & Finance, 29(5), 1113-1130.
10. Carter, D. A., McNulty, J. E., & Verbrugge, J. A. (2004). Do small banks have an advantage in lending? An examination of risk-adjusted yields on business loans at large and small banks. Journal of Financial Services Research, 25(2-3), 233-252.
11. Chantapong, S. (2005). Comparative study of domestic and foreign bank performance in Thailand: The regression analysis. Economic Change and Restructuring, 38(1), 63-83.
12. De Lis, S. F., Pagés, J. M., & Saurina, J. (2001). Credit growth, problem loans and credit risk provisioning in Spain. BIS Papers, 1, 331-353.
13. Demirgüç-Kunt, A. (1989). Deposit-institution failures: A review of empirical literature. Economic Review, 25(4), 2-19.
14. Dietrich, A., & Wanzenried, G. (2011). Determinants of bank profitability before and during the crisis: Evidence from Switzerland. Journal of International Financial Markets, Institutions and Money, 21(3), 307-327. Retrieved from http://econpapers.repec.org/article/eeeintfin/v _3a21_3ay_3a2011_3ai_3a3_3ap_3a307-327.htm
15. Duraj, B., & Moci, E. (2015). Fac-tors influencing the bank profitabil-ity - Empirical evidence from Alba-nia. Asian Economic and Financial Review, 5(3), 483. Retrieved from http://www.aessweb.com/pdf-files/aefr-2015-5(3)-483-494.pdf
16. Goddard, J., Molyneux, P.,
& Wilson, J. O. (2004). The
profitability of European banks: A cross‐sectional and dynamic panel analysis. The Manchester School,
72(3), 363-381.
17. Gujarati, D. (2014). Econometrics by example. Palgrave Macmillan. Retrieved from https://he.palgrave.com/page/detail/Econometrics-by-Example/?K=9781137375018
18. Hausman, J. A. (1978). Specification tests in econometrics. Econometrica: Journal of the Econometric Society, 46(6), 1251-1271.
19. Hsiao, C. (2003). Analysis of panel data. Econometric Society Monographs, 11. Cambridge University Press, New York.
20. International Monetary Fund (2009). Global Financial Stability Report, April, Washington, DC: IMF.
21. Kaya, A. (2002). Aesthetics of diaspora: contemporary minstrels in Turkish Berlin. Journal of Ethnic and Migration Studies, 28(1), 43-62.
22. Laird, N. M., & Ware, J. H. (1982). Random-effects models for longitudinal data. Biometrics, 963-974.
23. Liang, K. Y., & Zeger, S. L. (1986). Longitudinal data analysis using generalized linear models. Biometrika, 73(1), 13-22.
24. McNaughton, D., & Barltrop, C. (1992). Banking Institutions in Developing Markets: Building strong management and responding to change, 1. World Bank Publications.
25. Oral, M., & Yolalan, R. (1990). An empirical study on measuring operating efficiency and profitability of bank branches. European Journal of Operational Research, 46(3), 282-294.
26. Pasiouras, F., & Kosmidou, K. (2007). Factors influencing the profitability of domestic and foreign commercial banks in the European Union. Research in International Business and Finance, 21(2), 222-237.
27. Rajan, R., & Dhal, S. C. (2003). Non-performing loans and terms of credit of public sector banks in India: An empirical assessment. Occasional Papers, 24(3), 81-121.
28. Scardovi, C. (2015). Holistic Active
Management of Non-Performing
Loans. Springer Switzerland.
29. Smith, R., Staikouras, C., & Wood,
G. (2003). Non-interest income and
total income stability. Cass Business
School Research Paper (Bank of
England Working Paper No. 198).
Retrieved from https://papers.ssrn.
com/sol3/papers.cfm?abstract_
id=530687
30. Staikouras, C. K., & Wood, G.
E. (2011). The determinants of
European bank profitability.
International Business & Economics
Research Journal (IBER), 3(6).
31. Sufian, F. (2011). Profitability of
the Korean banking sector: Panel
evidence on bank-specific and
macroeconomic determinants.
Journal of Economics and
Management, 7(1), 43-72.
32. Sufian, F., & Habibullah, M.
S. (2009). Bank specific and
macroeconomic determinants
of bank profitability: Empirical
evidence from the China banking
sector. Frontiers of Economics in
China, 4(2), 274-291.
33. Swamy, V. (2012). Determinants of
bank asset quality and profitability-
An empirical assessment (MPRA
Paper No. 47513). Retrieved from
https://mpra.ub.uni-muenchen.
de/47513/
34. Vittas, D. (1991). Measuring
commercial bank efficiency: Use and
misuse of bank operating ratios, 806.
World Bank Publications.
Copyright © 2022 FDOKUMEN