Detection of Triclosan on Aqueous Environmental Matrices
19
nanomaterials Article Polyelectrolyte Based Sensors as Key to Achieve Quantitative Electronic Tongues: Detection of Triclosan on Aqueous Environmental Matrices Cátia Magro 1, * , Paulo Zagalo 2 , João Pereira-da-Silva 2 , Eduardo Pires Mateus 1 , Alexandra Branco Ribeiro 1 , Paulo Ribeiro 2 and Maria Raposo 2, * 1 CENSE, Departamento de Ciências e Engenharia do Ambiente, Faculdade de Ciências e Tecnologia, Universidade Nova de Lisboa, 2829-516 Caparica, Portugal; [email protected] (E.P.M.); [email protected] (A.B.R.) 2 CEFITEC, Departamento de Física, Faculdade de Ciências e Tecnologia, Universidade Nova de Lisboa, 2829-516 Caparica, Portugal; [email protected] (P.Z.); [email protected] (J.P.-d.-S.); [email protected] (P.R.) * Correspondence: [email protected] (C.M.); [email protected] (M.R.) Received: 28 February 2020; Accepted: 26 March 2020; Published: 29 March 2020 Abstract: Triclosan (TCS) is a bacteriostatic used in household items that promotes antimicrobial resistance and endocrine disruption effects both to humans and biota, raising health concerns. In this sense, new devices for its continuous monitoring in complex matrices are needed. In this work, sensors, based on polyelectrolyte layer-by-layer (LbL) films prepared onto gold interdigitated electrodes (IDE), were studied. An electronic tongue array, composed of (polyethyleneimine (PEI)/polysodium 4-styrenesulfonate (PSS)) 5 and (poly(allylamine hydrochloride/graphene oxide) 5 LbL films together with gold IDE without coating were used to detect TCS concentrations (10 -15 –10 -5 M). Electrical impedance spectroscopy was used as means of transduction and the obtained data was analyzed by principal component analysis (PCA). The electronic tongue was tested in deionized water, mineral water and wastewater matrices showing its ability to (1) distinguish between TCS doped and non-doped solutions and (2) sort out the TCS range of concentrations. Regarding film stability, strong polyelectrolytes, as (PEI/PSS) n , presented more firmness and no significant desorption when immersed in wastewater. Finally, the PCA data of gold IDE and (PEI/PSS) 5 sensors, for the mineral water and wastewater matrices, respectively, showed the ability to distinguish both matrices. A sensitivity value of 0.19 ± 0.02 per decade to TCS concentration and a resolution of 0.13 pM were found through the PCA second principal component. Keywords: environmental monitoring; triclosan; layer-by-layer technique; interdigitated sensors; electronic tongue; impedance spectroscopy 1. Introduction Triclosan (5-chloro-2-(2,4-dichlorophenoxy) phenol) (TCS) is widely used as an antimicrobial, antibacterial and preservative agent in different personal care and consumer products [1]. TCS’s main physical and chemical characteristics are presented in Table S1. Structurally, the TCS molecule has functional groups for both phenol (5-chloro-2-(2,4-dichlorophenoxy) phenol) and ether (2,4,4-trichloro-2-hydroxydiphenyl ether) and its lipophilicity (log K ow = 4.8) resulting in a potential for bioaccumulation. Several studies had proved its allergy risk, antimicrobial resistance [2], developmental toxicity, and endocrine disruption, both in humans and biota [3–9]. Due to its characteristics and inefficient removal in the wastewater treatment plants, TCS and its bioactive metabolites and/or by-products, have been detected in wastewaters and superficial waters, at 10 -8 –10 -12 M concentrations range (2 ng L -1 –40 μgL -1 ; Table S2 Supplementary Material) [10–12]. Consequently, TCS is continually Nanomaterials 2020, 10, 640; doi:10.3390/nano10040640 www.mdpi.com/journal/nanomaterials
-
Upload
khangminh22 -
Category
Documents
-
view
2 -
download
0
Transcript of Detection of Triclosan on Aqueous Environmental Matrices

nanomaterials
Article
Polyelectrolyte Based Sensors as Key to AchieveQuantitative Electronic Tongues: Detection ofTriclosan on Aqueous Environmental Matrices
Cátia Magro 1,* , Paulo Zagalo 2, João Pereira-da-Silva 2, Eduardo Pires Mateus 1,Alexandra Branco Ribeiro 1 , Paulo Ribeiro 2 and Maria Raposo 2,*
1 CENSE, Departamento de Ciências e Engenharia do Ambiente, Faculdade de Ciências e Tecnologia,Universidade Nova de Lisboa, 2829-516 Caparica, Portugal; [email protected] (E.P.M.); [email protected] (A.B.R.)
2 CEFITEC, Departamento de Física, Faculdade de Ciências e Tecnologia, Universidade Nova de Lisboa,2829-516 Caparica, Portugal; [email protected] (P.Z.); [email protected] (J.P.-d.-S.);[email protected] (P.R.)
* Correspondence: [email protected] (C.M.); [email protected] (M.R.)
Received: 28 February 2020; Accepted: 26 March 2020; Published: 29 March 2020�����������������
Abstract: Triclosan (TCS) is a bacteriostatic used in household items that promotes antimicrobialresistance and endocrine disruption effects both to humans and biota, raising health concerns. In thissense, new devices for its continuous monitoring in complex matrices are needed. In this work, sensors,based on polyelectrolyte layer-by-layer (LbL) films prepared onto gold interdigitated electrodes(IDE), were studied. An electronic tongue array, composed of (polyethyleneimine (PEI)/polysodium4-styrenesulfonate (PSS))5 and (poly(allylamine hydrochloride/graphene oxide)5 LbL films togetherwith gold IDE without coating were used to detect TCS concentrations (10−15–10−5 M). Electricalimpedance spectroscopy was used as means of transduction and the obtained data was analyzed byprincipal component analysis (PCA). The electronic tongue was tested in deionized water, mineralwater and wastewater matrices showing its ability to (1) distinguish between TCS doped andnon-doped solutions and (2) sort out the TCS range of concentrations. Regarding film stability, strongpolyelectrolytes, as (PEI/PSS)n, presented more firmness and no significant desorption when immersedin wastewater. Finally, the PCA data of gold IDE and (PEI/PSS)5 sensors, for the mineral water andwastewater matrices, respectively, showed the ability to distinguish both matrices. A sensitivity valueof 0.19 ± 0.02 per decade to TCS concentration and a resolution of 0.13 pM were found through thePCA second principal component.
Keywords: environmental monitoring; triclosan; layer-by-layer technique; interdigitated sensors;electronic tongue; impedance spectroscopy
1. Introduction
Triclosan (5-chloro-2-(2,4-dichlorophenoxy) phenol) (TCS) is widely used as an antimicrobial,antibacterial and preservative agent in different personal care and consumer products [1]. TCS’smain physical and chemical characteristics are presented in Table S1. Structurally, the TCSmolecule has functional groups for both phenol (5-chloro-2-(2,4-dichlorophenoxy) phenol) and ether(2,4,4-trichloro-2-hydroxydiphenyl ether) and its lipophilicity (log Kow = 4.8) resulting in a potential forbioaccumulation. Several studies had proved its allergy risk, antimicrobial resistance [2], developmentaltoxicity, and endocrine disruption, both in humans and biota [3–9]. Due to its characteristics andinefficient removal in the wastewater treatment plants, TCS and its bioactive metabolites and/orby-products, have been detected in wastewaters and superficial waters, at 10−8–10−12 M concentrationsrange (2 ng L−1–40 µg L−1; Table S2 Supplementary Material) [10–12]. Consequently, TCS is continually
Nanomaterials 2020, 10, 640; doi:10.3390/nano10040640 www.mdpi.com/journal/nanomaterials

Nanomaterials 2020, 10, 640 2 of 19
being introduced in the aquatic environment via a number of routes, primarily by both untreated andtreated wastewater [13].
Currently, the monitoring of TCS is a matter of concern and an important issue. Traditionalanalytical methods use gas or liquid chromatography and mass spectrometry [14–19]. However, thesemethods in spite of their high reliability are rather complex, time consuming and expensive [20].Subsequently, there is a need for rapid, low-cost, and sensitive tools for real time monitoring of TCSin environmental matrices [21–24]. Electronic tongue (e-tongue) systems present a great potentialto compete, complement, or replace traditional analytical techniques. Due to their specificities:fast response times, and user-friendly operation [25,26], these devices have been used for differentapplications in the food industry: discrimination of the honey botanic origin [27] or in the pharmaceuticalindustry [28] with active pharmaceutical ingredients detection [29,30]. An e-tongue is “a multi-sensorysystem, formed by an array of low-selective sensors, combined with advanced mathematical proceduresfor signal processing, based on pattern recognition and/or multi-variate data analysis” [31]. TCS isone of the most studied pollutants in sensors development, as examples: a strand of carbon fiberswith a voltammetric detector for high-performance liquid chromatography to detect TCS in rabbitserum and urine [32]; an electropolymerizing o-phenylenediamine on a glassy carbon electrode, usingan amperometric sensor achieved a linear range of 2.0 × 10⁻⁷–3.0 × 10⁻⁶ mol/L and a detection limitof 8.0 × 10⁻⁸ mol/L [22]; a multiwall carbon nanotube film was developed for TCS detection using aelectrochemical sensor with a linear range from 50 to 1.75 mg L−1, and a limit of detection of 16.5 µg L−1
(57 nM) [33]. Recent studies [34–38] have reported well succeeded applications with sensors composedof layer-by-layer (LbL) thin-films, which were produced with polyelectrolytes and used to detectorganic compounds (in ultrapure water matrices and methanol) using impedance measurements.
Accordingly, the LbL nanoassembly technique will produce nanostructures, in a flexible,easily-scalable, reproducible, and versatile approach that allows the precise control of the coatingthickness, composition, and structure [39]. This nanoassembly technique is a powerful tool for theincorporation of a wide variety of coating types, such as polyelectrolytes, biological molecules,liposomes, ceramics, and electrically charged small molecules [40]. An impedance system, in a simplerconceptual implementation, is the full scan of different alternated current frequencies or a selectednumber of discrete frequency values, which can be used (conductivity or capacitance) [41]. Theimpedance technique approach is based on the electrode perturbation caused by an external signal ofsmall magnitude [27]. Measurements can be performed in the equilibrium or stationary state. There isan increased interest in the impedantiometric systems to the electrical characterization of environmentalmatrices, since they present simple and flexible measurements, are portable and user friendly, anda non-destructive technique [42]. Thus, the characterization of aqueous environmental matrices isperformed by analyzing the electrical impedance components (reactance, resistance, capacitance, andloss tangent) as a function of frequency signals applied to nanostructures adsorbed onto solid substrateswith interdigitated electrodes [37]. It has been reported that the TCS adsorbed amount per unit of areaon thin-films is reduced if the outer layers have negative charged polyelectrolyte [43]. The stability ofthe sensorial layers produced by the LbL technique is dependent of the solution’s pH and the degreeof ionization of the uppermost polyelectrolyte layer [44]. Consequently, the TCS pKa (see Table S1)will play an essential role in its adsorption or non-absorption onto the used thin-films.
The aim of the present study was to explore the potential of the e-tongue concept usingimpedantiometric detection of TCS in environmental complex aqueous matrices. A deionized water,a Portuguese mineral water, and an effluent from a wastewater treatment plant (considered the primarysource of TCS into water bodies) were used as experimental matrices. TCS was spiked to the aqueousmatrices and measured using thin-films sensors based on polyethyleneimine (PEI), poly(sodium4-styrenesulfonate) (PSS), poly(allylamine hydrochloride) (PAH), and graphene oxide (GO; Figure 1),which have been prepared with the LbL technique onto solid supports with deposited gold electrodes.To the best of our knowledge, regarding wastewater real samples and these two combinations ofthin-films sensors, this is the first study that explores:
Nanomaterials 2020, 10, 640 3 of 19
(1) an e-tongue based in a set of five sensor devices providing the possibility to distinguishdifferent TCS concentrations;
(2) the use of electrical impedance spectroscopy measurements for TCS detection in environmentalaqueous complex matrices;
(3) the stability of the thin-films layers, analysis of adsorption and desorption phenomena,submitted to different aqueous matrices and pH values.
Nanomaterials 2020, 10, x FOR PEER REVIEW 3 of 19
Nanomaterials 2020, 10, x; doi: FOR PEER REVIEW www.mdpi.com/journal/nanomaterials
deposited gold electrodes. To the best of our knowledge, regarding wastewater real samples and these two combinations of thin-films sensors, this is the first study that explores:
(1) an e-tongue based in a set of five sensor devices providing the possibility to distinguish different TCS concentrations;
(2) the use of electrical impedance spectroscopy measurements for TCS detection in environmental aqueous complex matrices;
(3) the stability of the thin-films layers, analysis of adsorption and desorption phenomena, submitted to different aqueous matrices and pH values.
Figure 1. Chemical structure of triclosan and the polyelectrolytes: polyethyleneimine (PEI), poly (sodium 4-styrenesulfonate) (PSS), poly(allylamine hydrochloride) (PAH), and graphene oxide (GO).
2. Materials and Methods
The experimental matrices were deionized water (DW), a Portuguese mineral water (MW), and a wastewater (EF). DW was produced using a Millipore system (Bedford, MA, USA), MW was a commercial Portuguese mineral water and EF was the liquid fraction collected in the secondary clarifier at a wastewater treatment plant (Lisbon, Portugal). Table 1 presents the characterization of the experimental matrices for conductivity, pH, and total ion concentration parameters. These features were measured because (1) the pH of aqueous solutions can lead to desorption phenomena of thin-film layers, as well as, may change the TCS degree of ionization (dissociation constant pKa = 7.9 [45]): from Table 1 one can observe that the studied matrices present pH values in the range of 6.1–8.4; and (2) ion species and respective concentration can interact with the outermost layer of the sensor’s thin-films or with the gold in the gold IDE. All these measured parameters play a crucial role in the stability of the thin-film sensors and matrix–sensor interactions with the TCS molecule (pKa 7.9). The pH was measured with a Radiometer pH-electrode EDGE (HANNA, USA). The conductivity values were measured in a Radiometer Analytic LAQUA twin (HORIBA Ltd., Japan). Ca, Cu, K, Mg, Na, P, S, and Zn were determined by inductively coupled plasma with optical emission spectrometry (ICP-OES; HORIBA Jobin-Yvon Ultima, Japan). Cl– and SO42– were analyzed by ion chromatography (IC; DIONEX ICS-3000, USA), equipped with a conductivity detector.
Table 1. Characterization of the environmental matrices under study.
DW MW EF * pH 7.2 ± 0.1 5.7 ± 0.3 8.4 ± 0.1
Conductivity (µS/cm) 46.5 ± 0.7 113 ± 37 1400 ± 500 ICP analysis (mg/L)
Ca - 0.75 ± 0.1 39.1 ± 2.8 Cu - - 0.02 ± 0.01 K - - 22.9 ± 0.4
Mg - 7.3 ± 0.6 18.2 ± 5.1 Na - 1.7 ± 0.1 161 ± 58 P - - 2.2 ± 0.2 S - - 32.9 ± 8.6
O
Cl
ClCl
OH
SO3Na
nN
NH
NN
HN
NH2 NH
H2N
N
NH2
H2N
n
n
H2NHCl
COOH
OCOOH
HOOC
HOOCCOOH
O
OH OH
OH O
OH
Figure 1. Chemical structure of triclosan and the polyelectrolytes: polyethyleneimine (PEI), poly(sodium 4-styrenesulfonate) (PSS), poly(allylamine hydrochloride) (PAH), and graphene oxide (GO).
2. Materials and Methods
The experimental matrices were deionized water (DW), a Portuguese mineral water (MW), anda wastewater (EF). DW was produced using a Millipore system (Bedford, MA, USA), MW was acommercial Portuguese mineral water and EF was the liquid fraction collected in the secondaryclarifier at a wastewater treatment plant (Lisbon, Portugal). Table 1 presents the characterization of theexperimental matrices for conductivity, pH, and total ion concentration parameters. These featureswere measured because (1) the pH of aqueous solutions can lead to desorption phenomena of thin-filmlayers, as well as, may change the TCS degree of ionization (dissociation constant pKa = 7.9 [45]):from Table 1 one can observe that the studied matrices present pH values in the range of 6.1–8.4;and (2) ion species and respective concentration can interact with the outermost layer of the sensor’sthin-films or with the gold in the gold IDE. All these measured parameters play a crucial role in thestability of the thin-film sensors and matrix–sensor interactions with the TCS molecule (pKa 7.9). ThepH was measured with a Radiometer pH-electrode EDGE (HANNA, USA). The conductivity valueswere measured in a Radiometer Analytic LAQUA twin (HORIBA Ltd., Japan). Ca, Cu, K, Mg, Na,P, S, and Zn were determined by inductively coupled plasma with optical emission spectrometry(ICP-OES; HORIBA Jobin-Yvon Ultima, Japan). Cl− and SO4
2− were analyzed by ion chromatography(IC; DIONEX ICS-3000, USA), equipped with a conductivity detector.
Triclosan (TCS ≥ 97%) and methanol (MeOH; gradient grade) used were from Sigma–Aldrich(Steinheim, Germany). The experimental TCS dilutions range, 10−5–10−15 M, was made sequentiallyfrom a mother solution with a concentration of 10−4 M and analyzed immediately after preparation.All dilutions were prepared using experimental matrices/MeOH (9:1) solutions. A solution of eachexperimental matrix/MeOH, without TCS, was used as the blank standard (0 M).

Nanomaterials 2020, 10, 640 4 of 19
Table 1. Characterization of the environmental matrices under study.
DW MW EF *
pH 7.2 ± 0.1 5.7 ± 0.3 8.4 ± 0.1Conductivity (µS/cm) 46.5 ± 0.7 113 ± 37 1400 ± 500
ICP analysis (mg/L)
Ca - 0.75 ± 0.1 39.1 ± 2.8Cu - - 0.02 ± 0.01K - - 22.9 ± 0.4
Mg - 7.3 ± 0.6 18.2 ± 5.1Na - 1.7 ± 0.1 161 ± 58P - - 2.2 ± 0.2S - - 32.9 ± 8.6
Zn - - 0.07 ± 0.02
IC analysis (mg/L)
Cl− - 9.3 ± 0.4 488.7 ± 593.2SO4
2− - 1.3 ± 0.3 84.1 ± 92.4
DW—deionized water; MW—mineral water; EF—wastewater; * collected between September and December 2018.
The sensor devices used in this work were purchased from DropSens (Llanera Asturias, Spain)and were constituted by glass BK7 solid support with deposited gold interdigitate electrodes (IDE)comprising of 250 “fingers” each (Figure S3.1 in Supplementary Data). The supports’ dimensionswere 22.8 mm × 7.6 mm × 0.7 mm and each “finger” had 5 µm of width, which is the same spacingbetween the “fingers”. An array of sensor devices without and with different polyelectrolyte thin-filmsdeposited onto IDE surface was used to detect the TCS in aqueous solutions. The deposited thin-filmswere prepared with polyethyleneimine (PEI), poly(sodium 4-styrenesulfonate) (PSS), poly(allylaminehydrochloride) (PAH), and graphene oxide (GO) polyelectrolytes, all from Sigma–Aldrich (St Louis,MO, USA), by the LbL technique [46]. Accordingly, thin-films of PAH/GO and of PEI/PSS deposited onBK7 solid support with gold IDE were obtained by adsorbing alternate layers of electrically chargedpolyelectrolytes at the solid/liquid interface, washing away with water the already adsorbed layers afterbeing immersed in the polyelectrolyte solution in order to remove any polyelectrolyte molecules thatwere not completely adsorbed. The polyelectrolytes were made with a monomeric concentration of10−2 M diluted in water Type I, produced with a Millipore system (Bedford, MA, USA). The adsorptiontime period of each layer (i.e., immersion time in each polyelectrolyte solution) was 30 s and, afterthe adsorption of each layer, the thin-film was dried using nitrogen gas. Films of PAH/GO wereprepared with 5 bilayers, (PAH/GO)5, while films of PEI/PSS were prepared with 5, 10, and 20 bilayers,designated by (PEI/PSS)5, (PEI/PSS)10, and (PEI/PSS)20, respectively. Table 2 lists the thin-films used tocharacterize the aqueous solutions matrices under study (see Figure S3.2 on Supplementary Data: theexperimental scheme that complements Table 2).
Table 2. Characteristics of the thin-films deposited on BK7 solid support with gold interdigitateelectrodes to characterize the aqueous solutions matrices.
Aqueous Matrices Thin-Film Combinations Number of Bilayers
DW PAH/GO and PEI/PSS 5
MW PAH/GO and PEI/PSS 5
EF PAH/GO 5
PEI/PSS 5, 10, and 20
The electrical analysis of aqueous matrices was performed by measuring the impedance spectraof these sensor devices when immersed in the aqueous matrices with different TCS concentrations

Nanomaterials 2020, 10, 640 5 of 19
with a Solartron 1260 Impedance Analyzer in the frequency range of 1–1000,000 Hz, applying an ACvoltage of 25 mV. To avoid contamination of the sensor devices, the impedance spectra of thin-filmssensors and gold IDE were recorded for the TCS experimental matrices in a sequence of increasingconcentrations from 0 to 10−5 M. All measurements were performed at room temperature 25 ◦C.
The stability of thin-films on the different experimental matrices was also studied by measuringthe ultraviolet-visible (UV-vis) spectra of the LbL thin-films before and after being immersed in theexperimental matrices/MeOH solutions spiked with 10−9 M of TCS—an average concentration found inwastewater matrices and sufficient to see changes in the UV-vis spectra. The absorbance spectra wereattained using a double beam spectrophotometer UV-2101PC (Shimadzu) with a sampling intervalbetween 800 and 200 nm, with a resolution of 0.5 nm. For each thin-film combination, three absorbancespectra were obtained: (1) before being immersed in the TCS solution (t = 0 min) to establish a baseline,(2) after five minutes of immersion (t = 5 min), and (3) after a cumulative immersion time of ten minutes(t = 10 min). Characterization of LbL thin-films stability adjusting the EF’s pH with (1:1) HNO3, for pHvalues of 3, 6, and 8, were also performed.
Principal component analysis (PCA) was carried out, regarding the normalized (Z normalization)impedance spectroscopy data, to reduce the size of data and to obtain a new space of orthogonalcomponents, in which different concentration patterns can be observed and explained. Additionally, anarray of sensors, composed by all the thin-films and gold IDE sensors, was analyzed as an e-tongue forTCS detection in EF experimental matrix. The ANOVA was performed at 95% of confidence (p < 0.05),concerning the Table 1 data, to prove that they are statistically different.
3. Results and Discussion
3.1. Impedance Spectroscopy Measurements: Sensor Response
To evaluate the prepared sensors’ ability to detect TCS, impedance spectra were measured.As demonstrated by Taylor and Macdonald [47], the electrical properties of each thin-film, deposited onthe IDE, when immersed in the aqueous sample, are dependent on the characteristics of the thin-filmused as a sensitive layer, of the double layer formed on the surface of all the thin-films and of the bulkelectrolyte. These components can be considered an electrical circuit. Thus, representing the equivalentcircuit of the electrical characteristics of the thin-film, double-layer, and electrolyte, Figure 2 shows theimaginary impedance spectra, also designated as electrical reactance, measured by the different sensordevices when immersed in the different aqueous matrices doped with TCS concentrations from 0 to10−5 M. The data points are related to the average of three impedimetric measurements (reproducibilityin Supplementary Material Figure S4 for the lowest TCS concentration).

Nanomaterials 2020, 10, 640 6 of 19
Nanomaterials 2020, 10, x FOR PEER REVIEW 6 of 19
Nanomaterials 2020, 10, x; doi: FOR PEER REVIEW www.mdpi.com/journal/nanomaterials
I (a) I (b) I (c)
DW
Reac
tanc
e (Ω
)
II (a) II (b) II (c)
MW
Reac
tanc
e (Ω
)
Figure 2. Cont.

Nanomaterials 2020, 10, 640 7 of 19
Nanomaterials 2020, 10, x FOR PEER REVIEW 7 of 19
Nanomaterials 2020, 10, x; doi: FOR PEER REVIEW www.mdpi.com/journal/nanomaterials
III (a) III (b) III (c)
EF
Reac
tanc
e (Ω
)
Figure 2. Reactance (imaginary) impedance spectra of the sensor device (a) of the gold IDE sensor, (b) of the (PAH/GO)5 sensor, and (c) of the (PEI/PSS)5 sensor, immersed in TCS DW (I), MW (II), and EF (III) at different TCS concentrations.
Figure 2. Reactance (imaginary) impedance spectra of the sensor device (a) of the gold IDE sensor, (b) of the (PAH/GO)5 sensor, and (c) of the (PEI/PSS)5 sensor,immersed in TCS DW (I), MW (II), and EF (III) at different TCS concentrations.

Nanomaterials 2020, 10, 640 8 of 19
Different footprints were observed according to the experimental aqueous matrices and sensordevices. Similar behavior was observed for DW for all sensors. The gold IDE sensor presents asimilar footprint for the MW and EF matrices. The (PAH/GO)5 sensor shows a similar behavior, butdifferent from the gold IDE, for the same matrices. The (PEI/PSS)5 sensor shows different behaviorfor MW and EF matrices, however similar to the gold IDE and (PAH/GO)5 sensor, for MW and EFmatrices, respectively. Sensor physical properties (PP), such as reactance, loss tangent, and resistanceat constant frequency, may present increasing or decreasing monotone functions as a function of TCSconcentration. In order to allow operational TCS measurements (sensor sensitivity), a trend function ofits concentration must be found, for example at a given frequency, expressed as normalized reactance,loss tangent, or resistance spectra. A normalized response can be achieve using the following relation:
PP(C) − PP(0M)
PP(0M), (1)
where PP(C) is the physical property measured at a given concentration, and PP(0 M) is the physicalproperty measured at a reference solution for the different type of matrices (TCS 0 M in DW, MW, orEF). Plots I, II, and III of Figure 3 present examples of the normalized PP spectra to fixed frequencies,for the different films and type of environmental aqueous matrices. These fixed frequency values werechosen considering which frequency represented better the curve that relates the TCS effects on whichtype of sensors.
Nanomaterials 2020, 10, x FOR PEER REVIEW 8 of 19
Nanomaterials 2020, 10, x; doi: FOR PEER REVIEW www.mdpi.com/journal/nanomaterials
Different footprints were observed according to the experimental aqueous matrices and sensor devices. Similar behavior was observed for DW for all sensors. The gold IDE sensor presents a similar footprint for the MW and EF matrices. The (PAH/GO)5 sensor shows a similar behavior, but different from the gold IDE, for the same matrices. The (PEI/PSS)5 sensor shows different behavior for MW and EF matrices, however similar to the gold IDE and (PAH/GO)5 sensor, for MW and EF matrices, respectively. Sensor physical properties (PP), such as reactance, loss tangent, and resistance at constant frequency, may present increasing or decreasing monotone functions as a function of TCS concentration. In order to allow operational TCS measurements (sensor sensitivity), a trend function of its concentration must be found, for example at a given frequency, expressed as normalized reactance, loss tangent, or resistance spectra. A normalized response can be achieve using the following relation:
!!(#)%!!(&')!!(&') , (1)
where PP(C) is the physical property measured at a given concentration, and PP(0 M) is the physical property measured at a reference solution for the different type of matrices (TCS 0 M in DW, MW, or EF). Plots I, II, and III of Figure 3 present examples of the normalized PP spectra to fixed frequencies, for the different films and type of environmental aqueous matrices. These fixed frequency values were chosen considering which frequency represented better the curve that relates the TCS effects on which type of sensors.
Figure 3. Normalized transducing variables as a function of TCS concentrations at fixed frequencies: I) DW—reactance spectra at 6.3, 25,119, and 25,119 Hz; II) MW—loss tangent spectra at 63,095, 16,000, and 100,000 Hz; and III) EF—resistance spectra at 100,000, 16,000, and 3981 Hz; to gold IDE, (PAH/GO)5 and (PEI/PSS)5 sensors, respectively (n = 3, average and standard deviations of the respective impedance data used for the normalization, in supplementary material Figures S5.1, 5.2, and 5.3).
The accomplished detailed analysis of obtained spectra in TCS solutions prepared with all the experimental matrices, Figure 2, shows that the imaginary impedance or reactance could be used as a transducing variable. Regarding the DW matrix (Figure 2Ia,b,c), the gold IDE sensor did not show a clear trend, compared to the thin-films sensors that present a more pronounced sensitivity to discriminate different concentrations in the frequency ranges of 1–10 kHz, and of 100–1000 kHz. Thus, in order to better analyze the response of these sensors, the reactance values measured in the gold IDE, and (PAH/GO)5 and (PEI/PSS)5 sensors, at frequencies of 6.3 and 25,119 Hz, respectively, were normalized and plotted as a function of TCS concentrations in Figure 3I. This figure revealed that the reactance at these frequencies tended to or either showed no tendency or increase depending on the type of sensor for the TCS concentration ranges under study. The gold IDE sensor appeared to be insensitive (no visible trend) to the TCS presence in the studied concentrations, while the (PEI/PSS)5 sensor displays only significant sensitivity in the 10-5–10-7 M concentration range. Regarding the (PAH/GO)5 sensor (Figure 3I), it presents almost constant values of reactance at 25,119
Figure 3. Transducing variables normalization as function of TCS concentrations at fixed frequencies: I) DW -
Reactance spectra at 6.3, 25119, 25119 Hz; II) MW - Loss tangent spectra at 63095, 16000, 100000 Hz and III) EF -
Resistance spectra at 100000, 16000, 3981 Hz; to Gold IDE, (PAH/GO)5 and (PEI/PSS)5 sensors, respectively (n=3,
average and standard deviations of the respective impedance data used for the normalization, in supplementary
material C 1-3)
-0,5-0,4-0,3-0,2-0,1
00,10,20,30,4
10-15
M10
-14M10
-13M10
-12M10
-11M10
-10M10
-9M10
-8M10
-7M10
-6M10
-5M
Reac
tanc
e (Ω
)
TCS Concentrations (M)
-0,12-0,1
-0,08-0,06-0,04-0,02
00,020,04
10-15
M10
-14M10
-13M10
-12M10
-11M10
-10M10
-9M10
-8M10
-7M10
-6M10
-5M
Loss
Tan
gent
(a.u
)
TCS Concentrations (M)
-0,1
-0,05
0
0,05
0,1
0,15
10-15
M10
-14M10
-13M10
-12M10
-11M10
-10M10
-9M10
-8M10
-7M10
-6M10
-5M
Resis
tanc
e (Ω
)
TCS Concentrations (M)
I III II
(PAH/GO)5 (PEI/PSS)5 Gold IDE
Figure 3. Normalized transducing variables as a function of TCS concentrations at fixed frequencies:I) DW—reactance spectra at 6.3, 25,119, and 25,119 Hz; II) MW—loss tangent spectra at 63,095, 16,000,and 100,000 Hz; and III) EF—resistance spectra at 100,000, 16,000, and 3981 Hz; to gold IDE, (PAH/GO)5
and (PEI/PSS)5 sensors, respectively (n = 3, average and standard deviations of the respective impedancedata used for the normalization, in Supplementary Material Figures S5.1–5.3).
The accomplished detailed analysis of obtained spectra in TCS solutions prepared with all theexperimental matrices, Figure 2, shows that the imaginary impedance or reactance could be usedas a transducing variable. Regarding the DW matrix (Figure 2Ia,b,c), the gold IDE sensor did notshow a clear trend, compared to the thin-films sensors that present a more pronounced sensitivity todiscriminate different concentrations in the frequency ranges of 1–10 kHz, and of 100–1000 kHz. Thus,in order to better analyze the response of these sensors, the reactance values measured in the goldIDE, and (PAH/GO)5 and (PEI/PSS)5 sensors, at frequencies of 6.3 and 25,119 Hz, respectively, werenormalized and plotted as a function of TCS concentrations in Figure 3I. This figure revealed that thereactance at these frequencies tended to or either showed no tendency or increase depending on thetype of sensor for the TCS concentration ranges under study. The gold IDE sensor appeared to beinsensitive (no visible trend) to the TCS presence in the studied concentrations, while the (PEI/PSS)5
sensor displays only significant sensitivity in the 10−5–10−7 M concentration range. Regarding the(PAH/GO)5 sensor (Figure 3I), it presents almost constant values of reactance at 25,119 Hz. Analyzing

Nanomaterials 2020, 10, 640 9 of 19
the data plotted individually and only concerning data discrimination (discussed in Section 3.2), themost “efficient” sensor, for DW, seemed to be the (PAH/GO)5.
Concerning the TCS detection in MW solutions, the reactance spectra, represented in Figure 2IIa,c,revealed analogous behavior for both gold IDE and (PEI/PSS)5 sensors. In the present case (Figure 3II),the loss tangent at fixed frequencies, was used as the transducing variable. The frequency valueschosen were 63, 100, and 16 kHz, respectively, for the gold IDE, (PEI/PSS)5, and (PAH/GO)5 sensors. Itshould be remarked that all sensors tended to follow a decrease in the loss tangent with decreasingTCS concentrations.
Overall, for the EF, the (PEI/PSS)5 sensor was shown to be the most sensitive in the studied TCSconcentration range. At frequencies between 1 and 10 kHz, the reactance spectra presented a goodresponse discrimination (Figure 2IIIc). The normalized responses at 3981 Hz as exhibited in Figure 3III,clearly shows an electrical resistance trend with increasing TCS concentrations. It is important toremark, concerning the sensitivity of the sensor, that TCS was being detected/measured in a range ofconcentrations in accordance with real samples. For instance, the results showed that for the EF matrix,as the TCS concentrations increased, the measured electrical resistance also increased in the range of10−8–10−12 M, in accordance with the reported for wastewater samples [10–12], supporting its potentialfield applicability. Should also be referred that the EF matrix has a high amount of anions, Table 1,which directly contributes to the increase of electrical charge that can flow between electrodes, EFconductivity takes a value of 1400 µS/cm [2]. Concerning the gold IDE sensors, the electrical responsewas operationally difficult to obtain, due to the high conductivity of the medium, and only lowermeasurable values of resistance were obtained, as can be observed in Figure 3III. The EF matrix iscomposed of a high concentration of ions, such as Zn and S (Table 1), that interact with the goldelectrodes, thus promoting an overload of electrical resistance and contributing to sensor damageduring the electrical measurements (optical microscopy images, in Supplementary Material Figure S6).
3.2. Principal Component Analysis: Sensor Capabilities
In this section three questions will be addressed: 1) Are the tested sensors able to detectconcentrations of TCS equal and higher than zero? 2) Are the tested sensors able of distinguish differentTCS concentrations? 3) Do the tested sensors produce PCA plots with observable patterns and trendsaccording to TCS concentrations? To look for sensor “discrimination” from different concentrations ofTCS, on different matrices, the principal component analysis (PCA), a multivariate analysis technique,was performed after data normalization (Z type). The PCA was used to explore the sensors sensoryattributes to produce different patterns for the range of TCS concentrations. The PCA was applied forthe most sensitive sensor, regarding impedance normalized data (average of three loops impedancemeasurements). The PCA with the best score plots obtained for the sensors when immersed in DW,EF, and MW matrices, respectively, are presented in Figure 4I,II,III. The characterization associatedto the best sensor is the one where the variations in the plot among TCS concentrations are moresignificant [48]. The first component F1, explained the greatest data variation and was considered themost important, explaining more than 79.69% of the variance. With the exception of the measurementson DW (Figure 4I), PCA plots produced clearly distinguished the sample matrices without TCS fromthe samples with TCS (Figure 4II,III).
Nanomaterials 2020, 10, 640 10 of 19Nanomaterials 2020, 10, x FOR PEER REVIEW 10 of 19
Nanomaterials 2020, 10, x; doi: FOR PEER REVIEW www.mdpi.com/journal/nanomaterials
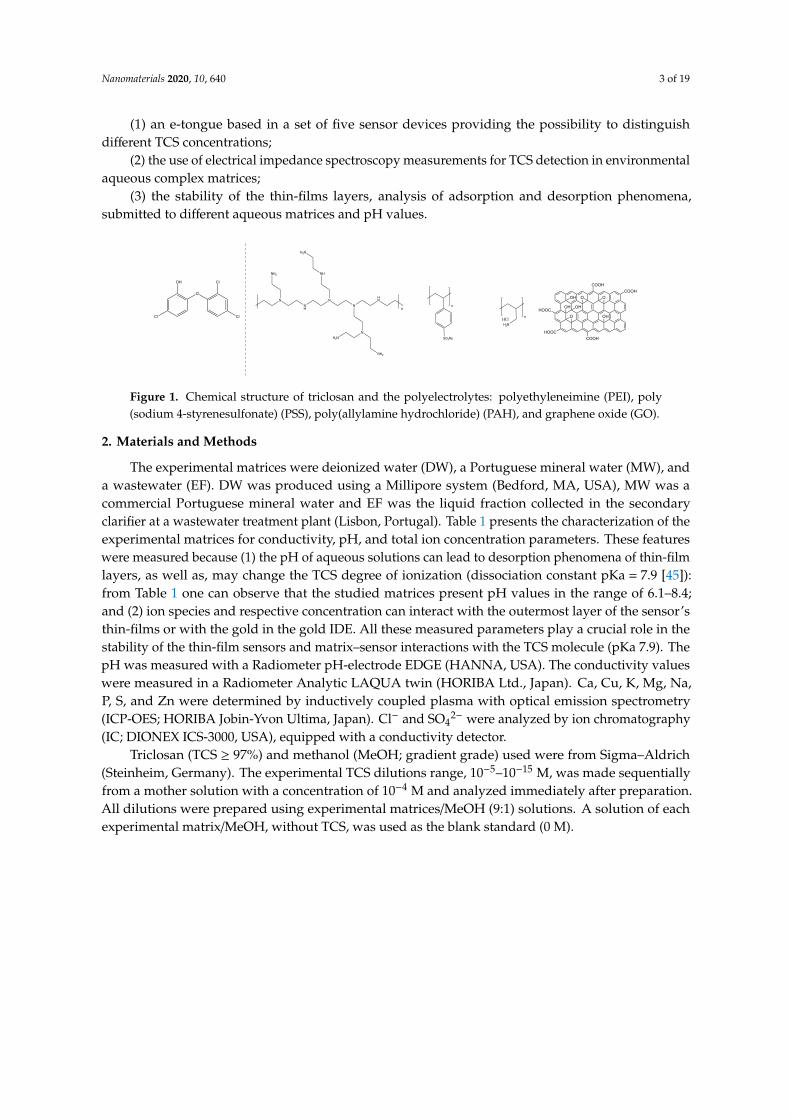
Figure 4. PCA plots of TCS concentrations (10-5–10-15 M) distinguished by I) the (PAH/GO)5 sensor for DW, II) the gold IDE sensor for MW, and III) the (PEI/PSS)5 sensor for EF.
Regarding the DW experimental matrices (Figure 4I), although the PCA plot distinguished the different concentrations, a trend of TCS concentration per principal components according to concentrations was not achieved. In the case of the (PAH/GO)5 sensor, the non-doped solution was in the same quadrant of the higher TCS concentration. A concentration pattern and trend, related to TCS concentrations, was visible for the data plot obtained by the gold IDE sensor (Figure 4II), where eigenvectors points tended to increase over the range of concentrations. The first two principal components, F1 and F2, explained 98.63% of the total variance. Even more, this distinction was better when compared to the one obtained by the thin-films sensors. For the EF matrix, the best discrimination among concentrations was achieved by the (PEI/PSS)5 sensor (Figure 4III). It can be
Figure 4. PCA plots of TCS concentrations (10−5–10−15 M) distinguished by (I) the (PAH/GO)5 sensorfor DW, (II) the gold IDE sensor for MW, and (III) the (PEI/PSS)5 sensor for EF.
Regarding the DW experimental matrices (Figure 4I), although the PCA plot distinguishedthe different concentrations, a trend of TCS concentration per principal components according toconcentrations was not achieved. In the case of the (PAH/GO)5 sensor, the non-doped solution wasin the same quadrant of the higher TCS concentration. A concentration pattern and trend, relatedto TCS concentrations, was visible for the data plot obtained by the gold IDE sensor (Figure 4II),where eigenvectors points tended to increase over the range of concentrations. The first two principalcomponents, F1 and F2, explained 98.63% of the total variance. Even more, this distinction was betterwhen compared to the one obtained by the thin-films sensors. For the EF matrix, the best discriminationamong concentrations was achieved by the (PEI/PSS)5 sensor (Figure 4III). It can be observed that TCSconcentrations produced a clear trend between 10−5 and 10−13 M. The first two principal components

Nanomaterials 2020, 10, 640 11 of 19
F1 and F2 accounted for 99.65% of the total variance. This sensor was capable of detection andsemi quantification, having a clear trend and pattern within the PCA plot. Considering MW andEF experimental matrices, there was an evident pattern, where the concentration of the non-dopedsolutions (TCS = 0) might be regarded as an outlier point, being the nearest concentration, in bothcases 10−15 M. Additionally, for EF the effect of the number of bilayers was tested for the most sensitivesensor obtained, (PEI/PSS)5. The PCA plots, showed that five bilayers revealed better response (PCAseparation to TCS concentrations) and signal intensity for impedance, when compared to the ones with10 or 20 bi-layers of (PEI/PSS)5 (PCA plots in Supplementary Material Figures S7 and S8). This couldbe due to the thickness increase with the number of bilayers, which led to the increase of the distancebetween the gold electrode and the outer layer of film that interacted with the TCS molecules. As thefilm thickness increased, the capacitance decreased, reducing the electrical signals intensity measuredin TCS solutions with different concentrations, i.e., for two distinct concentrations the difference of anymeasured electric property was smaller. The decrease in the double-layer capacitance was associatedwith a higher resistance imposed to electron spillover, where this phenomenon reduces the metalcapacitance according to the jellium model [49].
The combination of sensor arrays was expected to improve the capability of TCS concentrationdiscrimination. The array of sensors composed by the sensor devices without any film deposited(gold IDE) and with (PAH/GO)5, (PEI/PSS)5, (PEI/PSS)10, and (PEI/PSS)20 thin-films deposited, wasused to test the e-tongue concept and to analyze its ability to produce discrimination among TCSconcentrations in the EF matrix. The respective PCA plot, Figure 5, clearly distinguished the samplematrices without TCS from the samples with TCS. A concentration pattern and trend, related to TCSconcentrations, can be seen on the PCA plot along the main axis. The first two principal components F1and F2 accounted for 81.71% of the total variance. As it was observed in Figure 4II,III, the data followedthe same direction, from region A (TCS) = 0 to region B where (TCS) > 0, proving that the electronicbased in those sensor devices was able to distinguish between non-doped wastewater and doped TCSwastewater, producing an observable pattern and trend regarding the different concentration values.
Nanomaterials 2020, 10, x FOR PEER REVIEW 11 of 19
Nanomaterials 2020, 10, x; doi: FOR PEER REVIEW www.mdpi.com/journal/nanomaterials
observed that TCS concentrations produced a clear trend between 10−5 and 10−13 M. The first two principal components F1 and F2 accounted for 99.65% of the total variance. This sensor was capable of detection and semi quantification, having a clear trend and pattern within the PCA plot. Considering MW and EF experimental matrices, there was an evident pattern, where the concentration of the non-doped solutions (TCS = 0) might be regarded as an outlier point, being the nearest concentration, in both cases 10−15 M. Additionally, for EF the effect of the number of bilayers was tested for the most sensitive sensor obtained, (PEI/PSS)5. The PCA plots, showed that five bilayers revealed better response (PCA separation to TCS concentrations) and signal intensity for impedance, when compared to the ones with 10 or 20 bi-layers of (PEI/PSS)5 (PCA plots in supplementary material Figures S7 and S8). This could be due to the thickness increase with the number of bilayers, which led to the increase of the distance between the gold electrode and the outer layer of film that interacted with the TCS molecules. As the film thickness increased, the capacitance decreased, reducing the electrical signals intensity measured in TCS solutions with different concentrations, i.e., for two distinct concentrations the difference of any measured electric property was smaller. The decrease in the double-layer capacitance was associated with a higher resistance imposed to electron spillover, where this phenomenon reduces the metal capacitance according to the jellium model [49].
The combination of sensor arrays was expected to improve the capability of TCS concentration discrimination. The array of sensors composed by the sensor devices without any film deposited (gold IDE) and with (PAH/GO)5, (PEI/PSS)5, (PEI/PSS)10, and (PEI/PSS)20 thin-films deposited, was used to test the e-tongue concept and to analyze its ability to produce discrimination among TCS concentrations in the EF matrix. The respective PCA plot, Figure 5, clearly distinguished the sample matrices without TCS from the samples with TCS. A concentration pattern and trend, related to TCS concentrations, can be seen on the PCA plot along the main axis. The first two principal components F1 and F2 accounted for 81.71% of the total variance. As it was observed in Figure 4II,III, the data followed the same direction, from region A (TCS) = 0 to region B where (TCS) > 0, proving that the electronic based in those sensor devices was able to distinguish between non-doped wastewater and doped TCS wastewater, producing an observable pattern and trend regarding the different concentration values.
Figure 5. Principal components analysis (PCA) plot of TCS concentrations (10−5–10−15 M) distinguished with an electronic tongue sensor for EF.
3.3. Sensorial Layers’ Evaluation—Sensor Stability
Despite the positive response behavior of the thin-films sensors in the presence of the TCS molecules in different aqueous matrices, both individually and in an array tell us that we were on the right track for TCS detection, there is a need to evaluate the stability of the thin-films in order to confirm that the positive results are due to the presence of TCS in the aqueous matrix and not to the
Figure 5. Principal components analysis (PCA) plot of TCS concentrations (10−5–10−15 M) distinguishedwith an electronic tongue sensor for EF.
3.3. Sensorial Layers’ Evaluation—Sensor Stability
Despite the positive response behavior of the thin-films sensors in the presence of the TCSmolecules in different aqueous matrices, both individually and in an array tell us that we were onthe right track for TCS detection, there is a need to evaluate the stability of the thin-films in order toconfirm that the positive results are due to the presence of TCS in the aqueous matrix and not to theloss of polyelectrolyte molecules from the films by desorption. It is known that the LbL film stability isrelated with the electrostatic interactions, in the order of 100 kJ/mol, between the opposite ionized

Nanomaterials 2020, 10, 640 12 of 19
groups of cationic and polyelectrolyte molecules [50,51]. Therefore electrostatic interactions play avital role in the adsorption of these molecular bilayers but are also strongly pH dependent since thedegree of ionization of each polyelectrolyte is a function of pH [50,51]. Having in mind the goal ofdeveloping a sensor dedicated to detect a specific molecule in complex media that can present differentpH, the electrostatic interactions must be taken into account. Moreover, the salts and/or other elementspresent in the environmental matrices, change the degree of ionization of LbL films and of moleculesinvolved [52] and therefore affecting the electrical properties (e.g., impedance) of the sensor.
Additionally, the ionic elements present in the matrices, can be adsorbed onto the polyelectrolyte’slayers, changing the electrical properties of the sensor. Thus, in order to ascertain which sensor holdsthe best features for the detection of TCS with no loss/desorption of thin-film layers and no irreversibleadsorption of TCS onto thin-film, the adsorbed amount on the different thin-films was analyzed beforeand after the thin-films to be immersed on the different TCS aqueous matrices. The adsorbed amountper unit of area can be easily estimated by measuring the UV-visible spectra of the films since theyabsorb in this wavelength region and TCS presents two main absorbance bands at 230 and at 280 nm.In Figure 6 the UV-vis absorbance spectra of the LbL films are shown, before and after their immersion(t = 0, 5, and 10 min) into 10−9 M TCS aqueous solutions, prepared with DW, MW, and EF (see theMaterials and Methods section). These obtained spectra were plotted together by the type of film andaqueous matrix, thus allowing for an insight on the effects of adsorption and/or desorption occurringon each LbL thin-film. Accordantly, if the absorbance is seen to increase compared to the t = 0 islikely that TCS molecules are being adsorbed on the thin-film outermost surface. Contrarily, if theabsorbance is seen to decrease when compared to the spectrum measured before immersion of thefilm on the aqueous matrix, t = 0, it is likely that polyelectrolyte molecules are being desorbed fromthe thin-film. This desorption is related to losses in the electrostatic interactions with a consequenceof changes in the electrical impedance measured during the sensing procedure. By analyzing thespectra of the (PAH/GO)5 thin-film displayed in Figure 6Ia–c it is possible to observe that in bothDW (a) and MW (b) there was adsorption of TCS molecules on the films being more significant inthe case of DW. Additionally, in the DW, results show that a slight desorption took place when thefilm was immersed from five to ten minutes. This could be due to the more surface-located layers notbeing completely adsorbed during the film preparation, and when immersed for a second time suffer awashing process, resulting in a loss of previous adsorbed matter [53]. The adsorption phenomenon inthese cases holds an additional relevance aside from the detection factor, as it can be used for removingTCS from solutions.Nanomaterials 2020, 10, x FOR PEER REVIEW 13 of 19
Nanomaterials 2020, 10, x; doi: FOR PEER REVIEW www.mdpi.com/journal/nanomaterials
Figure 6. UV-Vis spectra of I) (PAH/GO)5 films and II) (PEI/PSS)5 before and after immersions times (t = 0, 5, and 10 min) in 10−9 M TCS solutions of: (a) DW; (b) MW, and (c) EF.
According to spectra of Figure 6Ia,b, the GO outer layer did not seem to be deeply influenced by pH, given that both waters have different pH values (5.7 for MW and 7.2 for DW, Table 1), and there was adsorption, nonetheless. Moreover, given the chemical structures of the TCS molecule and the polyelectrolyte (GO), the adsorption observed could be a result of either the formation of hydrogen bonds or from the interactions of π–π stacking [39]. In the case of EF, Figure 6Ic, desorption took place since the absorbance decreased as the immersion time in the EF matrix increased. This behavior could be attributed to the abundant presence of ions such as Mg2+, Na+, and SO42- (Table 1), which strongly interact with the GO outer layer of, facilitating the change of charge within the GO layer, from negatively charged to a predominantly neutral one. By turning neutral, the strong electrostatic interactions between the GO outer layer and the remaining layers were weakened, which in turn leads to polyelectrolyte molecules detachment as shown in Figure 6Ic [54]. The effect of pH on the degree of ionization of PAH and GO has been already discussed in the literature [50,55,56]. In fact, it was shown that although at higher pH GO is electrically charged, the PAH film molecules lost a large amount of charge, leading to both PAH and GO desorption. Due to this fact, this type of film (PAH/GO)5 should not be considered as a sensing film for future works containing EF.
From the characterization of UV-vis spectra of (PEI/PSS)5 thin-films, Figure 6II, there was a clear effect of film desorption in the cases of DW (a) and MW (b). While for the DW the observed desorption increased with the immersion time, for the MW, although desorption to be significant after five minutes, remained seemingly constant after the second immersion, suggesting that a desorption plateau was reached. As desorption was observed in both DW and MW, (PEI/PSS)5 thin-films should not be elected as sensing films for these aqueous matrices.
Regarding the thin-films in EF, the spectra of Figure 6IIc show that the absorbance between immersion times from t = 0 to t = 10 min slightly varied. This indicates that there was no significant adsorption either desorption, i.e., TCS adsorption or film losses. It is also possible to infer that pH plays a fundamental role in the adsorption and desorption phenomena regarding (PEI/PSS)5 LbL films. According to [57], the PEI degree of ionization is strongly pH dependent but the PSS is a strong polyelectrolyte, with a pKa near 1 [52,58], it can be influenced by solution pH due to the presence of a sulfonate group in its chemical structure and furthermore, reaching a more stable state at pH > 7 [59]. Therefore, not only due to this last referred reason but also due to the mineral waters (both have pH < 7), while for EF (pH above 8, see Table 1) the (PEI/PSS)5 LbL films were highly stable. To better understand the involved phenomena, a subsequent study about the stability of (PEI/PSS)5 thin-films was conducted by measuring the absorbance spectra of (PEI/PSS)5 thin-films
Figure 6. UV-Vis spectra of (I) (PAH/GO)5 films and (II) (PEI/PSS)5 before and after immersions times(t = 0, 5, and 10 min) in 10−9 M TCS solutions of: (a) DW; (b) MW, and (c) EF.

Nanomaterials 2020, 10, 640 13 of 19
According to spectra of Figure 6Ia,b, the GO outer layer did not seem to be deeply influenced bypH, given that both waters have different pH values (5.7 for MW and 7.2 for DW, Table 1), and therewas adsorption, nonetheless. Moreover, given the chemical structures of the TCS molecule and thepolyelectrolyte (GO), the adsorption observed could be a result of either the formation of hydrogenbonds or from the interactions of π–π stacking [39]. In the case of EF, Figure 6Ic, desorption tookplace since the absorbance decreased as the immersion time in the EF matrix increased. This behaviorcould be attributed to the abundant presence of ions such as Mg2+, Na+, and SO4
2− (Table 1), whichstrongly interact with the GO outer layer of, facilitating the change of charge within the GO layer,from negatively charged to a predominantly neutral one. By turning neutral, the strong electrostaticinteractions between the GO outer layer and the remaining layers were weakened, which in turn leadsto polyelectrolyte molecules detachment as shown in Figure 6Ic [54]. The effect of pH on the degree ofionization of PAH and GO has been already discussed in the literature [50,55,56]. In fact, it was shownthat although at higher pH GO is electrically charged, the PAH film molecules lost a large amount ofcharge, leading to both PAH and GO desorption. Due to this fact, this type of film (PAH/GO)5 shouldnot be considered as a sensing film for future works containing EF.
From the characterization of UV-vis spectra of (PEI/PSS)5 thin-films, Figure 6II, there was a cleareffect of film desorption in the cases of DW (a) and MW (b). While for the DW the observed desorptionincreased with the immersion time, for the MW, although desorption to be significant after five minutes,remained seemingly constant after the second immersion, suggesting that a desorption plateau wasreached. As desorption was observed in both DW and MW, (PEI/PSS)5 thin-films should not be electedas sensing films for these aqueous matrices.
Regarding the thin-films in EF, the spectra of Figure 6IIc show that the absorbance betweenimmersion times from t = 0 to t = 10 min slightly varied. This indicates that there was no significantadsorption either desorption, i.e., TCS adsorption or film losses. It is also possible to infer that pHplays a fundamental role in the adsorption and desorption phenomena regarding (PEI/PSS)5 LbLfilms. According to [57], the PEI degree of ionization is strongly pH dependent but the PSS is astrong polyelectrolyte, with a pKa near 1 [52,58], it can be influenced by solution pH due to thepresence of a sulfonate group in its chemical structure and furthermore, reaching a more stable stateat pH > 7 [59]. Therefore, not only due to this last referred reason but also due to the mineral waters(both have pH < 7), while for EF (pH above 8, see Table 1) the (PEI/PSS)5 LbL films were highly stable.To better understand the involved phenomena, a subsequent study about the stability of (PEI/PSS)5
thin-films was conducted by measuring the absorbance spectra of (PEI/PSS)5 thin-films before andafter to be immersed during different periods in EF matrices with different pH, namely, 3, 6, and 8, seeFigure 7a–c, respectively.
Nanomaterials 2020, 10, x FOR PEER REVIEW 14 of 19
Nanomaterials 2020, 10, x; doi: FOR PEER REVIEW www.mdpi.com/journal/nanomaterials
before and after to be immersed during different periods in EF matrices with different pH, namely, 3, 6, and 8, see Figures 7a,b,c, respectively.
Figure 7. UV-Vis spectra of (PEI/PSS)5 films before and after immersions times (t = 0, 5, and 10 min) in 10−9 M TCS solutions in EF with a pH of (a) pH = 3, (b) pH = 6, and (c) pH = 8.
Clear desorption occurred after immersion in Figure 7a,b while in Figure 7c a seemingly constant pattern happened among the three spectra. Furthermore, as pH decreased in the TCS solutions from pH 3 to pH 6, the phenomenon of desorption increased, suggesting that pH had a direct effect on the interaction between the thin-film and TCS. The behaviors displayed in Figure 7 further show that the absorbance of TCS onto the outer layer of PSS was deeply influenced by pH, confirming what was observed in Figure 6IIc. At pH 8, the film exhibited a stable behavior, due to PSS being fully charged and PEI maintaining about 40% of its electrical charge, which is sufficient to maintain the polyelectrolyte layers adsorbed in the LbL film and, therefore, no desorption occurred. As the outermost layer of the (PEI/PSS)5 thin-film was negative and, at high pH, the TCS was negatively charged, the TCS molecules were repelled by the films and were not adsorbed on its surface. Thus, neither desorption nor adsorption phenomena were observed.
3.4. Electronic Tongue—Sensor Sensitivity and Resolution
The results of the previous sections indicate that the (PAH/GO)5 LbL sensor should be applied to acid aqueous matrices with lower ionic strengths, while the (PEI/PSS)5 LbL sensor should be used with alkaline aqueous matrices with higher ionic strengths. Additionally, the gold IDE sensor should be applied to medium ionic strength in neutral solutions. Thus, to the environmental aqueous matrices under study, an array of sensors, composed by the gold IDE and (PEI/PSS)5 sensors was set in order to understand if the e-tongue concept were capable of “tasting”, through the impedance data, MW and EF, doped with TCS (Figure 8).
Figure 7. UV-Vis spectra of (PEI/PSS)5 films before and after immersions times (t = 0, 5, and 10 min) in10−9 M TCS solutions in EF with a pH of (a) pH = 3, (b) pH = 6, and (c) pH = 8.

Nanomaterials 2020, 10, 640 14 of 19
Clear desorption occurred after immersion in Figure 7a,b while in Figure 7c a seemingly constantpattern happened among the three spectra. Furthermore, as pH decreased in the TCS solutions frompH 3 to pH 6, the phenomenon of desorption increased, suggesting that pH had a direct effect onthe interaction between the thin-film and TCS. The behaviors displayed in Figure 7 further showthat the absorbance of TCS onto the outer layer of PSS was deeply influenced by pH, confirmingwhat was observed in Figure 6IIc. At pH 8, the film exhibited a stable behavior, due to PSS beingfully charged and PEI maintaining about 40% of its electrical charge, which is sufficient to maintainthe polyelectrolyte layers adsorbed in the LbL film and, therefore, no desorption occurred. As theoutermost layer of the (PEI/PSS)5 thin-film was negative and, at high pH, the TCS was negativelycharged, the TCS molecules were repelled by the films and were not adsorbed on its surface. Thus,neither desorption nor adsorption phenomena were observed.
3.4. Electronic Tongue—Sensor Sensitivity and Resolution
The results of the previous sections indicate that the (PAH/GO)5 LbL sensor should be applied toacid aqueous matrices with lower ionic strengths, while the (PEI/PSS)5 LbL sensor should be used withalkaline aqueous matrices with higher ionic strengths. Additionally, the gold IDE sensor should beapplied to medium ionic strength in neutral solutions. Thus, to the environmental aqueous matricesunder study, an array of sensors, composed by the gold IDE and (PEI/PSS)5 sensors was set in order tounderstand if the e-tongue concept were capable of “tasting”, through the impedance data, MW andEF, doped with TCS (Figure 8).
The PCA plot corresponding to the use of the adequate sensor devices to the matrix is presented inFigure 8a. This plot clearly distinguished the MW from EF matrix. Inside each matrix PCA region it wasalso possible to discriminate the TCS concentrations across the principal component F2. In Figure 8bthe values of F2 were plotted as a function of TCS concentrations for both types of matrices, and alinear relation and working range of the e-tongue was attained. The principal component F2 lineartendency suggests that F2 data could be used to determine the sensitivity, the slope of a linear function,of the sensor. Analyzing F2 curves, in detail, one could infer a linear range between 10−13 and 10−7 Mof the TCS concentrations. Considering the data within this concentration range, the F2 feature plotvs. the logarithm of the concentration, allows fitting the plotted data points to a straight line witha slope, ∆F2
∆ logC = 0.19 ± 0.02, which corresponds to the sensor sensitivity. Additionally, the sensorresolution (smallest concentration that can be detected) could be found near the smallest concentration(Cs). The Cs value was 0.1 pM while the minimum value that could be measured was 0.02, therefore,logC = 0.02
0.19 meaning, ∆logC = logC− logCs and, thus, C − Cs ≈ 0.13 pM, which corresponded to thesensor resolution of 0.13 pM (> 0.3 pg/L). The smallest concentration that could be measured was10−13 M and the range of detection of 10−13 to 10−7 M.

Nanomaterials 2020, 10, 640 15 of 19Nanomaterials 2020, 10, x FOR PEER REVIEW 15 of 19
Nanomaterials 2020, 10, x; doi: FOR PEER REVIEW www.mdpi.com/journal/nanomaterials
Figure 8. (a) PCA plot of TCS concentrations (10-5–10-15 M) distinguished the gold IDE sensor for MW and the (PEI/PSS)5 sensor for EF and (b) ((a) PCA data) principal components F2 factor scores as a function of TCS concentrations for the gold IDE sensor in MW and the (PEI/PSS)5 sensor in EF.
The PCA plot corresponding to the use of the adequate sensor devices to the matrix is presented in Figure 8a. This plot clearly distinguished the MW from EF matrix. Inside each matrix PCA region it was also possible to discriminate the TCS concentrations across the principal component F2. In Figure 8b the values of F2 were plotted as a function of TCS concentrations for both types of matrices, and a linear relation and working range of the e-tongue was attained. The principal component F2 linear tendency suggests that F2 data could be used to determine the sensitivity, the slope of a linear function, of the sensor. Analyzing F2 curves, in detail, one could infer a linear range between 10−13 and 10−7 M of the TCS concentrations. Considering the data within this concentration range, the F2 feature plot vs. the logarithm of the concentration, allows fitting the plotted data points to a straight line with a slope, ∆)*
∆,-.# = 0.19 ± 0.02, which corresponds to the sensor sensitivity. Additionally, the
sensor resolution (smallest concentration that can be detected) could be found near the smallest concentration (Cs). The Cs value was 0.1 pM while the minimum value that could be measured was 0.02, therefore, )*+, = &.&*
&.01 meaning, ∆)*+, = )*+, − )*+,/ and, thus, C−Cs≈ 0.13 pM, which
10-14 10-12 10-10 10-8 10-6
4
3
2
1
0
-1
-2
-3
Figure 8. (a) PCA plot of TCS concentrations (10−5–10−15 M) distinguished the gold IDE sensor forMW and the (PEI/PSS)5 sensor for EF and (b) ((a) PCA data) principal components F2 factor scores as afunction of TCS concentrations for the gold IDE sensor in MW and the (PEI/PSS)5 sensor in EF.
4. Conclusions
An electronic tongue, consisting of an array of sensors based on uncoated IDE and coated withdifferent LbL films was shown to be able to detect and quantify triclosan trace concentrations, withinthe range of 10−15–10−5 M, in a MW and in EF matrices, by measuring the impedance spectra of eachsensor device. The thin-film stability tests related with adsorption/desorption phenomena revealedthat some of the films were not appropriate as TCS monitoring tools as they were highly influenced byboth matrices’ ion composition and pH. The experimental data suggests the potential of (PEI/PSS)5 LbLfilms combination to be employed in alkaline aqueous matrices, such as wastewater, with high ionicstrength. This is contrary to the gold IDE (uncoated) sensors that reacted with ions in the solutions,were damaged by S and Zn elements, and might be considered only to analyze neutral solutions withlow ionic strengths. In fact, the choice of more stable sensing layers is the key to develop quantitativee-tongues and, in the case of LbL films, that stability is only achieved when strong polyelectrolytes areemployed in its preparation.
Nanomaterials 2020, 10, 640 16 of 19
In this sense, the experimental data, analyzed through a PCA, supported and demonstratedthe sensor’s ability and potential to distinguish between aqueous matrices and to discriminate TCSconcentrations using the principal component F2. For an experimental/environmental range of triclosanconcentrations of 10−13–10−7 M (0.3–30,000 ng/L), the e-tongue presents a sensitivity value of 0.19 ± 0.02and a resolution of 0.13 pM. Lastly, observing the main conclusions on the thin-film stability and PCAdiscrimination through MW and EF, the e-tongue array studied could be used as an “analytical” sensorfor the detection and quantification of TCS in the monitoring of environmental aqueous matrices.
Supplementary Materials: The following are available online at http://www.mdpi.com/2079-4991/10/4/640/s1,Table S1: Triclosan physical and chemical characteristics; Table S2: Concentration guidance: molar, µg/, ng/L, andpg/L; Figure S3.1: Sensor device used: glass BK7 solid support with deposited gold interdigitated electrodes fromDropSens (Llanera Asturias, Spain); Figure S3.2: Scheme of the sensor’s preparation for the electronic tonguearray; Figure S4: Reactance (imaginary) impedance spectra of sensor device of the gold IDE sensor, (PAH/GO)5sensor, and (PEI/PSS)5 sensor, immersed in deionized water, mineral water and wastewater with 10−15 M of TCS(related to the measurements in Figure 2); Table S5.1: Impedance data measurements, reactance (imaginary), usedfor the normalization of Plots I in Figure 3; Table S.5.2: Impedance data measurements, loss tangent, used forthe normalization of Plots II in Figure 3; Table S.5.3: Impedance data measurements, resistance, used for thenormalization of Plots III in Figure 3; Figure S6: Optical microscopy images of gold interdigitated electrodeswithout coating, gold IDE; Magnitude: (a) 4×, (b)10×, and (c) 40×, analyzed in wastewater; Figure S7: PCA plot ofTCS concentrations (10−5–10−15 M) distinguished with (PEI/PSS)10 sensor for wastewater; Figure S8: PCA plot ofTCS concentrations (10−5–10−15 M) distinguished with (PEI/PSS)20 sensor for wastewater
Author Contributions: Conceptualization, C.M.; P.Z. and J.P.-d.-S.; Data curation, C.M.; Formal analysis, E.P.M.,P.R., A.B.R., and M.R.; Funding acquisition, M.R. and A.B.R.; Methodology, C.M.; Project administration, M.R. andA.B.R.; Resources, E.P.M., M.R., P.R. and A.B.R.; Supervision, E.P.M., A.B.R. and M.R.; Validation, E.P.M., A.B.R.and M.R.; Writing—original draft, C.M.; Writing—review and editing, C.M., P.Z., E.P.M., A.B.R., P.R. and M.R.All authors have read and agreed to the published version of the manuscript.
Funding: This work was supported by the Project “Development of Nanostructures for Detection of TriclosanTraces on Aquatic Environments” (PTDC/FIS-NAN/0909/2014). The Center for Environmental and SustainabilityResearch CENSE and Centre of Physics and Technological Research CEFITEC, which is financed by national fundsfrom FCT/MEC (UID/AMB/04085/2019 and UID/FIS/00068/2019).
Acknowledgments: This research was anchored by the RESOLUTION LAB, an infrastructure at NOVA Schoolof Science and Technology. J. Pereira-da-Silva and P. Zagalo acknowledge their fellowships PD/BD/142768/2018,PD/BD/142767/2018 from RABBIT Doctoral Program, respectively. C. Magro acknowledges to Fundação para aCiência e a Tecnologia for her PhD fellowship (SFRH/BD/114674/2016).
Conflicts of Interest: The authors declare no conflict of interest.
References
1. Sanchez-prado, L.; Garcia-jares, C.; Llompart, M. Microwave-assisted extraction: Application to thedetermination of emerging pollutants in solid samples. J. Chromatogr. A 2010, 1217, 2390–2414. [CrossRef][PubMed]
2. Evdokimova, O.; Svensson, F.; Agafonov, A.; Håkansson, S.; Seisenbaeva, G.; Kessler, V. Hybrid DrugDelivery Patches Based on Spherical Cellulose Nanocrystals and Colloid Titania—Synthesis and AntibacterialProperties. Nanomaterials 2018, 8, 228. [CrossRef] [PubMed]
3. Fang, J.; Stingley, R.L.; Beland, F.A.; Harrouk, W.; Lumpkins, D.L.; Howard, P. Occurrence, Efficacy,Metabolism, and Toxicity of Triclosan. J. Environ. Sci. Health Part C 2010, 28, 147–171. [CrossRef] [PubMed]
4. Sabaliunas, D.; Webb, S.F.; Hauk, A.; Jacob, M.; Eckhoff, W.S. Environmental fate of Triclosan in the RiverAire Basin, UK. Water Res. 2003, 37, 3145–3154. [CrossRef]
5. Skarha, J.; Mínguez-Alarcón, L.; Williams, P.L.; Korevaar, T.I.M.; De Poortere, R.A.; Broeren, M.A.C.; Ford, J.B.;Eliot, M.; Hauser, R.; Braun, J.M. Cross-sectional associations between urinary triclosan and serum thyroidfunction biomarker concentrations in women. Environ. Int. 2019, 122, 256–262. [CrossRef]
6. Ma, X.; Wan, Y.; Wu, M.; Xu, Y.; Xu, Q.; He, Z.; Xia, W. Occurrence of benzophenones, parabens and triclosanin the Yangtze River of China, and the implications for human exposure. Chemosphere 2018, 213, 517–525.[CrossRef]
7. Juric, A.; Singh, K.; Hu, X.F.; Chan, H.M. Exposure to triclosan among the Canadian population: Results ofthe Canadian Health Measures Survey (2009–2013). Environ. Int. 2019, 123, 29–38. [CrossRef]

Nanomaterials 2020, 10, 640 17 of 19
8. Lehutso, R.F.; Daso, A.P.; Okonkwo, J.O. Occurrence and environmental levels of triclosan and triclocarbanin selected wastewater treatment plants in Gauteng Province, South Africa. Emerg. Contam. 2017, 3, 107–114.[CrossRef]
9. Freitas, R.; Coppola, F.; Costa, S.; Pretti, C.; Intorre, L.; Meucci, V.; Soares, A.M.V.M.; Solé, M. The influence oftemperature on the effects induced by Triclosan and Diclofenac in mussels. Sci. Total Environ. 2019, 663,992–999. [CrossRef]
10. Hua, W.; Bennett, E.; Letcher, R. Triclosan in waste and surface waters from the upper Detroit River byliquid chromatography-electrospray-tandem quadrupole mass spectrometry. Environ. Int. 2005, 31, 621–630.[CrossRef]
11. Lindström, A.; Buerge, I.J.; Poiger, T.; Bergqvist, P.A.; Müller, M.D.; Buser, H.R. Occurrence and environmentalbehavior of the bactericide triclosan and its methyl derivative in surface waters and in wastewater. Environ.Sci. Technol. 2002, 36, 2322–2329. [CrossRef] [PubMed]
12. Stackelberg, P.E.; Furlong, E.T.; Meyer, M.T.; Zaugg, S.D.; Henderson, A.K.; Reissman, D.B. Persistence ofpharmaceutical compounds and other organic wastewater contaminants in a conventional drinking-water-treatment plant. Sci. Total Environ. 2004, 329, 99–113. [CrossRef] [PubMed]
13. Daughton, C.G.; Ternes, T.A. Pharmaceuticals and personal care products in the environment: Agents ofsubtle change? Environ. Health Perspect. 1999, 107, 907–938. [CrossRef] [PubMed]
14. Tohidi, F.; Cai, Z. GC/MS analysis of triclosan and its degradation by-products in wastewater and sludgesamples from different treatments. Environ. Sci. Pollut. Res. 2015, 22, 11387–11400. [CrossRef] [PubMed]
15. Queiroz, S.C.N.; Lazou, K.; Sandra, P.; Jardim, I.C.S.F. Determination of pesticides in water by liquidchromatography-(electrospray ionization)-mass spectrometry (LC-ESI-MS). Pestic. Rev. Ecotoxicol. MeioAmbient. 2004, 14, 53–60. [CrossRef]
16. Sun, J.; Yi, C.L.; Zhao, R.S.; Wang, X.; Jiang, W.Q.; Wang, X.K. Determination of trace triclosan in environmentalwater by microporous bamboo-activated charcoal solid-phase extraction combined with HPLC-ESI-MS.J. Sep. Sci. 2012, 35, 2781–2786. [CrossRef] [PubMed]
17. Regueiro, J.; Becerril, E.; Garcia-Jares, C.; Llompart, M. Trace analysis of parabens, triclosan and relatedchlorophenols in water by headspace solid-phase microextraction with In Situ derivatization and gaschromatography–tandem mass spectrometry. J. Chromatogr. A 2009, 1216, 4693–4702. [CrossRef]
18. Guo, J.H.; Li, X.H.; Cao, X.L.; Li, Y.; Wang, X.Z.; Xu, X.B. Determination of triclosan, triclocarban andmethyl-triclosan in aqueous samples by dispersive liquid–liquid microextraction combined with rapid liquidchromatography. J. Chromatogr. A 2009, 1216, 3038–3043. [CrossRef]
19. Sanchez-Prado, L.; Llompart, M.; Lores, M.; García-Jares, C.; Bayona, J.M.; Cela, R. Monitoring thephotochemical degradation of triclosan in wastewater by UV light and sunlight using solid-phasemicroextraction. Chemosphere 2006, 65, 1338–1347. [CrossRef]
20. Bourgeois, W.; Stuetz, R.M. Use of a chemical sensor array for detecting pollutants in domestic wastewater.Water Res. 2002, 36, 4505–4512. [CrossRef]
21. Wu, T.; Li, T.; Liu, Z.; Guo, Y.; Dong, C. Talanta Electrochemical sensor for sensitive detection of triclosanbased on graphene / palladium nanoparticles hybrids. Talanta 2017, 164, 556–562. [CrossRef] [PubMed]
22. Liu, Y.; Song, Q.J.; Wang, L. Development and characterization of an amperometric sensor for triclosandetection based on electropolymerized molecularly imprinted polymer. Microchem. J. 2009, 91, 222–226.[CrossRef]
23. Zheng, J.; Zhang, M.; Ling, Y.; Xu, J.; Hu, S.; Hayat, T.; Alharbi, N.S.; Yang, F. Fabrication of one dimensionalCNTs/Fe3O4@PPy/Pd magnetic composites for the accumulation and electrochemical detection of triclosan.J. Electroanal. Chem. 2018, 818, 97–105. [CrossRef]
24. Petrie, B.; Barden, R.; Kasprzyk-Hordern, B. A review on emerging contaminants in wastewaters and theenvironment: Current knowledge, understudied areas and recommendations for future monitoring. WaterRes. 2015, 72, 3–27. [CrossRef] [PubMed]
25. Magro, C.; Mateus, E.; Raposo, M.; Ribeiro, A.B. Overview of electronic tongue sensing in environmentalaqueous matrices: Potential for monitoring emerging organic contaminants. Environ. Rev. 2019, 1–13.[CrossRef]
26. Podrazka, M.; Báczynska, E.; Kundys, M.; Jelen, P.S.; Nery, E.W. Electronic tongue—A tool for all tastes?Biosensors 2017, 8, 3. [CrossRef]

Nanomaterials 2020, 10, 640 18 of 19
27. Elamine, Y.; Inácio, P.M.C.; Lyoussi, B.; Anjos, O.; Estevinho, L.M.; da Graça Miguel, M.; Gomes, H.L. Insightinto the sensing mechanism of an impedance based electronic tongue for honey botanic origin discrimination.Sens. Actuators B. Chem. 2019, 285, 24–33. [CrossRef]
28. Wasilewski, T.; Migon, D.; Gebicki, J.; Kamysz, W. Critical review of electronic nose and tongue instrumentsprospects in pharmaceutical analysis. Analytica Chimica Acta 2019, 1077, 14–29. [CrossRef]
29. Wesoły, M.; Cal, K.; Ciosek, P.; Wróblewski, W. Influence of dissolution-modifying excipients in variouspharmaceutical formulations on electronic tongue results. Talanta 2017, 162, 203–209. [CrossRef]
30. Janczyk, M.; Kutyła, A.; Sollohub, K.; Wosicka, H.; Cal, K.; Ciosek, P. Electronic tongue for the detection oftaste-masking microencapsulation of active pharmaceutical substances. Bioelectrochemistry 2010, 80, 94–98.[CrossRef]
31. Vlasov, Y.; Legin, A.; Rudnitskaya, A.; Di Natale, C.; D’Amico, A. Nonspecific sensor arrays (“electronictongue”) for chemical analysis of liquids (IUPAC Technical Report). Pure Appl. Chem. 2005, 77, 1965–1983.[CrossRef]
32. Wang, L.H.; Chu, S.C. Voltammetric Detector for Liquid Chromatography: Determination of Triclosan inRabbit Urine and Serum. Chromatographia 2004, 60, 385–390. [CrossRef]
33. Yang, J.; Wang, P.; Zhang, X.; Wu, K. Electrochemical sensor for rapid detection of triclosan using a multiwallcarbon nanotube film. J. Agric. Food Chem. 2009, 57, 9403–9407. [CrossRef] [PubMed]
34. Carvalho, E.R.; Filho, N.C.; Venancio, E.C.; Osvaldo, N.O.; Mattoso, L.H.C.; Martin-Neto, L. Detection ofbrominated by-products using a sensor array based on nanostructured thin films of conducting polymers.Sensors 2007, 7, 3258–3271. [CrossRef]
35. Wang, H.; Ohnuki, H.; Endo, H.; Izumi, M. Impedimetric and amperometric bifunctional glucose biosensorbased on hybrid organic—inorganic thin films. Bioelectrochemistry 2015, 101, 1–7. [CrossRef]
36. Abegão, L.; Ribeiro, J.; Ribeiro, P.; Raposo, M. Nano-Molar Deltamethrin Sensor Based on Electrical Impedanceof PAH/PAZO Layer-by-Layer Sensing Films. Sensors 2013, 13, 10167–10176. [CrossRef]
37. Riul, A.; Dos Santos, D.S.; Wohnrath, K.; Di Tommazo, R.; Carvalho, A.C.P.L.F.; Fonseca, F.J.; Oliveira, O.N.;Taylor, D.M.; Mattoso, L.H.C. Artificial taste sensor: Efficient combination of sensors made fromLangmuir-Blodgett films of conducting polymers and a ruthenium complex and self-assembled filmsof an azobenzene-containing polymer. Langmuir 2002, 18, 239–245. [CrossRef]
38. Marques, I.; Magalhâes-Mota, G.; Pires, F.; Sério, S.; Ribeiro, P.A.; Raposo, M. Detection of traces of triclosanin water. Appl. Surf. Sci. 2017, 421, 142–147. [CrossRef]
39. Raposo, M.; Oliveira, O.N., Jr. Adsorption mechanisms in layer-by-layer films. Braz. J. Phys. 1998, 28, 1–14.[CrossRef]
40. Rivero, P.J.; Goicoechea, J.; Arregui, F.J. Layer-by-Layer Nano-Assembly: A Powerful Tool for Optical FiberSensing Applications. Sensors 2019, 19, 683. [CrossRef]
41. Del Valle, M. Electronic tongues employing electrochemical sensors. Electroanalysis 2010, 22, 1539–1555.[CrossRef]
42. Carminati, M. Advances in High-Resolution Microscale Impedance Sensors. J. Sensors 2017, 2017, 1–15.[CrossRef]
43. Pereira-da-Silva, J.; Zagalo, P.M.; Magro, C.; Pinto, I.; Ribeiro, P.A.; Raposo, M. Detection and Adsorptionof Triclosan on Sensors Based on PAH/PVS Thin-Films. In Proceedings of the 2019 IEEE 6th PortugueseMeeting on Bioengineering (ENBENG), Caparica, Portugal, 6–8 September 2019; IEEE: Piscataway, NJ, USA,2019; pp. 1–4.
44. Pereira-da-Silva, J.; Zagalo, P.; Magalhães-Mota, G.; Ribeiro, P.; Raposo, M. Adsorption of Triclosan on SensorsBased on PAH/PAZO Thin-Films: The Effect of pH. In Computational Intelligence Methods for Bioinformatics andBiostatistics; Raposo, M., Ribeiro, P., Sério, S., Staiano, A., Ciaramella, A., Eds.; Springer: Cham, Switzerland,2020; pp. 319–325.
45. Williams, M. The Merck Index: An Encyclopedia of Chemicals, Drugs, and Biologicals, 15th ed.; O’Neil, M.J., Ed.;Royal Society of Chemistry: Cambridge, UK, 2013; pp. 1–2708, ISBN 9781849736701.
46. Oliveira, O.N.; Raposo, M.; Dhanabalan, A. Langmuir-Blodgett and Self-Assembled Polymeric Films.In Handbook of Surfaces and Interfaces of Materials; Nalwa, H.S., Ed.; Elsevier: Burlington, USA, 2001; pp. 1–63,ISBN 978-0-12-513910-6.
47. Taylor, D.M.; Macdonald, A.G. AC admittance of the metal/insulator/electrolyte interface. J. Phys. D. Appl.Phys. 1987, 20, 1277. [CrossRef]

Nanomaterials 2020, 10, 640 19 of 19
48. Parra, V.; Arrieta, Á.A.; Fernández-Escudero, J.A.; Rodríguez-Méndez, M.L.; De Saja, J.A. Electronic tonguebased on chemically modified electrodes and voltammetry for the detection of adulterations in wines. Sens.Actuators B. Chem. 2006, 118, 448–453. [CrossRef]
49. Rieger, P.H. The Electrified Interface. In Electrochemistry; Springer: Dordrecht, The Netherlands, 1994;pp. 59–108, ISBN 0306455552.
50. Ferreira, Q.; Gomes, P.J.; Ribeiro, P.A.; Jones, N.C.; Hoffmann, S.V.; Mason, N.J.; Oliveira, O.N.; Raposo, M.Determination of degree of ionization of poly(allylamine hydrochloride) (PAH) and poly[1-[4-(3-carboxy-4hydroxyphenylazo)benzene sulfonamido]-1,2- ethanediyl, sodium salt] (PAZO) in layer-by-layer films usingvacuum photoabsorption spectroscopy. Langmuir 2013, 29, 448–455. [CrossRef]
51. Raposo, M.; Oliveira, O.N. Energies of Adsorption of Poly (o-methoxyaniline) Layer-by-Layer Films. Langmuir2000, 16, 2839–2844. [CrossRef]
52. Raposo, M.; Lourenço, J.M.C.; Botelho do Rego, A.M.; Ferraria, A.M.; Ribeiro, P.A. Counterions—A newapproach to control the degree of ionization of polyelectrolytes in layer-by-layer films. Colloids Surf. APhysicochem. Eng. Asp. 2012, 412, 1–10. [CrossRef]
53. Rao, S.S.; Winter, J.O. Adhesion molecule-modified biomaterials for neural tissue engineering. Front.Neuroeng. 2009, 2, 1–4. [CrossRef]
54. Chang, C.W.; Kumar, S.R.; Wong, C.B.; Lue, S.J.; Baskoro, F.; Chen, C.H.; Chen, D.W. Graphene oxide-cationinteraction: Inter-layer spacing and zeta potential changes in response to various salt solutions. J. Memb. Sci.2018, 554, 253–263.
55. Choi, J.; Rubner, M.F. Influence of the degree of ionization on weak polyelectrolyte multilayer assembly.Macromolecules 2005, 38, 116–124. [CrossRef]
56. Konkena, B.; Vasudevan, S. Understanding aqueous dispersibility of graphene oxide and reduced grapheneoxide through p K a measurements. J. Phys. Chem. Lett. 2012, 3, 867–872. [CrossRef] [PubMed]
57. Zhu, X.; Tang, F.; Suzuki, T.S.; Sakka, Y. Role of the initial degree of ionization of polyethylenimine in thedispersion of silicon carbide nanoparticles. J. Am. Ceram. Soc. 2003, 86, 189–191. [CrossRef]
58. Lourenço, J.M.C.; Ribeiro, P.A.; Botelho do Rego, A.M.; Braz Fernandes, F.M.; Moutinho, A.M.C.; Raposo, M.Counterions in Poly (allylamine hydrochloride) and Poly (styrene sulfonate) Layer-by-Layer Films. Langmuir2004, 20, 8103–8109. [CrossRef] [PubMed]
59. Smith, R.N.; McCormick, M.; Barrett, C.J.; Reven, L.; Spiess, H.W. NMR studies of PAH/PSS polyelectrolytemultilayers adsorbed onto silica. Macromolecules 2004, 37, 4830–4838. [CrossRef]
© 2020 by the authors. Licensee MDPI, Basel, Switzerland. This article is an open accessarticle distributed under the terms and conditions of the Creative Commons Attribution(CC BY) license (http://creativecommons.org/licenses/by/4.0/).