New Probability Matrices for Identification of Streptomyces
13
Journal of General Microbiology ( 1989), 135, 12 1 - 133. Printed in Great Britain New Probability Matrices for Identification of Streptomyces By C . D. LANGHAM,l* S. T. WILLIAMS,* P. H. A. SNEATH' AND A. M. MORTIMER2 Department of Microbiology, University of Leicester, Leicester LEI 7RU, UK Department of Botany, University of Liverpool, Liverpool L69 3BX, UK (Received 19 May 1988; revised 24 August 1988; accepted 19 September 1988) 121 The character state data obtained for clusters defined in a previous phenetic classification were used to construct two probabilistic matrices for Streptomyces species. These superseded an original published identification matrix by exclusion of other genera and the inclusion of more Streptomyces species. Separate matrices were constructed for major and minor clusters. The minimum number of diagnostic characters for each matrix was selected by computer programs for determination of character separation indices (CHARSEP) and a selection of group diagnostic properties (DIACHAR). The resulting matrices consisted of 26 phena x 50 characters (major clusters) and 28 phena x 39 characters (minor clusters).Cluster overlap (OVERMAT program) was small in both matrices. Identification scores were used to evaluate both matrices. The theoretically best scores for the most typical example of each cluster (MOSTTYP program) were all satisfactory. Input of test data for randomly selected cluster representatives resulted in correct identification with high scores. The major cluster matrix was shown to be practically sound by its application to 35 unknown soil isolates, 77% of which were clearly identified. The minor cluster matrix provides tentative probabilistic identifications as the small number of strains in each cluster reduces its ability to withstand test variation. A diagnostic table for single- membered clusters, constructed using the CHARSEP and DIACHAR programs, was also produced. / INTRODUCTION The genus Streptomyces presents a particularly difficult problem for taxonomists. Its importance as a major source of antibiotics and other useful metabolites has resulted in the multiplication of so-called species, which has led to taxonomic confusion. It is, nevertheless, the role of taxonomists to provide more objective systems for the classification and identification of these important microbes. Most early attempts to group the several hundred Streptomyces species were made using a few subjectively chosen criteria. Such schemes are artificial and provide identifications of little predictive value. Numerical classification provides an alternative, producing a large amount of quantitative data on test reactions of strains within the clusters which are defined by overall similarity. Such data are useful for the construction of probabilistic identification matrices (Sneath & Sokal, 1973; Hill, 1974; Sneath, 1978), which contain the minimum number of characters needed to discriminate between taxa and are less susceptible to test error than are other diagnostic systems. The most comprehensive numerical classification of Streptomyces species to date used 139 unit characters to classify 394 type cultures of Streptomyces and other actinomycete genera into 19 major, 39 minor and 18 single-membered Streptomyces clusters at the 77.5% Ss, S-level (Williams et a/., 1983a). These data were then used to construct a probability matrix for the identification of 23 phena which consisted of 19 Streptomyces, 2 Streptoverticillium and one Amycolatopsis rnediterranei major clusters, together with one minor cluster (Streptomycesfradiae) Abbreviation : VSP, variance separation potential. 0001-4904 0 1989 SGM
-
Upload
independent -
Category
Documents
-
view
3 -
download
0
Transcript of New Probability Matrices for Identification of Streptomyces

Journal of General Microbiology ( 1989), 135, 12 1 - 133. Printed in Great Britain
New Probability Matrices for Identification of Streptomyces
By C. D. LANGHAM,l* S . T. WILLIAMS,* P . H. A. S N E A T H ' AND A . M. MORTIMER2
Department of Microbiology, University of Leicester, Leicester LEI 7RU, UK Department of Botany, University of Liverpool, Liverpool L69 3BX, UK
(Received 19 May 1988; revised 24 August 1988; accepted 19 September 1988)
121
The character state data obtained for clusters defined in a previous phenetic classification were used to construct two probabilistic matrices for Streptomyces species. These superseded an original published identification matrix by exclusion of other genera and the inclusion of more Streptomyces species. Separate matrices were constructed for major and minor clusters. The minimum number of diagnostic characters for each matrix was selected by computer programs for determination of character separation indices (CHARSEP) and a selection of group diagnostic properties (DIACHAR). The resulting matrices consisted of 26 phena x 50 characters (major clusters) and 28 phena x 39 characters (minor clusters). Cluster overlap (OVERMAT program) was small in both matrices. Identification scores were used to evaluate both matrices. The theoretically best scores for the most typical example of each cluster (MOSTTYP program) were all satisfactory. Input of test data for randomly selected cluster representatives resulted in correct identification with high scores. The major cluster matrix was shown to be practically sound by its application to 35 unknown soil isolates, 77% of which were clearly identified. The minor cluster matrix provides tentative probabilistic identifications as the small number of strains in each cluster reduces its ability to withstand test variation. A diagnostic table for single- membered clusters, constructed using the CHARSEP and DIACHAR programs, was also produced.
/
INTRODUCTION
The genus Streptomyces presents a particularly difficult problem for taxonomists. Its importance as a major source of antibiotics and other useful metabolites has resulted in the multiplication of so-called species, which has led to taxonomic confusion. It is, nevertheless, the role of taxonomists to provide more objective systems for the classification and identification of these important microbes. Most early attempts to group the several hundred Streptomyces species were made using a few subjectively chosen criteria. Such schemes are artificial and provide identifications of little predictive value. Numerical classification provides an alternative, producing a large amount of quantitative data on test reactions of strains within the clusters which are defined by overall similarity. Such data are useful for the construction of probabilistic identification matrices (Sneath & Sokal, 1973; Hill, 1974; Sneath, 1978), which contain the minimum number of characters needed to discriminate between taxa and are less susceptible to test error than are other diagnostic systems.
The most comprehensive numerical classification of Streptomyces species to date used 139 unit characters to classify 394 type cultures of Streptomyces and other actinomycete genera into 19 major, 39 minor and 18 single-membered Streptomyces clusters at the 77.5% Ss, S-level (Williams et a/., 1983a). These data were then used to construct a probability matrix for the identification of 23 phena which consisted of 19 Streptomyces, 2 Streptoverticillium and one Amycolatopsis rnediterranei major clusters, together with one minor cluster (Streptomycesfradiae)
Abbreviation : VSP, variance separation potential.
0001-4904 0 1989 SGM
122 C . D . LANGHAM A N D OTHERS
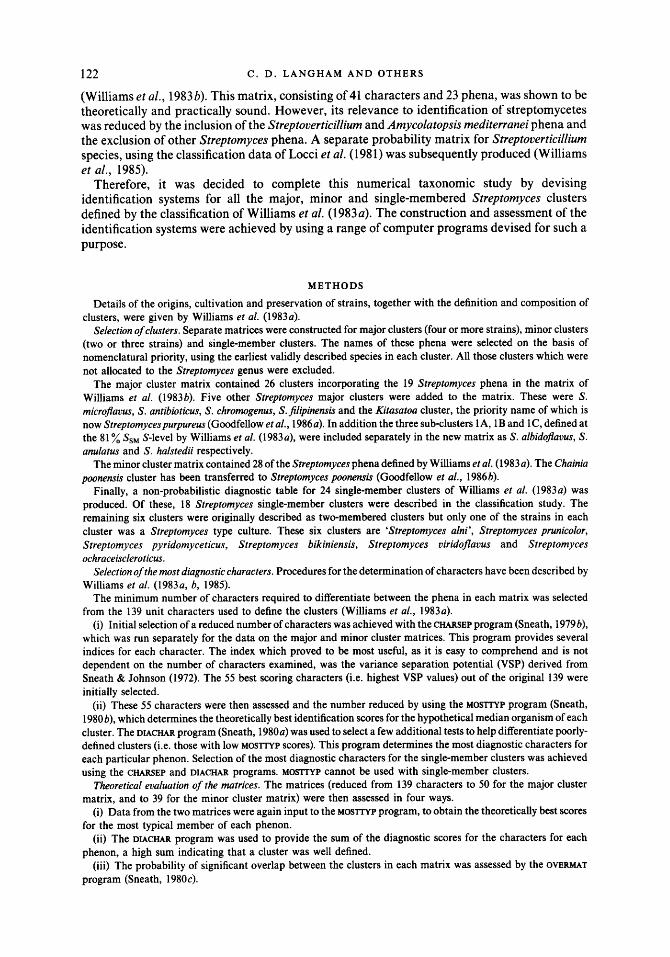
(Williams et al., 1983b). This matrix, consisting of 41 characters and 23 phena, was shown to be theoretically and practically sound. However, its relevance to identification of streptomycetes was reduced by the inclusion of the Streptoverticillium and Amycolatopsis mediterranei phena and the exclusion of other Streptomyces phena. A separate probability matrix for Streptoverticillium species, using the classification data of Locci et al. (1981) was subsequently produced (Williams et al., 1985).
Therefore, it was decided to complete this numerical taxonomic study by devising identification systems for all the major, minor and single-membered Streptomyces clusters defined by the classification of Williams et al. (1983a). The construction and assessment of the identification systems were achieved by using a range of computer programs devised for such a purpose.
METHODS
Details of the origins, cultivation and preservation of strains, together with the definition and composition of clusters, were given by Williams et al. (1983~).
Selection of clusters, Separate matrices were constructed for major clusters (four or more strains), minor clusters (two or three strains) and single-member clusters. The names of these phena were selected on the basis of nomenclatural priority, using the earliest validly described species in each cluster. All those clusters which were not allocated to the Streptomyces genus were excluded.
The major cluster matrix contained 26 clusters incorporating the 19 Streptomyces phena in the matrix of Williams et al. (1983b). Five other Streptomyces major clusters were added to the matrix. These were S. microflavus, S. antibioticus, S. chromogenus, S.ji1ipinensis and the Kitasatoa cluster, the priority name of which is now Streptomycespurpureus (Goodfellow etal., 1986~). In addition the three sub-clusters 1 A, 1B and lC, defined at the 81 % SSM S-level by Williams et al. (1983a), were included separately in the new matrix as S. albidoJaw, S . anulatus and S . halstedii respectively.
The minor cluster matrix contained 28 of the Streptomyces phena defined by Williams et al. (1983~). The Chainia poonensis cluster has been transferred to Streptomyces poonensis (Goodfellow et al., 1986b).
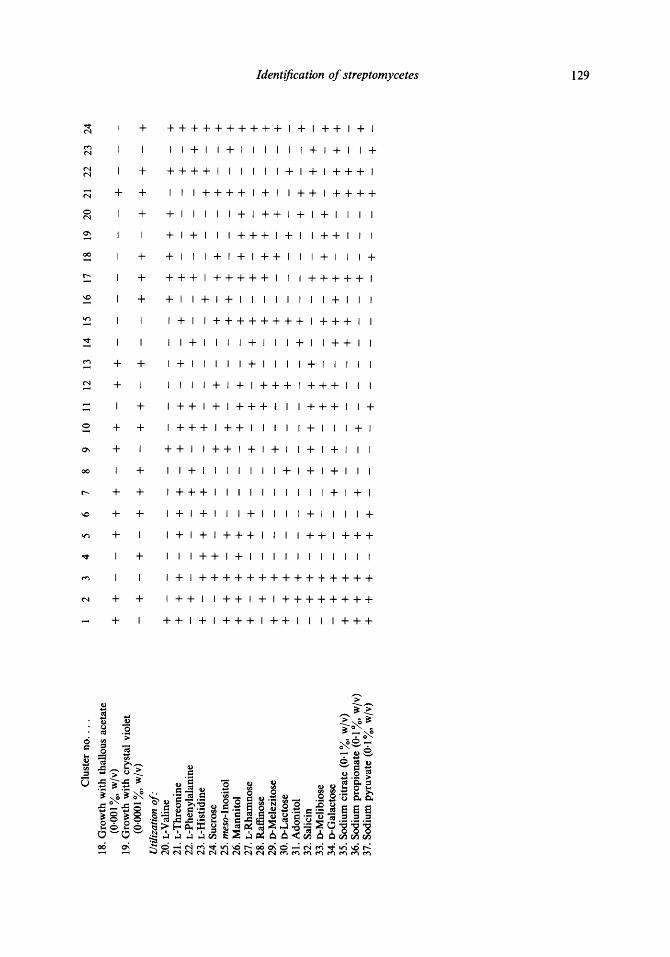
Finally, a non-probabilistic diagnostic table for 24 single-member clusters of Williams et al. (1983~) was produced. Of these, 18 Streptornyces single-member clusters were described in the classification study. The remaining six clusters were originally described as two-membered clusters but only one of the strains in each cluster was a Streptomyces type culture. These six clusters are ‘Streptomyces alni’, Streptomyces prunicolor, Streptomyces pyridomyceticus, Streptomyces bikiniensis, Streptomyces viridoflavus and Streptomyces ochraceiscleroticus.
Selection of the most diagnostic characters. Procedures for the determination of characters have been described by Williams et al. (1983a, b, 1985).
The minimum number of characters required to differentiate between the phena in each matrix was selected from the 139 unit characters used to define the clusters (Williams et al., 1983~).
(i) Initial selection of a reduced number of characters was achieved with the CHARSEP program (Sneath, 19793), which was run separately for the data on the major and minor cluster matrices. This program provides several indices for each character. The index which proved to be most useful, as it is easy to comprehend and is not dependent on the number of characters examined, was the variance separation potential (VSP) derived from Sneath & Johnson (1972). The 55 best scoring characters (i.e. highest VSP values) out of the original 139 were initially selected.
(ii) These 55 characters were then assessed and the number reduced by using the MOSTTYP program (Sneath, 1980 b), which determines the theoretically best identification scores for the hypothetical median organism of each cluster. The DIACHAR program (Sneath, 1980a) was used to select a few additional tests to help differentiate poorly- defined clusters (i.e. those with low MOSTTYP scores). This program determines the most diagnostic characters for each particular phenon. Selection of the most diagnostic characters for the single-member clusters was achieved using the CHARSEP and DIACHAR programs. M O S ~ P cannot be used with single-member clusters.
Theoretical evaluation of the matrices. The matrices (reduced from 139 characters to 50 for the major cluster matrix, and to 39 for the minor cluster matrix) were then assessed in four ways.
(i) Data from the two matrices were again input to the M O S ~ P program, to obtain the theoretically best scores for the most typical member of each phenon.
(ii) The DIACHAR program was used to provide the sum of the diagnostic scores for the characters for each phenon, a high sum indicating that a cluster was well defined.
(iii) The probability of significant overlap between the clusters in each matrix was assessed by the OVERMAT
program (Sneath, 1980~).

Iden t ijica t ion of strep tomy cetes 123
(iv) A strain from each cluster (or two if the number of strains exceeded 20) was selected at random. The test data for these strains (obtained from the results of Williams et al., 1983a) were input to the MATIDEN program (Sneath, 1979~) . This provides the three best identification scores for a known or unknown strain against a matrix and lists characters of the strain which are atypical of the phenon to which it best identifies. The identification coefficients determined were the Willcox probability (Willcox et al., 1973), taxonomic distance and standard error of taxonomic distance. With the Willcox probability a score approaching 1.0 indicates a high likelihood of identification ; low scores for taxonomic distance (less than 0.3) indicate relatedness; and acceptable values for the standard error of taxonomic distance areless than about 2.0-3-0, with negative values showing that the unknown is closer to the centroid than average.
Theoretical evaluation of the single-member clusters was not possible. Practical evaluation ofthe major cluster matrix. This matrix was further evaluated by using it for the identification
of 35 soil isolates, some of which had been identified using the original matrix (Williams et al., 19836) with a Willcox probability of > 0.85.
The 50 characters in the newly constructed major cluster matrix were determined for these isolates, using the test methods of Williams et al. (1983a, 6). The test data were assessed against this matrix using the MATIDEN program to determine identification scores.
The reproducibility of the test results was assessed by examining the agreement between the 29 tests common to the original identification matrix (Williams et al., 19836) and the new major cluster matrix. Both sets of data were used to calculate the test variances and the average probability of an erroneous test result (Sneath & Johnson, 1972).
RESULTS
Construction and composition of matrices
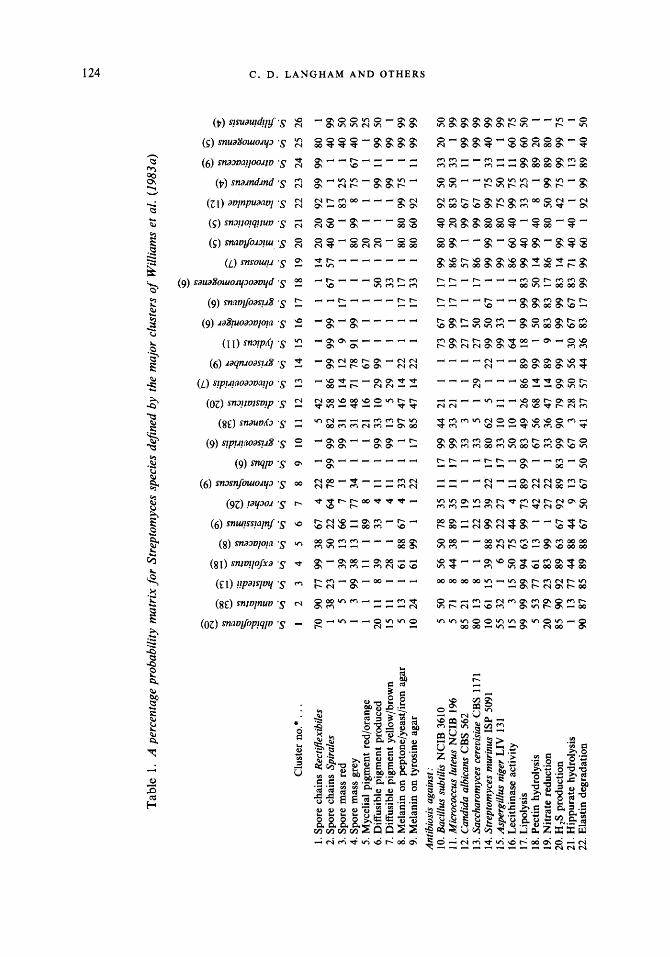
The major cluster matrix consisted of 26 phena, comprising a total of 307 strains, and 50 characters (Table 1). The characters covered a wide range of attributes, including morphology, pigmentation, antibiosis, antibiotic sensitivity, growth tolerances and nutritional requirements. Of the 50 characters, 29 were in common with the original matrix (Williams et al., 1983b). The minor cluster matrix consisted of 28 phena (71 strains) and 39 characters, 26 of which were in common with the major cluster matrix (Table 2). The diagnostic table for single-member clusters (Table 3) contained 24 phena and 37 characters, 30 of which were shared by the major cluster matrix. Nineteen characters were common to both matrices and the diagnostic table.
Sneath (19793) recommended selection of characters with a VSP of >25% where possible. This was achieved for the minor cluster matrix, where scores ranged from 45.50% (Rectgexibiles spore chains) to 74.1 3 % (utilization of sodium propionate) (Table 4). However, with the major cluster matrix some tests with high VSP scores were excluded due to practical difficulties in their determination (e.g. growth at 4 "C with a VSP score of 33.15 % was excluded as it requires 6 weeks incubation). Also excluded was the presence of smooth spores (VSP of 29.21 %) as this requires examination by scanning electron microscopy, while other characters with low scores were shown by the DIACHAR program to be useful for differentiating particular clusters. Thus, the VSP scores for the tests included ranged from 6.62% (red-orange mycelial pigment) to 55.30 % (melanin production on peptone/iron agar).
Theoretical evaluation of matrices
A summary of the scores obtained for both matrices by the various programs is given in Table 4.
The MOSTTYP program gave good scores for the hypothetical median organism of all clusters in both matrices. Willcox probabilities were high, with only S. diastaticus in the major cluster matrix scoring less than 0.999; values for taxonomic distance were low and those for its standard error were all negative. The results compare well with those obtained for the original matrix by Williams et al. (19833), where Willcox probabilities ranged from 0.974 to 1.000.
The sums of diagnostic scores provided by the DIACHAR program for the major cluster matrix ranged from 10.81 (for S. diastaticus) to 20.36 (S . purpureus), improving on the original matrix scores of 9.36 to 18.56. Scores for the minor cluster matrix were even better. It should be noted that the values obtained are dependent on the number of characters examined, so the criterion
c
=!
- s. 13 s. w s. P s. ul s. m s.. 4 s. 00 s. w s. ;; s. z s. ;J s. t; s. r: s. t; s. ;;; s. 5 s.
s. s.
g s. E s. k s. g s. g s.
s.
albidoflavus (20)
anulatus (38)
halstedii (1 3)
exfoliatus (1 8)
violaceus (8)
fulvissimus (9)
rochei (26)
chromofuscus (9)
albus (6)
griseoviridis (6)
cyaneus (38)
diastaticus (20)
olivaceoviridis (7)
griseoruber (9)
lydicus (1 1)
violaceoniger (6)
griseoflavus (6)
phaeochromogenes (6)
rimosus (7)
microjlauus (5)
antibioticus (5)
lavendulae (1 2)
purpureus (4)
atroolivaceus (9)
chromugenus (5)
Elipinensis (4)
PZ I
c
N
P
Tab
le 1
. A
per
cent
age
prob
abili
ty m
atri
x fo
r St
rept
omyc
es s
peci
es d
efin
ed b
y th
e m
ajor
clu
ster
s of
Will
iam
s et
al.
(1
98
3~
)
Clu
ster
no.
* . .
. 1.
Spo
re c
hain
s R
ectiP
exib
iles
2. S
pore
cha
ins
Spir
ales
3.
Spo
re m
ass
red
4. S
pore
mas
s gr
ey
5. M
ycel
ial p
igm
ent
red/
oran
ge
6. D
iffu
sibl
e pi
gmen
t pro
duce
d 7.
Dif
fusi
ble
pigm
ent y
ello
w/b
row
n 8.
Mel
anin
on
pept
onel
yeas
tlir
on a
gar
9. M
elan
in o
n ty
rosi
ne a
gar
Ant
ibio
sis
agai
nst :
10. B
acill
us s
ubtil
is N
CIB
361
0 1 1
. Mic
roco
ccus
fute
us N
CIB
196
12
. Can
dida
alb
ican
s C
BS
562
1 3. S
acch
arom
yces
cer
evis
iae
CB
S 1 1
7 1
14. S
trep
tom
yces
mur
inus
ISP
509
1 15
. Asp
ergi
fus n
iger
LIV
13 1
16
. Lec
ithi
nase
act
ivit
y 17
. Lip
olys
is
18. P
ecti
n hy
drol
ysis
19
. Nit
rate
red
uctio
n 20
. H2S
pro
duct
ion
21.
Hip
pura
te h
ydro
lysi
s 22
. E
last
in d
egra
dati
on
~~~~
~~~~
~~~~
~~~~
~~~~
~~~~
~~
1 2
3 4
5 6
7 8
9 10
11
12
13
14
15
16
17
18
19
20
21
22
23
24
25
26
70
90
77
99
38
67
4 22
1
1 5
42
1 1
1 1
1 1
14
20
20
92
99
99
80
1 1
38
23
1 50
22
64
78
99
99
82
58
86
99
99
99
1 67
57
40
60
17
1 1
40
99
5 5
1 39
13
66
7
1 1
99
31
16
14
12
9 1
17
1 1
1 1
83
25
1
40
50
1 3
99
38
13
11
77
34
1 1
31
48
71
78
91
99
1 1
1 80
99
8
75
67
40
50
11
11
1
18
9
8 1
1 1
21
16
1
67
1
1 1
1 1
20
1
1 1
1 1
25
20
11
8
39
1 33
4
11
1 99
33
10
29
99
1
1 1
50
1 20
1
1 99
11
99
50
1
51
1
12
8
11
41
1
19
91
3
52
9
11
11
33
1
1 1
19
9
19
9
1 5
13
1 61
88
67
4
33
1 1
97
47
14
22
1
1 17
17
1
80
80
99
75
1
99
99
10
24
1 61
99
1
1 22
1
17
85
47
14
22
1 1
17
33
1 80
60
92
1
11
99
99
5 50
8
56
50
78
35
11
17
99
44
21
1 1
73
67
17
17
99
80
40
92
50
33
20
50
5 71
8
44
38
89
35
11
17
99
33
21
1 1
99
99
17
17
86
99
20
83
50
33
1 99
85
21
8
1 1
11
19
1 1
33
3 1
1 1
27
17
1 1
57
1 99
67
1
11
99
99
80
13
8 1
1 22
15
1
1 33
5
1 29
1
27
50
1
17
86
1 99
67
1
1 99
99
10
61
15
39
88
99
39
22
17
80
62
5
1 22
99
50
67
1
99
99
80
99
75
33
40
99
55
32
1 6
25
22
27
1 17
33
10
11
1
1
99
33
1 1
99
1 80
75
50
11
1
99
15
3
15
50
75
44
4 11
1
50
10
1 1
1 64
1 1
1 86
60
40
99
75
11
60
75
99
99
99
94
63
99
73
89
99
83
49
26
86
89
18
99
99
83
99
40
1
33
25
99
60
50
5 53
77
61
13
1
42
22
1 67
56
68
14
99
1
50
99
50
14
99
40
8 1
89
20
1 20
79
23
83
99
1
27
22
1 33
36
47
14
89
9
83
83
17
86
1 80
50
99
89
80
1
85
90
92
89
63
67
92
89
83
99
90
79
99
99
1 99
99
83
14
99
1 42
75
99
99
75
1
13
77
44
88
44
9 13
1
67
3 28
50
56
30
67
67
83
71
40
40
1
1 13
1
1 90
87
85
89
88
67
50
67
50
50
41
37
57
44
36
83
17
99
99
60
1
92
99
89
40
50

Clu
ster
no.
* . .
. 1
2 3
4 5
6 7
8 9
10
11
12
13
14
15
16
17
18
19
20
21
22
23
24
25
26
23. X
anth
ine
degr
adat
ion
95
95
99
94
88
99
96
22
83
83
80
53
29
78
82
1 1
99
86
60
80
83
99
99
20
99
24. A
rbut
in d
egra
datio
n 99
99
99
99
99
67
96
99
99
99
54
53
1
99
99
99
50
67
71
99
99
92
75
99
60
75
25. R
esis
tanc
e to
neom
ycin
(50
pg m
l-I)
11
11
12
58
9
8 1
1 1
1 1
1 1
18
1
1 1
99
1
15
07
51
1
11
26
. Res
ista
nce t
o rif
ampi
cin
(50p
g m
l-I)
40
66
31
11
99
99
89
33
99
83
46
68
86
78
9 83
50
50
99
99
20
33
99
89
80
75
27
. Res
ista
nce t
oole
ando
myc
in (1
OO
pg m
l-I)
70
84
99 44
13
99
46
1 83
17
13
26
1
1 9
50
83
33
71
1 1
8 75
78
20
25
28
. Res
ista
nce t
o pe
nici
llin
G (
10 L
u.)
90
74
92 44
99
99
92 44
99
99 64
47
14
78
91
17
83
33
99
20
40
58
25
99
80
25
29. G
row
th a
t 45°
C
1 5
23
17
1 22
77
67
99
67
41
16
86
1
1 50
1
67
43
60
80
17
1 1
1 25
30
. Gro
wth
with
NaC
l (7%
, w/v
) 85
74
92
22
38
22
92
44
99
83
18
32
29
78
55
1 33
83
99
1
20
1 25
44
20
1 31
. Gro
wth
with
NaN
, (0
.01 %
, w/v
) 75
32
85
23
63
1
62
56
99
99
15
5 57
11
18
50
33
67
71
60
60
1
1 1
1 75
32
. Gro
wth
with
phe
nol (
0.1 %
, w/v
) 90
92
85
72
99
44
96
22
17
83 64
95
86
89
9 1
99
99
71
99
80
58
1 56
60
50
33
. Gro
wth
with
pot
assi
um te
llurit
e 85
87
99
83
99
56
73
67
50
99
46
74
57
78
55
17
99
99
71
80
60
42
1 56
20
1
34. G
row
th w
ith th
allo
us a
ceta
te
90
87
92
67
63
22
54
54
1 50
13
21
14
33
46
1
50
33
14
1 40
17
1
11
1 1
(0.0
01%
, wlv
)
(O.O
ol%
, w/v
) &
Util
izat
ion of:
9 35
. DL-
a-A
min
o-n-
buty
ric a
cid
65
37
54
61
88
89
12
67
1 1
31
32
57
33
9 99
17
67
1
60
20
42
1 33
99
25
36
. L-C
yste
ine
60
61
69
50
38 44
50
67
1 83
72
79
99
78
46
33
17
17
29
60
80
33
1
56
99
99
s 37
. L-V
alin
e 35
37
62
50
50
99
15
33
17
17
69
74
86
56
27
33
1
99
57
40
60
17
1 1 40
99
6’
39. L
-His
tidin
e 40
74
69
78
25
99
77
78
99
83
85
68
99
99
36
99
17
83
99
40
99
8
1 78
20
99
%
40
. L-H
ydro
xypr
olin
e 1
37
23
89
88
78
8 1
67
17
28
21
1 22
55
83
17
67
29
20
40
42
I 11
40
75
-+
41. S
ucro
se
4 42
. mes
o-In
osito
l 45
32
23
6
63
99
96
89
33
67
92
84
57
99
91
67
83
99
99
40
80
25
75
1 60
75
3
43
. Man
nito
l 90
99
69
1
38
99
99
99
99
99
95 90
99
99
91
99
99
99
99
99
80
8 25
89
60
75
3 ‘“0 z
44.
L-R
ham
nose
20
82
69
61
38
22
96
67
17
83
92
95
99
99
18
83
83
99
1
80
60
17
1 78
20
25
2
45. R
affin
ose
5 18
31
33
63
89
69
22
33
50
99
84
99
99
82
83
33
99
86
99
60
8
1 22
80
99
46
. D-M
elez
itose
55
71
46
22
50
44
81
22
67
33
72
26
29
56
82
83
67
99
57 40
80
33
99
1 1
75
47. A
doni
tol
50
66
8 1
13
89
35
22
99
67
82
16
14
22
82
67
1 99
99
1
20
8 1
11
1 99
48
. D-M
elib
iose
25
32
77
28
75
89
96
44
50
33
98
95
99
78
82
83
67
83
99
40
99
17
25
11
99
75
49. D
extra
n 20
76
69
6
13
22
89
78
1 17
59
16
14
44
1 17
50
50
14
1
1 1
1 22
20
1
50. X
ylito
l 5
21
1
1 1
11
46
1
1 1
21
16
29
1
55
17
1
99
86
40
1
12
5 1
1 1
* Fig
ures
in p
aren
thes
es a
fter
the
clus
ter n
ames
are
the
num
ber o
f st
rain
s in
the
clus
ter.
38. L
-Phe
nyla
lani
ne
70
61
77
83
99
89
46
11
17
33
67
16
71
33
99
67
17
83
86
99
40
42
1 89
60
50
45
26
23
28
38
34
81
33
33
17
92
74
86 44
73
33
83
83
1 99
80
50
25
11
1
50

Tab
le 2
. A
per
cent
age
prob
abili
ty m
atri
x fo
r St
rept
omyc
es sp
ecie
s de
fined
by
the
min
or c
lust
ers
of W
illia
ms
et a
l. (
1983
a)
Clu
ster
no.
* . .
. 1.
Spo
re c
hain
s R
ectij
7exi
bile
.s
2. S
pore
cha
ins
Spir
ales
3.
Spo
re m
ass
grey
4.
Dif
fusi
ble
pigm
ent p
rodu
ced
5. B
acill
us s
ubtil
is N
CIB
361
0 6.
Mic
roco
ccus
lute
us N
CIB
196
7.
Str
epto
myc
es m
urin
us I
SP 5
091
8. P
ecti
n hy
drol
ysis
9.
Gua
nine
deg
rada
tion
10. E
last
in d
egra
datio
n 1 1
. Xan
thin
e de
grad
atio
n 12
. Xyl
an d
egra
dati
on
13. U
rea
degr
adat
ion
14. A
llant
oin
degr
adat
ion
15. R
esis
tanc
e to
rif
ampi
cin
Ant
ibw
sis a
gain
st :
(50
pg
ml-
I)
n
rn
W
n
m
n
v
1 2
3 4
5 6
7 8
9 10
11
12
13
14
15
16
17
18
19
20
21
22
23
24
25
26
27
28
99
99
99
1
99
1
1 1
1 1
1 1
13
3
11
11
11
11
33
99
66
50
1
1
1 1
1 50
1
99
99
50
99
99
99
1 99
33
99
66
1
99
99
99
99
1 66
1
1 50
50
50
33
1
33
50
50
1 33
99
99
1
50
99
1 1
33
1
99
99
66
1 1
1 33
1
66
1 1
1 1
19
99
9
15
06
6
11
50
50
99
50
1
1 1
19
99
9
11
11
13
35
0
11
33
99
66
50
1
1 1
19
9
15
0
11
11
11
33
1
1 1
66
99
33
99
1
99
99
33
33
33
50
99
1
1 50
99
1
99
1 1
1 33
1
33
33
1 1
1 66
99
99
99
50
99
50
1
99
66
50
50
1 66
50
99
1
99
66
1 1
33
1 1
66
1 50
1
99
99
66
33
1 50
99
33
1
1 1
50
50
1
99
50
1
99
99
1
19
99
9
11
11
11
33
1
1 1
50
1
99
99
99
99
99
50
66
99
99
99
50
66
1 1
1 1
99
99
33
99 99
66
99
99
99
1 50
99
66
99
99
1
99
50
99
99
99
50
1 99
50
66
1
66
1 66
1
1 1
66
66
99
99
99
50
99
99
33
99
99
99
50
99
99
99
99
50
66
1 33
1
33
33
99
1 50
99
66
99
99
66
50
1
1 66
1
1 1
50
1
66
99
99
1
99
99
1
1 1
66
1
1 1
15
0
13
33
3
11
99
1
66
99
99
50
99
99
99
99
1 50
50
33
99
1
66
99
66
99
66
99
50
99
99
33
1 99
50
1
33
99
99
1 1
99
66
1 1
1 1
66
50
1 1
33
66
66
66
50
50
99
99
33
1 99
1
1
99
1 99
99
50
1
66
50
50
99
99
66
1 1
33
99
66
1 66
99
50
99
33
33
1
1 1
1
- ‘Stv. olivoverticillatum’ (3:
m S. roseus (3)
w S. californicus (3)
P S. cellulosae (2)
~1 S. aureofaciens (2)
rn S. poonensis (2)
.I S. javeolus (3)
00 S. canus (2)
rg S. graminofaciens (2)
S. viridochromogenes (2)
S. glaucescens (2)
S. nogalater (3)
S. chattanoogensis (2)
S. thermovulgaris (3)
t, S. prasinosporus (3)
& S. longisporojaauus (3)
S. griseoluteus (3)
Z S. pactum (3)
S. aurantiacus (3)
8 S. varsoviensis (2)
2 S. tubercidicus (2)
S. albojavus (3)
S. luridus (3)
S. xanthochromogenes (3
S. misakiensis (3)
g S. psammoticus (2)
2 S. fradiae (2)
!i2 S. cIavuIigem (2)

Clu
ster
no.
* . .
. 1
2 3
4 5
6 7
8 9
10
11
12
13
14
15
16
17
18
19
20
21
22
23
24
25
26
27
28
16. R
esis
tanc
e to
pen
icill
in G
(1
0 i.u
.)
99
99
66
99
50
99
33
99
50
1 1
33
50
1 33
66
33
33
66
99
99
99
66
33
1
1 50
99
17
. Gro
wth
at
45 "
C
33
1 1
99
50
99
99
50
1 99
99
99
1
99
66
1 33
99
66
1
50
1 33
1
33
1 99
1
18.G
row
th w
ith
NaC
l (7
%,
w/v
) 99
1
99
50
1
1 1
50
99
1 50
1
50
1 1
66
66
33
33
99
50
1 1
1 1
1 1
1
19. G
row
th w
ith
NaN
3 (0
-01%
, w/v
) 99
1
99
99
99
1 66
1
1 99
50
33
99
99
33
66
99
33
1
1 1
33
1 33
1
1 1
1 20
. Gro
wth
with
phe
nol (
0-1%
, w/v
) 66
'66
99
99
99
99
66
50
99
99
50
33
99
99
99
33
99
33
33
SO
1
99
33
1 1
1 1
1 21
. Gro
wth
wit
h po
tass
ium
tellu
rite
(0
.001
%,
w/v
) 99
1
99
99
99
99
1 1
99
50
99
66
99
99
33
66
99
99
33
99
99
33
1 1
66
99
99
1 U
tiliz
atio
n of:
22. P
otas
sium
nit
rate
66
1
99
23. L
-Phe
nyla
lani
ne
66
99
99
24. L
-His
tidin
e 99
99
99
25
. L-A
rabi
nose
99
1
33
26. S
ucro
se
66
1 1
27. D
-Xyl
ose
99
33
66
28. m
eso-
Inos
itol
66
1 66
29
. Man
nito
l 99
1
66
30. D
Fru
ctos
e 99
33
99
3 1
. L-R
ham
nose
66
33
33
32
. Raf
finos
e 33
1
1 33
. D-L
acto
se
99
33
33
34. S
alic
in
99
99
99
35. D
-Mel
ibio
se
66
33
66
36. S
odiu
m a
ceta
te (0
.1 %
, w/v
) 66
66
99
37
. Sod
ium
cit
rate
(0.1
%,
w/v
) 99
1
99
38. S
odiu
m p
ropi
onat
e (0
.1%
, w/v
) 99
99
66
39
. Sod
ium
pyr
uvat
e (0
.1 %
, w/v
) 99
66
66
99 1 50
99
50
99
99
99
99
50 1 99
99
99
99
99
99
99
1 1 1 99
99
99
99
99
99
99
50
99
99
99
99
99
99
99
99 1 99
99 1 99
99
99
99
50 1 99
99
99
99
50
99
50
99
99
33
99
99
99
99
99
99
99
66
66
99
99
66
66 1 1
99
50 1 99
99
99 1 50
50 1 50
50
99
99 1 50 1 1
99
99 1 50
99
99
50
99
99
99
99
50
99
50 1 99
99
99
99 1 50
99 1 50
99
99 1 99
99
50
99
99
50
50
50
50
99
50
50
99
99 1 50
99
99
99 1 99 1 1 1 50 1 1
99
66
99
99 1
66
66
99
66
66
33
99 1
99
66
66
66
66
50
99
99
50
99
99
99
99
99 1 50
99
50
99 1 1 99 1
33
99
99
99
99
99
1 99
66
1
1 33
66
66
1
1 50
99
33
1
1 99
99
33
99
99
1
99
1 99
1
33
99
1 99
99
33
33
66
1
1 1
1
1 33
99
66
99
33
1
1
1 1
99
33
66
99
33
33
33
1 50
66
99
99
99
99
33
1
50
1 99
99
99
99
99
33
99
1
1 99
1
99
99
1 1
33
1
1 33
99
33
99
1
1 33
1
50
66
66
66
99
1 66
1
1 50
66
33
66
46
1
1 1
50
1
66
99
66
66
33
1 1
50
99
33
66
33
1 33
1
1 1
1 99
66
66
33
66
1
1 1
50
66
33
11
33
1
1 1
16
6
99
33
1 33
1
1 50
1
1
99
99
66
99
33
99
33 1 99 1 1 1 99 1 33
99
33
66
99
99
1 99
1
66
33
1 SO
1
66
99
50
1 1
66
66
1
50
50
33
66
50
1 1
33
66
1 99
50
1
1 1
15
0
33
1 1
1 so
33
99
99
1
1 1
1 1
99
50
33
66
1 50
1
66
33
1 50
1
99
1 1
50
50
33
1 1
50
1 1
66
50
1
50
33
66
99
99
50
1 99
99
99
1
33
66
1 50
1
* Fig
ures
in p
aren
thes
es a
fter
the
clu
ster
nam
e ar
e th
e nu
mbe
r of
str
ains
in t
he c
lust
er.

3 P
I + I + I I + I + I I I I I I I + + S. albocyaneus
I I I I 1 + + I I ++ I I I + + I w S. amakusaensis
1 + I I I I I I I I I + + + + I + w S. aurantiogriseus
+ I +++++++++ + I ++ I I P S.badius
I + I + 1 + I +++ I I I + I I + v1 S. bambergiensis
I + + + + I + I I + + + + I + + I Q\ S. cyaneogrisercs
I I + I I I +++ I I I I I I I I 4 S.jinlayi
I I I + I ++++++ I I I + I + 00 S.fiagi1is
+ I +++++ I + I I I I I I I I \o S-gelaticus
+11++++1+11
11+1+1+1111
+11++++1111
++1+++1++++
++1+1111111
11+++11+1+1
+IIll++ll++
++11++11+11
11++11+111+
+1+1+++1+++
+++l+++++lI
11++11+1+11
++111++1+1+
II++l I
I1+1 I I
I l1+1 I
+++ I + I
I II+l+
+++ I + I
1+1+1 I
1+1 I I I
IIIIII
l1++1+
I l1++1
++ I ++ I 1+1 I I I
;; ‘S. alni’
S. prunicolor
’5 S. pyridomyceticus
t; S. lateritius
S. luteofluorescens
t; S. massasporeus
g S. medwcidicus
=; S. moderatus
;;; S. novaecaesarae
;; S. ramulosus
g S. sulphureus
S. versipellis
S. bikiniensis
+ I I 1 I + + I + I I 1 I I + I I !2 S. uiridoflavus
+ + + 1 + + + + + I I I I I + + I S. ochraceiscleroticus
SPBHLO aNv HVHCJNV~ *a ’3 82 T
Clu
ster
no.
. . .
1. S
pore
cha
ins
Rec
tinic
ulia
pert
i 2.
Spo
re c
hain
s Sp
iral
es
3. A
bsen
ce of
myc
elia
l pig
men
t
5. M
elan
in o
n pe
pton
e/ye
ast/i
ron
agar
6.
Mel
anin
on
tyro
sine
aga
r
7. M
icro
cocc
us lu
teus
NC
IB 1
96
8. S
trep
tom
yces
mur
inus
ISP
509
1 9.
Lip
olys
is 10
. Pec
tin h
ydro
lysi
s 11
. H2S
pro
duct
ion
12. E
last
in d
egra
datio
n 13
. Xan
thin
e de
grad
atio
n
15. R
esis
tanc
e to
rifa
mpi
cin
(SO p
g m
l-I)
16. R
esis
tanc
e to
ole
ando
myc
in (1
OO
pg m
l-l)
17. R
esis
tanc
e to
pen
icill
in G
(10
i.u.
)
4. D
iffus
ible
pig
men
t pro
duce
d
Ant
ibio
sis
agai
nst :
14. A
rbut
in d
egra
datio
n
Tab
le 3
. A
dia
gnos
tic ta
ble for
Stre
ptom
yces
spec
ies
dejin
ed b
y th
e si
ngle
-mem
ber
clus
ters
of
Will
iam
s et
al. (
1983
a)
IdentiJication of streptomycetes 129
OI + I
OQ I +
t- + + \o + + m + l
d I +
m I I
r4 + + d + I
Clu
ster
no.
. . .
18. G
row
th w
ith t
hallo
us a
ceta
te
19. G
row
th w
ith c
ryst
al v
iole
t
Util
izat
ion of:
20. L
-Val
ine
21. L
-Thr
eoni
ne
22. L
-Phe
nyla
lani
ne
23. L
-His
tidin
e 24
. Suc
rose
25
. mes
o-In
osito
l 26
. Man
nito
l 27
. L-R
ham
nose
28
. Raf
finos
e 29
. DM
elez
itos
e 30
. D-L
acto
se
3 1. A
doni
tol
32. S
alic
in
33. D
Mel
ibio
se
34. D
-Gal
acto
se
35. S
odiu
m c
itrat
e (0
-1 %
, w/v
) 36
. Sod
ium
pro
pion
ate
(0.1
%, w
/v)
37. S
odiu
m p
yruv
ate
(0.1
%, w
/v)
(0.0
01%
, WlV
)
(O.o
Ool
%, w
/v)
10
11
12
13
14
15
16
17
18
19
20
21
22
23
24

130 C . D . LANGHAM A N D OTHERS
Table 4. A summary of scores obtained in the construction and assessment of the major and minor cluster matrices
Range of scores r 3
Program Information provided Major cluster Minor cluster
CHARSEP VSP (“A) 6-62 to 55.30 43.50 to 74.13 MOSTTYP Hypothetical median organism :
Willcox probability 0.993 to 1.000 1.0 Taxonomic distance ( D ) 0.180 to 0-283 0.130 to 0-300 Standard error of D -4.820 to -2.874 -3.973 to -2.74
DUCHAR Sum of diagnostic scores 10.81 to 20.36 14.00 to 19.53
OVERMAT Number of clusters with > 5 % overlap 1 0 MATIDEN Identification coefficients for cluster representatives :
Willcox probability 0.671 to 1.OOO 0.999 to 1.000 Taxonomic distance ( D ) 0.250 to 0466 0.169 to 0.414 Standard error of D -1.957 to 2.520 -2.394 to 4.153
Table 5 . Ident$cation of soil isolates by the original matrix (Williams et al., I983b) and the new major cluster matrix
Percentage of isolates identified at a Willcox probability level of > 0.850
Isolates identified by original matrix Isolates unidentified by original matrix Overall identified
1
New major cluster matrix Original matrix
71.4 85.7 77.0
100 0
60.0
used was the attainment of higher scores than were obtained for the published identification matrix (Williams et al., 1983b).
The OVERMAT program indicated that only one pair of clusters in the major cluster matrix exceeded 5 % overlap, S. cyaneus and S. rnicrocflauus showing 5.17 % overlap. None of the clusters in the minor cluster matrix had an overlap exceeding 1%.
The identification scores for randomly selected cluster representatives, provided by the MATIDEN program, were inevitably inferior to those for the hypothetical median organisms. Nevertheless, with three exceptions, all representatives of major and minor clusters identified to the correct phenon with Willcox probabilities > 0.900, low taxonomic distance and standard errors. In the major cluster matrix, S. glomeraurantiacus (ISP 5429) identified to its parent cluster (S. diastaticus) with a Willcox probability of only 0.671, unlike the other representative of this cluster, which had a high score. Two representatives of minor clusters, S . lusitanus (ISP 5568) and S. uarsoviensis (ISP 5346) identified with high Willcox probabilities but with standard errors of taxonomic distance exceeding 3.00.
Practical evaluation of major cluster matrix As with the evaluation of the original matrix, a minimum Willcox probability of 0.85 was
selected as the prime criterion for identification of unknown strains. All the isolates had been previously tested against the original matrix and were selected to provide a balance between strains identifying and those not.
The new matrix identified a substantial proportion of both groups (Table 5 ) and the overall percentage of identifications was higher than with the original matrix. Four of the isolates changed their identifications against the new matrix with good scores. This was mainly due to test error in the original determinations.

Iden t @ca t ion of s trep tomyce tes 131
Comparison of the earlier and current determinations of the 29 tests shared by both matrices on the same strains showed a probability of error of 13.4%. This reflected the problems of reproducibility between different operatives in varying laboratory conditions, but the identification results underline the resilience of probabilistic systems.
DISCUSSION
Numerical classifications result in objective groupings based on a large number of phenetic characters. They also sometimes lead to a reduction in the number of taxa. Such an approach to streptomycetes using 139 unit characters led to the distribution of 394 type species between 77 clusters at the 77.5% SsM S-level (Williams et al., 1983~). The clusters were regarded as species, which were relatively small and homogeneous, or as species groups, which were larger and heterogeneous. The distinction between these two categories was not always clear, but the subsequent application of other techniques has clarified the status of some clusters. Thus Mordarski et al. (1986) obtained good congruence between numerical phenetic and DNA homology data for strains assigned to the clearly delimited S. albidoJEavus sub-cluster. In contrast, the SIMCA statistical analysis of fatty acid data supported the view the S . cyaneus cluster was heterogeneous (Saddler et al., 1987).
Such studies also provide large reference data banks which can be accessed for a variety of purposes, including, for example, the formulation of selective isolation procedures (Vickers et al., 1984). However, it is their large data content that militates against their usefulness for the identification of unknown strains, which is an important aspect of taxonomy. Comprehensive classification data can, however, be used to develop matrices for probabilistic identification containing the minimum of characters needed to discriminate between the clusters (Hill, 1974). Such a system has many advantages over monothetic sequential keys, which are very susceptible to test ranking and test error (Sneath, 1974). Such matrices have been constructed for several bacterial genera, including Streptomyces (Williams et al., 1983 b) and Streptoverticillium (Williams et al., 1985). In the present study, an attempt was made to extend the number of streptomycetes which could be identified probabilistically.
The matrices for major and minor clusters, based on a total of 378 strains, were shown to be theoretically sound and superior to the original matrix (Williams et al., 1983b). Scores for the major cluster matrix were somewhat poorer, reflecting the variation in size and homogeneity of its clusters. Nevertheless, some care is needed when using the minor cluster matrix. With only two or three strains per cluster, cluster boundaries may not be so well defined, so there is less allowance for inherent variability of strains of a taxon (Sneath, 1979~).
The data for single-member clusters cannot be used for probabilistic identification, but a diagnostic table for these species was included to give some guidance for dealing with unknowns not identifying to the matrices.
The practical evaluation of the major cluster matrix against soil isolates was a relatively limited exercise. The overall percentage of identification (77 %) was satisfactory, particularly as a proportion of the strains failing to identify to the original matrix were deliberately included in the assessment. Despite this, the success rates compares well with those of other probabilistic systems, such as 70.8% for Gram-negative non-fermentative rods (Lapage et al., 1973), 50.5% for ‘coryneforms’ (Hill et al., 1978), 47% for slowly-growing mycobacteria (Wayne et al., 1980), 79.4% for vibrios (Dawson & Sneath, 1985) and 89.2% for Gram-negative fermentative bacteria (Holmes et al., 1986). Most of these workers used higher levels of Willcox probability for identification, but, with the exception of the ‘coryneforms’ and mycobacteria, they were dealing with more tightly defined phena.
Our matrices and diagnostic table will, therefore, help to improve the efficiency and objectivity of streptomycete identification, but some problems remain. In particular, not all validly described Streptomyces species, of which there is still a steady stream, have been characterized on a sufficiently broad phenetic base to allow their accurate classification and incorporation in the matrices.

132 C . D . LANGHAM A N D OTHERS
Another problem is the need for two matrices, and a diagnostic table, which do not have all tests in common. The size and diversity of the genus make it difficult to construct a single, workable identification matrix. Thus, unknowns should be tested initially against the major clusters and then if necessary against the minor and single-member clusters. It may be possible eventually to construct a small, preliminary or ‘super’ matrix to determine the most appropriate choice of identification system. Such a scheme was used by Davis et al. (1983) for identification of marine bacteria. Another, more satisfactory, possibility is that the widespread use of these two matrices will provide new strains assigned to minor clusters, facilitating their delimitation and inclusion in the major matrix.
Nevertheless, the current problem is the large number of tests still needed for a correct identification, again reflecting the diversity of streptomycetes. New programs (authors’ unpublished data) may help to reduce the theoretical minimum number required, and automation of testing procedures is increasing. The use of more rapid tests, such as those applied to representatives of numerically defined Streptomyces groups by Goodfellow et al. (1987), is another promising approach to this problem.
This work was supported by a research grant from the Science and Engineering Research Council.
REFERENCES
DAVIS, A. W., ATLAS, R. M. & KRICHEVSKY, M. I. (1983). Development of probability matrices for identification of Alaskan marine bacteria. Inter- national Journal of Systematic Bacteriology 33,
DAWSON, C. W. & SNEATH, P. H. A. (1985). A probability matrix for the identification of vibrios. Journal of Applied Bacteriology 58, 407-423.
GOODFELLOW, M., WILLIAMS, S. T. & ALDERSON, G. (1986~). Transfer of Kitasatoa purpurea Matsumae and Hara to the genus Streptomyces as Streptomyces purpureus comb. nov. Systematic and Applied Micro- biology 8, 65-66.
GOODPELLOW, M., WILLIAMS, S. T. & ALDERSON, G. (1986b). Transfer of Chainia species to the genus Streptomyces with emended description of species. Systematic and Applied Microbiology 8, 55-60.
GOODFELLOW, M., LONSDALE, C., JAMES, A. L. & MCNAMARA, 0. C. (1987). Rapid biochemical tests for the characterisation of streptomycetes. FEMS Microbiology Letters 43, 39-44.
HILL, L. R. (1974). Theoretical aspects of numerical identification. International Journal of Systematic Bacteriology 24, 494-499.
HILL, L. R., LAPAGE, S. P. & BOWIE, I. S. (1978). Computer-assisted identification of coryneform bac- teria. In Coryneform Bacteria, pp. 181-215. Edited by I. J. Bousfield & A. G. Callely. London: Academic Press.
HOLMES, B., DAWSON, C. A. & PINNING, C. A. (1986). A revised probability matrix for the identification of Gram-negative, aerobic, rod-shaped, fermentative bacteria. Journal of General Microbiology 132, 3 1 13- 3135.
LAPAGE, S. P., BASCOMB, S., WILLCOX, W. R. & CURTIS, M. A. (1983). Identification of bacteria by computer: general aspects and perspectives. Journal of General Microbiology 77, 273-290.
LOCCI, R., ROGERS, J., SARDI, P. & SCHOFIELD, G. M. (1981). A preliminary numerical study on named species of the genus Streptoverticillium. Annuli di microbwlogia 31, 1 1 5- 1 2 1.
803-8 10.
MORDARSKI, M., GOODFELLOW, M., WILLIAMS, S. T. & SNEATH, P. H. A. (1986). Evaluation of species groups in the genus Streptomyces. In Biological, Biochemical and Biomedical Aspects of Actinomycetes, pp. 517-525. Edited by G. Szabo, S. Biro & M. Goodfellow. Budapest : Akademiai Kiado.
SADDLER, G. S., O’DONNELL, A. G., GOODFELLOW, M. & MINNIKIN, D. E. (1987). SIMCA pattern recogni- tion in the analysis of streptomycete fatty acids. Journal of General Microbiology 133, 1 137-1 147.
SNEATH, P. H. A. (1974). Test reproducibility in relation to identification. International Journal of Systematic Bacteriology 24, 508-523.
SNEATH, P. H. A. (1978). Identification of micro- organisms. In Essays in Microbiology, pp. loll- 10/32. Edited by J. R. Norris & M. H. Richmond. Chichester : Wiley.
SNEATH, P. H. A. (1979~). BASIC program for identifica- tion of an unknown with presence-absence data against an identification matrix of percent positive characters. Computers & Geosciences 5, 195-21 3.
SNEATH, P. H. A. (19796). BASIC program for character separation indices from an identification matrix of percent positive characters. Computers & Geosciences 5, 349-357.
SNEATH, P. H. A. (1980~). BASIC program for the most diagnostic properties of groups from an identifica- tion matrix of percent positive characters. Computers & Geosciences 6, 21-26.
SNEATH, P. H. A. (19806). BASIC program for determin- ing the best identification scores possible from the most typical examples when compared with an identification matrix of percent positive characters . Computers & Geosciences 6, 27-34.
SNEATH, P. H. A. (1980~). BASIC program for determin- ing overlap between groups in an identification matrix of percent positive characters. Computers & Geosciences 6, 267-278.
SNEATH, P. H. A. & JOHNSON, R. (1972). The influence on numerical taxonomic similarities of errors in microbiological tests. Journal of General Microbi- ology 72, 377-392.

Iden t ijica t ion of st rep tomy cetes 133
SNEATH, P. H. A. & SOKAL, R. R. (1973). Numerical Taxonomy : the Principles and Practice of Numerical Class@cation. San Francisco: W. H. Freeman.
VICKERS, J. C., WILLIAMS, S. T. & R m , G. W. (1984). A taxonomic approach to selective isolation of streptomycetes from soil. In Biological, Biochemical and Biomedical Aspects of Actinomycetes, pp. 553- 561. Edited by L. Ortiz-Ortiz, L. F. Bojalil & V. Yakoleff. Orlando: Academic Press.
WAYNE, L. G., KRICHEVSKY, E. J., LOVE, L. L., JOHNSON, R. & KRICHEVSKY, M. I. (1980). Taxo- nomic probability matrix for use with slowly- growing mycobacteria. International Journal of Syste- matic Bacteriology 30, 528-538.
WILLCOX, W. R., LAPAGE, S. P., BASCOMB, S. & CURTIS, M. A. (1973). Identification of bacteria by computer: theory and programming. Journal of General Microbiology 77, 3 17-330.
WILLIAMS, S. T., GOODFELLOW, M., ALDERSON, G., WELLINGTON, E. M. H., SNEATH, P. H. A. &SACKIN, M. J. (1983~). Numerical classification of Strepto- myces and related genera. Journal of General Micro- biology 129, 1743-1813.
WILLIAMS, S. T., GOODFELLOW, M., WELLINGTON, E. M. H., VICKERS, J. C., ALDERSON, G., SNEATH, P. H. A., SACKIN, M. J. & MORTIMER, A. M. (1983 b). A probability matrix for identification of some streptomycetes. Journal of General Microbiology 129,
WILLIAMS, S. T., Loccr, R., VICKERS, J. C., SCHOFIELD, G. M., SNEATH, P. H. A., & MORTIMER, A. M. (1985). Probabilistic identification of Streptouerti- cillium species. Journal of General Microbiology 131,
1815-1830.
168 1-1689.