Detecting Changes in Coastline in United States and Malaysia
64
RNI: DELENG/2005/15153 RNI: DELENG/2005/15153 No: DL(E)-01/5079/14-16 No: DL(E)-01/5079/14-16 Publication: 15 Publication: 15 th th of every month of every month Licensed to post without pre-payment Licensed to post without pre-payment U(E) 28/2014-16 U(E) 28/2014-16 Posting: 19 Posting: 19 th th /20 /20 th th of every month at NDPSO of every month at NDPSO Rs.100 Rs.100 Volume X, Issue 09, September 2014 THE MONTHLY MAGAZINE ON POSITIONING, NAVIGATION AND BEYOND ISSN 0973-2136 ISSN 0973-2136 SDI • Navigation • GIS SO YOU THINK YOU ARE SAFE Safety, Confidentiality and Integrity of PNT information is important
-
Upload
kampalainternationalwc -
Category
Documents
-
view
2 -
download
0
Transcript of Detecting Changes in Coastline in United States and Malaysia

RNI: DELENG/2005/15153RNI: DELENG/2005/15153 No: DL(E)-01/5079/14-16No: DL(E)-01/5079/14-16Publication: 15Publication: 15thth of every month of every month Licensed to post without pre-payment Licensed to post without pre-payment U(E) 28/2014-16U(E) 28/2014-16Posting: 19Posting: 19thth/20/20thth of every month at NDPSO of every month at NDPSO Rs.100Rs.100
Volume X, Issue 09, September 2014 THE MONTHLY MAGAZINE ON POSITIONING, NAVIGATION AND BEYOND
ISSN
0973-2
136
ISSN
0973-2
136
SDI • Navigation • GIS
SO YOU THINKYOU ARE SAFE
Safety, Confi dentiality and Integrity of PNT information is important
SD34_CMPL_September 2014.indd 1SD34_CMPL_September 2014.indd 1 02/09/14 8:00 am02/09/14 8:00 am

Count On It
©2014, Trimble Navigation Limited. All rights reserved. Nikon is a registered trademark of Nikon Corporation.
All other trademarks are the property of their respective owners.
Nikon QualityNik Q litThere are things you can count on in this world. The sun will rise, taxes will be levied,
surveyors will be working, and Nikon total stations will be right there with them day
after day. Your customers count on you and surveyors have always relied on Nikon
total stations to provide quality results.
Nivo™o C Series features a Windows CE touchscreen interface and powerful
Survey Pro, Layout Pro and Survey Basic field software.
Nivo M Series uses the intuitive, easy to learn Nikon onboard field software.
NPL-322 and DTM-322 Series offer economical choices with Nikon quality
and precision.
Nikon surveying equipment provides precise results day in and day out. Visit
www.spectraprecision.com to choose the model that is right for you. Your jobs.
Your choice.
Simply Nikon Quality
AMERICAS
Spectra Precision Division10368 Westmoor Drive
Westminster, CO 80021, USA
+1-720-587-4700 Phone
888-477-7516 (Toll Free in USA)
EUROPE, MIDDLE EAST AND AFRICA
Spectra Precision DivisionRue Thomas Edison
ZAC de la Fleuriaye - CS 60433
44474 Carquefou (Nantes), France
+33 (0)2 28 09 38 00 Phone
ASIA-PACIFIC
Spectra Precision Division80 Marine Parade Road
#22-06, Parkway Parade
Singapore 449269, Singapore
+65-6348-2212 Phone
NPL-322NPL 322DTM-322
Nivo MSerieses
Nivo CNi CSeriesS
Visit www.spectraprecision.com for
the latest product information and
to locate your nearest distributor.
SCAN THIS CODE FOR MORE INFORMATION
SD27_CMPL_Nikon_Feb_Ad_AS.indd 1 28/08/14 11:41 pmSD34_CMPL_September 2014.indd 2SD34_CMPL_September 2014.indd 2 02/09/14 8:00 am02/09/14 8:00 am

© Copyright 2014, Trimble. All rights reserved. All other trademarks are the property of their respective owners. TPC095 (06/14)
www.trimble.com/gnss-inertial
Trimble GNSS OEM
Simplified Integrationwith single-board GNSS + Communications.
By integrating UHF or WiFi/Cellular communications on the same module, the task of receiving RTK corrections is significantly
simplified — speeding integration and development times.
Trimble BD920-WG360mm x 55mm x 19mm
GNSS RTK receiver module with WiFi/Cellular modem
Trimble BD930-UHF60mm x 55mm x 15mm
GNSS RTK receiver module with UHF receiver
Booth H
SD34_CMPL_Trimble-ION GNSS_Sep_Ad_AS.indd 1 20/08/14 9:06 pmSD34_CMPL_September 2014.indd 3SD34_CMPL_September 2014.indd 3 02/09/14 8:00 am02/09/14 8:00 am

Articles
So you think you are safe E THEUNISSEN 10 When two do the same thing DEÁK PETER 18 EDAS: EGNOS data over the internet for added value services ELISABET LACARRA, PEDRO GÓMEZ, JUAN VÁZQUEZ AND MIGUEL ÁNGEL SÁNCHEZ 37
Detecting Changes in Coastline in United States and Malaysia LAWAL ABDUL QAYOOM TUNJI, KAMARUZAMAN WAN
YUSOF AND AHMAD MUSTAFA HASHIM 46
This issue has been made possible by the support and good wishes of the following individuals and companies Ahmad Mustafa Hashim, Deák Peter, E Theunissen, Elisabet Lacarra, Helder Delfi no, Jim Baumann, Jim Williams, Juan Vázquez, Kamaruzaman Wan Yusof, Lawal Abdul Qayoom Tunji, Miguel Ángel Sánchez, and Pedro Gómez; Antcom, Effi gis, Foif, GGS, HiTarget, Javad, MicroSurvey, Navcom, Nikon, NovAtel, Pentax, Riegl, Rohde & Schwarz, Supergeo, Trimble, and many others.
COLOPHON AND CONTENTS
Mailing Address
A 002, Mansara Apartments
C 9, Vasundhara Enclave
Delhi 110 096, India.
Phones +91 11 22632607, 98102 33422, 98107 24567
Fax +91 11 22632607
[information] [email protected]
[editorial] [email protected]
[advertising] [email protected]
[subscriptions] [email protected]
Web www.mycoordinates.org
In this issueCoordinates Coordinates Volume 10, Issue 09, September 2014
Coordinates is an initiative of cGIT that aims to broaden the
scope of positioning, navigation and related technologies.
cGIT does not neccesarily subscribe to the views expressed
by the authors in this magazine and may not be held
liable for any losses caused directly or indirectly due to the
information provided herein. © cGIT, 2014. Reprinting with
permission is encouraged; contact the editor for details.
Annual subscription (12 issues) [India] Rs.1,200
[Overseas] US$80
Printed and published by Sanjay Malaviya on behalf of
Centre for Geoinformation Technologies at A221 Mangal
Apartments, Vasundhara Enclave, Delhi 110096, India.
Editor Bal Krishna
Owner Centre for Geoinformation Technologies
Designed at Spring Design ([email protected])
Printer Thomson Press India Ltd., B 315, Okhla Phase I,
New Delhi - 110020, India
This issue of Coordinates is of 64 pages, including
cover.
Columns
My Coordinates EDITORIAL 6 His Coordinates JIM WILLIAMS 8 HELDER DELFINO 9 Conference UN-GGIM 26
ESRI USER CONFERENCE 28 News SNIPPETS 53 GALILEO UPDATE 54 UAV 54 LBS 56 IMAGING 57 GNSS 58 GIS 59 INDUSTRY 60
Mark your calendar SEPTEMBER 2014 TO JULY 2015 62
SD34_CMPL_September 2014.indd 4SD34_CMPL_September 2014.indd 4 02/09/14 8:00 am02/09/14 8:00 am

Gain perspective in real-world GNSS simulationThe GNSS simulator in the ¸SMBV100A vector signal generator
www.rohde-schwarz.com/ad/smbv-gnss
¸SMBV-GNSS
September_013_Rhode and Schwarz_Ad_AS.indd 1 04/09/13 2:46 PMSD34_CMPL_September 2014.indd 5SD34_CMPL_September 2014.indd 5 02/09/14 8:00 am02/09/14 8:00 am

ADVISORS Naser El-Sheimy PEng, CRC Professor, Department of Geomatics Engineering, The University of Calgary Canada, George
Cho Professor in GIS and the Law, University of Canberra, Australia, Professor Abbas Rajabifard Director, Centre for SDI and Land
Administration, University of Melbourne, Australia, Luiz Paulo Souto Fortes PhD Associate Director of Geosciences, Brazilian Institute of
Geography and Statistics -IBGE, Brazil, John Hannah Professor, School of Surveying, University of Otago, New Zealand
MYCOORDINATES
Galileo 5 and 6, the pair of Galileo satellites,
Were launched on Aug 22, 2014.
Instead of the expected circular orbit.
They were released on a lower and elliptical orbit,
Although the ‘wayward’ satellites are said to be safely under control,
Studies are being conducted to determine
The scope of the anomaly
And its impact on the mission
Are yet to be determined,
Does it mean that use of these satellites
For its planned potential
Now doubtful?
Let us hope that Galileo remain on track.
Bal Krishna, [email protected]
Lost its way
6 | CoordinatesCoordinates September 2014
SD34_CMPL_September 2014.indd 6SD34_CMPL_September 2014.indd 6 02/09/14 8:00 am02/09/14 8:00 am

Viewing your survey network in Google Earth is just one of many new features in STAR*NET 8.1.
New in 8.1: Visually identify regions with lower redundancy without
analysis, correct distances without tedious calculations, and
immediately confirm whether your traverses fall within the maximum
allowable tolerances—all with STAR*NET 8.1.
Download a free demo from our website: www.microsurvey.com
GooGooglegleg EaEarthth isss a a regre ists eree d trada emam rk k of Googlegl Inc.c
® M® icroSurvey is registered in the U.S. Patent and Trademark Office by
MicroSr urvey y Software Inc. MicroSurvey is partr of Hexagon.
SD34_CMPL_MicroSurvey_Sep_Ad_AS.indd 1 28/08/14 11:20 pmSD34_CMPL_September 2014.indd 7SD34_CMPL_September 2014.indd 7 02/09/14 8:00 am02/09/14 8:00 am

Great produc ts and services are only part of the formula for successSays Jim Williams, Sales Director, NavCom Technology Inc., in an interview with Coordinates
Which are the regions where Business Partners have been crucial in taking the NavCom Technology torch forward?
NavCom off ers our products and services through a network of over 40 authorized resellers and OEM rela onships in 25 countries. Our sales channel partners are the key to our sales success as well as a core element of our product improvement and development process. Our resellers know their respec ve markets and customer needs. This allows them to provide us mely, cri cal feedback on our products and business prac ces. Based on their comments and sugges ons we
con nuously reassess the features of our
current product line up as well as the
capabili es of our next genera on
of products. Great products and services are only part of the formula for success. A mo vated,
capable, and respected sales team is the other crucial
requirement and we believe we have that in our current family of authorized
resellers and OEM partners.
Of all the products which are available from NavCom, which are the ones that are most popular in emerging markets in Asia, Africa and South America?
Our LAND-PAK product line has been very well received in South East Asia and La n America. The lack of reference networks and limited GSM coverage in these regions provides a great market for a UHF – RTK land survey systems. However, since LAND-PAK also includes life me access to our StarFire GNSS correc on service, a 3-year warranty, and numerous customiza on features it is especially well received in these emerging markets. For those same reasons we are seeing substan al interest in our products in various parts of Africa and, as such, are ac vely seeking sales channel partners there. Learn more about how to become an authorized NavCom dealer at www.navcomtech.com
Could you please elaborate on the StarFire™ Network for our readers?
StarFire is a global augmenta on service found only in NavCom developed GNSS receivers. We have been promo ng its performance and suitability for mul ple precise posi oning applica ons since its launch in 2000, during which me it has transi oned from a regional service
off ering 25cm accuracy to a global service off ering 5cm accuracy. The StarFire network is in a constant state of evolu on and as well as improved posi on accuracy we have focused on strengthening the resilience of the network, improving its availability and adding addi onal constella on support. The augmenta on signals are available to end-users over-the-air via L Band satellite transmission and also via terrestrial networks that support Ethernet for markets with low eleva on look angles which suff er from equatorial satellite shading. This capability (StarFire Over IP), along with other innova ons such as RTK-Extend, Quick Start, and Rapid Recovery, con nue to expand the opera ng environment for end users in their never ending search to streamline produc vity.
Improving end user produc vity and accuracy is what this business is all about. In products like our LAND-PAK system, developing markets are able to drama cally improve lower-level survey quality projects, such as property boundary surveys, at signifi cantly lower equipment and opera ng costs u lizing StarFire services standalone. Where a higher degree of accuracy and repeatability are required, StarFire can augment tradi onal RTK systems to provide extended RTK performance in marginal areas of RTK radio signal coverage, which reduces opera ng costs by not having to establish a new base posi on. StarFire is literally changing how industry gets the job done.
INTERVIEWS
SD34_CMPL_September 2014.indd 8SD34_CMPL_September 2014.indd 8 02/09/14 8:00 am02/09/14 8:00 am

What is the signifi cance of the LAND-PAK Survey System in the Brazilian market?
In the 1990’s there was a great change in the Brazilian Geo-technology market, with the introduc on of Total Sta ons, subs tu ng the products that were available at the me. In the 2000´s, there was yet another transforma on in the market with the introduc on of the GPS L1/L2. During the 2010´s we had a new and upcoming GPS and RTK user community. By the years 2013 and 2014, there was a na on-wide spread of RTK equipment use, due to the crea on of an RTK user community in the Brazilian market. LAND-PAK possesses strong technological diff eren als and has assumed an important role in the growth and use of RTK for survey applica ons; since there were more than 150 pairs of LAND-PAK inserted into the Brazilian market last year alone.
What features and benefi ts does NavCom off er that diff eren ates it from others?
NavCom equipment diff eren ates itself from other exis ng equipment for the following reasons:
• Excellent cost/benefi t rela onship• High reliability and ease of opera on• Unique product capabili es such
as a Life me Starfi re License and RTK-X technology
• Excellent support to clients that purchased equipment through Topomap; the main LAND-PAK dealer in Brazil
How is NavCom’s LAND-PAK system changing the industry in the Brazilian market?
The topography industry has been evolving quickly. LAND-PAK was introduced in Brazil with an excellent cost/benefi t rela onship, which facilitated its acquisi on by Topography companies. The inclusion of StarFire, RTK Extend along with other features has increased the desire to adopt RTK technology in Brazil. The increased use of RTK in this industry created the necessity to retrain the
technicians involved, as to strengthen the technical knowledge of these professionals. This resulted in lower produc on costs and increase in produc vity of such professionals, thus crea ng new job opportuni es and raising profi tability of Topography companies. Today, the mapping data produced using RTK presents more accuracy, which results in a higher reliability of topographic survey u lizing GPS.
Can you explain a specifi c challenge that
the LAND-PAK system helped you overcome?
Recently, LAND-PAK was u lized in the survey of the rails in the Norte-Sul railroad. They needed a quick survey of the rails, and the Starfi re global augmenta on signal capability was used for this purpose elimina ng the need for base sta on set-up, thereby saving considerable me for the end user.
Approximately 700 km were surveyed during 3 days in the fi eld.
m’s
temg the
y in the n market?
raphy industry y haas sing quickly. LLANAND-D-trt odducede inn BrBrazazillilceceellenent t cocostst/b/benenefiefifittpp, whwhicch h fafacic lilitatateteddoonn byby TTopopogograraphphp y y .. TTTThehehehe iiincncncn lululusisisisionononon ooof f f
TTK Extend aloongng wwwitith h ururesess hhhhhasasasasss iiiincncncncrereeasasededd tthhhehheeddoppt t RTRTRTRR K K K tetechchc nonononololooooogyggyghehhehehe iiiincncnncncnccrerererrr asasasasededededdd uuseseee oooooff ffinininindudududduustststtsts ryryryryryy ccccccrererereataaatttedededeitititittyyy yy y yy tttotototootototototo rrrrrretetettetetrrararaaininin tttthehehehehe
accuracy, which results in a higher reliability of topographic survey u lizing GPS.
Can you explain a specifi c challenge that
the LAND-PAK system helped you overcome?
ReRReRececec ntlyy, LAL ND-PAKKAKAKwawawaas sss uuuu llizizedededd iiiinn n n ththththe e susususurvrvrvrveyeyeyey ooff f thththe e rarailils s inini ttheheNoNoNoNortrtrtrte-e-e-e-SuSuSuSullllrarararaililroroadad.ThTheyeynenneedededededded aaa qqq iuiu ckkcksususurvrveyey ooof f tht e e e e rarararaaillilillllillss,s,s,s,ss,s,aananndddd thththhththeee e e StStSttStS ararararfifi fi fififirererereglgllggglobobo alallal aaaaugugugugggggmememememm ntntntnn aaa oooooon nnnnnsisis gngngngngngnalall cccapapapappabababababbililililititititty y y y wawawawawaas ss usussususededededefofofofofofofofofofoffor r rrrr thththhththisisisis ppppurururururppoppopppooosesesesss eeeeeelilililimimimiiiiminanaaa ngnngngngngththththttthe ee eeee neneneeededededededed ffffororor bbbasaaa eestststaaa ooon nn seseset-t-ttt-ttt upuuupp, , ththththhherererr bbebebbeby yyyysaaasas vivivv ngngnngg ccononsisidederaaablblbbb eeeeee memmemee fffororor ttttthehehehehehe eeeeeeenndnddndndd uuuuuussseseser.r.rr.r.
ApApApApprrprprooxoooxoximimmmmmatatatateleeleleee yyy y yy 70707070707 0 0 000 kmkmmmmwwwwewweweewwewwwwewewewew rereerererererrre ssssssssurururururrvevevvvvveyeeyedd d dudddduddu iriririrririnnngngg333 3 daddaddaddayysys iiinn ththe fi fifieleld.d.
LAND-PAK possesses s trong tec hnological differentialsSays Helder Delfi no, Owner, Topomap, about poten al of LAND-PAK Survey System in the Brazilian Market
ggggg yyyyy
TESTIMONIAL“LAND-PAK has become our principal product. Our clients are completely happy with its quality, durability, and ease of opera on. Topomap is very happy to have contributed to the crea on of an RTK user community in Brazil, above all, with equipment of such an excellent quality.”
- Helder Delfi no, Owner-Topomap, Brazil
SD34_CMPL_September 2014.indd 9SD34_CMPL_September 2014.indd 9 02/09/14 8:00 am02/09/14 8:00 am

GNSS
When looking at the timeline of technology of today’s consumer
electronics, there are several interesting connections with technology and associated infrastructure originally (at least partly) developed in the cont ext of DoD funded projects. Large-scale integration of this technology into consumer electronics created an economy of scale that is unmatched, enabling capabilities and services that otherwise may have been prohibitive due to cost. Besides being used in consumer electronics from a perspective of economic necessity, society has become strongly dependent on the continuous availability of the associated infrastructure. Although twenty years ago potential vulnerabilities were deemed as unrealistic, today we know different, and some of the lessons learned have been very expensive.
Except perhaps for the last statement, this discussion could have been about the GPS infrastructure made up by satellites, and the GPS receiver technology used in a wide variety of products with the information used for a wide variety of services (Certain applications only use the timing information). However, the discussion concerned the information infrastructure commonly referred to as the ‘Internet’ and the technology to access and transfer data and to manage and coordinate transactions. An important commonality between the two domains is the requirement that the data used is not interfered with. This article discusses the reliance on the technology and infrastructure from a safety perspective, and identifi es trends that could contribute to a reduction in safety.
It is likely that when asked, most people will confi rm that safety is important. However, when asked to defi ne safety, it is unlikely that a single defi nition will result. To obtain a workable and acceptable defi nition for the purpose of the discussion in this article, some defi nitions are reviewed.
The fi rst one (source Wikipedia) is: ‘The condition of being protected against Physical, Social, Spiritual, Financial, Political, Emotional, Occupational, Psychological, Educational or other types or consequences of: Failure, Damage, Error, Accident, Harm, or any other event which could be considered non-desirable’. Many of the causes of unsafety mentioned in this defi nition are related to one another: A design error can result in a fault that leads to a failure. A resulting accident can cause damage and harm (which can have a physical nature, but also fi nancial, political and psychological). Important to notice is that victims may never have felt ‘unsafe’ until the harm occurred. The safety referred to in this latter context is a perception (The perceived or subjective safety, which refers to the users’ level of comfort and perception of risk, typically does not consider standards or safety history. If such a perception is unwarranted, safety is an illusion).
A more engineering oriented defi nition of safety is: The control of recognized hazards to achieve an acceptable level of risk (In this context, risk is defi ned as ‘The probability of something happening multiplied by the resulting cost if it does’). Key in this defi nition is that safety requires awareness of vulnerabilities and the specifi cation of their acceptability. To prevent an (unjustifi ed) illusion of safety, awareness of all hazards, threats (A threat is a method of triggering a risk event) and vulnerabilities is required. In response to the identifi ed risk, several types of mitigation can be pursued. Engineering and regulation are two of the most common.
Information integrity and continuity
Both communication and navigation rely on information. In the communication domain, safety is addressed through
So you think you are safeAbout (mis)perceptions, unwarranted assumptions and unintended capabilities
Prof Dr ir E TheunissenNetherlands Defence Academy, Den Helder, The Netherlands
It would be most
unfortunate if those
responsible for safety are
unaware of the existing
and emerging threats or
underestimate them, and
as a result do not see
the need for the required
coordinated engineering
responses and regulation
10 | CoordinatesCoordinates September 2014
SD34_CMPL_September 2014.indd 10SD34_CMPL_September 2014.indd 10 02/09/14 8:00 am02/09/14 8:00 am

information security, comprising confi dentiality, integrity, and availability. Safe navigation relies on continuity in the accuracy and integrity of the position data. Safe navigation also relies on traffi c management, in which the surveillance function has to provide position data of all traffi c, with high accuracy and integrity. Clearly, information integrity and continuity is critical for aviation safety. In the Required Navigation Performance (RNP) concept [1, 2, 3], the target level of safety is achieved by specifying performance in terms of accuracy, integrity, availability and continuity. Future Concepts of Operation (ConOps) developed under SESAR [4] and Nextgen [5] programs foresee an increased reliance on GNSS-based position estimation, both for aircraft navigation function and for the surveillance function. When considering operations that are specifi cally enabled by the GNSS, the possible causes and effects of a loss of integrity and continuity on safety need to be identifi ed and analyzed. Based on the outcome, mitigation strategies and/or back-up systems may need to be designed and put in place.
Vulnerabilities
Both in the communication and navigation domain, security (Security: The degree of resistance to, or protection from, harm) vulnerabilities exist that threaten the information continuity and integrity. On the Internet, so-called Distributed
Denial of Service (DDoS) attacks can disrupt information availability, while IP-spoofi ng-based Man-in-the-Middle (MitM) attacks threaten information integrity. The timeline in Figure 1 illustrates how these threats evolved over the past 20 years.
As early as 1989, a vulnerability due to the possible sequence prediction in the transmission control protocol was discussed [6]. Although deemed unlikely by the experts at that time, 5 years later this vulnerability was exploited by Kevin Mitnick to break in to Tsutomu Shimomura’s computers in San Diego. Due to several books and reports written about this break-
in [7], it serves as a useful warning that the barriers that need to be overcome to exploit vulnerabilities in a system are not cast in stone. Once a vulnerability is known, more and different means to exploit it are likely to be developed. As a result, the original assessment of the likelihood that a particular vulnerability will be exploited may lose its validity. This applies equally well to GPS vulnerabilities, and should always be considered, especially in case safety depends on it. To prevent an unjustifi ed perception of security, any (expert) assessment that a particular vulnerability does not pose a threat should be accompanied with a well-supported rationale that both identifi es the underlying assumptions and indicates how their validity may change in the future.
Whereas, IP-spoofi ng as performed by Mitnick required considerable expertise, the proliferation of DDoS tools on the Internet (which started around 1997) provided anyone with an incentive the capability to harass a particular website by overloading it with requests. Although at the end of the Nineties of the previous century such events were still rather limited, their amount (and bandwidth) and their targets increased tremendously during the following decade. In the Netherlands alone, in 2014, the website of every major bank, most newspaper sites, websites from railways and airlines and several government websites suffered DDoS attacks.
Figure 1: Evolvement of DDoS and MitM threats from 1994 to 2014.
Figure 2: Evolvement of GPS jamming threats from 1994 to 2014
CoordinatesCoordinates September 2014 | 11
SD34_CMPL_September 2014.indd 11SD34_CMPL_September 2014.indd 11 02/09/14 8:00 am02/09/14 8:00 am

In the navigation domain, the equivalent to a DDoS attack is jamming. Although fi fteen years ago it was concluded that ‘there is no credible spoofi ng threat and jamming threats can be managed’ [8], the timeline in Figure 2 illustrates how the jamming threat has evolved during over the past 20 years:
In 1994, motivated by promising demonstrations using GPS to provide landing guidance, the Federal Aviation Administration (FAA) cancelled further development of the Microwave Landing System (MLS), which until then was the intended replacement of the Instrument Landing System (ILS). In 1995, the International Civil Aviation Organization (ICAO) followed by cancelling its mandate that in 1998 ILS should have been replaced by MLS. The underlying rationale was that GPS would soon provide the same capability at a much lower cost. To assess the risk of using GPS for landing guidance, a thorough analysis was performed by the Applied Physics Laboratory of John Hopkins University. Based on the requirements in [9], the analysis used a classifi cation matrix in which fi ve levels of likelihood of the identifi ed potential disturbance (Both intentional and unintentional disturbances) related failures (rows) and fi ve levels of their impact on safety (columns) provide a total of 25 possible combinations (Figure 3).
From a safety perspective, certain combinations of likelihood and impact are unacceptable (red cells 1-6 in the fi gure), whereas others were classifi ed as undesirable (yellow), as acceptable but with FAA review required (white) or as acceptable (green cells). The study clearly identifi ed that the potential for jamming existed, but at that time no combinations
of likelihood and consequences for cells 1 to 6 were identifi ed. After the 1999 risk assessment study, various other studies investigated the potential jamming and spoofi ng threats with varying assumptions about likelihood and impact of the threat [10]. Nowadays, due to the vastly increased amount of services relying on GPS and the vastly increased amount of jammers many of the early assumptions are no longer valid.
Regarding the intended replacement of ILS with GPS around the year 2000 (which was the basis for the cancellation of the MLS mandate), after more than $200 million in development effort, the FAA stopped further expenditures on the GPS Cat. 1 LAAS in January 2004. The good news is that ILS still provides safe landing guidance. The bad news is that the intended capabilities that a replacement system was to offer, such as curved and steep approach guidance to fl y noise abatement procedures, are not possible with ILS.
Although already in 2002 the hacker magazine Phrack published a schematic and software for a DIY GPS jammer, it still
took some time for GPS jammers to reach a ‘consumer electronics’ level. Nowadays, they are offered on various websites, often with a ‘privacy incentive’. In spite of the fact that sale, use or possession is forbidden in many countries, legislation alone may prove not to be enough. Similar to the tools needed to launch a DDoS attack on the Internet, GPS jammers are available to everyone with an incentive to do so. It is reported that in the UK alone, thousands of people are using GPS jammers, and near airports multiple jamming events per day have been detected.
Spoofi ng: Navigation warfare meets Cyber
On the Internet, tools to cause considerable mischief by means of DDoS attacks have been available for over 15 years. More recently, sophisticated tools to ‘explore’ Man-in-the-Middle attacks have emerged. Cybersecurity is the container term used for activities related to dealing with these threats in order to protect information confi dentiality, integrity and availability. Two important techniques to achieve cybersecurity comprise encryption and authentication. The lack of encryption in the civil GPS signal makes it particularly vulnerable to spoofi ng. However, compared to a MitM attack on the Internet, GPS spoofi ng requires a signal to be generated and synchronized with the actual signal before the spoofi ng can take effect. In research this is typically done by using a GPS signal simulator. An example is the research addressing questions concerning the required precision of the attacker’s spoofi ng signals [11].
With typical prices for a GPS signal simulator above 100k$, the spoofi ng threat may seem unlikely to happen. However, here too the barriers to be passed are reducing. Already in 2003, Logan Scott [12] warned that ‘rapid advances in computing power are making an all software implementation much more feasible’, followed by the warning that at some time in the future, ‘script kiddies using software downloaded from the Internet may mount a spoofi ng attack’. It does not seem to have happened yet, and one might argue
Figure 3: Hazard classifi cation scheme used in [8].
Both in the
communication and
navigation domain,
security vulnerabilities
exist that threaten the
information continuity
and integrity
12 | CoordinatesCoordinates September 2014
SD34_CMPL_September 2014.indd 12SD34_CMPL_September 2014.indd 12 02/09/14 8:00 am02/09/14 8:00 am

SD34_CMPL_Hi-Target_Sep_Ad_AS.indd 1 01/09/14 1:29 pmSD34_CMPL_September 2014.indd 13SD34_CMPL_September 2014.indd 13 02/09/14 8:00 am02/09/14 8:00 am

that this is unlikely to become a serious threat, but the same could be said about software to manufacture a gun. The latter will only become a hazard if the person planning mischief not only has Internet access but also a 3D-printer. Whereas in [12] the ‘all software implementation’ was still a prediction, fi ve years ago it was demonstrated that such a spoofer can be realized using an existing software-defi ned receiver with some extensions [13]. Since that time, various demonstrations have proven technical feasibility of a portable, low-cost, software defi ned spoofer.
The fact that it still may take some years for the spoofi ng threat to materialize can be regarded as temporarily good news for the nautical and aeronautical navigation functions relying on the position data, and for the power grids and secure fi nancial transactions that depend on accurate timing information. However, for the GNSS-based surveillance function relying on Automatic Dependent Surveillance Broadcast (ADS-B), there is another threat on the horizon: Like the civil GPS signal, the ADS-B messages that are broadcast by an aircraft are unencrypted. The associated potential vulnerability did not go by unnoticed in the hacker community. In 2007, at the DefCon Hackers conference, it was suggested that ‘one could easily fake an ADS-B transmission’ [14]. To prove the feasibility, an ADS-B out application was designed and implemented on GNU-radio [15], and in 2012 it was indicated that the ‘plan is to release the software’, which could lead to a scenario similar to the one predicted in [12]. That same year, at the industry-sponsored Black Hat Security conference, another presentation about ADS-B spoofi ng using a software defi ned radio setup was presented. The paper [16] describes the hardware and software to generate ADS-B targets, and concludes that the potential for Denial of Service on ATC fl ight-space resource and ADS-B IN aircraft exists. For IT specialists, the following assessment of ADS-B security made at the 2012 Black Hat security conference may be particularly insightful: ADS-B is almost like “ALL R/W with ‘Guest as Admin’ enabled”.
To stimulate discussions that lead to a better awareness of the potential security/
safety implications, in [17] an overview of and classifi cation of possible attacks on ADS-B is provided. In 2013, researchers from the University of Kaiserslautern in Germany, Armasuisse in Switzerland and the University of Oxford concluded that: ‘attacks on ADS-B can be inexpensive and highly successful’ followed by the conclusion that ‘any safety-critical air traffi c decision process should not rely exclusively on the ADS-B system’ [18]. In follow-on research that analyzed current approaches to deal with this issue [19], it is concluded that ‘solutions currently under consideration (and in use in practice such as multi-lateration) can only be a fill-in, providing a quick improvement to the security of the current system’.
The timeline in Figure 4 provides an overview of spoofi ng-related developments.
Interestingly enough, two years before experts concluded that there is no credible spoofi ng threat, in the 1997 James Bond Movie ‘Tomorrow Never Dies’ spoofi ng of GPS served as a major element in the plan of a villain to cause signifi cant havoc. Perhaps the movie was so unrealistic that it strengthened the opinion that in reality spoofi ng of GPS would be impossible. It was very fi tting that in 2013, Dr Humpreys actually used an 80M$ super-yacht to demonstrate feasibility of his 3k$ software-defi ned spoofer.
Dealing with the threats
Safety results from risk mitigation, which can comprise both engineering responses and regulation to deal with threats. In order to make the associated trade-off in a responsible way, the fi rst requirement is that hazards are actually recognized for what they are. This requires both recognition of the threats and their potential impact.
Step 1: Recognition
Jamming and spoofi ng threats may have seemed unwarranted, impossible, unlikely, too diffi cult to realize or technically infeasible in 1999. Given that nowadays anyone can buy a GPS jammer for about 30$ through a webstore, such optimism is neither justifi able nor affordable. Since 1999, society’s dependency on the availability of accurate position and timing information has increased signifi cantly. As a result, the consequence of a disruption will be far more severe than 15 years ago (power grids, fi nancial transactions, aircraft navigation, surveillance, etc).
Due to the developments in software defi ned radio and the increase in computing power, the barrier to be passed for both GPS and ADS-B spoofi ng in terms of investment, effort and experience has been lowered considerably. Nowadays, the type of GPS spoofi ng threat that was
Figure 4: Evolvement of GPS and ADS-B spoofi ng threats from 1994 to 2014
14 | CoordinatesCoordinates September 2014
SD34_CMPL_September 2014.indd 14SD34_CMPL_September 2014.indd 14 02/09/14 8:00 am02/09/14 8:00 am

predicted in 2003 is possible. Fortunately, the experts that have developed the required software did not release it to the general public. However, one should consider that the MP3 compression which was internally developed at the Fraunhofer laboratory was also not intended to be released. In the end, MP3 altered the landscape of the music industry. The possibility of ADS-B spoofi ng has been demonstrated both in Europe and the U.S.
Step 2: Identifi cation and Classifi cation
Similar to the fact that in 1989 few people would have expected how today’s society has become dependent on the Internet and how vulnerabilities have been exploited by criminals, it is unlikely that the experts involved in the 1999 GPS risk assessment study could have foreseen the proliferation of GPS jammers as (be it illegal) ‘consumer electronics’ and recent developments in the area of software defi ned spoofers. Whereas in the 1999 GPS risk assessment study, the classifi cation was only used to judge consequences related to the use of GPS as an aid to landing, the approach has a much broader applicability. Given today’s vastly increased dependence on satellite based position and timing information, a periodic vulnerability assessment using a classifi cation based on probability and consequence, combined with a rationale for the unacceptable combinations, should be part of any process in which systems rely on GPS or similar data, and the consequence of failure is in the category ‘major’ or worse.
Undeniably, the likelihood of occurrence of jamming and spoofi ng threats has
increased in the past 15 years. When looking how similar threats have increased on the Internet, there is not a single reason to assume it will not get worse. Figure 5 uses the matrix presented in Figure 3 to visualize the impact of these developments:
The vertical arrow represents the effect that due to the proliferation of jammers, the likelihood that disturbances occur has signifi cantly increased. The slanted arrow represents the effect of society’s increased use of and dependency on accurate position and timing information, also in critical infrastructure. Due to these two developments, both the
likelihood and the consequences of disturbances have become worse.
The impact of disturbances on consumer electronics will also have increased, but although consequences will be considered as a nuisance by the users, it is fair to say that in terms of safety these events belong in the category of ‘no effect’. Similarly, the impact of a local disturbance on a road-taxing system may have (minor) fi nancial consequences for the agency responsible for collecting the fees, but also has no effect on safety. On the other hand, it is not unlikely that people may be tempted to use jammers in an attempt to defeat a road taxing system. Depending upon which other infrastructure relying on GPS is also affected; the consequences may increase in severity. Suffi cient examples exist that this is already happening today.
Step 3: Mitigation
Jamming and spoofi ng are illegal. As indicated in the introduction, engineering and regulation are two of the most common options for risk mitigation. Regarding the latter option, an important question concerns which part of the threat can be ‘legislated’ away.
In his keynote address at the ENC 2014, Dr Parkinson addressed the question what actions can/should be taken to reduce vulnerability and ensure PNT availability [20]. His main recommendation was to ‘Protect the clear and truthful signal, Toughen user’s receivers and Augment or substitute PNT sources’, in short: PTA. An example of a local, alternative system that is being considered to guarantee PNT availability in the harbor of Rotterdam is eDLoran [21], which has demonstrated accuracies in the order of 5 meters. Regarding legislation, Dr Parkinson recommended the increase of current U.S. penalties for jamming (fi nes in the order of 12 k$) to those enforced in Australia (up to fi ve years imprisonment and/or fi nes approaching 1M$). In [22], a broader approach to the regulation is discussed and a range of required improvements to PNT governance are proposed. Whereas the proposed PTA approach focuses on PNT
Figure 5: Impact of the the increased dependency on PNT and the increase in likelihood of the threats.
Jamming and spoofing
threats may have seemed
unwarranted, impossible,
unlikely, too difficult
to realize or technically
infeasible in 1999.
Given that nowadays
anyone can buy a GPS
jammer for about 30$
through a webstore,
such optimism is neither
justifiable nor affordable
CoordinatesCoordinates September 2014 | 15
SD34_CMPL_September 2014.indd 15SD34_CMPL_September 2014.indd 15 02/09/14 8:00 am02/09/14 8:00 am

availability, solutions for the threat to integrity also have already been proposed over 10 years ago. In [12] a public key/private key authentication architecture is described for the low-rate data stream that would enable receivers to detect spoofi ng attempts from data contents, rather than from signal properties only.
A comparable encryption/authentication approach could also solve the issues related to ADS-B spoofi ng. In [23], encryption schemes and challenges associated with implementing confi dentiality security protections for the ADS-B environment are discussed. In [17], the continued development of so-called mode 5 level 2 ADS-B broadcasts (using encrypted channels) is suggested. In [19], it is recommended that: ‘for the creation of a long-term security solution in dependent air traffic surveillance, it makes sense to consider the impact of both secure broadcast authentication approaches as well as of secure location verification’.
Conclusion
This article started by identifying similarities in threats to information confi dentiality, integrity and availability on the Internet to those in the navigation domain. Once the associated technology and infrastructure reached the consumer electronics domain, the resulting economy of scale reduced cost dramatically. This enabled an unprecedented creation of services that rely on the availability of PNT information, often without the user’s awareness of the threat and potential consequences. Based on the similarities with the developments of threats to information availability and integrity on the Internet, there is no reason to hope that it will not get worse. Similar to the use of encryption and authentication techniques on the Internet, the use of such techniques holds great promise to assure integrity of PNT information. Also threats to PNT availability due to jamming have been recognized over many years, and several types of solutions have been proposed. It would be most unfortunate if those responsible for safety are unaware of the existing and emerging
threats or underestimate them, and as a result do not see the need for the required coordinated engineering responses and regulation as described in [20] and [22].
References1. ICAO (1995). Report of the Special
Communications/Operations Divisional Meeting, Document 9650.
2. RTCA (1997). Minimum Aviation System Performance Standards: Required Navigation Performance for Area Navigation.
3. Davis, J.M. and R.J. Kelley (1993). RNP Tunnel Concept for Precision Approach with GNSS Application. Proceedings of the ION 49th Annual Meeting, June 21-23, Cambridge, MA.
4. SESAR Consortium (2009). European Air Traffi c Management Master Plan – Edition 1.
5. JPDO (2010). “Concept of Operations for the Next Generation Air Transportation System”, Version 3.1.
6. Bellovin, S.M. (1989). Security Problems in the TCP/IP Protocol Suit. Computer Communications Review, Vol. 19, No. 2, pp. 32-48.
7. Shimomura, T. and J. Markoff (1996). Takedown: The pursuit and Capture of Kevin Mitnick, America’s Most Wanted Computer Outlaw. Hyperion, ISBN 9780786889136.
8. GPS Risk Assessment Study Final Report, January 1999 M8A01 Revised. The John Hopkins University – Applied Physics Laboratory, Laurel, MD.
9. 14 CFR 25.1309 – Equipment, Systems and Installations.
10. Vulnerability Assessment of the Transportation Infrastructure Relying on the Global Positioning System – Final Report, August 29, 2001. John A. Volpe National Transportation Systems Center.
11. Tippenhauer, N.O., C. Pöpper, K.B. Rasmussen and S. Čapkun (2011). On the Requirements for Successful GPS Spoofi ng Attacks. Proceedings of the 18th ACM Conference on Computer Communications and Security, October 17-21, Chicago, Il.
12. Scott, L. (2003). Anti-Spoofi ng & Authenticated Signal Architectures for Civil Navigation Systems. Proceedings
of the ION GPS/GNSS Conference, 9-12 September, Portland, OR.
13. Humpreys, T.E., B.A. Ledvina, M.L. Psiaki, B.W. O’Hanlon and P.M. Kitner Jr. (2009). Assessing the Spoofi ng Threat. GPS World, Vol. 20, No. 9, pp. 28-38.
14. Kunkel, R. (2009). Air Traffi c Control: Insecurity and ADS-B. Defcon 17, July 30 - August 2, Las Vegas, NV.
15. Haines, B. (2012). Hackers + Airplanes. No good can come of this. Defcon 20, July 26-29, Las Vegas, NV.
16. Costin, A. and A. Francillon (2012). Ghost in the Air(Traffi c): On insecurity of ADS-B protocol and practical attacks on ADS-B devices. Black Hat Conference, July 21-26, Las Vegas, NV.
17. McCallie, D.L. (2011). Exploring potential ADS-B vulnerabilities in the FAA’s NEXTGEN Air Transportation System. Air Force Institute of Technology, AFIT/IWC/ENG/11-09.
18. Schafer, M., V. Lenders and I. Martinovic (2013). Experimental Analysis of Attacks on Next Generation Air Traffi c Communication. In: Applied Cryptography and Network Security, pp. 253-271, Springer.
19. Strohmeier, M., V. Lenders, I. Martinovic (2014). On the Security of the Automatic Dependent Surveillance-Broadcast Protocol.
20. Parkinson, B. (2014). Assured PNT – assured world economic benefi ts. Keynote address at the European Navigation Conference, April 15-17, Rotterdam, The Netherlands.
21. Van Willigen, D., R. Kellenbach, C. Dekker and W. van Buuren (2014). eDLoran – next generation of differential Loran. Proceedings of the European Navigation Conference, April 15-17, Rotterdam, The Netherlands.
22. Goward, D.A. (2014). Position, Navigation, and Timing (PNT) Governance – Required Improvements. Proceedings of the European Navigation Conference, April 15-17, Rotterdam, The Netherlands.
23. Finke, C., J. Butts and R. Mills (2013). ADS-B encryption. Confi dentiality in friendly skies. Proceedings of the Eight Annual Cyber Security and Information Intelligence Research Workshop (CSIIRW).
16 | CoordinatesCoordinates September 2014
SD34_CMPL_September 2014.indd 16SD34_CMPL_September 2014.indd 16 02/09/14 8:00 am02/09/14 8:00 am

SD34_CMPL_FOIF_Sep_Ad_AS.indd 1 28/08/14 11:15 pmSD34_CMPL_September 2014.indd 17SD34_CMPL_September 2014.indd 17 02/09/14 8:00 am02/09/14 8:00 am

In 2014, the INSPIRE Directive had its seventh birthday and is undergoing
revision. During those seven years the Directive and its regulation were implemented into the national law of the EU states. Additions were made as well as numerous technical guidelines (TG) and other documents, which were designed to better explain individual requirements and assist in their implementation. These documents have recommendatory character. Despite this fact, the question arises ‘Has INSPIRE clearly defi ned rules?’
If we look at the INSPIRE Roadmap (Figure 1) [1], we can see that individual Member States, or more precisely their compulsory organizations should have metadata currently available for all themes of Annexes I, II and III, as well as for different types of services. Metadata should be discoverable through the discovery service. The data should be already available through view, download and transformation services that must already be in accordance with Commission Regulation (EC) No.
976/2009 of October 19, 2009, implementing Directive 2007/2/EC of the European
Parliament and of the Council as per the Network Services (EC No. 976/2009) [2]. It should be borne in mind also that the data may not currently be in accordance with Commission Regulation (EU) No. 1089/2010 of November 23, 2010 implementing Directive 2007/2/EC of the European Parliament and of the Council with regard to interoperability of spatial data sets and services (EU No. 1089/2010) [3].
Considering this fact, we would like to point out some differences in the different interpretations of individual requirements for the provision of data through the view services. Individual samples/demonstrations will cover selected themes of Annex I of the INSPIRE Directive, especially in the area of Central European countries. Individual view services were connected to the Map client ZBGIS®
(https://zbgis.skgeodesy.sk/tkgis/Default.aspx?lang=en) of the national mapping and cadastral agency (NMCA) in the Slovak Republic (SR) - Geodesy, Cartography and Cadastre Authority of the Slovak Republic (GCCA SR).
One of the themes of Annex I is Geographical Grid Systems (GGS). An interesting aspect of this theme is that TG
When two do the same thingView of the European directive INSPIRE and the implementation of its requirements in the Member States of the European Union (EU)
Figure 1: INSPIRE Roadmap Figure 2: Services for theme GGS
Deák PeterHead of department GIS and development projects, Research Institute of Geodesy and Cartography in Bratislava, Slovak Republic.
SDI
18 | CoordinatesCoordinates September 2014
SD34_CMPL_September 2014.indd 18SD34_CMPL_September 2014.indd 18 02/09/14 8:00 am02/09/14 8:00 am

itself says, “Geographical grid systems (hereafter: Grids) play a specifi c role that is quite different from the other themes in the Directive’s annexes. Contrary to the other themes, the Grids’ specifi cation does not concern a downloadable or viewable thematic data set.” [4]. Despite this fact, Slovakia (SR) and the Czech Republic (CZ) provided view services. Here, attention should be drawn to the fact that services were published before receiving the fi nal versions of TG for the themes of Annexes II and III. Today, we know that this theme has a link with the theme of statistical units (SU). Looking at Figure 2, we can see several differences.
Cartography of single cells is different. SR has brown and CZ has red cells for the same layer. The explanation is simple - TG itself does not have a chapter portrayal like other TG. In practice, it means that if individual organizations are providing these data, they can also design their own cartography, which could be confusing for users (Cartography is defi ned in the TG for theme SU). Furthermore, we can see that different services have different names of layers, and in addition, the Czech service provides the names of the cells. In a more detailed preview, we can see, that Czech service has ‘gaps’ in geometry, i.e., lines are not closed (Figure 3).
In case of another theme, i.e., Geographical Names (GN), the situation is somewhat different. The structure of layers is substantially the same, the difference is in the languages (Figure 4). Slovak and Czech services have the names of layers in the English language, while Poland used their national
Figure 3: GGS - Detail
Ultra high performing, extremely compact UAS LiDAR sensor
NEW RIEGL VUX®-1
www.riegl.com
ULS
Introducing the World´s first survey-grade UAS laser scanner!
The VUX®-1 is a compact and lightweight laser scanner for unmanned aerial missions. | weight approx. 3.6 kg | accuracy 10 mm | up to 550 kHz PRR | long measurement range | up to 200 scans/sec | 330° field of view | echo digitization & online waveform proces-sing | multiple target capability | multiple time around pro-cessing | parallel scan lines | various IMU integration options |internal data storage 240 GByte | data storage on external USBdevices | integrated LAN-TCP/IP interface | flexible, easysystem installation
RIEGL offers a whole family of proven Airborne Laser Scanner Systems& Engines for every purpose:LMS-Q1560 Dual Channel, High Performance, Fully Integrated Airborne LaserScanning SystemLMS-Q780 & LMS-Q680i High Altitude, High Speed Airborne ScannersVQ-820-G Topo-Hydrographic Airborne Scanner VQ-480i & VQ-480-U Compact & Lightweight Airborne Scanners, for helicopters & UAS other types on request
Intergeo 2014October 7-9, 2014Berlin | Germany
Hall 3.1, Booth A3.014
Visit us at
FOV330°
field of view (FOV) up to 330°
VUX®-1 mounted on UAS, e.g. Flying-Cam 3.0 SARAH
© F
lyin
g-C
am
compact and lightweight
3.6 kg
10 cm0 cm 20 cm 30 cm
RIEGL LMS GmbH, Austria | RIEGL USA Inc. | RIEGL Japan Ltd. | RIEGL China Ltd.
SD34_CMPL_RIEGL_Sep_Ad_AS.indd 1 21/08/14 6:18 pmSD34_CMPL_September 2014.indd 19SD34_CMPL_September 2014.indd 19 02/09/14 8:00 am02/09/14 8:00 am

language. Regarding cartography, TG says, “All names (i.e., all spellings of all names of the named place) are displayed in black, with font Arial 10 pt, and located in order to touch the geometry of the named place, at its centre if possible.” [5] Comparing the Czech and Slovak services, names are placed in the middle of reference point of the name, and the font is slightly different. If we look at the Polish service, the name is located to the right of the reference point and the font name coincides with Slovak.
Another theme of Annex I of the INSPIRE Directive is Administrative Units (AU) [6]. At fi rst sight it is evident to the user (Figure 5) that the structure of layers for each service is different. Slovak service provides four layers of administrative units and four layers of administrative boundaries - state, region, district and municipality). Similarly, it is the Czech service that additionally provides the name of the administrative unit. Polish service provides only one
layer, namely administrative units for the state level (The theme AU was by Commission Regulation (EU) No 1253/2013 of 21 October 2013 amending Regulation (EU) No 1089/2010 implementing Directive 2007/2/EC as regards interoperability of spatial data sets and services changed, where feature NUTSRegion was removed.). Other differences include the language used. In this case, three different languages were used - English, Slovak and Polish. In case of cartography, there is compliance with all services, but the difference occurs at the scale denominator restrictions. Figure 5 provides preview into data at a scale 1:1000000, where the Slovak service displays data up to the district level, and the Czech service only to the region level. Poland has only one layer.
Other themes of Annex I of the INSPIRE Directive are still more complicated. Concretely, it is Hydrography (HY) [7], Figure 6 and Transport Network (TN) [8], Figure 7. Even with these themes it
can be stated that the differences found in the previous themes are repeated here again – be it diversity in layers, languages, cartography or restrictions for scale denominators. In case of TN theme, four languages are used (English, Polish, Slovak and German). Slovak service provides only three layers that display information based on their geometry - polygons, lines and points. From individual layers it is not possible to fi nd out what a particular feature it is.
The following examples depict the situations at small scales. But how does it look in detail, at the borders of states? Figure 8 shows the point at the border of three countries at a scale 1:5 (difference between Slovakia and the Czech Republic is about 2 cm and between Slovakia and Poland approximately 20 cm).
Figure 9 at a scale of 1:5000 shows an example at the border between Slovakia and Poland for the theme TN. Here it is evident that when single lines are
Figure 4: View services for theme GN
Figure 6: Hydrography
Figure 5: Portrayal AU
Figure 7: Transport Network
20 | CoordinatesCoordinates September 2014
SD34_CMPL_September 2014.indd 20SD34_CMPL_September 2014.indd 20 02/09/14 8:00 am02/09/14 8:00 am

Refl ectorless WinCE Total Station
W-800
A truly integrated system
Digital Automatic Level
BL-100
Increase your Effi ciency!
Positioning SystemG3100-R1
Precision satellite surveying, with wireless communications
Refl ectorless Total Station w/built-in digital camera
R-2500DN
Capture the full picture!
www.pentaxsurveying.com/en/
TI Asahi Co., Ltd.International Sales Department4-3-4 Ueno Iwatsuki-Ku, Saitama-ShiSaitama, 339-0073 JapanTel.: +81-48-793-0118Fax: +81-48-793-0128E-mail: [email protected]
www.lawrenceandmayo.co.in
Lawrence & Mayo PVT. LTD.274, Dr. Dadabhai Naoroji Rd.Mumbai 400 001INDIATel.: +91 22 22 07 7440Fax: +91 22 22 07 0048E-mail: [email protected]
SD28_CMPL_Pentax_March_Ad_AS.indd 1 21-Feb-14 11:12:21 AMSD34_CMPL_September 2014.indd 21SD34_CMPL_September 2014.indd 21 02/09/14 8:00 am02/09/14 8:00 am
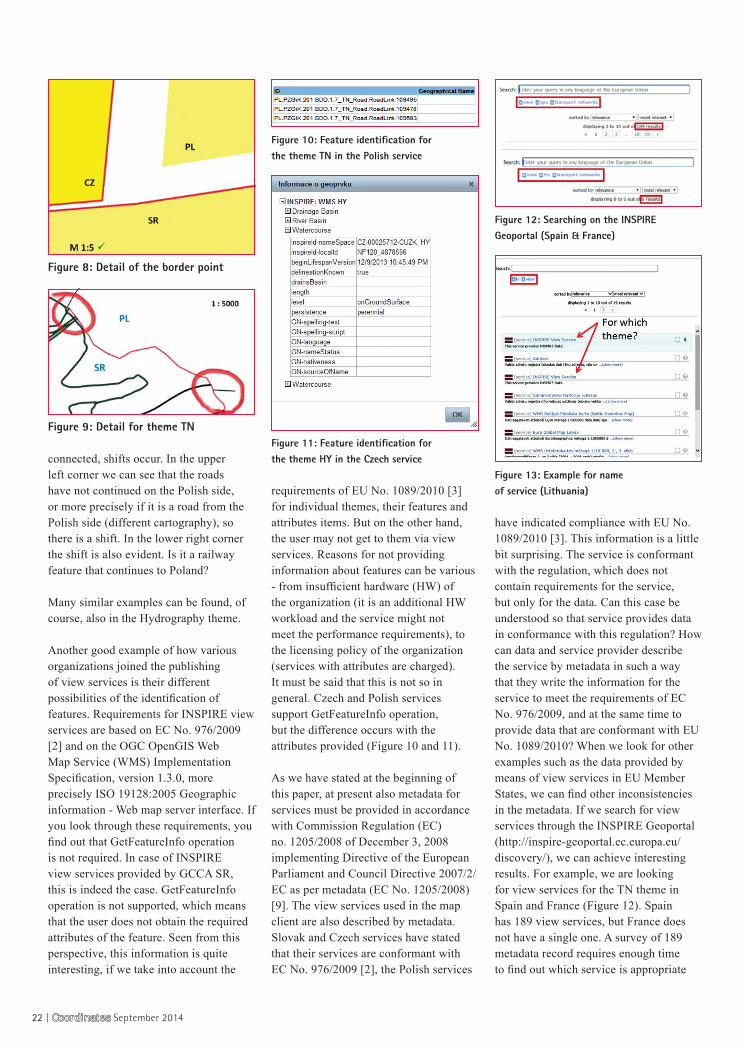
connected, shifts occur. In the upper left corner we can see that the roads have not continued on the Polish side, or more precisely if it is a road from the Polish side (different cartography), so there is a shift. In the lower right corner the shift is also evident. Is it a railway feature that continues to Poland?
Many similar examples can be found, of course, also in the Hydrography theme.
Another good example of how various organizations joined the publishing of view services is their different possibilities of the identifi cation of features. Requirements for INSPIRE view services are based on EC No. 976/2009 [2] and on the OGC OpenGIS Web Map Service (WMS) Implementation Specifi cation, version 1.3.0, more precisely ISO 19128:2005 Geographic information - Web map server interface. If you look through these requirements, you fi nd out that GetFeatureInfo operation is not required. In case of INSPIRE view services provided by GCCA SR, this is indeed the case. GetFeatureInfo operation is not supported, which means that the user does not obtain the required attributes of the feature. Seen from this perspective, this information is quite interesting, if we take into account the
requirements of EU No. 1089/2010 [3] for individual themes, their features and attributes items. But on the other hand, the user may not get to them via view services. Reasons for not providing information about features can be various - from insuffi cient hardware (HW) of the organization (it is an additional HW workload and the service might not meet the performance requirements), to the licensing policy of the organization (services with attributes are charged). It must be said that this is not so in general. Czech and Polish services support GetFeatureInfo operation, but the difference occurs with the attributes provided (Figure 10 and 11).
As we have stated at the beginning of this paper, at present also metadata for services must be provided in accordance with Commission Regulation (EC) no. 1205/2008 of December 3, 2008 implementing Directive of the European Parliament and Council Directive 2007/2/EC as per metadata (EC No. 1205/2008) [9]. The view services used in the map client are also described by metadata. Slovak and Czech services have stated that their services are conformant with EC No. 976/2009 [2], the Polish services
have indicated compliance with EU No. 1089/2010 [3]. This information is a little bit surprising. The service is conformant with the regulation, which does not contain requirements for the service, but only for the data. Can this case be understood so that service provides data in conformance with this regulation? How can data and service provider describe the service by metadata in such a way that they write the information for the service to meet the requirements of EC No. 976/2009, and at the same time to provide data that are conformant with EU No. 1089/2010? When we look for other examples such as the data provided by means of view services in EU Member States, we can fi nd other inconsistencies in the metadata. If we search for view services through the INSPIRE Geoportal (http://inspire-geoportal.ec.europa.eu/discovery/), we can achieve interesting results. For example, we are looking for view services for the TN theme in Spain and France (Figure 12). Spain has 189 view services, but France does not have a single one. A survey of 189 metadata record requires enough time to fi nd out which service is appropriate
Figure 8: Detail of the border point
Figure 9: Detail for theme TN
Figure 10: Feature identifi cation for the theme TN in the Polish service
Figure 11: Feature identifi cation for the theme HY in the Czech service
Figure 12: Searching on the INSPIRE Geoportal (Spain & France)
Figure 13: Example for name of service (Lithuania)
22 | CoordinatesCoordinates September 2014
SD34_CMPL_September 2014.indd 22SD34_CMPL_September 2014.indd 22 02/09/14 8:00 am02/09/14 8:00 am

For what purpose was INSPIRE Directive created? Who will primarily use the data and services? On the initial INSPIRE (http://inspire.ec.europa.eu/index.cfm) web page, it is the very fi rst sentence that reads – “In Europe a major recent development has been the entering in force of the INSPIRE Directive in May 2007, establishing an infrastructure for spatial information in Europe to support community environmental policies, and
EU sample metadata and services could be provided. These examples could serve as inspiration for providers. As for point no. 2, solution seems to be the transposition of chapter portrayal from TG to the EU Regulation No. 1089/2010 [3], which is legally binding. In this case, cartography would be uniform and there would be no differences. Finding solutions for points 3 and 4 are probably quite complicated. Given the diverse areas of EU countries, it is probably rather unrealistic to defi ne the scale denominator restrictions that would suit everyone. The same applies to the language used. The EU has 24 offi cial languages and the European Commission has no power to order that the INSPIRE data and services should use only one of them. Then in place are questions like:
for this kind of work. Another good example is from Lithuania (Figure 13) and fi nally once again Spain (Figure 14), where view service is even in conformance with EC No. 1205/2008 [9].
Findings and recommendations
What we have seen in previous demonstrations could be summarized as below:1) Differences in ‘tree structure’ of data 2) Differences in views (cartography) 3) Differences in scale
denominator restrictions4) Differences in languages 5) Differences in the provided attributes 6) Weaknesses in linking
data on the border 7) Weaknesses in metadata
We could also give a thought to possible solutions to these problems. For points 1 and 7, the solution may lie in the fact that in the framework of projects aimed at the issues of INSPIRE and funded by the
Figure 14: Example from Spain
SD33_CMPL_Antcom_Aug_Ad_AS.indd 1 01/08/14 5:45 pmSD34_CMPL_September 2014.indd 23SD34_CMPL_September 2014.indd 23 02/09/14 8:00 am02/09/14 8:00 am

policies or activities which may have an impact on the environment.” [10]. This implies that the data and services should be preferentially used by EU institutions, such as the European Environment Agency, Eurostat, etc. Thus, if we look at it this way, then the employees of these institutions that implement global environmental policies across the EU, should be preferentially multilingual and not experts on the issue. Another question to think about may also be the fact that organizations which provide INSPIRE services and data, in most cases provide data and services in their own data structures and in their own language too, as they were accustomed to do before INSPIRE. In these cases, we can say that these products go beyond the requirements of the Directive and are more convenient for users. This means that the INSPIRE data and services could be provided in one language, but of course, the decision rests with providers. The same decision can also be applied to the provision of attributes - point no. 5. In essence, if view service does not support identifi cation, we have ‘nice’ pictures. The question is ‘how can we use these services?’ If we consider the solution of point no. 6, from a technological point of view it is easy. Tools for removing, for example overlaps, holes, shifts in GIS software products already exist. But here are we talking about state borders wherein the fi rst place the conclusion of international agreements is expected? Such negotiations are not easy at all, and they certainly do not last a short time. Of course, here can also help the outcomes of international projects focused on this issue, where ‘best practices’ from various countries are collected. A good example can be the outputs of the project European Location Framework (ELF), which is represented by circa 30 organizations. Key stakeholder is an organization Eurogeographics (GCCA SR is member of Eurogeographics), more precisely NMCA.
Conclusion
Anyone who provides data and services for INSPIRE, read and follow the same
documents. Nevertheless, the results of individual solutions across Europe are different. Here an old familiar saying holds true- “If two do the same thing, this is not always the same.” We believe that the paper will contribute to increasing the knowledge of INSPIRE issues and stir up debate to avoid problems which the future may bring and contribute to their solutions.
The issue addressed in the paper was presented at the INSPIRE Conference 2014 which was held on June 16-20, 2014 in Aalborg, Denmark [11].
References[1] INSPIRE Roadmap [online].
[cit. 2014-08-07.] Available from: http://inspire.ec.europa.eu/index.cfm/pageid/44
[2] COMMISSION REGULATION (EC) No 976/2009 of 19 October 2009 implementing Directive 2007/2/EC of the European Parliament and of the Council as regards the Network Services [online]. [cit. 2014-08-07.] Available from: http://eur-lex.europa.eu/legal-content/EN/TXT/PDF/?uri=CELEX:02009R0976-20101228&from=EN
[3] COMMISSION REGULATION (EU) No 1089/2010 of 23 November 2010 implementingDirective 2007/2/EC of the European Parliament and of the Council as regards interoperability of spatial datasets and services [online]. [cit. 2014-
08-07.] Available from: http://eur-lex.europa.eu/legal-content/EN/TXT/PDF/?uri=CELEX:32010R1089&from=EN
[4] D2.8.I.2 DataSpecifi cation on GeographicalGridSystems – TechnicalGuidelines[online]. [cit. 2014-08-07.] Available from: http://inspire.ec.europa.eu/documents/Data_Specifi cations/INSPIRE_DataSpecifi cation_GG_v3.1.pdf
[5] D2.8.I.3 Data Specifi cation on Geographical Names – Technical Guidelines [online]. [cit. 2014-08-07.] Available from: http://inspire.ec.europa.eu/documents/Data_Specifi cations/INSPIRE_DataSpecifi cation_GN_v3.1.pdf
[6] D2.8.I.4 Data Specifi cation on Administrative Units – Technical Guidelines [online]. [cit. 2014-08-07.] Available from: http://inspire.ec.europa.eu/documents/Data_Specifi cations/INSPIRE_DataSpecifi cation_AU_v3.1.pdf
[7] D2.8.I.8Data Specifi cation on Hydrography – Technical Guidelines [online]. [cit. 2014-08-07.] Available from: http://inspire.ec.europa.eu/documents/Data_Specifi cations/INSPIRE_DataSpecifi cation_HY_v3.1.pdf
[8] D2.8.I.7Data Specifi cation on Transport Networks – Technical Guidelines[online]. [cit. 2014-08-07.] Available from: http://inspire.ec.europa.eu/documents/Data_Specifi cations/INSPIRE_DataSpecifi cation_TN_v3.2.pdf
[9] COMMISSION REGULATION (EC) No 1205/2008 of 3 December 2008 implementing Directive 2007/2/EC of the European Parliament and of the Council as regards metadata [online]. [cit. 2014-08-07.] Available from: http://eur-lex.europa.eu/legal-content/EN/TXT/PDF/?uri=CELEX:32008R1205&from=EN
[10] INSPIRE web site [online]. [cit. 2014-08-07.] Available from: http://inspire.ec.europa.eu/index.cfm
[11] INSPIRE conference 2014, Oral presentation[online]. [cit. 2014-08-07.] http://inspire.ec.europa.eu/events/conferences/inspire_2014/pdfs/18.06_6_14.00_Peter_De%C3%A1k.pdf
Anyone who provides
data and services for
INSPIRE, read and follow
the same documents.
Nevertheless, the
results of individual
solutions across
Europe are different
24 | CoordinatesCoordinates September 2014
SD34_CMPL_September 2014.indd 24SD34_CMPL_September 2014.indd 24 02/09/14 8:00 am02/09/14 8:00 am

SD33_CMPL_Trimble-Dimensions_Aug_Ad_AS.indd 1 29/07/14 4:07 pmSD34_CMPL_September 2014.indd 25SD34_CMPL_September 2014.indd 25 02/09/14 8:00 am02/09/14 8:00 am

CONFERENCE
The new Bureau to lead the United Nations Committee of Experts
on Global Geospatial Information Management (UN-GGIM) has been elected by the Member States. The election occurred as Ministers and senior leaders from UN Member States and international organizations attended the fourth session of the UN-GGIM from 6-8 August 2014 at the United Nations Headquarters in New York.
The Bureau members span the world of geographical thought, strategy and management. The Co-Chairs have been announced as: Dr Vanessa Lawrence CB from the United Kingdom, Dr Li Pengde from China, Dr Eduardo Sojo from Mexico. The Rapporteur was announced as Mr. Sultan Mohamed Alya from Ethiopia.
Upon re-election for a fourth year, Dr Vanessa Lawrence said “On behalf of the Co-Chairs, we accept our election as a great honour. We will do our best to fulfi l our work effi ciently and successfully to meet the objectives of UN-GGIM, on behalf of the Member States”.
At the forefront of their deliberations was an effort to set a clear path to enhance sustainable development across the world. One aspect of their work was the recognition of the growing requirement for more accurate measuring of the changing planet, down to millimetres. Such data will have enormous economic benefi ts since the data impacts on countries’ economies as well as their environments. At the same time, it was recognised that such improved data can only come through enhanced global co-operation.
Location-based services, based on for example the Global Positioning System (GPS), are becoming an expected fundamental requirement in many Member States, along with essentials like power and water. These all depend on a robust Global Geodetic Reference Frame (GGRF) being in place. During the meeting of UN-GGIM, a draft Resolution to support the
long term sustainability of the GGRF was agreed, and will now pass to the Economic and Social Council (ECOSOC); the United Nations’ central platform for refl ection, debate, and innovative thinking on sustainable development. The intent is for ECOSOC to then refer the Resolution to the UN General Assembly later in the year.
The Committee of Experts on Global Geospatial Information Management also calls for the adoption of common standards so that geospatial data can be seamlessly shared and used around the world. The adoption of standards for all geospatial information is driven by the needs of organisations, institutions and individuals to seamlessly share, integrate and use geospatial data. Standardization is behind the success of structures like the worldwide web and e-commerce.
The benefi ts of developing and implementing technical standards for geospatial information include uniformity, compatibility and interoperability. Thus millions of processes, devices and applications in all areas of the global economy can work together for the common good.
The absence of such standards has been proven to be harmful, for example in cases associated with disaster management.
The Committee of Experts on UN-GGIM recognized the important work done by three international standards development organisations: the Open Geospatial Consortium (OGC), Technical Committee 211 of the International Organization for Standardization (ISO/TC 211) and the International Hydrographic Organization (IHO).
Their guide, entitled Guide to the Role of Standards in Geospatial Information Management, lays down in very simple terms, some of the guidelines necessary for the adoption of common standards. The Committee of Experts recognises that different countries are at different stages of the journey towards standardization and so endorses a phased implementation – a structure laid out in the Guide. In addition a paper was tabled, co-authored by Ordnance Survey from the UK perspective and INEGI from the Mexican perspective, which explored how a national mapping authority can benefi t from the adoption of international standards.
The Secretariat of the UN-GGIM, in collaboration with the standards organizations, hosted a workshop side-meeting during the Fourth Session. This meeting briefed Member States on the essential standards, as well as the business value and good practice in adopting them.
The Committee of Experts considered the activities and the documents at their Session. There was considerable support for the documents and delegates proposed that the Guide should be published and promoted to assist Member States with making the case for use of standards. Only by Member States, organisations and institutions working together, through agreed international standards, can geospatial information really become the trusted and accessible resource that the world is increasingly demanding.
The Secretariat of the UN’s Committee of Experts on Global Geospatial Information Management (UN-GGIM) has also released two reports which look at different aspects of how
UN-GGIM calls for the adoption of common standardsFourth session of the UN-GGIM from 6-8 August 2014 at the United Nations Headquarters in New York
The benefits of developing and implementing
technical standards for geospatial information include
uniformity, compatibility and interoperability
26 | CoordinatesCoordinates September 2014
SD34_CMPL_September 2014.indd 26SD34_CMPL_September 2014.indd 26 02/09/14 8:00 am02/09/14 8:00 am

geospatial information can contribute to sustainable development in the post-2015 landscape. These were considered by the fourth session of the Committee of Experts on Global Geospatial Information Management in New York this month.
With post-2015 planning being central to the UN’s agenda, consideration of how geospatial data can help with everything from sustainable development to disaster risk reduction, comes at an opportune time.
The important role geospatial information can play in the post-2015 agenda is understood and accepted by everyone in the geospatial community, but the challenge is to ensure this is realised outside that community, so that the benefi ts can be gained.
Over the last year, Member countries of UN-GGIM reached out to as many UN initiatives, groups and events as possible to enhance the understanding and take-up of geospatial information and the
nature of the role it can play. The report gives a simple example. A satellite image may well identify fl ooded areas. What the image does not show is fl ood risk. To determine fl ood risk you need much more data covering aspects like historical fl ooding, the exposure of everything from people and buildings to infrastructure and their associated vulnerability. All of this contextual information and much more comes from fundamental geospatial data.
To promote this, UN-GGIM was actively involved in the Pacifi c Small Island Developing States Symposium, the World Bank Land and Poverty Conference and the Chengdu Forum on development and applications in urban hazard mapping. The events strongly concluded that the UN-GGIM had a vital role to play in both sustainable development and disaster risk reduction.
In the case of the event held in Chengdu, China, the importance of geospatial data was reinforced by the event having to be postponed because of a 7.0 magnitude
earthquake that hit the region just a few days before the Forum was due to begin. Despite all the valuable work so far, many people at the decision-making and policy level still do not fully understand the importance of geospatial information. This is particularly the case when planning for a future of sustainable development, yet the message from Dr Vanessa Lawrence CB, a Co-Chair of UN-GGIM is a simple and consistent one, “You cannot measure and monitor sustainable development over time in a consistent manner, without understanding place and location.”
The message is getting through in some places. Signifi cantly, the High Level Political Forum on Sustainable Development (HLPF) published their Prototype Global Sustainable Development Report in July this year and it explicitly recognises the potential of data - in this case remotely sensed data and other Big Data approaches – for assessing long term sustainable development progress.
Cre
atio
n B
igFi
sh-c
p.be
SD30_CMPL_Linertec_May_Ad_AS.indd 1 26/04/14 11:59 AMSD34_CMPL_September 2014.indd 27SD34_CMPL_September 2014.indd 27 02/09/14 8:00 am02/09/14 8:00 am

Arecord of more than 16,000 Esri users attended the company’s
weeklong annual Conference (Esri UC) and fi ve concurrent events in San Diego, California, this past July.
In his opening remarks, Esri president Jack Dangermond talked about how GIS can help create a better future. “Geography is now more important than ever,” said Dangermond. Before introducing the keynote speakers, he challenged all GIS users to “be the architects of the future.”
Dangermond demonstrated GeoNet, a new social network for the Esri community. He indicated that future ArcGIS releases would include greater use of crowdsourced data, advanced navigation capabilities, and innovative modeling functions. Recognition is a big part of the Esri UC. Royal Dutch Shell received the Enterprise GIS Award, while the City of Rancho Cucamonga earned the Esri President’s Award.
Plenary Speakers Set Conference Tone
Dr. Bruce Aylward, the assistant director-general for the World Health Organization’s Polio and Emergencies cluster, and Dr. Vincent Seaman, a senior program offi cer for the Polio Country Support Team at the Bill & Melinda Gates Foundation, spoke about polio eradication. Seaman showed how GIS maps help medical teams locate and immunize children in Nigeria.
United States Secretary of Commerce Penny Pritzker discussed how open data can unlock $3 trillion in the world economy and that her offi ce will appoint the fi rst-ever US chief data offi cer.
Jane Goodall joined the conference via video from Tanzania to tell attendees how much she appreciates GIS as a major tool in helping protect animal habitats.
will.i.am, entertainer and philanthropist, Skyped with conference attendees
about his enthusiasm for a wristwatch that included maps created with Esri technology and its potential impact on science, technology, engineering, and mathematics (STEM) education.
Entire Plenary Session Available for Viewing
GIS – Creating Our Future begins with Esri president Jack Dangermond’s opening remarks, award presentations, and industry-leading GIS solutions.
Technology and Users highlights new Esri software tools and user demonstrations from the Netherlands; Seattle, Washington, USA; and Singapore. Building Resilient Communities shows the many ways GIS is being used to make communities more resilient in the face of habitat loss, climate change, disease in the developing world, and other challenges.
Special Displays Highlight Impact of GIS
Special displays are an annual feature of the Esri User Conference. Among the 20 displays this year was a special tribute to Roger Tomlinson, the “father of GIS”. Another popular exhibition was the Urban Observatory, which compared housing, transportation, public services, and quality of life among 10 major cities in the world. The Annual Young Scholar Award display recognized the exemplary work of international undergraduate and graduate students, while the URISA GISCorps exhibit highlighted the work of its volunteers.
Concurrent Events Bring Together Industry Specialists
On the weekend preceding the Esri User Conference, several special events are held each year.
At the 3D Mapping Forum, Lawrie Jordan, Esri’s director of imagery, and Esri product engineers discussed the future of Esri 3D imagery. Other topics included unmanned aerial vehicles and mobile mapping, smart 3D cities, and military installation 3D management.
The AEC Summit featured keynote speaker Billy Gililland, president of General Atomics Systems Integration, who discussed how unmanned systems work in our airspace and how the technology will affect civil engineering in the future.
At the Esri Business Summit, speakers from Cisco Systems, Wendy’s, Nike, Bank of America, Con-way Freight, and other corporations discussed their use of GIS and location analytics to help improve their businesses.
The National Security Summit brought together GIS users from the defense, national security, intelligence, law enforcement, emergency management, and public safety sectors. Experts discussed critical infrastructure protection, cybersecurity, and activity-based intelligence analysis.
More than 500 educators attended the Esri Education GIS Conference, where they discussed the challenges and opportunities in GIS education. Highlights included nearly 100 user presentations and technical workshops and the GIS Solutions EXPO.
The 2015 Esri User Conference will be held July 20–24 in San Diego, California.
- Jim Baumann, Esri
CONFERENCE
Record Attendance at 34th Annual Esri User Conference Esri User Conference
28 | CoordinatesCoordinates September 2014
SD34_CMPL_September 2014.indd 28SD34_CMPL_September 2014.indd 28 02/09/14 8:00 am02/09/14 8:00 am

SD34_CMPL_Javad_Sep_Ad_AS.indd 1 28/08/14 11:07 pmSD34_CMPL_September 2014.indd 29SD34_CMPL_September 2014.indd 29 02/09/14 8:00 am02/09/14 8:00 am

SD34_CMPL_Javad_Sep_Ad_AS.indd 2 28/08/14 11:07 pmSD34_CMPL_September 2014.indd 30SD34_CMPL_September 2014.indd 30 02/09/14 8:00 am02/09/14 8:00 am

SD34_CMPL_Javad_Sep_Ad_AS.indd 3 28/08/14 11:07 pmSD34_CMPL_September 2014.indd 31SD34_CMPL_September 2014.indd 31 02/09/14 8:00 am02/09/14 8:00 am

SD34_CMPL_Javad_Sep_Ad_AS.indd 4 28/08/14 11:07 pmSD34_CMPL_September 2014.indd 32SD34_CMPL_September 2014.indd 32 02/09/14 8:00 am02/09/14 8:00 am

SD34_CMPL_Javad_Sep_Ad_AS.indd 5 28/08/14 11:07 pmSD34_CMPL_September 2014.indd 33SD34_CMPL_September 2014.indd 33 02/09/14 8:00 am02/09/14 8:00 am

SD34_CMPL_Javad_Sep_Ad_AS.indd 6 28/08/14 11:07 pmSD34_CMPL_September 2014.indd 34SD34_CMPL_September 2014.indd 34 02/09/14 8:01 am02/09/14 8:01 am

SD34_CMPL_Javad_Sep_Ad_AS.indd 7 28/08/14 11:07 pmSD34_CMPL_September 2014.indd 35SD34_CMPL_September 2014.indd 35 02/09/14 8:01 am02/09/14 8:01 am

SD34_CMPL_Javad_Sep_Ad_AS.indd 8 28/08/14 11:07 pmSD34_CMPL_September 2014.indd 36SD34_CMPL_September 2014.indd 36 02/09/14 8:01 am02/09/14 8:01 am

European Geostationary Navigation Overlay Service (EGNOS), the
European Satellite Based Augmentation System (SBAS), provides corrections and integrity information to GPS signals over a broad area centred over Europe, and is fully interoperable with other existing SBAS systems (e.g., WAAS, the brand name of the American SBAS).
ESSP (European Satellite Services Provider) is the EGNOS system operator and EGNOS Service provider of the following three services:• EGNOS Open Service (OS),
freely available to any user;• EGNOS Safety of Life (SoL) Service,
that provides the most stringent level of signal-in-space performance to all Safety of Life user communities;
• EGNOS Data Access Service (EDAS) is the EGNOS terrestrial data service offering ground-based access to GNSS data to authorised users.
As it can be observed in Figure 1, EDAS is the access point to the data collected and generated by the EGNOS ground infrastructure through the EGNOS stations network. In consequence, EDAS gathers all the raw data coming from the GPS, GLONASS and EGNOS GEO satellites collected by all the receivers located at the EGNOS stations. There are currently 39 ground stations (Ranging and Integrity Monitoring Station - RIMS) and 6 uplink stations (Navigation Land Earth Stations - NLES), mainly distributed over Europe and North Africa. EDAS disseminates this GNSS data in real time to EDAS users and/or Service providers that distribute
the data locally or to a specifi c set of applications. In consequence, EDAS allows users to ‘plug in’ to EGNOS system by providing access to GPS/GLONASS satellite navigation and observation data, along with the EGNOS messages received by EGNOS ground stations.
EDAS therefore provides an opportunity to deliver EGNOS data to users who cannot always view the EGNOS satellites (such as in urban canyons), or Global Navigation Satellite System (GNSS)/ Differential GNSS (DGNSS) data to support a variety of other services, applications and research programs.
European Commission (EC) launched the EDAS Service on July 26, 2012, declaring it offi cially available to EU users. This event was accompanied by the publication of the EDAS Service Defi nition Document v1.0. The ‘EDAS Service Defi nition Document’ (EDAS SDD) provides information on the EDAS services available and their conditions of use. On April 10, 2013, a new set of EDAS Services were made available to the GNSS community: Data Filtering, SISNeT, File Transfer Protocol (FTP)
EDAS: EGNOS data over the internet for added value servicesThis EDAS Service has been offi cially available for GNSS community since July 2012, with a commitment of minimum availability of 98.5% for the main data services and of 98% for the rest of the EDAS Services
Elisabet LacarraESSP SAS, Madrid, Spain
Pedro GómezESSP SAS, Madrid, Spain
Juan VázquezESSP SAS, Madrid, Spain
Miguel Ángel SánchezESSP SAS, Madrid, Spain
Figur e 1: EDAS High-Level Architecture
SBAS
CoordinatesCoordinates September 2014 | 37
SD34_CMPL_September 2014.indd 37SD34_CMPL_September 2014.indd 37 02/09/14 8:01 am02/09/14 8:01 am

and Networked Transport of Radio Technical Commission for Maritime Services (RTCM) via Internet Protocol (NTRIP). In consequence, EC released a new version (v2.0) of the EDAS Service Defi nition Document (see ref. European Satellite Services Provider (ESSP), 2013c) with the aim to refl ect these new services and associated added value for EDAS users. This expansion is the consequence of the EGNOS program strategy to continuously improve all the EGNOS services and further support user needs.
EDAS User Registration and Support
In order to request an EDAS account, users should follow the steps detailed below:1. Visit and register in the EGNOS
User Support Website: http://egnos-user-support.essp-sas.eu
2. Fill and submit the EDAS registration form (only accessible upon online registration): http://egnos-user-support.essp-sas.eu/egnos_ops/edas_registration
After the verifi cation of the provided data, the EGNOS Helpdesk will provide the user with the credentials and confi guration details necessary to connect to the requested EDAS Service. Additionally, the website credentials will allow the user to download user oriented documentation and SW, such as the EDAS Client SW User Manual and the user information packages for each EDAS Service.
EDAS users are welcome to contact the EGNOS Helpdesk for EDAS registration and for any request or question related to EDAS, including but not limited to EDAS
services status and performance, connectivity issues, technical specifi cations, data streams structure, conditions of use, etc. Prior to that, users are kindly invited to read the FAQs available at the ESSP (see Web-1) and the EGNOS User
Support (see Web-2) websites.
At the time of writing this paper, there were 170 EDAS registered users. The evolution in terms of number of registered users in the last year is depicted in Figure 2:
EDAS On line information
The following information could be found on line regarding EDAS:• EDAS Service Defi nition Document
(see ref. ESSP, 2013c, available at Web-3and Web-4): This EDAS SDD provides information on the EDAS services and their conditions of use. In terms of content, the EDAS SDD describes the EDAS system architecture and provides an overview of the current EDAS services with regards to the information that is transmitted, the data formats, protocols and committed performances.
• EGNOS User Support Website (see Web-2): Up-to-date information about the EDAS Services, along with the interface with the EGNOS helpdesk and the form to register as EDAS user is located in the EGNOS User Support Website.
• EGNOS Monthly performance report (see Web-5): This EGNOS monthly performance report contains the EDAS performances of the last month, in terms of availability and latency for all services.
EDAS Services
There are different types of data available from EDAS that can be exploited for different purposes. The real-time and historical data provided by EDAS are mainly:• The Global Positioning System (GPS),
GLONASS and EGNOS Geostationary Earth Orbit or Geostationary satellite (GEO) observations and navigation data collected by the entire network of Ranging and Integrity Monitoring Stations (RIMS) and Navigation Land Earth Stations (NLES).
• EGNOS augmentation messages, as normally received by users via the EGNOS geostationary satellites.
• Differential GNSS (DGNSS) and RTK (Real-Time Kinematic) messages allowing users implementing advanced positioning techniques to obtain sub-metre to centimetre level accuracy.
Figure 2: EDAS users’ evolution
Mode EDAS Service
Type of Data
Standards & Formats
OB
SERV
ATIO
N
&N
AVIG
ATIO
N
EGN
OS
MES
SAG
ES
RTK
MES
SAG
ES
DG
NSS
C
OR
REC
TIO
NS
Real Time
Service Level 0&2 X X Data encoded in ASN.1 format
for SL0 and RTCM 3.1 for SL2.
Data Filtering 0&2 X X Data encoded in ASN.1 format
for SL0 and RTCM 3.1 for SL2.SISNET X SISNET Protocol defi ned by ESA.
NTRIP X X XNTRIP v2.0 protocol in RTCM 3.1, RTCM 2.1, and RTCM 2.3 formats
Archive FTP X X Files in RINEX 2.11, RINEX B 2.10, EMS, SL0 and SL2 formats.
Table 1: Summary of EDAS Services
38 | CoordinatesCoordinates September 2014
SD34_CMPL_September 2014.indd 38SD34_CMPL_September 2014.indd 38 02/09/14 8:01 am02/09/14 8:01 am

This type of data is encoded and sent in different formats and protocols, resulting in the available set of EDAS services. Table 1 shows a summary of the type of data provided by each service, along with the standard and format used.
Main data stream services
The raw observation data gathered by EGNOS stations, including RIMS sites and NLES stations, is provided by EDAS in real time with an update rate of one second. The main types of data provided by the main data stream services are:• Service Level 0 (SL0): it provides
data encoded in ASN.1 format (see Web-6). It is recommended for those users willing to transmit data in raw format, or transmit them in a format that allows a complete reconstruction after decoding.
• Service Level 2 (SL2): it is used to transmit data in RTCM 3.1 standard (see RTCM, 2011).
Each EDAS message is embedded in a frame which starts with the EDAS Control Header, followed by the platform message whose format depends on the Service Level and the kind of contained data. The details about the message format are explained in the EDAS Client SW User Manual (see ref. ESSP, 2013), that is available to registered users at the ‘EDAS Documentation & SW’ tab within the EDAS section of the EGNOS User Support website (see Web-2).
A platform-independent interface element (executable through command line or in the graphical mode), called EDAS Client Software, allows users to connect to these Service Levels and retrieve data. This application is available to users after registration and is described in the aforementioned Client SW Manual (see ref. ESSP, 2013), which includes installation process, confi guration, functions and data output format.
Data Filtering Service
The EDAS Data Filtering Service allows EDAS users accessing a subset of the Service Level 0 or Service Level 2 data.
The EDAS Client SW allows selection one of the available predefi ned groups that are a subset of the EGNOS stations, and the data rate of the received messages. This means that EDAS users can be subscribed to a predefi ned group of RIMS and retrieve data from these set of stations at 1Hz or 1/30 Hz. The details about the message format and confi guration are explained in the EDAS Client SW User Manual (see ref. ESSP, 2013).
In consequence, the Data Filtering Service enables reduction of the bandwidth consumption and amount of data to be processed on the user side with respect to the corresponding main data stream. The current confi guration of this service, that illustrates the way in which the EDAS Data Filtering Service groups can be defi ned, includes six groups. One of them includes all the EGNOS RIMS A stations, whereas the remaining fi ve include a subset of RIMS A based on a geographical criteria shown in Figure 3:
SISNeT Service
The main purpose of the EDAS SISNeT service is to provide worldwide access to the EGNOS augmentation messages through the Internet, in real time, using the SISNeT protocol defi ned by European Space Agency (ESA) (see ref. ESA, 2006 and Web-7). Hence, through the EDAS SISNeT service, the EGNOS messages are available over the Internet even if the EGNOS GEO satellites are not visible from the user location.
The dissemination of the SISNeT messages is done using a dedicated protocol named DS2DC. This protocol (see Web-8) allows the transmission of SISNeT messages as text strings through the TCP/IP protocol. The
SISNeT protocol also allows the user to request specifi c messages to the server.
Actually, on top of the EGNOS augmentation messages, EDAS SISNeT service provides GPS ephemeris (RINEX format, see IGS, 2012) and ionospheric parameters of the Klobuchar model, which are delivered upon user request. For the case of the EGNOS messages, not only the last message may be requested, but also an already broadcasted one. For this purpose, the last 30 EGNOS augmentation messages of each message type are stored, to be delivered to the client in case the user requests them. This is especially useful for reducing the Time To First Fix (TTFT). The Time To First Fix for a SBAS receiver is the time period required to acquire the necessary satellite signals, navigation data, and SBAS messages to calculate a position solution. This TTFT can be signifi cantly decreased by quickly obtaining the ephemeris of all the GPS satellites as well as the whole set of EGNOS messages. Note that some SBAS messages are broadcast with a low frequency (as is the case for ionospheric corrections) being necessary up to fi ve minutes to start applying the augmentation information.
In order to connect to the EDAS SISNeT service, a SISNeT client is needed. Some client applications already exist, and even some receiver manufacturers support SISNeT. Details of the SISNeT
F igure 3: EDAS Data Filtering Service Groups
CoordinatesCoordinates September 2014 | 39
SD34_CMPL_September 2014.indd 39SD34_CMPL_September 2014.indd 39 02/09/14 8:01 am02/09/14 8:01 am

Service, specifi c guidelines for the access and usage are available in the EDAS SISNeT-User Information Package (ESSP, 2012b) for registered users located at the EDAS section of the EGNOS User Support website.
FTP Service
One of the most important characteristics of EDAS is the real time provision of GNSS data. However, for a certain kind of users and applications, it is also useful to access archived GNSS data and EGNOS messages through an FTP server.
The EDAS FTP Service provides the following fi les to users:• GPS and GLONASS mixed
observation data received at RIMS sites and NLES stations in RINEX 2.11 format (IGS, 2012) at 1Hz and 1/30 Hz.
• GPS and GLONASS navigation data in RINEX 2.11 format (IGS, 2012) per station and consolidated.
• EGNOS messages in EGNOS Message Server (EMS) format (ESA, 2004) and RINEX B 2.10 format (IGS, 2007).
• EDAS Service Level 0 and Service Level 2 raw data.
• Ionosphere maps providing TEC information of the area monitored by EGNOS in IONosphere map Exchange format (IONEX) 1.0 format (Schaer et al., 1998).
Historical data for a period of 2 years will be available for all the fi les with the exception of the EDAS Service Level 0/2 raw data, which will be kept for a period of 6 months, starting from March 1, 2013.
EDAS users may access this service using a standard FTP client. Specifi c guidelines for the access and usage of the EDAS FTP service, including naming conventions and folder structure, are available for registered users in the EDAS FTP-User Information Package (ESSP, 2012a) available at the EDAS section of the EGNOS User Support website.
N TRIP Service
EDAS-based NTRIP service retrieves GPS and GLONASS raw measurements
from the EGNOS stations (RIMS and NLES) and disseminates this information, together with DGNSS/RTK correction, in real time through the NTRIP (version 2.0) protocol (RTCM, 2004) in RTCM 3.1 (RTCM, 2011), RTCM 2.1 (RTCM, 1994) and RTCM 2.3 (RTCM, 2001) formats. The EDAS Ntrip Service allows users to implement advanced positioning techniques such as Differential GNSS (DGNSS) and RTK (Real-Time Kinematic), which are able to provide sub-metre to centimeter level accuracy. Some examples of the achieved accuracies using the EDAS Ntrip Service to feed RTK and DGNSS algorithms are provided later in this paper (§3.2).
Ntrip is a Network Transport standard designed for disseminating of GNSS in RTCM format via Internet Protocol. EDAS Ntrip Service implements the protocol version 2.0 of the Ntrip standard (IGS, 2007), which uses RTSP (Real Time Streaming Protocol) for stream control on top of TCP and RTP (Real Time Transport Protocol) for data transport on top of the connection-less UDP. For an exhaustive list of the RTCM messages that are delivered through the EDAS Ntrip service, along with detailed information for the connection and usage of the EDAS NTRIP service, the EDAS NTRIP-User Information Package (ESSP, 2013e) is available for registered users.
In order to access the EDAS Ntrip Service, there are GNSS receivers that directly apply the DGNSS and RTK corrections coming from the NTRIP Caster, and there are also free applications that retrieve the data coming from the EDAS NTRIP Service, such as the BNC Client, available at Web-9.
EDAS Performances
As explained before, EDAS, as all the other EGNOS Services, has its own EDAS SDD (see ref. ESSP, 2013c). Among other contents, the EDAS SDD defi nes the committed performances for EDAS (those that should always be met in a nominal situation) in terms of availability and latency:• Availability: Percentage of time
in which EDAS is providing its services according to specifi cations. The availability of EDAS services is measured at the EDAS system output (excluding external network performance).
• Latency: Time elapsed since the transmission of the last bit of the navigation message from the space segment (EGNOS and GPS/GLONASS satellites) until the data leave the EDAS system (formatted according to the corresponding service level specifi cation). EDAS latency is a one-way parameter defi ned for real time services.
Based on the above defi nitions, the tables below provide EDAS services’ minimum availability and maximum latency:
Please, note that latency is only defi ned for real-time services and in consequence, FTP Service does not have a latency requirement.
As an example, the performances for the last three months are shown below (monthly performance are available at the ESSP Website). As it can be easily seen, all services have met the minimum availability and maximum latency described in EDAS SDD.
SL0 SL2 SISNeT FTPData Filtering
NtripSL0 SL2
1,3 seconds
1,450 seconds
1,150 seconds N/A 1,6 seconds 1,75
seconds 1,75 seconds
Table 2: EDAS services minimum availability
SL0 SL2 SISNeT FTP Data Filtering Ntrip98.5% 98.5% 98% 98% 98% 98%
Table 3: EDAS services maximum latency
40 | CoordinatesCoordinates September 2014
SD34_CMPL_September 2014.indd 40SD34_CMPL_September 2014.indd 40 02/09/14 8:01 am02/09/14 8:01 am

EDAS Applications
Areas of applications
The Main Data Streams (Service Level 0 & 2) provide all EGNOS data for all EGNOS stations in real time and thus, have a wide range of areas of application. They are used for monitoring and research purposes. The data coming from the Service Levels can be used as input for the development of applications based on GNSS data or for the provision of added value services based on EDAS. They also provide EGNOS messages and therefore allow all kind of applications using EGNOS augmentation in real time.
The Data Filtering Service, since it provides a subset of the Service Level 0 & 2, can cope with the same use cases as the main data streams.
The SISNeT Service gives access to the wide-area differential corrections and the integrity information of EGNOS. Any user with Internet access (usually through wireless networks - GSM or GPRS) can access EGNOS messages through SISNeT, irrespective of the GEO visibility conditions. In consequence, GNSS receivers could improve accuracy with respect to GPS and even use the EGNOS protection levels in order to have an estimate of the navigation position error. An example of the accuracy
improvement observed in a receiver located at Berlin using SISNeT with respect to GPS only is described in §3.2. Moreover, SISNeT can be used to analyse EGNOS SBAS messages in real time.
The NTRIP Service disseminates GPS and GLONASS measurements, DGNSS corrections and RTK messages from the EGNOS stations (RIMS and NLES) in real time through the NTRIP protocol, supporting wireless Internet access through Mobile Internet Protocol (IP) Networks like GSM, GPRS, EDGE, or UMTS, and allowing simultaneous PC, Laptop, PDA, or receiver connections to a broadcasting host. Using this service, GNSS receivers can improve accuracy of satellite-based positioning systems down to centimetre-level applying DGNSS or RTK techniques. On the one hand, DGNSS is based on the principle that receivers in the vicinity of the reference station will see similar errors on a particular satellite ranging signal. The DGNSS technique uses range corrections from a reference receiver (RIMS stations in the case of the EDAS NTRIP service) established at a known location and sent by the NTRIP Service to remove common satellite and signal propagation errors from the navigation solution. On the other hand, Real-Time Kinematic (RTK) uses phase measurements of the signal′s carrier waves of a reference station located in the vicinity (L1 and L2
for the case of GPS), in order to enhance the precision of position data derived from satellite-based positioning systems.
It is noted that for the application of RTK, the receiver should be located close to an EGNOS ground station (approximately up to 40 kilometres) in order to achieve the expected precision. For the case of differential GNSS, DGNSS corrections are valid and can be applied within several hundreds of kilometres. §3.2 shows an example of the accuracy levels of a receiver located in Berlin area using DGNSS and RTK algorithms from EDAS NTRIP Service (coming from Berlin RIMS station). This NTRIP Service could support agriculture applications that require a stringent level of accuracy. Furthermore, this service can be used to monitor the performances of EGNOS stations.
Finally, the FTP Service can be used for research and investigation, performing post-processing of GNSS performances or analysing the atmosphere behaviour off-line.
Imp rovements in terms of accuracy
As an example of the added value of EDAS, the improvements in the accuracy using SISNeT and NTRIP Services will be shown with respect to a GPS standalone positioning solution.
The scenario uses the observation and navigation data from EDAS for the EGNOS ground station (RIMS) located at Berlin (Germany), computing the following results:• GPS: The raw data coming from
RIMS Berlin is used to compute GPS navigation solution.
• EDAS SISNeT: The raw data coming from RIMS Berlin and the EGNOS messages received by the SISNeT Service provide a SBAS (GPS+EGNOS) navigation solution.
• EDAS DGPS: The raw data coming from a receiver located at Potsdam (Germany) (16 kilometers away from the RIMS Berlin) and the DGNSS corrections coming from the NTRIP Service for RIMS Berlin are combined to compute a DGPS navigation
Availability (%) Latency (ms)
EDAS Service April 2014
May 2014
June 2014
April 2014
May 2014
June 2014
Service Level 0 99.99% 100.00% 99.32% 525.53 654.97 529.17Service Level 2 99.99% 100.00% 99.30% 529.63 661.26 533.83Ntrip Service 99.96% 99.46% 99.41% 336.83 596.97 262.23SISNeT ServiceGEO 120 99.29% 99.39% 98.58% 249.37 210.65 72.50GEO 126 99.25% 99.49% 98.27% 241.17 212.90 72.53Data Filtering ServiceRIMS A 99.93% 99.96% 99.26% 569.13 792.61 507.30Central 99.93% 99.96% 99.24% 477.62 655.73 431.14MEDA 99.92% 99.96% 99.24% 530.63 732.90 479.40North-East 99.92% 99.96% 99.24% 249.53 458.55 201.53North-West 99.94% 99.96% 99.25% 527.8 739.06 492.97South-West 99.92% 99.96% 99.26% 575.1 763.74 498.53FTP 99.95% 99.87% 98.40% N/A N/A N/A
Table 4: EDAS availability and latency from April to June 2014
CoordinatesCoordinates September 2014 | 41
SD34_CMPL_September 2014.indd 41SD34_CMPL_September 2014.indd 41 02/09/14 8:01 am02/09/14 8:01 am

solution at Postdam. It is noted that for this example only differential corrections from GPS are used, whereas GLONASS could be also used.
• EDAS RTK: The raw data coming from a receiver located at Potsdam (Germany) and the RTK corrections coming from the NTRIP Service for RIMS Berlin are combined to compute a RTK (Real-Time Kinematic) navigation solution at Postdam.
Figure 4 shows the location of the different elements comprising this scenario:
The raw data coming from the receiver located at Potsdam comes from the EUREF Permanent Network (see Web-10), which is a European Network of more than 200 continuously operating GNSS reference stations. The solutions using DGNSS and RTK algorithms are provided by the Alberding GmbH’s DGNSS Monitoring system. Alberding GmbH (see Web-11), a satellite positioning company based in Wildau, Germany, is a leading developer and distributor of professional GNSS solutions, having experience in high-accuracy GNSS data processing, analysis and monitoring.
As a result, the horizontal and vertical errors using GPS, SISNeT, DGPS and RTK solutions are shown below for July 19, 2013 at Berlin station (for GPS and SISNET) and at Potsdam station (for DGPS and RTK), which is distanced
approximately 16 kilometres from the RIMS Berlin.
Figures below represent a zoom of the above fi gures. In those charts it is observed that, in average, the horizontal and vertical errors using GPS navigation solution are clearly improved with the SISNET Service, applying the EGNOS corrections. Moreover, it is observed the high-level precision obtained using DGPS and RTK, providing up-to centimetre-level accuracy.
Finally, the maximum, mean and two sigma value are provided in Table 5 for each positioning solution, showing the improvement in terms of accuracy that the EDAS Services provide with respect to the GPS only navigation solution:
EDAS based commercial/professional applications
Currently, there are several commercial applications that use EDAS Services.
Figure 4: Position of Postdam receiver (POTS) and RIMS Berlin (BRNA)
40 km radio(RTK application area)
Figure 5: Horizontal error: 2013-07-19
Figure 6: Vertical error: 2013-07-19
Figure 7: Horizontal error (zoom): 2013-07-19
42 | CoordinatesCoordinates September 2014
SD34_CMPL_September 2014.indd 42SD34_CMPL_September 2014.indd 42 02/09/14 8:01 am02/09/14 8:01 am

Some examples of applications and projects which have taken benefi t from EDAS products are explained below.
EDAS for tracking and tracing of dangerous goods
EDAS is used for tracking and tracing dangerous goods. The solution is presently adopted by ENI (the leading Italian oil and gas company, also operating at international level), further to the validation carried out in a European Research & Development (R&D) initiative, the SCUTUM (see Web-12). Tankers transporting hydrocarbon by road in various European countries are equipped with tracking and tracing devices that use GPS, EGNOS and EDAS. The added value of EDAS is in the capability to provide higher position accuracy and availability and a guarantee on the position information, supporting a better control, the elaboration of more reliable statistics, and thus an enhanced risk management and prevention. The generated benefits are both commercial and social, thanks to an increased control and traceability.
In the scope of the MEDUSA project, funded by the European Commission, the possibility to expand the added value that EGNOS and EDAS provide for freight transport applications to the Euromed countries is being investigated. The activities ongoing in the project include the development of a system for tracking
& tracing freight containers using EGNOS and a demonstration/proof of concept in the fi eld. The latter consists on the tracking of a container from Italy to Jordan. The main project outcomes will be publicly presented at a workshop on the use of EGNOS OS/EDAS for freight transport/logistics/road/ITS applications in Amman (Jordan), on October 21, 2014.
GNSS Performance Monitoring
EDAS Services can be used for GNSS performance monitoring and analysis, using in real time messages via SL0, SL2, Data Filtering, NTRIP or SISNeT Services. For example, observation and navigation measurements can be obtained through the EDAS NTRIP services for each EGNOS stations and SBAS messages can be received from EDAS SISNet server.
In particular, some Air navigation service providers (ANSPs) use applications based on EDAS to monitor the GNSS performances in -real time over the entire service area and at several specific airport locations. In addition, there are tools that supervise the RTK and DGNSS performances at specific locations in-real time using the EDAS NTRIP Service.
ESSP, as the EGNOS services provider, is also using EDAS SISNeT service as one of the data sources for the provision of the EGNOS real time performance information available at the EGNOS User Support Website (see Web-2).
Figure 8: Horizontal error (zoom): 2013-07-19
Max Mean 2σ
GPSHorizontal Error 2.81 0.85 0.97Vertical Error 3.66 0.98 1.53
EDAS SISNET
Horizontal Error 1.92 0.32 0.39Vertical Error 2.45 0.42 0.65
EDAS DGPS Horizontal Error 0.77 0.16 0.17Vertical Error 1.57 0.27 0.48
EDAS RTK Horizontal Error 0.13 0.03 0.04Vertical Error 0.34 0.14 0.10
Table 5: Statistics of horizontal and vertical errors (m)
Figure 9: High level architecture of EDAS for tracking and tracing of dangerous goods
Figure 10: MEDUSA system
CoordinatesCoordinates September 2014 | 43
SD34_CMPL_September 2014.indd 43SD34_CMPL_September 2014.indd 43 02/09/14 8:01 am02/09/14 8:01 am

The aim of the CoVeL (Cooperative Vehicle Localization for Effi cient Urban Mobility, see Web-15) project is to develop and commercialize the Lane Navigation Assistant (LNA) – an in-vehicle device which will enable lane-level navigation and lane-level traffi c management especially in urban areas. The LNA will use satellite positioning as its primary source, whereas these data will be augmented by correction information coming from the EDAS Service. The EGNOS data will be obtained from EDAS and broadcasted to the vehicles. The resulting lane-level vehicle positioning will bring navigation and traffi c management to a new level of detail and effectiveness.
ERSEC project (see Web-16) is named as Enhanced Road Safety by integrating Egnos-Galileo data with on-board Control System. The general objective of the ERSEC project is concerned with the broadening of the scope of application to road transport of the EGNOS/GNSS (and later Galileo), through an appropriate integration and data fusion with measurement data coming from other measuring instruments. More specifi cally, the objective of the project is to develop a measuring system, which will be used on board vehicles, that is able to produce the output of the position on the road map of the equipped vehicle and of all the obstacles.
The GNSSmeter Project (GNSS-based metering for vehicle applications and value added road services, see Web-17) developed a road pricing and pay per use insurance application system based on vehicle on-board technology that can be integrated rapidly to an existing market product. Currently, GPS is used as the primary positioning technology and is the key enabler of the existing system. Within GNSSmeter, the existing concept is extended by integrating EGNOS/EDAS augmentation data as well as Galileo measurements.
Conclusions
EDAS is the access point to the data collected and generated by the EGNOS
EDAS for management of airport fleets
A large number of airport vehicles are moving in the airport apron to perform its services. An Apron Management System based on centralized EGNOS positioning and integrity computation and redundant wireless communication links has been developed within the SENECA project (see SENECA, 2013).
This application uses EDAS data in real time along with other techniques aiming at increasing the safety of the vehicles moving in the airport, increasing airport capacity in low visibility conditions and providing the Air Traffi c Control with an accurate and updated estimate of the time when ground operations will be completed. Figure 12 shows the high-level architecture of this application.
EDAS based R&D Initiatives
There are some research and development initiatives that are
analyzing the use of EDAS Services, that are presented below.
The EEGS2 project (see Web-13) aims to demonstrate through fl ight trials the benefi ts of EGNOS in areas of Eastern Europe where EGNOS Safety of Life is not yet available (see ref. ESSP, 2013d), and prepare the civil aviation authorities and navigation service providers of those areas for the future usage of EGNOS. During this project, EDAS data in real time were used to simulate a test SBAS system and to perform several fl ight trials (covering Moldova, Poland, Romania and Ukraine).
The GAIN (Galileo For Interactive Driving, see Web-14) project is oriented to road applications, aiming at developing the Enhanced Active Green Driving (EAGD) system for real time optimization and reduction of CO2 emissions and fuel consumption. GAIN will directly contribute to defi ning guidelines for the proper application of EGNOS/EDAS corrections in the transport domain.
The INCLUSION project aims to build a solution capable of providing motor-impaired persons with the possibility of improving their mobility in safe conditions. Using only a GPS signal is not suffi cient to guarantee the required positioning performance because of its relatively poor accuracy and fading in urban scenarios.
Figure 11: Real-time APV-I availability and 24 hours availability map at the EGNOS User Support Website (see Web-2).
Figure 12: High-level architecture of EDAS for management of airport fl eets
44 | CoordinatesCoordinates September 2014
SD34_CMPL_September 2014.indd 44SD34_CMPL_September 2014.indd 44 02/09/14 8:01 am02/09/14 8:01 am

IGS, 2007, “RINEX: The Receiver Independent Exchange Format”, Version 2.10, 10/12/2007
IGS, 2012, “RINEX: The Receiver Independent Exchange Format”, Version 2.11, 26/06/2012
Schaer S., Gurtner W., Feltens J., “IONEX: The IONosphere Map EXchage Format Version 1” 25/02/98
SENECA, 2013, “SENECA Program for GNSS in Civil Aviation, proceedings of 19th KA and broadband communications, navigation and Earth Observation conference, Florence, October 14-17 2013
Web sites:Web-1: www.essp-sas.eu,
consulted on July 17th 2014Web-2: http://egnos-user-support.essp-
sas.eu/, consulted on July 17th 2014Web-3: www.essp-sas.eu/
service_defi nition_documents, consulted on July 17th 2014
Web-4: www.egnos-portal.eu, consulted on July 17th 2014
Web-5: www.essp-sas.eu/monthly_performance_reports, consulted on July 17th 2014
Web-6: http://www.itu.int/ITU-T/asn1/introduction/index.htm, consulted on July 17th, 2014
Web-7: http://www.egnos-pro.esa.int/sisnet/publications.html, consulted on July 17th, 2014
Web-8: www.egnos-pro.esa.int/sisnet, consulted on July 17th 2014
Web-9: http://igs.bkg.bund.de/ntrip/download, consulted on July 17th 2014
Web-10: http://www.epncb.oma.be, consulted on July 17th 2014
Web-11: http://www.alberding.eu, consulted on July 17th 2014
Web-12: http://www.scutumgnss.eu, consulted on July 17th 2014
Web-13: http://eegs-project.eu, consulted on July 17th, 2014
Web-14: http://www.gain-project.eu, consulted on July 17th 2014
Web-15: http://www.covel-project.eu/, consulted on July 17th 2014
Web-16: http://www.ersecproject.eu/, consulted on July 17th 2014
Web-17: http://www.gnssmeter.eu/, consulted on July 17th 2014
ground infrastructure through the EGNOS stations network in real time and off line in form of an FTP archive. This EDAS Service has been offi cially available for GNSS community since July 2012, with a commitment of minimum availability of 98.5% for the main data services and of 98% for the rest of the EDAS Services.
EDAS data can be used in real time in order to enhance GPS accuracy performances. An example of a station located at Berlin (Germany) shows that the accuracy provided by GPS can be enhanced using the EGNOS messages coming from the EDAS SISNET Service. Also, implementing DGNSS or RTK techniques using the RTCM messages coming from the EDAS NTRIP Service, sub-meter to centimetre level accuracies can be obtained.
Finally, EDAS has already proven to be a versatile service, supporting professional users in different commercial applications, such as SBAS evolution programs, GNSS performance monitoring, tracking and tracing of dangerous goods and management of airport fl eets. Other Research and Development activities continue to analyze the use of EDAS in new application domains, increasing the use of EDAS and supporting a wider range of application domains. For that, ESSP encourage EU citizens to take advantage of this European Service for their applications in order to enhance their performances
Acknowledgements
Firstly, the authors would like to acknowledge the efforts done by European Commission (EC) and the European GNSS Agency (GSA) for continuously supporting the EDAS program and for launching the evolution project which concluded in 2013 that included several enhancements to the EDAS support services and the addition of a new set of added value services.
Secondly, we would like to thank GMV for the good work performed in developing and maintaining the EDAS system and the continuous effort in order to improve the EDAS Services.
The authors would like to acknowledge Tamás Horváth (Alberding GmbH) and Jürgen Alberding (Alberding GmbH) for their technical expertise and for developing of the DGNSS & RTK monitoring software that enables the computation and representation of the accuracy performances provided by the EDAS NTRIP Service.
In addition, the authors also recognize Antonella di Fazio (Telespazio), Antonio Maria Salonico (Telespazio), Ester Armengou (GSA) and Vincent Brison (GSA) for supporting this article and for the material provided.
ReferencesESSP, 2013b. “EDAS Client
SW User Manual”, ESSP-DRD-6977 v2.2, 25/03/2013
ESSP, 2013c. “EGNOS EDAS Service Defi nition Document”, v2.0, 10/04/2013
ESSP, 2013d. “EGNOS Safety of Life Service Defi nition Document”, v2.0, 28/06/2013
ESSP, 2012a. “EDAS FTP Service – User Information Package”, v1.1, 10/04/2012
ESSP, 2012b. “EDAS SISNeT Service – User Information Package”, v1.0, 28/12/2012
ESSP, 2013e, “EDAS Ntrip Service– User Information Package”, v2.1, 12/07/2013
RTCM, 2011, “RTCM 10403.1 recommended standards for differential GNSS Services”, Version 3.1, 01/07/2011
ESA, 2004, “EGNOS Message Server (EMS) User Interface Document”, Version 2.0, E-RD-SYS-E31-011-ESA 2.0, 26/11/2004
ESA, 2006, “SISNeT User Interface Document”, E-RD-SYS-31-010, Version 3, Revision 1, 15/05/2006.
RTCM, 1994, “RTCM Recommended Standards for Differential NAVSTAR GPS Service”, version 2.1, 25/01/1994
RTCM, 2001, “RTCM 10402.3 Recommended Standards for Differential GNSS Service”, version 2.3, 20/08/2001
RTCM, 2004, “RTCM 10410.0 Networked Transport of RTCM via Internet Protocol (Ntrip)”, version 1.0, 30/09/2004
CoordinatesCoordinates September 2014 | 45
SD34_CMPL_September 2014.indd 45SD34_CMPL_September 2014.indd 45 02/09/14 8:01 am02/09/14 8:01 am

Lawal Abdul Qayoom TunjiCivil Engineering Department, Universiti Teknologi PETRONAS, Malaysia
Kamaruzaman Wan YusofCivil Engineering Department, Universiti Teknologi PETRONAS, Malaysia
Ahmad Mustafa HashimCivil Engineering Department, Universiti Teknologi PETRONAS, Malaysia
Detecting Changes in Coastline in United States and MalaysiaThis paper highlights the accuracy of remote sensing/GIS in measuring/detecting morphological changes in the coastline
Emergent coastal structures such as groins, detached offshore breakwaters,
and sea walls have been successfully adopted as coastal protection measures for many decades (Dean and Dalrymple, 2001: Silvester and Hsu, 1997). These type of structures are common in the US and Europe (Dean and Dalrymple, 2001), and even more so in Japan, where Seiji et al. (1987) reported the completion of over 4,000 emergent breakwaters by the mid-1980s. However, these types of highly intrusive and aesthetically unappealing engineering structures are becoming increasingly unpopular among the more environmentally aware modern communities. As a result, submerged breakwaters (SBWs), that do not impair amenity or aesthetics are becoming a preferred option for coastal protection (Burcharth et al., 2007: Ranasinghe and Turner, 2006; Lamberti et al, 2005;). Nonetheless, SBWs have rarely been adopted for coastal protection in the past and therefore, their effi cacy remains largely unknown. Furthermore enhanced shoreline erosion has been reported in the lee of the structures at several SBW projects worldwide. Ranasinghe and Turner, (2006) carried out a comprehensive review on documented projects of submerged breakwater in different parts of the world. Unfortunately, not many of these types of projects are available. From the ten (10) projects reviewed, erosion was noticed at the lee of seven (7) of these projects. Studying this type of projects has become imperative. The mode and magnitude of salient formation behind these structures need to be well documented and analyzed. But unfortunately performing an actual beach survey for all these SBW projects in different parts of the world will be quite expensive considering the inter-continental
nature of their location. Feasibly, the remote sensing and GIS technique would be an appropriate substitute.
The role of remote sensing and GIS to study shoreline changes is invaluable through complementing the fi eld surveys, which are diffi cult and expensive to carry out in shorter periods. Remote sensing has made it possible for easy access to valuable data remotely. Valuable data such as Light Detection and Ranging (LIDAR) and satellite images of all places in the world could be acquired remotely. Landsat TM and ETM+ data for most places around the globe are currently freely available for download from the US Geological Survey’s Earth Resource Observation and Science Centre (EROS). Over 29 years of Landsat TM and ETM+ data are available at no or low cost from EROS. A majority of this data is terrain corrected to the L1T level. This processing level has been shown to have a nominal horizontal accuracy of +/- 1 pixel or 30 m.
Objectives
The accuracy of such an advanced technique to measure/detect the morphology of coastline has been questioned by a lot of researchers, stakeholders and consultants in the fi eld of coastal engineering. This part of a larger study will endeavor to detect the morphology of two coastlines in the US and Malaysia using the advanced technique of remote sensing/GIS, and emphasis will be placed on the accuracy of such a technique. The accuracy of such technique was determined by the following;• Acquire remote sensing data in
the form of LIDAR and medium resolution satellite images for places in the US and Malaysia respectively.
GIS
46 | CoordinatesCoordinates September 2014
SD34_CMPL_September 2014.indd 46SD34_CMPL_September 2014.indd 46 02/09/14 8:01 am02/09/14 8:01 am

• Process and analyze the acquired data using remote sensing/GIS technique.
• Validate the medium resolution satellite images for Malaysia with actual beach profi le survey.
Literature
Study Area
To validate the remote sensing data acquired for Kerteh, Malaysia a study area was chosen in Malaysia. The study area is located within a town called Kerteh in the district of Kemaman in Southern Terengganu, Malaysia, about 30 km or 20 minutes’ drive north of Chukai. Kerteh is the base of operations for PETRONAS in Terengganu, overseeing the oil platform operations off the state’s coast. Kemaman is a district of 2,536 km2 area with a population of 174,876. It’s geographical location is 4º 31′ 38″ N and 103º 28′ 9″ E. The stretch of the beach protected is approximately 2,100 m. The study area is characterized with much of its coast to be a series of large and small hook-shaped bays, fully exposed to direct wave attack (especially during NE-monsoon) from the South China Sea. The geomorphologic feature of Kerteh bay is such that its development is controlled by protruding headlands. Most of the bays along this region are considered to be in dynamic equilibrium. This is when constant supply of material from up-coast or within its embayment is passing through the bay and beyond the down-coast headland. The littoral drift rate, associated with the dynamically stable confi guration of Kerteh Bay has been computed to be some 210,000 m3/yr of which more than 80% is transported during the NE-monsoon period
The cause of the coastal erosion at the study area Kerteh Bay was studied by Tilman et al (1993). Some major causes were highlighted by the researchers. The beach platform at Kerteh Bay is a continual long-shore sediment transport from up-coast to down-coast. Disruption of this dynamic stability may easily occur when up-coast sediment supply is (partly) cut off which can result into erosion of the coast leading to a larger indentation of the bay confi guration. If the entire up-coast
sediment supply is cut off, the bay would become even more indented until littoral drift ceases. Another factor identifi ed is the cross-shore sediment transport, although it was reported that this factor doesn’t have as much effect as the long-shore sediment transport. The direction and intensity of this transport phenomenon are ruled by the wave steepness, geometry of the seabed slope and the size of the seabed particles. The beach will accrete at moderate wave conditions and recede under severe wave attack.
The third factor is the supply of sand by S. Kerteh River discharge. Unlike the larger rivers in the region such as S. Terengganu, S. Dungun and S. Kemaman, it was found that S. Kerteh River only drains a very limited catchment and it is unlikely that its sediment yield will be of signifi cance for beach stability. The last factor identifi ed as affecting the stability of the coastal area within Kerteh Bay is considered to be human activity, such as removal of natural dune systems and vegetation.
An interesting phenomenon that affects the coastal erosion at Kerteh Bay is the up-coast sediment supply from Paka Bay which is largely transferred into Kerteh Bay through offshore bar, bypassing at the northern end of the bay. The ‘supply point‘ on to the coast of Kerteh Bay is located immediately up-drift from Rantau PETRONAS Complex, which makes this coastal stretch particularly vulnerable to any disruption of the equilibrium situation. This is refl ected in the shoreline mapping from 1966 to 1987. The observed erosion over this period would indicate an average defi cit in the up-coast sediment supply of some 40,000 m3/yr. The causes and persistency of this defi cit in unknown, but quite likely originate from S. Kerteh infl uence (disruptive of bar bypassing) and from shore developments within the up-coast Paka Bay, undertaken since the late sixties.
From the fi ndings of the cause of coastal erosion at Kerteh Bay, Tilmans and others proposed some mitigation measures. By careful examination of the geomorphologic situation of the Kerteh Bay and acknowledging the cause of erosion at the Rantau PETRONAS Complex, various defense schemes were proposed. An
artifi cial supply of sand (beach nourishment, perched beaches), structures to prevent waves from reaching erodible materials such as bulkheads, seawalls, revetments and offshore breakwaters, and the last being structures to slow down the rate of littoral transport such as groynes (trapping the sediment) or offshore breakwaters (reducing the wave energy in the coastal zone) were all among the methods proposed.
The beach nourishment and use of three offshore submerged breakwaters were adopted for the purpose of mitigating the coastal erosion at the affected area as of the time of the study carried out by Tilmans et al (1993). Subsequently, after sometime erosion occurred at further north and south of the protected area.
No doubt the fi ndings of Tilmans and others have been of tremendous use for the mitigation of the coastal problem at a time. Their fi ndings led to the construction of three submerged breakwaters with beach nourishment to mitigate the coastal problem at a specifi c time. The solution could be considered relatively effective considering the problem at that time, but no monitory survey has been carried out since the installation to evaluate the performance of these structures, but erosion has been noticed at the south and north of the protected area.
Remote sensing/GIS
Traditionally, morphological response of shoreline to structures is observed with the use of beach profi le survey and other methods that involves physical measurement of changes at the site over time. Remote sensing can provide an alternative to this tedious, laborious and expensive exercise.
Figure 1: Study area
CoordinatesCoordinates September 2014 | 47
SD34_CMPL_September 2014.indd 47SD34_CMPL_September 2014.indd 47 02/09/14 8:01 am02/09/14 8:01 am

Previous studies of monitoring topography and morph-dynamics of coastal fl ats using remote sensing imagery have focused on ‘waterline’ extraction. The waterline is defi ned as the instantaneous land-water boundary at the time of the imaging, while coastline or shoreline is the water at the highest possible water level (Niedemeier et al., 2005). The sea may be treated as an altimeter in this method, and the sea level may be determined by the data on tide height collected from original tide gauge records or obtained from hydrodynamic models. Waterlines at different tide stages of a particular location can be corrected to obtain a particular datum-based shoreline using tidal correction models.
Over the past decades, many studies have used satellite-derived data to ‘sketch’ waterlines at coastal areas and water bodies using both active and passive sensors, including synthetic aperture radar (SAR), near infra-red, shortwave infrared and thermal infrared images (Yamano et al., 2006). Among these satellite-based sensors, SAR shows prominent advantages in the waterline technique (Mason and Davenport, 1996), which can provide ground information regardless of cloud presence. Archived SAR data are, however, less available than commercial optical sensors (such as Landsat TM/ETM, Terra ASTER, SPOT, and IKONOS/Quickbird). Obviously, SAR sensor seems unlikely to be widely applied to coastal areas at present. In the passive optical sensors, higher spatial resolution is another attractive option because of their higher accuracy in waterline detection, but purchasing such images means higher costs (Yamano et al., 2006). For this practical reason, a cost/benefi t analysis of fi ve satellite sensor bands (IKNOS band 4, Terra ASTER bands 3 and 4, and Landsat ETM+ bands 4 and 5) has been made by Yamano et al. (2006), and their work declares that Terra ASTER band 3 is the most cost-effective sensor for extracting waterlines with reasonable accuracy.
However, it should be noted that Terra ASTER is mainly observed on user demand and lacks routinely archived data. In this sense, it is impossible to obtain enough Terra ASTER data archives with various tide conditions in coastal areas for all the study
areas of this research. The Landsat platforms have been providing scientists with medium-resolution satellite imagery for over 30 years. In 1970s, Landsat launched land mapping with a series of MSS satellites. In the early 1980s, the second generation of Landsat satellite TM added two more infrared bands and a thermal long-wave infrared band, and doubled the resolution capabilities of the multispectral bands. Later, Landsat 7 successfully introduced the Enhanced Thematic Mapper platform in 1999 and added a higher-resolution panchromatic band (15 m). TM became a popular platform providing repetitive synoptic, global coverage of multispectral imagery with relatively high-frequency, especially providing the preferred data source for the analysis of historical data sets.
Several researches have been carried out using Landsat Imageries for various purposes. Ryu et al., (2004) applied Landsat ETM+ satellite images to the study on the relationship between spectral refl ectance and the sedimentary environments on Gomso Bay, Korea. They concluded that remnant surface water in a tidal fl at is an important factor in infl uencing spectral refl ectance, and is affected by regional topography, grain size and the distribution of tidal channels. Zhao et al (2009) used Landsat imageries of Yangtze Delta, China to detect changes that have occurred over time. They obtained imageries for the period between 1987 and 2004, extracted the waterlines and used their corresponding tidal heights obtained from hydrodynamic models to construct a Digital Elevation Model.
Daniels Richard (2001) showed that an accurate shoreline/waterline extraction could be achieved using Landsat archived imageries when a tasseled cap transformation is used to convert the originals bands into new sets of bands with defi ned interpretations that are useful for vegetation mapping. The transformation is calculated by the taking the original images bands and creating a new set of output bands based on the sum of image band 1 times a constant plus image band 2 times a constant. The derived brightness, greenness, wetness Tasseled Cap bands will then be used as an input into ESRI unsupervised ISO classifi cation algorithm to derive ten
land use classes, and these 10 classes will be merged to obtain a binary classifi cation (i.e., land and sea). He reported that the Tasseled Cap did a good job of differentiating between waves and beach, especially when the classifi er option to leave 0.5% of the pixels was unclassifi ed. The Tasseled Cap was unable to differentiate between land and sea for imageries with stratus clouds but this was solved by the use of NDVI band.
Materials & data
LIDAR
LIDAR data were acquired for the area of Palm Beach, United states in LAS format and converted to ASCII. Triangulated Irregular Networks (TIN) was generated from the xyz data contained in the ASCII format using the ArcGIS 10.1. The data were acquired based on tile scheme as shown in Figure 2 below. Data sets are chosen based on the tile that covers the respective study area of interest. As shown in Figure 2, four tiles were chosen for the data acquisition. These four tiles (with the green dots) covers the area of interest for this study.
Landsat 5 Satellite Images
Landsat imageries from Landsat 5 were acquired for the Malaysia study area; imageries of 30 m spatial resolution were acquired from the Landsat platform.
Figure 2: Tiles covering area of interest
48 | CoordinatesCoordinates September 2014
SD34_CMPL_September 2014.indd 48SD34_CMPL_September 2014.indd 48 02/09/14 8:01 am02/09/14 8:01 am

Landsat is known to be a platform that provides repetitive synoptic, global coverage of multispectral imagery with relatively high-frequency, especially providing the preferred data source for the analysis of historical data sets. Table 1.0 below shows the relevant information on the images acquired such as the date of images; time of image captured; the sensor that captured the images; resolution of the images and corresponding tidal heights of the images. The tidal heights were acquired using the hydrodynamic model.
Beach Profi le survey data
Beach profi le survey is still the most accurate means of detecting changes in shoreline over time and was used for the validation of the remote sensing/GIS technique results. The Real Time kinematics survey method was adopted for this study. Real Time Kinematic (RTK) is a technique used to enhance the precision of position data derived from satellite-based positioning systems being usable in conjunction with GPS. It uses measurements of the phase
of signal’s carrier wave rather than the information content of the signal, and relies on a single reference station to provide real-time corrections, providing up to centimeter-level accuracy. It has applications in land survey and in hydrographic survey. The survey path in which the survey was carried out is shown in Figure 3. The shoreline surveyed is about 3 km. Figure 4 shows the actual survey being overlaid in a Google earth image of the area surveyed.
Methodology
Processing of LIDAR data
The method of data acquisition for the LiDAR data for the Florida area in the US. These numerous ASCII format data were uploaded into ArcGIS interface as shown in Figure 5 and then converted to TIN as shown in Figure 7. Figure 6 below shows the work fl ow chart for this process.
TIN was generated for the ASCII data for 1999, 2004 and 2007 for the same area. This provided topographic information for these years for Florida,
US. With the aid of a profi le measuring tool in ArcGIS 10.1, the profi les at different sections covering the interested coastline were measured and compared for these years.
Processing of Landsat Images
The accuracy of shoreline extraction using remote sensing/GIS relies mostly on classifi cation and tidal correction.
Land cover classifi cation has been the pivot that determines the accuracy of shoreline extraction, especially for medium to coarse spatial resolution imageries. Previous studies have suggested that the calculation of a single transformation, the Normalized Difference Vegetation Index (NDVI) or the use of the Infrared Band (NIR) may be suitable for water delineation and the values of the band ’sliced’ to identify water, bare soil, and vegetated
Masters ImageDate Time Sensor Resolution (m) Tidal level (m)
1998/06/13 10:42:09 A.M TM 30 0.941998/07/31 10:40:05 A.M TM 30 1.311995/02/09 11:01:02 A.M TM 30 -0.61995/07/03 10:49:18 A.M TM 30 0.591997/03/18 10:42:09 A.M TM 30 -0.481997/04/19 10:40:05 A.M TM 30 -0.262000/05/31 10:40:05 A.M TM 30 -0.292000/02/07 11:01:02 A.M TM 30 -0.212004/04/22 10:49:18 A.M TM 30 0.882004/12/2 10:42:09 A.M TM 30 -0.302009/04/20 10:40:05 A.M TM 30 -0.352009/05/22 11:01:02 A.M TM 30 0.24
Table 1.0: Images with their respective dates and tides
Figure 3: Survey path Figure 4: Overlay of Survey data
Figure 5: ASCII (xyz) data uploaded in ArcGIS
CoordinatesCoordinates September 2014 | 49
SD34_CMPL_September 2014.indd 49SD34_CMPL_September 2014.indd 49 02/09/14 8:01 am02/09/14 8:01 am

lands. However, a majority of these studies dealt with calm water environment unlike what’s applicable to the study area of this research. The study area is characterized with white capping along the shoreline.
This study is based on Daniels Richards (2008), process (Table 2) of extracting shoreline from Landsat TM and ETM+. He used this method to derive ocean shorelines for 1989, 1995, 1999, 2010, 2011 and 2012 for Southwest Washington and Northwest Oregon. The shoreline changes were analyzed for a 102 km-long coastline. The changes rates from 1995 to 1999 were compared to published rates obtained from orthophotography and an R-squared of 0.79 was obtained. This method was further improved by correcting the extracted shoreline tidally. Two tide corrections models were used and the equi-angular triangle tide model was selected based on its closeness in slope value to the slope value of an actual survey.
Figure 8 shows a processed image from the raster form to the extracted shoreline.
Figure 6: Workfl ow of TIN creation
Figure 7: TIN generated from point data
Process Process Name Description
0 Download and extract data Download data from USGS EROS data center and unzip
1 Clip multiple rasters to AOI Clip the imagery to the area of interest
2 Fill Landsat 7 ETM+ Scanline Errors Fills missing data in Landsat 7 ETM+ data using the Nibble command
3 Landsat TM/ETM+ Tasseled cap Calculate the Tasseled Cap brightness, greenness, and wetness transformations. Normalize the band values to 0-255
4 NDVI Calculate the NDVI transformation normalize the band value to 0-255
5 Category creation for land and sea Take tasseled cap and NDVI bands as input and create a 10-class land cover data set and dendogram
6 Classify Land and sea Re-class the land cover data set from 10 to 2 classes
7 Create shore Boundary Create a shoreline from the 2-class land cover data set using Majority fi ltering, contour, and Smooth line commands
8 Manual shoreline review Correct for cloud/beach overlap
Table 2: Listing of process steps used to obtain, classify and process the Landsat TM and ETM+ data for each year of interest. (Daniels Richard,2008)
As highlighted in table 2 above, after the successful download of the Raster image, it’s then clipped (subset). Landsat 5 has 7 bands and 6 of these bands were transformed. Bands 1-5 and band 7 are merged using the Tasseled Cap, which will give an output of Greenness, Brightness and Wetness transformation. Bands 4 and 5 are then separately combined to give an output of NDVI. These outputs - greenness, brightness, wetness and NDVI are used as an input to create a 10 class land cover data set and dendogram. The 10 class land cover data set is then re-classifi ed to obtain a 2 class land cover. A distinctive line (shoreline) is obtained from the 2 class land cover by the means of vectorization.
Estimation of tidal level
Hydrodynamic model was used for the purpose of estimating the tidal level for this study. Even
though some tide gauges were available at some distances away from the study area, they could not be used because a tidal level difference of about 1 meter was observed between the tide gauges. Therefore, a hydrodynamic tidal model was used to determine the height of the sea surface at various times of image capture.
Raster
Wetness Shoreline10 Class Land cover
2 Class land cover
Brightness Greenness
Figure 8: Processing of Landsat image
50 | CoordinatesCoordinates September 2014
SD34_CMPL_September 2014.indd 50SD34_CMPL_September 2014.indd 50 02/09/14 8:01 am02/09/14 8:01 am

Shoreline determination
To accurately determine the actual shoreline for each year, the equi-angular tidal correction method (Figure 9) was used. Shoreline is considered to be the interface between land and sea. Instantaneous waterline at the time the various images were captured cannot be regarded as the shoreline. This instantaneous waterline is the shoreline position based on the tide at the time the image was captured. If a low tide for the same image is compared to a high tide of same image on the same day, it will defi nitely show that erosion has occurred over this very short span time – which is a misconception.
The equi-angular triangle model involves the extraction of two waterlines l1l1 and l2l2. The waterlines were extracted using the method described in the section above. The sea surface was regarded as an altimeter, the altitude of which was determined using the hydrodynamic model referred to also in the section above. The respective waterlines heights h1h1 and h2h2 were assigned using the tidal harmonic model. Thus, the bottom slope, ρ, was defi ned by Equation (1);
(1)
The Mean Higher High Water of 1995-96 was used as the tidal datum (hh) which was obtained from the tidal level standard port. It was assumed that the beach moves offshore or onshore with the same bottom profi le (Huang et al., 1994). Thus, the waterlines were shifted to the tidal datum-based shoreline position based on the equi-angular theory as shown in Figure 9. The shifted distance, l, was estimated as;
(2)
Processing of Actual beach survey data
Survey exercise was carried out at the study area of Kerteh, Malaysia, in October 2012. The data were acquired using the Real Time Kinematic (RTK) method. The survey data were extracted from the RTK equipment in the ASCII format (xyz). These data were uploaded in the ArcGIS interface as shown in Figure 10. These point data were then converted to TIN as shown in Figure 11.
Results and discussion
Palm Beach, Florida, USA
Profi les of cross-sections created from TINs for the years 1999, 2004 and 2006 were compared to deduce the changes that must have occurred in the coastline of Palm Beach. Figure 12 shows the section of the beach in which the profi le was measured. It was observed that most of the profi les analyzed showed almost similar morphology on the coastline. Henceforth, just one of the profi les will be discussed in this paper.
The cross-section of the profi le that is situated in the middle of the coastline is selected for discussion in this paper.
The changes that occurred at the Palm Beach coastline from 1999 through 2004 and 2007 are as shown in Figure 13. From the graphical representation it can be deduced that between 1999 and 2004, there was erosion. But also from the same graph (Figure 13) it can be deduced that between 2004 and 2007 there was accretion.
Kerteh Bay, Malaysia
Change analysis of the processed and corrected shoreline from the satellite images as described in section 5, were carried out with the Digital Shoreline Analysis System (DSAS). The DSAS plug-in computes rate-of-change statistics for a time series of shoreline vector data. It works within
the Environmental Systems Research Institute (ESRI) Geographic Information System (ArcGIS) software. Amongst the statistics computation, this plug-in computes are Net shore Movement (NSM; Shoreline Change Envelope (SCE); End point rate (EPR); Linear regression rate (LRR); Standard Error
Figure 9: Equi-angular triangle tidal model diagram
Figure 10: Survey points loaded in ArcGIS
Figure 11: TIN created from survey points
Figure 12: Palm beach, Florida, USA
Figure 13: Morphology of Palm Beach coastline
CoordinatesCoordinates September 2014 | 51
SD34_CMPL_September 2014.indd 51SD34_CMPL_September 2014.indd 51 02/09/14 8:01 am02/09/14 8:01 am

of Linear Regression (LSE); Confi dence Interval of Linear regression (LCI); R-squared of Linear Regression (LR2); Weighted Linear Regression rate (WLR); Standard Error of Weighted Linear regression (WSE); Confi dence interval of weighted Linear regression (WCI); R-squared of linear regression (WR2) and Least median of squares (LMS).
To better understand the morph-dynamic process that has occurred at the study area over the period of 1988-2009, the study area is broken in parts as shown in Figure 14.
The Staff Quarters is situated in the northern part of the coastline studied, while the golf course and school are situated in the middle and southern parts of the coastline respectively. Figure 15 through Figure 17 shows the graphical representation of the morphology over time.
Figure 17 shows a graphical representation of the morphological process as obtained from the analysis of satellite images of the Kerteh. The analysis contained in this fi gure is based on the process that occurred between 1995 and1997. It shows accretion occurring at most parts of the coastline in this year slice. The magnitude of accretion at the beach directly in front of staff quarters can be approximated to be 35-40 m of width. This means the beach in front of the staff quarters widens up to about 35-40 m. The beach in front of the golf course also widened up for the same year slice but not as much as the beach in front of the staff quarters. The width of the beach in front
of the golf course increases in width by a value of 20-25 m and for the same year period the school had its beach increased by a smaller value of 18-22 m.
For the year slice of 2000-2004, erosion rather than accretion was observed at the study area remotely. Erosion of magnitude of 18-20 m was observed in front of the staff quarters. This is well depicted in Figure 16 as shown above. The magnitude of erosion for the beach in front of the golf course is between 5-22 m, not as much erosion as compared to the magnitude of erosion in front of the staff quarters. Erosion in front of the school for this period was put at 15-27 m of average magnitude.
Unlike the morphological process observed for the year slice 1995-1997 and year slice 2000-2004, both erosion and accretion were noticed at the study area from the images processed for years between 2004-2009. While accretion was observed to have occurred at the beach in front of staff quarters and school, erosion was observed at the golf course for the same year slice. The staff quarters and the school have accretion magnitude of 5-10 m and 5 m respectively, and the golf course had erosion value of 5 m as shown in Figure 17 below.
Validation
Validation was done based on comparison of slopes obtained from the processed images as described in section 5, with slopes obtained from actual fi eld study for the same period of images processed. The date of the fi eld study used for the
validation was sometime in October 2012 and this was compared to slopes of images of the same period (2012) and place. Digital Terrain Model (DTM) was created from the survey data (Figure 10) generated from this fi eld survey using the triangulation method of interpolation as show in Figure 11 above.
Conclusion
Measuring/detecting shoreline changes remotely would one day be carried out solely from remote places of the offi ces of stakeholders. The accuracy of such an advanced technique can only get better with more research.
The use of LIDAR has achieved some level of accuracy as compared to the medium resolution images of 30 m spatial resolution.
Conclusively the accuracy of the LIDAR data could be put at 0.6 m vertical accuracy which makes a valuable data for remote sensing. Past research have also
Figure 14: Kerteh Bay, Terengganu, Malaysia Figure 15: Changes in shoreline at Kerteh 1995-1997
Figure 16: Changes in shoreline at Kerteh 2000-2004
Figure 17: Changes in shoreline at Kerteh 2004-2009
52 | CoordinatesCoordinates September 2014
SD34_CMPL_September 2014.indd 52SD34_CMPL_September 2014.indd 52 02/09/14 8:01 am02/09/14 8:01 am

reported the accuracy of using Landsat 5 images and the accuracy is mostly put at ±30 m, but with the method described in this paper it is believed the accuracy has been tremendously improved.
The accuracy of the Landsat 5 images analyzed in this study can be correlated to the difference in slope of the measured beach slope and the calculated beach slope. Beach Slopes measured on the site for year of 2012 for the intertidal zone in front of the golf course is 0.63-0.70 and the slope obtained remotely from the images of the same place are put at 0.107.
ReferencesDean R. G and R. A Dalrymple,
Coastal Processes with Engineering Applications, Cambridge University Press (2001) 488p.
Lamberti, A., Mancinelli, A. Italian experience on submerged barriers as beach defence structures. Proc. 25th International Conference on Coastal Engineering. ASCE, Orlando, USA, pp. 2352-2365.
Mason, D., Hill, D., Davenport, I., Flather, R., Robinson, G., (1997). Improving inter-tidal digital elevation models constructed by the waterline technique. In: Third ERS Symposium, Florence, Italy, pp. 1079-1082.
Niedermeir, A., Hoja. D., Lehner, S., (2005). Topography and morphodynamics in the German bright using SAR and optical remote sensing data. Ocean dynamics 55, pp. 100-109.
Pope, J., & Dean, J. L. (1986). Development of design criteria for segmented breakwaters, Proceedings 20th international conference on coastal engineering. American Society of Civil engineers, Tapei. Pp. 2144-2158.
Ranasinghe R., Hacking N., and Evans P., Multi-function artifi cial surf breaks: a review, Report No. CNR 2001.015, NSW Dept. of Land and Water Conservation, Parramatta, Australia (2001)
Ranasinghe R., Turner I., and Symonds G., Shoreline Response to Submerged Structures: A review Coastal Engineering (2006). Vol. 53, 65-79
Ranasinghe R. and S. Sato, Beach morphology behind impermeable submerged breakwater under obliquely incident waves. Coastal Engineering (2007). Pp. 1-24
Richard C. Daniels (2008). Using ArcMap to Extract Shorelines from Landsat TM & ETM+ Data. Thirty-second ESRI International Users Conference Proceedings, San Diego, CA.
Ryu, J.H., Kim, C.H., Lee, Y.K., Chun, S.S., Lee, S., (2004). Detecting the intertidal morphologic change using satellite data. Estuarine, Coastal and Shelf Science 78, 623-632.
Seiji, W. N., Uda, T., Tanaka, S., Statistical study on the effect and stability of detached breakwaters. Coastal Engineering in Japan 30 (1), 121-131.
Silvester R. and Hsu J., Coastal stabilization, World Scientifi c Publishing Co., Singapore (1997) 578 pp.
Stauble, D. K., Tabar, J.R., Smith, J.B., (2000) Performance of a Submerged breakwater along a hardbottom infl uenced coast: Vero Beach, Florida. Proc. 13th National Conference on Beach Preservation Technology, Melbourne, Florida, USA, pp. 175-190.
Tilmans W.M.K, W.H.G. Klomp & H.H. de Vroeg 1992. Coastal erosion – the Kerteh Case. Analysis of causative factors and mitigative measures using dedicated mathematical modeling tools, International Colloquim on Computer Applications in Coastal and Offshore Engineering.
Yamano, H., Shimazaki, H.S., Matsunaga, T., Ishoda. A., McClennen, C., Yokoki, H., Fujita, K., Osawa, Y., Kayanne, H., (2006). Evaluation of various satellite sensors for waterline extraction in a coral reef environment: Majuro Atollm Marshall Islands. Geomorphology 82, 398-411.
Zhao, B., Guo, H., Yan, Y., Wang, Q., Li, B., (2008). A simple waterline approach for tidelands using multi-temporal satellite images: a case study in Yangtze delta. Estuarine, Coastal and Shelf Science 77, 134-142.
The paper was presented at 9th National GIS Symposiun in Saudi Arabia at Damman during April 28-30, 2014.
SNIPPETS
AT A GLANCE
► Supergeo to Release Forest Inventory App for Android Users
► KEYW Unveils Aeroptic Aerial Mapping System
► Handheld NAUTIZ X4 Rugged PDA Certifi ed by Made4Net Supply Chain Solutions
► iXBlue expands operations in Brazil, increasing local support and product stock
► Proteus Introduces Fast-Turnaround Habitat Mapping for Environmental Impact Assessments
► NM Group selects Leica RCD30 cameras to capture electrical utilities with highest quality
► Beeline tests Sims for Era-Glonass car nav systems
► Leidos bags contract by National Geospatial-Intelligence Agency
► Intermap bags a $1.8 million contract to provide an airborne radar mapping services solution. -
► Topcon, GAP announce a new partnership
► Pix4D, Tetracam partner to better farming via remote sensing
► MDA, India sign contract for RADARSAT-2 data
► Tanzania to update mining cadastre system
► Canada announces $6.7 million support for developing new EO products
► China releases geo-information industry plan
CoordinatesCoordinates September 2014 | 53
SD34_CMPL_September 2014.indd 53SD34_CMPL_September 2014.indd 53 02/09/14 8:01 am02/09/14 8:01 am

Galileo updateGalileo Satellites lose way in space after launch
On 22 August 2014, a Soyuz rocket launched Europe’s fi fth and sixth Galileo satellites from Europe’s Spaceport in Kourou, French Guiana. These new satellites were intended to join four Galileo satellites already in orbit, launched in October 2011 and October 2012 respectively. This fi rst quartet were ‘In-Orbit Validation’ satellites, serving to demonstrate the Galileo system would function as planned. However, it soon appeared there was a discrepancy between targeted and reached orbit after the launch.
The lift-off and fi rst part of the mission proceeded normally, leading to the release of the satellites according to the planned timetable, and the reception of signals from them. It was only after the separation of the satellites that the ongoing analysis of the data provided by the telemetry stations operated by the European Space Agency (ESA) and the French space agency CNES showed that the satellites were not in the expected orbit.
Studies and data analyses are continuing in Kourou, French Guiana, and at Arianespace headquarters in Evry, near Paris, under the direction of Stéphane Israël, Chairman and CEO of Arianespace, to determine the scope of the anomaly and its impact on this mission. European Space Agency (ESA)
Telespazio, DLR take responsibility for Galileo satellite operations
Telespazio and the German Aerospace Center (DLR) will cooperatively run the operations for Galileo, through a
joint venture. Established by the two entities in 2009, Spaceopal GmbH, is the main contractor for operations services and will handle controlling the satellites, navigation data processing and monitoring worldwide receiving systems.
The DLR operates through one of two identical control centers. The agency’s is located in Oberpfaffenhofen, Germany, while Telespazio’s is located in Fucino, Italy.
First encrypted signal demo from Galileo
The Early Proof of Concept (EPOC) team has successfully tracked the encrypted Galileo E60B and E6-C signals broadcast by Galileo satellites. As a result, the Commercial Service loop has been closed using both encrypted and non-encrypted signals.
During the 10-day testing period, receivers located in Tres Cantos, Spain and Poing, Germany, showed the successful tracking and data demodulation of the encrypted signals from available Galileo satellites, with periods where all satellites transmitting E6 encrypted signals were tracked simultaneously.
The tests verifi ed the functionality of the Galileo Commercial Service (CS) signal’s encryption functionalities, with the data received containing authentication and high accuracy information previously generated outside the Galileo system. This is an essential feature to ensuring Galileo’s high accuracy and authentication services – some of which may be commercial in nature. GSA
Full-Featured UAV-Based Remote Sensing Solution
Headwall has launched a fully integrated remote sensing solution, combining hyperspectral and LiDAR sensors on a small Unmanned Air Vehicle (UAV). The UAV is a multi-rotor UAV (four wings with two props per wing). It carries Headwall’s lightweight Micro-Hyperspec VNIR hyperspectral sensor and a Velodyne LiDAR unit. The LiDAR provides a point cloud that refl ects the fi eld’s topographic relief, and the hyperspectral sensor delivers a picture showing spectral signatures of every object within the fi eld of view. Mounted on the UAV, the Ekinox-N provides LiDAR and the hyperspectral camera’s orientation and position during the whole fl ight. www.headwallphotonics.com
South Africa civil airspace UAV regulations likely by next March
The South African Civil AviationAuthority (CAA) hopes to have fi nalised regulations for the fl ying of unmanned air vehicles (UAVs) – also designated remotely piloted air systems(RPAS) and popularly called drones – in the country’s civilian airspace by the end of March 31, 2015.
According to Transport Minister Dipuo Peters, “The process of developing regulations in this regard takes consideration of the unique new safetyand security risks presented by the operation of RPAS, ... in South African airspace,” pointed out Peters. “Given the wide-ranging applications, it becomes prudent that the regulations are applied equally to all operators of RPAS, more so given that the risks presented by the operation of RPAS remain comparatively similar, regardless of application.”
“In all cases, a comprehensive analysis of inherent risk factors should be carried out before approval is granted,” she stated. “Additionally, it would be unconstitutional to permit the usage of RPAS technology in one sector whilst restricting other users.” www.engineeringnews.co.za/
NEWS - UAV
54 | CoordinatesCoordinates September 2014
SD34_CMPL_September 2014.indd 54SD34_CMPL_September 2014.indd 54 02/09/14 8:01 am02/09/14 8:01 am

Mark III, a small, fi xed-wing autonomous UAV weighing just 1.3 kg that is capable of collecting extremely high-resolution remote-sensing data. http://dronelife.com/
FAA announces New York UAS test site now operational
The U.S. Department of Transportation’s Federal Aviation Administration today announced that the Griffi ss International Airport unmanned aircraft systems (UAS) test site in Rome, N.Y., is ready to conduct research vital to integrating UAS into the national airspace system (NAS). The site is the fi fth of six test sites to become operational. www.faa.gov/uas
House of Lords in UK launches inquiry into civil use of drones
The House of Lords is holding an enquiry into the civil use of drones, to determine whether the conditions are right “for the industry to take off”.
In a call for submissions, aimed at gathering expert written and oral evidence as a precursor to its fi nal report in March 2015, the Lords’ EU subcommittee on the internal market, infrastructure and employment said that the increased use of drones throws up “a multitude of questions”.
“How safe are they? Do drones pose a privacy risk? What are the economic benefi ts to the UK and EU of drones? Is the European industry falling too far behind the rest of the world? These are some of the issues” that the committee will address, in its investigation into “Remotely Piloted Aircraft Systems (RPAS)“ – the offi cial terminology for drones, known in the US as “Unmanned Aerial Vehicles” (UAVs).
A Revolutionary UAS-Based Delivery Network is Being Tested—in Bhutan
It’s one of the world’s fi rst drone-based delivery networks, but it’s not in the Silicon Valley. It’s in Shangri-la. A Silicon Valley startup is piloting a low-cost drone-based delivery project in the remote Himalayan nation of
UND vies for UAS funding from FAA
With all six of its unmanned aircraft systems (UAS) research test sites operational, the Federal Aviation Administration is turning its attention to creating a UAS Center of Excellence. The University of North Dakota in Grand Forks has confi rmed it will be among those vying to be part of the center, which will study challenges surrounding the integration of unmanned systems into commercial airspace.UND, at least 14 other universities and numerous industry partners will be submitting an application together as the Alliance for System Safety of UAS Through Research Excellence. www.prairiebizmag.com
Google tests drone deliveries in Project Wing trials
Google has built and tested autonomous aerial vehicles, which it believes could be used for goods deliveries. The project is being developed at Google X, the company’s clandestine tech research arm, which is also responsible for its self-driving car. Project Wing has been running for two years, but was a secret until now. Google said that its long-term goal was to develop drones that could be used for disaster relief by delivering aid to isolated areas. The Project Wing trials have been held in Australia’s north-eastern state Queensland. Australia was selected as a test site due to what Google calls “progressive” rules about the use of drones, which are more tightly controlled in other parts of the world.
Hyperspectral Drones See ‘Down to the Grape’
The US company Precision Hawk has seen its UAV technology employed in a variety of plant research, crop-protection and crop-production applications – initially in the wine industry, where it was modifi ed to resemble a hawk to scare away pest birds while collecting sensing data useful to vineyard owners. Now it is fi nding use in a variety of other sectors, including forestry, land-surveying, insurance, and the energy industry. The company’s latest model is the Lancaster
Bhutan that could save lives in far-fl ung rural communities—and perhaps pioneer the system globally.
Bhutan has only 0.3 physicians per 1,000 people, according to the World Bank data, which is lower than larger regional countries like India, Pakistan and Bangladesh. But the bigger problem for many Bhutanese is access. The Bhutanese government and the World Health Organization reached out to Matternet, a Palo Alto, USA company that develops transportation networks using unmanned aerial vehicles to reach hard-to-access places.
The project in Bhutan, however, is the fi rst big test for the startup. Matternet uses small quadcopters that can carry loads of about four pounds across 20 km at a time, to and from pre-designated landing stations. The company is able to track these fl ights in real-time, and aims to eventually deploy fully-automated landing stations that replace drone batteries, giving them extended range and fl ight time. http://qz.com
No Unmanned Flights 'Anytime Soon,' FAA Assures Pilots
Airlines should not expect to see unmanned aircraft systems (UAS) fl ying regularly in U.S. airspace “anytime soon,” a senior offi cial with the Federal Aviation Administration told pilots recently. The assurance came amid continuing reports of unauthorized UAS fl ights near airliners.
FAA Administrator Michael Huerta “has made it clear regarding the entry of UASs into the [airspace] system. It’s going to be done in a prudent, step-by-step way, with safety foremost in our minds,” John Hickey, the agency’s deputy associate administrator for aviation safety, told the Air Line Pilots Association (ALPA) Air Safety Forum. While the agency has allowed some commercial operations of small unmanned aircraft by exemption to its current rules, it will take “slow, deliberative steps before letting UASs into more busy airspace,” he added.
CoordinatesCoordinates September 2014 | 55
SD34_CMPL_September 2014.indd 55SD34_CMPL_September 2014.indd 55 02/09/14 8:01 am02/09/14 8:01 am

NEWS - LBS
$2.6M raised for ultra-precise GPS System
Swift Navigation has developed a GPS module that comes at a fraction of a cost of competing chips with the same accuracy. To do so, it’s raised $2.6 million in funding to get its low-cost GPS modules embedded into a whole bunch of new devices. And while highly accurate GPS chips are already available for up to $10,000, Swift Navigation makes and sells its chips for about $500. http://techcrunch.com/
TeleCommunication Systems adds 10 U.S. Patents
TeleCommunication Systems, Inc has announced that the U.S. Patent and Trademark Offi ce (USPTO) have issued TCS 10 U.S. patents during the second quarter of 2014. The 10 recently issued U.S. patents describe innovations in messaging, location-based services, GIS/mapping and wireless. They include the following three:
• TCS reported in the fi rst quarter that it was issued a Prepaid Short Messaging Services patent. In the second quarter, TCS received notice that another prepaid patent was issued to the company that will serve as one of the cornerstone patents in a monetization program that TCS is planning to launch later this year.
• A geofence defi nes a virtual spatial boundary for creating triggers when a mobile device either enters or exits that boundary. The recently issued TCS patent covering a Method and System for Identifying and Defi ning Geofences (U.S. 8,731,813) describes techniques to simply and easily create geofences based on real-world objects or places.
• Thousands of portable computing platforms have emerged that have the capability of directly connecting to the Internet either through a wireless wide area network (e.g., cellular network or campus WiFi network) via a front-end built into the device (smartphone, etc.), or, via Bluetooth or other short-range wireless communication,
to a wireless proxy device such as a modem or a smartphone.
The recently issued Remotely Provisioned Wireless Proxy patent (U.S. 8,712,408) describes techniques to create white lists (allowed URLs) and black lists (disallowed URLs) within a wireless/mobile device acting as a proxy so that access to certain sites can be controlled effectively. www.telecomsys.com
LBS market to reach $43.3Bn by 2019
According to Juniper Research forecasts that the Mobile Context and Location Services market will reach $43.3bn in revenue by 2019, rising from an estimated $12.2bn in 2014. The report highlighted that over two-thirds of revenues will be driven through highly targeted and contextually aware ad-supported apps by the end of the forecast period. www.juniperresearch.com
GPS tracking devices to Break $3.5 Billion in 2019
Health, commercial/enterprise, wearables, and iBeacons will help to revive the GPS tracking device market, with ABI Research forecasting the market to reach over $3.5 billion in 2019. In its latest report, “Personal Location Device and Application Markets”, it considers adoption of GPS devices and smartphone applications across family, elderly/health, lone worker, pets, and personal assets. www.abiresearch.com
Spirent enhances location availability for VoLTE E911
Spirent Communications has announced major enhancements that will help improve location accuracy for E911 calls indoors. The additional test capabilities on Spirent’s 8100 Location Technology Solution (LTS) enable operators to deliver optimal location performance to support VoLTE E911 calling and to understand how LTE positioning technologies such as OTDOA can help meet the recently proposed FCC regulations for E911 indoors. LTE brings a promise of improved location accuracy with new positioning technologies and their integration using hybrid techniques.
HERE for Samsung
HERE has partnered with Samsung to bring its maps and location platform services to Tizen-powered smart devices by Samsung, including the newly-announced Samsung Gear S. HERE is powering an application called Navigator, which offers turn-by-turn walk navigation and public transit routing. http://360.here.com
3G/4G technologies to dominate cellular M2M communications
According to Berg Insight, the global cellular M2M market has entered a period of transition from 2G to 3G/4G technologies. The share of cellular M2M devices connected to HSPA/LTE networks is projected to more than double from less than 20 percent at the end of 2014 to more than 50 percent by 2018. www.berginsight.com
Low power GNSS module by CSR, Maestro
Hong Kong based Maestro Wireless Solutions and CSR plc have announced the immediate availability of the A5100-A, a next-generation SiRFstarV™ GNSS positioning module that combines high performance GPS and GLONASS receiver technology in a small 10 x 15 mm package. The A5100-A is the fi rst release within Maestro’s new line of GNSS receivers. www.maestro-wireless.com
56 | CoordinatesCoordinates September 2014
SD34_CMPL_September 2014.indd 56SD34_CMPL_September 2014.indd 56 02/09/14 8:01 am02/09/14 8:01 am

China successfully launches remote sensing satellite
China recently has successfully launched a remote-sensing satellite to carry out scientifi c experiments and provide early alerts about natural disasters. The Yaogan XX satellite will be used to conduct scientifi c experiments, carry out land surveys, monitor crop yields and aid in preventing and reducing natural disasters. The launch marked the 190th mission for the nation’s Long March rocket family. http://articles.economictimes.indiatimes.com
China to launch satellite for Venezuela
The China Aerospace Science and Technology Corporation (CASC) has signed an agreement with Venezuela for in-orbit delivery of a second remote sensing satellite for the country, the company said. CASC subsidiary Great Wall Industry Corporation will be the major contractor of the project, the
corporation said. But the corporation did not give a specifi c timeframe for the project. www.globalpost.com
Atlas 5 launches DigitalGlobe’s WorldView-3
An Atlas 5 rocket blasted off from California and streaked into orbit carrying the most powerful remote sensing satellite ever built for the commercial market, a spacecraft capable of zooming in on a baseball fi eld and detecting home plate from an altitude of nearly 400 miles.
Powered by a Russian-built RD-180 fi rst-stage engine, the rocket streaked away to the south over the Pacifi c Ocean toward a polar orbit where DigitalGlobe’s WorldView-3 satellite will be able to image the entire planet as it rotates below.
Capable of resolving surface features as small as one foot across, WorldView-3 features a state-of-the-art multi-spectral imaging system, a high-speed data downlink operating at 1.2 gigabits per
second and control moment gyroscopes that will allow ground controllers to quickly re-orient the spacecraft for on-demand observations. www.cbsnews.com/
NM Group Selects Leica RCD30 Cameras
Leica Geosystems has announced that NM Group has selected three sets of its latest Leica RCD30 aerial medium format cameras as a multi-angle camera system to capture infrastructure assets with the highest quality. These systems have been added to an existing airborne sensor suite to execute high-quality helicopter based corridor mapping.
This innovative solution with 80 megapixel resolution provides the highest possible detail available from a helicopter platform. A simultaneous full color and near infrared (NIR) downwards camera provides new opportunities to intelligently manage vegetation on asset corridors, in addition to the creation of high-quality imagery mosaics.
NEWS - IMAGING
TM
March_013_GGS_Ad_AS.indd 1 2/27/2013 10:10:39 AMSD34_CMPL_September 2014.indd 57SD34_CMPL_September 2014.indd 57 02/09/14 8:01 am02/09/14 8:01 am

NEWS - GNSS
developing the ERA-GLONASS road accident emergency response system.
Russian President Vladimir Putin earlier gave instructions to develop a roadmap for establishing GLONASS public company with a 100% stake as an operator of the ERA-GLONASS state automated information system based on data provided by Russia’s GLONASS satellite group.
The roadmap, which will be implemented in 2014-2018, is designed to cut federal expenditures on the ERA-GLONASS operation from the current $16 million to zero and achieve the system’s annual gross revenues of $138 million.
ERA-GLONASS aims to shorten the time when rescuers arrives in road traffi c accidents: in case of a traffi c accident, information on a transport vehicle, including its precise coordinates, will be automatically transferred to a control center of the 112 emergency response system, which will dispatch emergency response teams to the scene of the accident.
Scientists claim GPS data has fi nally solved the ‘Sheepdog Mystery’
With a GPS tracking device attached to its back, an Australian sheepdog has fi nally revealed how a single canine can control a rebellious fl ock, according to a new study.
The “sheepdog mystery” has baffl ed scientists and mathematicians for generations, but a new paper in a journal by Britain’s Royal Society says the secret lies in the animal fi rst bringing the sheep together by weaving side-to-side at their rear, then driving them forward. The study suggests that a talented sheepdog could use the technique to control a fl ock up to 100-strong.
Researchers hope that the new knowledge can be applied to future planning with regards to crowd control, and even guiding groups of exploring robots across remote terrains. http://time.com
JAVAD GNSS is introducing its new unmanned aerial vehicle - TRIUMPH-F1 unmanned aerial vehicle, which is based on the JAVAD GNSS TRIUMPH-1. It is the company’s fi eld-tested high-precision geodetic GNSS receiver with 864 channels to track all current and future GNSS signals.
When used on the ground, the TRIUMPH-F1 can function as a TRIUMPH-1 base or rover. The four motor arms (for eight motors) are detachable. There are four screw inserts in the bottom to attach the TRIUMPH-F1 to a pole mount for fi eld use. It features user-friendly mission programming. The four lithium
TRIUMPH-F1 UAV by JAVAD
polymer batteries that power the eight propeller motors, arranged in a stacked quad formation, each have a test button and LEDs to indicate the current charge level, as well as accessible ports for easy charging.
The TRIUMPH-F1 also has two micro-SD slots for image storage, a SIM card slot, a USB connector for uploading fl ight plans and downloading collected images, and indicators for satellite tracking and communications. Other indicators are dedicated to fl ight status and gyro. It comes equipped with four angled documentation cameras and a downward high-precision camera for photogrammetry. www.javad.com/
Russian government may turn GLONASS union into joint stock fi rm
The Russian government may turn non-commercial Partnership GLONASS, which will provide services on the basis of the state accident emergency response system ERA-GLONASS, into a joint stock company and sell a minor stake in it to attract investment.
The Transportation Ministry suggested creating the ERA-GLONASS operator as a public-private partnership by creating a joint stock company from GLONASS with a further expansion of the number
of shareholders through a placement of new shares. At present, the GLONASS partnership comprises 12 companies, including state-controlled telecom giant Rostelecom, Internet company Yandex and the country’s three largest mobile operators – MTS, MegaFon and VimpelCom, operating under the Beeline brand. http://www.brics-info.org
Roadmap for ERA-GLONASS road accident response system
Russian Prime Minister Dmitry Medvedev has approved a roadmap for establishing GLONASS public company and
58 | CoordinatesCoordinates September 2014
SD34_CMPL_September 2014.indd 58SD34_CMPL_September 2014.indd 58 02/09/14 8:01 am02/09/14 8:01 am

NEWS - GIS
GIS mapping to check on school dropouts
Tamil Nadu, India would be the fi rst state in the country to integrate GIS mapping with the education management information system to check on school drop outs, IT Minister ‘Mukkur’ N Subramanian said. “The GIS mapping clubbed with the Education Management Information System will help the department to keep a track of not only the schools but also every school going child”, the minister said. www.dnaindia.com
Minister instructs DDA to complete mapping of land in 3 months
Delhi Development Authority (DDA) and all the municipal bodies of Delhi have been instructed by the Urban Development Minister M Venkaiah Naidu to get their respective land mapped properly using GIS and Information Technology. Naidu instructed that details of the land should be made available in the public domain and all
MPs, MLAs and Corporators and general public should provide necessary information in this regard to respective agencies so that the problem of encroachment can be addressed. www.thehindubusinessline.com
Meghalaya, India to tap wind energy
Power-starved Meghalaya, India is preparing “wind energy density maps” to identify regions in the mountainous state where wind energy could be tapped to meet the power requirement. “The MeECL (Meghalaya Energy Corporation Limited) is mapping certain areas of the state where wind mills could be set up to harness the energy,” John Kharshiing, co-chairman of the Meghalaya State Planning Board. http://twocircles.net
Turkey launches giant geoportal
The Turkish government has launched Gezgin Geoportal, a project that will provide a detailed image of the country’s landscape by the RASAT Satellite, with a member of the Cabinet calling it a “strategic” move at a time when the world
has turned into a “Big Brother House.” “There is great competition in the fi eld of space industry. At a time when the world is becoming increasingly smaller and when everywhere is being observed like a BBG [the abbreviation of the Turkish version of the Big Brother television show] house; information, informatics and surveillance have become important in the world,” Science, Industry and Technology Minister Fikri Işık said during launching ceremony of the Gezgin Geoportal.
UEM group implements ArcFM UT
The French multi-utility UEM group has successfully completed all tests for the implementation of ArcFM UT for district heating and went with it in production. With this step the project phase 2 has been nearly completed. It was started in February 2013 after the decision by both UEM and its subsidiary URM to implement the ArcGIS and ArcFM UT platform with project partners Esri France and AED-SICAD. Project phase 3 (implementation of electricity) is well under way.
SD34_CMPL_September 2014.indd 59SD34_CMPL_September 2014.indd 59 02/09/14 8:01 am02/09/14 8:01 am

NEWS - INDUSTRY
New IMU to SPAN line of GNSS products by NovAtel
NovAtel Inc. has added the IMU-ISA-100C as an inertial measurement unit (IMU) option to its SPAN GNSS+INS line of positioning products. It is a high-performance, near navigation-grade IMU designed for platform stabilization, general-purpose navigation, photogrammetry, remote sensing, and ground mobile-mapping applications. Commercially exportable, the IMU-ISA-100C integrates easily with a NovAtel SPAN capable receiver to provide a tightly coupled 3D navigation solution. Offering customers continuous position, velocity and attitude (roll, pitch and
azimuth) measurements, a SPAN system is stable and available even through periods when satellite signals are blocked or unavailable. With the IMU-ISA-100C, customers will receive near navigation-grade performance, at an affordable price point. The product also features a new enclosure designed to maximize versatility for a range of applications.
PCTEL unveils GPS/GLONASS high rejection time sync antennas
PCTEL, Inc has announced its new series of GPS/GLONASS High Rejection Time Sync antennas. These new multi-GNSS antennas use advanced fi lter technology that allows the same antenna to cover both GPS L1 and GLONASS L1 frequencies while maintaining PCTEL’s industry-leading high rejection performance. Their robust IP67-compliant design provides durability for long-term deployments. www.pctel.com
GPU-Based Orthorectifi cation Module
SimActive Inc has announced Correlator3D™ version 5.3, with signifi cantly faster ortho rectifi cation. The process is now powered by GPU
technology and multi-core CPUs, leading to a tenfold increase in processing times compared to previous versions. Correlator3D™ also includes a new feature for displaying, in real-time, the generated ortho photos. This allows visual monitoring of results as they get produced. www.simactive.com
Topcon releases new UAS for aerial mapping
Topcon Positioning Group has released two unmanned aerial systems (UAS) for mapping — the Sirius Pro and Sirius Basic. Both systems are designed to produce the most accurate solutions for the automated mapping of a wide range of sites — regardless of terrain. The fi xed-wing systems resulted from a partnership with MAVinci GmbH, a UAS development company with which Topcon recently entered into a worldwide distribution agreement.
SafScan™ High Defi nition Laser Surveying
Safway is introducing SafScan™ High-Defi nition Laser Surveying, which can deliver accurate, precise 3D images of existing conditions at any industrial plant, off-shore facility, bridge or other commercial site. Safway’s SafScan technology creates a precise, as-built copy of any jobsite using state-of-the-art laser scanning equipment. www.safwaygroup.com
Fugro launches Seastar XP2
Fugro Satellite Positioning has released its Seastar XP2 PPP GNSS augmentation service, which provides increased redundancy for mission-critical offshore GNSS position and navigation applications. XP2 is an L1/L2, phase-based, Orbit and Clock PPP service. Similar to the 24+ American GPS satellites, XP2 incorporates a number of Russian GLONASS satellites to generate corrections that permit the calculation of a real-time position solution. The new XP2 service mimics Fugro’s fl agship G2 and offers accuracies approaching it. www.marinelink.com/
Pacifi c Crest XDL Rover 2
Trimble has introduced the new Pacifi c Crest® XDL Rover 2, an advanced, high-speed, wireless data link built to withstand the rigors of GNSS/RTK surveying and precise positioning. It is equipped with Bluetooth®
wireless communication for ease in confi guration and operation. It can be quickly confi gured with an Android device in the fi eld and UHF data can be transmitted via Bluetooth to a paired host device for operational effi ciency. It is designed for digital radio communications between 403 and 473 MHz in either 12.5 or 25 kHz channels. The XDL Rover 2 is pocket sized and provides for cableless operations. It features an
Trimble News
internal, rechargeable battery for ease of use and portability that allows long operational hours. www.trimble.com
Trimble SeismoGeodetic system
Trimble has introduced an integrated GNSS reference receiver, broadband seismic recorder and a force-balance triaxial accelerometer for infrastructure and precise scientifi c applications―the Trimble® SG160-09 SeismoGeodetic system. It provides real-time GNSS positioning and seismic data for earthquake early warning and volcano monitoring as well as infrastructure monitoring for buildings, bridges, dams as well as other natural and manmade structures. www.trimble.com
WorldView-3: First Images!
60 | CoordinatesCoordinates September 2014
SD34_CMPL_September 2014.indd 60SD34_CMPL_September 2014.indd 60 02/09/14 8:01 am02/09/14 8:01 am

Simrad announces GLONASS compatibility in MX series
New Simrad MX Series MX521B Smart Antenna, and HS80A and MX575D DGNSS Compasses have been announced. The new products are compatible with the GPS and the GLONASS. Enhancing heading and position performance, and reducing the time taken for position acquisition, the new Simrad MX521B Smart Antenna, HS80A compass and MX575D compass feature increased lock-on speed and accuracy in challenging conditions. Latest GN70/MX610/MX612 Control and Display Unit (CDU) software can be used with these antennas for both GPS and GLONASS functionality. pro.simrad-yachting.com/en
GigOptix GNSS RF receiver
GigOptix, Inc has announced sample availability of its newest GNSS RF Receiver for Road, Maritime, Agriculture and Surveying applications. This device
is expected to be one of several RF focused products the Company will bring to market over the next few quarters stemming from the recently acquired Tahoe RF Semiconductor, now called the GigOptix-Auburn RF Design Center after its integration into GigOptix. EXG0201 is a low-power consumption, highly linear RF GNSS receiver in a small Quad Flat No-Lead (QFN) package. The fully integrated device is optimized for industrial applications and has dual channels supporting both the upper and lower GNSS bands. www.gigoptix.com
Carlson BRx5 GNSS Receiver
The Carlson BRx5 GNSS receiver, an integrated all-in-one pole-top GNSS receiver, has just been released by Carlson Software, Inc. Each BRx5 contains a multi-constellation, multi-band 270-channel GNSS receiver, internal GSM cell modem, UHF radio, dual hot-swappable batteries and internal level sensors. Designed for survey and GIS professionals,
the it delivers both affordability and the highest positional accuracy.
POM & Juniper Systems Provide Parking Meter Management Solutions
POM Incorporated (POM), based in Russellville, Arkansas, USA, utilizes Juniper Systems’ Archer 2™ rugged handheld to provide innovative, energy-effi cient parking meter solutions. The Archer 2 is used to collect data with POM’s POMComm parking meter management app, which then transfers collected data to its cloud-based software, MeterManager.Net. POM’s newest parking meter, the Parktel 2.0, offers easy installation, innovative technology, and power conservation.
3D laser mapping for French rail network
French surveyors FIT ESIC are creating a 3D topographical map of track and lineside equipment for French
effi gis.com/ezsurvCompatible with
POWER AND PRECISIONAT YOUR FINGERTIPS
EZSURV ® POST-PROCESSING SOFTWAREPROVIDES YOU WITH:
Access to more than 8,000 CORS stations data all around the world
Support multiple receiver native data format
State-of-the-art processing engine
Easy-to-use application
Flexible licensing mechanism
White Label version available for manufacturers
SD33_CMPL_effigis_Aug_Ad_AS.indd 1 01/08/14 11:46 pmSD34_CMPL_September 2014.indd 61SD34_CMPL_September 2014.indd 61 02/09/14 8:01 am02/09/14 8:01 am

MARK YOUR CALENDAR
September 2014GIScience 2014GIScience 2014
Vienna, Austria23 – 26 Septemberwww.giscience.org
October 2014INTERGEO 2014INTERGEO 2014
7 - 9 OctoberBerlin, Germanywww.intergeo.de
6thth Asia Oceania Regional Workshop on GNSS Asia Oceania Regional Workshop on GNSS 9-11 October Phuket, Thailandwww.multignss.asia/workshop.html
GeoFormGeoForm14-16 October 2014Moscow, Russiahttp://www.geoexpo.ru/en-GB
Esri Mid-East & Africa User ConferenceEsri Mid-East & Africa User Conference22 - 24 October 2014 Kuwaithttp://www.esri.com/events/meauc
ISGNSS2014ISGNSS201422 - 24 OctoberJeju Island, Korea www.isgnss2014.org
35th Asian Conference on Remote Sensing35th Asian Conference on Remote Sensing27-31 October Nay Pyi Taw, Myanmarwww.acrs2014.com
NZIS Conference 2014NZIS Conference 201429 Oct - 1 NovNew Plymouth, New Zealandwww.nzisconference.org.nz/
November 2014Trimble Dimensions 2014Trimble Dimensions 2014
3 - 5, November Las Vegas, USAwww.trimbledimensions.com
5th ISDE Digital Earth Summit 5th ISDE Digital Earth Summit 9 - 11 NovemberNagoya, Japan, www.isde-j.com/summit2014/
4th International FIG 3D Cadastre Workshop 4th International FIG 3D Cadastre Workshop 9-11 NovemberDubai, United Arab Emirateswww.gdmc.nl/3DCadastres/workshop2014/
G-spatial EXPOG-spatial EXPO13-15 November Tokyo, Japanhttp://www.g-expo.jp/
1111thth International Symposium on International Symposium on Location-based Services Location-based Services
26 -28 November Vienna, Austriawww.lbs2014.org/
December 2014PTTI 2014: Precise Time and Time Interval PTTI 2014: Precise Time and Time Interval Systems and Applications MeetingSystems and Applications Meeting
1 – 4 DecemberBoston, Massachusetts, U.S.A.www.ion.org/ptti/future-meetings.cfm
European LiDAR Mapping Forum European LiDAR Mapping Forum 8-10 December Amsterdam, The Netherlandswww.lidarmap.org/europe
February 2015The Unmanned Systems ExpoThe Unmanned Systems Expo
4 - 6 FebruaryThe Hague, The Netherlandshttp://www.tusexpo.com
The International Navigation Conference The International Navigation Conference 24-26 FebruaryManchester, UKwww.internationalnavigationconference.org.uk/
March 2015Locate15Locate15
Brisbane, Australia10 – 12 Marchwww.locateconference.com
Munich Satellite Navigation Summit 2015Munich Satellite Navigation Summit 201524 – 26 MarchMunich, Germanywww.munich-satellite-navigation-summit.org
May 2015RIEGL LIDAR 2015 User ConferenceRIEGL LIDAR 2015 User Conference
5 - 8, MayHong Kong & Guangzhou, China
3636thth International Symposium on International Symposium on Remote Sensing of EnvironmentRemote Sensing of Environment
11-15 MayBerlin, Germanyhttp://www.isrse36.org
FIG Working Week and General AssemblyFIG Working Week and General AssemblySofi a, Bulgaria17 – 21 Maywww.fi g.net
GEO Business 2015GEO Business 201527 - 28 MayLondon, UKhttp://geobusinessshow.com/
June 2015TransNav 2015 TransNav 2015
17 - 19 June Gdynia, Polandhttp://transnav2015.am.gdynia.pl
July 201513th South East Asian Survey Congress13th South East Asian Survey Congress
28 – 31 July, Singaporewww.seasc2015.org.sg
National Railways (SNCF) using the StreetMapper LiDAR laser surveying system developed by 3D Laser Mapping, Britain. The device, which is mounted on a rail vehicle, is being used to scan several hundred kilometres of rail infrastructure and the data gathered from millions of individual laser-scanned measurements is used to generate engineering-grade survey data and a 3D topographical map of the track, catenary, and trackside area. SNCF says the data is being used to provide topographical inputs for studies into infrastructure enhancements, gauging, and electrifi cation projects.
New GNSS market outlook report forecasts to 2020
Research and Markets has announced the addition of the “GNSS Market Outlook 2020″ report to its offerings. According to the report, the GNSS market is expected to fl ourish with new technological applications and is anticipated to grow at a CAGR of 9.4 percent during 2014-2020. The report analyzes the GNSS market by its major application areas such as LBS, transportation, surveying, and agriculture, over a period of eight years (2013-2020).
Inertial Navigation System market worth $4.63 billion by 2019
According to a new market research report the “Inertial Navigation System Market by Product (Marine grade, Navigation grade, Tactical grade, and Commercial grade), Technology (Mechanical, Fiber optic gyro (FOG), Ring laser gyro (RLG), Micro-Electro-Mechanical Systems (MEMS), Hemispherical Resonator gyro (HRG), and Vibrating gyro), Application (Air, Land, and Naval Platforms), Geography (North America, Europe, Asia-Pacifi c, the Middle East, and ROW) - Forecast & Analysis to 2014 - 2019” is estimated at $2.75 billion in 2014 and is expected to register a CAGR of 10.98% to reach $4.63 billion by 2019. www.marketsandmarkets.com
62 | CoordinatesCoordinates September 2014
SD34_CMPL_September 2014.indd 62SD34_CMPL_September 2014.indd 62 02/09/14 8:01 am02/09/14 8:01 am

SD34_CMPL_Navcom_Sep_Ad_AS.indd 1 29/08/14 2:04 amSD34_CMPL_September 2014.indd 63SD34_CMPL_September 2014.indd 63 02/09/14 8:01 am02/09/14 8:01 am

NEWS - GIS
NovAtel CORRECT™ with TerraStar
Decimetre-level positioning. Anywhere, anytime. No local RTK base station or support infrastructure required.
LIMITED TIME OFFER
Trade in your legacy NovAtel hardware for a FlexPak6™, antenna and 1-year TerraStar subscription for only $4,995.00
ORCurrent OEM6® customers, buy a 1-year TerraStar subscription and get your authorization code upgrade for free
Call: 1-800-NovAtel (1-800-668-2835) E-mail: [email protected] Visit NovAtel.com/terrastar-promo for more information.
SD33_CMPL_NovAtel_Aug_Ad_AS.indd 1 31/07/14 11:12 pmSD34_CMPL_September 2014.indd 64SD34_CMPL_September 2014.indd 64 02/09/14 8:01 am02/09/14 8:01 am