DETAILED PROTOCOL FOR AN ACCURATE NON-DESTRUCTIVE DIRECT DATING OF TOOTH ENAMEL FRAGMENT USING...
12
ISSN 1897-1695 (online), 1733-8387 (print) © 2013 Silesian University of Technology, Gliwice, Poland. All rights reserved. GEOCHRONOMETRIA 40(4) 2013: 322-333 DOI 10.2478/s13386-013-0132-7 Available online at www.springerlink.com DETAILED PROTOCOL FOR AN ACCURATE NON-DESTRUCTIVE DIRECT DATING OF TOOTH ENAMEL FRAGMENT USING ELECTRON SPIN RESONANCE RENAUD JOANNES-BOYAU Southern Cross GeoScience, Southern Cross University, Lismore, NSW, 2480, Australia Received 7 January 2013 Accepted 30 August 2013 Abstract: In the context of human evolution, fossil remains are too valuable to be destroyed and any alteration should be kept to a minimum. The newly developed protocol on fossil fragments has open the gate for ‘virtually’ non-destructive ESR (Electron Spin Resonance) direct dating of human re- mains. The method allows the separation of unstable and interfering signals that were responsible for large dose underestimation. While a complete investigation of the ESR signal remains a complex task and requires numerous hours of manipulations, a rapid dose assessment protocol can be achieve with- out compromising the accuracy nor the integrity of the sample. The new protocol should be used for future dating regardless of the possibility of measuring powder. Keywords: ESR dating, direct dating, geochronology, fossil tooth enamel. 1. INTRODUCTION To obtain absolute age estimates, scientists have ac- cess to a range of dating techniques; each with their own limitations with respect to the material able to be dated and the time range within each is applicable. Direct dating of hominid fossils remains preferable to other indirect techniques where the age of the sample is interpreted based on its association with the surrounding; it avoids any inaccuracies generated from the misinterpre- tation of taphonomic processes within the site. Improving direct dating techniques such as ESR (Electron Spin Res- onance) is seen as a priority by the archaeological scien- tific world in order to validate proposed chronologies and hypotheses about human evolution. Direct dating of animal and human fossils can only be achieved on biological materials that survive the burial time, mostly bones and teeth depending on the environ- ment (i.e. acidic soil, permafrost, peat-land). ESR dating was first applied to fossil bones in early 1980 (e.g. Ikeya and Miki, 1980; Yokoyama et al., 1981) but did not lay satisfactory results, as the intrinsic constitution of bones does not allow reliable dating (e.g. Grün and Schwarcz, 1987). On the other hand, the use of the enamel fragment from fossil teeth for dose reconstruction has been success- fully reported by numerous studies including Grün et al. (2006, 2008) and Joannes-Boyau and Grün (2011b). Nev- ertheless, most of past dating studies have been carried out on enamel powder, inducing irreversible damage to the sample. In the perspective of world heritage, human fossils are too valuable to be destroyed, and therefore the altera- tion of the sample should be kept to a minimum in order to maintain the integrity of the archaeological remains. One of archaeologists’ requirement to geochronologists was the development of a “non-destructive” direct dating protocol, which does not compromise the accuracy of dating. In Corresponding author: R. Joannes-Boyau e-mail: [email protected]
Transcript of DETAILED PROTOCOL FOR AN ACCURATE NON-DESTRUCTIVE DIRECT DATING OF TOOTH ENAMEL FRAGMENT USING...

ISSN 1897-1695 (online), 1733-8387 (print) © 2013 Silesian University of Technology, Gliwice, Poland. All rights reserved.
GEOCHRONOMETRIA 40(4) 2013: 322-333 DOI 10.2478/s13386-013-0132-7
Available online at
www.springerlink.com
DETAILED PROTOCOL FOR AN ACCURATE NON-DESTRUCTIVE DIRECT DATING OF TOOTH ENAMEL FRAGMENT USING ELECTRON
SPIN RESONANCE
RENAUD JOANNES-BOYAU Southern Cross GeoScience, Southern Cross University, Lismore, NSW, 2480, Australia
Received 7 January 2013 Accepted 30 August 2013
Abstract: In the context of human evolution, fossil remains are too valuable to be destroyed and any alteration should be kept to a minimum. The newly developed protocol on fossil fragments has open the gate for ‘virtually’ non-destructive ESR (Electron Spin Resonance) direct dating of human re-mains. The method allows the separation of unstable and interfering signals that were responsible for large dose underestimation. While a complete investigation of the ESR signal remains a complex task and requires numerous hours of manipulations, a rapid dose assessment protocol can be achieve with-out compromising the accuracy nor the integrity of the sample. The new protocol should be used for future dating regardless of the possibility of measuring powder. Keywords: ESR dating, direct dating, geochronology, fossil tooth enamel.
1. INTRODUCTION
To obtain absolute age estimates, scientists have ac-cess to a range of dating techniques; each with their own limitations with respect to the material able to be dated and the time range within each is applicable.
Direct dating of hominid fossils remains preferable to other indirect techniques where the age of the sample is interpreted based on its association with the surrounding; it avoids any inaccuracies generated from the misinterpre-tation of taphonomic processes within the site. Improving direct dating techniques such as ESR (Electron Spin Res-onance) is seen as a priority by the archaeological scien-tific world in order to validate proposed chronologies and hypotheses about human evolution.
Direct dating of animal and human fossils can only be achieved on biological materials that survive the burial
time, mostly bones and teeth depending on the environ-ment (i.e. acidic soil, permafrost, peat-land). ESR dating was first applied to fossil bones in early 1980 (e.g. Ikeya and Miki, 1980; Yokoyama et al., 1981) but did not lay satisfactory results, as the intrinsic constitution of bones does not allow reliable dating (e.g. Grün and Schwarcz, 1987). On the other hand, the use of the enamel fragment from fossil teeth for dose reconstruction has been success-fully reported by numerous studies including Grün et al. (2006, 2008) and Joannes-Boyau and Grün (2011b). Nev-ertheless, most of past dating studies have been carried out on enamel powder, inducing irreversible damage to the sample. In the perspective of world heritage, human fossils are too valuable to be destroyed, and therefore the altera-tion of the sample should be kept to a minimum in order to maintain the integrity of the archaeological remains. One of archaeologists’ requirement to geochronologists was the development of a “non-destructive” direct dating protocol, which does not compromise the accuracy of dating. In
Corresponding author: R. Joannes-Boyau e-mail: [email protected]

R. Joannes-Boyau
323
1995, already Grün raised the question, by foreseeing the inevitable evolution of direct dating of fossil remains, using enamel fragment instead of powder. Unfortunately the methods raised several problems that had to be re-solved in order to produce usable data.
Here we present a comprehensive protocol that allows virtually non-destructive dose reconstruction of fossil enamel fragment without compromising the accuracy of the dating.
2. ENAMEL STRUCTURE
Dental enamel is the utmost mineralized structure in the human body, formed within a unique extracellular matrix from ameloblast cells secretion (Johnson, 1998). It constitutes an interface layer between organic and pseu-do-organic tissue within the oral environment, very well adapted to resist the mechanical stresses of mastication. The tissue does not present any cells or vestige of cells; it is an inorganic mineral structure, composed of 96 to 97% of hydroxylapatite (HAp, Ca10(PO4)6(OH)2) crystal, <1% of organic impurities (0.4-0.9%), and 2 to 3% of intersti-tial water (Hillson, 1986; Driessens, 1980). Because of an intricate structure, enamel fragments do not have the same properties as HAp single crystals do (e.g. unclear main crystal axes). Firstly, the enamel crystal structure has a problematic pattern, with significant anisotropy, which complicates the establishment of experimental protocols. The growth of HAp crystals in the enamel is complex, forming rhombic prisms with vertical sides, which have complex three-dimensional structures (Macho et al., 2003; Fig. 1A). HAp crystals are elongated prisms (~4 to 8 μm diameter and ~16 μm long), grouped in beams, parallel in the direction of the length (extending from the enamel-dentine junction (EDJ)) and agglomerate to each other by a semi-amorphous interprismatic phase (Driessens, 1980; Lester and Koenigswald, 1989; Fig. 2).
The HAp crystal is filled with impurities that get trapped within the crystal lattice. In particular carbonates which play the role of precursor for the creation of the paramagnetic CO2
- radical, are exuded by the amelo-blastes to increase the pH and avoid demineralisation (Smith and Tafforeau, 2008).
The ESR signal of fossil enamel is composed by a multitude of radicals located in different domains (e.g. prismatic and interprismatic phase) of the enamel that forms the amalgamated spectra by superposition (Fig. 1B). The asymmetrical signal around g=2 is composed by radicals with different radiation and temperature sensi-tivities (for more details see Brik et al.; 2000a; Callens et al., 1995; Vanhaelewyn et al., 2000a, 2000b; Ishchenko et al., 2002; Grün et al., 2008; Joannes-Boyau and Grün, 2009, 2011a, 2011b; Joannes-Boyau et al., 2010a, 2010b). The spectrum is shaped by three main peaks T1, B1 and B2, with g-values at g=2.0030, g=2.0015 and g=1.9975, for T1, zero passing and B2 respectively (Fig. 1B, shows a typical powder spectrum), which are at-
tributed to several CO2- radicals (Brik et al., 2000b;
Callens et al., 1998). Other radicals are known to inter-fere with the main signal including CO3
-, CO33-, methyl,
SO2-, O-, O3
-, CO- and several wide lines (for a compila-tion see Callens et al., 1995; Joannes-Boyau and Grün, 2011a, 2011b).
Fig. 1. (A) SEM picture of the enamel structure with detail of the rhom-bic prisms; (B) Shape of the ESR spectra of fossil tooth enamel pow-der representing the three main peaks T1, B1 and B2 with g-values g1, g2 and g3 for T1, zero passing and B2 respectively.
Fig. 2. Simplified enamel prism organization. The two main phase enamel prism and the enamel inter-prismatic structure are believed to have radicals within with different thermal stability.
NON-DESTRUCTIVE ESR DIRECT DATING PROTOCOL OF ENAMEL FRAGMENT
324
3. ESR MEASUREMENTS OF FOSSIL TOOTH ENAMEL
Measuring enamel powder For the past decades, most direct dating of fossil teeth
with ESR have been conducted on powder enamel. Main-ly, because powder offers a multi-aliquot dating approach which increase sample output and at the same time sup-press the angular dependency easing the readability of the spectrum. Powder is usually obtained by gently crushing cleaned enamel pieces (e.g. free from dentine, cement and residue) using a mortar and pestle until creating a homog-enized sample with crystal smaller than 200 microns. Therefore, the ESR spectrum of powder corresponds to an average orientation of micro crystal in random orienta-tion (Fig. 1B). Nevertheless, to use the signal for dating purposes, we have to postulate that first, no signals are induced nor lost by the mechanical action (unfortunately proven by many studies to be the opposite (e.g. Aragno et al., 2001)); and secondly, that the signal is composed by one or several CO2
- radicals that possess the same kinet-ics properties
Furthermore, a major drawback from using powder was always the irreversible damage to the tooth, which in light of valuable human remains is often considered as unacceptable. This can be overcome by using a fragment instead, which offers little or no visible damage and can be therefore considered as virtually non-destructive.
Measuring enamel fragments
Removing the fragment The initial step of sample preparation requires a frag-
ment to be removed from the tooth. The use of natural cracks in the enamel offers the best opportunity to sepa-rate the fragment, causing minimal damage. Small frac-tures frequently occur on fossil enamel due to environ-mental processes during burial. With a small pressure on the side, the fragment is easily removed. Alternatively, if the sample does not possess any fractures, the use of a diamond saw might be required. Nevertheless the later process should be avoided whenever possible to minimise damage to the fossil. All organic material as well as ce-ment (usually absent from human fossil teeth) and den-tine need to be carefully separated from the enamel. Dur-ing these stages it is important not to apply the tools too vigorously, so as to prevent the creation of a mechanical-ly-induced ESR signal (Desrosiers et al., 1989). When all experiments have been completed, the fragment can be reattached to the tooth, with no apparent damage.
Measurements and angular dependency Powder samples afford an easier protocol for meas-
urement as show in previous paragraphs, since by defini-tion powder corresponds to an average of all orientations. Unfortunately, this does not apply to enamel fragments
which are strongly anisotropic. On the other hand, errors associated with mass fluctuation (i.e. variation of sur-rounding humidity or loss of material during tube trans-fer), are avoided with analyses of fragments.
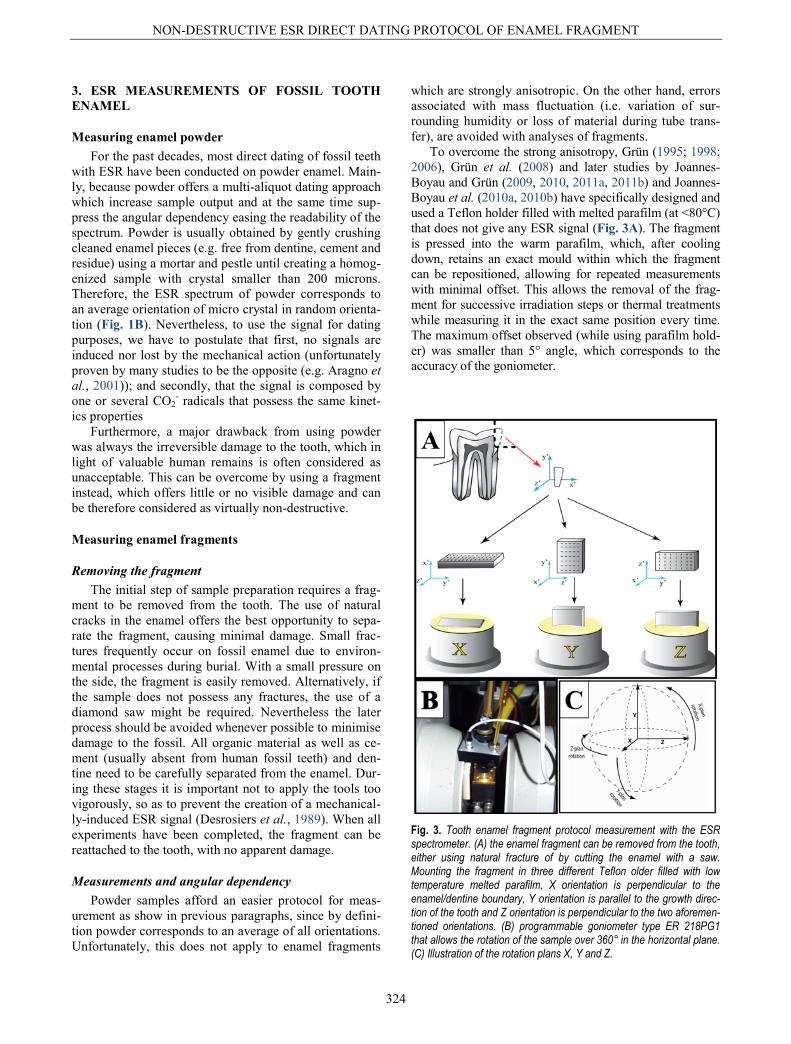
To overcome the strong anisotropy, Grün (1995; 1998; 2006), Grün et al. (2008) and later studies by Joannes-Boyau and Grün (2009, 2010, 2011a, 2011b) and Joannes-Boyau et al. (2010a, 2010b) have specifically designed and used a Teflon holder filled with melted parafilm (at <80°C) that does not give any ESR signal (Fig. 3A). The fragment is pressed into the warm parafilm, which, after cooling down, retains an exact mould within which the fragment can be repositioned, allowing for repeated measurements with minimal offset. This allows the removal of the frag-ment for successive irradiation steps or thermal treatments while measuring it in the exact same position every time. The maximum offset observed (while using parafilm hold-er) was smaller than 5° angle, which corresponds to the accuracy of the goniometer.
Fig. 3. Tooth enamel fragment protocol measurement with the ESR spectrometer. (A) the enamel fragment can be removed from the tooth, either using natural fracture of by cutting the enamel with a saw. Mounting the fragment in three different Teflon older filled with low temperature melted parafilm, X orientation is perpendicular to the enamel/dentine boundary, Y orientation is parallel to the growth direc-tion of the tooth and Z orientation is perpendicular to the two aforemen-tioned orientations. (B) programmable goniometer type ER 218PG1 that allows the rotation of the sample over 360° in the horizontal plane. (C) Illustration of the rotation plans X, Y and Z.

R. Joannes-Boyau
325
The Teflon holder is then inserted in the ESR cavity at the bottom of a large quartz tube. The cavity is then topped up with a programmable goniometer (i.e. type ER 218PG1, from Bruker) that allows the rotation of the sample over 360° in the horizontal plane (Fig. 3B). The goniometer is associated with an ESR spectrometer and X-band microwave bridge (frequency of ~9.5 GHz). Since the sample only rotates in the horizontal plane, three Teflon holders are necessary to measure the sample in every possible configuration (Figs. 3A and 3C). The fragment is mounted in three different orientations, with the goniometer rotating 36 times through incrementing
10° steps, for each orientation. As a result, instead of a single powder spectrum, fragment measurements corre-spond to 108 spectra (Fig. 4). As a convention, Joannes-Boyau and Grün (2009) have defined the three orienta-tions (X, Y and Z) corresponding to respectively the rotation around the axis perpendicular to the Dentine-Enamel-Junction (DEJ), the rotation around the axis par-allel to the direction of the growth, and the rotation around the axis perpendicular to the two other axes. In the aforementioned study, the protocol has been designed using the following settings: 2 mW microwave power, 0.1 mT modulation amplitude, and 12 mT sweep width with a sweep time of 21 s, (experimental settings should carefully transform to suit the enamel structure).
4. DATA SET EVALUATION AND SPECTRUM DECOMPOSITION
Angular measurements of single crystal (rotated around the Y or Z axis) show a signal at different g-values, shifting from the parallel (gz, gx) to the perpen-dicular position (gy) (Fig. 5). In contrast, enamel frag-ments are a partially ordered system and only minor g-value shifts have been observed for the T1-B1 and B2 components (Fig. 6; for more details see Joannes-Boyau and Grün, 2009; Joannes-Boyau et al., 2010a, 2010b). As mentioned previously, the ESR spectra of fossil tooth enamel is a complex composite signals made of several radicals around g=2, that requires some extraction in order to single out the desired signal.
Extraction of interfering signals A large amount of interfering signals have been de-
Fig. 4. Stacks of natural spectra of a fossil tooth fragment; 2-axes plan view; for the three configurations X, Y and Z, row 1, 2 and 3 respec-tively.
Fig. 5. Simulation of the angular ESR spectra of orthorhombic CO2- radicals in a single hydroxylapatite crystal with the mineralogical c-axis in the rotation plane (from Joannes-Boyau et al., 2010a).

NON-DESTRUCTIVE ESR DIRECT DATING PROTOCOL OF ENAMEL FRAGMENT
326
scribed in literature. The denomination sometimes varies from one publication to the other, and the identification and characterisation of each interfering radical falls out of the scope of this publication. For a complete description of radicals we encourage reader to refer to Callens et al., (1989 and 1995), Bouchez et al. (1988), Schramm and Rossi (2000), Vanhaelewyn et al. (2000a and 2000b) and Joannes-Boyau et al., 2010a. The influence of the main known signals can have serious repercussion on the in-tensity measured especially for T1-baseline and T1-B1 (Fig. 7). Most radicals are isotropic and show no increase with irradiation, limiting the effect on the dose response curve of fragment. Nevertheless, a few have shown a clear interference and should be carefully extracted from the signal (Fig. 7).
The isotropic components are subtracted by creating a merged signal that contains all interfering isotropic lines; each individually simulated and fitted to the right intensity, width and g-value (Fig. 8A; for more details refer to Joan-nes-Boyau and Grün, 2009; Joannes-Boyau et al., 2010a).
Two types of CO2- radicals
The number and types of CO2- radicals contributing to
the total ESR signal of tooth enamel is still under debate. Brik et al. (2000a) identified seven different types of CO2
- radicals with very similar g-values, while other studies (Callens et al., 1995; Brik et al., 1998; Ishchenko et al., 2002; Scherbina and Brik, 2000; Joannes-Boyau et al., 2010a) are separating two main types of CO2
- radicals with significantly different kinetic properties. The first radical, non-oriented CO2
- radical (NOCOR) (Callens et al., 1995; Brik et al., 1998; Joannes-Boyau and Grün, 2009), is formed by radicals with non-preferential orien-tation giving rise to a powder spectrum, identical at every angle. The second type or group of radicals, commonly named oriented radicals (AICOR), is strongly anisotropic and is responsible for the angular variation observed in fragments. As shown in Fig. 5, the signal of each radical would approximate (in an ideal situation) a Gaussian line at specific g-value, which would shift with the orientation of the crystal. It is not possible to differentiate the two
species in the powder spectrum due to the nature of the NOCORs. Unlike Callens et al. (1995) who described the two radicals NOCORs and AICORs, but consider the AICORs as only one radical type, Ishchenko et al. (2002) and later by Joannes-Boyau and Grün (2009), have sepa-rated the AICOR group in two species: one orthorhombic at gx=2.0030, gy=2.0015 and gz=1.9970 (R1 radical in red, Fig. 8B) and the other one axial with g-values at g┴ =2.0023 and g//=1.9975 (R1 and R2 radicals in red and blue respectively in Fig. 8B).
Fig. 6. Decomposition of selected angular spectra of a fragment in Z-configuration. Starting from angle where T1-B1 intensity is maximum, and finishing with B2 maximum, which correspond to a rotation of 90° degrees. Top graph represent the measured (full line) and simulated signal (dotted line), and the residual below. The bottom row represent the decomposition of the signal and their behav-iour over 90° degrees with the main compo-nents R1, R2, R3 and B2 in red, blue, black and orange respectively. The lines across the figure indicates the g-values at 2.0030 and 1.9975 in full and dotted lines respectively.
Fig. 7. Influence interfering radicals on the CO2- radical ESR signal. The dotted red line is the undisturbed measured powder CO2- signal. The black line represents the resulting spectrum with 20% interfering signal incorporated (adapted from Vanhaelewyn, 2000a and 2000b).

R. Joannes-Boyau
327
None of this would have caused any interference in the dating, if Brik et al. (1998) had not shown that NOCORs were significantly less stable than the AICOR species (Fig. 9). The kinetic property of each species remains disputed, with Vorona et al. (2006) that found slightly different kinetic properties for the two radical species, than the one described by Brik et al. (1998) and by Scherbina and Brik (2000) (e.g. a higher annealing temperature). Most importantly, the three studies were performed on modern tooth enamel, which complicates the comparison with fossil sample (e.g. modern tooth usually contains a different ratio NOCORs to AICORs, after γ-irradiation between 65% and 80% of NOCORs in modern enamel (Vorona et al., 2006) against 40% in fossil enamel (Joannes-Boyau and Grün, 2009). However, as we will see later in this paper, the percentage of radi-cals varies considerably depending on the estimation methods used.
Similarly, the two AICORs R1 and R2 show different kinetic properties and irradiation sensitivity. The property differences between the two AICORs radicals were ex-tensively discussed by Joannes-Boyau and Grün (2010, 2011a, 2011b) where potential transfer process between the two species was shown.
Extraction of NOCORs The extraction of NOCORs remains a complex task
due to the nature of the signal. By definition the g-values and the signal shape are similar between the two groups of radicals (AICOR and NOCOR) and does not offer any straightforward separation in a fragment and at the pre-sent unachievable on powder sample. The main differ-ences come from the anisotropic response and the differ-ence kinetic properties.
Recent publication by Joannes-Boyau and Grün (2011b) have argued that two types of NOCORS could be identified, with some described as unstable that should be removed from the dating signal and others more stable that should be kept in the dose response curve (on the specific matter of unstable and stable NOCORs we en-courage readers to refer to the aforementioned paper). The later study warns against the use of a common “mag-ic” ratio for all samples, and suggests estimating for each case the corresponding amount for accurate correction. One has to keep in mind that such unstable NOCORs are describe by Joannes-Boyau and Grün (2011b) to be re-sponsible in certain cases of up to 30% age underestima-tion. A range of animal and human teeth were estimated using the following three methods and results are summa-rized in Table 1.
Method 1 (from Grün et al., 2008) The first method (Method 1) was developed by Grün
et al. (2008) and allows fast estimation of the NOCORs
Fig. 8. (A) Extraction of interfering signals from the measured ESR spectra; (Top): Comparison of the measured and simulated spectra at 100° angle (intermediate angle). The residual is offset for better understand-ing and corresponds to the subtraction of the simulated spectrum from the measured spectrum. (Bottom): Position of the isotropic lines, which were combined and subtracted from all measured spectra. (B) Decomposi-tion of the ESR measured spectra; (Top): Comparison of the measured and simulated spectra at 50° angle (T1-B1 maximum). The residual is offset for better understanding and corresponds to the subtraction of the simulated spectrum from the measured spectrum (Bottom): Decomposition using four Gaussian components with the SA procedure (from Joannes-Boyau et al., 2010a).
Fig. 9. Thermal stabilities of the two different types of CO2- radicals, NOCORS – dots and AICORS – stars (adapted from Brik et al., 1998).

NON-DESTRUCTIVE ESR DIRECT DATING PROTOCOL OF ENAMEL FRAGMENT
328
concentration within the spectrum. The starting point was the main difference that exists between the two radicals NOCORs and AICORs: the anisotropic properties. The NOCORs give rise to a spectrum that remains identical at every angle, while the AICORs are strongly influenced by the measuring angle. Grün et al. (2008) defines the composite total spectrum ST (Spectrum Total) as a mix between the AICORs SA (Spectrum AICOR) and NO-CORs SN (Spectrum NOCOR) concentration. This can be simply expressed by the equation (1):
ST =SA + K·SN (1)
SN is the powder spectrum intensity; nevertheless the radical concentration of SN in the total spectrum varies, depending on the organic phases, crystal phases, the age of the sample and the burial conditions. Therefore, K is a factor by which the powder spectrum has to be multiplied to be equivalent to the radical concentration of NOCORs within the sample. The value of K is the coefficient by which the (simulated) powder spectrum needs to be mul-tiplied in order to graphically remove the B2 component of the measured spectrum, this using a simple fitting procedure at B2 minimum.
Because the B2 portion of the spectra is supposedly composed solely of NOCORs and AICORs without any other interfering signal, when B2 is minimal, the signal is considered to be from the NOCORs solely (in reality, the orientation X, Y and Z, does not permit to achieve a “per-fect” angle, and therefore there is a certain error relative to the angle offset). By subtracting K·SN from the total spec-trum, the remaining component represents only the AICORs in the signal. To obtain the exact amount of NO-CORs in the total signal, the B2 signal (at minimum) has to be completely subtracted without deforming the shape of the spectrum around g=2.004. A common mistake is to over-estimate the amount of NOCORs, which frequently results in a depletion of the signal intensity around g=2.004, as well as a bump in the B2 region (Fig. 10).
The powder spectrum used in the estimation should always be obtained by either measuring a powder spec-trum of the same enamel (not achievable for non-destructive analyses) or by merging all spectra from all three configurations, referred herein as the ‘merged spec-trum’. The use of a random powder (referring to a powder spectrum obtained on another tooth fragment) spectrum increases the error in the NOCORs concentration value (Fig. 10). The shape of the powder spectrum can vary greatly between two fragments of two different teeth,
Table 1. Summarizes the various NOCORs percentage found in the Natural signal (prior any irradiation nor thermal treatment) of animal and human enamel fragments. As shown the percentage varies slightly from one method to the other, as well as from one tooth the other (fossil and modern, animal to human, between animal species). There-fore no universal percentage can be applied and each sample needs an independent evaluation.
Percentage of NOCORs in the Natural spectrum Method #1
(Grün et al., 2008)
Method #3 (Vorona
et al., 2006)
Method #3 (Joannes-Boyau
et al., 2010a) Holon Bovid Teeth (1556) 9-13 * 9-10
Holon Bovid Teeth (1557) 10-14 * 10-11
Horse teeth 6-8 * 8 Rhino teeth 12-17 * 14-16 Modern Human 0 0 0 Fossil Human (Broken Hill) 9-10 * 9-10
Fossil Human (North Africa) 9-13 * 10
* According to Method 2, the amount of NOCORs would be anywhere between 0% and 50% of the natural signal, depending on the ratio creation vs. decay of the NOCORs. No accurate estimation can be achieved with Method 2, specifically because it was designed on modern human, which obviously does not have any natural signal.
Fig. 10. Comparison of the amount of NOCORs in the angular measurements (A.M., same spectrum in both side) at B2 minimum, by sub-tracting the powder spectrum (P.S.) obtained from powder of the same tooth multiplied by a factor K and a simulated powder spectrum (S.P.S) multiplied by a factor K’, which are determined by iteration slowly increasing the amount of powder spectrum to be fitted into the measured spectrum. The residual 1 and 2 repre-sent the amount of AICORs in the sample. The # symbol shows an incomplete fitting because of simulation imperfection. The use of PS or SPS induces a significant variation in the amount of NOCORs estimated, 43% to 37% respectively. The estimation on the right clearly exhibits a small over estimation on the residual curve.

R. Joannes-Boyau
329
especially on the T1-B1 and T1-B2 ratios. For example, the use of the actual powder spectrum in the estimation of NOCORs concentration provides a radical concentration of 9-13%, for Holon fossil bovid tooth (Joannes-Boyau and Grün, 2009) and around 10% for Broken Hill sample (Grün et al., 2008), while the use of two random spectra, derived from a Horse fossil tooth and a Rhinoceros fossil tooth (both powdered and measured with the same equipment) gave 6-8% and 12-17% of NOCORS for the two sites respectively (unpublished data)
Method 2 (from Vorona et al., 2006) The second method was originally developed by Vo-
rona et al. (2006). This method is based on the angular variation observed over 360° rotation and a ∆ factor, which is independent of the enamel measured, but con-strained by the irradiation source. The constant ∆ is de-fined by the intensity I measured between T1 and baseline at T1 minimum (Imin) and maximum (Imax). Vorona et al. (2007) estimate that the intensity Imin is equal to the NO-CORs intensity solely. They have postulated that the ratio of NOCORs and AICORs would be identical in all enam-el fragments (animal and human) and independent of the irradiation time. With this hypothesis, exposing an enam-el fragment to UV and gamma irradiation would generate 50% and 35% of AICORs respectively. Nevertheless, Joannes-Boyau et al. (2010b) and Joannes-Boyau and Grün (2009 and 2011b) have demonstrated that the AICORs and NOCORs ratio changes radically from one tooth to the other and is dependent on the type of irradia-tion received. One has to keep in mind that while later publications calculated the ratio on bovid fossil tooth enamel, the technique of Vorona et al. (2007) was under-taken on modern human sample, which certainly explains the discrepancy of the results. Potentially, the methods could represent the solution for powder estimation if the contribution (∆ values) of each irradiation source, α, β and cosmic rays would be known. Therefore, this method does not offer to estimate accurately the amount of NO-CORs in the natural, unless considering that the only contribution to the signal was gamma. Even though we would have to assume the rate in which the NOCORs have decayed to be able to calculate the remaining amount. The technique offers a fast and standardized assessment of the NOCOR/AICOR ratio for every sample after irradiation, but could potentially lead to severe esti-mation errors.
Method 3 (from Joannes-Boyau et al., 2010a) The method proposed by Joannes-Boyau et al.
(2010a), is also based on the angular variation of the sample, however, relies on the fact that the percentage of NOCORs in the sample will flatten the angular response intensity (Fig. 11). After irradiation, the angular response is diminished by the amount of newly created NOCORs (stable and unstable). While the relative amount of stable
NOCORs compare to the AICORs remains constant with irradiation, the unstable NOCORs ratio varies greatly. Each intensity (T1, B1, B2, T1-B1, T1-B2) is measured at every angle and plotted over 360° (Fig. 1). Percentage of unstable NOCORs (represented by a constant value) is subtracted until the angular variation reaches equal values as for the angular variation of the natural (Fig. 11). The value obtain for the NOCORs can vary slightly for each peak intensity, such influence is most of the time small and can be reduced or even eliminated by averaging the NOCORs percentage obtained for each peak intensity. Once, the total amount of unstable NOCORs has been estimated in the irradiation sample, then the intensity can be subtracted before creating the dose response curve.
In any case, the original amount of stable NOCORs needs to be also estimated (Fig. 12A). In that case, the sample has to be measured in all orientation over 360°
each time to allow the calculation of radical orientation within the enamel. This so-called ideal orientation corre-sponds to the plane defined by the rotation of AICORs in which the radicals are perpendicular and parallel every 90° to the magnetic field (Fig. 12B). In this particular case, the B2 region is supposedly free of AICORs when gz is parallel to the magnetic field, and the remaining signal belongs solely to the NOCORs, which by defini-tion correspond to a constant signal at all orientation (Fig. 12). The amount of remaining AICORs in the signal at B2 minimum in ideal orientation, was estimated by Joannes-Boyau et al. (2010a) (using thermal treatment) to be less than 1% of the NOCORs signal, which makes this meth-od extremely accurate, but time consuming.
Fig. 11. Illustration of the effect of irradiation on the angular response (angle is in 10° increment). Blue curve (diamond marker) represent the natural angular variation. Black curve (circle marker) is the angular response after gamma-irradiation, which induces the creation of unsta-ble NOCORs. In Red (square marker) is the angular variation after subtracting the unstable NOCORs. The black curve correspond to the 7th irradiation step, creating 65% NOCORs within the signal inducing the curve to clearly flatten.

NON-DESTRUCTIVE ESR DIRECT DATING PROTOCOL OF ENAMEL FRAGMENT
330
Discussion (method 1, 2 and 3) When comparing the results of method 1, 2 and 3, it
became apparent that method 1 tends to over-estimate the amount of NOCORs because of misalignment problems with AICORs. Nevertheless, even if less accurate com-pared to the method 3, it remains a fast and “sufficiently” accurate method for the measurements of stable NOCORs in the natural spectrum. However, it will introduce large errors when estimating the amount of unstable NOCORs,
as the estimation of stable NOCORs in the natural is reported every time in the calculation after irradiation. For example, Joannes-Boyau et al. (2010b) estimated the amount of stable NOCORs in the natural with method 1 at 10 to 13 and with method 3 between 9 and 10%. A difference of 4% between methods 1 and 3 is negligible, unless this values are used to estimate the amount of unstable NOCORs, then the errors becomes exponentially larger.
5. INVESTIGATION OF THE AICORS AND SIM-ULATED ANNEALING (SA) PROCEDURE
According to Joannes-Boyau and Grün (2011b) study, the different radicals R1 and R2 (Fig. 8) that compose the AICORs signal have different kinetic properties. This could have been of major concern, if the latter specie (solely created by gamma irradiation) was not to transfer with time into the first specie. By doing so, the AICORs radical distribution does not play a role in the dating, and the AICORs signal can be used as a single signal for dose response curve purposes. Nevertheless, the differentiation of the two radicals R1 and R2 can be achieved using the simulated annealing (SA) procedure based on a Monte Carlo approach used for combinatorial optimisation prob-lems (for more details refer to Joannes-Boyau et al., 2010a and Joannes-Boyau and Grün, 2011a and 2011b). With the separation of all components underlying in the composite signal, the dose response curve can be recon-structed using the B2 component only, which offers a less tempered component. (The program is freely available on request to the author)
Simulated Annealing (SA) procedure All spectrum decompositions and simulations were
carried out on the measured derivative spectra. Initially we used Matlab software with the easyspin add-on (Stoll and Schweiger, 2006; 2007). For simplification, only line shapes defined by the first derivative of the Gaussian function were used, although there were indications that in some cases Lorentzian or Voigtian line shapes were perhaps more appropriate. Some apparent signals in the residual (measured minus simulated) spectra appear to be due to the error induced by the Gaussian approximation. After several subjective manual approaches to spectrum analysis, decomposition was optimised and automated using a simulated annealing (SA) procedure.
The name comes from annealing in metallurgy, a technique involving heating and controlled cooling of a material to increase the size of its crystals and reduce their defects. By analogy with this physical process, each step of the SA algorithm replaces the current solution with a random "nearby" solution, chosen with a probabil-ity that depends on the difference between the corre-sponding function values and on a global parameter T (temperature) that is gradually decreased during the pro-cess. The current solution changes randomly when the
Fig. 12. Rotation of the fragment around the “Ideal orientation”. (A) Measure of angular response at T1-B1 maximum. The B2 signal is solely due to the NOCORs. The amount of powder spectrum introduce to fit the B2 signal correspond to the percentage of NOCORs within the signal; (B) Angular variation at perfect orientation of a tooth fragment (after NOCORs subtraction) over 90°, with a variation from T1-B1 max to the B2 max position. (Compare to the single crystal simulation in Fig. 4).

R. Joannes-Boyau
331
temperature is high, and less when T is close to zero, allowing the search of the global minimum misfit without getting stuck in local solutions. The Monte-Carlo optimi-sation method is a powerful tool when searching for globally optimal solutions amongst numerous local opti-ma.
The SA procedure is an adaptation of the Metropolis-Hastings algorithm and can be described as a Monte Carlo method used for combinatorial optimisation prob-lems (for details see Metropolis et al., 1953; Kirkpatrick et al., 1983; Černý, 1985; Mossegard and Sambridge, 2002; Bodin and Sambridge, 2009). Our SA procedure is able to randomly generate a large number of synthetic spectra defined by a linear combination of four Gaussian lines. Each simulated spectra is compared to the meas-ured spectra in terms of a least square misfit. The proba-bility of changing the parameters is determined by the acceptance probability function S(p,p',T), where p and p’ representing the old and new parameters, respectively, defined by the variance (δ) of the proposed parameters p’. The derivative Gaussian function of each radical is writ-ten:
( ) ( )( )
( )( )( )2
2
3 22 ση
σπ
ηα ieiiR −−−= (2)
where (i) the number of points that defines the spectra, α the Gaussian amplitude, σ the g-values or the channels and η the width of the Gaussian.
The Gaussian lines had prescribed limits with respect to the g-value range so as to avoid unrealistic solutions outside the regions for the CO2
- radical in hydroxylapatite (see above). No restrictions is set on the intensity and maximum line width, however, a minimum width (0.10 mT) is defined to avoid aberrations.
In order to assess the uncertainties of our decomposi-tion approach, we firstly re-ran the Monte Carlo simula-tion on the same spectra with different initial parameters. However, the robustness of the fitting strategy resulted in very small differences. The changes in minimum and maximum g-values and widths range between -0.0002 and +0.0001 (average ±0.00004) and -0.03 and +0.03 mT (average ±0.01 mT), respectively. The changes in g-values are virtually within measurement error, and the line width changes are well below 5%. Most previous decomposition approaches (e.g. Grün, 1998; Vanhaelewyn et al., 2000a) could not resolve closely overlapping signals. Hence, we consider our results ro-bust.
R3 is a component of the orientated CO2- radicals that
poses several problems. Recalling that enamel fragments are a partially ordered system with some preferential direction of the hydroxylapatite crystals, R3 can be desig-nated as a heterogeneous signal composed by misalign-ments of R1 in the irradiation spectra and R1 and R2 in the natural. It would then consist of a semi-infinite series of Gaussian components with varying amplitudes between
the T1 and B2 positions and can be described by the equation:
( ) ( )( )
∫
−−
−
=b
a
x
dexAxf µσµµ σ
µ2
2
23 (3)
where a and b are the positions of T1 and B2, µ the cen-tre, σ the width of the Gaussian line, and A(µ) the ampli-tude function. A part of this equation is known as the error function (erf). This erf function has an influence on the line shape. For example, if A(µ) is a linear function, f(x) may approximate a Gaussian function if the magnetic field is located between T1 and B2. Nevertheless, for the sake of effectiveness R3 has been approximated by a simple Gaussian line, but should be endeavoured in future simulation.
6. DOSE RESPONSE CURVE OF A FRAGMENT
After irradiating the sample with gamma rays, the R1/R2 ratio varies considerably from the natural spectrum value. Even with a complete transfer process between the two species, we strongly suggest to create the dose re-sponse curve using the B2 component only, which in-cludes also the stable NOCORs. Joannes-Boyau and Grün (2011b) have shown that by subtracting all interfering signals, the dose response curve is identical in the three X, Y and Z-configurations, limiting the amount of work required on fragments to obtain an accurate equivalent dose. Thus, by measuring only one configuration for each irradiation step, the time required to analyze a fossil fragment reaches the measurements time of powder sam-ples, but with enhanced accuracy, as the unstable NO-CORs cannot be removed in powder measurements. Nev-ertheless, for an accurate reading of the unstable NO-CORs amount we suggest that the natural would be measured in all configurations to adequately use the fit-ting methods (method 3) on the angular response.
A promising alternative could be in the future the use X-rays instead of gamma rays. However, while X-rays have been proven to recreate similar ratios that of the natural (Grün et al., 2012), more work needs to be done especially on dose calibration.
7. CONCLUSION
The new simplified model for tooth enamel fragments offers the possibility to directly date fossil samples using virtually non-destructive embedded mounting protocol. First, with the ability to overcome the strong anisotropy of the fragment using three orientations, each measured over 360° with an automated goniometer; secondly, with the ability to separate interfering radicals and unstable components such as the unstable NOCORs. This not only allows fragment dating, but also enhances the accuracy of direct dating with ESR on tooth enamel when compared

NON-DESTRUCTIVE ESR DIRECT DATING PROTOCOL OF ENAMEL FRAGMENT
332
to regular powder measurements. The amount of afore-mentioned unstable NOCORs is well constrained using the angular dependency methods (method 3), and can be accurately removed from the dating signal after each irradiation steps. It was also established that only one configuration either X, Y or Z were sufficient to recon-struct the dose response curve. This reduces considerably the amount of work required, when working directly on a fragment, and the amount of measurements time is no longer an issue in comparison to powder. While it was first designed to be able to precisely date fragments, when powder dating was not possible, the method has proven to enhance accuracy of direct dating and should be applied regardless. This new model offers a rapid, virtually non-destructive and precise direct dating of fossil tooth enamel.
ACKNOWLEDGEMENT
I am very thankful, to my supervisor, mentor and sci-entific role model, Prof. Rainer Grün, for endless conver-sations, his constant new ideas, his valuable help, time and advice before, during my PhD, which led to this paper. I am also grateful to F. Callens and H. Vrielinck, University of Gent, for valuable advice on spectrum de-composition and signal simulation. I would like to thank Dr. Thomas Bodin for his valuable mathematical help. Aspects of this study were supported by the ARC discov-ery project funded DP120101752.
REFERENCES
Aragno D, Fattibene P and Onorie S, 2001. Mechanically induced EPR signals in tooth enamel. Applied Radiation and Isotopes 55(3): 375-382, DOI 10.1016/S0969-8043(01)00078-1.
Bouchez R, Cox R, Hervé A, Lopez-Carranza E, Ma JL, Piboule M, Poupeau G and Rey P, 1988. Q-Band ESR studies of fossil teeth: consequences for ESR dating. Quaternary Science Reviews 7(3-4): 497-501, DOI 10.1016/0277-3791(88)90052-2.
Brik AS, Haskell EH, Scherbina OI, Brik VB and Atamanenko ON, 1998. Alignment of CO2 - radicals of tooth enamel with heating. Mineralogy Journal 20: 26-36.
Brik A, Haskell E, Brik V, Scherbina O and Atamanenko ON, 2000a. Anisotropy effects of EPR signals and mechanisms of mass trans-fer in tooth enamel and bones. Applied Radiation and Isotopes 52(5): 1077-1083, DOI 10.1016/S0969-8043(00)00047-6.
Brik AS, Rosenfeld LG, Haskell EH, Kenner GH and Brik VB, 2000b. Formation mechanism and localization places of CO2- radicals in tooth enamel. Mineralogie Journal 22: 57-67.
Bodin T and Sambridge M, 2009. Seismic tomography with the reversi-ble jump algorithm. Geophysical Journal International 178(3): 1411-1436, DOI 10.1111/j.1365-246X.2009.04226.x.
Callens FJ, Verbeeck RMH, Naessens DE, Matthys PFA and Boesman ER, 1989. Effect of carbonate content on the ESR spectrum near g=2 of carbonated calciumapatites synthetized from aqueous me-dia. Calcified Tissue International 44(2): 114-124, DOI 10.1007/BF02556470.
Callens F, Moens P and Verbeeck R, 1995. An EPR study of intact and powdered human tooth enamel dried at 400°C. Calcified Tissue In-ternational 56(6): 543-548, DOI 10.1007/BF00298587.
Callens F, Vanhaelewyn G, Matthys P and Boesman E, 1998. EPR of carbonate derived radicals: applications in dosimetry, dating and
detection of irradiated food. Applied Magnetic Resonance 14(2-3): 235-254, DOI 10.1007/BF03161892.
Černỳ V, 1985. A thermodynamical approach to the travelling salesman problem: an efficient simulation algorithm. Journal of Optimiza-tion Theory and Applications. 45(1): 41-51, DOI 10.1007/BF00940812.
Desrosiers MF, Simic MG, Eichmiller FC, Johnston AD and Boen RL, 1989. Mechanically-induced generation of radicals in tooth enam-el. Applied Radiation and Isotopes 40(10-12): 1195-1197, DOI 10.1016/0883-2889(89)90062-2.
Driessens P, 1980. The mineral in bones, dentine and enamel. Bulletin Des Sociétés Chimiques Belges 89: 663-687.
Grün R, 1989. Electron spin resonance (ESR) dating. Quaternary International 1: 65-109, DOI 10.1016/1040-6182(89)90010-4.
Grün R, 1995. Semi non-destructive, single aliquot ESR dating. Ancient TL 13: 3-7.
Grün R, 1998. Dose determination on fossil tooth enamel using spec-trum deconvolution with Gaussian and Lorentzian peak shapes. Ancient TL 16: 51-55.
Grün R, 2006. A simple method for the rapid assessment of the qualita-tive ESR response of fossil samples to laboratory irradiation. Ra-diation Measurements 41(6): 682-689, DOI 10.1016/j.radmeas.2006.04.009.
Grün R and Schwarcz HP, 1987. Some problems on ESR dating of bones. Ancient TL 5(2) 1-9.
Grün R, Maroto J, Eggins S, Stringer C, Robertson S, Taylor L, Morti-mer G and McCulloch M, 2006. ESR and U-series analyses of enamel and dentine fragments of the Banyoles mandible. Journal of Human Evolution 50(3): 347-358, DOI 10.1016/j.jhevol.2005.10.001.
Grün R, Joannes-Boyau R and Stringer C, 2008. Two types of CO2- radicals threaten the fundamentals of ESR dating of tooth enamel. Quaternary Geochronology 3(1-2): 150-172, DOI 10.1016/j.quageo.2007.09.004.
Grün R, Mahat R and Joannes-Boyau R, 2012. Ionization efficiencies of alanine dosimeters and tooth enamel irradiated by gamma and X-ray sources. Radiation Measurements 47(9): 665-667, DOI 10.1016/j.radmeas.2012.03.018.
Hillson S, 1986. Teeth, Cambridge Manuals in Archaeology, Cambridge University Press, Cambridge.
Ikeya M and Miki T, 1980. Electron spin resonance dating of animal and human bones. Science 215: 1392-1393, DOI 10.1126/science.215.4538.1392.
Ishchenko SS, Vorona IP, Okulov SM and Baran NP, 2002. 13C hyper-fine interactions of CO2- in irradiated tooth enamel as studied by EPR. Applied Radiation and Isotopes 56(6): 815-819, DOI 10.1016/S0969-8043(02)00049-0.
Joannes-Boyau R and Grün R, 2009. Thermal behavior of oriented and non-oriented CO2- radicals in tooth enamel. Radiation Measure-ments 44(5-6), 505-511, DOI 10.1016/j.radmeas.2009.02.010.
Joannes-Boyau R, Bodin T and Grün R, 2010a. Decomposition of the angular ESR spectra of fossil tooth enamel fragments. Radiation Measurements 45(8): 887-898, DOI 10.1016/j.radmeas.2010.06.029.
Joannes-Boyau R, Grün R, Bodin T, 2010b. Decomposition of the laboratory irradiation component of angular ESR spectra of fossil tooth enamel fragments. Applied Radiation and Isotopes 68(9): 1798-1808, DOI 10.1016/j.apradiso.2010.03.015.
Joannes-Boyau R and Grün R, 2010. Decomposition of UV induced ESR spectra in enamel fragments of a modern and a fossil tooth. Ancient TL 28: 23-34.
Joannes-Boyau R and Grün R, 2011a. Decomposition of β-induced ESR spectra of fossil tooth enamel. Radiation Physics and Chemistry 80(3): 335-342, DOI 10.1016/j.radphyschem.2010.10.002.
Joannes-Boyau R and Grün R, 2011b. A comprehensive model for CO2- radicals in fossil tooth enamel: implications for ESR dating. Qua-ternary Geochronology 6(1): 82-97, DOI 10.1016/j.quageo.2010.09.001.
Johnson C, 1998. Biology of Human Dentition. Illinois University, Chicago College of Dentistry.

R. Joannes-Boyau
333
Kirkpatrick S, Gelatt CD and Vecchi MP, 1983. Optimization by Simu-lated Annealing. Science 220: 671-680, DOI 10.1126/science.220.4598.671.
Lester KS and Koeningswald WV, 1989. Crystallite orientation discon-tinuities and the evolution of mammalian enamel or, when is a prism? Scanning Microscopy 3: 645-663.
Macho GA, Jiang Y and Spears IR, 2003. Enamel micro structure – a truly three-dimensional structure. Journal of Human Evolution 45(1): 81-90, DOI 10.1016/S0047-2484(03)00083-6.
Metropolis N, Rosenbluth AW, Rosenbluth MN, Teller AH and Teller E, 1953. Equations of state calculations by fast computing ma-chines. Journal of Chemical Physics 21(6): 1087-1092, DOI 10.1063/1.1699114.
Mosegaard K and Sambridge M, 2002. Monte Carlo analysis of inverse problems. Inverse Problems 18: R29, DOI 10.1088/0266-5611/18/3/201.
Schramm DU and Rossi AM, 2000. Electron spin resonance (ESR) studies of CO-2 radicals in irradiated A and B-type carbonate-containing apatites. Applied Radiation and Isotopes 52(5): 1085-1091, DOI 10.1016/S0969-8043(00)00046-4.
Scherbina OI and Brik AB, 2000. Temperature stability of carbonate groups in tooth enamel. Applied Radiation and Isotopes 52(5): 1071-1075, DOI 10.1016/S0969-8043(00)00048-8.
Smith TM and Tafforeau P, 2008. New Visions of Dental Tissue Re-search: Tooth Development, Chemistry, and Structure. Evolution-ary Anthropology 17(5): 213-226, DOI 10.1002/evan.20176.
Stoll S and Schweiger A, 2006. EasySpin, a comprehensive software package for spectral simulation and analysis in EPR. Journal of Magnetic Resonance 178(1): 42-55, DOI 10.1016/j.jmr.2005.08.013.
Stoll S and Schweiger A, 2007. EasySpin: Simulating cw ESR spectra. Biological Magnetic Resonance 27: 299-321.
Vanhaelewyn G, Callens F, Grün R, 2000a. EPR spectrum deconvolu-tion and dose assessment of fossil tooth enamel using maximum likelihood common factor analysis. Applied Radiation and Iso-topes 52(5): 1317-1326, DOI 10.1016/S0969-8043(00)00090-7.
Vanhaelewyn GCAM, Morent RA, Callens FJ, Matthys PFAE, 2000b. X- and Q-band electron paramagnetic resonance of CO2- in hy-droxylapatite single crystals. Radiation Research 154(4): 467-472.
Vorona IP, Ishchenko SS, Baran NP, Petrenko TL and Rudko VV, 2006. Evidence of annealing-induced transformation of CO2- radi-cals in irradiated tooth enamel. Radiation Measurements 41(5): 577-581, DOI 10.1016/j.radmeas.2005.12.002.
Vorona IP, Baran NP, Ishchenko SS and Rudko VV, 2007. Separation of the contributions from γ- and UV-radiation to the EPR spectra of tooth enamel plates. Applied Radiation and Isotopes 65(5): 553-556, DOI 10.1016/j.apradiso.2006.12.001.
Yokoyama Y, Quaegebeur JP, Bibron R, Leger C, Nguyen HV and Poupeau G, 1981. Electron spin resonance (ESR) dating of fossil bones of the Caune of l'Arago at Tautavel. Lumley H (de) et Labeyrie J eds, pp.437-455.