
Thermoplastic Disks Used for Commercial Orthodontic Aligners
Upload
khangminh22Category
view
0download
0
Graduate Theses, Dissertations, and Problem Reports
2017
Effect of Micro-Osteoperforations on Orthodontic Tooth Effect of Micro-Osteoperforations on Orthodontic Tooth
Movement with Clear Aligner Treatment. Movement with Clear Aligner Treatment.
DoBin Choi
Follow this and additional works at: https://researchrepository.wvu.edu/etd
Recommended Citation Recommended Citation Choi, DoBin, "Effect of Micro-Osteoperforations on Orthodontic Tooth Movement with Clear Aligner Treatment." (2017). Graduate Theses, Dissertations, and Problem Reports. 8179. https://researchrepository.wvu.edu/etd/8179
This Thesis is protected by copyright and/or related rights. It has been brought to you by the The Research Repository @ WVU with permission from the rights-holder(s). You are free to use this Thesis in any way that is permitted by the copyright and related rights legislation that applies to your use. For other uses you must obtain permission from the rights-holder(s) directly, unless additional rights are indicated by a Creative Commons license in the record and/ or on the work itself. This Thesis has been accepted for inclusion in WVU Graduate Theses, Dissertations, and Problem Reports collection by an authorized administrator of The Research Repository @ WVU. For more information, please contact [email protected].

Effect of Micro-Osteoperforations on
Orthodontic Tooth Movement with
Clear Aligner Treatment
DoBin Choi, D.D.S.
Thesis submitted
to the School of Dentistry
at West Virginia University
in partial fulfillment of the requirements for the degree of
Master of Science in
Orthodontics
Peter Ngan, D.M.D., Chair
Osama Mukdadi, Ph.D., M.S., Co-Chair
Chris Martin, D.D.S., M.S.
Department of Orthodontics
Morgantown, West Virginia
2017
Keywords: Accelerated orthodontics, Micro-osteoperforation, Orthodontic tooth movement,
Clear aligner treatment
Copyright 2017 DoBin Choi, D.D.S.

ABSTRACT
Effect of Micro-Osteoperforations on Orthodontic Tooth Movement with
Clear Aligner Treatment
DoBin Choi, D.D.S.
Background and Objectives: Micro-osteoperforation (MOP) is a relatively non-
invasive procedure to expedite the rate of orthodontic tooth movement (OTM) by enahncing
naturally occurring inflammatory response. This procedure is often combined with clear aligner
treatment (CAT) in order to shorten the duration of aligner wear. However, the question yet
remained whether the accuracy of OTM was maintained if the patients switched the aligners
more frequently than recommended. The objectives of the study were to investigate the effect of
MOPs on the accuracy of anterior OTM and to evaluate the differential effect of MOPs on
gender, age, severity of the mal-alignment, and the likelihood of refinement treatment.
Experimental Design and Methods: A de-identified sample of 105 patients who completed
CAT and met the inclusion criteria was obtained from the private practice of Thomas Shipley
(Peoria, AZ). The experimental group consisted of 46 CAT cases with MOPs and 3-day aligner
change, and the control group consisted of 59 CAT cases with 14-day aligner change. For data
collection, CloudCompare software was used to superimpose the post-treatment and prediction
scans to the pre-treatment scans and to measure the actual and predicted amount of displacement
of each anterior tooth of both arches. Using the transformation matrices from tooth-by-tooth
alignment, the amount of linear and angular displacement in 3 different planes was obtained and
used to calculate the linear discrepancy and the relative errors for the angular discrepancy. The
difference of these values between the control and the experimental samples was analyzed using
ANOVA, student’s t-test, Wilcoxon/Kruskal-Wallis rank sums test, and contingency analysis.
Results: Statistical analyses showed no significant difference between the groups for the
accuracy of anterior tooth movement in general, and the type of movement was unaffected by
MOPs. No clinically significant difference was found between the predicted and the actual
outcomes for varying gender, age, and severity of mal-alignment. On the other hand, a greater
percentage of the experimental samples required refinement treatment. Conclusions: Compare
to the 14-day aligner wear, the 3-day aligner wear with MOPs did not affect the accuracy of
OTM. MOP had a negligible effect on the types of tooth movement, gender, age, and the severity
of mal-alignment. The frequency of refinement treatment was higher for the 3-day aligner wear
with MOPs possibly due to more severe mal-alignment and greater number of prescribed
aligners of the experimental samples. In general, MOP can be a viable procedure to reduce the
length of CAT without compromising the quality of the clinical outcome.

iii
ACKNOWLEDGEMENTS
I would like to take this opportunity to acknowledge and thank the following people who
have played a pivotal role in my specialty training. None of my achievements would have been
possible without them.
Dr. Peter Ngan, The opportunity you have given me to become a specialist is priceless. I cannot
thank you enough.
Dr. Osama Mukdadi, It has been a true pleasure to work with you as my committee co-chair.
Your guidance made this study possible.
Dr. Chris Martin, Thank you for serving as a committee member. Your guidance throughout
my training will always be appreciated.
Dr. Thomas Shipley, Thank you for providing me with the data and your input for the study.
Your passion for the project has inspired me to push through.
Dr. Gerry Hobbs, You have been so patient and kind throughout the process of data analyses.
Thank you.
Dr. Doyoung Choi, You have always been and always will be my role model. I am blessed to
have you as my sister, teacher, and friend.
Drs. Tim Tremont, Tom Jarrett, Michael Hazey, Scott Little, Glenn Boyles, Dan Foley,
Kerry Kirsch, and Lawrence Wright, Your knowledge and wisdom will always be the
lighthouse of my career. Thank you.
Drs. Marina Gonchar and Uyen Nguyen, I am ever so grateful to have you as my classmates.
Thank you for being my inspiration and support.
Nick, Jen, Travis, Martin, Tim, Jason, MacKenzie, Tyler, Amer, Ghaddy, Carl, and Niki,
You all are the best co-residents that I could ask for. I will always remember the great times.

iv
TABLE OF CONTENTS
ABSTRACT ............................................................................................................................ II
ACKNOWLEDGEMENTS ................................................................................................. III
TABLE OF CONTENTS ..................................................................................................... IV
LIST OF TABLES ...............................................................................................................VII
LIST OF FIGURES ........................................................................................................... VIII
LIST OF EQUATIONS ........................................................................................................ IX
CHAPTER 1: INTRODUCTION ...........................................................................................1
BACKGROUND ............................................................................................................................................................ 1
STATEMENT OF THE PROBLEM ................................................................................................................................... 4
SIGNIFICANCE OF THE STUDY .................................................................................................................................... 4
PRIMARY RESEARCH QUESTIONS ............................................................................................................................... 5
NULL HYPOTHESES .................................................................................................................................................... 5
ASSUMPTIONS ............................................................................................................................................................ 6
LIMITATIONS .............................................................................................................................................................. 7
DELIMITATIONS ......................................................................................................................................................... 7
CHAPTER 2: REVIEW OF THE LITERATURE...............................................................9
THEORIES OF ORTHODONTIC TOOTH MOVEMENT ...................................................................................................... 9
1. Bone Bending/Piezoelectric Theory (Farrar)............................................................................................... 9
2. Pressure-Tension Theory ........................................................................................................................... 10
REGIONAL ACCELERATORY PHENOMENON .............................................................................................................. 13
INTERVENTIONS FOR ACCELERATED ORTHODONTICS .............................................................................................. 14
MICRO-OSTEOPERFORATION ................................................................................................................................... 16
CLEAR ALIGNER THERAPY ...................................................................................................................................... 19
1. Overview ................................................................................................................................................... 19
2. Factors Affecting the Tooth Movement with Clear Aligner Treatment .................................................... 20
3. Accuracy of Orthodontic Tooth Movement with Clear Aligner Treatment .............................................. 21
v
METHODS OF ANALYZING ORTHODONTIC TOOTH MOVEMENT ............................................................................... 24
1. Superimposition of Intraoral Scans ........................................................................................................... 24
2. Measurement of Tooth Displacement........................................................................................................ 25
3. CloudCompare Software ........................................................................................................................... 27
CHAPTER 3: EXPERIMENTAL DESIGN AND METHODS.........................................29
INSTITUTIONAL REVIEW BOARD APPROVAL ............................................................................................................ 29
SAMPLE COLLECTION .............................................................................................................................................. 29
Inclusion Criteria ........................................................................................................................................... 29
SUPERIMPOSITION OF SCANS AND ESTABLISHING COORDINATE SYSTEM ................................................................ 31
ANALYSIS OF TOOTH DISPLACEMENT ...................................................................................................................... 33
CALCULATION OF TOOTH DISPLACEMENT ............................................................................................................... 36
STATISTICAL ANALYSIS ........................................................................................................................................... 38
CHAPTER 4: RESULTS ......................................................................................................39
RELIABILITY OF MEASUREMENTS ............................................................................................................................ 39
ANALYSIS OF TOOTH DISPLACEMENT ...................................................................................................................... 39
1. Effect of MOP on Individual Tooth .......................................................................................................... 39
2. Effect of MOP by Arch ............................................................................................................................. 43
3. Effect of MOP on the Types of Orthodontic Tooth Movement ................................................................ 45
EFFECT OF MICRO-OSTEOPERFORATION BY GENDER .............................................................................................. 47
EFFECT OF MICRO-OSTEOPERFORATION BY AGE ..................................................................................................... 49
EFFECT OF MICRO-OSTEOPERFORATION BY SEVERITY OF ANTERIOR MALALIGNMENT .......................................... 51
1. Maxillary Arch .......................................................................................................................................... 51
2. Mandibular Arch ....................................................................................................................................... 53
EFFECT OF MICRO-OSTEOPERFORATION ON THE FREQUENCY OF REFINEMENT ....................................................... 55
CHAPTER 5: DISCUSSION ................................................................................................57
HYPOTHESES TESTING ............................................................................................................................................. 62
Summary of Results ...................................................................................................................................... 62
CLINICAL IMPLICATIONS .......................................................................................................................................... 63

vi
CHAPTER 6: SUMMARY AND CONCLUSIONS ...........................................................64
SUMMARY ................................................................................................................................................................ 64
CONCLUSIONS .......................................................................................................................................................... 65
CHAPTER 7: RECOMMENDATIONS FOR FUTURE RESEARCH ............................66
RECOMMENDATIONS ON SAMPLE COLLECTION ....................................................................................................... 66
RECOMMENDATIONS ON METHODOLOGY ................................................................................................................ 66
REFERENCES .......................................................................................................................67
APPENDICES ........................................................................................................................73
APPENDIX A – IRB EXEMPTION ............................................................................................................................... 73
APPENDIX B – LETTER OF PERMISSION TO CONDUCT RESEARCH ............................................................................ 75
APPENDIX C – HIPAA DATA USE AGREEMENT FOR LIMITED DATA SETS............................................................... 76
APPENDIX D – HIPAA WAIVER OF RESEARCH AUTHORIZATION FORM .................................................................. 79
APPENDIX E – RAW DATA & STATISTICAL ANALYSES ............................................................................................ 81
Raw Data ....................................................................................................................................................... 81
Statistical Analyses ....................................................................................................................................... 98
APPENDIX F – ELECTRONIC THESIS AND DISSERTATION SIGNATURE FORM .......................................................... 244

vii
LIST OF TABLES
Table 1. Mean values of the linear (ΔV) and angular discrepancies (Δx˚, Δy˚, Δz˚) of all anterior
teeth and the standard deviations for all parameters ..................................................................... 40
Table 2. One-way ANOVA of the linear and angular discrepancies between the actual outcome
and the predicted outcome for individual anterior teeth between the control and the experimental
samples .......................................................................................................................................... 43
Table 3. Mean values of the linear and angular discrepancies of upper, lower, and both arches
and the standard deviations for all parameters .............................................................................. 44
Table 4. One-way ANOVA of the linear and angular discrepancies between the actual outcome
and the predicted outcome of upper, lower, and combined arches between the control and the
experimental groups ...................................................................................................................... 45
Table 5. The difference in linear and angular discrepancy between the groups and the statistical
significance ................................................................................................................................... 46
Table 6. The mean linear and angular discrepancies for male and female subjects of both groups
and the significance of the interaction between the gender and the orthodontic tooth movement in
clear aligner treatment with or without MOPs .............................................................................. 49
Table 7. Multi-factorial ANOVA of the significance of the interaction between MOP and the age
of the subjects ............................................................................................................................... 50
Table 8. Multi-factorial ANOVA of the significance of the interaction between MOP and the
amount of space available in the upper anterior region ................................................................ 52
Table 9. Multi-factorial ANOVA of the significance of the interaction between MOP and the
amount of space available in the lower anterior region ................................................................ 54
Table 10. Contingency table of the frequency of refinement treatment needed per group .......... 55

viii
LIST OF FIGURES
Figure 1. A schematic of Pressure-Tension Theory of orthodontic tooth movement.74
............... 12
Figure 2. Different designs of the devices specifically designed for Micro-osteoperforation by
PROPEL Orthodontics (Ossining, NY) ........................................................................................ 18
Figure 3. Normalized 3-D view of the anterior teeth before and after treatment. Black: before
treatment; gray: 2 months after treatment. .................................................................................... 26
Figure 4. Coordinate system for analyzing tooth movement by automatic registration. (a) Before
registration, (b) after registration. The coordinate systems (x’, y’, z’) and (x, y, z) correspond to
before and after tooth movement, respectively. ............................................................................ 27
Figure 5. An example of a composite of intraoral scans obtained from OrthoCAD .................... 31
Figure 6. An example of a composite of prediction models obtained from ClinCheck Pro ......... 31
Figure 7. Initial alignment and registration of pre-treatment and post-treatment scans using
“Align/Point Pairs Picking” function on CloudCompare ............................................................. 32
Figure 8. Visual verification of the initial alignment of pre-treatment and post-treatment scans 33
Figure 9. Aligned scans were uploaded on CloudCompare to analyze the displacement of each
tooth .............................................................................................................................................. 34
Figure 10. Tooth-to-tooth alignment using the “Align/Point Pair Picking” function ................... 34
Figure 11. Visual verification of the alignment of the tooth and the resultant transformation
matrix ............................................................................................................................................ 35
Figure 12. An example of a transformation matrix....................................................................... 36
Figure 13. Mean linear discrepancy (ΔV) and relative errors for angular displacement (Δx˚, Δy˚,
Δz˚) for upper anterior teeth (#6-#11) for the experimental (MOP) and control samples ............ 41
Figure 14. Mean linear discrepancy (ΔV) and relative errors for angular displacement (Δx˚, Δy˚,

ix
Δz˚) for lower anterior teeth (#22-#27) for the experimental (MOP) and control samples. ......... 42
Figure 15. Mean linear discrepancy and relative errors for angular displacement for upper, lower,
and combined arches for the experimental (MOP) and control samples. ..................................... 44
Figure 16. Comparison of mean tooth displacement by different types of orthodontic tooth
movement ...................................................................................................................................... 46
Figure 17. Means of linear and angular discrepancies by gender with the groups combined ...... 48
Figure 18. Least Squares Means Plot of gender versus the linear discrepancy (ΔV) between the
actual and the predicted outcomes for both control and experimental samples combined ........... 48
Figure 19. Regression plot of the linear discrepancy (ΔV) and age and the fit lines for control and
experimental groups ...................................................................................................................... 50
Figure 20. Regression analysis of the amount of upper anterior crowding or spacing versus the
angular discrepancy about the x-axis (Δx°) between the actual and the predicted tooth
displacements ................................................................................................................................ 52
Figure 21. Regression analysis of the amount of lower anterior crowding or spacing versus the
linear discrepancy (ΔV) between the actual and the predicted tooth displacements .................... 54
Figure 22. Mosaic Plot of the frequency of refinement treatment necessary at the completion of
the prescribed aligner wear for control and experimental samples ............................................... 56
LIST OF EQUATIONS
Equation 1. Cost function as the mean of the least-square distances from the vertices of one data
set to the other (M is a rigid transformation matrix, N is the number of points, xi is the vertex of
the first data set, and pi is the vertex of the second data) .............................................................. 25

1
CHAPTER 1: INTRODUCTION
Background
Prolonged orthodontic treatments are associated with a higher risk of several adverse
effects, such as enamel decalcification, external root resorption, gingival inflammation, decrease
in patient compliance, and poorer quality of treatment outcome as a result.2, 13-16
Hence, the
current trend in orthodontics is incorporation of methods to expedite the treatment while
achieving a satisfactory outcome by increasing the rate of orthodontic tooth movement as well as
increasing treatment efficiency. In an attempt to accelerate the rate of orthodontic tooth
movement, many studies have investigated the biological mechanism of orthodontic tooth
movement and how to manipulate the physiology.
Orthodontic tooth movement is an inflammatory phenomenon. A mechanical force
applied to a target tooth creates a pressure side and a tension side of the tooth root, which
stimulates the production and activation of various inflammatory mediators. These inflammatory
factors in turn activate bone-remodeling cells, including osteoblasts and osteoclasts in the
periodontal ligament (PDL) space.8 This idea that orthodontic tooth movement is an
inflammatory phenomenon is empirically supported by a higher level of an inflammatory
mediator, PGE2, found in gingival crevicular fluid of patients undergoing orthodontic
treatment.10
Also, Bartzela et al. reported in the systematic review that experimental
administration of inflammatory mediators, such as leukotriene, prostaglandin, and prostacyclin,
significantly increased the rate of orthodontic tooth movement in non-human subjects.11
On the
other hand, substances that inhibit the activities of bone remodeling cells, such as
bisphosphonates, are capable of inhibiting the orthodontic tooth movement, and anti-

2
inflammatory substances have been shown to decrease the rate of tooth movement.11, 12
These
results suggest that enhanced inflammatory response in the periodontal ligament space may
promote bone resorption and bone deposition, encouraging rapid tooth movement within
alveolus.
Induction of inflammation to increase the tooth movement is not a novel concept. In
1983, Frost first used a term “regional acceleratory phenomenon” to describe a tissue reaction to
noxious stimuli by increasing the production of inflammatory mediators.25
Noxious stimuli can
be any chemical or mechanical agents that can cause “trauma” to the periodontal ligament, thus
increasing the production of inflammatory factors within the PDL space. These factors in turn
will activate and recruit osteoblasts and osteoclasts involved in remodeling of the bone around
the tooth. Increased bone remodeling during orthodontic treatment will result in an increased
tooth movement. Other dental procedures, such as tooth extraction, periodontal surgery, or even
orthognathic surgery, are considered noxious stimuli, and a faster tooth movement and shortened
treatment duration can be observed following invasive dental procedures.
Inspired by the regional acceleratory phenomenon, researchers have made numerous
efforts to utilize this phenomenon to deliberately increase the rate of orthodontic tooth movement
and shorten the treatment duration. Studies have evaluated various surgical and non-surgical
interventions to induce inflammation to increase the rate of orthodontic tooth movement. These
efforts range from low-level laser therapy and pulsed electromagnetic fields to corticotomy and
distraction osteogenesis.17-23
Nevertheless, only a few of these procedures are found to be
effective. Surgical procedures, such as full-thickness flap elevation with extensive decortications,
corticotomies, piezopunctures, and periodontal and dento-alveolar distractions, are shown to
increase the rate of orthodontic tooth movement by activating inflammatory mediators, thus

3
increasing the osteoclastic and osteoblastic activities in the alveolar bone.1, 3-6, 9
However, the
most notable drawbacks of these methods lie in their invasive nature, possibility of surgery-
related morbidity, and impracticality of a routine application.
Micro-osteoperforation (MOP) is a newly introduced technique that can easily be
performed in an office setting with minimal patient discomfort to increase the rate of orthodontic
tooth movement. MOP is a shallow intentional puncture wound through soft tissue into the
cortical plate around a target tooth using a stainless steel mini-screw of a 2-mm diameter and 7-
mm length. According to Alikhani et al., a resultant localized inflammatory response seems to
recruit and stimulate surrounding bone remodeling cells to increase the rate of bone resorption
and deposition, thus increasing the rate of tooth movement and shortening the treatment
duration.7 Unlike the aforementioned surgical techniques, MOPs can be applied under topical
anesthesia, minimizing patient discomfort and surgery-related morbidities. Moreover, a simple,
cost-effective protocol may allow a more frequent application in comprehensive treatment with
fixed appliances as well as clear aligner treatment (CAT).24
An aesthetic alternative to the traditional fixed appliance treatment, CAT is a series of
removable vacuum-formed polyurethane appliances that are designed to apply a point pressure to
move teeth to a desired position in small increments. This is not a new treatment concept; in fact,
many practitioners have used this technique to achieve a minor tooth movement. In 2001, Align
Technology incorporated computer-aided designing/computer aided manufacturing (CAD/CAM)
stereolithographic technology to CAT, which allowed CAT to be an aesthetic treatment option
for more complex cases. However, many studies revealed that the efficiency of orthodontic tooth
movement via CAT is less than ideal with the average accuracy of tooth movement between 29
to 57 percent.26-28
In addition, many clinicians have incorporated accelerated tooth movement

4
into CAT, claiming that the duration of clear aligner treatment can be shortened by half or even a
third of the usual treatment duration (3-day aligner wear versus 14-day aligner wear) while
maintaining the quality of the outcome.
Statement of the Problem
Attempts have been made to increase the accuracy of the tooth movement as well as the
rate of the tooth movement with clear aligner treatment. With the emergence of new techniques
to accelerate the rate of tooth movement, clinicians and researchers are investigating the effects
of MOP in clear aligner treatments. Until present, there have been no organized studies that
systematically investigated the effect of MOPs in clear aligner therapy.
Significance of the Study
A relatively non-invasive method, MOP has been shown to increase the rate of tooth
movement and reduce the duration of orthodontic treatment. Understanding the effectiveness and
efficiency of this procedure on clear aligner therapy may provide orthodontists an added
armamentarium to reduce the duration of orthodontic treatment with the same or similar
accuracy in orthodontic tooth movement. The present study will shed light on whether the use of
MOP can reduce the length of time in changing from one aligner to the next and the ability of the
aligners to track the tooth movement accurately in three planes of space.

5
Primary Research Questions
1. Can the addition of the MOP procedure help in reducing the length of time changing
from one aligner to the next?
2. How close can the aligners track the tooth movement in the experimental group
treated with the addition of the MOP procedure compared to the control group?
3. Is there a difference in the aligner’s ability to track different types of tooth movement
(tipping, rotation, and torque movements) in either the experimental or the control
group?
4. Is there a difference in the effect of MOP for different gender, age, or the severity of
mal-alignment?
5. Is there a difference in the frequency of refinement treatment at the completion of the
prescribed aligner treatment with or without the use of MOP?
Null Hypotheses
Compared to the conventional clear aligner therapy alone, the fast-tracked clear aligner
therapy with micro-osteoperforation will show:
1. No significant difference in tooth movements of the anterior teeth predicted by the
ClinCheck compared to the actual treatment between the experimental and control
groups.
2. No significant difference in the tooth movements of anterior teeth predicted by the
ClinCheck compared to the actual treatment outcome among different types of tooth

6
movement (i.e. linear displacement and angular displacement in mesiodistal,
faciolingual, and occlusogingival directions).
3. No significant difference in the tooth movements of anterior teeth predicted by the
ClinCheck compared to the actual treatment outcome between genders.
4. No significant difference in the tooth movements of anterior teeth predicted by the
ClinCheck compared to the actual treatment outcome among different age groups.
5. No significant difference in the tooth movements of anterior teeth predicted by the
ClinCheck compared to the actual treatment outcome for varying severity of anterior
malalignment.
6. No significant difference in the frequency of refinement treatments at the completion
of the prescribed aligner treatment.
Assumptions
The following were assumed for the purpose of the study:
1. Same algorithm developed by Align Technology is used for treatment planning of all
cases.
2. Each aligner is designed to move the tooth at a fixed increment in distance and
rotation.
3. All MOPs are completed equally to perforate the full thickness of the buccal cortical
plate around the anterior teeth.
4. The effect of interarch elastics on anterior alignment is insignificant.
7
5. Landmarks are accurately identified for necessary measurements and superimposition
of the intraoral scans.
Limitations
1. Samples are limited to the subject database provided by one of the co-investigators
Dr. Thomas Shipley (Peoria, AZ).
2. There is no sample of patients with CAT with 3-day aligner wear without MOPs.
3. There is patient-related variability – demographics, bone physiology, types of
malocclusion, amount of crowding, and the level of compliance.
4. There is treatment-related variability – types and amount of required tooth movement,
amount of interproximal reduction, and the use of auxiliary devices.
5. Measurements are affected by intra-operator variability and margin of error.
Delimitations
1. Control samples that were treated in the same time period (January 2013 to July
2016) as the experimental samples were selected to eliminate any variables in
treatment planning algorithm or treatment philosophy.

8
2. Samples were selected to include a similar distribution of patient-related variability,
such as age range, race, gender distribution, types of malocclusion, and high
compliance level, for both groups.
3. Samples were selected to include a similar distribution of treatment-related
variability, such as types and amount of required tooth movement, amount of
interproximal reduction, and the use of auxiliary devices, for both groups.
4. Ten samples in each group were randomly selected for intra-operator reliability test to
calculate the margin of error and the reliability of the measurements.

9
CHAPTER 2: REVIEW OF THE LITERATURE
Theories of Orthodontic Tooth Movement
Discoveries of the evidence of orthodontic tooth movement in ancient Egyptian
mummies suggest the long history of practice of orthodontics. However, the physiology of
orthodontic tooth movement is a topic of relatively recent studies. These studies introduce
several theories of orthodontic tooth movement.
1. Bone Bending/Piezoelectric Theory (Farrar)
In 1888, Farrar first introduced Piezoelectric Theory, also known as Bone Bending
Theory, to describe the mechanism of orthodontic tooth movement.36
Piezoelectricity is an
electric charge that occurs due to a mechanical deformation of a crystalline object, such as
mucopolysaccharide, collagen, hydroxyapatite, or collagen-hydroxyapatite interface in bone.
The piezoelectricity will create micro-currents throughout the object, stimulating the bone
remodeling cells, such as osteoblastic and osteoclastic activities.37
The theory explains that
any mechanical stress that causes bending of any of these crystalline structures will generate
electric signals, increasing the cellular activities in the matrix. Yasuda et al. found differential
charges on different surfaces of the deformed bone. When a pressure was applied on a femur,
they detected a callus formation in the periosteum and endosteum as well as negative
piezoelectric charges on the compression side and positive piezoelectric charges on the
tension side.38
The negative charge is generally associated with an increased osteoclastic
activity, and the positive charge is associated with an increased osteoblastic activity.
Studies also suggest that increasing the amount of bone deflection may cause an increase

10
in piezoelectricity.39, 43
The inverse of this phenomenon was also shown to be true when an
increased osteogenic activity and an accelerated bone repair were observed in animals with an
application of an electric current.40, 41
This concept can be applied to the tooth movement where a
force to a tooth causes bending of the alveolar bone surrounding the tooth and creates differential
piezoelectric currents within the PDL space. These currents will stimulate osteoclasts and
osteoblasts necessary for bone remodeling and in turn, orthodontic tooth movement. Shapiro and
his colleagues noted a sustained tooth movement when a pulsed electric current was applied to a
maxillary molar of a female patient.42
One of the main drawbacks to this theory to explain the physiology of orthodontic tooth
movement is the quick decay rate of piezoelectricity. When a force is applied to a tooth, a
piezoelectric current is created; however, the electric signal quickly dissipates to zero even with
a sustained force application. Moreover, another unusual characteristic of piezoelectricity is that
once the force is released, an equal and opposite piezoelectric signal is created.44
Thus, this may
imply that after the force is released, the resorptive area shows bone deposition and vice versa.
Also, studies indicate that the piezoelectricity is responsible for bone remodeling due to stress-
generated electric signals. Yet, this phenomenon does not fully explain the physiology of tooth
movement when the orthodontic force application is maintained, which frequently occurs in
orthodontic treatments with fixed appliances. Nevertheless, studies suggest that a pulsed force
application with a careful removal of force may stimulate a unidirectional orthodontic tooth
movement.
2. Pressure-Tension Theory
Pressure-tension theory is based on the concept that orthodontic tooth movement is an

11
inflammatory process. When orthodontic force is applied to a tooth in a certain direction, a
catabolic-pressure side and an anabolic-tension side are created in the PDL space. Depending on
the side of the tooth, cellular activities are distinctly different. On the pressure side,
histochemical findings indicate that compressive force within the PDL space significantly
increases the expression of cyclooxygenase (COX).8 COX is derived from arachidonic acid, one
of the components of cell membrane phospholipids. COX enzyme is responsible for the
production of prostaglandins (PG), especially PGE1 and PGE2. Studies have indicated the bone
resorptive effect of PGE1 and PGE2 via their effect on other molecules.45, 46
These factors
activate receptor activator of nuclear factor kappa B ligand (RANKL), whose action is to aid in
differentiation, function, and survival of bone-resorbing osteoclasts. These PGs are also involved
in initiating the cyclic adenosine monophosphate (cAMP) pathway.47
This pathway eventually
leads to an increased production of cellular components necessary to sustain an increased cellular
activity of bone remodeling cells.
At the same time, PGs lower the osteoprotegerin (OPG) level, altering the ratio of
RANKL/OPG to favor the formation of functional osteoclasts.30, 31
Compressive force also
increases the expression of interleukin (IL)-17, whose action is to activate bone-forming
osteoblasts.29
In addition, there is a differential expression of various inflammatory cytokines,
such as IL-1, IL-6, tissue necrosis factor (TNF)-, and interferon-, which are also associated
with osteoblast and osteoclast activation. The combined actions of these inflammatory factors
and the cells they stimulate on the pressure side will aid in bone remodeling and bone modeling
necessary for the tooth to move into the newly created space.
On the tension side, similar molecules and cells are involved but at a different level of
activity, thus producing a different phenomenon. The major factor associated with the anabolic

12
side is transforming-growth factor (TGF)-1. TGF-1 is a chemotactic molecule involved in
proliferation, differentiation, survival, and function of osteoblasts, which are the cells responsible
for bone formation. Osteoblasts will deposit bone on the tension side of the socket once the tooth
is moved away from the original position.32, 33
Studies indicate an increased level of TGF-1 in
the PDL space upon application of tensile force, increasing the osteoblastic activity.34
In
addition, upon the force application, there is an increased level of vascular endothelial growth
factor (VEGF). This is another factor that is associated with the enhanced survival and activity of
osteoblasts.35
Also, as mentioned earlier, the ratio of RANKL/OPG affects the osteoclast
formation. With a tensile force, OPG level is increased, lowering the RANKL/OPG ratio and
decreasing the production of functional osteoclasts.32
Overall there is an increased osteoblastic
activity and a decreased osteoclastic activity, thus increasing the rate of bone deposition in the
tension side of the PDL space. The Pressure-Tension Theory explains the biologic mechanism of
orthodontic tooth movement by presenting the evidence of altered level of inflammatory
mediators caused by orthodontic force application to a tooth.
Figure 1. A schematic of Pressure-Tension Theory of orthodontic tooth movement.74

13
Regional Acceleratory Phenomenon
First described by Frost in 1983, the regional acceleratory phenomenon (RAP) is used to
describe a tissue response to a noxious stimulus that results in an increased cellular activity.25
It
is understood as a necessary reaction of the affected tissue to counter the disturbance and
increase the healing capacity. Without the RAP reaction, healing capacity is compromised, and
the tissue becomes more prone to infection.52
This phenomenon of accelerated healing occurs not
just in soft tissue, but also in hard tissue, such as bone and cartilage.48
According to Verna, the
extent of the elicited response is directly proportional to the magnitude and the nature of the
noxious stimuli, which can include a variety of external factors, both chemical and mechanical.
For example, soft or hard tissue infection, any type of fractures, surgical procedures, and
inflammatory processes are all capable of inducing the RAP.51
Verna explains that the RAP affects the variety of cellular activities, such as the
differentiation of precursor cells and the metabolism of the already differentiated cells within the
bone multicellular unit (BMU). The BMU consists of the cells depositing, resorbing, and
maintaining the bone in a cyclical sequence. The sequence of bone remodeling during the RAP is
activation, resorption, reversal, and formation. First, activation phase is initiated by binding of
RANKL to its receptors present on the surface of preosteoblasts. This reaction results in the
emergence and differentiation of preosteoclasts from the bone marrow into osteoclasts. The
mature osteoclasts will begin the second phase, bone resorption. After the second phase,
osteoclasts undergo apoptosis, and the further resorption is carried out and completed by
mononucleated phagocytes. At the same time, during the reversal phase, preosteoblasts are
differentiated into mature osteoblasts, which secret OPG to discourage the differentiation and
activities of osteoclasts. During the last phase of bone formation, mature osteoblasts deposit
14
osteoids, which eventually complete mineralization in three to four months.51
The bone
modeling/remodeling sequence is a normal process of bone turnover, but becomes heightened
during the state of injury via the RAP.
Histologic studies have supported the above process that in an injured bone tissue, the
RAP is characterized by augmented osteoblastic and osteoclastic activities that lead to an
increased formation of unorganized woven bone, which subsequently becomes organized into
lamellar bone.49-51
As a result, the rate of bone modeling and remodeling is increased, eventually
leading to bone healing. Dental pathologies that can cause the RAP include fractures of the bone
and periodontal diseases, and dental procedures that can cause this phenomenon include tooth
extraction, orthognathic surgery, implant placement, and orthodontic tooth movement.
Experimental results suggest that the RAP in general lasts between four and eight months, but
the scope of the tissue response depends on the severity of the dental disease processes or the
extent of the dental procedures.51
In orthodontic tooth movement, since the RAP stimulates both
the osteoblastic and the osteoclastic activities, it can be assumed that this phenomenon occurs on
both the tension and the pressure sides.
Interventions for Accelerated Orthodontics
Once the connection between the orthodontic tooth movement and the RAP has been
established, numerous studies have been conducted to develop methods to accelerate the rate of
orthodontic tooth movement. The main idea is to induce the regional inflammatory response
around the target tooth to increase the RAP, thus increasing the rate of tooth movement.
Researchers have investigated various methods to utilize and enhance the RAP, both surgical and

15
non-surgical, and several systematic reviews that analyzed these studies are available.
Long and his colleagues reviewed five procedures discussed in nine studies that met their
inclusion criteria in their systematic review.1 Among the five procedures were low-level laser
therapy (LLLT), corticotomy, electrical current, pulsed electromagnetic fields (PEMF),
dentoalveolar and periodontal distraction. First, from the two qualifying studies, the authors
concluded that corticotomy could reliably accelerate orthodontic tooth movement. The authors
noted a report of transiently compromised gingival health in the corticotomy samples, possibly
due to the difficulty maintaining an adequate oral hygiene following the surgery. Nevertheless,
the authors agreed that corticotomy is a relatively safe and effective method of increasing the
rate of orthodontic tooth movement.
Another study included in this systematic review was by Kharkar et al. that investigated
the effectiveness of dentoalveolar and periodontal distractions.9 This study reported a faster rate
of orthodontic tooth movement with dentoalveolar distraction compared to periodontal
distraction. Despite the limitations of the experimental design of this study, the authors suggested
that dentoalveolar distraction was a safe, promising procedure in clinical practice. The last three
procedures, LLLT, electrical current, and pulsed electromagnetic fields, were also investigated
for their efficacy. However, the authors were unable to find any definitive evidence that these
procedures were effective in accelerating orthodontic tooth movement.
A more recent systematic review by Hoogeveen et al. reviewed eighteen studies that
evaluated corticotomy, periodontal ligament distraction, and dentoalveolar distraction.53
Unlike
the previous study, Hoogeveen et al. found the evidence of the efficacy of both distraction
methods. They concluded that all three procedures, corticotomy, PDL distraction, and
dentoalveolar distraction were methods that can temporarily, but reliably increase the orthodontic

16
tooth movement with minimal risks of periodontal damage, root resorption, and pulp
devitalization. However, the authors noted that the level of evidence to support this claim is
limited due to the moderate to high level of bias of evidence currently available.
Another systematic review by Gkantidis and his associates reviewed eighteen articles that
evaluated the efficacy of five surgical and non-surgical interventions, namely corticotomy,
interseptal bone reduction, photobiomodulation, LLLT, and PEMF.54
The authors concluded that
corticotomy was the only procedure that reliably increased the rate of orthodontic tooth
movement without any significant adverse effect. They found no evidence to support the efficacy
of interseptal bone reduction, photobiomodulation, and PEMF. On the other hand, several studies
included in this review indicated some evidence of effectiveness of LLLT. However, a careful
interpretation of the data concerning LLLT was recommended since the effectiveness of the
procedure was indicated only in the studies with a moderate risk of bias, whereas the studies with
a low risk of bias failed to show the effectiveness. Along with the aforementioned reviews, other
systematic reviews and comparison studies have also concluded that corticotomy is a reliable and
safe method of elevating the rate of orthodontic tooth movement, whereas other procedures lack
evidence to support the efficacy. 4, 19, 20, 55
Micro-Osteoperforation
Inspired by findings of the RAP in orthodontic tooth movement, Micro-
Osteoperformation (MOP) is a technique recently incorporated in orthodontics to accelerate the
rate of orthodontic tooth movement. MOPs are done by creating shallow perforations using a
mini-implant-like device or a small round bur and a hand-piece through the gingiva into the

17
buccal cortical plate of a target tooth.55
The idea is to induce regional inflammatory response via
intentional bone injuries to increase the bone remodeling activities, thus accelerating the rate of
orthodontic tooth movement. The perforation process is similar to that of corticotomy, which is
one of few procedures that are shown to be effective in accelerating the rate of orthodontic tooth
movement. However, corticotomy involves an extensive gingival flap procedure, which may
increase the healing time and patient discomfort level and negatively impact the patient
acceptance rate. On the other hand, MOPs do not require laying a gingival flap. Instead, the
small perforations are completed directly through the soft tissue.
The animal study conducted by Teixeira and her associates reported a significantly higher
rate of orthodontic tooth movement in rats with orthodontic force and MOPs (0.62mm),
compared to the rats with orthodontic force only (0.29mm). Also, histochemical studies indicated
that on the MOP side, the authors observed a 1.6- to 2.8-fold increase in the level of cytokines
and chemokines as well as a 3-fold increase in the number of osteoclasts in the experimental
side.55
The results indicate that in rats, the injury caused by MOPs illicit a regional inflammatory
response, leading to an accelerated rate of orthodontic tooth movement through the RAP.
Similarly, another animal study by Tsai et al. investigated the effect of MOPs and
corticision on the rate of tooth movement in rats.56
They concluded that compared to the control
samples that received orthodontic force only, both experimental samples (MOPs and corticision)
experienced an increased rate of tooth movement and the difference between the two
experimental groups was insignificant. Histologic studies indicated that the bone density was
significantly lower around the tooth with the MOPs. In addition, the number of osteoclasts
present around the target tooth was significantly higher in both experimental samples. The
authors concluded that these minimally invasive procedures resulted in an induction of a

18
localized inflammatory process and an increase in the rate of orthodontic tooth movement in rats.
Lastly, Alikhani et al. investigated the effect of MOPs on the rate of canine retraction in
human subjects.7 All of the subjects underwent maxillary first premolar extraction and canine
retraction, and the subjects in the experimental group received MOPs with a mini-implant-like
device. The results indicated an increased rate of tooth retraction by 2.3-fold in the subjects who
received MOPs, compared to the control samples. Moreover, the gingival crevicular fluid study
indicated a significantly increased level of cytokine expression in the experimental samples. The
authors explained that MOPs were capable of inducing a localized inflammatory response, thus
recruiting and stimulating the surrounding bone remodeling cells to increase the rate of bone
resorption and deposition to aid in the accelerated tooth movement.
Figure 2. Different designs of the devices specifically designed for Micro-osteoperforation by PROPEL Orthodontics
(Ossining, NY)75

19
Clear Aligner Therapy
1. Overview
Clear aligner therapy (CAT) is an aesthetic treatment alternative to conventional
orthodontic treatment with fixed appliances. The treatment is rendered through a series of clear
removable vacuum-formed polyurethane aligners to accomplish minor tooth movement as each
aligner moves the teeth by fixed distances.56
First introduced by Kesling in 1945 as a flexible
tooth-positioning device, CAT is not a new concept. Traditionally, the aligners were fabricated
by manually altering the tooth position in small increments on a stone model, thus limiting the
scope of CAT to only minor tooth movement, such as mild rotations and mal-alignment of
anterior teeth up to 2mm.57
If more dental movement was desired, additional stone models with
the altered tooth position had to be manually fabricated.
Recent development of Invisalign® (Align Technology, Santa Clara, CA) incorporated
the CAD/CAM technology into CAT, which dramatically changed the ability of the clear
aligners to treat more complex malocclusion. Instead of fabricating each dental cast by hand, the
practitioners can simply submit polyvinyl siloxane impressions or 3-dimensional digital intraoral
scans, which are used to virtually design a desired treatment outcome.57
Computer program then
develops a sequence of tooth movements that will be achieved by each aligner to reach the
desired outcome. Thus, each stage of the treatment can be visualized and modified before ever
starting the treatment.56
Moreover, the traditional method of producing the physical models is
replaced by stereolithography, a method to print a solid three-dimensional object, in this case a
dental model, from liquid plastic. This method allows a mass production of dental casts so that
the sequential models and corresponding clear aligners can be easily manufactured.57
The
incorporation of CAD/CAM technology allows the CAT to be a viable, aesthetic treatment

20
option for more complex malocclusion.
2. Factors Affecting the Tooth Movement with Clear Aligner Treatment
Orthodontic tooth movement with CAT depends on several external and internal factors,
including the physical properties of thermoplastic materials and the characteristics of
attachments. Materials used in CAT differ according to manufacturers and stages of the
treatment.58
Depending on the physical property of the polymers or the fabrication method of the
aligners, the force level and the activation rate may differ significantly.59
According to Ercoli et
al., an aligner system that uses poly-vinyl chloride (PVC) material with pronounced elastics
characteristics when subjected to a moderate load may require less optimal wear time due to the
characteristic force that the PVC material can apply to the tooth. On the other hand, an aligner
system that uses polyethylene terephthalate glycol may be more resistant to time and wear and
allow more gradual tooth movement.60
Another study by Simon and the colleagues investigated
the forces and moments generated by Invisalign’s proprietary aligner material. They observed
the exponential force decay during the aligner wear. Their results indicated that the force systems
varied throughout the aligner treatment despite a treatment plan with a constant tooth movement.
Also, the authors recommended using attachments to maximize the moment transfer.59
Likewise,
different materials exert different effects on tooth, which may translate into varying efficiency of
orthodontic tooth movement.
Another factor that can affect the efficiency of tooth movement is the activation time, or
aligner-wear time. An in-vivo study by Clements et al. evaluated the effect of varying activation
time on the quality of the outcome determined by peer assessment rating and incisor irregularity
index.56
Among the four protocols with differing types of material and aligner wear time (1-week
21
activation with soft material, 1-week activation with hard material, 2-week activation with soft
material, and 2-week activation with hard material), the authors did not find any statistically
significant difference among the 4 protocols in the rate of space closure or anterior alignment.
However, they noted a general trend with a 2-week activation having a higher rate of extraction
space closure and anterior alignment, compared to the 1-week activation. Similarly, Drake and
his colleagues investigated the effect of a duplicate aligner for the second week of aligner wear,
compared to the conventional protocol of 2-week aligner wear on the total amount of orthodontic
tooth movement.61
The results showed no statistically significant difference between the two
protocols, indicating that the material fatigue was not a major determinant of the amount of
orthodontic tooth movement.
In addition to the treatment-related factors, Chisari et al. evaluated patient-related factors
that may affect orthodontic tooth movement, such as age, sex, root length, bone levels, and bone
quality. The results indicated a negative correlation between age and tooth movement as well as
a significant negative correlation between locations of center of resistance, determined by root
length and bone levels, and tooth movement. However, bone quality had little effect on
orthodontic tooth movement. Sex of the patients, the authors reported, may have a complex
contribution to orthodontic tooth movement.27
Furthermore, tooth movement via clear aligner
treatment is considerably affected by patient compliance. Therefore, controlling orthodontic
tooth movement with clear aligners is a complex process, and the amount and rate of tooth
movement is rather unpredictable.
3. Accuracy of Orthodontic Tooth Movement with Clear Aligner Treatment
Studies have shown that the efficiency of orthodontic tooth movement with CAT is

22
affected by patient-related factors as well as treatment-related factors.26-28
A recent systematic
review evaluated current available literatures on the efficacy of clear aligners in controlling
orthodontic tooth movement. Their search concluded that the efficacy of the treatment with clear
aligners is comparable to that of the fixed appliances with straight-wire technique in general.
However, the selected articles indicated certain differences in the efficacy of CAT compared to
the straight-wire technique (SWT). Compared to SWT, CAT was more effective in leveling and
aligning, anterior intrusion, controlling posterior buccolingual inclination, and upper molar
distalization up to 1.5mm. On the other hand, this treatment modality was less effective in
anterior extrusion, controlling anterior buccolingual inclination, and rotation of rounded teeth.62
Therefore, due to these deficiencies in the ability to control certain orthodontic tooth movement,
CAT becomes less predictable than fixed appliance treatment with SWT.
The predictability of clear aligner treatment was tested using several different methods.
Buschang et al. utilized the standardized grading system to objectively evaluate the quality of the
actual outcome and compare to that of the prediction.26
ClinCheck feature of Invisalign system,
which allows the practitioners to visualize the predicted outcome, was used as the predicted
outcome of each case. The authors graded the outcomes of selected CAT cases using the
American Board of Orthodontics (ABO) Objective Grading System (OGS), and compared the
scores of the predicted outcomes to those of the actual outcomes. The results showed that the
OGS scores of the predicted outcomes were lower than those of the actual outcomes, indicating
that the quality of the ClinCheck prediction was more acceptable than that of the actual outcome.
The authors supported the idea that the ClinCheck prediction was not entirely an accurate
representation of the actual outcome observed clinically. Their conclusion agreed with the
aforementioned systematic review in that the discrepancy between the OGS scores of the actual

23
outcomes and those of the predicted was mainly due to deficiencies in the ability of CAT to
control alignment, buccolingual inclinations, occlusal contacts, and occlusal relations.
Another method of evaluating the accuracy of orthodontic tooth movement with clear
aligners is to compare the amount of tooth movement that actually occurred to the anticipated
amount of tooth movement. Kravitz and his colleagues used Invisalign’s proprietary software,
ToothMeasure to answer the question, “How well does Invisalign work?”. The authors evaluated
the efficiency of seven different types of tooth movements of over 400 anterior teeth by
superimposing the intraoral scans of the achieved outcome to the predicted outcome. The results
indicated the mean accuracy of tooth movement was 41%, the most accurate movement being
lingual constriction of maxillary incisors (47.1%) and the least being extrusion of maxillary
incisors (18.3%). They also observed a significant loss of control of maxillary canine rotation
greater than fifteen degrees.28
These results are in general agreement with other studies that
reported the lack of control of orthodontic tooth movement with clear aligners.
In 2011, Krieger and her colleagues utilized the same software to determine the accuracy
of Invisalign treatments in the anterior region. They compared the prediction models to the final
models by measuring the changes in overjet, overbite, and dental midline shift in upper and
lower arches. The results revealed deviations in all parameters: overjet 0.4mm (SD±0.7),
overbite 0.9mm (SD±0.9), and dental midline shift 0.4mm (SD±0.5).63
Similarly, the same
authors evaluated the efficiency of CAT in further details. Using ToothMeasure, the accuracy of
Invisalign treatments was evaluated in terms of the change in anterior crowding, anterior arch
length, intercanine distance, overjet, overbite, dental midline deviation, and Little’s irregularity
index. The authors found that the clear aligner treatment was effective in resolving anterior
crowding by increasing the arch length and intercanine distance. The results were comparable to

24
their previous study where they observed slight discrepancies between the ClinCheck prediction
and the actual outcome in all parameters. Although the change in overbite was the least effective
(-0.7mm ± 0.87), the authors concluded that the discrepancies were clinically insignificant.64
The
reported deviations between the predicted outcome and the actual outcome may necessitate the
practitioners to incorporate overcorrection in their treatment plan to achieve the desired amount
of tooth movement.
Methods of Analyzing Orthodontic Tooth Movement
As intraoral-scanning and mesh-analyzing technology advances, many studies have been
done to analyze orthodontic tooth movement occurring during CAT. Some studies used a certain
company’s proprietary software to superimpose the intraoral scans and measure the
discrepancies.28,63,64
Others used commercially available CAD software to reach a similar goal.65-
68 With any type of software, the steps involve superimposing the scanned models and measuring
the tooth movement in terms of translation and rotation in three planes (mesiodistal,
buccolingual, and occlusogingival).
1. Superimposition of Intraoral Scans
3D models of the dentition can be obtained via either directly scanning the teeth using
any commercially available intraoral scanner or laser scanning the stone models of teeth obtained
from an alginate or polyvinyl siloxane (PVS) impression. These intraoral scans can be uploaded
on any CAD software with an alignment function. In order to compare orthodontic tooth
movement between two 3D models, the scans have to be superimposed using stable structures as

25
references. According to Jang et al., anatomic structures, such as palatal rugae, that are known to
be stable throughout orthodontic treatment can be used as a reliable registration point.69
Mandibular superimposition may involve superimposing on chin, which is a stable skeletal
structure.67
Implants can also be placed in areas that are not affected by tooth movement to be
used as stable references for superimposition.70
Others have utilized teeth that underwent no
orthodontic movement.65,66
Whatever the structure is used, superimposition can be valid as long
as the structures are stable between the two time points that the intraoral scans are obtained.
Once the stable registration points are identified, most CAD programs use iterative
closest point (ICP) algorithm, where the distances between one point to its closest point on the
two registered scans are calculated, using the least-squares method as shown in Equation 1.68
Based on the unchanged structures found in both scans, software computes the optimal
transformation to align one set of data points to the other set of data points by calculating the
smallest possible differences of the two data sets.67
As a result, the transformation matrix is
obtained where the two scans can be best aligned.
( )
∑‖ ‖
Equation 1. Cost function as the mean of the least-square distances from the vertices of one data set to the other (M is a
rigid transformation matrix, N is the number of points, xi is the vertex of the first data set, and pi is the vertex of the
second data set)
2. Measurement of Tooth Displacement
In order to measure the amount of tooth displacement through superimposing the pre-
treatment and post-treatment scans, numerous methods can be used to measure the 3-dimensional

26
changes. Many studies utilize the 3-plane coordinate system to calculate the displacement in
translation and rotation in x-, y-, and z-axes.65-68
Once two scans are aligned and oriented in a
common coordinate system, each axis is defined to represent mesiobuccal, faciolingual, and
occlusogingival planes. Depending on the goal of the study, some studies record the coordinates
of the same anatomic structures, e.g. cusp tips, of the scans to calculate the linear displacement in
three diretions.65,66
This method does not include any rotational changes.
On the other hand, the ICP algorithm that was used to initially align the two scans can be
used again to calculate the direction and the extent of tooth movement. After the scans are
oriented in a common coordinate system, the tooth in question can be superimposed in three
dimensions to the corresponding tooth in the other model, using the same method with a different
transformation matrix that is unique to each tooth. This transformation matrix represents the
movement by a translation vector and a rotation matrix.67,68
This method will provide a linear
displacement as well as a rotational displacement.
Figure 3. Normalized 3-D view of the anterior teeth before and after treatment. Black: before treatment; gray: 2 months
after treatment.68

27
Figure 4. Coordinate system for analyzing tooth movement by automatic registration. (a) Before registration, (b) after
registration. The coordinate systems (x’, y’, z’) and (x, y, z) correspond to before and after tooth movement,
respectively.68
3. CloudCompare Software
CloudCompare (http://www.danielgm.net/cc/) is open source 3-dimensional point cloud
and mesh processing software. Designed mainly to compare between two point clouds or
meshes, the software can carry out advanced algorithms, including registration, resampling,
statistics computation, sensor management, and segmentation.71
With these functions,
CloudCompare can be applied to tasks that require high sensitivity and specificity in comparing
two 3-dimensional objects. Manuel and his colleagues utilized CloudCompare to validate their
comparison study of the steady state geometry of the finite element model of the nasal tip
deformation. The comparison of the models was made by evaluating the distance between the
subset of points. Their results indicated that there was a good agreement with the two un-
deformed models as well as a good overlap between the point cloud from 3D reconstruction and
the finite element model from computed tomography image. Using CloudCompare, the authors

28
could validate the finite element models with a clinical significance.72
Likewise, another study employed CloudCompare in identifying the unique anatomical
features of frontal sinus. Beani and his colleagues obtained 3D configurations of frontal sinus of
twenty subjects. Using CloudCompare, the authors calculated the difference between the two
meshes and performed a qualitative comparison of the two. The results indicated that the
accuracy of the comparison was up to 100%, and the study concluded that the 3D anatomy of
frontal sinus can be used to identify different individuals.73
Therefore, CloudCompare is used in
a variety of researches that require a meticulous comparison of 3D point clouds and meshes. The
software can perform advanced algorithms to derive a conclusion with reasonable reliability.

29
CHAPTER 3: EXPERIMENTAL DESIGN AND METHODS
Institutional Review Board Approval
In an effort to protect the participants’ human right, the protocol was reviewed and approved
by West Virginia University Institutional Review Board for human research protection (Protocol
#1606156142). (See Appendix A)
Sample Collection
For this retrospective study, permission to use the patient records was obtained from one
of the co-investigators, Thomas Shipley (Peoria, AZ), who provided the necessary patient data.
(See Appendix B) The records of all patients who completed treatment with clear aligners
between January 1, 2013 and July 1, 2016 were reviewed. Cases that did not have pre-treatment
or post-treatment (or pre-refinement) scans were not included in the study. Among 426 clear
aligner cases reviewed, a total of 105 cases met the following inclusion criteria and were
included in the study.
Inclusion Criteria
1) Complete permanent dentition excluding third molars
2) Age between 13 and 80
3) Non-smoker
4) No gender or race predilection

30
5) ClinCheck treatment plan included a minimum of 10 aligners
6) Complete pre-treatment and post-treatment (or pre-refinement) records, including
intraoral scans
7) No fixed appliances or auxiliary devices were used
8) Non-extraction treatment
9) Planned treatment involved minimal molar movement
10) All of the prescribed aligners were completed without refinement or alterations of the
treatment plan
For the experimental group, a total of 46 consecutively treated clear aligner cases with
MOPs were selected. These patients switched the aligners every 3 days after receiving MOPs in
the anterior region for both arches. For the control group, a total of 59 consecutively treated clear
aligner cases without MOPs were selected. These patients did not undergo MOPs and switched
the aligners every 14 days. Each subject was given a random identification number, and all
protected healthy information identifiers were removed for de-identification purposes.
Using OrthoCAD (http://www.mycadent.com), the pre-treatment as well as the post-
treatment intraoral scans of the maxillary and mandibular arches of each patient were obtained in
STL file format (Figure 5). The prediction models were also obtained in STL file format via
ClinCheck Pro v.5.0 (http://www.invisalign.com/us/support/pages/clincheckpro.aspx) (Figure 6).
For the study, tooth displacement of only the permanent maxillary and mandibular incisors and
canines were considered.

31
Figure 5. An example of a composite of intraoral scans obtained
from OrthoCAD
Figure 6. An example of a composite of prediction models
obtained from ClinCheck Pro
Superimposition of Scans and Establishing Coordinate System
For each case, a pre-treatment scan and a post-treatment scan of the same arch were
uploaded on the CloudCompare software. Using “Align/Point Pairs Picking” function of the
software, 3 or more easily identifiable anatomical landmarks on unmoved posterior teeth, such as
cusp tips and fossae of the molars, were selected on the post-treatment scan (i.e. “Reference”).
The corresponding landmarks were also selected on the pre-treatment scan (i.e. “Align”) in the
same order (Figure 7).

32
With the Root Mean Square (RMS) <10%, the pre-treatment scan was superimposed onto
the post-treatment scan. The alignment was visually inspected to verify the correct positioning of
the scans (Figure 8). The aligned scans were saved as a CloudCompare project.
Next, the same pre-treatment scan was uploaded; this time, it was aligned to the ClinCheck
prediction model using the same method. This process was repeated for both upper and lower
arches. For each sample, maxillary and mandibular pre-treatment, post-treatment, and prediction
scans were aligned and saved separately as CloudCompare projects.
Figure 7. Initial alignment and registration of pre-treatment and post-treatment scans using “Align/Point Pairs
Picking” function on CloudCompare

33
Analysis of Tooth Displacement
For the study, the amount of displacement of only the incisors and canines of each arch were
considered. The previously saved project of the aligned arches was uploaded onto
CloudCompare (Figure 9).
Using the “Align/Point-Pairs Picking” function with RMS < 10%, the pre-treatment scan
was selected as the “Align” point cloud, and either the post-treatment scan or the prediction
model was selected as the “Reference” point cloud (Figure 10). The scans were re-aligned at one
of the anterior teeth by selecting three or more easily recognizable anatomical structures on a
particular tooth.
Figure 8. Visual verification of the initial alignment of pre-treatment and post-treatment scans

34
Figure 9. Aligned scans were uploaded on CloudCompare to analyze the displacement of each tooth
Figure 10. Tooth-to-tooth alignment using the “Align/Point Pair Picking” function

35
Unlike the initial alignment of the arches, the information of the direction and the magnitude
of the transformation was important for the tooth-to-tooth alignment. Thus, after the alignment at
the particular tooth was visually verified, the resultant transformation matrix was saved in a text
format (Figure 11). The same process was repeated for all incisors and canines of both arches for
all of the pre-treatment/post-treatment and pre-treatment/prediction projects.
Figure 11. Visual verification of the alignment of the tooth and the resultant transformation matrix

36
Calculation of Tooth Displacement
Each transformation matrix (Figure 12) was applied to a formula on Microsoft Excel
spreadsheet to calculate the angular changes about the x-, y-, and z-axes as well as the linear
changes in x-, y-, and z-planes.
Figure 12. An example of a transformation matrix
From the transformation matrix, the magnitude of the linear and angular displacement of
each tooth could be calculated using the components of the matrix. The transformation matrix is
expressed as 44 matrix as:
[
]
or
[
]
where, (
); (
√
); (
).
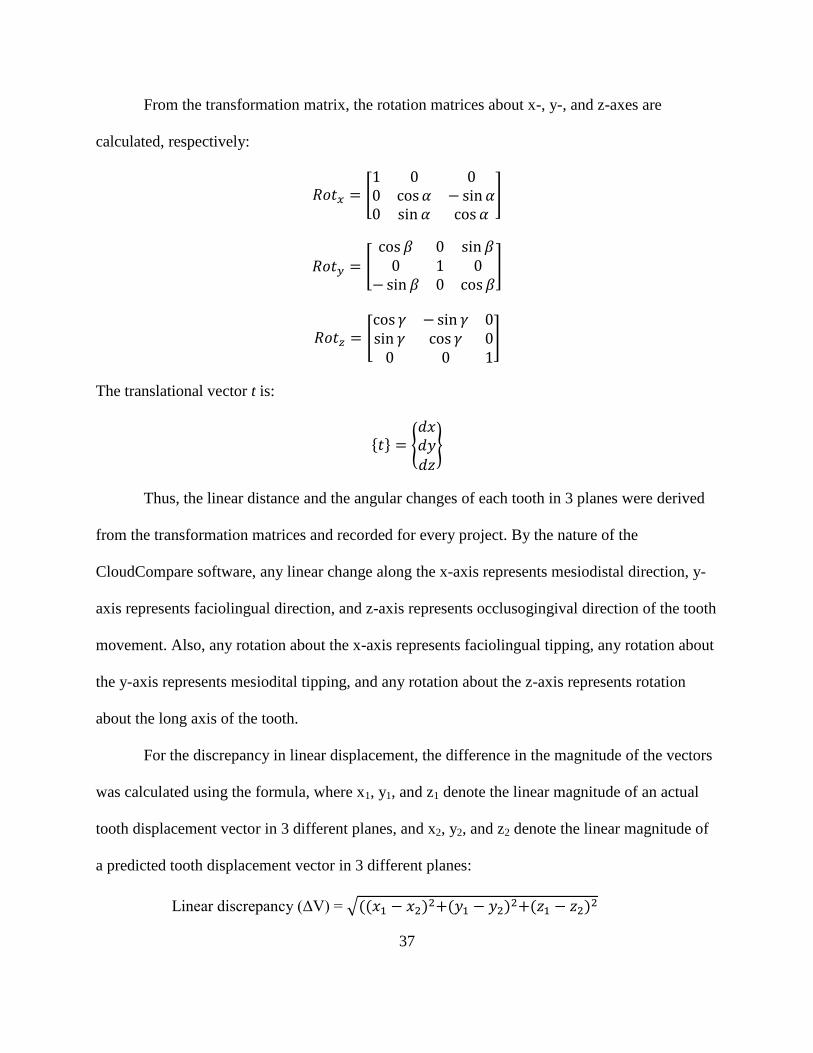
37
From the transformation matrix, the rotation matrices about x-, y-, and z-axes are
calculated, respectively:
[
]
[
]
[
]
The translational vector t is:
{ } {
}
Thus, the linear distance and the angular changes of each tooth in 3 planes were derived
from the transformation matrices and recorded for every project. By the nature of the
CloudCompare software, any linear change along the x-axis represents mesiodistal direction, y-
axis represents faciolingual direction, and z-axis represents occlusogingival direction of the tooth
movement. Also, any rotation about the x-axis represents faciolingual tipping, any rotation about
the y-axis represents mesiodital tipping, and any rotation about the z-axis represents rotation
about the long axis of the tooth.
For the discrepancy in linear displacement, the difference in the magnitude of the vectors
was calculated using the formula, where x1, y1, and z1 denote the linear magnitude of an actual
tooth displacement vector in 3 different planes, and x2, y2, and z2 denote the linear magnitude of
a predicted tooth displacement vector in 3 different planes:
Linear discrepancy (ΔV) = √(( ) ( ) ( )

38
For the discrepancy in angular displacement, the relative error of the angular change in each
direction was calculated using the formula:
Relative Error for Angular Change (Δx˚, Δy˚, Δz˚) = | (
)|
The resultant relative errors have no unit. All of the values would approach zero as the actual
tooth displacement approximated closer to the predicted amount of tooth displacement.
Statistical Analysis
Tooth movements for each tooth in all three directions were analyzed using analysis of
variance, Student’s t-test, Wilcoxon/Kruskal-Wallis rank sums test, and contingency analysis.
Significance of results was determined as p-value < 0.05 (95% Confidence Interval). The intra-
operator correlation test was performed to evaluate the intra-operator error.

39
CHAPTER 4: RESULTS
Reliability of Measurements
Intra-rater reliability test was performed to evaluate the operator’s reliability with initial
alignment of the scans, superimposition of the anterior teeth, and measurement of the tooth
displacement. Twenty measurements were repeated seven days apart. The intra-rater reliability
of the investigator was 98.8%.
Analysis of Tooth Displacement
1. Effect of MOP on Individual Tooth
The linear and angular discrepancies of the individual tooth were compared between the
control samples and the experimental samples using one-way analysis of variance (ANOVA)
supplemented by Wilcoxon/Kruskal-Wallis Rank Sums test. The mean values of all data were
presented in Table 1. The average values for V, x, y, and z of individual tooth ranged
from 1.9138 to 3.5393, from 1.0386 to 2.5315, from 0.8844 to 3.9326, and from 0.5938 to
1.8373, respectively. However, the standard deviations for all parameters ranged from 0.4470 to
14.6098, indicating a broad range of discrepancy values. The broad range of the values can be
visually confirmed when these mean values were plotted in bar graphs according to teeth and
parameters (V, x, y, and z).
The mean values showed a noticeable variability among teeth, parameters, or arches
(Figures 13 and 14). The figures indicate no consistent pattern between the groups where no

40
mean value of a certain parameter is consistently higher in one group than the other. For
example, the control group’s mean relative error of the rotation about the y-axis (y) for upper
right central incisors (3.9326±2.2639) was greater than twice the experimental group’s value
(1.9114±2.8025). On the other hand, for the same parameter, the mean relative errors for lower
right canines (#27) show an opposite pattern, where the experimental value (1.5885±2.5676) is
almost double the control value (0.8844±2.2146). Likewise, the figures do not readily exhibit
any tendency for other parameters of the rest of the anterior teeth.
Table 1. Mean values of the linear (ΔV) and angular discrepancies (Δx˚, Δy˚, Δz˚) of all anterior teeth and the standard
deviations for all parameters
V x y z
Mean Std Dv Mean Std Dv Mean Std Dv Mean Std Dv
#6
Control 2.7242 0.9866 1.6015 1.6681 1.2881 2.2489 0.8774 3.5278
MOP 3.5393 1.4669 1.0988 1.9814 1.5790 2.6037 0.9594 7.9788
#7
Control 2.7672 1.0244 1.9361 1.6694 2.0734 2.2613 0.9025 3.5645
MOP 3.2902 1.5055 1.4042 1.9906 1.4716 2.6446 0.8104 8.0522
#8
Control 2.7395 1.0966 1.4863 1.6705 3.9326 2.2639 0.5938 3.7776
MOP 3.4710 1.5105 2.5315 1.9931 1.9114 2.8025 0.7343 9.8747
#9
Control 2.6373 1.1554 2.3918 1.7157 1.2886 2.2783 0.8459 3.9076
MOP 3.3507 1.5155 2.1857 2.0453 1.4127 2.8044 1.4923 14.6098
#10
Control 3.0536 0.4470 1.9469 1.5314 2.4048 2.0591 0.9430 2.8251
MOP 3.2301 1.1609 1.2121 1.7197 1.6645 2.2995 0.8124 4.4877
#11
Control 2.6453 0.5761 1.7060 1.5373 1.0201 2.0762 1.1353 2.9449
MOP 2.8778 1.1962 2.3236 1.7677 1.3125 2.3816 1.3372 4.7342

41
#22
Control 3.0861 0.6026 1.2583 1.5487 2.8260 2.1010 1.7371 3.0960
MOP 2.7090 1.2279 1.4935 1.7918 1.2024 2.4453 0.7758 5.3465
#23
Control 2.2611 0.6718 1.0386 1.5759 1.0461 2.1107 0.9315 3.1101
MOP 2.2687 1.2439 1.2320 1.7984 0.9379 2.5035 1.0233 5.4802
#24
Control 2.3523 0.6999 1.4854 1.5944 1.0071 2.1187 0.7418 3.1664
MOP 1.9138 1.2867 1.0705 1.8280 1.5060 2.5053 0.7991 5.6427
#25
Control 2.0561 0.7600 1.8523 1.5970 1.2406 2.1297 0.6830 3.1909
MOP 2.3261 1.3779 1.3244 1.8581 1.8509 2.5256 1.1071 6.1317
#26
Control 2.3759 0.7970 1.1473 1.6209 1.0799 2.1898 0.9189 3.2412
MOP 2.0885 1.3889 1.6533 1.9313 1.4454 2.5607 1.1816 6.3562
#27
Control 3.0149 0.9632 1.9657 1.6465 0.8844 2.2146 1.8373 3.5182
MOP 2.5751 1.4369 1.3916 1.9386 1.5885 2.5676 0.7304 7.8771
Figure 13. Mean linear discrepancy (ΔV) and relative errors for angular displacement (Δx˚, Δy˚, Δz˚) for upper anterior
teeth (#6-#11) for the experimental (MOP) and control samples with standard errors, where ΔV is millimeter, and the
angular parameters are dimensionless.
0.0
1.0
2.0
3.0
4.0
5.0
6.0
ΔV Δx˚ Δy˚ Δz˚ ΔV Δx˚ Δy˚ Δz˚ ΔV Δx˚ Δy˚ Δz˚ ΔV Δx˚ Δy˚ Δz˚ ΔV Δx˚ Δy˚ Δz˚ ΔV Δx˚ Δy˚ Δz˚
#6 #7 #8 #9 #10 #11
Mean Tooth Displacement - Upper Teeth
Control MOP
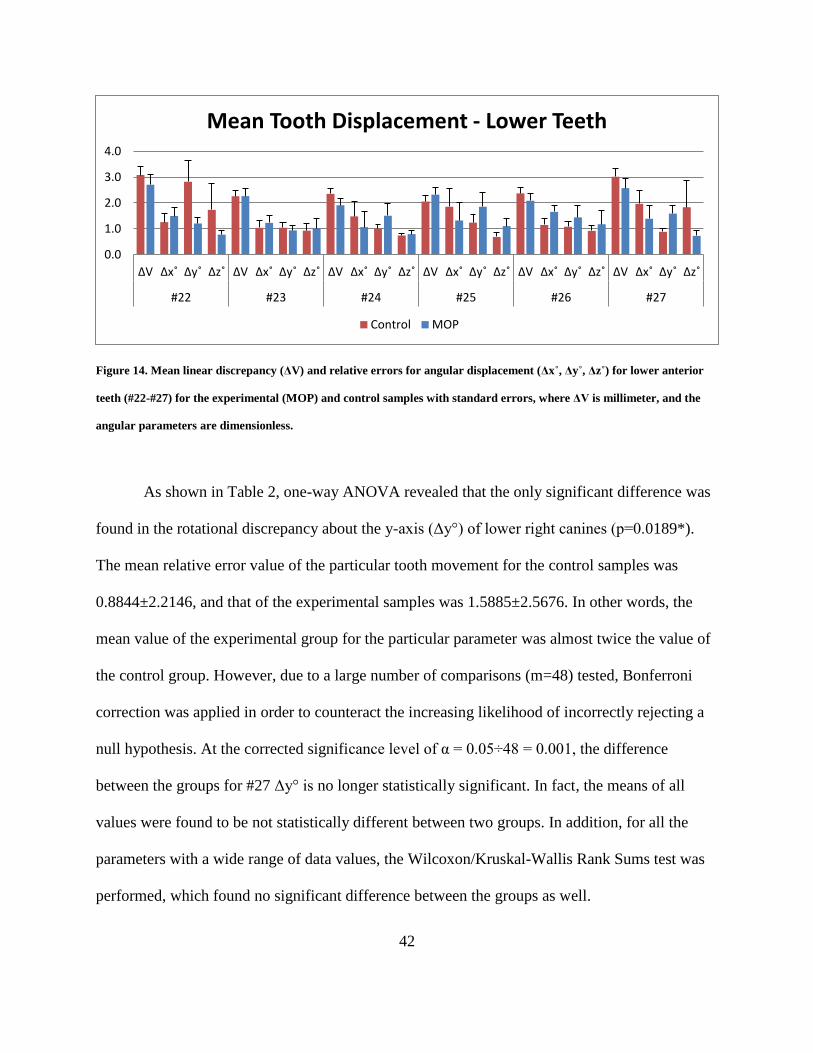
42
Figure 14. Mean linear discrepancy (ΔV) and relative errors for angular displacement (Δx˚, Δy˚, Δz˚) for lower anterior
teeth (#22-#27) for the experimental (MOP) and control samples with standard errors, where ΔV is millimeter, and the
angular parameters are dimensionless.
As shown in Table 2, one-way ANOVA revealed that the only significant difference was
found in the rotational discrepancy about the y-axis (Δy°) of lower right canines (p=0.0189*).
The mean relative error value of the particular tooth movement for the control samples was
0.8844±2.2146, and that of the experimental samples was 1.5885±2.5676. In other words, the
mean value of the experimental group for the particular parameter was almost twice the value of
the control group. However, due to a large number of comparisons (m=48) tested, Bonferroni
correction was applied in order to counteract the increasing likelihood of incorrectly rejecting a
null hypothesis. At the corrected significance level of α = 0.05÷48 = 0.001, the difference
between the groups for #27 Δy° is no longer statistically significant. In fact, the means of all
values were found to be not statistically different between two groups. In addition, for all the
parameters with a wide range of data values, the Wilcoxon/Kruskal-Wallis Rank Sums test was
performed, which found no significant difference between the groups as well.
0.0
1.0
2.0
3.0
4.0
ΔV Δx˚ Δy˚ Δz˚ ΔV Δx˚ Δy˚ Δz˚ ΔV Δx˚ Δy˚ Δz˚ ΔV Δx˚ Δy˚ Δz˚ ΔV Δx˚ Δy˚ Δz˚ ΔV Δx˚ Δy˚ Δz˚
#22 #23 #24 #25 #26 #27
Mean Tooth Displacement - Lower Teeth
Control MOP

43
Table 2. One-way ANOVA of the linear and angular discrepancies between the actual outcome and the predicted outcome
for individual anterior teeth between the control and the experimental samples
V x y z
p value S/NS p value S/NS p value S/NS p value S/NS
#6 0.0926 NS 0.1680 NS 0.6169 NS 0.7333 NS
#7 0.1419 NS 0.3660 NS 0.5623 NS 0.6495 NS
#8 0.0631 NS 0.1773 NS 0.3758 NS 0.1835 NS
#9 0.0733 NS 0.8772 NS 0.7751 NS 0.1703 NS
#10 0.7244 NS 0.1381 NS 0.6494 NS 0.5353 NS
#11 0.4782 NS 0.4565 NS 0.4447 NS 0.6099 NS
#22 0.4443 NS 0.6158 NS 0.1454 NS 0.4814 NS
#23 0.9842 NS 0.7010 NS 0.7179 NS 0.8364 NS
#24 0.1654 NS 0.6046 NS 0.2427 NS 0.7135 NS
#25 0.4645 NS 0.5835 NS 0.3095 NS 0.2044 NS
#26 0.4236 NS 0.4734 NS 0.3846 NS 0.5978 NS
#27 0.3825 NS 0.4340 NS 0.0189* NS 0.4384 NS
2. Effect of MOP by Arch
The mean linear discrepancy and the relative errors for angular displacement were
combined for the upper arch, the lower arch, and the entire dentition for all samples. The mean
values for the parameters ranged between 0.8830 and 3.2932, and the standard deviations ranged
from 0.0085 to 2.0470 (Table 3). Unlike the mean values and standard deviations for individual
teeth, the values combined by the arch showed a smaller range and less variation. However, the
values exhibited no pattern amongst themselves; neither group showed consistently higher mean

44
value than the other. This can be visually verified in Figure 15.
Table 3. Mean values of the linear and angular discrepancies of upper, lower, and both arches and the standard
deviations for all parameters
V x y z
Mean Std Dv Mean Std Dv Mean Std Dv Mean Std Dv
Mx
Control 2.7607 0.0859 1.8421 0.0713 1.9964 0.0206 0.8830 0.0486
MOP 3.2932 0.2332 1.7961 2.0470 1.5595 0.2124 1.0236 0.7969
Md
Control 2.5244 0.4176 1.4584 0.0085 1.3449 0.0680 1.1422 0.0106
MOP 2.3135 0.2958 1.3611 0.8331 1.4198 0.3133 0.9378 0.5990
Total
Control 2.6428 0.4354 1.6514 0.0967 1.6743 0.0315 1.0123 0.0363
MOP 2.8034 0.5712 2.5284 1.7139 1.4872 0.2659 1.2967 0.6891
Figure 15. Mean linear discrepancy and relative errors for angular displacement for upper, lower, and combined arches
for the experimental (MOP) and control samples and standard errors, where ΔV is millimeter, and the angular
parameters are dimensionless.
0
0.5
1
1.5
2
2.5
3
3.5
4
Control MOP Control MOP Control MOP Control MOP
ΔV Δx° Δy° Δz°
Mean Tooth Displacement by Arch
Upper Lower Total

45
One-way ANOVA revealed that there was a statistically significant difference between
the groups when the linear discrepancy (ΔV) of the upper anterior teeth was considered
(p=0.0015*). The mean value of the linear discrepancy of the upper teeth for the control samples
(2.7607±0.0859) was lower than that of the experimental samples (3.2932±0.2332). For some
parameters, the control samples exhibited higher mean values than the experimental samples.
However, no significant difference between the control and the experimental groups was found
for the rest of the parameters when the teeth were combined by the arches (Table 4).
Table 4. One-way ANOVA of the linear and angular discrepancies between the actual outcome and the predicted outcome
of upper, lower, and combined arches between the control and the experimental groups
V x y z
p value S/NS p value S/NS p value S/NS p value S/NS
Mx 0.0015* S 0.8864 NS 0.3949 NS 0.2466 NS
Md 0.2088 NS 0.7374 NS 0.7607 NS 0.5572 NS
Total 0.4073 NS 0.6874 NS 0.5233 NS 0.8130 NS
3. Effect of MOP on the Types of Orthodontic Tooth Movement
Table 5 shows the difference between the mean values of the groups according to the
types of OTM and the statistical significance of the differences for upper and lower arches. As
shown in Figure 16, the linear discrepancy and the angular relative errors are generally similar
for both groups. Neither group has a consistently higher value for any parameter. However, the
greatest discrepancy between the mean values of the groups was found in the translational
movement (ΔV) of the upper anterior teeth, which was 0.8770 (MOP: 2.5284±1.7139, Control:

46
1.6514±0.0967). The difference in the mean values between the groups for all other movements
was within 0.55. Multi-factor ANOVA indicated that the differences between the groups
according to the types of orthodontic tooth movement were not statistically significant indicated
by the p-values presented in Table 5.
Table 5. The difference in linear and angular discrepancy between the groups and the statistical significance
V x y z
Mean Difference Mean Difference Mean Difference Mean Difference
Mx Control 2.7607
0.5325 1.8421
0.0460 1.9964
0.4369 0.8830
0.1406 MOP 3.2932 1.7961 1.5595 1.0236
Md
Control 2.5244 0.2109
1.4584 0.0973
1.3449 0.0749
1.1422 0.2044
MOP 2.3135 1.3611 1.4198 0.9378
Total
Control 2.6428 0.1606
(p=0.4073)
1.6514 0.8770
(p=0.6873)
1.6743 0.1871
(p=0.5233)
1.0123 0.2844
(p=0.8130) MOP 2.8034 2.5284 1.4872 1.2967
Figure 16. Comparison of mean tooth displacement by different types of orthodontic tooth movement with standard
deviations, where the ΔV is millimeter, and the angular parameters are dimensionless.
0
0.5
1
1.5
2
2.5
3
3.5
4
ΔV Δx˚ Δy˚ Δz˚ ΔV Δx˚ Δy˚ Δz˚ ΔV Δx˚ Δy˚ Δz˚
Upper Lower Total
Mean Tooth Displacement by Types of OTM
Control MOP

47
Effect of Micro-Osteoperforation by Gender
The control group consisted of 23 male (39.0%) and 36 female (61.0%) subjects. The
experimental group consisted of 13 male (28.3%) and 33 female (71.7%) subjects. Both groups
had noticeably more female subjects, but the control group had a slightly higher rate of male
subjects.
The effect of micro-osteoperforation in relation to gender of the subjects was analyzed
using regression analysis with the least squares means. All anterior teeth were combined, but
each parameter was analyzed separately. When gender was considered separately for all samples
in both groups, linear displacement was the only parameter that was found significantly different
between genders (p = 0.0005*). For both groups, females had smaller linear and angular
discrepancies between the predicted and the actual tooth positions, compared to males in the
same group. As visually represented in Figure 18, males (mean = 2.98 ± 0.11) showed a greater
linear discrepancy (ΔV) than females (mean = 2.57 ± 0.07) with the difference of approximately
0.41 when both the control and experimental samples were considered together. A similar pattern
was observed in all other parameters. (See Appendix E) However, if the gender effect was
combined with the effect of MOP, the interaction was only suggestive of statistical significance
(p = 0.0526). On the other hand, the analyses of the angular parameters showed no significant
difference between the genders or between the groups (Table 6).

48
Figure 17. Means of linear and angular discrepancies by gender with the groups combined with standard deviations,
where the ΔV is millimeter, and the angular parameters are dimensionless.
Figure 18. Least Squares Means Plot of gender versus the linear discrepancy (ΔV) between the actual and the predicted
outcomes for both control and experimental samples combined
0
0.5
1
1.5
2
2.5
3
3.5
ΔV Δx˚ Δy˚ Δz˚
Dis
cre
pan
cy
Tooth Displacement
Mean Discrepancy of Tooth Displacement: Gender
Male
Female

49
Table 6. The mean linear and angular discrepancies for male and female subjects of both groups and the significance of
the interaction between the gender and the orthodontic tooth movement in clear aligner treatment with or without MOPs
Parameter
Gender Mean
Gender
p-value
Gender*Group Mean Gender
& Group
p-value Male Female Male &
Control
Female &
Control
Male
& MOP
Female
& MOP
V 2.97916 2.57532 0.0005* 2.84341 2.51387 3.21356 2.64188 0.0526
x 1.43202 1.73846 0.2149 1.41367 1.79470 1.46792 1.66174 0.6862
y 1.59172 1.60492 0.9388 1.56108 1.73319 1.65034 1.43021 0.5303
z 1.04956 0.97762 0.8025 1.09690 0.93612 0.95796 0.99749 0.6457
Effect of Micro-Osteoperforation by Age
The mean age for the control group was 29.3 years, ranging from 11.3 to 89.4 years. The
mean age for the experimental group was 34.1 years, ranging from 17.1 to 60.2 years. Although
the mean age was slightly higher for the experimental group, the range was smaller than that of
the control group.
The relationship between MOPs and the age of the subjects was analyzed using multi-
factorial ANOVA. As shown in Figure 19, the fit line of the experimental group has a negative
slope between the linear discrepancy (ΔV) and the age of the patients, but the fit line of the
control group has a slightly positive, almost flat slope. As indicated by the difference in the
slopes, the negative correlation between the age and the linear discrepancy is more pronounced
in the MOP group (estimated difference = 0.0204), while the linear discrepancy tends to increase

50
as the age increases for the control group. The analyses showed that the difference between the
groups was statistically significant for ΔV that was affected by the age of the patients
(p<0.0001*) (Table 7). There is a minimal difference in the linear discrepancy values between
groups where the fit lines intersect around the age of 38. Nevertheless, as the age of the subjects
increased, the MOP samples showed less linear discrepancy between the post-treatment and the
prediction compared to the control.
Figure 19. Regression plot of the linear discrepancy (ΔV) and age and the fit lines for control and experimental groups
Table 7. Multi-factorial ANOVA of the significance of the interaction between MOP and the age of the subjects
Parameter Estimated Difference p-value Significance
V 0.0204 <0.0001* S
x -0.0126 0.1803 NS
y 0.0232 0.0672 NS
z -0.0016 0.8366 NS

51
Effect of Micro-Osteoperforation by Severity of Anterior Malalignment
1. Maxillary Arch
Multi-factorial ANOVA was performed to analyze the relationship between the effect of
MOP and the severity of anterior mal-alignment, indicated by the amount of crowding or spacing
present in the anterior region. As shown in the regression analysis of Δx° and the space available
in the anterior region in Figure 20, the blue fit line that represents the experimental group has a
negative slope. This negative slope indicated a negative correlation between the space available
in the anterior region and the angular discrepancy between the actual and the predicted tooth
displacement about the x-axis. As more space became available, the experimental samples
showed that the actual amount of rotation about x-axis was closer to the predicted amount. On
the other hand, the red fit line in the same regression analysis showed a slightly positive slope,
indicating a mildly positive correlation between the space available in the anterior region and the
angular discrepancy between the actual and the predicted tooth movement.
Regression analyses of the linear and other angular discrepancy values exhibited a similar
pattern, where the MOP fit lines showed a negative correlation and the control fit lines showed a
slightly positive correlation (See Appendix E). However, as shown in Table 8, the analyses
indicated no statistically significant difference between the control and the experimental groups
for the translational movement (p=0.1470) and the rotational movement about the y- and z-axes
(p=0.5316 and p=0.3322, respectively). The rotational movement about the x-axis was the only
movement in the maxillary anterior region that the analysis indicated a statistically different
between the groups (p=0.0201*).

52
Figure 20. Regression analysis of the amount of upper anterior crowding or spacing versus the angular discrepancy about
the x-axis (Δx°) between the actual and the predicted tooth displacements
Table 8. Multi-factorial ANOVA of the significance of the interaction between MOP and the amount of space available in
the upper anterior region
Parameter Estimated Difference p-value Significance
V -0.0487 0.1470 NS
x 0.3993 0.0201* S
y 0.0638 0.5316 NS
z 1.3921 0.3322 NS

53
2. Mandibular Arch
Multi-factorial ANOVA was performed to analyze the relationship between the amount
of space available in the lower anterior region and the effect of micro-osteoperforations. In
Figure 21, the regression plot shows a negative correlation between the linear discrepancy (V)
and the amount of space available in the lower anterior sextant for both groups. As the space
became more available, samples in both groups resulted in a translational movement that was
closer to the predicted movement. With a greater amount of crowding, both groups showed a
greater discrepancy between the actual outcome and the predicted outcome. Although the
difference is slight, the slope of the experimental fit line is steeper than that of the control,
indicating that the experimental samples resulted in even less linear discrepancies with an
increased amount of spacing compared to the control samples. Due to the point where two fit
lines intersect (-3mm of crowding), the difference is more pronounced with more spacing. The
regression plots of the angular discrepancies (x, y, and z) showed a similar pattern where
the fit lines were sloping downwards as the amount of available space increased. (See Appendix
E) However, as reported in Table 9, the ANOVA indicated that the only statistically significant
difference in the slopes between the groups was found with the linear discrepancy (p<0.0001*).
The groups showed no statistically significant difference in terms of angular discrepancies in
mesiodistal, faciolingual, and occlusogingival directions (p=0.1733, 0.8701, and 0.6158,
respectively).
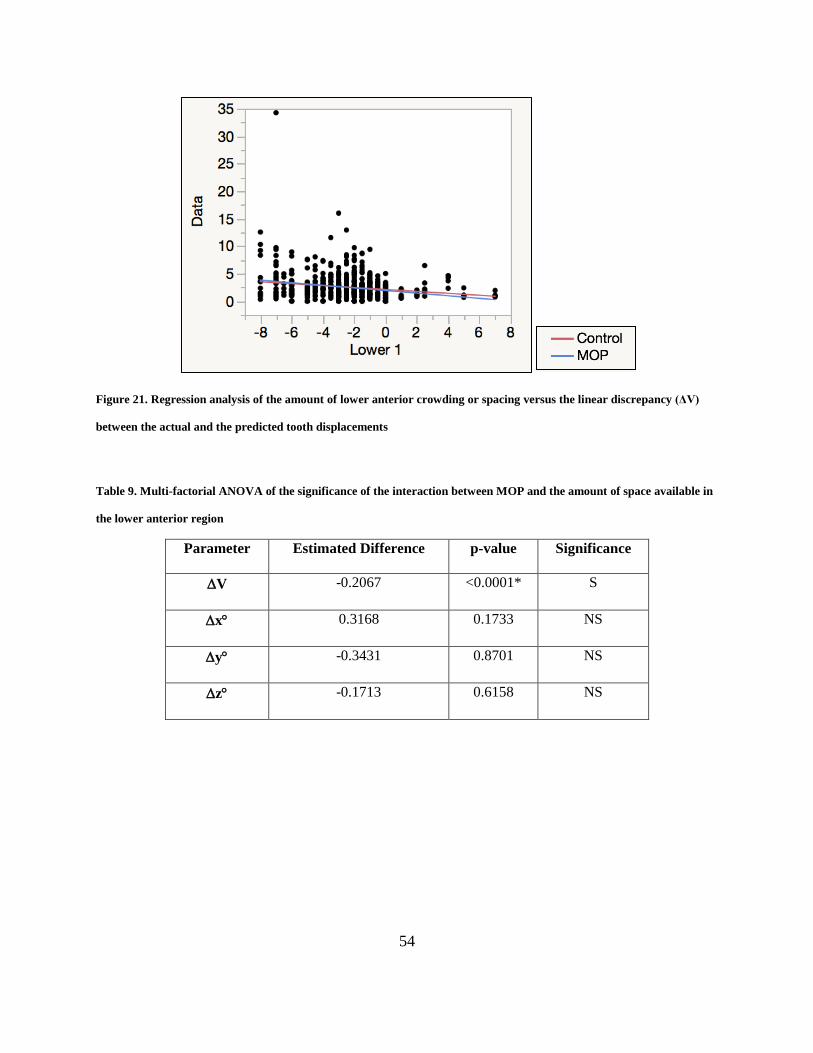
54
Figure 21. Regression analysis of the amount of lower anterior crowding or spacing versus the linear discrepancy (ΔV)
between the actual and the predicted tooth displacements
Table 9. Multi-factorial ANOVA of the significance of the interaction between MOP and the amount of space available in
the lower anterior region
Parameter Estimated Difference p-value Significance
V -0.2067 <0.0001* S
x 0.3168 0.1733 NS
y -0.3431 0.8701 NS
z -0.1713 0.6158 NS
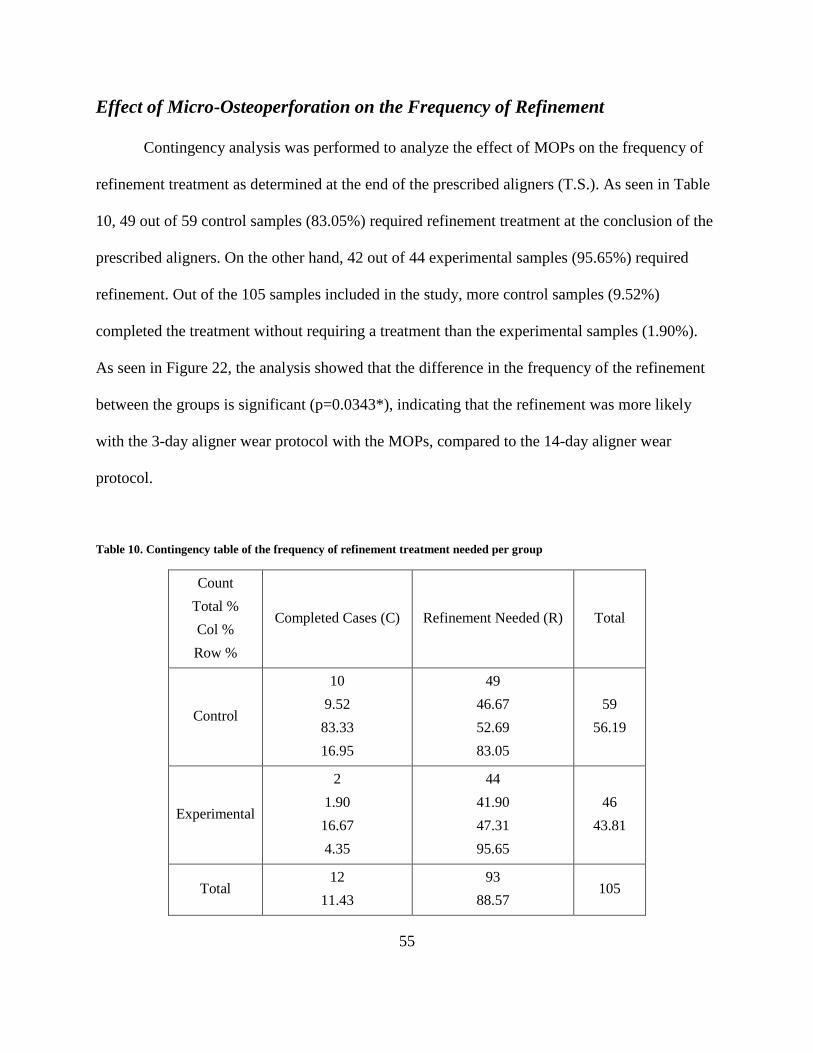
55
Effect of Micro-Osteoperforation on the Frequency of Refinement
Contingency analysis was performed to analyze the effect of MOPs on the frequency of
refinement treatment as determined at the end of the prescribed aligners (T.S.). As seen in Table
10, 49 out of 59 control samples (83.05%) required refinement treatment at the conclusion of the
prescribed aligners. On the other hand, 42 out of 44 experimental samples (95.65%) required
refinement. Out of the 105 samples included in the study, more control samples (9.52%)
completed the treatment without requiring a treatment than the experimental samples (1.90%).
As seen in Figure 22, the analysis showed that the difference in the frequency of the refinement
between the groups is significant (p=0.0343*), indicating that the refinement was more likely
with the 3-day aligner wear protocol with the MOPs, compared to the 14-day aligner wear
protocol.
Table 10. Contingency table of the frequency of refinement treatment needed per group
Count
Total %
Col %
Row %
Completed Cases (C) Refinement Needed (R) Total
Control
10
9.52
83.33
16.95
49
46.67
52.69
83.05
59
56.19
Experimental
2
1.90
16.67
4.35
44
41.90
47.31
95.65
46
43.81
Total 12
11.43
93
88.57 105

56
Figure 22. Mosaic Plot of the frequency of refinement treatment necessary at the completion of the prescribed aligner
wear for control and experimental samples

57
CHAPTER 5: DISCUSSION
The ability of clear aligners to improve the alignment of the anterior teeth and the effects
of MOPs on the accuracy of anterior tooth movement with CAT was examined by comparing the
actual amount of tooth displacement to the predicted amount of tooth displacement. The
information gained through this study will shed light on whether clinicians can shorten the
treatment duration when using clear aligners in conjunction with MOP. The linear discrepancy
was represented by the difference in the magnitude of the ClinCheck prediction and the actual
treatment outcomes. The angular discrepancy was represented by the relative error of the angular
displacement about three different axes (x-, y-, and z-axes). When the discrepancy between the
prediction and the actual outcome of individual teeth was analyzed in three separate planes, the
difference between the control and the experimental samples in all of the values was found to be
statistically insignificant. When these movements for each individual anterior tooth were
considered, the linear and angular discrepancies between the actual outcome and the predicted
outcome in the experimental samples with MOPs were comparable to those of the control
samples without MOP.
On the other hand, the analyses indicated that the only value that was found to be
statistically significant at α=0.05 was the difference in the relative error of angular movement in
faciolingual directions of lower right cuspids. This seemingly significant difference between the
groups exists in other parameters. However, as a result of the high variability of the values as
indicated by the standard deviations, the differences in these parameters were found to be
statistically insignificant. In fact, when Bonferroni correction was applied due to a large number
of comparisons performed for all teeth in all 3 dimensions, the difference between the groups for

58
Δy° of #27 was found to be not statistically significant. Thus, the data indicate that the 3-day
aligner wear combined with MOPs resulted in a clinically comparable accuracy of anterior tooth
movement.
When six anterior teeth were considered together, the analyses indicated a statistically
significant difference between the groups with the linear discrepancy of the maxillary anterior
teeth. Since the formula to obtain the linear discrepancy is a square root of the sum of the
differences in the distances of the vectors, the magnitude of the difference between the actual and
the predicted outcome may not be clinically significant despite the statistical significance. In
fact, the numerical difference between the groups for this parameter was around 0.3mm per
dimension, which may not be clinically significant. Likewise, the differences in all other
parameters for the upper and lower teeth between the two groups were neither clinically nor
statistically significant, indicating that the 3-day aligner wear protocol did not adversely affect
the aligners’ ability to control orthodontic tooth movement if combined with MOPs.
When the mean discrepancies were considered according to the different types of
orthodontic tooth movement, the analyses indicated no statistically significant difference
between the control and the experimental groups. Moreover, the effect of MOP is non-
discriminatory towards the types of tooth movement, such as rotation and translation. However,
this result is not in full agreement with the currently available literature, which reported that the
most accurate tooth movement was lingual tipping (47.1%) and the least accurate was extrusion
(29.6%).28
Due to the method utilized to calculate the discrepancy of the orthodontic tooth
movement in the current study, a direct comparison with the referenced study may not be
applicable. Nevertheless, the results of this study show that the discrepancies in the accuracy of
tooth movement also vary per parameter, suggesting differences in the accuracy of tooth

59
movement with clear aligners although the difference may be statistically insignificant.
Once the data were arranged according to the gender of the subjects, the statistical
analysis indicated that females achieved a translational tooth movement that was significantly
closer to the prediction compared to males. However, for other parameters, the data did not
exhibit this trend or show any statistically significant difference between the genders. This is
partially consistent with the study by Chisari et al., which showed a combined effect of age and
gender on the accuracy of OTM in CAT.27
Nevertheless, the gender differences presented in this
study failed to indicate any clinical significance. In addition, the data indicate no significant
interaction between the effects of MOP and gender. MOPs may have a favorable effect on
translational tooth movement, possibly increasing the tracking ability for female subjects;
however, the analysis is merely suggestive of a possible differential effect of MOP on gender.
If the age of the subjects was considered, a statistically significant effect of MOPs on the
translational movement was observed with the increasing age of the subjects. The effect of MOP
became more favorable as the patient’s age increased, approximating the predicted tooth
movement closer than the 14-day aligner wear protocol. This may be interpreted as a minimal
effect of MOPs in younger individuals. As reported by Ren et al. in their animal study, younger
samples exhibit a faster orthodontic tooth movement compared to older individuals especially
during the initial phase of orthodontic treatment.76
Thus, the effect of MOP may be masked by a
naturally elevated bone turnover observed in younger patients. However, as the rate of
orthodontic tooth movement becomes impeded in adult patients, an intervention to increase the
rate of tooth movement may be more desirable. As supported by the results of the current study,
increasing age may be an indication for MOPs.
The differential effect of MOPs on severity of anterior mal-alignment was measured by

60
the amount of crowding or spacing present initially. Regardless of the application of MOPs, the
actual outcome seems to approximate closer to the prediction with anterior spacing compared to
crowding. On the other hand, as the amount of crowding increases, the subjects who received
MOPs were associated with slightly greater linear and angular discrepancies between the
predicted and the actual outcomes for both upper and lower anterior teeth. This may be explained
by the varying severity of mal-alignment in each group. In general, crowding greater than 4mm
is considered severe, often necessitating extraction or a substantial amount of interproximal
reduction, expansion, and proclination to resolve the crowding. For the samples included in the
study, a total of 31% of the experimental group had severe crowding in either one or both arches,
whereas 22% of the control group had crowding greater than 4mm. On the contrary, the control
group had a higher rate (60%) of minimal crowding or spacing (i.e. less than 1mm crowding or
spacing) compared to the experimental group (45%). In other words, the conclusion that MOPs
may adversely affect the outcome of clear aligner treatment with severe crowding may be
misleading. Nevertheless, the results mostly indicate that the outcome of CAT with or without
MOPs is not significantly affected by the severity of anterior mal-alignment.
Lastly, when the frequency of refinement treatment at the completion of prescribed
aligners was measured, the results revealed that the majority of the CAT cases considered in this
study required refinement treatment, indicating that the actual treatment outcome did not
satisfactorily approximated the predicted outcome for most cases. This is somewhat in agreement
with the current studies that reported the efficiency of clear aligner treatment was anywhere
between less than ideal and clinically unacceptable.26-28, 63, 64
The overall frequency reported in
this study (88.57%) is slightly higher than that reported by Kravitz (70-80%).26
However, the
slight difference between the survey result and the samples used in the current study can be
61
explained by the different standards that may be used to evaluate the final outcome to decide the
need for refinement treatment. Nevertheless, both studies agree that the majority of CAT cases
often do not result in a satisfactory outcome.
Moreover, the experimental group was more likely to proceed with refinement treatment
(95.65% versus 83.05%). Several explanations are possible: First, the 3-day aligner wear may
result in slightly greater discrepancies in all three dimensions per aligner than the 14-day aligner
wear, which may accumulate to a noticeable gap between the actual and the predicted outcome,
necessitating a refinement. Although most of the analyses showed no statistical difference
between the control and the experimental groups, many of the parameters showed a higher
discrepancy for the experimental samples. The cumulative discrepancy between the actual and
the predicted outcomes, though unnoticeable individually, may lead to a need for a refinement
treatment. Second possible explanation is the difference in the severity of malocclusion, which
can be extrapolated from the severity of mal-alignment and the number of prescribed aligners.
The patients with a more severe malocclusion may be more inclined to elect an interventional
procedure in an effort to increase the rate of tooth movement and shorten the treatment duration.
Thus, the experimental group might have inadvertently included more severe cases with more
complicated tooth movement. As mentioned earlier, a greater percentage of the experimental
samples started with more severe anterior crowding. Additionally, the average number of
prescribed aligners was higher for the experimental group (mean 24.7 aligners, ranging from 15
to 50) compared to the control group (mean 21.2 aligners, ranging from 10 to 46). Therefore, the
sheer complexity of the cases might have resulted in a higher frequency of refinement treatment.

62
Hypotheses Testing
Summary of Results
1. ACCEPTED: There was no significant difference between the groups in tooth
movements of the anterior teeth predicted by the ClinCheck compared to the actual
treatment between the experimental and control groups.
2. PARTIALLY ACCEPTED: There was no significant difference between the groups in
the tooth movements of anterior teeth predicted by the ClinCheck compared to the actual
treatment outcome among angular movements. However, there was a statistically
significant difference in the linear tooth movement of upper anterior teeth predicted by
the ClinCheck compared to the actual treatment outcome.
3. ACCEPTED: There was no statistically significant difference between the groups in the
accuracy of tooth movements of anterior teeth predicted by the ClinCheck compared to
the actual treatment outcome between genders. However, there was a statistically
significant difference for the translational movements between genders when samples
from both groups were combined. There was no significant difference in the interaction
of MOPs and gender for the accuracy of anterior tooth movement.
4. REJECTED: There was a statistically significant difference between the groups in the
accuracy of the tooth movements of anterior teeth predicted by the ClinCheck compared
to the actual treatment outcome among different age groups.
5. PARTIALLY ACCEPTED: There was a statistically significant difference between the
groups in the rotational tooth movements of upper anterior teeth and in the linear tooth
movements of lower anterior teeth predicted by the ClinCheck compared to the actual

63
treatment outcome for varying severity of anterior mal-alignment. No other tooth
movements showed any statistical difference between the groups.
6. REJECTED: There was a statistically significant difference between the groups in the
frequency of refinement treatments at the completion of the prescribed aligner treatment.
Clinical Implications
The addition of MOP in clear aligner treatment seems to be a viable option to shorten the
treatment duration without adversely affecting the quality of treatment outcome. The
approximation of the actual tooth movement to the predicted tooth movement seems to be
minimally affected by a significant shortening in the duration of the aligner wear (3 days versus
14 days). By shortening the treatment duration, the patients will more likely to maintain a high
level of compliance throughout the treatment without exposing themselves to damaging side
effects associated with prolonged orthodontic treatment.
For more complicated tooth movement, MOPs may be combined with a longer aligner
wear to increase the efficiency of tooth movement. In cases where the impeded tooth movement
becomes an evident concern, such as in older patients and male patients, MOP can be offered not
just as a method of shortening the treatment duration, but also as an auxiliary to increase the
accuracy of the orthodontic tooth movement with the longer duration of aligner wear.

64
CHAPTER 6: SUMMARY AND CONCLUSIONS
Summary
Accelerated CAT can offer many benefits to the clinicians and the patients. However, the
accuracy of orthodontic tooth movement with the shorter aligner-wear with MOPs needed to be
verified. In this retrospective study, the effect of MOP on the accuracy of tooth movement was
examined by comparing the actual treatment outcomes to the prediction models of 49
experimental samples (3-day aligner wear and MOPs) and 56 control samples (14-day aligner
wear without MOPs). Using CloudCompare software, the pre-treatment, post-treatment intraoral
scans, and prediction models were superimposed to each other, and the differences between the
predicted and the actual tooth position of the anterior teeth in both arches were measured. The
results indicated that the accuracy of orthodontic tooth movement was not significantly affected
by the shortened duration of the aligner wear if the treatment was combined with MOPs.
Although the correlation was not strong, and most of the differences were clinically insignificant,
MOPs seemed to be more effective in aligning anterior teeth in males, older patients, and
anterior spacing cases, compared to CAT with the 14-day aligner protocol. On the other hand,
the refinement treatment was more frequently considered for the experimental group, possibly
due to the higher complexity of the cases included in the experimental group than the control.
Thus, the current study suggests that the CAT 3-day aligner wear with MOPs may be a viable
option to accelerate OTM without negatively affecting the quality of the treatment outcome.

65
Conclusions
Based on the results of the study, following conclusions can be made:
The reduction of the duration of aligner wear from 14 days to 3 days with MOPs
did not negatively affect the accuracy of the linear and angular tooth movement in
clear aligner treatment.
o The types of orthodontic tooth movement were not significantly
influenced by the effect of MOP on the accuracy of tooth movement.
MOPs had a clinically insignificant effect on gender, age, and the severity of mal-
alignment.
There is a significant increase in the frequency of refinement treatment in the
CAT with MOPs probably due to a higher number of aligners and a greater
amount of anterior crowding seen in the experimental samples.
o Patients with more severe mal-alignment or longer treatment plan are
more likely to elect an auxiliary procedure to accelerate orthodontic tooth
movement.
o The complexity of the treatment mechanics may need to be considered
when determining the duration of the aligner wear despite the auxiliary
procedure to increase the rate of orthodontic tooth movement.

66
CHAPTER 7: RECOMMENDATIONS FOR FUTURE RESEARCH
Recommendations on Sample Collection
The current study can yield a more definitive conclusion if the samples included the CAT
with 3-day aligner wear without MOP and the CAT with 14-day aligner wear with MOP.
However, this was not possible in this retrospective study due to the ethical reasons and the
limitation of the available data. Moreover, Align Technology recently announced a change in the
protocol, promoting a 7-day aligner wear instead of 14. It may be worthwhile to investigate the
accuracy of tooth movement within 7 days and compare to the current data of the 3-day aligner
wear CAT combined with MOPs.
Recommendations on Methodology
Visual verification to align the post-treatment and the prediction scans with the pre-
treatment scans may introduce some variability in the interpretation of the direction and the
magnitude of tooth movement. For future research, the same samples can be analyzed using
software that can consistently superimpose the scans using a programmed algorithm to reduce
the variability in overlaying of the scans. Also, the chosen method with the CloudCompare
software introduces a fair amount of variability indicated by the reported standard deviations.
Software that is more sensitive with small measurements can be used instead to reduce the
variability in the angular and linear measurements of the tooth displacement.

67
REFERENCES
1. Long H, Pyakurel U, Wang Y, Lioa L, Zhou Y, Lai W. Interventions for accelerating
orthodontic tooth movement: A systematic review. Angle Orthod. 2013;83(1)164-71.
2. Segal GR, Schiffman PH, Tuncay OC. Meta analysis of the treatment-related factors of
external apical root resorption. Orthod Craniofacial Res 7, 2004;71-8.
3. Cruz DR, Kohara EK, Ribeiro MS, Wetter NU. Effects of low-intensity laser therapy on the
orthodontic movement velocity of human teeth: a preliminary study. Lasers Surg Med.
2004;35:117-20.
4. Fischer TJ. Orthodontic treatment acceleration with corticotomy-assisted exposure of palatally
impacted canines. Angle Orthod 2007;77:417-420.
5. Kim DH, Park YG, Kang SG. The effects of electrical current from a micro-electrical device
on tooth movement. Korean J Orthod. 2008;38:337-46.
6. Kim YS, Kim, SJ, Yoon HJ, Lee PJ, Moon W, Park YG. Effect of piezopuncture on tooth
movement and bone remodeling in dogs. Am J Orthod Dentofacial Orthop. 7, 2013;144(1):23-
31.
7. Alikhani M, Raptis M, Zoldan B, Sangsuwon C, Lee YB, Alyami B, Corpodian C, Barrera
LM, Alansari S, Khoo E, Teixeira C. Effect of micro-osteoperforations on the rate of tooth
movement. Am J Orthod Dentofacial Orthop. 11, 2013;144(5):639-48.
8. Huang H, Williams RC, Kyrkanides S. Accelerated orthodontic tooth movement: Molecular
mechanisms. Am J Orthod Dentofacial Orthop 2014;146:620-32.
9. Kharkar VR, Kotraschetti SM, Kulkarni P. Comparative evaluation of dento-alveolar
distraction and periodontal distraction assisted rapid retraction of the maxillary canine: A pilot
study. Int J Oral Maxillofac Surg. 2010;39:1074-9.
10. Shetty N, Patil AK, Ganeshkar SV, Hedge S. Comparison of the effects of ibuprofen and
acetaminophen on PGE2 levels in the GCF during orthodontic tooth movement: a human study.
Prog Orthod. 2013;14:6.
11. Bartzela T, Turp JC, Motschall E, Maltha JC. Medication effects on the rate of orthodontic
tooth movement: A systemic literature review. Am J Orthod Dentofacial Orthop. 2009;135:16-
26.
12. Toro EJ, Zuo J, Guiterrez A, La Rosa RL, Gawron AJ, Bradaschia-Correa V, Arana-Chavez
V, Dolce C, Rivera MF, Kesavalu L, Bhattacharyya I, Neubert JK, Holliday LS. Bis-enoxacin

68
inhibits bone resorption and orthodontic tooth movement. J Dent Res. 2013 Oct;92(10):925-31.
13. Richter AE, Arruda AO, Peters MC, Sohn W. Incidence of caries lesions among patients
treated with comprehensive orthodontics. Am J Orthod Dentofacial Orthop. 2011;139(5):657-64.
14. Brezniak N, Wasserstein A. Root resorption after orthodontic treatment: Part 1. Literature
review. Am J Orthod Dentofacial Orthop. 1993;103(1):62-6.
15. Royko A, Denes Z, Razouk G. The relationship between the length of orthodontic treatment
and patient compliance. Fogorv Sz. 1999;92:79-86.
16. Zachrisson S, Zachrisson BU. Gingival condition associated with orthodontic treatment.
Angle Orthod. 1972;42(1):26-34.
17. Cruz DR, Kohara EK, Ribeiro MS, Wetter NU. Effects of low-intensity laser therapy on the
orthodontic movement velocity of human teeth: a preliminary study. Lasers Surg Med.
2004;35:117–120.
18. Yamaguchi M, Hayashi M, Fujita S, et al. Low-energy laser irradiation facilitates the
velocity of tooth movement and the expressions of matrix metalloproteinase-9, cathepsin K, and
alpha(v) beta(3) integrin in rats. Eur J Orthod. 2010;32:131–139.
19. Hassan AH, Al-Fraidi AA, Al-Saeed SH. Corticotomy-assisted orthodontic treatment:
review. Open Dent J. 2010;4:159–164.
20. Aboul-Ela SM, El-Beialy AR, El-Sayed KM, Selim EM, El-Mangoury NH, Mostafa YA.
Miniscrew implant-supported maxillary canine retraction with and without corticotomy-
facilitated orthodontics. Am J Orthod Dentofacial Orthop. 2011;139:252–259.
21. Liou EJ, Huang CS. Rapid canine retraction through distraction of the periodontal ligament.
Am J Orthod Dentofacial Orthop. 1998;114:372–382.
22. Sayin S, Bengi AO, Gurton AU, Ortakoglu K. Rapid canine distalization using distraction of
the periodontal ligament: a preliminary clinical validation of the original technique. Angle
Orthod. 2004;74:304–315.
23. Iseri H, Kisnisci R, Bzizi N, Tuz H. Rapid canine retraction and orthodontic treatment with
dentoalveolar distraction osteogenesis. Am J Orthod Dentofacial Orthop. 2005;127: 533–541.
24. Shipley TS. The use of Propel to increase the rate of aligner progression. Orthod Practice US.
March 22, 2014. http://orthopracticeus.com/magazine-articles/columns/the-use-of-propel-to-
increase-the-rate-of-aligner-progression.
25. Frost HM. The regional acceleratory phenomenon: a review. Henry Ford Hops Med J. 1983;
31(1):3-9.

69
26. Buschang PH, Ross M, Shaw SG, Crosby D, Campbell PM. Predicted and actual end-of-
treatment occlusion produced with aligner therapy. Angle Orthod. 2015; 85(5): 723-727.
27. Chisari JR, McGorray SP, Nair M, Wheeler TT. Variables affecting orthodontic tooth
movement with clear aligners. Am J Orthod Dentofacial Orthop. 2014; 145(4): 82-91.
28. Kravitz ND, Kusnoto B, BeGole E, Obrez A, Agran B. How well does Invisalign work? A
prospective clinical study evaluating the efficacy of tooth movement with Invisalign. Am J
Orthod Dentofacial Orthop. 2009; 135(1): 27-35.
29. Nishijima Y, Yamaguchi M, Kojima T, Aihara N, Nakajima R, Kasai K. levels of RANKL
and OPG in gingival crevicular fluid during orthodontic tooth movement and effect of
compression force on releases from periodontal ligament cells in vitro. Orthod Craniofac Res.
2006; 9:63-70.
30. Toygar HU, Kircelli BH, Bulut S, Sezgin N, Tasdelen B. Osteoprotegerin in gingival
crevicular fluid under long-term continuous orthodontic force application. Angle Orthod. 2008;
78:988-993.
31. Kanzaki H, Chiba M, Shimizu Y, Mitani H. Periodontal ligament cells under mechanical
stress induce osteoclasogenesis by receptor activator of nuclear factor kappaB ligand up-
regulation via prostaglandin E2 synthesis. J Bone Miner Res. 2002; 17:210-220.
32. Janssens K, ten Dijke P, Janssens S, Van Hul W. Transforming growth factor-beta 1 to the
bone. Endocr Rev. 2005; 26:743-774.
33. Uematsu S, Mogi M, Edguchi T. Increase of transforming growth factor-beta 1 in gingival
crevicular fluid during human orthodontic tooth movement. Arch Oral Biol. 1996; 41: 1091-
1095.
34. Wang LL, Zhu H, Liang T. Changes of transforming rowth factor beta 1 in rat periodontal
tissue during orthodontic tooth movement. Chin J Dent Res. 2000; 3:19-22.
35. Street J, Lenehan B. Vascular endothelial growth factor regulates osteoblast survival –
evidence for an autocrine feedback mechanism. J Orthop Surg Res. 2009; 4:19.
36. Krishnan V, Davidovitch Z. Cellular, molecular, and tissue-level reactions to orthodontic
force. 2006; 129: 469e.1-460e.32).
37. Bassett CAL. Biologic significance of piezoelectricity. Tissue Res. 1968; 1:252-272.
38. Yasuda I, Nogucki K, Sata T. Dyanamic calluls and electrical callus. J Bone joint Surg. 1955;
37A: 1291-1293.
39. Grimm FM. Bone bending, a feature of orthodontic tooth movement. Am J Orthod. 1972; 62:

70
384-393.
40. Levy DD. A pulsed electrical stimulation technique for inducing bone growth. Ann NY Acad
Sci. 1974; 238:478-490.
41. Friedenberg ZB, Andrews ET, Smolensky BQ, Pearl BW, Brighton CT. Bone reaction to
varying amounts of direct current. Surg Gynecol Obstet. 1970; 131:894-899.
42. Shapiro E, Roeber FW, Klempner LS. Orthodontic movement using pulsating force-induced
piezoelectricity. Am J Orthod. 1979; 76:59-66.
43. Fukada E, Yasuda I. On the piezoelectric effect of bone. J Physiol Soc Jpn. 1957; 12:1158-
1162.
44. Proffit WR. The biologic basis of orthodontic therapy. In: Proffit WR, Fields HW, Sarver
DM, editors. Contemporary Orthodontics. 5th
ed. St. Louis: Mosby; 2013.
45. Lee W. Experimental study of the effect of prostaglandin administration on tooth movement
with particular emphasis on the relationship to the method of PGE1 administration. Am J Orthod
Dentofacial Orthop. 1990; 98:238-241.
46. Leiker BJ, Nanda RS, Currier GF, Howes RI, Sinha PK. The effects of exogenous
prostaglandins on orthodontic tooth movement in rats. Am J Orthod Dentofacial Orthop. 1995;
108:380-388.
47. Krishnan V, Davidovitch Z. Cellular, molecular, and tissue-level reactions to orthodontic
force. Am J Orthod Dentofacial Orthop. 2006; 129:469e.1-460e.32.
48. Verna C. Regional acceleratory phenomenon. Front Oral Biol. 2016; 18:28-35.
49. King GJ, Keeling SD, Wronski TJ. Histomorphometric study of alveolar bone turnover in
orthodontic tooth movement. Bone. 1991; 12:401-409.
50. Melsen B. Bioligcal reaction of alveolar bone to orthodontic tooth movement. Angle Orthod.
1999; 69:151-158.
51. Verna C. Zaffe D, Siciliani G. Histomorphometric study of bone reactions during orthodontic
tooth movement in rats. Bone. 1999;24:371-379.
52. Frost HM. Wolff’s law and bone’s structural adaptations to mechanical usage: an overview
for clinicians. Angle Orthod. 1994; 64:175-188.
53. Hoogeveen EJ, Jansma J, Ren Y. Surgically facilitated orthodontic treatment: a systematic
review. Am J Orthod Dentofacial Orthop. 2014; 145:51-64.

71
54. Gkantidis N, Mistakidis I, Kouskoura T, Pandis N. Effectiveness of non-conventional
methods for accelerated orthodontic tooth movement: a systematic review and meta-analysis. J
Dent. 2014; 42(10): 1300-1319.
55. Teixeira CC, Khoo E, Tran J, Chartres I, Liu Y, Thant LM, Khabensky I, Gart LP, Cisneros
G, Alikhani M. Cytokine expression and accelerated tooth movement. J Dent Res. 2010;
89:1135-1141.
56. Clements KM, Bollen AM, Huang G, King G, Hujoel P, Ma T. Activation time and material
stiffness of sequential removable orthodontic appliances. Part 2: Dental improvements. Am J
Orthod Dentofacial Orthop. 2003; 124:502-508.
57. Wong BH. Invisalign A to Z. Am J Orthod Dentofacial Orthop. 2002; 121:540-541.
58. Dasy H, Dasy A, Asatrian G, Rozsa N, Lee HF, Kwak JH. Effects of variable attachment
shapes and aligner material on aligner retention. Angle Orthod. 2015; 85:934-940.
59. Simon M, Keilig L, Schwarze J, Jung BA, Bourauel C. Forces and moments generated by
removable thermoplastic aligners: Incisor torque, premolar derotation, and molar distalization.
Am J Orthod Dentofacial Orthop. 2014; 145:728-736.
60. Ercoli F, Tepedino M, Parziale V, Luzi C. A comparative study of two different clear aligner
systems. Progress in Orthodontics. 2014; 15:31.
61. Drake CT, McGorray SP, Dolce C, Nair M, Wheeler TT. Orthodontic tooth movement with
clear aligners. ISRN Dentistry. 2012; 657973.
62. Rossini G, Parrini S, Castroflorio T, Deregibus A, Debernardi CL. Efficacy of clear aligners
in controlling orthodontic tooth movement: A systematic review. Angle Orthod. 2015; 85:881-
889.
63. Krieger E, Seiferth J, Saric I, Jung BA, Wehrbein H. Accuracy of Invisalign treatments in the
anterior tooth region: First results. J Orthof Orthop. 2011; 72:141-149.
64. Krieger E, Seiferth J, Marinello I, Jung BA, Wriedt S, Jacobs C, Wehrbein H. Invisalign
treatment in the anterior region: Were the predicted tooth movements achieved? J Orofac Orthop.
2012; 73:365-376.
65. Cha BK, Lee JY, Jost-Brinkmann PG, Yoshida N. Anaylsis of tooth movement in extraction
cases using three-dimensional reverse engineering technology. Eur J Orthod. 2007; 29:325-331.
66. Lee SJ, Jang SY, Chun YS, Lim WH. Three-dimensional analysis of tooth movement after
intrusion of a supraerupted molar using a mini-implant with partial-fixed orthodontic appliances.
Angle Orthod. 2013; 83:274-279.

72
67. Chen J, Li S, Fang S. Quantification of tooth displacement from cone-beam computed
tomography images. Am J Orthod Dentofacial Orthop. 2009; 136:393-400.
68. Hayashi K, Araki Y, Uechi J, Ohno H, Mizoguchi I. A novel method for the three-
dimensional (3-D) analysis of orthodontic tooth movement – calculation of rotation about and
translation along the finite helical axis. J Biomech. 2002; 35:45-51.
69. Jang I, Tanaka M, Koga Y, Iigima S, Yozgatian JH, Cha BK, Yoshida N. A novel method for
the assessment of three-dimensional tooth movement during orthodontic treatment. Angle Ortho.
2009; 79:447-453.
70. Hayashi K, Uechi J, Lee SP, Mizoguchi I. Three-dimensional analysis of orthodontic tooth
movement based on XYZ and finite helical axis systems. Eur J Orthod. 2007; 29:589-595.
71. CloudCompare. http://www.danielgm.net/cc/.
72. Manuel CT, Harb R, Badran A, Ho D, Wong BJF. Finite element model and validation of
nasal tip deformation. Ann Biomed Eng. 2016. DOI: 10.1007/s10439-016-1729-9.
73. Beaini TL, Duailibi-Neto EF, Chilvarquer I, Melani RFH. Human idenfitication through
frontal sinus 3D superimposition: Pilot study with cone beam computer tomography. J Forensic
Leg Med. 2015; 36: 63-69.
74. Kitaura, H, Kimura K, Ishida M, Takano-Yamamoto T. Effect of cytokines on osteoclast
formation and bone resorption during mechanical force loading of the periodontal membrane.
Scientific World J. 2014(5):617032.
75. PROPEL Orthodontics. http://propelorthodontics.com
76. Ren Y, Maltha JC, Van’t Hof MA, Kuijpers-Jagtman AM. Age effect on orthodontic tooth
movement in rats. J Dent Res. 2003;82(1):38-42.

73
APPENDICES
Appendix A – IRB Exemption

74

75
Appendix B – Letter of Permission to Conduct Research

76
Appendix C – HIPAA Data Use Agreement for Limited Data Sets

77

78

79
Appendix D – HIPAA Waiver of Research Authorization Form

80

81
Appendix E – Raw Data & Statistical Analyses
Raw Data
Control
#6 #7
ΔV Δx° Δy° Δz° ΔV Δx° Δy° Δz°
2.049096 1.756936 0.361499 0.95196 2.157742 1.308557 0.746785 0.838368
1.450983 0.522909 6.478438 1.452057 0.984109 0.522497 0.555256 1.344574
4.787782 1.048626 0.105975 0.567682 1.649083 0.289595 1.238961 0.743022
1.995202 0.683417 0.027499 0.319329 3.443079 2.806072 3.323187 2.279155
4.350422 1.431219 1.128356 1.756287 3.613649 0.213732 0.294004 1.08581
3.229938 3.970314 0.829701 0.000744 2.053435 0.622711 0.696667 0.504289
2.634639 3.08932 4.637364 0.63511 3.461342 0.757185 12.88682 2.161923
0.848152 0.32796 0.098684 0.693938 2.750289 0.869971 1.124417 8.769427
0.792549 1.055538 0.140161 0.21998 6.895034 18.88837 2.941783 1.781111
2.196869 1.910957 4.571517 0.132927 0.807661 1.306757 1.301276 0.647371
1.149922 0.410011 0.369812 0.313097 5.638871 0.344924 45.35777 1.042123
4.276363 1.555788 0.790307 0.729122 0.485087 1.020621 1.125705 0.584998
1.85771 0.134062 0.708969 0.126644 1.643593 4.744837 1.415143 1.044166
3.066178 3.467783 0.935138 0.462539 2.832669 3.290714 0.466849 0.10771
2.231194 0.622546 3.157655 0.137701 1.859488 0.228888 0.911062 0.84801
2.013071 0.759917 0.149292 0.490558 1.108284 0.516254 0.222115 0.099836
2.656224 0.897132 0.971092 0.548337 3.355949 0.848009 0.498775 0.624137
3.878567 0.70423 0.253998 0.31601 2.431444 0.909437 0.457205 1.597374
1.832655 4.476667 1.097565 0.964344 3.409833 0.683413 2.022379 0.798754
2.835404 3.25411 1.036119 1.677988 2.235568 1.840137 0.077498 0.401145
5.402112 0.863831 0.654403 0.89572 3.291214 0.165361 0.971827 0.92704
4.139003 1.245245 0.894382 1.128684 6.318498 0.795082 0.957237 3.57483 3.802987 0.706163 0.103104 0.757253
2.508384 0.877889 0.665125 0.536873 1.890797 1.570985 1.030102 0.166313
7.434493 1.449887 0.459638 0.685259 3.085863 0.323328 2.682984 0.258727
3.17788 1.288952 1.391584 1.227952 2.859587 1.172098 0.879213 0.016334
5.087044 0.694415 0.873556 0.701217 4.725453 0.948556 0.609116 0.379559
2.122073 0.607006 0.005785 0.49614 3.130209 0.307433 1.861487 0.178138
1.169507 0.408329 0.417527 0.242675 1.419468 2.599519 0.698153 2.206525
1.361124 5.555127 0.267269 0.054589 1.841306 1.170989 1.302916 0.25701

82
6.956593 1.073728 1.301938 0.960405 3.884771 0.109468 0.699686 1.351152
0.892341 15.75109 7.22571 1.117234 5.993379 0.961363 0.517234 0.905058
0.398883 0.08433 0.12424 3.036422 2.392079 3.379229 0.655337 0.282435
1.799886 0.787782 0.813904 0.154629 4.219237 0.488566 4.805526 0.909718
1.174583 0.338093 0.317347 0.271742 1.884892 0.841597 0.220273 0.582115
1.451107 6.17037 0.456701 0.511062 2.313279 1.060909 2.921241 0.734761
2.185136 0.959223 13.50475 1.519192 2.695793 0.49241 1.769523 0.182766
1.953102 0.636674 1.225381 0.53216 1.266603 19.41111 0.77895 0.453795
0.238051 0.023128 0.203292 0.017418 2.816849 0.540312 3.712196 0.443385
0.835677 0.304113 1.216899 0.051817 1.036909 1.800932 0.382119 0.538635
3.227008 0.038127 5.227369 0.032402 3.879173 0.605109 0.599348 0.30864
2.438809 1.764116 2.180872 0.329563 1.139859 0.707028 3.791008 0.030393
0.726818 0.058216 0.424921 0.070538 1.236344 1.122928 0.080911 0.507456
1.144021 0.060384 0.170725 0.549354 0.791855 5.172108 0.67968 0.200898
5.027946 1.730685 0.000985 0.432678 0.604556 0.76073 0.074163 0.303108
3.252003 1.939435 0.188305 0.390999 4.198485 5.290341 0.374309 1.491154
1.525424 0.663366 0.147982 7.569257 3.827691 1.123312 1.87105 0.871284
1.105356 0.434966 0.312023 0.351875 1.353727 2.000001 0.379374 0.492253
5.351674 1.458417 0.851144 0.702504 7.102558 1.252337 1.436688 0.765057
1.308666 2.650987 0.368135 0.324306 1.945197 0.29058 0.179877 1.242205
3.993698 1.200638 0.518764 0.790432 2.283317 3.09739 0.057062 0.256517
5.055615 0.808658 0.528155 0.516139 2.684846 0.701959 0.577675 0.675672
3.23397 1.776669 0.144205 1.600453 3.72544 1.285709 0.260507 1.423666
1.651448 0.936455 0.039278 0.268757 1.519953 1.255024 0.05168 0.714964
4.995333 2.992391 0.770358 0.864086 5.309003 0.964055 1.092193 0.809208
4.260628 0.715337 0.261075 0.915531 2.231164 1.212439 0.639663 0.262206
0.995346 0.838317 1.367059 0.075151 4.044867 2.673072 0.069006 0.51679
1.96966 0.828557 0.382012 4.89519 2.484561 0.778082 1.706562 1.736717
#8 #9
ΔV Δx° Δy° Δz° ΔV Δx° Δy° Δz°
3.176327 0.958168 0.250471 0.576432 1.512504 0.604136 0.015443 0.547967
1.305187 0.431741 0.57813 1.279594 1.877008 0.647929 1.546015 0.366142
2.212921 0.572228 0.152411 0.266893 2.583212 0.53747 14.1954 0.387381
4.442844 4.102828 3.208358 1.165359 3.621599 5.912757 1.429554 0.938246 2.113509 0.299153 0.761315 0.639706
1.908621 0.55146 0.796165 0.533889 0.606196 0.33557 3.134427 0.436299
1.755153 1.135631 0.873687 0.622658 0.80816 0.257713 0.372745 0.567152
1.738121 0.149143 0.165229 0.066416 0.295737 0.02023 0.378919 0.237735

83
2.264655 1.705407 0.100416 0.083584 1.671891 7.009276 1.342678 0.259443
3.487544 0.897582 0.46461 0.21688 1.614183 0.700633 1.23029 0.021433
1.860892 0.531606 0.281657 0.597157 1.158176 0.260216 0.047302 0.600517
6.656135 1.072366 3.764577 1.764289 0.960636 0.701003 0.503791 0.264248
4.085121 0.577857 0.117984 0.513543 3.366035 0.370815 3.489283 0.079693
3.371851 8.182992 67.89788 0.180664 2.44964 2.910898 0.433312 0.694509
1.976607 0.362792 0.35366 0.447667 1.306504 5.917286 0.403439 0.112118
0.904338 1.921207 0.843456 0.894441 0.933617 1.272457 0.325986 0.703443
4.731262 0.824131 1.682673 0.851715 4.605541 1.039491 7.070233 0.696423
2.7918 0.951876 0.61265 0.356331 2.260685 1.152204 0.227464 0.150265
2.431921 0.917435 2.518127 0.740656 5.621168 1.059753 0.088818 0.67305
4.373783 1.671799 0.418452 0.850815 2.624205 0.072078 0.259622 0.54816
5.884442 1.28741 1.054629 1.031032 4.401738 1.068821 0.964593 0.836198
3.018697 4.216881 88.751 0.456612 0.780458 1.061968 0.414488 0.269369
4.079722 1.26125 1.427428 0.141958 6.254056 0.626809 1.771635 0.74201
1.110082 0.803992 0.555208 2.657018 1.611656 0.487656 1.068724 0.251859
1.810934 0.67296 0.775775 0.542337 2.295654 0.681716 0.505103 0.164204
4.575906 1.546591 4.470209 0.76717 4.788557 1.574662 1.087814 1.196117
6.666044 0.752109 1.28321 0.667376 6.252091 0.666081 0.494626 0.569634
3.13866 0.109865 0.325918 0.465094 1.49275 1.56839 0.303753 0.122247
0.784177 1.21048 1.565289 0.00455 2.925767 0.857919 0.926558 0.645968
0.707862 0.422778 0.13816 0.049935 0.354443 1.140329 0.132109 0.093917
1.007579 0.292793 0.597429 0.440738 2.198321 0.756023 1.128525 0.696273
4.865653 1.151459 10.62832 0.609349 2.781141 0.38948 0.893726 1.211256
1.373573 2.255116 0.302793 0.541224 3.052933 2.979635 0.322019 0.478919
1.657724 0.345523 0.085929 0.405463 0.21655 0.264167 0.629437 0.301333
2.130485 1.406561 0.191465 0.393846 3.567011 0.747736 1.700017 0.433459
1.928364 0.189879 1.44729 0.458678 3.638153 0.591788 0.863125 0.027147
1.740327 0.462547 0.423095 0.339643 2.262905 0.398914 0.077553 0.302477
1.604886 0.043704 0.606585 0.219942 1.415318 1.640452 0.44065 0.693512
1.226885 3.854508 0.438891 0.282068 1.324233 5.047631 2.470605 0.928035
1.059061 2.83271 0.205538 0.352402 1.024685 1.032875 0.50998 0.130946
1.91248 3.971234 0.057754 0.19254 10.22508 0.790082 1.691912 6.543904
1.287371 1.006736 0.020528 1.103198
0.445281 0.190624 12.32951 0.809921 0.74625 3.076362 1.762994 0.455384
1.213191 0.638173 0.514939 1.11644 1.397072 0.508355 0.736637 0.608841
1.809755 0.783394 0.058089 0.138652 2.977828 1.037991 0.784903 0.129108
5.990985 0.569689 0.434788 0.993756 3.187755
1.473066 0.294199
2.765559 0.37923 0.103394 0.876413 3.851511 0.533849 0.744382 2.724953
3.163707 6.125282 0.130223 0.237585 4.27922 3.770413 0.423463 0.383247
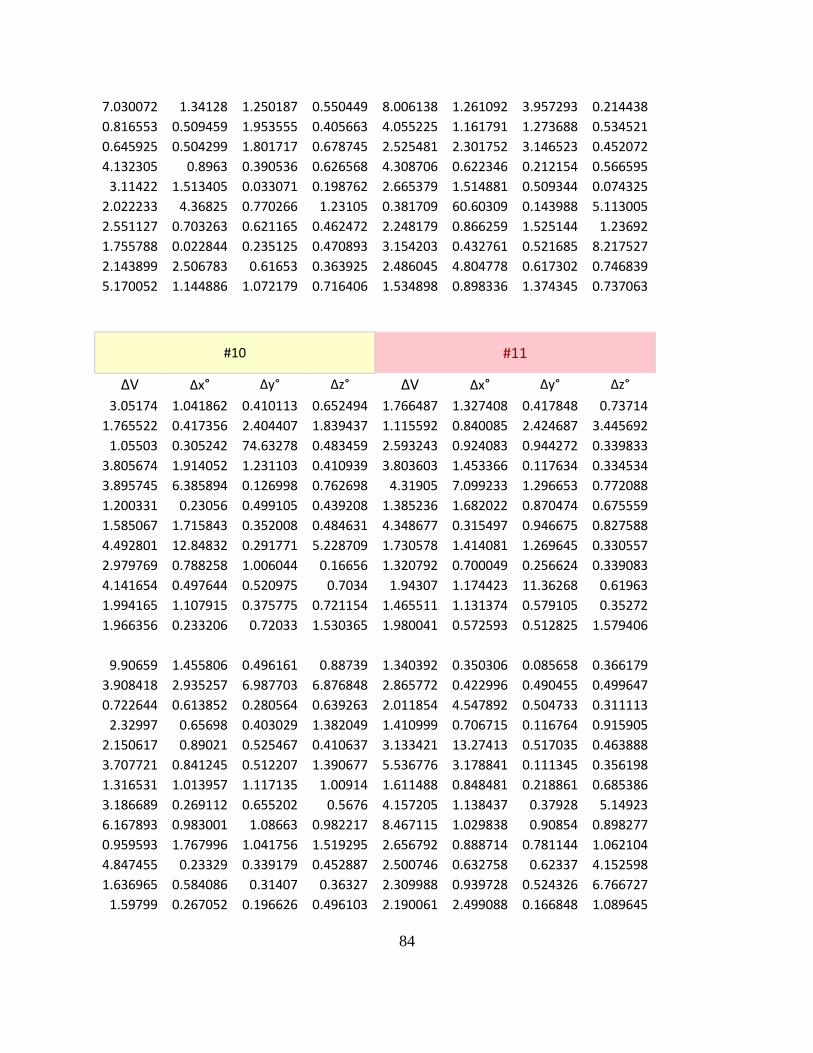
84
7.030072 1.34128 1.250187 0.550449 8.006138 1.261092 3.957293 0.214438
0.816553 0.509459 1.953555 0.405663 4.055225 1.161791 1.273688 0.534521
0.645925 0.504299 1.801717 0.678745 2.525481 2.301752 3.146523 0.452072
4.132305 0.8963 0.390536 0.626568 4.308706 0.622346 0.212154 0.566595
3.11422 1.513405 0.033071 0.198762 2.665379 1.514881 0.509344 0.074325
2.022233 4.36825 0.770266 1.23105 0.381709 60.60309 0.143988 5.113005
2.551127 0.703263 0.621165 0.462472 2.248179 0.866259 1.525144 1.23692
1.755788 0.022844 0.235125 0.470893 3.154203 0.432761 0.521685 8.217527
2.143899 2.506783 0.61653 0.363925 2.486045 4.804778 0.617302 0.746839
5.170052 1.144886 1.072179 0.716406 1.534898 0.898336 1.374345 0.737063
#10 #11
ΔV Δx° Δy° Δz° ΔV Δx° Δy° Δz°
3.05174 1.041862 0.410113 0.652494 1.766487 1.327408 0.417848 0.73714
1.765522 0.417356 2.404407 1.839437 1.115592 0.840085 2.424687 3.445692
1.05503 0.305242 74.63278 0.483459 2.593243 0.924083 0.944272 0.339833
3.805674 1.914052 1.231103 0.410939 3.803603 1.453366 0.117634 0.334534
3.895745 6.385894 0.126998 0.762698 4.31905 7.099233 1.296653 0.772088
1.200331 0.23056 0.499105 0.439208 1.385236 1.682022 0.870474 0.675559
1.585067 1.715843 0.352008 0.484631 4.348677 0.315497 0.946675 0.827588
4.492801 12.84832 0.291771 5.228709 1.730578 1.414081 1.269645 0.330557
2.979769 0.788258 1.006044 0.16656 1.320792 0.700049 0.256624 0.339083
4.141654 0.497644 0.520975 0.7034 1.94307 1.174423 11.36268 0.61963
1.994165 1.107915 0.375775 0.721154 1.465511 1.131374 0.579105 0.35272
1.966356 0.233206 0.72033 1.530365 1.980041 0.572593 0.512825 1.579406
9.90659 1.455806 0.496161 0.88739 1.340392 0.350306 0.085658 0.366179
3.908418 2.935257 6.987703 6.876848 2.865772 0.422996 0.490455 0.499647
0.722644 0.613852 0.280564 0.639263 2.011854 4.547892 0.504733 0.311113
2.32997 0.65698 0.403029 1.382049 1.410999 0.706715 0.116764 0.915905
2.150617 0.89021 0.525467 0.410637 3.133421 13.27413 0.517035 0.463888
3.707721 0.841245 0.512207 1.390677 5.536776 3.178841 0.111345 0.356198
1.316531 1.013957 1.117135 1.00914 1.611488 0.848481 0.218861 0.685386
3.186689 0.269112 0.655202 0.5676 4.157205 1.138437 0.37928 5.14923
6.167893 0.983001 1.08663 0.982217 8.467115 1.029838 0.90854 0.898277
0.959593 1.767996 1.041756 1.519295 2.656792 0.888714 0.781144 1.062104
4.847455 0.23329 0.339179 0.452887 2.500746 0.632758 0.62337 4.152598
1.636965 0.584086 0.31407 0.36327 2.309988 0.939728 0.524326 6.766727
1.59799 0.267052 0.196626 0.496103 2.190061 2.499088 0.166848 1.089645
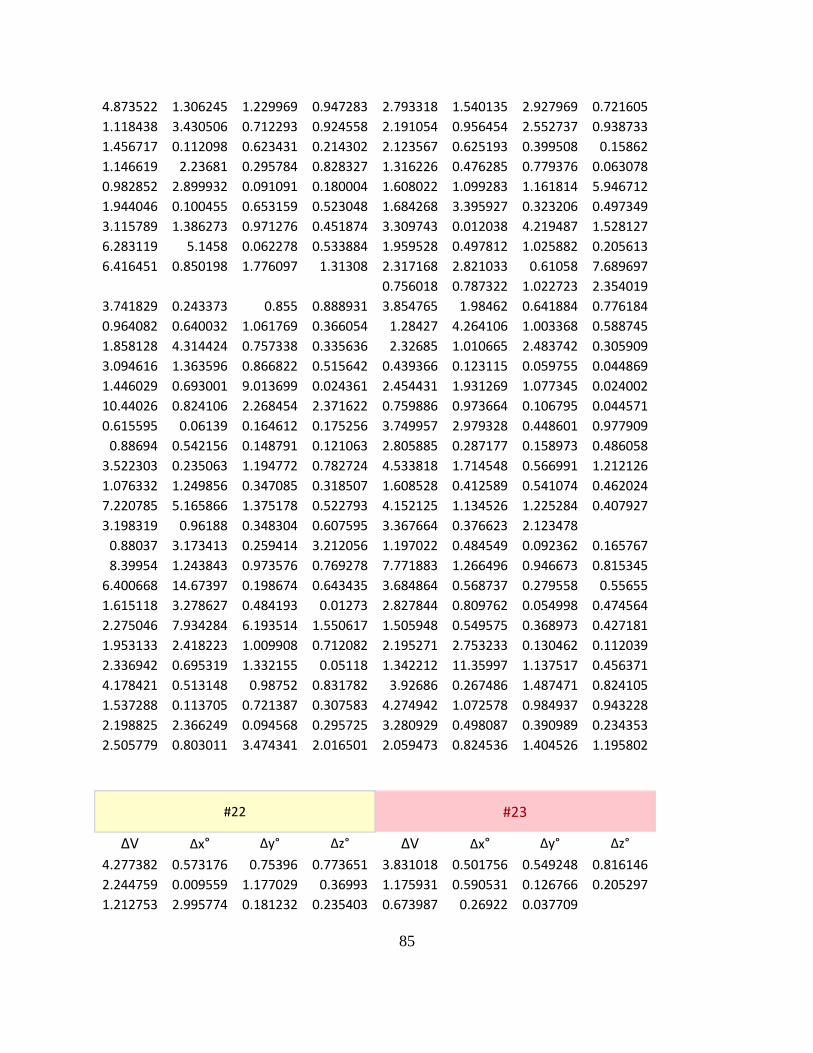
85
4.873522 1.306245 1.229969 0.947283 2.793318 1.540135 2.927969 0.721605
1.118438 3.430506 0.712293 0.924558 2.191054 0.956454 2.552737 0.938733
1.456717 0.112098 0.623431 0.214302 2.123567 0.625193 0.399508 0.15862
1.146619 2.23681 0.295784 0.828327 1.316226 0.476285 0.779376 0.063078
0.982852 2.899932 0.091091 0.180004 1.608022 1.099283 1.161814 5.946712
1.944046 0.100455 0.653159 0.523048 1.684268 3.395927 0.323206 0.497349
3.115789 1.386273 0.971276 0.451874 3.309743 0.012038 4.219487 1.528127
6.283119 5.1458 0.062278 0.533884 1.959528 0.497812 1.025882 0.205613
6.416451 0.850198 1.776097 1.31308 2.317168 2.821033 0.61058 7.689697
0.756018 0.787322 1.022723 2.354019
3.741829 0.243373 0.855 0.888931 3.854765 1.98462 0.641884 0.776184
0.964082 0.640032 1.061769 0.366054 1.28427 4.264106 1.003368 0.588745
1.858128 4.314424 0.757338 0.335636 2.32685 1.010665 2.483742 0.305909
3.094616 1.363596 0.866822 0.515642 0.439366 0.123115 0.059755 0.044869
1.446029 0.693001 9.013699 0.024361 2.454431 1.931269 1.077345 0.024002
10.44026 0.824106 2.268454 2.371622 0.759886 0.973664 0.106795 0.044571
0.615595 0.06139 0.164612 0.175256 3.749957 2.979328 0.448601 0.977909
0.88694 0.542156 0.148791 0.121063 2.805885 0.287177 0.158973 0.486058
3.522303 0.235063 1.194772 0.782724 4.533818 1.714548 0.566991 1.212126
1.076332 1.249856 0.347085 0.318507 1.608528 0.412589 0.541074 0.462024
7.220785 5.165866 1.375178 0.522793 4.152125 1.134526 1.225284 0.407927
3.198319 0.96188 0.348304 0.607595 3.367664 0.376623 2.123478 0.88037 3.173413 0.259414 3.212056 1.197022 0.484549 0.092362 0.165767
8.39954 1.243843 0.973576 0.769278 7.771883 1.266496 0.946673 0.815345
6.400668 14.67397 0.198674 0.643435 3.684864 0.568737 0.279558 0.55655
1.615118 3.278627 0.484193 0.01273 2.827844 0.809762 0.054998 0.474564
2.275046 7.934284 6.193514 1.550617 1.505948 0.549575 0.368973 0.427181
1.953133 2.418223 1.009908 0.712082 2.195271 2.753233 0.130462 0.112039
2.336942 0.695319 1.332155 0.05118 1.342212 11.35997 1.137517 0.456371
4.178421 0.513148 0.98752 0.831782 3.92686 0.267486 1.487471 0.824105
1.537288 0.113705 0.721387 0.307583 4.274942 1.072578 0.984937 0.943228
2.198825 2.366249 0.094568 0.295725 3.280929 0.498087 0.390989 0.234353
2.505779 0.803011 3.474341 2.016501 2.059473 0.824536 1.404526 1.195802
#22 #23
ΔV Δx° Δy° Δz° ΔV Δx° Δy° Δz°
4.277382 0.573176 0.75396 0.773651 3.831018 0.501756 0.549248 0.816146
2.244759 0.009559 1.177029 0.36993 1.175931 0.590531 0.126766 0.205297
1.212753 2.995774 0.181232 0.235403 0.673987 0.26922 0.037709

86
2.10792 1.628796 0.246032 0.723065 4.709107 6.029316 0.018494 0.711408
1.929198 0.032336 1.600129 1.745574 2.103595 0.126091 1.468276 3.98645
3.423802 0.770482 0.288713 0.599611 0.9747 0.690836 1.52778 2.070132
2.135499 0.049883 0.209838 0.123401 1.287509 0.354413 0.481554 0.210604
1.219622 0.231655 0.023025 0.057977 1.509286 0.104883 0.022029 0.349939
4.972066 0.908429 1.46841 0.902634 1.061378 0.189612 0.197915 0.313371
1.672548 0.064681 0.194898 0.566906 0.59747 0.304728 0.257924 0.072322
1.349719 1.541451 0.371773 0.190985 1.282245 0.020443 1.032468 0.317656
2.285699 0.671175 1.142218 4.73341 1.39241 1.430828 4.254594 0.054928
9.414432 0.902685 0.886433 0.930952 4.040211 0.117269 0.938359 0.892563
6.772857 1.329101 3.181945 2.103355 2.490634 0.618435 0.276296 0.231095
2.329484 3.837496 0.393798 0.662225 4.326506 5.753761 0.005169 0.961013
3.272508 0.097103 2.230483 1.317836 0.570606 0.34124 0.29739 0.16334
2.144448 0.094265 0.814968 0.239329 1.73994 2.199728 0.065225 0.283293
2.085408 1.227425 0.073787 0.8836 2.382343 2.116708 0.71878 0.609911
3.48446
0.178505 0.376565 2.729658 0.543934
0.725668
1.444512 0.509948 0.664451 0.615151 1.57789 0.176881 0.88598 0.312866
8.317364 0.293995 0.195947 1.036028 1.744158 0.559224 1.247559 0.536419
9.3956 1.027477 1.062883 1.014869 1.588606 0.782115 0.962116 0.739704
3.035513 0.473341 0.288774 1.278553 2.209023 1.005671 9.221143 0.37791
3.756295 1.077642 0.911864 0.522484 2.133527 0.448699 0.005583 0.708916
1.518788 0.62379 0.712766 0.385213 1.456242 0.614348 0.093478 0.416818
8.123335 0.86883 0.479472 0.664048 4.432894 0.968493 0.869179 1.201524
1.813645 1.044163 0.86655 60.99432 2.133783 1.280472 0.570235 0.15466
2.850949 0.485188 0.822302 0.616728 8.717498 0.932947 1.176661 1.345002
3.745524 0.407162 9.451492 0.284914 4.227414 0.626976 6.327158 0.0092
1.183695 0.075401 0.371846 0.133393 1.192272 0.5899 0.400392 0.335904
1.509219 0.401356 4.683483 0.278823 0.730275 0.505402 0.363834 1.992941
1.728081 0.693545
0.422581 0.951551 0.833788 0.414783 1.323996
1.51591 0.489565 3.252169 0.268653 1.423014 0.251971 2.848548 0.013606
0.551689 0.987774 35.54303 0.790601 0.361885 0.907765 1.027155 0.450768
4.066163 0.731295 0.016217 0.560336 3.134329 0.872178 0.952607 0.305473
1.329034 0.551239 0.784332 1.293041 1.324446 0.567718 1.80948 14.78597
2.084819 0.749661 0.322215 1.038886 2.682459 0.118735 0.387078 0.486387
4.857747 0.773741 28.62826 0.359051 1.519981 0.252133 1.024081 0.17615
1.019582 1.914925 1.33256 0.652575 1.490313 0.130289 0.78549 0.711673
1.683922 19.01066 0.279624 0.331881 1.648571 0.71222
0.26649
1.048179 0.511817 0.777556 0.710843 1.931708 1.049753 0.595846 0.019887
8.187405 1.145494 0.548696 0.509051 2.791627 0.138614 0.887566 0.474971
1.8284 1.598639 7.60768 0.272463 0.275837 0.282475 1.330093 0.125344
2.410744 0.317806 11.86448 1.427367 0.878012 0.785458 0.622156 0.869828

87
0.572893 1.420977 3.712045 0.66996 0.437828 0.007048 0.643361 0.16826
1.579386 2.526552 0.331834 0.147982 2.38338 0.219181 0.613345 0.155539
1.293701 1.025195 1.387448 1.457942 2.689509 0.928387 0.820225 0.154091
0.49336 2.824074 0.274579 0.332238 3.029174 0.868872 0.439488 1.554432
1.274417 0.848843 0.055747 0.345911 1.94452 0.735915 0.138597 1.374255
2.510305 0.966338 6.488917 0.741782 3.036865 0.846624 1.389782 1.079546
6.443606 1.09089 1.293076 0.514893 2.061023 0.469045 0.576043 0.540174
3.019185 0.589338 1.511922 0.118995 2.777954 0.481701 1.255182 1.122317
4.89333 0.757478 0.802221 1.05262 3.68371 0.218875 0.152828 0.497436
1.024809 0.316805 3.532924 0.559185 1.298217 0.974293 0.458338 0.941007
1.486295 0.382404 0.009156 0.190072 2.176284 0.681358 0.173965 2.708501
10.31727 0.927767 0.932421 0.889993 2.344529 0.395351 0.983451 1.012604
4.742654 1.155231 0.752558 0.794426 11.55601 0.875286 0.804753 0.975643
4.279638 1.215506 0.039708 0.293882 1.764325 14.74713 3.675996 0.01078
0.808377 3.20539 15.89919 0.378832 0.783294 1.131882 0.416934 0.615694
#24 #25
ΔV Δx° Δy° Δz° ΔV Δx° Δy° Δz°
2.182289 0.534194 0.565229 0.643319 2.363731 0.65732 0.390523 0.695286
1.839466 0.333515 1.618665 0.814677 0.174057 1.043546 0.582195 1.079708
2.649999 0.216418 0.127296 0.289539 3.469605 0.106091 0.324381 0.278019
3.322474
0.062679 1.658812 2.558796 3.032146 0.701867 0.922988
5.154721 0.677292 0.718231 1.420333 4.799354 3.994433 0.185578 0.671533
1.105221 0.714644 1.329004 0.258008 2.229282 0.648246 0.782451 1.249813
1.786195 0.577789 0.948887 2.263531 2.508286 3.340459 0.113168 0.251688
3.625191 0.503568 0.295409 0.346724 0.914261 0.448368 0.932854 0.067988
4.381914 0.25238 7.234854 0.827463 2.297521 0.050361 1.146608 0.416677
2.594228 0.459418 0.034668 0.33599 1.980994 1.216891 0.237498 0.828877
1.070174 0.377444 0.107575 0.298591 0.80289 0.918072 1.059249 1.166281
0.379378 0.629928 1.403124 0.783309 3.699927 1.374947 0.957043 1.181787
3.303928 0.871012 0.939499 0.99757 1.238602 7.125203 0.553253 0.733851
1.921428 0.552408 0.192082 0.807011 2.044783 0.268669 0.030185 0.967294
4.390566 31.35324 0.144515 0.029801 4.637821 37.87329 0.622449 0.179297
1.852025 0.232351 0.692024 1.233821 0.945513 0.442011 0.313789 0.211414
0.593987 0.205534 0.333559 4.036575 0.765011 0.08792 0.244104 0.322979
1.732705 0.842621 0.042288 0.265792 2.434033 0.528507 1.831951 0.644007
2.32119 0.74778 0.115425 0.377096 2.658633 0.513647 0.898231 0.587038
6.099451 1.849906 1.881957 0.6927 1.815347 0.037774 2.001302 0.693382
2.895334 0.427818 5.034074 0.415207 1.690524 0.465237 8.069392 0.7394

88
8.29715 1.008673 0.832918 1.030668 4.196915 1.036937 0.68553 0.286099
3.526665 0.778522 0.351921 0.840054 1.736763 0.410443 1.277242 1.117833
3.147867 1.367313 0.874419 0.80037 2.105199 1.259879 1.083009 0.156949
0.923672 0.47514 0.375767 0.321562 2.219069 0.737513 0.240231 0.728273
3.010809 0.81368 0.796493 0.665588 1.669701 0.891406 1.405357 0.241203
3.392099 1.911598 0.932736 0.081759 1.822147 1.32172 2.996361 1.510212
2.420935 0.552172 0.401872 0.435417 0.690585 0.957826 0.103604 0.661274
3.157071 1.295698 0.978881 0.323148 2.247834 0.529412 0.782063 0.401145
0.728318 0.001889 1.020965 0.874014 0.865673 0.193727 4.137656 0.298373
1.006684 0.166526 0.247462 1.327969 2.059275 0.11295 0.441804 0.350187
2.578247 0.601283 1.724959 0.596582 2.177907 1.019051 1.392777 1.111283
2.017541 1.02451 0.266641 0.265646 1.504176 1.627907 0.68164 0.007532
0.981768 15.88305 0.060359 1.619078 1.444325 1.801797 1.889526 0.434281
0.709676 0.044025 4.494875 0.159963 0.834777 0.127425 1.221145 0.090718
0.823155 1.564907 1.920718 0.004729 1.401077 2.717528 0.397298 0.226647
2.122223 0.45667 1.865257 0.518202 1.406376 0.356584 1.822143 0.281621
2.700429 0.116837 1.15947 0.392366 1.133565 0.271164 0.031296 0.160663
2.104717 0.114065 0.524719 0.021008 3.310729 0.324817 0.651012 0.47717
1.156559 0.796872 0.128533 0.578242 3.230346 0.6242 0.436724 0.227091
1.04834 1.311511 1.218678 0.837776 0.831259 3.291014 0.279572 0.488497
0.926343 0.248818 0.867201 1.43404 1.291098 0.645534 0.176579 0.008389
1.223768 0.799024 0.951503 0.746478 1.133616 0.541341 0.363583 0.128389
1.098269 0.90244 1.189057 0.21471 0.668505 0.130524 0.755178 0.145457
0.942612 0.118839 1.100496 0.468224 0.586887 0.120933 0.639129 0.251243
1.751272 0.232546 0.681398 0.248948 0.291302 0.190199 0.702663 1.058443
3.047589 1.419566 0.057821 2.370964 3.389052 1.310296 1.242089 0.307594
2.069853 1.252913 0.527682 0.455467 2.210605 0.678392 2.096952 0.27239
1.25322 2.236223 0.350515 0.168581 1.048685 17.11207 0.35884 0.28226
1.92524 0.74249 0.827066 1.970747 1.360565 0.101592 17.85929 0.713383
1.044171 0.404123 0.383679 0.649726 2.916097 0.46342 0.775701 0.890077
1.295056 0.459246 0.866146 0.434734 1.56781 0.409876 0.105304 0.627689
2.413981 0.254295 0.860962 0.336505 0.951103 0.198414 0.942066 0.149237
2.011741 0.599251 1.057056 0.043162 1.120151 0.501539 0.904014 0.089127
1.783903 1.317117 2.033135 0.148441 1.067671 0.642068 0.128368 0.06089
4.289949 0.877377 0.919021 1.459838 12.56293 0.885103 0.793387 1.077992
6.463429 0.763405 0.319073 0.482102 4.315354 0.522988 1.064582 10.69167
3.00926 0.04907 1.79949 0.407006 1.472575 0.542802 0.264099 0.317284
1.17978 0.83375 0.63011 1.236261 0.439291 0.504867 0.089627 0.081515
#26 #27
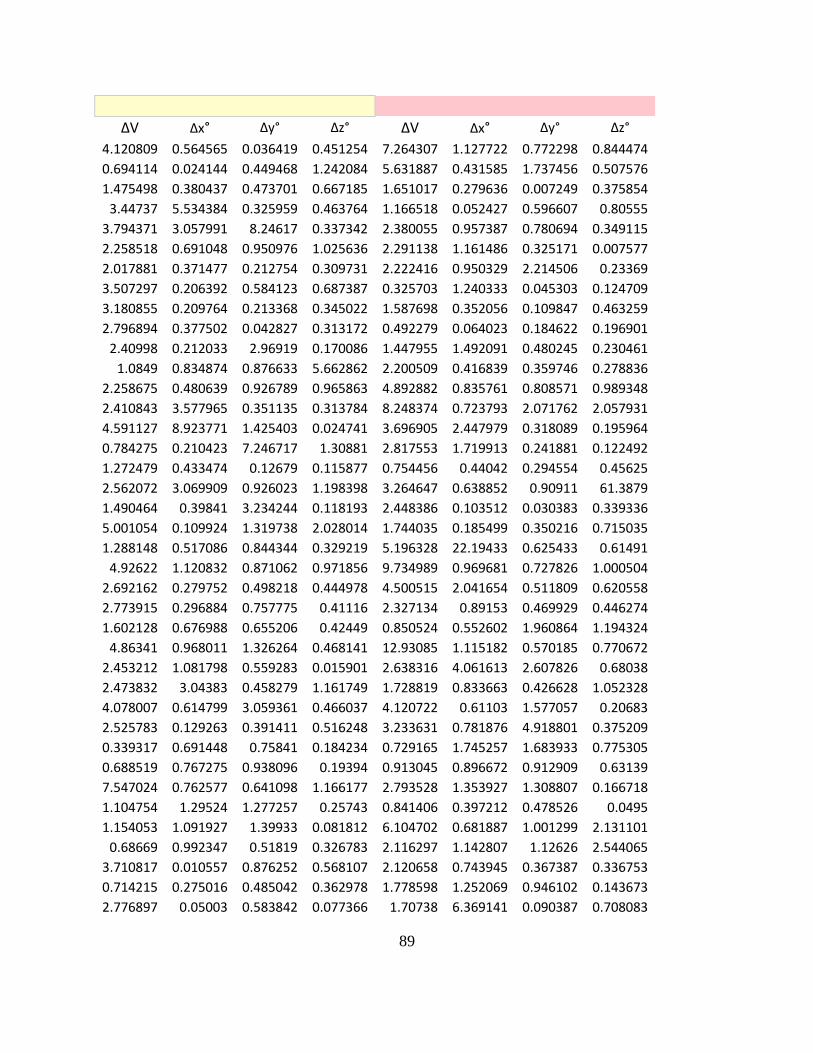
89
ΔV Δx° Δy° Δz° ΔV Δx° Δy° Δz°
4.120809 0.564565 0.036419 0.451254 7.264307 1.127722 0.772298 0.844474
0.694114 0.024144 0.449468 1.242084 5.631887 0.431585 1.737456 0.507576
1.475498 0.380437 0.473701 0.667185 1.651017 0.279636 0.007249 0.375854
3.44737 5.534384 0.325959 0.463764 1.166518 0.052427 0.596607 0.80555
3.794371 3.057991 8.24617 0.337342 2.380055 0.957387 0.780694 0.349115
2.258518 0.691048 0.950976 1.025636 2.291138 1.161486 0.325171 0.007577
2.017881 0.371477 0.212754 0.309731 2.222416 0.950329 2.214506 0.23369
3.507297 0.206392 0.584123 0.687387 0.325703 1.240333 0.045303 0.124709
3.180855 0.209764 0.213368 0.345022 1.587698 0.352056 0.109847 0.463259
2.796894 0.377502 0.042827 0.313172 0.492279 0.064023 0.184622 0.196901
2.40998 0.212033 2.96919 0.170086 1.447955 1.492091 0.480245 0.230461
1.0849 0.834874 0.876633 5.662862 2.200509 0.416839 0.359746 0.278836
2.258675 0.480639 0.926789 0.965863 4.892882 0.835761 0.808571 0.989348
2.410843 3.577965 0.351135 0.313784 8.248374 0.723793 2.071762 2.057931
4.591127 8.923771 1.425403 0.024741 3.696905 2.447979 0.318089 0.195964
0.784275 0.210423 7.246717 1.30881 2.817553 1.719913 0.241881 0.122492
1.272479 0.433474 0.12679 0.115877 0.754456 0.44042 0.294554 0.45625
2.562072 3.069909 0.926023 1.198398 3.264647 0.638852 0.90911 61.3879
1.490464 0.39841 3.234244 0.118193 2.448386 0.103512 0.030383 0.339336
5.001054 0.109924 1.319738 2.028014 1.744035 0.185499 0.350216 0.715035
1.288148 0.517086 0.844344 0.329219 5.196328 22.19433 0.625433 0.61491
4.92622 1.120832 0.871062 0.971856 9.734989 0.969681 0.727826 1.000504
2.692162 0.279752 0.498218 0.444978 4.500515 2.041654 0.511809 0.620558
2.773915 0.296884 0.757775 0.41116 2.327134 0.89153 0.469929 0.446274
1.602128 0.676988 0.655206 0.42449 0.850524 0.552602 1.960864 1.194324
4.86341 0.968011 1.326264 0.468141 12.93085 1.115182 0.570185 0.770672
2.453212 1.081798 0.559283 0.015901 2.638316 4.061613 2.607826 0.68038
2.473832 3.04383 0.458279 1.161749 1.728819 0.833663 0.426628 1.052328
4.078007 0.614799 3.059361 0.466037 4.120722 0.61103 1.577057 0.20683
2.525783 0.129263 0.391411 0.516248 3.233631 0.781876 4.918801 0.375209
0.339317 0.691448 0.75841 0.184234 0.729165 1.745257 1.683933 0.775305
0.688519 0.767275 0.938096 0.19394 0.913045 0.896672 0.912909 0.63139
7.547024 0.762577 0.641098 1.166177 2.793528 1.353927 1.308807 0.166718
1.104754 1.29524 1.277257 0.25743 0.841406 0.397212 0.478526 0.0495
1.154053 1.091927 1.39933 0.081812 6.104702 0.681887 1.001299 2.131101
0.68669 0.992347 0.51819 0.326783 2.116297 1.142807 1.12626 2.544065
3.710817 0.010557 0.876252 0.568107 2.120658 0.743945 0.367387 0.336753
0.714215 0.275016 0.485042 0.362978 1.778598 1.252069 0.946102 0.143673
2.776897 0.05003 0.583842 0.077366 1.70738 6.369141 0.090387 0.708083

90
1.71933 0.329135 0.971137 1.735438 1.213914 0.900694 0.109786 0.080064
0.913011 1.667151 0.32037 0.119744 0.766862 18.96939 0.431938 0.393419
5.61912 0.023469 0.158398 0.394028 3.150601 0.533961 0.63454 0.416204
0.507246 0.230663 0.36992 1.609982 3.025173 4.130975 2.408031 0.267916
1.03505 1.102516 0.995492 11.24081 1.002791 0.233296 0.852432 0.114743
1.039903 0.320307 0.966489 2.095901 0.567132 10.35076 2.317176 0.377792
1.728323 0.299007 0.805472 0.619821 3.001222 0.933316 0.044566 0.279549
4.598999 0.820244 0.642242 0.504269 3.901341 5.247696 1.140369 1.094439
3.322769 1.021308 1.182051 2.656164 1.328307 0.433371 0.141 3.61173
1.393403 0.666212 0.004912 0.359524 2.163088 0.69633 0.276544 0.317948
2.231656 1.22895 0.987802 1.03279 2.853152 0.674366 0.880789 0.820808
0.895179 0.53654 0.772448 0.188305 8.047017 0.819006 0.384994 0.627259
0.709709 0.311778 1.119737 0.956017 1.291979 0.653468 0.424224 5.916578
0.528868 11.50978 0.520406 0.370525 2.837138 1.834832 0.532689 0.539373
1.069336 0.614613 0.645033 0.093032 0.852689 0.381413 0.43732 0.066413
0.700548 0.347683 0.040436 0.618801 1.283603 0.264768 0.198552 0.268383
8.348646 0.889283 1.009253 1.024528 9.207369 0.902126 0.914272 0.90283
1.385479 0.322194 0.703379 0.326283 4.888359 1.65355 0.20387 0.18495
0.890865 0.022657 2.722465 0.186315 2.88353 1.435754 0.220782 0.372099
1.981094 1.092187 0.9381 1.904644 0.719076 0.666721 4.675806 6.618709
Experimental
#6 #7
ΔV Δx° Δy° Δz° ΔV Δx° Δy° Δz°
3.440625 0.839239 1.218498 0.187924 6.667263 1.084499 0.824798 0.870908
0
0 3.092129 0.624368 1.146749 0.258936 6.187275 3.638518 0.765209 0.16715
0.616787 0.401034 1.318718 0.387451 1.54373 6.243448 6.735225 0.605573
2.074229 0.54158 1.853475 1.066822 2.918066 0.846361 0.19474 0.768491
3.107353 1.104968 0.598042 1.055186 5.284727 0.710966 0.028241 0.743584
1.933664 0.563147 0.452233 0.477987 4.404483 2.454173 0.823375 0.721933
4.907295 0.72592 0.682862 0.652896 3.251113 1.248913 0.356404 1.398174
4.698148 1.012851 5.089697 0.890086 4.467338 0.338665 0.832737 0.741216
2.975149 2.256525 0.808174 0.731529 2.750136 0.423711 0.549808 0.509671
0
0 2.374469 1.068771 0.441688 0.113971 1.451003 0.40669 0.459505 0.103069
2.28483 0.896683 0.682345 0.6593 2.217818 0.278308 0.649925 0.908908
3.026913 1.747875 1.277411 0.571618 2.425091 5.744494 0.347234 0.076185
3.4928 1.940116 0.656778 0.276615 1.831698 5.802647 0.010146 0.368902

91
3.219041 0.05507 0.097794 0.938347 3.342901 0.141176 1.135525 1.806017
3.29195 0.196249 0.727547 0.809558 5.431108 0.657943 0.834191 0.79935
2.422228 1.090263 0.465873 0.59047 5.763985 0.985226 0.30162 1.319514
1.844301 0.542967 0.522186 0.263726 3.897934 1.304578 2.884079 0.970115
9.638285 0.922287 0.683328 0.24557 0 5.973581 1.064638 0.909159 0.975338 3.323546 1.27221 0.020089 0.819281
2.312816 0.715761 0.771317 0.493869 7.686208 1.264852 0.298049 0.587161
2.784714 0.74209 0.440534 1.668229 0.921686 0.209412 3.480961 0.514291
3.922804 0.387336 0.89038 0.740861 3.752085 0.666729 18.23627 0.918158
13.87161 3.072709 0.772675 0.95906 7.724437 2.856741 0.67947 1.685232
11.60085 1.205389 0.84834 0.764998 3.251211 1.898301 1.313514 1.132169
2.059142 1.76687 0.583616 0.32631 0 3.134326 0.920158 0.514697 2.143882 1.901753 0.10653 0.669647 0.297575
1.569772 2.91764 0.571015 1.926442 2.16826 0.3684 0.582 3.42018
12.16346 1.213448 1.681156 0.968945 3.932858 1.322732 1.374799 0.666861
2.740087 1.304205 1.04282
3.671444 2.937138 1.203766 1.118183
5.273046 0.833308 0.849843 0.907113 1.982559 0.11071 0.088229 0.466221
2.462971 1.204669 0.041248 1.212272 3.953249 1.605527 1.522733 1.065997
0.713494 0.863101 1.479076 0.691916 3.038992 0.819819 1.275254 0.713107
1.732842 1.017331 0.770492 0.094407 4.004565 0.63879 1.950876 1.307509
0.962117 1.524333 0.797653 6.511793 2.637769 1.046039 0.716997 0.310476
8.431273 1.209275 1.155357 0.979976 8.237087 1.39283 3.351686 0.820559
0
0 1.616791 2.064543 0.618512 3.646382 0.913604 0.119517 0.331505 0.113835
1.377226 0.835402 1.534492 0.751737 2.472058 0.554021 0.77761 0.584468
4.547888 1.065418 23.46908 0.239494 3.932788 1.712311 0.855316 0.749037
1.021555 0.539989 1.444999 1.919991 3.542008 0.788037 0.433188 0.658899
4.529873 0.89191 0.828684 0.770369 5.037198 0.897472 0.772306 0.919396
0.417895 2.39028 0.772013 0.175846 1.24648 1.416039 0.932883 0.704515
4.338318 0.364721 5.398219 0.817546 4.035581 0.658272 1.533674 0.383524
4.80796 0.604991 0.990078 0.431705 4.145346 0.598567 0.203723 0.391064
#8 #9
ΔV Δx° Δy° Δz° ΔV Δx° Δy° Δz°
6.265865 0.738978 0.932467 0.719932 4.87707 0.784572 1.342451 0.855635
0
0 3.02884 26.37862 4.995803 2.039486 3.081352 4.874138 2.162173 1.610328
2.276785 24.71878 3.363323 0.528453 2.017281 3.041806 1.081532 6.336705
4.621341 0.935213 0.124805 0.635149 2.439594 1.459288 0.185158 0.68046
4.315523 0.944569 1.18569 0.665185 3.027347 0.920064 0.729391 0.787651

92
1.613062 4.64361 1.468728 0.763952 5.835151 14.52584 7.255824 0.64533
6.103351 1.322601 2.822752 0.326661 6.161373 1.432649 0.661963 1.914966
0.632035 0.341493 1.940843 0.470508 1.42674 1.70701 0.332512 0.46664
2.1836 0.503005 10.76506 2.503845 2.049589 0.419084 0.608788 2.558156
0
0 4.396228 0.699677 0.742875 0.396727 5.394632 0.799015 0.343221 0.440496
3.449065 0.425152 0.391466 0.476671 3.262657 0.422327 1.925075 18.98676
1.459291 0.545165 0.928272 0.264252 1.174698 0.469021 0.579927 0.22832
5.25873 0.950302 0.57741 0.449684 1.830099 0.685664 0.216383 0.276274
10.20074 0.379826 3.158932 0.788419 4.137125
0.425537 0.684756
6.758823 1.12289 1.657235 1.906124 4.255883 1.453185 1.164284 1.831266
2.643804
0.125888 0.650169 3.605569 1.585656 1.023563 0.160403
2.494304 0.795478 0.548125 0.723205 1.372351 0.62786 1.299826 0.313941
5.60197 1.344924 6.279054 0.489456 9.387163 2.429364 12.70952 6.84721
3.084716 0.861218 14.52576 2.922403 3.700235 0.799418 1.005932 0.989162
2.586223 0.621134 1.036299 0.078627 2.85521 0.698413 0.72481 0.330742
2.240035 0.476924 12.38025 0.759179 2.299088 1.065495 0.353176 0.446633
5.980657 1.332324 0.690691 0.744497 3.04663 0.728097 0.504322 0.810805
7.332305 0.835988 0.107708 0.932962 8.48598 9.641721 0.395866 0.115764
1.807392 0.878411 0.353517 0.175373 3.895368 1.28771 0.068124 0.659498
6.39693 0.836579 1.248963 0.344225 5.641615 1.074445 1.130775 0.709672
2.832021 0.557847 0.191892 1.039413 2.465885 0.476389 3.250332 1.106445
1.653463 5.546252 0.116923 1.471015 2.104184 1.855801 0.713299 0.968212
1.764073 0.841529 0.631076 0.024603 3.69621 2.701222 0.348823 2.626479
3.287741 1.143901 0.115329 0.703299 2.917453 0.522226 0.023216 0.30921
1.101417 0.331446 0.251318 0.235352 2.883628 0.260148 0.19483 0.373606
2.40757 1.307738 0.096194 0.8397 2.298539 3.36878 1.097647 1.105647
1.622309 0.714318 0.686795 0.506693 4.092383 0.719813 0.233146 0.682449
3.192342 0.956237 0.969981 0.779385 3.630329 1.028676 3.184151 0.402602
6.456959 1.139057 0.514508 0.338026 2.635551 0.627312 1.273584 0.469683
4.64071 0.064003 0.206301 0.813943 8.95286 0.950711 1.194169 0.780354
0
0 1.843633 8.802877 0.704424 0.255469 3.659462 3.129358 1.552254 0.099548
1.633241 1.107699 0.703379 0.49504 4.221894 0.873606 1.618589 1.844871
5.217097 3.285766 0.641596 0.491462 3.487537 0.943058 4.260797 2.147163 5.256982 0.100638 0.643844 2.183558 2.292726 0.968317 0.239853
2.677646 0.929744 0.940326 0.913951 2.425846 0.793396 1.082803 0.829842
1.888247 0.532763 0.460251 0.581754 1.820378 17.43292 0.394119 0.440217
7.614341 0.60279 0.932502 0.608981 1.438002 0.398058 0.171306 0.386589
4.952115 0.570265 1.576189 0.076936 3.959557 0.49294 0.956377 0.324973
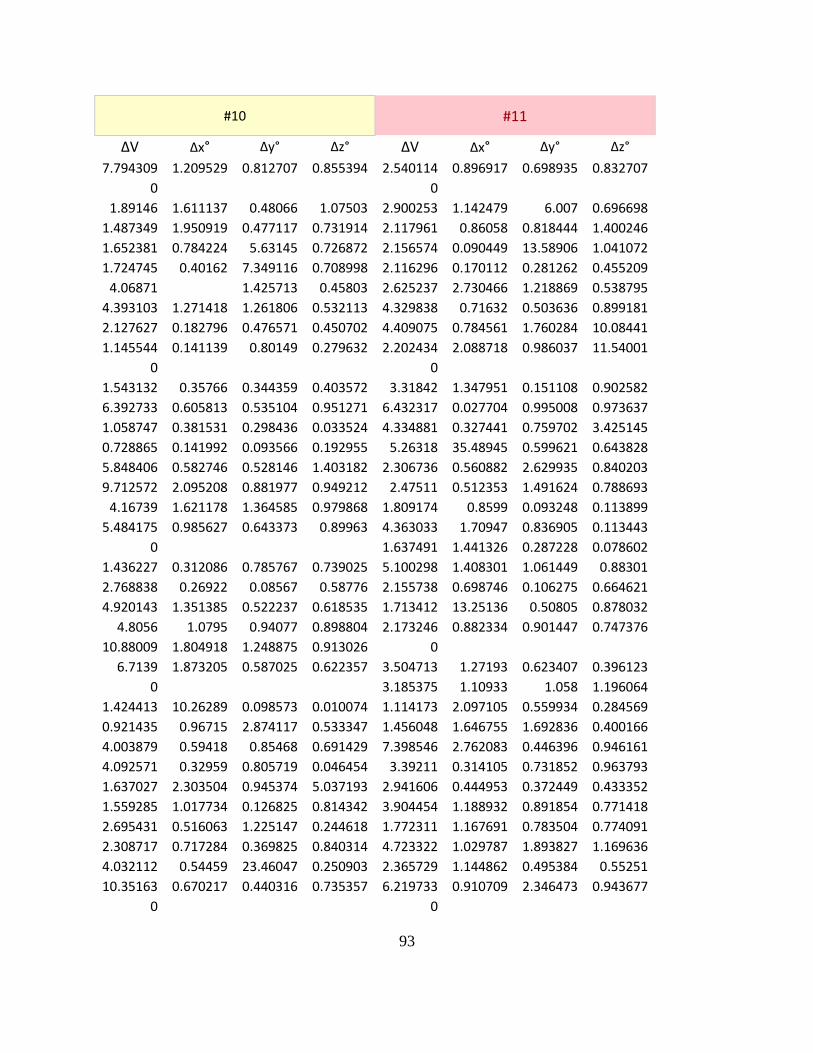
93
#10 #11
ΔV Δx° Δy° Δz° ΔV Δx° Δy° Δz°
7.794309 1.209529 0.812707 0.855394 2.540114 0.896917 0.698935 0.832707
0
0 1.89146 1.611137 0.48066 1.07503 2.900253 1.142479 6.007 0.696698
1.487349 1.950919 0.477117 0.731914 2.117961 0.86058 0.818444 1.400246
1.652381 0.784224 5.63145 0.726872 2.156574 0.090449 13.58906 1.041072
1.724745 0.40162 7.349116 0.708998 2.116296 0.170112 0.281262 0.455209
4.06871
1.425713 0.45803 2.625237 2.730466 1.218869 0.538795
4.393103 1.271418 1.261806 0.532113 4.329838 0.71632 0.503636 0.899181
2.127627 0.182796 0.476571 0.450702 4.409075 0.784561 1.760284 10.08441
1.145544 0.141139 0.80149 0.279632 2.202434 2.088718 0.986037 11.54001
0
0 1.543132 0.35766 0.344359 0.403572 3.31842 1.347951 0.151108 0.902582
6.392733 0.605813 0.535104 0.951271 6.432317 0.027704 0.995008 0.973637
1.058747 0.381531 0.298436 0.033524 4.334881 0.327441 0.759702 3.425145
0.728865 0.141992 0.093566 0.192955 5.26318 35.48945 0.599621 0.643828
5.848406 0.582746 0.528146 1.403182 2.306736 0.560882 2.629935 0.840203
9.712572 2.095208 0.881977 0.949212 2.47511 0.512353 1.491624 0.788693
4.16739 1.621178 1.364585 0.979868 1.809174 0.8599 0.093248 0.113899
5.484175 0.985627 0.643373 0.89963 4.363033 1.70947 0.836905 0.113443
0
1.637491 1.441326 0.287228 0.078602
1.436227 0.312086 0.785767 0.739025 5.100298 1.408301 1.061449 0.88301
2.768838 0.26922 0.08567 0.58776 2.155738 0.698746 0.106275 0.664621
4.920143 1.351385 0.522237 0.618535 1.713412 13.25136 0.50805 0.878032
4.8056 1.0795 0.94077 0.898804 2.173246 0.882334 0.901447 0.747376
10.88009 1.804918 1.248875 0.913026 0 6.7139 1.873205 0.587025 0.622357 3.504713 1.27193 0.623407 0.396123
0
3.185375 1.10933 1.058 1.196064
1.424413 10.26289 0.098573 0.010074 1.114173 2.097105 0.559934 0.284569
0.921435 0.96715 2.874117 0.533347 1.456048 1.646755 1.692836 0.400166
4.003879 0.59418 0.85468 0.691429 7.398546 2.762083 0.446396 0.946161
4.092571 0.32959 0.805719 0.046454 3.39211 0.314105 0.731852 0.963793
1.637027 2.303504 0.945374 5.037193 2.941606 0.444953 0.372449 0.433352
1.559285 1.017734 0.126825 0.814342 3.904454 1.188932 0.891854 0.771418
2.695431 0.516063 1.225147 0.244618 1.772311 1.167691 0.783504 0.774091
2.308717 0.717284 0.369825 0.840314 4.723322 1.029787 1.893827 1.169636
4.032112 0.54459 23.46047 0.250903 2.365729 1.144862 0.495384 0.55251
10.35163 0.670217 0.440316 0.735357 6.219733 0.910709 2.346473 0.943677
0
0

94
6.494476 1.269815 0.140792 1.027049 3.931853 1.817642 0.822978 0.355884
0.905217 1.117622 0.57372 0.390553 1.171098 0.751333 0.139692 0.897731
2.854901 1.934977 1.51983 1.332971 3.38905 0.751481 3.591965 0.777927 0.883359 0.255236 1.99629 2.052011 0.921269 0.268837 0.461338
0.899924 2.082518 0.904954 0.804411 6.802955 1.493066 1.013657 0.911046
5.575248 1.382968 1.022046 0.834795 0.279057 5.768683 0.069023 2.062427
4.077625 0.239526 0.879436 0.062522 2.73696 0.934283 0.495951 0.383934
1.228479 0.636587 4.170843 1.643753 1.558689 2.065592 0.540198 2.38173
#22 #23
ΔV Δx° Δy° Δz° ΔV Δx° Δy° Δz°
0
0 1.440992 0.284835 1.577294 0.132825 1.257825 0.483912 0.493747 0.209521
0.338826 3.423746 0.614983 0.831753 1.497398 0.307018 3.317123 0.121573
3.990541 0.462834 0.73392 0.515162 1.420503 0.201017 0.005948 0.444707
0
0 0
0
8.642865 2.132574 1.457789 1.644099 2.687355 1.208775 1.063634 0.731191
0.399008 0.570052 1.060557 0.532722 6.768182 1.268268 0.486175 0.517408
5.697406 3.77133 0.691901 0.466846 2.636858 0.460702 4.697592 0.516885
0.90173 0.093373 0.020471 0.386634 1.845689 1.238108 1.801286 0.114881
1.415147 1.964213 2.040347 1.536981 3.487467 0.002492 0.365882 0.703126
4.934308 3.067679 0.321078 0.484961 3.501661 0.161498 1.407898 0.231866
0
0 2.019712 5.033867 4.603272 0.306331 1.058373 1.179104 0.41682 0.272785
4.227378 0.397841 6.418218 0.641208 0.91833 0.127757 0.234313 0.04999
6.456436 1.530506 0.924743 0.043591 3.031072 0.960284 0.242066 0.504041
0
0 3.611413 1.283285 0.209895 1.864702 7.257698 0.597369 0.780321 0.580953
2.663501 1.026201 0.933405 0.676252 3.471787 15.46334 0.496828 0.524011
2.237208 0.604249 0.51888 0.032786 7.168533 0.45415 0.427638 0.388393
3.039606 0.949945 0.824964 0.943957 1.745057 0.943631 0.738231 0.58633
3.431561 0.751405 0.95155 0.206626 2.060121 0.595017 0.804149 1.356454
2.382976 2.943181 1.727016 0.043222 4.320657 1.319778 3.537611 0.415655
4.928775 3.364709 1.20542 0.855177 2.787915 1.145633 0.772272 1.330047
7.373142 1.607053 0.192614 0.59414 3.398789 0.028528 1.61467 0
0
0
0 2.582955 0.366746 0.645382 5.590195 6.037009 0.573095 0.26351 0.558199
0
0

95
4.308245 1.010552 0.678501 0.985336 3.918965 0.535496 0.529562 0.59032
3.454068 0.909914 0.733063 0.427871 6.149535 0.759911 1.100014 0.628594
3.536911 0.673823 0.412346 0.524245 1.337846 0.416524 1.202467 0.018179
4.888816 5.44157 1.432159 0.555423 2.91216
0.283533 0.376408
3.914308 1.180344 2.101632 1.099832 1.620703 0.014589 0.949022 3.733958
6.449083 0.858122 1.58094 0.829341 0.862211 0.430582 0.832857 0.395228
1.465162 0.717365 1.370122 0.22746 2.773189 1.717458 0.130269 0.783721
0
0 0.998913 0.209304 0.430879 0.330163 2.153502 1.468851 0.649931 0.213217
7.357883 1.236308 0.563546 1.229083 4.005106 1.748809 0.463093 0.686366
3.73271 1.822067 0.557298 0.707721 3.000106 0.647977 0.603983 3.952238
1.233326 0.317929 0.117268 0.135014 3.021036 0.748936 0.599172 0.195158
0
0 0
0
0
0 8.951671 0.081082 2.926007 0.253038 2.002963 0.029045 0.418097 0.248741
1.608195 0.691435 0.304974 0.741709 2.242917 3.417381 0.157529 11.78722
#24 #25
ΔV Δx° Δy° Δz° ΔV Δx° Δy° Δz°
0
0 1.22665 0.261771 0.155534 3.655249 0.839712 0.24443 0.62706 0.212366
0.896021 0.033547 1.130293 0.21778 2.780136 7.60239 1.609463 0.948864
1.923813 5.175717 0.315251 0.562838 3.850021 0.299002 0.485884 0.664426
0
0 0
0
1.120946 0.56931 0.506245 0.221207 4.003116 4.409307 0.837496 0.517341
2.829571 2.473705 0.958565 0.894363 3.218319 1.131553 0.66683 0.653921
3.608423 0.719099 0.833645 0.62699 4.431707 0.676579 0.785725 3.295064
2.196468 0.453014 0.768602 0.499987 3.302979 0.309433 0.051509 1.026398
3.570077 0.453395 1.776285 2.404835 3.470805 0.188337 1.889979 2.37722
3.11384 0.279688 0.676118 0.282456 1.692604 0.312363 0.170511 0.200449
0
0 0.542018 0.705869 0.02578 0.19542 2.241724 0.854464 0.12847 0.360942
3.224671 0.509866 1.270553 0.938398 0.671504 0.144053 15.35327 0.549989
5.24512 0.357071 0.196207 0.561018 7.119375 0.472501 0.258475 0.558011
0
0 1.471634 1.117343 1.351789 0.19318 1.963071 0.394929 0.744879 0.509558
2.573475 0.537121 0.51024 0.425376 1.823502 1.247763 1.322079 0.148747
6.674005 0.308037 0.280693 0.524576 5.120205 0.248005 0.725421 1.707071

96
4.325274 0.942488 0.272369 0.681181 3.017287 0.973814 1.799723 1.078042
1.984522 0.600495 2.079245 1.268685 2.593466 0.620143 1.347589 10.26612
1.1158 1.135176 0.401672 0.548937 2.595539 1.354958 1.144014 0.705529
3.629591 0.793897 0.373625 0.815576 3.654894 0.957287 0.050244 1.116326
1.030994 0.500167 5.954972 0.487301 2.439464 0.218171 0.571888 0.390009
0
0 0
0
2.406007 0.585065 0.03779 0.178045 7.619917 0.340174 1.885125 2.795398
0
0 0.698879 0.291511 3.827779 0.496026 2.729201 0.523294 1.032714 1.022166
4.366253 0.524018 15.57851 2.161143 6.080028 0.653109 7.833475 0.066042
1.687613 0.453841 0.744674 0.54756 1.253782 0.631686 0.123573 0.227077
3.322706 7.159284 0.352966 1.088819 1.360094 0.346727 1.536177 0.33091
2.829528 0.624306 1.346924 2.387033 4.855293 0.688118 0.754307 1.539285
0.780898 0.761556 0.894345 0.441452 3.70143 1.220634 9.638633 0.294495
2.033731 1.015128 0.519634 0.404526 1.643671 2.566591 0.604334 0.047485
0
0 2.260182 0.342945
0.32146 4.908857 0.337573 1.489032 1.219354
4.650269 5.060417 0.589773 0.619278 1.527049 4.47993 0.041285 0.220466
2.878643 0.549823 3.8228 0.586024 2.856186 0.649154 0.001947 0.311694
1.772386 0.296741 0.493857 0.362193 2.712421 0.095087 1.127523 0.726794
0
0 0
0
0
0 2.844967 0.21018 1.637288 0.830131 1.694302 0.217161 5.70409 0.188357
3.201634 0.594611 0.014175 0.739543 3.227722 9.619267 0.587067 1.366216
#26 #27
ΔV Δx° Δy° Δz° ΔV Δx° Δy° Δz°
0
0 0.431022 0.969433 0.260348 0.057525 3.743756 0.799812 0.48655 0.143099
1.456836 0.186294 0.98078 0.289383 2.453886 5.182354 0.511998 0.858647
0.915934 2.266558 0.168239 18.43283 1.258938 6.500278 1.21537 0.791056
0
0 0
0
2.964973 1.047647 2.524518 0.345856 2.024444 3.562836 0.26403 0.327739
3.480284 5.181331 0.492002 0.544429 1.898973 1.674471 0.385808 0.075481
3.485886 0.667227 0.643062 0.039818 2.703279 0.451906 0.619835 0.735593
1.654172 0.928626 0.533306 0.544282 6.468408 0.867504 0.685831 6.797493
3.410007 27.94853 6.171814 0.105572 4.313938 1.481877 5.80492 1.544691

97
3.03766 0.225976 0.469668 0.209746 2.155846 0.209485 0.664953 0.322984
0
0 0.776194 0.956242 0.448191 0.161215 0.53936 0.269098 0.86917 0.104974
0.486657 0.212586 0.871947 0.744729 3.232758 0.535449 5.764409 0.223334
1.867638 0.203887 0.206618 0.807928 5.177673 0.072646 1.10451 0.428905
0
0 3.083386 0.866749 1.197932 0.126742 2.239198 0.848156 0.305773 1.042683
2.2247 0.526004 0.565718 0.877811 2.176201
0.987626 0.412278
3.184055 0.266761 0.179988 4.899605 0 2.496369 0.974425 0.596386 0.91907 1.232257 1.895453 1.509766 0.834973
2.417864 0.619644 11.24971 0.218205 1.934409 0.574545 1.741793 0.488205
1.864158 1.398753 0.874159 0.007595 8.417091 0.522147 2.714541 0.365029
2.478127 0.726196 8.916779 0.708599 7.665421 0.684933 1.583247 0.981633
1.063067 0.507227 1.022466 1.542871 5.038888 0.378417 1.169079 0.520894
0
0 0
0
7.511171 0.561621 0.111773 0.56254 1.219866 1.788271 1.738955 0.127281
0
0 6.891743 0.900739 0.414728 0.841394 1.072738 0.39946 0.701404 1.044561
5.448023 0.763297 0.40269 0.152994 9.723448 3.968095 0.186224 0.362582
1.213139 0.326767 0.463848 0.953247 5.244754 0.296978 6.734441 0.822808
2.693872 0.593981 0.292944 0.25195 4.59017 0.483182 0.117272 0.403113
5.316245 0.590808 0.861863 0.875695 0 1.667384 0.307302 5.880138 0.453478 4.43843 0.929198 0.990719 0.732289
2.239023 0.830167 0.007467 0.431125 2.612103 0.88521 5.34601 0.368254
0
0 5.238935 1.60592 0.343346 1.658348 5.600256 1.842351 0.482275 0.45026
1.690049 1.852387 0.283125 0.487843 3.0987 1.252291 0.195899 0.345506
4.774339 0.650314 0.548464 0.443636 3.393916 0.943081 0.314296 0.301718
1.759508 0.08878 0.112044 0.010002 5.021889 2.100998 3.630454 0.309056
0
0 0
0
0
0 3.746248 0.293318 0.610859 0.248491 5.032579 1.675139 0.625375 0.404299
3.101242 0.166825 0.435394 1.21944 2.731268 0.063654 1.378439 0.701539

98
Statistical Analyses
DISCREPANCY BY INDIVIDUAL TEETH
On eway An aly sis o f Data By Gro u p param eter=ΔV, To o th =# 1 0
Missin g Ro ws 2
On eway An o va
Su m m ary o f Fit
Rsq u a r e 0 .0 0 1 2 3 6
Ad j Rsq u a r e -0 .0 0 8 6 5
Ro o t Mea n Sq u a r e Er r o r 2 .5 1 9 0 9 5
Mea n o f Resp o n se 3 .1 3 2 4 5 8
Ob se r va t io n s (o r Su m Wgt s) 1 0 3

99
t Test
MOP-CONTROL
Assu m in g eq u a l va r ia n ces
Diffe r en ce 0 .1 7 6 5 t Ra t io 0 .3 5 3 5 2 6
Std Er r Dif 0 .4 9 9 3 DF 1 0 1
Up p e r CL Dif 1 .1 6 7 0 Pr o b > |t | 0 .7 2 4 4
Lo wer CL Dif -0 .8 1 3 9 Pr o b > t 0 .3 6 2 2
Co n fid en ce 0 .9 5 Pr o b < t 0 .6 3 7 8
An aly sis o f Varian ce
So u rce DF Su m o f Squares Mean Square F Ratio Pro b > F
Gr o u p 1 0 .7 9 3 1 1 0 .7 9 3 1 1 0 .1 2 5 0 0 .7 2 4 4
Er r o r 1 0 1 6 4 0 .9 2 9 8 5 6 .3 4 5 8 4
C. To t a l 1 0 2 6 4 1 .7 2 2 9 6
Mean s fo r On eway An o va
Leve l Nu m ber Mean Std Erro r Lo wer 9 5 % Up p er 9 5 %
CONTROL 5 7 3 .0 5 3 6 3 0 .3 3 3 6 6 2 .3 9 1 7 3 .7 1 5 5
MOP 4 6 3 .2 3 0 1 4 0 .3 7 1 4 2 2 .4 9 3 3 3 .9 6 6 9
Std Er r o r u se s a p o o led e st im a te o f e r r o r va r ia n ce

100
On eway An aly sis o f Data By Gro u p param eter= ΔV, To o th =# 1 1
Missin g Ro ws 1
On eway An o va
Su m m ary o f Fit
Rsq u a r e 0 .0 0 4 9 4 3
Ad j Rsq u a r e -0 .0 0 4 8 1
Ro o t Mea n Sq u a r e Er r o r 1 .6 5 4 5 3 4
Mea n o f Resp o n se 2 .7 4 8 1 6 2
Ob se r va t io n s (o r Su m Wgt s) 1 0 4
t Test
MOP-CONTROL
Assu m in g eq u a l va r ia n ces
Diffe r en ce 0 .2 3 2 5 3 t Ra t io 0 .7 1 1 8 2 2

101
Std Er r Dif 0 .3 2 6 6 6 DF 1 0 2
Up p e r CL Dif 0 .8 8 0 4 6 Pr o b > |t | 0 .4 7 8 2
Lo wer CL Dif -0 .4 1 5 4 1 Pr o b > t 0 .2 3 9 1
Co n fid en ce 0 .9 5 Pr o b < t 0 .7 6 0 9
An aly sis o f Varian ce
So u rce DF Su m o f Squares Mean Square F Ratio Pro b > F
Gr o u p 1 1 .3 8 7 0 6 1 .3 8 7 0 6 0 .5 0 6 7 0 .4 7 8 2
Er r o r 1 0 2 2 7 9 .2 2 3 0 7 2 .7 3 7 4 8
C. To t a l 1 0 3 2 8 0 .6 1 0 1 3
Mean s fo r On eway An o va
Leve l Nu m ber Mean Std Erro r Lo wer 9 5 % Up p er 9 5 %
CONTROL 5 8 2 .6 4 5 3 1 0 .2 1 7 2 5 2 .2 1 4 4 3 .0 7 6 2
MOP 4 6 2 .8 7 7 8 4 0 .2 4 3 9 5 2 .3 9 4 0 3 .3 6 1 7
Std Er r o r u se s a p o o led e st im a te o f e r r o r va r ia n ce
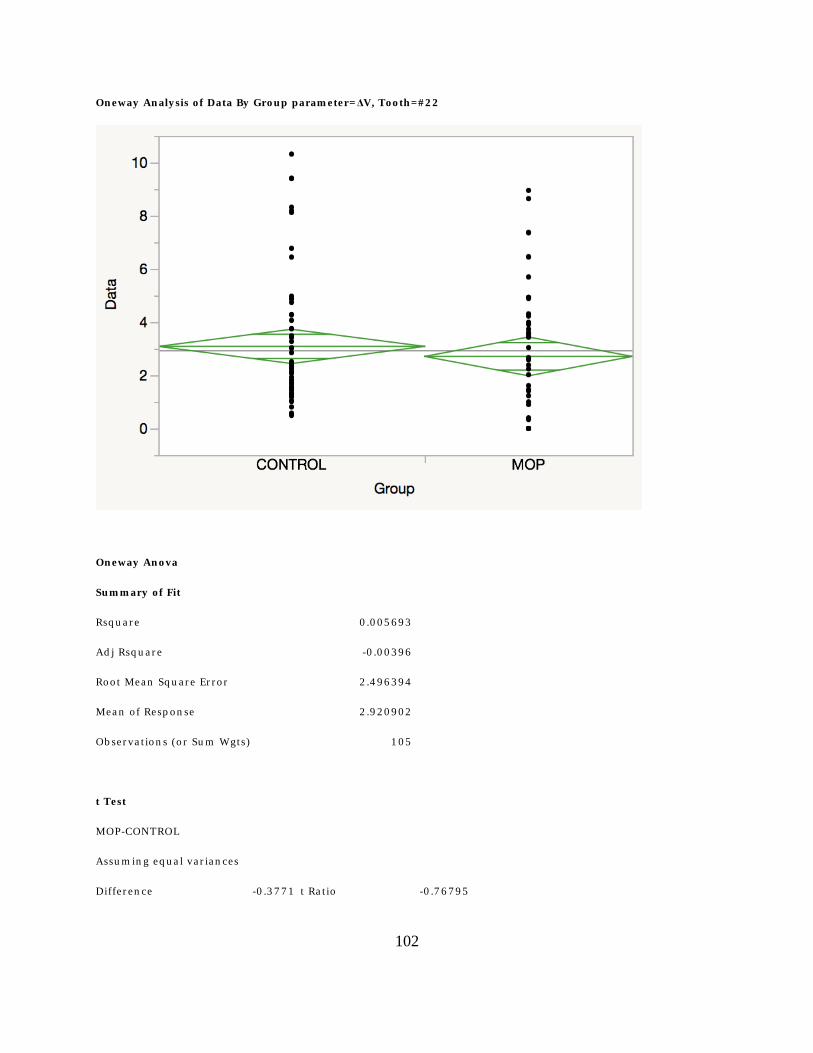
102
On eway An aly sis o f Data By Gro u p param eter= ΔV, To o th =# 2 2
On eway An o va
Su m m ary o f Fit
Rsq u a r e 0 .0 0 5 6 9 3
Ad j Rsq u a r e -0 .0 0 3 9 6
Ro o t Mea n Sq u a r e Er r o r 2 .4 9 6 3 9 4
Mea n o f Resp o n se 2 .9 2 0 9 0 2
Ob se r va t io n s (o r Su m Wgt s) 1 0 5
t Test
MOP-CONTROL
Assu m in g eq u a l va r ia n ces
Diffe r en ce -0 .3 7 7 1 t Ra t io -0 .7 6 7 9 5
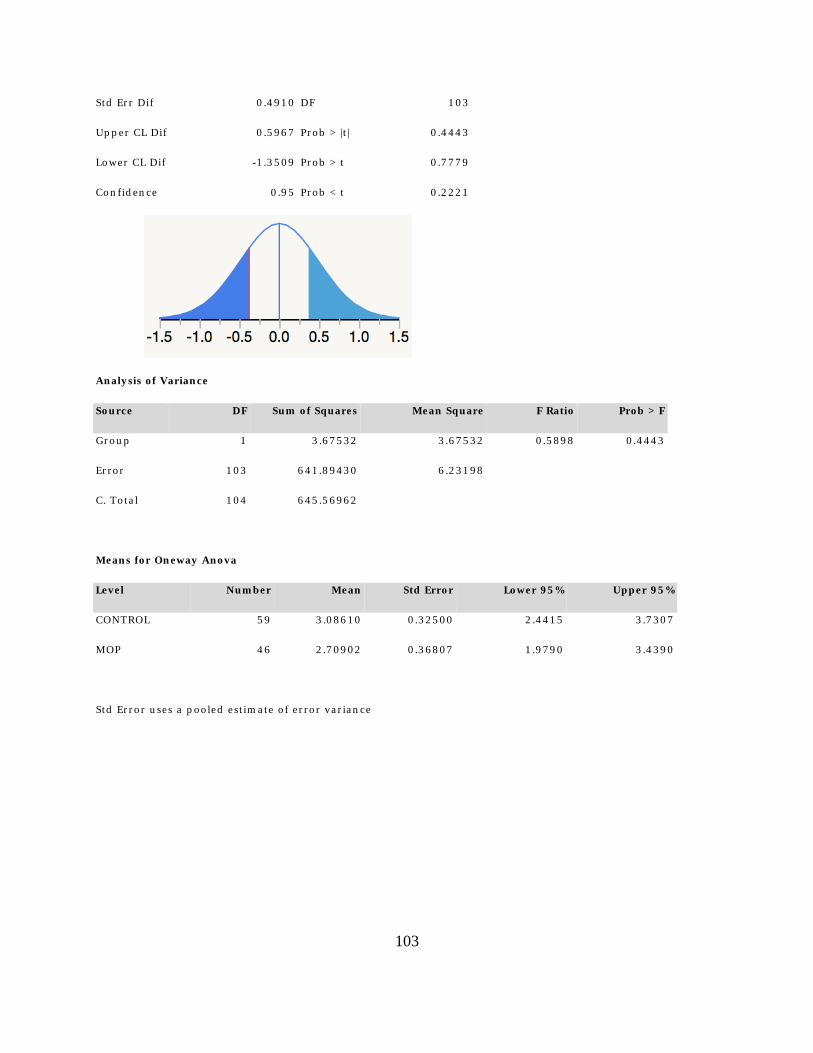
103
Std Er r Dif 0 .4 9 1 0 DF 1 0 3
Up p e r CL Dif 0 .5 9 6 7 Pr o b > |t | 0 .4 4 4 3
Lo wer CL Dif -1 .3 5 0 9 Pr o b > t 0 .7 7 7 9
Co n fid en ce 0 .9 5 Pr o b < t 0 .2 2 2 1
An aly sis o f Varian ce
So u rce DF Su m o f Squares Mean Square F Ratio Pro b > F
Gr o u p 1 3 .6 7 5 3 2 3 .6 7 5 3 2 0 .5 8 9 8 0 .4 4 4 3
Er r o r 1 0 3 6 4 1 .8 9 4 3 0 6 .2 3 1 9 8
C. To t a l 1 0 4 6 4 5 .5 6 9 6 2
Mean s fo r On eway An o va
Leve l Nu m ber Mean Std Erro r Lo wer 9 5 % Up p er 9 5 %
CONTROL 5 9 3 .0 8 6 1 0 0 .3 2 5 0 0 2 .4 4 1 5 3 .7 3 0 7
MOP 4 6 2 .7 0 9 0 2 0 .3 6 8 0 7 1 .9 7 9 0 3 .4 3 9 0
Std Er r o r u se s a p o o led e st im a te o f e r r o r va r ia n ce

104
On eway An aly sis o f Data By Gro u p param eter= ΔV, To o th =# 2 3
On eway An o va
Su m m ary o f Fit
Rsq u a r e 3 .8 4 8 e -6
Ad j Rsq u a r e -0 .0 0 9 7
Ro o t Mea n Sq u a r e Er r o r 1 .9 4 2 1 3 4
Mea n o f Resp o n se 2 .2 6 4 3 9
Ob se r va t io n s (o r Su m Wgt s) 1 0 5
t Test
MOP-CONTROL
Assu m in g eq u a l va r ia n ces
Diffe r en ce 0 .0 0 7 6 0 t Ra t io 0 .0 1 9 9 0 7

105
Std Er r Dif 0 .3 8 2 0 0 DF 1 0 3
Up p e r CL Dif 0 .7 6 5 2 2 Pr o b > |t | 0 .9 8 4 2
Lo wer CL Dif -0 .7 5 0 0 1 Pr o b > t 0 .4 9 2 1
Co n fid en ce 0 .9 5 Pr o b < t 0 .5 0 7 9
An aly sis o f Varian ce
So u rce DF Su m o f Squares Mean Square F Ratio Pro b > F
Gr o u p 1 0 .0 0 1 4 9 0 .0 0 1 4 9 0 .0 0 0 4 0 .9 8 4 2
Er r o r 1 0 3 3 8 8 .5 0 4 0 6 3 .7 7 1 8 8
C. To t a l 1 0 4 3 8 8 .5 0 5 5 5
Mean s fo r On eway An o va
Leve l Nu m ber Mean Std Erro r Lo wer 9 5 % Up p er 9 5 %
CONTROL 5 9 2 .2 6 1 0 6 0 .2 5 2 8 4 1 .7 5 9 6 2 .7 6 2 5
MOP 4 6 2 .2 6 8 6 6 0 .2 8 6 3 5 1 .7 0 0 8 2 .8 3 6 6
Std Er r o r u se s a p o o led e st im a te o f e r r o r va r ia n ce

106
On eway An aly sis o f Data By Gro u p param eter= ΔV, To o th =# 2 4
On eway An o va
Su m m ary o f Fit
Rsq u a r e 0 .0 1 8 5 9 3
Ad j Rsq u a r e 0 .0 0 9 0 6 5
Ro o t Mea n Sq u a r e Er r o r 1 .5 9 5 7 5 6
Mea n o f Resp o n se 2 .1 6 0 2 0 8
Ob se r va t io n s (o r Su m Wgt s) 1 0 5
t Test
MOP-CONTROL
Assu m in g eq u a l va r ia n ces
Diffe r en ce -0 .4 3 8 5 t Ra t io -1 .3 9 6 9
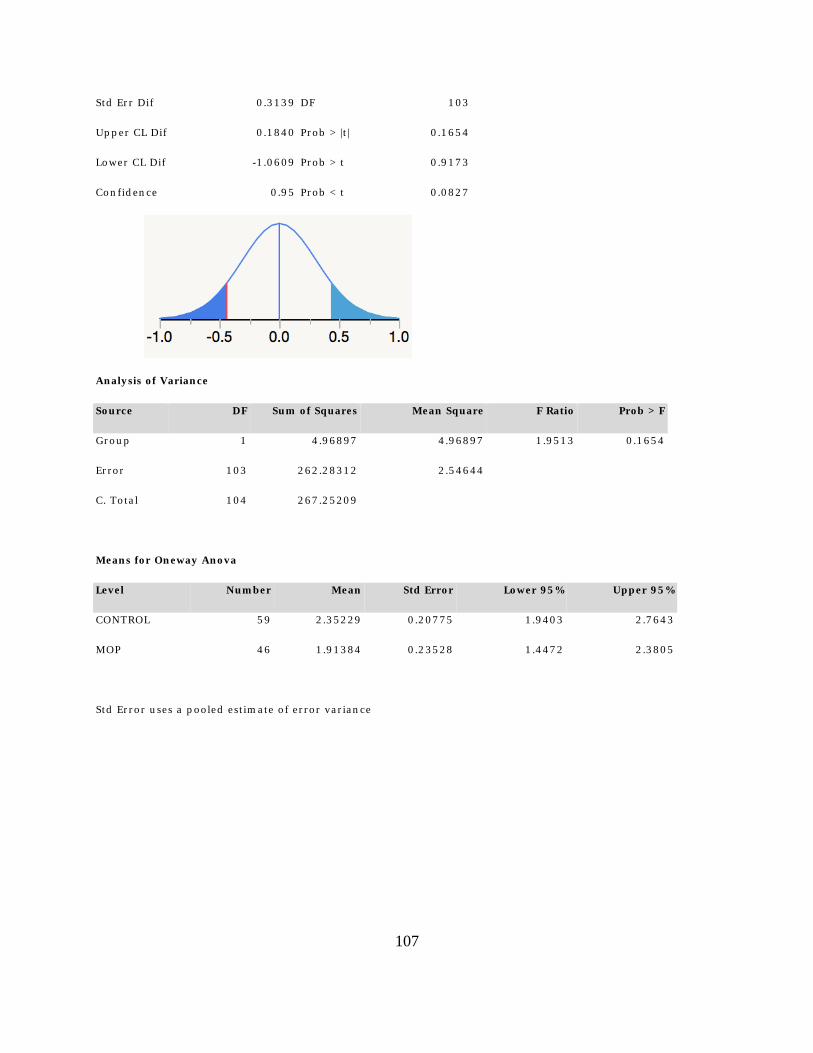
107
Std Er r Dif 0 .3 1 3 9 DF 1 0 3
Up p e r CL Dif 0 .1 8 4 0 Pr o b > |t | 0 .1 6 5 4
Lo wer CL Dif -1 .0 6 0 9 Pr o b > t 0 .9 1 7 3
Co n fid en ce 0 .9 5 Pr o b < t 0 .0 8 2 7
An aly sis o f Varian ce
So u rce DF Su m o f Squares Mean Square F Ratio Pro b > F
Gr o u p 1 4 .9 6 8 9 7 4 .9 6 8 9 7 1 .9 5 1 3 0 .1 6 5 4
Er r o r 1 0 3 2 6 2 .2 8 3 1 2 2 .5 4 6 4 4
C. To t a l 1 0 4 2 6 7 .2 5 2 0 9
Mean s fo r On eway An o va
Leve l Nu m ber Mean Std Erro r Lo wer 9 5 % Up p er 9 5 %
CONTROL 5 9 2 .3 5 2 2 9 0 .2 0 7 7 5 1 .9 4 0 3 2 .7 6 4 3
MOP 4 6 1 .9 1 3 8 4 0 .2 3 5 2 8 1 .4 4 7 2 2 .3 8 0 5
Std Er r o r u se s a p o o led e st im a te o f e r r o r va r ia n ce

108
On eway An aly sis o f Data By Gro u p param eter= ΔV, To o th =# 2 5
On eway An o va
Su m m ary o f Fit
Rsq u a r e 0 .0 0 5 2 0 6
Ad j Rsq u a r e -0 .0 0 4 4 5
Ro o t Mea n Sq u a r e Er r o r 1 .8 6 9 5 0 3
Mea n o f Resp o n se 2 .1 7 4 3 7 5
Ob se r va t io n s (o r Su m Wgt s) 1 0 5
t Test
MOP-CONTROL
Assu m in g eq u a l va r ia n ces
Diffe r en ce 0 .2 6 9 9 7 t Ra t io 0 .7 3 4 1 8 1

109
Std Er r Dif 0 .3 6 7 7 2 DF 1 0 3
Up p e r CL Dif 0 .9 9 9 2 6 Pr o b > |t | 0 .4 6 4 5
Lo wer CL Dif -0 .4 5 9 3 1 Pr o b > t 0 .2 3 2 3
Co n fid en ce 0 .9 5 Pr o b < t 0 .7 6 7 7
An aly sis o f Varian ce
So u rce DF Su m o f Squares Mean Square F Ratio Pro b > F
Gr o u p 1 1 .8 8 3 9 1 1 .8 8 3 9 1 0 .5 3 9 0 0 .4 6 4 5
Er r o r 1 0 3 3 5 9 .9 8 9 3 1 3 .4 9 5 0 4
C. To t a l 1 0 4 3 6 1 .8 7 3 2 2
Mean s fo r On eway An o va
Leve l Nu m ber Mean Std Erro r Lo wer 9 5 % Up p er 9 5 %
CONTROL 5 9 2 .0 5 6 1 0 0 .2 4 3 3 9 1 .5 7 3 4 2 .5 3 8 8
MOP 4 6 2 .3 2 6 0 7 0 .2 7 5 6 4 1 .7 7 9 4 2 .8 7 2 7
Std Er r o r u se s a p o o led e st im a te o f e r r o r va r ia n ce

110
On eway An aly sis o f Data By Gro u p param eter= ΔV, To o th =# 2 6
On eway An o va
Su m m ary o f Fit
Rsq u a r e 0 .0 0 6 2 2 9
Ad j Rsq u a r e -0 .0 0 3 4 2
Ro o t Mea n Sq u a r e Er r o r 1 .8 1 8 6 0 4
Mea n o f Resp o n se 2 .2 4 9 9 7 2
Ob se r va t io n s (o r Su m Wgt s) 1 0 5
t Test
MOP-CONTROL
Assu m in g eq u a l va r ia n ces
Diffe r en ce -0 .2 8 7 4 1 t Ra t io -0 .8 0 3 4 7

111
Std Er r Dif 0 .3 5 7 7 1 DF 1 0 3
Up p e r CL Dif 0 .4 2 2 0 2 Pr o b > |t | 0 .4 2 3 6
Lo wer CL Dif -0 .9 9 6 8 4 Pr o b > t 0 .7 8 8 2
Co n fid en ce 0 .9 5 Pr o b < t 0 .2 1 1 8
An aly sis o f Varian ce
So u rce DF Su m o f Squares Mean Square F Ratio Pro b > F
Gr o u p 1 2 .1 3 5 0 8 2 .1 3 5 0 8 0 .6 4 5 6 0 .4 2 3 6
Er r o r 1 0 3 3 4 0 .6 5 4 1 5 3 .3 0 7 3 2
C. To t a l 1 0 4 3 4 2 .7 8 9 2 3
Mean s fo r On eway An o va
Leve l Nu m ber Mean Std Erro r Lo wer 9 5 % Up p er 9 5 %
CONTROL 5 9 2 .3 7 5 8 8 0 .2 3 6 7 6 1 .9 0 6 3 2 .8 4 5 4
MOP 4 6 2 .0 8 8 4 8 0 .2 6 8 1 4 1 .5 5 6 7 2 .6 2 0 3
Std Er r o r u se s a p o o led e st im a te o f e r r o r va r ia n ce

112
On eway An aly sis o f Data By Gro u p param eter= ΔV, To o th =# 2 7
On eway An o va
Su m m ary o f Fit
Rsq u a r e 0 .0 0 7 4 1 3
Ad j Rsq u a r e -0 .0 0 2 2 2
Ro o t Mea n Sq u a r e Er r o r 2 .5 4 9 3 3 1
Mea n o f Resp o n se 2 .8 2 2 2 3 3
Ob se r va t io n s (o r Su m Wgt s) 1 0 5
t Test
MOP-CONTROL
Assu m in g eq u a l va r ia n ces
Diffe r en ce -0 .4 3 9 8 t Ra t io -0 .8 7 7 0 9

113
Std Er r Dif 0 .5 0 1 4 DF 1 0 3
Up p e r CL Dif 0 .5 5 4 7 Pr o b > |t | 0 .3 8 2 5
Lo wer CL Dif -1 .4 3 4 3 Pr o b > t 0 .8 0 8 8
Co n fid en ce 0 .9 5 Pr o b < t 0 .1 9 1 2
An aly sis o f Varian ce
So u rce DF Su m o f Squares Mean Square F Ratio Pro b > F
Gr o u p 1 4 .9 9 9 6 5 4 .9 9 9 6 5 0 .7 6 9 3 0 .3 8 2 5
Er r o r 1 0 3 6 6 9 .4 0 6 1 8 6 .4 9 9 0 9
C. To t a l 1 0 4 6 7 4 .4 0 5 8 3
Mean s fo r On eway An o va
Leve l Nu m ber Mean Std Erro r Lo wer 9 5 % Up p er 9 5 %
CONTROL 5 9 3 .0 1 4 9 1 0 .3 3 1 8 9 2 .3 5 6 7 3 .6 7 3 1
MOP 4 6 2 .5 7 5 1 1 0 .3 7 5 8 8 1 .8 2 9 6 3 .3 2 0 6
Std Er r o r u se s a p o o led e st im a te o f e r r o r va r ia n ce

114
On eway An aly sis o f Data By Gro u p param eter= ΔV, To o th =# 6
Missin g Ro ws 1
On eway An o va
Su m m ary o f Fit
Rsq u a r e 0 .0 2 7 4 8 6
Ad j Rsq u a r e 0 .0 1 7 9 5 1
Ro o t Mea n Sq u a r e Er r o r 2 .4 3 1 5 6
Mea n o f Resp o n se 3 .0 8 4 6 9 6
Ob se r va t io n s (o r Su m Wgt s) 1 0 4
t Test
MOP-CONTROL
Assu m in g eq u a l va r ia n ces
Diffe r en ce 0 .8 1 5 1 t Ra t io 1 .6 9 7 8 7 1

115
Std Er r Dif 0 .4 8 0 1 DF 1 0 2
Up p e r CL Dif 1 .7 6 7 3 Pr o b > |t | 0 .0 9 2 6
Lo wer CL Dif -0 .1 3 7 1 Pr o b > t 0 .0 4 6 3 *
Co n fid en ce 0 .9 5 Pr o b < t 0 .9 5 3 7
An aly sis o f Varian ce
So u rce DF Su m o f Squares Mean Square F Ratio Pro b > F
Gr o u p 1 1 7 .0 4 4 3 0 1 7 .0 4 4 3 2 .8 8 2 8 0 .0 9 2 6
Er r o r 1 0 2 6 0 3 .0 7 3 2 3 5 .9 1 2 5
C. To t a l 1 0 3 6 2 0 .1 1 7 5 4
Mean s fo r On eway An o va
Leve l Nu m ber Mean Std Erro r Lo wer 9 5 % Up p er 9 5 %
CONTROL 5 8 2 .7 2 4 1 7 0 .3 1 9 2 8 2 .0 9 0 9 3 .3 5 7 5
MOP 4 6 3 .5 3 9 2 7 0 .3 5 8 5 1 2 .8 2 8 2 4 .2 5 0 4
Std Er r o r u se s a p o o led e st im a te o f e r r o r va r ia n ce
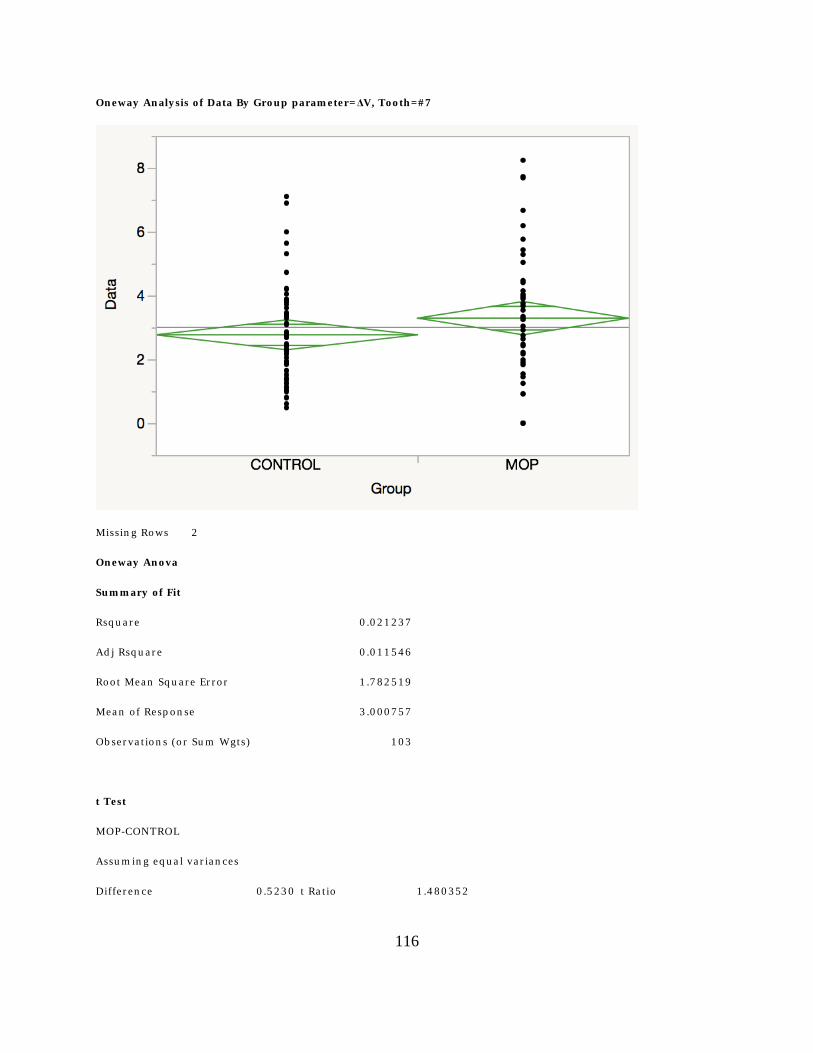
116
On eway An aly sis o f Data By Gro u p param eter= ΔV, To o th =# 7
Missin g Ro ws 2
On eway An o va
Su m m ary o f Fit
Rsq u a r e 0 .0 2 1 2 3 7
Ad j Rsq u a r e 0 .0 1 1 5 4 6
Ro o t Mea n Sq u a r e Er r o r 1 .7 8 2 5 1 9
Mea n o f Resp o n se 3 .0 0 0 7 5 7
Ob se r va t io n s (o r Su m Wgt s) 1 0 3
t Test
MOP-CONTROL
Assu m in g eq u a l va r ia n ces
Diffe r en ce 0 .5 2 3 0 t Ra t io 1 .4 8 0 3 5 2

117
Std Er r Dif 0 .3 5 3 3 DF 1 0 1
Up p e r CL Dif 1 .2 2 3 8 Pr o b > |t | 0 .1 4 1 9
Lo wer CL Dif -0 .1 7 7 8 Pr o b > t 0 .0 7 0 9
Co n fid en ce 0 .9 5 Pr o b < t 0 .9 2 9 1
An aly sis o f Varian ce
So u rce DF Su m o f Squares Mean Square F Ratio Pro b > F
Gr o u p 1 6 .9 6 3 0 3 6 .9 6 3 0 3 2 .1 9 1 4 0 .1 4 1 9
Er r o r 1 0 1 3 2 0 .9 1 4 8 0 3 .1 7 7 3 7
C. To t a l 1 0 2 3 2 7 .8 7 7 8 2
Mean s fo r On eway An o va
Leve l Nu m ber Mean Std Erro r Lo wer 9 5 % Up p er 9 5 %
CONTROL 5 7 2 .7 6 7 1 8 0 .2 3 6 1 0 2 .2 9 8 8 3 .2 3 5 5
MOP 4 6 3 .2 9 0 1 8 0 .2 6 2 8 2 2 .7 6 8 8 3 .8 1 1 5
Std Er r o r u se s a p o o led e st im a te o f e r r o r va r ia n ce
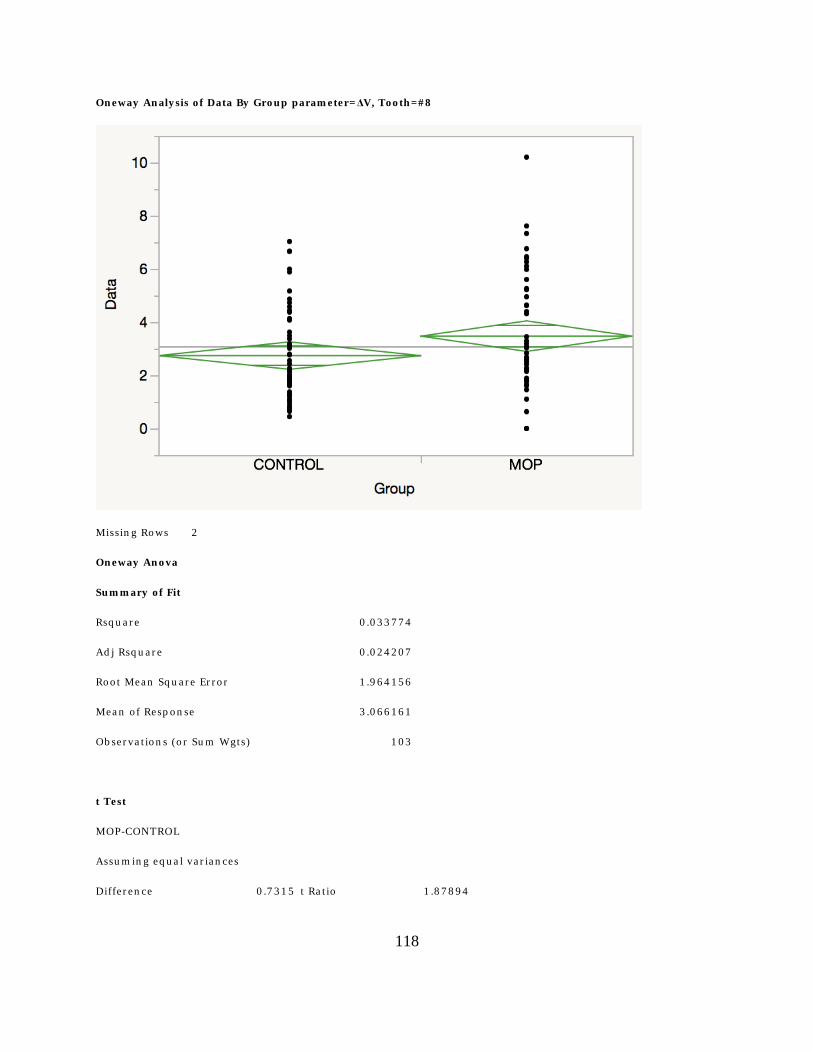
118
On eway An aly sis o f Data By Gro u p param eter= ΔV, To o th =# 8
Missin g Ro ws 2
On eway An o va
Su m m ary o f Fit
Rsq u a r e 0 .0 3 3 7 7 4
Ad j Rsq u a r e 0 .0 2 4 2 0 7
Ro o t Mea n Sq u a r e Er r o r 1 .9 6 4 1 5 6
Mea n o f Resp o n se 3 .0 6 6 1 6 1
Ob se r va t io n s (o r Su m Wgt s) 1 0 3
t Test
MOP-CONTROL
Assu m in g eq u a l va r ia n ces
Diffe r en ce 0 .7 3 1 5 t Ra t io 1 .8 7 8 9 4

119
Std Er r Dif 0 .3 8 9 3 DF 1 0 1
Up p e r CL Dif 1 .5 0 3 7 Pr o b > |t | 0 .0 6 3 1
Lo wer CL Dif -0 .0 4 0 8 Pr o b > t 0 .0 3 1 6 *
Co n fid en ce 0 .9 5 Pr o b < t 0 .9 6 8 4
An aly sis o f Varian ce
So u rce DF Su m o f Squares Mean Square F Ratio Pro b > F
Gr o u p 1 1 3 .6 2 0 0 2 1 3 .6 2 0 0 3 .5 3 0 4 0 .0 6 3 1
Er r o r 1 0 1 3 8 9 .6 4 8 7 9 3 .8 5 7 9
C. To t a l 1 0 2 4 0 3 .2 6 8 8 2
Mean s fo r On eway An o va
Leve l Nu m ber Mean Std Erro r Lo wer 9 5 % Up p er 9 5 %
CONTROL 5 7 2 .7 3 9 4 9 0 .2 6 0 1 6 2 .2 2 3 4 3 .2 5 5 6
MOP 4 6 3 .4 7 0 9 5 0 .2 8 9 6 0 2 .8 9 6 5 4 .0 4 5 4
Std Er r o r u se s a p o o led e st im a te o f e r r o r va r ia n ce

120
On eway An aly sis o f Data By Gro u p param eter=ΔV, To o th =# 9
Missin g Ro ws 2
On eway An o va
Su m m ary o f Fit
Rsq u a r e 0 .0 3 1 4 0 2
Ad j Rsq u a r e 0 .0 2 1 8 1 2
Ro o t Mea n Sq u a r e Er r o r 1 .9 8 9 2 4 5
Mea n o f Resp o n se 2 .9 5 5 9 0 4
Ob se r va t io n s (o r Su m Wgt s) 1 0 3
t Test
MOP-CONTROL
Assu m in g eq u a l va r ia n ces
Diffe r en ce 0 .7 1 3 4 t Ra t io 1 .8 0 9 5 2 6

121
Std Er r Dif 0 .3 9 4 3 DF 1 0 1
Up p e r CL Dif 1 .4 9 5 6 Pr o b > |t | 0 .0 7 3 3
Lo wer CL Dif -0 .0 6 8 7 Pr o b > t 0 .0 3 6 7 *
Co n fid en ce 0 .9 5 Pr o b < t 0 .9 6 3 3
An aly sis o f Varian ce
So u rce DF Su m o f Squares Mean Square F Ratio Pro b > F
Gr o u p 1 1 2 .9 5 7 0 5 1 2 .9 5 7 1 3 .2 7 4 4 0 .0 7 3 3
Er r o r 1 0 1 3 9 9 .6 6 6 5 3 3 .9 5 7 1
C. To t a l 1 0 2 4 1 2 .6 2 3 5 8
Mean s fo r On eway An o va
Leve l Nu m ber Mean Std Erro r Lo wer 9 5 % Up p er 9 5 %
CONTROL 5 7 2 .6 3 7 2 8 0 .2 6 3 4 8 2 .1 1 4 6 3 .1 6 0 0
MOP 4 6 3 .3 5 0 7 2 0 .2 9 3 3 0 2 .7 6 8 9 3 .9 3 2 5
Std Er r o r u se s a p o o led e st im a te o f e r r o r va r ia n ce

122
On eway An aly sis o f Data By Gro u p param eter= Δx°, To o th =# 1 0
Missin g Ro ws 8
On eway An o va
Su m m ary o f Fit
Rsq u a r e 0 .0 2 3 0 0 5
Ad j Rsq u a r e 0 .0 1 2 7 2
Ro o t Mea n Sq u a r e Er r o r 2 .3 8 1 8 9 4
Mea n o f Resp o n se 1 .6 4 3 9 2
Ob se r va t io n s (o r Su m Wgt s) 9 7
t Test
MOP-CONTROL
Assu m in g eq u a l va r ia n ces
Diffe r en ce -0 .7 3 4 8 t Ra t io -1 .4 9 5 6 3

123
Std Er r Dif 0 .4 9 1 3 DF 9 5
Up p e r CL Dif 0 .2 4 0 5 Pr o b > |t | 0 .1 3 8 1
Lo wer CL Dif -1 .7 1 0 1 Pr o b > t 0 .9 3 1 0
Co n fid en ce 0 .9 5 Pr o b < t 0 .0 6 9 0
An aly sis o f Varian ce
So u rce DF Su m o f Squares Mean Square F Ratio Pro b > F
Gr o u p 1 1 2 .6 9 0 8 7 1 2 .6 9 0 9 2 .2 3 6 9 0 .1 3 8 1
Er r o r 9 5 5 3 8 .9 7 4 6 2 5 .6 7 3 4
C. To t a l 9 6 5 5 1 .6 6 5 5 0
Mean s fo r On eway An o va
Leve l Nu m ber Mean Std Erro r Lo wer 9 5 % Up p er 9 5 %
CONTROL 5 7 1 .9 4 6 9 3 0 .3 1 5 4 9 1 .3 2 0 6 2 .5 7 3 3
MOP 4 0 1 .2 1 2 1 4 0 .3 7 6 6 1 0 .4 6 4 5 1 .9 5 9 8
Std Er r o r u se s a p o o led e st im a te o f e r r o r va r ia n ce

124
On eway An aly sis o f Data By Gro u p param eter= Δx°, To o th =# 1 1
Missin g Ro ws 5
On eway An o va
Su m m ary o f Fit
Rsq u a r e 0 .0 0 5 6 7 1
Ad j Rsq u a r e -0 .0 0 4 4 8
Ro o t Mea n Sq u a r e Er r o r 4 .0 7 6 7 8 2
Mea n o f Resp o n se 1 .9 6 5 4 0 3
Ob se r va t io n s (o r Su m Wgt s) 1 0 0
t Test
MOP-CONTROL
Assu m in g eq u a l va r ia n ces
Diffe r en ce 0 .6 1 7 5 t Ra t io 0 .7 4 7 5 9

125
Std Er r Dif 0 .8 2 6 0 DF 9 8
Up p e r CL Dif 2 .2 5 6 7 Pr o b > |t | 0 .4 5 6 5
Lo wer CL Dif -1 .0 2 1 7 Pr o b > t 0 .2 2 8 2
Co n fid en ce 0 .9 5 Pr o b < t 0 .7 7 1 8
An aly sis o f Varian ce
So u rce DF Su m o f Squares Mean Square F Ratio Pro b > F
Gr o u p 1 9 .2 8 8 9 9 .2 8 8 9 0 .5 5 8 9 0 .4 5 6 5
Er r o r 9 8 1 6 2 8 .7 7 5 2 1 6 .6 2 0 2
C. To t a l 9 9 1 6 3 8 .0 6 4 0
Mean s fo r On eway An o va
Leve l Nu m ber Mean Std Erro r Lo wer 9 5 % Up p er 9 5 %
CONTROL 5 8 1 .7 0 6 0 5 0 .5 3 5 3 1 0 .6 4 3 7 2 .7 6 8 4
MOP 4 2 2 .3 2 3 5 6 0 .6 2 9 0 6 1 .0 7 5 2 3 .5 7 1 9
Std Er r o r u se s a p o o led e st im a te o f e r r o r va r ia n ce

126
On eway An aly sis o f Data By Gro u p param eter= Δx°, To o th =# 2 2
Missin g Ro ws 1 3
On eway An o va
Su m m ary o f Fit
Rsq u a r e 0 .0 0 2 8 0 9
Ad j Rsq u a r e -0 .0 0 8 2 7
Ro o t Mea n Sq u a r e Er r o r 2 .1 6 2 5 5 2
Mea n o f Resp o n se 1 .3 4 5 2 4 1
Ob se r va t io n s (o r Su m Wgt s) 9 2
t Test
MOP-CONTROL
Assu m in g eq u a l va r ia n ces
Diffe r en ce 0 .2 3 5 2 t Ra t io 0 .5 0 3 5 1 5

127
Std Er r Dif 0 .4 6 7 1 DF 9 0
Up p e r CL Dif 1 .1 6 3 2 Pr o b > |t | 0 .6 1 5 8
Lo wer CL Dif -0 .6 9 2 8 Pr o b > t 0 .3 0 7 9
Co n fid en ce 0 .9 5 Pr o b < t 0 .6 9 2 1
An aly sis o f Varian ce
So u rce DF Su m o f Squares Mean Square F Ratio Pro b > F
Gr o u p 1 1 .1 8 5 6 5 1 .1 8 5 6 5 0 .2 5 3 5 0 .6 1 5 8
Er r o r 9 0 4 2 0 .8 9 6 9 2 4 .6 7 6 6 3
C. To t a l 9 1 4 2 2 .0 8 2 5 8
Mean s fo r On eway An o va
Leve l Nu m ber Mean Std Erro r Lo wer 9 5 % Up p er 9 5 %
CONTROL 5 8 1 .2 5 8 3 2 0 .2 8 3 9 6 0 .6 9 4 1 9 1 .8 2 2 5
MOP 3 4 1 .4 9 3 5 1 0 .3 7 0 8 7 0 .7 5 6 7 1 2 .2 3 0 3
Std Er r o r u se s a p o o led e st im a te o f e r r o r va r ia n ce

128
On eway An aly sis o f Data By Gro u p param eter= Δx°, To o th =# 2 3
Missin g Ro ws 1 3
On eway An o va
Su m m ary o f Fit
Rsq u a r e 0 .0 0 1 6 4 6
Ad j Rsq u a r e -0 .0 0 9 4 5
Ro o t Mea n Sq u a r e Er r o r 2 .3 0 8 9 7 1
Mea n o f Resp o n se 1 .1 0 7 9 7 8
Ob se r va t io n s (o r Su m Wgt s) 9 2
t Test
MOP-CONTROL
Assu m in g eq u a l va r ia n ces
Diffe r en ce 0 .1 9 3 3 t Ra t io 0 .3 8 5 2 1 6

129
Std Er r Dif 0 .5 0 1 9 DF 9 0
Up p e r CL Dif 1 .1 9 0 5 Pr o b > |t | 0 .7 0 1 0
Lo wer CL Dif -0 .8 0 3 8 Pr o b > t 0 .3 5 0 5
Co n fid en ce 0 .9 5 Pr o b < t 0 .6 4 9 5
An aly sis o f Varian ce
So u rce DF Su m o f Squares Mean Square F Ratio Pro b > F
Gr o u p 1 0 .7 9 1 1 2 0 .7 9 1 1 2 0 .1 4 8 4 0 .7 0 1 0
Er r o r 9 0 4 7 9 .8 2 1 0 3 5 .3 3 1 3 4
C. To t a l 9 1 4 8 0 .6 1 2 1 6
Mean s fo r On eway An o va
Leve l Nu m ber Mean Std Erro r Lo wer 9 5 % Up p er 9 5 %
CONTROL 5 9 1 .0 3 8 6 3 0 .3 0 0 6 0 0 .4 4 1 4 3 1 .6 3 5 8
MOP 3 3 1 .2 3 1 9 7 0 .4 0 1 9 4 0 .4 3 3 4 5 2 .0 3 0 5
Std Er r o r u se s a p o o led e st im a te o f e r r o r va r ia n ce

130
On eway An aly sis o f Data By Gro u p param eter= Δx°, To o th =# 2 4
Missin g Ro ws 1 3
On eway An o va
Su m m ary o f Fit
Rsq u a r e 0 .0 0 2 9 9 2
Ad j Rsq u a r e -0 .0 0 8 0 9
Ro o t Mea n Sq u a r e Er r o r 3 .6 9 6 7 3 9
Mea n o f Resp o n se 1 .3 3 2 0 7 5
Ob se r va t io n s (o r Su m Wgt s) 9 2
t Test
MOP-CONTROL
Assu m in g eq u a l va r ia n ces
Diffe r en ce -0 .4 1 4 9 t Ra t io -0 .5 1 9 6 8

131
Std Er r Dif 0 .7 9 8 5 DF 9 0
Up p e r CL Dif 1 .1 7 1 4 Pr o b > |t | 0 .6 0 4 6
Lo wer CL Dif -2 .0 0 1 3 Pr o b > t 0 .6 9 7 7
Co n fid en ce 0 .9 5 Pr o b < t 0 .3 0 2 3
An aly sis o f Varian ce
So u rce DF Su m o f Squares Mean Square F Ratio Pro b > F
Gr o u p 1 3 .6 9 0 7 3 .6 9 0 7 0 .2 7 0 1 0 .6 0 4 6
Er r o r 9 0 1 2 2 9 .9 2 9 3 1 3 .6 6 5 9
C. To t a l 9 1 1 2 3 3 .6 2 0 0
Mean s fo r On eway An o va
Leve l Nu m ber Mean Std Erro r Lo wer 9 5 % Up p er 9 5 %
CONTROL 5 8 1 .4 8 5 4 3 0 .4 8 5 4 1 0 .5 2 1 1 2 .4 4 9 8
MOP 3 4 1 .0 7 0 4 8 0 .6 3 3 9 9 -0 .1 8 9 0 2 .3 3 0 0
Std Er r o r u se s a p o o led e st im a te o f e r r o r va r ia n ce

132
On eway An aly sis o f Data By Gro u p param eter= Δx°, To o th =# 2 5
Missin g Ro ws 1 2
On eway An o va
Su m m ary o f Fit
Rsq u a r e 0 .0 0 3 3 1 6
Ad j Rsq u a r e -0 .0 0 7 6 4
Ro o t Mea n Sq u a r e Er r o r 4 .4 5 6 8 9 7
Mea n o f Resp o n se 1 .6 5 9 3 1 6
Ob se r va t io n s (o r Su m Wgt s) 9 3
t Test
MOP-CONTROL
Assu m in g eq u a l va r ia n ces
Diffe r en ce -0 .5 2 8 0 t Ra t io -0 .5 5 0 2
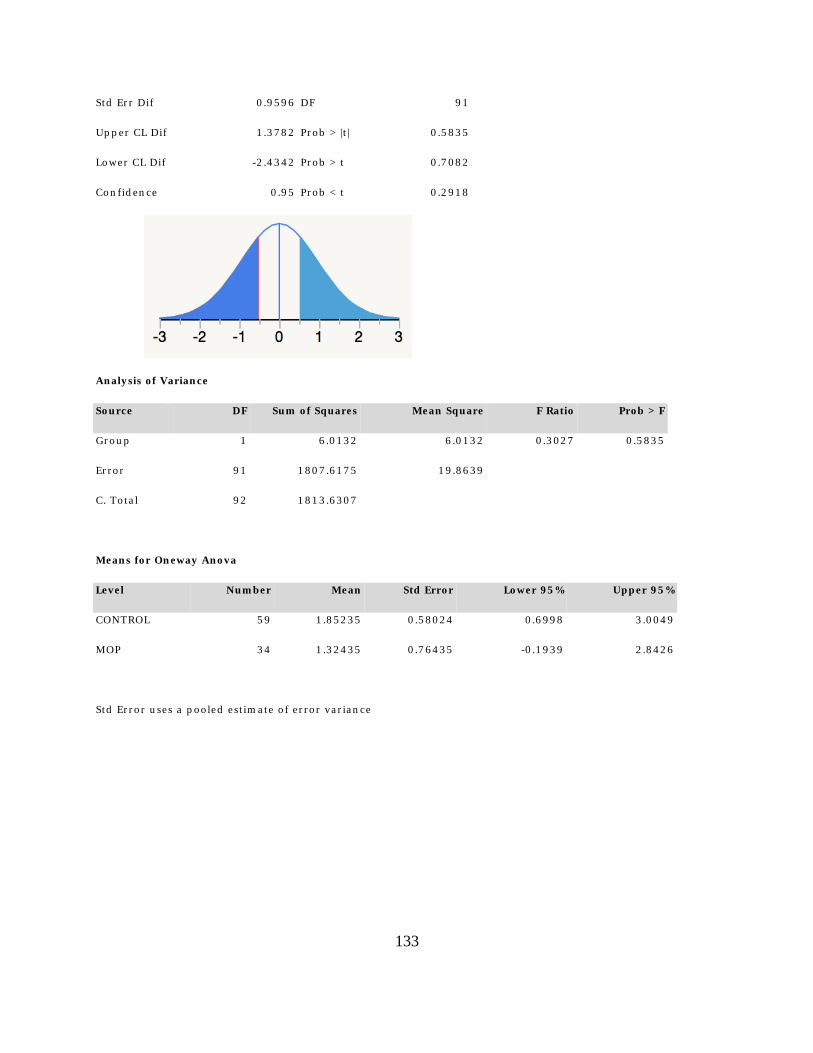
133
Std Er r Dif 0 .9 5 9 6 DF 9 1
Up p e r CL Dif 1 .3 7 8 2 Pr o b > |t | 0 .5 8 3 5
Lo wer CL Dif -2 .4 3 4 2 Pr o b > t 0 .7 0 8 2
Co n fid en ce 0 .9 5 Pr o b < t 0 .2 9 1 8
An aly sis o f Varian ce
So u rce DF Su m o f Squares Mean Square F Ratio Pro b > F
Gr o u p 1 6 .0 1 3 2 6 .0 1 3 2 0 .3 0 2 7 0 .5 8 3 5
Er r o r 9 1 1 8 0 7 .6 1 7 5 1 9 .8 6 3 9
C. To t a l 9 2 1 8 1 3 .6 3 0 7
Mean s fo r On eway An o va
Leve l Nu m ber Mean Std Erro r Lo wer 9 5 % Up p er 9 5 %
CONTROL 5 9 1 .8 5 2 3 5 0 .5 8 0 2 4 0 .6 9 9 8 3 .0 0 4 9
MOP 3 4 1 .3 2 4 3 5 0 .7 6 4 3 5 -0 .1 9 3 9 2 .8 4 2 6
Std Er r o r u se s a p o o led e st im a te o f e r r o r va r ia n ce

134
On eway An aly sis o f Data By Gro u p param eter=Δx°, To o th =# 2 6
Missin g Ro ws 1 2
On eway An o va
Su m m ary o f Fit
Rsq u a r e 0 .0 0 5 6 6 5
Ad j Rsq u a r e -0 .0 0 5 2 6
Ro o t Mea n Sq u a r e Er r o r 3 .2 6 3 9 5
Mea n o f Resp o n se 1 .3 3 2 2 8 8
Ob se r va t io n s (o r Su m Wgt s) 9 3
t Test
MOP-CONTROL
Assu m in g eq u a l va r ia n ces
Diffe r en ce 0 .5 0 6 0 t Ra t io 0 .7 2 0 0 0 8
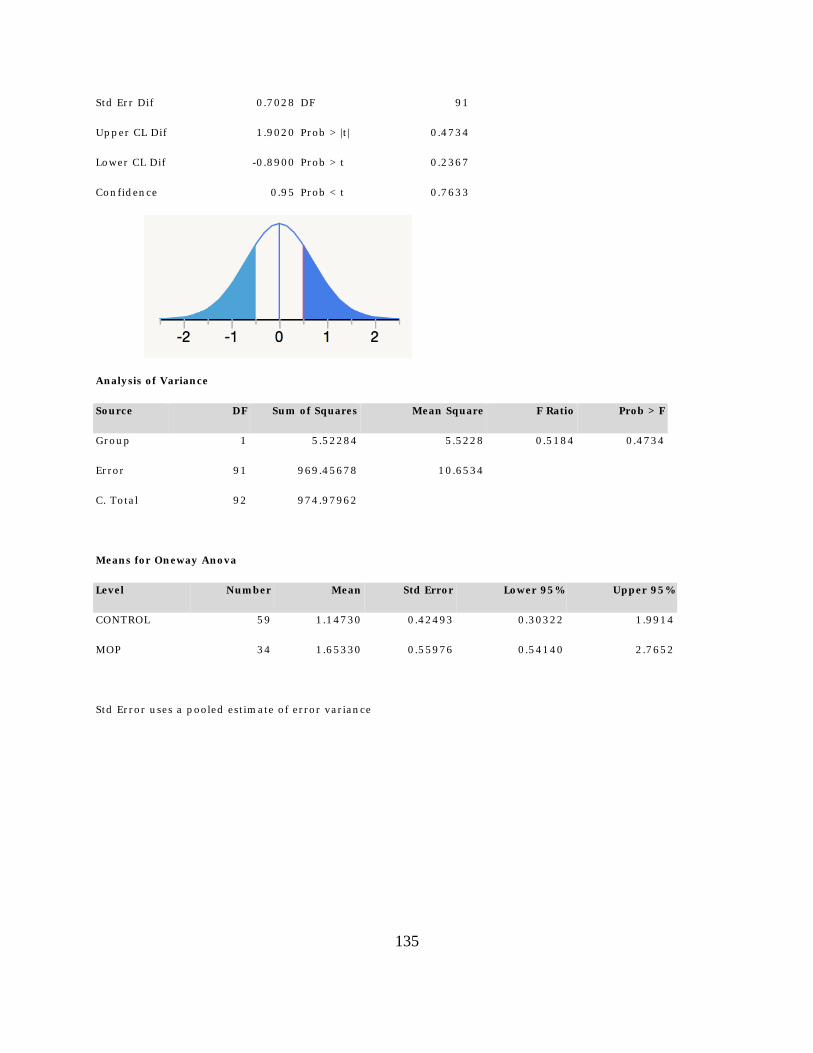
135
Std Er r Dif 0 .7 0 2 8 DF 9 1
Up p e r CL Dif 1 .9 0 2 0 Pr o b > |t | 0 .4 7 3 4
Lo wer CL Dif -0 .8 9 0 0 Pr o b > t 0 .2 3 6 7
Co n fid en ce 0 .9 5 Pr o b < t 0 .7 6 3 3
An aly sis o f Varian ce
So u rce DF Su m o f Squares Mean Square F Ratio Pro b > F
Gr o u p 1 5 .5 2 2 8 4 5 .5 2 2 8 0 .5 1 8 4 0 .4 7 3 4
Er r o r 9 1 9 6 9 .4 5 6 7 8 1 0 .6 5 3 4
C. To t a l 9 2 9 7 4 .9 7 9 6 2
Mean s fo r On eway An o va
Leve l Nu m ber Mean Std Erro r Lo wer 9 5 % Up p er 9 5 %
CONTROL 5 9 1 .1 4 7 3 0 0 .4 2 4 9 3 0 .3 0 3 2 2 1 .9 9 1 4
MOP 3 4 1 .6 5 3 3 0 0 .5 5 9 7 6 0 .5 4 1 4 0 2 .7 6 5 2
Std Er r o r u se s a p o o led e st im a te o f e r r o r va r ia n ce

136
On eway An aly sis o f Data By Gro u p param eter= Δx°, To o th =# 2 7
Missin g Ro ws 1 5
On eway An o va
Su m m ary o f Fit
Rsq u a r e 0 .0 0 6 9 7 1
Ad j Rsq u a r e -0 .0 0 4 3 1
Ro o t Mea n Sq u a r e Er r o r 3 .2 9 2 6 6
Mea n o f Resp o n se 1 .7 6 7 9 2
Ob se r va t io n s (o r Su m Wgt s) 9 0
t Test
MOP-CONTROL
Assu m in g eq u a l va r ia n ces
Diffe r en ce -0 .5 7 4 1 t Ra t io -0 .7 8 5 9 6

137
Std Er r Dif 0 .7 3 0 4 DF 8 8
Up p e r CL Dif 0 .8 7 7 5 Pr o b > |t | 0 .4 3 4 0
Lo wer CL Dif -2 .0 2 5 6 Pr o b > t 0 .7 8 3 0
Co n fid en ce 0 .9 5 Pr o b < t 0 .2 1 7 0
An aly sis o f Varian ce
So u rce DF Su m o f Squares Mean Square F Ratio Pro b > F
Gr o u p 1 6 .6 9 7 1 6 6 .6 9 7 2 0 .6 1 7 7 0 .4 3 4 0
Er r o r 8 8 9 5 4 .0 6 1 4 3 1 0 .8 4 1 6
C. To t a l 8 9 9 6 0 .7 5 8 5 9
Mean s fo r On eway An o va
Leve l Nu m ber Mean Std Erro r Lo wer 9 5 % Up p er 9 5 %
CONTROL 5 9 1 .9 6 5 6 5 0 .4 2 8 6 7 1 .1 1 3 8 2 .8 1 7 5
MOP 3 1 1 .3 9 1 5 9 0 .5 9 1 3 8 0 .2 1 6 3 2 .5 6 6 8
Std Er r o r u se s a p o o led e st im a te o f e r r o r va r ia n ce

138
On eway An aly sis o f Data By Gro u p param eter= Δx°, To o th =# 6
Missin g Ro ws 4
On eway An o va
Su m m ary o f Fit
Rsq u a r e 0 .0 1 9 1 0 9
Ad j Rsq u a r e 0 .0 0 9 2 0 1
Ro o t Mea n Sq u a r e Er r o r 1 .7 9 8 8 2 7
Mea n o f Resp o n se 1 .3 8 7 5 1 4
Ob se r va t io n s (o r Su m Wgt s) 1 0 1
t Test
MOP-CONTROL
Assu m in g eq u a l va r ia n ces
Diffe r en ce -0 .5 0 2 7 t Ra t io -1 .3 8 8 7 5

139
Std Er r Dif 0 .3 6 2 0 DF 9 9
Up p e r CL Dif 0 .2 1 5 6 Pr o b > |t | 0 .1 6 8 0
Lo wer CL Dif -1 .2 2 1 0 Pr o b > t 0 .9 1 6 0
Co n fid en ce 0 .9 5 Pr o b < t 0 .0 8 4 0
An aly sis o f Varian ce
So u rce DF Su m o f Squares Mean Square F Ratio Pro b > F
Gr o u p 1 6 .2 4 0 5 8 6 .2 4 0 5 8 1 .9 2 8 6 0 .1 6 8 0
Er r o r 9 9 3 2 0 .3 4 2 1 4 3 .2 3 5 7 8
C. To t a l 1 0 0 3 2 6 .5 8 2 7 2
Mean s fo r On eway An o va
Leve l Nu m ber Mean Std Erro r Lo wer 9 5 % Up p er 9 5 %
CONTROL 5 8 1 .6 0 1 5 4 0 .2 3 6 2 0 1 .1 3 2 9 2 .0 7 0 2
MOP 4 3 1 .0 9 8 8 2 0 .2 7 4 3 2 0 .5 5 4 5 1 .6 4 3 1
Std Er r o r u se s a p o o led e st im a te o f e r r o r va r ia n ce

140
On eway An aly sis o f Data By Gro u p param eter= Δx°, To o th =# 7
Missin g Ro ws 7
On eway An o va
Su m m ary o f Fit
Rsq u a r e 0 .0 0 8 5 2
Ad j Rsq u a r e -0 .0 0 1 8 1
Ro o t Mea n Sq u a r e Er r o r 2 .8 5 9 6 2 5
Mea n o f Resp o n se 1 .7 1 3 5 3 6
Ob se r va t io n s (o r Su m Wgt s) 9 8
t Test
MOP-CONTROL
Assu m in g eq u a l va r ia n ces
Diffe r en ce -0 .5 3 1 9 t Ra t io -0 .9 0 8 2 8

141
Std Er r Dif 0 .5 8 5 6 DF 9 6
Up p e r CL Dif 0 .6 3 0 5 Pr o b > |t | 0 .3 6 6 0
Lo wer CL Dif -1 .6 9 4 3 Pr o b > t 0 .8 1 7 0
Co n fid en ce 0 .9 5 Pr o b < t 0 .1 8 3 0
An aly sis o f Varian ce
So u rce DF Su m o f Squares Mean Square F Ratio Pro b > F
Gr o u p 1 6 .7 4 6 1 7 6 .7 4 6 1 7 0 .8 2 5 0 0 .3 6 6 0
Er r o r 9 6 7 8 5 .0 3 5 8 7 8 .1 7 7 4 6
C. To t a l 9 7 7 9 1 .7 8 2 0 3
Mean s fo r On eway An o va
Leve l Nu m ber Mean Std Erro r Lo wer 9 5 % Up p er 9 5 %
CONTROL 5 7 1 .9 3 6 0 6 0 .3 7 8 7 7 1 .1 8 4 2 2 .6 8 7 9
MOP 4 1 1 .4 0 4 1 8 0 .4 4 6 6 0 0 .5 1 7 7 2 .2 9 0 7
Std Er r o r u se s a p o o led e st im a te o f e r r o r va r ia n ce

142
On eway An aly sis o f Data By Gro u p param eter= Δx°, To o th =# 8
Missin g Ro ws 6
On eway An o va
Su m m ary o f Fit
Rsq u a r e 0 .0 1 8 6 8 4
Ad j Rsq u a r e 0 .0 0 8 5 6 7
Ro o t Mea n Sq u a r e Er r o r 3 .7 8 2 2 1 4
Mea n o f Resp o n se 1 .9 2 9 7 2 3
Ob se r va t io n s (o r Su m Wgt s) 9 9
t Test
MOP-CONTROL
Assu m in g eq u a l va r ia n ces
Diffe r en ce 1 .0 4 5 2 t Ra t io 1 .3 5 8 9 7 9

143
Std Er r Dif 0 .7 6 9 1 DF 9 7
Up p e r CL Dif 2 .5 7 1 8 Pr o b > |t | 0 .1 7 7 3
Lo wer CL Dif -0 .4 8 1 3 Pr o b > t 0 .0 8 8 7
Co n fid en ce 0 .9 5 Pr o b < t 0 .9 1 1 3
An aly sis o f Varian ce
So u rce DF Su m o f Squares Mean Square F Ratio Pro b > F
Gr o u p 1 2 6 .4 1 9 1 2 6 .4 1 9 1 1 .8 4 6 8 0 .1 7 7 3
Er r o r 9 7 1 3 8 7 .5 9 8 9 1 4 .3 0 5 1
C. To t a l 9 8 1 4 1 4 .0 1 8 0
Mean s fo r On eway An o va
Leve l Nu m ber Mean Std Erro r Lo wer 9 5 % Up p er 9 5 %
CONTROL 5 7 1 .4 8 6 2 9 0 .5 0 0 9 7 0 .4 9 2 0 2 .4 8 0 6
MOP 4 2 2 .5 3 1 5 3 0 .5 8 3 6 1 1 .3 7 3 2 3 .6 8 9 8
Std Er r o r u se s a p o o led e st im a te o f e r r o r va r ia n ce

144
On eway An aly sis o f Data By Gro u p param eter= Δx°, To o th =# 9
Missin g Ro ws 7
On eway An o va
Su m m ary o f Fit
Rsq u a r e 0 .0 0 0 2 5
Ad j Rsq u a r e -0 .0 1 0 1 6
Ro o t Mea n Sq u a r e Er r o r 6 .5 1 6 3 1 6
Mea n o f Resp o n se 2 .3 0 3 4 8 2
Ob se r va t io n s (o r Su m Wgt s) 9 8
t Test
MOP-CONTROL
Assu m in g eq u a l va r ia n ces
Diffe r en ce -0 .2 0 6 1 t Ra t io -0 .1 5 4 9 7

145
Std Er r Dif 1 .3 3 0 1 DF 9 6
Up p e r CL Dif 2 .4 3 4 2 Pr o b > |t | 0 .8 7 7 2
Lo wer CL Dif -2 .8 4 6 4 Pr o b > t 0 .5 6 1 4
Co n fid en ce 0 .9 5 Pr o b < t 0 .4 3 8 6
An aly sis o f Varian ce
So u rce DF Su m o f Squares Mean Square F Ratio Pro b > F
Gr o u p 1 1 .0 1 9 8 1 .0 1 9 8 0 .0 2 4 0 0 .8 7 7 2
Er r o r 9 6 4 0 7 6 .3 8 8 5 4 2 .4 6 2 4
C. To t a l 9 7 4 0 7 7 .4 0 8 3
Mean s fo r On eway An o va
Leve l Nu m ber Mean Std Erro r Lo wer 9 5 % Up p er 9 5 %
CONTROL 5 6 2 .3 9 1 8 3 0 .8 7 0 8 0 .6 6 3 3 4 4 .1 2 0 3
MOP 4 2 2 .1 8 5 6 9 1 .0 0 5 5 0 .1 8 9 8 1 4 .1 8 1 6
Std Er r o r u se s a p o o led e st im a te o f e r r o r va r ia n ce

146
On eway An aly sis o f Data By Gro u p param eter= Δy °, To o th =# 1 0
Missin g Ro ws 7
On eway An o va
Su m m ary o f Fit
Rsq u a r e 0 .0 0 2 1 6 2
Ad j Rsq u a r e -0 .0 0 8 2 3
Ro o t Mea n Sq u a r e Er r o r 7 .9 2 6 3 5 1
Mea n o f Resp o n se 2 .0 9 5 0 8 2
Ob se r va t io n s (o r Su m Wgt s) 9 8
t Test
MOP-CONTROL
Assu m in g eq u a l va r ia n ces
Diffe r en ce -0 .7 4 0 3 t Ra t io -0 .4 5 6 0 9

147
Std Er r Dif 1 .6 2 3 1 DF 9 6
Up p e r CL Dif 2 .4 8 1 6 Pr o b > |t | 0 .6 4 9 4
Lo wer CL Dif -3 .9 6 2 2 Pr o b > t 0 .6 7 5 3
Co n fid en ce 0 .9 5 Pr o b < t 0 .3 2 4 7
An aly sis o f Varian ce
So u rce DF Su m o f Squares Mean Square F Ratio Pro b > F
Gr o u p 1 1 3 .0 6 9 2 1 3 .0 6 9 2 0 .2 0 8 0 0 .6 4 9 4
Er r o r 9 6 6 0 3 1 .3 9 5 6 6 2 .8 2 7 0
C. To t a l 9 7 6 0 4 4 .4 6 4 8
Mean s fo r On eway An o va
Leve l Nu m ber Mean Std Erro r Lo wer 9 5 % Up p er 9 5 %
CONTROL 5 7 2 .4 0 4 8 0 1 .0 4 9 9 0 .3 2 0 8 4 .4 8 8 8
MOP 4 1 1 .6 6 4 5 0 1 .2 3 7 9 -0 .7 9 2 7 4 .1 2 1 7
Std Er r o r u se s a p o o led e st im a te o f e r r o r va r ia n ce
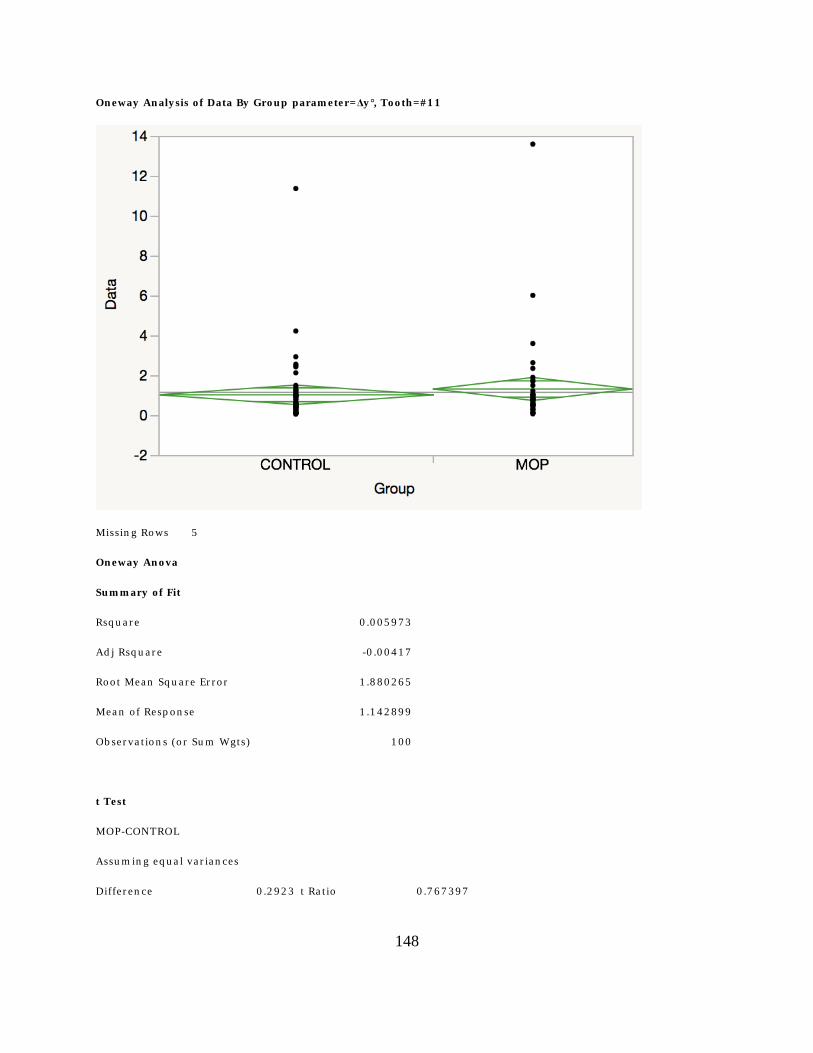
148
On eway An aly sis o f Data By Gro u p param eter=Δy °, To o th =# 1 1
Missin g Ro ws 5
On eway An o va
Su m m ary o f Fit
Rsq u a r e 0 .0 0 5 9 7 3
Ad j Rsq u a r e -0 .0 0 4 1 7
Ro o t Mea n Sq u a r e Er r o r 1 .8 8 0 2 6 5
Mea n o f Resp o n se 1 .1 4 2 8 9 9
Ob se r va t io n s (o r Su m Wgt s) 1 0 0
t Test
MOP-CONTROL
Assu m in g eq u a l va r ia n ces
Diffe r en ce 0 .2 9 2 3 t Ra t io 0 .7 6 7 3 9 7

149
Std Er r Dif 0 .3 8 1 0 DF 9 8
Up p e r CL Dif 1 .0 4 8 4 Pr o b > |t | 0 .4 4 4 7
Lo wer CL Dif -0 .4 6 3 7 Pr o b > t 0 .2 2 2 3
Co n fid en ce 0 .9 5 Pr o b < t 0 .7 7 7 7
An aly sis o f Varian ce
So u rce DF Su m o f Squares Mean Square F Ratio Pro b > F
Gr o u p 1 2 .0 8 1 9 9 2 .0 8 1 9 9 0 .5 8 8 9 0 .4 4 4 7
Er r o r 9 8 3 4 6 .4 6 8 7 9 3 .5 3 5 4 0
C. To t a l 9 9 3 4 8 .5 5 0 7 8
Mean s fo r On eway An o va
Leve l Nu m ber Mean Std Erro r Lo wer 9 5 % Up p er 9 5 %
CONTROL 5 8 1 .0 2 0 1 1 0 .2 4 6 8 9 0 .5 3 0 1 7 1 .5 1 0 1
MOP 4 2 1 .3 1 2 4 6 0 .2 9 0 1 3 0 .7 3 6 7 0 1 .8 8 8 2
Std Er r o r u se s a p o o led e st im a te o f e r r o r va r ia n ce

150
On eway An aly sis o f Data By Gro u p param eter= Δy °, To o th =# 2 2
Missin g Ro ws 1 3
On eway An o va
Su m m ary o f Fit
Rsq u a r e 0 .0 2 3 4 0 7
Ad j Rsq u a r e 0 .0 1 2 5 5 6
Ro o t Mea n Sq u a r e Er r o r 5 .1 1 8 0 6 9
Mea n o f Resp o n se 2 .2 2 6
Ob se r va t io n s (o r Su m Wgt s) 9 2
t Test
MOP-CONTROL
Assu m in g eq u a l va r ia n ces
Diffe r en ce -1 .6 2 3 6 t Ra t io -1 .4 6 8 7

151
Std Er r Dif 1 .1 0 5 5 DF 9 0
Up p e r CL Dif 0 .5 7 2 6 Pr o b > |t | 0 .1 4 5 4
Lo wer CL Dif -3 .8 1 9 8 Pr o b > t 0 .9 2 7 3
Co n fid en ce 0 .9 5 Pr o b < t 0 .0 7 2 7
An aly sis o f Varian ce
So u rce DF Su m o f Squares Mean Square F Ratio Pro b > F
Gr o u p 1 5 6 .5 0 3 9 5 6 .5 0 3 9 2 .1 5 7 1 0 .1 4 5 4
Er r o r 9 0 2 3 5 7 .5 1 6 3 2 6 .1 9 4 6
C. To t a l 9 1 2 4 1 4 .0 2 0 2
Mean s fo r On eway An o va
Leve l Nu m ber Mean Std Erro r Lo wer 9 5 % Up p er 9 5 %
CONTROL 5 8 2 .8 2 6 0 3 0 .6 7 2 0 4 1 .4 9 1 4 .1 6 1 1
MOP 3 4 1 .2 0 2 4 2 0 .8 7 7 7 4 -0 .5 4 1 2 .9 4 6 2
Std Er r o r u se s a p o o led e st im a te o f e r r o r va r ia n ce

152
On eway An aly sis o f Data By Gro u p param eter= Δy °, To o th =# 2 3
Missin g Ro ws 1 4
On eway An o va
Su m m ary o f Fit
Rsq u a r e 0 .0 0 1 4 7 4
Ad j Rsq u a r e -0 .0 0 9 7 5
Ro o t Mea n Sq u a r e Er r o r 1 .3 7 7 7 9 7
Mea n o f Resp o n se 1 .0 0 5 6 4 5
Ob se r va t io n s (o r Su m Wgt s) 9 1
t Test
MOP-CONTROL
Assu m in g eq u a l va r ia n ces
Diffe r en ce -0 .1 0 8 2 2 t Ra t io -0 .3 6 2 4 7

153
Std Er r Dif 0 .2 9 8 5 6 DF 8 9
Up p e r CL Dif 0 .4 8 5 0 1 Pr o b > |t | 0 .7 1 7 9
Lo wer CL Dif -0 .7 0 1 4 5 Pr o b > t 0 .6 4 1 1
Co n fid en ce 0 .9 5 Pr o b < t 0 .3 5 8 9
An aly sis o f Varian ce
So u rce DF Su m o f Squares Mean Square F Ratio Pro b > F
Gr o u p 1 0 .2 4 9 4 1 0 .2 4 9 4 1 0 .1 3 1 4 0 .7 1 7 9
Er r o r 8 9 1 6 8 .9 5 0 9 3 1 .8 9 8 3 3
C. To t a l 9 0 1 6 9 .2 0 0 3 4
Mean s fo r On eway An o va
Leve l Nu m ber Mean Std Erro r Lo wer 9 5 % Up p er 9 5 %
CONTROL 5 7 1 .0 4 6 0 8 0 .1 8 2 4 9 0 .6 8 3 4 7 1 .4 0 8 7
MOP 3 4 0 .9 3 7 8 6 0 .2 3 6 2 9 0 .4 6 8 3 6 1 .4 0 7 4
Std Er r o r u se s a p o o led e st im a te o f e r r o r va r ia n ce

154
On eway An aly sis o f Data By Gro u p param eter= Δy °, To o th =# 2 4
Missin g Ro ws 1 3
On eway An o va
Su m m ary o f Fit
Rsq u a r e 0 .0 1 5 1 3 1
Ad j Rsq u a r e 0 .0 0 4 1 8 8
Ro o t Mea n Sq u a r e Er r o r 1 .9 5 1 7 6 1
Mea n o f Resp o n se 1 .1 8 6 0 6 8
Ob se r va t io n s (o r Su m Wgt s) 9 2
t Test
MOP-CONTROL
Assu m in g eq u a l va r ia n ces
Diffe r en ce 0 .4 9 8 9 t Ra t io 1 .1 7 5 8 8 1

155
Std Er r Dif 0 .4 2 4 3 DF 9 0
Up p e r CL Dif 1 .3 4 1 8 Pr o b > |t | 0 .2 4 2 7
Lo wer CL Dif -0 .3 4 4 0 Pr o b > t 0 .1 2 1 4
Co n fid en ce 0 .9 5 Pr o b < t 0 .8 7 8 6
An aly sis o f Varian ce
So u rce DF Su m o f Squares Mean Square F Ratio Pro b > F
Gr o u p 1 5 .2 6 7 2 1 5 .2 6 7 2 1 1 .3 8 2 7 0 .2 4 2 7
Er r o r 9 0 3 4 2 .8 4 3 3 2 3 .8 0 9 3 7
C. To t a l 9 1 3 4 8 .1 1 0 5 3
Mean s fo r On eway An o va
Leve l Nu m ber Mean Std Erro r Lo wer 9 5 % Up p er 9 5 %
CONTROL 5 9 1 .0 0 7 1 2 0 .2 5 4 1 0 0 .5 0 2 3 1 1 .5 1 1 9
MOP 3 3 1 .5 0 6 0 1 0 .3 3 9 7 6 0 .8 3 1 0 2 2 .1 8 1 0
Std Er r o r u se s a p o o led e st im a te o f e r r o r va r ia n ce

156
On eway An aly sis o f Data By Gro u p param eter= Δy °, To o th =# 2 5
Missin g Ro ws 1 2
On eway An o va
Su m m ary o f Fit
Rsq u a r e 0 .0 1 1 3 4 5
Ad j Rsq u a r e 0 .0 0 0 4 8 1
Ro o t Mea n Sq u a r e Er r o r 2 .7 7 3 6 1 8
Mea n o f Resp o n se 1 .4 6 3 7 1 3
Ob se r va t io n s (o r Su m Wgt s) 9 3
t Test
MOP-CONTROL
Assu m in g eq u a l va r ia n ces
Diffe r en ce 0 .6 1 0 3 t Ra t io 1 .0 2 1 8 8 6

157
Std Er r Dif 0 .5 9 7 2 DF 9 1
Up p e r CL Dif 1 .7 9 6 5 Pr o b > |t | 0 .3 0 9 5
Lo wer CL Dif -0 .5 7 6 0 Pr o b > t 0 .1 5 4 8
Co n fid en ce 0 .9 5 Pr o b < t 0 .8 4 5 2
An aly sis o f Varian ce
So u rce DF Su m o f Squares Mean Square F Ratio Pro b > F
Gr o u p 1 8 .0 3 3 3 8 8 .0 3 3 3 8 1 .0 4 4 3 0 .3 0 9 5
Er r o r 9 1 7 0 0 .0 5 8 9 2 7 .6 9 2 9 6
C. To t a l 9 2 7 0 8 .0 9 2 3 0
Mean s fo r On eway An o va
Leve l Nu m ber Mean Std Erro r Lo wer 9 5 % Up p er 9 5 %
CONTROL 5 9 1 .2 4 0 6 0 0 .3 6 1 0 9 0 .5 2 3 3 3 1 .9 5 7 9
MOP 3 4 1 .8 5 0 8 8 0 .4 7 5 6 7 0 .9 0 6 0 1 2 .7 9 5 7
Std Er r o r u se s a p o o led e st im a te o f e r r o r va r ia n ce

158
On eway An aly sis o f Data By Gro u p param eter= Δy °, To o th =# 2 6
Missin g Ro ws 1 2
On eway An o va
Su m m ary o f Fit
Rsq u a r e 0 .0 0 8 3 1 9
Ad j Rsq u a r e -0 .0 0 2 5 8
Ro o t Mea n Sq u a r e Er r o r 1 .9 4 2 7 8 9
Mea n o f Resp o n se 1 .2 1 3 4 9 5
Ob se r va t io n s (o r Su m Wgt s) 9 3
t Test
MOP-CONTROL
Assu m in g eq u a l va r ia n ces
Diffe r en ce 0 .3 6 5 5 t Ra t io 0 .8 7 3 7 1 4

159
Std Er r Dif 0 .4 1 8 3 DF 9 1
Up p e r CL Dif 1 .1 9 6 4 Pr o b > |t | 0 .3 8 4 6
Lo wer CL Dif -0 .4 6 5 4 Pr o b > t 0 .1 9 2 3
Co n fid en ce 0 .9 5 Pr o b < t 0 .8 0 7 7
An aly sis o f Varian ce
So u rce DF Su m o f Squares Mean Square F Ratio Pro b > F
Gr o u p 1 2 .8 8 1 3 1 2 .8 8 1 3 1 0 .7 6 3 4 0 .3 8 4 6
Er r o r 9 1 3 4 3 .4 7 3 1 8 3 .7 7 4 4 3
C. To t a l 9 2 3 4 6 .3 5 4 4 9
Mean s fo r On eway An o va
Leve l Nu m ber Mean Std Erro r Lo wer 9 5 % Up p er 9 5 %
CONTROL 5 9 1 .0 7 9 8 8 0 .2 5 2 9 3 0 .5 7 7 4 6 1 .5 8 2 3
MOP 3 4 1 .4 4 5 3 6 0 .3 3 3 1 9 0 .7 8 3 5 3 2 .1 0 7 2
Std Er r o r u se s a p o o led e st im a te o f e r r o r va r ia n ce

160
On eway An aly sis o f Data By Gro u p param eter= Δy °, To o th =# 2 7
Missin g Ro ws 1 4
On eway An o va
Su m m ary o f Fit
Rsq u a r e 0 .0 6 0 3 7 9
Ad j Rsq u a r e 0 .0 4 9 8 2 2
Ro o t Mea n Sq u a r e Er r o r 1 .3 4 0 9 9 8
Mea n o f Resp o n se 1 .1 3 1 9 8 8
Ob se r va t io n s (o r Su m Wgt s) 9 1
t Test
MOP-CONTROL
Assu m in g eq u a l va r ia n ces
Diffe r en ce 0 .7 0 4 0 6 t Ra t io 2 .3 9 1 4 5 9

161
Std Er r Dif 0 .2 9 4 4 1 DF 8 9
Up p e r CL Dif 1 .2 8 9 0 4 Pr o b > |t | 0 .0 1 8 9 *
Lo wer CL Dif 0 .1 1 9 0 8 Pr o b > t 0 .0 0 9 4 *
Co n fid en ce 0 .9 5 Pr o b < t 0 .9 9 0 6
An aly sis o f Varian ce
So u rce DF Su m o f Squares Mean Square F Ratio Pro b > F
Gr o u p 1 1 0 .2 8 4 4 7 1 0 .2 8 4 5 5 .7 1 9 1 0 .0 1 8 9 *
Er r o r 8 9 1 6 0 .0 4 6 5 0 1 .7 9 8 3
C. To t a l 9 0 1 7 0 .3 3 0 9 7
Mean s fo r On eway An o va
Leve l Nu m ber Mean Std Erro r Lo wer 9 5 % Up p er 9 5 %
CONTROL 5 9 0 .8 8 4 4 1 0 .1 7 4 5 8 0 .5 3 7 5 1 .2 3 1 3
MOP 3 2 1 .5 8 8 4 7 0 .2 3 7 0 6 1 .1 1 7 4 2 .0 5 9 5
Std Er r o r u se s a p o o led e st im a te o f e r r o r va r ia n ce
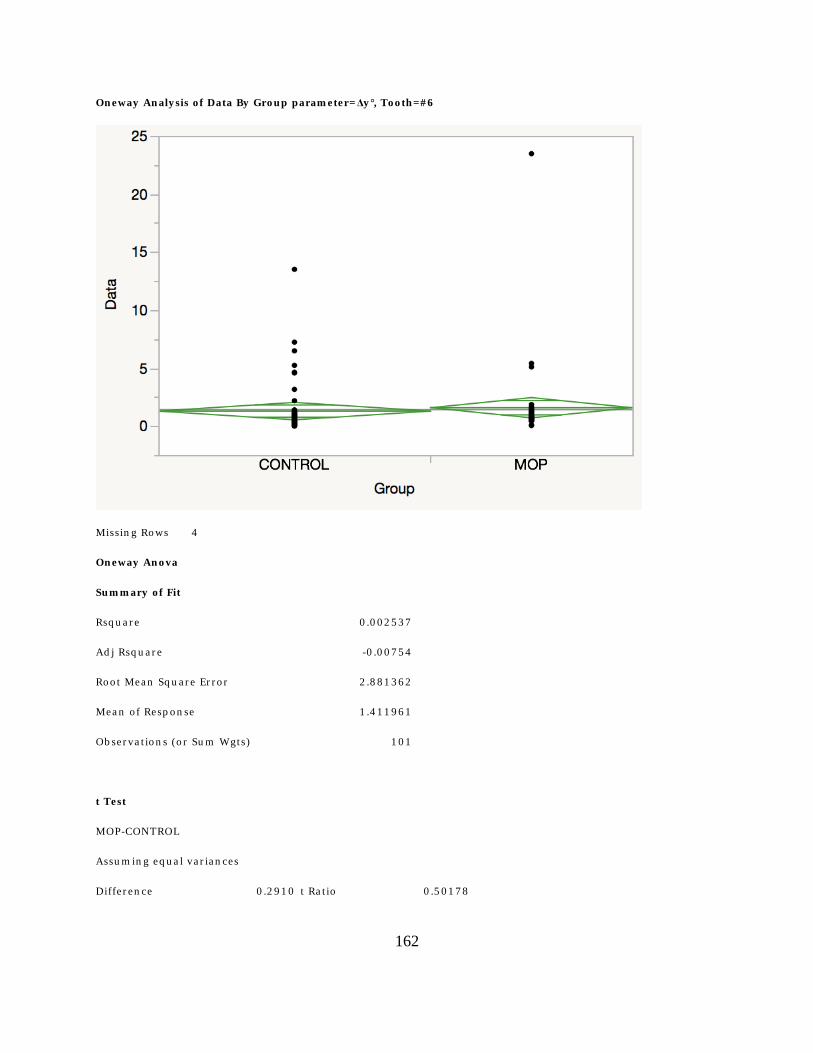
162
On eway An aly sis o f Data By Gro u p param eter= Δy °, To o th =# 6
Missin g Ro ws 4
On eway An o va
Su m m ary o f Fit
Rsq u a r e 0 .0 0 2 5 3 7
Ad j Rsq u a r e -0 .0 0 7 5 4
Ro o t Mea n Sq u a r e Er r o r 2 .8 8 1 3 6 2
Mea n o f Resp o n se 1 .4 1 1 9 6 1
Ob se r va t io n s (o r Su m Wgt s) 1 0 1
t Test
MOP-CONTROL
Assu m in g eq u a l va r ia n ces
Diffe r en ce 0 .2 9 1 0 t Ra t io 0 .5 0 1 7 8

163
Std Er r Dif 0 .5 7 9 8 DF 9 9
Up p e r CL Dif 1 .4 4 1 5 Pr o b > |t | 0 .6 1 6 9
Lo wer CL Dif -0 .8 5 9 6 Pr o b > t 0 .3 0 8 5
Co n fid en ce 0 .9 5 Pr o b < t 0 .6 9 1 5
An aly sis o f Varian ce
So u rce DF Su m o f Squares Mean Square F Ratio Pro b > F
Gr o u p 1 2 .0 9 0 3 7 2 .0 9 0 3 7 0 .2 5 1 8 0 .6 1 6 9
Er r o r 9 9 8 2 1 .9 2 2 4 1 8 .3 0 2 2 5
C. To t a l 1 0 0 8 2 4 .0 1 2 7 8
Mean s fo r On eway An o va
Leve l Nu m ber Mean Std Erro r Lo wer 9 5 % Up p er 9 5 %
CONTROL 5 8 1 .2 8 8 0 9 0 .3 7 8 3 4 0 .5 3 7 3 8 2 .0 3 8 8
MOP 4 3 1 .5 7 9 0 4 0 .4 3 9 4 0 0 .7 0 7 1 7 2 .4 5 0 9
Std Er r o r u se s a p o o led e st im a te o f e r r o r va r ia n ce

164
On eway An aly sis o f Data By Gro u p param eter= Δy °, To o th =# 7
Missin g Ro ws 7
On eway An o va
Su m m ary o f Fit
Rsq u a r e 0 .0 0 3 5 0 9
Ad j Rsq u a r e -0 .0 0 6 8 7
Ro o t Mea n Sq u a r e Er r o r 5 .0 5 4 2 3 6
Mea n o f Resp o n se 1 .8 2 1 6 6
Ob se r va t io n s (o r Su m Wgt s) 9 8
t Test
MOP-CONTROL
Assu m in g eq u a l va r ia n ces
Diffe r en ce -0 .6 0 1 8 t Ra t io -0 .5 8 1 4 4

165
Std Er r Dif 1 .0 3 5 0 DF 9 6
Up p e r CL Dif 1 .4 5 2 7 Pr o b > |t | 0 .5 6 2 3
Lo wer CL Dif -2 .6 5 6 2 Pr o b > t 0 .7 1 8 8
Co n fid en ce 0 .9 5 Pr o b < t 0 .2 8 1 2
An aly sis o f Varian ce
So u rce DF Su m o f Squares Mean Square F Ratio Pro b > F
Gr o u p 1 8 .6 3 6 1 8 .6 3 6 1 0 .3 3 8 1 0 .5 6 2 3
Er r o r 9 6 2 4 5 2 .3 4 9 3 2 5 .5 4 5 3
C. To t a l 9 7 2 4 6 0 .9 8 5 4
Mean s fo r On eway An o va
Leve l Nu m ber Mean Std Erro r Lo wer 9 5 % Up p er 9 5 %
CONTROL 5 7 2 .0 7 3 4 3 0 .6 6 9 4 5 0 .7 4 4 6 3 .4 0 2 3
MOP 4 1 1 .4 7 1 6 4 0 .7 8 9 3 4 -0 .0 9 5 2 3 .0 3 8 5
Std Er r o r u se s a p o o led e st im a te o f e r r o r va r ia n ce

166
On eway An aly sis o f Data By Gro u p param eter= Δy °, To o th =# 8
Missin g Ro ws 5
On eway An o va
Su m m ary o f Fit
Rsq u a r e 0 .0 0 8 0 1 4
Ad j Rsq u a r e -0 .0 0 2 1 1
Ro o t Mea n Sq u a r e Er r o r 1 1 .2 4 5 9 8
Mea n o f Resp o n se 3 .0 6 3 4 8 9
Ob se r va t io n s (o r Su m Wgt s) 1 0 0
t Test
MOP-CONTROL
Assu m in g eq u a l va r ia n ces
Diffe r en ce -2 .0 2 1 2 t Ra t io -0 .8 8 9 7 6

167
Std Er r Dif 2 .2 7 1 6 DF 9 8
Up p e r CL Dif 2 .4 8 6 7 Pr o b > |t | 0 .3 7 5 8
Lo wer CL Dif -6 .5 2 9 0 Pr o b > t 0 .8 1 2 1
Co n fid en ce 0 .9 5 Pr o b < t 0 .1 8 7 9
An aly sis o f Varian ce
So u rce DF Su m o f Squares Mean Square F Ratio Pro b > F
Gr o u p 1 1 0 0 .1 2 5 1 0 0 .1 2 5 0 .7 9 1 7 0 .3 7 5 8
Er r o r 9 8 1 2 3 9 4 .2 5 8 1 2 6 .4 7 2
C. To t a l 9 9 1 2 4 9 4 .3 8 3
Mean s fo r On eway An o va
Leve l Nu m ber Mean Std Erro r Lo wer 9 5 % Up p er 9 5 %
CONTROL 5 7 3 .9 3 2 5 8 1 .4 8 9 6 0 .9 7 7 6 .8 8 8 6
MOP 4 3 1 .9 1 1 4 3 1 .7 1 5 0 -1 .4 9 2 5 .3 1 4 8
Std Er r o r u se s a p o o led e st im a te o f e r r o r va r ia n ce

168
On eway An aly sis o f Data By Gro u p param eter=Δy °, To o th =# 9
Missin g Ro ws 5
On eway An o va
Su m m ary o f Fit
Rsq u a r e 0 .0 0 0 8 3 7
Ad j Rsq u a r e -0 .0 0 9 3 6
Ro o t Mea n Sq u a r e Er r o r 2 .1 4 4 9 3 2
Mea n o f Resp o n se 1 .3 4 1 9 8 8
Ob se r va t io n s (o r Su m Wgt s) 1 0 0
t Test
MOP-CONTROL
Assu m in g eq u a l va r ia n ces
Diffe r en ce 0 .1 2 4 1 3 t Ra t io 0 .2 8 6 5 0 7

169
Std Er r Dif 0 .4 3 3 2 5 DF 9 8
Up p e r CL Dif 0 .9 8 3 9 1 Pr o b > |t | 0 .7 7 5 1
Lo wer CL Dif -0 .7 3 5 6 5 Pr o b > t 0 .3 8 7 5
Co n fid en ce 0 .9 5 Pr o b < t 0 .6 1 2 5
An aly sis o f Varian ce
So u rce DF Su m o f Squares Mean Square F Ratio Pro b > F
Gr o u p 1 0 .3 7 7 6 6 0 .3 7 7 6 6 0 .0 8 2 1 0 .7 7 5 1
Er r o r 9 8 4 5 0 .8 7 1 9 2 4 .6 0 0 7 3
C. To t a l 9 9 4 5 1 .2 4 9 5 8
Mean s fo r On eway An o va
Leve l Nu m ber Mean Std Erro r Lo wer 9 5 % Up p er 9 5 %
CONTROL 5 7 1 .2 8 8 6 1 0 .2 8 4 1 0 0 .7 2 4 8 2 1 .8 5 2 4
MOP 4 3 1 .4 1 2 7 4 0 .3 2 7 1 0 0 .7 6 3 6 2 2 .0 6 1 9
Std Er r o r u se s a p o o led e st im a te o f e r r o r va r ia n ce

170
On eway An aly sis o f Data By Gro u p param eter= Δz°, To o th =# 1 0
Missin g Ro ws 7
On eway An o va
Su m m ary o f Fit
Rsq u a r e 0 .0 0 4 0 1 6
Ad j Rsq u a r e -0 .0 0 6 3 6
Ro o t Mea n Sq u a r e Er r o r 1 .0 2 5 0 8 1
Mea n o f Resp o n se 0 .8 8 8 3 4 4
Ob se r va t io n s (o r Su m Wgt s) 9 8
t Test
MOP-CONTROL
Assu m in g eq u a l va r ia n ces
Diffe r en ce -0 .1 3 0 6 0 t Ra t io -0 .6 2 2 1 4

171
Std Er r Dif 0 .2 0 9 9 1 DF 9 6
Up p e r CL Dif 0 .2 8 6 0 8 Pr o b > |t | 0 .5 3 5 3
Lo wer CL Dif -0 .5 4 7 2 7 Pr o b > t 0 .7 3 2 3
Co n fid en ce 0 .9 5 Pr o b < t 0 .2 6 7 7
An aly sis o f Varian ce
So u rce DF Su m o f Squares Mean Square F Ratio Pro b > F
Gr o u p 1 0 .4 0 6 7 2 0 .4 0 6 7 2 0 .3 8 7 1 0 .5 3 5 3
Er r o r 9 6 1 0 0 .8 7 5 9 6 1 .0 5 0 7 9
C. To t a l 9 7 1 0 1 .2 8 2 6 8
Mean s fo r On eway An o va
Leve l Nu m ber Mean Std Erro r Lo wer 9 5 % Up p er 9 5 %
CONTROL 5 7 0 .9 4 2 9 8 1 0 .1 3 5 7 8 0 .6 7 3 4 7 1 .2 1 2 5
MOP 4 1 0 .8 1 2 3 8 5 0 .1 6 0 0 9 0 .4 9 4 6 1 1 .1 3 0 2
Std Er r o r u se s a p o o led e st im a te o f e r r o r va r ia n ce

172
On eway An aly sis o f Data By Gro u p param eter= Δz°, To o th =# 1 1
Missin g Ro ws 7
On eway An o va
Su m m ary o f Fit
Rsq u a r e 0 .0 0 2 7 2 3
Ad j Rsq u a r e -0 .0 0 7 6 7
Ro o t Mea n Sq u a r e Er r o r 1 .9 2 6 6 7 2
Mea n o f Resp o n se 1 .2 1 9 7 6 5
Ob se r va t io n s (o r Su m Wgt s) 9 8
t Test
MOP-CONTROL
Assu m in g eq u a l va r ia n ces
Diffe r en ce 0 .2 0 1 9 8 t Ra t io 0 .5 1 1 9 4 7

173
Std Er r Dif 0 .3 9 4 5 4 DF 9 6
Up p e r CL Dif 0 .9 8 5 1 4 Pr o b > |t | 0 .6 0 9 9
Lo wer CL Dif -0 .5 8 1 1 7 Pr o b > t 0 .3 0 4 9
Co n fid en ce 0 .9 5 Pr o b < t 0 .6 9 5 1
An aly sis o f Varian ce
So u rce DF Su m o f Squares Mean Square F Ratio Pro b > F
Gr o u p 1 0 .9 7 2 8 9 0 .9 7 2 8 9 0 .2 6 2 1 0 .6 0 9 9
Er r o r 9 6 3 5 6 .3 5 8 0 7 3 .7 1 2 0 6
C. To t a l 9 7 3 5 7 .3 3 0 9 6
Mean s fo r On eway An o va
Leve l Nu m ber Mean Std Erro r Lo wer 9 5 % Up p er 9 5 %
CONTROL 5 7 1 .1 3 5 2 6 0 .2 5 5 1 9 0 .6 2 8 7 1 1 .6 4 1 8
MOP 4 1 1 .3 3 7 2 5 0 .3 0 0 9 0 0 .7 3 9 9 7 1 .9 3 4 5
Std Er r o r u se s a p o o led e st im a te o f e r r o r va r ia n ce

174
On eway An aly sis o f Data By Gro u p param eter= Δz°, To o th =# 2 2
Missin g Ro ws 1 2
On eway An o va
Su m m ary o f Fit
Rsq u a r e 0 .0 0 5 4 6 2
Ad j Rsq u a r e -0 .0 0 5 4 7
Ro o t Mea n Sq u a r e Er r o r 6 .3 1 5 3 7 6
Mea n o f Resp o n se 1 .3 8 5 6 2 8
Ob se r va t io n s (o r Su m Wgt s) 9 3
t Test
MOP-CONTROL
Assu m in g eq u a l va r ia n ces
Diffe r en ce -0 .9 6 1 3 t Ra t io -0 .7 0 6 9 3

175
Std Er r Dif 1 .3 5 9 8 DF 9 1
Up p e r CL Dif 1 .7 3 9 8 Pr o b > |t | 0 .4 8 1 4
Lo wer CL Dif -3 .6 6 2 4 Pr o b > t 0 .7 5 9 3
Co n fid en ce 0 .9 5 Pr o b < t 0 .2 4 0 7
An aly sis o f Varian ce
So u rce DF Su m o f Squares Mean Square F Ratio Pro b > F
Gr o u p 1 1 9 .9 3 2 3 1 9 .9 3 2 3 0 .4 9 9 8 0 .4 8 1 4
Er r o r 9 1 3 6 2 9 .4 4 2 1 3 9 .8 8 4 0
C. To t a l 9 2 3 6 4 9 .3 7 4 4
Mean s fo r On eway An o va
Leve l Nu m ber Mean Std Erro r Lo wer 9 5 % Up p er 9 5 %
CONTROL 5 9 1 .7 3 7 0 7 0 .8 2 2 2 0 .1 0 4 3 .3 7 0 3
MOP 3 4 0 .7 7 5 7 8 1 .0 8 3 1 -1 .3 7 6 2 .9 2 7 2
Std Er r o r u se s a p o o led e st im a te o f e r r o r va r ia n ce

176
On eway An aly sis o f Data By Gro u p param eter= Δz°, To o th =# 2 3
Missin g Ro ws 1 4
On eway An o va
Su m m ary o f Fit
Rsq u a r e 0 .0 0 0 4 8 2
Ad j Rsq u a r e -0 .0 1 0 7 5
Ro o t Mea n Sq u a r e Er r o r 2 .0 3 1 8 0 1
Mea n o f Resp o n se 0 .9 6 4 7 8 2
Ob se r va t io n s (o r Su m Wgt s) 9 1
t Test
MOP-CONTROL
Assu m in g eq u a l va r ia n ces
Diffe r en ce 0 .0 9 1 7 4 t Ra t io 0 .2 0 7 0 7 3

177
Std Er r Dif 0 .4 4 3 0 3 DF 8 9
Up p e r CL Dif 0 .9 7 2 0 3 Pr o b > |t | 0 .8 3 6 4
Lo wer CL Dif -0 .7 8 8 5 5 Pr o b > t 0 .4 1 8 2
Co n fid en ce 0 .9 5 Pr o b < t 0 .5 8 1 8
An aly sis o f Varian ce
So u rce DF Su m o f Squares Mean Square F Ratio Pro b > F
Gr o u p 1 0 .1 7 7 0 2 0 .1 7 7 0 2 0 .0 4 2 9 0 .8 3 6 4
Er r o r 8 9 3 6 7 .4 1 1 2 4 4 .1 2 8 2 2
C. To t a l 9 0 3 6 7 .5 8 8 2 6
Mean s fo r On eway An o va
Leve l Nu m ber Mean Std Erro r Lo wer 9 5 % Up p er 9 5 %
CONTROL 5 8 0 .9 3 1 5 1 0 .2 6 6 7 9 0 .4 0 1 4 1 1 .4 6 1 6
MOP 3 3 1 .0 2 3 2 5 0 .3 5 3 6 9 0 .3 2 0 4 8 1 .7 2 6 0
Std Er r o r u se s a p o o led e st im a te o f e r r o r va r ia n ce

178
On eway An aly sis o f Data By Gro u p param eter= Δz°, To o th =# 2 4
Missin g Ro ws 1 2
On eway An o va
Su m m ary o f Fit
Rsq u a r e 0 .0 0 1 4 8 9
Ad j Rsq u a r e -0 .0 0 9 4 8
Ro o t Mea n Sq u a r e Er r o r 0 .7 2 2 2 5 5
Mea n o f Resp o n se 0 .7 6 2 7 3 7
Ob se r va t io n s (o r Su m Wgt s) 9 3
t Test
MOP-CONTROL
Assu m in g eq u a l va r ia n ces
Diffe r en ce 0 .0 5 7 2 8 t Ra t io 0 .3 6 8 3 3 2

179
Std Er r Dif 0 .1 5 5 5 1 DF 9 1
Up p e r CL Dif 0 .3 6 6 1 9 Pr o b > |t | 0 .7 1 3 5
Lo wer CL Dif -0 .2 5 1 6 3 Pr o b > t 0 .3 5 6 7
Co n fid en ce 0 .9 5 Pr o b < t 0 .6 4 3 3
An aly sis o f Varian ce
So u rce DF Su m o f Squares Mean Square F Ratio Pro b > F
Gr o u p 1 0 .0 7 0 7 7 2 0 .0 7 0 7 7 2 0 .1 3 5 7 0 .7 1 3 5
Er r o r 9 1 4 7 .4 7 0 3 3 3 0 .5 2 1 6 5 2
C. To t a l 9 2 4 7 .5 4 1 1 0 4
Mean s fo r On eway An o va
Leve l Nu m ber Mean Std Erro r Lo wer 9 5 % Up p er 9 5 %
CONTROL 5 9 0 .7 4 1 7 9 6 0 .0 9 4 0 3 0 .5 5 5 0 2 0 .9 2 8 6
MOP 3 4 0 .7 9 9 0 7 6 0 .1 2 3 8 7 0 .5 5 3 0 3 1 .0 4 5 1
Std Er r o r u se s a p o o led e st im a te o f e r r o r va r ia n ce

180
On eway An aly sis o f Data By Gro u p param eter= Δz°, To o th =# 2 5
Missin g Ro ws 1 2
On eway An o va
Su m m ary o f Fit
Rsq u a r e 0 .0 1 7 6 3 8
Ad j Rsq u a r e 0 .0 0 6 8 4 2
Ro o t Mea n Sq u a r e Er r o r 1 .5 4 0 8 7 7
Mea n o f Resp o n se 0 .8 3 8 0 8 1
Ob se r va t io n s (o r Su m Wgt s) 9 3
t Test
MOP-CONTROL
Assu m in g eq u a l va r ia n ces
Diffe r en ce 0 .4 2 4 1 t Ra t io 1 .2 7 8 2 1 7

181
Std Er r Dif 0 .3 3 1 8 DF 9 1
Up p e r CL Dif 1 .0 8 3 1 Pr o b > |t | 0 .2 0 4 4
Lo wer CL Dif -0 .2 3 4 9 Pr o b > t 0 .1 0 2 2
Co n fid en ce 0 .9 5 Pr o b < t 0 .8 9 7 8
An aly sis o f Varian ce
So u rce DF Su m o f Squares Mean Square F Ratio Pro b > F
Gr o u p 1 3 .8 7 9 2 3 3 .8 7 9 2 3 1 .6 3 3 8 0 .2 0 4 4
Er r o r 9 1 2 1 6 .0 6 1 5 2 2 .3 7 4 3 0
C. To t a l 9 2 2 1 9 .9 4 0 7 5
Mean s fo r On eway An o va
Leve l Nu m ber Mean Std Erro r Lo wer 9 5 % Up p er 9 5 %
CONTROL 5 9 0 .6 8 3 0 4 0 .2 0 0 6 1 0 .2 8 4 5 6 1 .0 8 1 5
MOP 3 4 1 .1 0 7 1 2 0 .2 6 4 2 6 0 .5 8 2 2 0 1 .6 3 2 0
Std Er r o r u se s a p o o led e st im a te o f e r r o r va r ia n ce

182
On eway An aly sis o f Data By Gro u p param eter= Δz°, To o th =# 2 6
Missin g Ro ws 1 2
On eway An o va
Su m m ary o f Fit
Rsq u a r e 0 .0 0 3 0 7 1
Ad j Rsq u a r e -0 .0 0 7 8 8
Ro o t Mea n Sq u a r e Er r o r 2 .3 0 4 4 6 6
Mea n o f Resp o n se 1 .0 1 4 9 3 3
Ob se r va t io n s (o r Su m Wgt s) 9 3
t Test
MOP-CONTROL
Assu m in g eq u a l va r ia n ces
Diffe r en ce 0 .2 6 2 7 t Ra t io 0 .5 2 9 4 2 5

183
Std Er r Dif 0 .4 9 6 2 DF 9 1
Up p e r CL Dif 1 .2 4 8 3 Pr o b > |t | 0 .5 9 7 8
Lo wer CL Dif -0 .7 2 2 9 Pr o b > t 0 .2 9 8 9
Co n fid en ce 0 .9 5 Pr o b < t 0 .7 0 1 1
An aly sis o f Varian ce
So u rce DF Su m o f Squares Mean Square F Ratio Pro b > F
Gr o u p 1 1 .4 8 8 5 0 1 .4 8 8 5 0 0 .2 8 0 3 0 .5 9 7 8
Er r o r 9 1 4 8 3 .2 6 1 1 2 5 .3 1 0 5 6
C. To t a l 9 2 4 8 4 .7 4 9 6 2
Mean s fo r On eway An o va
Leve l Nu m ber Mean Std Erro r Lo wer 9 5 % Up p er 9 5 %
CONTROL 5 9 0 .9 1 8 8 9 0 .3 0 0 0 2 0 .3 2 2 9 5 1 .5 1 4 8
MOP 3 4 1 .1 8 1 5 9 0 .3 9 5 2 1 0 .3 9 6 5 5 1 .9 6 6 6
Std Er r o r u se s a p o o led e st im a te o f e r r o r va r ia n ce

184
On eway An aly sis o f Data By Gro u p param eter= Δz°, To o th =# 2 7
Missin g Ro ws 1 4
On eway An o va
Su m m ary o f Fit
Rsq u a r e 0 .0 0 6 7 6 2
Ad j Rsq u a r e -0 .0 0 4 4
Ro o t Mea n Sq u a r e Er r o r 6 .4 7 7 0 6 6
Mea n o f Resp o n se 1 .4 4 8 0 7 7
Ob se r va t io n s (o r Su m Wgt s) 9 1
t Test
MOP-CONTROL
Assu m in g eq u a l va r ia n ces
Diffe r en ce -1 .1 0 6 9 t Ra t io -0 .7 7 8 4 3

185
Std Er r Dif 1 .4 2 2 0 DF 8 9
Up p e r CL Dif 1 .7 1 8 6 Pr o b > |t | 0 .4 3 8 4
Lo wer CL Dif -3 .9 3 2 4 Pr o b > t 0 .7 8 0 8
Co n fid en ce 0 .9 5 Pr o b < t 0 .2 1 9 2
An aly sis o f Varian ce
So u rce DF Su m o f Squares Mean Square F Ratio Pro b > F
Gr o u p 1 2 5 .4 2 0 9 2 5 .4 2 0 9 0 .6 0 5 9 0 .4 3 8 4
Er r o r 8 9 3 7 3 3 .7 6 2 5 4 1 .9 5 2 4
C. To t a l 9 0 3 7 5 9 .1 8 3 4
Mean s fo r On eway An o va
Leve l Nu m ber Mean Std Erro r Lo wer 9 5 % Up p er 9 5 %
CONTROL 5 9 1 .8 3 7 3 2 0 .8 4 3 2 0 .1 6 2 3 .5 1 2 8
MOP 3 2 0 .7 3 0 4 0 1 .1 4 5 0 -1 .5 4 5 3 .0 0 5 5
Std Er r o r u se s a p o o led e st im a te o f e r r o r va r ia n ce
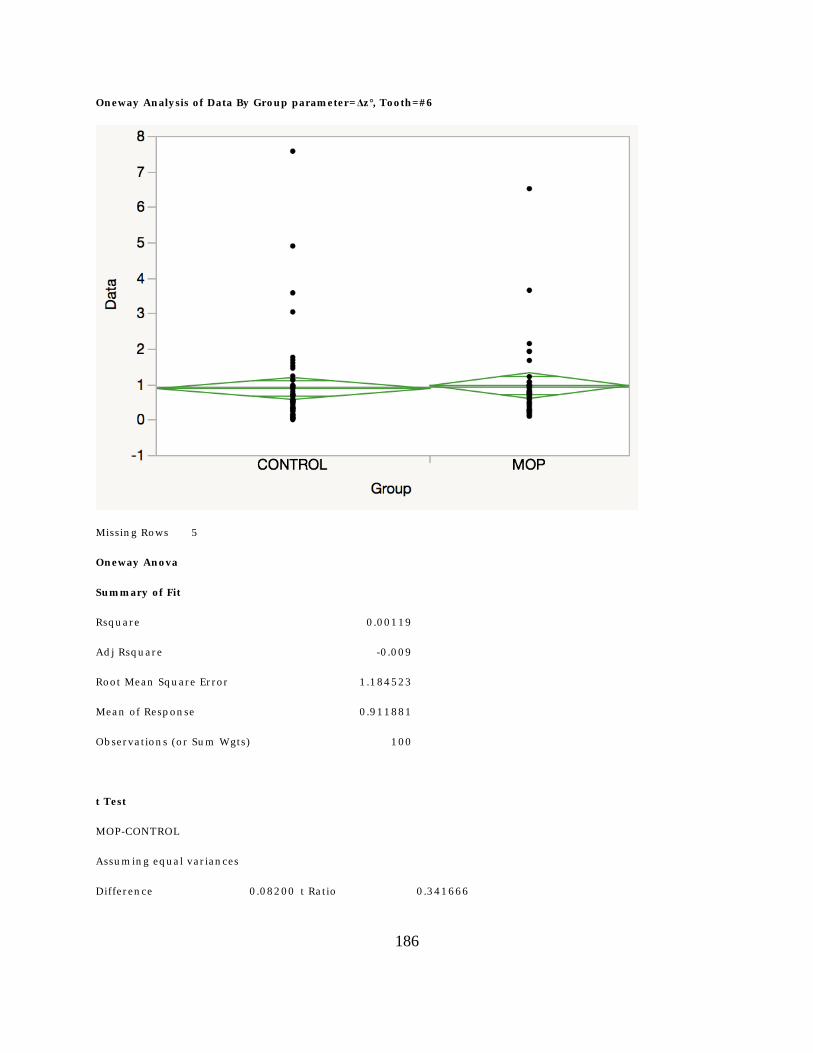
186
On eway An aly sis o f Data By Gro u p param eter= Δz°, To o th =# 6
Missin g Ro ws 5
On eway An o va
Su m m ary o f Fit
Rsq u a r e 0 .0 0 1 1 9
Ad j Rsq u a r e -0 .0 0 9
Ro o t Mea n Sq u a r e Er r o r 1 .1 8 4 5 2 3
Mea n o f Resp o n se 0 .9 1 1 8 8 1
Ob se r va t io n s (o r Su m Wgt s) 1 0 0
t Test
MOP-CONTROL
Assu m in g eq u a l va r ia n ces
Diffe r en ce 0 .0 8 2 0 0 t Ra t io 0 .3 4 1 6 6 6

187
Std Er r Dif 0 .2 4 0 0 0 DF 9 8
Up p e r CL Dif 0 .5 5 8 2 6 Pr o b > |t | 0 .7 3 3 3
Lo wer CL Dif -0 .3 9 4 2 7 Pr o b > t 0 .3 6 6 7
Co n fid en ce 0 .9 5 Pr o b < t 0 .6 3 3 3
An aly sis o f Varian ce
So u rce DF Su m o f Squares Mean Square F Ratio Pro b > F
Gr o u p 1 0 .1 6 3 7 9 0 .1 6 3 7 9 0 .1 1 6 7 0 .7 3 3 3
Er r o r 9 8 1 3 7 .5 0 3 1 8 1 .4 0 3 0 9
C. To t a l 9 9 1 3 7 .6 6 6 9 7
Mean s fo r On eway An o va
Leve l Nu m ber Mean Std Erro r Lo wer 9 5 % Up p er 9 5 %
CONTROL 5 8 0 .8 7 7 4 4 1 0 .1 5 5 5 4 0 .5 6 8 7 9 1 .1 8 6 1
MOP 4 2 0 .9 5 9 4 4 0 0 .1 8 2 7 8 0 .5 9 6 7 3 1 .3 2 2 2
Std Er r o r u se s a p o o led e st im a te o f e r r o r va r ia n ce

188
On eway An aly sis o f Data By Gro u p param eter=Δz°, To o th =# 7
Missin g Ro ws 7
On eway An o va
Su m m ary o f Fit
Rsq u a r e 0 .0 0 2 1 6 1
Ad j Rsq u a r e -0 .0 0 8 2 3
Ro o t Mea n Sq u a r e Er r o r 0 .9 8 6 4 1 6
Mea n o f Resp o n se 0 .8 6 3 9 6 6
Ob se r va t io n s (o r Su m Wgt s) 9 8
t Test
MOP-CONTROL
Assu m in g eq u a l va r ia n ces
Diffe r en ce -0 .0 9 2 0 9 t Ra t io -0 .4 5 5 9 2

189
Std Er r Dif 0 .2 0 2 0 0 DF 9 6
Up p e r CL Dif 0 .3 0 8 8 7 Pr o b > |t | 0 .6 4 9 5
Lo wer CL Dif -0 .4 9 3 0 5 Pr o b > t 0 .6 7 5 3
Co n fid en ce 0 .9 5 Pr o b < t 0 .3 2 4 7
An aly sis o f Varian ce
So u rce DF Su m o f Squares Mean Square F Ratio Pro b > F
Gr o u p 1 0 .2 0 2 2 5 1 0 .2 0 2 2 5 1 0 .2 0 7 9 0 .6 4 9 5
Er r o r 9 6 9 3 .4 0 9 5 7 6 0 .9 7 3 0 1 6
C. To t a l 9 7 9 3 .6 1 1 8 2 7
Mean s fo r On eway An o va
Leve l Nu m ber Mean Std Erro r Lo wer 9 5 % Up p er 9 5 %
CONTROL 5 7 0 .9 0 2 4 9 5 0 .1 3 0 6 5 0 .6 4 3 1 5 1 .1 6 1 8
MOP 4 1 0 .8 1 0 4 0 1 0 .1 5 4 0 5 0 .5 0 4 6 1 1 .1 1 6 2
Std Er r o r u se s a p o o led e st im a te o f e r r o r va r ia n ce
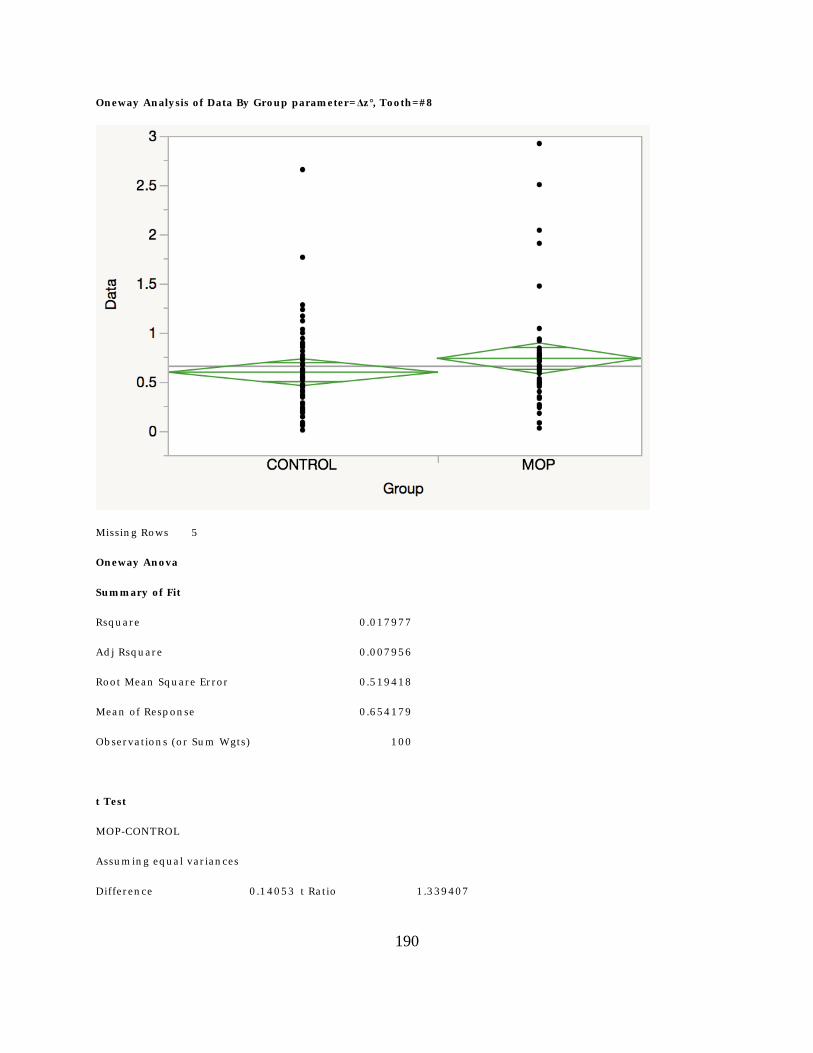
190
On eway An aly sis o f Data By Gro u p param eter= Δz°, To o th =# 8
Missin g Ro ws 5
On eway An o va
Su m m ary o f Fit
Rsq u a r e 0 .0 1 7 9 7 7
Ad j Rsq u a r e 0 .0 0 7 9 5 6
Ro o t Mea n Sq u a r e Er r o r 0 .5 1 9 4 1 8
Mea n o f Resp o n se 0 .6 5 4 1 7 9
Ob se r va t io n s (o r Su m Wgt s) 1 0 0
t Test
MOP-CONTROL
Assu m in g eq u a l va r ia n ces
Diffe r en ce 0 .1 4 0 5 3 t Ra t io 1 .3 3 9 4 0 7

191
Std Er r Dif 0 .1 0 4 9 2 DF 9 8
Up p e r CL Dif 0 .3 4 8 7 3 Pr o b > |t | 0 .1 8 3 5
Lo wer CL Dif -0 .0 6 7 6 8 Pr o b > t 0 .0 9 1 8
Co n fid en ce 0 .9 5 Pr o b < t 0 .9 0 8 2
An aly sis o f Varian ce
So u rce DF Su m o f Squares Mean Square F Ratio Pro b > F
Gr o u p 1 0 .4 8 4 0 1 6 0 .4 8 4 0 1 6 1 .7 9 4 0 0 .1 8 3 5
Er r o r 9 8 2 6 .4 3 9 9 6 5 0 .2 6 9 7 9 6
C. To t a l 9 9 2 6 .9 2 3 9 8 1
Mean s fo r On eway An o va
Leve l Nu m ber Mean Std Erro r Lo wer 9 5 % Up p er 9 5 %
CONTROL 5 7 0 .5 9 3 7 5 3 0 .0 6 8 8 0 0 .4 5 7 2 2 0 .7 3 0 2 8
MOP 4 3 0 .7 3 4 2 7 9 0 .0 7 9 2 1 0 .5 7 7 0 9 0 .8 9 1 4 7
Std Er r o r u se s a p o o led e st im a te o f e r r o r va r ia n ce

192
On eway An aly sis o f Data By Gro u p param eter= Δz°, To o th =# 9
Missin g Ro ws 6
On eway An o va
Su m m ary o f Fit
Rsq u a r e 0 .0 1 9 2 9 8
Ad j Rsq u a r e 0 .0 0 9 1 8 8
Ro o t Mea n Sq u a r e Er r o r 2 .3 0 0 8 5 3
Mea n o f Resp o n se 1 .1 2 0 1 5
Ob se r va t io n s (o r Su m Wgt s) 9 9
t Test
MOP-CONTROL
Assu m in g eq u a l va r ia n ces
Diffe r en ce 0 .6 4 6 4 t Ra t io 1 .3 8 1 5 8 3

193
Std Er r Dif 0 .4 6 7 9 DF 9 7
Up p e r CL Dif 1 .5 7 5 1 Pr o b > |t | 0 .1 7 0 3
Lo wer CL Dif -0 .2 8 2 2 Pr o b > t 0 .0 8 5 1
Co n fid en ce 0 .9 5 Pr o b < t 0 .9 1 4 9
An aly sis o f Varian ce
So u rce DF Su m o f Squares Mean Square F Ratio Pro b > F
Gr o u p 1 1 0 .1 0 4 9 0 1 0 .1 0 4 9 1 .9 0 8 8 0 .1 7 0 3
Er r o r 9 7 5 1 3 .5 1 0 6 3 5 .2 9 3 9
C. To t a l 9 8 5 2 3 .6 1 5 5 3
Mean s fo r On eway An o va
Leve l Nu m ber Mean Std Erro r Lo wer 9 5 % Up p er 9 5 %
CONTROL 5 7 0 .8 4 5 9 1 0 .3 0 4 7 6 0 .2 4 1 0 5 1 .4 5 0 8
MOP 4 2 1 .4 9 2 3 4 0 .3 5 5 0 3 0 .7 8 7 7 0 2 .1 9 7 0

194
DISCREPANCY BY ARCH
On eway An aly sis o f Data By Gro u p param eter= ΔV, Arch =Lo wer
On eway An o va
Su m m ary o f Fit
Rsq u a r e 0 .0 0 2 5 1 4
Ad j Rsq u a r e 0 .0 0 0 9 2 6
Ro o t Mea n Sq u a r e Er r o r 2 .0 8 7 1 6 9
Mea n o f Resp o n se 2 .4 3 2 0 1 3
Ob se r va t io n s (o r Su m Wgt s) 6 3 0
t Test
MOP-CONTROL
Assu m in g eq u a l va r ia n ces

195
Diffe r en ce -0 .2 1 0 8 6 t Ra t io -1 .2 5 8 1 3
Std Er r Dif 0 .1 6 7 6 0 DF 6 2 8
Up p e r CL Dif 0 .1 1 8 2 6 Pr o b > |t | 0 .2 0 8 8
Lo wer CL Dif -0 .5 3 9 9 8 Pr o b > t 0 .8 9 5 6
Co n fid en ce 0 .9 5 Pr o b < t 0 .1 0 4 4
An aly sis o f Varian ce
So u rce DF Su m o f Squares Mean Square F Ratio Pro b > F
Gr o u p 1 6 .8 9 5 5 6 .8 9 5 5 2 1 .5 8 2 9 0 .2 0 8 8
Er r o r 6 2 8 2 7 3 5 .7 4 1 5 4 .3 5 6 2 8
C. To t a l 6 2 9 2 7 4 2 .6 3 7 0
Mean s fo r On eway An o va
Leve l Nu m ber Mean Std Erro r Lo wer 9 5 % Up p er 9 5 %
CONTROL 3 5 4 2 .5 2 4 3 9 0 .1 1 0 9 3 2 .3 0 6 5 2 .7 4 2 2
MOP 2 7 6 2 .3 1 3 5 3 0 .1 2 5 6 3 2 .0 6 6 8 2 .5 6 0 2
Std Er r o r u se s a p o o led e st im a te o f e r r o r va r ia n ce

196
On eway An aly sis o f Data By Gro u p param eter=ΔV, Arch =Up p er
Missin g Ro ws 1 0
On eway An o va
Su m m ary o f Fit
Rsq u a r e 0 .0 1 6 1 0 3
Ad j Rsq u a r e 0 .0 1 4 5 1 1
Ro o t Mea n Sq u a r e Er r o r 2 .0 7 1 7 7 2
Mea n o f Resp o n se 2 .9 9 7 7 6
Ob se r va t io n s (o r Su m Wgt s) 6 2 0
t Test
MOP-CONTROL
Assu m in g eq u a l va r ia n ces
Diffe r en ce 0 .5 3 2 4 5 1 t Ra t io 3 .1 8 0 3 5 3
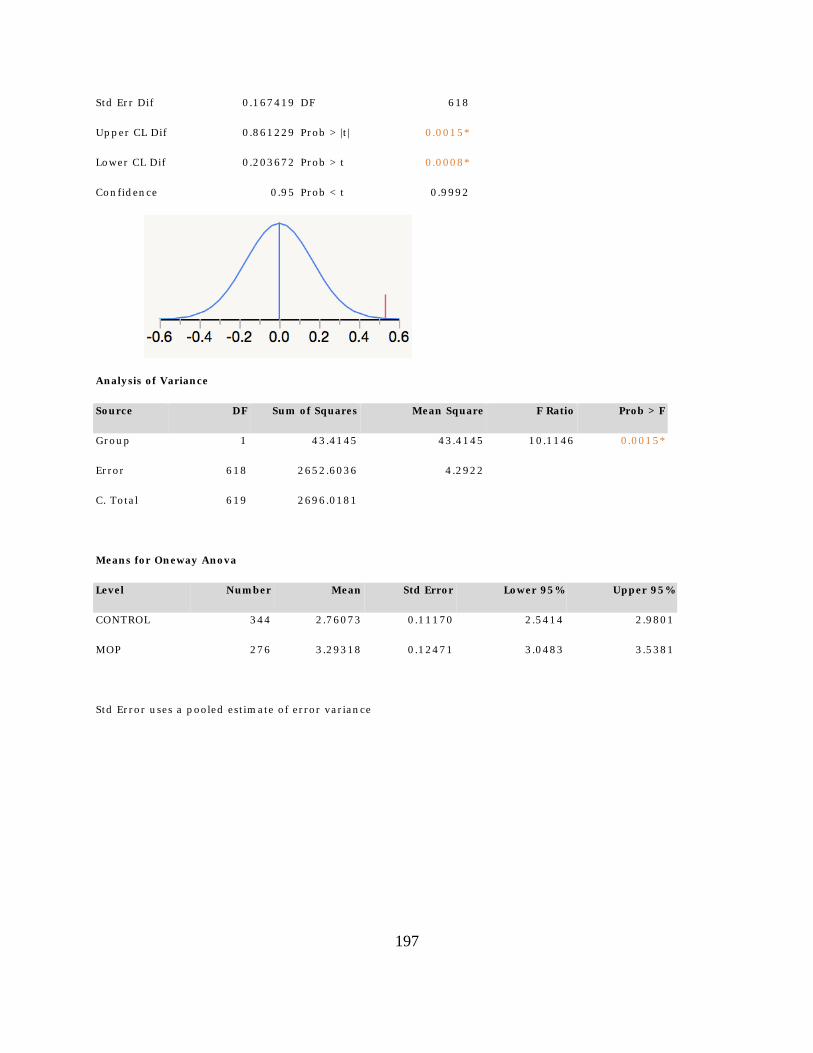
197
Std Er r Dif 0 .1 6 7 4 1 9 DF 6 1 8
Up p e r CL Dif 0 .8 6 1 2 2 9 Pr o b > |t | 0 .0 0 1 5 *
Lo wer CL Dif 0 .2 0 3 6 7 2 Pr o b > t 0 .0 0 0 8 *
Co n fid en ce 0 .9 5 Pr o b < t 0 .9 9 9 2
An aly sis o f Varian ce
So u rce DF Su m o f Squares Mean Square F Ratio Pro b > F
Gr o u p 1 4 3 .4 1 4 5 4 3 .4 1 4 5 1 0 .1 1 4 6 0 .0 0 1 5 *
Er r o r 6 1 8 2 6 5 2 .6 0 3 6 4 .2 9 2 2
C. To t a l 6 1 9 2 6 9 6 .0 1 8 1
Mean s fo r On eway An o va
Leve l Nu m ber Mean Std Erro r Lo wer 9 5 % Up p er 9 5 %
CONTROL 3 4 4 2 .7 6 0 7 3 0 .1 1 1 7 0 2 .5 4 1 4 2 .9 8 0 1
MOP 2 7 6 3 .2 9 3 1 8 0 .1 2 4 7 1 3 .0 4 8 3 3 .5 3 8 1
Std Er r o r u se s a p o o led e st im a te o f e r r o r va r ia n ce

198
On eway An aly sis o f Data By Gro u p param eter= Δx°, Arch =Lo wer
Missin g Ro ws 7 8
On eway An o va
Su m m ary o f Fit
Rsq u a r e 0 .0 0 0 2 0 5
Ad j Rsq u a r e -0 .0 0 1 6 1
Ro o t Mea n Sq u a r e Er r o r 3 .2 7 8 4 6 6
Mea n o f Resp o n se 1 .4 2 3 1 5
Ob se r va t io n s (o r Su m Wgt s) 5 5 2
t Test
MOP-CONTROL
Assu m in g eq u a l va r ia n ces
Diffe r en ce -0 .0 9 7 3 8 t Ra t io -0 .3 3 5 4 5

199
Std Er r Dif 0 .2 9 0 3 0 DF 5 5 0
Up p e r CL Dif 0 .4 7 2 8 6 Pr o b > |t | 0 .7 3 7 4
Lo wer CL Dif -0 .6 6 7 6 2 Pr o b > t 0 .6 3 1 3
Co n fid en ce 0 .9 5 Pr o b < t 0 .3 6 8 7
An aly sis o f Varian ce
So u rce DF Su m o f Squares Mean Square F Ratio Pro b > F
Gr o u p 1 1 .2 0 9 5 1 .2 0 9 5 0 .1 1 2 5 0 .7 3 7 4
Er r o r 5 5 0 5 9 1 1 .5 8 7 2 1 0 .7 4 8 3
C. To t a l 5 5 1 5 9 1 2 .7 9 6 7
Mean s fo r On eway An o va
Leve l Nu m ber Mean Std Erro r Lo wer 9 5 % Up p er 9 5 %
CONTROL 3 5 2 1 .4 5 8 4 3 0 .1 7 4 7 4 1 .1 1 5 2 1 .8 0 1 7
MOP 2 0 0 1 .3 6 1 0 5 0 .2 3 1 8 2 0 .9 0 5 7 1 .8 1 6 4
Std Er r o r u se s a p o o led e st im a te o f e r r o r va r ia n ce

200
On eway An aly sis o f Data By Gro u p param eter= Δx°, Arch =Up p er
Missin g Ro ws 3 7
On eway An o va
Su m m ary o f Fit
Rsq u a r e 3 .4 5 8 e -5
Ad j Rsq u a r e -0 .0 0 1 6 6
Ro o t Mea n Sq u a r e Er r o r 3 .8 6 9 3 6 3
Mea n o f Resp o n se 1 .8 2 2 6 8 1
Ob se r va t io n s (o r Su m Wgt s) 5 9 3
t Test
MOP-CONTROL
Assu m in g eq u a l va r ia n ces
Diffe r en ce -0 .0 4 6 0 0 t Ra t io -0 .1 4 2 9 5

201
Std Er r Dif 0 .3 2 1 7 7 DF 5 9 1
Up p e r CL Dif 0 .5 8 5 9 6 Pr o b > |t | 0 .8 8 6 4
Lo wer CL Dif -0 .6 7 7 9 6 Pr o b > t 0 .5 5 6 8
Co n fid en ce 0 .9 5 Pr o b < t 0 .4 4 3 2
An aly sis o f Varian ce
So u rce DF Su m o f Squares Mean Square F Ratio Pro b > F
Gr o u p 1 0 .3 0 6 0 0 .3 0 6 0 0 .0 2 0 4 0 .8 8 6 4
Er r o r 5 9 1 8 8 4 8 .4 3 4 0 1 4 .9 7 2 0
C. To t a l 5 9 2 8 8 4 8 .7 4 0 0
Mean s fo r On eway An o va
Leve l Nu m ber Mean Std Erro r Lo wer 9 5 % Up p er 9 5 %
CONTROL 3 4 3 1 .8 4 2 0 7 0 .2 0 8 9 3 1 .4 3 1 7 2 .2 5 2 4
MOP 2 5 0 1 .7 9 6 0 7 0 .2 4 4 7 2 1 .3 1 5 4 2 .2 7 6 7
Std Er r o r u se s a p o o led e st im a te o f e r r o r va r ia n ce

202
On eway An aly sis o f Data By Gro u p param eter=Δy °, Arch =Lo wer
Missin g Ro ws 7 8
On eway An o va
Su m m ary o f Fit
Rsq u a r e 0 .0 0 0 1 6 9
Ad j Rsq u a r e -0 .0 0 1 6 5
Ro o t Mea n Sq u a r e Er r o r 2 .7 7 8 5 6 9
Mea n o f Resp o n se 1 .3 7 2 1 2 9
Ob se r va t io n s (o r Su m Wgt s) 5 5 2
t Test
MOP-CONTROL
Assu m in g eq u a l va r ia n ces
Diffe r en ce 0 .0 7 4 9 0 t Ra t io 0 .3 0 4 7 5 1
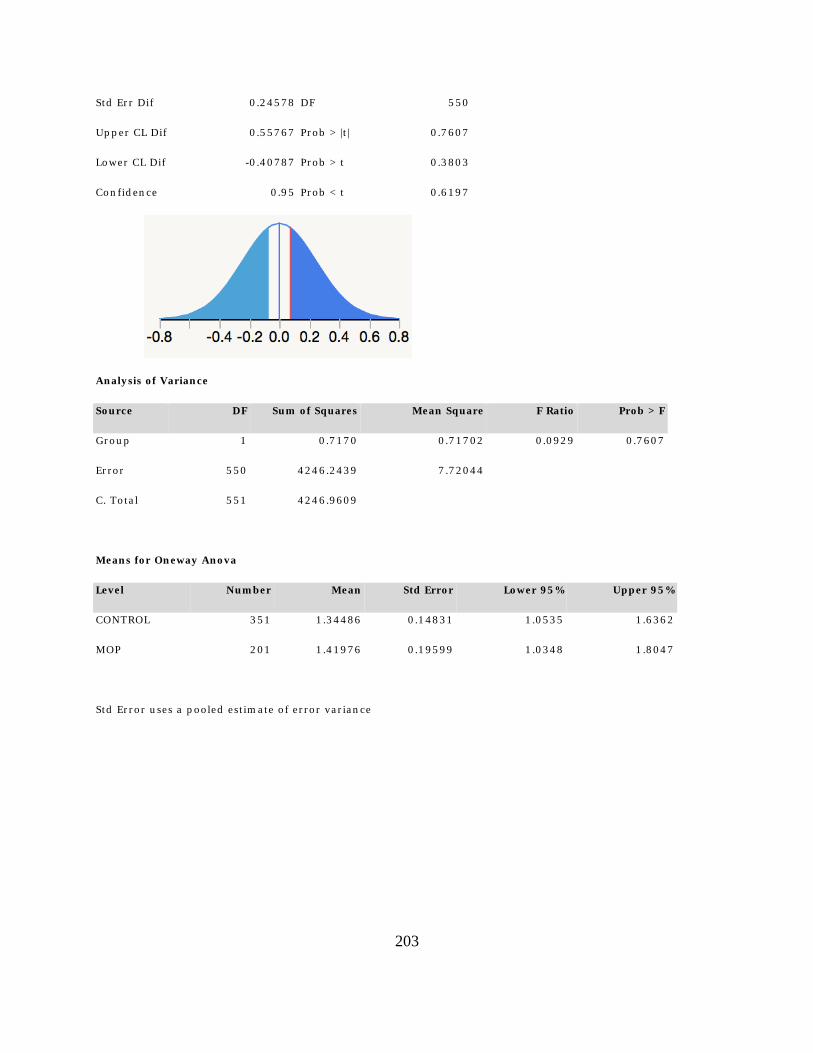
203
Std Er r Dif 0 .2 4 5 7 8 DF 5 5 0
Up p e r CL Dif 0 .5 5 7 6 7 Pr o b > |t | 0 .7 6 0 7
Lo wer CL Dif -0 .4 0 7 8 7 Pr o b > t 0 .3 8 0 3
Co n fid en ce 0 .9 5 Pr o b < t 0 .6 1 9 7
An aly sis o f Varian ce
So u rce DF Su m o f Squares Mean Square F Ratio Pro b > F
Gr o u p 1 0 .7 1 7 0 0 .7 1 7 0 2 0 .0 9 2 9 0 .7 6 0 7
Er r o r 5 5 0 4 2 4 6 .2 4 3 9 7 .7 2 0 4 4
C. To t a l 5 5 1 4 2 4 6 .9 6 0 9
Mean s fo r On eway An o va
Leve l Nu m ber Mean Std Erro r Lo wer 9 5 % Up p er 9 5 %
CONTROL 3 5 1 1 .3 4 4 8 6 0 .1 4 8 3 1 1 .0 5 3 5 1 .6 3 6 2
MOP 2 0 1 1 .4 1 9 7 6 0 .1 9 5 9 9 1 .0 3 4 8 1 .8 0 4 7
Std Er r o r u se s a p o o led e st im a te o f e r r o r va r ia n ce

204
On eway An aly sis o f Data By Gro u p param eter= Δy °, Arch =Up p er
Missin g Ro ws 3 3
On eway An o va
Su m m ary o f Fit
Rsq u a r e 0 .0 0 1 2 1 7
Ad j Rsq u a r e -0 .0 0 0 4 6
Ro o t Mea n Sq u a r e Er r o r 6 .1 9 6 1 4
Mea n o f Resp o n se 1 .8 1 1 2
Ob se r va t io n s (o r Su m Wgt s) 5 9 7
t Test
MOP-CONTROL
Assu m in g eq u a l va r ia n ces
Diffe r en ce -0 .4 3 6 9 t Ra t io -0 .8 5 1 3 3

205
Std Er r Dif 0 .5 1 3 2 DF 5 9 5
Up p e r CL Dif 0 .5 7 1 0 Pr o b > |t | 0 .3 9 4 9
Lo wer CL Dif -1 .4 4 4 7 Pr o b > t 0 .8 0 2 5
Co n fid en ce 0 .9 5 Pr o b < t 0 .1 9 7 5
An aly sis o f Varian ce
So u rce DF Su m o f Squares Mean Square F Ratio Pro b > F
Gr o u p 1 2 7 .8 2 5 2 7 .8 2 5 3 0 .7 2 4 8 0 .3 9 4 9
Er r o r 5 9 5 2 2 8 4 3 .3 2 9 3 8 .3 9 2 1
C. To t a l 5 9 6 2 2 8 7 1 .1 5 4
Mean s fo r On eway An o va
Leve l Nu m ber Mean Std Erro r Lo wer 9 5 % Up p er 9 5 %
CONTROL 3 4 4 1 .9 9 6 3 5 0 .3 3 4 0 7 1 .3 4 0 2 2 .6 5 2 5
MOP 2 5 3 1 .5 5 9 4 6 0 .3 8 9 5 5 0 .7 9 4 4 2 .3 2 4 5
Std Er r o r u se s a p o o led e st im a te o f e r r o r va r ia n ce

206
On eway An aly sis o f Data By Gro u p param eter= Δz°, Arch =Lo wer
Missin g Ro ws 7 6
On eway An o va
Su m m ary o f Fit
Rsq u a r e 0 .0 0 0 6 2 5
Ad j Rsq u a r e -0 .0 0 1 1 9
Ro o t Mea n Sq u a r e Er r o r 3 .9 3 8 0 0 9
Mea n o f Resp o n se 1 .0 6 8 0 4 8
Ob se r va t io n s (o r Su m Wgt s) 5 5 4
t Test
MOP-CONTROL
Assu m in g eq u a l va r ia n ces
Diffe r en ce -0 .2 0 4 3 8 t Ra t io -0 .5 8 7 3 5

207
Std Er r Dif 0 .3 4 7 9 7 DF 5 5 2
Up p e r CL Dif 0 .4 7 9 1 3 Pr o b > |t | 0 .5 5 7 2
Lo wer CL Dif -0 .8 8 7 9 0 Pr o b > t 0 .7 2 1 4
Co n fid en ce 0 .9 5 Pr o b < t 0 .2 7 8 6
An aly sis o f Varian ce
So u rce DF Su m o f Squares Mean Square F Ratio Pro b > F
Gr o u p 1 5 .3 4 9 9 5 .3 4 9 9 0 .3 4 5 0 0 .5 5 7 2
Er r o r 5 5 2 8 5 6 0 .3 6 9 7 1 5 .5 0 7 9
C. To t a l 5 5 3 8 5 6 5 .7 1 9 7
Mean s fo r On eway An o va
Leve l Nu m ber Mean Std Erro r Lo wer 9 5 % Up p er 9 5 %
CONTROL 3 5 3 1 .1 4 2 2 0 0 .2 0 9 6 0 0 .7 3 0 4 9 1 .5 5 3 9
MOP 2 0 1 0 .9 3 7 8 2 0 .2 7 7 7 7 0 .3 9 2 2 1 1 .4 8 3 4
Std Er r o r u se s a p o o led e st im a te o f e r r o r va r ia n ce

208
On eway An aly sis o f Data By Gro u p param eter= Δz°, Arch =Up p er
Missin g Ro ws 3 7
On eway An o va
Su m m ary o f Fit
Rsq u a r e 0 .0 0 2 2 7 1
Ad j Rsq u a r e 0 .0 0 0 5 8 2
Ro o t Mea n Sq u a r e Er r o r 1 .4 5 8 6 9 6
Mea n o f Resp o n se 0 .9 4 2 2 6 7
Ob se r va t io n s (o r Su m Wgt s) 5 9 3
t Test
MOP-CONTROL
Assu m in g eq u a l va r ia n ces
Diffe r en ce 0 .1 4 0 6 8 t Ra t io 1 .1 5 9 7 5 3

209
Std Er r Dif 0 .1 2 1 3 0 DF 5 9 1
Up p e r CL Dif 0 .3 7 8 9 2 Pr o b > |t | 0 .2 4 6 6
Lo wer CL Dif -0 .0 9 7 5 6 Pr o b > t 0 .1 2 3 3
Co n fid en ce 0 .9 5 Pr o b < t 0 .8 7 6 7
An aly sis o f Varian ce
So u rce DF Su m o f Squares Mean Square F Ratio Pro b > F
Gr o u p 1 2 .8 6 1 9 2 .8 6 1 9 4 1 .3 4 5 0 0 .2 4 6 6
Er r o r 5 9 1 1 2 5 7 .5 2 6 7 2 .1 2 7 7 9
C. To t a l 5 9 2 1 2 6 0 .3 8 8 6
Mean s fo r On eway An o va
Leve l Nu m ber Mean Std Erro r Lo wer 9 5 % Up p er 9 5 %
CONTROL 3 4 3 0 .8 8 2 9 6 0 .0 7 8 7 6 0 .7 2 8 2 7 1 .0 3 7 6
MOP 2 5 0 1 .0 2 3 6 4 0 .0 9 2 2 6 0 .8 4 2 4 5 1 .2 0 4 8
Std Er r o r u se s a p o o led e st im a te o f e r r o r va r ia n ce

210
GENDER
Resp o n se Data p aram eter=ΔV
An aly sis o f Varian ce
So u rce DF Su m o f Squares Mean Square F Ratio
Mo d e l 3 6 2 .6 2 8 5 2 0 .8 7 6 2 4 .7 5 0 1
Er r o r 1 2 4 6 5 4 7 6 .0 4 1 8 4 .3 9 4 9 Pro b > F
C. To ta l 1 2 4 9 5 5 3 8 .6 7 0 3 0 .0 0 2 7 *
Param eter Estim ates
Term Estim ate Std Erro r t Ratio Pro b>|t|
In t e r cep t 2 .8 0 3 1 0 3 6 0 .0 6 4 1 5 5 4 3 .6 9 < .0 0 0 1 *
Gen d e r [F] -0 .2 2 5 2 2 8 0 .0 6 4 1 5 5 -3 .5 1 0 .0 0 0 5 *
Gr o u p [CONTROL] -0 .1 2 4 4 6 5 0 .0 6 4 1 5 5 -1 .9 4 0 .0 5 2 6
Gen d e r [F]*Gr o u p [CONTROL] 0 .0 6 0 4 6 0 3 0 .0 6 4 1 5 5 0 .9 4 0 .3 4 6 2
Effect Details
Gen d er
Least Squ ares Mean s Table
Leve l Least Sq Mean Std Erro r Mean
F 2 .5 7 7 8 7 5 4 0 .0 7 3 0 4 5 7 7 2 .5 7 5 3 2
M 3 .0 2 8 3 3 1 7 0 .1 0 5 4 8 7 3 5 2 .9 7 9 1 6

211
LS Mean s Plo t
Gro u p
Least Squ ares Mean s Table
Leve l Least Sq Mean Std Erro r Mean
CONTROL 2 .6 7 8 6 3 8 2 0 .0 8 1 5 2 0 5 8 2 .6 4 0 8 7
MOP 2 .9 2 7 5 6 8 9 0 .0 9 9 0 8 4 1 1 2 .8 0 3 3 6
LS Mean s Plo t

212
Gen d er*Gro u p
Least Squ ares Mean s Table
Leve l Least Sq Mean Std Erro r
F,CONTROL 2 .5 1 3 8 7 0 4 0 .1 0 1 2 1 5 1 9
F,MOP 2 .6 4 1 8 8 0 4 0 .1 0 5 3 4 8 1 1
M,CONTROL 2 .8 4 3 4 0 6 1 0 .1 2 7 8 1 9 8 2
M,MOP 3 .2 1 3 2 5 7 4 0 .1 6 7 8 4 6 4 1
LS Mean s Plo t
Resp o n se Data p aram eter=Δx°
An aly sis o f Varian ce
So u rce DF Su m o f Squares Mean Square F Ratio
Mo d e l 3 2 8 .0 3 9 9 .3 4 6 3 0 .7 2 1 6
Er r o r 1 1 4 1 1 4 7 7 9 .1 3 2 1 2 .9 5 2 8 Pro b > F
C. To ta l 1 1 4 4 1 4 8 0 7 .1 7 1 0 .5 3 9 2
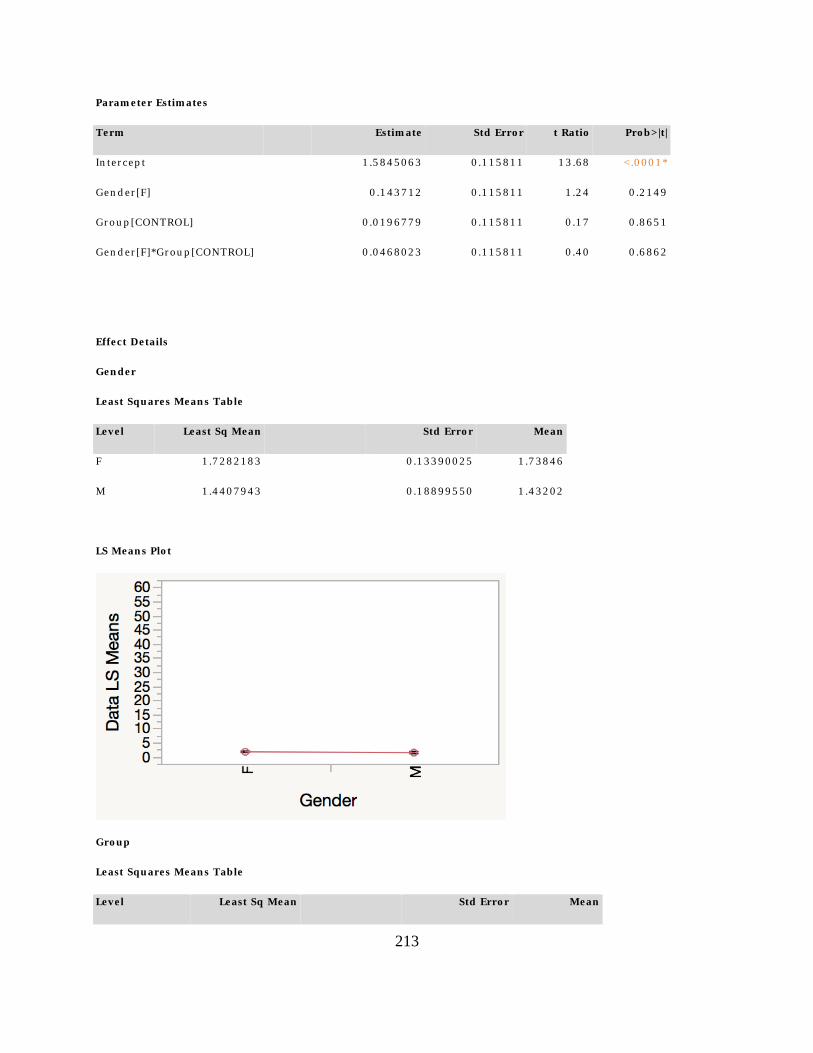
213
Param eter Estim ates
Term Estim ate Std Erro r t Ratio Pro b>|t|
In t e r cep t 1 .5 8 4 5 0 6 3 0 .1 1 5 8 1 1 1 3 .6 8 < .0 0 0 1 *
Gen d e r [F] 0 .1 4 3 7 1 2 0 .1 1 5 8 1 1 1 .2 4 0 .2 1 4 9
Gr o u p [CONTROL] 0 .0 1 9 6 7 7 9 0 .1 1 5 8 1 1 0 .1 7 0 .8 6 5 1
Gen d e r [F]*Gr o u p [CONTROL] 0 .0 4 6 8 0 2 3 0 .1 1 5 8 1 1 0 .4 0 0 .6 8 6 2
Effect Details
Gen d er
Least Squ ares Mean s Table
Leve l Least Sq Mean Std Erro r Mean
F 1 .7 2 8 2 1 8 3 0 .1 3 3 9 0 0 2 5 1 .7 3 8 4 6
M 1 .4 4 0 7 9 4 3 0 .1 8 8 9 9 5 5 0 1 .4 3 2 0 2
LS Mean s Plo t
Gro u p
Least Squ ares Mean s Table
Leve l Least Sq Mean Std Erro r Mean

214
Leve l Least Sq Mean Std Erro r Mean
CONTROL 1 .6 0 4 1 8 4 3 0 .1 4 0 2 3 7 0 3 1 .6 4 7 7 7
MOP 1 .5 6 4 8 2 8 4 0 .1 8 4 3 4 2 4 9 1 .6 0 2 7 3
LS Mean s Plo t
Gen d er*Gro u p
Least Squ ares Mean s Table
Leve l Least Sq Mean Std Erro r
F,CONTROL 1 .7 9 4 6 9 8 5 0 .1 7 4 1 6 7 7 3
F,MOP 1 .6 6 1 7 3 8 1 0 .2 0 3 4 2 7 4 1
M,CONTROL 1 .4 1 3 6 7 0 0 0 .2 1 9 8 4 3 8 1
M,MOP 1 .4 6 7 9 1 8 6 0 .3 0 7 4 8 3 1 7

215
LS Mean s Plo t
Resp o n se Data p aram eter=Δy °
An aly sis o f Varian ce
So u rce DF Su m o f Squares Mean Square F Ratio
Mo d e l 3 1 7 .4 4 6 5 .8 1 5 5 0 .2 4 5 2
Er r o r 1 1 4 5 2 7 1 5 5 .9 6 1 2 3 .7 1 7 0 Pro b > F
C. To ta l 1 1 4 8 2 7 1 7 3 .4 0 7 0 .8 6 4 8
Param eter Estim ates
Term Estim ate Std Erro r t Ratio Pro b>|t|
In t e r cep t 1 .5 9 3 7 0 6 5 0 .1 5 6 1 9 8 1 0 .2 0 < .0 0 0 1 *
Gen d e r [F] -0 .0 1 2 0 0 4 0 .1 5 6 1 9 8 -0 .0 8 0 .9 3 8 8
Gr o u p [CONTROL] 0 .0 5 3 4 3 0 2 0 .1 5 6 1 9 8 0 .3 4 0 .7 3 2 4
Gen d e r [F]*Gr o u p [CONTROL] 0 .0 9 8 0 5 9 7 0 .1 5 6 1 9 8 0 .6 3 0 .5 3 0 3

216
Effect Details
Gen d er
Least Squ ares Mean s Table
Leve l Least Sq Mean Std Erro r Mean
F 1 .5 8 1 7 0 3 0 0 .1 8 0 6 7 6 8 0 1 .6 0 4 9 2
M 1 .6 0 5 7 1 0 0 0 .2 5 4 8 4 6 7 7 1 .5 9 1 7 2
LS Mean s Plo t
Gro u p
Least Squ ares Mean s Table
Leve l Least Sq Mean Std Erro r Mean
CONTROL 1 .6 4 7 1 3 6 7 0 .1 9 0 0 3 0 2 7 1 .6 6 7 3 2
MOP 1 .5 4 0 2 7 6 3 0 .2 4 7 9 5 0 5 6 1 .4 9 7 6 1

217
LS Mean s Plo t
Gen d er*Gro u p
Least Squ ares Mean s Table
Leve l Least Sq Mean Std Erro r
F,CONTROL 1 .7 3 3 1 9 2 9 0 .2 3 5 1 2 6 2 9
F,MOP 1 .4 3 0 2 1 3 0 0 .2 7 4 3 9 3 9 7
M,CONTROL 1 .5 6 1 0 8 0 5 0 .2 9 8 5 9 9 4 7
M,MOP 1 .6 5 0 3 3 9 5 0 .4 1 3 0 6 8 8 5
LS Mean s Plo t

218
Resp o n se Data p aram eter=Δz°
An aly sis o f Varian ce
So u rce DF Su m o f Squares Mean Square F Ratio
Mo d e l 3 3 .3 2 6 0 1 .1 0 8 6 7 0 .1 2 8 9
Er r o r 1 1 4 3 9 8 2 7 .3 1 3 7 8 .5 9 7 8 2 Pro b > F
C. To ta l 1 1 4 6 9 8 3 0 .6 3 9 7 0 .9 4 2 9
Param eter Estim ates
Term Estim ate Std Erro r t Ratio Pro b>|t|
In t e r cep t 1 .0 0 3 8 6 6 7 0 .0 9 4 2 1 2 1 0 .6 6 < .0 0 0 1 *
Gen d e r [F] -0 .0 2 3 5 6 4 0 .0 9 4 2 1 2 -0 .2 5 0 .8 0 2 5
Gr o u p [CONTROL] 0 .0 2 6 1 4 4 0 .0 9 4 2 1 2 0 .2 8 0 .7 8 1 4
Gen d e r [F]*Gr o u p [CONTROL] -0 .0 4 3 3 2 7 0 .0 9 4 2 1 2 -0 .4 6 0 .6 4 5 7
Effect Details
Gen d er
Least Squ ares Mean s Table
Leve l Least Sq Mean Std Erro r Mean
F 0 .9 8 0 3 0 2 6 0 .1 0 8 9 8 4 6 8 0 .9 7 7 6 2
M 1 .0 2 7 4 3 0 8 0 .1 5 3 7 0 8 0 6 1 .0 4 9 5 6

219
LS Mean s Plo t
Gro u p
Least Squ ares Mean s Table
Leve l Least Sq Mean Std Erro r Mean
CONTROL 1 .0 3 0 0 1 0 7 0 .1 1 4 2 8 3 7 9 1 .0 1 4 4 4
MOP 0 .9 7 7 7 2 2 7 0 .1 4 9 8 1 0 0 2 0 .9 8 5 3 9
LS Mean s Plo t

220
Gen d er*Gro u p
Least Squ ares Mean s Table
Leve l Least Sq Mean Std Erro r
F,CONTROL 0 .9 6 3 1 2 0 1 0 .1 4 1 5 6 8 1 8
F,MOP 0 .9 9 7 4 8 5 1 0 .1 6 5 7 3 8 0 1
M,CONTROL 1 .0 9 6 9 0 1 4 0 .1 7 9 4 4 8 0 2
M,MOP 0 .9 5 7 9 6 0 3 0 .2 4 9 6 0 5 8 4
LS Mean s Plo t
AGE
Resp o n se Data p aram eter=ΔV

221
Regressio n Plo t
Su m m ary o f Fit
RSq u a r e 0 .0 1 9 4 2 3
RSq u a r e Ad j 0 .0 1 7 0 6 2
Ro o t Mea n Sq u a r e Er r o r 2 .0 8 7 7 8
Mea n o f Resp o n se 2 .7 1 2 6 2 4
Ob se r va t io n s (o r Su m Wgt s) 1 2 5 0
An aly sis o f Varian ce
So u rce DF Su m o f Squares Mean Square F Ratio
Mo d e l 3 1 0 7 .5 7 5 0 3 5 .8 5 8 3 8 .2 2 6 6
Er r o r 1 2 4 6 5 4 3 1 .0 9 5 3 4 .3 5 8 8 Pro b > F
C. To ta l 1 2 4 9 5 5 3 8 .6 7 0 3 < .0 0 0 1 *
Lack Of Fit
So u rce DF Su m o f Squares Mean Square F Ratio
La ck Of Fit 9 4 1 2 0 8 .0 2 7 8 1 2 .8 5 1 4 3 .5 0 5 7
Pu r e Er r o r 1 1 5 2 4 2 2 3 .0 6 7 5 3 .6 6 5 9 Pro b > F

222
So u rce DF Su m o f Squares Mean Square F Ratio
To ta l Er r o r 1 2 4 6 5 4 3 1 .0 9 5 3 < .0 0 0 1 *
Max RSq
0 .2 3 7 5
Param eter Estim ates
Term Estim ate Std Erro r t Ratio Pro b>|t|
In t e r cep t 3 .3 9 9 2 3 3 0 .1 6 6 6 3 3 2 0 .4 0 < .0 0 0 1 *
Age -0 .0 1 9 7 7 9 0 .0 0 4 6 9 6 -4 .2 1 < .0 0 0 1 *
Gr o u p [CONTROL] -0 .1 4 1 6 2 2 0 .0 6 1 0 2 8 -2 .3 2 0 .0 2 0 5 *
(Age -3 1 .1 0 3 )*Gr o u p [CONTROL] 0 .0 2 0 4 2 2 5 0 .0 0 4 6 9 6 4 .3 5 < .0 0 0 1 *
Resp o n se Data p aram eter=Δx°
Regressio n Plo t

223
Su m m ary o f Fit
RSq u a r e 0 .0 0 4 8 5 6
RSq u a r e Ad j 0 .0 0 2 2 3 9
Ro o t Mea n Sq u a r e Er r o r 3 .5 9 3 6 5 4
Mea n o f Resp o n se 1 .6 3 0 0 6 9
Ob se r va t io n s (o r Su m Wgt s) 1 1 4 5
An aly sis o f Varian ce
So u rce DF Su m o f Squares Mean Square F Ratio
Mo d e l 3 7 1 .9 0 1 2 3 .9 6 6 9 1 .8 5 5 8
Er r o r 1 1 4 1 1 4 7 3 5 .2 7 0 1 2 .9 1 4 3 Pro b > F
C. To ta l 1 1 4 4 1 4 8 0 7 .1 7 1 0 .1 3 5 3
Lack Of Fit
So u rce DF Su m o f Squares Mean Square F Ratio
La ck Of Fit 9 4 1 6 9 4 .8 3 7 1 8 .0 3 0 2 1 .4 4 7 6
Pu r e Er r o r 1 0 4 7 1 3 0 4 0 .4 3 3 1 2 .4 5 5 0 Pro b > F
To ta l Er r o r 1 1 4 1 1 4 7 3 5 .2 7 0 0 .0 0 4 7 *
Max RSq
0 .1 1 9 3
Param eter Estim ates
Term Estim ate Std Erro r t Ratio Pro b>|t|
In t e r cep t 0 .9 3 1 8 3 9 3 0 .3 2 1 6 2 4 2 .9 0 0 .0 0 3 8 *
Age 0 .0 2 1 6 6 6 4 0 .0 0 9 3 6 9 2 .3 1 0 .0 2 0 9 *
Gr o u p [CONTROL] 0 .0 7 3 7 5 1 6 0 .1 1 1 1 0 4 0 .6 6 0 .5 0 6 9
(Age -3 0 .3 3 4 4 )*Gr o u p [CONTROL] -0 .0 1 2 5 6 0 .0 0 9 3 6 9 -1 .3 4 0 .1 8 0 3

224
Resp o n se Data p aram eter=Δy °
Regressio n Plo t
Su m m ary o f Fit
RSq u a r e 0 .0 0 4 9 5 4
RSq u a r e Ad j 0 .0 0 2 3 4 7
Ro o t Mea n Sq u a r e Er r o r 4 .8 5 9 4 9 3
Mea n o f Resp o n se 1 .6 0 0 2 6 2
Ob se r va t io n s (o r Su m Wgt s) 1 1 4 9
An aly sis o f Varian ce
So u rce DF Su m o f Squares Mean Square F Ratio
Mo d e l 3 1 3 4 .6 0 9 4 4 .8 6 9 7 1 .9 0 0 1
Er r o r 1 1 4 5 2 7 0 3 8 .7 9 8 2 3 .6 1 4 7 Pro b > F
C. To ta l 1 1 4 8 2 7 1 7 3 .4 0 7 0 .1 2 7 8

225
Lack Of Fit
So u rce DF Su m o f Squares Mean Square F Ratio
La ck Of Fit 9 4 2 1 5 7 .5 5 6 2 2 .9 5 2 7 0 .9 6 9 5
Pu r e Er r o r 1 0 5 1 2 4 8 8 1 .2 4 2 2 3 .6 7 3 9 Pro b > F
To ta l Er r o r 1 1 4 5 2 7 0 3 8 .7 9 8 0 .5 6 3 4
Max RSq
0 .0 8 4 4
Param eter Estim ates
Term Estim ate Std Erro r t Ratio Pro b>|t|
In t e r cep t 1 .7 4 5 6 9 6 2 0 .4 3 4 7 8 2 4 .0 2 < .0 0 0 1 *
Age -0 .0 0 3 7 3 5 0 .0 1 2 6 6 5 -0 .2 9 0 .7 6 8 1
Gr o u p [CONTROL] 0 .0 6 7 0 1 6 9 0 .1 4 9 7 4 3 0 .4 5 0 .6 5 4 6
(Age -3 0 .3 8 2 3 )*Gr o u p [CONTROL] 0 .0 2 3 2 0 6 5 0 .0 1 2 6 6 5 1 .8 3 0 .0 6 7 2
Resp o n se Data p aram eter=Δz°

226
Regressio n Plo t
Su m m ary o f Fit
RSq u a r e 0 .0 0 4 6 2 8
RSq u a r e Ad j 0 .0 0 2 0 1 6
Ro o t Mea n Sq u a r e Er r o r 2 .9 2 5 9 0 6
Mea n o f Resp o n se 1 .0 0 3 0 1 9
Ob se r va t io n s (o r Su m Wgt s) 1 1 4 7
An aly sis o f Varian ce
So u rce DF Su m o f Squares Mean Square F Ratio
Mo d e l 3 4 5 .4 9 9 2 1 5 .1 6 6 4 1 .7 7 1 6
Er r o r 1 1 4 3 9 7 8 5 .1 4 0 5 8 .5 6 0 9 Pro b > F
C. To ta l 1 1 4 6 9 8 3 0 .6 3 9 7 0 .1 5 0 8
Lack Of Fit
So u rce DF Su m o f Squares Mean Square F Ratio
La ck Of Fit 9 4 7 7 7 .0 6 5 2 8 .2 6 6 6 5 0 .9 6 2 7
Pu r e Er r o r 1 0 4 9 9 0 0 8 .0 7 5 3 8 .5 8 7 3 0 Pro b > F

227
So u rce DF Su m o f Squares Mean Square F Ratio
To ta l Er r o r 1 1 4 3 9 7 8 5 .1 4 0 5 0 .5 8 1 6
Max RSq
0 .0 8 3 7
Param eter Estim ates
Term Estim ate Std Erro r t Ratio Pro b>|t|
In t e r cep t 0 .5 8 0 5 8 3 8 0 .2 6 4 2 2 3 2 .2 0 0 .0 2 8 2 *
Age 0 .0 1 3 4 7 8 2 0 .0 0 7 6 7 7 1 .7 6 0 .0 7 9 4
Gr o u p [CONTROL] 0 .0 4 4 3 6 7 6 0 .0 9 0 5 0 8 0 .4 9 0 .6 2 4 1
(Age -3 0 .3 9 6 8 )*Gr o u p [CONTROL] -0 .0 0 1 5 8 3 0 .0 0 7 6 7 7 -0 .2 1 0 .8 3 6 6
SEVERITY OF MAL-ALIGNMENT
Resp o n se Data Up p er o r Lo wer?=Lo wer, Param eters= ΔV
Effect Su m m ary
So u rce Lo gWo rth PValu e
Lo wer 1 5 .6 4 4
0 .0 0 0 0 0
Lo wer 1 *Gr o u p 0 .3 1 6
0 .4 8 2 8 5
Gr o u p 0 .0 8 9
0 .8 1 5 0 0 ^
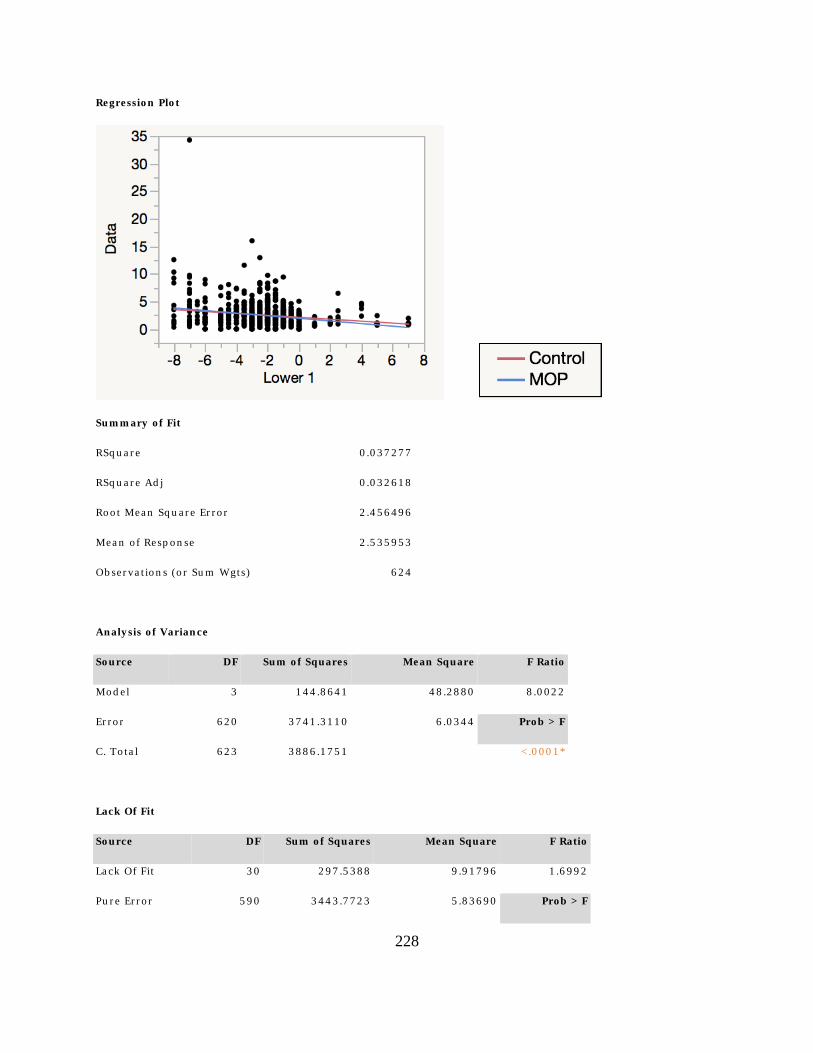
228
Regressio n Plo t
Su m m ary o f Fit
RSq u a r e 0 .0 3 7 2 7 7
RSq u a r e Ad j 0 .0 3 2 6 1 8
Ro o t Mea n Sq u a r e Er r o r 2 .4 5 6 4 9 6
Mea n o f Resp o n se 2 .5 3 5 9 5 3
Ob se r va t io n s (o r Su m Wgt s) 6 2 4
An aly sis o f Varian ce
So u rce DF Su m o f Squares Mean Square F Ratio
Mo d e l 3 1 4 4 .8 6 4 1 4 8 .2 8 8 0 8 .0 0 2 2
Er r o r 6 2 0 3 7 4 1 .3 1 1 0 6 .0 3 4 4 Pro b > F
C. To ta l 6 2 3 3 8 8 6 .1 7 5 1 < .0 0 0 1 *
Lack Of Fit
So u rce DF Su m o f Squares Mean Square F Ratio
La ck Of Fit 3 0 2 9 7 .5 3 8 8 9 .9 1 7 9 6 1 .6 9 9 2
Pu r e Er r o r 5 9 0 3 4 4 3 .7 7 2 3 5 .8 3 6 9 0 Pro b > F

229
So u rce DF Su m o f Squares Mean Square F Ratio
To ta l Er r o r 6 2 0 3 7 4 1 .3 1 1 0 0 .0 1 2 3 *
Max RSq
0 .1 1 3 8
Param eter Estim ates
Term Estim ate Std Erro r t Ratio Pro b>|t|
In t e r cep t 2 .0 2 1 7 3 9 8 0 .1 4 8 1 2 1 1 3 .6 5 < .0 0 0 1 *
Lo wer 1 -0 .2 0 6 7 2 6 0 .0 4 3 3 1 4 -4 .7 7 < .0 0 0 1 *
Gr o u p [Co n t r o l] 0 .0 2 3 3 0 4 5 0 .0 9 9 5 6 0 .2 3 0 .8 1 5 0
(Lo wer 1 +2 .4 4 7 1 2 )*Gr o u p [Co n t r o l] 0 .0 3 0 4 1 2 6 0 .0 4 3 3 1 4 0 .7 0 0 .4 8 2 9
Resp o n se Data Up p er o r Lo wer?=Lo wer, Param eters= Δx°
Effect Su m m ary
So u rce Lo gWo rth PValu e
Lo wer 1 0 .7 6 1
0 .1 7 3 3 2
Lo wer 1 *Gr o u p 0 .1 6 7
0 .6 8 1 2 5
Gr o u p 0 .1 1 2
0 .7 7 2 2 6 ^

230
Regressio n Plo t
Su m m ary o f Fit
RSq u a r e 0 .0 0 5 7 3 7
RSq u a r e Ad j 0 .0 0 0 3 5 3
Ro o t Mea n Sq u a r e Er r o r 1 2 .2 6 4 9 6
Mea n o f Resp o n se 2 .2 0 3 4 6
Ob se r va t io n s (o r Su m Wgt s) 5 5 8
An aly sis o f Varian ce
So u rce DF Su m o f Squares Mean Square F Ratio
Mo d e l 3 4 8 0 .8 5 4 1 6 0 .2 8 5 1 .0 6 5 5
Er r o r 5 5 4 8 3 3 3 7 .7 9 9 1 5 0 .4 2 9 Pro b > F
C. To ta l 5 5 7 8 3 8 1 8 .6 5 3 0 .3 6 3 2
Lack Of Fit
So u rce DF Su m o f Squares Mean Square F Ratio
La ck Of Fit 3 0 2 4 2 9 .8 2 8 8 0 .9 9 4 0 .5 2 4 6
Pu r e Er r o r 5 2 4 8 0 9 0 7 .9 7 1 1 5 4 .4 0 5 Pro b > F

231
So u rce DF Su m o f Squares Mean Square F Ratio
To ta l Er r o r 5 5 4 8 3 3 3 7 .7 9 9 0 .9 8 3 4
Max RSq
0 .0 3 4 7
Param eter Estim ates
Term Estim ate Std Erro r t Ratio Pro b>|t|
In t e r cep t 3 .0 0 0 2 9 2 1 0 .8 0 5 6 9 2 3 .7 2 0 .0 0 0 2 *
Lo wer 1 0 .3 1 6 7 8 0 9 0 .2 3 2 3 5 3 1 .3 6 0 .1 7 3 3
Gr o u p [Co n t r o l] -0 .1 5 6 7 7 6 0 .5 4 1 4 2 5 -0 .2 9 0 .7 7 2 3
(Lo wer 1 +2 .4 3 5 4 8 )*Gr o u p [Co n t r o l] 0 .0 9 5 4 9 2 5 0 .2 3 2 3 5 3 0 .4 1 0 .6 8 1 2
Resp o n se Data Up p er o r Lo wer?=Lo wer, Param eters= Δy °
Effect Su m m ary
So u rce Lo gWo rth PValu e
Gr o u p 0 .5 2 4
0 .2 9 8 9 9
Lo wer 1 *Gr o u p 0 .0 7 8
0 .8 3 5 4 8
Lo wer 1 0 .0 6 0
0 .8 7 0 0 8 ^

232
Regressio n Plo t
Su m m ary o f Fit
RSq u a r e 0 .0 0 2 1 6 1
RSq u a r e Ad j -0 .0 0 3 2 5
Ro o t Mea n Sq u a r e Er r o r 1 1 0 .6 7 7 6
Mea n o f Resp o n se 8 .5 2 5 5 5 5
Ob se r va t io n s (o r Su m Wgt s) 5 5 7
An aly sis o f Varian ce
So u rce DF Su m o f Squares Mean Square F Ratio
Mo d e l 3 1 4 6 6 8 .2 4 8 8 9 .4 0 .3 9 9 1
Er r o r 5 5 3 6 7 7 3 9 8 8 .5 1 2 2 4 9 .5 Pro b > F
C. To ta l 5 5 6 6 7 8 8 6 5 6 .7 0 .7 5 3 7
Lack Of Fit
So u rce DF Su m o f Squares Mean Square F Ratio
La ck Of Fit 3 0 2 0 3 4 2 2 .5 6 7 8 0 .7 0 .5 3 9 7
Pu r e Er r o r 5 2 3 6 5 7 0 5 6 6 .0 1 2 5 6 3 .2 Pro b > F

233
So u rce DF Su m o f Squares Mean Square F Ratio
To ta l Er r o r 5 5 3 6 7 7 3 9 8 8 .5 0 .9 7 9 4
Max RSq
0 .0 3 2 1
Param eter Estim ates
Term Estim ate Std Erro r t Ratio Pro b>|t|
In t e r cep t 6 .3 8 7 7 4 7 .2 7 6 6 2 5 0 .8 8 0 .3 8 0 4
Lo wer 1 -0 .3 4 3 0 8 7 2 .0 9 6 7 5 3 -0 .1 6 0 .8 7 0 1
Gr o u p [Co n t r o l] 5 .0 8 7 1 7 9 7 4 .8 9 3 4 7 3 1 .0 4 0 .2 9 9 0
(Lo wer 1 +2 .4 3 5 3 7 )*Gr o u p [Co n t r o l] -0 .4 3 5 6 5 1 2 .0 9 6 7 5 3 -0 .2 1 0 .8 3 5 5
Resp o n se Data Up p er o r Lo wer?=Lo wer, Param eters=Δz°
Effect Su m m ary
So u rce Lo gWo rth PValu e
Gr o u p 0 .3 4 8
0 .4 4 8 4 1
Lo wer 1 0 .2 1 1
0 .6 1 5 8 5
Lo wer 1 *Gr o u p 0 .1 6 5
0 .6 8 3 8 1
Su m m ary o f Fit
RSq u a r e 0 .0 0 2 3 1 2
RSq u a r e Ad j -0 .0 0 3 0 9
Ro o t Mea n Sq u a r e Er r o r 1 8 .0 1 1 6 7
Mea n o f Resp o n se 1 .8 8 4 3 8 5

234
Ob se r va t io n s (o r Su m Wgt s) 5 5 8
An aly sis o f Varian ce
So u rce DF Su m o f Squares Mean Square F Ratio
Mo d e l 3 4 1 6 .5 4 1 3 8 .8 4 7 0 .4 2 8 0
Er r o r 5 5 4 1 7 9 7 2 8 .7 7 3 2 4 .4 2 0 Pro b > F
C. To ta l 5 5 7 1 8 0 1 4 5 .3 2 0 .7 3 3 0
Lack Of Fit
So u rce DF Su m o f Squares Mean Square F Ratio
La ck Of Fit 3 0 8 6 8 8 .7 1 2 8 9 .6 2 4 0 .8 8 7 3
Pu r e Er r o r 5 2 4 1 7 1 0 4 0 .0 6 3 2 6 .4 1 2 Pro b > F
To ta l Er r o r 5 5 4 1 7 9 7 2 8 .7 7 0 .6 4 1 5
Max RSq
0 .0 5 0 5
Param eter Estim ates
Term Estim ate Std Erro r t Ratio Pro b>|t|
In t e r cep t 1 .3 2 9 5 3 6 4 1 .1 8 3 1 9 7 1 .1 2 0 .2 6 1 6
Lo wer 1 -0 .1 7 1 3 0 2 0 .3 4 1 2 2 1 -0 .5 0 0 .6 1 5 8
Gr o u p [Co n t r o l] 0 .6 0 3 1 8 1 5 0 .7 9 5 1 0 9 0 .7 6 0 .4 4 8 4
(Lo wer 1 +2 .4 3 5 4 8 )*Gr o u p [Co n t r o l] -0 .1 3 9 0 4 2 0 .3 4 1 2 2 1 -0 .4 1 0 .6 8 3 8

235
Resp o n se Data Up p er o r Lo wer?=Up p er, Param eters= ΔV
Regressio n Plo t
Su m m ary o f Fit
RSq u a r e 0 .0 3 2 4 3 1
RSq u a r e Ad j 0 .0 2 7 7 9 4
Ro o t Mea n Sq u a r e Er r o r 2 .1 3 4 5 3 3
Mea n o f Resp o n se 2 .9 8 0 3 3 9
Ob se r va t io n s (o r Su m Wgt s) 6 3 0
An aly sis o f Varian ce
So u rce DF Su m o f Squares Mean Square F Ratio
Mo d e l 3 9 5 .5 9 9 3 3 1 .8 6 6 4 6 .9 9 4 0
Er r o r 6 2 6 2 8 5 2 .2 0 1 3 4 .5 5 6 2 Pro b > F
C. To ta l 6 2 9 2 9 4 7 .8 0 0 7 0 .0 0 0 1 *
Lack Of Fit
So u rce DF Su m o f Squares Mean Square F Ratio

236
So u rce DF Su m o f Squares Mean Square F Ratio
La ck Of Fit 2 9 3 6 7 .9 4 7 3 1 2 .6 8 7 8 3 .0 4 9 1
Pu r e Er r o r 5 9 7 2 4 8 4 .2 5 4 1 4 .1 6 1 2 Pro b > F
To ta l Er r o r 6 2 6 2 8 5 2 .2 0 1 3 < .0 0 0 1 *
Max RSq
0 .1 5 7 3
Param eter Estim ates
Term Estim ate Std Erro r t Ratio Pro b>|t|
In t e r cep t 2 .9 3 5 1 1 9 1 0 .0 9 6 4 0 3 3 0 .4 5 < .0 0 0 1 *
Up p e r 1 -0 .0 4 8 7 1 1 0 .0 3 3 5 4 6 -1 .4 5 0 .1 4 7 0
Gr o u p [Co n t r o l] -0 .3 0 9 0 1 3 0 .0 8 6 7 3 -3 .5 6 0 .0 0 0 4 *
(Up p e r 1 +1 .1 2 3 8 1 )*Gr o u p [Co n t r o l] 0 .0 7 6 1 7 7 4 0 .0 3 3 5 4 6 2 .2 7 0 .0 2 3 5 *
Resp o n se Data Up p er o r Lo wer?=Up p er, Param eters= Δx°
Effect Su m m ary
So u rce Lo gWo rth PValu e
Up p er 1 1 .6 9 7
0 .0 2 0 1 0
Gr o u p 1 .1 2 2
0 .0 7 5 5 7
Up p e r 1 *Gr o u p 1 .1 1 7
0 .0 7 6 3 9

237
Regressio n Plo t
Su m m ary o f Fit
RSq u a r e 0 .0 1 4 7 6 9
RSq u a r e Ad j 0 .0 0 9 8 0 1
Ro o t Mea n Sq u a r e Er r o r 1 0 .6 5 9 2 6
Mea n o f Resp o n se 2 .6 2 5 0 9
Ob se r va t io n s (o r Su m Wgt s) 5 9 9
An aly sis o f Varian ce
So u rce DF Su m o f Squares Mean Square F Ratio
Mo d e l 3 1 0 1 3 .3 9 3 3 3 7 .7 9 8 2 .9 7 3 0
Er r o r 5 9 5 6 7 6 0 3 .8 4 9 1 1 3 .6 2 0 Pro b > F
C. To ta l 5 9 8 6 8 6 1 7 .2 4 2 0 .0 3 1 2 *
Lack Of Fit
So u rce DF Su m o f Squares Mean Square F Ratio
La ck Of Fit 2 9 4 1 6 6 .5 6 8 1 4 3 .6 7 5 1 .2 8 1 9
Pu r e Er r o r 5 6 6 6 3 4 3 7 .2 8 1 1 1 2 .0 8 0 Pro b > F

238
So u rce DF Su m o f Squares Mean Square F Ratio
To ta l Er r o r 5 9 5 6 7 6 0 3 .8 4 9 0 .1 5 0 0
Max RSq
0 .0 7 5 5
Param eter Estim ates
Term Estim ate Std Erro r t Ratio Pro b>|t|
In t e r cep t 3 .3 0 5 4 8 5 0 .4 9 5 8 9 1 6 .6 7 < .0 0 0 1 *
Up p e r 1 0 .3 9 9 3 1 4 8 0 .1 7 1 3 2 5 2 .3 3 0 .0 2 0 1 *
Gr o u p [Co n t r o l] -0 .7 9 3 5 5 0 .4 4 5 7 8 3 -1 .7 8 0 .0 7 5 6
(Up p e r 1 +1 .1 2 2 7 )*Gr o u p [Co n t r o l] -0 .3 0 4 1 1 7 0 .1 7 1 3 2 5 -1 .7 8 0 .0 7 6 4
Resp o n se Data Up p er o r Lo wer?=Up p er, Param eters= Δy °
Effect Su m m ary
So u rce Lo gWo rth PValu e
Gr o u p 0 .4 4 4
0 .3 6 0 1 1
Up p e r 1 0 .2 7 4
0 .5 3 1 6 3
Up p e r 1 *Gr o u p 0 .0 7 1
0 .8 4 9 4 4

239
Regressio n Plo t
Su m m ary o f Fit
RSq u a r e 0 .0 0 2 4 1
RSq u a r e Ad j -0 .0 0 2 6 2
Ro o t Mea n Sq u a r e Er r o r 6 .3 4 0 1 3 6
Mea n o f Resp o n se 1 .8 6 4 9 5 5
Ob se r va t io n s (o r Su m Wgt s) 5 9 9
An aly sis o f Varian ce
So u rce DF Su m o f Squares Mean Square F Ratio
Mo d e l 3 5 7 .7 7 4 1 9 .2 5 7 9 0 .4 7 9 1
Er r o r 5 9 5 2 3 9 1 7 .4 1 2 4 0 .1 9 7 3 Pro b > F
C. To ta l 5 9 8 2 3 9 7 5 .1 8 5 0 .6 9 6 9
Lack Of Fit
So u rce DF Su m o f Squares Mean Square F Ratio
La ck Of Fit 2 9 1 7 8 9 .5 1 9 6 1 .7 0 7 6 1 .5 7 8 4
Pu r e Er r o r 5 6 6 2 2 1 2 7 .8 9 2 3 9 .0 9 5 2 Pro b > F

240
So u rce DF Su m o f Squares Mean Square F Ratio
To ta l Er r o r 5 9 5 2 3 9 1 7 .4 1 2 0 .0 2 9 1 *
Max RSq
0 .0 7 7 1
Param eter Estim ates
Term Estim ate Std Erro r t Ratio Pro b>|t|
In t e r cep t 1 .9 0 6 7 6 6 1 0 .2 9 4 9 5 6 6 .4 6 < .0 0 0 1 *
Up p e r 1 0 .0 6 3 7 8 0 3 0 .1 0 1 9 0 4 0 .6 3 0 .5 3 1 6
Gr o u p [Co n t r o l] 0 .2 4 2 8 4 4 1 0 .2 6 5 1 5 2 0 .9 2 0 .3 6 0 1
(Up p e r 1 +1 .1 2 2 7 )*Gr o u p [Co n t r o l] -0 .0 1 9 3 5 3 0 .1 0 1 9 0 4 -0 .1 9 0 .8 4 9 4
Resp o n se Data Up p er o r Lo wer?=Up p er, Param eters=Δz°
Effect Su m m ary
So u rce Lo gWo rth PValu e
Gr o u p 0 .5 6 3
0 .2 7 3 4 1
Up p e r 1 0 .4 7 9
0 .3 3 2 1 7
Up p e r 1 *Gr o u p 0 .0 2 1
0 .9 5 3 5 4

241
Regressio n Plo t
Su m m ary o f Fit
RSq u a r e 0 .0 0 3 2 0 9
RSq u a r e Ad j -0 .0 0 1 8 2
Ro o t Mea n Sq u a r e Er r o r 8 9 .2 3 9 7 4
Mea n o f Resp o n se 5 .6 1 0 9 8 2
Ob se r va t io n s (o r Su m Wgt s) 5 9 9
An aly sis o f Varian ce
So u rce DF Su m o f Squares Mean Square F Ratio
Mo d e l 3 1 5 2 5 5 .4 5 0 8 5 .1 3 0 .6 3 8 5
Er r o r 5 9 5 4 7 3 8 4 1 9 .8 7 9 6 3 .7 3 Pro b > F
C. To ta l 5 9 8 4 7 5 3 6 7 5 .2 0 .5 9 0 4
Lack Of Fit
So u rce DF Su m o f Squares Mean Square F Ratio
La ck Of Fit 2 9 3 8 2 8 8 9 .3 1 3 2 0 3 .1 1 .7 1 5 7
Pu r e Er r o r 5 6 6 4 3 5 5 5 3 0 .6 7 6 9 5 .3 Pro b > F
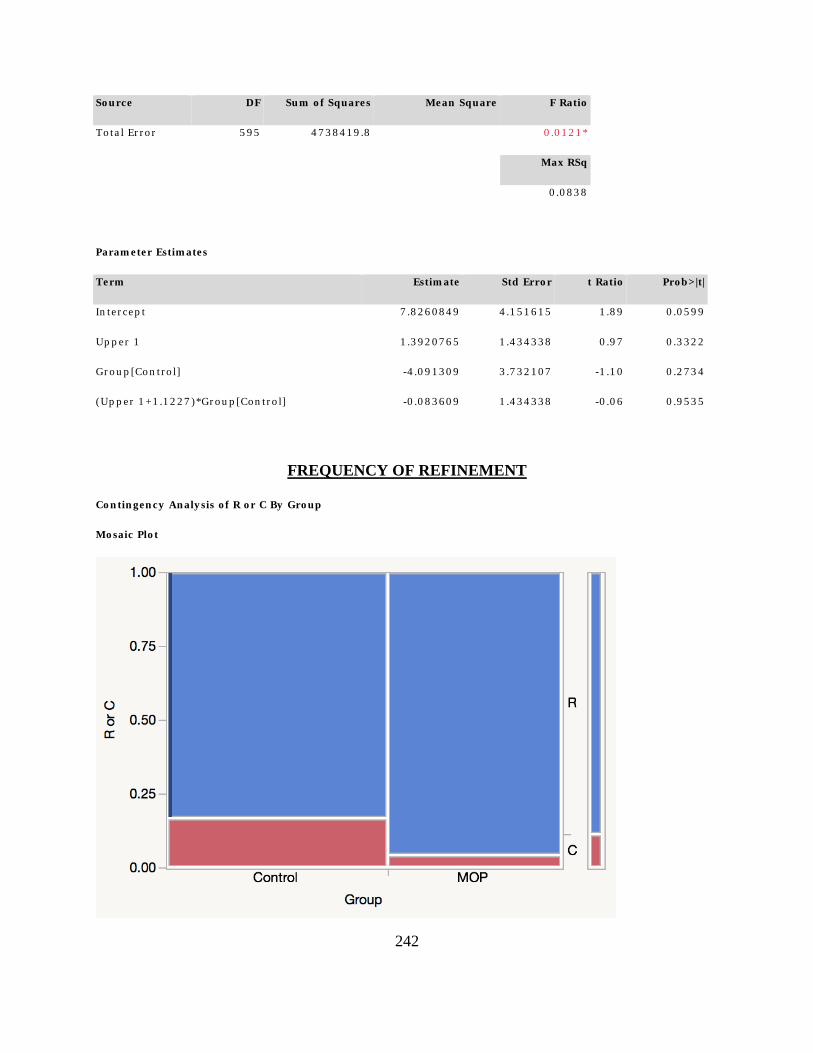
242
So u rce DF Su m o f Squares Mean Square F Ratio
To ta l Er r o r 5 9 5 4 7 3 8 4 1 9 .8 0 .0 1 2 1 *
Max RSq
0 .0 8 3 8
Param eter Estim ates
Term Estim ate Std Erro r t Ratio Pro b>|t|
In t e r cep t 7 .8 2 6 0 8 4 9 4 .1 5 1 6 1 5 1 .8 9 0 .0 5 9 9
Up p e r 1 1 .3 9 2 0 7 6 5 1 .4 3 4 3 3 8 0 .9 7 0 .3 3 2 2
Gr o u p [Co n t r o l] -4 .0 9 1 3 0 9 3 .7 3 2 1 0 7 -1 .1 0 0 .2 7 3 4
(Up p e r 1 +1 .1 2 2 7 )*Gr o u p [Co n t r o l] -0 .0 8 3 6 0 9 1 .4 3 4 3 3 8 -0 .0 6 0 .9 5 3 5
FREQUENCY OF REFINEMENT
Co n tin gen cy An aly sis o f R o r C By Gro up
Mo saic Plo t

243
Co n tin gen cy Table
Gr o u p By R o r C
Co u n t
To t a l %
Co l %
Ro w %
C R To ta l
Co n t r o l 1 0
9 .5 2
8 3 .3 3
1 6 .9 5
4 9
4 6 .6 7
5 2 .6 9
8 3 .0 5
5 9
5 6 .1 9
MOP 2
1 .9 0
1 6 .6 7
4 .3 5
4 4
4 1 .9 0
4 7 .3 1
9 5 .6 5
4 6
4 3 .8 1
To ta l 1 2
1 1 .4 3
9 3
8 8 .5 7
1 0 5
Tests
N DF -Lo gLike RSqu are (U)
1 0 5 1 2 .2 3 8 6 7 4 5 0 .0 6 0 0
Test Ch iSquare Pro b>Ch iSq
Lik e lih o o d Ra t io 4 .4 7 7 0 .0 3 4 3 *
Pea r so n 4 .0 5 5 0 .0 4 4 0 *
Fish er's Exact
Test
Pro b Altern ative Hy p o th esis
Left 0 .9 9 2 8 Pr o b (R o r C=R) is gr ea t e r fo r Gr o u p =Co n t r o l t h a n MOP
Righ t 0 .0 4 0 5 * Pr o b (R o r C=R) is gr ea t e r fo r Gr o u p =MOP th a n Co n t r o l
2 -Ta il 0 .0 6 2 8 Pr o b (R o r C=R) is d iffe r en t a cr o ss Gr o u p

244
Appendix F – Electronic Thesis and Dissertation Signature Form
Copyright © 2022 FDOKUMEN