design and development of wireless acoustic emission sensor ...
220
DESIGN AND DEVELOPMENT OF WIRELESS ACOUSTIC EMISSION SENSOR SYSTEM FOR STRUCTURAL HEALTH MONITORING APPLICATIONS By CHANDAN KUMAR BHAGAT (Enrollment No: ENGG02201204005) Indira Gandhi Centre for Atomic Research, Kalpakkam A thesis submitted to the Board of Studies in Engineering Sciences In partial fulfillment of requirements for the Degree of DOCTOR OF PHILOSOPHY of HOMI BHABHA NATIONAL INSTITUTE June, 2020
-
Upload
khangminh22 -
Category
Documents
-
view
7 -
download
0
Transcript of design and development of wireless acoustic emission sensor ...

DESIGN AND DEVELOPMENT OF WIRELESS ACOUSTIC EMISSION SENSOR SYSTEM FOR STRUCTURAL
HEALTH MONITORING APPLICATIONS
By
CHANDAN KUMAR BHAGAT (Enrollment No: ENGG02201204005)
Indira Gandhi Centre for Atomic Research, Kalpakkam
A thesis submitted to the Board of Studies in Engineering Sciences
In partial fulfillment of requirements for the Degree of
DOCTOR OF PHILOSOPHY
of
HOMI BHABHA NATIONAL INSTITUTE
June, 2020


STATEMENT BY AUTHOR
This dissertation has been submitted in partial fulfilment of requirements for an advanced
degree at Homi Bhabha National Institute (HBNI) and is deposited in the library to be made
available to borrowers under rules of the HBNI.
Brief quotations from this dissertation are allowable without special permission, provided
that accurate acknowledgement of source is made. Requests for permission for extended
quotation from or reproduction of this manuscript in whole or in part may be granted by the
competent authority of HBNI when in his or her judgment the proposed use of the material
is in the interests of scholarship. In all other instances, however, permission must be obtained
from the author.
Date: 12/06/2020
Place: Kalpakkam (CHANDAN KUMAR BHAGAT)

DECLARATION
I, hereby declare that the investigation presented in the thesis entitled “Design and
development of wireless acoustic emission sensor system for structural health
monitoring applications” submitted to Homi Bhabha National Institute (HBNI), Mumbai,
India, for the award of Doctor of Philosophy in Engineering Sciences, is the record of work
carried out by me under the guidance of Dr. C. K. Mukhopadhyay, Professor, HBNI and
former Head, Non Destructive Evaluation Division, Metallurgy and Materials Group, Indira
Gandhi Centre for Atomic Research, Kalpakkam. The work is original and has not been
submitted earlier as a whole or in part for a degree / diploma at this or any other
Institution/University.
Date: 12/06/2020
Place: Kalpakkam (CHANDAN KUMAR BHAGAT)

LIST OF PUBLICATIONS ARISING FROM THE THESIS
Journal
a) Published
1. Chandan K. Bhagat, Nilangshu K. Das, C. K. Mukhopadhyay and B. Purna
Chandra Rao, “Hardware-based parameter extraction of acoustic emission burst
signal for structural health monitoring applications”, IETE Journal of Research,
Vol. 65, pp. 157-163, May 2018. https://doi.org/10.1080/03772063.2017.1417753.
2. Chandan K. Bhagat, C. K. Mukhopadhyay and B. Purna Chandra Rao, “Design
and development of signal conditioning unit for acquisition of acoustic emission
signal for metallic materials”, Transactions of the Indian Institute of Metals, Vol.
71, pp. 1913-1918, August 2018. https://doi.org/10.1007/s12666-018-1326-8.
b) Under Review
1. Chandan K. Bhagat, C. K. Mukhopadhyay and B. Purna Chandra Rao, “Design
and development of wireless acoustic emission sensor system for structural health
monitoring of concrete”, Journal of IETE Technical Review.
2. Chandan K. Bhagat and C. K. Mukhopadhyay, “Design development and
validation of data acquisition for acoustic emission signals using programmable
system on chip”, IET Science, Measurement & Technology.

Conferences
1. Chandan K. Bhagat, Nilangshu K. Das, C. K. Mukhopadhyay and B. Purna
Chandra Rao, “Acoustic emission signal conditioning and analysis using digital
storage oscilloscope”, IEEE Conference Proceedings (ICCES), pp. 1–4, 2016.
DOI:10.1109/CESYS.2016.7889941.
2. Chandan K. Bhagat, C. K. Mukhopadhyay and B. Purna Chandra Rao, “Design
scheme of wireless acoustic emission sensor system”, National Conference on
Condition Monitoring (NCCM-2017), October 26-27, 2017, Kalpakkam, India.
3. Chandan K. Bhagat, C. K. Mukhopadhyay and B. Purna Chandra Rao,
“Parameter analysis of acoustic emission signals for characterizing damage and
crack growth in concrete”, Conference & Exhibition on Non-destructive
Evaluation (NDE-2017), December 14-16, 2017, Chennai.
4. Chandan K. Bhagat and C. K. Mukhopadhyay, “Parameter analysis of acoustic
emission signals for characterizing corrosion damage in concrete”, Second
International Conference on Structural Integrity (ICONS), December 14-17, 2018,
Chennai.
(CHANDAN KUMAR BHAGAT)

DEDICATIONS
TO MY FAMILY MEMBERS AND MENTORS

ACKNOWLEDGEMENT
This thesis would not have been possible without the support and encouragement of many
people who contributed and extended their valuable co-operation for the completion of the
research work. I fell short of words in expressing my appreciation for their help at various
stages of this work.
First and foremost, I would like to express my sincere gratitude to my guide Dr. C. K.
Mukhopadhyay, Professor, HBNI and former Head, Non Destructive Evaluation Division
(NDED), Metallurgy and Materials Group (MMG), Indira Gandhi Centre for Atomic
Research (IGCAR), Kalpakkam for his continuous support, encouragement, enthusiasm
and immense knowledge. His intellectual ideas and guidance helped me in my research
work and writing this thesis. He has always been a source of motivation for me in difficult
times during the research work. I express my deep sense of appreciation for his support and
for energizing me to overcome all the hurdles.
I am thankful to my doctoral committee members Dr. B. K. Panigrahi (Chairman), Dr. B.
P. C. Rao (Co-Guide), Dr. K. Velusamy (Member) and Dr. V. S. Srinivasan (Member)
for their encouragement, insightful comments and suggestions. I thank all the Professors
of HBNI who taught me various subjects during my course work.
I express my sincere gratitude to Dr. A. K. Bhaduri, Director, IGCAR and Dr. G.
Amarendra, former Director, MMG, IGCAR, for their inspiration and encouragement. I
express sincere gratitude to Dr. Shaju K. Albert, Director, MMG, IGCAR for inspiration

and encouragement. Furthermore, I sincerely thank the Department of Atomic Energy
(DAE), India, for providing the necessary financial support. I would like to thank Dr. M.
Saibaba (former Dean, Student Affairs), Dr. Lakshmi Narasimhan (Dean, Student Affairs),
Dr. G. Sasikala (former Dean, Engineering Sciences), Dr. Anish Kumar (Dean,
Engineering Sciences) and authorities of GSO, Kalpakkam for providing a pleasant
accommodation in the enclave.
I would like to express my sincere gratitude to Dr. N. K. Das (former Scientific Officer,
NDED, IGCAR) for his help and support. I would like to express my gratitude to Mr. T.
K. Haneef, NDED, IGCAR, for help in carrying out the experimental work. I am grateful
to Dr. S. Thirunavukkarasu, NDED, IGCAR, for his invaluable inputs, constant
encouragement and support in preparing this thesis.
I express my gratitude to IGCAR colleagues, especially, Mr. V. Arjun, Dr. B. Sasi, Dr. W.
Sharatchandra Singh, Dr. T. Saravanan and Dr. G. K. Sharma, for their support and help
in carrying out the experiments. I thank my colleagues Dr. Varun Hasija, Mr. Manoj
Kumar Parida, Dr. Vikas Kumar, Mr. Shivang Triphati, Mr. T. S. Nidhin, Dr. Anil
Kumar Soni, Dr. S. Shuaib Ahmed, Dr. Sambasiva Rao Kambala, Mr. Santosh Kumar,
Mr. K. Thirukkumaran, Dr. K. Prajna, Ms. Vijayachandrika, Ms. Sumana and other
NDED members and Research scholars for their suggestions and moral support.
Apart from the intellectual support, emotional support is always needed to conquer the
hardship. For this, I would like to thank, from the bottom of my heart, Mr. A. Viswanath,
Mr. G. V. K. Kishore, Mr. G. M. S. K. Chaitanya, Mr. Manoj Kumar Raja, Mr. M.

M. Narayanan, Mr. A. Ravi Gopal, Mr. S. Ponseenivasan and Ms. S. Sosamma for their
help and support.
I thank all the members of Enclave cricket and badminton team for the funny,
entertaining and exciting moments we shared during cricket and badminton matches. I
would also like to express my heartfelt thanks to the Mess Cook, Hostel in charge, and
especially cleaning staff for making the stay at the enclave very pleasant and lovely one.
Finally, I would like to express my heartfelt gratitude to most important persons in my life
that is my beloved parents Mr. Mahendra Kumar Bhagat and Ms. Kunti Devi along with
my father-in-law Mr. Ramjee Bhagat and mother-in-law Ms. Anita Devi who have been
so caring and supportive of me all the time. I would like to thank and share this achievement
with my beloved wife Ms. Kumari Rashmi, who has always been with me creating a
cheerful world filled with love, affection, and support.
Above all, I thank the Almighty, for granting me wisdom, health and strength to undertake
this research work and enabling me to take it to completion. He is the one who knows all
the hardships, all my hard works and he is the one whose satisfaction and acceptance I seek
the most.
(CHANDAN KUMAR BHAGAT)

Table of Contents
Abstract ............................................................................................................................. i
List of figures .................................................................................................................. iii
List of tables .................................................................................................................... ix
List of abbreviations ........................................................................................................ xi
1 Introduction .............................................................................................................. 1
1.1 Preamble ........................................................................................................... 1
1.2 Non-destructive testing ..................................................................................... 1
1.3 Structural health monitoring (SHM) .................................................................. 3
1.4 Acoustic emission testing (AET) ....................................................................... 6
1.4.1 Acoustic emission (AE) source mechanism ................................................. 9
1.4.2 Background noise ...................................................................................... 12
1.5 Advantages and limitations of AET ................................................................. 14
1.5.1 Advantages................................................................................................ 14
1.5.2 Limitations ................................................................................................ 15
1.6 Applications of AET ....................................................................................... 16
1.7 Instrument of AET .......................................................................................... 19
1.7.1 Acoustic emission sensor ........................................................................... 20
1.7.1.1 Calibration of sensor .......................................................................... 21
1.7.2 Amplification ............................................................................................. 23
1.7.3 Filter .......................................................................................................... 23
1.7.4 Cable ......................................................................................................... 24
1.7.5 Couplant .................................................................................................... 24
2 Literature Survey ..................................................................................................... 27
2.1 Preamble.......................................................................................................... 27
2.2 Acoustic emission signal .................................................................................. 27
2.3 AET for damage detection of concrete ............................................................. 32
2.4 Acoustic emission system ................................................................................ 35
2.4.1 Wireless structural health monitoring ......................................................... 37
2.4.1.1 Signal conditioning unit (SCU) ........................................................... 40
2.4.1.2 Parameter processing of AE signal ...................................................... 43
2.4.1.3 Data Acquisition (DAQ) ..................................................................... 44
2.4.1.4 PSoC based DAQ device and computational core unit (CCU) ............. 45
2.4.1.5 PSoC family ....................................................................................... 48
2.5 Motivation and objective ................................................................................. 51
2.6 Organization of the thesis ................................................................................ 53
3 Design development and validation of the signal conditioning unit ......................... 55
3.1 Preamble.......................................................................................................... 55
3.2 Introduction ..................................................................................................... 55
3.3 Sensor with integral pre-amplifier ................................................................... 56
3.3.1 Sensor ....................................................................................................... 56
3.4 Signal conditioning unit .................................................................................. 59
3.4.1 Sensing interface circuit ............................................................................ 60
3.4.2 Gain control amplifier ............................................................................... 62
3.4.3 Filter design .............................................................................................. 63
3.5 Design validation of the SCU .......................................................................... 66
3.5.1 Metallic material ....................................................................................... 66
3.5.2 Concrete .................................................................................................... 72
3.6 Summary ........................................................................................................ 76
4 Simulation study for parameters extraction of burst type AE signals ....................... 79
4.1 Preamble ......................................................................................................... 79
4.2 Hardware design for parameter extraction ....................................................... 79
4.2.1 Processing board (AE Board) .................................................................... 82
4.2.1.1 Analog circuit block ........................................................................... 84
4.2.1.2 Digital circuit block ............................................................................ 88
4.2.2 Results and discussion ............................................................................... 93
4.3 Summary ........................................................................................................ 97
5 Design development and validation of data acquisition device ............................... 99
5.1 Preamble ......................................................................................................... 99
5.2 Introduction ..................................................................................................... 99
5.3 Description of PSoC family and its selection ................................................. 100
5.4 Data acquisition system ................................................................................. 105
5.4.1 Design of data acquisition hardware ......................................................... 107
5.4.2 Data acquisition software design .............................................................. 109
5.5 Signal generator device .................................................................................. 110
5.6 Communication interface ............................................................................... 113
5.7 Experimental, results and discussion .............................................................. 115
5.8 Summary ....................................................................................................... 118
6 Design development and validation of wireless AE sensor system ........................ 119
6.1 Preamble........................................................................................................ 119
6.2 Wireless sensing hardware design and architecture ........................................ 119
6.2.1 Redesign of the signal conditioning unit ................................................... 121
6.2.2 Design of the computational core unit ...................................................... 123
6.2.3 Wireless communication unit ................................................................... 126
6.3 Assembled prototype wireless sensor unit ...................................................... 127
6.4 Performance validation of the wireless sensor unit ......................................... 130
6.4.1 Signal validation using artificial AE signal ............................................... 130
6.4.2 Signal validation using pencil lead break .................................................. 132

6.4.3 Application of the wireless AE sensor system to concrete compression test
…………………………………………………………………………….134
6.4.4 Application of the wireless AE sensor system to concrete corrosion test .. 142
6.5 Summary ...................................................................................................... 146
7 Conclusion, contribution and scope for future work ............................................. 149
7.1 Conclusion .................................................................................................... 149
7.2 Contribution .................................................................................................. 151
7.3 Scope of future work ..................................................................................... 153
Appendix ...................................................................................................................... 155
A .................................................................................................................................. 155
B .................................................................................................................................. 159
C .................................................................................................................................. 163
References .................................................................................................................... 169


i
Abstract
Acoustic emission (AE) testing plays a significant role in structural health monitoring
(SHM) applications. Acoustic emissions are high frequency (20 kHz – 1 MHz) stress waves,
which are generated due to crack initiation and fracture growth behaviour of a
material/structure by the rapid release of transient energy from the confined sources. AE
testing involves the recording of these waves using piezoelectric sensors attached to the
surface of structures under test and then analyzing the signals to extract information about
the nature of the sources. There are different parameters associated with acoustic emission
signals such as peak amplitude, RMS, counts, cumulative counts, rise time, and event
duration. These parameters are beneficial for assessing the AE activity obtained during
SHM applications and provide vital information about the integrity of components. A few
commercial AE systems are available for these applications, the cost of which is very high,
and details of instrumentation development proprietary in nature. For continuous monitoring
of structures, typical AE sensing systems demand compact, portable and battery-operated
devices. Distributed AE sensing also demands less wiring complexities for the ease of
deployment and maintenance. In this context, the present thesis presents a first of its kind
details about the design and development of a wireless acoustic emission sensor system
(AE-SS) for structural health monitoring applications using the programmable system on
chip (PSoC). The design challenges and validation of different sub-modules of AE-SS, such
as signal conditioning unit (SCU), data acquisition (DAQ) device, and computational core
unit (CCU) have been realized towards achieving the objectives of the thesis:
A signal conditioning unit has been designed and developed for amplifying weak AE signals
enabling their further processing. The performance of the developed SCU has been validated

ii
using artificial AE events generated by pencil lead break (PLB) test. A novel hardware
design approach has been proposed for the extraction of the parameters of AE signals. A
data acquisition device has been designed and developed on the programmable system on
chip. The developed DAQ device has also been validated by using an artificial burst type
AE signal. Zigbee based wireless communication unit is interfaced with the CCU for
transmission of AE parameters and their analysis. Different sub-modules of the wireless AE
sensor system have been fabricated and assembled in a compact single two-layer printed
circuit board (PCB).
Finally, the AE results obtained from compression and corrosion tests of concrete using the
developed wireless system have been compared with those obtained by using a
commercially available wired system for validation. The results of compression and
corrosion tests of concrete have been verified with scanning electron microscopy and X-ray
radiography methods. The developed wireless system offers several unique advantages such
as it is cost-effective, compact in size (85 mm x 56 mm), easy to install on structures,
portable, low power consumption (50 mA) capability to ensure long term monitoring in a
single charge battery supply and remote operational capability. The developed AE system
can be effectively utilized for condition monitoring and health monitoring of structures and
components such as nuclear power plant (NPP) containments, bridges, tanks, and
components in petrochemical industries where corrosion is a potential issue, with utmost
ease and efficiency.
iii
List of figures
Figure No. Caption Page No.
Figure 1.1 Block diagram representation of the SHM system ............................................ 5
Figure 1.2 Process block diagram of the acoustic emission testing. ................................... 7
Figure 1.3 Basic of acoustic emission activity shows the Kaiser effect (BCB), Felicity effect
(DEF) and emission during hold (GH) [45]. .................................................................... 11
Figure 1.4 AET applications: (a) pressure vessel, (b) pipeline leakage inspection, (c)
inspection of weld quality and (d) integrity monitoring of bridge [48]. ........................... 17
Figure 1.5 Hsu-Nielson source. ....................................................................................... 22
Figure 2.1 (a) Burst type AE signal and (b) Continuous type AE signal [56]. .................. 28
Figure 2.2 Cumulative counts (CC) by compression tests in (a) plain concrete and (b) fly
ash concrete for different periods of curing [83]. ............................................................ 35
Figure 2.3 Block diagram architecture of acoustic emission sensor system. .................... 36
Figure 2.4 Block diagram of signal conditioning. ............................................................ 41
Figure 2.5 Block diagram of typical MCU [139]. ............................................................ 47
Figure 2.6 Block diagram of PSoC 5LP [139]. ................................................................ 47
Figure 2.7 Comparison of PSoC family. ......................................................................... 49
Figure 3.1 Block diagram of the acoustic emission system. ............................................. 56

iv
Figure 3.2 Block diagram of the signal conditioning unit. ................................................ 59
Figure 3.3 Sensing interface circuit design. ..................................................................... 62
Figure 3.4 Circuit design for the digital gain control amplifier. ........................................ 63
Figure 3.5 Schematic design and simulation results of the bandpass filter. ....................... 65
Figure 3.6 Photograph of prototype signal conditioning unit. ........................................... 66
Figure 3.7 Photograph of experimental setup used for acoustic emission testing on a metallic
plate using (a) developed signal conditioning unit and (b) commercially available PAC
system. ............................................................................................................................ 68
Figure 3.8 Result of pencil lead break test of AE signals for the plate received from sensor
one and sensor two respectively by the developed conditioning unit. ................................ 69
Figure 3.9 Result of pencil lead break test of AE signals for the plate received from sensor
one and sensor two respectively by the PAC system. ........................................................ 69
Figure 3.10 FFT of PLB test signals acquired using the developed SCU. .......................... 71
Figure 3.11 FFT of PLB test signals acquired using the PAC system. ............................... 71
Figure 3.12 Photograph of the experimental setup used for acoustic emission testing in
concrete. ......................................................................................................................... 72
Figure 3.13 PLB signals and corresponding FFT for distances of 10 cm (a), 20 cm (b) and
30 cm (c) from the sensor. ............................................................................................... 75
Figure 3.14 Peak amplitude of the AE signal versus distance from the sensor. .................. 76

v
Figure 4.1 Schematic design of a hardware system for parameter extraction of the AE signal.
....................................................................................................................................... 81
Figure 4.2 Flow diagram representation of the hardware system functionality................. 82
Figure 4.3 Block diagram of AE Board with the components used in the design. ............ 83
Figure 4.4 AE Board design. ........................................................................................... 84
Figure 4.5 AnalogCircuit (Analog circuit) block design. ................................................. 84
Figure 4.6 Peak detect circuit along with peak reset. ....................................................... 86
Figure 4.7 RMS circuit design. ....................................................................................... 87
Figure 4.8 Differentiator circuit design. .......................................................................... 87
Figure 4.9 Rise time clock circuit design. ....................................................................... 88
Figure 4.10 Digital circuits (DigitalCircuit) block design. ............................................... 89
Figure 4.11 Monoshot circuit design. .............................................................................. 90
Figure 4.12 Retriggerable monoshot circuit design. ........................................................ 90
Figure 4.13 Short pulse circuit design. ............................................................................ 90
Figure 4.14 Simulation results of (a) AnalogCircuit block and (b) DigitalCircuit block. .. 94
Figure 5.1 Block diagram representation of PSoC 5LP kit [108]. .................................. 104
Figure 5.2 Data acquisition system block diagram. ....................................................... 106
Figure 5.3 Block diagram representation of components used for the DAQ. ................. 107

vi
Figure 5.4 Schematic design of the DAQ in PSoC creator 4.0 IDE. ............................... 108
Figure 5.5 Software design flow chart for the acquisition of AE signals. ....................... 109
Figure 5.6 Schematic design of the signal generator device in PSoC creator 4.0 IDE. .... 111
Figure 5.7 Block diagram of signal validation test. ........................................................ 112
Figure 5.8 Photograph of the experimental setup for validation of the AE signal generator.
..................................................................................................................................... 112
Figure 5.9 (a) Burst type AE signal generated and it's (b) FFT received from signal generator
device. .......................................................................................................................... 113
Figure 5.10 Photograph of the experimental setup for the data acquisition system. ........ 116
Figure 5.11 Burst type AE signal received from DAQ displayed using LabVIEW. ........ 116
Figure 5.12 AE signal received from the (a) DAQ and its (b) FFT. ................................ 117
Figure 6.1 System architecture block diagram for the wireless AE sensor system. ......... 120
Figure 6.2 Multisim simulation result for the bandpass filter. ........................................ 122
Figure 6.3 Optimized circuit diagram of SCU in a single IC. ......................................... 122
Figure 6.4 Design of computational core unit in a PSoC creator 4.0 IDE. ...................... 123
Figure 6.5 Front and rare views of integrated prototype wireless AE sensor unit. .......... 128
Figure 6.6 Voltage and current are measured by USB meter. ......................................... 129
Figure 6.7 Block diagram representation of test setup for signal validation test. ............ 131

vii
Figure 6.8 Photograph of the test setup made in the laboratory for validation of wireless AE
sensor system. .............................................................................................................. 131
Figure 6.9 FFT of the signal received from the wireless sensor system. ........................ 132
Figure 6.10 Photograph of the experimental setup of the wired based PAC system along
with the wireless AE sensor system in the Lab. ............................................................. 133
Figure 6.11 Pencil lead break test signal and it’s FFT from (a) wireless AE system and (b)
wired PAC system. ....................................................................................................... 134
Figure 6.12 Photograph of an experimental setup for the compression test of concrete
specimen. ..................................................................................................................... 136
Figure 6.13 Counts and applied load as a function of time from (a) developed wireless AE
system and (b) wired PAC system. ............................................................................... 139
Figure 6.14 Cumulative counts and applied load as a function of time from (a) developed
wireless AE system and (b) wired PAC system. ............................................................ 139
Figure 6.15 RMS and applied load as a function of time from (a) developed wireless AE
system and (b) wired PAC system. ............................................................................... 140
Figure 6.16 Peak amplitude and applied load as a function of time from (a) developed
wireless AE system and (b) wired PAC system. ............................................................ 140
Figure 6.17 Rise time and applied load as a function of time from (a) developed wireless
AE system and (b) wired PAC system. ......................................................................... 141
Figure 6.18 Event duration and applied load as a function of time from (a) developed
wireless AE system and (b) wired PAC system. ............................................................ 141

viii
Figure 6.19 SEM images of the fracture surface of a concrete specimen. ....................... 142
Figure 6.20 Photograph of an experimental setup for the concrete corrosion test in the Lab.
..................................................................................................................................... 143
Figure 6.21 Cumulative count as a function of time in days from (a) developed wireless AE
system and (b) wired PAC system. ................................................................................ 144
Figure 6.22 X-ray radiography image of concrete block (a) without corrosion (b) after
accelerated corrosion ..................................................................................................... 145
ix
List of tables
Table No. Caption Page No.
Table 3.1 Specifications of the sensors used for metallic material ................................... 57
Table 3.2 Specifications of the sensor used for concrete specimen. ................................. 58
Table 4.1 AE parameters measurement values (Figure 4.14a and Figure 4.14b) .............. 95
Table 4.2 Event duration measurement values taken from the simulation data (Figure 4.14b)
....................................................................................................................................... 97
Table 4.3 Rise time measurement values taken from the simulation data (Figure 4.14 b) 97
Table 5.1 PSoC types and specifications ....................................................................... 101
Table 5.2 The UART parameters configuration for DAQ and the PC. ........................... 115
Table 6.1 Key characteristics of the ZigBee wireless transceiver................................... 127
Table 6.2 Approximate current consumption of different components. ......................... 129
Table 6.3 Details of specimens used for compression tests ............................................ 135
Table 6.4 Specifications of the sensor used with the wired PAC, USA system ............. 137

x
xi
List of abbreviations
ADC Analog to digital converter AE-SS Acoustic emission sensor system AET Acoustic emission testing API Application programmer interface ARM Advanced RISC Machine ASCII American standard code for information interchange ASIC Application specific integrated circuit BW Bandwidth CAN Controlled area network CCU Computational core unit CMRR Common mode rejection ratio CPU Central processing unit CRC Cyclic redundancy check DAC Digital to analog converter DAQ Data acquisition DC Direct current DMA Direct memory access DSO Digital storage oscilloscope ECT Eddy current testing EMI Electromagnetic interference FFT Fast Fourier Transform FPGA Field programmable gate array FRC Fiber reinforced concrete GUI Graphical user interface I2C Inter Integrated Circuit IC Integrated circuit IDE Integrated development environment IRT Infrared testing ISR Interrupt Service routine JTAG Joint test action group kHz Kilo Hertz kSPS Kilo sample per second LED Light emitting diode LPT Liquid penetrant testing MCU Microcontroller MHz Mega Hertz MOS Metal oxide semiconductor MPT Magnetic particle testing

xii
MSPS Mega sample per second NDE Non-destructive evaluation NPP Nuclear power plant OPAMP Operational amplifier PAC Physical Acoustic Corporation PC Personal computer PCB Printed circuit board PGA Programmable gain amplifier PRS Pseudo random sequence PSoC Programmable system on chip RAM Random access memory RMS Root mean square ROM Read only memory RT Radiography testing SAR Successive approximation register SCU System control unit SEM Scanning electron microscope SHM Structural health monitoring SNR Signal to noise ratio SoC System on chip SPI Serial peripheral interface SS Stainless steel UART Universal asynchronous receiver and transmitter USB Universal synchronous Bus UT Ultrasonic testing VREF Reference voltage VS Visual studio VT Visual testing
Chapter 1
1
1 Introduction
1.1 Preamble
This chapter provides a brief introduction to non-destructive evaluation (NDE), structural
health monitoring (SHM), principles of acoustic emission testing (AET), and acoustic
emission instrument. As the thesis is concerned with the development of an instrument for
SHM applications using acoustic emission method, a brief description of the method, and
signal analysis is discussed.
1.2 Non-destructive test ing
Non-destructive testing (NDT) is an interdisciplinary technology that plays a vital role in
ensuring the quality and structural integrity of components and systems [1]. The NDT is
defined as the identification of the physical condition of materials/structures without
affecting their intended functions [2]. NDT technologies are essential in various industries,
including petrochemical, nuclear, aerospace, construction, automotive, and defence [3].
Several NDT methods are available based on a particular physical principle [4-9]. There
exist different NDT methods which are used for inspection of materials/structures such as
visual testing (VT), magnetic particle testing (MPT), radiography testing (RT), liquid
penetrant testing (LPT), ultrasonic testing (UT), vibration testing (VT), eddy current testing

Chapter 1
2
(ECT), infrared thermography testing (IRT) and acoustic emission testing (AET). These
methods are further subdivided into various techniques. These methods and techniques lend
themselves well to specific applications such as structural integrity assessment, online
monitoring, etc. through detection and characterization of damage and defects, e.g., cracks,
porosity, inclusions [10-11]. Judicious selection of methods and techniques is an essential
part according to the area of applications.
NDT methods can be classified into offline and online. The methods such as VT, LPT, MPT,
RT, UT and ECT are offline while the vibration testing, AET and IRT are online. NDT
methods generally use some form of energy such as x-ray radiation, ultrasonic waves and
electromagnetic waves, to interrogate a material/structure. The interaction of this energy
with the material/structure is sensed to detect the presence of flaws. AET is an exception to
this, wherein the material/structure under test acts as a source for the emission of acoustic
waves which are associated with dynamic events such as the growth of cracks and
microstructural degradation [12]. Thus, AET is useful for the continuous monitoring of large
structures such as pressure vessels, aircraft and concrete bridges in real-time. The AE
method is distinct in two main aspects from other traditional NDT methods. Firstly, in the
AE method, an external stimulus is present to aid the dynamic events. Secondly, the AE
method detects the internal changes in materials subject to loading. AET is widely used for
early fault detection and diagnosis compared to other NDT methods for monitoring

Chapter 1
3
materials/structures [13-14]. The details of structural health monitoring are discussed
subsequently.
1.3 Structural health monitoring (SHM)
SHM is adopted to assess the healthiness/condition of structures through their monitoring
and any damage sensing before failure. SHM is vital for monitoring the health of any
structure to ensure the safety of working personnel and has economic implications [15].
SHM is a new concept in the field of engineering. It is intended for continuous monitoring
of structures in real-time. It also evaluates the structural performance under various external
stimulus to identify damage or deterioration, in order to ensure the healthiness of the
structures/components. Towards the advancement in SHM, many non-destructive testing
methods have been developed over the past three decades [16-17]. NDT including proof
loading, coring, radar methods and conductivity mapping have all been used for
enhancement of the visual inspection method for concrete and sandstone based civil
structures [18-19]. Many researchers have gone about trying to determine the best methods
of damage prognosis in mechanical, civil and aerospace structures for SHM applications.

Chapter 1
4
Structural health monitoring is applied to monitor the operational loads and to the
components/structures which are prone to accidental impairment [20].
The structural health monitoring on a continuous real-time basis is essential for
manufacturing, end-users and maintenance teams. SHM system allows optimal use of the
structure, avoidance of catastrophic failure and a minimized downtime. The SHM system,
once correctly implemented, shows improvement in a product and drastically changes
maintenance service. The drastic changes in maintenance philosophy are described in
several publications, particularly for civil infrastructure [21], military air vehicle [22], army
systems [23] and civil aircraft [24]. In civil infrastructure, wireless SHM is a potential tool
for condition monitoring applications [20]. SHM system involves the integration of
structures, sensors, computational core, data transmission, computational power, and
PC/Server/Base station. The typical block diagram representation of the SHM system is
given in Figure 1.1.
In an SHM application, the sensor is mounted on the monitoring material or structure for
the detection of signals generated by crack growth or fracture. The signals are acquired and
processed using the computational core. Finally, the processed signals are transmitted
through wired/wireless mode to the personal computer/server/Base station for data

Chapter 1
5
collection, data analysis and diagnostics towards structures/materials condition assessment.
The power management is taken care of by the computational power of the individual
system used in the design of SHM systems. The current trend and widely accepted methods
for monitoring large structures are based on sensor network technology where multiple
sensors are mounted on the structures.
Figure 1.1 Block diagram representation of the SHM system
Traditionally SHM uses wired technology for collecting AE data. SHM has advantages in
its anti-interference ability. Also, the wired system requires a large number of cables, and
increases workforce, wiring complexity and cost of maintenance as the number of sensor
node increases. Also, in some situations, it may not be possible to install cables for such
monitoring. The technological improvement in wireless technology has enabled the wireless

Chapter 1
6
system to overcome the constraints of the wired system. AET plays a significant role in
structural health monitoring. The details of AET, including its applications and
instrumentation, are explained subsequently.
1.4 Acoustic emission test ing (AET)
Acoustic emission is generated by a release of transient energy from the localized source
when materials are subjected to an external stimulus like pressure, load and temprature[25].
Acoustic emission is one of the structural health monitoring techniques to monitor the
performance and integrity of the structure when subjected to a stimulus. AET has emerged
as a potential and reliable NDT method that can provide an estimate of the source location,
severity and type of damage in the material/structure [26-27]. The frequency range of
interest in AET is from 20 kHz to 1 MHz. AET is useful in the detection of initial stage
failure and onset of cracking during monitoring of structures under loading condition. There
are different structures such as bridges, buildings and aircraft which are vital for modern
society. While these structures are designed to provide sustainable functionality under
reasonable operating condition, it is also often necessary to re-examine their integrity in the
presence of any structural deterioration [28] or after extreme loading scenarios [29-30].
When a load is applied to a material, it results in the transient energy/stress wave release
from the material. The transient energy released travels in the form of a spherical wavefront
in the material. These stress waves undergo distortion and attenuation while travelling
through the material. The part of the wave reaching the material surface is highly distorted
Chapter 1
7
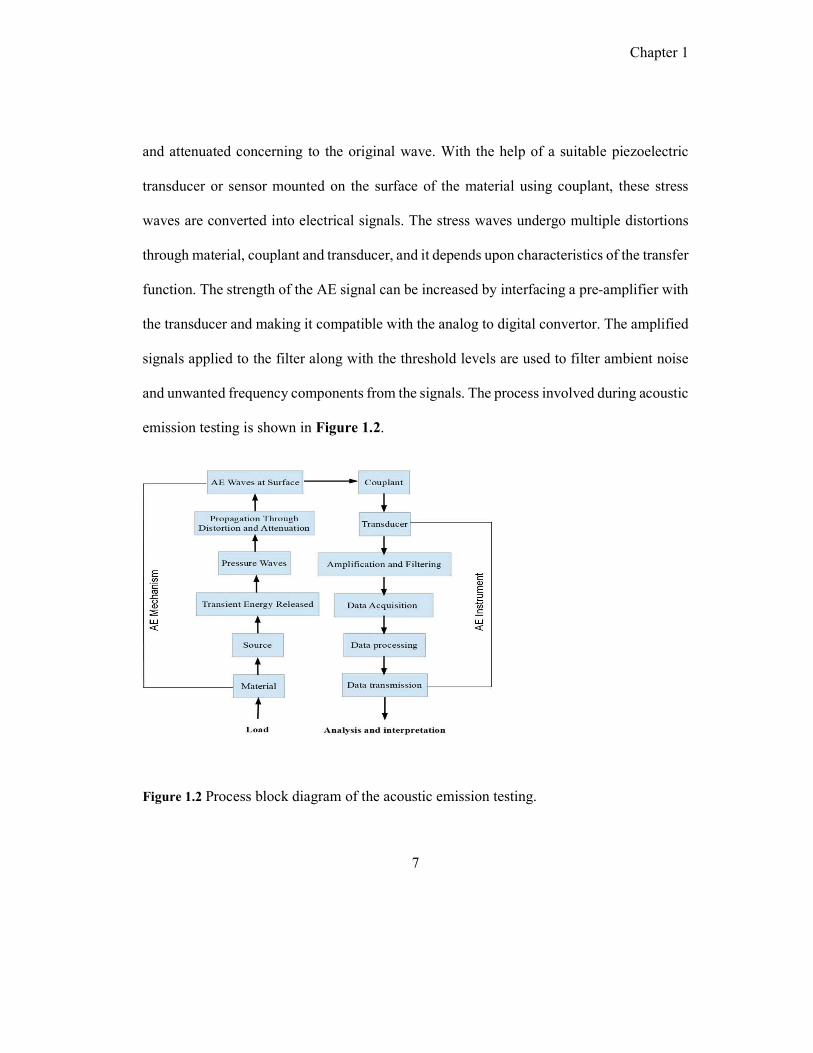
and attenuated concerning to the original wave. With the help of a suitable piezoelectric
transducer or sensor mounted on the surface of the material using couplant, these stress
waves are converted into electrical signals. The stress waves undergo multiple distortions
through material, couplant and transducer, and it depends upon characteristics of the transfer
function. The strength of the AE signal can be increased by interfacing a pre-amplifier with
the transducer and making it compatible with the analog to digital convertor. The amplified
signals applied to the filter along with the threshold levels are used to filter ambient noise
and unwanted frequency components from the signals. The process involved during acoustic
emission testing is shown in Figure 1.2.
Figure 1.2 Process block diagram of the acoustic emission testing.
Chapter 1
8
The dynamic events such as dislocation movement, slip, twinning, phase transformation,
initiation and propagation of cracks, and fusion (welding) are typical examples of
mechanisms giving rise to AE. The magnitude and characteristics of the acoustic emission
generated from the material are dependent on the source characteristics such as the severity
of source, the metallurgical structure of the material and environment. Acoustic emission
technique is used to investigate the micro-mechanisms of deformation and fracture in
materials [31]. The sources of AE are related to the damage and growth of defects and is
used to predict the failure of materials or structures [32]. Partial discharge localization of
power transformers uses the method of acoustic emission [33].
Acoustic emission testing is widely used for integrity assessment or health monitoring of
structures/systems like pressure vessels, pipelines, reactor vessels, concrete structures, etc.
[34-37]. Fundamental studies on AE are directed at clarifying the mechanisms of AE
generation, correlation of AE signals to physical or mechanical processes, and evaluation
of the interaction of stress waves with the material/structure through which it passes [38].
Since practical applications of AE have become more demanding, more understanding of
the AE phenomena is required. An understanding of the acoustic emission signals generated
during various deformation and fracture processes is essential for successful monitoring of
the integrity of structural components. Fundamentals of AET are discussed subsequently.

Chapter 1
9
1.4.1 Acoustic emission (AE) source mechanism
Different mechanisms responsible for the generation of AE are given below [39]:
a) Naturally occurring sources
1. Earthquake
2. Rock bursts in mines
b) Sources in metals
1. Crack propagation
2. Grain boundaries and dislocations movement
3. Slip formation
4. Twins growth
5. Realignment or growth of magnetic domains
6. Grain boundary sliding
c) Secondary sources
1. Leaks and cavitations
2. Friction
3. Solid-solid phase transformation
When a certain magnitude of stress is applied to a material, then strain induces in the
material. During application of stress to the material, it is possible that the material may get
back to its original state (elastic deformation) or may get permanently deformed (plastic

Chapter 1
10
deformation) which depends upon the magnitude of stress during loading and unloading
condition [40]. The maximum AE activity is observed when the material is under plastic
deformation [40]. The occurrence of plastic deformation at a microscopic level causes the
slip of atomic planes past each other through the movement of dislocations [41]. These
movements of dislocations produce energy called as elastic waves. The elastic wave thus
produced can be conceived as naturally generated AE signal, travelling through the material.
When cracks exist in a material, the stress level present at the crack tip can be several times
higher than the surrounding area. Hence, AE activity will also be observed when the material
with a crack undergoes plastic deformation [42]. Fatigue cracks also cause acoustic
emission in two different ways. The first is emissive particles (e.g. non-metallic inclusions
or second phase precipitates) at the origin of the crack tip. The other source is crack growth
through the movement of dislocations and small-scale cleavage produced by tri-axial
stresses at the crack tip [43]. The maximum amplitude and amount of energy released during
emission depend upon the source mechanism. The magnitude of acoustic emission is
proportional to the velocity of crack propagation and size of the surface area created during
crack growth of the material. Large and discrete crack jumps will produce larger AE signals
than cracks that propagate slowly over the same distance [44]. Hence, the elastic signal
detection and its transformation into an electrical signal is the basis of AE testing. Analysis
of these signals yields valuable information regarding the origin and severity of flaws/cracks
in a material.

Chapter 1
11
The acoustic emission signals generated at different loading conditions can provide vital
information concerning the structural integrity of a material/structure. The levels of load
that have been previously exerted on a metallic material do not produce AE activity during
further loading and emit AE when the load is exceeded beyond the previous loading, is
known as Kaiser effect [45]. The cumulative emission versus load plot for the metallic
material is shown in Figure 1.3.
Figure 1.3 Basic of acoustic emission activity shows the Kaiser effect (BCB), Felicity effect
(DEF) and emission during hold (GH) [45].
The AE activity starts accumulating, as shown in the segment AB during continuous loading
of the material. The segment BCB corresponds to unloading and then reloading. The AE
activity starts generating only when the load is exceeded from point B. As the load increases,
AE activity also increases shown by BD and AE activity stops when the load is removed.
Chapter 1
12
At point F, the applied load is high enough to cause significant AE generation even though
the previous maximum load (D) is not reached, and it is known as Felicity effect [45]. The
Felicity effect is quantified by using Felicity Ratio, which is defined as the load where
considerable AE activity resumes divided by the maximum applied load (F/D). This felicity
effect is used for the study of composite materials [45].
1.4.2 Background noise
The amount of background noise often limits the sensitivity of an acoustic emission system.
Acoustic emission testing noise refers to the undesired signals detected by the transducer.
The noise from background in most of the situations where AET is performed is high. It is
essential to understand the types of noise sources and to ensure the elimination of their
influence on AE testing and analysis. It is required to take a survey on the influences of
noise which helps in identifying the amplitude/frequency, selecting sensor, setting threshold
and finalizing test procedure before AE testing. It has to be also noted that whether AE
signals during testing is detected above the background noise. The frequency response of
the noise helps in the selection of optimum operating frequency band (sensor frequency,
filtering, etc.) to avoid noise. Before AET, it is crucial to study the effect of background
noise and suggest ways to nullify it.
Chapter 1
13
Different types of noise are (1) Mechanical noise, (2) Hydraulic noise, (3) Cyclic noise, (4)
Electrical (Electro-Magnetic Noise). The types of mechanical noise are due to the following
reasons:
1. Mechanical part movement,
2. Fretting noise which gives a broad frequency spectrum,
3. Roller bearings with spalled races,
4. Riveted, pinned, or bolted structures usually are noisy due to their loose-fitting.
The mechanical noise is used for the detection of mechanical failures such as turbines,
blades, bearings, etc. Different types of hydraulic noise consist of a) Boiling of liquid, b)
Leaks in hydraulic system, c) Leaking airlines and d) Turbulence and cavitation. The cyclic
noise is periodic, which is bursty, e.g. electrode positioning during spot-welding and during
a specific time for every rotation in rotating machinery. It is possible to eliminate the
uniform noise generation having a low repetition rate by blocking the AE recording
periodically. Electromagnetic interference (EMI) is the noise associated with AE
instrumentation due to electrical conduction and radiation. There are different sources of
EMI which include noise from welding machines, fluorescent lamps, turning relay power
on/off with inductive load, and electric motor circuits. The electromagnetic noise can be
eliminated by providing better shielding to the sensor, pre-amplifier and main amplifier in
high conductivity metal cases and by grounding the cases at a common point. Use of
isolation to the transformer on the power supply side can also reduce EMI. A significant
problem may arise if the test structure has a ground system that is different from the AE

Chapter 1
14
system. The difference in potential between the structure and AE system can be substantial
and may produce high-frequency noise spikes which is much higher than the valid signals
detected by the sensors. Even a sensor is insulated from the structure, can influence
capacitively coupled noise. A differential type AE transducer will provide substantial relief
from such noise types. Auspiciously, researchers have developed viable techniques in order
to filter or discriminate the noisy test environments [12].
1.5 Advantages and l imitations of AET
1.5.1 Advantages
AET is found to be most advantageous in source location and evaluation of dynamic
discontinuities in an entire structure in one stroke compared to other NDT techniques which
selectively test the localized area. The superiority of the AE technique over other NDT
techniques lies in its monitoring capability of the entire structure in real-time without
disturbing its operation [46].
The advantages of AET are listed as follows:
i) AET gives dynamic characteristics of active defects.
ii) It is a global volume technique, i.e. structures such as bridges, pressure
vessels and storage tanks can be monitored in one stroke by mounting
Chapter 1
15
several sensors on it from where the source of an acoustic event can be
realized.
iii) The AE data provides real-time detection of cracks/damage.
iv) AET is used for source location in components such as active flaws.
v) It can distinguish different types of active defects, i.e. source
characterization is possible.
vi) Though the initial cost is comparable with other NDTs, operational cost
is minimum for AET.
1.5.2 Limitations
The limitations of AET are as follows:
i) The limited accuracy of source localization.
ii) The structure should be loaded to get the AE signals.
iii) It has very limited information on the size of a flaw.
iv) Usually, the transducer has to be placed on the structure under test.
v) Test object has to be stimulated to make the defects active.
vi) Extraneous noise is a severe problem in AE testing.
Chapter 1
16
1.6 Applicat ions of AET
Acoustic emission technique can always be an aspirant when testing is associated with
dynamic changes of an object. Firstly, the AET is helpful for researchers in the laboratory.
Recorded AE data can provide useful information to a researcher for a better understanding
of test object properties. Secondly, AE testing assists in quality control during different
metal joining and metal forming operations such as brazing, welding, thermo-compression
bonding, punch press operating, shaft straightening etc. At last, AET helps to ascertain the
structural integrity of the dam, components in power plants, storage tanks, aircraft, pressure
vessels and bridges [34-38]. Partial discharge localization of power transformer uses the
method of acoustic emission [47]. A few of the applications of AET are shown in Figure
1.4. The detailed applications of AET are as follows [48]:
1) Testing of material: It involves different testing methods such as fatigue testing, crack
detection testing, detection of corrosion, hydrogen embrittlement detection, ceramic
material testing, integrity testing of composite materials, tribology testing of materials, and
reinforced plastics testing.

Chapter 1
17
Figure 1.4 AET applications: (a) pressure vessel, (b) pipeline leakage inspection, (c)
inspection of weld quality and (d) integrity monitoring of bridge [48].
2) Petroleum and chemical industries: It involves several applications such as integrity
monitoring of spherical tanks, pressure vessel testing, testing of cryogenic tanks, towers,
columns, hot piping systems and cool down for boiling reactors, tank bottom testing, real-
time corrosion monitoring, pipeline and FRP tank testing, gas valves leak detection, buried
pipes leak detection, offshore pipelines sand detection, and monitoring the integrity of the
maritime platform.

Chapter 1
18
3) Power plant and electric industries: It involves the applications such as monitoring and
diagnosis of power plant components and high-pressure vessels, testing of steam chests,
testing of steam line and its continuous monitoring, testing of partial discharge in
transformers, evaluation of valves for quantitative steam loss, testing of bucket trucks,
furnace monitoring, monitoring of leak detection in reheat pipelines, leak detection in the
boiler, testing and condition monitoring of turbine blade, and condition monitoring of
turbine bearing.
4) Aerospace and aircraft industries: It involves different applications such as proof testing
of aircraft, testing of aged aircraft, structures/aircrafts fatigue testing, monitoring landing
gear, wind turbine blade testing and testing of helicopter blade, continuous monitoring of
on-board aircraft, fuselage crack detection, skin lap joints and pivot bearing testing, in-
process tracking of helicopter gearbox transmission, composite fuel tanks testing and
examination of explosive bolt, aerospace launcher proof testing.
5) Metalworking industries: Applications such as detection of wear and breakage in the
cutting tool, grinding wheel/dresser touch detection and dressing verification, quality
control during metalworking processes, testing of forging press, detection of chatter, crash
detection and prevention during the manufacturing processes.

Chapter 1
19
6) Civil structure: Applications such as testing of the concrete building, testing of the bridge,
testing of the tunnel, testing of the dam, continuous monitoring of crack propagation in
structures made of concrete and testing of the crane.
7) Applications in transportation: Applications used for detection and location of flaws in
tube trailers, tank trucks and railroad cars, detection of a crack in railway materials and
structures, integrity testing of tunnels and bridges, flaw detection in train and truck ball
bearing, detection of cracks in components of the train such as shafts and wheels.
8) Other applications: Applications such as integrity testing of flasks, testing of wear and
friction, testing of pinpoint trouble spots in welds, detection of head disk interference, rock
detection, drought stress monitoring of woods and crops, seismological and geological
applications, monitoring of engine status, steel roller crack detection, monitoring of
automobile shaft strengthening process, monitoring of investment casting process and
monitoring of operations in rotating machinery.
1.7 Instrument of AET
AET instrument consists of a sensor, cable, amplifier, filter, acquisition system and personal
computer. AET can be performed in the field or the laboratory. The acquisition system and
personal computer are used for the measurement, storage and display of the AE data. A
description of the equipment used in AE testing is provided in the subsequent sections.

Chapter 1
20
1.7.1 Acoustic emission sensor
Acoustic emission transducer is a device that transforms local material displacements
produced by a stress wave to an electrical signal. The piezoelectric (PZT) type sensor is
commonly used for the detection of AE signal. A piezoelectric sensor is based on the
principle of piezoelectricity which converts the changes in temperature, pressure, vibration,
acceleration, and strain into electrical charges. PZT sensor is used for the measurement of
various processes such as process control, quality assurance, research and production
industries. The sensor is made of lead zirconate titanate, which is an inorganic compound
called PZT. It is a ceramic material that shows marked piezoelectricity effect, meaning that
the compound changes shape when an electric field is applied. The sensor is attached to the
material/structure by using couplant and measures the change in electrical impedance during
any damage in the material/structure [49]. Selection of a specific sensor depends on the
application, type of damage/flaw to be revealed, background noise characteristics and other
factors. AE sensors are classified into two categories based on their frequency response: (a)
resonant and (b) wideband or broadband. Resonant type sensors are most sensitive at
resonant frequencies, and the ranges of operating frequencies are a decisive factor for their
applications. The resonant type AE sensors are used where different AE parameters such as
RMS, amplitude, count, event duration and rise time are required for analysis [50].
Broadband sensors are used where one is interested in finding the dominant frequency in
the received signal [51]. AE sensors with in-build pre-amplifiers are called active sensors,
Chapter 1
21
whereas sensors without pre-amplifiers are known as passive sensors. A passive sensor
requires an external pre-amplifier. In general, the active sensor is more cost-effective
compared to the passive sensor. The resonant type AE sensors are used for applications
related to concrete which has high attenuation characteristics. The resonant type sensors
have higher sensitivity, but the range of frequency is lower than the broadband type AE
sensors.
1.7.1.1 Calibration of sensor
There is a possibility for the variation in sensor characteristics with time, operating
environment etc. Therefore, the calibration of sensors should be checked periodically for
frequency response and sensitivity before using. A reproducible artificial reference AE
source should be used for testing the sensors. Following the work of Hsu and Nielsen [52],
AE source is also called Hsu-Nielsen source. The Hsu-Nielsen source is most widely used
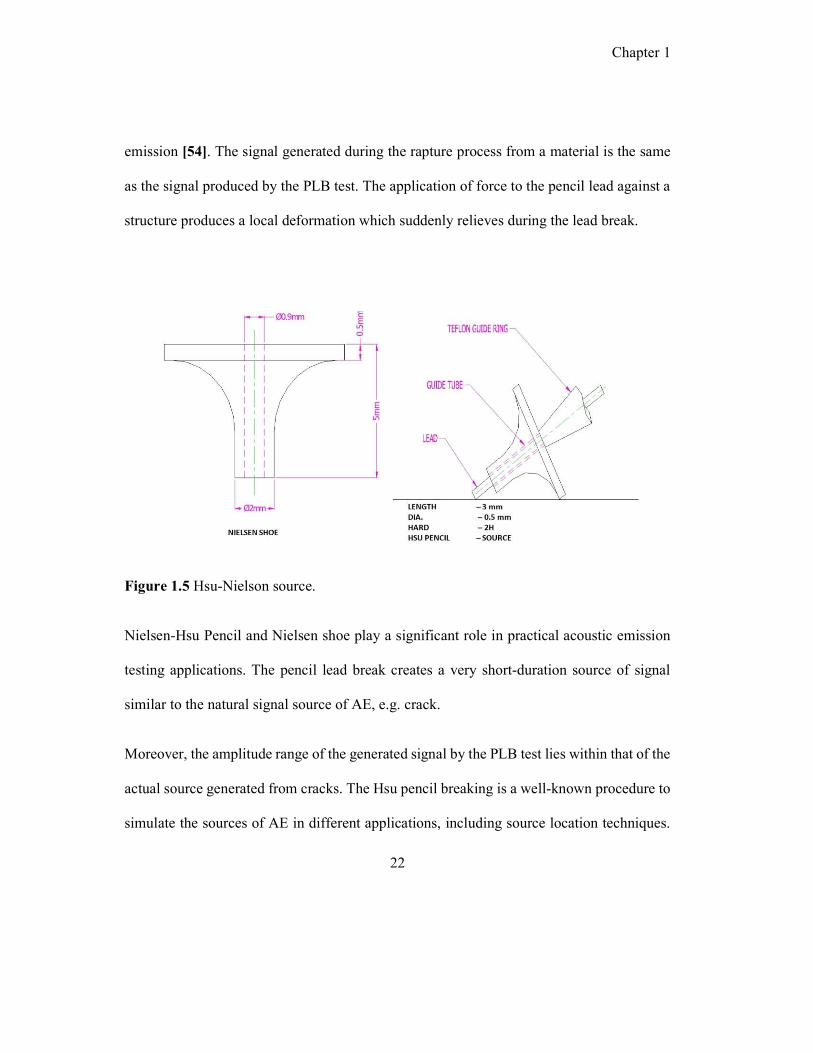
to simulate an AE event through pencil lead break test where the lead is pressed against a
workpiece or object [53]. The standard method of Hsu Nielsen pencil lead break test is
shown in Figure 1.5.
The Nielsen-Hsu Pencil aids to simulate an event of AE by graphite lead break in an
appropriate fitting. The 2H pencil lead of 0.5 mm diameter is pressed to break at the surface
of the object with an approximate tip length of 3 mm (+/-0.5 mm). The pencil lead breaking
(PLB) against the surface generates intense signal similar to the natural source of acoustic
Chapter 1
22
emission [54]. The signal generated during the rapture process from a material is the same
as the signal produced by the PLB test. The application of force to the pencil lead against a
structure produces a local deformation which suddenly relieves during the lead break.
Figure 1.5 Hsu-Nielson source.
Nielsen-Hsu Pencil and Nielsen shoe play a significant role in practical acoustic emission
testing applications. The pencil lead break creates a very short-duration source of signal
similar to the natural signal source of AE, e.g. crack.
Moreover, the amplitude range of the generated signal by the PLB test lies within that of the
actual source generated from cracks. The Hsu pencil breaking is a well-known procedure to
simulate the sources of AE in different applications, including source location techniques.

Chapter 1
23
It is widely used for finding the maximum possible distance among different sensors for
detection of the source. For the development of a graph, the amplitude values of signals at
different distances from the sensor are recorded through the PLB test. The average values
of amplitudes for different distances can be plotted against the distances from the sensors.
1.7.2 Amplification
The amplitude of the AE signal received from a sensor is very low, usually in the range of
microvolt. The amplification and filtering are required in order to process the signal further.
The amplification of the signal is performed by using an electronic amplifier circuit which
increases the power of the signal. Quantitatively the amount of amplification provided by
an amplifier is measured by amplification factor or gain. The amplifier circuit has the power
to gain greater than one. The gain of the amplifier is defined as the ratio of output power
(Pout) to input power (Pin) and is usually measured in decibel (dB). When measured in
decibel, it is logarithmically related to the power ratio:
(Gain)dB = 10 ∗ log ( )-------------------------------- (1.1)
1.7.3 Filter
The sources of noise during AE testing may be due to impact loading, friction, liquid flow
and electromagnetic. The recorded AE signals during a test contaminated by background
noise will affect the reliability and accuracy of the test results. As the noise has always been

Chapter 1
24
an issue for acoustic emission testing, it is required to handle carefully and appropriately
during either practical AE application or laboratory testing. The undesired frequency can be
avoided by implementing the proper frequency range in a bandpass filter for the AE
application.
1.7.4 Cable
The function of cable is to transmit an electrical signal from source to load. The connecting
cables should be chosen to eliminate electromagnetic interference [55]. For the application
of AET, coaxial cables are used universally because of their proper shielding. These cables
are offered with BNC, Microdot, or SMA connectors on the sensor end, and BNC
connections are used on the pre-amplifier end.
1.7.5 Couplant
The couplant plays an essential role in the accuracy of AET because of the low amplitude
of the AE signal. The couplant is used between the sensor, and the component surface is
essential for efficient detection of acoustic emission. A high viscosity fluid or a semi-solid
gel will help to transmit the AE waves from the surface of the structure to the sensor. Thus,
the purpose of a couplant is to ensure excellent acoustic contact on the microscopic level
between the two surfaces. Couplants should have the following characteristics:
1. High wettability

Chapter 1
25
2. Corrosion resistance
3. Sufficient viscosity
4. Easy removal
Some commonly used couplants are:
1. Natural wax
2. Silicone grease
3. Epoxy resin
4. Propylene glycol
Generally, silicone grease is most widely used in AE testing.

Chapter 1
26

Chapter 3
27
2 Literature Survey
2.1 Preamble
This chapter presents the application of AE signal for damage detection of concrete. This
chapter also introduces the state-of-the-artwork in both AE testing as well as wireless system
design through literature survey, towards setting the motivation and identifying the
objective of this research work.
2.2 Acoustic emission s ignal
The majority of acoustic emission signals lie in the frequency range of 20 kHz - 1 MHz [28].
The waveform of the AE signal generated is broadly classified into burst type and
continuous type. The waveform of burst type AE signal is detected as single decaying
sinusoid due to resonance in the structures and transducers. It is generated during crack
growth and fracture in materials/structures [56]. The waveform of continuous type emission
appears to consist of an overlapping sequence of individual bursts. The continuous type
emission is commonly associated with plastic deformation, grain boundary sliding and
dislocation movement in a metal or alloy [56]. Typical burst and continuous type AE signals
are shown in Figure 2.1 (a) and (b) respectively. The technique used for the analysis of
burst type AE signals is known as parameter-based technique. In this technique, several
Chapter 3
28
parameters from the received burst type signals are extracted without saving the waveforms.
The parameters of the burst type AE signals are peak amplitude, ring down count or AE
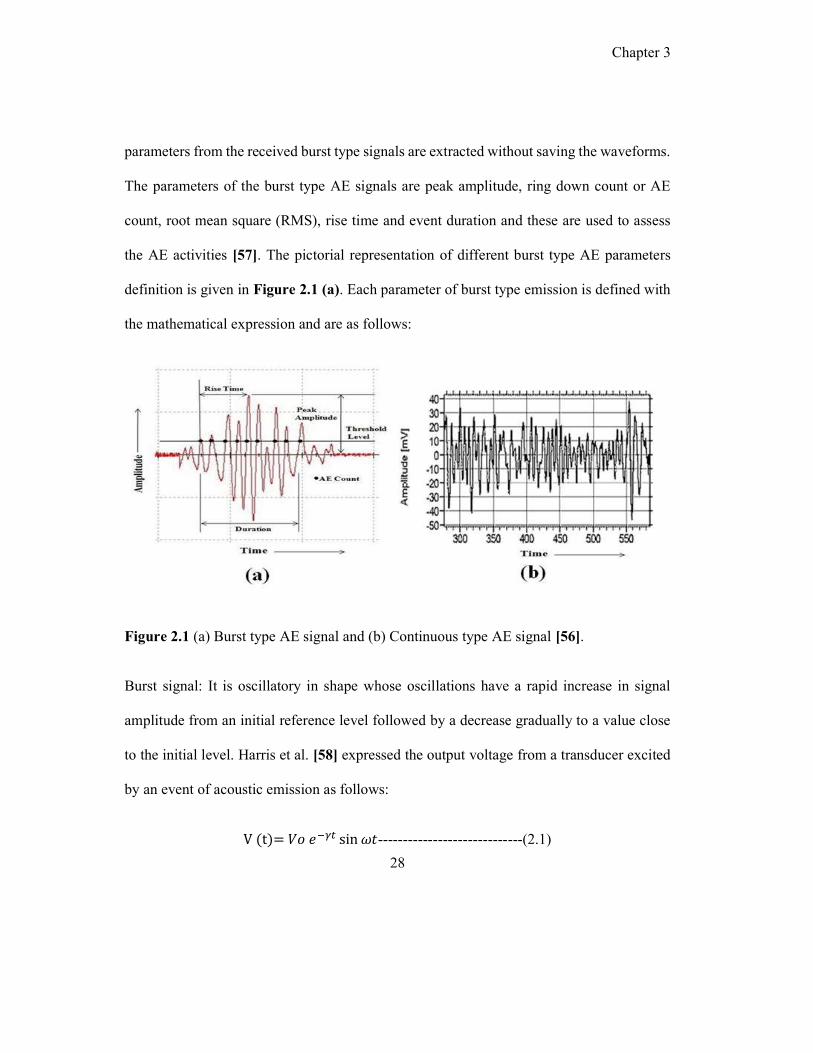
count, root mean square (RMS), rise time and event duration and these are used to assess
the AE activities [57]. The pictorial representation of different burst type AE parameters
definition is given in Figure 2.1 (a). Each parameter of burst type emission is defined with
the mathematical expression and are as follows:
Figure 2.1 (a) Burst type AE signal and (b) Continuous type AE signal [56].
Burst signal: It is oscillatory in shape whose oscillations have a rapid increase in signal
amplitude from an initial reference level followed by a decrease gradually to a value close
to the initial level. Harris et al. [58] expressed the output voltage from a transducer excited
by an event of acoustic emission as follows:
V (t)= 𝑉𝑜 𝑒 sin 𝜔𝑡-----------------------------(2.1)

Chapter 3
29
where, V (t) = Output voltage from the transducer, V0 = Initial signal voltage, γ = Decay
constant (>0), t = time and ω = Signal frequency.
Threshold: It is a voltage level set in the instrument to eliminate low amplitude noise from
the AE signal. An event of the AE signal is detected only when a threshold voltage is set
slightly higher than the voltage level of the background noise [58-59]. The pencil lead break
(PLB) test is carried out to simulate AE events for calibration purpose of checking sensor
couplings and of defining threshold [152]. The mathematical expression of the threshold is
as follows:
𝑉 = 𝑉𝑜 𝑒∗----------------------------(2.2)
𝑉 = Fixed threshold voltage or Minimum voltage required to trigger the count or event, V0
= Initial signal voltage, t* = time for amplified acoustic emission signal to ring down or AE
count below the trigger level of the count and γ is the decay constant (>0).
Peak amplitude: It is defined as the maximum amplitude attained by an acoustic emission
signal. This parameter plays a vital role in the detection of acoustic emission event. The
magnitude of the AE signal varies from microvolt to millivolts range. The amplitude of the
AE signal can be expressed in term of a common logarithm to a reference voltage of 1 μV
[59] and is defined as follows:
Peak amplitude (dB) = 20 𝐿𝑜𝑔 -------------(2.3)

Chapter 3
30
Where, A0 = 1 μV and A1 = Maximum voltage of the AE signal.
AE counts: This is the number of thresholds crossing pulses in a waveform and is also called
ring down counts. The number of counts from a burst type AE signal depends on the
magnitude of the source event. It is defined as follows [58]:
AE Counts = 20 𝑙𝑛 -------------(2.4)
Where, Vt = Fixed threshold voltage or Minimum voltage required to trigger the count or
event, V0 = Initial signal voltage, ω = signal frequency and γ is the decay constant (>0).
Root Mean Square (RMS): The RMS value is defined as the square root of the mean of the
squares of instantaneous values. The RMS of the AE signal can be expressed by equation
2.5 [60]:
𝐴𝐸 = ∑ 𝐴𝐸 (𝑖) =∆
∫ 𝐴𝐸 (𝑡)𝑑𝑡∆
-----------(2.5)
Where N represents the number of discrete values of AE data within ΔT, and ΔT represents
the integration time constant. AERMS can be calculated by digital manner, or by analog RMS
filter through the right side of the equation (2.5).
Rise Time: It is defined as the time difference between the Time of the peak signal and Time
of the first threshold crossing of an AE wave [58-59]. This definition of rising time is used
for AET applications where the signal is generated by initiation and fracture growth from
Chapter 3
31
materials/structures under loading [58-59]. Time to peak is a parameter used in AE signal
analysis and is the conventional rise time. The time to peak parameter is extensively used
by researchers to correlate various damage mechanism [50].
Event duration: It is defined as the time difference between the first threshold crossing to
the last threshold crossing of the AE wave. It is measured in microseconds. The event
duration depends upon the magnitude of the source and material properties [58-59].
Only when the amplitude of a signal exceeds the threshold, it is recognized as an AE signal
and recorded by the system. Fast Fourier Transform (FFT) method is used for the analysis
of peak frequency characteristics present in the recorded time-domain signal. The
parameter-based technique shows advantages compared to signal-based technique
concerning storing speed and data acquisition. The extracted AE parameters from signals
offer useful information about failure or damage behaviour of materials/structures [11]. The
parameter-based AE system does not get crashed when processing a large amount of AE
data compared to signal-based AE system. The advantage of the signal-based technique is
that the post-processing of the AE signal can be performed on the saved data. Also, it is
possible to apply the signal processing algorithm to eliminate undesired signals from the
captured AE waveforms. The attributes of the signal-based AE technique require large
storing capacity, particularly for long-term monitoring. The financial support primarily
determines the preference of which approach to select and storing space of the AE system.
In metallic materials, both continuous and burst type signals are generated but in concrete,

Chapter 3
32
only burst type signals are generated by the development of microcracks and macro cracks
[61]. Hence, the parameter-based technique is more useful for concrete concerning low
usages of system physical memory and low development cost for the long-term structural
health monitoring applications. The burst type AE signals are detected from the resonant
type sensor. The parameters of burst type AE signals are used for the analysis of initiation
and fracture of materials/structures. Hence, this thesis only deals with the development of
wireless acoustic emission sensor system (AE-SS) using resonant type sensors.
2.3 AET for damage detection of concrete
Structures fail mainly by the occurrence of damage. Early-stage damage detection received
more priority from engineers/researchers towards deciding the healthiness of structural
components in the last few decades. More specifically, researchers focused on monitoring
the healthiness of structures using vibration technique in case of mechanical, aeronautical
and civil engineering communities. Because of this, various developmental work in the field
of NDT using structural vibration is seen published in recent years. It is also applied in the
detection of damage, identifying the severity of damage and finding the location of the
source. Moreover, the necessity for early-stage damage detection in structural components
leads to an increase in the use of NDT and its further developments.
Concrete is the most abundantly construction material used in the world [62]. Concrete
structures deteriorate with time and need to be repaired [63-65]. The health status of
Chapter 3
33
concrete structures, especially the ones under rigid circumstances is imperative to human
lives and properties. AET is widely used for the assessment of concrete under various types
of loadings such as impact loading, flexural loading, cyclic loading and chemical stimulus
such as corrosion [66-69]. AET is applied to monitor internal failure of concrete, which is
quasi-brittle [70]. AET has been successfully used to classify the types of cracking in
reinforced concrete structures [71-73]. The real-time corrosion detection ability of AET
makes it a strong candidate for serving as an efficient non-destructive test method and gives
advantages compared to another method of NDT [74-75]. Labuz et al. [68] carried out
compression, flexural, and indentation tests on quasi-brittle materials. They had identified
six intrinsic process zones when specimens were loaded to maximum stress. The length of
the zone is similar even in the samples of different sizes. Soulioti et al. [76] have carried out
four-point bending tests on fiber reinforced concrete (FRC) slabs having different fibre
content, to find the correlation between the acoustic emission characteristics and concrete
properties. It is observed that the activity of AE increases with an increase in the fibre
content of FRC. The transition of failure mode from tensile fracture to shear fracture has
been observed in the concrete slab with higher fibre content. Chen et al. [77] have studied
acoustic emission signal generation during three-point bend testing of concrete having
various notch depths and fibre content. A time delay in the appearance of AE peak during
bend testing and decrease in the amplitude of AE signal has been observed with an increase
in the notch depth. Weiler et al. [78] studied the importance of AET in concrete with three
different loading scenarios like compression, three-point bending, and axial tension.
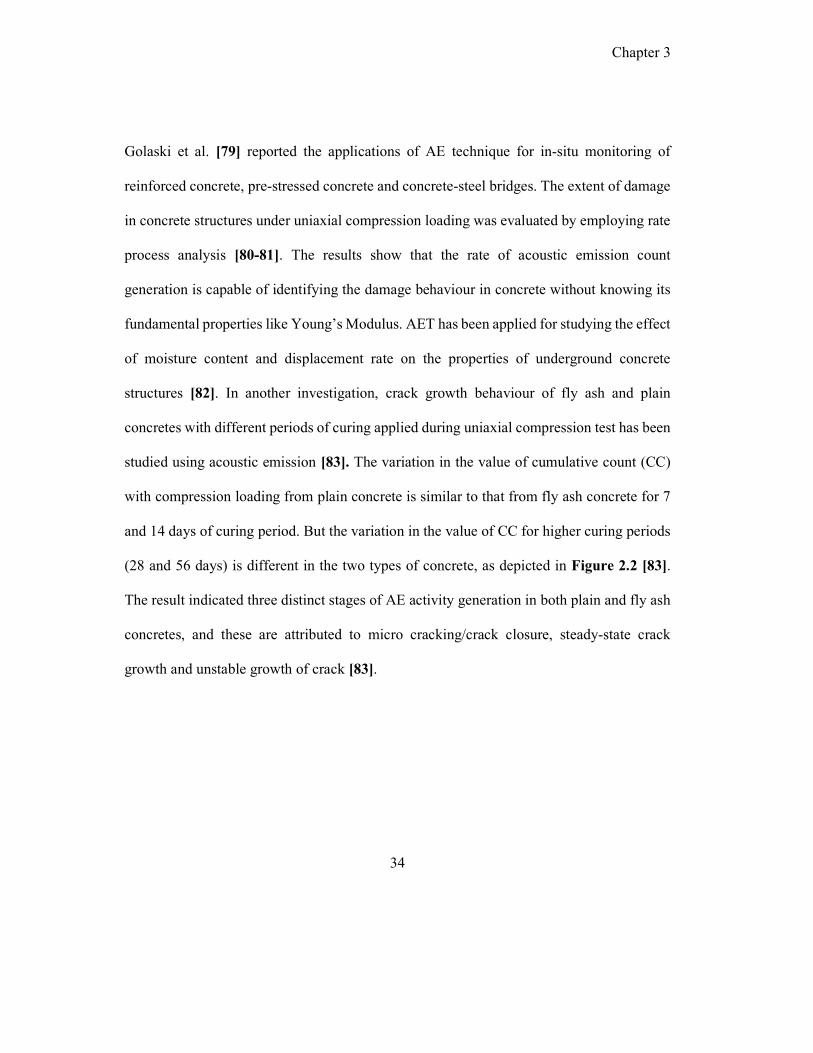
Chapter 3
34
Golaski et al. [79] reported the applications of AE technique for in-situ monitoring of
reinforced concrete, pre-stressed concrete and concrete-steel bridges. The extent of damage
in concrete structures under uniaxial compression loading was evaluated by employing rate
process analysis [80-81]. The results show that the rate of acoustic emission count
generation is capable of identifying the damage behaviour in concrete without knowing its
fundamental properties like Young’s Modulus. AET has been applied for studying the effect
of moisture content and displacement rate on the properties of underground concrete
structures [82]. In another investigation, crack growth behaviour of fly ash and plain
concretes with different periods of curing applied during uniaxial compression test has been
studied using acoustic emission [83]. The variation in the value of cumulative count (CC)
with compression loading from plain concrete is similar to that from fly ash concrete for 7
and 14 days of curing period. But the variation in the value of CC for higher curing periods
(28 and 56 days) is different in the two types of concrete, as depicted in Figure 2.2 [83].
The result indicated three distinct stages of AE activity generation in both plain and fly ash
concretes, and these are attributed to micro cracking/crack closure, steady-state crack
growth and unstable growth of crack [83].
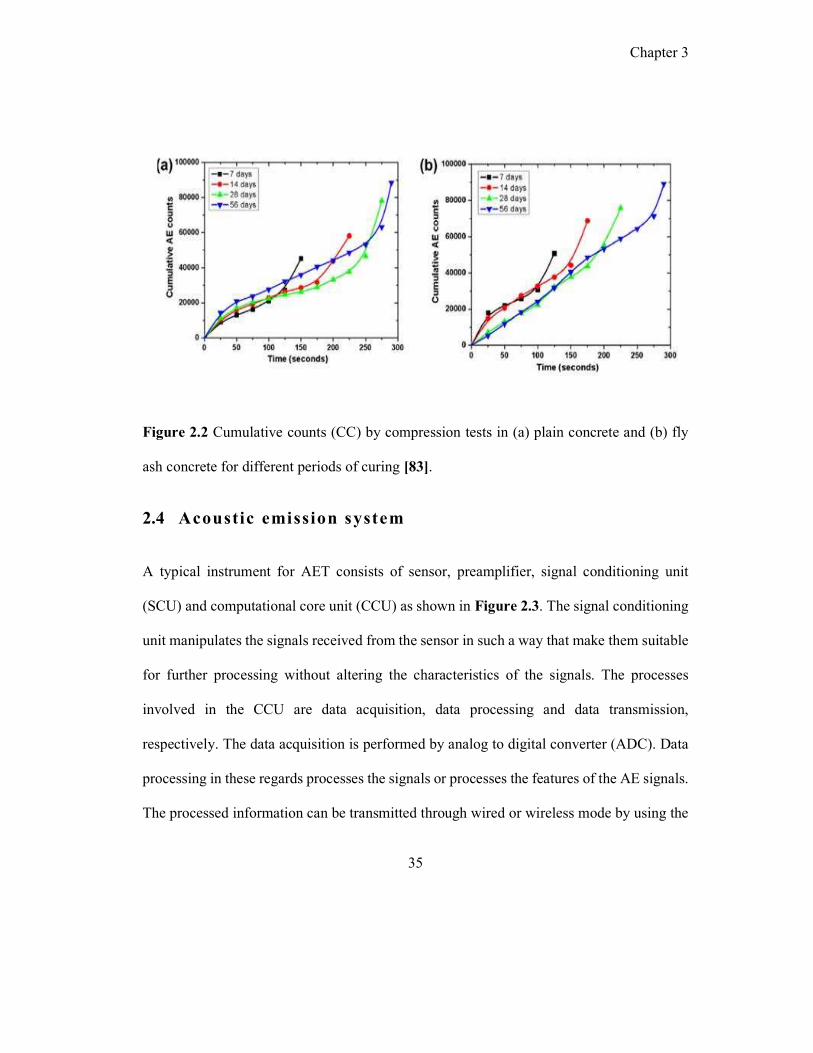
Chapter 3
35
Figure 2.2 Cumulative counts (CC) by compression tests in (a) plain concrete and (b) fly
ash concrete for different periods of curing [83].
2.4 Acoustic emission system
A typical instrument for AET consists of sensor, preamplifier, signal conditioning unit
(SCU) and computational core unit (CCU) as shown in Figure 2.3. The signal conditioning
unit manipulates the signals received from the sensor in such a way that make them suitable
for further processing without altering the characteristics of the signals. The processes
involved in the CCU are data acquisition, data processing and data transmission,
respectively. The data acquisition is performed by analog to digital converter (ADC). Data
processing in these regards processes the signals or processes the features of the AE signals.
The processed information can be transmitted through wired or wireless mode by using the

Chapter 3
36
communication device. Extraction of useful information from the AE signal and its
interpretation through offline/online means is needed for characterizing the source. A few
commercial AE systems (Mistras Physical Acoustics System, USA and Vallen System,
Germany) are available, the cost of which is exceedingly high. Also, details about hardware
circuit design and its software implementation towards the development of AE instrument
are not furnished in the open literature because of its proprietary in nature.
Figure 2.3 Block diagram architecture of acoustic emission sensor system.
There exist two types of systems based on data communication between the sensor unit and
personal computer (PC). The one is a wired sensor system while other is a wireless sensor
system. The wired system requires the use of a lengthy cable and increases workforce,
wiring complexity, and maintenance cost as the number sensor nodes are increases. Also,
there will be some situation where complicated in cable installation for their monitoring of

Chapter 3
37
a structure. With the technological improvement in wireless communication, the
development of wireless sensor systems has become matured and can be applied to
monitoring the healthiness of structural applications [84-87].
2.4.1 Wireless structural health monitoring
Wireless structural health monitoring (SHM) systems have seen increased demand because
of two reasons: low system development cost, and abilities of wireless technology for
multiple distributions of sensor data for further processing [88]. The overall elements and
working procedure in SHM involve sensor system, data gathering system, data processing
and damage analysis [89-90]. Wireless SHM involves a much lower system and
maintenance costs and saves installation time which greatly boosts the practical use of SHM.
Several research papers are reported on the design development and practical use of wireless
SHM. Yoon et al. [91] developed a wireless sensor module using AVR microcontroller and
applied to the concrete beam. Yang et al. [92] developed a wireless SHM monitoring system
with multithread sensing device using 8-bit AVR microcontroller for the measurement of
vibration signals generated from the concrete structure. Hodge et al. [93] have carried out
an extensive survey on the use of wireless sensor network for monitoring railway
infrastructures. Wireless sensor-based instrumentation has been developed for natural
disaster monitoring and mitigation [94]. A synchronized wireless sensor network for nodal
analysis in SHM has been developed by using 16-bit TI microcontroller [95]. Sadeghioon
et al. [96] have developed a smart wireless sensor network for leak detection in water
Chapter 3
38
pipeline using 8-bit PIC microcontroller. Chaea et al. [97] have developed a prototype of
the wireless sensor network system using 8-bit Atmel microcontroller for health monitoring
of suspension bridge using accelerometer and strain gauge sensor. Bhattacharjee et al. [98]
have developed an intelligent wireless sensor node using 8-bit PIC microcontroller for the
measurement of temperature, humidity, and light in real-time towards environment
condition monitoring application. Ladgaonkar et al. [99] have developed a wireless sensor
node using 8-bit AVR microcontroller to monitor the humidity of the high-tech poly-house
environment. A prototype wireless system using FPGA and microcontroller is reported for
real-time detection of active fatigue cracks in aging railway bridges using the strain gauge
sensor [100-101]. Zhang et al. [102] presented the design of an acoustic emission data
acquisition system using FPGA for the detection of wood damage. Grosse et al. [103] have
developed wireless motes using 16-bit TI microcontroller for monitoring civil infrastructure
in the concrete bridge by the vibration sensor. Wu et al. [104] presents the development of
a novel wireless acoustic emission sensor platform designed using 32-bit STM
microcontroller for distributed large-scale wooden structure health monitoring. Carpinteri
et al. [105] reports a prototype acoustic emission wireless transmission system using FPGA
for structural and infrastructural networks. The wireless system development and sensor
networking are emerging as potential sensing models for consideration as an alternative
solution to the wired monitoring system in the field of acoustic emission testing. The
usefulness of AET as a potent wireless structural health monitoring system has been
highlighted [106].

Chapter 3
39
Currently, structural health monitoring by acoustic emission technique is performed by
using wired systems which have installation difficulty, noise associated with cabling,
portability issues, restriction on remote monitoring capability and wiring complexity.
Compared to the wired systems, the wireless systems enable remote monitoring, offer low-
cost system development, and has a low maintenance cost, and thereby significantly
enhancing the practical use of structural health monitoring for monitoring large-scale
structures. A wireless structural health monitoring is usually a more flexible solution with
the minor cost involved with the wireless system. It does not require any cable if nodes are
battery-powered. Concerning a wired solution, new problems should be considered for a
wireless system such as optimization of energy consumption, synchronization between the
sensor unit and remote end-user, and selection of adequate low-cost sensor and sensor unit.
The development of wireless systems using different kinds of sensors based on acoustic
emission, vibration, strain gauge, and accelerometer towards structural health monitoring
applications is reported in open literature using FPGA and microcontroller [92-105]. The
literature which deals with the development wireless acoustic emission sensor system is
proprietary domain since the work has been carried by a limited number of organizations or
agencies. Also, there is no such report available on wireless acoustic emission system using
the programmable system on chip (PSoC) technology. Hence, the present work has been
accomplished with minimal literature support, and cost-effective wireless sensor system has
been developed by using a programmable system on chip technology. The reason for

Chapter 3
40
selecting PSoC is that all components of electronic circuitry (buffer, a programmable gain
amplifier, successive approximation analog to digital converter (SAR ADC), comparator,
counter, synchronizer, voltage digital to analog converter (VDAC), interrupt, universal
asynchronous receiver and transmitter (UART), and a microcontroller to control operation
and command) can be designed in single integrated circuit (IC). Because of this whole
electronic circuitry can be minimized and hence reducing the board space, power
consumption and system cost while improving the quality of the system development [107-
109]. The design and development carried out in this work are the first of its kind using a
programmable system on chip technology on acoustic emission technique for concrete
structural health monitoring applications.
In order to develop a wireless acoustic emission sensor system (AE-SS), it is required to
design, develop and validate the individual sub-systems used for designing the wireless AE-
SS. These individual sub-systems are signal conditioning unit, computational core unit and
a wireless communication unit. Finally, the individual sub-systems are integrated and
validated for SHM of concrete. The details of individual sub-systems design with their
component selection are explained subsequently.
2.4.1.1 Signal conditioning unit (SCU)
Signal conditioning unit is an integral part of the acoustic emission system, and it is required
to be developed for next stage processing of AE signals. It is often necessary to acquire real-

Chapter 3
41
world analog signals by industrial systems for different applications. There are different
physical phenomena to be measured like temperature, pressure, the intensity of light,
vibration, acoustic emission, etc. by the sensor. Different applications often require the
measurement of different physical entities from the real world. Different type of sensors
have different electrical properties. Also, the output characteristics may vary for different
analog sensors like some have voltage output and some others have current output.
However, output signal amplitude of all type of analog sensors is usually weak in the range
of a few hundreds of microvolts to tens of millivolts. The signal conditioning of such weak
signals is required before their processing by means of amplification, filtering, isolation and
range matching. The operational amplifier is most widely used in electronics design for
signal conditioning of the weak signal received from a sensor. Hence, the role of the signal
conditioning circuit is to modify the analog signals to make them compatible for analog to
digital converter for next stage processing. The block representation of signal conditioning
is shown in Figure 2.4.
Figure 2.4 Block diagram of signal conditioning.
Chapter 3
42
A signal conditioning unit consists of buffer, amplifier, and filter corresponding to perform
impedance matching, amplification, and filtering to the signal. The development of an AE-
SS involves the design and development of high-performance advanced signal conditioning
front-ends. The signal conditioning units are usually employed to modify the characteristics
of the signals and make compatible data recording and processing by the instrument [110].
There are following possible set of operations to be performed like amplification, bandwidth
(BW) limiting, direct current (DC) signal shifting, impedance transformation, etc. [111].
There are different configurations of signal conditioning units [112]. These are used for
different types of sensors like electrochemical type sensors [113], MOS based type sensors
[114], magneto-resistive type sensors [115], resistive type sensors [116], inductive type
sensors [117], and PZT type sensors [118]. The switching mode type conditioning circuits
are used to generate a square wave with variation in frequency [119] or duty cycle variation
[120]. The growing trend for mixed-signal systems design necessitates the use of versatile
signal conditioning units that require digital control for the functionality of the SCU [121-
124]. With the integration of digitally control path to SCU, a sensor is made to operate in a
smart and intelligent manner [125].
It is pertinent from the above discussion that SCU is an important element in an AET system.
However, sensing interface circuit design for the development of an SCU using resonant
type AE sensor is not found in the open literature. Hence, the design and development of an
SCU are indispensable towards obtaining correct data for interpretation for the next stage

Chapter 3
43
processing. It also enables to receive AE signals at a maximum dynamic range to avoid
distortion using a digital gain control amplifier or by using a programmable gain amplifier.
2.4.1.2 Parameter processing of AE signal
The parameters of AE burst signals are correlated to the micromechanics of damage and
fracture in materials and hence desired to be extracted in real-time. The parameters
commonly used for analysis are peak amplitude, ring down count (or, AE count), root means
square (RMS) value of the signal, rise time, and event duration [57, 83]. The burst type AE
signal and its different parameters have been explained in Section 2.2.
For the applications related to structural health monitoring, real-time extraction of the
parameters from AE signals is advantageous. The development has been reported in this
direction using embedded systems [126-129]. But an embedded system has limitations with
respect to limited computational and storage resources, transmission bandwidth, smaller
data word size and relative slow clocks [130-131]. The challenges faced by various types of
designs for embedded system approach are discussed in detail [130-132]. Another potential
method is the combination of hardware and software co-design, which offers substantial
advantages regarding cost and quality for future embedded system development [133-135].
The combination of hardware and software co-design enables their concurrent design and
thus fulfilling the objective of the system development. This co-design concept has been
implemented in the development of wireless AE sensor system for data acquisition,

Chapter 3
44
processing and transmission of AE signals parameters. Towards this, parameter extraction
of AE signal in real-time reduces the processing load of the microcontroller, data processing
and data transmission. It thus offers a solution to the constraint of an embedded system. The
parameter-based technique involves comparatively low financial expense and low system
physical memory usage compared to signal-based technique when implemented for long
term health monitoring of concrete structures.
2.4.1.3 Data Acquisition (DAQ)
One of the essential units of AE-SS is data acquisition (DAQ). A DAQ is a system designed
to acquire physical signals from the actual process [136]. The DAQ device is used for the
acquisition and processing of acoustic emission signals without aliasing. The objective of
this device is to measure, process and store the data.
A sensor can be classified in many ways, depending on how the sensor senses the incoming
signal and the kind of output it delivers. In a DAQ device irrespective of the source, the
signals are converted to the digital format by using an analog to digital Converter (ADC);
this ADC is the crucial component of the DAQ device. The ADC must be able to track the
changes in the input and should have a high resolution to reflect these changes in the output.
Among various types of ADCs available most used are the Flash-type ADC, the Sigma-
Delta ADC, the integrating type ADC and the Successive Approximation Register (SAR)
ADC. The key difference among various types of ADCs is the way the incoming signal is

Chapter 3
45
sampled. Due to different methods of quantization, different ADCs provide outputs with
varying sampling rate. In an ADC, the incoming signals are sampled, and once they are
quantized, each signal level is assigned a binary value which is the representation of the
analog signal in digital format. The DAQ main clock triggers sampling of the input signal
at a periodic rate. Hence, the performance of the DAQ device will depend on the
performance of ADC parameters which include resolution, dynamic range and sampling
rate.
2.4.1.4 PSoC based DAQ device and computational core unit (CCU)
In an acoustic emission system, DAQ is used to acquire AE signals from SCU and transmit
the signal data to a personal computer (PC)/Laptop. Whereas the role of computational core
unit is to perform acquisition of signals, process the parameters of the signals and transmit
the processed data to the PC/Laptop. The selection of a DAQ device or CCU is important
to meet the application-specific criteria for concrete. Several embedded devices for the DAQ
application are available in the market. The technological progress in the field of embedded
system design has achieved the trade-off in the field of application-specific areas like
automobiles, telecommunications, smart cards, missiles, satellites, computer networking,
and digital consumer electronics. It is also used for real-time monitoring of the healthiness
of structures as an intelligent sensor. The programmable system on chip based technology
has been selected for the data acquisition and processing of AE signals. By this technology,

Chapter 3
46
the analog, as well as digital components, can be designed and interfaced in a single IC
[137]. The PSoC is a family of microcontroller integrated circuits developed by the
manufacturer Cypress Semiconductor. There is some other technology available such as
FPGA, ASIC and microcontroller, which was established a decade ago. After comparing
these technologies, it is found that FPGA is less expensive than ASIC. In a situation where
both of them are required, FPGA is designed in the Lab, but ASIC is designed outside the
Lab. Because of this, FPGA is less costly than that of ASIC. But, ASIC is technologically
superior and most versatile compared to FPGA. Whereas both PSoC and FPGA are quite
handy, PSoC is less expensive and consumes less power than FPGA. The embedded system
is programmed on the software side only. Whereas, PSoC possesses the advantage that the
user can program on both software and hardware sides. Kansal [138] explained the benefit
of PSoC selection compared to ASIC, FPGA and microcontroller.
The difference between PSoC and micro-controller unit (MCU) is that the PSoC includes
both analog and digital modules, and can have hundreds of built-in functions. Consequently,
there is a drastic reduction in design time using PSoC [139]. Figure 2.5 shows the block
diagram of a typical MCU that contains Central Processing Unit (CPU) and a set of
peripheral functions such as ADC, DAC, UART, Serial Peripheral Interface (SPI), and
general input/output (I/O), all linked to the CPU’s register interface [140]. CPU is the heart
of MCU and manages everything from setup to data movement to timing. Figure 2.6 shows
the block diagram of PSoC 5, which is quite different from MCU. The Central Processing

Chapter 3
47
Unit, analog, digital, and I/O units are equally important in the PSoC system. In a PSoC, the
analog and digital peripherals are interconnected with a highly configurable routing matrix,
which allows users to create custom design program to meet the desired application
requirements. The PSoC can be programmed to emulate an MCU, but the MCU cannot be
programmed to emulate a PSoC.
Figure 2.5 Block diagram of typical MCU [139].
Figure 2.6 Block diagram of PSoC 5LP [139].

Chapter 3
48
2.4.1.5 PSoC family
There are three families of a programmable system on chip (PSoC), namely, PSoC 1, PSoC
3 and PSoC 5. The PSoC 1 uses 8-bit microcontroller core which works at a speed of 4
MIPS (million instruction per second). The PSoC 3 also uses an 8-bit microcontroller which
operates at a speed of 33 MIPS. The production of PSoC 3 stared in December 2010.
PSoC is a mixed-signal array which consists of programmable digital block and analog
block, and processor core giving programming routine and their interconnection. The
available microcontrollers from different manufactures such as ST microelectronics, Texas
instrument, Analog devices, Microchip, Intel etc. only have 8-bit, 16-bit or 32-bit processor
core. PSoC enables the integration of complete analog and digital circuit design along with
microcontroller single integrated circuit (IC). Because of this, the overall bill of material
(BOM) costs for system design gets reduced. Also, PSoC has exceptional flexibility for
programmable analog and digital circuit design that uses a PSoC creator integrated
development environment (IDE). This IDE provides the combined hardware and software
design to the programmable system on chip for version 1, 3 and 5 based system
development. The processor used in PSoC 1, PSoC 3, and PSoC 5 is M8C, 8051 and ARM
Cortex M3 processor core respectively. PSoC has three separate memory such as memory
registers, flash memory for instructions and fixed data, and SRAM for data, accessing and
command control to the configurable logic block and their intended functions. Application
peripheral Interfaces (APIs) initialize the user selected components in Visual Studio (VS)

Chapter 3
49
or LabView for the graphical user interface (GUI). PSoC 5 is the latest disruptive technology
because of its powerful ARM-based processor. The IDE design tools and architecture of
PSoC 3 and PSoC 5 are compatible with each other. PSoC 5 has 32-bit ARM Cortex M3
processor core which performs at a speed of 100 MIPS. Figure 2.7 shows a comparison of
PSoC 1, PSoC 3, and PSoC 5.
Figure 2.7 Comparison of PSoC family.
PSoC architecture is widely used for numerous applications. Fernando et al. [141] have used
the PSoC architecture to design a data acquisition system for the educational purpose. In
another study, J. Guevara et al. [142] have designed data acquisition, control and wired
remote display system using PSoC. Similarly, in [143], PSoC-5 based system has been used
by Hyejung Kim et al. to demonstrate a technique to design low-cost and highly accurate
ECG data acquisition system. In a separate study [144], the analog system of PSoC-1 has
Chapter 3
50
been used by Cabrera Lopez et al. to realize a reconfigurable filter stage. This system can
adapt itself as per the incoming signal. Usage of PSoC in the wireless sensor node is
proposed [145], where, Fatecha et al. have used the configurable capabilities of the hardware
to minimize the power consumption.
The programmable system on chip kits has a right balance among different components,
i.e., analog blocks, digital blocks and processor. This offers a single chip solution to
different design applications. The production of PSoC 5 started in the second quarter of
2011. PSoC 5 architecture has programmable and configurable analog and digital blocks of
sub-systems. There are different blocks of programmable analog sub-systems with a good
precision used in PSoC 5. These are 12-bit SAR ADC, 20-bit Delta-Sigma ADC, DAC,
Mixers, PGA (programmable gain amplifier) with 25 mA driving capacity, Op-Amps etc.
which can be configured to satisfy the design requirements. There are different blocks of
digital sub-systems used in PSoC 5 which include digital logic blocks, counter, timer (8, 16,
24 and 32-bit timers), and pulse width modulation (PWM) that can be configured and
programed. There are some digital peripheral components available with PSoC 5 like
pseudo-random sequence (PRS) generators, quadrature decoders, and cyclic redundancy
check (CRC). It also supports wide ranges of communication interfaces including UART,
SPI, I2C, CAN and USB, for data communication. The current consumption for PSoC 5 in
sleep mode is 2.0 µA, whereas it is 2.0 mA in active mode [137]. The new and disruptive
architecture of PSoC 5 consumes extremely low power and can be operated in a 0.5 to 5.5

Chapter 3
51
voltage range. It offers programmable routing for any analog signal or digital signal to any
general-purpose input/output device for easy circuit board layout. By considering the
characteristics of different PSoCs, it is found that PSoC 5 is a new disruptive technology
which can work with both analog and digital circuit blocks along with the microcontroller
on a single system on chip IC.
2.5 Motivation and objective
A wireless AE system offers several advantages over the existing wired based AE systems
for online monitoring of structures. Some of the benefits of wireless AE systems are
compactness, ease of installation, low wiring complexity, low power consumption
capability, economical (associated with low cabling cost) and remote operational capability.
Thus, the development of a wireless AE system seems attractive.
A few commercial AE systems are available, the cost of which is very high and the details
of instrumentation are also not furnished. A few papers have reported the design and
development of wireless systems for vibration, strain gauge, and accelerometer towards
SHM applications based on FPGA and microcontrollers. However, for continuous
monitoring of structures, typical AE sensing systems demand compact, portable and less
power consuming (preferably battery operated) devices. Distributed AE sensing also
demands less wiring complexity for ease of deployment and maintenance. Thus, the
development of a programmable system on chip based wireless system is expected to be

Chapter 3
52
efficient for AE applications. However, information related to wireless AE systems lies in
the proprietary domain and scarce in the open literature. Hence, there is a strong requirement
for dedicated efforts to develop wireless acoustic emission sensor system for structural
health monitoring applications. In order to design and develop the wireless AE sensor
system, several novel design steps, challenges and issues were addressed in the thesis, as
mentioned below:
1) Design of signal conditioning circuit for acoustic emission signals which enables
maximum dynamic range and rail to rail input-output swings for next stage
processing of AE signals.
2) Development of methodologies and its hardware implementation to extract the AE
features and transmission of data in a wireless environment.
3) Design of compact system on chip-based hardware and software for acquisition and
processing of AE signals for structural health monitoring applications.
4) Selecting the appropriate protocol towards establishing communication between the
sensor unit and the control unit for wireless data transmission.
5) Finally, implementation and test validation of the designed and developed wireless
AE system for typical SHM applications.
Following objectives have been set to meet the above challenges and to address the issues.

Chapter 3
53
1) Design development and validation of a signal conditioning unit for the acoustic
emission signals.
2) Design of hardware-based parameters extraction for the burst type AE signals using
Multisim software.
3) Design development and validation of embedded hardware and software for
acquisition and processing of an event of AE signals using a programmable system
on chip.
4) Acquiring AE signals from sensors through embedded hardware and software using
the programmable system on chip. Extraction of AE parameters from the received
signal and wireless transmission of AE parameters.
5) Validating the performance of the wireless AE system with a commercially available
wired AE system in the laboratory for SHM of concrete.
2.6 Organization of the thesis
The rest of the thesis is organized into four major working chapters addressing the identified
objectives, towards developing a wireless acoustic emission sensor system for structural
health monitoring applications, followed by conclusions and future works.
Chapter 3 presents the design and development of signal conditioning unit for the
acquisition of acoustic emission signals towards application to concrete as well as to

Chapter 3
54
metallic materials. The performance of the in-house developed SCU has been compared
with a commercially available one, and the results are presented in this chapter.
Chapter 4 proposes a simulation study for the extraction of parameters from AE signal such
as peak amplitude, ring down count or AE count, RMS, rise time and event duration.
Multisim software is used for simulation of the hardware design, and the results are
presented in this chapter.
Chapter 5 explains the data acquisition of acoustic emission signals using the
programmable system on a chip. Fast Fourier Transform (FFT) has been performed for the
signal analysis and validation of the acquisition unit.
Chapter 6 discusses the prototype design aspects and development of wireless AE-SS for
structural health monitoring of concrete. The integrated prototype system has been
fabricated, assembled and validated in the laboratory by signal validation tests, and by
conducting compression tests and corrosion test on concrete specimens for dynamic
detection of defects.
Chapter 7 summarizes the major conclusions drawn from the research work and provides
the scope for future research.

Chapter 3
55
3 Design development and validation of the signal conditioning unit
3.1 Preamble
This chapter presents the details of in-house design and development of a signal
conditioning unit (SCU) for the acquisition of acoustic emission signals from metallic and
concrete materials. The performance of the developed SCU has been compared with a
commercially available one, and the results are presented in this chapter.
3.2 Introduction
A piezoelectric type sensor is used to detect acoustic emission signals generated from the
surface of an object under test. For most of the metallic and concrete structural health
monitoring applications, the AE sensor frequency lies in the range of 100 kHz to 400 kHz
and 20 kHz to 100 kHz, respectively [146]. The raw AE signal acquired by a piezoelectric
sensor is of very low level, usually in the range of microvolts (µV), and needs to be
amplified for further processing. Hence, there is a strong requirement to develop SCU to
maximize the dynamic range of AE signals and to make it suitable for analog to digital
conversion for correct AE data representation. A schematic representation of a typical
acoustic emission system consists of (a) sensor with an integral pre-amplifier, (b) signal

Chapter 3
56
conditioning unit and (c) data acquisition (DAQ) as shown in Figure 3.1. The detailed
descriptions of each block are explained in the subsequent sections.
Figure 3.1 Block diagram of the acoustic emission system.
3.3 Sensor with integral pre-amplifier
3.3.1 Sensor
Selection of the proper frequency range of an AE sensor is important for any particular
application, and different factors to be considered for sensor selection are the nature of
material or object under test, type of environment, and test condition. Acoustic emission
sensors are mostly specified for normal environmental condition as one would practice
during field testing or testing in the laboratory. Table 3.1 provides the specifications of two
different piezoelectric resonant sensors used for the validation studies of the developed SCU
for application to metallic materials. Both sensors have integral pre-amplifier and are
manufactured by M/s. Physical Acoustics Corporation (PAC), USA. The sensors (PK15I
and R15I) resonate at 150 kHz and operate in the frequency range from 100 to 450 kHz and
50 to 400 kHz, respectively. The sensor PK15I, selected for the validation test requires 5.0

Chapter 3
57
mA current in an active mode which needs an excitation of 5.0 volts and is used with the
developed SCU in the laboratory. The sensor R15I needs DC excitation of 28 volts to the
pre-amplifier and is used with the commercially available SCU (PAC, USA) system. Both
sensors are directly mounted on the metallic plate by using vacuum grease as couplant.
Table 3.1 Specifications of the sensors used for metallic material
Specifications Sensor (PK15I)* Sensor (R15I)**
Type
Integral
Integral
Operating Frequency Range 100-450 kHz 50-400 kHz
Resonant Frequency ~150 kHz ~150 kHz
Input Voltage 5 Volt 28 Volt
Pre-amplifier Gain 26 dB 40 dB
* Sensor (PK15I) is used with the developed SCU in the laboratory ** Sensor (R15I) is used with the PAC, USA system
Table 3.2 provides the specifications of the sensor used for the concrete specimen. The sensor
PK6I has been used for the validation of SCU. The AE signal generated from concrete is burst
type. Hence, the resonant type AE sensor has been selected for this work. The sensor (PK6I)
manufactured by M/s. PAC, USA is used in the system which requires 4 to 7 Volts DC power
supply and has a resonant frequency at 55 kHz. The sensor gives a good response in the
frequency band of 35 to 65 kHz and has an integral pre-amplifier of 26 dB gain. The sensor is
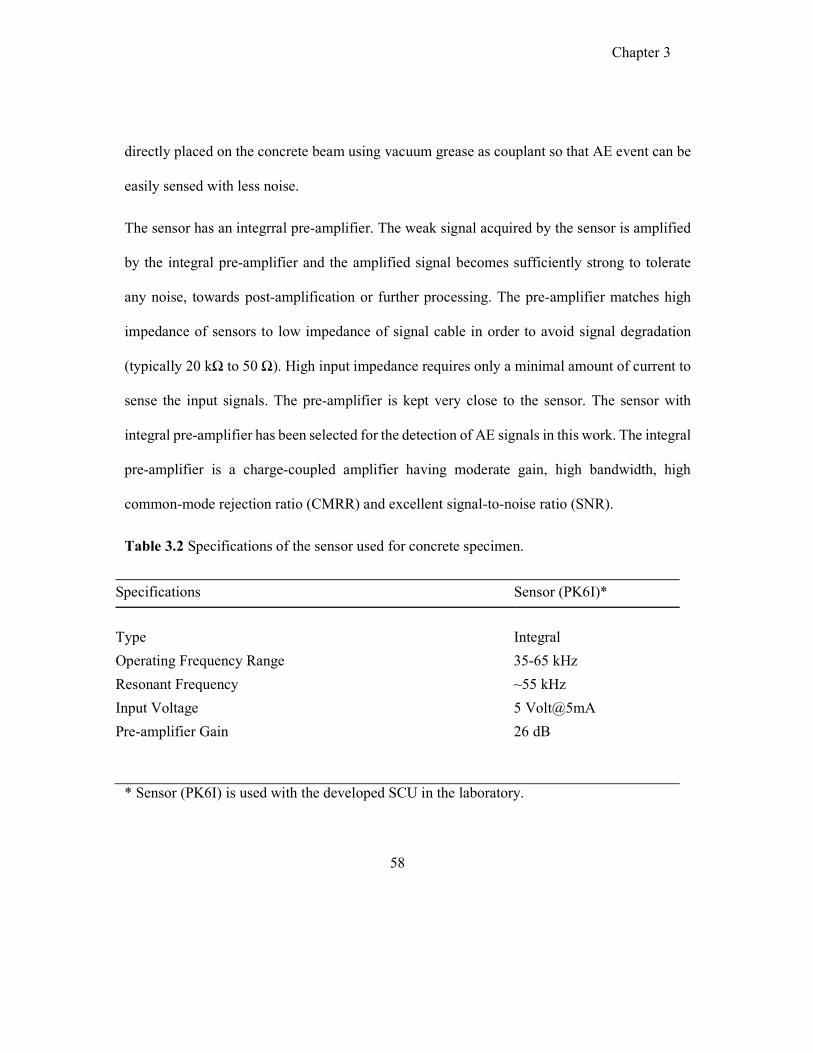
Chapter 3
58
directly placed on the concrete beam using vacuum grease as couplant so that AE event can be
easily sensed with less noise.
The sensor has an integrral pre-amplifier. The weak signal acquired by the sensor is amplified
by the integral pre-amplifier and the amplified signal becomes sufficiently strong to tolerate
any noise, towards post-amplification or further processing. The pre-amplifier matches high
impedance of sensors to low impedance of signal cable in order to avoid signal degradation
(typically 20 kΩ to 50 Ω). High input impedance requires only a minimal amount of current to
sense the input signals. The pre-amplifier is kept very close to the sensor. The sensor with
integral pre-amplifier has been selected for the detection of AE signals in this work. The integral
pre-amplifier is a charge-coupled amplifier having moderate gain, high bandwidth, high
common-mode rejection ratio (CMRR) and excellent signal-to-noise ratio (SNR).
Table 3.2 Specifications of the sensor used for concrete specimen.
Specifications Sensor (PK6I)*
Type
Integral
Operating Frequency Range 35-65 kHz
Resonant Frequency ~55 kHz
Input Voltage 5 Volt@5mA
Pre-amplifier Gain 26 dB
* Sensor (PK6I) is used with the developed SCU in the laboratory.
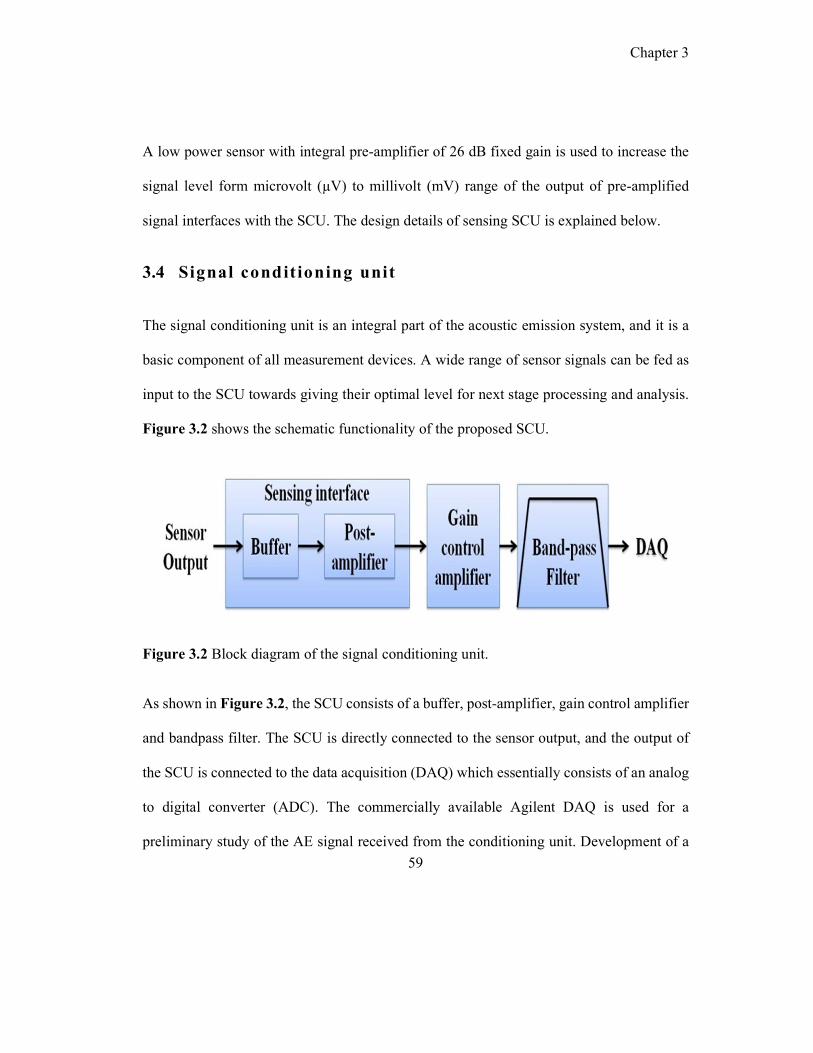
Chapter 3
59
A low power sensor with integral pre-amplifier of 26 dB fixed gain is used to increase the
signal level form microvolt (µV) to millivolt (mV) range of the output of pre-amplified
signal interfaces with the SCU. The design details of sensing SCU is explained below.
3.4 Signal condit ioning unit
The signal conditioning unit is an integral part of the acoustic emission system, and it is a
basic component of all measurement devices. A wide range of sensor signals can be fed as
input to the SCU towards giving their optimal level for next stage processing and analysis.
Figure 3.2 shows the schematic functionality of the proposed SCU.
Figure 3.2 Block diagram of the signal conditioning unit.
As shown in Figure 3.2, the SCU consists of a buffer, post-amplifier, gain control amplifier
and bandpass filter. The SCU is directly connected to the sensor output, and the output of
the SCU is connected to the data acquisition (DAQ) which essentially consists of an analog
to digital converter (ADC). The commercially available Agilent DAQ is used for a
preliminary study of the AE signal received from the conditioning unit. Development of a
Chapter 3
60
dedicated DAQ for wireless AE system is presented in Chapter 5. The design details of
signal conditioning blocks are discussed in subsequent sections.
3.4.1 Sensing interface circuit
The primary function of the conditioning unit is to acquire a signal from an AE sensor
without degrading the signal to noise ratio. The sensing interface circuit senses the pre-
amplified signal from the sensor. The amplified signal is fed to the buffer and subsequently
to the post-amplifier, as shown in Figure 3.2. There are diffrent important parameters are
to be consider while designing the sensing interface circuit which include:
1. Impedance matching
2. Amplification gain
3. Frequency bandwidth
The buffer provides impedance matching to the load. Impedance matching is in practice
used for maximizing the power transfer or minimizing signal reflection from the load. The
voltage buffer is a unity gain amplifier which is also called a voltage follower because the
output voltage follows or tracks the input [147].
The signal amplitude received from the sensor may vary significantly depending on the
strength of the source generating AE. Therefore, gain adjustment is required to amplify the
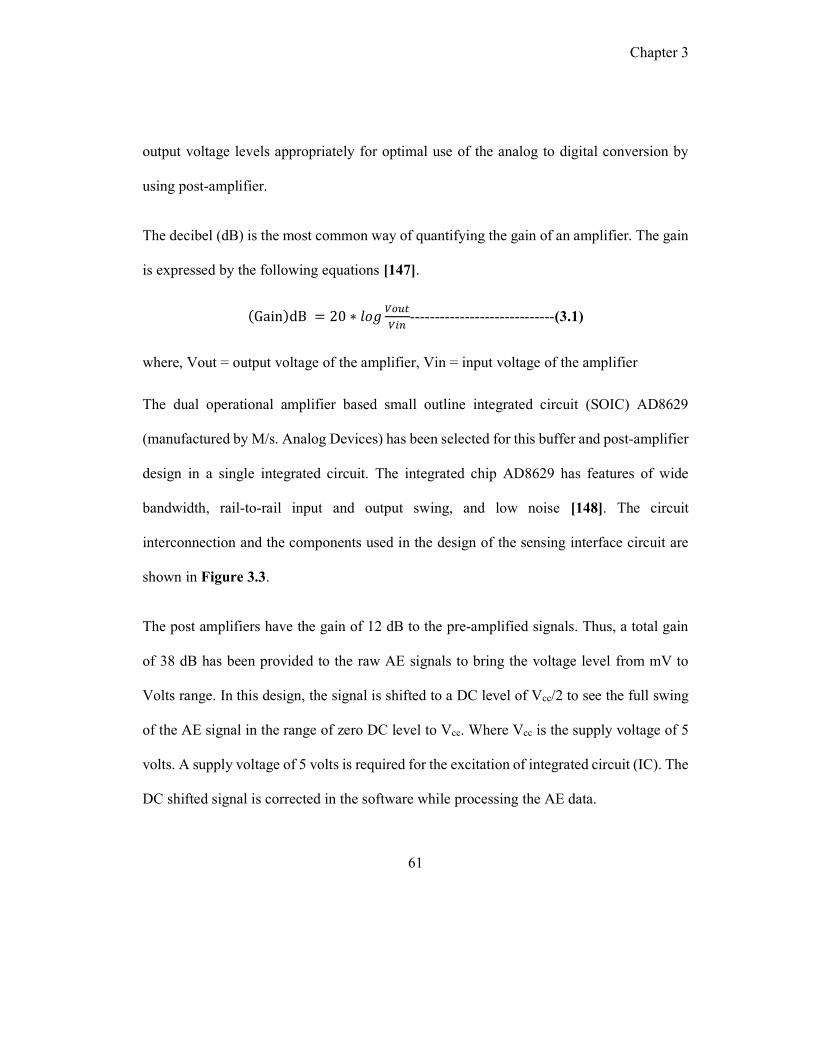
Chapter 3
61
output voltage levels appropriately for optimal use of the analog to digital conversion by
using post-amplifier.
The decibel (dB) is the most common way of quantifying the gain of an amplifier. The gain
is expressed by the following equations [147].
(Gain)dB = 20 ∗ 𝑙𝑜𝑔 -----------------------------(3.1)
where, Vout = output voltage of the amplifier, Vin = input voltage of the amplifier
The dual operational amplifier based small outline integrated circuit (SOIC) AD8629
(manufactured by M/s. Analog Devices) has been selected for this buffer and post-amplifier
design in a single integrated circuit. The integrated chip AD8629 has features of wide
bandwidth, rail-to-rail input and output swing, and low noise [148]. The circuit
interconnection and the components used in the design of the sensing interface circuit are
shown in Figure 3.3.
The post amplifiers have the gain of 12 dB to the pre-amplified signals. Thus, a total gain
of 38 dB has been provided to the raw AE signals to bring the voltage level from mV to
Volts range. In this design, the signal is shifted to a DC level of Vcc/2 to see the full swing
of the AE signal in the range of zero DC level to Vcc. Where Vcc is the supply voltage of 5
volts. A supply voltage of 5 volts is required for the excitation of integrated circuit (IC). The
DC shifted signal is corrected in the software while processing the AE data.
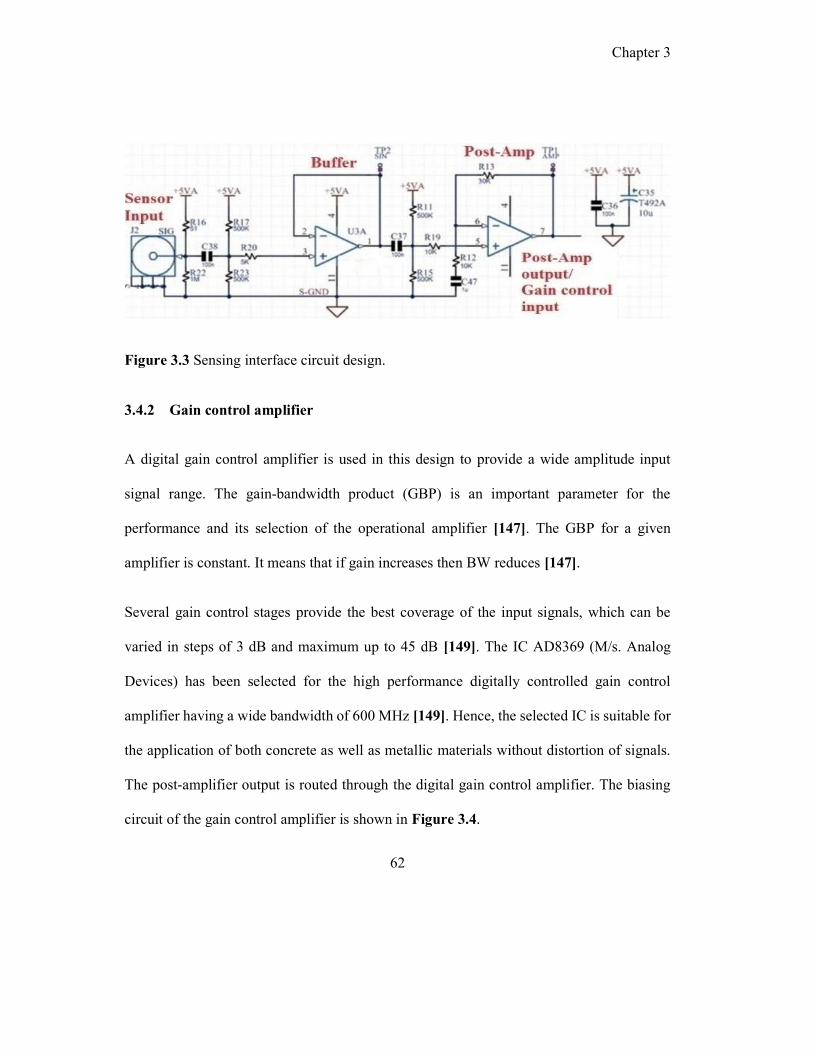
Chapter 3
62
Figure 3.3 Sensing interface circuit design.
3.4.2 Gain control amplifier
A digital gain control amplifier is used in this design to provide a wide amplitude input
signal range. The gain-bandwidth product (GBP) is an important parameter for the
performance and its selection of the operational amplifier [147]. The GBP for a given
amplifier is constant. It means that if gain increases then BW reduces [147].
Several gain control stages provide the best coverage of the input signals, which can be
varied in steps of 3 dB and maximum up to 45 dB [149]. The IC AD8369 (M/s. Analog
Devices) has been selected for the high performance digitally controlled gain control
amplifier having a wide bandwidth of 600 MHz [149]. Hence, the selected IC is suitable for
the application of both concrete as well as metallic materials without distortion of signals.
The post-amplifier output is routed through the digital gain control amplifier. The biasing
circuit of the gain control amplifier is shown in Figure 3.4.

Chapter 3
63
Figure 3.4 Circuit design for the digital gain control amplifier.
3.4.3 Filter design
Noise is a common and pervasive problem in electronics design and debug. It originates
from numerous external and internal sources to disturb the signals of interest [150]. A major
concern in noise-related signal is the measurement of true voltage of the signal. Noise makes
the measurement of timing difficult by increasing jitter. It is required to have the signal
noise-free and clean for the intended design of signal conditioning [150]. The pickup sensor
output signals are affected by external noise; hence a filter circuit is to be included to reduce
noise. The frequency of application of acoustic emission signals for metallic and concrete
lies in a certain frequency band. Hence there is a strong need to design bandpass filters that
can be used to isolate or filter out certain frequencies of AE signals that are lying within a
particular band or range of frequencies. There are two cascading stages involved in the
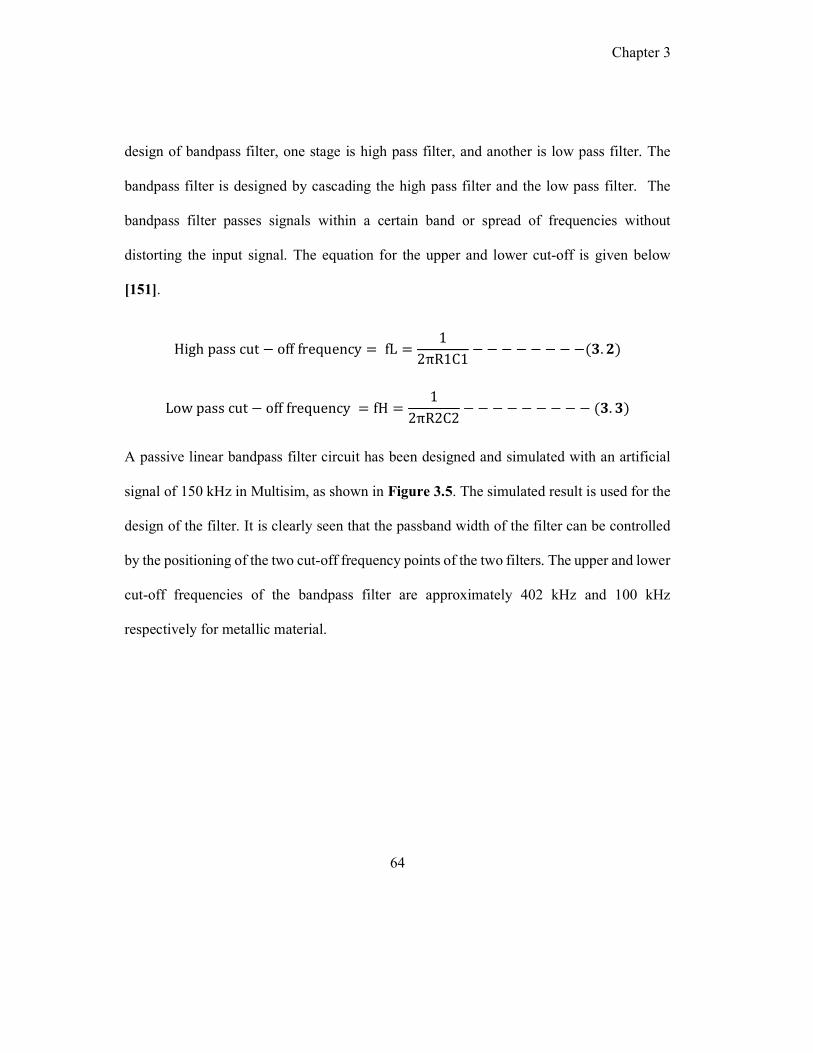
Chapter 3
64
design of bandpass filter, one stage is high pass filter, and another is low pass filter. The
bandpass filter is designed by cascading the high pass filter and the low pass filter. The
bandpass filter passes signals within a certain band or spread of frequencies without
distorting the input signal. The equation for the upper and lower cut-off is given below
[151].
High pass cut − off frequency = fL =1
2πR1C1− − − − − − − −(𝟑. 𝟐)
Low pass cut − off frequency = fH =1
2πR2C2− − − − − − − − − (𝟑. 𝟑)
A passive linear bandpass filter circuit has been designed and simulated with an artificial
signal of 150 kHz in Multisim, as shown in Figure 3.5. The simulated result is used for the
design of the filter. It is clearly seen that the passband width of the filter can be controlled
by the positioning of the two cut-off frequency points of the two filters. The upper and lower
cut-off frequencies of the bandpass filter are approximately 402 kHz and 100 kHz
respectively for metallic material.

Chapter 3
65
Figure 3.5 Schematic design and simulation results of the bandpass filter.
As per the design, sensing interface circuit, gain control amplifier, and bandpass filter has
been fabricated and assembled in a two-layer PCB. The photograph of the assembled
prototype signal conditioning unit is shown in Figure 3.6. The integrated prototype SCU
has been validated by conducting pencil lead break (PLB) tests on both metallic materials
(AISI type 310 stainless steel) and concrete in the laboratory. The experimental descriptions
and their results are presented in the subsequent section.

Chapter 3
66
Figure 3.6 Photograph of prototype signal conditioning unit.
3.5 Design validation of the SCU
3.5.1 Metallic material
Experiments have been performed for the validation of signal conditioning unit by capturing
artificial AE events generated on a 310 stainless steel (SS) plate by using a commercially
available wired AE system. The experimental setup has been made in the laboratory for the
acquisition and analysis of AE signals using the in-house developed SCU as well as a
commercially available one from M/s. Physical Acoustics Corporation (PAC), USA. The
photograph of the experimental setup is shown in Figures 3.7 (a) and (b). The pencil lead
is made to break against the surface of the material/structure under test. The surface of the
structure gets deformed by breakage of the pencil lead and this results in the sudden release
of acoustic energy which propagates throughout the structure [152].

Chapter 3
67
The AE signals generated from the PLB tests at different locations of the SS plate are stored
in ASCII form by using the data acquisition unit for post-analysis. Two similar sensors of
the model (PK15I) were connected to channels 1 and 2 of the data acquisition unit of the
developed SCU (Figure 3.7a). Two other similar sensors of the model (R15I) were
connected to channels 1 and 2 of the PAC system (Figure 3.7b). In Figure 3.7, Sensor 1
and Sensor 2 represent Channel 1 and Channel 2 of the two systems. The event of AE signals
was captured by both the developed SCU coupled with Agilent DAQ system (Figure 3.7a)
and the PAC, USA system (Figure 3.7b) simultaneously when it crosses the particular
threshold voltage. The value of the threshold voltage varies depending on the background
noise generated from the physical environmental condition. The PLB tests were conducted
at different distances of 20 cm, 40 cm, and 60 cm from sensor 1 to capture the single event
of AE signal using both sensors 1 and 2. The event of the AE signal generated by the PLB
tests at different locations was stored in the data acquisition unit as well as in the PAC
system for plotting and further analysis using Origin software.
Figure 3.8 and Figure 3.9 show the time domain AE signals from pencil lead break test
acquired by the developed SCU and by the PAC system, respectively. Figure 3.8 and
Figure 3.9 show the measured time differences between the signals captured by two sensors
from PLB tests. The PLB tests are performed at locations of 20 cm, 40 cm and 60 cm from
sensor 1 and 100 cm, 80 cm, 60 cm from sensor two respectively. The pattern of AE signals
and the measured time differences of the signals from the developed SCU (Figure 3.8)
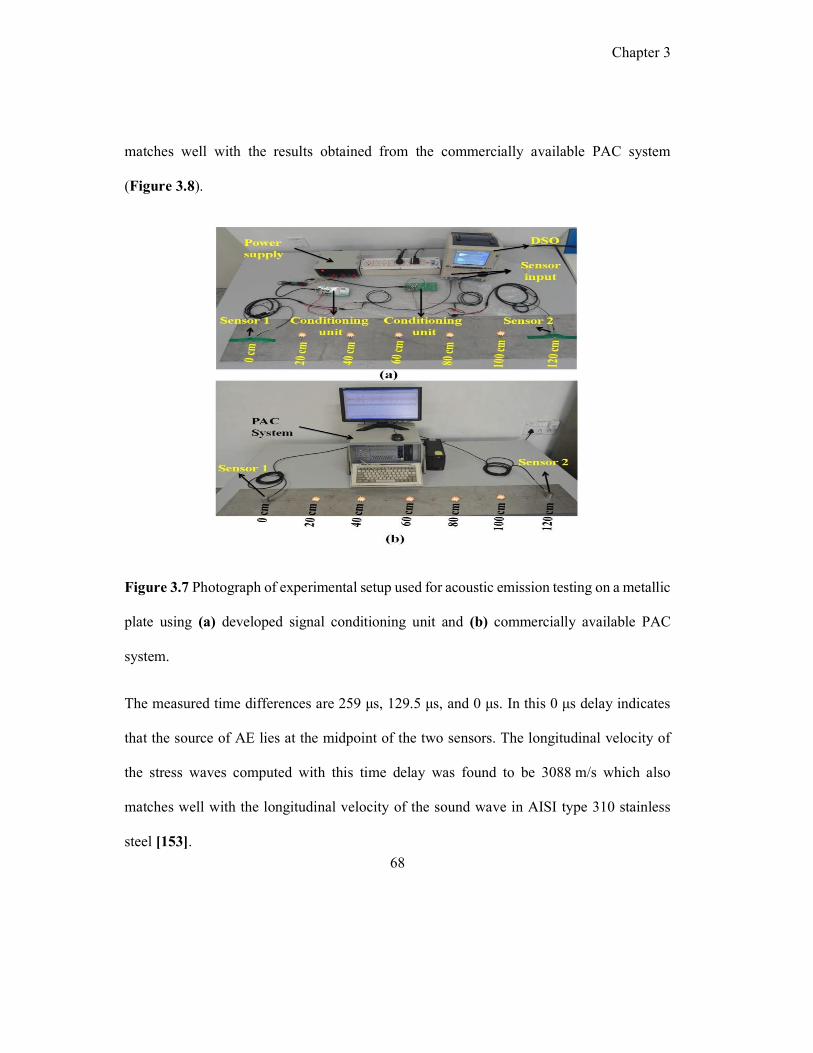
Chapter 3
68
matches well with the results obtained from the commercially available PAC system
(Figure 3.8).
Figure 3.7 Photograph of experimental setup used for acoustic emission testing on a metallic
plate using (a) developed signal conditioning unit and (b) commercially available PAC
system.
The measured time differences are 259 μs, 129.5 μs, and 0 μs. In this 0 μs delay indicates
that the source of AE lies at the midpoint of the two sensors. The longitudinal velocity of
the stress waves computed with this time delay was found to be 3088 m/s which also
matches well with the longitudinal velocity of the sound wave in AISI type 310 stainless
steel [153].

Chapter 3
69
Figure 3.8 Result of pencil lead break test of AE signals for the plate received from sensor
one and sensor two respectively by the developed conditioning unit.
Figure 3.9 Result of pencil lead break test of AE signals for the plate received from sensor
one and sensor two respectively by the PAC system.

Chapter 3
70
The frequency spectra of the captured AE events were also compared by computing Fast
Fourier Transform (FFT) of the time domain signals captured at different locations. Figure
3.10 shows the power spectral density of the signals received by the PLB tests of the SS
plate at distances of 20 cm, 40 cm and 60 cm from sensor one which is connected to channel
1 (ch1) of the in-house developed SCU. Figure 3.11. shows the similar results obtained
using the commercial PAC system. It can be seen that the peak frequency of the signals
acquired by both the systems is approximately the same. Also, it can be seen that the peak
frequency of the event occurring at different locations for both the systems is approximately
the same, i.e., peak frequency is 125.34 kHz for tests at distances of 20, 40, and 60 cm from
channel 1 using the developed SCU; and frequency is 122 kHz for tests at 20, 40, and 60
cm from channel 1 using the PAC system. In both the systems, the peak frequency varies
within the operating frequency range (100 kHz to 400 kHz) of the sensor. However, there
is statistical fluctuation in frequency caused by any minute difference in excitation by an
external force applied during the pencil lead break test. Since the characteristics of the
source influence the frequency content of the propagating AE signal [152].

Chapter 3
71
Figure 3.10 FFT of PLB test signals acquired using the developed SCU.
Figure 3.11 FFT of PLB test signals acquired using the PAC system.

Chapter 3
72
3.5.2 Concrete
An experiment has been performed for the validation of the developed signal conditioning
unit for concrete material. The frequency of operation of AE for concrete is different from
metallic materials. Hence, the bandpass filter has been designed with their upper and lower
cut-off frequencies of 27 kHz and 90 kHz respectively for concrete material.
An experimental setup was made for the acquisition and analysis of AE signals using the
in-house developed signal conditioning unit. A concrete beam of dimension (length = 400
mm, breadth = 100 mm, thickness = 100 mm) was used for the experiments. The
experimental photograph of the test setup is shown in Figure 3.12.
Figure 3.12 Photograph of the experimental setup used for acoustic emission testing in
concrete.

Chapter 3
73
The commercially available Agilent digital storage oscilloscope (DSO) was used for data
recording and display. The measured voltage level in the DSO is 20 mV without pencil lead
break test, and the trigger was set in the channel to capture the signal event on DSO. The
pencil lead break test was done at different locations on the concrete beam, i.e. at 10 cm, 20
cm and 30 cm from the PZT sensor to capture the single event of the AE signal. The sensor
PK6I was used with the developed SCU, as shown in Table 3.2. When the signal level
crosses the particular threshold voltage, one event is recorded. The event of the AE signal
generated by pencil lead break tests at different locations is stored in the DSO for further
analysis. The captured AE signals were analyzed by processing, computing the event
statistics and peak analysis.
The signals acquired by the PLB tests at different locations on the concrete beam were used
for finding the resonant frequency and peak amplitude of the AE signal. Figure 3.13(a),
Figure 3.13(b) and Figure 3.13(c) show the PLB signals and the corresponding FFT for the
distances of 10 cm, 20 cm and 30 cm from the sensor respectively.

Chapter 3
74
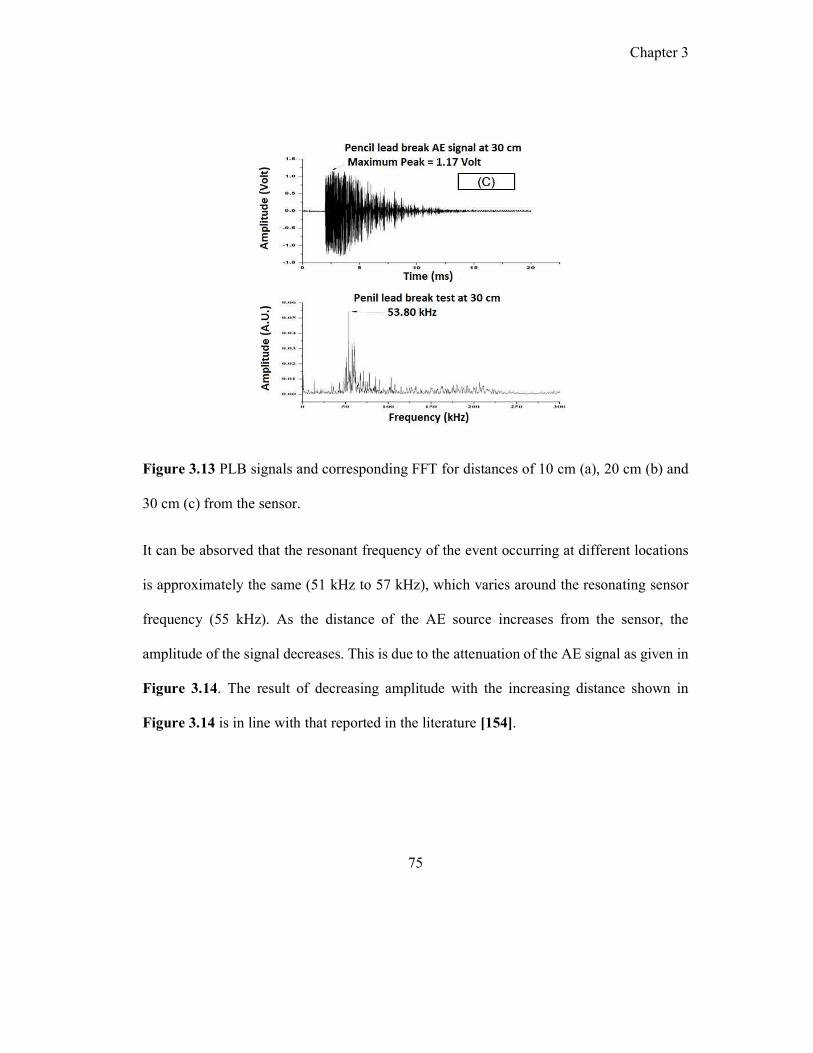
Chapter 3
75
Figure 3.13 PLB signals and corresponding FFT for distances of 10 cm (a), 20 cm (b) and
30 cm (c) from the sensor.
It can be absorved that the resonant frequency of the event occurring at different locations
is approximately the same (51 kHz to 57 kHz), which varies around the resonating sensor
frequency (55 kHz). As the distance of the AE source increases from the sensor, the
amplitude of the signal decreases. This is due to the attenuation of the AE signal as given in
Figure 3.14. The result of decreasing amplitude with the increasing distance shown in
Figure 3.14 is in line with that reported in the literature [154].

Chapter 3
76
Figure 3.14 Peak amplitude of the AE signal versus distance from the sensor.
3.6 Summary
A signal conditioning unit has been designed and developed for amplification and filtering
noise in the acoustic emission signals for the resonant sensor. The buffer, post-amplifier,
gain control amplifier, and filter has been designed and integrated for the development of
SCU. The developed SCU provides a wide range of sensor signals, rail-to-rail input and
output swings, and reduces the complexity of biasing and provides an optimal level for
further processing of AE signals. An appropriate bandpass filter has been designed and
simulated for application to metallic materials as well as to concrete structures to avoid
external noise interruption with AE signals. A combination of high pass and low pass filter
has been designed with their 3 dB cut-off frequency of 100 kHz- 400 kHz for metallic

Chapter 3
77
material and 27 kHz - 90 kHz for concrete respectively. The performance of the in-house
developed SCU has been compared with a commercially available system through the pencil
lead break test. The time-domain and power spectral density of the AE events reproduced
by the in-house developed SCU and a commercially available system has been found to
agree with each other. The resonant frequency at different locations is found to be the same
and lies within the operating frequency range from 100 to 400 kHz for metallic material and
35 to 65 kHz for concrete respectively.

Chapter 3
78

Chapter 4
79
4 Simulation study for parameters extraction of burst type AE signals
4.1 Preamble
This chapter proposes a new approach for transmitting the parameters of burst type AE
signals as against the entire signals over a wireless network, which would require huge
computational and hardware resources. It presents the hardware design using Multisim
simulation software and experimental validation of the hardware for extracting the AE
signal parameters.
4.2 Hardware design for parameter extract ion
Subsequent to the amplification and filtering of AE signals from the source using the SCU,
processing of the signals needs to be carried out to extract features for meaningful
interpretation of the results. But, wireless transmission and processing of the complete AE
signals require huge bandwidth and computational resources, respectively. In this context,
the new and novel hardware-based design has been proposed for extracting the parameters
of AE signals. Hence, this chapter is dedicated to the development of hardware for feature
extraction from AE signals and its validation. A combination of analog and digital circuit
design is presented in this chapter for the extraction of AE parameters using Multisim
simulation software. There are different parameters of acoustic emission signals such as
peak amplitude, root mean square (RMS), counts, rise time, and event duration. Parameter-
based analysis technique is routinely applied for the burst type AE signals. The derived

Chapter 4
80
parameters in turn are correlated to the deformation and fracture behaviour of materials. In
this technique, parameters from received burst type signals are extracted without saving the
waveforms at the controller. Parameter-based AE technique is advantageous over the signal-
based technique with reference to storing speed and data acquisition. The parameter-based
AE system will not have any shortage of computational resources and requirement of
bandwidth compared to waveform-based or signal-based AE system when dealing with a
large amount of data to be acquired and transmitted. The attributes of signal-based technique
require huge computational resources and large transmission bandwidth. The parameter-
based technique seems beneficial and advantageous in view of low cost, low physical system
memory, and low transmission bandwidth towards long term monitoring of structures.
The schematic design of a hardware system for extraction of the parameters from the AE
signal is shown in Figure 4.1. It consists of a signal processing board (AE Board) and
microcontroller blocks in addition to the sensor and the SCU. The details of the SCU have
been discussed in the previous chapter. The output signal from the SCU is fed into the AE
Board, as shown in Figure 4.1. A combination of analog and digital circuit design is
embedded in the AE board for extracting the AE parameters. The AE Board uses two crystal
clocks (frequencies 100 kHz and 50 kHz) which will be used for measuring timing-related
AE parameters. The microcontroller block is used for parameter processing and real-time
control.

Chapter 4
81
Figure 4.1 Schematic design of a hardware system for parameter extraction of the AE
signal.
A flow chart representing the working function of the hardware system design is shown in
Figure 4.2. An AE signal event occurs randomly, and it could be attributed to the
redistribution of localized strain energy that is generated by microscopic changes in a
material/structure under load. When the system starts, it continuously monitors the activity
of AE signals during loading condition. The event of the AE signal is detected when the
signal level crosses the threshold set by the digital to analog converter (DAC0) of the
controller block. Typically, an AE signal consists of a train of bursts of diminishing energy,
and there is no activity between the consecutive bursts. The controller block starts extracting
the parameters when the burst signal reaches the peak amplitude and completes at the end
of the signal. Therefore, at the end of each AE burst, the circuit has to extract all the
parameters. The controller block triggers the software command signal (AE_Softclear) to
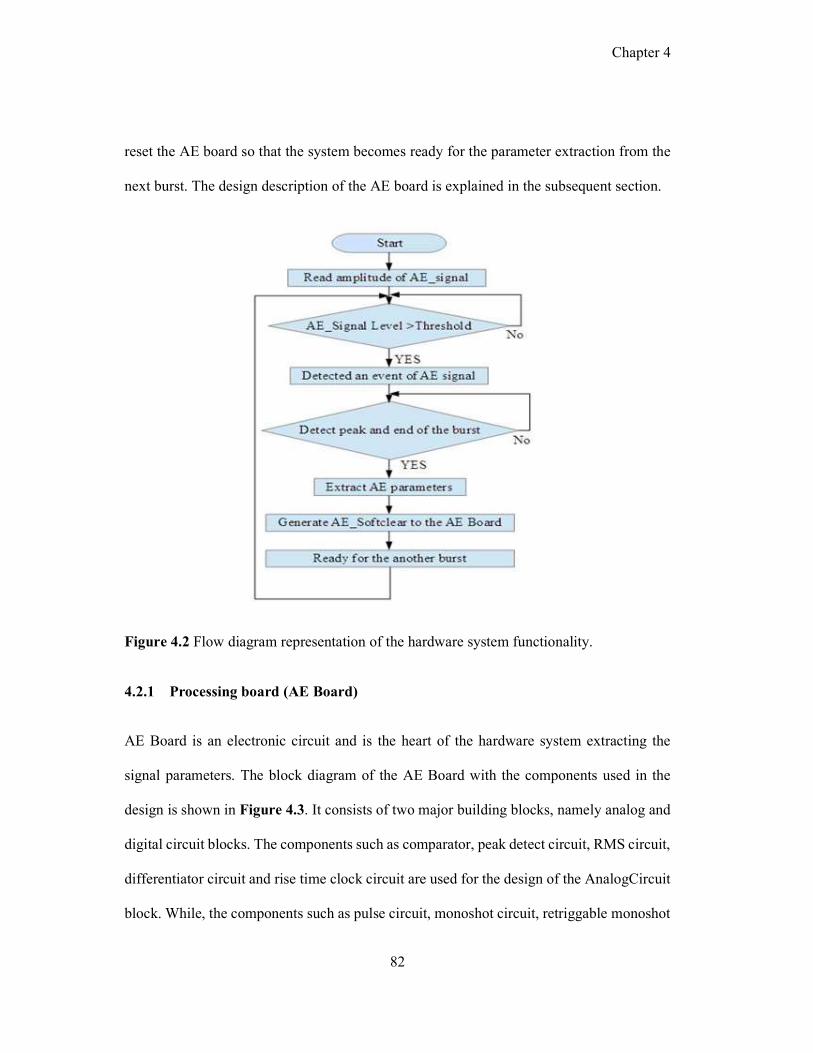
Chapter 4
82
reset the AE board so that the system becomes ready for the parameter extraction from the
next burst. The design description of the AE board is explained in the subsequent section.
Figure 4.2 Flow diagram representation of the hardware system functionality.
4.2.1 Processing board (AE Board)
AE Board is an electronic circuit and is the heart of the hardware system extracting the
signal parameters. The block diagram of the AE Board with the components used in the
design is shown in Figure 4.3. It consists of two major building blocks, namely analog and
digital circuit blocks. The components such as comparator, peak detect circuit, RMS circuit,
differentiator circuit and rise time clock circuit are used for the design of the AnalogCircuit
block. While, the components such as pulse circuit, monoshot circuit, retriggable monoshot

Chapter 4
83
circuit, AND gate, OR gate, NOT gate and T-FF (Toggle Flip Flop) are used for the design
of digital circuit block.
Figure 4.3 Block diagram of AE Board with the components used in the design.
The interconnection of input and output signals from the two blocks for the AE Board design
in Multisim software is shown in Figure 4.4. As for as the design is concerned, there are
two types of parameters associated with the burst type AE signals, namely analog and
digital. The AE signal parameters such as peak amplitude and RMS are analog parameters
while counts, rise time and event duration are digital parameters. The analog parameters are
extracted from the analog circuit block, and the digital parameters are extracted from the
analog as well as digital circuit block. The design description of the two blocks is explained
in the subsequent sections.

Chapter 4
84
Figure 4.4 AE Board design.
4.2.1.1 Analog circuit block
The analog circuits block measures the peak amplitude and RMS values of AE burst signal
and also generates prerequisite signals for the timing measurement by the digital circuit. A
Multisim design of the analog circuit block with the interconnection of different circuit
blocks such as comparator, PeakDetect, RMScircuit, Differentiator and RTclkGen is shown
in Figure 4.5.
Figure 4.5 AnalogCircuit (Analog circuit) block design.
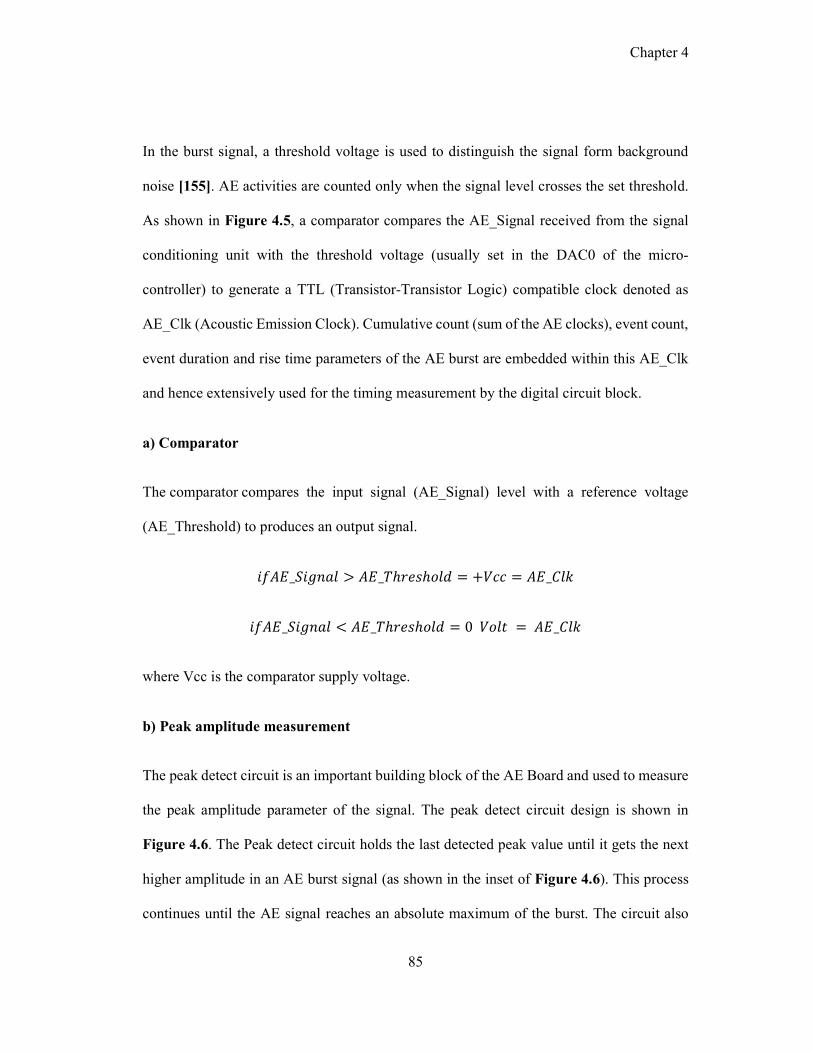
Chapter 4
85
In the burst signal, a threshold voltage is used to distinguish the signal form background
noise [155]. AE activities are counted only when the signal level crosses the set threshold.
As shown in Figure 4.5, a comparator compares the AE_Signal received from the signal
conditioning unit with the threshold voltage (usually set in the DAC0 of the micro-
controller) to generate a TTL (Transistor-Transistor Logic) compatible clock denoted as
AE_Clk (Acoustic Emission Clock). Cumulative count (sum of the AE clocks), event count,
event duration and rise time parameters of the AE burst are embedded within this AE_Clk
and hence extensively used for the timing measurement by the digital circuit block.
a) Comparator
The comparator compares the input signal (AE_Signal) level with a reference voltage
(AE_Threshold) to produces an output signal.
𝑖𝑓𝐴𝐸_𝑆𝑖𝑔𝑛𝑎𝑙 > 𝐴𝐸_𝑇ℎ𝑟𝑒𝑠ℎ𝑜𝑙𝑑 = +𝑉𝑐𝑐 = 𝐴𝐸_𝐶𝑙𝑘
𝑖𝑓𝐴𝐸_𝑆𝑖𝑔𝑛𝑎𝑙 < 𝐴𝐸_𝑇ℎ𝑟𝑒𝑠ℎ𝑜𝑙𝑑 = 0 𝑉𝑜𝑙𝑡 = 𝐴𝐸_𝐶𝑙𝑘
where Vcc is the comparator supply voltage.
b) Peak amplitude measurement
The peak detect circuit is an important building block of the AE Board and used to measure
the peak amplitude parameter of the signal. The peak detect circuit design is shown in
Figure 4.6. The Peak detect circuit holds the last detected peak value until it gets the next
higher amplitude in an AE burst signal (as shown in the inset of Figure 4.6). This process
continues until the AE signal reaches an absolute maximum of the burst. The circuit also

Chapter 4
86
produces a peak reset signal, as shown in Figure 4.6. The peak circuit design is embedded
in the peak detector block with their input and outputs as AE_Signal, Peak_Out and PKreset.
This peak amplitude value is read by ADC1 of the controller block.
Figure 4.6 Peak detect circuit along with peak reset.
c) RMS measurements
Root Mean Square (RMS) is the most useful measurement of the amplitude of the time-
variant signals. RMS is only unifying metric of all time-varying signals. It is implied to an
AC quantity of current or voltage in terms of functionality equivalent to their DC values
[156]. Measurement of the RMS value requires an RMS-to-DC converter, which provides
a DC output equal to the RMS value of any input AE signal. The AD536AJD IC
(manufactured by M/s. Analog devices) is used in the Multisim design as an RMS-to-DC
converter. The RMS circuit design is shown in Figure 4.7. The RMS circuit design is
embedded in the RMScircuit block with their input and output pin as AEsignal and RMSout
respectively. The output of the RMS circuit is read through the ADC0 of the microcontroller
block.
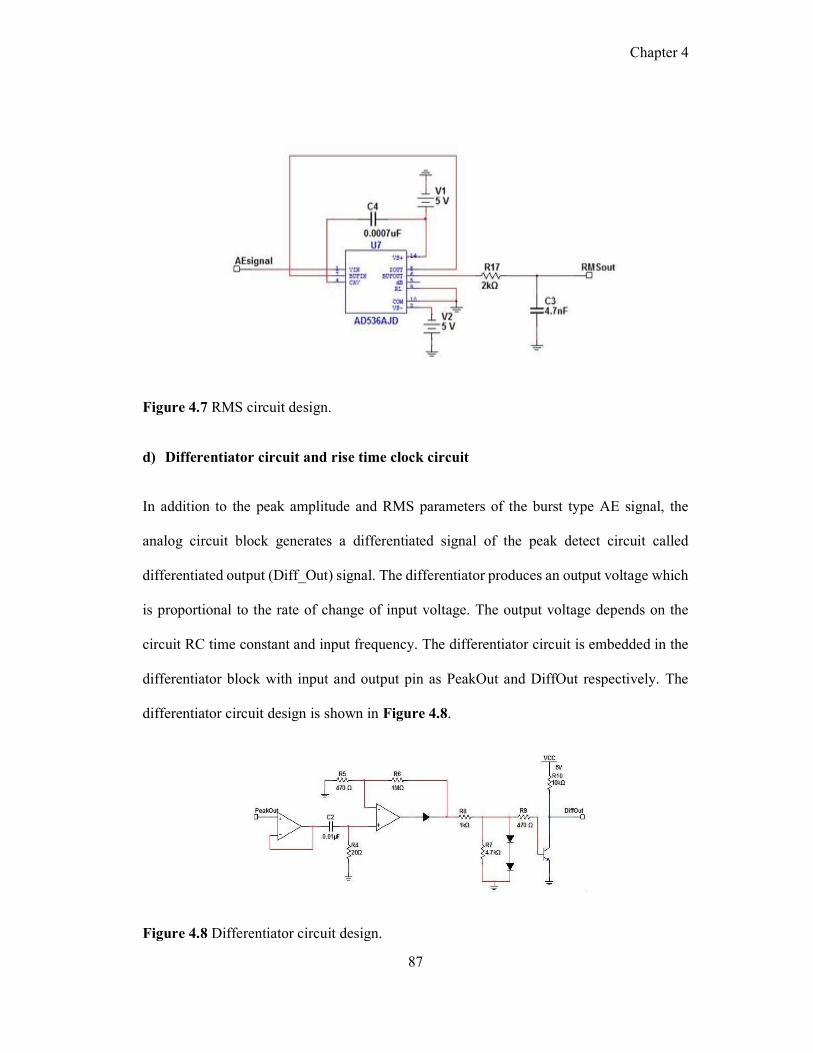
Chapter 4
87
Figure 4.7 RMS circuit design.
d) Differentiator circuit and rise time clock circuit
In addition to the peak amplitude and RMS parameters of the burst type AE signal, the
analog circuit block generates a differentiated signal of the peak detect circuit called
differentiated output (Diff_Out) signal. The differentiator produces an output voltage which
is proportional to the rate of change of input voltage. The output voltage depends on the
circuit RC time constant and input frequency. The differentiator circuit is embedded in the
differentiator block with input and output pin as PeakOut and DiffOut respectively. The
differentiator circuit design is shown in Figure 4.8.
Figure 4.8 Differentiator circuit design.
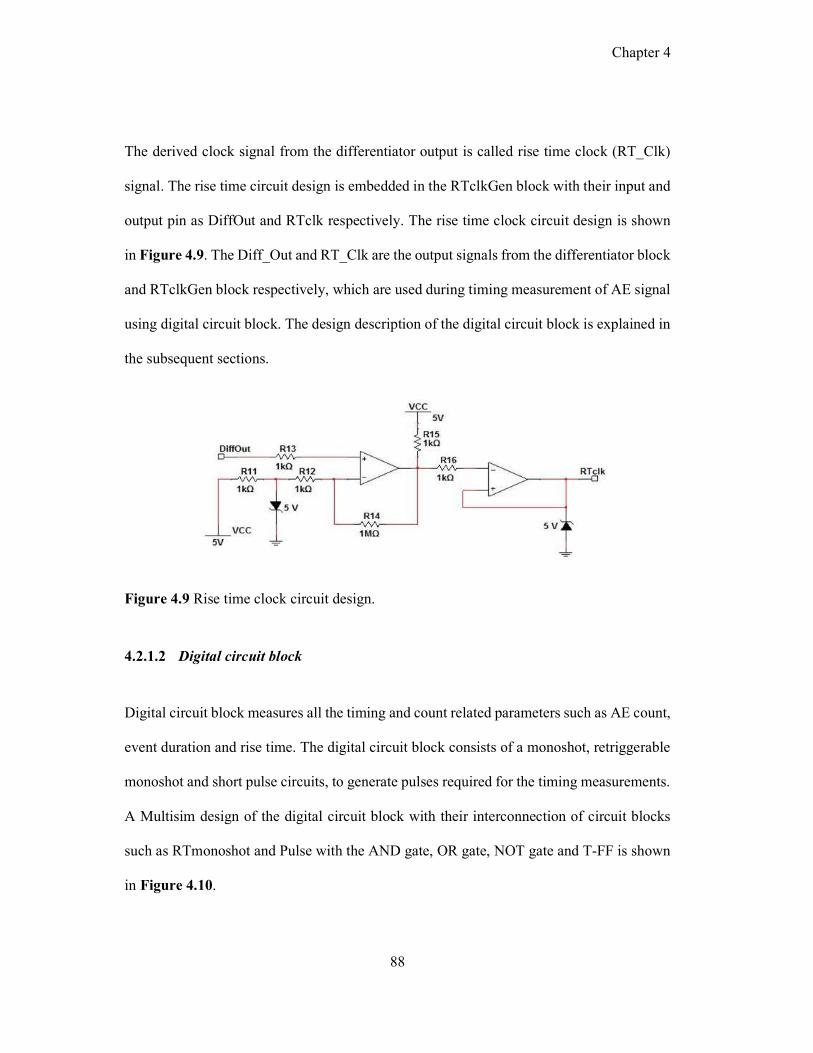
Chapter 4
88
The derived clock signal from the differentiator output is called rise time clock (RT_Clk)
signal. The rise time circuit design is embedded in the RTclkGen block with their input and
output pin as DiffOut and RTclk respectively. The rise time clock circuit design is shown
in Figure 4.9. The Diff_Out and RT_Clk are the output signals from the differentiator block
and RTclkGen block respectively, which are used during timing measurement of AE signal
using digital circuit block. The design description of the digital circuit block is explained in
the subsequent sections.
Figure 4.9 Rise time clock circuit design.
4.2.1.2 Digital circuit block
Digital circuit block measures all the timing and count related parameters such as AE count,
event duration and rise time. The digital circuit block consists of a monoshot, retriggerable
monoshot and short pulse circuits, to generate pulses required for the timing measurements.
A Multisim design of the digital circuit block with their interconnection of circuit blocks
such as RTmonoshot and Pulse with the AND gate, OR gate, NOT gate and T-FF is shown
in Figure 4.10.
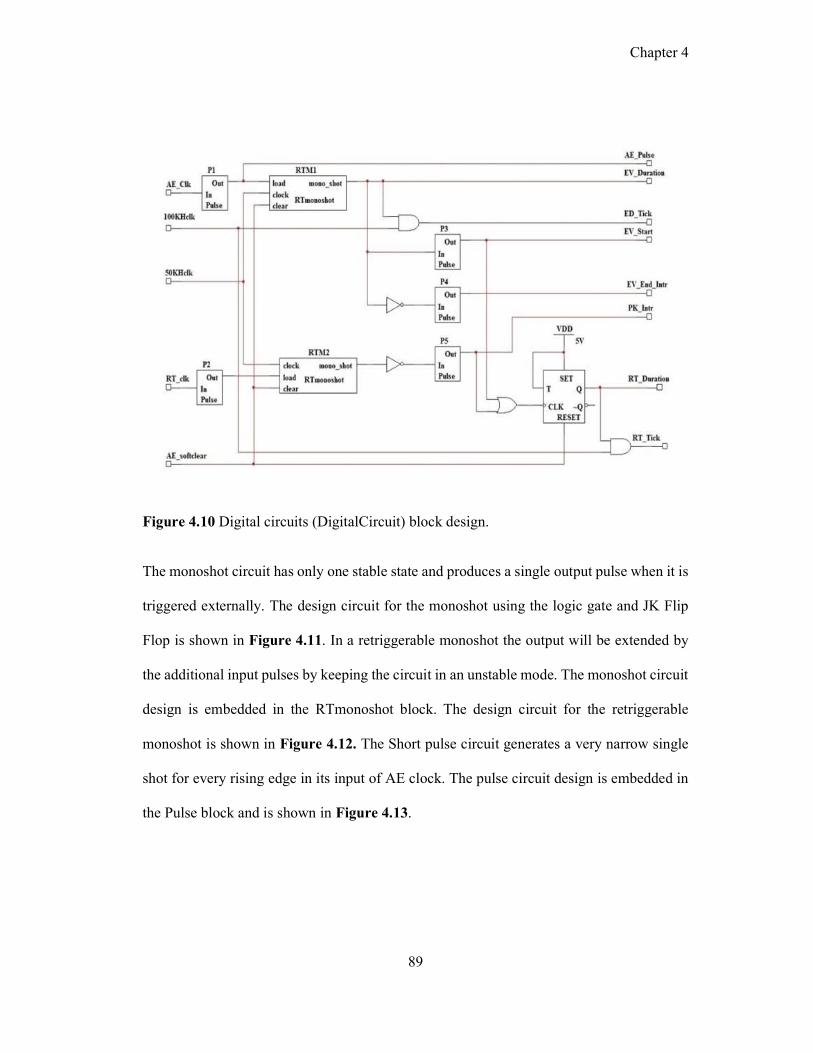
Chapter 4
89
Figure 4.10 Digital circuits (DigitalCircuit) block design.
The monoshot circuit has only one stable state and produces a single output pulse when it is
triggered externally. The design circuit for the monoshot using the logic gate and JK Flip
Flop is shown in Figure 4.11. In a retriggerable monoshot the output will be extended by
the additional input pulses by keeping the circuit in an unstable mode. The monoshot circuit
design is embedded in the RTmonoshot block. The design circuit for the retriggerable
monoshot is shown in Figure 4.12. The Short pulse circuit generates a very narrow single
shot for every rising edge in its input of AE clock. The pulse circuit design is embedded in
the Pulse block and is shown in Figure 4.13.

Chapter 4
90
Figure 4.11 Monoshot circuit design.
Figure 4.12 Retriggerable monoshot circuit design.
Figure 4.13 Short pulse circuit design.
Chapter 4
91
a) Count measurements
The AE_Clk output from the AnalogCircuit block (Figure 4.4) is interfaced with the pulse
sub-block of the DigitalCircuit block (Figure 4.10) for the measurement of counts. The
pulse sub-block generates a very narrow single shot for every rising edge in its input of
AE_clk. This single narrow shot is required for noise immunity, and the counters count these
narrow shots. The AE_Pulse output from the DigitalCircuit block is counted by the counter
zero (CNT0) to get counts and cumulative counts (sum of counts in each event) from the
controller block (Figure 4.1).
b) Event duration and event counts measurement
AE_clk is also fed to two retriggerable monoshot circuits to generate RTM1, and RTM2
signals and are used for event duration and event count measurements respectively. In order
to measure the event duration, the RTM1 signal is clocked by 50 kHz clock. The internal
delay of RTM1 is set to be 3T where T is the pulse width of 50 kHz clock, i.e., 20 µs
(microsecond). This 3T should be wider than the largest possible width of AE_Clk. So, for
every AE_Pulse, the output of the RTM1 extends to 60 μs, which results in a constant offset
in event duration. Hence, the actual event duration is determined by subtracting 60 μs from
the measured time difference between the start and end of the events. The event duration
pulse is ANDed with a 100 kHz clock (10 μs tick width) to generate ED_Tick (Event
Duration Ticks). CNT_2 counts the ED_Ticks. The count value (the number of ED_Tick)
multiplied by the ANDed clock period of 10 μs minus 60 μs (3T) is the value of measured
event duration. EV_Start (Event Start) and EV_End_Intr (Event End Interrupt) are

Chapter 4
92
generated from the rising and falling edges of an Event Duration signal. EV_start pulse is
used to count the event count by CNT_1 counter.
c) Rise time measurement
In order to measure the rise time of the burst, one has to know the time elapsed from the
first occurrence of AE count until it reaches the peak. The first occurrence of the AE counts
starts from when the AE signal crosses the threshold. The rise time clock (RT_clk) generated
from AnalogCircuit block and interfaced to the DigitalCircuit block is shown in Figure 4.4.
The RT_clk generated by using interfacing of peak detect circuit (PeakDetect), differentiator
circuit (Differentiator) and rise time clock generator circuit (RTclkGen) is shown in Figure
4.5. The output of the peak detect circuit has a rising edge followed by a steady-state, and it
continues until it reaches the maximum amplitude of the AE_Signal (inset of Figure 4.6).
So, the rising edge ceases to exist after the arrival of the peak. If the peak output is
differentiated by the differentiator circuit (Figure 4.8), there will be pulses at every rising
edge of the PK_out (Peak out) signal. The Diff_out signal from the differentiator circuit of
the analog circuit block is used for this purpose of generating the pulse at every rising edge
of the PK_out signal. The pulses (Diff_out) are then amplified and made TTL level by
RTclkGen block (Figure 4.9). Finally, we get RT_clk (Rise Time clock) pulses. The last
pulse of RT_clk indicates the end of rise time. Therefore, the time duration between event
start pulse and the last pulse of RT_clk will be the rise time. RT_Clk is used to measure the
rise time duration. RTM2 also has an extra 3T delay as explained previously in the event
duration measurement. Although RTM2 is used for the generation RT_Duration (Rise Time
Duration) but there will be an error in RT_Clk. The RT_Clk is generated from an analog
differentiator block where sufficient growth in peak value is required to get RT_Clk. So, the

Chapter 4
93
initial RT_Clk may arise stochastically before or after EV_Start. To avoid this ambiguity,
the rise time is evaluated between the EV_Start and PK_Intr (Peak Interrupt). 100 kHz clock
ANDed with RT_Duration is used to get RT_Tick (Rise time Tick). The number of
RT_Ticks are counted by CNT_3 counter for rise time measurement in μsec. Thus all the
parameters are extracted in the hardware.
4.2.2 Results and discussion
Multisim is an advanced SPICE simulation environment. The simulation is done on real AE
data collected by the pencil lead break tests on a concrete block, as discussed in the previous
chapter. The AE data is stored in ASCII format using the developed signal conditioning
board. The pencil lead test AE signal is amplified and stored for 2 ms (millisecond) and the
signal contains four AE bursts (AE_Signal). Approximate duration of each AE burst varies
from 150 to 200 µs. The AE_Signal is applied to the AE Board and simulated in the
Multisim simulator. The simulated result of analog circuit (AnalogCircuit) blocks such as
AE_clk, AE_RMS, AE_Peak, Diff_Out and RT_clk are shown in the Figure 4.14a.
Similarly, the simulated result of digital circuit (DigitalCircuit) blocks such as AE_Clk,
AE_Pulse, EV_Duration, EV_Start_Pulse, EV_End_Intr, EV_Tick, RT_Clk, PK_Intr,
RT_Duration, RT_Tick, 100 kHz and 50 kHz are shown in the Figure 4.14b. The simulated
result from AnalogCircuit blocks are used for the measurement of analog parameters such
as peak and RMS of the AE signals. The simulated result of DigitalCircuit blocks are used
for the measurement of digital parameters such as counts, event duration and rise time of
the AE signals.

Chapter 4
94
Figure 4.14 Simulation results of (a) AnalogCircuit block and (b) DigitalCircuit block.
As observed from Figure 4.14a, the comparator output of the analog circuit block is a TTL
compatible AE_Clk. The RMS of the AE signal is a DC signal with nominal fluctuations
[139]. The peak detector output as expected rises steps by step (for every event) till it reaches
the maximum peak. Differentiator circuit generates pulses at the rising edge of AE_Peak
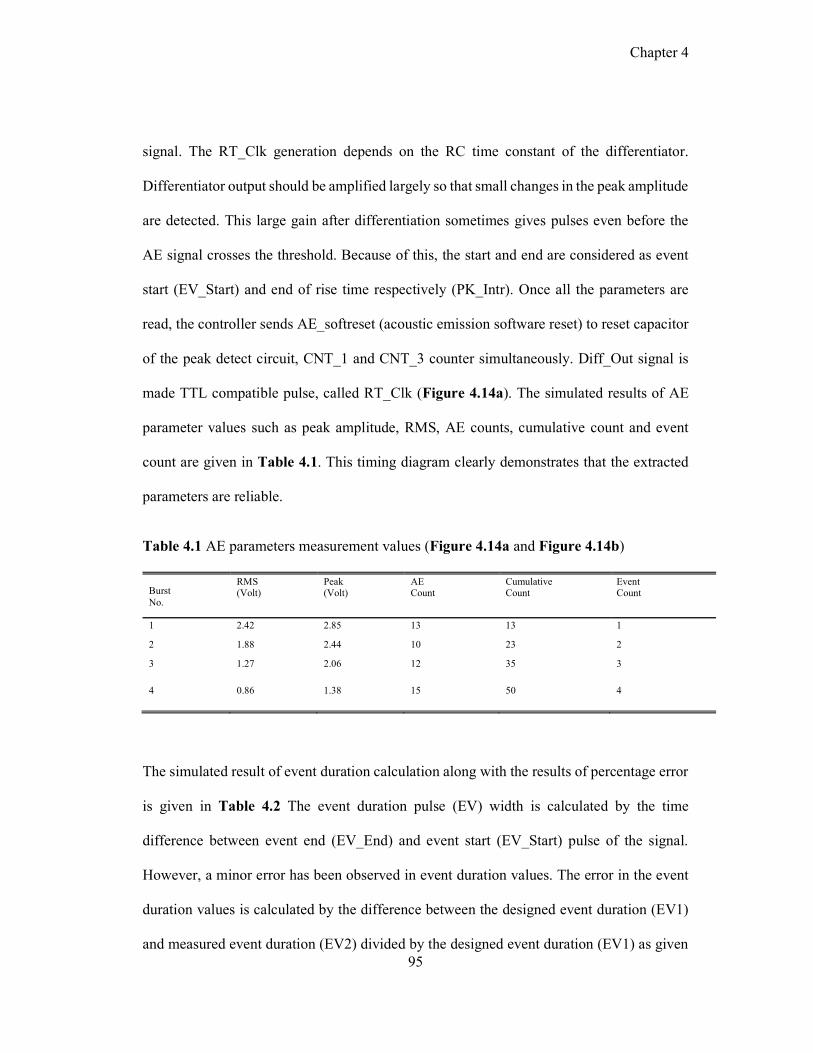
Chapter 4
95
signal. The RT_Clk generation depends on the RC time constant of the differentiator.
Differentiator output should be amplified largely so that small changes in the peak amplitude
are detected. This large gain after differentiation sometimes gives pulses even before the
AE signal crosses the threshold. Because of this, the start and end are considered as event
start (EV_Start) and end of rise time respectively (PK_Intr). Once all the parameters are
read, the controller sends AE_softreset (acoustic emission software reset) to reset capacitor
of the peak detect circuit, CNT_1 and CNT_3 counter simultaneously. Diff_Out signal is
made TTL compatible pulse, called RT_Clk (Figure 4.14a). The simulated results of AE
parameter values such as peak amplitude, RMS, AE counts, cumulative count and event
count are given in Table 4.1. This timing diagram clearly demonstrates that the extracted
parameters are reliable.
Table 4.1 AE parameters measurement values (Figure 4.14a and Figure 4.14b)
Burst No.
RMS (Volt)
Peak (Volt)
AE Count
Cumulative Count
Event Count
1 2.42 2.85 13 13 1
2 1.88 2.44 10 23 2
3 1.27 2.06 12 35 3
4 0.86 1.38 15 50 4
The simulated result of event duration calculation along with the results of percentage error
is given in Table 4.2 The event duration pulse (EV) width is calculated by the time
difference between event end (EV_End) and event start (EV_Start) pulse of the signal.
However, a minor error has been observed in event duration values. The error in the event
duration values is calculated by the difference between the designed event duration (EV1)
and measured event duration (EV2) divided by the designed event duration (EV1) as given
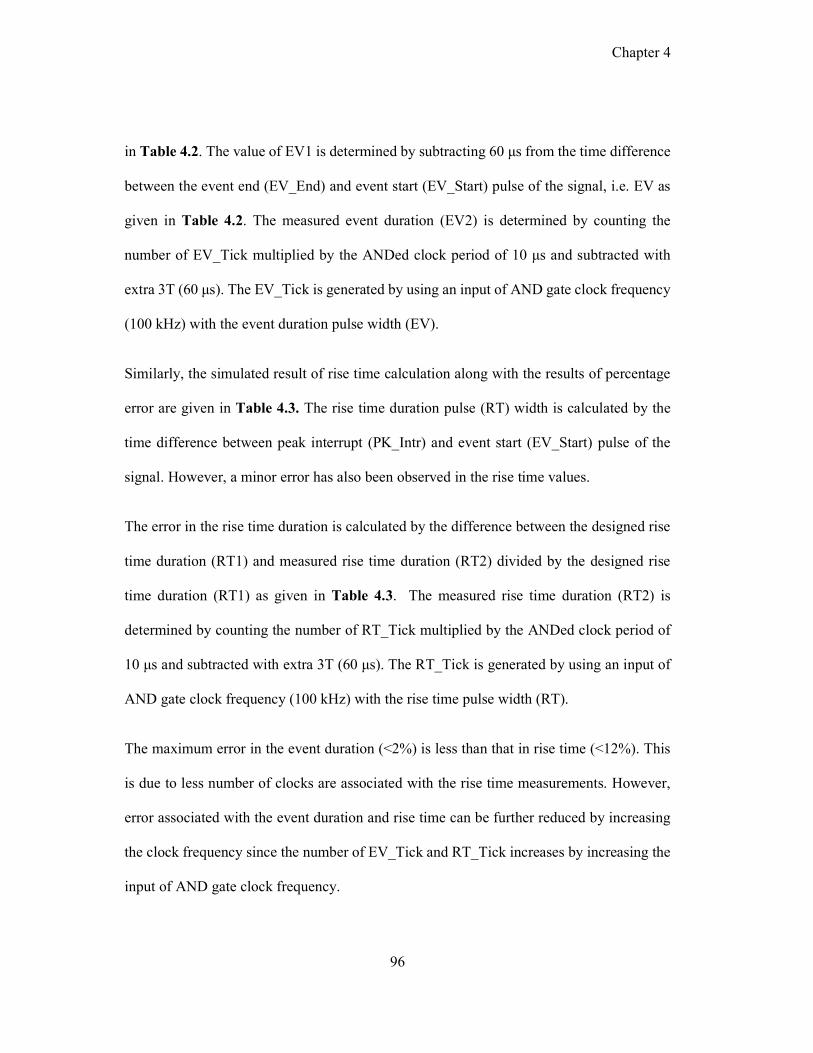
Chapter 4
96
in Table 4.2. The value of EV1 is determined by subtracting 60 μs from the time difference
between the event end (EV_End) and event start (EV_Start) pulse of the signal, i.e. EV as
given in Table 4.2. The measured event duration (EV2) is determined by counting the
number of EV_Tick multiplied by the ANDed clock period of 10 μs and subtracted with
extra 3T (60 μs). The EV_Tick is generated by using an input of AND gate clock frequency
(100 kHz) with the event duration pulse width (EV).
Similarly, the simulated result of rise time calculation along with the results of percentage
error are given in Table 4.3. The rise time duration pulse (RT) width is calculated by the
time difference between peak interrupt (PK_Intr) and event start (EV_Start) pulse of the
signal. However, a minor error has also been observed in the rise time values.
The error in the rise time duration is calculated by the difference between the designed rise
time duration (RT1) and measured rise time duration (RT2) divided by the designed rise
time duration (RT1) as given in Table 4.3. The measured rise time duration (RT2) is
determined by counting the number of RT_Tick multiplied by the ANDed clock period of
10 μs and subtracted with extra 3T (60 μs). The RT_Tick is generated by using an input of
AND gate clock frequency (100 kHz) with the rise time pulse width (RT).
The maximum error in the event duration (<2%) is less than that in rise time (<12%). This
is due to less number of clocks are associated with the rise time measurements. However,
error associated with the event duration and rise time can be further reduced by increasing
the clock frequency since the number of EV_Tick and RT_Tick increases by increasing the
input of AND gate clock frequency.
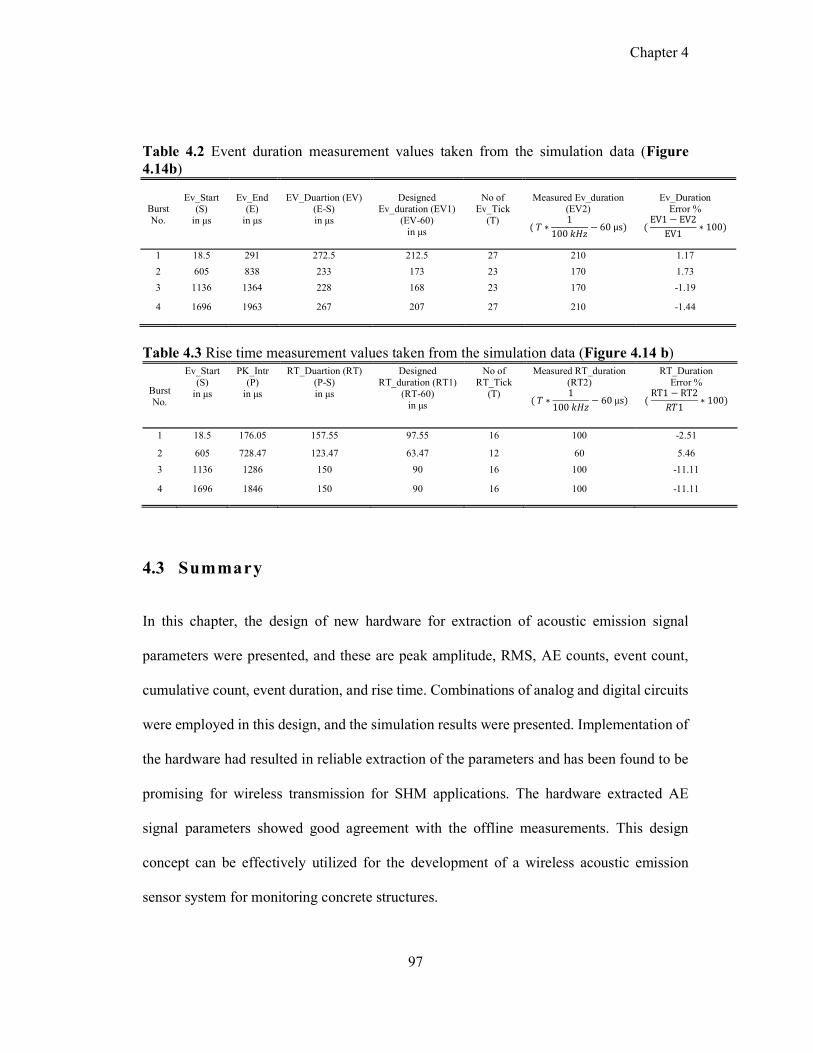
Chapter 4
97
Table 4.2 Event duration measurement values taken from the simulation data (Figure 4.14b)
Burst No.
Ev_Start
(S) in μs
Ev_End
(E) in μs
EV_Duartion (EV)
(E-S) in μs
Designed
Ev_duration (EV1) (EV-60)
in μs
No of
Ev_Tick (T)
Measured Ev_duration
(EV2)
( 𝑇 ∗1
100 𝑘𝐻𝑧− 60 μs)
Ev_Duration
Error %
( EV1 − EV2
EV1∗ 100)
1 18.5 291 272.5 212.5 27 210 1.17
2 605 838 233 173 23 170 1.73
3 1136 1364 228 168 23 170 -1.19
4 1696 1963 267 207 27 210 -1.44
Table 4.3 Rise time measurement values taken from the simulation data (Figure 4.14 b)
Burst No.
Ev_Start (S)
in μs
PK_Intr (P)
in μs
RT_Duartion (RT) (P-S) in μs
Designed RT_duration (RT1)
(RT-60) in μs
No of RT_Tick
(T)
Measured RT_duration (RT2)
( 𝑇 ∗1
100 𝑘𝐻𝑧− 60 μs)
RT_Duration Error %
( RT1 − RT2
𝑅𝑇1∗ 100)
1 18.5 176.05 157.55 97.55 16 100 -2.51
2 605 728.47 123.47 63.47 12 60 5.46
3 1136 1286 150 90 16 100 -11.11
4 1696 1846 150 90 16 100 -11.11
4.3 Summary
In this chapter, the design of new hardware for extraction of acoustic emission signal
parameters were presented, and these are peak amplitude, RMS, AE counts, event count,
cumulative count, event duration, and rise time. Combinations of analog and digital circuits
were employed in this design, and the simulation results were presented. Implementation of
the hardware had resulted in reliable extraction of the parameters and has been found to be
promising for wireless transmission for SHM applications. The hardware extracted AE
signal parameters showed good agreement with the offline measurements. This design
concept can be effectively utilized for the development of a wireless acoustic emission
sensor system for monitoring concrete structures.

Chapter 4
98

Chapter 5
99
5 Design development and validation of data acquisition device
5.1 Preamble
This chapter deals with the deployment of a programmable system on chip (PSoC) based
data acquisition device for efficiently acquiring the AE signals and parameters in a wireless
environment. It presents the hardware and software developments using PSoC. Generating
and acquiring burst type AE signals has been demonstrated in this chapter.
5.2 Introduction
Digital storage oscilloscopes (DSOs) are well suited for acquiring data using sensors in a
laboratory environment, as has been reported in the previous chapter. However, for field
applications, surged and dedicated systems capable of acquiring AE signal parameters are
essential. Moreover, a DSO is a general-purpose equipment designed to acquire, display and
record the signal from any transducer and hence has many additional features which are not
essential for integrating with AE equipment. Thus, a portable and modular data acquisition
(DAQ) system needs to be developed for wireless AE applications. Such a DAQ system
should meet the following requirements.
1. The throughput of the DAQ system should be reasonably high so that the
system can acquire all possible changes in the physical processes.
2. The DAQ should be rugged for structural health monitoring applications.
Chapter 5
100
3. The DAQ should have the capability for interactive human-machine
interface.
4. It should be possible to control the data export rate to an external computer
for further processing.
5. It should have the simplest of design and control features so that the same
can be operated by another user.
6. The DAQ should be cost-effective and extremely portable.
Considering these aspects, work has been carried out to design and develop a data
acquisition system based on PSoC for structural health monitoring. The configuration
software has been designed using the PSoC creator 4.0 platform. Subsequently, a Human
Machine Interface (HMI) has been developed for an interactive layout and to process the
event of AE signals acquired using the PSoC. The development of the PSoC based DAQ
has been validated by acquiring artificial AE signals in the laboratory. It is shown that the
results are comparable with those obtained using DSO. This device can be used as an
alternative to DSO for dynamic defect detection by AE signals. A detailed description of
how the design evolution of the PSoC based system was made and how the design concept
was used for wireless AE sensor system development, are described in this chapter.
5.3 Description of PSoC family and i ts selection
The PSoC is a highly configurable system-on-chip architecture for embedded control and
design, manufactured by Cypress Semiconductor. It integrates the configurable digital and
analog circuits controlled by an on-chip microcontroller. System on chip (SoC) is a
technique where all the components of electronic circuitry can be designed in single IC, and

Chapter 5
101
because of this, whole electronic circuitry can be minimized and hence reducing the board
space, power consumption, and system cost while improving the quality of the system
development. Even noise immunity can be improved, which is one of the most important
aspects when dealing with acoustic emission. The PSoC has several blocks like Read-Only
Memory (ROM), Random Access Memory (RAM), Flash Memory, etc. It also encompasses
Ethernet Port, UART (Universal Asynchronous Receiver/Transmitter), SPI (Serial
Programming Interface), and USB (Universal Serial Bus). Hence, PSoC provides a perfect
platform to design an instrument based on the specific embedded design for acoustic
emission testing that needs to be in a single board. There are various members of the PSoC
family. A brief description of their types and specifications are given in Table 5.1.
Table 5.1 PSoC types and specifications
PSoC 1 PSoC 3 PSoC 5
8-bit Microcontroller and
optimized performance
8-bit 8051 core and
optimized performance
32-bit ARM Cortex-M3 processor core and
high performance
Flash memory of 4 kB to 32 kB,
The clock frequency of 24 MHz and 4 MIPS,
Static RAM of 256 bytes to 2kB and
Operating voltage 1.7 to 2.5V
Flash memory 8 kB to 64 kB,
The clock frequency of 67 MHz and 33 MIPS,
Static RAM of 3 kB to 8 kB and
Operating voltage 0.5 to 5.5V
Flash memory 32 kB to 256 kB,
The clock frequency of 67 MHz and 84 MIPS,
Static RAM of 16 kB to 64 kB and
Operating voltage 2.7 to 5.5V
6-14-bit one Delta-Sigma ADC, 131 kSPS @ 8-bit,
6-8-bit up to two DACs
8-20-bit one Delta-Sigma ADC, 192 kSPS @ 12-bit,
8-bit up to four DACs
8-20-bit, one Delta-Sigma ADC, 192 kSPS @ 12-bit,

Chapter 5
102
The number of bits and sampling frequency of the PSoC member (Table 5.1) are essential
features to be considered while selecting PSoC for the AE application. The dynamic range
can be improved by increasing the number of bit conversion of an ADC [157]. The useful
frequency ranges for acoustic emission generated from concrete based materials/structures
is 20 kHz to 100 kHz. In the case of Analog to digital conversion (ADC), in order to satisfy
the Nyquist criteria, the minimum sampling rate should be twice of the maximum frequency
present in the signals [147]. However, for true representation of the signals ten times
sampling frequency is widely used [158]. Based on these, a PSoC-5 based CY8CKIT-059
PSoC 5LP Prototyping kit has been selected for the development of DAQ. It has successive
approximation (SAR) ADC with a maximum sampling rate at a speed 1 MSPS with 12-bit
resolution, which makes it suitable for further correct representation of AE data. In addition,
the performance of PSoC 5LP architecture is enhanced through the following features [108]:
12-bit two SAR ADCs @1 MSPS,
8-bit up to four DACs
2 mA active current and 3 μA sleep current
Communication protocol: UART, I2C, FS USB 2.0, and SPI
2 mA active current 1 μA sleep current and 200 nA hibernate
Communication protocol: UART, I2C, FS USB 2.0, SPI, LIN and CAN
2 mA active current 2 μA sleep current and 300 nA hibernate
Communication protocol: UART, I2C, FS USB 2.0, SPI, LIN and CAN
Requires ICE Cube and Flex Pods
Programming interface: SWV, SWD, On-chip JTAG and Debug and Trace
Programming interface: SWV, SWD, On-chip JTAG and Debug and Trace
64 input/output port 72 input/output port 72 input/output port
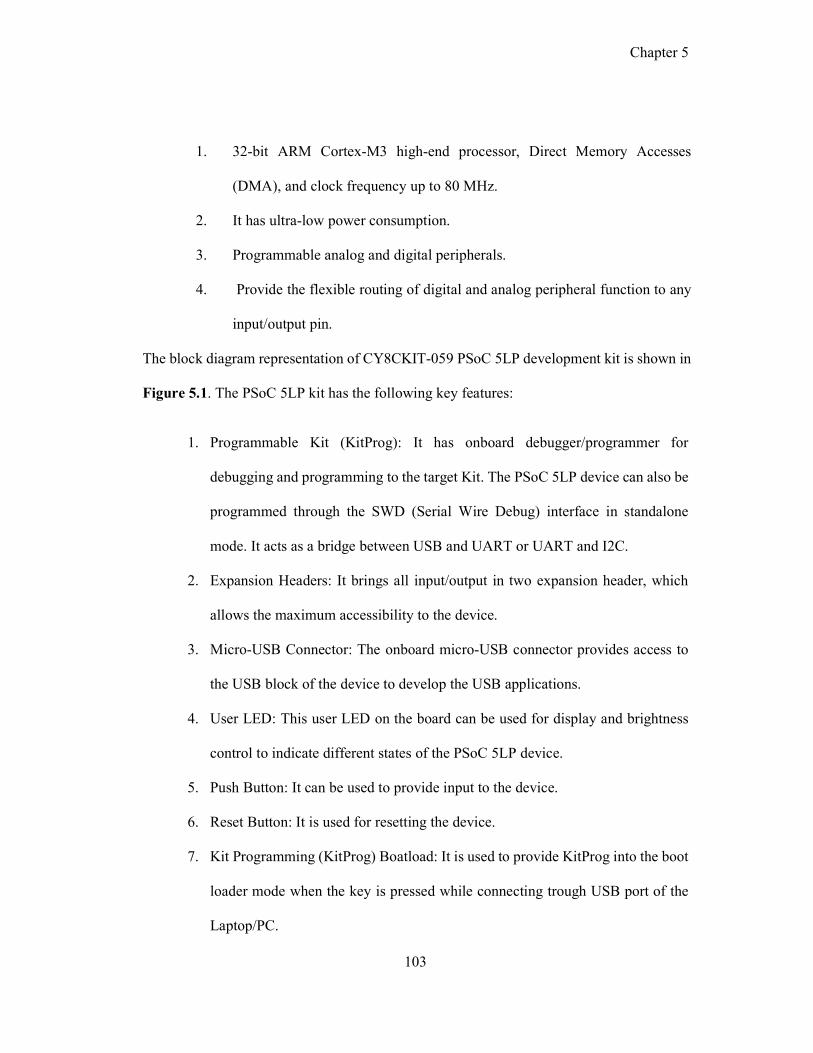
Chapter 5
103
1. 32-bit ARM Cortex-M3 high-end processor, Direct Memory Accesses
(DMA), and clock frequency up to 80 MHz.
2. It has ultra-low power consumption.
3. Programmable analog and digital peripherals.
4. Provide the flexible routing of digital and analog peripheral function to any
input/output pin.
The block diagram representation of CY8CKIT-059 PSoC 5LP development kit is shown in
Figure 5.1. The PSoC 5LP kit has the following key features:
1. Programmable Kit (KitProg): It has onboard debugger/programmer for
debugging and programming to the target Kit. The PSoC 5LP device can also be
programmed through the SWD (Serial Wire Debug) interface in standalone
mode. It acts as a bridge between USB and UART or UART and I2C.
2. Expansion Headers: It brings all input/output in two expansion header, which
allows the maximum accessibility to the device.
3. Micro-USB Connector: The onboard micro-USB connector provides access to
the USB block of the device to develop the USB applications.
4. User LED: This user LED on the board can be used for display and brightness
control to indicate different states of the PSoC 5LP device.
5. Push Button: It can be used to provide input to the device.
6. Reset Button: It is used for resetting the device.
7. Kit Programming (KitProg) Boatload: It is used to provide KitProg into the boot
loader mode when the key is pressed while connecting trough USB port of the
Laptop/PC.

Chapter 5
104
The application-specific system on chip can be designed in the PSoC creator, which
is provided by the manufacturer Cypress Semiconductor. PSoC Creator is a tool for
providing integrated design environment (IDE) towards concurrent hardware
configuration and software editing, debugging, and compiling of PSoC [108]. The
digital and analog components are represented by a symbol which an user can drag
and drop into his design, interconnect, and configure for PSoC applications.
Figure 5.1 Block diagram representation of PSoC 5LP kit [108].
The components used in mixed-signal Cypress catalogue is configured and dynamically
generate API (Peripheral Application Interface) libraries. Different components and their
peripherals used in the design are configured. Routing, firmware executing and debugging
can be performed in the PSoC Creator IDE. The PSoC creator code can be exported to third-
party IDEs like IAR Embedded Workbench, Eclipse, and ARM microcontroller based kit.
PSoC Creator is available freely in the window-based integrated development environment
(IDE) with no code size limitation. The PSoC creator includes the following features:

Chapter 5
105
1. Easy hardware design schematic capture and its wiring.
2. Readily available pre-verified components
It includes different communications library such as Bluetooth, I2C, SPI,
USB, CAN, UART, and LIN.
It provides graphical configuration to digital peripherals.
It supports different analog components like ADC, Filter, DAC, CMP, and
amplifier (AMP)
It generates dynamically API libraries
3. The compiler has no limitation in coding size.
4. The Integrated source editor performs inline diagnostics, code snippets and auto-
complete.
5. It has a built-in debugger
5.4 Data acquisit ion system
The architecture block diagram of the data acquisition system (DAS) for the acquisition of
AE signals is shown in Figure 5.2. The system consists of a signal generator device, DAQ,
and a personal computer (PC). The output signal from the signal generator device is
interfaced with the DAQ. The signal generator device is used in this investigation for
validating the design concept for DAQ. The PSoC based DAQ is designed to acquire the
AE data, and this has the capability to transmit the acquired signal through RS232 interface
of the board to an external computer for post-processing.
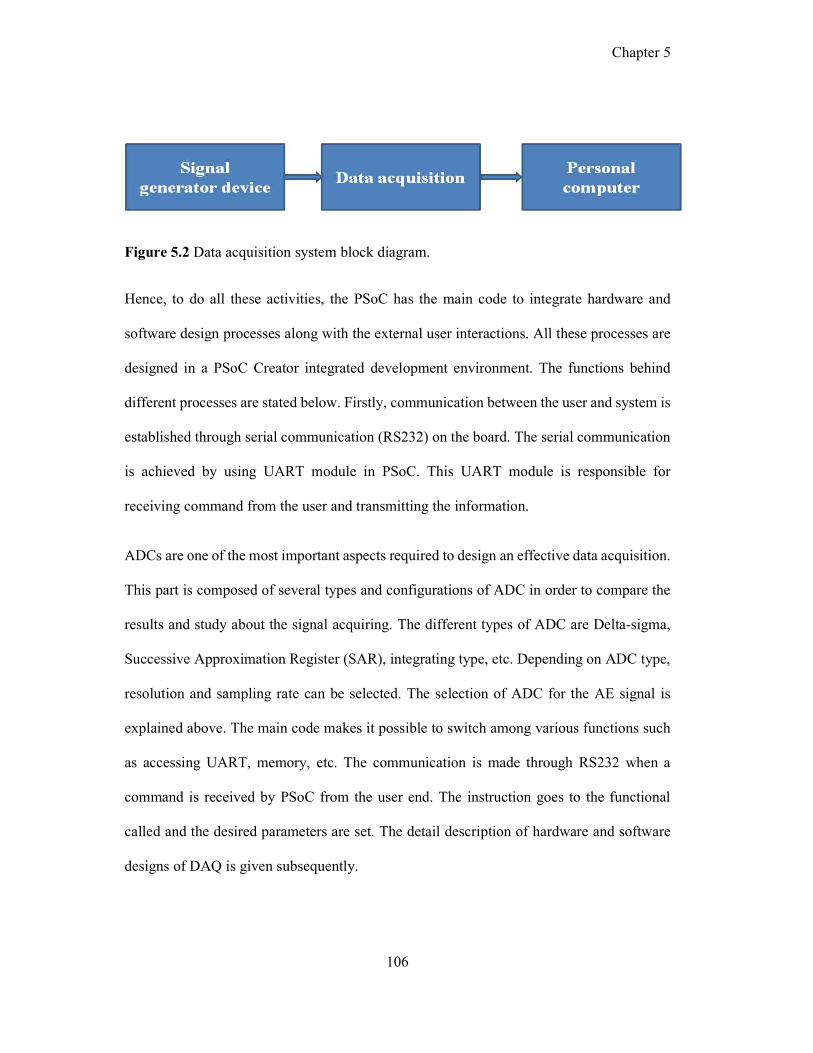
Chapter 5
106
Figure 5.2 Data acquisition system block diagram.
Hence, to do all these activities, the PSoC has the main code to integrate hardware and
software design processes along with the external user interactions. All these processes are
designed in a PSoC Creator integrated development environment. The functions behind
different processes are stated below. Firstly, communication between the user and system is
established through serial communication (RS232) on the board. The serial communication
is achieved by using UART module in PSoC. This UART module is responsible for
receiving command from the user and transmitting the information.
ADCs are one of the most important aspects required to design an effective data acquisition.
This part is composed of several types and configurations of ADC in order to compare the
results and study about the signal acquiring. The different types of ADC are Delta-sigma,
Successive Approximation Register (SAR), integrating type, etc. Depending on ADC type,
resolution and sampling rate can be selected. The selection of ADC for the AE signal is
explained above. The main code makes it possible to switch among various functions such
as accessing UART, memory, etc. The communication is made through RS232 when a
command is received by PSoC from the user end. The instruction goes to the functional
called and the desired parameters are set. The detail description of hardware and software
designs of DAQ is given subsequently.
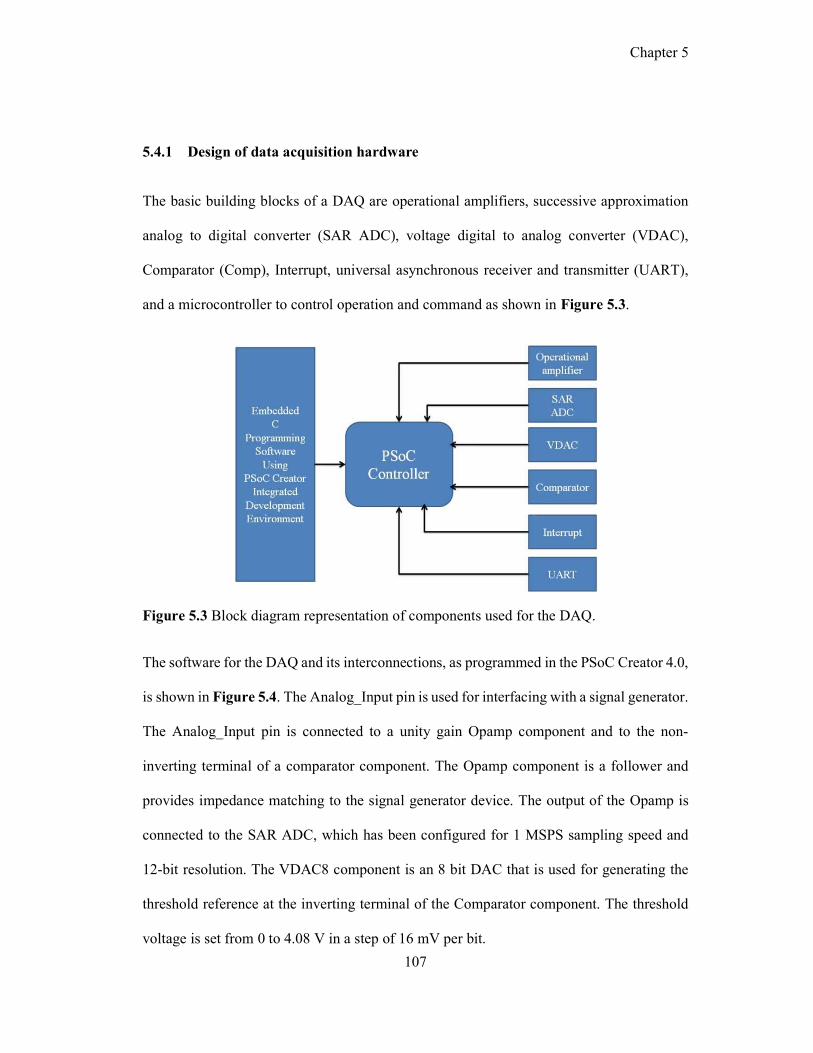
Chapter 5
107
5.4.1 Design of data acquisition hardware
The basic building blocks of a DAQ are operational amplifiers, successive approximation
analog to digital converter (SAR ADC), voltage digital to analog converter (VDAC),
Comparator (Comp), Interrupt, universal asynchronous receiver and transmitter (UART),
and a microcontroller to control operation and command as shown in Figure 5.3.
Figure 5.3 Block diagram representation of components used for the DAQ.
The software for the DAQ and its interconnections, as programmed in the PSoC Creator 4.0,
is shown in Figure 5.4. The Analog_Input pin is used for interfacing with a signal generator.
The Analog_Input pin is connected to a unity gain Opamp component and to the non-
inverting terminal of a comparator component. The Opamp component is a follower and
provides impedance matching to the signal generator device. The output of the Opamp is
connected to the SAR ADC, which has been configured for 1 MSPS sampling speed and
12-bit resolution. The VDAC8 component is an 8 bit DAC that is used for generating the
threshold reference at the inverting terminal of the Comparator component. The threshold
voltage is set from 0 to 4.08 V in a step of 16 mV per bit.

Chapter 5
108
Figure 5.4 Schematic design of the DAQ in PSoC creator 4.0 IDE.
It can be controlled either by hardware or software or a combination of both. The Comparator
component generates an output signal based on the comparison between the AE signal levels
and the threshold reference set at the comparator. The Interrupt component is connected to
the output of the comparator and is configured in the rising edge of the signal. The USB
UART interface is used to establish communication between DAQ and personal computer
for display, storage and analysis. The configuration of the UART for data transfer rate is
921600 bits per second with the following features such as full-duplex communication, 8-
bit of data length, parity type as none, stop bit like one and flow control as none. The
development of the embedded software code for enabling the hardware component and
signal processing algorithm for acquisition, processing, and transmission of the AE signal is
explained in the subsequent sections.
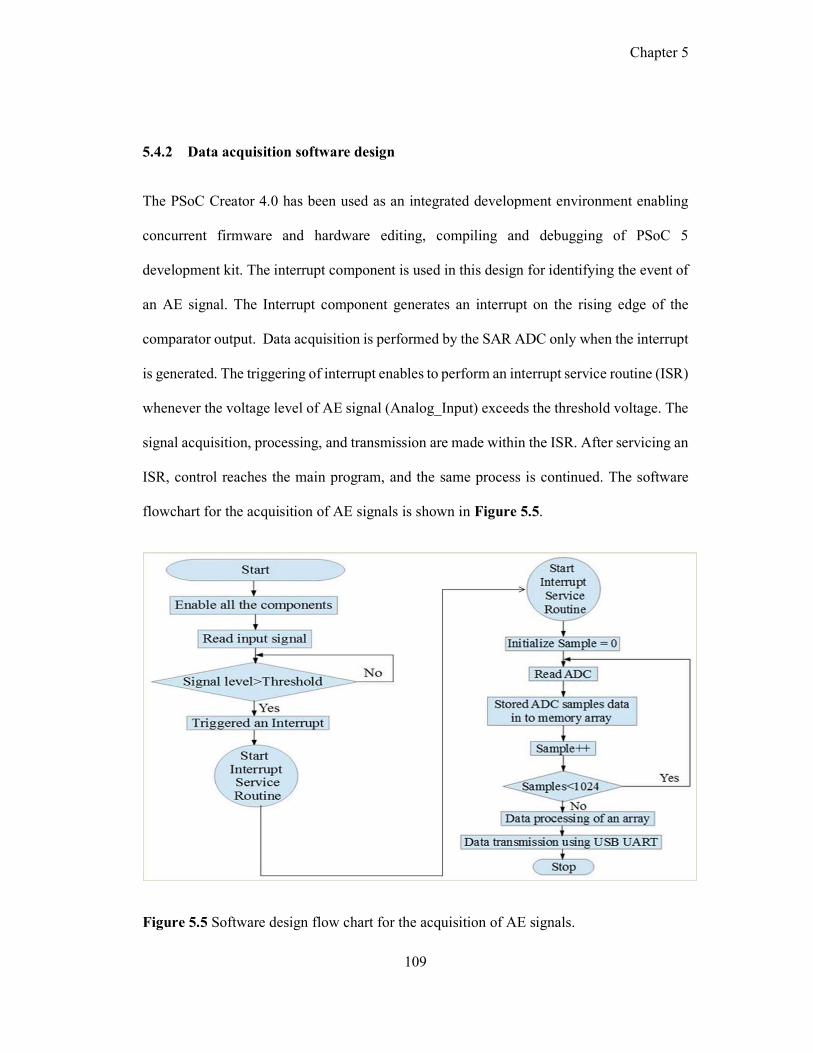
Chapter 5
109
5.4.2 Data acquisition software design
The PSoC Creator 4.0 has been used as an integrated development environment enabling
concurrent firmware and hardware editing, compiling and debugging of PSoC 5
development kit. The interrupt component is used in this design for identifying the event of
an AE signal. The Interrupt component generates an interrupt on the rising edge of the
comparator output. Data acquisition is performed by the SAR ADC only when the interrupt
is generated. The triggering of interrupt enables to perform an interrupt service routine (ISR)
whenever the voltage level of AE signal (Analog_Input) exceeds the threshold voltage. The
signal acquisition, processing, and transmission are made within the ISR. After servicing an
ISR, control reaches the main program, and the same process is continued. The software
flowchart for the acquisition of AE signals is shown in Figure 5.5.
Figure 5.5 Software design flow chart for the acquisition of AE signals.

Chapter 5
110
One thousand twenty-four samples of AE signal length with a duration of 1.03 milliseconds
is recorded with a sampling rate of 1 MSPS. These one thousand twenty-four samples are
processed and transmitted through USB UART. The embedded software has been
developed in C programming language for this purpose and is given in Appendix A. An
artificial burst type AE signal has been generated by a signal generator device in the
laboratory and acquired using the designed PSoC hardware to validate the design of the
DAQ.
5.5 Signal generator device
Similar to the analog-to-digital converter, a digital to analog converter (DAC) has also been
designed and developed using the PSoC hardware for testing and validating the DAQ. A
burst type AE signal with a frequency of 50 kHz has been generated using the DAC. One
thousand twenty-four samples are covered in a 1.023 millisecond decaying signal of
frequency 50 kHz. The signal is normalized with respect to 2.5-volt reference DC level.
Where the decay constant is 10000, and the duration between the samples is one
microsecond. The generated samples of signals are made compatible to read 8-bit digital to
analog converter and can be found in the software programming code in Appendix B. The
schematic hardware design of the DAC for the generation of AE burst using a PSoC Creator
4.0 is shown in Figure 5.6.
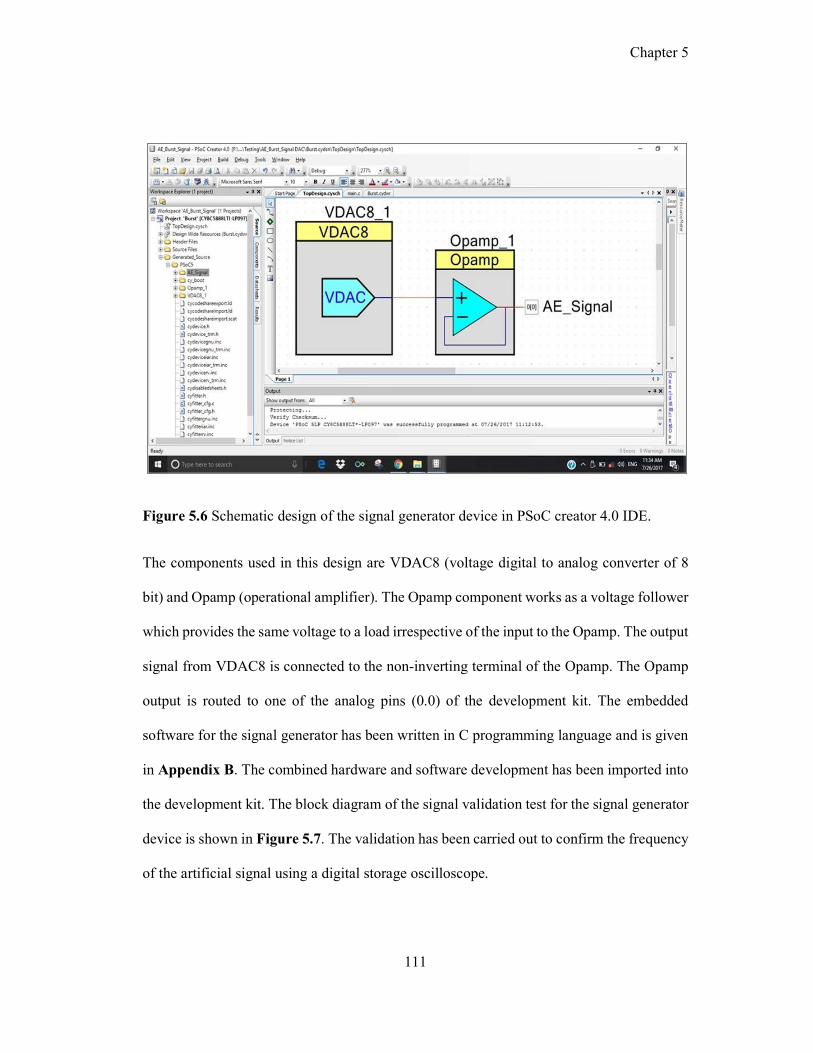
Chapter 5
111
Figure 5.6 Schematic design of the signal generator device in PSoC creator 4.0 IDE.
The components used in this design are VDAC8 (voltage digital to analog converter of 8
bit) and Opamp (operational amplifier). The Opamp component works as a voltage follower
which provides the same voltage to a load irrespective of the input to the Opamp. The output
signal from VDAC8 is connected to the non-inverting terminal of the Opamp. The Opamp
output is routed to one of the analog pins (0.0) of the development kit. The embedded
software for the signal generator has been written in C programming language and is given
in Appendix B. The combined hardware and software development has been imported into
the development kit. The block diagram of the signal validation test for the signal generator
device is shown in Figure 5.7. The validation has been carried out to confirm the frequency
of the artificial signal using a digital storage oscilloscope.
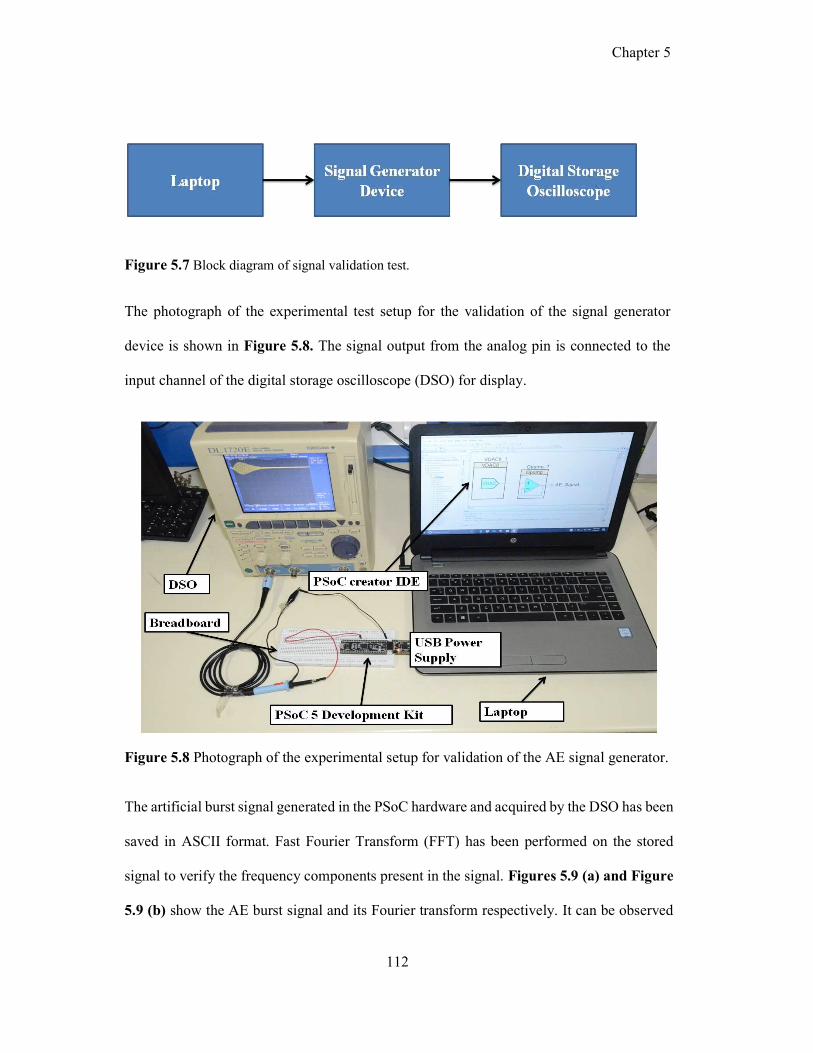
Chapter 5
112
Figure 5.7 Block diagram of signal validation test.
The photograph of the experimental test setup for the validation of the signal generator
device is shown in Figure 5.8. The signal output from the analog pin is connected to the
input channel of the digital storage oscilloscope (DSO) for display.
Figure 5.8 Photograph of the experimental setup for validation of the AE signal generator.
The artificial burst signal generated in the PSoC hardware and acquired by the DSO has been
saved in ASCII format. Fast Fourier Transform (FFT) has been performed on the stored
signal to verify the frequency components present in the signal. Figures 5.9 (a) and Figure
5.9 (b) show the AE burst signal and its Fourier transform respectively. It can be observed

Chapter 5
113
from Figure 5.9 (b) that only 50 kHz frequency component is present in the signal as
expected. This experiment validates the functioning of the signal generator. Further
experimental work to validate the DAQ for the acquisition of burst type AE signals is
explained in the subsequent section.
Figure 5.9 (a) Burst type AE signal generated and it's (b) FFT received from signal
generator device.
5.6 Communication interface
LabVIEW tool has been used with a laptop for the data display and saving the AE signals.
NI Visa serial communication interface has been established with USB UART COM port.
NI Visa is a software tool which is used for serial communication in the LabVIEW. USB

Chapter 5
114
UART is used to transfer and receive the serial data between two devices. The USB UART
follows an asynchronous serial protocol to ensure reliable data transfer. There are different
UART parameters that are used to communicate the DAQ with PC such as mode, bits per
second (Baud rate), data bits, type of parity, stop bit and flow control. The detail description
of the parameters is given below.
Mode of communication: There are different mode of communications in UART such as
half-duplex mode, transmit mode (TX), receiver mode, and full-duplex mode.
Bits per second (BPS): It is used for the data to Tx/Rx at a rate of bits per second called
baud-rate. There are different baud rate that can be configured with varying internal clock
frequency such as 1200, 2400, 4800, 19200, 38400, 57600, 115200, 230400, 460800 and
921600 bits per seconds.
Data bits: It is used for the number of data (5, 6, 7, or 8-bit) to be transmitted between the
start and stop of single UART transfer.
8-bit data is the default configuration for the data transfer.
Parity Type: The parity bit location (Even, Odd or None) is used with the data transfer.
Stop bit: This defines the number of stop bits (1 or 2 bits) and are used with the data transfer.
Flow Control: It allows to choose between hardware or None.
The UART configuration of DAQ and laptop should be the same to communicate between
them. The required setting for UART communication for both the devices is given in Table
5.2.
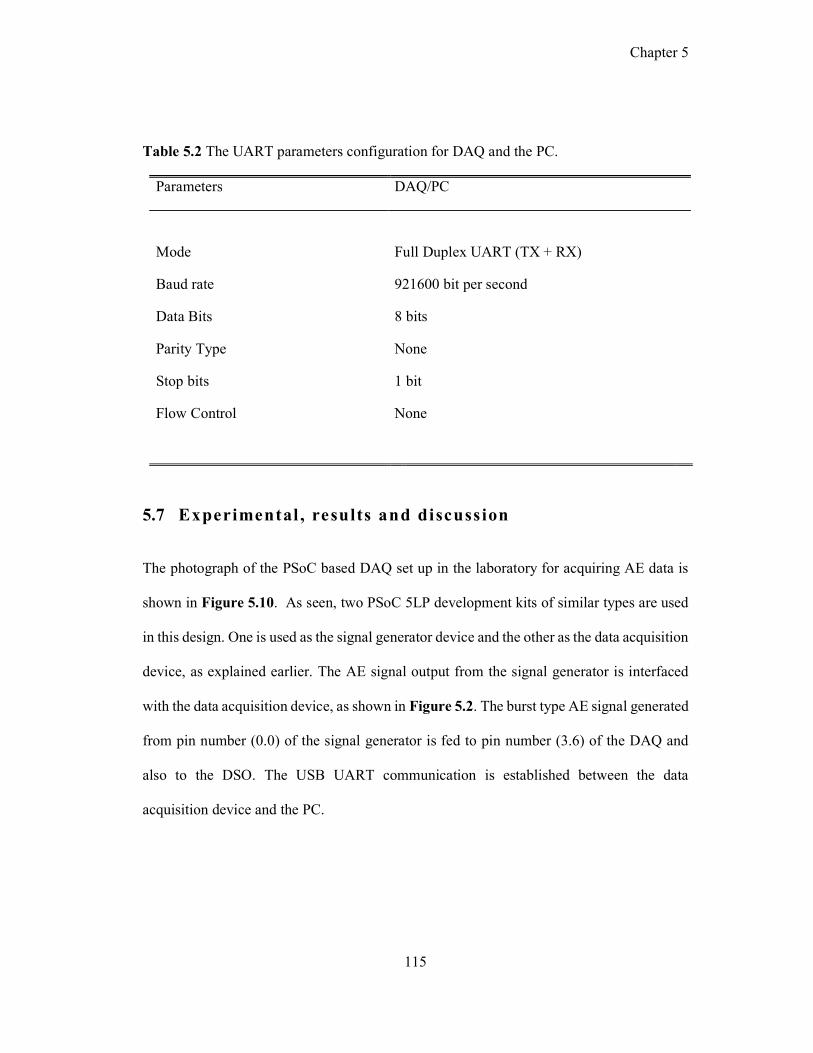
Chapter 5
115
Table 5.2 The UART parameters configuration for DAQ and the PC.
Parameters DAQ/PC
Mode
Full Duplex UART (TX + RX)
Baud rate 921600 bit per second
Data Bits 8 bits
Parity Type None
Stop bits 1 bit
Flow Control None
5.7 Experimental , results and discussion
The photograph of the PSoC based DAQ set up in the laboratory for acquiring AE data is
shown in Figure 5.10. As seen, two PSoC 5LP development kits of similar types are used
in this design. One is used as the signal generator device and the other as the data acquisition
device, as explained earlier. The AE signal output from the signal generator is interfaced
with the data acquisition device, as shown in Figure 5.2. The burst type AE signal generated
from pin number (0.0) of the signal generator is fed to pin number (3.6) of the DAQ and
also to the DSO. The USB UART communication is established between the data
acquisition device and the PC.

Chapter 5
116
Figure 5.10 Photograph of the experimental setup for the data acquisition system.
Once the signal voltage level crosses the threshold, the event of the AE signal is detected,
and one thousand twenty-four samples of the signal are acquired and transmitted using USB
UART communication. The duration between the samples is set to one microsecond. The
recorded AE signal length of 1.023 microseconds is displayed in the LabVIEW graphical
user interface, as shown in Figure 5.11.
Figure 5.11 Burst type AE signal received from DAQ displayed using LabVIEW.
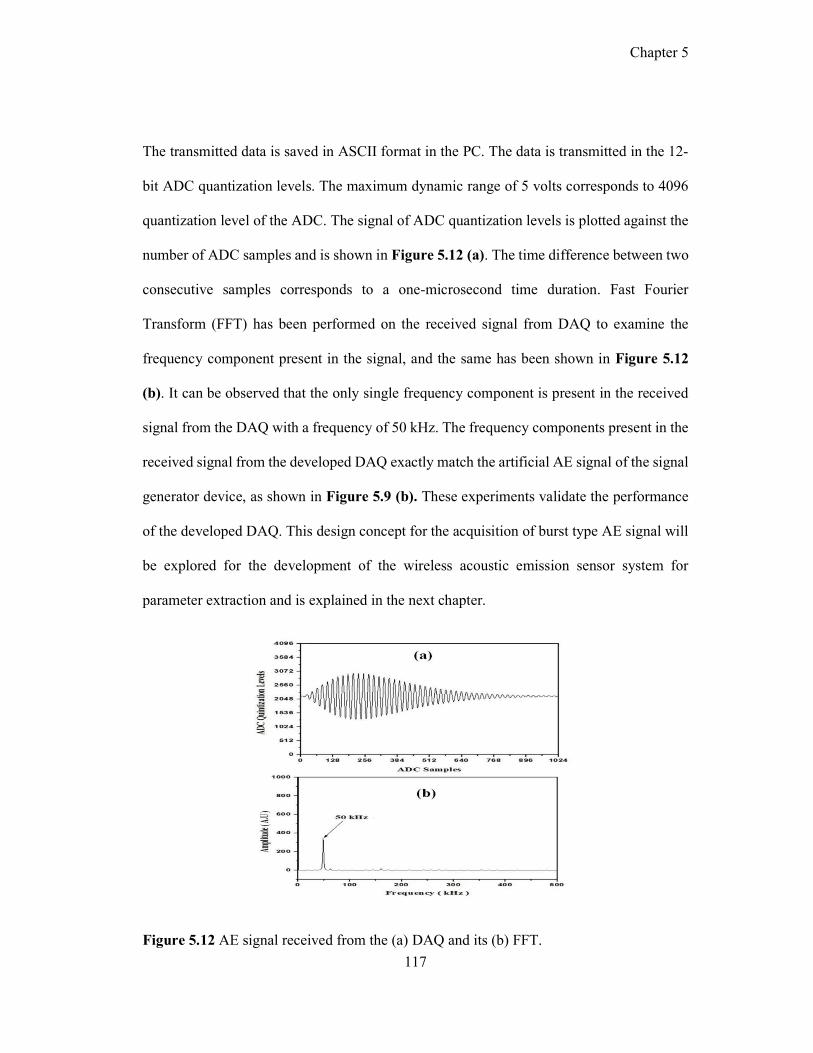
Chapter 5
117
The transmitted data is saved in ASCII format in the PC. The data is transmitted in the 12-
bit ADC quantization levels. The maximum dynamic range of 5 volts corresponds to 4096
quantization level of the ADC. The signal of ADC quantization levels is plotted against the
number of ADC samples and is shown in Figure 5.12 (a). The time difference between two
consecutive samples corresponds to a one-microsecond time duration. Fast Fourier
Transform (FFT) has been performed on the received signal from DAQ to examine the
frequency component present in the signal, and the same has been shown in Figure 5.12
(b). It can be observed that the only single frequency component is present in the received
signal from the DAQ with a frequency of 50 kHz. The frequency components present in the
received signal from the developed DAQ exactly match the artificial AE signal of the signal
generator device, as shown in Figure 5.9 (b). These experiments validate the performance
of the developed DAQ. This design concept for the acquisition of burst type AE signal will
be explored for the development of the wireless acoustic emission sensor system for
parameter extraction and is explained in the next chapter.
Figure 5.12 AE signal received from the (a) DAQ and its (b) FFT.
Chapter 5
118
5.8 Summary
A programmable system on chip based data acquisition device for dynamic detection of an
event of AE signal has been designed and developed. The performance of the developed
DAQ has been successfully demonstrated with the in-house developed signal generator
device for detecting dynamic AE events. The developed data acquisition is capable of
acquiring, storing and processing AE data up to a speed of 1 MSPS and provides 12-bit
resolution to the signal which is sufficient for the correct data interpretation of AE signals
in the frequency range 20 to 100 kHz. Validation of the DAQ has been carried out by the
signal generator device and DSO using FFT. The frequency components (50 kHz) present
in the received signal has been found to be in good agreement with the frequency
components (50 kHz) present in the signal generator device.

Chapter 6
119
6 Design development and validation of wireless AE sensor system
6.1 Preamble
This chapter provides the overall design concept and architecture of the wireless AE sensor
system. It deals with the deployment of a programmable system on chip (PSoC) based
wireless sensor system for efficiently extracting and wireless transmission of the parameters
of AE signals. It also presents the validation of the developed wireless sensor system by
applying the signal validation test along with two different applications, namely
compression test and corrosion detection test of concrete specimens in the laboratory.
6.2 Wireless sensing hardware design and architecture
Existing wired based AE systems have several drawbacks such as high installation time,
high power requirement, noise associated with cabling, and portability issue due to the large
size of the instrument, and restriction on remote monitoring. The wireless AE system
overcomes the constraint of the wired AE system. By considering all these aspects, the PSoC
based wireless AE sensor system has been designed and developed. Typical wireless AE
unit consists of a sensor, signal conditioning unit, computational core unit, base station and
wireless communication unit for transmission and reception of signals and commands, as
illustrated in the functional block diagram given in Figure 6.1. Commands are instructions
given by the base station to the sensor unit for control and handshaking. The important
design aspects of the wireless sensor unit for SHM applications are onboard processing

Chapter 6
120
capability of the computational core unit and battery power of the system. Accordingly, the
wireless sensor unit has been designed in such a way that it consumes minimum power to
extend its lifetime and uses minimum hardware, which makes the sensor unit compact and
cheap.
The wireless AE system includes a single wireless sensor unit communicating with a base
station. In this prototype implementation, the base station is a computer either desktop or
laptop, connected through a compatible wireless transceiver through a USB UART
communication port. The wireless AE sensor unit is responsible for the acquisition of AE
signal, processing various parameters associated with the signal, and finally transmitting the
processed information wirelessly to the base station for permanent storage and further data
analysis.
Figure 6.1 System architecture block diagram for the wireless AE sensor system.
Chapter 6
121
6.2.1 Redesign of the signal conditioning unit
The development of the wireless sensor unit involves the design of three functional units
viz., signal conditioning unit, computational core unit, and a wireless communication unit.
The design and developmental aspects of SCU have been discussed in Chapter 2. In order
to reduce the size and the power consumption, the SCU has been redesigned to
accommodate it in a single chip of AD8630ARUZ manufactured by M/s. Analog Devices.
This single chip SCU has a buffer, post-amplifier and filter. The integrated circuit chosen
for the SCU has four operational amplifiers, out of which the first one has been used as a
buffer, second one as a post-amplifier and the remaining two for active bandpass filter
circuit. The Sallen-Key configuration, one of the most widely used filter, has been adopted
for the design of bandpass filter. The Multisim design of the bandpass filter with 3 dB lower,
and upper cut-off frequencies of approximately 27 kHz and 90 kHz respectively, is shown
in Figure 6.2. The simulation results are used for the design of the bandpass filter. The
optimized circuit diagram of the SCU in a single IC based on the simulations is shown in
Figure 6.3.

Chapter 6
122
Figure 6.2 Multisim simulation result for the bandpass filter.
Figure 6.3 Optimized circuit diagram of SCU in a single IC.
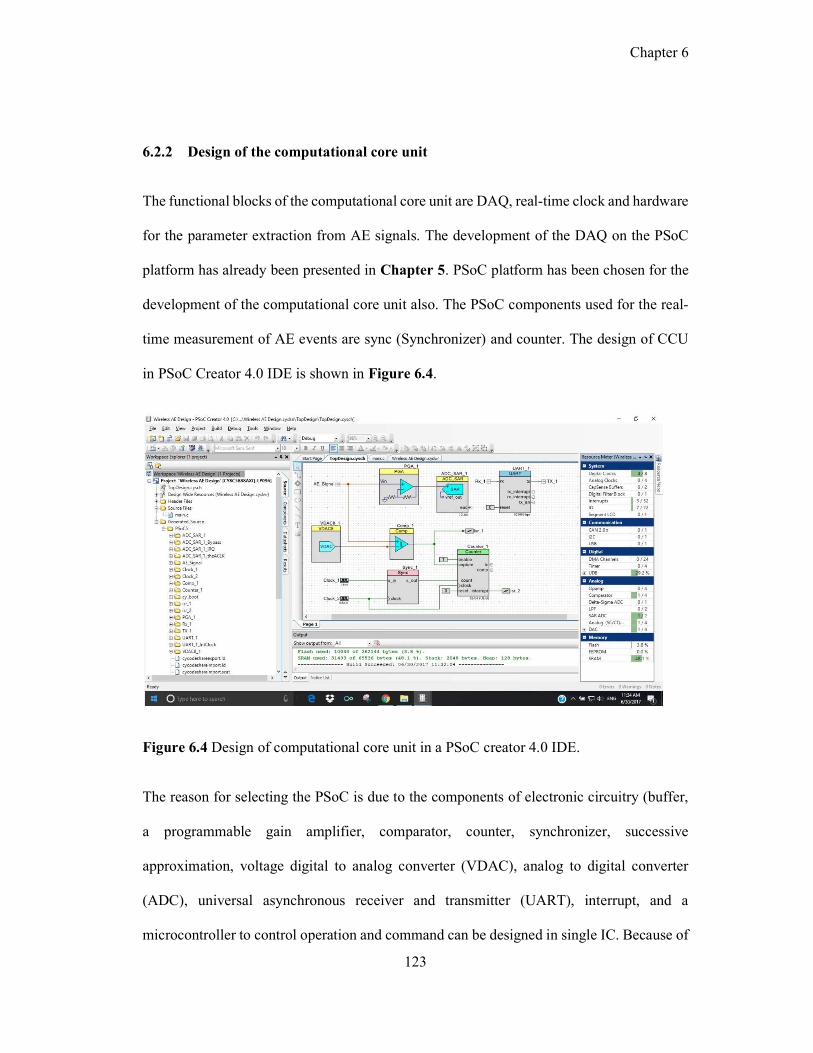
Chapter 6
123
6.2.2 Design of the computational core unit
The functional blocks of the computational core unit are DAQ, real-time clock and hardware
for the parameter extraction from AE signals. The development of the DAQ on the PSoC
platform has already been presented in Chapter 5. PSoC platform has been chosen for the
development of the computational core unit also. The PSoC components used for the real-
time measurement of AE events are sync (Synchronizer) and counter. The design of CCU
in PSoC Creator 4.0 IDE is shown in Figure 6.4.
Figure 6.4 Design of computational core unit in a PSoC creator 4.0 IDE.
The reason for selecting the PSoC is due to the components of electronic circuitry (buffer,
a programmable gain amplifier, comparator, counter, synchronizer, successive
approximation, voltage digital to analog converter (VDAC), analog to digital converter
(ADC), universal asynchronous receiver and transmitter (UART), interrupt, and a
microcontroller to control operation and command can be designed in single IC. Because of

Chapter 6
124
this, whole electronic circuitry can be minimized and hence reducing the board space, power
consumption, and system cost while improving the quality of the system development.
The AE_Signal output from the signal conditioning unit is internally connected to the
programmable gain amplifier (PGA) input pin of the CCU. The PGA output is connected to
the input pin of the SAR ADC. The detail configurations of the PGA, SAR ADC, VDAC8
and isr_1 component with their inter-connection have been explained for the design of DAQ
in the previous chapter. The comparator compares the AE_signal voltage level with the
preset threshold voltage reference (VREF) and yields the output signal based on this voltage
level comparison. The comparator output is connected to isr_1. The isr_1 component is used
for generating an interrupt on the rising edge of the comparator output. The 32-bit counter
component is implemented along with the sync component to synchronize the input clock
(Clock_1) with the source clock (Clock_2) to capture the real-time occurrence of an event
of the AE signal. The sync component resynchronizes the input signal to the rising edge of
the source clock. The CCU then extracts the parameters of AE signals such as ring down
count or AE count, rise time, event duration, peak amplitude and root mean square (RMS).
The hardware implementation of the feature extraction module has been presented in
Chapter 4. A wireless communication unit has been interfaced with the CCU for
transmission of AE parameters, the detail of which is dealt with in the subsequent sections.
The system includes one base station and one wireless AE sensor unit. The base station is
responsible for:
1) Commanding the wireless AE sensor unit to perform data collection,
2) Controlling the process,
3) Receiving data from the wireless AE sensor unit, and

Chapter 6
125
4) Storing the received data in a file.
A personal computer with a ZigBee wireless transceiver connection is used as the base
station. The software for the wireless AE sensor system is divided into two parts, i.e.,
embedded software for the wireless AE sensor unit and software for the base station. The
base station always initiates communication. The base station repeatedly sends commands
until an expected response is received from the sensor unit.
The basic requirement for software design is to configure the sensor unit for achieving the
required gain, threshold level and enable or disable data acquisition remotely. These
requirements are set at the base station. The second requirement is to acquire processed data
from the sensor unit and transmits the data to the base station. LabVIEW environment is
used for the data analysis, display and data storage at the base station. The implemented
embedded software can execute two tasks in parallel. The sensor unit can collect data from
the sensor whenever the signal voltage level crosses the threshold reference of the
comparator and can perform another operation simultaneously, i.e., wireless data transceiver
or execute a computational algorithm to interrogate the sensor data. Multitask
implementation is made a success by interrupt service routine (ISR) offered by the
microcontroller. The interrupt function is a powerful feature that allows the software to
momentarily pause and execute a certain task. This includes the processing of data and
transmitting wirelessly when it is scheduled time to sample data from the sensor unit. The
paused task resumes immediately after servicing. The above description of software
development is implemented in the PSoC Creator integrated development environment
(IDE). The software is written in the embedded C programming language. The details of
embedded C programming code are included in Appendix C.
Chapter 6
126
6.2.3 Wireless communication unit
A significant achievement is made when the raw data is processed locally, and only the
results are transmitted. The transmission of only processed results leads to a decrease in data
size to be communicated. Hence, a reduction in the decrease in data size after processing is
relatively more power-efficient compared to the transfer of raw data to the base station.
Currently, many types of wireless technologies are available for transmitting data. The most
predominant wireless technologies are Bluetooth, Zigbee, mobile communication and Wi-
Fi. The data transfer rate of Wi-Fi communication is high, but it requires high power for
long term SHM. The data transfer rate of Bluetooth communication is relatively high, but
the range of data transmission is less (approx. 10 meters). Mobile data communication
covers long-distance communication, but the service fees increase the cost for large scale
monitoring of structural applications.
Zigbee shows many advantages compared to other wireless communications with respect to
high network capacity, self-organization capability, low cost, and low power consumption.
Due to this, ZigBee is the most predominantly used communication mode in a sensor
network for monitoring of large-scale structural applications.
Robust data communication between the wireless AE sensor unit and the base station is
essential for monitoring any structure. The estimated communication range for the civil
structure may perhaps be several hundred meters. Generally, high power is associated with
the long-range communication of wireless transceiver. Hence, it is required to keep a
balance between low power consumption and long-range communication for monitoring of
structures. However, the communication range can be extended by the use of a repeater.

Chapter 6
127
The features of the ZigBee wireless transceiver are shown in Table 6.1. The communication
range of 100 m outdoor (LOS) and 30 m indoor for ZigBee wireless transceiver is sufficient
for most of the small civil structures and for laboratory works. ZigBee wireless transceiver
consumes much less power in sleep mode. The maximum transfer rate of the ZigBee
wireless transceiver is 921600 bps. The ZigBee wireless transceiver is an interface to the
base station for continuous data communication in real-time. ZigBee wireless transceiver
has different modes of communication between AE sensor unit and base station like point-
to-point, point to multipoint and peer to peer, for local data analysis.
Table 6.1 Key characteristics of the ZigBee wireless transceiver.
Parameters Specifications
Indoor/Urban Range
up to 30 m (100 ft)
Outdoor RF line-of-sight Range up to 100 m (300 ft)
Serial Interface Data Rate (software selectable)
1200 - 921600 bps
Supply Voltage 2.8 – 3.4 Volt
Transmit Current (typical) 45mA @ 3.3 Volt
Operating Frequency ISM 2.4 GHz Network Topologies Point-to-Point, Point-to-Multipoint &
Peer-to-Peer
6.3 Assembled prototype wireless sensor unit
Based on the hardware design architecture, the wireless AE-SS has been developed in the
laboratory. The components used for the wireless sensor unit are fabricated on a single two-
layer printed circuit board (PCB). The photograph of the complete PCB with all the essential
integrated circuits (ICs) is shown in Figure 6.5. The dimension of the two-layer PCB is 85

Chapter 6
128
x 56 mm and can be further reduced by using multilayer PCB manufacturing techniques. To
protect the wireless AE sensor unit and batteries from harsh weather condition, it is stored
within a weather-proof polypropylene enclosure with an IP65 (ingress protection) rating of
dimension 110x80x60 mm.
Figure 6.5 Front and rare views of integrated prototype wireless AE sensor unit.
In order to calculate the power consumption of the wireless AE sensor unit, the power rating
specifications have been studied. All the design hardware components are internally
referenced at 5V except the wireless transceiver, which needs 3.3V. The wireless sensor
unit can collect, process, and transmit the AE data when it is active. In contrast, the wireless
sensor unit can be kept in a sleep mode from which it can be easily awakened. In the sleep
mode, the wireless unit consumes very low electrical current. The current consumption in
slip mode is called standby current. The maximum and standby currents consumed by the
elements are given in Table 6.2.

Chapter 6
129
Table 6.2 Approximate current consumption of different components.
Components Maximum Active current
Standby current
AD8630ARUZ (IC)
1.0 mA
100 pA
PSOC-5LP (CY8C5888AXQ-LP096) 2.0 mA 2.0 µA
ZigBee transceiver
45.0 mA 20.0 µA
Total
48.0 mA
22.0 µA
In the current prototype, 10000 mAh Lithium-ion rechargeable power bank has been used.
The total active current consumption of the developed wireless AE sensor unit with the
wireless transceiver in operation is measured by USB type voltage and current meter in the
laboratory, are found to be 5.09 Volt and 50 mA respectively, as shown in Figure 6.6.
Figure 6.6 Voltage and current are measured by USB meter.
Chapter 6
130
The estimated lifetime of the wireless sensor unit for continuous monitoring is expected to
be:
𝐴𝑐𝑡𝑖𝑣𝑒 𝑡𝑖𝑚𝑒 =𝐸𝑛𝑒𝑟𝑔𝑦 𝑐𝑎𝑝𝑎𝑐𝑖𝑡𝑦
𝑐𝑢𝑟𝑟𝑒𝑛𝑡 𝑐𝑜𝑛𝑠𝑢𝑚𝑝𝑡𝑖𝑜𝑛=
10000 𝑚𝐴ℎ
50 𝑚𝐴
= 200 ℎ = 8.33 𝑑𝑎𝑦𝑠
This expected active life is conservative because it assumes continuous operation of the unit
at all times.
6.4 Performance validation of the wireless sensor unit
Three different types of tests have been performed for validation of the developed prototype
wireless AE-SS. These are the signal validation test, concrete compression test and concrete
corrosion test. The experimental results of the tests are presented in subsequent sections.
6.4.1 Signal validation using artificial AE signal
An artificial burst type AE signal of 50 kHz has been generated using a signal generator
device, as explained in Chapter 5. This signal generator device has been used for validating
the developed prototype wireless system. The block diagram representation of the
experimental setup for signal validation test using artificial AE events is shown in Figure
6.7. The actual photograph of the experimental setup is shown in Figure 6.8. AE_Signal is
the output of the signal generator device interfaced with the developed wireless sensor unit
and also to digital storage oscilloscope (DSO). The DSO has been used for recording the

Chapter 6
131
event of an AE signal crossing the defined threshold and for saving as ASCII format. The
event of the AE signal is also acquired and transmitted by the wireless sensor unit to the
base station. The transmitted event of AE data is stored and displayed at the base station, as
shown in Figure 6.8.
Figure 6.7 Block diagram representation of test setup for signal validation test.
Figure 6.8 Photograph of the test setup made in the laboratory for validation of wireless AE
sensor system.
The recorded AE signals at the transmitted and received sides were subjected to FFT to
check for any loss of information. Figure 6.9 shows the frequency spectra of the AE signals
at the received sides. As can be seen, only 50 kHz frequency component is present in the

Chapter 6
132
received signal, which matches the frequency of artificial burst type AE signals (Figure
5.9b). Moreover, the frequency spectra of both the signals exactly match with each other,
indicating that there is no loss of information during the wireless transmission.
Figure 6.9 FFT of the signal received from the wireless sensor system.
6.4.2 Signal validation using pencil lead break
A setup has been made in the laboratory to validate the AE signal acquired by the wireless
AE sensor unit and is shown in Figure 6.10. The validation has been done by comparing
the signals acquired by the developed wireless AE sensor system with that obtained by a
commercially available AE system (PAC). The entire setup is divided into two parts: (a)
Test setup for the developed wireless AE system which consists of AE sensor unit, PK6I
PZT sensor, power bank, V & I meter and Base station; and (b) Test setup for commercially
available Physical Acoustic Corporation (PAC) system. This consists of DISP AE
workstation, R6α PZT sensor, pre-amplifier and power supply.

Chapter 6
133
Figure 6.10 Photograph of the experimental setup of the wired based PAC system along
with the wireless AE sensor system in the Lab.
The signal validation has been carried out by the pencil lead break (PLB) test. The PLB
signal is considered to generate an AE event akin to that generated by the growth of a crack.
The sensors for both the systems are mounted on the top surface of a concrete block
separated by 40 cm. The pencil lead break tests were carried out at a location midway
between the two sensors. The event of an AE signal is detected when the signal level crosses
the defined threshold reference. In an AE signal, the threshold voltage is set and used for
discrimination of the signal from the background noise. When an event is detected a
thousand samples of AE data is recorded with a sampling rate of 1 MSPS (one-microsecond
duration between samples) which means the duration of one millisecond data are recorded
by both the systems. The frequency spectrum has been performed to the pencil lead break
test signals. FFT is used to characterize the frequency content present in the time domain
signal. One typical signal acquired by both the sensors and its FFT is shown in Figure 6.11.
The signals received by both the sensors are almost similar in nature. The resonant

Chapter 6
134
frequency from the wireless AE system and PAC system is found to be 55.68 kHz and 46
kHz respectively, which varies within the operating range of frequency and around the
sensor resonant frequency. The developed wireless AE system has been further validated by
conducting a compression test and corrosion test on the concrete specimen.
Figure 6.11 Pencil lead break test signal and it’s FFT from (a) wireless AE system and (b)
wired PAC system.
6.4.3 Application of the wireless AE sensor system to concrete compression test
The compression test is widely used to estimate the compressive strength of concrete. The
compressive strength provides many characteristics of concrete, such as cement strength,

Chapter 6
135
water-cement ratio, quality control, and quality of concrete material during the production.
Table 6.3 gives detail descriptions of concrete specimens used for the compression tests.
Two different grades of concrete (M30 & M45) and two different geometries of the
specimen (cube & cylinder) were used. All the concrete specimens were cured for 28 days
and then subjected to compression tests. AE signals generated during the compression test
provide a wide range of information concerning the quality of the concrete. The tests were
conducted according to the standard procedure in IS: 516-1959 with a constant loading rate
of 5.2 kN/s.
Table 6.3 Details of specimens used for compression tests
Serial No. Concrete grade Specimen shape Specimen dimension
1 M30 Cube 100x100x100 mm3
2 M30 Cylinder 200 mm Height and 60 mm in Diameter
3 M30 Cylinder 300 mm Height and 60 mm in Diameter
4 M45 Cube 100x100x100 mm3
5 M45 Cube 150x150x150 mm3
6 M45 Cylinder 200 mm Height and 60 mm in Diameter
The photograph of the experimental setup for concrete compression and AE testing is shown
in Figure 6.12. The entire setup is divided into two parts: (a) Test setup for the developed
wireless AE system which consists of AE sensor unit, PK6I PZT sensor, power bank, V &
I meter and Base station; and (b) Test setup for the commercially available Physical
Acoustics Corporation (PAC, USA) system.

Chapter 6
136
The test set up for the commercially available AE system consists of DISP AE workstation,
R6α PZT sensor, pre-amplifier and power supply. DiSP-16 is a 16 channel wired system
with dynamic range >82 dB and has a variable sampling rate from 1 MSPS to 10 MSPS.
The system has an ADC resolution of 16 bit. The developed wireless system has a sampling
rate of 1 MSPS and ADC resolution of 12 bit. Two PZT AE sensors (PK6I and R6α) both
having a resonant frequency at 55 kHz were fixed firmly at the opposite faces of the concrete
specimens. Silicon grease was used as couplant. The specification of the sensor PK6I has
already been given in Table 3.2. The specifications of the sensor R6α used with the
commercial wired PAC, USA system is given in Table 6.4.
Figure 6.12 Photograph of an experimental setup for the compression test of concrete
specimen.

Chapter 6
137
Table 6.4 Specifications of the sensor used with the wired PAC, USA system
Specifications Sensor (R6α) *
Type
External
Operating Frequency Range 35-100 kHz
Resonant Frequency ~55 kHz
Input Voltage 28 Volt@ 30mA
Pre-amplifier Gain 40 dB
*Sensor (R6α) is used with the wired PAC, USA system
The overall gain of the PAC system and the developed system were 40 dB and 38 dB,
respectively. Prior to the compression test, the PLB test has been carried out to simulate AE
events for calibration purpose. After calibration, the threshold of 55 dB and 50 dB has been
fixed for the wireless and wired system, respectively. During the compression test, the
applied load as a function of time has been recorded. The parameters of the AE signals
generated during the compression tests after crossing the threshold were recorded by the
developed wireless AE sensor system as well as by the commercially available wired PAC
system. The signals were recorded at the speed of 1MSPS by both the systems. The
computed AE signal parameters have been continuously transmitted through the wireless
system and captured and plotted using the LabVIEW program. Similarly, AE parameters
from different tests are also obtained using the commercial system. The results from one of
the tests (M30 grade concrete cube of dimension 100x100x100 mm3) are shown here.
Figure 6.13 shows the variations of counts and applied load as a function of time from (a)
developed wireless AE system and (b) wired PAC system. Similar plots for other AE
parameters such as cumulative counts, RMS, peak amplitude, rise time and event durations

Chapter 6
138
along with the load as a function of time from the wireless and wired PAC systems, are
shown in Figure 6.14 - 6.18.
The variations of the parameters of AE signals with time, obtained from the developed
wireless system are found to be a good agreement with the parameters obtained from the
commercially available system. The result of cumulative counts shows a strong
representation of the AE activity during the test. Three different AE activity regions can be
observed from the plots, as highlighted in Figure 6.14. In region I, many AE signals or
activity are generated due to the closure of pre-existing cracks and formation of microcracks
through weak boundaries of particles within the concrete specimen. In the second region,
there is a continuous increase in AE counts because of the steady growth of the cracks. AE
counts generated in this region are related to multiple crack branching, fracture of large
pores, and aggregate to cement interface cracking. In region III, a drastic increase in AE
counts is observed when the load increases to the ultimate strength of the concrete specimen
where unstable cracking occurs. These three regions of activity are also seen in other AE
parameters. The difference in AE activity in the two systems is due to different
characteristics of the instrument, and different gain and threshold of the sensor systems. The
results of AE activity observed in different regions are in agreement with the results reported
in the literature [83].
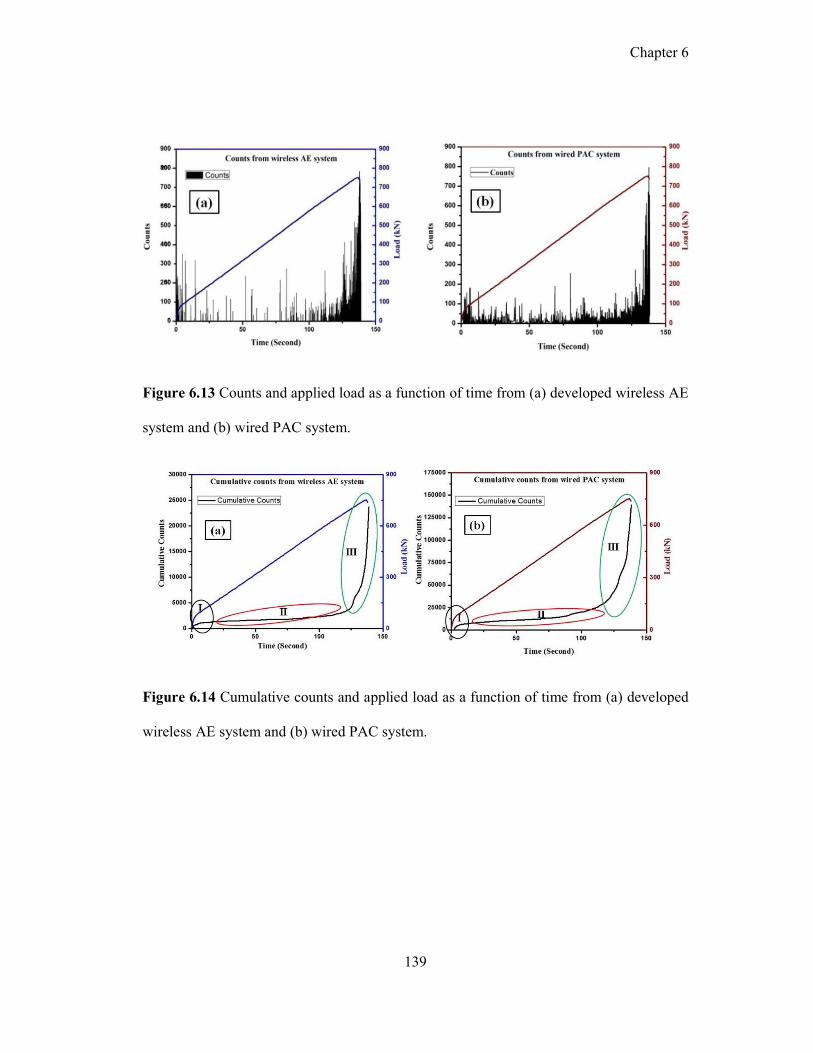
Chapter 6
139
Figure 6.13 Counts and applied load as a function of time from (a) developed wireless AE
system and (b) wired PAC system.
Figure 6.14 Cumulative counts and applied load as a function of time from (a) developed
wireless AE system and (b) wired PAC system.

Chapter 6
140
Figure 6.15 RMS and applied load as a function of time from (a) developed wireless AE
system and (b) wired PAC system.
Figure 6.16 Peak amplitude and applied load as a function of time from (a) developed
wireless AE system and (b) wired PAC system.
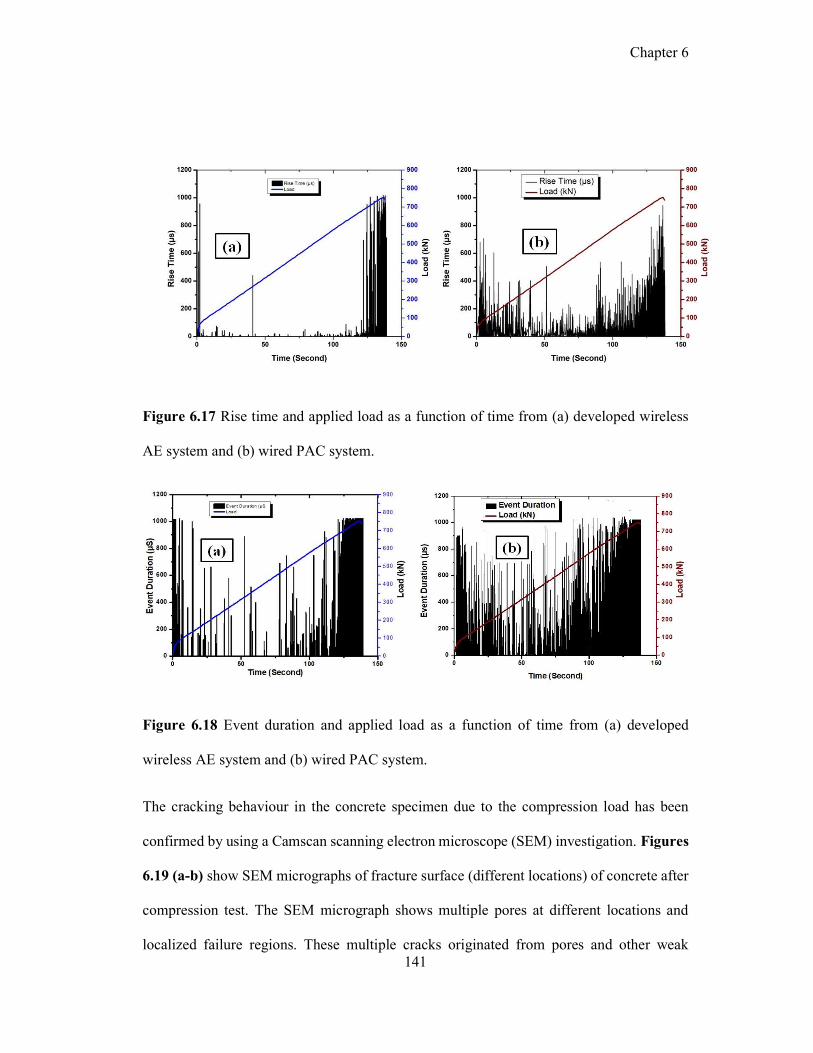
Chapter 6
141
Figure 6.17 Rise time and applied load as a function of time from (a) developed wireless
AE system and (b) wired PAC system.
Figure 6.18 Event duration and applied load as a function of time from (a) developed
wireless AE system and (b) wired PAC system.
The cracking behaviour in the concrete specimen due to the compression load has been
confirmed by using a Camscan scanning electron microscope (SEM) investigation. Figures
6.19 (a-b) show SEM micrographs of fracture surface (different locations) of concrete after
compression test. The SEM micrograph shows multiple pores at different locations and
localized failure regions. These multiple cracks originated from pores and other weak

Chapter 6
142
boundaries and propagated into many directions after the compression test, as shown by the
arrows in Figure 6. 19.
Figure 6.19 SEM images of the fracture surface of a concrete specimen.
6.4.4 Application of the wireless AE sensor system to concrete corrosion test
Rebar corrosion is one of the critical deterioration modes of reinforced concrete structures
due to exposure to the saline environment. Acoustic emission monitoring of rebar corrosion
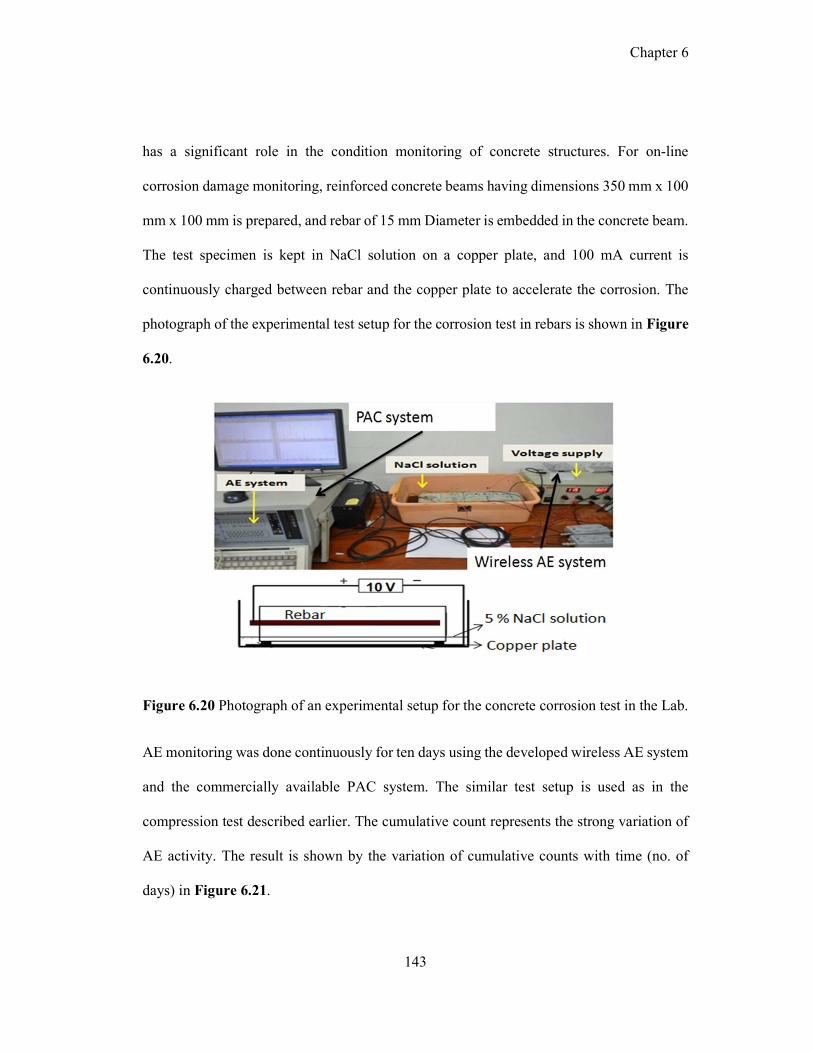
Chapter 6
143
has a significant role in the condition monitoring of concrete structures. For on-line
corrosion damage monitoring, reinforced concrete beams having dimensions 350 mm x 100
mm x 100 mm is prepared, and rebar of 15 mm Diameter is embedded in the concrete beam.
The test specimen is kept in NaCl solution on a copper plate, and 100 mA current is
continuously charged between rebar and the copper plate to accelerate the corrosion. The
photograph of the experimental test setup for the corrosion test in rebars is shown in Figure
6.20.
Figure 6.20 Photograph of an experimental setup for the concrete corrosion test in the Lab.
AE monitoring was done continuously for ten days using the developed wireless AE system
and the commercially available PAC system. The similar test setup is used as in the
compression test described earlier. The cumulative count represents the strong variation of
AE activity. The result is shown by the variation of cumulative counts with time (no. of
days) in Figure 6.21.
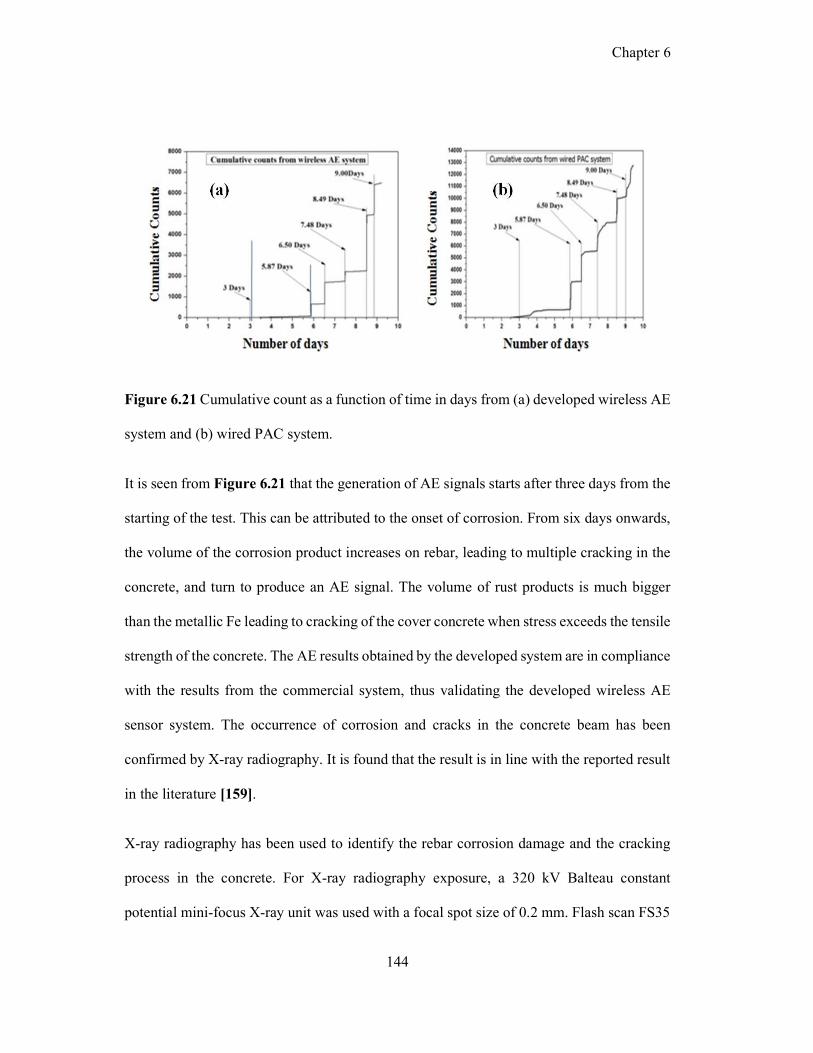
Chapter 6
144
Figure 6.21 Cumulative count as a function of time in days from (a) developed wireless AE
system and (b) wired PAC system.
It is seen from Figure 6.21 that the generation of AE signals starts after three days from the
starting of the test. This can be attributed to the onset of corrosion. From six days onwards,
the volume of the corrosion product increases on rebar, leading to multiple cracking in the
concrete, and turn to produce an AE signal. The volume of rust products is much bigger
than the metallic Fe leading to cracking of the cover concrete when stress exceeds the tensile
strength of the concrete. The AE results obtained by the developed system are in compliance
with the results from the commercial system, thus validating the developed wireless AE
sensor system. The occurrence of corrosion and cracks in the concrete beam has been
confirmed by X-ray radiography. It is found that the result is in line with the reported result
in the literature [159].
X-ray radiography has been used to identify the rebar corrosion damage and the cracking
process in the concrete. For X-ray radiography exposure, a 320 kV Balteau constant
potential mini-focus X-ray unit was used with a focal spot size of 0.2 mm. Flash scan FS35
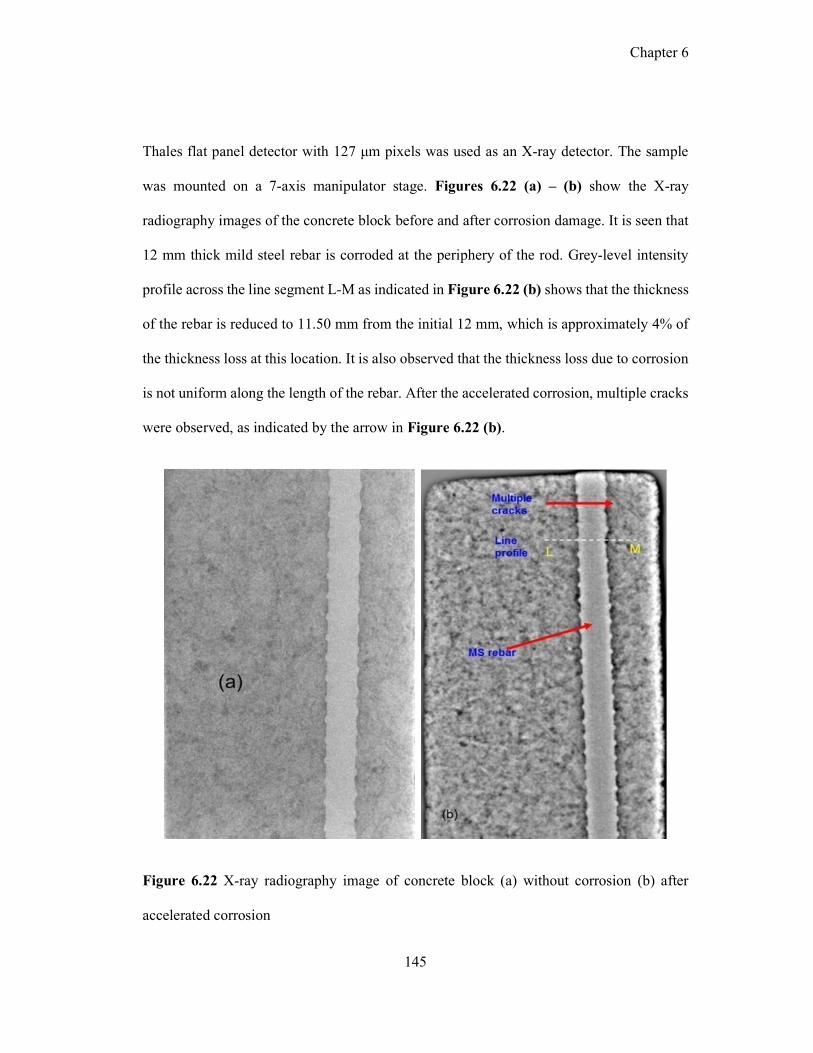
Chapter 6
145
Thales flat panel detector with 127 μm pixels was used as an X-ray detector. The sample
was mounted on a 7-axis manipulator stage. Figures 6.22 (a) – (b) show the X-ray
radiography images of the concrete block before and after corrosion damage. It is seen that
12 mm thick mild steel rebar is corroded at the periphery of the rod. Grey-level intensity
profile across the line segment L-M as indicated in Figure 6.22 (b) shows that the thickness
of the rebar is reduced to 11.50 mm from the initial 12 mm, which is approximately 4% of
the thickness loss at this location. It is also observed that the thickness loss due to corrosion
is not uniform along the length of the rebar. After the accelerated corrosion, multiple cracks
were observed, as indicated by the arrow in Figure 6.22 (b).
Figure 6.22 X-ray radiography image of concrete block (a) without corrosion (b) after
accelerated corrosion
Chapter 6
146
It can be concluded that the developed wireless system is able to detect the AE activity as
shown by the characteristic curves from the compression test and corrosion test and are in
compliance with the detected activity by the commercially available wired PAC system.
The results of compression and corrosion tests have been verified with the SEM and X-ray
radiography methods. Moreover, the developed system is the first of its kind, which has
been designed and implemented on PSoC technology. The developed system can be
effectively deployed for structural health monitoring of various critical concrete structures
like nuclear power plant (NPP) containment, bridges, and tanks along with corrosion
monitoring of rebar concrete structures in the petrochemical industry, where corrosion is a
potential issue.
6.5 Summary
A real-time wireless AE-SS for structural health monitoring applications of concrete has
been developed, and various design and developmental aspects have been discussed. The
acquisition of burst type AE signals and extraction of various parameters of the signals is
successfully implemented in real-time based on a programmable system on chip (PSoC).
The wireless AE system developed has been validated by three different methods viz. signal
validation using artificial AE signal along with pencil lead break test, concrete compression
test and concrete corrosion test in the laboratory.
The developed wireless AE system has been successfully used for monitoring the
compression test of concrete specimens. Three different regions of AE activity have been
identified. The obtained results from the compression test by the developed system are in
compliance with the results obtained by a commercially available system. The results of AE

Chapter 6
147
activity obtained by the developed system during the concrete corrosion test also match the
activity obtained by the commercially available system. The results of compression and
corrosion tests of concrete have been verified with the SEM and X-ray radiography methods.

Chapter 6
148

Chapter 7
149
7 Conclusion, contribution and scope for future work
7.1 Conclusion
The objective of the thesis is the development of a wireless acoustic emission sensor system
(AE-SS) for structural health monitoring applications. A combination of hardware and software
design approaches has been implemented in a programmable system on chip (PSoC) towards
achieving the objective. There are different sub-modules in the design, such as signal
conditioning unit (SCU), data acquisition (DAQ) device and computational core unit (CCU),
for realizing a complete wireless AE sensor system.
The signal conditioning unit is developed and successfully validated by detecting artificial AE
events through the piezoelectric sensor. The developed SCU is suitable for integration in the
wireless sensor system and further processing of the signals. Fast Fourier Transform is used to
assess the frequency characteristics of the AE signal conditioned by the SCU. The developed
SCU has also been validated by comparing the signal with a commercially available AE
system.
There are different parameters of burst type AE signals such as peak amplitude, RMS, counts,
cumulative counts, rise time and event duration. The parameter analysis technique is found to
be promising for wireless systems. The parameter-based technique solves the constraint of the
embedded system over the signal-based technique with respect to a huge amount of physical
memory data storage, high processing time, and large transmission bandwidth. A new and

Chapter 7
150
novel method for hardware-based parameters extraction from burst type AE signals has been
presented. The designed and measured values of the parameters obtained from the simulation
results are in good agreement with each other. Wireless transmission of AE parameters instead
of the signal is advantageous in terms of the storage capacity of data, the processing load of the
microcontroller, and transmission time.
A data acquisition device is developed based on an integrated hardware and software design
approach in a programmable system on chip for acquiring burst type AE events. The developed
DAQ is capable of capturing AE events at 1 mega samples per second (1 MSPS) rate with a
12-bit resolution, which is sufficient for the reliable representation of AE events.
The computational core hardware and software design is implemented in PSoC for parameter
extraction from burst type AE events and transmission of the parameters wirelessly to a base
station. ZigBee wireless communication protocol has been established to ensure reliable
transmission of the signal parameters to the base station. Finally, the signal conditioning unit,
computational core unit and the wireless unit is fabricated, assembled, and the complete
wireless AE-SS is validated in the laboratory.
A number of experiments were carried out for validating the developed wireless acoustic
emission sensor system. This involves signal validation using artificial AE signal along with
pencil lead break test, concrete compression test and concrete corrosion test. The AE results
from concrete compression test have confirmed three different regions of activity as envisaged
and these are attributed to (a) closure of pre-existing cracks and formation of micro-cracks
through weak boundaries of particles within the concrete specimen, (b) steady growth of the
cracks resulting in continuous increase in AE counts and (c) unstable cracking near to ultimate
Chapter 7
151
strength of the concrete specimen resulting in drastic increase in AE counts. The results of
monitoring of accelerated rebar corrosion by AE show the generation of AE signals from 3rd
day onwards, which is attributed to the onset of corrosion. The increased AE activity from 6th
day onwards is attributed to multiple cracking in concrete, and this could be understood by an
increase in the volume of the corrosion products. The developed wireless AE-SS has been
successfully employed for detecting damage in concrete materials. The additional advantages
of the wireless AE sensor system are that it is cost-effective, compact in size, easy to install on
structures, portable, low power consumption capability to ensure long term monitoring in a
single charge battery supply and remote operational capability.
7.2 Contribution
In this thesis, a first of its kind, programmable system on chip (PSoC) based wireless acoustic
emission sensor system has been designed and developed. The developed wireless acoustic
emission sensor system has been successfully validated and applied for structural health
monitoring applications. The developed wireless system offers unique advantages of its
compactness in size (85 mm x 56 mm), low power consumption capability (50 mA), battery
operated, portability, reduced wiring complexity, reduced cost and remote operational
capability. This system can be effectively utilized for condition monitoring of structures and
components such as NPP containments, bridges, tanks, and components in petrochemical
industries where corrosion is a potential issue, with utmost ease and efficiency. The following
contribution arises from the design and development process for the wireless acoustic emission
sensor system, as listed below.

Chapter 7
152
1. A signal conditioning unit has been designed, developed and validated for acoustic
emission signal. The developed SCU provides a wide range of sensor signals, rail-to-
rail input and output swings, and reduces the complexity of biasing, and provides an
optimal level for further processing of AE signals.
2. The performance of the in-house developed SCU has been compared with a
commercially available system through the pencil lead break test. The time-domain and
power spectral density of AE events reproduced by the in-house developed SCU and a
commercially available system has been found to agree with each other. The resonant
frequency of AE signals at different locations is found to be the same and lies within
the operating frequency range from 100 to 400 kHz for metallic material and 35 to 65
kHz for concrete, respectively.
3. A new and novel hardware design approach has been proposed towards extracting the
parameters of AE signals. Combinations of analog and digital circuits were employed
in this design and the simulation results were presented. Implementation of the
hardware had resulted in reliable extraction of the parameters of AE signals and is found
to be promising for wireless transmission for SHM applications.
4. A programmable system on chip based data acquisition (DAQ) has been designed and
developed for AE signals. The developed DAQ has been successfully validated with
artificial AE signals and can be applied for SHM of concrete.
5. A programmable system on chip based computational core unit has been designed and
interfaced with the signal conditioning unit along with Zigbee based wireless
communication unit for the development of the wireless acoustic emission sensor
system in a single two-layer PCB. The developed wireless system has been successfully
Chapter 7
153
validated with a commercially available wired PAC system through concrete
compression and corrosion tests. The results of compression and corrosion tests of
concrete have been verified with scanning electron microscopy and X-ray radiography
methods.
7.3 Scope of future work
In this work signal conditioning unit has been developed for resonant type piezoelectric sensor.
The development of a signal conditioning unit for wideband sensor is not covered. A study can
be made to realize the frequency characteristics present in continuous type AE signals. An
appropriate filter can be designed and implemented to avoid external noise within the operating
frequency band of the wideband sensor. Low sampling and resolution are required for data
acquisition devices for burst type AE signals in concrete compared to continuous type AE
signals generated in metallic materials. Hence further steps can be taken to develop data
acquisition with high sampling and high resolution for metallic materials. In the present work,
the developed wireless AE-SS is restricted to wireless transmission of the AE parameters only.
This development can be extended to wireless transmission of AE parameters along with the
complete AE signal. In this work, a single wireless sensor unit has been realized by using peer
to peer communication between the sensor unit and the base station. This work can be extended
to the development of multiple sensor units, which can be synchronized with the base station
for identifying the location of AE sources during SHM. The structural integrity of large
structures such as pressure vessels, aircrafts and bridges can be realized using acoustic emission
wireless sensor network.

Chapter 7
154

Appendix A
155
Appendix
A Embedded C Programming Code for data acquisition device
/* =========================================================================== *PROGRAMMING CODE FOR THE DATA ACQUISITION DEVICE IN PSoC CREATOR 4.0 IDE =========================================================================== */ #include<project.h> #include<stdio.h> #include<math.h> #definesample_size 1024 unsignedintThresholdValue=2070; unsignedint VDAC=2070; uint16 signal[1024]; charbuf[4]; uint8 Gain; unsignedint samples; uint8Flag_Run; uint8Thr_Flag; //Data Acquisition using interrupts CY_ISR(T_crossing_ISR) for(samples=0;samples<1024;samples++) ADC_SAR_1_StartConvert(); ADC_SAR_1_IsEndConversion(ADC_SAR_1_WAIT_FOR_RESULT); signal[samples]= ADC_SAR_1_GetResult16();
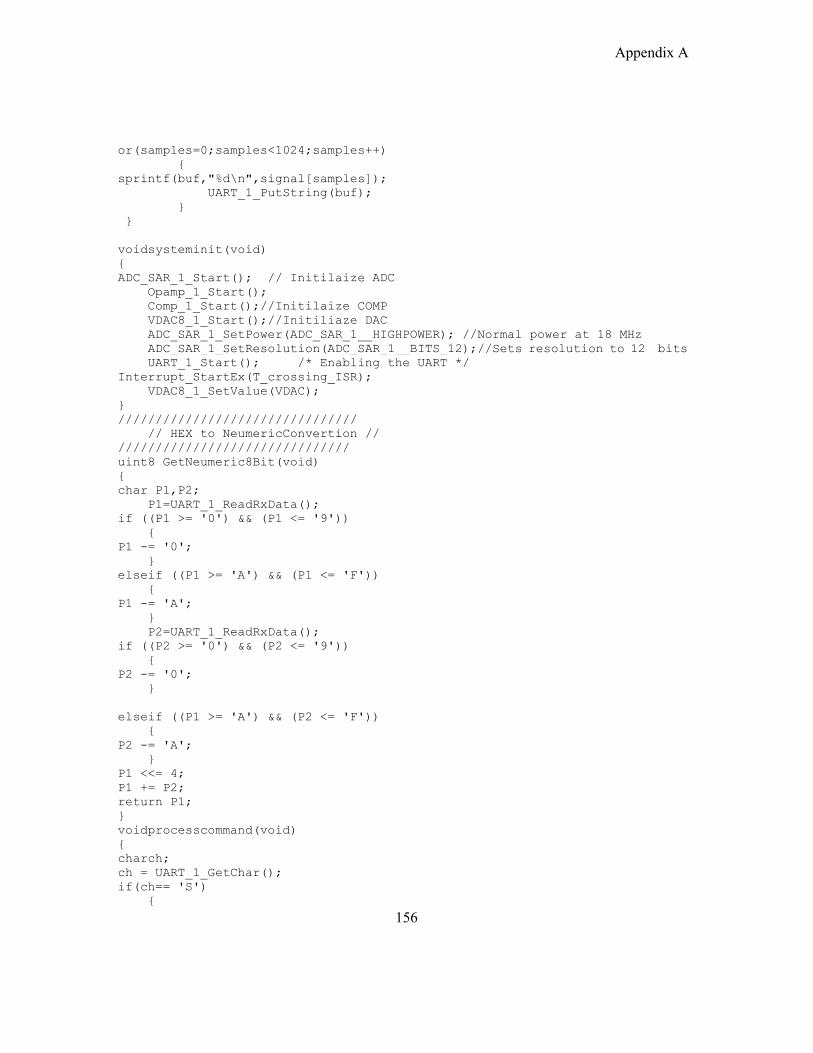
Appendix A
156
or(samples=0;samples<1024;samples++) sprintf(buf,"%d\n",signal[samples]); UART_1_PutString(buf); voidsysteminit(void) ADC_SAR_1_Start(); // Initilaize ADC Opamp_1_Start(); Comp_1_Start();//Initilaize COMP VDAC8_1_Start();//Initiliaze DAC ADC_SAR_1_SetPower(ADC_SAR_1__HIGHPOWER); //Normal power at 18 MHz ADC_SAR_1_SetResolution(ADC_SAR_1__BITS_12);//Sets resolution to 12 bits UART_1_Start(); /* Enabling the UART */ Interrupt_StartEx(T_crossing_ISR); VDAC8_1_SetValue(VDAC); //////////////////////////////// // HEX to NeumericConvertion // /////////////////////////////// uint8 GetNeumeric8Bit(void) char P1,P2; P1=UART_1_ReadRxData(); if ((P1 >= '0') && (P1 <= '9')) P1 -= '0'; elseif ((P1 >= 'A') && (P1 <= 'F')) P1 -= 'A'; P2=UART_1_ReadRxData(); if ((P2 >= '0') && (P2 <= '9')) P2 -= '0'; elseif ((P1 >= 'A') && (P2 <= 'F')) P2 -= 'A'; P1 <<= 4; P1 += P2; return P1; voidprocesscommand(void) charch; ch = UART_1_GetChar(); if(ch== 'S')
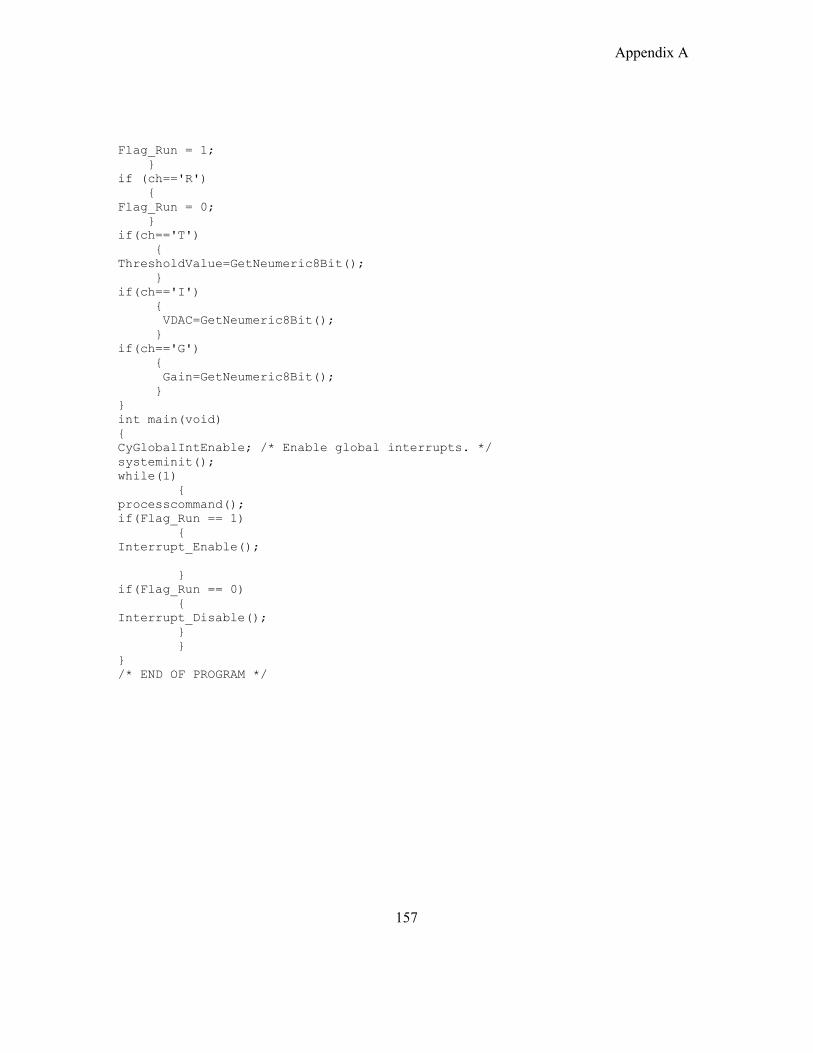
Appendix A
157
Flag_Run = 1; if (ch=='R') Flag_Run = 0; if(ch=='T') ThresholdValue=GetNeumeric8Bit(); if(ch=='I') VDAC=GetNeumeric8Bit(); if(ch=='G') Gain=GetNeumeric8Bit(); int main(void) CyGlobalIntEnable; /* Enable global interrupts. */ systeminit(); while(1) processcommand(); if(Flag_Run == 1) Interrupt_Enable(); if(Flag_Run == 0) Interrupt_Disable(); /* END OF PROGRAM */

Appendix A
158

Appendix B
159
B
Embedded C Programming Code for signal generator device
/* =========================================================================== *PROGRAMMING CODE FOR THE SIGNAL GENERATOR DEVICE IN PSoC CREATOR 4.0 IDE =========================================================================== */ #include "project.h" int AE_Burst1024[]=
156, 156, 156, 156, 156, 157, 157, 157, 157, 156, 156, 155, 155, 155, 154, 154, 155, 155, 156, 157, 159, 160, 161, 161, 161, 160, 159, 157, 155, 152, 150, 148, 148, 148, 149, 152, 155, 159, 162, 166, 168, 169, 169, 167, 163, 159, 153, 148, 143, 140, 139, 139, 142, 146, 153, 159, 166, 172, 177, 179, 178, 175, 169, 162, 153, 145, 137, 132, 129, 129, 133, 140, 149, 159, 169, 178, 185, 188, 188, 184, 176, 166, 154, 142, 132, 124, 120, 120, 125, 133, 144, 157, 171, 183, 192, 197, 197, 192, 183, 171, 156, 142, 128, 118, 112, 112, 116, 126, 139, 155, 171, 185, 197, 203, 204, 200, 190, 176, 159, 142, 126, 114, 106, 105, 109, 119, 134, 151, 170, 186, 200, 208, 211, 206, 196, 181, 163, 144, 126, 112, 102, 100, 103, 113, 129, 147, 167, 186, 201, 211, 215, 212, 202, 186, 167, 147, 127, 111, 100, 96, 99, 108, 124, 143, 164, 184, 201, 213, 218, 215, 206, 191, 172, 150, 130, 112, 100, 94, 96, 104, 119, 139, 160, 181, 199, 212, 219, 218, 210, 195, 176, 154, 133, 114, 101, 94, 94, 102, 116, 135, 156, 178, 197, 211, 218, 219, 212, 198, 180, 158, 137, 118, 103, 95, 94, 100, 113, 131, 152, 174, 193, 208, 217, 219, 213, 200, 183, 162, 141, 121, 106,
97, 95, 100, 111, 128, 149, 170, 189, 205, 214, 217, 213, 202, 185, 166, 145, 126, 110, 100, 96, 100, 110, 126, 145, 166, 185, 201, 211, 215, 212, 203, 188, 169, 149, 130, 114,

Appendix B
160
103, 99, 101, 110, 124, 142, 162, 180, 196, 207, 212, 211, 203, 189, 172, 153, 134, 119, 107, 102, 103, 110, 123, 140, 158, 176, 192, 203, 209, 208, 202, 190, 174, 156, 139, 123, 112, 105, 105, 111, 122, 137, 155, 172, 187, 199, 205, 206, 201, 190, 176, 159, 143, 128, 116, 109, 108, 113, 122, 136, 152, 168, 183, 194, 201, 203, 199, 190, 177, 162, 146, 132, 120, 113, 111, 115, 123, 135, 149, 164, 179, 190, 197, 200, 197, 189, 178, 164, 150, 136, 125, 117, 115, 117, 124, 134, 147, 161, 175, 186, 193, 196, 194, 188, 178, 166, 153, 140, 129, 121, 118, 119, 125, 134, 146, 159, 171, 182, 189, 193, 192, 187, 178, 167, 155, 143, 133, 125, 122, 122, 126, 134, 145, 156, 168, 178, 185, 189, 189, 185, 178, 168, 157, 146, 136, 129, 125, 125, 128, 135, 144, 154, 165, 174, 182, 186, 187, 184, 178, 169, 159, 149, 140, 133, 128, 127, 130, 135, 143, 153, 162, 171, 178, 183, 184, 182, 177, 169, 160, 151, 143, 136, 131, 130, 132, 136, 143, 151, 160, 169, 175, 180, 181, 180, 176, 169, 162, 153, 145, 139, 134, 133, 134, 137, 143, 150, 158, 166, 172, 177, 179, 178, 175, 169, 162, 155, 148, 141, 137, 135, 135, 138, 143, 150, 157, 164, 170, 174, 176, 176, 174, 169, 163, 156, 150, 144, 140, 137, 137, 140, 144, 149, 156, 162, 168, 172, 174, 174, 172, 168, 163, 157, 151, 146, 142, 140, 139, 141, 144, 149, 155, 160, 166, 170, 172, 172, 171, 168, 163, 158, 153, 148, 144, 142, 141, 142, 145, 149, 154, 159, 164, 168, 170, 171, 170, 167, 163, 159, 154, 150, 146, 143, 143, 143, 146, 149, 153, 158, 162, 166, 168, 169, 169, 167, 163, 159, 155, 151, 148, 145, 144, 145, 146, 149, 153, 157, 161, 164, 167, 168, 167, 166, 163, 160, 156, 152, 149, 147, 146, 146, 147, 150, 153, 156, 160, 163, 165, 166, 166, 165, 163, 160, 157, 153, 150, 148, 147, 147, 148, 150, 153, 156, 159, 162, 164, 165, 165, 164, 162, 160, 157, 154, 151, 149, 148, 148, 149, 150, 153, 155, 158, 161, 163, 164, 164, 164, 162, 160, 157, 155, 152, 150, 149, 149, 149, 151, 153, 155, 157, 160, 162, 163, 163, 163, 162, 160, 158, 155, 153, 151, 150, 150, 150, 151, 153, 155, 157, 159, 161, 162, 162, 162, 161, 160, 158, 156, 154, 152, 151, 151, 151, 151, 153, 155, 156, 158, 160, 161, 162, 162, 161, 160, 158, 156, 154, 153, 152, 151, 151, 152, 153, 154, 156, 158, 159, 160, 161, 161, 160, 159, 158, 157, 155, 154, 153, 152, 152, 152, 153, 154, 156, 157, 159, 160, 160, 160, 160, 159, 158, 157, 155, 154, 153, 153, 152, 153, 153, 154, 156, 157, 158, 159, 160, 160, 160, 159, 158, 157, 156, 155, 154, 153, 153, 153, 154, 154, 156, 157, 158, 159, 159, 159, 159, 159, 158, 157, 156, 155, 154, 154, 153, 153, 154, 155, 155, 156, 157, 158, 159, 159, 159, 159, 158, 157, 156, 155, 154, 154, 154, 154, 154, 155, 155, 156, 157, 158, 158, 159, 159, 158, 158, 157, 156, 156, 155, 154, 154, 154, 154, 155, 155, 156, 157, 158, 158, 158, 158, 158, 158, 157, 156, 156, 155, 155, 154, 154, 154, 155, 155, 156, 157, 157, 158, 158, 158, 158, 158, 157, 157, 156, 155, 155, 155, 155, 155, 155, 155, 156, 157, 157, 157, 158, 158, 158, 157, 157, 157, 156, 156, 155, 155, 155, 155, 155, 155, 156, 156, 157, 157, 158, 158, 158, 157, 157, 157, 156, 156, 155, 155, 155, 155, 155, 155, 156, 156, 157, 157, 157, 157, 157, 157, 157, 157, 156, 156, 156, 155, 155, 155, 155, 156, 156, 156, 157, 157, 157, 157, 157,
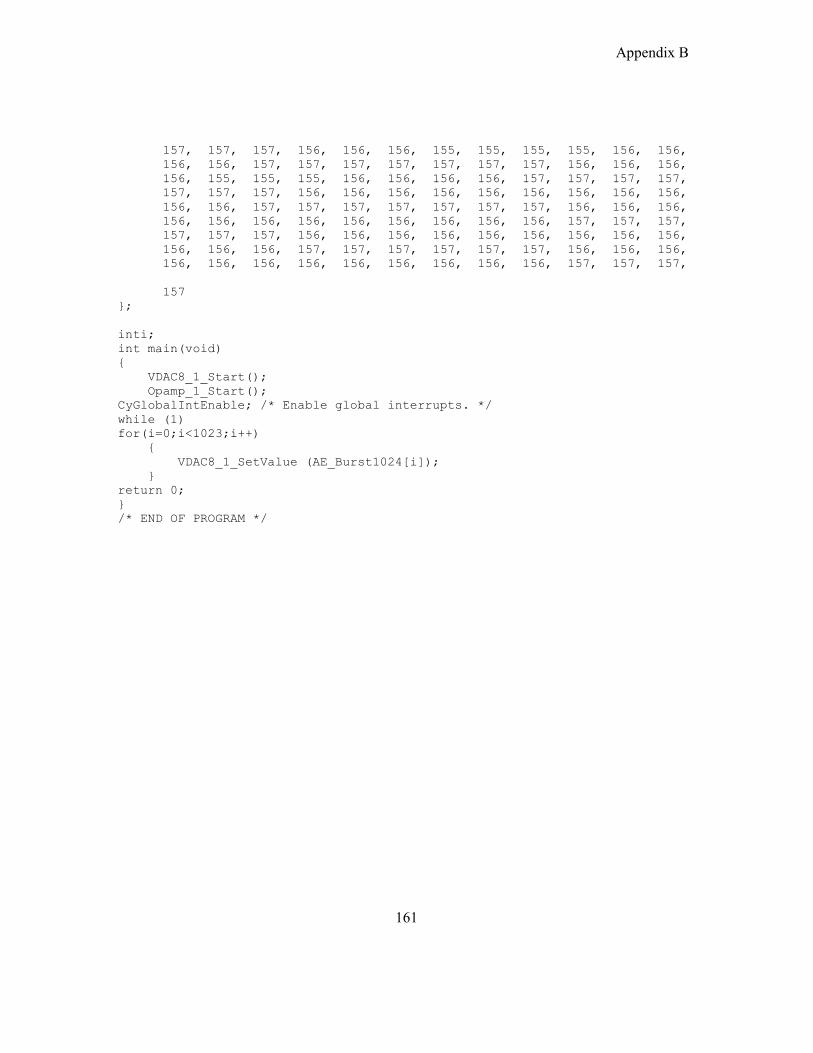
Appendix B
161
157, 157, 157, 156, 156, 156, 155, 155, 155, 155, 156, 156, 156, 156, 157, 157, 157, 157, 157, 157, 157, 156, 156, 156, 156, 155, 155, 155, 156, 156, 156, 156, 157, 157, 157, 157, 157, 157, 157, 156, 156, 156, 156, 156, 156, 156, 156, 156, 156, 156, 157, 157, 157, 157, 157, 157, 157, 156, 156, 156, 156, 156, 156, 156, 156, 156, 156, 156, 156, 157, 157, 157, 157, 157, 157, 156, 156, 156, 156, 156, 156, 156, 156, 156, 156, 156, 156, 157, 157, 157, 157, 157, 157, 156, 156, 156, 156, 156, 156, 156, 156, 156, 156, 156, 156, 157, 157, 157, 157 ; inti; int main(void) VDAC8_1_Start(); Opamp_1_Start(); CyGlobalIntEnable; /* Enable global interrupts. */ while (1) for(i=0;i<1023;i++) VDAC8_1_SetValue (AE_Burst1024[i]); return 0; /* END OF PROGRAM */

Appendix B
162

Appendix C
163
C
Embedded C Programming Code for the wireless sensor unit
/* ======================================================================== *PROGRAMMING CODE FOR THE wireless sensor unit IN PSoC CREATOR 4.0 IDE ======================================================================== */ #include<project.h> #include<stdio.h> #include<math.h> #definesample_size 1024 #definesample_interval 1//in microseconds //unsigned long int sample_size=1024; unsignedintThresholdValue=2070; unsignedint VDAC=2076; unsignedintMidValue=2036; uint8 Gain; unsignedintz,event; unsignedint samples1[sample_size],samples2[sample_size],samples3[sample_size],samples4[sample_size],samples5[sample_size],samples6[sample_size]; unsignedint *a[6]=samples1,samples2,samples3,samples4,samples5,samples6; unsignedintDPArray[sample_size]; unsignedint sem_DA,sem_DP1,sem_DP2,sem_DP3,sem_DP4,sem_DP5,sem_DP6,array,parray,samples,PeakAmplitude,RiseTime,EventDuration,ApproxAEcount,AEcount; unsignedintsem_DP,refill=0; unsignedlongintsquare,sumofsquares; unsignedlongintCumulativeCount=0; unsignedintSquareMean; unsignedint RMS; unsignedint Hit; unsignedint sum; unsignedint average=0; unsignedintfirstthresholdcrossing; unsignedintlastthresholdcrossing; unsignedintpeaksamples;

Appendix C
164
uint32CapturedTime=0; uint8Flag_Run; uint8Thr_Flag; void parameters(void) ApproxAEcount=0; sumofsquares=0; AEcount=0; square=0; SquareMean=0; RMS=0; sum=0; PeakAmplitude=0; peaksamples=0; firstthresholdcrossing=0; lastthresholdcrossing=0; for(samples=0;samples<sample_size;samples++) //to find peakamplitude and risetime PeakAmplitude=DPArray[0]; if(DPArray[0] <DPArray[samples]) DPArray[0]= DPArray[samples]; PeakAmplitude=DPArray[0]; peaksamples=(sample_interval*samples); //event duration if(DPArray[samples]>ThresholdValue) lastthresholdcrossing=samples; if(DPArray[lastthresholdcrossing-1]<ThresholdValue) firstthresholdcrossing= samples; //to find AEcount and cumulativecount if (DPArray[samples]<MidValue) Thr_Flag=0; elseif(DPArray[samples]>ThresholdValue) if (Thr_Flag==0) Thr_Flag=1; AEcount++; // to find rms square=((DPArray[samples]-2057)*(DPArray[samples]-2057)); sumofsquares=sumofsquares+square; sum=sum+DPArray[samples]; //AEcount and cumulativecount EventDuration = lastthresholdcrossing - firstthresholdcrossing; RiseTime= peaksamples-firstthresholdcrossing; Hit=Hit+1;

Appendix C
165
CumulativeCount=AEcount+CumulativeCount; SquareMean=sumofsquares/sample_size; RMS=sqrt(SquareMean); RMS=(RMS*5000)/4096; average=sum/sample_size; PeakAmplitude=PeakAmplitude-average; PeakAmplitude=(PeakAmplitude*5000)/4096; sem_DP=1; voidDataprocessing() sem_DA=0; parray=parray+1;//variable to choose arrays for data processing. if(parray>6) parray=1; switch(parray) case 1: for(samples=0;samples<sample_size;samples++) DPArray[samples]=samples1[samples]; parameters(); break; case 2: for(samples=0;samples<sample_size;samples++) DPArray[samples]=samples2[samples]; parameters(); break; case 3: for(samples=0;samples<sample_size;samples++) DPArray[samples]=samples3[samples]; parameters(); break; case 4: for(samples=0;samples<1024;samples++) DPArray[samples]=samples4[samples]; parameters(); break; case 5: for(samples=0;samples<sample_size;samples++) DPArray[samples]=samples5[samples]; parameters(); break;

Appendix C
166
case 6: for(samples=0;samples<sample_size;samples++) DPArray[samples]=samples6[samples]; parameters(); break; //Data Acquisition using Interrupts CY_ISR(T_crossing_ISR) CapturedTime = Counter_1_ReadCapture(); if(refill<=0) for(samples=0;samples<sample_size;samples++) ADC_SAR_1_StartConvert(); ADC_SAR_1_IsEndConversion(ADC_SAR_1_WAIT_FOR_RESULT); a[event][samples]=ADC_SAR_1_GetResult16(); event=event+1; if(event>5) event=0; refill=refill+1; sem_DA=1; else if(sem_DP==1) sem_DP=0; for(samples=0;samples<sample_size;samples++) ADC_SAR_1_StartConvert(); ADC_SAR_1_IsEndConversion(ADC_SAR_1_WAIT_FOR_RESULT); a[event][samples]=ADC_SAR_1_GetResult16(); event=event+1; if(event>5) event=0; refill=refill+1; sem_DA=1; CY_ISR(counterInterrupt) voidDatatransmission()

Appendix C
167
char buffer[80]; sprintf(buffer,sizeof(buffer)," %u,%u,%u,%lu,%u,%u,%u,%u,%lu\n",PeakAmplitude,RMS,AEcount,CumulativeCount,Hit,RiseTime,EventDuration,average,CapturedTime); UART_1_PutString(buffer); voidsysteminit(void) Counter_1_Start(); ADC_SAR_1_Start(); // Initilaize ADC Comp_1_Start();//Initilaize COMP VDAC8_1_Start();//Initiliaze DAC ADC_SAR_1_SetPower(ADC_SAR_1__HIGHPOWER); //Normal power at 18 MHz ADC_SAR_1_SetResolution(ADC_SAR_1__BITS_12);//Sets resolution to 12 bits UART_1_Start(); /* Enabling the UART */ PGA_1_Start(); isr_1_StartEx(T_crossing_ISR); PGA_1_SetGain(Gain); VDAC8_1_SetValue(VDAC); //////////////////////////////// // HEX to NeumericConvertion // /////////////////////////////// uint8 GetNeumeric8Bit(void) char P1,P2; P1=UART_1_ReadRxData(); if ((P1 >= '0') && (P1 <= '9')) P1 -= '0'; elseif ((P1 >= 'A') && (P1 <= 'F')) P1 -= 'A'; P2=UART_1_ReadRxData(); if ((P2 >= '0') && (P2 <= '9')) P2 -= '0'; elseif ((P1 >= 'A') && (P2 <= 'F')) P2 -= 'A'; P1 <<= 4; P1 += P2; return P1; voidprocesscommand(void) charch; ch = UART_1_GetChar(); if(ch== 'S') Flag_Run = 1;

Appendix C
168
if (ch=='R') Flag_Run = 0; if(ch=='T') ThresholdValue=GetNeumeric8Bit(); if(ch=='I') VDAC=GetNeumeric8Bit(); if(ch=='G') Gain=GetNeumeric8Bit(); int main(void) CyGlobalIntEnable; /* Enable global interrupts. */ systeminit(); while(1) processcommand(); if(Flag_Run == 1) isr_1_Enable(); if(sem_DA==1) Dataprocessing(); Datatransmission(); if(Flag_Run == 0) isr_1_Disable(); /* END OF PROGRAM */
References
169
References
1. D. E. Bray and R. K. Stanley, “Non-destructive Evaluation”, Revised edition,
CRC Press, Florida, 1997.
2. Robert C. Memaster, “Non-destructive testing handbook”, American Society
for Nondestructive testing, 1st edition, 1959.
3. Jack Blitz, “Electrical and Magnetic Methods of Non-destructive Testing”,
Chapman & Hall, London, 2nd edition, 1997.
4. R. Prakash, “Non-destructive Testing of Composites”, Composites, Vol.11, No.
4, pp. 217-224, 1980.
5. Harold Berger, “Non-destructive testing of railroad”, Transportation Research
Record, pp. 22-26, 1980.
6. D. C. Hollaby, “Ultrasonic flaw detection and characterization–an Australian
view”, Non-destructive Testing, Australia, Vol. 17, No.10, pp.9-13, 1980.
7. D. L. Parry, “Detection and analysis of vessel discontinuities by acoustic
emission inspection”, Ammonia Plane Safety (and related facilities), Vol. 33,
pp. 140-145, 1980.
8. Yoseph Bar-Cohen, “Emerging NDE technologies and challenges at the
beginning of the 3 rd millennium-Part1”, NDT.net, Vol. 5, No.1, 2000.
9. G. Dobmann, R. Becker and M. Disque, “Life extension the contribution of a
low and multi-frequency eddy current technique to assure the integrity of
References
170
cladding in nuclear power plant pressure vessels”, Welding Research Abroad,
Vol. 44, pp. 16-23, 1998.
10. Annual Book of ASTM Standards, Section Three, Metals Test and Analytical
Procedures, Non-destructive Testing, ASTM International, Vol. 03, 2005.
11. Mohamed Ben Gharsallah and Ezzeddine Ben Braiek, “Weld inspection based
on radiography image segmentation with level set active contour guided off-
center saliency map”, Journal of Advances in Materials Science and
Engineering, Vol. 2015, pp 1-10, 2015.
12. A. A. Pollock, “Acoustic emission inspection”, Metals Handbook, Vol. 17, pp.
278-294, 1989.
13. T. H. Loutas, G. Sotiriades, I. Kalaitzoglou, and V. Kostopoulos, “Condition
monitoring of a single-stage gearbox with artificially induced gear cracks
utilizing on-line vibration and acoustic emission measurements”, Journal of
Applied Acoustic, Vol. 70, pp. 1148-59, 2009.
14. T. H. Loutas, D. Roulias, E. Pauly, and V. Kostopoulos, “The combined use of
vibration, acoustic emission and oil debris on-line monitoring towards a more
effective condition monitoring of rotating machinery”, Mechanical System
Signal Process, Vol. 25, pp. 1339–1352, 2011.
15. D. M. McCann and M. C. Forde, “Review of NDT methods in the assessment
of concrete and masonry structures”, NDT & E International, Vol. 34, pp. 71-
84, 2001.

References
171
16. J. M. Brownjohn, “Structural health monitoring of civil infrastructure”,
Philosophical Transactions of the Royal Society A: Mathematical, Physical and
Engineering Sciences, Vol. 365, pp. 589-622, 2007.
17. Z. Hou, A. Hera, and A. Shinde, “Wavelet-based structural health monitoring
of earthquake excited structures”, Computer-Aided Civil and Infrastructure
Engineering, Vol. 21, pp. 268-279, 2006.
18. Allen C. Estes, M Asce, Dan Frangopol and F Asce, “Updating bridge reliability
based on bridge management systems visual inspection results”, Journal of
Bridge Engineering, Vol.8, pp. 374-382, 2003.
19. Charles R. Farrar and Keith Worden, “An introduction to structural health
monitoring”, Philosophical Transaction of the Royal Society A, Vol. 365, pp.
303–315, 2006.
20. A. Mahoon, “The role of non-destructive testing in the airworthiness
certification of civil aircraft composite structures”, Composites, Vol.19, pp.229-
235, 1988.
21. D. M. Frangopol, “New directions and research needs in life-cycle performance
and cost of civil infrastructures”, Structural Health Monitoring 2003, From
diagnostics & Prognostics to Structural Health Management, Proceedings of the
4th International Workshop on Structural Health Monitoring, Stanford, CA,
Lancaster, PA, DEStech Publications, Inc, pp. 53-63, September 15-17, 2003.
22. M. M. Derriso, D. M. Pratt, D. B. Homan, J. B. Schroeder and R. A. Bortne,
“Integrated vehicle health management: the key to future aerospace systems”,

References
172
Structural health monitoring from diagnostics & prognostics to structural health
introduction to SHM management, proceedings of the 4th International
workshop on structural health monitoring, Stanford, CA, Lancaster, PA,
DEStech Publications, Inc, pp. 3-11, September 15-17, 2003.
23. S. M. Walsh “A requirements-based approach to Structural Health Monitoring
research, development, and application”, Structural Health Monitoring 2003,
From diagnostics & Prognostics to Structural Health Management, Proceedings
of the 4th International Workshop on Structural Health Monitoring, Stanford,
CA, Lancaster, PA, DEStech Publications, Inc, pp. 79-87. September 15-17,
2003.
24. B. Beral and H. Speckmann, “Structure Health Monitoring (SHM) for aircraft
structures: a challenge for system developers and aircraft manufacturers”,
Structural health monitoring from diagnostics & prognostics to structural health
management, proceedings of the 4th international workshop on structural health
monitoring, Stanford, CA, Lancaster, PA, DEStech Publications, Inc, pp. 12-29.
September 15-17, 2003.
25. R. K. Miller, “Acoustic Emission Testing”, Non-destructive Testing Handbook,
3rd ed. Vol. 6, Columbus, OH: Amer. Society for Non-Destructive Testing,
2006.
26. G. A. Washer, “Developments for the non-destructive evaluation of highway
bridges in the USA”, NDT& E International, Vol. 31, pp. 245-249, 1998.

References
173
27. V. M. Malhotra and N. J Carino, “Handbook on non-destructive testing of
concrete”, CRC Press, LLC, Boca Raton, FL, 2004.
28. Boris Muravin, “Acoustic Emission Science and Technology”, Journal of
Building and Infrastructure Engineering of the Israeli Association of Engineers
and Architects, Vol. 1. pp. 4-5, 2009.
29. C. Boller, “Structural health monitoring — An introduction and definitions”,
Encyclopedia of Structural Health Monitoring, 2009.
30. Raj Dharma, Dharma Raj Dhakal, Keshab Neupane, Chirayu Thapa and G. V.
Ramanjaneyul, “Different techniques of structural health monitoring”
International Journal of Civil, Structural, Environmental and Infrastructure
Engineering Research and Development, Vol. 3, pp. 55-66, 2013.
31. Thodamra Kandy Haneef, Barid Baran Lahiri, Subramaniam Bagavathiappan,
Chandan Kumar Mukhopadhyay, John Philip, Bhagi Purna Chandra Rao and
Tamanna Jayakumar, “Study of the tensile behavior of AISI type 316 stainless
steel using acoustic emission and infrared thermography techniques”, Journal of
Materials Research and Technology, Vol. 4, pp. 241–253, 2015.
32. Gongtian Shen, Zhanwen Wu and Junjiao Zhang, “Advances in acoustic
emission technology”, Springer Proceedings in Physics, Vol. 179, pp. 257-258,
2015.
33. M. Mondal and G. B. Kumbhar, “Detection, measurement, and classification of
partial discharge in a power transformer: methods, trends and future research”,
IETE Technical Review, Vol. 35, pp. 483-493, 2017.

References
174
34. Ozevin, Didem and James Harding “Novel leak localization in pressurized
pipeline networks using acoustic emission and geometric connectivity”,
International Journal of Pressure Vessels and Piping, Vol. 92, pp. 63-69, 2012.
35. P. Mazal and J. Dvoracek, “Application of acoustic emission method in contact
damage identification”, International Journal Materials and Product
Technology, Vol. 41, pp. 140-152, 2011.
36. David Crivelli and Stewart Bland, “Structural health monitoring via acoustic
emission”, Journal of Reinforced Plastics, Vol. 60, pp. 390-392, 2015.
37. Mohamed K. ElBatanouny, Paul H. Ziehl, Aaron Larosche, Jesé Mangual, Fabio
Matta and Antonio Nanni, “Acoustic emission monitoring for assessment of pre-
stressed concrete beams”, Construction and Building Materials, Vol. 58, pp. 46-
53, 2014.
38. A. Damgaard Jensen and S. Chatterji, “State of the art report on micro-cracking
and lifetime of concrete - Part I”, Matdriauxet Constructions Materials and
Structures, Vol. 29, pp 3-8. 1996.
39. Mahindra Kaphle, “Analysis of acoustic emission data for accurate damage
assessment for structural health monitoring applications”, PhD Thesis, School
of chemistry, Queensland University of Technology, Australia, 2012.
40. David Roylance, “Stress-strain curves”, 2001. Available at
http://web.mit.edu/course/3/3.11/www/modules/ss.pdf.
References
175
41. Jianan Hu Alan and C. F. Cocks, “A multi-scale self-consistent model
describing the lattice deformation in austenitic stainless steels”, International
Journal of Solids and Structures, Vol. 78–79, pp. 21-37, 2016.
42. Parag Tandaiya, R. Narasimhan and U. Ramamurty, “Mode I crack tip fields in
amorphous materials with application to metallic glasses”, Acta Materialia, Vol.
55, pp. 6541–6552, 2007.
43. J. Pokluda “Brittle and ductile fracture”, Micromechanisms of Fracture and
Fatigue, Chapter 2, Vol. 0, pp 69-123, 2010.
44. A. V. Lavrov, and V. L. Shkuratnik, “Deformation and fracture-induced
acoustic emission in rocks”, Acoustical Physics, Vol. 51, pp. S2–S11, 2005.
45. The Collaboration for NDT Education. (n.d.). Theory - AE Sources. Retrieved
August 10, 2010, Available from NDT Education Resource Center:
http://www.ndt-ed.org/EducationResources/CommunityCollege/Other
Methods/AE/AE_Theory-Sources.htm
46. M. Ohtsu, “The history and development of acoustic emission in concrete
engineering”, Magazine of Concrete Research, Vol. 48, pp. 321-330, 1995.
47. M. Mondal and G. B. Kumbhar, “Detection, measurement, and classification of
partial discharge in a power transformer: methods, trends and future research”,
IETE Technical Review, pp. 483-493, 2017.
48. Christian U. Grosse and Masayasu Ohtsu, “Acoustic emission testing”, 1st Edn.
SpringerVerlag Berlin Heidelberg, le-tex publishing services HG, Leipzig,
Germany, 2008.
49. F. G. Baptista and J. V. Filho, “A new impedance measurement system for PZT-
based structural health monitoring”, IEEE Transaction Instrument and
Measurement, Vol. 58, pp. 3602–3608. 2009.

References
176
50. S. Gholizadeh, Z. Leman and B.T.H.T. Baharudin, “A review of the application
of acoustic emission technique in engineering”, Structural Engineering and
Mechanics, Vol. 54, pp. 1075-1095, 2015.
51. Kaita Ito and Manabu Enoki, “Acquisition and analysis of continuous acoustic
emission waveform for classification of damage sources in ceramic fiber mat”,
Materials Transactions, Vol. 48, No. 6, pp. 1221-1226, 2007.
52. N.N. Hsu and F.R. Breckenridge, “Characterization and calibration of acoustic
emission sensors”, Materials Evaluation, Vol. 39, pp. 60-68, 1981.
53. C. A. Tatro, “Design criteria for acoustic emission experiment”, Acoustic
Emission, ASTM STP 505, Hiladelphia, PA: American Society for Testing and
Materials; 1972.
54. Lance E. Rewerts, Ron A. Roberts and M Amanda Clark, “Dispersion
compensation in acoustic emission pipeline leak location”, Review of Progress
in Quantitative Non-destructive Evaluation, no. 4, pp. 427-434, 1997.
55. Jun Zhou, “A study of acoustic emission technique for concrete damage
detection”, Master’s report, Michigan Technological University, 2011.
http://digitalcommons.mtu.edu/etds/726.
56. Horst Czichos, “Handbook of technical diagnostics: fundamentals and
application to structures and systems,” Springer Science & Business Media,
Chapter 8, pp. 137-154, 2013.

References
177
57. P. Kalyanasundaram, C. K. Mukhopadhyay and S. V. Subba Rao; Series editor:
Baldev Raj, and B. Venkatraman, “Practical acoustic emission”, Pub. Narosa
Publishing House, New Delhi, India, 2007.
58. D. O. Harris, A. S. Tetelman and F. A. Darwish, “Acoustic emission”, ASTM
STP 505 (American Society for Testing and Marerials, Philadelphia, PA), pp.
243-246, 1972.
59. Masayasu Ohtsu, Manabu Enoki, Yoshihiro Mizutani, and Mitsuhiro Shigeishi,
“Practical acoustic emission testing”, The Japanese Society for Non-Destructive
Inspection (Springer Japan), Chapter 2, pp. 5-34, 2016
60. Paulo R. Aguiar, Cesar H.R. Martins, Marcelo Marchi and Eduardo C. Bianchi
“Digital signal processing for acoustic emission”, IntechOpen, pp. 297-316,
2012.
61. Shaowei Hu, Jun Lu and Feipeng Xiao, “Evaluation of concrete fracture
procedure based on acoustic emission parameters”, Construction and Building
Materials, Vol. 47, pp. 1249–1256, 2013.
62. A. Nair and C. S. Cai “Acoustic emission monitoring of bridges: Review and
case studies”, Engineering Structures, Vol. 32, pp. 1704-1714, 2010.
63. Farid A. K. M. Uddin, Mitsuhiro Shigeish and Masayasuohtsu. “Fracture
mechanics of corrosion cracking in concrete by acoustic emission”, Meccanica,
Vol. 41, pp. 425-442, 2006.
64. Carpinteri and G. Lacidogna, “Earthquakes and acoustic emission”, 2007.

References
178
65. A. Carpinteri, G. Lacidogna and N. Pugno, “Structural damage diagnosis and
life-time assessment by acoustic emission monitoring”, Engineering Fracture
Mechanics, Vol. 74, pp. 273-289, 2007.
66. T. M. Morton, R. M. Harrington and J. G. Bjeletich, “Acoustic emissions of
fatigue crack growth”, Engineering Fracture Mechanics, Vol.5, pp. 691-697,
1973.
67. A. Berkovits and D. Fang, “Study of fatigue crack characteristics by acoustic
emission,” Engineering Fracture Mechanics, Vol. 51, pp. 401-409, 1995.
68. J. Labuz, S. Dai and K. Shah, “Identifying failure through locations of acoustic
emission”, Transportation Research Record, Vol. 1526, pp. 104-111, 1996.
69. W. Li, W. Sun and Jinyang Jiang, “Damage of concrete experiencing flexural
fatigue load and closed freeze/thaw cycles simultaneously”, Construction and
Building Materials, Vol. 25, pp. 2604-2610, 2011.
70. Tetsuya Suzuki, Hidehiko Ogata, Ryuichi Takada, Masao Aoki and Masayasu
Ohtsu, “Use of acoustic emission and X-ray computed tomography for damage
evaluation of freeze-thawed concrete”, Construction and Building Materials,
Vol. 24, pp. 2347-2352, 2010.
71. A. K. M. Farid Uddin, Kenichiro Numata, Jun Shimasaki, Mitsuhiro Shigeishi
and Masayasu Ohtsu, “Mechanisms of crack propagation due to corrosion of
reinforcement in concrete by AE-SiGMA and BEM”, Construction and
Building Materials, Vol. 18, pp. 181-188, 2004.
References
179
72. C. Grosse, H. Reinhardt and T. Dahm, “Localization and classification of
fracture types in concrete with quantitative acoustic emission measurement
techniques”, NDT & E International, Vol. 30, pp. 223-230, 1997.
73. K. Ohno and M. Ohtsu, “Crack classification in concrete based on acoustic
emission”, Construction and Building Materials, Vol. 24, pp. 2339-2346. 2010.
74. Ahmad Zaki, Hwa Kian Chai, Dimitrios G. Aggelis and Ninel Alver, “Non-
destructive evaluation for corrosion monitoring in concrete: A review and
capability of acoustic emission technique”, Sensors, Vol. 15, pp. 19069-19101,
2015.
75. Sudhir Singh Bhadauria and Saleem Akhtar, “Review of nondestructive testing
methods for condition monitoring of concrete structures”, Journal of
Construction Engineering, Vol. 2013, pp. 1-11, 2013.
76. D. Soulioti, N. M. Barkoula, A. Paipetis, T. E. Matikas, T. Shiotani and D. G.
Aggelis, “Acoustic emission behavior of steel fiber reinforced concrete under
bending”, Construction and Building Materials, Vol. 23, pp. 3532-3536, 2009.
77. B. Chen and J. Liu, “Experimental study on AE characteristics of three-point
bending concrete beams”, Cement and Concrete Research, Vol. 34, pp. 391-
397, 2004.
78. S. X. Bernd Weiler and Utz Mayer, “Acoustic emission analysis applied to
concrete under different loading conditions”, Otto Graf Journal, Vol. 8, pp. 255-
269, 1997.

References
180
79. P. G. Leszek Golaski and Kanji Ono, “Diagnostics of reinforced bridges by
acoustic emission”, Journal of Acoustic Emission, Vol. 20, pp. 83-98, 2002.
80. M. Ohtsu and H. Watanabe, “Quantitative damage estimation of concrete by
acoustic emission”, Construction and Building Materials, Vol. 15, pp. 217-224,
2001.
81. T. Suzuki and M. Ohtsu, “Quantitative damage evaluation of structural concrete
by a compression test based on AE rate process analysis”, Construction and
Building Materials, Vol. 18, pp. 197-202, 2004.
82. P. G. Ranjitha, D. Jasinge, J. Y. Song and S. K. Choi, “A study of the effect of
displacement rate and moisture content on the mechanical properties of
concrete: Use of acoustic emission”, Mechanics of Materials, Vol.40, pp. 453-
469, 2008.
83. T. K. Haneef, Kalpana Kumari, C. K. Mukhopadhyay, Venkatachalapathy, B.
Purnachandra Rao and T. Jayakumar, “Influence of fly ash and curing on
cracking behavior of concrete by acoustic emission technique”, Construction
and Building Materials, Vol. 44, pp. 342-350, 2013.
84. D. J. Pines and P. A. Lovell, “Conceptual framework of a remote wireless health
monitoring system for large civil structure”, Smart Material and Structures. Vol.
7, pp. 627–636, 1998.
85. Y. Yu, J. Ou and H. Li, “Design, calibration and application of wireless sensors
for structural global and local monitoring of civil infrastructures” Smart
Structures and Systems, Vol. 6, pp. 641–659. 2010.

References
181
86. Y. Yu, J. Ou, J. Zhang, C. Zhang and L. Li, “Development of wireless MEMS
inclination sensor system for swing monitoring of large-scale hook structures”,
IEEE Trans. Ind. Electron., Vol. 56, pp. 1072–1078, 2009.
87. Peng Li, Haichang Gu, Gangbing Song, Rong Zheng and Y. L. Mo, “Concrete
structural health monitoring using piezoceramic based wireless sensor
networks”, Smart Structures and Systems. Vol. 6, pp. 731–748, 2010.
88. A. N. Zagrai and V. Giurgiutiu, “Electro-mechanical impedance method for
crack detection in thin plates”, Journal of Intelligent Material Systems and
Structures, Vol. 12, pp. 709-718, 2001.
89. A. Raghavan and C. E. S. Cesnik, “Review of guided-wave structural health
monitoring”, The Shock and Vibration Digest, Vol. 39, pp. 91-114, 2007.
90. K. M. Holford, “Acoustic emission in structural health monitoring”, Key
Engineering Materials, Vol. 413-414, pp. 15-28, 2009.
91. Dong-Jin Yoon, Sang-I Lee, Chi-Yeop Kim and Dae-Cheol Seo, “Acoustic
emission diagnosis system and wireless monitoring for damage assessment of
concrete structures”, NDT for Safety, pp. 55-62, 2007.
92. Yang Wang, Jerome P. Lynch and Kincho H. Law, “A wireless structural health
monitoring system with multithreaded sensing devices: design and validation”,
Structure and Infrastructure Engineering, Vol. 3, No. 2, pp. 103-120, 2007.
93. Victoria J. Hodge, Simon O’Keefe, Michael Weeks and Anthony Moulds,
“Wireless sensor networks for condition monitoring in the railway industry: A

References
182
survey”, IEEE Transactions on Intelligent Transportation Systems, Vol. 16, pp.
1088 – 1106, 2015.
94. MA Shamshi, “Technologies convergence in recent instrumentation for natural
disaster monitoring and mitigation”, IETE Technical Review, Vol. 21, No. 4,
pp. 277-290, 2004.
95. M. Bocca, A. Mahmood, L. M. Eriksson, J. Kullaa and R. Jäntti, “A
synchronized wireless sensor network for experimental modal analysis in
structural health monitoring”, Computer-aided Civil & Infrastructure
Engineering, Vol. 26, No. 7, pp. 483-499, 2011.
96. Ali M. Sadeghioon, Nicole Metje, David N. Chapman and Carl J. Anthony,
“Smart wireless sensor networks for leak detection in water pipelines” Journal
of Sensor and Actuator Networks, Vol. 3, pp. 64-78, 2014.
97. M. J. Chaea, H.S. Yoo, J.Y. Kim and M.Y. Cho, “Development of a wireless
sensor network system for suspension bridge health monitoring”, Automation
in Construction, Vol. 21, pp. 237–252, 2012.
98. Dipanjan Bhattacharjee, Sourabh Kumar, Akash Kumar and Sushabhan
Choudhury, “Design and development of wireless sensor node”, International
Journal of Computer Science and Engineering, Vol. 02, No.7, pp. 2431-2438,
2010.
99. B. P. Ladgaonkar and A. M. Pawar, “Design and implementation of sensor node
for wireless sensors network to monitor humidity of high-tech poly house

References
183
environment”, International Journal of Advance in Engineering and
Technology, Vol.1, pp. 1-11, 2011.
100. ÁkosLédeczi, Thomas Hay, PéterVölgyesi, D. Robert Hay, AndrásNádas and
Subash Jayaraman, “Wireless acoustic emission sensor network for structural
monitoring”, IEEE Sensor Journal, Vol.9, No. 11, pp. 1370-1377, 2009.
101. Damian Sala, Jerzy Motylewski and Przemysław Kołakowski, “Wireless
transmission system for a railway bridge subject to structural health
monitoring”, Diagnostyka, Vol. 2, pp. 69-72, 2009.
102. Junmei Zhang, Yanyi Wang, Bowen Cheng and Shuai Wang, “Design of
acoustic emission data acquisition system of wood damage”, International
Journal of Control and Automation, Vol. 8, No. 9, pp. 291-302, 2015.
103. Christian U. Grosse, Steven D. Glaser and Markus Krüger, “Initial development
of wireless acoustic emission sensor motes for civil infrastructure state
monitoring”, Smart Structures and Systems, Vol. 6, No. 3, pp. 197-209, 2010.
104. Yin Wu, Wenbo Liu and Kaiyu Li, “A novel wireless acoustic emission sensor
system for distributed wooden structural health monitoring”, International
Journal of Innovative Computing, Information and Control, Vol. 13, No. 4, pp.
1289–1306, August 2017.
105. A. Carpinteri, G. Lacidogna, A. Manuello and G. Niccolini, “Acoustic emission
wireless transmission system for structural and infrastructural networks”, VIII
International Conference on Fracture Mechanics of Concrete and Concrete
Structures, FraMCoS-8, pp. 1-12, 2013.
References
184
106. Jerome P. Lynch and Kenneth J. Loh, “A summary review of wireless sensors
and sensor networks for structural health monitoring”, The Shock and Vibration
Digest, Vol. 38, No. 2, pp. 91–128, 2006.
107. Alex Doboli and Edward H. Currie, “An Overview of Mixed-Signal, Embedded
System Design”, Introduction to Mixed-Signal, Embedded Design, Springer,
New York, NY, pp. 1-49, 2011.
108. Nordin Aranzabal, Adrián Suárez, José Torres, Raimundo García‐Olcina, Julio
Martos, Jesús Soret, Abraham Menéndez and Pedro A. Martínez, “Design of
digital advanced systems based on programmable system on chip,” in Field-
Programmable Gate Array Technology, InTech, pp. 124–157, 2017.
109. Chun-Ming Huang, Chien-Ming Wu, Chih-Chyau Yang , Shih-Lun Chen, Chi-
Shi Chen, Jiann-Jenn Wang , Kuen-Jong Lee and Chin-Long Wey,
“Programmable system-on-chip for silicon prototyping”, in IEEE Transactions
on Industrial Electronics, Vol. 58 , pp. 830 – 838, May 2009.
110. Kester Walt, “Sensor signal conditioning”, S. Jon Wilson (Ed.), Sensor
Technology Handbook, Elsevier Inc., pp. 31–108, 2005.
111. W. Kester, J. Bryant, W. Jung, Wurcer Scott and Kitchin Chuck, Sensor signal
conditioning”, W. Jung (Ed.), Op Amp Applications Handbook J, Elsevier Inc.,
pp. 227–305, 2005.
112. B. Dobkin and Hamburger (Eds.), Signal Conditioning, Part 3 in Analog Circuit
Design, Circuit Note Collection, Elsevier Inc., Vol. 3, pp. 869–1054, 2015.

References
185
113. W. Gao, S. Emamineja, H. Y. Y. Nyein, S. Challa, K. Chen, A. Peck, H. M.
Fahad, H. Ota, H. Shiraki, D. Kiriya, D. H. Lien, G. A. Brooks, R. W. Davis and
A. Javey, “Fully integrated wearable sensor arrays for multiplexed in situ
perspiration analysis”, Nature, Vol. 529, pp. 509-514, 2016.
114. M. A. Carvajal, M. S. Martínez-García, D. Guirado, J. Banqueri and A. J. Palma,
“Dose verification system based on MOS transistor for real-time measurement”,
Sensors and Actuators A, Vol. 238, pp. 240–248, 2016.
115. Jose Pelegri Sebastia, Jorge Alberola Lluch and J. Rafael Lajara Vizcaino,
“Signal conditioning for GMR magnetic sensors applied to traffic speed
monitoring GMR sensors”, Sensors and Actuators A, Vol. 137, pp. 230–235,
2007.
116. Christian Falconia, Corrado Di Natalea, Arnaldo D’Amicoa and Marco Facciob,
“An electronic interface for theaccurate read-out of resistive sensors in low
voltage-low power integrated systems”, Sensors and Actuators A, Vol. 117
pp.121–126, 2005.
117. Naveen Kumar Vaegae, Venkata Lakshmi, Narayana Komanapalli and Srikanth
Malla, “Development of an intelligentpressure measuring technique for bellows
using radial basis function neural network” Sensors and Actuators A, Vol. 238,
pp. 240–248, 2016
118. Luis Armando Carvajal Ahumada, Nuria Peña Pérez, Oscar Leonardo Herrera
Sandoval, Franciscodel Pozo Guerrero and José Javier Serrano Olmedo, “A new

References
186
way to fine dielectric properties of liquidsample using the quartz crystal
resonator (QCR)”, Sensor and Actuators A, Vol. 239, pp. 153–160, 2016.
119. Ferran Reverter and Oscar Casas, “Direct interface circuit for capacitive
humidity sensors”, Sensor and Actuators A, Vol. 143, pp. 315-322, 2008.
120. An. Sang Hou and Susan Xiao-Ping Su, “Design of acapacitive-sensor signal
processing systemwith high accuracy and short conversion time”, Sensor and
Actuators A, Vol. 119, pp. 113–119, 2005.
121. K. Vairamani, N. Mathivanan, K. A. Venkatesh and U. D. Kumar,
“Environmental parameter monitoring using wireless sensor network”,
Instruments and Experimental Techniques, Vol. 56, pp. 468-471, 2013.
122. Gioacchino. Fertitta, Antonio Di. Stefano, Giuseppe. Fiscelli and Giuseppe C
Giaconia, “A low power and high-resolution data loggerfor submarine seismic
monitoring, Smart sensors and MEMS”, Microprocess. Microsyst. Vol. 34, pp.
63-72, 2010.
123. B. Baker, “Real analog solutions for digital designers”, Elsevier Science &
Technology, 2005.
124. B. Murmann, “Digitally assisted analog circuits” IEEE Micro, Vol. 26, pp. 38–
47, 2006.
125. R Frank, Understanding Smart Sensors, 2nd ed., Artech House, 2000.
126. Edward A. Lee, “What are the Key Challenges in Embedded Software? (Guest
Editorial)”, System Design Frontier, Volume 2, No. 1, 2005.
References
187
127. Giorgio Buttazzo, “Research trends in real-time computing for embedded
systems”, ACM Sigbed Review - Special issue on major international initiatives
on real-time and embedded systems, Vol. 3, pp. 1-10, 2006.
128. Philip Garcia, Katherine Compton, Michael Schulte, Emily Blem and Wenyin
Fu, “An Overview of Reconfigurable Hardware in Embedded Systems”, Eurasip
Journal on Embedded Systems, Vol. 2006, pp. 1-19, 2006.
129. Li Zhou, Tao Sun, Yuanzhi Zhan and Jia Wang, “Software and hardware
implementation of stereo matching”, International Journal of Signal Processing,
Image Processing and Pattern Recognition, Vol. 7, No. 4, pp. 37-55, 2014.
130. Rainer Leupers, “Code Optimization Techniques for Embedded Processors:
Methods, Algorithms and Tools” Springer US, Chapter 1, pp. 1-28, 2000.
131. D. Zivkov, I. Papp, D. Kurtjak, M. Grumic, M. Ivanovic, “Application engine
for resource-constrained embedded platforms” IEEE 1st International
Workshop on Consumer Electronics (CE WS), 2015,
doi:10.1109/cews.2015.7867153.
132. Thomas A. Intisar Ibrahim, Rosmah Ali, Mohamad Zulkefli and Nazar El Fadil,
“Embedded systems pedagogical issue: Teaching approaches, students
readiness, and design challenges”, American Journal of Embedded Systems and
Applications, Vol. 3, No. 1, pp. 1-10, 2015.
133. Thomas A. Henzinger and Joseph Sifakis, “The embedded systems design
challenge”, International Symposium on Formal Methods, Vol. 4085, pp. 1-15,
2006.

References
188
134. Sunil R. Das, Jun-Feng Li, Amiya R. Nayak, Mansour H. Assaf, Emil M. Petriu
and Satyendra N. Biswas, “Circuit architecture test verification based on
hardware software co-design with model sim”, IETE Journal of Research, Vol.
59, pp. 132-140, 2013.
135. Vilas V. Deotare, Dinesh V. Padole and S. Ashok. “Performance evaluation of
AES using hardware and software co-design”, International Journal on Recent
and Innovation Trends in Computing and Communication, Vol. 2, pp. 1638-
1643, 2014.
136. Hans Petter Halvorsen, “Data Acquisition in LabVIEW”, Telemark University
College Department of Electrical Engineering. Information Technology and
Cybernetics, 2016.
137. Prattana Lopin and Kyle V. Lopin, “PSoC-Stat: A single chip open source
potentiostat based on a Programmable System on a Chip” in PLOS ONE, Vol.
3, pp. 1-21, 2018. Available from: https://doi.org/10.1371/journal.pone.020135
138. Abhay Raj Kansal, “A study on programmable system on chip”, IOSR Journal
of VLSI and Signal Processing (IOSR-JVSP), Vol. 4, Issue 5, Ver. I, pp. 31-37,
2014.
139. PSoC Mixed Signal Array, Technical Reference Manual, Document No. PSoC
TRM 1.21, Cypress Semiconductor Corporation, 2005.
140. Carlos J. G. Aguilera, Cristiano P. Chenet and Tiago R. Balen, “Fault injection
on a mixed-signal programmable SOC with design diversity mitigation”, in
Journal of Integrated Circuits and System, Vol.11, pp. 185-191, 2016.

References
189
141. Fernando Manzano Rubio, M.Tech Thesis on Programmable-System-on-Chip
based data acquisition for educational purposes, Universitatpolitecnica De
Catalunya, Spain, 2012.
142. J. Guevara, A. Fatecha, E. Vargas and F. Barrero, “A reconfigurable WSN node
based on ISO/IEC/IEEE 21451 standard”, IEEE International Conference on
Instrumentation and Measurement Technology (I2MTC) Proceedings, pp. 873-
877, 2014.
143. Hyejung Kim, Sunyoung Kim, N. Van Helleputte, A. Artes, M. Konijnenburg,
J. Huisken, C. Van Hoof and R. F. Yazicioglu, “A configurable and low-power
mixed signal SoC for portable ECG monitoring applications, Biomedical
Circuits and Systems”, IEEE Transaction on Bio Medical Circuits and system,
Vol 8, pp. 257-267, 2014
144. J. J. Cabrera-Lopez and C. A. Romero-Beltran, “Auto-adjustable low-signal
processing technique based on programmable mixed-signal SoCs”, IEEE 9th
Ibero-American Congress on Sensors (Fiber Sensor), pp. 1- 4, 2014.
145. Arturo Fatecha, Jean Guevara and Enrique A. Vargas Cabral, “Reconfigurable
architecture for smart sensor node based on IEEE 1451 standard”, IEEE
Sensors, Vol. 1, pp. 1- 4, 2013.
146. Vallen Systeme GmbH, “Acoustic Emission Sensors Specification”, 2015.
Available from: http://www.vallen.de/zdownload/pdf/sov1507.pdf.

References
190
147. Perry Miller and Richard Cesari, “Op Amp for everyone”, Wireless
Communication: Signal Conditioning for IF Sampling, 3rd Ed., Chapter 16,
Pages 271-293, 2009.
148. Analog Devices, Data sheet, available from:
http://www.analog.com/media/en/technicaldocumentation/datasheets/AD8628
_8629_8630.pdf.
149. Analog Devices, Data sheet, available from:
http://www.analog.com/media/en/technical-
documentation/datasheets/AD8369.pdf.
150. Randy White, “Blocking out the noise means selecting the right filter”,
Electronic Design, 2009. Available
from:https://www.electronicdesign.com/displays/blocking-out-noise-
meansselecting-right-filter.
151. Janet Heath, “Basics of bandpass filters” Analogictips, May 2017. available
from: https://www.analogictips.com/basics-of-bandpass-filters/
152. Markus G. R. Sause, “Investigation of pencil-lead breaks as acoustic emission
sources”, Journal of Acoustic Emission, vol. 29, pp. 29-184, 2011.
153. H. M. Ledbetter, “Sound velocities and elastic constants of steels 304, 310, and
316”, Journal of Metal Science, Vol. 14, pp. 595-596, 1980.
154. Francisco Sagasta, Yoshihiro Mizutani, Ignacio Valverde, Elisabet Suarez,
Francisco J. Rescalvo and Antolino Gallego, “Influence of attenuation on the
acoustic emission b-value for damage evaluation of reinforced concrete

References
191
specimens”, 32nd European Conference on Acoustic Emission Testing Prague,
Czech Republic, pp. 433-440, September 07-09, 2016.
155. B. K. Sharma, Amod Kumar and V. M. Murthy, “Evaluation of seismic events
detection algorithms”, Journal of the Geological Society of India, Vol. 75, pp.
533-538, March 2010.
156. Tony R. Kuphaldt, “Lessons in electric circuits”, Sixth Edition, pp. 16-17, 2007.
Available from: https://www.ibiblio.org/kuphaldt/electricCircuits/AC/AC.pdf.
157. Steve Arar, “Understanding the dynamic range specification of an ADC”, All
about circuit, Technical Article, June 2018.
158. Anders Brandt and Kjell Ahlin, “Sampling and time-domain analysis”, Sound
& Vibration, pp. 13-16, May 2010. Available at:
http://www.sandv.com/downloads/1005bran.pdf.
159. Shilpa Patil, Bilavari Karkare and Shweta Goyal, “Acoustic emission vis-Ã-vis
electrochemical techniques for corrosion monitoring of reinforced concrete
element”, Construction and Building Materials, Vol. 68, pp.326–332, 2014.

References
192