Deposition of Highly Ordered CF 2 Rich Films Using Continuous Wave and Pulsed Hexafluoropropylene...
11
Deposition of Highly Ordered CF 2 -Rich Films Using Continuous Wave and Pulsed Hexafluoropropylene Oxide Plasmas Carmen I. Butoi, Neil M. Mackie, Lara J. Gamble, ² David G. Castner, ² Jeffrey Barnd, Anne M. Miller, and Ellen R. Fisher* Department of Chemistry, Colorado State University, Fort Collins, Colorado 80523-1872 Received March 20, 2000. Revised Manuscript Received May 15, 2000 The structure and composition of fluorocarbon materials deposited in pulsed and continuous wave (CW) hexafluoropropylene oxide (HFPO) plasmas were investigated. Results indicate substantial dependence on substrate position relative to the rf coil. When the substrate was placed 8 cm downstream from the rf coil (25 W CW), highly amorphous, cross-linked films were obtained. In contrast, materials deposited 28 cm downstream from the rf coil contained less cross-linked moieties and a higher degree of order. Angle-resolved X-ray photoelectron spectroscopy (XPS) C 1s analysis showed that the 28 cm materials contain up to ∼80% CF 2 and CF 3 surface-enriched layers. Static secondary ion mass spectroscopy (SIMS) data revealed that these fluorocarbon materials are composed of long CF 2 chains. Near edge X-ray absorption fine structure (NEXAFS) analysis showed that the CF 2 chains were oriented perpendicular to the substrate surface for the films deposited at 28 cm downstream, while the films obtained 8 cm downstream do not exhibit any particular orientation. The compositions of materials deposited in pulsed HFPO systems have rf power and distance dependencies similar to those observed in the CW plasmas. I. Introduction Over the past 20 years, pulsed rf plasmas have been successfully employed in plasma polymerization of a variety of monomers. 1,2,3 With pulsed plasma polymer- ization, high retention of the monomer functional group in the resulting polymeric film can be achieved. 4 In addition, pulsed plasmas provide access to lower con- tinuous wave (CW) equivalent powers because the rf power is on for only a portion of the cycle time. Use of pulsed sources reduces trapped radicals in the film, lowers deposition surface temperatures, decreases high- energy ion bombardment and UV flux to the surface, and provides greater control over the resulting film chemistry. 5 In contrast, films deposited from CW plas- mas are often amorphous polymeric materials with little resemblance to the original monomer. 6,7 This is partially because CW plasmas can significantly fragment and scramble monomer functional groups through complex recombination and addition reactions. 8 However, ma- terials generated at very low CW powers have been shown to retain some monomer functionalities. 9 Alter- natively, we have previously reported the use of pulsed rf plasmas to produce a variety of hydrogenated and fluorinated organic films with a high degree of control- lability over film composition. 4 Alternatives to pulsed plasma film deposition are provided by plasma-enhanced chemical vapor deposition (PECVD) using downstream and remote CW plasmas, which also decrease energetic species bombardment of the deposited material. Again, this eliminates undesired effects usually associated with the use of CW plasmas and can produce films with unique properties. 10,11,12 Fluorocarbon materials deposited in this manner have been shown to possess low dielectric constants 13 and increased biocompatibility. 14,15 O’Kane and Rice re- ported pronounced composition differences between films generated at different distances from the rf glow ² Department of Bioengineering and Chemical Engineering, Uni- versity of Washington, Box 1750, Seattle, WA 98195-1750. (1) Yasuda, H.; Hsu, T. J. Polym. Sci., Polym. Chem. Ed. 1977, 15, 81-87. (2) Rinsch, C. L.; Chen, X.; Panchalingam, V.; Eberhart, R. C.; Wang, J. H.; Timmons, R. B. Langmuir 1996, 12, 2995. (3) Savage, C. R.; Timmons, R. B.; Lin, J. W. In Structure-Property Relations in Polymers; Advances in Chemistry Series 236; American Chemical Society: Washington, DC, 1993; p 745. (4) Mackie, N. M.; Castner, D. G.; Fisher, E. R. Langmuir 1998, 14, 1227-1235. Mackie, N. M.; Fisher, E. R. Polym. Prepr. 1997, 38, 1059. Leich, M. A.; Mackie, N. M.; Williams, K. L.; Fisher, E. R. Macromolecules 1998, 31, 7618-7626. Lefohn, A. E.; Mackie, N. M.; Fisher, E. R. Plasmas Polym. 1998, 4, 197. (5) Panchalingam, V.; Chen, X.; Savage, C. R.; Timmons, R. B.; Eberhart, R. C. J. Appl. Polym. Sci., Polym. Symp. 1994, 54, 123. (6) Yasuda, H. Plasma Polymerization; Academic Press: Orlando, FL, 1985. (7) Mackie, N. M.; Dalleska, N. F.; Castner, D. G.; Fisher, E. R. Chem. Mater. 1997, 9, 349. (8) Plasma Deposition, Treatment and Etching of Polymers; d′Agostino, R., Ed.; Academic Press: Boston, 1990. (9) Alexander, M. R.; Duc, T. M. J. Mater. Chem. 1998, 8, 937. (10) Castner, D. G. In Plasma Processing of Polymers;d′Agostino, R., Favia, P., Fracassi, F., Eds.; Kluwer Academic Publishers: Dor- drecht, The Netherlands, 1997; pp 221-230. (11) O′Kane, D. F.; Rice, D. W. J. Macromol. Sci. Chem. A 1976, 10, 567. (12) Yasuda, H. J. Polym. Sci. Macromol. Rev. 1981, 16, 199. (13) Singer, P. Semicond. Int. 1996, May, 88-96. (14) Bohnert, J. L.; Fowler, B. C.; Horbett, T. A.; Hoffman, A. S. J. Biomater. Sci., Polym. Ed. 1990, 1, 279. (15) Kiaei, D.; Hoffman, A. S.; Horbett, T. A. J. Biomater. Sci., Polym. Ed. 1992, 4, 35. 2014 Chem. Mater. 2000, 12, 2014-2024 10.1021/cm0002416 CCC: $19.00 © 2000 American Chemical Society Published on Web 06/16/2000
Transcript of Deposition of Highly Ordered CF 2 Rich Films Using Continuous Wave and Pulsed Hexafluoropropylene...
Deposition of Highly Ordered CF2-Rich Films UsingContinuous Wave and Pulsed Hexafluoropropylene
Oxide Plasmas
Carmen I. Butoi, Neil M. Mackie, Lara J. Gamble,† David G. Castner,†Jeffrey Barnd, Anne M. Miller, and Ellen R. Fisher*
Department of Chemistry, Colorado State University, Fort Collins, Colorado 80523-1872
Received March 20, 2000. Revised Manuscript Received May 15, 2000
The structure and composition of fluorocarbon materials deposited in pulsed and continuouswave (CW) hexafluoropropylene oxide (HFPO) plasmas were investigated. Results indicatesubstantial dependence on substrate position relative to the rf coil. When the substrate wasplaced 8 cm downstream from the rf coil (25 W CW), highly amorphous, cross-linked filmswere obtained. In contrast, materials deposited 28 cm downstream from the rf coil containedless cross-linked moieties and a higher degree of order. Angle-resolved X-ray photoelectronspectroscopy (XPS) C1s analysis showed that the 28 cm materials contain up to ∼80% CF2and CF3 surface-enriched layers. Static secondary ion mass spectroscopy (SIMS) data revealedthat these fluorocarbon materials are composed of long CF2 chains. Near edge X-rayabsorption fine structure (NEXAFS) analysis showed that the CF2 chains were orientedperpendicular to the substrate surface for the films deposited at 28 cm downstream, whilethe films obtained 8 cm downstream do not exhibit any particular orientation. Thecompositions of materials deposited in pulsed HFPO systems have rf power and distancedependencies similar to those observed in the CW plasmas.
I. Introduction
Over the past 20 years, pulsed rf plasmas have beensuccessfully employed in plasma polymerization of avariety of monomers.1,2,3 With pulsed plasma polymer-ization, high retention of the monomer functional groupin the resulting polymeric film can be achieved.4 Inaddition, pulsed plasmas provide access to lower con-tinuous wave (CW) equivalent powers because the rfpower is on for only a portion of the cycle time. Use ofpulsed sources reduces trapped radicals in the film,lowers deposition surface temperatures, decreases high-energy ion bombardment and UV flux to the surface,and provides greater control over the resulting filmchemistry.5 In contrast, films deposited from CW plas-mas are often amorphous polymeric materials with littleresemblance to the original monomer.6,7 This is partially
because CW plasmas can significantly fragment andscramble monomer functional groups through complexrecombination and addition reactions.8 However, ma-terials generated at very low CW powers have beenshown to retain some monomer functionalities.9 Alter-natively, we have previously reported the use of pulsedrf plasmas to produce a variety of hydrogenated andfluorinated organic films with a high degree of control-lability over film composition.4
Alternatives to pulsed plasma film deposition areprovided by plasma-enhanced chemical vapor deposition(PECVD) using downstream and remote CW plasmas,which also decrease energetic species bombardment ofthe deposited material. Again, this eliminates undesiredeffects usually associated with the use of CW plasmasand can produce films with unique properties.10,11,12
Fluorocarbon materials deposited in this manner havebeen shown to possess low dielectric constants13 andincreased biocompatibility.14,15 O’Kane and Rice re-ported pronounced composition differences betweenfilms generated at different distances from the rf glow
† Department of Bioengineering and Chemical Engineering, Uni-versity of Washington, Box 1750, Seattle, WA 98195-1750.
(1) Yasuda, H.; Hsu, T. J. Polym. Sci., Polym. Chem. Ed. 1977, 15,81-87.
(2) Rinsch, C. L.; Chen, X.; Panchalingam, V.; Eberhart, R. C.;Wang, J. H.; Timmons, R. B. Langmuir 1996, 12, 2995.
(3) Savage, C. R.; Timmons, R. B.; Lin, J. W. In Structure-PropertyRelations in Polymers; Advances in Chemistry Series 236; AmericanChemical Society: Washington, DC, 1993; p 745.
(4) Mackie, N. M.; Castner, D. G.; Fisher, E. R. Langmuir 1998,14, 1227-1235. Mackie, N. M.; Fisher, E. R. Polym. Prepr. 1997, 38,1059. Leich, M. A.; Mackie, N. M.; Williams, K. L.; Fisher, E. R.Macromolecules 1998, 31, 7618-7626. Lefohn, A. E.; Mackie, N. M.;Fisher, E. R. Plasmas Polym. 1998, 4, 197.
(5) Panchalingam, V.; Chen, X.; Savage, C. R.; Timmons, R. B.;Eberhart, R. C. J. Appl. Polym. Sci., Polym. Symp. 1994, 54, 123.
(6) Yasuda, H. Plasma Polymerization; Academic Press: Orlando,FL, 1985.
(7) Mackie, N. M.; Dalleska, N. F.; Castner, D. G.; Fisher, E. R.Chem. Mater. 1997, 9, 349.
(8) Plasma Deposition, Treatment and Etching of Polymers;d′Agostino, R., Ed.; Academic Press: Boston, 1990.
(9) Alexander, M. R.; Duc, T. M. J. Mater. Chem. 1998, 8, 937.(10) Castner, D. G. In Plasma Processing of Polymers; d′Agostino,
R., Favia, P., Fracassi, F., Eds.; Kluwer Academic Publishers: Dor-drecht, The Netherlands, 1997; pp 221-230.
(11) O′Kane, D. F.; Rice, D. W. J. Macromol. Sci. Chem. A 1976,10, 567.
(12) Yasuda, H. J. Polym. Sci. Macromol. Rev. 1981, 16, 199.(13) Singer, P. Semicond. Int. 1996, May, 88-96.(14) Bohnert, J. L.; Fowler, B. C.; Horbett, T. A.; Hoffman, A. S. J.
Biomater. Sci., Polym. Ed. 1990, 1, 279.(15) Kiaei, D.; Hoffman, A. S.; Horbett, T. A. J. Biomater. Sci.,
Polym. Ed. 1992, 4, 35.
2014 Chem. Mater. 2000, 12, 2014-2024
10.1021/cm0002416 CCC: $19.00 © 2000 American Chemical SocietyPublished on Web 06/16/2000
of a tetrafluoroethylene (TFE) plasma.10 Fluoropolymersdeposited at the longest distances contained the highestpercentage of CF2 and <5% CF3. Castner and co-workers found that depositions performed downstreamfrom the discharge glow in a TFE plasma producedhighly ordered materials with high CF2 content.16
Along with TFE plasmas, other fluorocarbon systemshave been utilized for the deposition of polymeric filmswith low dielectric constants as well as for producingbiocompatible materials.17,18,19 One monomer that hasbeen used extensively in pulsed plasma polymerizationwork is hexafluoropropylene oxide (HFPO). Timmonsand co-workers deposited films in HFPO plasmas underpulsed conditions but observed no film formation at 300W under CW conditions.20 Gleason and co-workers alsofound that the use of pulsed HFPO plasmas (0.5% dutycycle, 280 W) results in high CF2 content fluoropoly-mers. In contrast to Timmons’ results, Gleason’s groupdid observe film formation under CW conditions (120W), but these films were highly cross-linked, unlikethose obtained in the pulsed plasma system.21 NeitherTimmons’ nor Gleason’s studies probed film orientationwith respect to the substrate surface.
An earlier communication from our laboratory pre-sented limited results for films deposited in CW HFPOplasmas.22 The present work aims to provide a morecomprehensive perspective into the nature of filmsdeposited in HFPO plasmas under CW as well as pulsedconditions. To identify the best conditions for thedeposition of highly ordered, CF2-rich materials, plasmaparameters were varied along with distance from thedischarge visible glow for both CW and pulsed systems.Film composition was investigated with Fourier trans-form infrared (FTIR) spectroscopy, angle-resolved X-rayphotoelectron spectroscopy (XPS), and static secondaryion mass spectrometry (SIMS), while near-edge X-rayabsorption fine structure (NEXAFS) analysis was usedto determine structural attributes. We have also deter-mined film deposition rates under different plasmaconditions and tested the mechanical stress propertiesof fluoropolymers deposited on Cu wires.
II. Experimental Methods
All films were deposited in our home-built inductivelycoupled rf plasma reactor, described in detail previously.7,23
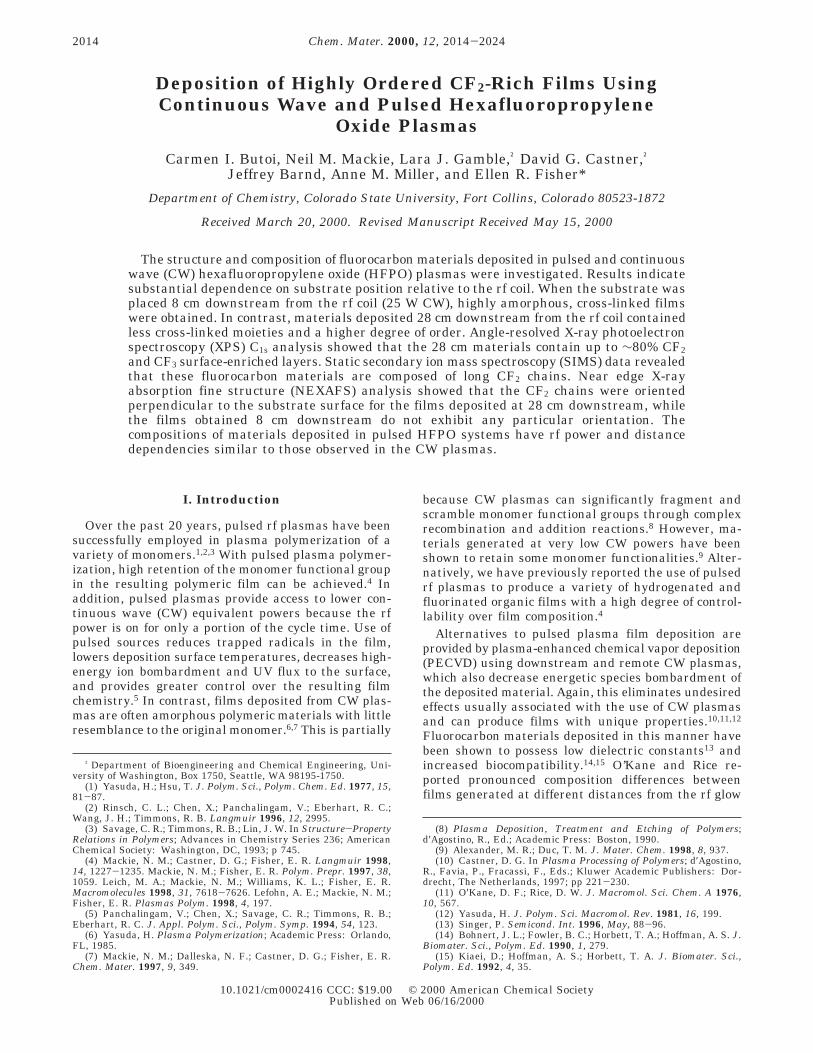
For the present work, the reactor was modified by extendingone glass tube section to allow for downstream depositions(Figure 1). Input power for CW depositions was varied from 5to 120 W, and the applied peak power was kept constant at300 W for pulsed experiments. In the latter case, the equiva-lent CW power can be determined by calculating the timeaveraged power applied over the entire pulse cycle. A 10/190ms pulse sequence, where the plasma is on for 10 ms and offfor 190 ms, corresponds to an equivalent CW power of 15 Wand a duty cycle of 5%. The pulse duty cycle (defined as the
ratio of pulse on time to the total cycle time) was varied usingthe internal pulse generator of an RF Power Products powersupply. For each deposition, a freshly pressed FTIR grade KBr(Aldrich) pellet and a silicon wafer (p-type, 110) with 40-60Å of native oxide were used as substrates. These were placedon glass microscope slides oriented parallel to the gas flowwithin the coil region (position A, Figure 1) as well as at 8and 28 cm downstream (positions B and C, respectively, inFigure 1). CW and pulsed deposition times ranged from 30min to 2 h. For pulsed experiments, deposition time wasdefined by the total time the sample was exposed to both pulseon and off cycles.
Transmission FTIR spectral analysis on films deposited onKBr pellets and Si wafers was performed ex situ using aNicolet Magna 760 FTIR spectrometer (resolution of 8 cm-1
and averaging 128 scans). Spectra shown are corrected forresidual carbon dioxide not purged from the FTIR spectrometer(absorbances at ∼2340 and 2360 cm-1).
XPS analyses were performed on a Surface Science Instru-ments S-probe spectrometer located at the University ofWashington NESAC-BIO center. This system has a mono-chromatic Al KR X-ray source (hν ) 1486.6 eV), a hemispheri-cal analyzer, and a resistive strip multichannel detector. A low-energy (∼5 eV) electron gun was used for charge neutralizationon the nonconducting samples. The binding energy (BE) scalesfor the samples were referenced by setting the CF2 peakmaxima in the C1s spectra to 292.0 eV. High-resolution C1s
spectra were acquired at an analyzer pass energy of 50 eV andan X-ray spot size of 1000 µm and were fit using Gaussianfunctions with fwhm of 1.3-1.5 eV. XPS elemental composi-tions were obtained using a pass energy of 150 eV. Photoelec-tron takeoff angles of 0, 55, and 80° were used; the takeoffangle is defined as the angle between the axis of the analyzerlens and the surface normal.
NEXAFS analysis was performed at the National Synchro-tron Light Source at Brookhaven National Laboratory onbeamline U7A. The 600 lines/mm grating monochromator wascalibrated using the graphite C1s f π* transition (285.35 eV)and had an energy resolution of ∼0.15 eV (fwhm) at the carbonK edge. Photoelectrons and Auger electrons were collected witha negatively biased channeltron to obtain partial electron yield(PEY) spectra. These spectra were normalized by using thePEY from a 90% transmission grid which was gold coated insitu and positioned in the incoming X-ray beam. The incidenceangle is defined as the angle between the incident X-ray beamand the sample surface. Data were obtained at differentincidence angles by rotating the sample with respect to theX-ray beam.
All time-of-flight SIMS (ToF-SIMS) spectra were acquiredon a Physical Electronics PHI 7200 ToF-SIMS spectrometer.The instrument is equipped with a Cs+ ion source operated at
(16) Castner, D. G.; Lewis, K. B.; Fischer, D. A.; Ratner, B. D.;Gland, J. L. Langmuir 1993, 9, 537-542.
(17) Endo, K.; Tatsumi, T. Appl. Phys. Lett. 1996, 68, 2864.(18) Lee, W. W.; Ho, P. S. MRS Bull. 1997, 22, 19.(19) Hoffman, A. S. J. Appl. Polym. Sci.; Appl. Polym. Symp. 1988,
42, 251.(20) Savage, C. R.; Timmons, R. B. Chem. Mater. 1991, 3, 575.(21) Limb, S. J.; Edell, D. J.; Gleason, E. F.; Gleason, K. K. J. Appl.
Polym. Sci. 1998, 67, 1489.(22) Butoi, C. I.; Mackie, N. M.; Barnd, J. E.; Fisher, E. R.; Gamble,
L. J.; Castner, D. G. Chem. Mater. 1999, 11, 862.(23) Bogart, K. H. A.; Dalleska, N. F.; Bogart, G.; Fisher, E. R. J.
Vac. Sci. Technol. A 1995, 13, 476.
Figure 1. Schematic diagram of the inductively coupled rfplasma reactor used for all depositions. The HFPO flow iscontrolled by a mass-flow controller (MFC). Substrates placedat position A are within the visible glow. Positions B and Ccorrespond to substrate positions 8 and 28 cm downstreamfrom the rf coil, respectively.
Deposition of Highly Ordered CF2-Rich Films Chem. Mater., Vol. 12, No. 7, 2000 2015
8 keV, a reflectron mass analyzer, and chevron-type multi-channel plate detectors. For acquisition of spectra, a bunchedprimary Cs+ beam (50 µm diameter, approximately 1 ns pulsewidth) is used, and the bin width of the time-to-digitalconverter (TDC) is set at 1.25 ns, resulting in mass resolutions(m/∆m) of >8000 at m/z ) 27 for electrically conductingsamples. The beam is rastered over a square area that is 100µm on a side. Data acquisition times were adjusted to ensurethat the spectra were taken in static mode, that is, that thetotal ion dose was <2 × 10¹² ions/cm2 during the acquisition.
Static contact angles for water were measured using thesessile drop method with a contact angle goniometer (RameHart Model 100). Measurements were taken on both sides ofwater drops at ambient temperature, 30-40 s after 1 µL dropswere applied to the surface and the needle tip was removedfrom each drop. For each sample, four drops were placed atdifferent locations on the surface of the film. Each reportedcontact angle is an average of these measurements for threesamples.
To investigate the morphology of the fluorocarbon materialsdeposited in HFPO plasmas, scanning electron microscope(SEM) images were obtained using a Philips 505 apparatus.The accelerating voltage was 26.0 kV, and the spot size was20 nm. For more detailed morphological information, an atomicforce microscope was utilized in tapping mode. The DigitalInstruments Nanoscope III apparatus was used to measureroot-mean-square (rms) surface roughness values on 5 × 5 µm2
sample areas. Deposition rates were calculated using atomicforce microscopy (AFM), ellipsometry, and profilometry analy-sis. For films with thickness > 500 Å, deposition rates werecalculated on the basis of step height measurements with aTencor Alpha Step 100 profilometer. Variable-angle spectro-scopic ellipsometry (J. A. Woollam Company Inc., model HS190) and AFM analysis were used to determine depositionrates for films thinner than 500 Å.
III. Results
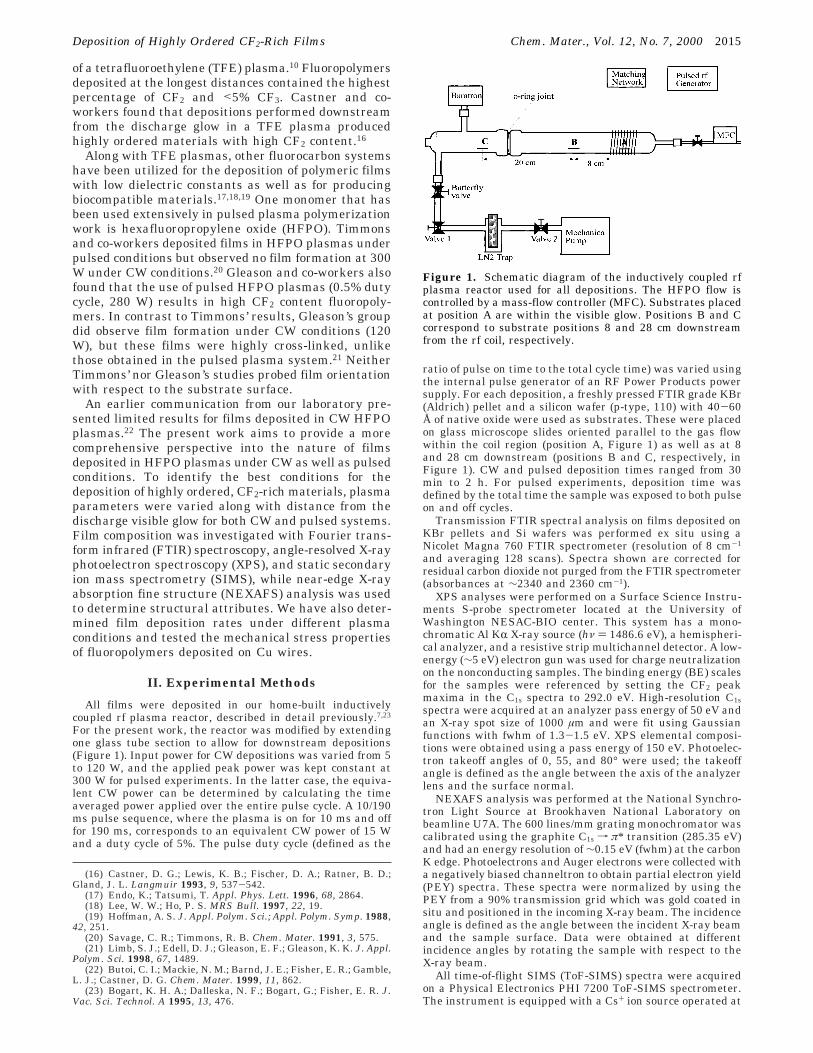
A. FTIR Spectroscopy. Figure 2 shows FTIR spec-tra of films deposited at 8 cm (position B) and 28 cm(position C) downstream from the rf coil, using rf powersof 15, 30, and 60 W in a CW HFPO plasma. Formaterials deposited at position B at low rf powers (15and 30 W), the spectra contain absorbance bandsassociated with amorphous plasma-polymerized fluoro-carbon materials (Figure 2a). The most prominentfeature in both spectra is the absorbance band at 1100-1400 cm-1, attributable to all CFx (x ) 1-3) stretchingmodes.24 The weaker absorbance band at 1700-1850cm-1 corresponds to either CdCF2 or CFdCF2 moietiesin the film.23 In contrast, the film obtained from a 60W CW plasma shows a feature corresponding to SiOstretching at ∼1100 cm-1, but very little CF2 signal. TheSiO band results from etching of the glass reactor wallsfollowed by redeposition of the etched material on theKBr substrate.7 This constitutes strong evidence thatetching is the predominant plasma process at high rfpowers.
Figure 2b shows FTIR spectra of films deposited atposition C with applied rf powers of 15, 30, and 60 W.The spectra of materials obtained in 15 and 30 W CWplasmas are different from those shown in Figure 2a.Two distinct absorption bands at 1217 and 1165 cm-1,corresponding to the CF2 asymmetric and symmetricmodes, respectively, are observed.25 In addition, the
intensity of the CFx)CF2 (x ) 0, 1) stretch at ∼1700-1800 cm-1 is considerably lower in these films comparedto what was observed in the films deposited at positionB (Figure 2a). Along with the separation of CF2 asym-metric and symmetric stretch bands, this indicates alower degree of cross-linking than that of the fluorocar-bon materials deposited at position B. In contrast, theFTIR spectrum of the 60 W film contains a broadabsorption band at ∼1200 cm-1, consistent with arelatively amorphous fluorocarbon film.
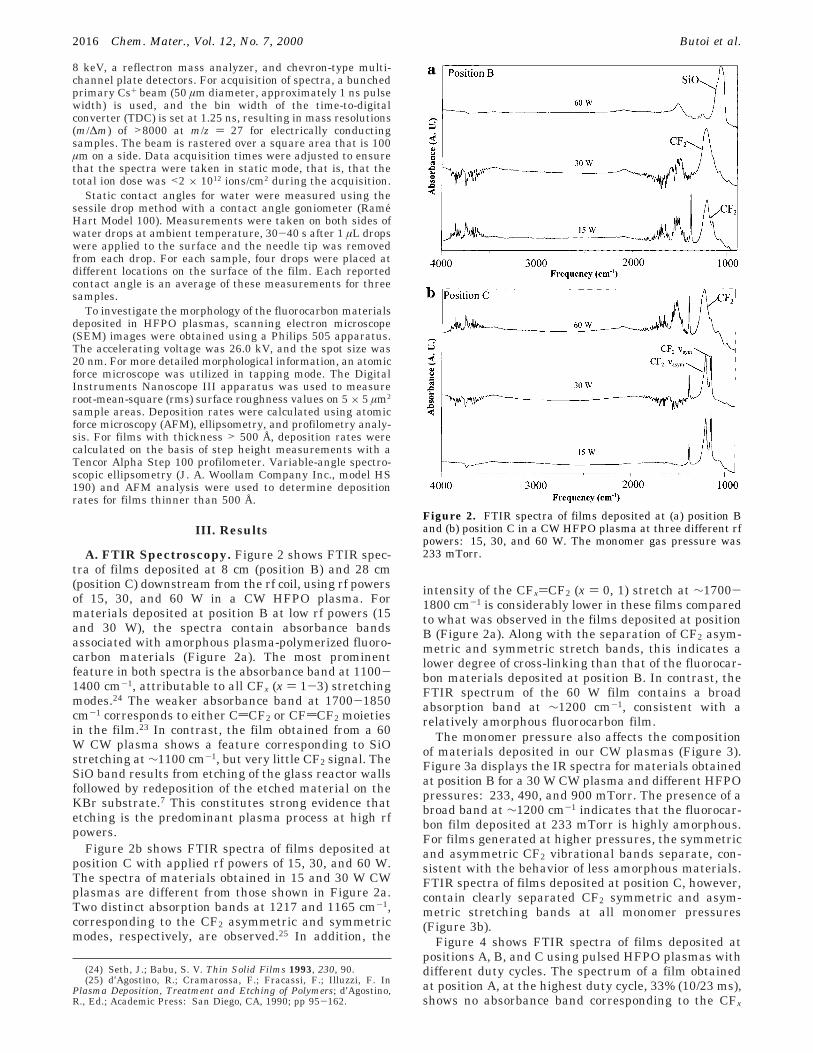
The monomer pressure also affects the compositionof materials deposited in our CW plasmas (Figure 3).Figure 3a displays the IR spectra for materials obtainedat position B for a 30 W CW plasma and different HFPOpressures: 233, 490, and 900 mTorr. The presence of abroad band at ∼1200 cm-1 indicates that the fluorocar-bon film deposited at 233 mTorr is highly amorphous.For films generated at higher pressures, the symmetricand asymmetric CF2 vibrational bands separate, con-sistent with the behavior of less amorphous materials.FTIR spectra of films deposited at position C, however,contain clearly separated CF2 symmetric and asym-metric stretching bands at all monomer pressures(Figure 3b).
Figure 4 shows FTIR spectra of films deposited atpositions A, B, and C using pulsed HFPO plasmas withdifferent duty cycles. The spectrum of a film obtainedat position A, at the highest duty cycle, 33% (10/23 ms),shows no absorbance band corresponding to the CFx
(24) Seth, J.; Babu, S. V. Thin Solid Films 1993, 230, 90.(25) d′Agostino, R.; Cramarossa, F.; Fracassi, F.; Illuzzi, F. In
Plasma Deposition, Treatment and Etching of Polymers; d′Agostino,R., Ed.; Academic Press: San Diego, CA, 1990; pp 95-162.
Figure 2. FTIR spectra of films deposited at (a) position Band (b) position C in a CW HFPO plasma at three different rfpowers: 15, 30, and 60 W. The monomer gas pressure was233 mTorr.
2016 Chem. Mater., Vol. 12, No. 7, 2000 Butoi et al.
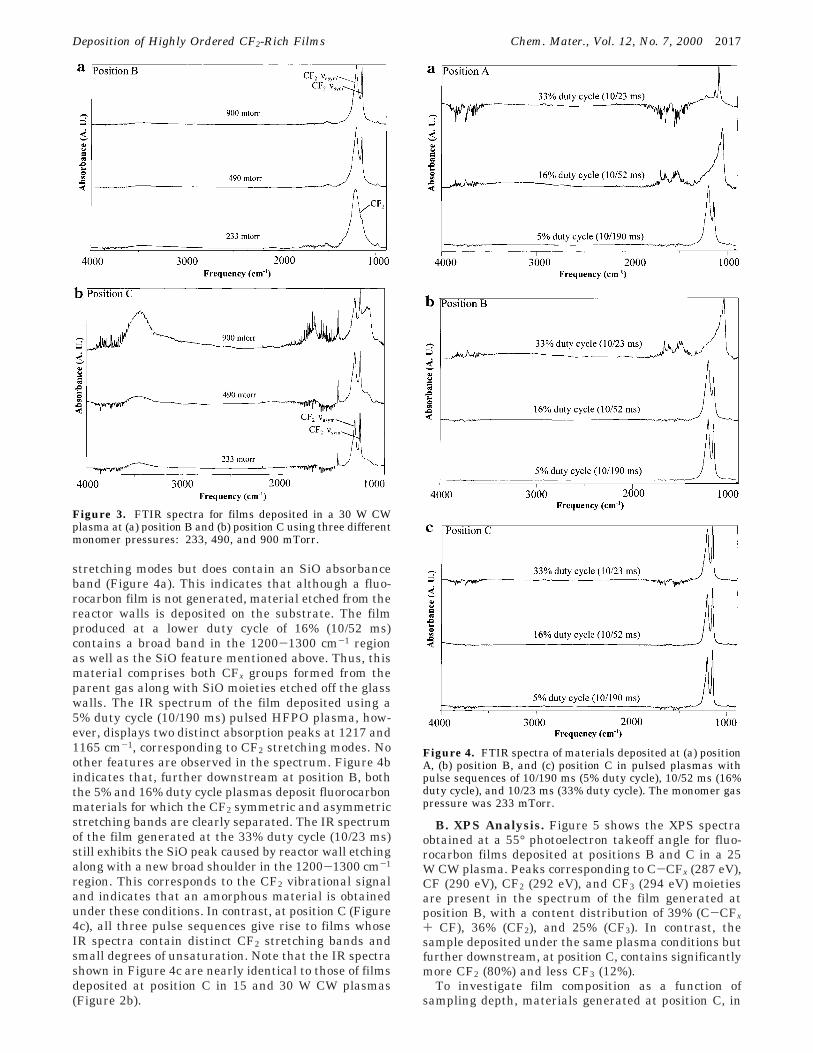
stretching modes but does contain an SiO absorbanceband (Figure 4a). This indicates that although a fluo-rocarbon film is not generated, material etched from thereactor walls is deposited on the substrate. The filmproduced at a lower duty cycle of 16% (10/52 ms)contains a broad band in the 1200-1300 cm-1 regionas well as the SiO feature mentioned above. Thus, thismaterial comprises both CFx groups formed from theparent gas along with SiO moieties etched off the glasswalls. The IR spectrum of the film deposited using a5% duty cycle (10/190 ms) pulsed HFPO plasma, how-ever, displays two distinct absorption peaks at 1217 and1165 cm-1, corresponding to CF2 stretching modes. Noother features are observed in the spectrum. Figure 4bindicates that, further downstream at position B, boththe 5% and 16% duty cycle plasmas deposit fluorocarbonmaterials for which the CF2 symmetric and asymmetricstretching bands are clearly separated. The IR spectrumof the film generated at the 33% duty cycle (10/23 ms)still exhibits the SiO peak caused by reactor wall etchingalong with a new broad shoulder in the 1200-1300 cm-1
region. This corresponds to the CF2 vibrational signaland indicates that an amorphous material is obtainedunder these conditions. In contrast, at position C (Figure4c), all three pulse sequences give rise to films whoseIR spectra contain distinct CF2 stretching bands andsmall degrees of unsaturation. Note that the IR spectrashown in Figure 4c are nearly identical to those of filmsdeposited at position C in 15 and 30 W CW plasmas(Figure 2b).
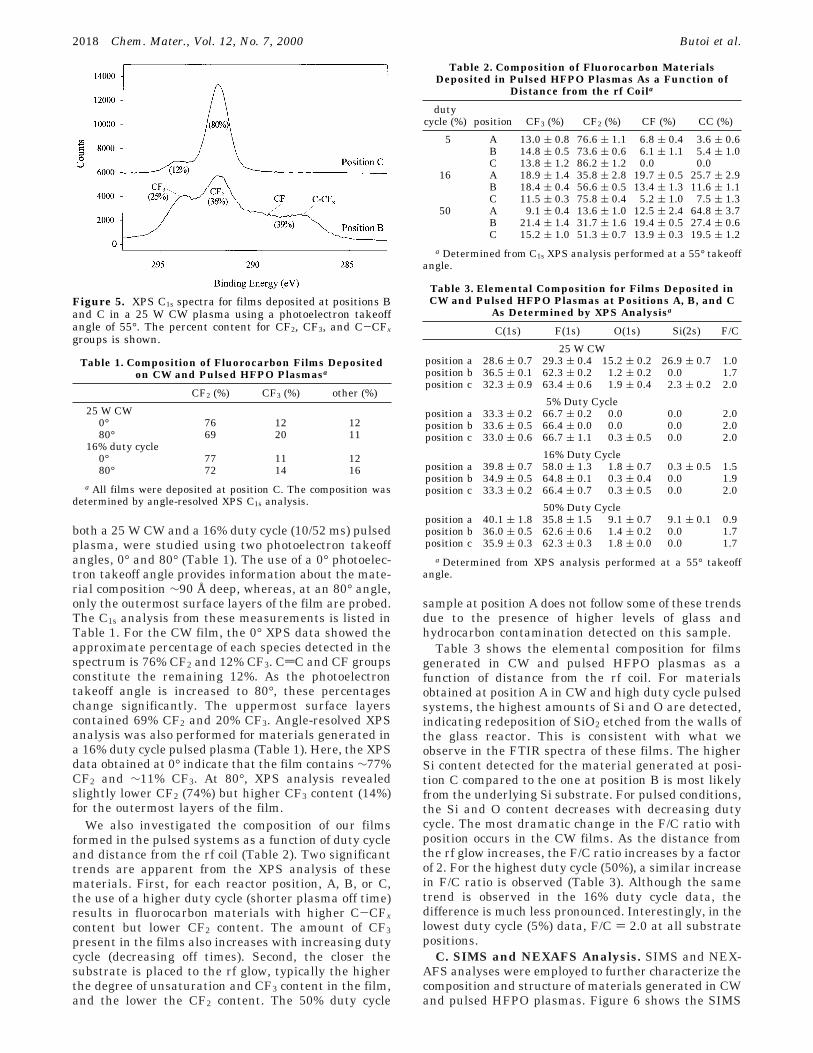
B. XPS Analysis. Figure 5 shows the XPS spectraobtained at a 55° photoelectron takeoff angle for fluo-rocarbon films deposited at positions B and C in a 25W CW plasma. Peaks corresponding to C-CFx (287 eV),CF (290 eV), CF2 (292 eV), and CF3 (294 eV) moietiesare present in the spectrum of the film generated atposition B, with a content distribution of 39% (C-CFx+ CF), 36% (CF2), and 25% (CF3). In contrast, thesample deposited under the same plasma conditions butfurther downstream, at position C, contains significantlymore CF2 (80%) and less CF3 (12%).
To investigate film composition as a function ofsampling depth, materials generated at position C, in
Figure 3. FTIR spectra for films deposited in a 30 W CWplasma at (a) position B and (b) position C using three differentmonomer pressures: 233, 490, and 900 mTorr.
Figure 4. FTIR spectra of materials deposited at (a) positionA, (b) position B, and (c) position C in pulsed plasmas withpulse sequences of 10/190 ms (5% duty cycle), 10/52 ms (16%duty cycle), and 10/23 ms (33% duty cycle). The monomer gaspressure was 233 mTorr.
Deposition of Highly Ordered CF2-Rich Films Chem. Mater., Vol. 12, No. 7, 2000 2017
both a 25 W CW and a 16% duty cycle (10/52 ms) pulsedplasma, were studied using two photoelectron takeoffangles, 0° and 80° (Table 1). The use of a 0° photoelec-tron takeoff angle provides information about the mate-rial composition ∼90 Å deep, whereas, at an 80° angle,only the outermost surface layers of the film are probed.The C1s analysis from these measurements is listed inTable 1. For the CW film, the 0° XPS data showed theapproximate percentage of each species detected in thespectrum is 76% CF2 and 12% CF3. CdC and CF groupsconstitute the remaining 12%. As the photoelectrontakeoff angle is increased to 80°, these percentageschange significantly. The uppermost surface layerscontained 69% CF2 and 20% CF3. Angle-resolved XPSanalysis was also performed for materials generated ina 16% duty cycle pulsed plasma (Table 1). Here, the XPSdata obtained at 0° indicate that the film contains ∼77%CF2 and ∼11% CF3. At 80°, XPS analysis revealedslightly lower CF2 (74%) but higher CF3 content (14%)for the outermost layers of the film.
We also investigated the composition of our filmsformed in the pulsed systems as a function of duty cycleand distance from the rf coil (Table 2). Two significanttrends are apparent from the XPS analysis of thesematerials. First, for each reactor position, A, B, or C,the use of a higher duty cycle (shorter plasma off time)results in fluorocarbon materials with higher C-CFxcontent but lower CF2 content. The amount of CF3present in the films also increases with increasing dutycycle (decreasing off times). Second, the closer thesubstrate is placed to the rf glow, typically the higherthe degree of unsaturation and CF3 content in the film,and the lower the CF2 content. The 50% duty cycle
sample at position A does not follow some of these trendsdue to the presence of higher levels of glass andhydrocarbon contamination detected on this sample.
Table 3 shows the elemental composition for filmsgenerated in CW and pulsed HFPO plasmas as afunction of distance from the rf coil. For materialsobtained at position A in CW and high duty cycle pulsedsystems, the highest amounts of Si and O are detected,indicating redeposition of SiO2 etched from the walls ofthe glass reactor. This is consistent with what weobserve in the FTIR spectra of these films. The higherSi content detected for the material generated at posi-tion C compared to the one at position B is most likelyfrom the underlying Si substrate. For pulsed conditions,the Si and O content decreases with decreasing dutycycle. The most dramatic change in the F/C ratio withposition occurs in the CW films. As the distance fromthe rf glow increases, the F/C ratio increases by a factorof 2. For the highest duty cycle (50%), a similar increasein F/C ratio is observed (Table 3). Although the sametrend is observed in the 16% duty cycle data, thedifference is much less pronounced. Interestingly, in thelowest duty cycle (5%) data, F/C ) 2.0 at all substratepositions.
C. SIMS and NEXAFS Analysis. SIMS and NEX-AFS analyses were employed to further characterize thecomposition and structure of materials generated in CWand pulsed HFPO plasmas. Figure 6 shows the SIMS
Figure 5. XPS C1s spectra for films deposited at positions Band C in a 25 W CW plasma using a photoelectron takeoffangle of 55°. The percent content for CF2, CF3, and C-CFx
groups is shown.
Table 1. Composition of Fluorocarbon Films Depositedon CW and Pulsed HFPO Plasmasa
CF2 (%) CF3 (%) other (%)
25 W CW0° 76 12 1280° 69 20 11
16% duty cycle0° 77 11 1280° 72 14 16
a All films were deposited at position C. The composition wasdetermined by angle-resolved XPS C1s analysis.
Table 2. Composition of Fluorocarbon MaterialsDeposited in Pulsed HFPO Plasmas As a Function of
Distance from the rf Coila
dutycycle (%) position CF3 (%) CF2 (%) CF (%) CC (%)
5 A 13.0 ( 0.8 76.6 ( 1.1 6.8 ( 0.4 3.6 ( 0.6B 14.8 ( 0.5 73.6 ( 0.6 6.1 ( 1.1 5.4 ( 1.0C 13.8 ( 1.2 86.2 ( 1.2 0.0 0.0
16 A 18.9 ( 1.4 35.8 ( 2.8 19.7 ( 0.5 25.7 ( 2.9B 18.4 ( 0.4 56.6 ( 0.5 13.4 ( 1.3 11.6 ( 1.1C 11.5 ( 0.3 75.8 ( 0.4 5.2 ( 1.0 7.5 ( 1.3
50 A 9.1 ( 0.4 13.6 ( 1.0 12.5 ( 2.4 64.8 ( 3.7B 21.4 ( 1.4 31.7 ( 1.6 19.4 ( 0.5 27.4 ( 0.6C 15.2 ( 1.0 51.3 ( 0.7 13.9 ( 0.3 19.5 ( 1.2
a Determined from C1s XPS analysis performed at a 55° takeoffangle.
Table 3. Elemental Composition for Films Deposited inCW and Pulsed HFPO Plasmas at Positions A, B, and C
As Determined by XPS Analysisa
C(1s) F(1s) O(1s) Si(2s) F/C
25 W CWposition a 28.6 ( 0.7 29.3 ( 0.4 15.2 ( 0.2 26.9 ( 0.7 1.0position b 36.5 ( 0.1 62.3 ( 0.2 1.2 ( 0.2 0.0 1.7position c 32.3 ( 0.9 63.4 ( 0.6 1.9 ( 0.4 2.3 ( 0.2 2.0
5% Duty Cycleposition a 33.3 ( 0.2 66.7 ( 0.2 0.0 0.0 2.0position b 33.6 ( 0.5 66.4 ( 0.0 0.0 0.0 2.0position c 33.0 ( 0.6 66.7 ( 1.1 0.3 ( 0.5 0.0 2.0
16% Duty Cycleposition a 39.8 ( 0.7 58.0 ( 1.3 1.8 ( 0.7 0.3 ( 0.5 1.5position b 34.9 ( 0.5 64.8 ( 0.1 0.3 ( 0.4 0.0 1.9position c 33.3 ( 0.2 66.4 ( 0.7 0.3 ( 0.5 0.0 2.0
50% Duty Cycleposition a 40.1 ( 1.8 35.8 ( 1.5 9.1 ( 0.7 9.1 ( 0.1 0.9position b 36.0 ( 0.5 62.6 ( 0.6 1.4 ( 0.2 0.0 1.7position c 35.9 ( 0.3 62.3 ( 0.3 1.8 ( 0.0 0.0 1.7
a Determined from XPS analysis performed at a 55° takeoffangle.
2018 Chem. Mater., Vol. 12, No. 7, 2000 Butoi et al.
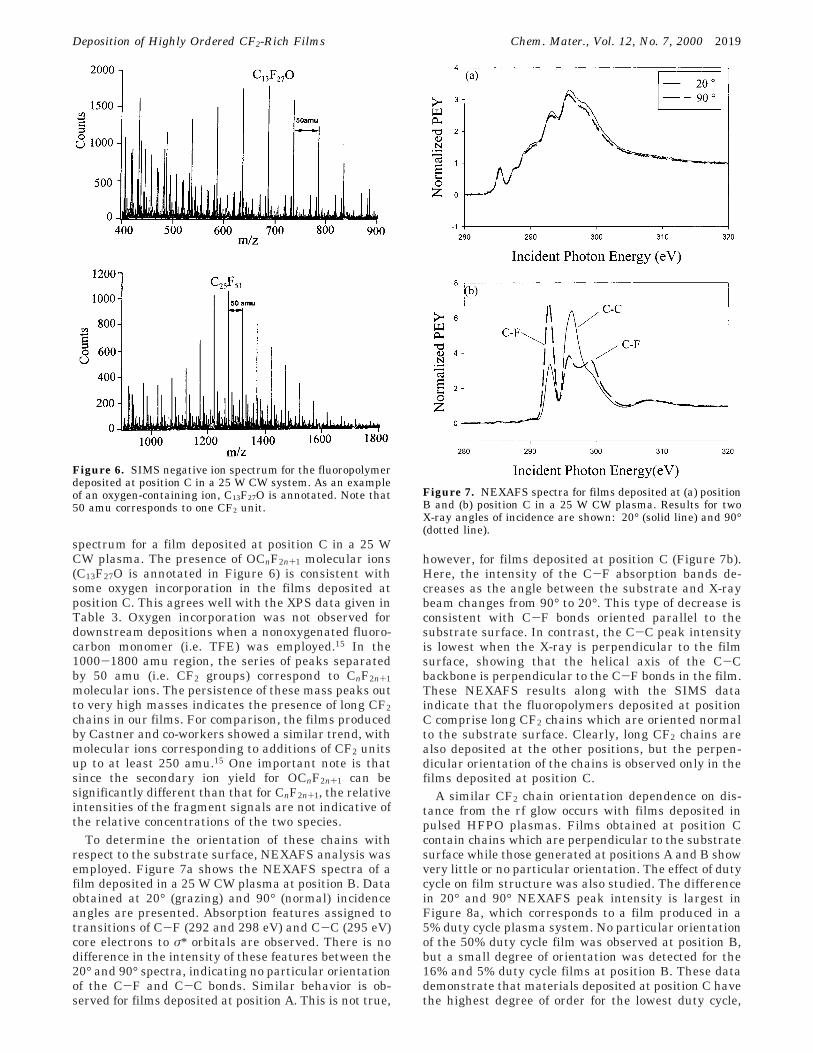
spectrum for a film deposited at position C in a 25 WCW plasma. The presence of OCnF2n+1 molecular ions(C13F27O is annotated in Figure 6) is consistent withsome oxygen incorporation in the films deposited atposition C. This agrees well with the XPS data given inTable 3. Oxygen incorporation was not observed fordownstream depositions when a nonoxygenated fluoro-carbon monomer (i.e. TFE) was employed.15 In the1000-1800 amu region, the series of peaks separatedby 50 amu (i.e. CF2 groups) correspond to CnF2n+1molecular ions. The persistence of these mass peaks outto very high masses indicates the presence of long CF2chains in our films. For comparison, the films producedby Castner and co-workers showed a similar trend, withmolecular ions corresponding to additions of CF2 unitsup to at least 250 amu.15 One important note is thatsince the secondary ion yield for OCnF2n+1 can besignificantly different than that for CnF2n+1, the relativeintensities of the fragment signals are not indicative ofthe relative concentrations of the two species.
To determine the orientation of these chains withrespect to the substrate surface, NEXAFS analysis wasemployed. Figure 7a shows the NEXAFS spectra of afilm deposited in a 25 W CW plasma at position B. Dataobtained at 20° (grazing) and 90° (normal) incidenceangles are presented. Absorption features assigned totransitions of C-F (292 and 298 eV) and C-C (295 eV)core electrons to σ* orbitals are observed. There is nodifference in the intensity of these features between the20° and 90° spectra, indicating no particular orientationof the C-F and C-C bonds. Similar behavior is ob-served for films deposited at position A. This is not true,
however, for films deposited at position C (Figure 7b).Here, the intensity of the C-F absorption bands de-creases as the angle between the substrate and X-raybeam changes from 90° to 20°. This type of decrease isconsistent with C-F bonds oriented parallel to thesubstrate surface. In contrast, the C-C peak intensityis lowest when the X-ray is perpendicular to the filmsurface, showing that the helical axis of the C-Cbackbone is perpendicular to the C-F bonds in the film.These NEXAFS results along with the SIMS dataindicate that the fluoropolymers deposited at positionC comprise long CF2 chains which are oriented normalto the substrate surface. Clearly, long CF2 chains arealso deposited at the other positions, but the perpen-dicular orientation of the chains is observed only in thefilms deposited at position C.
A similar CF2 chain orientation dependence on dis-tance from the rf glow occurs with films deposited inpulsed HFPO plasmas. Films obtained at position Ccontain chains which are perpendicular to the substratesurface while those generated at positions A and B showvery little or no particular orientation. The effect of dutycycle on film structure was also studied. The differencein 20° and 90° NEXAFS peak intensity is largest inFigure 8a, which corresponds to a film produced in a5% duty cycle plasma system. No particular orientationof the 50% duty cycle film was observed at position B,but a small degree of orientation was detected for the16% and 5% duty cycle films at position B. These datademonstrate that materials deposited at position C havethe highest degree of order for the lowest duty cycle,
Figure 6. SIMS negative ion spectrum for the fluoropolymerdeposited at position C in a 25 W CW system. As an exampleof an oxygen-containing ion, C13F27O is annotated. Note that50 amu corresponds to one CF2 unit.
Figure 7. NEXAFS spectra for films deposited at (a) positionB and (b) position C in a 25 W CW plasma. Results for twoX-ray angles of incidence are shown: 20° (solid line) and 90°(dotted line).
Deposition of Highly Ordered CF2-Rich Films Chem. Mater., Vol. 12, No. 7, 2000 2019
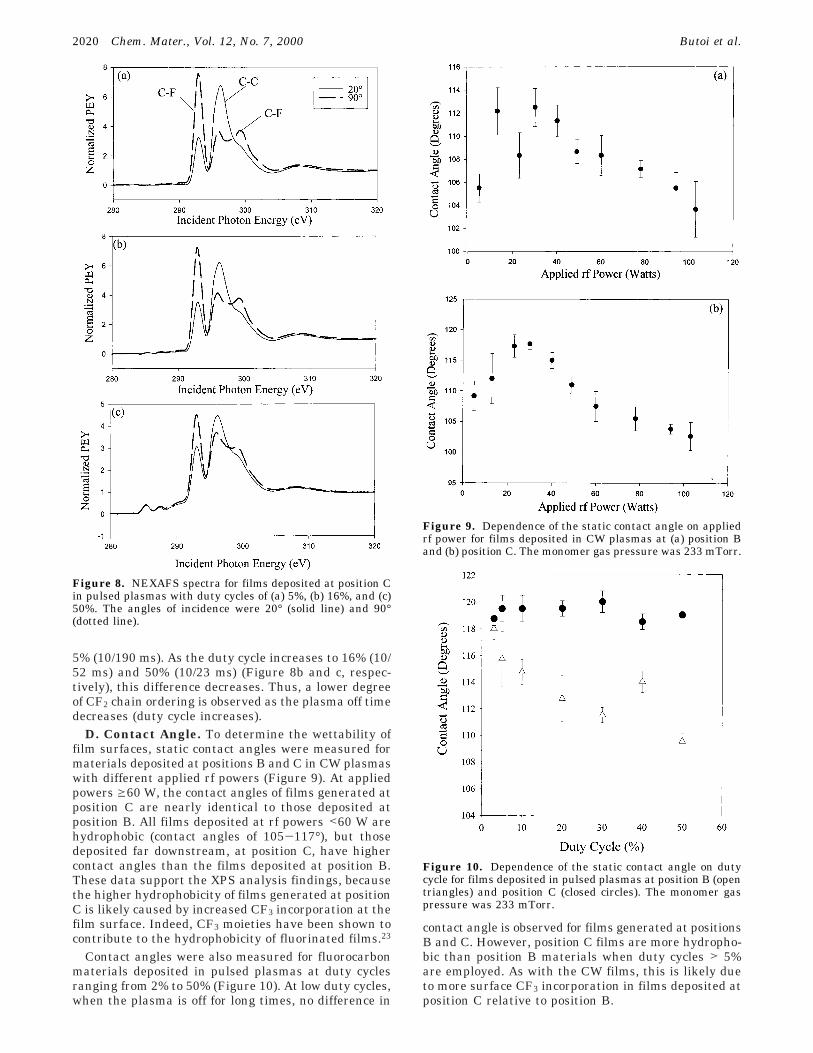
5% (10/190 ms). As the duty cycle increases to 16% (10/52 ms) and 50% (10/23 ms) (Figure 8b and c, respec-tively), this difference decreases. Thus, a lower degreeof CF2 chain ordering is observed as the plasma off timedecreases (duty cycle increases).
D. Contact Angle. To determine the wettability offilm surfaces, static contact angles were measured formaterials deposited at positions B and C in CW plasmaswith different applied rf powers (Figure 9). At appliedpowers g60 W, the contact angles of films generated atposition C are nearly identical to those deposited atposition B. All films deposited at rf powers <60 W arehydrophobic (contact angles of 105-117°), but thosedeposited far downstream, at position C, have highercontact angles than the films deposited at position B.These data support the XPS analysis findings, becausethe higher hydrophobicity of films generated at positionC is likely caused by increased CF3 incorporation at thefilm surface. Indeed, CF3 moieties have been shown tocontribute to the hydrophobicity of fluorinated films.23
Contact angles were also measured for fluorocarbonmaterials deposited in pulsed plasmas at duty cyclesranging from 2% to 50% (Figure 10). At low duty cycles,when the plasma is off for long times, no difference in
contact angle is observed for films generated at positionsB and C. However, position C films are more hydropho-bic than position B materials when duty cycles > 5%are employed. As with the CW films, this is likely dueto more surface CF3 incorporation in films deposited atposition C relative to position B.
Figure 8. NEXAFS spectra for films deposited at position Cin pulsed plasmas with duty cycles of (a) 5%, (b) 16%, and (c)50%. The angles of incidence were 20° (solid line) and 90°(dotted line).
Figure 9. Dependence of the static contact angle on appliedrf power for films deposited in CW plasmas at (a) position Band (b) position C. The monomer gas pressure was 233 mTorr.
Figure 10. Dependence of the static contact angle on dutycycle for films deposited in pulsed plasmas at position B (opentriangles) and position C (closed circles). The monomer gaspressure was 233 mTorr.
2020 Chem. Mater., Vol. 12, No. 7, 2000 Butoi et al.
E. Deposition Rates. Table 4 lists the depositionrates measured for materials generated in a 25 W CWplasma at positions B and C. A relatively high deposi-tion rate of 30 Å/min is observed at position B comparedto the 1.6 Å/min observed at position C. The lowthickness for films generated at position C explains thehigher Si content detected by XPS compared to that forthe materials generated at position B. For comparison,we also measured deposition rates in pulsed plasmasystems. As shown in Table 4, these deposition ratesare higher for materials generated at both positions Band C, relative to what was observed for CW systems.Indeed, at position C, there is an order of magnitudeincrease in the deposition rate for the 16% duty cyclepulsed system compared to the 25 W CW system. Alsoimportant to note, deposition rates are higher closer tothe glow under all plasma conditions (CW and pulsed).
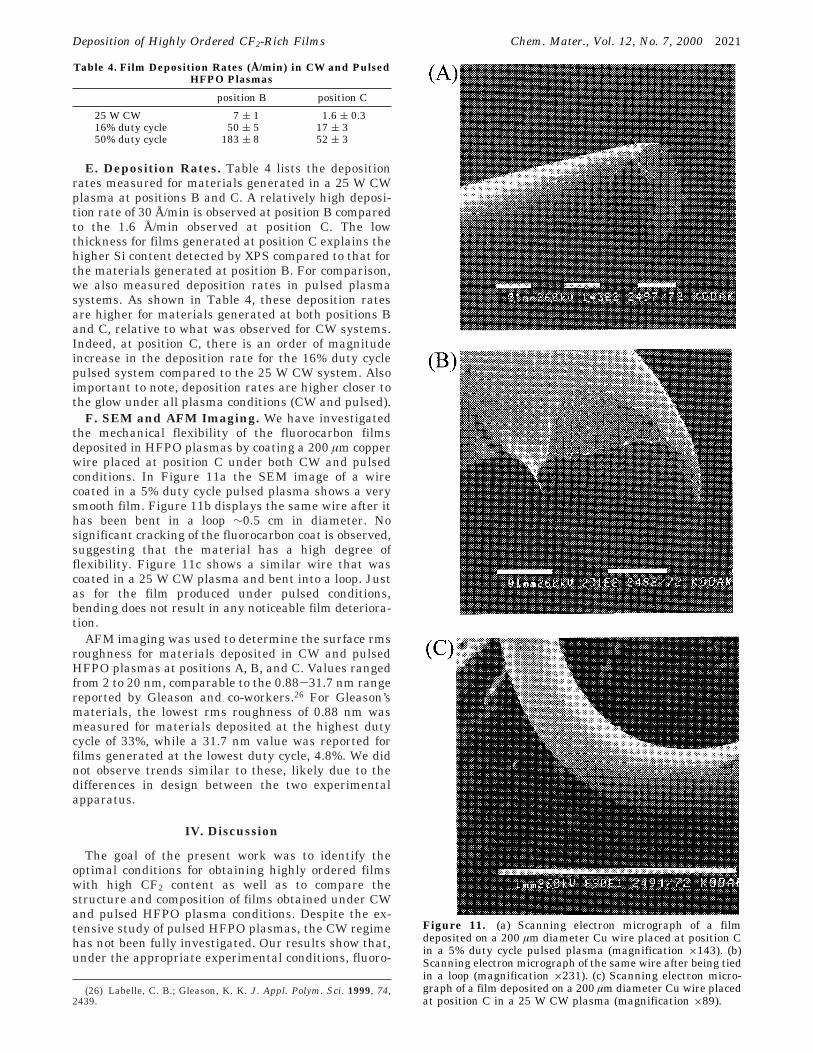
F. SEM and AFM Imaging. We have investigatedthe mechanical flexibility of the fluorocarbon filmsdeposited in HFPO plasmas by coating a 200 µm copperwire placed at position C under both CW and pulsedconditions. In Figure 11a the SEM image of a wirecoated in a 5% duty cycle pulsed plasma shows a verysmooth film. Figure 11b displays the same wire after ithas been bent in a loop ∼0.5 cm in diameter. Nosignificant cracking of the fluorocarbon coat is observed,suggesting that the material has a high degree offlexibility. Figure 11c shows a similar wire that wascoated in a 25 W CW plasma and bent into a loop. Justas for the film produced under pulsed conditions,bending does not result in any noticeable film deteriora-tion.
AFM imaging was used to determine the surface rmsroughness for materials deposited in CW and pulsedHFPO plasmas at positions A, B, and C. Values rangedfrom 2 to 20 nm, comparable to the 0.88-31.7 nm rangereported by Gleason and co-workers.26 For Gleason’smaterials, the lowest rms roughness of 0.88 nm wasmeasured for materials deposited at the highest dutycycle of 33%, while a 31.7 nm value was reported forfilms generated at the lowest duty cycle, 4.8%. We didnot observe trends similar to these, likely due to thedifferences in design between the two experimentalapparatus.
IV. Discussion
The goal of the present work was to identify theoptimal conditions for obtaining highly ordered filmswith high CF2 content as well as to compare thestructure and composition of films obtained under CWand pulsed HFPO plasma conditions. Despite the ex-tensive study of pulsed HFPO plasmas, the CW regimehas not been fully investigated. Our results show that,under the appropriate experimental conditions, fluoro-
(26) Labelle, C. B.; Gleason, K. K. J. Appl. Polym. Sci. 1999, 74,2439.
Figure 11. (a) Scanning electron micrograph of a filmdeposited on a 200 µm diameter Cu wire placed at position Cin a 5% duty cycle pulsed plasma (magnification ×143). (b)Scanning electron micrograph of the same wire after being tiedin a loop (magnification ×231). (c) Scanning electron micro-graph of a film deposited on a 200 µm diameter Cu wire placedat position C in a 25 W CW plasma (magnification ×89).
Table 4. Film Deposition Rates (Å/min) in CW and PulsedHFPO Plasmas
position B position C
25 W CW 7 ( 1 1.6 ( 0.316% duty cycle 50 ( 5 17 ( 350% duty cycle 183 ( 8 52 ( 3
Deposition of Highly Ordered CF2-Rich Films Chem. Mater., Vol. 12, No. 7, 2000 2021
carbon materials generated in CW systems displayattributes virtually identical to those of films producedin pulsed plasmas. In this work, we show that filmsdeposited far downstream from the rf glow (position C),under both CW and pulsed conditions, have the lowestdegree of cross-linking and are the least amorphous.This is demonstrated convincingly by the FTIR spectra(Figures 2-4), which contain clearly separated asym-metric and symmetric stretching bands and no otherfeatures. Moreover, these compositional attributes cor-relate well with XPS data which show that materialsgenerated at position C also have the highest CF2content and F/C ratios (Tables 1-3). Position C filmsalso contain long CF2 chains, as demonstrated by theSIMS data of Figure 6, which display a pronouncedorientation, as determined via NEXAFS experiments.The following discussion highlights and interprets themajor trends observed from our extensive parameterstudy and analysis.
The two experimental parameters that primarilycontrol the type of material obtained in CW HFPO rfglows are distance from the rf coil and applied rf power.Gleason and co-workers did explore the CW powerdependence in a parallel plate system but generatedonly amorphous films.20 Materials generated in the glowof our CW HFPO plasmas are similar to those reportedby Gleason. Unlike previous researchers, however, wehave also explored the dependence of film compositionas a function of distance from the HFPO plasma rf glow.While we were the first to perform distance dependencestudies for materials generated in HFPO plasmas, otherresearchers have investigated distance effects on thecomposition of films generated in TFE plasma systems.Castner and co-workers found that materials deposited10-30 cm downstream with CW rf powers < 10 Wcontained a high CF2 content (∼90%) and a high degreeof orientation.9 Conversely, films generated in the rfglow comprised significantly more CF3 as well as CFgroups.
Similar to Castner’s results with TFE, we also dis-covered that the position of the substrate relative to thevisible glow plays a very significant role in the type ofmaterial obtained in HFPO plasma systems. For depo-sitions performed at position B and rf powers > 50 W,etching of the glass reactor walls occurs, as indicatedby the intense SiO peak (∼1100 cm-1) present in theFTIR spectrum shown in Figure 2a. In contrast, materi-als generated at position C have IR spectra in whichthe dominant feature is the 1200 cm-1 band correspond-ing to CFx stretches (Figure 2b). At lower rf powers (15,30 W), however, no sign of reactor etching is observedfor position B films, while position C materials have alow degree of cross-linking and high CF2 content (Figure2a and b, respectively). The composition dependence ondistance from the rf glow is not surprising when oneconsiders that many of the energetic species in theplasma, which are primarily responsible for etching andcross-linking, decay before reaching a substrate placedfar downstream.9
The pressure dependence of the films obtained at anapplied rf power of 30 W CW is also very interesting(Figure 3). At low pressures, the fluorocarbon filmsgenerated at position B are highly amorphous, asindicated by the broad IR absorbance band at 1200
cm-1. At higher HFPO pressures, however, the separa-tion between the CF2 symmetric and asymmetric IRbands is consistent with a less amorphous fluoropoly-mer, similar to that deposited at position C. Increasingthe pressure has a dual effect on the rf glow: bothelectron energy and particle mean free path decrease.8Both of these effects serve to decrease the amount ofUV radiation reaching the deposited fluoropolymerbecause most excited state neutral species, whichfluoresce in the UV, are created through collisions withelectrons. As the electron energy decreases, the numberof excited state neutrals formed decreases. Likewise, asthe mean free path decreases, energy transfer occurspreferentially through molecule-molecule collisionsrather than through radiative decay (emission). Inaddition, as the electron energy decreases, fewer ionsare formed. Those ions that are created through electronimpact will have less energy than the ones formed atlower pressures (higher electron energies). Thus, athigher pressures, plasma-polymerized fluorocarbon filmsgenerated at position B do not undergo as muchbombardment from energetic particles as they do atlower pressures. This is also consistent with the lack ofpressure dependence observed for the composition offilms generated at position C, where most energeticspecies have already undergone recombination reac-tions.
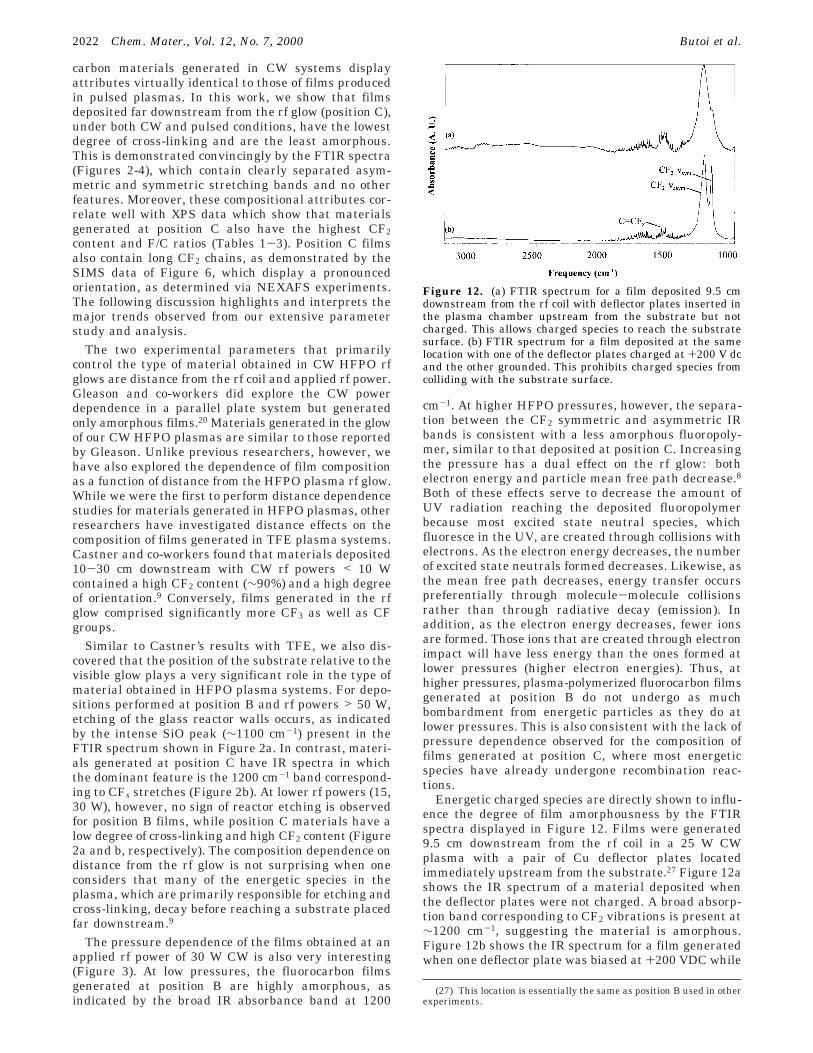
Energetic charged species are directly shown to influ-ence the degree of film amorphousness by the FTIRspectra displayed in Figure 12. Films were generated9.5 cm downstream from the rf coil in a 25 W CWplasma with a pair of Cu deflector plates locatedimmediately upstream from the substrate.27 Figure 12ashows the IR spectrum of a material deposited whenthe deflector plates were not charged. A broad absorp-tion band corresponding to CF2 vibrations is present at∼1200 cm-1, suggesting the material is amorphous.Figure 12b shows the IR spectrum for a film generatedwhen one deflector plate was biased at +200 VDC while
(27) This location is essentially the same as position B used in otherexperiments.
Figure 12. (a) FTIR spectrum for a film deposited 9.5 cmdownstream from the rf coil with deflector plates inserted inthe plasma chamber upstream from the substrate but notcharged. This allows charged species to reach the substratesurface. (b) FTIR spectrum for a film deposited at the samelocation with one of the deflector plates charged at +200 V dcand the other grounded. This prohibits charged species fromcolliding with the substrate surface.
2022 Chem. Mater., Vol. 12, No. 7, 2000 Butoi et al.
the other was grounded. The electric field thus createdprevents charged species from colliding with the sub-strate surface. A distinct separation between the sym-metric and asymmetric CF2 IR absorbance bands isobserved for materials deposited under biasing condi-tions, similar to what was observed for films depositedat reactor position C. The separation is not as dramatic,however, due to the presence of energetic neutral speciesand UV light, which are not deflected by the chargedplates. The difference between the IR spectra displayedin Figure 12a and b constitutes direct evidence thatcharged species bombardment is primarily responsiblefor the formation of highly amorphous and cross-linkedmaterials at position B.
Similar to the CW system, there are two mainexperimental variables that affect film composition inpulsed HFPO plasmas: duty cycle and distance fromglow. Fluorocarbon polymers deposited at position C inpulsed HFPO plasmas have higher CF2 content and ahigher degree of CF2 chain orientation than materialsgenerated at positions A and B (Table 2). Etching of theglass reactor walls occurs at duty cycles > 5% at positionA (Figure 4a and Table 3). As the duty cycle increases,however, the CF2 content decreases and the orientationof film chains becomes less distinct in materials depos-ited at position C (Table 2 and Figure 8). Pulsed plasmadynamics studies show that during the on-time periodradicals and charged species are created, followed bythe rapid decay of short-lived ionic fragments duringthe off time of the pulse sequence.28,29 The effect ofenergetic species on film composition and structure issignificantly reduced at all reactor positions because theplasma is pulsed. With a constant on time, lower pulseduty cycles (longer off times) provide a longer time fordeposition to occur unhindered by charged specieseffects. In addition, lower duty cycles also mean lowerequivalent power applied to the plasma. Indeed, as theduty cycle increases from 5% to 33%, the CW equivalentpower rises from 15 to 100 W. In a 100 W CW plasma,fluorocarbon film deposition occurs only at position C.In contrast, for the 33% duty cycle system (100 Wequivalent CW power) fluorocarbon film depositionoccurs at both position B and position C. One additionalnote is that, at higher duty cycles, we observe a moremarked dependence of film composition on reactorposition (Tables 2 and 3).
Angle-resolved XPS analysis results correlate wellwith the FTIR data and also provide additional infor-mation about composition differences between the filmsurface and the bulk. All the materials whose IR spectradid not contain features associated with cross-linkedgroups had the highest CF2 content and F/C ratiosaccording to XPS data. XPS analysis also showed that,for materials deposited at position C under CW condi-tions, the CF2/CF3 ratio changed from 3.5 to 6.3 whenthe sampling depth increased from ∼20 to ∼90 Å(photoelectron takeoff angle changed from 80° to 0°).Likewise, the CF2/CF3 ratio for films generated atposition C in a 16% duty cycle pulsed plasma changedfrom 5.2 for surface layers to 7.2 for the film bulk at 0°.These changes suggest that the films deposited at
position C in both systems have CF3-enriched surfaces.This conclusion is further supported by static contactangle measurements which show that the surfaces ofmaterials generated at position C are more hydrophobicthan those at position B. The angle-resolved XPS andcontact angle measurement information also agreeswith the findings of static SIMS analysis. The formertwo show that position C films have CF3-enrichedsurfaces, which indicates that the molecular ions of theform CnF2n+1 detected in the SIMS spectrum are verylikely to correspond to (CF2)nCF3 moieties in the film.Similar conclusions were drawn by Castner and co-workers in regard to fluorocarbon materials obtaineddownstream from TFE plasmas. The same progressionof molecular ions was observed and interpreted toindicate the presence of (CF2)nCF3 chains.15
Another intriguing characteristic of the films depos-ited at position C is the high degree of orientation ofthe CF2 chains observed for both CW and pulsed HFPOplasmas. Unlike PTFE, in which the CF2 strands areparallel to the film surface,15 fluorocarbon films depos-ited in our HFPO CW and pulsed systems at position Ccontain CF2 chains perpendicular to the substratesurface. This is only the second plasma system for whichthis type of orientation is seen in the fluorocarbonmaterials generated.15 One possible explanation for theperpendicular orientation of the CF2 chains is the higherstability of the C-C (144 kcal/mol) bond relative to aC-Si (104 kcal/mol) bond.30 If the film is formed throughsequential addition of CF2 moieties, this difference couldlead to preferential C-C bond formation, after the firstdifluorocarbene groups bond to the Si surface. Incontrast, the films deposited upstream do not havepreferential orientation, most likely as a result of higherlevels of ion and electron bombardment which lead tohigher densities of chain nucleation sites.
Given the structural and compositional similaritiesbetween materials deposited in our CW and pulsedHFPO plasmas at position C, we also investigated howtheir flexibilities compare under mechanical stress.SEM images indicate that our films are flexible enoughnot to crack under the stress of bending a coated wireinto a loop ∼0.5 cm in diameter (Figure 11). This is thefirst time a high degree of flexibility was observed forfilms obtained in HFPO plasmas under CW conditions.Gleason and co-workers generated flexible materials in2.4% (10/400 ms) duty cycle pulsed HFPO plasmas, buttheir CW films were found to crack under bendingstress.31 The difference between our CW films generatedat position C and the ones studied by Gleason is thatthe latter were deposited at high power densities in therf glow of a parallel plate reactor. Gleason’s previousresearch has shown that, at high rf power, HFPOPECVD produces highly cross-linked materials whichare less robust against mechanical stress than filmswith a low degree of cross-linking.20 Our films depositedat position C in a 25 W CW system contain virtually nocross-linked groups, explaining their high degree offlexibility.
(28) Lin, S.; Liao, C.; Liang, R. Polym. J. 1995, 27, 201.(29) Booth, J. P.; Hancock, G.; Perry, N. D.; Toogood, M. J. J. Appl.
Phys. 1989, 66, 5251.
(30) CRC Handbook of Chemistry and Physics; Weast, R. C., Selby,S. M., Eds.; The Chemical Rubber Co.: Cleveland, OH, 1966; p F-130.
(31) Limb, S. J.; Gleason, K. K.; Edell, D. J.; Gleason, E. F. J. Vac.Sci. Technol. A 1997, 15 (4), 1814.
Deposition of Highly Ordered CF2-Rich Films Chem. Mater., Vol. 12, No. 7, 2000 2023
V. Summary
PECVD using fluorocarbon systems is an extremelyvaluable technique in the quest for improved vapor-deposited fluoropolymers. This study shows that HFPOplasmas can be employed to produce materials with highCF2 content and low degrees of cross-linking. In addi-tion, our results demonstrate that pulsing the HFPOplasma is not the only route to obtaining such films.CW downstream depositions produced similar high-quality films. Note that the films generated in HFPOplasmas, similar to those seen in TFE systems, are notTeflon-like in structure. PTFE contains CF2 moietieslinked parallel to substrate surfaces, whereas thematerials we deposit comprise vertically oriented CF2chains which are terminated in CF3 groups. However,only films obtained at the longest distance from theplasma glow display a high degree of orientation. Asobserved in other plasma systems, the energetic chargedspecies produced in the rf plasma play a crucial role inthe structure and composition of the materials gener-ated. We conclude that, with low rf powers, far down-stream depositions are virtually free of undesired
energetic species bombardment effects simply becausethese species are lost through plasma recombinationprocesses prior to reaching a substrate. A similar resultis obtained for pulsing the HFPO plasmas, despite the300 W applied power, because charged species rapidlydecay during the time off period of the pulse sequence.Further investigations of gas-phase species in the HFPOsystem are currently underway in our laboratories.32
Acknowledgment. This work was supported by theNational Science Foundation. J.B. and A.M.M. alsoacknowledge support from the NSF-REU program.L.J.G. and D.G.C. were supported by grants from theNIH (RR-01296) and the NSF (EEC-9529161). TheNEXAFS studies were performed at the NSLS,Brookhaven National Laboratory, which is supportedby the DOE, Division of Materials Science and Divisionof Chemical Sciences. We are also grateful to Prof. BruceParkinson for the use of his AFM instrument.
CM0002416
(32) Butoi, C. I.; Mackie, N. M.; Williams, K. L.; Fisher, E. R. J.Vac. Sci. Technol. A, submitted for publication.
2024 Chem. Mater., Vol. 12, No. 7, 2000 Butoi et al.


![#@cf}+jflif{s k|ltj]bg @)&%–)&^](https://static.fdokumen.com/doc/165x107/6331ac16ba79697da50fe7f4/cfjflifs-kltjbg-.jpg)