Diego de Cuentas, pintor de entresiglos en la Nueva Galicia (1654-1744)

arX
iv:a
stro
-ph/
0009
045v
1 4
Sep
200
0
Mon. Not. R. Astron. Soc. 000, 000–000 (0000) Printed 1 February 2008 (MN LATEX style file v2.2)
Depletion of background galaxies due to the cluster lens
CL0024+1654: U and R band observations
O. E. Rognvaldsson,1⋆ T. R. Greve,2 J. Hjorth,2
E. H. Gudmundsson,3 V. S. Sigmundsson,3 P. Jakobsson,2,3
A. O. Jaunsen,4 L. L. Christensen,5 E. van Kampen6 and A. N. Taylor61NORDITA, Blegdamsvej 17, DK-2100 Copenhagen Ø, Denmark2Astronomical Observatory, Univeristy of Copenhagen, Juliane Maries Vej 30, DK-2100 Copenhagen Ø, Denmark3Science Institute, University of Iceland, Dunhaga 3, IS-107 Reykjavik, Iceland4Institute of Theoretical Astrophysics, Postboks 1029 Blindern, N-0135 Oslo, Norway5ST-ECF/ESO, Garching, Germany6Institute for Astronomy, Blackford Hill, Edinburgh EH9 3HJ, UK
Accepted . . . Received 2000 July 17; revised 2000 August 30
ABSTRACT
We have obtained U and R band observations of the depletion of background galaxiesdue to the gravitational lensing of the galaxy cluster CL0024+1654 (z = 0.39). Theradial depletion curves show a significant depletion in both bands within a radius of40′′ − 70′′ from the cluster center. This is the first time depletion is detected in theU band. This gives independent evidence for a break in the slope of the U band lu-minosity function at faint magnitudes. The radially averaged R band depletion curveis broader and deeper than in the U band. The differences can be attributed to thewavelength dependence of the slope of the luminosity function and to the differentredshift distribution of the objects probed in the two bands. We estimate the Ein-stein radius, rE, of a singular isothermal sphere lens model using maximum likelihoodanalysis. Adopting a slope of the number counts of α = 0.2 and using the backgrounddensity found beyond r = 150′′ we find rE = 17′′ ± 3′′ and rE = 25′′ ± 3′′ in the U
and R band, respectively. When combined with the redshift of the single backgroundgalaxy at z = 1.675 seen as four giant arcs around 30′′ from the cluster center, thesevalues indicate a median redshift in the range 〈zS〉 ≈ 0.7 to 1.1 for the UAB≥ 24 magand RAB≥ 24 mag populations.
Key words: Gravitational lensing – galaxy counts – galaxies: clusters: general –galaxies: clusters: individual: CL0024+1654 – ultraviolet: galaxies
1 INTRODUCTION
Gravitational lensing by clusters of galaxies affects the ap-parent distribution of background galaxies on the sky, pro-vided that the slope of the galaxy number counts differs froma critical value corresponding to a balance between the di-lution due to local stretching of the background sky and thedensity enhancement due to magnification of faint sourcesabove the observed magnitude limit. Normally, the slopelevels off at faint magnitudes, causing an apparent deple-tion of galaxies behind strong gravitational lenses relative tothe field. This depletion signal is, under fairly general condi-tions, directly related to the magnification of the lens, whichin turn may be used to find its surface mass density. Broad-
⋆ email: [email protected]
hurst et al. (1995) first pointed out the potential of this as-pect of the magnification bias to estimate cluster masses anddensity profiles, using the so-called number count method.This method was first used for absolute mass estimation byTaylor et al. (1998), who also discuss various observationalissues. Models for relating the magnification to the surfacemass density (or convergence), going beyond the weak lens-ing approximation, were considered by van Kampen (1998)and Dye & Taylor (1998). Such models, which take into ac-count the presence of a shear term in the magnification,are of great importance in combination with the numbercount method, since the shear pattern can not be measuredfrom the background densities alone. Schneider et al. (2000)have compared the number count method to shear measure-ments, using maximum likelihood analysis. They find thatthe number count method does a better job of estimating

2 O. E. Rognvaldsson et al.
cluster density profiles, provided that the unlensed numberdensity of galaxies is known to a good precision. Bezecourtet al. (1999) have investigated the wavelength dependence ofdepletion curves, while Mayen & Soucail (2000) investigatehow depletion curves depend on the cluster density profile.They also investigate how the filter bands used in obser-vations affect the results through different sampling of thebackground population. Gray et al. (2000) show that the ef-fects of incompleteness on model parameters estimated withmaximum likelihood methods (Schneider et al. (2000)) maybe neglected, at least under the standard assumption thatthe intrinsic luminosity function is a power law.
A few other methods based on gravitational lensinghave been applied to cluster mass estimation. Dye et al.(2000) have studied the effects of the lens magnification onthe luminosity function of background population, and ap-plied this method to Abell 1689. Weak shear analysis, wherethe average distortion of the shape of background galaxies isused to estimate the shear field of the lens, has been appliedto a number of clusters (e.g. Smail & Dickinson (1995); Lup-pino & Kaiser (1997); Clowe et al. (1998); Hoekstra et al.(2000); Joffre et al. (2000); Athreya et al. (2000), and refer-ences therein). Strong lensing effects have also been used toprobe the density distribution in clusters (e.g. Tyson et al.(1998); Broadhurst et al. (2000)), and statistical studies ofarclets are being pursued (e.g. Bezecourt et al. (1999)). Thetheoretical and observational aspects of gravitational lensingand its applications have recently been reviewed in Mellier(1999) and Bartelmann & Schneider (1999).
To date, depletion of background galaxies has been ob-served in connection with a handful of clusters. Fort et al.(1997) were the first to report on depletion in the B and Iband behind CL0024+1654. Their observations were how-ever plagued by a low density of objects and an uncertainbackground estimate as discussed by van Kampen (1998).Taylor et al. (1998) found depletion in the I band in Abell1689, after careful removal of cluster and foreground ob-jects using additional color information. Mayen & Soucail(2000) find depletion of faint B, V , R, and I objects towardsMS1008–1224. This cluster can possibly be used to investi-gate how background clustering affects the depletion anal-ysis, since Athreya et al. (2000) have tentatively detectedanother cluster in the background (at z = 0.9). Finally,Gray et al. (2000) have explored depletion at near-infraredwavelengths in Abell 2219. Depletion analysis in the infrared(IR) benefit from a low slope of the number counts alreadyat moderately faint IR magnitudes, but the low backgroundnumber density may outweigh the benefits.
In our work, we apply the number count method in theU and R band to the rich cluster CL0024+1654 (z=0.39),first observed to be a strong gravitational lens by Koo(1988). The U filter is well suited for depletion studies, pro-vided that the observations are deep enough to probe galax-ies fainter than UAB≈ 25.75 where the slope of the luminos-ity function in the U band levels off (Williams et al. (1996);Pozzetti et al. (1998), but see e.g. Hogg et al. (1997); Volon-teri et al. (2000) for evidence against this), while the slope inthe R band is low enough to accommodate depletion studiesgiven sufficient number of background objects. With suffi-ciently deep observations, depletion analysis in these twowidely separated bands will also reflect the different sam-pling of the background redshift distribution. The large Ein-
stein radius of CL0024+1654, inferred from the position ofgiant arcs around 30′′ from the cluster center, and previ-ous detection of depletion in the I and B band (Fort et al.(1997)) make this cluster a good candidate for depletionstudies. Moreover, its mass and mass distribution have beenstudied carefully with other methods.
From the redshift catalog compiled by Dressler et al.(1985), Schneider et al. (1986), and Dressler & Gunn (1992),a velocity dispersion of σv = 1200 km s−1 is found, re-sulting in a mass of roughly 7 × 10¹⁴h−1
50 M⊙ within a ra-dius of 0.5h−1
50 Mpc. (The Hubble parameter is H0 = 50h50
km/s/Mpc.) A much larger sample of redshifts in the clusterfield has recently been obtained by Dressler et al. (1999) andCzoske et al. (1999). Analysis of this data leads to a con-siderably lower velocity dispersion, σ ≈ 700 km s−1, for the227 cluster objects identified. The estimated mass is conse-quently lower. For example Czoske et al. (1999) find a massof 1.4 × 10¹⁴h−1
50 M⊙ within 0.5h−150 Mpc.
From a detailed inversion of the lens using mainly thegiant arcs, which are the multiple images of a single back-ground galaxy, Tyson et al. (1998) find the central massdistribution to be very relaxed, with no signs of substruc-ture within 220h−1
50 kpc. On the other hand, Broadhurstet al. (2000) find evidence for substructure on the clustercore scale. Their mass estimate for the innermost 220h−1
50
kpc is 2.6 × 10¹⁴h−150 M⊙, or somewhat lower than the
3.3 × 10¹⁴h−150 M⊙ estimated by Tyson et al. (1998). Their
model does however predict an unrealistically high velocitydispersion for the cluster (Shapiro & Iliev (2000)).
On a much larger scale, Bonnet et al. (1994) using weakshear analysis find a mass of 4×10¹⁵h−1
50 M⊙ within a radiusof 3h−1
50 Mpc. Analysis of X-ray observations by Bohringeret al. (2000) and Soucail et al. (2000) shows a discrepancyof about a factor 1 − 3 between X-ray and lensing mass,similar to what is found in many other clusters. The differ-ence is most probably attributable to simplified assumptionsabout the dynamical state of the cluster. Finally, van Kam-pen (1998) used the depletion observations by Fort et al.(1997) to constrain the mass of the cluster, noting that a bet-ter estimate of the unlensed background density was neededto give reliable results.
In order to constrain the mass distribution of the clusterusing our data, additional information is needed on variousproperties of the background sources. The unlensed averagedensity, redshift distribution, and the slope of the numbercounts of the background sources all play a role in relatingthe observed depletion to the convergence of the lens. In thispaper, we present the first U band observations of depletionand apply simple parametric modeling to our U and R banddata to investigate the dependence of the model on the apriori parameters. A more detailed investigation of the massdistribution implied by our data is being undertaken (vanKampen et al., in preparation).
The rest of this paper is organized as follows. Basicdescription of the data is given in Section 2. The objectextraction and analysis of the resulting catalogs is discussedin Section 3, and the results are discussed and summarizedin Section 4.
2 THE DATA

Depletion due to the cluster lens CL0024+1654 3
2.1 Data acquisition and reduction
The data were obtained with the ALFOSC instrument onthe Nordic Optical Telescope in August 1999. The field-of-view was 6.52
′ with a pixel size of 0.188′′. The total inte-gration time in the (Cousins) U band was 37 ksec and 8.7ksec in the (Cousins) R band with average seeing of 1.1′′ and1.0′′, respectively. The formal 3σ detection limits in the finaldrizzled images are UAB,lim= 27.2 mag and RAB,lim= 27.5mag. (We use AB magnitudes throughout, using a simpleshift of +0.71 mag and +0.199 mag to convert from the ob-served Cousins U and R magnitudes, respectively (Fukugitaet al. (1995)).
Standard bias and flat field corrections were made to thedata before stacking the individual frames using tools fromthe ditherII package (Fruchter & Hook (1997); Mutchler &Fruchter (1997); Hook et al. (1999)) in IRAF. Shifts were es-timated by cross-correlating images and cosmic rays maskedout using the blotting technique as described by Mutchler& Fruchter (1997). The original pixel scale was retained andno attempt was made to correct for field distortions.
2.2 Photometry and completeness
The calibration against photometric standards (mainly inM92 (Davis (1999)) and a few standards from Landolt(1983)) gives formal errors of σ∆R = 0.02 mag and σ∆U =0.05 mag. Typical photometric errors estimated by the de-tection software are between 0.1−0.3 mag for the magnituderanges 24 ≤ (R, U)AB ≤ 27. (This is the magnitude rangeused below to select background objects for the depletionanalysis.)
In order to estimate the level of completeness as a func-tion of magnitude in our data, 300 artificial objects wereadded to the science frames using the artdata task in IRAF.Completeness was estimated as the ratio between detectedsynthetic objects and the number of synthetic objects added.In order to improve the statistics this procedure was re-peated 100 times, each time adding objects at random posi-tions. The final average completion curves indicate that oursample is 50% complete at UAB= 26.7 mag and RAB= 26.5.
The fraction of detections due to spurious noise peakswill steadily increase towards faint flux levels. To investi-gate this, frames containing only noise were generated andusing SExtractor (Bertin & Arnouts (1996)), 700 apertureswere dropped onto the frames. To ensure that the noise-onlyframes would mimic the noise characteristics of the scienceframes as closely as possible, they were convolved with thenoise correlation function found in the science frames. Bycounting the number of detections per magnitude bin wecan readily quantify the contamination from noise peaks.It was found that only 7% of the detections have U mag-nitudes brighter than 27 mag while in the R frame about9% have magnitudes brighter than 27 mag. With this lowlevel of noise contamination, we decided not to make anycorrections for false detections.
3 ANALYSIS
The number count method is based on the following prop-erty of cluster lenses. Under the standard assumption that
the number density of background galaxies follows a powerlaw, n0(S) ∝ S−β for a given flux limit S, one finds a sim-ple relation between the magnification of the lens, µ, andn(θ; > S), the number density of background objects as ob-served through the lens,
n(θ; > S)
n0(S)= µβ−1(θ). (1)
Here θ is the position on the sky. In practice, one observesthe local galaxy distribution down to a limiting magnitude,m, so that the cumulative normalized number density is of-ten written as
n(θ; < m)
n0(m)= µ2.5α−1(θ), (2)
with α ≡ d log N/dm = 0.4β being the slope of the(unlensed) differential galaxy number counts. By invertingEq. (2), it is therefore possible to measure the magnificationfield, µ(θ), provided that a sample of background sourcescan be isolated, e.g. on the basis of color and magnitude(Sec. 3.4), and that the parameters α and n0 for this samplecan be determined to a sufficient accuracy. In the followingsections, we shall discuss these issues, and present detailedanalysis of the observed density field n/n0 in the form ofradially averaged depletion curves and maximum likelihoodanalysis.
3.1 Source extractions
The first step in the analysis of the final images is to ex-tract the sources. Source extraction was done with bothSExtractor (Bertin & Arnouts (1996)) and ImCat (Kaiseret al. (1995)), with comparable results. The ImCat resultswere used to identify stars, based on half-light radii, butthe rest of the analysis below is based on the informationextracted by SExtractor. The full set of SExtractor objectcatalogs used here is available at the CDS and ADC catalogarchives.
We have performed extensive analysis of simulateddata, using noise characteristics from the final reduced im-ages, to find optimal adjustments of the various parametersof the detection software (see Greve (2000) for details). ForSExtractor, these considerations resulted in choosing a de-tection threshold of 1σ per pixel, combined with a Gaussianfiltering kernel (FWHM of 5 pixels, roughly correspondingto our seeing of 6 pixels), and a minimum detection area of10 pixels. The complete SExtractor parameter files used areavailable at the aforementioned website.
When selecting objects for further analysis from the cat-alogs produced by SExtractor, we leave out objects whichhave internal flags larger than 3. This excludes objects withsaturated pixels, objects that have been truncated, and ob-jects with corrupt isophotal or aperture data.
3.2 Galaxy number counts
The original motivation for using U band observations fordepletion studies was the indication of a break in the galaxynumber counts at faint U magnitudes reported by Williamset al. (1996). They found a logarithmic slope α ≈ 0.4 forU300 ≤ 26 dropping to 0.05 in the range 26 < U300 < 28.A more detailed analysis of the HDF number counts by
4 O. E. Rognvaldsson et al.
Pozzetti et al. (1998) shows that the slope drops to α = 0.135at U300 = 25.75, with an allowed range of 0.08 < α < 0.16.
The differential number counts in our field are shownin Fig. 1 for the R and U band. The overall higher levelof bright R band objects in our data relative to the countsfrom Smail et al. (1995), Williams et al. (1996), and Hogget al. (1997) is simply due to the presence of the cluster. Asimilar effect is seen in the U band. The net result of thisand the incompleteness at faint magnitudes is to lower thelogarithmic slope of the differential number counts. This isevident from Fig. 1a, where we find a slope of 0.21 in themagnitude range 20 ≤RAB≤ 25, compared to an estimate of0.27 for the other data in the same magnitude range.
It is evident that our data is incomplete beyond UAB≈26 and RAB≈ 25.5. This is consistent with our completenessestimates, but as shown by Gray et al. (2000), the incom-pleteness does not affect the depletion analysis, as long asthe field used to estimate the average background densityhas the same completeness characteristics. It means, how-ever, that we are unable to determine the slope at the faintend of the luminosity function, and must rely on estimatesfrom deeper observations. The slope in the U magnitude in-terval used in the depletion analysis (section 3.6) is likely tobe varying from a value close to 0.4 at UAB= 24 to the value0.135 found by Pozzetti et al. (1998) at UAB≈ 26. Similarly,the R band slope is dropping from a value of αR = 0.3 orso at bright magnitudes (Smail et al. (1995); Hogg et al.(1997)) to 0.18 at the faint end (RAB=27) of the selectedmagnitude interval, in accordance with the slopes found inthe V and I bands from HDF data (Williams et al. (1996),see also Madau & Pozzetti (2000)).
3.3 Color-magnitude diagrams
We find the (U −R)AB color by first detecting and measur-ing the magnitudes in the U band. The U catalog is thenmatched to the R band image by running SExtractor in “as-soc” mode with a search radius of 6 pixels, appropriate tocompensate for our seeing and error in the alignment be-tween the U and R images. In this way, 1229 objects arefound when associating the U image with the full R catalog.These objects comprise our “matched” catalog.
In Figs. 2a and 2b we show the color-magnitude dia-gram for all the 1169 objects in the matched catalog afterremoval of 60 stars (the distinction between stars and galax-ies was based on the analysis of half-light radii). The formaldetection limits in U and R are indicated by dashed lines,and the color and magnitude cuts used to select backgroundobjects are shown with dash-dotted lines (see Sec. 3.4). Thebluing trend at faint R and U magnitudes (e.g. Hogg et al.(1997)) is reflected in the negative slope of the lower edge ofthe “wedge” shaped region that the objects populate. Thiseffect is especially pronounced in Fig. 2a.
The color-magnitude diagrams clearly show a lower den-sity of objects around (U − R)AB=3, also seen in U and Rband data we have obtained for the cluster MS1621+2640(van Kampen et al., in preparation). By combining our pho-tometric data with redshifts from the survey of Czoske et al.(1999) and Dressler et al. (1999) for the CL0024+1654 field,we find that the (U−R)AB color of the cluster galaxies showsa distinct bi-modal distribution, with a minimum around(U −R)AB=3 and a large fraction above (U −R)AB=3. This
distinction is not seen for the field galaxies in the redshiftsurvey, suggesting that mostly cluster galaxies will be dis-carded by selecting only galaxies bluer than (U − R)AB=3.This can also be inferred from the distribution of confirmedcluster galaxies, marked by ’+’, in the color-magnitude dia-grams. The radial gradient observed for g − r color in manyclusters (see e.g. Morris et al. (1998)) is also seen in the(U − R)AB color. These features are suggestive of a strongcorrelation between star formation activity in cluster galax-ies and the cluster environment. We shall investigate thisaspect of the data in greater detail in a forthcoming paper(van Kampen et al., in preparation).
3.4 Selection of background candidates
For the depletion analysis, it is important to remove clusterand foreground galaxies from the object catalogs as the num-ber density of cluster galaxies typically increases towards thecenter, interfering with radial gradients in the number den-sity of the background. In line with the discussion above oncolor-magnitude diagrams, we chose to use simple limits onmagnitudes and color, restricting the depletion analysis tothe magnitude ranges 24 ≤ (R,U)AB ≤ 27 and to objectsbluer than (U −R)AB = 3. The limiting U band magnitudeof 27.2 implies that R band objects in the magnitude range24 ≤ RAB ≤ 27 that have a well defined counterpart inthe U band image are all bluer than (U − R)AB=3, as canbe seen from figure 2a. Therefore, the exclusion of objectsredder than (U − R)AB=3 will only affect the selection ofbackground objects in the U band.
The background samples are constructed by first se-lecting objects in the magnitude ranges 24 ≤ (R, U)AB ≤ 27from the full R and U band catalogs. In order to excludethe red (cluster) objects, one could in principle extract thebackground sample from the matched catalog, with the ad-ditional constraint on color. Doing this, however, one tendsto miss primarily the faintest objects, partly because someof the U objects are simply too faint in R to be detected,and vice versa, as well as because the association is moredifficult the fainter the object is. We avoid this drawback byconstructing masks (using the shape parameters estimatedby SExtractor) covering the (U − R)AB ≥ 3 objects in thematched catalog. The objects that fall on these masks arethen deleted from the background samples.
In addition, the masks are augmented with the brightobjects ((R,U)AB < 24), to cover the parts obscured bythe foreground and cluster candidates in the correspond-ing image (see figure 3). The estimated (Poisson) errors forthe depletion curves are corrected for the effective area ofeach annulus of the radial averaging by subtracting off thenumber of pixels in the mask from the pixelized area of theannulus. The correction due to the mask is quite importantfor the innermost bins, especially in the R band, where thebright cluster galaxies obscure a large fraction of the area.Hence, the innermost bins have the highest uncertainty dueto the small effective area.
3.5 Depletion analysis
Radial averaging is typically used to boost the significanceof the depletion signal (e.g. Taylor et al. (1998); Mayen &

Depletion due to the cluster lens CL0024+1654 5
18 20 22 24 26 28RAB
102
103
104
105
106
N[m
ag-1 d
eg-2]
Hogg et al. (1997)Williams et al. (1996)Cl0024+1654Smail et al. (1995)
18 20 22 24 26 28UAB
102
103
104
105
106
N[m
ag-1 d
eg-2]
Hogg et al. (1997)Williams et al. (1996)Cl0024+1654
Figure 1. (a) The RAB number counts compared to R band data from Hogg et al. (1997), and Smail et al. (1995), and I band data fromWilliams et al. (1996). The effect of the cluster is more pronounced at bright magnitudes, while incompleteness sets in around RAB=25.(b) The UAB number counts compared to data from Williams et al. (1996), and Hogg et al. (1997). Again, the presence of the clusterresults in overall higher counts, and the turn-over at faint magnitudes reflects the incompleteness beyond UAB=26.
Figure 2. (a) The (U −R)AB vs RAB color-magnitude diagram. The formal detecion 3σ limits, UAB,lim= 27.2 mag and RAB,lim= 27.5mag, are indicated with dashed lines. Dash-dotted lines indicate the color ((U − R)AB≤ 3) and magnitude (RAB≥ 24) limits used tomask out foreground objects in the R band. The upper edge of the “wedge” shape is defined by the limiting magnitude in U , while theslope of the lower edge clearly reflects a bluing trend towards fainter magnitudes. Note also the distinct low density around (U −R)AB=3.Confirmed cluster galaxies are marked by ’+’. (b) The (U − R)AB vs UAB color-magnitude diagram. Dash-dotted lines show the color((U −R)AB≤ 3) and magnitude (UAB≥ 24) limits used to mask out foreground objects in the U band. The general features are the sameas in (a)
Soucail (2000)). The number density is estimated by count-ing the number of objects in annuli around the cluster cen-ter. This average density is normalized by an (indepen-dent) estimate of the unlensed background density of thesame class of objects resulting in a radial depletion curve.The width of the annuli, ∆r, may be adjusted to obtain areasonable balance between smoothing and shot noise. Wecalculate the number density averaged over 10′′ wide an-nuli as a function of radius from the cluster center, takento be the center of light (α(J2000) = 00h26m35.8s andδ(J2000) = +1709′42.3′′) of the R image within 100′′ ra-dius after a few bright stars and a foreground galaxy havebeen masked out. The number counts are normalized tothe background density, n0, estimated as the average den-sity of the corresponding objects in the annulus between
150′′ < r < 240′′. This assumes that the cluster does notaffect the background significantly beyond 150′′. (Ideally,the unlensed background density should be estimated froma separate field, known not to be affected by strong fore-ground lenses.) We find values of n0(U) = 28 ± 2 arcmin−2
and n0(R) = 49 ± 7 arcmin−2, with 1084 and 1780 selectedbackground objects in the U and R band, respectively. (Theuncertainties quoted are jackknife estimates, see below.)
The obscuration by the masks (separate for each band)is taken into account in determining an effective area,Aeff(ri), for each annulus, ri − ∆r/2 ≤ r < ri + ∆r/2. Theuncertainties may as a first approximation be taken to bedue only to Poisson noise in the counts, so that
∆N(ri) = Nexp(ri)1/2 = (n0Aeff(ri))
1/2
6 O. E. Rognvaldsson et al.
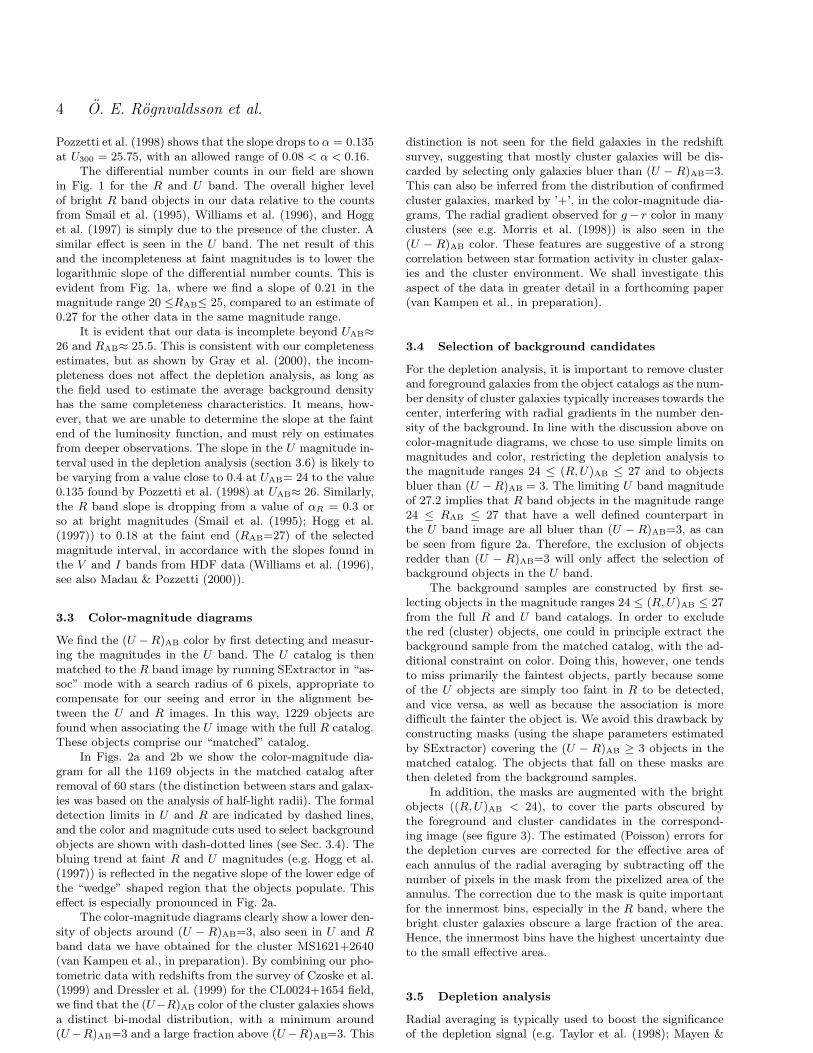
Figure 3. (a) The R band mask used in the depletion analysis superimposed on the R band image of CL0024+1654. Objects brighterthan RAB= 24 and redder than (U −R)AB= 3 are masked out. The background objects are marked with ‘+’. (b) Same as (a) for the U
band. Objects brighter than UAB= 24 and redder than (U − R)AB= 3 are masked out.
where N(ri) are the actual number counts in the annuluscentered on ri, and Nexp(ri) = n0Aeff(ri) is the expectednumber of counts in the annulus. Then,
∆n(ri)
n0= (n0Aeff(ri))
−1/2.
Given an uncertainty in the absolute background density,∆n0, a more conservative estimate of the uncertainty is
∆
(
n(ri)
n0
)
=
(
(
∆n(ri)
n0
)2
+
(
n(ri)∆n0
n20
)2)1/2
. (3)
We have made simple estimates of the intrinsic uncertaintyin n0 due to non-uniformity of the background, effects ofbright objects, etc, by masking out each of the four quad-rants of the images in turn, numbered counter-clockwisefrom the NE quadrant. The four values of the backgroundobtained in this way are then used to form a standard jack-knife estimate the variance of n0. We find that σU (n0) = 2.2and σR(n0) = 7.2. The errors indicated on Fig. 4a and 4b in-clude a fractional uncertainty η = ∆n0/n0 of ηR = 7.2/49 =0.15 and ηU = 2.2/28 = 0.08, respectively. Note, that anerror in n0 only affects the normalization of the depletioncurve, while the relative depletion does not change. The es-timated background density in the R band is strongly influ-enced by quadrant 2, where the density of selected objectsis markedly higher than in the other three quadrants. Theform of the depletion curves is however robust. The varia-tion in the R band may at least partly be explained by ahigher background flux in quadrants 3 and 4, due to brightstars. The background flux in the U band is more uniformacross the whole field. The estimated values of η should onlybe taken as an indication of the level of uncertainty in n0.
The depletion curves in the R and U band are shown
in Fig. 4. A clear sign of depletion is seen in both bands. Inthe R band the density falls steadily from a radius of around100′′ all the way to the center. Most lens models predicta turn-up in the density inside the innermost critical line;the indication seen here in the innermost two bins is non-significant due to the obscuration of the foreground galaxies.On the other hand, it is easier to detect faint backgroundobjects closer to the cluster center in the U band, since thedominant cluster galaxies are all quite red. Given that weare successful in identifying cluster members, the observedturn-up is quite sharp and significant in the U band.
Our data is not complete to sufficiently faint magni-tudes to allow estimation of the slopes αR and αU , for themagnitude ranges involved. However, we find that most ofthe depletion signal in the U band is due to galaxies with24 < UAB < 26.5, which indicates that the slope has alreadydropped well below 0.4 in this magnitude range. This is atodds with the results of Hogg et al. (1997), who found aslope of 0.467 down to U13 = 25.5, roughly correspondingto UAB=26.3. The recent investigation by Volonteri et al.(2000) of the HDF-S shows no evidence of a break either,down to the faintest magnitude bin of UAB=26.5.
Although the data may not warrant a detailed quanti-tative interpretation of the depletion curves, especially whentaking the uncertainty in the slope, α, and unlensed back-ground estimate, n0, into account, it is in principle possi-ble to use multiband depletion measurements to constrainthe properties of the background population (see e.g. Tay-lor et al. (1998); Bartelmann & Schneider (1999); Mayen &Soucail (2000), and references therein) due to the depen-dence on the slope of the luminosity function. The redshiftdistribution of the background objects will also affect thewidth and position of the minimum of the depletion curve,essentially through the dependence of the Einstein radius on

Depletion due to the cluster lens CL0024+1654 7
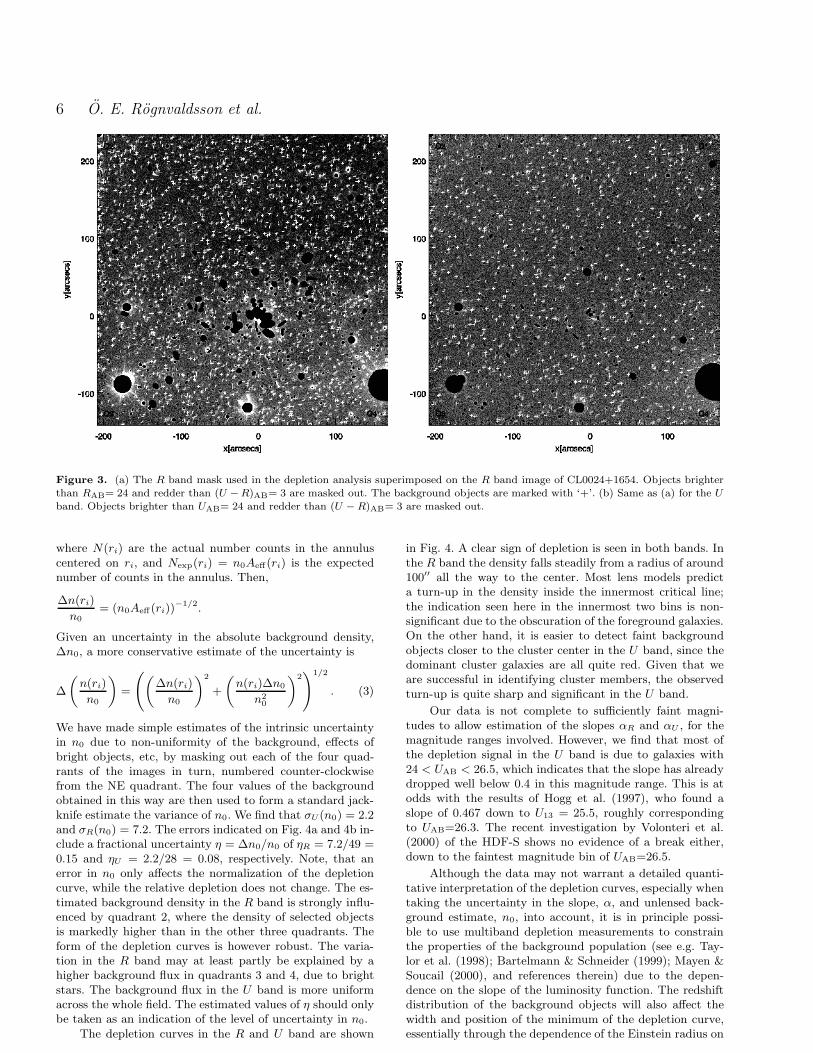
the lens-source distance. In Fig. 4, we compare the radiallyaveraged data to the singular isothermal sphere (SIS) modeldescribed in section 3.6. In case of the R band depletioncurve, results for αR = 0.15 and 0.2 are shown, with theEinstein radius rE = 25′′. In addition, we show the theo-retical depletion curve for rE = 40′′ and αR = 0.32. TheU band depletion is compared to models with αU = 0.15and 0.2, with a fixed Einstein radius of rE = 20′′, as wellas to αU = 0.32 and rE = 32′′. (This choice of parametersis dictated by results of the maximum likelihood analysisin section 3.6.) We note that the depletion curve is betterrepresented by the rE = 25′′ and rE = 20′′ models in the Rand U bands, respectively.
3.6 Einstein radius estimates
We use the maximum likelihood approach developed bySchneider et al. (2000) and Gray et al. (2000) to investigatethe depletion in more detail. A singular isothermal sphere(SIS) model, where the magnification is a simple function ofthe distance from the center of the lens, r, and its Einsteinradius,
µSIS(r; rE) =
∣
∣
∣
∣
1
1 − rE/r
∣
∣
∣
∣
,
is used to calculate the likelihood as a function of a single pa-rameter, the Einstein radius rE. Recall, that the theoreticaldepletion curve is in this case given by
n(r)
n0=
∣
∣
∣
∣
1
1 − rE/r
∣
∣
∣
∣
β−1
where the slope of the luminosity function is β = 2.5α. Forsimplicity, we adopt a constant slope, noting that a propertreatment of our data would take the variation in α intoaccount, since we are very likely probing a transition regionin both the R and U bands. We take the (unknown) uncer-tainty in the unlensed background density into account, us-ing the likelihood function (see Gray et al. (2000), Eq. (10)),
log L(η)µ ≡ l(η)
µ = −n0I + (β − 1)
N∑
i=1
log µ(θi)
+N log n0 −(n0 − n0)
2
2(ηn0)2(4)
where I =∫
d2θ(µ(θ))β−1, and
n0
n0= ν + (ν2 + η2N)1/2 (5)
with ν = 12(1 − ηn0I). The first term in Eq. (4) stems from
the likelihood of observing a total of N galaxies in the wholefield, while the second term is the log-likelihood for findingthose N galaxies at the observed positions θi = (ri, θi) inpolar coordinates. The third term is just a normalization,but is needed in this case as we include prior informationon n0, taken to be a Gaussian with mean n0 and dispersionηn0. The maximum likelihood estimate of n0 is then givenby Eq. (5), and is inserted back into Eq. (4) to obtain thelog-likelihood. Note, that the model parameters (rE in theSIS case) are all hidden in the magnification µ.
To assess the effect of the uncertainty in n0 we studyfour values of the dispersion by setting η = 0, 0.05, 0.1, and
0.15. The highest value is probably a conservative estimatetaking clustering of the background into account, given thelatest measurements of the two point correlation function(Fynbo et al. (2000)), which indicate insignificant correla-tion beyond 10′′ for the magnitude range considered here.The estimated amplitude of the two point correlation func-tion in the U band is even lower (Brunner et al. (2000)),making the U band depletion less sensitive to errors due toclustering. Possible bias in the estimated unlensed densityis studied by shifting n0 up by 10%. We would expect theestimated n0 to be biased low relative to the true value n0,since the depletion due to the cluster probably extends be-yond the inner radius ri = 150′′. Contamination by clustermembers would however work in the other direction, and itis difficult to disentangle the two effects with our data. Byvarying the inner radius ri from 150′′ to 220′′ we find thatthe U band background density is quite stable, while in theR band n0 does indeed increase by roughly 10%, going to54 arcmin−2 at ri = 200′′.
We also study the dependence of the estimated Ein-stein radius on the slope in the range 0.1 ≤ α ≤ 0.4. In theU band, αU = 0.135 is appropriate for UAB> 25.5, but since50% of the selected background galaxies in the magnituderange 24 ≤UAB≤ 27 are brighter than this, we expect theeffective slope to be steeper. Similarly, in the R band, theslope at the bright end is of order 0.32, dropping to ≈ 0.18at the faint end (Smail et al. (1995); Williams et al. (1996);Madau & Pozzetti (2000)). As 50% of the background can-didates have RAB> 25.3, the effective slope probably lies inthis range. The uncertainties, ∆rE, quoted below are esti-mated as the width of the likelihood function, L
(η)µ ,
∆rE =
∫
(r′E − rE)2L(η)µ dr′E
∫
L(η)µ dr′E
, (6)
where rE is the estimated value of the Einstein radius, cor-responding to the maximum of L
(η)µ .
The results of this analysis for the R and U band areshown in Fig. 5, where the estimated Einstein radius, rE, isplotted as a function of the slope α for values of the disper-sion parameter η in the expected range 0 − 0.15. The errorbars indicate ±∆rE. The estimated rE grows with increasingα, up to α = 0.4 where the theoretical depletion signal van-ishes. The effect of increasing α is to lower the log-likelihoodat small rE, so that local maxima at higher rE take over asglobal maxima, causing discrete jumps in the (α, rE) plots.
Increasing η tilts the l(η)µ curve upwards at high rE, but for
η ≥ 0.05 the estimated rE is not very sensitive to this param-eter. Assuming that our unlensed background estimate n0 isbiased low relative to the true value by about 10%, we findthat even the η = 0 estimates of rE are compatible with theη ≥ 0.05 cases. The dependence of the log-likelihood l
(η)µ on
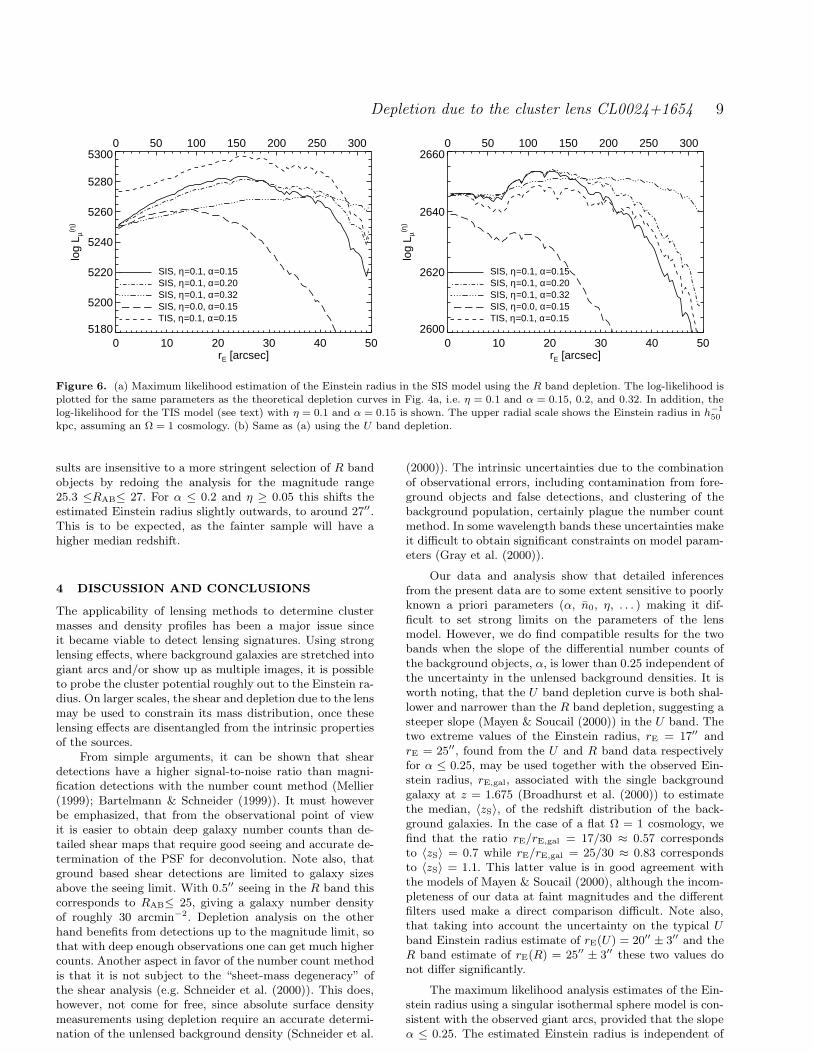
the parameters α and η is shown in Fig 6 where we plot l(η)µ
as a function of the Einstein radius, rE, for selected values ofthese parameters. We simply tabulate l
(η)µ with ∆rE = 0.5′′
and take the estimated Einstein radius to be the rE wherethe tabulated function is maximized. The dips in the l
(η)µ
curves are caused by galaxies that happen to lie close to thecurrent rE (the critical line being tested), where the secondterm in Eq. 4 dominates, and the probability of finding agalaxy vanishes.
8 O. E. Rognvaldsson et al.
0 50 100 150 200 250r [arcsec]
0.0
0.5
1.0
1.5
2.0
n/n 0
0 500 1000 1500
dataα=0.15, rE=25"α=0.20, rE=25"α=0.32, rE=40"
0 50 100 150 200 250r [arcsec]
0.0
0.5
1.0
1.5
2.0
n/n 0
0 500 1000 1500
dataα=0.15, rE=20"α=0.20, rE=20"α=0.32, rE=32"
Figure 4. (a) Normalized density of faint R band galaxies as a function of radius from the center of CL0024+1654. The selectedmagnitude range is 24 ≤ RAB ≤ 27, and the radial binsize is 10′′. The upper radial scale shows the distance from the center in h−1
50kpc, assuming an Ω = 1 cosmology. The data is compared to three singular isothermal sphere (SIS) models, with rE,α=25′′, 0.15,25′′,0.2, and 40′′,0.32. (b) Same figure for the U band. The selected magnitude range is 24 ≤ UAB ≤ 27. Here, the SIS models shownhave rE,α=20′′, 0.15, 20′′,0.2, and 32′′,0.32.
0.10 0.20 0.30 0.40α
0
10
20
30
40
50
r E [a
rcse
c]
0
50
100
150
200
250
300SIS, R bandη=0η=0.05η=0.10η=0.15biased, η=0
0.10 0.20 0.30 0.40α
0
10
20
30
40
50
r E [a
rcse
c]
0
50
100
150
200
250
300SIS, U bandη=0η=0.05η=0.10η=0.15biased, η=0
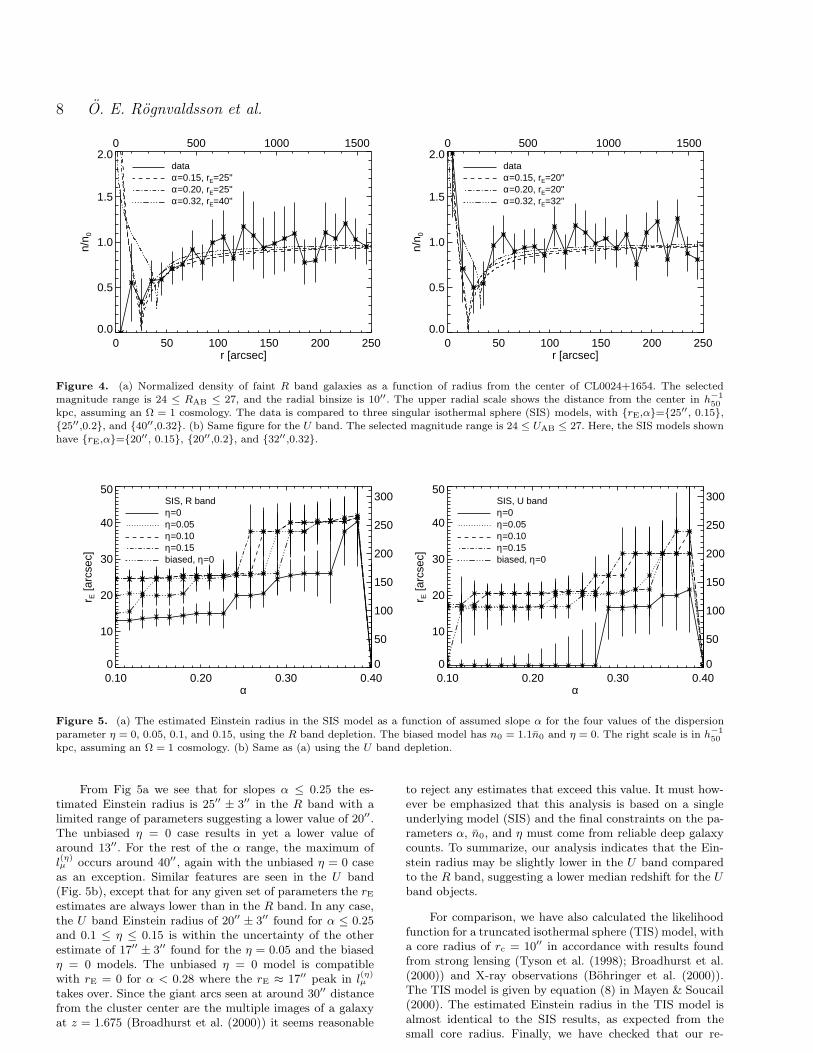
Figure 5. (a) The estimated Einstein radius in the SIS model as a function of assumed slope α for the four values of the dispersion
parameter η = 0, 0.05, 0.1, and 0.15, using the R band depletion. The biased model has n0 = 1.1n0 and η = 0. The right scale is in h−150
kpc, assuming an Ω = 1 cosmology. (b) Same as (a) using the U band depletion.
From Fig 5a we see that for slopes α ≤ 0.25 the es-timated Einstein radius is 25′′ ± 3′′ in the R band with alimited range of parameters suggesting a lower value of 20′′.The unbiased η = 0 case results in yet a lower value ofaround 13′′. For the rest of the α range, the maximum ofl(η)µ occurs around 40′′, again with the unbiased η = 0 caseas an exception. Similar features are seen in the U band(Fig. 5b), except that for any given set of parameters the rE
estimates are always lower than in the R band. In any case,the U band Einstein radius of 20′′ ± 3′′ found for α ≤ 0.25and 0.1 ≤ η ≤ 0.15 is within the uncertainty of the otherestimate of 17′′ ± 3′′ found for the η = 0.05 and the biasedη = 0 models. The unbiased η = 0 model is compatiblewith rE = 0 for α < 0.28 where the rE ≈ 17′′ peak in l
(η)µ
takes over. Since the giant arcs seen at around 30′′ distancefrom the cluster center are the multiple images of a galaxyat z = 1.675 (Broadhurst et al. (2000)) it seems reasonable
to reject any estimates that exceed this value. It must how-ever be emphasized that this analysis is based on a singleunderlying model (SIS) and the final constraints on the pa-rameters α, n0, and η must come from reliable deep galaxycounts. To summarize, our analysis indicates that the Ein-stein radius may be slightly lower in the U band comparedto the R band, suggesting a lower median redshift for the Uband objects.
For comparison, we have also calculated the likelihoodfunction for a truncated isothermal sphere (TIS) model, witha core radius of rc = 10′′ in accordance with results foundfrom strong lensing (Tyson et al. (1998); Broadhurst et al.(2000)) and X-ray observations (Bohringer et al. (2000)).The TIS model is given by equation (8) in Mayen & Soucail(2000). The estimated Einstein radius in the TIS model isalmost identical to the SIS results, as expected from thesmall core radius. Finally, we have checked that our re-
Depletion due to the cluster lens CL0024+1654 9
0 10 20 30 40 50rE [arcsec]
5180
5200
5220
5240
5260
5280
5300
log
L µ(η
)
0 50 100 150 200 250 300
SIS, η=0.1, α=0.15SIS, η=0.1, α=0.20SIS, η=0.1, α=0.32SIS, η=0.0, α=0.15TIS, η=0.1, α=0.15
0 10 20 30 40 50rE [arcsec]
2600
2620
2640
2660
log
L µ(η
)
0 50 100 150 200 250 300
SIS, η=0.1, α=0.15SIS, η=0.1, α=0.20SIS, η=0.1, α=0.32SIS, η=0.0, α=0.15TIS, η=0.1, α=0.15
Figure 6. (a) Maximum likelihood estimation of the Einstein radius in the SIS model using the R band depletion. The log-likelihood isplotted for the same parameters as the theoretical depletion curves in Fig. 4a, i.e. η = 0.1 and α = 0.15, 0.2, and 0.32. In addition, thelog-likelihood for the TIS model (see text) with η = 0.1 and α = 0.15 is shown. The upper radial scale shows the Einstein radius in h−1
50kpc, assuming an Ω = 1 cosmology. (b) Same as (a) using the U band depletion.
sults are insensitive to a more stringent selection of R bandobjects by redoing the analysis for the magnitude range25.3 ≤RAB≤ 27. For α ≤ 0.2 and η ≥ 0.05 this shifts theestimated Einstein radius slightly outwards, to around 27′′.This is to be expected, as the fainter sample will have ahigher median redshift.
4 DISCUSSION AND CONCLUSIONS
The applicability of lensing methods to determine clustermasses and density profiles has been a major issue sinceit became viable to detect lensing signatures. Using stronglensing effects, where background galaxies are stretched intogiant arcs and/or show up as multiple images, it is possibleto probe the cluster potential roughly out to the Einstein ra-dius. On larger scales, the shear and depletion due to the lensmay be used to constrain its mass distribution, once theselensing effects are disentangled from the intrinsic propertiesof the sources.
From simple arguments, it can be shown that sheardetections have a higher signal-to-noise ratio than magni-fication detections with the number count method (Mellier(1999); Bartelmann & Schneider (1999)). It must howeverbe emphasized, that from the observational point of viewit is easier to obtain deep galaxy number counts than de-tailed shear maps that require good seeing and accurate de-termination of the PSF for deconvolution. Note also, thatground based shear detections are limited to galaxy sizesabove the seeing limit. With 0.5′′ seeing in the R band thiscorresponds to RAB≤ 25, giving a galaxy number densityof roughly 30 arcmin−2. Depletion analysis on the otherhand benefits from detections up to the magnitude limit, sothat with deep enough observations one can get much highercounts. Another aspect in favor of the number count methodis that it is not subject to the “sheet-mass degeneracy” ofthe shear analysis (e.g. Schneider et al. (2000)). This does,however, not come for free, since absolute surface densitymeasurements using depletion require an accurate determi-nation of the unlensed background density (Schneider et al.
(2000)). The intrinsic uncertainties due to the combinationof observational errors, including contamination from fore-ground objects and false detections, and clustering of thebackground population, certainly plague the number countmethod. In some wavelength bands these uncertainties makeit difficult to obtain significant constraints on model param-eters (Gray et al. (2000)).
Our data and analysis show that detailed inferencesfrom the present data are to some extent sensitive to poorlyknown a priori parameters (α, n0, η, . . . ) making it dif-ficult to set strong limits on the parameters of the lensmodel. However, we do find compatible results for the twobands when the slope of the differential number counts ofthe background objects, α, is lower than 0.25 independent ofthe uncertainty in the unlensed background densities. It isworth noting, that the U band depletion curve is both shal-lower and narrower than the R band depletion, suggesting asteeper slope (Mayen & Soucail (2000)) in the U band. Thetwo extreme values of the Einstein radius, rE = 17′′ andrE = 25′′, found from the U and R band data respectivelyfor α ≤ 0.25, may be used together with the observed Ein-stein radius, rE,gal, associated with the single backgroundgalaxy at z = 1.675 (Broadhurst et al. (2000)) to estimatethe median, 〈zS〉, of the redshift distribution of the back-ground galaxies. In the case of a flat Ω = 1 cosmology, wefind that the ratio rE/rE,gal = 17/30 ≈ 0.57 correspondsto 〈zS〉 = 0.7 while rE/rE,gal = 25/30 ≈ 0.83 correspondsto 〈zS〉 = 1.1. This latter value is in good agreement withthe models of Mayen & Soucail (2000), although the incom-pleteness of our data at faint magnitudes and the differentfilters used make a direct comparison difficult. Note also,that taking into account the uncertainty on the typical Uband Einstein radius estimate of rE(U) = 20′′ ± 3′′ and theR band estimate of rE(R) = 25′′ ± 3′′ these two values donot differ significantly.
The maximum likelihood analysis estimates of the Ein-stein radius using a singular isothermal sphere model is con-sistent with the observed giant arcs, provided that the slopeα ≤ 0.25. The estimated Einstein radius is independent of
10 O. E. Rognvaldsson et al.
the dispersion of the unlensed background density, parame-terized by η, provided that our estimate of the backgrounddensity is biased low. We would indeed expect that to bethe case since the cluster is likely to deplete the backgrounddensity beyond the 150′′ assumed in our estimation of thebackground density. We conclude that although it is difficultto draw strong conclusions about e.g. the different galaxypopulations probed with the two bands without a more rig-orous treatment of the effects of a variable α and firmerestimates of the unlensed background densities, we do getresults that are consistent with results obtained by differentmethods by others.
One of the main aims of our work was to look for de-pletion of background galaxies in the U band. Our dataclearly show this effect towards the cluster CL0024+1654,giving independent evidence for a flattening to a slope β < 1(α < 0.4) at the faint end of the U band luminosity func-tion. While the reality of this flattening is still debatable(e.g. Pozzetti et al. (1998); Volonteri et al. (2000)), furtherdepletion studies in the U band will help to constrain theslope of the number counts in this band. It is clear that ul-timately the shape of the number counts at faint U bandmagnitudes must be determined from deep, reliable obser-vations in the field. This would also settle the absolute un-lensed density of background sources, both of which is nec-essary for making U band depletion a reliable tool in clusterstudies.
As the dominant cluster galaxies are relatively faint inthe U band, we are able to measure the background numberdensity close to the cluster center accurately enough to finda significant turn-up in the density as expected from simplelens models. This strengthens the indication of a turn-upin the R band, where the estimated background density isstarting to increase before reaching the innermost parts ofthe cluster where the foreground objects cover a too largefraction of the available area to warrant a significant mea-surement.
With the present data, where the background densityis of order 30 − 50 arcmin−2, the inherent uncertainties ofthe number count method still give rather loose bounds onlens model parameters, both when fitting models to radiallyaveraged depletion curves, and when more elaborate maxi-mum likelihood analysis is applied. It goes without sayingthat with deeper number counts towards lenses, and bet-ter estimates of the properties of the unlensed backgroundpopulation, the reliability of the number count method willincrease. Some of the difficulties of the parametric modelinginherent to these methods may however also be alleviatedby using more sophisticated, non-parametric methods. Weplan to study this in more detail for the data presented inthis paper.
ACKNOWLEDGEMENTS
This work was supported in part by the Danish ResearchFoundation (through its establishment of the TheoreticalAstrophysics Center), The Icelandic Research Council, TheResearch Fund of the University of Iceland, The Danish Nat-ural Science Research Council (SNF), and by the “Access toLarge-Scale Facilities” program of the European commis-sion of the EU. The Nordic Optical Telescope is operated
on the island of La Palma jointly by Denmark, Finland,Iceland, Norway and Sweden, in the Spanish Observatoriodel Roque de los Muchachos of the Instituto de Astrofisicade Canarias. We are indebted to Ian Smail, David Hogg,and Lucia Pozzetti for providing data on galaxy numbercounts, and to Oliver Czoske for providing redshift data forCL0024+1654. We thank the referee for useful commentsand suggestions.
REFERENCES
Athreya R., Mellier Y., van Waerbeke L., Fort B., Pello R.,Dantel-Fort M., 2000, A&A, submitted
Bartelmann M., Schneider P., 1999, Weak gravitationallensing
Bertin E., Arnouts S., 1996, A&AS, 117, 393Bezecourt J., Kneib J.-P., Soucail G., Ebbels T. M. D.,1999, A&A, 347, 21
Bohringer H., Soucail G., Mellier Y., Ikebe Y., SchueckerP., 2000, A&A, submitted
Bonnet H., Mellier Y., Fort B., 1994, ApJ, 427, L83Broadhurst T., Huang X., Frye B., Ellis R., 2000, ApJ, 534,L15
Broadhurst T. J., Taylor A. N., Peacock J. A., 1995, ApJ,438, 49
Brunner R. J., Szalay A. S., Connolly A. J., 2000, ApJ,accepted
Clowe D., Luppino G. A., Kaiser N., Henry J. P., GioiaI. M., 1998, ApJ, 497, L61
Czoske O., Soucail G., Kneib J.-P., Bridges T., CuillandreJ.-C., Mellier Y., 1999, in Gravitational lensing: Recentprogress and future goals. A wide-field spectroscopic sur-vey in the cluster lens Cl0024+17. Boston University
Davis L., , 1999, private communicationsDressler A., Gunn J. E., 1992, ApJS, 78, 1Dressler A., Gunn J. E., Schneider D. P., 1985, ApJ, 294,70
Dressler A., Smail I., Poggianti B. M., Butcher H., CouchW. J., Ellis R. S., Oemler A. J., 1999, ApJS, 122, 51
Dye S., Taylor A., 1998, MNRAS, 300, L23Dye S., Taylor A. N., Thommes E. M., Meisenheimer K.,Wolf C., Peacock J. A., 2000, MNRAS, submitted
Fort B., Mellier Y., Dantel-Fort M., 1997, A&A, 321, 353Fruchter A. S., Hook R. N., 1997, Astron. Data Soft-ware and Systems, VI, 147
Fukugita M., Shimasaku K., Ichikawa T., 1995, PASP, 107,945
Fynbo J. U., Freudling W., Moller P., 2000, A&A, 355, 37Gray M. E., Ellis R. S., Refregier A., Bezecourt J., McMa-hon R. G., Beckett M. G., Mackay C. D., Hoenig M. D.,2000, MNRAS, submitted
Greve T., 2000, Master’s thesis, University of CopenhagenHoekstra H., Franx M., Kuijken K., 2000, ApJ, 532, 88Hogg D. W., Pahre M. A., McCarthy J. K., Cohen J. G.,Blandford R., Smail I., Soifer B. T., 1997, MNRAS, 288,404
Hook R. N., Pirzkal N., Fruchter A. S., 1999, As-tron. Data Software and Systems, VIII, 337
Joffre M., Fischer P., Frieman J., McKay T., Mohr J. J.,Nichol R. C., Johnston D., Sheldon E., Bernstein G., 2000,ApJ, 534, L131

Depletion due to the cluster lens CL0024+1654 11
Kaiser N., Squires G., Broadhurst T., 1995Koo D. C., 1988, in Rubin V. G., Coyne G. V., eds, LargeScale Motions in the Universe Princeton University Press
Landolt A. U., 1983, AJ, 88, 439Luppino G. A., Kaiser N., 1997, ApJ, 475, 20Madau P., Pozzetti L., 2000, MNRAS, 312, L9Mayen C., Soucail G., 2000, A&A, submittedMellier Y., 1999, ARA&A, 37Morris S. L., Hutchings J. B., Carlberg R. G., Yee H. K. C.,Ellingson E., Balogh M. L., Abraham R. G., Smecker-Hane T. A., 1998, ApJ, 507, 84
Mutchler A., Fruchter A. S., 1997, Am. Astron. Soc. Meet-ing, 191, 4107
Pozzetti L., Madau P., Zamorani G., Ferguson H. C.,Bruzual A. G., 1998, MNRAS, 298, 1133
Schneider D. P., Dressler A., Gunn J. E., 1986, AJ, 92, 523Schneider P., King L., Erben T., 2000, A&A, 353, 41Shapiro P., Iliev I., 2000, ApJ, submittedSmail I., Dickinson M., 1995, ApJ, 455, L99Smail I., Hogg D., Yan L., Cohen J., 1995, ApJ, 449, L105Soucail G., Ota N., Bohringer H., Czoske O., Hattori M.,Mellier Y., 2000, A&A, 355, 433
Taylor A. N., Dye S., Broadhurst T. J., Benitez N., vanKampen E., 1998, ApJ, 501, 539
Tyson J. A., Kochanski G. P., dell’Antonio I. P., 1998, ApJ,498, L107
van Kampen E., 1998, MNRAS, 301, 389Volonteri M., Saracco P., Chincarini G., Bolzonella M.,2000, A&A, accepted
Williams R. E., Blacker B., Dickinson M., Dixon W. V. D.,Ferguson H. C., Fruchter A. S., Giavalisco M., GillilandR. L., Heyer I., Katsanis R., Levay Z., Lucas R. A., MCEl-roy D. B., Petro L., Postman M., Adorf H. M., Hook R.,1996, AJ, 112, 1335
Copyright © 2022 FDOKUMEN