Experimental sodium depletion and salt taste in normal ...
9
Am J C/in Nuir 1990;5 1:881-9. Printed in USA. © 1990 American Society for Clinical Nutrition 881 Experimental sodium depletion and salt taste in normal human volunteers13 Gary K Beauchamp, Mary Bertino, Darlene Burke, and Karl Engelman ABSTRACT To examine the sensory effects ofextreme so- dium depletion in humans, 10 normal volunteers were fed a very-low-sodium diet and were treated with diuretics for 10 d. Urine samples were collected and blood was drawn for hor- mone analyses. Taste tests included threshold and intensity judgments of salt (NaC1) and sucrose and preferences for salt and sucrose in foods. Subjects also rated the pleasantness of 29 foods listed on a questionnaire. Substantial sodium depletion was induced in all subjects. Salt thresholds decreased in a ma- jority of the subjects whereas preference judgments for salt in foods tended to be greater during the depletion period. The changes in pleasantness of the 29 foods revealed that saltier foods were substantially more attractive during the depletion period than during the pre- and postdepletion periods. These data indicate that experimental sodium depletion in humans is followed by moderate sensory changes and an increased prefer- ence for salty foods. Am J Clin Nutr I 990;5 1:881-9. KEY WORDS Sodium depletion, taste, salt, human Introduction The ability of animals to taste sodium presumably evolved as a result of the critical nature of this nutrient and its patchy distribution ( 1 , 2). Many herbivorous and omnivorous animals respond to sodium deficit with increased activity and a height- ened tendency toward oral exploration of novel aspects of the environment. When a source ofsodium is encountered, its dis- tinctive taste is innately recognized and ingestion to correct the deficit proceeds (2). Although there is considerable work on the effects of sodium depletion on taste and in animal models (3-8), remarkably lit- tle work has been done on the sensory effects ofsodium deple- tion in humans. Much ofwhat is available is anecdotal, uncon- trolled, and subject to experimental bias because the experi- menter and subject were often the same individual or because the study was conducted at a time when appropriate proce- dures were not well developed and validated. The fact that adult humans develop a specific appetite or craving for salt when sodium is deficient is not well established although it is widely assumed (9, 10). Because many behavioral as well as neurophysiobogical responses to salt differ among rats, sheep, and humans, it is questionable whether rats and sheep provide a good model for humans (2, 4, 1 1-13). Historical and anthropological sources (2, 14, 1 5) document the remarkable effort humans have devoted to securing salt and provide circumstantial evidence that salt insufficiency stimu- bates a kind of salt appetite. The most dramatic illustration of a depletion-specific sodium appetite in humans came from the observation of a child with adrenal insufficiency and sodium wasting (16, 17). This child demonstrated what appeared to be a specific craving for salt. After being placed on a controlled hospital diet, the child died when not allowed to satisfy the craving. Although the written account ofthis case is both pow- erful and convincing, it does represent a single uncontrolled clinical case. There are a number of other similar clinical descriptions of salt appetite (18-23). In almost every one of these cases, the onset of the extreme salt appetite was in childhood although the underlying medical problem varied. There have been very few documented cases of salt appetite with adult onset. In one report, 16% (10 of64) ofpatients with adrenal insufficiency exhibited “. . . a definitely increased de- sire for salt and salty foods” (24). The time of onset of this symptom was not reported. In a widely cited monograph on Addison’s disease (25), 19% is given as the incidence of salt craving. Yet salt appetite or craving is not listed as one of the nine signs and symptoms of this disease. Knowles and Asher (26) described the case of a 36-y-obd male with Addison’s dis- ease who developed a salt appetite; he ate 2500 g salty black olives a day. The patient also had a specific appetite for licorice, a food flavor that contains compounds with mineralocorticoid activity. Knowles and Asher (26) indicate that licorice appetite is as common a symptom of Addison’s disease as is salt appe- tite. Indeed, Cotterill and Cunliffe (27) report on an adult with Addison’s disease who denied craving salt but instead craved licorice sweets, consuming 340 g/d. Whether the salt and/or licorice candy actually tasted especially good to these patients or whether the patients had merely learned that consumption of these items relieved symptoms, as might be the case for a I From the Monell Chemical Senses Center and the Department of Medicine and Pharmacology, School ofMedicine, University of Penn- sylvania, Philadelphia. 2 Supported by grant HL 3 1736 from NIH and grant RR 00040 from the Clinical Research Center, Hospital ofthe University of Pennsylva- nia. 3 Address reprint requests to GK Beauchamp, Monell Chemical Senses Center, 3500 Market Street, Philadelphia, PA 19104. Received February 2 1 , 1989. Accepted for publication July 5, 1989. at PENNSYLVANIA STATE UNIV PATERNO LIBRARY on February 23, 2013 ajcn.nutrition.org Downloaded from
-
Upload
khangminh22 -
Category
Documents
-
view
0 -
download
0
Transcript of Experimental sodium depletion and salt taste in normal ...

Am J C/in Nuir 1990;5 1:881-9. Printed in USA. © 1990 American Society for Clinical Nutrition 881
Experimental sodium depletion and salt tastein normal human volunteers13
Gary K Beauchamp, Mary Bertino, Darlene Burke, and Karl Engelman
ABSTRACT To examine the sensory effects ofextreme so-
dium depletion in humans, 10 normal volunteers were fed a
very-low-sodium diet and were treated with diuretics for 10 d.
Urine samples were collected and blood was drawn for hor-
mone analyses. Taste tests included threshold and intensity
judgments of salt (NaC1) and sucrose and preferences for salt
and sucrose in foods. Subjects also rated the pleasantness of 29
foods listed on a questionnaire. Substantial sodium depletion
was induced in all subjects. Salt thresholds decreased in a ma-
jority of the subjects whereas preference judgments for salt in
foods tended to be greater during the depletion period. The
changes in pleasantness of the 29 foods revealed that saltier
foods were substantially more attractive during the depletion
period than during the pre- and postdepletion periods. These
data indicate that experimental sodium depletion in humans is
followed by moderate sensory changes and an increased prefer-
ence for salty foods. Am J Clin Nutr I 990;5 1:881-9.
KEY WORDS Sodium depletion, taste, salt, human
Introduction
The ability of animals to taste sodium presumably evolved
as a result of the critical nature of this nutrient and its patchy
distribution ( 1 , 2). Many herbivorous and omnivorous animals
respond to sodium deficit with increased activity and a height-
ened tendency toward oral exploration of novel aspects of the
environment. When a source ofsodium is encountered, its dis-
tinctive taste is innately recognized and ingestion to correct the
deficit proceeds (2).
Although there is considerable work on the effects of sodium
depletion on taste and in animal models (3-8), remarkably lit-
tle work has been done on the sensory effects ofsodium deple-
tion in humans. Much ofwhat is available is anecdotal, uncon-
trolled, and subject to experimental bias because the experi-
menter and subject were often the same individual or because
the study was conducted at a time when appropriate proce-
dures were not well developed and validated. The fact that
adult humans develop a specific appetite or craving for salt
when sodium is deficient is not well established although it is
widely assumed (9, 10). Because many behavioral as well as
neurophysiobogical responses to salt differ among rats, sheep,
and humans, it is questionable whether rats and sheep provide
a good model for humans (2, 4, 1 1-13).
Historical and anthropological sources (2, 14, 1 5) document
the remarkable effort humans have devoted to securing salt and
provide circumstantial evidence that salt insufficiency stimu-
bates a kind of salt appetite. The most dramatic illustration ofa depletion-specific sodium appetite in humans came from theobservation of a child with adrenal insufficiency and sodium
wasting (16, 17). This child demonstrated what appeared to be
a specific craving for salt. After being placed on a controlled
hospital diet, the child died when not allowed to satisfy the
craving. Although the written account ofthis case is both pow-
erful and convincing, it does represent a single uncontrolled
clinical case.
There are a number of other similar clinical descriptions of
salt appetite (18-23). In almost every one of these cases, the
onset of the extreme salt appetite was in childhood although
the underlying medical problem varied.
There have been very few documented cases of salt appetitewith adult onset. In one report, 16% (10 of64) ofpatients with
adrenal insufficiency exhibited “. . . a definitely increased de-sire for salt and salty foods” (24). The time of onset of this
symptom was not reported. In a widely cited monograph on
Addison’s disease (25), 19% is given as the incidence of salt
craving. Yet salt appetite or craving is not listed as one of the
nine signs and symptoms of this disease. Knowles and Asher
(26) described the case of a 36-y-obd male with Addison’s dis-
ease who developed a salt appetite; he ate � 2500 g salty blackolives a day. The patient also had a specific appetite for licorice,
a food flavor that contains compounds with mineralocorticoid
activity. Knowles and Asher (26) indicate that licorice appetite
is as common a symptom of Addison’s disease as is salt appe-
tite. Indeed, Cotterill and Cunliffe (27) report on an adult with
Addison’s disease who denied craving salt but instead cravedlicorice sweets, consuming 340 g/d. Whether the salt and/or
licorice candy actually tasted especially good to these patients
or whether the patients had merely learned that consumption
of these items relieved symptoms, as might be the case for a
I From the Monell Chemical Senses Center and the Department of
Medicine and Pharmacology, School ofMedicine, University of Penn-
sylvania, Philadelphia.2 Supported by grant HL 3 1736 from NIH and grant RR 00040 from
the Clinical Research Center, Hospital ofthe University of Pennsylva-
nia.
3 Address reprint requests to GK Beauchamp, Monell ChemicalSenses Center, 3500 Market Street, Philadelphia, PA 19104.
Received February 2 1 , 1989.Accepted for publication July 5, 1989.
at PE
NN
SY
LVA
NIA
ST
AT
E U
NIV
PA
TE
RN
O LIB
RA
RY
on February 23, 2013
ajcn.nutrition.orgD
ownloaded from

T I I I I
882 BEAUCHAMP ET AL
medicine that is taken even though it never really tastes good,
cannot be determined from the clinical reports. Finally,Shapiro and Linas (28) attribute the huge salt craving (600
mmol table salt/d) of a 33-y-old woman to an iron-deficiencydisorder. She claimed to ingest salt “by the shaker full” but did
not find it offensive; this pica disappeared after iron-replace-ment therapy. Mattes and Mela (29) reviewed other studies of
apparent increased sodium intake after depletion without anyovert indication of salt appetite or changes in preference for
salty foods.
Clinical studies ofsalt-taste sensitivity (eg, threshold) are alsoinfrequent. Henkin et al (30) found a nonspecific lowered
threshold (greater sensitivity) for taste compounds representingsalty, sweet, sour, and bitter among patients with adrenal in-
sufficiency. A report of increased taste sensitivity in older chil-
dren with cystic fibrosis (3 1) was not supported in subsequentstudies (32-34). One patient studied at age 20 y, who exhibited
a salt appetite from early childhood associated with primary
pulmonary arteriosclerosis, was reported to have a strikinglylow salt threshold (20).
Few attempts have been made to induce sodium depletionexperimentally in human volunteers. McCance (35) inducedsodium loss in four subjects over periods of 10 d with a com-
bination of very-low-salt diets and heavy sweating. In this in-tensive study, induced sweat was collected in rubber sheets and
all urine and feces were collected for analysis. Subjects lost � 22
g total sodium and there was a modest decrease in serum so-
dium. Although no formal taste evaluations were undertaken,McCance reported that foods (and even cigarettes) seemed
tasteless and that anorexia and nausea were prominent symp-toms. McCance, who was himself a subject in these experi-ments, reported no specific cravings for salt.
Yensen (36) used a procedure similar to McCance’s to in-
duce sodium loss in two subjects. Subjectively, the volunteers
adapted to the diet rather well with the exception of the low-sodium bread, which they found unpleasant. “Apart from the
feeling at meal times that some of the food would probably
‘taste nicer with some salt,’ no cravings for salt were felt byeither subject” (36). Significant increases in salt-taste sensitiv-
ity (lower thresholds) were found during the sodium-depletion
periods. However, because rather uncontrolled methods were
employed to evaluate threshold, the small reported changeswere possibly confounded with other factors such as changes inpreference and subject expectations (30). Mildly salty solutionswere reported to taste more salty when subjects were sodium
depleted but no data were presented to support this.de Wardener and Herxheimer (37) induced sodium deple-
tion by having two subjects (themselves) drink huge amounts
of water for a period of 12 d. Subjects were fed a diet low insodium but were allowed to use salt from a shaker. One subjectwas in substantial negative sodium balance throughout this pe-
riod while the second was only in slight negative balance. For
days 2-4, food was reported to be tasteless unless large amounts
ofsalt were added. Salt intake from shakers increased for both
subjects during the drinking period. Although a transient in-crease in salt-taste sensitivity occurred, sensitivity returned to
baseline before normalization ofsodium balance. These obser-vations suggested to the authors that there was an increased
desire for salt of central origin. Stinebaugh et al (38) evaluated
salt taste sensitivity in fasting patients. The patients exhibited
substantial negative sodium balance over the course ofthe fast
I
DOD 0 0 D 0
Dos XIIXH XXXXXXXXXXX � X Xy. 1234567891011
Pre-Depletion Depletion Post-Depletion
FIG 1. Design ofthe sodium depletion study illustrating the days onwhich diuretics(D)were administered and physiobogical(H, hormones,
and X, 24-h urine collections, blood pressures, and body weights, andpsychophysical (T, taste tests and food-item questionnaire) measures
were obtained. For six subjects, Ds were administered on days 1, 2, 3,
4, 6, 8, and 10. The time length of urine collections varied on day 1(admittance day, range 12-14 h.) and on day ofhospital discharge (day
ll,range8-14h).
(mean cumulative sodium balance, -94 mmol on day 5) but
there were no changes in salt-taste threshold.In summary, little is known about the sensory effects of so-
dium depletion in humans. Although anecdotal and clinical
reports suggest that an appetite or craving may develop, thismay be largely restricted to sodium depletion occurring duringinfancy or early childhood. Additionally, salt appetite has not
been reported in the few available experimental studies. Thereare suggestions from these studies that there is an increased de-
sire for salty foods, not salt itself. Those studies that seem todemonstrate increased sensitivity for salt during depletion used
taste-assessment methods now known to be imprecise. Indeed,animal neurophysiobogical studies are more consistent with oh-servations of a decrease in sensitivity after sodium depletion
rather than the increase occasionally reported. Because pro-found species differences are observed in many aspects of salt-
taste perception (2, 4, 1 1, 39), the literature concerning animalscannot be used to infer human experiences. On the basis of
these considerations, we evaluated salt-taste perception(threshold, intensity scaling, preference, and food desires)among normal subjects during sodium depletion. Because of
ethical considerations, our depletion regimen was not as strin-gent as some previously used (35).
Methods
Subjects
Ten Caucasian University of Pennsylvania students [sixmen, four women, age 21.9 ± 4.34 y (1 ± SD), range 18-33 y]
volunteered to participate in the study. Subjects were classified
as moderate- to high-salt consumers by their responses to a salt-attitude and -usage survey (40). All participants were in goodphysical health as determined by a medical examination. Eachwas paid for participation. Subjects were told that the purposeof the experiment was to investigate relationships among diet,diuretics, and taste though the details of the hypotheses tested
were not presented to them. The experimental protocol wasapproved by the Committee on Studies Involving Human Be-ings of the University of Pennsylvania. The protocol was cx-planed to each subject in advance and each signed a consent
form.
Procedure
The protocol is outlined in Figure 1. Subjects were requiredto stay in the Clinical Research Center (CRC) of the Hospital
at PE
NN
SY
LVA
NIA
ST
AT
E U
NIV
PA
TE
RN
O LIB
RA
RY
on February 23, 2013
ajcn.nutrition.orgD
ownloaded from

SODIUM DEPLETION AND SALT TASTE 883
et al (44).
ofthe University ofPennsylvania for 10 d. During this period,
sodium depletion was accomplished through administration of
diuretics and a very-low-sodium diet (�-‘ 10 mmol/d) prepared
by the CRC research diet kitchen. There was no restriction on
calorie or fluid consumption. None ofthe subjects were over-
weight. Subjects were assigned to receive one of two diuretics
orally. In one group subjects were administered furosemide (40mg) whereas the other group received ethacrynic acid (50 mg).
Both drugs are high-ceiling loop diuretics that can produce po-tassium as well as sodium depletion. Subjects received a total
ofseven drug administrations, the maximum considered advis-
able. Drugs were administered daily for the first 3 or 4 d ofhospitalization, then on alternate days for the remaining 7 or 8
d. For one individual (subject 10) it was necessary to eliminate
2 treatment days and to decrease the dosage from 40 to 20 mg
furosemide after day 2 because of hypotension, dizziness, and
headaches.
Physiological measures
During each day of the 10-d hospitalization period, blood
pressures were measured (while the subjects were supine andupright) four times and body weight was also recorded. Dailycomplete urine samples were collected during the l0-d hospi-talization period and were analyzed for sodium, potassium,
and creatinine. To estimate subjects’ customary salt intake on
ad libitum diets, two 24-h urine collections were made 1-3 wk
before depletion and again on 1 (n = 4) or 2 d (n = 5) 1-4 wkafter the depletion period. At these times, blood pressures and
body weight were also recorded. Plasma aldosterone concentra-
tions were obtained for 8 of 10 subjects before the depletionperiod and on day 8 of hospitalization. Renin measurementsduring the same periods were obtained for only four subjects.
On the last day ofhospitalization, all subjects received a saltydinner and 3 g enteric, coated salt tablets. An additional supply
ofsalt tablets was to be taken over the next several days. Within
a week ofdischarge they returned for follow-up laboratory tests
and physical examination and were questioned to be sure that
all salt tablets had been taken.
Psychophysical measures
Taste tests were conducted on 6 d throughout the study:twice 1-3 wk before hospitalization, days 6 (or 7 for three sub-
jects) and 1 1 of hospitalization, and 1-4 wk (n = 7) after dis-charge (Fig 1). In the pre- and postdepletion periods, taste test-
ing occurred during the same days on which physiological mea-
sures were obtained. Sodium chloride and sucrose detection
thresholds were determined during each test session. The possi-bility ofdifferential effects ofthe two drugs on the taste tests was
examined by use ofanalysis ofvariance (ANOVA) procedures
(4 1 ). Analyses were performed on the threshold measures (so-
dium chloride and sucrose separately), preference, food desir-
ability, and judgments of intensity. In addition, subjects rated
the intensity and the pleasantness of the food, and indicated
their preferred concentrations of salt in soup and sugar in a
fruit-flavored beverage (Kool-Aid, General Foods Co., WhitePlains, NY). Subjects also assigned a pleasantness rating toeach food item on a list of common foods. Those foods were
chosen to meet the following criteria: 1) they had to be familiar
and commonly consumed, and 2) they had to range from foodsseldom considered salty or consumed with added salt to those
always considered salty and containing substantial amounts ofsodium. The foods also exhibited a wide range of perceived
sweetness, fihlingness, fattiness, and healthfulness.
Threshold
Thresholds for sodium chloride and sucrose were obtainedby use of a forced-choice staircase procedure (42). Stimuli in-
cluded 18 proportionally spaced concentrations of reagentgrade sodium chloride and sucrose (0.08, 0. 12, 0. 18, . . . 0.80mmol/L). Solutions were prepared with double-distilled, de-ionized water and presented in plain medicine cups. A rinse
was interpolated between taste samples.Two cups were presented during each trial. One cup always
contained distilled, deionized water, whereas the other con-tamed a solution ofeither sodium chloride or sucrose. The sub-
ject was required to taste the contents of one cup, rinse, tastethe contents ofthe second cup, and report which cup contained
the solute. After two consecutive correct identifications (hits)the stimulus concentration was decreased to the next lowerconcentration. An incorrect response (miss) was followed byan increase in stimulus concentration. Alternating increasingand decreasing concentrations continued until six reversals inconcentration had been completed. Presentations of sodiumchloride or sucrose stimuli were alternated after each reversal.
The threshold value was defined as the geometric mean of theconcentrations at the last five reversals.
Intensity and hedonic ratings
Sodium chloride in crackers, sodium chloride in soup, andsucrose in the fruit-flavored beverage were used to measure re-
sponses to tastes in real foods. Judgments of intensity andpleasantness were obtained for five concentrations of sodium
chloride ( 157, 29 1 , 420, 7 1 3, and 1290 zmol/g) in crackers,
nine concentrations of added sodium chloride (60, 80, 120,180, 250, 350, 500, 700, and 990 mmol/L) in strained low-so-dium vegetable soup (Campbell Soup Co, Camden, NJ) (con-taming 10 mmol/L Na), and nine sucrose concentrations(70, 100, 150, 220, 320, 480, 700, 1020, and 1500 mmol/L)in a cherry-flavored beverage made in deionized water. Each
concentration within a set (crackers, soup, and fruit-flavoredbeverage) was presented three times and randomized withineach ofthe three sets. All concentrations contained in a set werepresented before a concentration was replicated; there was a
rinse between each stimulus presentation. The order for set pre-
sentation was also randomized.Intensityjudgments were made by magnitude matching (43,
44). In this procedure, intensity judgments ofstimuli from an-other sensory modality(in this case, audition)are obtained dur-ing the same session as the taste-intensity judgments. Subjectsare instructed to use the same scale for the auditory and thetaste judgments. The auditory judgments are then used to nor-malize tastejudgments. The purpose ofthe normalization is to
ensure that any differences in taste perception are not the result
of changes in use of numbers during scaling but are specific totaste (for a fuller description, see 43, 44). Subjects thus judged
the saltiness of crackers and soup, the sweetness of the fruit-
flavored beverage, and the loudness of seven tones (rangingfrom 30 to 100 dB, 1000 Hz)generated by an MA 39 audiome-ter (Maico Hearing Instruments, Minneapolis). Taste data
were normalized to the auditory data as described by Marks
at PE
NN
SY
LVA
NIA
ST
AT
E U
NIV
PA
TE
RN
O LIB
RA
RY
on February 23, 2013
ajcn.nutrition.orgD
ownloaded from
Pre 1 Pre 2 Hospital Day Post 1
884 BEAUCHAMP ET AL
TABLE 1Estimated net sodium loss over the lO-d depletion period,
loss calculated as a function ofbody weight on day 1, and total weight
loss during depletion (weight on day 1 minus that on day 1 1)’
Subject,sex, drug
Net sodiumlosst
Bodyweight
Sodiumloss
Individualweight loss(days 1-1 1)
mmo/ kgmmol/kg
bodywi kg
l,M,Fur2, M, Fur
3, M, EA4, M, Fur
5, M, EA
6, M, EA7, F, EA8, F, Fur9,F,EA
10,F,Fur
509.4409.6
515.4234.5
236. 1
159.0234.6421.8407.5221.2
80.1064.05
109.30
66.70
62.4064.8055.2069.15
52.8076.45
6.366.404.72
3.52
3.782.454.256.10
7.722.89
5.503.30
5.252.403.303.603.903.65
4.052.60j: 334.9
‘ Fur, furosemide; EA, ethacrynic acid.
t Net sodium loss = total urinary sodium minus dietary sodium in-take.
After judging the intensity of a stimulus, subjects rated thepleasantness ofthe crackers, soups, and fruit-flavored beverage
according to a 10-point category rating scale (1 = least pleasant,10 = most pleasant). The stimuli for the hedonic ratings were
identical to those used in the intensity procedure. As before, all
concentrations within each set as well as individual sets were
randomized.
Foodpleasantness questionnaire
After each taste test, subjects were given a newly-developed
questionnaire used to determine imagined pleasantness of
foods. (A copy of the questionnaire is available from the first
author.) The questionnaire consisted of a list containing 29
common food items. The list included a variety of foods that
varied in degree of sweetness and saltiness. Subjects were in-
structed to rate the imagined pleasantness of the taste of each
food according to an 1 1-point category rating scale (0 = least
pleasant, 10 = most pleasant). Space was provided at the bot-
tom ofthe questionnaire for subjects to list any foods that they
craved or would particularly like to eat.
Results
Physiological measures
The total sodium intake during the 10-d period on the hospi-tab diet was calculated by the hospital dietitian as being 1 12mmol per subject. To calculate the negative sodium balance
(net loss ofsodium), this average sodium intake was subtracted
from each subject’s total excreted urinary sodium over the 10-
d depletion period. The resulting differences (335 ± 43.8 mmol
(1 ± SEM), Table 1) reflect the estimated net sodium loss
caused by the salt restriction and diuretics over the l0-d period.
This estimate does not take into account differences in food
consumption and thus may lead to some exaggeration of so-
dium loss in lighter relative to heavier individuals. Unfortu-nately, we did not weigh food intake and the estimate reflects
calculations based on all food prepared and consumed during
several meals divided by the number of subjects tested. Sodi-um-excretion values on nondiuretic days toward the end of thedepletion period (see below) suggest that the estimated intakeswere reasonably accurate. Although neither stool nor sweat so-dium loss were measured, loss from stools may be estimated at
< 5% of total sodium loss (35); losses in sweat should also be
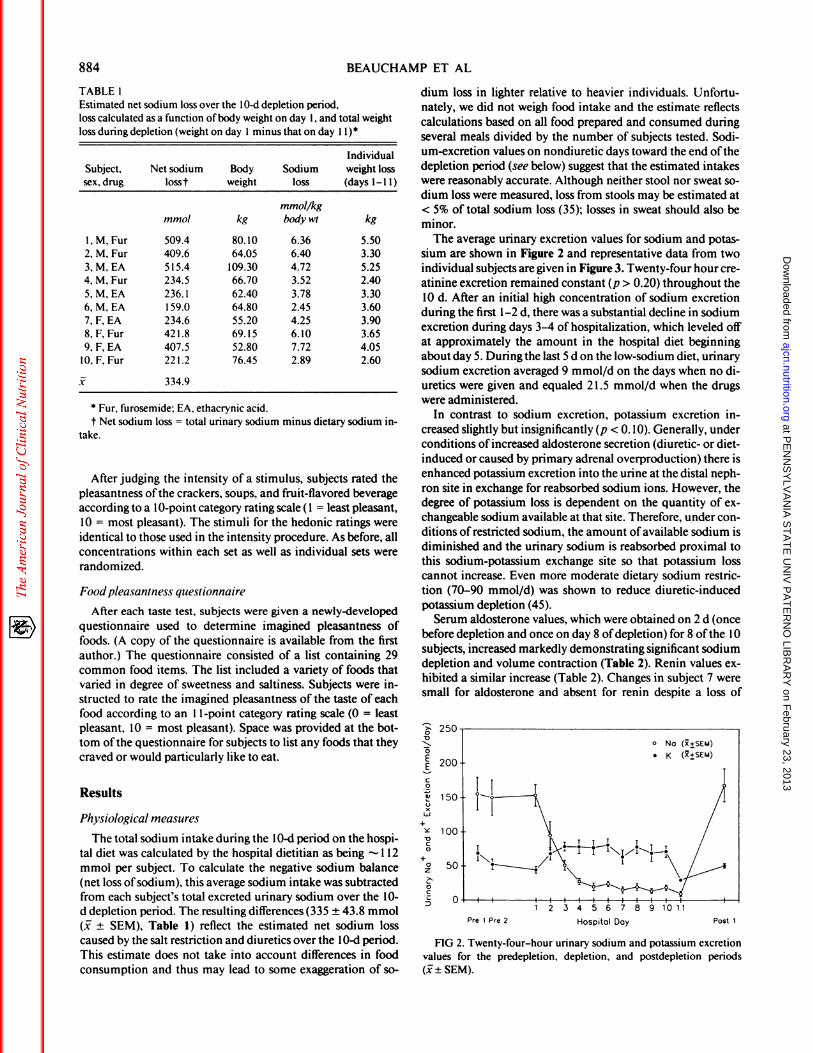
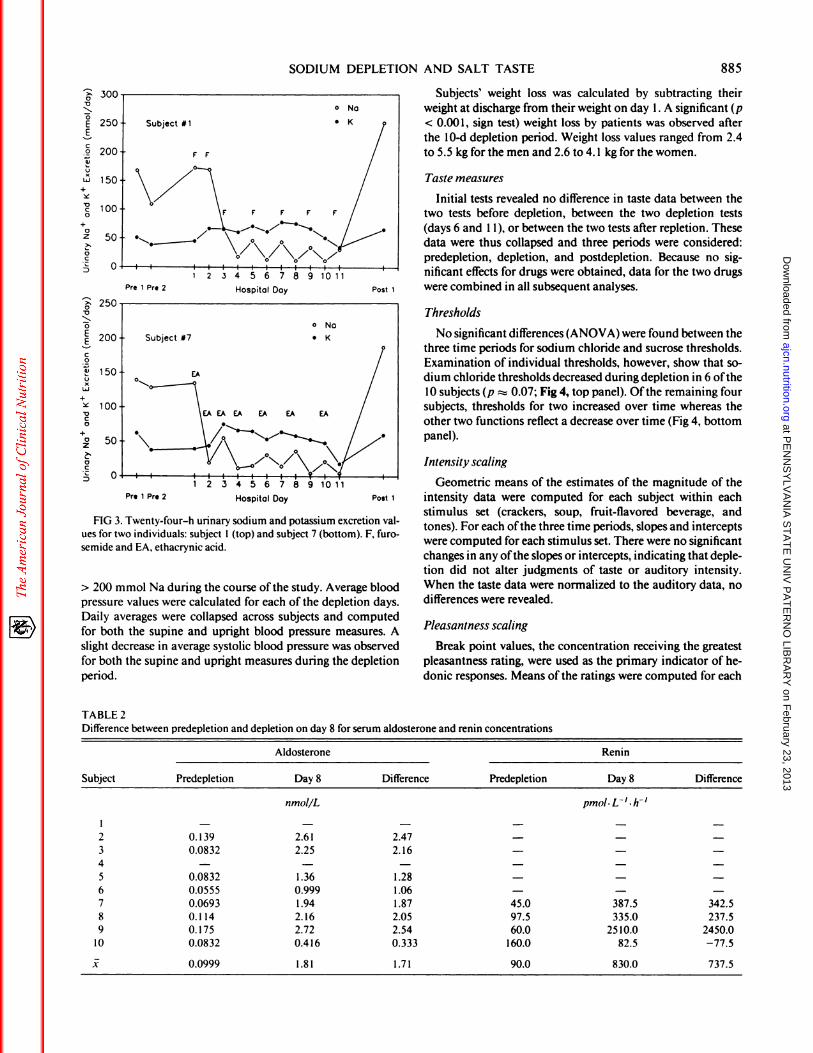
minor.The average urinary excretion values for sodium and potas-
sium are shown in Figure 2 and representative data from twoindividual subjects are given in Figure 3. Twenty-four hour crc-atinine excretion remained constant (p > 0.20) throughout the
10 d. After an initial high concentration of sodium excretion
during the first 1-2 d, there was a substantial decline in sodiumexcretion during days 3-4 of hospitalization, which leveled off
at approximately the amount in the hospital diet beginningabout day 5. During the last 5 d on the low-sodium diet, urinarysodium excretion averaged 9 mmol/d on the days when no di-uretics were given and equaled 2 1.5 mmol/d when the drugswere administered.
In contrast to sodium excretion, potassium excretion in-
creased slightly but insignificantly (p < 0. 10). Generally, under
conditions of increased aldosterone secretion (diuretic- or diet-induced or caused by primary adrenal overproduction) there isenhanced potassium excretion into the urine at the distal neph-ron site in exchange for reabsorbed sodium ions. However, thedegree of potassium loss is dependent on the quantity of cx-changeable sodium available at that site. Therefore, under con-ditions ofrestricted sodium, the amount ofavailable sodium is
diminished and the urinary sodium is reabsorbed proximal tothis sodium-potassium exchange site so that potassium losscannot increase. Even more moderate dietary sodium restric-
tion (70-90 mmol/d) was shown to reduce diuretic-inducedpotassium depletion (45).
Serum aldosterone values, which were obtained on 2 d (once
before depletion and once on day 8 ofdepletion) for 8 ofthe 10subjects, increased markedly demonstrating significant sodiumdepletion and volume contraction (Table 2). Renin values cx-hibited a similar increase (Table 2). Changes in subject 7 weresmall for aldosterone and absent for renin despite a loss of
0V
0EEC0
I)
C-,
L�J
+
VC0
+0
z
0C
FIG 2. Twenty-four-hour urinary sodium and potassium excretion
values for the predepletion, depletion, and postdepletion periods
(i�± SEM).
at PE
NN
SY
LVA
NIA
ST
AT
E U
NIV
PA
TE
RN
O LIB
RA
RY
on February 23, 2013
ajcn.nutrition.orgD
ownloaded from
Pre 1 Pre 2 Hospital Day
150
100
Pre 1 Pre 2 Hospital Day
SODIUM DEPLETION AND SALT TASTE 885
0V
0
EEC0
5)
C-,
Li
+
VC0
+az
>�
0
C
_�: 250V
� 200
C
0
5)
C-,
Li
+
VC0
+0z
0C
FIG 3. Twenty-four-h urinary sodium and potassium excretion val-
ues for two individuals: subject 1 (top) and subject 7 (bottom). F, furo-semide and EA, ethacrynic acid.
> 200 mmol Na during the course ofthe study. Average blood
pressure values were calculated for each of the depletion days.
Daily averages were collapsed across subjects and computed
for both the supine and upright blood pressure measures. A
slight decrease in average systolic blood pressure was observed
for both the supine and upright measures during the depletion
period.
TABLE 2
Subjects’ weight loss was calculated by subtracting theirweight at discharge from their weight on day 1 . A significant (p
< 0.001, sign test) weight loss by patients was observed after
the 10-d depletion period. Weight loss values ranged from 2.4
to 5.5 kg for the men and 2.6 to 4. 1 kg for the women.
Taste measures
Initial tests revealed no difference in taste data between thetwo tests before depletion, between the two depletion tests
(days 6 and 1 1), or between the two tests after repletion. These
data were thus collapsed and three periods were considered:predepletion, depletion, and postdepletion. Because no sig-
nificant effects for drugs were obtained, data for the two drugs
Post 1 were combined in all subsequent analyses.
Thresholds
No significant differences (ANOVA) were found between the
three time periods for sodium chloride and sucrose thresholds.Examination of individual thresholds, however, show that so-
dium chloride thresholds decreased during depletion in 6 of the
10 subjects (p � 0.07; Fig 4, top panel). Ofthe remaining foursubjects, thresholds for two increased over time whereas the
other two functions reflect a decrease over time (Fig 4, bottompanel).
Intensity scaling
Geometric means of the estimates of the magnitude of thePost 1 intensity data were computed for each subject within each
stimulus set (crackers, soup, fruit-flavored beverage, andtones). For each ofthe three time periods, slopes and intercepts
were computed for each stimulus set. There were no significant
changes in any ofthe slopes or intercepts, indicating that deple-tion did not alter judgments of taste or auditory intensity.When the taste data were normalized to the auditory data, no
differences were revealed.
Pleasantness scaling
Break point values, the concentration receiving the greatestpleasantness rating, were used as the primary indicator of he-
donic responses. Means of the ratings were computed for each
Difference bet ween predepletion and d epletion on day 8 for serum aldosterone and renin concentrations
Aldosterone Renin
Subject Predepletion Day 8
nmol/L
Difference Predepletion Day 8
pmol. L’ . h’
Difference
2
3
4
56
78
9
10
0. 139
0.0832
-
0.08320.0555
0.06930.114
0.175
0.0832
2.6 1
2.25
-
1.360.999
1.942.16
2.720.416
2.47
2.16
-
1.281.06
1.872.05
2.54
0.333
-
-
-
-
-
45.097.5
60.0
160.0
-
-
-
-
-
387.5
335.0
2510.0
82.5
-
-
-
-
-
342.5
237.5
2450.0
-77.5j: 0.0999 1.81 1.71 90.0 830.0 737.5
at PE
NN
SY
LVA
NIA
ST
AT
E U
NIV
PA
TE
RN
O LIB
RA
RY
on February 23, 2013
ajcn.nutrition.orgD
ownloaded from

I 15.8� 7.0
CVUC 3.10
(1V
2 1.45,V
� 0.600z
0EE 15.8C0
� 7.0CV
� 3.1
� 1.4U,V
� 0.600z
V
00
C
aEE
5,
0
(/1
490
470
450
430
410
390
370
320
300 c�
0280 v
260
E240 E
220 �
200 ,�
4.7
4.5 t�U,
U..) 0
0
4.1 �
3.9E
3.7
3.5 U,
886 BEAUCHAMP ET AL
3
8.53
I I
Pre-depletion Depletion Post-depletion
2�
\. �
Pre-depletion Depletion Post-depletion
FIG 4. Sodium chloride threshold values for six subjects(top) whosethresholds declined during the depletion period relative to pre- andpostdepletion periods. Various patterns were observed for thresholdvalues for the four other subjects (bottom).
food per session. As shown in Figure 5, break points were high-est during the depletion period for crackers (7 of 10 subjects)
and soup (8 of 10 subjects, p = 0.055). In contrast, sucrose in
the fruit-flavored beverage break points changed in an oppositedirection (8 of 10 subjects, p = 0.055). Two subjects (#6 and 9)exhibited lower salt break points for both crackers and soupduring the depletion period relative to the pre- and postdeple-tion tests. As seen in Table 1, subject 6 was the least depleted
whereas subject 9 was the most depleted.
Foodpleasantness questionnaire
The goal was to evaluate whether subjects’ desires for foodschanged during depletion and determine whether such changeswere consistently associated with the attribute offood saltiness.To this end, the degree to which each of the 29 foods exhibitattributes of saltiness, sweetness, nutritiousness, fattiness, andfillingness was first independently determined by a naive, non-
depleted group of subjects drawn from the same pool as the
depletion subjects. These 14 subjects were provided with a listof the 29 food items (Fig 6) and asked to judge the saltiness,sweetness, nutritiousness, fattiness, and fillingness according toan eight-point category rating scale (0 = low, 7 = high). These
attributes were not independent of each other. Intercorre-lations among the values ofthe food items within the five attri-butes were then computed. Thejudged salty and sweet contentswere inversely related (r = -0.80, p < 0.01) whereas nutritious-ness was negatively correlated with saltiness (r = -0.22, p
< 0. 10) and fattiness (r = -0.29, p < 0. 10). Fattiness was posi-
tively correlated with saltiness (r = +0.56, p < 0.01) and fill-
ingness (r = +0.62, p < 0.01). All other intercorrelations were
nonsignificant.
Food items were ordered from highest to lowest within each
ofthe five categories (eg, for saltiness, potato chips were judgedmost salty and apples least salty; see Fig 6). To evaluate whetherthe ratings ofthe experimental subjects were altered by sodium
depletion, the average ratings for each food item were calcu-bated for the predepletion period, the depletion period (days 6and 1 1), and the postdepletion period. There were no differ-
ences between judgments during the predepletion and postde-pletion periods. Consequently, the difference between the rat-ing during depletion was compared with the average ofthe rat-
ings before and after depletion to determine whether depletion
significantly affected ratings of foods and more importantlywhether effects were specific to foods high in salt.
Figure 6 presents the judged saltiness ofeach food item (de-termined as described above from independent analysis) plot-ted against the difference score, which reflects differences be-tween pleasantnessjudgments during depletion compared withthose before and after depletion. The correlation betweenranked saltiness ofthe 29 foods and differences in pleasantness
as a function of depletion was high (r = +0.86, p < 0.0001),indicating that foods judged high in salt increased most in
pleasantness when subjects were sodium depleted.
The other attributes rated (sweetness, fillingness, nutritious-
ness, and fattiness) were treated in a similar manner and thedata for these are presented in Table 3. For sweetness, the corre-lation between ranked sweetness and change in pleasantnesswas opposite that observed for saltiness, as would be expected
based on the negative correlation between these two attributes.The correlation for the fattiness was positive but less so thanthat for saltiness; correlations for fillingness and nutritiousnesswere low.
Seven of the 10 subjects listed additional foods that theycraved or would like to have had. Between 1 and 13 items werelisted on each questionnaire. Six of the subjects clearly cx-pressed a greater desire for salty foods during the depletion pe-riod compared with pre- and postdepletion periods with theseventh subject’s responses being ambiguous. For example, one
subject desired cookies andjelly beans during the pre- and post-depletion periods but wished for chili dogs with cheese duringthe depletion days. Other foods listed as desired during deple-tion days included anchovies, regular soup, pizza, bacon,
0�y6 D�y11
Pre-depletion Depletion Post-depletion
FIG 5. Mean breaking point values for sodium chloride in crackersand soup and sucrose in the fruit-flavored beverage for each taste-test-
ing period.
at PE
NN
SY
LVA
NIA
ST
AT
E U
NIV
PA
TE
RN
O LIB
RA
RY
on February 23, 2013
ajcn.nutrition.orgD
ownloaded from

SALT CONTENT(High) (Low)
.5
00
OC� 05,a.
> 0.=Oo
vs
#{149}1
I)
C’-
#{163}�
1�0 � .5C.xL&LNUI�CO5V
oN��2U2a2� � E�: .�
o.�E vs�v 0�. oa.:� � .�
i� 0�(�5 � 20 0.C V0005
IU
U
1.5
1.0
0.5
0.0
-0.5
-1.0
-1.5
UUU
U
FIG 6. Changes during the depletion period in the desirability offoods as a function oftheirjudged saltiness. Thefoods are ranked from left to right by judged saltiness: potato chips were ranked by a separate group of nondepletedsubjects as most salty, salad as moderately salty, and apples asleast salty. The difference score represents the differencebetween the subjects imagined preference for this food while depleted minus the average imagined preference for
bacon, soup, and hot dogs, foods independentlyjudged as being high in saltiness, exhibited an increase in desirability
during sodium depletion. In contrast, apples, oranges, and grapefruit, foodsjudged low in saltiness, were less desirableduring depletion.
SODIUM DEPLETION AND SALT TASTE 887
a)0U
(J�
a)UCa)a)
0
French fries, as well as a number offoods not usually classified
as salty. However, only one subject explicitly used the word
salty to describe the desired foods.
Discussion
The level of sodium depletion attained in this study did notsignificantly alter taste sensitivity as determined by threshold
and suprathreshold evaluations. Although there was a trend forthresholds to decrease during the depletion period, in agree-ment with some previous work (36), this was not evident in all
TABLE 3
Correlation between food attributes and changes in food preferences5,
Attribute r p
Salty 0.86 <0.0001Sweet -0.67 <0.002Fatty 0.60 <0.002Filling 0.24 <0.10Nutritious -0.23 <0.10
5,Food items were ranked from high to low within each attribute (eg,
salty: I = high, 29 = low) and difference scores were computed foreach food (mean hospital minus mean pre- and postdepletion values).Correlations were then computed between their difference scores andrank order.
subjects. Psychophysical scaling ofsalt intensity was unaffected
by sodium depletion. As expected, there was no change in sweet
perception.
In direct contrast to these negative results for salt sensitivity,judgments ofthe pleasantness ofsalt taste in food and the desir-ability offoods were influenced by the treatment. Break pointsfor salt in soup and crackers increased for the majority of sub-jects. In contrast, break points for sucrose in the fruit-flavoredbeverage declined during sodium depletion. Data obtained inthe food-desirability questionnaire were entirely consistentwith these sensory-hedonic results. Foods perceived (by others)
as high in salt were substantially more desirable during deple-tion than they were before and after depletion whereas thosehigh in sweetness exhibited the opposite pattern. Finally, of the
subjects listing other foods they craved, most desired saltierfoods during the depletion period.
The effects on the hedonics ofsalty foods could be due to thephysiological need for sodium induced by the depletion or by
the deprivation ofexperience tasting salty foods or some com-bination of the two factors. When individuals are placed onlowered sodium diets (‘�50-75 mmol/d) there is some cvi-
dence of an acute transient increase in salt preference similarto that observed here (46). However, after weeks or months on
such diets, a shift in the opposite direction towards preferencefor lower amounts ofsalt in foods was found (47-49). Further-more, existing data suggest that it is the level ofsensory experi-
ence with salty tastes rather than the absolute amount of so-
at PE
NN
SY
LVA
NIA
ST
AT
E U
NIV
PA
TE
RN
O LIB
RA
RY
on February 23, 2013
ajcn.nutrition.orgD
ownloaded from

888 BEAUCHAMP ET AL
dium consumed that is critical for the change in taste hedonics
(9). A direct assessment ofthe relative roles ofdepletion vs sen-
sory deprivation should be conducted.
The effects of sodium depletion on judgments of salty-fooddesirability from the questionnaire were statistically more ro-bust than were the taste-hedonic data with the latter being onlymarginally significant. What could account for this? It is possi-
ble that saltiness is only one correlated attribute ofthe changesmeasured by the questionnaire. That is, perhaps saltiness is a
component of the more general factor, flavorfulness. Underthis hypothesis, subjects who were required to eat the verybland low-sodium diet craved not saltiness but merely foodwith more flavor. Although this is difficult to disprove with the
current data, there are several objections to the hypothesis.First, a desire for flavorful foods would include sweet foods,
which, instead, generally became less desirable. Second, the di-
etitian who prepared the meals tried to make the low-sodium
foods more palatable with other condiments. With the impor-tant exception of salt, the low-sodium diet was itself high inspice flavor.
Perhaps saltiness is an integral component of flavorfulness.If so, the difficulties of producing palatable foods, indeed fla-vorfub foods, with substantially reduced sodium may reflect
this close relationship. Under this hypothesis, the anecdotal re-sults ofboth McCance (35) and Yensen (36) make more sense:both investigators failed to report an appetite for salt itself but
instead noted that food was tasteless, which is also consistentwith anecdotal reports by our subjects. For humans who obtain
their salt primarily in the context of food, moderate depletionappears to reflect itself more in increases in the desirability of
foods known to be high in salt. Only one subject explicitlynoted an increased desire for salty foods. Indeed, although rats
prefer salt solutions but do not prefer their foods salted (1 1, 50),
humans generally consume salt with foods and not alone or in
drinks (9).Although the hedonic scaling data (break points) were con-
sistent with the questionnaire data, it is puzzling that they werenot more robust in revealing an effect of depletion. We andothers (47, 48) employed similar methodologies to demon-
strate decreases in food saltiness judged most pleasant afterlowered-sodium diets lending face validity to the methodology.However, salt-taste-preference methods often are not veryhighly correlated with total sodium intake [eg, r = 0.40 (40)]and it may be that multiple sensory measures ofpreference arerequired to obtain a good estimate of overall salt prefer-
ence (51).
The timing and degree ofsodium depletion may account for
the apparent absence ofa strong craving for very-high-salt con-centrations among our subjects who were depleted to a lesser
degree than those of McCance (35) and probably Yensen (36).
The only direct human evidence for strong cravings for salti-
ness itselfcomes from clinical studies (see Introduction). Theseobservations almost uniformly involved a profound salt defi-ciency and an initiation ofsalt cravings during childhood. Early
salt restriction may be particularly likely to induce salt appetite,perhaps by altering some receptor population or central ncr-vous system structures that are labile at this time (4). Further-
more, salt depletion in these clinical studies was substantiallymore severe and extended over a much longer period than un-der the current experimental protocol. A classic salt appetiteappears to be very rare in adult humans and can be induced
under only the most extreme circumstances of sodium deple-
tion probably occurring only in infancy or early childhood.A variety of similar factors could account for the absence of
significant changes in threshold and perceived intensity. As in
the development of an appetite, such changes may only be
achieved under more stringent (longer and greater) conditions
ofdepletion. McCance’s (35) subjects experienced only a mod-
est increase in salt sensitivity with more severe depletion. Neu-
rophysiobogical studies imply that suprathreshold concentra-
tions of salt should be perceived as tasting less salty (6) andperhaps more sweet (8). In the current study we did not observethe former and did not investigate the latter. Because it isknown that the physiological mechanisms mediating salt appe-
tite in rats and sheep differ (4), it is conceivable that humanresponses to sodium depletion may not be predicted from re-
suIts with experimental animals.In summary, although few objective changes in taste sensitiv-
ity were found in this study, sodium-depleted subjects did sub-
jectively report an increased desire for food higher in salt and
exhibited a tendency to judge higher amounts of salt in foods
as most preferred. Such desires, if acted upon, would serve toensure that sufficient sodium would be consumed to restore thedeficit, although in our society, except in extremely rare cases,
the degree ofdepletion we induced is unlikely to occur. 0
We thank D Wang and C Shute ofthe Clinical Research Center and
B Garrison and L Freedman of Monell for their able assistance.
References
1 . Dethier VG. The taste ofsalt. Am Sci 1977;65:744-5 I.
2. Denton D. The hunger for salt. Berlin: Springer-Verlag, 1982.3. Richter CP. Salt appetite of mammals: its dependence on instinct
and metabolism. In: Autuoure M, ed. Instinct in the behavior ofanimals and men. Paris: Masson, I 956.
4. Sakai RR, Nicolaidis 5, Epstein AN. Salt appetite is suppressedby interference with angiotensin II and aldosterone. Am J Physiol1986;25 1:R762-8.
5. Carr Wi. The effect ofadrenalectomy upon the NaC1 taste thresh-
old in the rat. J Comp Physiol Psychol 1952;45:377-80.6. Contreras Ri, Frank ME. Sodium deprivation alters neural re-
sponses to gustatory stimuli. J Gen Physiol 1979;73:569-94.7. Contreras Ri, Kosten T, Frank ME. Activity in salt taste fibers:
peripheral mechanism for mediating changes in salt intake. ChemSenses l984;8:275-88.
8. Jacobs KM. Mark GP, Scott TR. Taste responses in the nucleustractussolitarius ofsodium-deprived rats. J Physiol l988;406:393-410.
9. Beauchamp GK. The human preference for excess salt. Am Sci1987;75:27-33.
10. Stricker EM, Verbalis JG. Hormone and behavior: the biology ofthirstand sodium appetite. Am Sci 1988;76:261-7.
1 1. Beauchamp GK, Bertino M. Rats do not prefer salted solid food. JComp Psychol l985;99:240-7.
12. Denton D, McBurnie M, Ong F, Osborne P. Tarjan E. Na defi-
ciency and other physiological influences on voluntary Na intakeofBALB/c mice. Am J Physiol 1988;255:R1025-34.
13. Rowland NE, Fregly Mi. Sodium appetite: species and straindifferences and role of renin-angiotensin-aldosterone system. Ap-petite 1988; 11:143-78.
14. MulthaufRP. Neptune’s gift: a history ofcommon salt. Baltimore:
Johns Hopkins University Press, 1978.15. Moss KN. Some effects of high air temperatures and muscular cx-
ertion upon colliers. Proc R Soc Lond [BiolJ 1923-1924; series 95:181-207.
at PE
NN
SY
LVA
NIA
ST
AT
E U
NIV
PA
TE
RN
O LIB
RA
RY
on February 23, 2013
ajcn.nutrition.orgD
ownloaded from

SODIUM DEPLETION AND SALT TASTE
16. Wilkins L, Fleischmann W, Howard JE. Macrogenitosomia precoxassociated with hyperplasia ofthe androgenic tissue ofthe adrenal
and death from corticoadrenal insufficiency. Endocrinology1940: 26:385-95.
17. Wilkins L, RichterCP. A great craving for salt by a child with corti-
coadrenal insufficiency. JAMA 1940; 1 14:866-8.
18. McQuame I, Thompson WH, Anderson JA. Effects of excessiveingestion ofsodium and potassium salts on carbohydrate metabo-
lism and blood pressure in diabetic children. J Nutr 1936; 1 1:77-
101.
19. Thompson WH, McQuarrie I. Effects ofvarious salts on carbohy-drate metabolism and blood pressure in diabetic children. Proc SocExp Biol Med 1934:31:907-9.
20. Darley W, Doan CA. Primary pulmonary arteriosclerosis with
polycythemia: associated with the chronic ingestion of abnormallylarge quantities of sodium chloride (halophagia). Am J Med Sci1936; 19 1:633-46.
2 1. Shy GM, Gonatas NK, Perez M. Two childhood myopathies with
abnormal mitochondria. I Megaconial myopathy. II Pleoconial
myopathy. Brain 1966;89:133-58.
22. Spiro AJ, Pineas JW, Moore CL. A new mitochondrial myopathy
in a patient with salt craving. Arch Neurol 1970;22:259-69.
23. Grossman H, Kennedy E, McCamman S, Rice K, Hellerstein S.
Salt appetite in children with sickle cell disease. J Pediatr l977;90:
67 1-2.
24. Thorn GW, Dorrance 55, Emerson D. Addison’s disease: evalua-tion of synthetic deoxycorticosterone acetate therapy in 158 pa-
tients. Ann Intern Med 1942; 16:1053-96.25. Thorn GW. The diagnosis and treatment ofadrenal insufficiency.
Springfield: Charles C Thomas Publishing Co. 1949.26. Knowles JP, Asher R. Addison’s disease with glycyrrhizophilia.
Proc R Soc Med 1958;51:178.
27. Cotterill JA, Cunliffe Wi. Self-medication with liquorice in a pa-
tient with Addison’s disease. Lancet 1973; 1:294-5.
28. Shapiro MD, Linas SL. Sodium chloride pica secondary to iron-
deficiency anemia. Am J Kidney Dis 1985; 5:67-8.
29. Mattes RD. Mela Di. Relationships between and among selectedmeasures of sweet-taste preference and dietary intake. Chem
Senses 1986: 11:523-39.
30. Henkin RI, Gill JR, Bartter FC. Studies on taste thresholds in nor-mal man and in patients with adrenal cortical insufficiency: the
role of adrenal cortical steroids and of serum sodium concentra-tion. J Clin Invest 1963;42:727-35.
3 1. Henkin RI, Powell GF. Increased sensitivity of taste and smell in
cystic fibrosis. Science 1962; 138: 1 107-8.
32. Wotman S, Mandel ID, Khotim 5, et al. Salt taste threshold andcystic fibrosis. Am J DisChild 1964; 108:372-4.
33. Desor JA, MaIler 0. Taste correlates ofdisease states: cystic fibro-sis. J Pediatr 1975:87:93-6.
34. Hertz J, Cain W, Bartoshuk IM, Dolan TF. Olfactory and taste
889
sensitivity in children with cystic fibrosis. Physiol Behav 1975; 14:89-94.
35. McCance RA. Medical problems in mineral metabolism. Lancet1936; 1:823-30.
36. Yensen R. Some factors affecting taste sensitivity in man. II Deple-
tion ofbody salt. Q J Exp Psychol 1959; 1 1:230-8.
37. de Wardener HE, Herxheimer A. The effect ofa high water intakeon salt consumption, taste thresholds and salivary secretion in
man. J Physiol 1957; 139:53-63.
38. Stinebaugh BJ, Vasquez MI, Schloeder FX. Taste thresholds forsalt in fasting patients. Am J Clin Nutr 1975:28:814-7.
39. Barnwell GM, Dollahite J, Mitchell DS. Salt taste preference inbaboons. Physiol Behav I 986; 37:279-84.
40. Mailer 0, Cardello A, Sweeney J, Shapiro D. Psychophysical and
cognitive correlates of discretionary usage of table salt and sugarby humans. In: Steiner JE, Ganchrow JR. eds. Determination ofbehavior by chemical stimuli. London: Information Printing, Ltd.1982.
41. Winer BJ. Statistical principles in experimental design. New York:
McGraw-Hill, 1971.
42. Cornsweet TN. The staircase method in psychophysics. Am J Psy-
chol 1962;75:485-91.43. Stevens JC, Marks LE. Cross-modality matching functions gener-
ated by magnitude estimation. Percept Psychophys 1980:27:379-
89.
44. Marks LE, Stevens JC, Bartoshuk IM, Gent iF, Rifkin, B, StoneVK. Magnitude-matching: the measurement of taste and smell.Chem Senses 1988; 13:63-87.
45. Ram CVS, Garrett BN, Kaplan NM. Moderate sodium restrictionand various diuretics in the treatment of hypertension: effects ofpotassium wastage and blood pressure control. Arch Intern Med198 1:141:1015-9.
46. Bertino M, Beauchamp GK, Riskey DR. Engelman K. Taste per-
ception in three individuals on a low sodium diet. Appetite 198 1:2:67-73.
47. Bertino M, Engelman K, Beauchamp GK. Long-term reduction indietary sodium alters the taste of salt. Am J Clin Nutr l982;36:
1134-44.
48. BlaisC, Pangborn RM, Borhani NO, Ferrell MF, Prineas RJ, LaingB. Effect ofdietary sodium restriction on taste responses to sodiumchloride: a longitudinal study. Am J Clin Nutr 1986;44:323-43.
49. Teow BH, DiNicolantonio R, Morgan TO. Sodium detectionthreshold and preference for sodium salts in humans on high and
low salt diets. Chem Senses 1984;8:267(abstr).
50. Bertino M, Beauchamp GK. Salted food preferences in rats (Raitus
norvegicus): responses to liquid milk products. Appetite 1987;8:
55-66.
5 1. Mattes RD, Christensen CM, Engelman K. Effects of hydrochloro-thiazide and amiloride on salt taste and excretion (intake). Am J
Hypertens (in press).
at PE
NN
SY
LVA
NIA
ST
AT
E U
NIV
PA
TE
RN
O LIB
RA
RY
on February 23, 2013
ajcn.nutrition.orgD
ownloaded from