Depletion policy options for Western Europe
15
Depletion policyoptions for Western Europe Reinier de Man, Bert de Vries and Jan Kommandeur The production potential of proven oil and gas fields in Western Europe clearly exceeds previous official expectations. If high reserve estimates prove correct, about half of Western Europe's present energy needs might come from indigenous oil and gas. At the same time the rapid depletion favoured by short-term political and economic interests will place enormous strain on Europe's energy economy by the 1990s. By then, on the basis of current knowledge of reserves, oil and gas will have to be replaced by other energy sources at an unprecedented rate and scale. Governments' medium-term energy policies should therefore carefully take into account risks of such development and the benefits of go-slow policies. The authors are with the Department of Physical Chemistry, University of Groningen, Zernikelaan, Paddepoel, Groningen, The Netherlands. ~Bert de Vries and Jan Kommandeur, 'Gas for Western Europe: How much for how long?', Energy Policy, Vol 3, No 1, March 1975, pp 24-38. 2 Reports to the Norwegian Storting, Nos 51 (1972-73), 30 (1973-74),-/7 (1973- 74), 81 (1974-75), 90 (1974-75), and 90-91 (1975-76), unofficial translations from Norwegian Ministry of Industry and Crafts. 3Aardgas en aardolie in Nederland en op de Noordzee 1973, 1974, 1975, Ministry of Economic Affairs. Many reports ofoil and gas discoveries in the North Sea have appeared since 1975, when in an earlier paper 1 we tried to sketch the future availability and use of natural gas for Western Europe. We concluded that present practices based on short-term objectives lead to wasteful use and a rapid depletion of this highly valuable energy source. It now seems useful to extend the evaluation for both gas and oil to these recent discoveries, to provide fairly objective information for those charged with planning Western Europe's future energy policies. Our basic conclusions remain the same, since they are based more on present expansive policies than on resource availability, but we believe it is nevertheless illuminating to have a more complete view of the availability of gas and oil resources. Reserves From the geological viewpoint it is oil (or gas) in place which counts. Knowledge of this is a function of exploration intensity and is represented in terms of probability of occurrence. 'Proven reserves' have a probability of 90%, 'probable reserves' 50%, and 'possible reserves' 10% of actually being there. As knowledge of fields increases, the magnitude of the latter two decreases while generally the first category augments. 'Total proven reserves' are larger than the sum of all individual 'proven reserves', since individual fields are independent. Conversely, the probability of occurrence of the sum of the proven reserves is higher than 90%. The inverse consideration holds for 'possible reserves'. The probability of occurrence is variously given in the literature. The British Department of Energy uses the method of tabulation of reserves described above, whereas the Norwegian Reports to the Storting use low estimates based on 'strict interpretation of data' with 'uncertainty reduced to a minimum' and high estimates based on 'possible interpretation of available data ... containing a certain element of optimism over and above what is strictly justifiable in view of the basic data'. 2 A similar categorization is used by the Dutch government).4 Massive investments are required for the exploitation and transport of the North Sea fossil fuels. The oil companies base their investment decisions on expected internal rate of return and net present value. These in turn depend on assumptions about the amount to be ENERGY POLICY December 1977 319
-
Upload
independent -
Category
Documents
-
view
0 -
download
0
Transcript of Depletion policy options for Western Europe
Depletion policy options for Western Europe
Reinier de Man, Bert de Vries and Jan Kommandeur
The production potential of proven oil and gas fields in Western Europe clearly exceeds previous official expectations. If high reserve estimates prove correct, about half of Western Europe's present energy needs might come from indigenous oil and gas. At the same time the rapid depletion favoured by short-term political and economic interests will place enormous strain on Europe's energy economy by the 1990s. By then, on the basis of current knowledge of reserves, oil and gas wi l l have to be replaced by other energy sources at an unprecedented rate and scale. G o v e r n m e n t s ' medium- te rm energy policies should therefore carefully take into account risks of such development and the benefits of go-slow policies.
The authors are wi th the Department of Physical Chemistry, University of Groningen, Zernikelaan, Paddepoel, Groningen, The Netherlands.
~Bert de Vries and Jan Kommandeur, 'Gas for Western Europe: How much for how long?', Energy Policy, Vol 3, No 1, March 1975, pp 24-38. 2 Reports to the Norwegian Storting, Nos 51 (1972-73), 30 (1973-74),-/7 (1973- 74), 81 (1974-75), 90 (1974-75), and 90-91 (1975-76), unofficial translations from Norwegian Ministry of Industry and Crafts. 3 Aardgas en aardolie in Nederland en op de Noordzee 1973, 1974, 1975, Ministry of Economic Affairs.
Many reports ofoil and gas discoveries in the North Sea have appeared since 1975, when in an earlier paper 1 we tried to sketch the future availability and use of natural gas for Western Europe. We concluded that present practices based on short-term objectives lead to wasteful use and a rapid depletion of this highly valuable energy source. It now seems useful to extend the evaluation for both gas and oil to these recent discoveries, to provide fairly objective information for those charged with planning Western Europe's future energy policies. Our basic conclusions remain the same, since they are based more on present expansive policies than on resource availability, but we believe it is nevertheless illuminating to have a more complete view of the availability of gas and oil resources.
Reserves
From the geological viewpoint it is oil (or gas) in place which counts. Knowledge of this is a function of exploration intensity and is represented in terms of probability of occurrence. 'Proven reserves' have a probability of 90%, 'probable reserves' 50%, and 'possible reserves' 10% of actually being there. As knowledge of fields increases, the magnitude of the latter two decreases while generally the first category augments. 'Total proven reserves' are larger than the sum of all individual 'proven reserves', since individual fields are independent. Conversely, the probability of occurrence of the sum of the proven reserves is higher than 90%. The inverse consideration holds for 'possible reserves'.
The probability of occurrence is variously given in the literature. The British Department of Energy uses the method of tabulation of reserves described above, whereas the Norwegian Reports to the Storting use low estimates based on 'strict interpretation of data' with 'uncertainty reduced to a minimum' and high estimates based on 'possible interpretation of available data ... containing a certain element of optimism over and above what is strictly justifiable in view of the basic data'. 2 A similar categorization is used by the Dutch government).4
Massive investments are required for the exploitation and transport of the North Sea fossil fuels. The oil companies base their investment decisions on expected internal rate of return and net present value. These in turn depend on assumptions about the amount to be
ENERGY POLICY December 1977 319

Depletion policy options for Western Europe
recovered, price expectations, discount rate, financial constraints, state regulations, etc. Thus, estimates of economically recoverable reserves reflect commercially oriented development plans. More intensive exploitation leads to the production of additional oil and gas at a higher specific cost.
First, depending on the porosity and the permeability of hydrocarbon-bearing layers, only part of the oil and/or gas can be exploited. This fraction increases with the application of secondary and tertiary recovery techniques. From 1950 until now the average has risen from 25% to 32%, and a further increase up to 36% is expected for the 1980s. 5 Public information on recovery factors and its relations with economic parameters is scarce, Norwegian reports2, 6 give recovery factors for the Ekofisk fields of 18% for oil and 63% for gas. Other sources, particularly Phillips, the operator of the field, consider this to be too pessimistic? The Stat0ord field owes its high oil supply potential to its extremely high recovery factory of 60%. For British fields like Forties, Montrose and Piper, values of 40-50% are reported. 6 For the Ninian field 37% appears to be agreed upon, but this is also criticized as being too low. 7 For Brent 35% has been suggested, secondary techniques having already been decided upon.
Secondly, intensity of exploitation is a function of the number of wells drilled and their time of operation. For the Ninian field two development plans are presented, the more intensive one producing some 15% more oil. Odell and Rosing estimate for the Forties, Montrose and Piper fields recoverable reserves in a 20 year period as a function of the number of wells drilled against platforms installed. More intensive exploitation than presently proposed by the operating oil companies would yield up to 30% more oil. 6
It is not clear how economic factors are taken into account in official estimates. Dutch reports contain nothing on the subject, while British papers distinguish between 'commercial fields' and 'significant discoveries'. Too little is known about the latter to judge their commercial prospects. The Norwegian reports are the most explicit - either extensive information is given on plans for exploitation, or it is clearly stated that this is lacking.
In view of the above uncertainties, for the purposes of this evaluation the data are divided into four categories:
• Commer¢ialfields. Investments in exploitation have already been made, and reserve estimates are the most conservative given.
• Additional commercial reserves. The difference between the highest and lowest estimates given for commercial fields.
• Probably commercial fields. No investment in exploitation has been made, but reserve estimates have been given; we use the highest estimates.
• Smallfields andfields being assessed.
It will be clear that these categories are ordered according to the probability of their eventual availability, ie the geological probability of occurrence and economic exploitability decrease from 'commercial fields' through to 'small fields'. The data we have used are listed in Appendix 1. The small fields have been given a magnitude of 10 mtoe, plus 5 mtoe when associated gas can be expected. 8
Future discoveries So far we have only considered results of exploration up to 1 January
4 Official government estimates give oil and/or gas present at the time of estimation, but in this paper we use 'cumulative reserve estimates', ie the official estimates augmented by what has already been taken out. s Energy Prospects to 1985, OECD, Paris, 1974. e Oljedirektoratet Arsberetning (Norwegian Petroleum Directorate Annual Report), 1974, 1975. 7Wood, Mackenzie & Co, North Sea Report 60.16, Section 2, Edinburgh, March 1975. See also Petroleum Economist, May 1976. 8 1 mtoe = 1 million tons of oil equivalent, taken as equal to 1 billion (109 ) m z of natural gas.
320 ENERGY POLICY December 1977
9 Reserves of crude oil, gas, natural gas liquids, and sulphur: Province of Alberta, Energy Resources Conservation Board, Alberta, Canada, 31 December 1974. 1°Reserve estimates for Alberta have grown by 70-160% on average in the first three yea rs after discovery.
Depletion policy options for Western Europe
1976. For a more complete picture we should also try to take into account future discoveries. We have three ways of approximating these: appreciation of present finds, logistic development of reserves in a specific area and official estimates of'ultimately exploitable reserves'.
Appreciation Reserves usually prove much larger than believed at the time of discovery. Reserve development in time can be expressed as A(t) = A( ~ )[ 1-exp(--(t-to))/b)], where A(t) is the factor by which the initial reserve estimate tends to grow in time.
This relationship was found to hold true for the oil and gas reserves of Alberta in Canada. 9 We also used it for the development of gas reserves in North Western Europe; it was supported by our statistical analysisJ
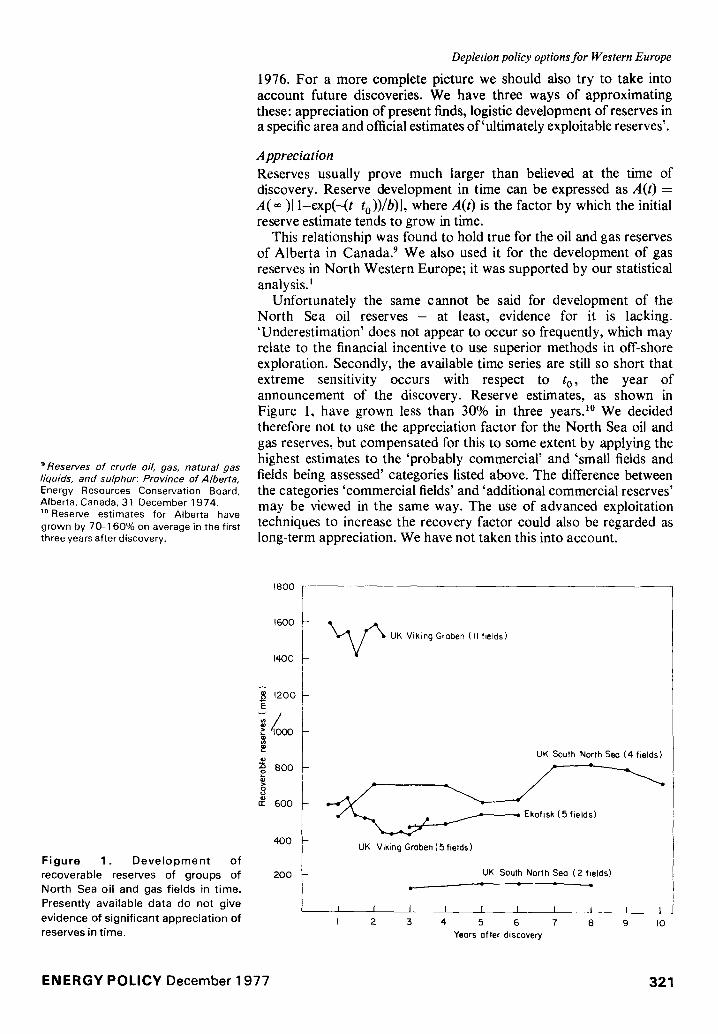
Unfortunately the same cannot be said for development of the North Sea oil reserves - at least, evidence for it is lacking. 'Underestimation' does not appear to occur so frequently, which may relate to the financial incentive to use superior methods in off-shore exploration. Secondly, the available time series are still so short that extreme sensitivity occurs with respect to t o , the year of announcement of the discovery. Reserve estimates, as shown in Figure 1, have grown less than 30% in three yearsJ ° We decided therefore not to use the appreciation factor for the North Sea oil and gas reserves, but compensated for this to some extent by applying the highest estimates to the 'probably commercial' and 'small fields and fields being assessed' categories listed above. The difference between the categories 'commercial fields' and 'additional commercial reserves' may be viewed in the same way. The use of advanced exploitation techniques to increase the recovery factor could also be regarded as long-term appreciation. We have not taken this into account.
F i g u r e 1. D e v e l o p m e n t o f recoverable reserves of groups of North Sea oil and gas fields in t ime. Presently avai lable data do not give evidence of signif icant appreciat ion of reserves in t ime.
1800
1600
1400
"• 1200 E
~ 800
8 ~ 6oo
400
200
- ~ UK Viking Groben (11 fields)
UK South North Seo (4 fields)
; Ekofisk (5 fields)
UK Viking Groben (5 fields)
UK South North Sea ( 2 fields) • • - o I
I I I I I _ I I I I I I 2 3 4 5 6 7 8 9 IO
Years ofter discovery
E N E R G Y POLICY December 1 977 321

Depletion policy options for Western Europe Logistic development The growth of total available reserves may be approximated by a logistic function. The rate of growth of reserves is then given by dR(t) = b.R(t). JR( ~ ) - R(t)], where R(t) are the reserves known at time t and b is a constant reflecting the intensity of exploration. Unfortunately, as long as this rate is increasing, ie as long as half of the reserves have not yet been discovered, a reliable estimate of b can hardly be obtained from the limited time series. This approximation is therefore only valid for areas which have already been fairly well explored. Table 1 gives the increase in reserves, the number of exploratory drillings, and the number of wildcats for various parts of the North Sea continental shelf. With the reasonable assumptions that the most promising areas have been explored first, and that considerable appreciation cannot be expected, some limited conclusions can be drawn.
For the Southern North Sea gas fields and for the Ekofisk area, the amount discovered per wildcat has decreased monotonically, even though geological knowledge of the area has increased. Not many useful discoveries should therefore be expected, a conclusion which is also supported by the lognormal distribution of the fields found so far. The amount discovered per wildcat has also decreased for the British
Table 1. Exp lora tory drill ings, wildcats, and increases in cumulat ive reserves in the Nor th Sea
1964 1965 1966 1967 1968 1969 1970 1971 1972 1973 1974 1975
UK Southern North Sea (gas) N u m b e r of exploratory drillings 1 11 20 3 5 3 0 34 12 7 8 7 4 2
N u m b e r of wildcats - 3 4 2 2 4 4 - 3 2 - 1 Increase in cumulative reserves ( R ( t ) ) - 9 0 7 1 0 15 6 5 185 6 0 - 3 0 2 0 - 10
mtoe/exploratory drilling a - 2 5 12 9 3 4 5 3 2 3 2 - m t o e / w i l d c a t a - 1 1 2 91 9 9 33 31 31 13 10 10 10 -
Ne the r l ands offshore (gas) N u m b e r of exploratory drillings . . . . 7 15 14 18 16 17 16 15
N u m b e r of wildcats . . . . 2 1 3 - 5 2 4 4 Increase in cumulative reserves ( R ( t ) ) . . . . 20 10 2 0 0 - 2 1 0 3 0 6 0 4 0
m t o e / e x p l o r a t o r y d r i l l i ng a . . . . . 9 5 8 5 6 3 - m t o e / w i l d c a t a . . . . . 3 8 52 51 34 27 13 -
N o r w a y Ekofisk area (oil and gas)b N u m b e r of exploratory drillings -- - - 1 2 7 12 10 9 12 14 3 --
N u m b e r of wildcats . . . . 1 1 4 - 3 2 2 1 Increase in cumulative reserves ( R ( t ) ) . . . . 10 3 1 0 3 8 5 - 170 10 15 15
m t o e / e x p l o r a t o r y d r i l l i nga - - - 1 15 24 22 18 7 10 3 - m t o e / w i l d c a t a . . . . 180 1 2 0 1 2 0 79 36 2 8 8 -
U K Central Graben (East of Scotland) (o i l ) N u m b e r of exploratory drillings - - - 7 11 8 10 13 16 18 25 4 5
N u m b e r of wildcats . . . . 1 1 2 3 4 - 6 7 Increase in cumulative reserves ( R ( t ) ) . . . . 7 27 2 9 4 72 173 - 2 7 0 70
m t o e / e x p l o r a t o r y d r i l l i ng a . . . . 13 11 13 14 5 8 4 - m t o e / w i l d c a t a . . . . 17 82 6 5 54 3 5 4 4 24 -
U K Viking Graben (East of Shetland) (o i l ) N u m b e r of exploratory drillings - - 1 5 4 1 6 7 2 10 16 - -
N u m b e r of wildcats . . . . . . 1 1 2 2 5 - - Increase in cumulative reserves ( R ( t ) ) . . . . . . 10 115 8 0 6 0 7 8 5 10 mtoe/exploratory drilling a . . . . . 1 9 14 13 33 - -
- - 43 4 6 34 112 - - mtoe /wi ldcat a . . . .
N o r w a y Viking Graben ( 5 8 0 - - 6 2 ° N) (o i l and gas) b N u m b e r of exploratory drillings . . . . . . . 4 9 16 27 26
-- 4 6 11 12 N u m b e r of wildcats . . . . . . . Increase in cumulative reserves ( R ( t ) ) . . . . . . . . 5 ! 5 3 2 0 6 6 0 190
- 29 29 17 -- mtoe/exploratory drillinga . . . . . . . m t o e / w i l d c a t a . . . . . . . . 83 71 4 0 -
a 3 year progressive mean.
b 1 m t o e = 1 billion m3 of natural gas.
322 ENERGY POLICY December 1977

Depletion poficy options for Western Europe
parts of Central and Viking Graben, particularly if the time series are separated into fields from the Paleocene, the Zechstein and the Upper Jurassic. The time series are, however, very short and care should be exercised. For the Norwegian part of the Viking Graben the amount discovered per wildcat has increased, but time series are short and represent the 'go-slow' policy of the Norwegian government.
Official estimates Appreciation does not seem to add much to discovered reserves, and the statistical basis is insufficient for an estimate of future discoveries by means of logistic growth curves. We are therefore left with government estimates of probable and possible reserves, which at least represent the best geological knowledge (Table 2).
Expectations are greatest for the Irish Sea and the continental shelf north of 62 ° northern latitude. In the British sectors the Department of Energy estimates reserves of up to 4500 mtoe, while Norwegian reports only state that seismic studies have indicated 'quite thick sedimentary layers' which fulfil one of the preconditions for the formation of oi l . 2 Regulation of exploration by the Norwegian government makes it clear that exploratory drilling will not be carried out before 1978, implying that further knowledge about this area will not be available until the 1980s.
In our use of the data presented in Appendix 1 we may have overstated the production potential of known fields. Longer delays and more repairs than expected might occur. Estimates for 'additional commercial reserves' and 'probably commercial fields', being the highest found in the open literature, may prove too high.
Similarly, we may have underestimated the North Sea's production potential by the 1980s. In a situation of high oil prices, favourable taxes, etc successful development and introduction of secondary and tertiary exploitation techniques may lead to significantly higher
a Government estimates. b Brown Book, op cit, Ref 16.
c Based on a modest gas/oil ratio of 400 m~/toe. d Report 30 to the Norwegian Storting, op cit, R ef 2. e Slight increase of present figures; authors' estimate. f P.R. Odell, Energy Policy, Vol 2, No 4, December 1974. g Shell, press conference, November 1976.
Table 2. Oil and gas reserves in Western Europe
Reserve estimates as used in our scenario calculations (mtoe)
Commercial fields Newly discovered Total and unassessed fields
North sea 4375 2475 6850 UK 2490 1620 4110 Netherlands 360 265 625 Norway and Denmark 1525 590 2115 Continent 4590 -- 4590 Total Western Europe 8965 2475 11440
Estimates of ultimate oil and gas reserves in Western Europe (103 mtoe)
Oil Oil and gas
North Sea 9.9 a UK 4.5 b 6.3b, c No rway 2.0 d 2.8c, d Netherlands 0.8 e North Sea 10.8--18.9 f North Sea (below 62 °) 7.8 g 13.3_14.3 g Continent 4.6 a Total Western Europe 14.5 a
18.8--26.9 f 17.9-- 18.99
ENERGY POLICY December 1977 323
Depletion policy options for Western Europe
reserves and longer production periods. Also, small, as yet unevaluated fields may contain on average considerably more than 10-15 mtoe. Finally, appreciation may prove more important than it has been until now.
However, we believe our data are sufficiently accurate to provide a firm basis for the formulation of alternative depletion strategies for Western Europe's indigenous oil and gas reserves.
1~ The calculation has the nature of a firm prediction for commercial fields, while it has very limited value for 'probably commercial reserves' and "small fields' and 'fields being assessed" owing to the geological and economic uncertainties involved. For reference, oil and gas consumption in Western Europe up to 1 9 7 4 is also included.
E x p e c t e d and des irable e o n s u m p t i o n
The availability of gas and oil is determined as much by their rates of consumption as by the magnitude of the reserves. Consumption of the oil and gas reserves listed in Appendix 1 was calculated on the basis of standard consumption curves. Such a curve for natural gas was discussed in our earlier paper, 1 and a similar one may be constructed for oil. It has a somewhat different shape, because of the different techniques used in exploitation. The relevant parameters for the standard oil and gas consumption curves used are given in Appendix 2.
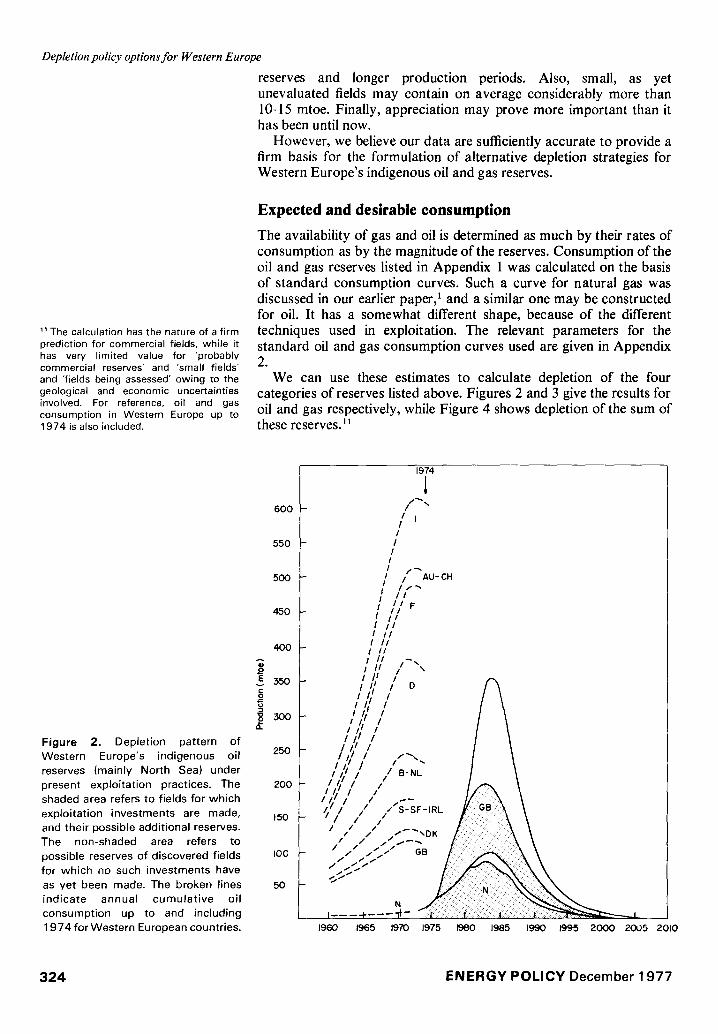
We can use these estimates to calculate depletion of the four categories of reserves listed above. Figures 2 and 3 give the results for oil and gas respectively, while Figure 4 shows depletion of the sum of these reserves.~
Figure 2. Depletion pattern of Western Europe's indigenous oil reserves (mainly North Sea) under present exploitation practices. The shaded area refers to fields for which exploitation investments are made, and their possible additional reserves. The non-shaded area refers to possible reserves of discovered fields for which no such i n v e s t m e n t s have
as yet been made. The broken lines indicate annual cumulat ive oil consumption up to and including 1 9 7 4 for Western European countries.
600
550
500
450
40O A
o
300
250
200
150
I00
50
1974
/ / I /
/ l
I I /
i / r ~AU-CH i '// '
I F I , // I i i I II
I / /
I g i1--., I .. \
1960 1965 1970 1975 1960 1985 1990 1995 2000 2005 2010
324 ENERGY POLICY December 1977

450
Depletion policy options for Western Europe
Figure 3. Depletion pattern Western Europe's indigenous gas reserves under present exploitat ion practices. As in Figure 2 the shaded area refers to gas fields already taken into exploitation. Past consumption equals production since imports are negligible.
400
350
300
E 250
200 fl_
150 of
100
50
1960 196,5 1970 197,5 1980 1985 [990 1995 2000 2005 E)IO
1200
I~0
I000
9OO
8OO
"E 7OO
• o 600 o
5OO
F i g u r e 4 . G a s and oil p r o d u c t i o n f r o m
Western European fields under 400 present exploitat ion policies. The shaded area refers to production f rom ~0o fields already taken into exploi tat ion and based on official reserve estimates. The broken lines show the 200 production increase if an addit ional 3000 and 6000 mtoe become avail- Ioo able over and above presently est imated reserves of some 12 000 mtoe.
1974
f :: Europe OECD- cool,oil and gas consumption
..': - Europe OECD- oil ond gas consumption
. : .! ,% / / / \
... ... : _ ~ \
.... / / \ \
.:: \ \
.'/ \ \ Gas ./" / \ \
1960 1965 1970 1975 1980 1965 1990 1995 2 0 0 0 20(36 2010
ENERGY POLICY December 1977 325

12Throughout this article we assumed that non-European exports from North Sea oil and gas will be only a minor fraction of total production. In view of the heavy involvement of US-based oil companies this assumption might prove false (Table 3).
Depletion policy options for Western Europe
In the consumption of the reserves on which we can count, the dominant role of the recent oil finds and the Groningen gas reserves in the Netherlands is clear. Figure 2 shows that the yield from British and Norwegian oil fields will together outstrip their combined present consumption by more than 25 mtoe/year for a period of five years, which amount will be available for export.
Since the yields of the most important Dutch and English natural gas fields have already reached their plateau values, additional quantities can only be expected from fields on the Dutch continental shelf and from associated gas in the Ekofisk area and the Central and Viking Graben. These can be estimated at about 50 billion m3/year from 1978.
The inclusion of estimated additional reserves in fields already being exploited provides for a possible increase of oil supply for some years of up to 35 mtoe/year (15%). We assume this oil would be exploited only to lengthen the lifetime of the commercial fields. The ultimate recovery factor is an important parameter in this lengthening process. This uncertainty does not exist for natural gas, so that inclusion of additional reserve estimates in natural gas consumption does not appreciably increase the lifetime of those reserves.
Recently discovered commercial fields and smaller fields are the only reserves for which political decisions are still relevant, since major investments in their exploitation have not yet been made. In calculating the results presented in Figures 2, 3 and 4 we used the most optimistic estimates of newly discovered reserves, and 10 mtoe as an average for the small, unassessed fields. We have assumed that their exploitation would start around 1980, in line with announced plans, and that most, including the smaller, gas fields are taken into exploitation when the planned pipelines are finished (1982 for the UK, 1984 for Norway).
Leaving aside the geological uncertainties, immense efforts will be required from industry and governments to realize this rate of depletion, but Norway and the UK would then benefit enormously from it. The 300 mtoe of oil extracted per year would not only completely satisfy their own needs, but would provide between one third and one half of present oil needs of Western Europe, from 1982 until 1987. This underlines the importance of recent oil finds. Natural gas consumption would increase from the present 170 billion m 3 up to 270 billion m 3 between 1982 and 1990, and so reduce Europe's oil imports by another 100 mtoe. ~2
However, our calculations demonstrate the enormous efforts that will be required to maintain oil and gas supplies at 550-600 mtoe/year after 1987. Balance of payment problems and dependence on the OPEC cartel, which should be diminished by the rapid exploitation, will return after about five years. From 1985 onwards Western Europe would be confronted with a steep decline in indigenous oil and gas production in the order of 50 mtoe/year per year. This will raise enormous 'rate and magnitude' problems, when substitution to other energy sources and technologies will have to take place.
Supposing that no further reserves were discovered to prevent this decline, three substitution options may be conceived to maintain energy production levels of 300 mtoe of oil and 270 billion m 3 of natural gas:
• direct electricity from nuclear plants;
326 ENERGY POLICY December 1977

13 R. Krymm, 'A new look at nuclear power costs', IAEA Bulletin, Vol 18, No 2, 1976, pp 2-12.
Depletion policy options for Western Europe
• hydrogen production by nuclear plants; • coal gasification.
Using the OECD base case projection s for 1985 distribution of energy over the user sectors, and some reasonable estimates for future conversion efficiencies, one would have to put into operation annually within about 10 years from now 60 nuclear power stations of 1000 MWe, or 95 1000 MWe nuclear power stations, or 50 million tons of coal per year, or 30 1000 MWe nuclear power stations and 35 million tons of coal in case of coal hydrogenation.
These are only order-of-magnitude estimates of the scale on which substitution would have to take place just to compensate for the decline in indigenous fossil fuel production. The growth rates for nuclear energy are some 3 to 4 times higher than is assumed in official estimates. '3 Substitution by coal gasification requires an annual increase in coal production from 1985 onwards equivalent to 15% of the total 1985 production level as forecast by the OECD. 5
We consider such a transition rate to be undesirable, unnecessary, and practically impossible. The transition seems impossible because of the tremendous rate at which capital, manpower, management, and uranium facilities would have to be made available - leaving aside public opposition to such giant nuclear power building programmes. It is undesirable because such a rate of substitution is bound to be detrimental to safety and environmental standards, while creating a severe dependence on a highly centralized and potentially very dangerous technology. It is unnecessary because, combined with a slowdown of indigenous fossil fuel consumption, alternative energy strategies can be realized, based on more efficient use of energy, development of new energy conversion techniques, and development of new sources.
A consumption pattern as sketched in Figure 5 is unfortunately not unrealistic. The Norwegian government appears to be less than susceptible to pressures. It has opted for a slow exploration policy, which for instance couples permission for exploration in a very promising area with a requirement for exploration in a less promising area, to obtain in an efficient and rational manner and at a planned rate information about their area of the continental shelf. The greatest worry of these 'Blue-eyed Arabs' appears to be to guard their local socio-economic structure against ruination by an oil bonanza, such as occurred in Alaska.
The British government's attitude appears to be quite different. In December 1974 the British Secretary for Energy declared:
We propose, therefore, to take powers of control for use in the future, but it remains the Government ' s aim that oil production from the U K Continental Shelf builds up as quickly as possible over the next few years ... This will help our balance of payments , contribute to Government revenues, stimulate our industries and make our energy supplies more secure.
Secure, yes, but for how long? Our calculations appear to limit the period to a maximum of ten years, inevitably followed by a possibly disastrous decline.
Stated British policy on depletion is largely confined to reserves discovered after 1975, with a consumption limitation of at most 20% not starting before 1982 or four years after exploitation has been started. On this basis it will hardly be possible to limit consumption in probably commercial fields, where exploitation investment has not yet
ENERGY POLICY December 1977 327

Depletion policy options for Western Europe
Figure 5. Gas and oil production from Western European fields under a
policy of delayed exploitation of the Central and Viking Graben oil and gas fields and of the Norwegian gas fields north of the Ekofisk area. The broken lines show production from an
additional 3 0 0 0 and 6 0 0 0 mtoe to maintain a production level of 4 0 0 mtoe/year and an "acceptable' decline of 2 2 - 5 mtoe/year. The shaded areas have the same significance as in
Figure 4.
1200
I100
I000
900
800
o o ~ 700
6oo
Oh
500
400
3OO
200
I00
/
r •
f
f"
1974
:'.,.
Europe OECD - cool, oil and gos consumption
• : Europe OECD-oil ond gas consumption /
f .: j
i
,.::,:: . . . .
.. " ~X "-'\\ ....." G o s a n d o i l ~ N,~ ~ \ \ \ \
::' \ \
1960 1965 1970 1975 1980 19~5 1990 1995 2000 2005 2010
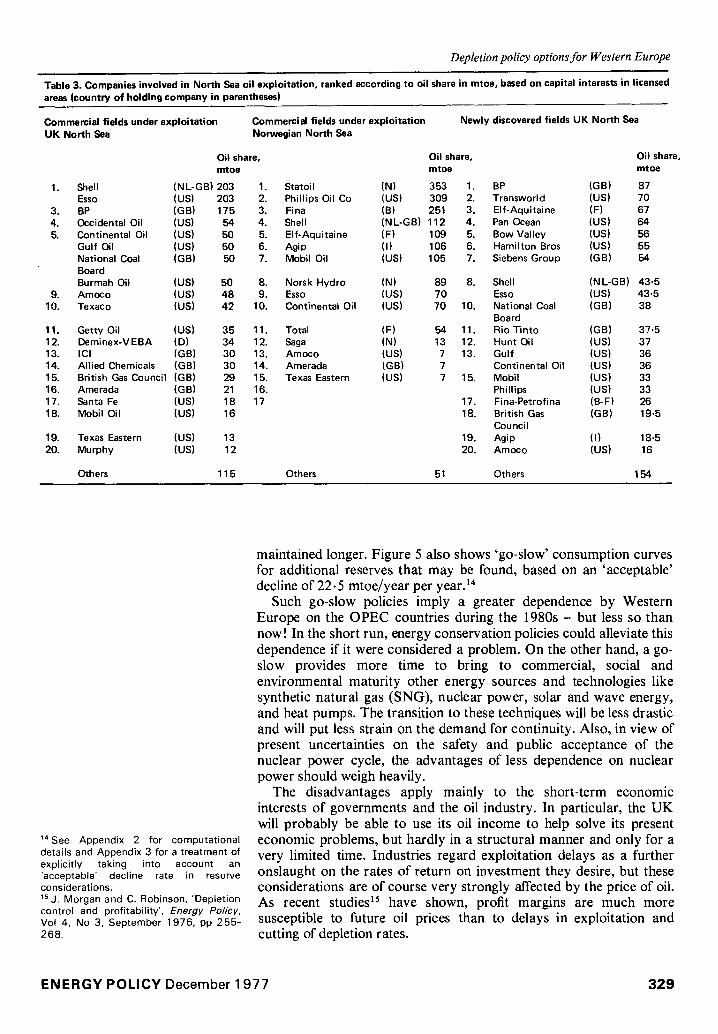
been made. Of course, from a purely commercial point of view, rapid depletion appears advantageous. A policy of depletion control would in general adversely affect oil company cash flows. Table 3 lists companies involved and shows the extent of their interest.
Whether the rate and magnitude problem can be avoided by finding new reserves depends on how they are put to use. Table 2 gives estimates for total possible oil and gas reserves in the North Sea. There are good prospects of proving a further 3000 mtoe. Ultimate reserves in Western Europe are possibly 3000 mtoe more, ie a total of some 18 000 mtoe.
In Figure 4 we show the various ways such additional reserves could be exploited. By depleting as rapidly as possible, the highest estimate would then delay the rate and magnitude problems for no more than 3 years.
Alternatively, a 'go-slow' policy could be initiated, in which a decline of between, say, 15 and 30 mtoe/year per year would be considered acceptable. An example of this policy as it affects newly discovered commercial fields and small, unassessed fields - the only reserves that can still be politically influenced - is given in Figure 5. For this calculation it was assumed that the output of those reserves would only be used to delay the decline from the level of some 420 mtoe/year, supplied by the existing commercial reserves. Obviously, the availability of fossil fuels would be considerably extended, and as more reserves are found, the level of 420 mtoe/year can be
3 2 8 E N E R G Y P O L I C Y December 1977
Depletion policy options for Western Europe
Table 3. Companies involved in North Sea oil exploitation, ranked according to oil share in mtoe, based on capital interests in licensed areas (country of holding company in parentheses)
Commercial fields under exploitation Commercial fields under exploitation Newly discovered fields UK North Sea UK North Sea Norwegian North Sea
Oil share, mtoe
1. Shell (NL-GB) 203 1. Esso (US) 203 2.
3. BP (GB) 175 3. 4. Occidental Oil (US) 54 4. 5. Continental Oil (US) 50 5.
Gulf Oil (US) 50 6. National Coal (GB) 50 7. Board Burmah Oil (US) 50 8,
9. Amoco (US) 48 9. 10. Texaco (US) 42 10.
11. Getty Oil (US) 35 11. 12. Deminex-V EBA (D) 34 12. 13. ICI (GB) 30 13. 14. Allied Chemicals (GB) 30 14. 15. British Gas Council (GB) 29 15. 16, Amerada (GB) 21 16, 17. Santa Fe (US) 18 17 18. Mobil Oil (US) 16
19. Texas Eastern (US) 13 20. Murphy (US) 12
Others 115
Oil share, mtoe
Statoil (N) 353 1, BP (GB) Phillips Oil Co (US) 309 2, Transworld (US) Fina (B) 251 3. Elf-Aquitaine (F) Shell (NL-GB) 112 4. Pan Ocean (US) Elf-Aquitaine (F) 109 5. Bow Valley (US) Agip (I) 106 6. Hamilton Bros (US) Mobil Oil (US) 105 7. Siebens Group (GB)
Norsk Hydro (N) 89 Esso (US) 70 Continental Oil (US) 70
Total ( F ) 54 Saga (N) 13 Amoco (US) 7 Amerada (GB) 7 Texas Eastern (US) 7
8. Shell (NL-GB) Esso (US)
10. National Coal (GB) Board
11. Rio Tinto (GB) 12. Hunt Oil (US) 13. Gulf (US)
Continental Oil (US) 15. Mobil (US)
Phillips (US) 17. Fina-Petrofina (B-F) 18. British Gas (GB)
Council 19. Agip (I) 20. Amoco (US)
Oil share, mtoe
87 70 67 64 56 55 54
43.5 43.5 38
37.5 37 36 36 33 33 26 19.5
18.5 16
Others 51 Others 154
14See Appendix 2 for computational details and Appendix 3 for a treatment of explicitly taking into account an 'acceptable' decline rate in reserve considerations. ls j . Morgan and C. Robinson, 'Depletion control and profitability', Energy Policy, Vol 4, No 3. September 1976, pp 255- 268.
maintained longer. Figure 5 also shows 'go-slow' consumption curves for additional reserves that may be found, based on an 'acceptable' decline of 22.5 mtoe/year per year. ~4
Such go-slow policies imply a greater dependence by Western Europe on the OPEC countries during the 1980s - but less so than now! In the short run, energy conservation policies could alleviate this dependence if it were considered a problem. On the other hand, a go- slow provides more time to bring to commercial, social and environmental maturity other energy sources and technologies like synthetic natural gas (SNG), nuclear power, solar and wave energy, and heat pumps. The transition to these techniques will be less drastic and will put less strain on the demand for continuity. Also, in view of present uncertainties on the safety and public acceptance of the nuclear power cycle, the advantages of less dependence on nuclear power should weigh heavily.
The disadvantages apply mainly to the short-term economic interests of governments and the oil industry. In particular, the UK will probably be able to use its oil income to help solve its present economic problems, but hardly in a structural manner and only for a very limited time. Industries regard exploitation delays as a further onslaught on the rates of return on investment they desire, but these considerations are of course very strongly affected by the price of oil. As recent studies 1~ have shown, profit margins are much more susceptible to future oil prices than to delays in exploitation and cutting of depletion rates.
ENERGY POLICY December 1977 329

Depletion policy options for Western Europe
Some economic considerations
There are great uncertainties in the future prices of oil and gas and in the 'acceptable rates of return on investment' which have a bearing on the economic consequences of slowing down exploitation. In our view, the economic disadvantages of delayed exploitation should be balanced carefully against the risks of future rapid decline, as outlined above.
However, by using recent calculations by Morgan and Robinson 15 on the effect of depletion control on internal rate of return (IRR) and net present values, one can come to some conclusions. It appears that at constant current prices of oil, an exploitation delay of 2 years and a 10% depletion cut brings to below 20% the IRR of about half the production potential of newly discovered commercial fields. If oil prices are kept constant in real terms, a delay in exploitation of even several years more than 2 years would not put the IRR of any new field below 20%.
The dilemma is quite clear. Because of the great sensitivity of IRR to future energy prices, a slower, more careful depletion of Europe's indigenous fossil resources is economically more justified when energy prices increase, relative for instance to capital goods prices. Energy price rises, however, are also the greatest incentive for rapid depletion in reaching short-term political goals. It would appear that purely economic arguments are insufficient when considering an energy policy. In fact, as discussed above, Norway - which admittedly is in a more favourable economic position - has opted for delayed exploitation by way of slowing down the exploration.
Conclusions
After careful categorizing of known oil and gas reserves in Western Europe, we found that with present exploitation practices and official - conservative - reserve estimates, indigenous oil and gas production might reach some 400 mtoe/year in the early 1980s, for 5-6 years.
Appreciation of reserves appears to have minor importance for the North Sea fields. However, taking into account recently discovered fields and using high estimates for older fields the production potential could well increase to 500-600 mtoe/year, or about half of Western Europe's present energy needs. Major discoveries up to a total of cumulative oil and gas reserves of some 18 000 mtoe might push production further up to 700-800 mtoe/year by 1985.
Such a depletion policy would confront Western Europe with severe problems stemming from the need to substitute new energy sources for the declining indigenous oil and gas production - at an unprecedented rate and scale. In this context we propose the use of an effective reserve index instead of a static or dynamic one, to account for the fact that substitution of oil and gas is only possible at a fairly restricted rate.
To avoid the social risks involved in such large-scale high-rate substitution processes, necessary only to maintain existing production levels, more attention should be paid to the desirability and consequences of a go-slow depletion policy. An energy policy based on longer term interests would not favour speeding up indigenous production - at least not on the basis of present knowledge. As an
330 ENERGY POLICY December 1977

Depletion policy options for Western Europe
example we propose a policy of delayed exploitation of recently discovered oil fields for which no production facilities as yet are installed. If oil prices keep constant in real terms, internal rates of return would decrease as a consequence of delayed production, but for most fields remain at more than 20%.
A p p e n d i x 1
Oil and natural gas felds in Western Europe Every field or area is categorized as follows:
(a) Fields in which investments have been made; lowest official estimate as of 1 January 1976.2,3,6.16
(b) Same, but highest official estimate in literature, z,3,6,7,16-~8
(c) Fields in which at 1 January 1976 no investments had been made; highest official estimate in literature. 2.3,6,7.16--18
(d) Small, as yet unassessed fields; for the purpose of calculation taken as 10mtoe and in the case of associated gas an additional 5 mtoe of gas.
Lowest and highest estimates of reserves are given in parentheses. A is oil, B is gas. CUM indicates total cumulative reserves.
Continental Europe A. Oil Category (a): with an appreciation relation, 9 37 fields in France, Italy, the Netherlands, Austria, Spain and West Germany have been evaluated. Total exploitable reserves 400 mtoe, probably a low estimate.
B. Natural gas Category (a): 9 natural gas areas in France, Italy, Austria and West Germany, 1 total exploitable reserves 890 mtoe.
Carbon Gas Province: Northern West Germany, the Netherlands, the Southern North Sea B1. Six appreciated gas felds in Elbe- Weser-Ems-area Category (a): Total exploitable reserves 485 mtoe; ultimate reserves estimated at 550 mtoeJ 9
B2. Slochteren and 11 smaller areas in the Netherlands Category (a): total exploitable reserves 2450 mtoe, of which Groningen holds 2150 mtoe.
B3. Dutch part of the continental shelf Categories (a), (b): 4 fields with a concession for exploitat ion- L/10-L/11 (100-140 mtoe), K14-K17 (20- 50mtoe), K/6-L/7 (30mtoe), K/13 (100-140 mtoe); CUM = 250-360 mtoe. Category (c): 4 fields without permission for exploitation - K/8, K/15, L/13, L/14 (20mtoe each); CUM = 80 mtoe. Category (d): 13 unevaluated or small fields; CUM = 130 mtoe.
B4. UK continental shelf Categories (a), (b): 7 fields, most in production - West Sole (80mtoe), Leman (380-400mtoe), Indefatigable (155-160 mtoe), Hewet t t (120- 140 mtoe), Deborah-Dotty Hewett Nord (35mtoe), Rough (12-13 mtoe), Viking (145-155 mtoe); CUM = 925- 1000 mtoe. Category (c): 5 fields - Ann, Dudgeon, Scan, Broken Bank, Amethyst; CUM = 60 mtoe. Category (d): 13 small or unassessed fields; CUM = 130 mtoe.
Central Graben: Ekofisk and East of Shetland A1. Oil from the Ekofisk area, mainly accumulations in Danian-Maestrichtian chalk layers on the northern part of the continental shelf Categories (a), (b): Cod (3-7mtoe), Ekofisk (122-160mtoe), West-Ekofisk (33-85 mtoe), Tor (21-35 mtoe), Eldfisk (56-98 mtoe), Edda (7-21 mtoe), Albuskjell (12-40 mtoe), and the Danish field Dan (20-30mtoe); CUM = 275- 450 mtoe.
Categories (c), (d): The Danish fields I, T and Vern; the Norwegian fields 25/8, SE Eldfisk, NW Tor, Flyndre, Hod, Valhalla; small or unevaluated; CUM = 65 mtoe.
B1. Mainly associated gas from Ekofisk area Categories (a), (b): Cod (20mtoe), Ekofisk (125-140mtoe), West Ekofisk (39-70 mtoe), Tor (13-27 mtoe, including S-E Tor), Eldfisk (75- 99 mtoe), Edda (7-17 mtoe), Albuskjell (40-85 mtoe); CUM = 319-428 mtoe. Category (d): 5 Danish and 6 Norwegian fields, qualified as small or unevaluated; CUM = 70 mtoe.
A2. Oil from the British and Dutch part of Central Graben in fields from Paleocene, Zechstein and Upper Jurassic Categories (a), (b): Montrose (20- 27 mtoe), Forties (240 mtoe), Auk (7- 16 mtoe), Argyll (7-16 mtoe), Piper (85- 110 mtoe), Claymore (50-60mtoe); CUM = 410-470 mtoe. Category (c): 2 Dutch oil fields - F/18 and F/3 (55 mtoe); 6 British fields - Josephine, 30/2, Maureen, Lomond, Andrew (70 mtoe), Buchan (100 mtoe); CUM = 325 mtoe. Category (d): 1 Danish and 10 British small or unevaluated fields; CUM = 110 mtoe.
Viking Graben: British and Norwegian part A 1. British oil fields from the Jurassic Categories (a), (b): Brent (195- 270 mtoe), Cormorant (21-54 mtoe), Beryl (55-90 mtoe), Thistle (50- 100 mtoe), Dunlin (55-60 mtoe), Heather (20-30mtoe), Ninian (130- 150 mtoe), Statfjord UK (40-60 mtoe); CUM = 565-815 mtoe. Category (c): Hutton (50 mtoe), Alwyn
E N E R G Y POLICY December 1 977 331

Depletion policy options for Western Europe
(100 mtoe), Crawford (70 mtoe), Bruce (30mtoe), Magnus (140mtoe), 9/13-4 Mobil (25 mtoe), Brae (160 mtoe), Tern (25mtoe), 2/10 Siebens (40mtoe), Murchison (80 mtoe); CUM = 720 mtoe. Category (d): 15 fields as yet unevaluated; CUM = 150 mtoe.
B1. Associated gas from Central and Viking Graben Category (a): Frigg UK (100mtoe), Brent (85 mtoe), Statfjord UK (20 mtoe); CUM = 205 mtoe. Categories (c), (d): Associated gas in smaller fields, exploitable by way of a British pipeline; CUM = 180 mtoe.
A2. Norwegian oil fields in Viking Graben Category (a): Statfjord (515 mtoe). Categories (c), (d): Unevaluated field Gudrun; Bream, Brisling, Sleipner (20 mtoe each); CUM = 70 mtoe.
B2. Norwegian gas fields in Viking Graben Category (a): Frigg (100 mtoe). Category (c): Statfjord (180mtoe), Heimdal (60 mtoe), Odin (30 mtoe), E, NE and SE Frigg (80 mtoe) and some others, to be exploited by a pipeline. Total exploitable reserves estimated at 375 mtoe, could well increase to 500 mtoe.
Appendix 2 The standard oil production curve The curve consists of five parts:
• discovery of the field at time to; • start of production, some 2-6 years
after discovery; • build-up of production, ie linear
increase of production until plateau value is reached (1-5 years);
• plateau period during which production is a fixed fraction of cumulative reserves (generally 8- 12%)
• when 40% of the cumulative reserves are depleted, production declines exponentially.
The actual values chosen for the curve parameters are, as far as available, based on production data and on published production plants. 2,3'6'7'~6-~s Average parameter values of the areas concerned were assigned to fields
without announced production plans. Our go-slow scenario calculation
(Figure 5) is based on extending the period between discovery and start of production for the UK Central Graben and Viking Graben category (c): production from these fields starts in 1984-1987 (instead of in 1981-82). In connection with these delays operation of the British and Norwegian gas pipelines is assumed to start in 1984- 86, two years later than presently planned. Finally, the small and not yet evaluated fields in category (d) were assumed to be taken into exploitation by 1991.
Appendix 3 To evaluate reserves generally the static reserve index S = Ro/Pois used, where R 0 and P0 are respectively reserves and production in the year of evaluation. A dynamic index D, which takes into account the exponential increase in consumption, has also been suggested, D = l l n (I +aS) , where a = l l n (1 + k), with k the growth rate over period 7- (usually one year). To
incorporate rate and magnitude problems into the evaluation it would seem better to use an effective reserve index T, which is the period for which consumption may be allowed to grow at an (annual) rate k, while insisting on a maximum acceptable decline rate d. Tis then the time between the year of evaluation and the consumption peak. As long as it is positive consumption can continue to grow at the (annual) rate k(= In (1 + a)); when it is zero the decline should be started; when it is negative the point has already been passed at which an acceptable decline should have started. T can be calculated a s
l 1 r=~t.__d+!i. ~+ ~a Po a a 2-7(1 +aS)- l
To compare T with the static and the exponential reserve index, the time of the constant decline ~ = PQ/d exp aT should be added, since T + 6 is the time to complete depletion of the resource.
Figure 5 illustrates the use of these reserve indices. Past and planned production of gas and oil from European
5000
i
8 2ooo
iooo
A
IO
~X~ <T' i / D' ..... l l
- \ -..+. - - ~ I S=S'
T+8 I 1,+ 8 , ~ . i _ _
20 30 40 50 60 70 80
Time (yeors)
F i g u r e 6. Comparison of static (S), dynamic (D) and effective (7") reserve indices for two different reserve positions: build-up rate of production 1 7% per year, dec l ine of 50 mtoe/year ( S , D , T , T + ~ ) and build-
up rate of production of 5% per year, dec l ine of 2 2 . 5 mtoe /yea r (S ' ,D ' ,T~,T ' + ~ '). For both cases reserves in year t o are taken as 16 000 mtoe, production in year to 2 00 mtoe.
3 3 2 E N E R G Y P O L I C Y December 1 9 7 7

fields presently grow at an annual rate of about 17%. The present production level is about 200 mtoe/year, and net reserves are estimated at 10000 and 16000mtoe respectively. The decline rate appears to be of the order of 50 mtoe/year per year. A decline rate of 22.5 mtoe/year is thought more desirable to avoid the associated rate and magnitude problems of such a steep decline. The values of the various reserve indices for these cases are given in Table 4.
T is the time lapse during which continued growth of consumption at the specified rate is justified. After T + (5 years all reserves are exhausted.
In our view the parameters T and are more valuable than the indices S and D for evaluating the resource base. Figure 6 illustrates this point for two cases.
Depletion policy options for Western Europe
Table 4. Comparison of static (S), dynamic (D) and effective (7") reserve indices as a function of initial consumption growth rate k and maximum acceptable decline rate d (~ indicates the number of years between beginning and end of the decline period)
R o = 10000mtoe Do = 200mtoe/year S D T T + $
k = 17% d = 50 mtoe/year 50 13.9 8.7 24.4 k = 17% d = 22.5 50 13.9 6.8 32.7 k = 5% d = 50 50 25.5 20.5 31.4 k = 5% d = 22.5 50 25.3 17.0 37-4
R ° = 16 000 mtoe Do = 200mtoe/year S D T T+
k = 17% d = 50 mtoe/year 80 16-6 10.5 31.3 k = 17% d = 22.5 80 16.6 8.4 41.7 k = 5% d = 50 80 32.6 26.3 40.8 k = 5% d = 22.5 80 32.6 22.3 48.8
~e Department of Energy, Development of the oil and gas resources of the UK, Brown Books, HMSO, London, 1975; 1976. ~? Annuaire Europ~en de P~trole, (ANEP), Otto Vieth Verlag, Hamburg, 1973, 1974,
1975. 18Norwegian Oil and Gas Journal, (Noroil), 1975, 1976. lS A. Mayer-GLirr, Erdgaserwartungen in der BRD, ErdSI-Erdgas-Zeitschrift, May 1975, pp 141-145.
E N E R G Y P O L I C Y D e c e m b e r 1 9 7 7 3 3 3