DEPARTAMENTO DE BIOQUÍMICA Y BIOLOGÍA MOLECULAR
366
DEPARTAMENTO DE BIOQUÍMICA Y BIOLOGÍA MOLECULAR Programa de Doctorado de Biociencias y Ciencias Agroalimentarias “Functional characterization of molecular regulatory mechanisms controlling the ripening in strawberry fruit” “Caracterización funcional de mecanismos reguladores del proceso de la maduración del fruto de fresa” TESIS DOCTORAL Félix Juan Martínez Rivas Directores: Rosario Blanco Portales Francisco Javier Molina Hidalgo Córdoba, Febrero 2021
-
Upload
khangminh22 -
Category
Documents
-
view
2 -
download
0
Transcript of DEPARTAMENTO DE BIOQUÍMICA Y BIOLOGÍA MOLECULAR

DEPARTAMENTO DE BIOQUÍMICA Y
BIOLOGÍA MOLECULAR
Programa de Doctorado de Biociencias y Ciencias Agroalimentarias
“Functional characterization of molecular
regulatory mechanisms controlling the ripening
in strawberry fruit”
“Caracterización funcional de mecanismos
reguladores del proceso de la maduración del
fruto de fresa”
TESIS DOCTORAL
Félix Juan Martínez Rivas
Directores: Rosario Blanco Portales
Francisco Javier Molina Hidalgo
Córdoba, Febrero 2021

TITULO: Caracterización funcional de mecanismos reguladores del proceso de lamaduración del fruto de fresa
AUTOR: Félix Juan Martínez Rivas
© Edita: UCOPress. 2021 Campus de RabanalesCtra. Nacional IV, Km. 396 A14071 Córdoba
https://www.uco.es/ucopress/index.php/es/[email protected]

UNIVERSIDAD DE CÓRDOBA
FACULTAD DE CIENCIAS
DEPARTAMENTO DE BIOQUÍMICA Y BIOLOGÍA MOLECULAR
TESIS DOCTORAL
“Functional characterization of molecular
regulatory mechanisms controlling the
ripening in strawberry fruit”
Memoria de Tesis Doctoral presentada por Félix Juan Martínez Rivas, Graduado
en Bioquímica, para optar al grado de Doctor en Bioquímica por la Universidad de
Córdoba con la mención de Doctorado Internacional
Córdoba, Febrero de 2021


UNIVERSIDAD DE CÓRDOBA
FACULTAD DE CIENCIAS
DEPARTAMENTO DE BIOQUÍMICA Y BIOLOGÍA MOLECULAR
ROSARIO BLANCO PORTALES, Investigadora Ramón y Cajal y FRANCISCO
JAVIER MOLINA HIDALGO, Investigador postdoctoral en el Departamento de
Bioquímica y Biología Molecular de la Universidad de Córdoba
Certificamos
Que FÉLIX JUAN MARTÍNEZ RIVAS, Graduado en Bioquímica por la Universidad de
Córdoba, ha realizado bajo nuestra dirección el trabajo de investigación correspondiente
a su Tesis Doctoral titulada “Functional characterization of molecular
regulatory mechanisms controlling the ripening in strawberry fruit”.
Revisado el presente trabajo estimamos que reúne todos los requisitos exigidos por la
Normativa vigente para optar al grado de Doctor y que puede ser presentado al Tribunal
que ha de evaluarlo, por ello autorizamos la defensa de esta Tesis en la Universidad de
Córdoba.
Córdoba, 15 de febrero de 2021.
Dra. Rosario Blanco Portales Dr. Francisco Javier Molina Hidalgo

TÍTULO DE LA TESIS DOCTORAL: “Functional characterization of
molecular regulatory mechanisms controlling the ripening in
strawberry fruit”.
DOCTORANDO/A: Félix Juan Martínez Rivas
INFORME RAZONADO DEL/DE LOS DIRECTOR/ES DE LA TESIS (se hará mención a la evolución y desarrollo de la tesis, así como a trabajos y publicaciones derivados de la misma).
El graduado Félix Juan Martínez Rivas ha desarrollado, en el seno del grupo BIO-278
liderado por el Dr. Juan Muñoz Blanco, el trabajo de investigación llamado “Functional
characterization of molecular regulatory mechanisms controlling the ripening in
strawberry fruit” que constituye el tema de su Tesis Doctoral para optar al grado de
Doctor con Mención Internacional. Este trabajo de investigación ha sido dirigido y
supervisado por la Dra. Rosario Blanco Portales y el Dr. Francisco Javier Molina Hidalgo,
ambos miembros del Departamento de Bioquímica y Biología Molecular de la
Universidad de Córdoba. Durante el periodo de investigación en el que se ha desarrollado
esta tesis, el Gdo. Martínez Rivas, además de haber desarrollado un correcto aprendizaje
en el laboratorio, que le ha permitido adquirir una amplia experiencia en diferentes
técnicas de Biología Molecular (mostradas en el apartado de materiales y métodos de la
tesis presentada), ha realizado dos estancias cortas (5 meses en total) en el grupo de
investigación dirigido por el Dr. Alisdair R. Fernie “Central Metabolism” del “Max
Planck Institute of Molecular Plant Physiology” en Potsdam, Alemania, donde se
realizaron parte de los análisis presentados en la tesis, y donde el Gdo. Martínez Rivas se
incorporará como investigador postdoctoral a la finalización de la tesis doctoral.
Durante el desarrollo de esta tesis doctoral se han estudiado varios genes, FaPRE1,
FaMYB123 y FaCXE2 relacionados en el control del proceso de maduración, de la
producción de antocianinas y flavonoles, y de la producción de compuestos volátiles,
respectivamente. También, se describe como el cambio en el patrón de metilación afecta
al normal desarrollo del proceso de maduración. El hecho de que este trabajo esté
estrechamente relacionado con el esclarecimiento de los procesos moleculares implicados
en el control de la maduración del fruto de fresa lo hace especialmente interesante desde
el punto de vista biotecnológico. Los resultados obtenidos por el Gdo. Martínez Rivas, e
incluidos en esta tesis doctoral dentro del trabajo realizado en el grupo BIO-278 y en
colaboración con grupos de la Universidad de Málaga y con el grupo del Dr. Fernie, han
dado lugar a 13 comunicaciones a congresos nacionales e internacionales, incluida la
obtención de un premio a mejor comunicación oral y a 3 publicaciones en revistas

indexadas e incluidas en el primer cuartil en el campo de la investigación en plantas
superiores, lo que avala su interés para la comunidad científica.
Además, el Gdo. Martínez Rivas también posee 5 manuscritos bajo revisión en la
actualidad.
Así, las comunicaciones presentadas a congresos más destacables han sido:
“Transcription factors and regulatory proteins during fruit ripening and plant
defense mechanisms against pathogens in strawberry (Fragaria × ananassa)”
Molina-Hidalgo FJ, Higuera JJ, Blanco-Portales R, Garrido-Gala J, Martínez-Rivas FJ,
Codesido V, Medina-Puche L, Lekhbou A, Moyano E, Rodríguez-Franco A, Caballero-
Repullo JL, Muñoz-Blanco J.
VII Jornadas de divulgación de la investigación en Biología Molecular, Celular, Genética
y Biotecnología. Córdoba, España. Junio, 2016.
“Wide genomic analysis of NAC proteins involved in the development and ripening
of strawberry (Fragaria vesca)”
Martínez-Rivas FJ, Moyano E, Molina-Hidalgo FJ, Ric-Varas P, Matas AJ, Caballero
Repullo JL, Blanco-Portales R, Muñoz-Blanco J, Rodríguez-Franco A.
5th Plant Genomics & Gene Editing Congress. Ámsterdam, Países Bajos, Marzo 2017.
“The strawberry fruit FaDOF2 transcription factor interacts with FaEOBII in
regulating eugenol production through FaEGS”
Molina-Hidalgo FJ, Medina-Puche L, Martínez-Rivas FJ, Cañete-Gómez CJ, Caballero
Repullo JL, Rodríguez-Franco A, Blanco-Portales R, Moyano E, Muñoz-Blanco J.
5th Plant Genomics & Gene Editing Congress. Ámsterdam, Países Bajos, Marzo 2017.
“Transcription factors during fruit ripening and plant defense against pathogens in
strawberry (Fragaria × ananassa)”
Higuera JJ, Molina-Hidalgo FJ, Garrido-Gala J, Blanco-Portales R, Martínez-Rivas FJ,
Codesido V, Lekhbou A, Jiménez-Pastor FJ, Moyano E, Rodríguez-Franco A, Caballero-
Repullo JL, Muñoz-Blanco J.
VIII Jornadas de divulgación de la investigación en Biología Molecular, Celular,
Genética y Biotecnología. Córdoba, España. Junio, 2018.
“WBGS analysis of m5C-methylation throughout the ripening of Fragaria vesca
fruits”
Martínez-Rivas FJ, Blanco-Portales R, Molina-Hidalgo FJ, Moyano E, Caballero
Repullo JL, Muñoz-Blanco J, Rodríguez-Franco A.
XIV Reunión de Biología Molecular de Plantas (XIV RBMP). Salamanca, España. Junio,
2018.
“The characterization of two basic/helix-loop-helix transcription factors reveals
genes involved in the ripening regulation in strawberry fruit receptacle”
Molina-Hidalgo FJ, Martínez-Rivas FJ, Moyano E, Rodríguez-Franco A, Caballero
Repullo JL, Muñoz-Blanco J, Blanco-Portales R.
XIV Reunión de Biología Molecular de Plantas (XIV RBMP). Salamanca, España. Junio,
2018.

“Methylation status goberns strawberry (Fragaria × ananassa) fruit ripening”
Martínez-Rivas FJ, Blanco-Portales R, Molina-Hidalgo FJ, Moyano E, Caballero
Repullo JL, Muñoz-Blanco J, Rodríguez-Franco A.
XIV Reunión de Biología Molecular de Plantas (XIV RBMP). Salamanca, España. Junio,
2018.
“Genome-wide analysis of the NAC transcription factor family and their expression
during the development and ripening of (Fragaria × ananassa) fruits”
Ric-Varas P, Martínez-Rivas FJ, Blanco-Portales R, Molina-Hidalgo FJ, Matas AJ,
Caballero Repullo JL, Muñoz-Blanco J, Rodríguez-Franco A, Moyano E.
XIV Reunión de Biología Molecular de Plantas (XIV RBMP). Salamanca, España. Junio,
2018.
“El proceso de maduración de la fresa está regulado por patrones de metilación
diferenciales”
Martínez-Rivas FJ, Blanco-Portales R, Molina-Hidalgo FJ, Caballero Repullo JL,
Moyano E, Muñoz-Blanco J, Rodríguez-Franco A.
I Congreso de Jóvenes Investigadores en Ciencias Agroalimentarias. Almería, España.
Diciembre, 2018. Premio a mejor comunicación oral.
“Caracterización funcional de un factor de transcripción de tipo WRKY en el
proceso de maduración del fruto de fresa”
Martínez-Rivas FJ, Molina-Hidalgo FJ, Caballero Repullo JL, Moyano E, Rodríguez-
Franco A, Muñoz-Blanco J, Blanco-Portales R.
VII congreso científico de investigadores en formación de la Universidad de Córdoba.
Córdoba, España. Febrero, 2019.
“The characterization of two basic/helix-loop-helix transcription factors reveals
genes involved in the ripening regulation in strawberry fruit receptacle”
Molina-Hidalgo FJ, Martínez-Rivas FJ, Moyano E, Rodríguez-Franco A, Caballero
Repullo JL, Muñoz-Blanco J, Blanco-Portales R.
XIV Reunión de Biología Molecular de Plantas (XIV RBMP). Salamanca, España. Junio,
2018.
“The transcriptional co-activator FaBOP1 plays an important regulatory role in the
strawberry (Fragaria × ananassa) fruit ripening”
Blanco-Portales R, Martínez-Rivas FJ, Molina-Hidalgo FJ, Moyano E, Caballero
Repullo JL, Muñoz-Blanco J, Blanco-Portales R.
XV Reunión de Biología Molecular de Plantas (XV RBMP). Málaga, España.
Noviembre, 2020.
“The R2-R3 MYB transcription factor FaMYB123 regulates anthocyanin and
flavonol biosynthesis in strawberry fruit”
Martínez-Rivas FJ, Blanco-Portales R, Serratosa M, Ric-Varas P, Medina-Puche L,
Moyano L, Mercado JA, Alseekh S, Caballero Repullo JL, Rodríguez-Franco A, Fernie
AR, Muñoz-Blanco J, Molina-Hidalgo FJ.
XV Reunión de Biología Molecular de Plantas (XV RBMP). Málaga, España.
Noviembre, 2020.

Los artículos de investigación publicados son:
“Genome-wide analysis of the NAC transcription factor family and their expression
during the development and ripening of the Fragaria × ananassa fruits”
Moyano E, Martínez-Rivas FJ, Blanco-Portales R, Molina-Hidalgo FJ, Ric-Varas P,
Matas AJ, Caballero JL, Muñoz Blanco J, Rodríguez Franco A. 2018. Plos One, DOI:
10.1371/journal.pone.0196953.
Impact factor: 2.776
“An atypical HLH transcriptional regulator plays a novel and important role in
strawberry ripened receptacle”
Medina-Puche L*, Martínez-Rivas FJ*, Molina-Hidalgo FJ*, Mercado JA, Moyano E,
Rodríguez Franco A, Caballero JL, Muñoz Blanco J, Blanco-Portales R. 2019. BMC
Plant Biology. DOI: 10.1186/s12870-019-2092-4. *Those authors contribute equally to
this work.
Impact factor: 3.670
“Ectopic expression of the atypical HLH FaPRE1 gene determines changes in cell
size and morphology”
Medina-Puche L, Martínez-Rivas FJ, Molina-Hidalgo FJ, García-Gago JA, Mercado
JA, Caballero JL, Muñoz-Blanco J, Blanco-Portales R. 2021. Plant Science. DOI:
10.1016/j.plantsci.2021.110830.
Impact factor: 3.591
Y los artículos de investigación que se encuentran actualmente en fase de escritura son:
“The R2R3-MYB transcription factor FaMYB123 regulates anthocyanin and
flavonol biosynthesis in strawberry fruit”
Martinez-Rivas FJ, Blanco-Portales R, Serratosa MP, Ric-Varas P, Medina-Puche L,
Moyano L, Mercado JA, Alseekh S, Caballero JL, Rodríguez-Franco A, Fernie AR,
Muñoz-Blanco J, Molina-Hidalgo FJ. 2021.
“Azacitidine treatment provides evidence that DNA methylation governs
strawberry (Fragaria × ananassa) fruit ripening”
Martínez-Rivas FJ, Blanco-Portales R, Molina-Hidalgo FJ, Caballero JL, Perez de
Souza L, Alseekh S, Fernie AR, Muñoz-Blanco J, Rodríguez-Franco A. 2021.
“A novel carboxylesterase is involved in volatile production in strawberry fruit” Martínez-Rivas FJ, Blanco-Portales R, Caballero JL, Alseekh S, Fernie AR, Schawb W,
Muñoz-Blanco J, Molina-Hidalgo FJ. 2021.
“Functional characterization of FaWRKY71, a novel WRKY transcription factor
related with biotic and abiotic resistance”
Martínez Rivas FJ, Molina-Hidalgo FJ, Caballero JL, Muñoz-Blanco J, Blanco-Portales
R. 2021
“Whole bisulfite analysis throughout Fragaria vesca ripening process”
Martínez Rivas FJ, Molina-Hidalgo FJ, Caballero JL, Muñoz-Blanco J, Blanco-Portales
R, Rodríguez Franco A. 2021

Por todo ello, se autoriza la presentación de la Tesis Doctoral
Córdoba, 15 de febrero de 2021
Firma de los directores
Dra. Rosario Blanco Portales Dr. Francisco Javier Molina Hidalgo


A mis padres


Sine agricultura nihil
Sin agricultura nada
Columela
La historia es nuestra
y la hacen los pueblos
Salvador Allende

Una vez terminada esta etapa, quiero agradecer a todas las personas que me han
acompañado en este camino y que me han ayudado a transitarlo con mayor facilidad.
En primer lugar, quiero agradecer a los directores de esta tesis por todo lo que he
aprendido de ellos, tanto a nivel científico como personal. A Charo, por confiar en mi
hace ya unos años para realizar la tesis, y por su dedicación en este trabajo. A Javi, por
su ayuda, su paciencia y por todo lo compartido juntos en el laboratorio, aunque a veces
me lleve la contraria solo por el placer de discutir. También quiero agradecer a Juan por
abrirme las puertas del laboratorio, por guiarme a lo largo de estos años y darme la
oportunidad de formarme como científico.
Al resto del grupo BIO-278 y a todas las personas que han formado parte de él a
lo largo de estos años. A Enri, José Luis y Antonio cuyos consejos y charlas me han
servido tanto. A José Javier, por todos los cafés compartidos y porque siempre ha estado
ahí para ayudarme en cualquier duda, y si no sabía la respuesta, no paraba hasta
encontrarla. A Pepe, Fran Pastor, Ana, Vicky y Ayman, por haber formado una pequeña
familia que siempre ha estado apoyándome y haciendo más divertido el trabajo. También
al grupo de la Universidad de Málaga dirigido por José Ángel Mercado y Fernando Pliego
y a sus componentes, Antonio, Pablo, Gloria… Gran parte del trabajo es gracias a vuestra
ayuda.
A los miembros del Departamento de Bioquímica y Biología Molecular, de los
que siempre he tenido su apoyo en lo que he necesitado, así como a su equipo de dirección
que siempre ha estado dispuesto a ayudar en todo lo necesario. A las secres Inés, Julia,
Susana, Conchi y Zaira, por estar siempre ahí para cualquier duda administrativa y
asegurarse de que todo esté perfecto. Mil gracias. En especial gracias al grupo de Jesús
Jorrín y sus componentes: Rosa, Lola, Mº Ángeles, Bonoso, Anita, Cristina, Patricia,
Mónica, Leti... Tanto por la ayuda en aquello que nos faltaba, o el espacio en los
congeladores, como por acogerme como uno más en tantos y tan buenos momentos
compartidos. A Nieves Abril, por acogerme como alumno interno cuando era alumno de
primerillo y junto a Carmen Pueyo y Juan López Barea, mostrarme el amor a la ciencia.
To meine lieben Freunde von AG Fernie. To Ally Fernie, who had no doubt in
accepting me for not one but two shorts stays, and to Saleh Alseekh for teaching and
supervising me during both stays at MPIMP Golm. To Gini, for each coffee break we
spent together. To all the members of AG Fernie (Laise, David, Leo, Micha, Thomas,
Mustafa…) for treating me as one of you while I was there. Y al gran grupo de españoles
y asociados que lo hicieron todo mucho más fácil: Norma, Sara, Itzell, Dionis, Pablo
Lucio… Danke schön!
A mi familia. A mis padres José Antonio y Clara, a mi hermano, Emilio. Gracias
por darlo siempre todo por mí. Gracias por vuestra confianza y cariño. Vosotros sois el
ejemplo del trabajo y del esfuerzo diario, siempre os habéis dejado la piel para que nunca
me faltase de nada, ni en los peores momentos. Estoy muy orgulloso de los valores que
me habéis enseñado, y si soy quien soy, es gracias a vosotros. A mis tíos, o mis cuñaos,
Dulce y Marcelino. Gracias por cuidarme en los momentos más duros. A mi abuela Dulce,
mi tío Félix y a mis primos, Marce y Melanie, por todos los momentos que hemos pasado
juntos, os quiero. Jamás me olvidaré de mis abuelos Isabel, Emilio y Félix, que nos
dejaron demasiado pronto, y con quienes me hubiera encantado compartir este momento.

Se dice que los amigos son la familia que se elige. Yo tengo la suerte de tener una
segunda familia increíble y cuyo apoyo he sentido durante este duro camino. A mis Anas,
cuya visita no podía faltar en cada viaje a Roquetas. Ana Cristina por tantos años juntos.
Gracias por estar siempre ahí, por todas las visitas que me has hecho, tanto en Córdoba
como en Berlín y por todos los buenos ratos juntos. A Ana Tomé, que siempre tenía un
plan para desconectar, y siempre preocupada por cómo me estaba yendo. Gracias por
todo.
A mis niñas, Bea, Eli y Majo. Sois lo mejor que me ha dejado el paso por la
universidad. Por todos los esfuerzos que hemos hecho por vernos siempre que hemos
podido y por todo vuestro apoyo. Gracias por estar ahí siempre. A la Navarro, por todo
lo que hemos compartido viviendo juntos, por esas risillas en el sofá viendo la tele y esos
momentos duros en los que siempre hemos sabido apoyarnos. A Sandra, que siempre ha
estado ahí para desahogarme. Gracias por esos momentos de “gimnasio” los viernes por
la tarde y por tantos y tantos cafés que han servido de terapia para desconectar, “o
denunciamos a todo el mundo o nos llamamos aporreando la pared, tú decides”. A Casi,
por todo el tiempo compartido en la universidad y fuera de ella, y por todas las veces que
hemos arreglado el mundo en la mesa de un bar; siempre hay una salida, amigo.
Al resto de compañeros que me han acompañado durante estos años. A las niñas
de Biología Celular: Elena, Lucía, Sara y Luzma, así como a Antonio Jesús, por adoptar
a un bioquímico en Biología Celular y por los momentos de comidas y cafés compartidos.
A Carmina, que siempre está dispuesta a ayudar en todo lo que pueda. A mis compañeros
de IU Roquetas que, aunque nos veamos de tanto en cuando siempre me han apoyado:
Juan Pablo, Belén, Sensi… gracias por todo lo que me habéis enseñado. A Marcos, por
esas risas compartidas en este último año pandémico. A Cirenia, por ponerle esta preciosa
portada a este trabajo.
Lo mejor es para el final, como el postre. A Diego, por haber sido mi pilar
fundamental durante todos estos años. Por tu apoyo constante, por creer en mí más que
yo mismo y por no dejarme caer en los momentos más difíciles. Gracias por hacerme ver
que soy capaz de lo que me propongo. Gracias por entenderme en los peores momentos
y por celebrar como tuyas mis victorias. Has caminado junto a mí estos años y lo que he
conseguido es gracias a tí. Y, ¡el siguiente eres tú!
Seguramente me deje a muchas personas que me han acompañado a lo largo de
estos cinco años, así que a la gente que me ha acompañado y ayudado, aunque ellos no lo
sepan, ¡gracias!


TABLE OF CONTENTS
19 PhD Thesis Félix Juan Martínez Rivas
Table of contents SUMMARY ................................................................................................................... 31
RESUMEN .................................................................................................................... 41
SUMMARY GENERAL INTRODUCTION ............................................................. 49
INTRODUCCIÓN ........................................................................................................ 56
1. La planta de fresa: generalidades............................................................................... 56
1.1. Origen, especiación y evolución .......................................................................... 56
2. Citología y análisis filogenético ................................................................................. 59
3. Morfología de la planta de fresa ................................................................................. 61
3.1. Morfología del fruto: aquenios y receptáculo...................................................... 63
4. Composición del fruto de fresa ................................................................................... 63
5. Fisiología del fruto de fresa ........................................................................................ 66
5.1. Cambios macroscópicos ...................................................................................... 66
5.1.1. Crecimiento .................................................................................................. 66
5.1.2. Elongación .................................................................................................... 68
5.1.3. Maduración ................................................................................................... 68
5.2. Cambios microscópicos ....................................................................................... 73
5.2.1. Cambios organolépticos: desarrollo del olor y sabor ................................... 73
5.2.2. Metabolismo de los fenilpropanoides: aparición del color ........................... 79
5.3. Respiración .......................................................................................................... 84
5.4. Choque oxidativo ................................................................................................. 85
6. Control de la floración ................................................................................................ 86
7. Regulación hormonal del desarrollo y maduración del fruto de fresa ........................ 88
7.1. Auxinas ................................................................................................................ 89
7.2. Giberelinas y citoquininas ................................................................................... 90
7.3. Ácido abscísico .................................................................................................... 92
7.4. Etileno .................................................................................................................. 93
7.5. Brasinoesteroides ................................................................................................. 95
8. Control epigenético de la maduración ........................................................................ 95
9. Expresión génica durante el desarrollo y la maduración del fruto de fresa ................ 97
10. Genes implicados en la mejora de fresa ................................................................. 104
10.1. Mejora de la planta de fresa frente a plagas y enfermedades .......................... 104
10.1.1. Resistencia a agentes abióticos ................................................................. 104
10.1.2. Resistencia a agentes bióticos .................................................................. 108
10.2. Mejora de la floración y fructificación de la planta de fresa ........................... 112
20 Functional characterization of molecular regulatory mechanisms controlling the ripening in strawberry fruit
10.3. Mejora de la calidad del fruto de fresa mediante la modificación de sus
propiedades organolépticas....................................................................................... 113
10.3.1. Manipulación del proceso de reblandecimiento ....................................... 113
10.3.2. Mejora de las propiedades organolépticas ................................................ 116
11. Alérgenos de la fresa .............................................................................................. 118
12. Importancia económica del fruto de fresa .............................................................. 119
OBJECTIVES ............................................................................................................. 151
MATERIALES Y MÉTODOS .................................................................................. 155
MATERIALES Y MÉTODOS .................................................................................. 157
1. MATERIALES ......................................................................................................... 157
1.1. Material químico ............................................................................................... 157
1.1.1. Productos químicos .................................................................................... 157
1.1.2. Antibióticos utilizados ................................................................................ 161
1.1.3. Kits de biología molecular .......................................................................... 161
1.2. Material biológico ............................................................................................. 162
1.2.1. Material vegetal .......................................................................................... 162
1.2.2. Estirpes bacterianas .................................................................................... 163
1.2.3. Estirpes de levaduras .................................................................................. 164
1.3. Vectores de clonación ........................................................................................ 164
1.3.1. Vectores de expresión de proteínas ............................................................ 166
1.3.2. Vectores binarios ........................................................................................ 169
2. MÉTODOS ............................................................................................................... 172
2.1. Condiciones de cultivo de las estirpes bacterianas ............................................ 172
2.2. Condiciones de cultivo de las estirpes de levaduras .......................................... 173
2.3. Obtención de células competentes y transformación de bacterias .................... 173
2.3.1. Preparación de células competentes permanentes de E. coli ...................... 173
2.3.2. Transformación de células de E. coli químicamente competentes ............. 174
2.3.3. Preparación de células competentes de A. tumefaciens GV3101 y AGL0 . 175
2.3.4. Transformación de células de A. tumefaciens químicamente competentes 175
2.3.5. Selección de transformantes bacterianos positivos .................................... 175
2.3.6. Identificación de transformantes positivos ................................................. 176
2.4. Obtención de células competentes y transformación de levaduras ................... 177
2.4.1. Obtención de células competentes y transformación de Saccharomyces
cerevisiae .............................................................................................................. 177
2.4.2. Selección por aminoácidos ......................................................................... 177
2.5. Manipulación de moléculas de ADN ................................................................ 177
2.5.1. Amplificación por PCR de fragmentos de ADN ........................................ 177
2.5.2. Purificación de fragmentos de ADN .......................................................... 180

TABLE OF CONTENTS
21 PhD Thesis Félix Juan Martínez Rivas
2.5.3. Concentración de muestras de ADN .......................................................... 180
2.5.4. Digestión de moléculas de ADN con endonucleasas de restricción ........... 181
2.5.5. Ligación de moléculas de ADN.................................................................. 181
2.5.6. Secuenciación ............................................................................................. 182
2.6. Aislamiento de ácidos nucleicos ....................................................................... 183
2.6.1. Extracción de ARN ..................................................................................... 183
2.6.2. Obtención y purificación de ARN .............................................................. 183
2.6.3. Extracción de ADN plasmídico .................................................................. 185
2.6.4. Cuantificación de ácidos nucleicos............................................................. 185
2.7. Separación electroforética de ácidos nucleicos ................................................. 186
2.7.1. Electroforesis de ADN................................................................................ 186
2.7.2. Electroforesis de ARN ................................................................................ 186
2.8. Estudios de expresión génica ............................................................................. 187
2.8.1. Tratamiento del ARN con DNasaI ............................................................. 187
2.8.2. Comprobación de la pureza del ARN total ................................................. 188
2.8.3. RT-PCR cuantitativa en tiempo real ........................................................... 188
2.8.4. Reacción de retrotranscripción ................................................................... 189
2.8.5. Análisis de los datos ................................................................................... 192
2.8.6. Generación y análisis de microarray .......................................................... 192
2.8.7. Estudios de RNA-Seq y análisis de genes diferencialmente expresados. .. 194
2.8.8. Anotación de secuencias ............................................................................. 194
2.9. Generación de plantas transgénicas ................................................................... 195
2.9.1. Introducción a la metodología Gateway ..................................................... 195
2.9.2. Subclonaje de moléculas de ADN en el vector
pCR®8/GW/TOPO®(InvitrogenTM) ...................................................................... 195
2.9.3. Principios básicos de la transformación genética mediada por Agrobacterium
.............................................................................................................................. 197
2.9.4. Transformación estable de plantas de Fragaria × ananassa “Chandler” .. 198
2.10. Transformación transitoria mediante agroinfiltración de frutos Fragaria ×
ananassa “Elsanta” ................................................................................................... 202
2.10.1. Obtención y mantenimiento de plantas de Fragaria × ananassa “Elsanta”
.............................................................................................................................. 202
2.10.2. Transformación transitoria de frutos de Fragaria × ananassa “Elsanta” a
través de agroinfiltración con A. tumefaciens AGL0 ........................................... 202
2.11. Transformación transitoria de hojas de Nicotiana benthamiana a través de
agroinfiltración con A. tumefaciens GV3101 ........................................................... 203
2.12. Interacción mediante doble híbrido en levadura.............................................. 205
2.12.1. Ensayos de auto-activación ...................................................................... 205
2.13. Tratamientos hormonales en frutos y plantas .................................................. 206

22 Functional characterization of molecular regulatory mechanisms controlling the ripening in strawberry fruit
2.13.1. Retirada de aquenios y tratamiento con auxinas ...................................... 206
2.13.2. Tratamiento con NDGA ........................................................................... 206
2.13.3. Tratamiento de estrés hídrico ................................................................... 207
2.13.4. Tratamiento con 5-azacitidina .................................................................. 207
2.13.5. Tratamientos con giberelinas y paclobutrazol .......................................... 208
2.14. Extracción de metabolitos y hormonas del fruto de fresa ............................... 208
2.14.1. Extracción de metabolitos ........................................................................ 208
2.14.2. Extracción de ABA ................................................................................... 210
2.14.3. Extracción y análisis de hormonas ........................................................... 211
2.15. Extracción de proteínas y análisis enzimáticos ............................................... 211
2.15.1. Extracción de proteínas ............................................................................ 211
2.15.2. Análisis enzimático y cinético de la proteína recombinante FaCXE ....... 212
2.16. Análisis estadístico de los datos ...................................................................... 213
CHAPTER 1 ................................................................................................................. 219
An atypical HLH transcriptional regulator plays a novel and important role in strawberry
ripened receptacle ......................................................................................................... 219
Abstract ......................................................................................................................... 221
Introduction .................................................................................................................. 221
Results .......................................................................................................................... 224
FaPRE genes encode atypical HLH proteins ........................................................... 224
FaPRE1 protein is located in nucleus ....................................................................... 227
The spatio-temporal expression of FaPRE genes indicates that FaPRE1 is a ripening-
related gene ............................................................................................................... 228
Hormonal regulation of FaPRE genes transcription ................................................ 229
High-throughput transcriptional analysis of transgenic receptacle where the FaPRE1
transcription was silenced ......................................................................................... 232
Discussion ..................................................................................................................... 235
FaPRE1 and fruit ripening ....................................................................................... 236
Conclusions .................................................................................................................. 241
Methods ........................................................................................................................ 241
Plant material ............................................................................................................ 241
Hormonal treatments ................................................................................................ 241
Quantification of abscisic acid content ..................................................................... 242
Bioinformatic resources ............................................................................................ 242
Generation of RNAi constructs and transfection of strawberry fruits by agroinfiltration
.................................................................................................................................. 243
Subcellular localization analysis .............................................................................. 243
RNA isolation ........................................................................................................... 244
TABLE OF CONTENTS
23 PhD Thesis Félix Juan Martínez Rivas
Microarray generation and analysis .......................................................................... 244
Validation of microarray data and expression analysis by quantitative real-time PCR
.................................................................................................................................. 245
CHAPTER 2 ................................................................................................................. 255
The R2R3-MYB transcription factor FaMYB123 regulates anthocyanin and flavonol
biosynthesis in strawberry fruit .................................................................................... 255
Abstract ......................................................................................................................... 257
Introduction .................................................................................................................. 258
Results .......................................................................................................................... 260
Sequence and phylogenetic analysis of the FaMYB123 .......................................... 261
FaMYB123 protein is located in the nucleus ........................................................... 263
FaMYB123 expression is strongly expressed in receptacles and hormonally regulated
throughout the fruit growth and ripening ................................................................. 264
Expression analysis shows that FaMYB123 is a regulator of the anthocyanin
biosynthesis pathway ................................................................................................ 267
Metabolite analysis of FaMYB123-RNAi transgenic fruits ..................................... 269
FaMYB123 interacts with FabHLH3, a flavonoid related TF.................................. 271
Discussion ..................................................................................................................... 273
FaMYB123, a MYB-like TF is ripening-related and hormonally regulated. ........... 273
FaMYB123 partially regulates anthocyanin and flavonol metabolic pathways. ...... 274
FaMYB123 interacts with FabHLH3 in the nucleus ................................................ 276
Material and methods ................................................................................................... 280
Plant Material and RNA isolation ............................................................................ 280
Hormone treatments ................................................................................................. 280
Analysis of nucleotide and deduced amino acid sequence of FaMYB123 gene ...... 281
Generation of FaMYB123-RNAi construct and silencing of FaMYB123 expression in
strawberry plants ...................................................................................................... 281
Expression analysis by quantitative real-time PCR .................................................. 282
Total anthocyanin analysis ....................................................................................... 283
Metabolite extraction, HPLC analysis and identification ......................................... 283
Cloning the full-length sequence of FaMYB123 and subcellular location of the protein
coded ......................................................................................................................... 284
Yeast-two-hybrid interaction studies ........................................................................ 284
Bimolecular fluorescence complementation assay ................................................... 285
CHAPTER 3 ................................................................................................................. 293
Azacitidine treatment provides evidence that DNA methylation governs strawberry
(Fragaria x ananassa) fruit ripening ............................................................................ 293
Introduction .................................................................................................................. 296
Results .......................................................................................................................... 299
24 Functional characterization of molecular regulatory mechanisms controlling the ripening in strawberry fruit
5-azacytidine delayed strawberry ripening promoting changes in transcriptome .... 299
AZA treatment blocks anthocyanin biosynthesis. .................................................... 299
AZA treatments alter the expression of transcription factors regulating the strawberry
ripening process ........................................................................................................ 300
AZA alters organoleptic related genes ..................................................................... 301
AZA altered key genes involved in the biosynthesis of hormones .......................... 302
Metabolic analysis shows differences between treated and non-treated part ........... 304
Effects of AZA in secondary metabolism ................................................................ 305
AZA treatment alters hormone contents ................................................................... 306
Discussion ..................................................................................................................... 308
A global demethylation mediated by AZA delay strawberry fruit ripening............. 308
Material and methods ................................................................................................... 313
Plant material ............................................................................................................ 313
5-azacytidine treatments ........................................................................................... 314
RNA extraction ......................................................................................................... 314
RNA-Seq and analysis of differentially expressed genes (DEGs) ........................... 314
Metabolites and Hormones determination ................................................................ 315
Primary metabolite determination ........................................................................ 315
Secondary metabolites determination ................................................................... 315
Hormone determination ........................................................................................ 316
CHAPTER 4 ................................................................................................................. 327
A novel carboxylesterase is involved in volatile production in strawberry fruit ......... 327
Introduction .................................................................................................................. 329
Results .......................................................................................................................... 331
Bioinformatics and phylogenetics analysis of the FaCXE2 gene and protein ......... 331
Spatio-temporal expression profile of FaCXE2 gene ............................................... 334
FaCXE2 gene expression is hormonally regulated by auxins and ABA .................. 335
Subcellular location of FaCXE2 protein .................................................................. 337
Enzymic characterization of the FaCXE2 protein expressed in E. coli.................... 338
Catalytic Properties .................................................................................................. 339
Effect of Time, Enzyme Concentration and Substrate Specificity ....................... 339
Influence of pH and Temperature on the Activity of Purified Esterase ............... 340
Km and Vmax ....................................................................................................... 341
Transient silencing of FaCXE2 alters volatile content ............................................. 341
Discussion ................................................................................................................. 344
FaCXE2 is a receptacle specific gene and hormones regulate its expression ...... 345
Subcellular localization ........................................................................................ 346

TABLE OF CONTENTS
25 PhD Thesis Félix Juan Martínez Rivas
Recombinant FaCXE2 .......................................................................................... 346
FaCXE2 has a role on volatile production in strawberry ..................................... 347
Conclusions .............................................................................................................. 347
Materials and methods .............................................................................................. 348
Plant material ........................................................................................................ 348
Hormone related experiments ............................................................................... 348
Preparation of deuterated abscisic acid, ABA extraction procedure and HPLC-MS
conditions ............................................................................................................. 349
RNA isolation ....................................................................................................... 349
Expression analysis by quantitative real time PCR (qRT-PCR) .......................... 349
Generation of RNAi constructs and transfection of strawberry fruit by
agroinfiltration ...................................................................................................... 350
Bioinformatics sequence analysis. ........................................................................ 350
Subcellular location .............................................................................................. 351
Cloning of full-length cDNA of FaCXE2 ............................................................ 352
Expression of recombinant FaCXE2 protein in Escherichia coli ......................... 352
Enzyme Assay ...................................................................................................... 352
Kinetic Studies ...................................................................................................... 353
Volatile extraction and identification ................................................................... 354
CONCLUSIONS ......................................................................................................... 361

26 Functional characterization of molecular regulatory mechanisms controlling the ripening in strawberry fruit

ABREVIATURAS / ABBREVIATIONS
27 PhD Thesis Félix Juan Martínez Rivas
ABREVIATURAS / ABBREVIATIONS
1-NAA ácido 1-naftalenacético / 1-naphthaleneacetic acid
4CL p-cumarato:CoA ligasa / p-coumarate:CoA ligase Fa4CL
Aa aminoácido / amino acid
AAT alcohol acil transferasa / alcohol acyltransferase
FaAAT1;
FaAAT2;
FaSAAT
ABA ácido abscísico / abscisic acid
ABP1 proteína de unión a auxinas 1 / auxin-binding protein 1 FaABP1
ACC 1-aminociclopropano-1-carboxilato sintasa / 1-aminocyclopropane-1-carboxylate
synthase
ACO ACC oxidasa / ACC oxidase FaACO1
ADH alcohol deshidrogenasa / alcohol dehydrogenase
ADN/DNA ácido desoxirribonucleico / deoxyribonucleic acid
ADNasa / DNAsa desoxirribonucleasa / deoxyribonuclease
ADNc/ cDNA ácido dexorribonucleico copia / deoxyribonucleic acid copy
ADNcp/ cpDNA ácido desoxirribonucleico del cloroplasto / chloroplast deoxyribonucleic acid
ADNcs/ ssDNA ácido desoxirribonucleico de cadena simple / single strand deoxyribonucleic acid
ADNdc/ dsDNA ácido desoxirribonucleico de doble cadena / double strand deoxyribonucleic acid
AG AGAMOUS FaAG1
AGPasa ADP-glucosa pirofosforilasa / ADP-glucose pyrophosphorylase
ANR antocianidin reductasa / anthocyanidin reductase FaANR
ANS/ LDOX antocianidin sintasa; leucoantocianidin dioxigenasa / anthocyanidin synthase;
leucoantocianidin dioxygenase FaANS
ARN ácido ribonucleico / ribonucleic acid
ARNasa/ RNAsa ribonucleasa / ribonuclease
ARNi/ RNAi ácido ribonucleico interferente / interfering ribonucleic acid
ARNm/ RNAm ácido ribonucleico mensajero / messenger ribonucleic acid
ARNr/ RNAr ácido ribonucleico ribosómico / ribosomal ribonucleic acid
AZA 5 azacitidina / 5 azacytidine
BA N6-benciladenina / N6-benzyladenine
bHLH basic helix-loop-helix
BL brasinólido / brassinolide
BRs brasinoesteroides / brassinosteroids
C4H ácido cinámico 4-hidroxilasa / cinnamic acid 4-hydroxylase FaC4H
CAD cinamil alcohol deshidrogenasa / cinnamyl alcohol dehydrogenase Facad;
FaCAD1
CBF1 factor de unión CRT/DRE / CRT/DRE binding factor 1 FaCBF1
CCR cinamoil CoA-reductasa / cinnamoyl CoA reductase Faccr; FaCCR
CDPK proteína quinasa calcio-dependiente / calcium-dependent protein kinase FaCDPK1
Cel celulasa / cellulase FaCel1
CHI chalcona isomerasa / chalcone isomerase FaCHI
CHR chalcona reductasa / chalcone reductase FaCHR
CHS chalcona sintasa / chalcone synthase FaCHS
(table continues on following page)

ABREVIATURAS / ABBREVIATIONS
28 Functional characterization of molecular regulatory mechanisms controlling the ripening in strawberry fruit
ABREVIATURAS / ABBREVIATIONS
CoA coenzima A / coenzyme A
COV/ VOC compuestos orgánicos volátiles / volatile organic compounds
CS catasterona / catasterone
Ct ciclo umbral / threshold cycle
cv. cultivar
Da Dalton
DEPC dietil pirocarbonato / diethyl pyrocarbonate
DFR dihidroflavonol reductasa / dihydroflavonol reductase FaDFR
D-Glu-6-P D-glucosa-6-fosfato / D-glucose-6-phosphate
DMMF 2,5-dietil-4-metoxy-3(2H)-furanona / 2,5-diethyl-4-metoxy-3 (2H)-furanone
DMSO dimetil sulfóxido / dimethyl sulfoxide
dNTPs desoxirribonucleótidos / deoxyribonucleotides
DO densidad óptica / absorbance
DTT ditiotreitol / dithiothreitol
EBGs genes tempranos reguladores de la biosíntesis del metabolismo de
flavonoides/fenilpropanoides / early regulated biosynthesis genes
EG endoglucanasa / endoglucanase FaEG
ERF elementos de respuesta al etileno / ethylene response elements
ESTs secuencia de ADNc expresada / expressed sequence tag
EXP expansina / expansin FaExp
F3H flavonoide 3-hidroxilasa / flavonoid 3-hydroxylase FaF3H
FAO Organización de las Naciones Unidas para la Alimentación y la Agricultura / Food
and Agriculture Organization of the United Nations
Fcor Fragaria regulada por frío / Fragaria cold-regulated Fcor1, Fcor2
Fig. figura / figure
FISH hibridación in situ fluorescente / fluorescence in situ hybridization
FK fructoquinasa / fructokinase
FLS flavonol sintasa / flavonol synthase
FT/TF factor de transcripción / transcription factor
GalUA ácido galacturónico / galacturonic acid
Gas giberelinas /gibberellins
GAST Transcrito estimulado por GA / GA-stimulated transcript FaGAST1;
FaGAST2
GC-MS cromatografía de gases-espectrometría de masas / gas chromatography-mass
spectrometry
GFP proteína verde fluorescente / green fluorescent protein
GST glutatión S-transferasa / glutathione S-transferase
HDMF 4-hydroxy-2,5-dimetil-3(2H)-furanona / 4-hydroxy-2,5-dimethyl-3 (2H)-furanone
(furaneol)
HGA homogalacturonanos / homogalacturonan
HK hexoquinasa / hexokinase
HPLC-MS cromatografía líquida de alto rendimiento-espectrometría de masas / high
performance liquid chromatography-mass spectrometry
HSP proteínas de choque térmico / heat shock protein HSP
(table continues on following page)

ABREVIATURAS / ABBREVIATIONS
29 PhD Thesis Félix Juan Martínez Rivas
ABREVIATURAS / ABBREVIATIONS
HyPRP híbrido proteína rica en prolina / hybrid proline-rich protein FaHyPRP
IAA ácido 3-indol acético / 3-indole acetic acid
IgE Inmunoglobulina E / immunoglobulin E
IPTG isopropil-β-D-galactósido / isopropyl-β-D-galactoside
ITS espaciadores de transcripción interna / internal transcribed spacer
Kb kilobase
LAGs genes tardíos reguladores de la biosíntesis del metabolismo de
flavonoides/fenilpropanoides / late-regulated biosynthesis genes
LB medio de cultivo Luria-Bertani / culture medium Luria-Bertani
LC-MS cromatografía líquida-espectrometría de masas / liquid chromatography–mass
spectrometry
LTP proteína de transferencia de lípidos / lipid transfer protein Faltp; FaLTP
MMA Sales de Murashige y Skoog, morfolina ácido etanosulfónico y acetosiryngona /
Murashige and Skoog salts, morpholine ethanesulfonic acid and acetosiryngone
MS medio de cultivo Murashige y Skoog / culture medium Murashige and Skoog
NADPH nicotinamida adenina dinucleótido fosfato reducida / reduced nicotinamide
adenine dinucleotide phosphate
MSTFA N-Methyl-N-(trimethylsilyl)trifluoroacetamide
NCBI Centro Nacional de Información sobre Biotecnología / National Center for
Biotechnology Information
NCED 9-cis-epoxicarotenoide dioxigenasa / 9-cis-dioxygenase epoxicarotenoide FaNCED1
NDGA ácido nordihidroguaiarético / nordihydroguaiaretic acid
NES1 nerolidol sintasa 1 / nerolidol synthase 1 FaNES1
NPR non expressor of pathogenesis related
nptII neomicina fosfotransferasa II / neomycin phosphotransferase II
OGA derivados pectínicos oligogalacturónidos / derivatives pectinic oligogalacturonides
OLP proteina de tipo osmotina / osmotin like protein OLP2
OMT O-metil transferasa / O-methyl transferase FaOMT
ORF marco abierto de lectura / open reading frame
PA; Pas proantocianidinas / proanthocyanidins
PAC paclobutrazol
PAL fenilalanina amonio-liasa / phenylalanine ammonia lyase FaPAL
pb/bp pares de bases / base pairs
PcF péptido fitotóxico extracelular / extracellular phytotoxic peptide
PCR reacción en cadena de la polimerasa / chain reaction polymerase
PDC piruvato descarboxilasa / pyruvate decarboxylase FaPDC1
PE pectín metilesterasa / pectin methylesterase FaPE1-FaPE4
PG poligalacturonasa / polygalacturonase FaPG
PGIP polygalacturonase-inhibiting protein / polygalacturonase-inhibiting protein PGIP
PINS sintasa pineno / pinene synthase FvPINS
PIP proteínas intrínsecas de la membrana plasmática / plasma membrane intrinsic
proteins
FaPIP1;1,
FaPIP2;1
PL pectato liasa / pectate lyase FaPL
PRs genes relacionados con la patogénesis / pathogenesis-related genes FaPR
(table continues on following page)

ABREVIATURAS / ABBREVIATIONS
30 Functional characterization of molecular regulatory mechanisms controlling the ripening in strawberry fruit
ABREVIATURAS / ABBREVIATIONS
PMSR metionina sulfóxido reductasa / methionine sulfoxide reductase Fapmsr;
FaPMSR
PRE resistente a paclobutrazol / paclobutrazol resistant FaPRE1
PRX peroxidasa / peroxidase FaPRX27
QR quinona reductasa / quinone reductase FaQR
qRTPCR PCR cuantitativa en tiempo real / quantitative real time PCR
QTL locus de un carácter cuantitativo / quantitative trait locus
RG-I ramnogalacturonanos I / rhamnogalacturonan I
RG-II ramnogalacturonanos II / rhamnogalacturonan II
RGlyase ramnogalacturonato liasa / rhamnogalacturonate lyase FaRGlyase1
ROS especies reactivas de oxígeno / reactive oxygen species
Rpm revoluciones por minuto / revolutions per minute
RT reacción de retrotranscripción / reverse transcription reaction
S6PDH sorbitol deshidrogenasa-6-fosfato / sorbitol-6-phosphate dehydrogenase FaS6PDH
SCAI Servicio Central de Apoyo a la Investigación / Central Service for Research
Support
SDH sorbitol deshidrogenasa NAD-dependiente / sorbitol dehydrogenase NAD-
dependent FaSDH
SDS duodecil sulfato sódico / sodium dodecyl sulfate
sp. especie / species
spp. subespecie / subspecies
SPS sacarosa fosfato sintasa / sucrose phosphate synthase
SS sacarosa sintasa / sucrose synthase
TBE tampón Tris-bórico-EDTA-Na2 / Tris-borate-EDTA-Na2
T-DNA ADN transferido / transfer DNA
TE tampón Tris-EDTA-Na2 / Tris-EDTA-Na2
Tm temperatura de fusión / melting temperature
UFGT UDP-glucosa:flavonoide-3-O-glucosiltransferasa / UDP-glucose:flavonoid-3-O-
glucosyltransferase FaUFGT
UV radiación ultravioleta / ultraviolet radiation
Wt planta silvestre / wild type
X-gal 5-bromo-4-cloro-3-indolil β-galactósido / 5-bromo-4-chloro-3-indolyl β-
galactoside
Xyl xilosidasa / xylosidase FaXyl

SUMMARY
31 PhD Thesis Félix Juan Martínez Rivas
SUMMARY

SUMMARY
32 Functional characterization of molecular regulatory mechanisms controlling the ripening in strawberry fruit

SUMMARY
33 PhD Thesis Félix Juan Martínez Rivas
SUMMARY
“Functional characterization of molecular regulatory mechanisms controlling the
ripening in strawberry fruit”
Along the development of this thesis, I have studied the different molecular
mechanisms that regulate the ripening process in strawberry (Fragaria × ananassa) fruit.
Transcriptomic analysis performed in our research group allowed us to identify several
transcription factors (TFs) and regulatory proteins up-regulated along the ripening
process. Moreover, those genes identified present a clear hormonal regulation suggesting
that they are involved in the regulation of physiological pathways that contribute to
modulate the final organoleptic properties of the fruit.
Among those genes, highlights FaPRE1, a ripening related gene that encode an
atypical HLH protein with high sequence homology with PACLOBUTRAZOL
RESISTANCE (PRE) genes. bHLH TFs contain two clearly differentiated domains, a
basic domain located at the amino terminus of the proteins, which contains 13-17 basic
amino acids, and a HLH region, located at the carboxy terminus, that comprises two
amphipathic α-helices which are rich in hydrophobic amino acids and are connected by a
loop of variable length. Meanwhile, HLH proteins lack sequences needed for DNA
binding and, in consequence, they did not present DNA-binding ability. PRE genes are
atypical bHLH proteins characterized by the lack of their DNA-binding domain, thus they
need to interact with other proteins to modulate the expression of other genes.
In our work, we identified three PRE genes in strawberry genome that present
more than 90% of homology in the aminoacidic sequence. Their transcriptional profile
reveals that, while FaPRE2 and 3 have their expression restricted to the vegetative tissues,
FaPRE1 is induced along the ripening process, presenting null expression in vegetative
tissues. Moreover, FaPRE1 expression is positively regulated by ABA and negatively by
auxins, while gibberellins have no role in its expression. FaPRE1 present ABA
responsive sequences in its promoter, but no gibberellin sequences are found. This might
explain the hormonal transcriptional response of this gene. FaPRE1 expression was
transiently down-regulated injecting Agrobacterium cells harboring RNAi construction
into fruit receptacles. Those receptacles that presented higher silencing degree were

SUMMARY
34 Functional characterization of molecular regulatory mechanisms controlling the ripening in strawberry fruit
selected for further transcriptomic studies. The silenced fruits did not present any
phenotypic changes, but microarray analysis showed 227 genes down-regulated and 276
up-regulated comparing with control. Among the down-regulated genes, 70% were
ripening related while, in the up-regulated genes, 76% were overexpressed in immature
receptacles. Those transcriptomic analysis support an important role of FaPRE1which
antagonistically coordinated the transcription of genes related to both receptacle growth
and ripening. Thus FaPRE1, in ripened receptacle, represses the transcription of
receptacle growth promoting genes while activating the transcription of those genes
related to the receptacle ripening process.
Transcription factors are essential for gene expression regulation in plants. Thus,
the next gene selected to be studied in our work was FaMYB123, a R2R3 MYB TF. These
TFs are recognisable by their two imperfect MYB repeats that follow the R2 and R3
structure of the c-MYB proteins. To play its regulatory role, MYB TFs interact with other
TFs and proteins involved in the transcription process by forming an MBW complex that
regulate many metabolic and developmental pathways.
In our group, we have previously identified and characterised other MYB TF
related with the control of key pathways in the ripening process, such as FaMYB10, a
master regulator of the phenylpropanoid/anthocyanin pathway, and FaEOBII, regulator
of eugenol production. In this work, we report that FaMYB123 is a MYB R2R3 that
present the imperfect R2R3 domain in its sequence and is localized in the nucleus. The
spatio-temporal expression pattern of FaMYB123 reveal that it is ripening related and
present low expression in vegetative tissues and achenes. Moreover, its expression is
induced by ABA and repressed by auxins. These combined expression results indicate
that FaMYB123 mainly regulates specific ripening-related physiological processes in the
fruit receptacle.
To further investigate the physiological role played by FaMYB123, we generated
stable transgenics plants with the expression of FaMYB123 knocked down by RNAi.
Lines that present a higher degree of silencing were selected for further analysis (≥ 95%).
Thus, expression analysis revealed a clear reduction of genes involved in anthocyanin
biosynthesis. Those results were validated with metabolomic analysis that I performed in
collaboration with the Alisdair Fernie lab in two shorts stays at the Max Planck Institute

SUMMARY
35 PhD Thesis Félix Juan Martínez Rivas
of Molecular Plant Physiology (Potsdam, Germany). The metabolomic results revealed a
disbalance between anthocyanins and proantocyanins. While transgenics accumulated
lower amounts of anthocyanins, as pelargonidin-3-glucose and its malonyl derivate, a
higher accumulation of proantocyanins were found in the transgenics receptacle, which
are usually present at minor levels in ripe receptacles. Protein interaction studies revealed
that FaMYB123 is able to bind to FabHLH3, a TF previously related to regulate
proanthocyanin biosynthesis through the interaction with FaMYB9. This suggest that the
complex FabHLH3-MYB9/123 could modulate the synthesis of pro- and anthocyanin.
Molecular and physiological studies showed that this TF could be involved in the
regulation of structural genes of the anthocyanins or flavonols that accumulate in ripen
fruit receptacles.
Other regulatory mechanism of the gene expression is DNA methylation. Those
epigenetics marks are usually tied to the silencing of genes, but lately there has been
described that DNA methylation might be required for activating gene expression or to
bind TFs at the promoter. Epigenetics marks are related to control ripening in different
fruits, but is mainly described in tomato. DNA methylation patterns change dramatically
after the application of either hyper- or hypo-methylating drugs. 5-Azacytidine (AZA) is
a chemical able to induce a general and nonspecific DNA hypomethylation. It is added to
DNA, acting as a cytosine analogue, and those bases are covalently bond to DNA
methyltransferases which would be degraded thus losing methylation marks after rounds
of DNA replication.
The application of AZA to halves of fruits results in an early ripening phenotype.
However, when injected to strawberries white fruits, a complete stop of the ripening
appears. RNA-seq studies determined that many TFs involved in the control of the
ripening process are not induced in the treated. Many transcripts associated to hormone
biosynthesis, aroma, flavor and texture were either reduced or not detected in the AZA
treated parts. In the non-climateric strawberry fruit, the ripening is not controlled by
ethylene but by the relation between ABA and auxins. After AZA treatment, key and
critical genes pertaining to the ABA biosynthetic pathway were downregulated while, at
the same time, those involved in its withdrawal are activated. Also, genes related with
auxins and gibberellin biosynthesis are induced under AZA treatment. Moreover,
metabolomic profile of AZA treated samples were similar to the white stages of ripening

SUMMARY
36 Functional characterization of molecular regulatory mechanisms controlling the ripening in strawberry fruit
rather to mature fruits. Null concentration of anthocyanin was found in treated parts while
the hormonal profile was similar to the early stages of development. Lower concentration
of bioactive ABA and higher amounts of the degradation products were found. Also,
higher concentration of auxins and gibberellins were present in the treated part,
suggesting a disbalance in hormonal content. AZA treatment leaded to a completely stop
of the ripening process due to the alterations on the hormonal content that are able to alter
the transcriptomic and metabolomic profiles. This work provides the basis revealing that
methylation marks are needed for ripening in strawberry, but further works should be
performed to fully understand this regulation.
The last gene selected was a carboxylesterase enzyme, FaCXE2.
Carboxylesterases (CXE) are hydrolytic enzymes that belong to the α/β hydrolase fold
superfamily of proteins. CXEs present a conserved catalytic triad, contained in the
conserved sequence GXSXG, formed by the acidic amino acid serine and a histidine, and
that constitutes the active site of these enzymes. In addition, these enzymes are related to
play several roles in xenobiotic degradation, biotic stress responses as well as the volatile
production.
Ripening in strawberry fruit is a complex process which carries out several
changes in flavor, color taste and softening. In most fruits, as is the case with strawberry,
the emission of volatiles begins and increase during ripening process. Only a few enzymes
related with those process have been described in strawberry. Two alcohol
acetyltransferases (FaAAT1 and FaAAT2) are related with volatile production but no
CXE has been previously characterized in strawberry, leaving unknown the functional
activities of those enzymes in this fruit. High-throughput transcriptomic analyses allowed
us to identify to FaCXE2, whose expression was ripening related, restricted to fruit
tissues, as present high expression on receptacle and achenes, and hormonally regulated
antagonistically by auxins and ABA. The subcellular localization studies revealed that
this protein is located in the cytoplasm, similar to other volatile related enzymes as alcohol
acyltransferases and other CXE. The recombinant protein was obtained its enzymatic
properties were characterized. The optimal pH for its activity was 7.5 and its optimal
temperature between 25-30ºC. FaCXE2 showed most affinity towards the longer chain
esters.

SUMMARY
37 PhD Thesis Félix Juan Martínez Rivas
In addition, the FaCXE2 expression was transiently silenced in ripe strawberry
receptacles by RNAi. Those receptacles with a higher silencing degree were selected for
further volatile determination. Metabolomic studies revealed clear differences on ester
content between transgenics and control fruit. Downregulation of FaCXE2 resulted in a
higher accumulation of different esters, while alcohol compounds were in lower
concentration. Moreover, the in vitro activity of FaCXE2 in hydrolyzing esters, together
with the increase of esters in vivo caused by the knock down of FaCXE2, indicates that
this CXE is a regulator of volatile ester content in strawberry.


RESUMEN
39 PhD Thesis Félix Juan Martínez Rivas
RESUMEN

RESUMEN
40 Functional characterization of molecular regulatory mechanisms controlling the ripening in strawberry fruit

RESUMEN
41 PhD Thesis Félix Juan Martínez Rivas
RESUMEN
“Caracterización funcional de mecanismos reguladores de la maduración del fruto
de fresa (Fragaria × ananassa)”
Durante el desarrollo de esta tesis doctoral, se han estudiado algunos procesos que
regulan el proceso de maduración del fruto de fresa (Fragaria × ananassa). Análisis
transcriptómicos masivos realizados previamente en nuestro grupo de investigación
permitieron la identificación de varios factores de transcripción (FTs) y proteínas
reguladoras inducidas durante la maduración del fruto de fresa. Se comprobó que la
expresión de estos genes estaba regulada por hormonas, sugiriendo así, que pueden
controlar diferentes procesos fisiológicos responsables de las características
organolépticas del fruto maduro. Dentro de esos genes, se seleccionó a FaPRE1 que
codifica una proteína HLH atípica con alta homología de secuencia con genes de tipo
PACLOBUTRAZOL RESISTANCE (PRE). Los FTs de tipo bHLH contienen dos
dominios claramente diferenciados, uno básico localizado en el extremo amino de la
proteína, que contiene entre 13 a 17 aminoácidos básicos, y una región HLH, localizada
en el extremo carboxilo que contiene dos regiones α-hélice anfipáticas ricas en
aminoácidos hidrofóbicos. Las proteínas de tipo HLH carecen de las secuencias
necesarias para la unión al ADN y, en consecuencia, no presentan esta habilidad. Así, los
genes de tipo PRE codifican proteínas de la familia bHLH caracterizadas por la ausencia
del dominio de unión al ADN y que, por lo tanto, necesitan de otras proteínas para
modular la expresión de otros genes.
En este trabajo, se identificaron tres genes de tipo PRE en el genoma de fresa con
más de un 90% de homología entre sus secuencias aminoacídicas. Sus perfiles
transcriptómicos indicaron que, mientras FaPRE2 y 3, se expresaban exclusivamente en
tejidos vegetativos, FaPRE1 se inducía a lo largo de la maduración del fruto presentando
una expresión muy baja en el resto de los tejidos analizados. Además, su expresión fue
inducida por ABA, reprimida por auxinas (ambas hormonas relacionadas con el control
de la maduración del fruto), y no se afectó por giberelinas. Este hecho se puede explicar

RESUMEN
42 Functional characterization of molecular regulatory mechanisms controlling the ripening in strawberry fruit
debido a la presencia de secuencias cis de respuesta a ABA y la ausencia de éstas para
giberelinas en el promotor de FaPRE1.
Cuando la expresión de FaPRE1 fue transitoriamente silenciada mediante la
infiltración de Agrobacterium portando la construcción ARNi de este gen, no se
observaron cambios fenotípicos que afectaran al proceso de maduración del fruto. No
obstante, el estudio transcriptómico comparativo de frutos control y frutos transgénicos
FaPRE1-ARNi reveló que 227 y 276 genes fueron silenciados y sobreexpresados
respectivamente en estas condiciones experimentales. Del conjunto de genes silenciados,
el 70% presentó un perfil de expresión relacionado con el proceso de maduración mientras
que el 76% de los sobreexpresados mostraron un incremento de expresión en el estadio
verde frente al rojo. Estos resultados indican que FaPRE1 regula antagónicamente la
expresión de genes relacionados con el desarrollo o la maduración del fruto rojo. Es decir,
en el receptáculo maduro, FaPRE1 reprime la expresión de genes relacionados con el
desarrollo mientras que activa la expresión de otros relacionados con la maduración.
Los FTs son esenciales para la modulación de la expresión génica por ello, el FT
de tipo R2R3 FaMYB123 fue también seleccionado para su estudio en mayor
profundidad. Este tipo de FTs se caracterizan por incluir dos repeticiones imperfectas de
tipo MYB seguidas de la estructura R2-R3 de las proteínas c-MYB. Para llevar a cabo su
función reguladora, interaccionan con otras proteínas formando complejos MBW que
regulan múltiples rutas metabólicas y de desarrollo. Además, FaMYB123 se localiza en
el núcleo celular.
La expresión espacio temporal de FaMYB123 indica que está asociado al proceso
de maduración de la fresa y que su expresión es prácticamente específica de fruto, ya que
presenta niveles de expresión muy bajos en aquenios y en otros tejidos vegetativos de la
planta. Además, su expresión se induce por ABA y se reprime por auxinas, lo que sugiere
que FaMYB123 debe regular procesos relacionados con la maduración del fruto. Para
comprender el papel regulador de este FT en fresa, se generaron plantas transgénicas
estables con la expresión de FaMYB123 silenciada (FaMYB123-ARNi). Aquellas líneas
que presentaron los niveles de silenciamiento más altos (≥ 95%) fueron seleccionadas
para realizar estudios metabolómicos y de expresión génica. Así, el análisis de expresión
comparativo entre las líneas transgénicas FaMYB123-ARNi y las líneas control mostró

RESUMEN
43 PhD Thesis Félix Juan Martínez Rivas
un claro silenciamiento de genes relacionados con la síntesis de antocianinas y
flavonoides. Estos compuestos son sintetizados a lo largo de la maduración del fruto de
fresa y son determinantes para la adquisición de las sus propiedades organolépticas
características. Los resultados transcriptómicos obtenidos fueron validados
posteriormente mediante el análisis metabolómico de las mismas muestras en
colaboración con el grupo del Dr. Alisdair Fernie durante dos estancias predoctorales
realizadas en el Max Planck Institute For Molecular Plant Physiology (Potsdam,
Alemania).
En este sentido, los análisis metabolómicos realizados revelaron un desajuste en
la concentración entre antocianinas y proantocianidinas. Así, mientras que los
receptáculos de frutos transgénicos presentaban menor cantidad de antocianinas del tipo
pelargonidina-3-glucósido y su derivado malonilo, sí acumulaban una mayor
concentración de proantocianidinas, compuestos presentes predominantemente en frutos
verdes de fresa y relacionados con sus etapas de desarrollo. Estudios de interacción de
proteínas realizados demostraron que FaMYB123 interaccionaba con FabHLH3, un FT
identificado como regulador de la síntesis de proantocianidinas mediante su unión con
FaMYB9. Estos datos sugieren la posible regulación de la síntesis de antocianinas y
proantocianidinas a través de la formación de un complejo FabHLH3-MYB9/123.
Estudios moleculares y fisiológicos posteriores parecen indicar que FaMYB123 controla
la expresión de genes relacionados con la síntesis de antocianinas y flavonoles,
compuestos que normalmente se acumulan en receptáculos maduros.
La metilación del ADN es un mecanismo muy común de regulación de la
expresión génica en plantas. Estas marcas epigenéticas han sido relacionadas con el
silenciamiento de la expresión de aquellos genes que las poseen. No obstante, se ha
descrito recientemente que la metilación también puede inducir la transcripción de ciertos
genes y/o puede ser necesaria para el anclaje correcto de ciertos factores de transcripción
a los promotores cuya expresión deben activar. Se sabe que el patrón de metilación del
ADN puede ser alterado mediante la aplicación de compuestos químicos que hiper- o
hipometilan dicha molécula. Entre esos compuestos, uno de los más usados es la 5-
azacitidina (AZA) que, al ser un análogo de la citosina, puede incorporarse al ADN para
pasar a formar parte de su estructura. Allí, se une covalentemente a las ADN

RESUMEN
44 Functional characterization of molecular regulatory mechanisms controlling the ripening in strawberry fruit
metiltransferasas que son degradadas debido a esta unión. De esta manera, las marcas
epigenéticas son eliminadas después de varias replicaciones del ADN.
Aunque el control epigenético de la maduración del fruto ha sido
mayoritariamente estudiado en tomate, se ha comprobado que la aplicación de AZA a
diferentes frutos produjo un adelanto de su maduración en todos los casos. Sin embargo,
su aplicación a mitades de frutos blancos de fresa produjo la respuesta contraria y la
paralización del proceso de maduración del fruto en dicha zona. El análisis
transcriptómico de la zona tratada y la zona control mediante secuenciación del ARN
revelaron la ausencia de inducción de FTs relacionados con el control de procesos típicos
de la maduración en las zonas tratadas. De igual manera, la transcripción de varios genes
asociados a la síntesis de hormonas, aroma, color y textura del fruto estaba reprimida o
no se produjo en la zona del fruto tratada con AZA.
Los frutos no climatéricos como la fresa no regulan su maduración por etileno. En
este caso, es el balance entre auxinas y ABA el que determina esta regulación. Así,
después del tratamiento con AZA, los genes relacionados con la biosíntesis de ABA
fueron silenciados mientras que los implicados en su degradación aumentaron su
expresión. De igual manera, genes implicados en la biosíntesis de auxinas y de giberelinas
también fueron sobrexpresados en la zona del fruto tratada con AZA. Además, se
comprobó que el perfil metabólico de estos mismos frutos fue más parecido al de frutos
en estadio blanco de maduración, con concentraciones de antocianinas prácticamente
nulas y niveles hormonales similares a los de estadios del fruto en fase de desarrollo. Así,
en la zona del fruto tratada con AZA, se detectó una menor concentración de ABA
bioactiva y un incremento de sus productos de degradación. De la misma manera, la
concentración de auxinas y giberelinas fue mayor en la zona del fruto tratada con AZA
que en la zona control, lo que indica un desajuste del contenido hormonal en este tejido.
En consecuencia, el tratamiento con AZA produjo una paralización completa del proceso
de maduración del fruto de fresa debido a una alteración en su contenido hormonal que
se tradujo en una alteración de la expresión génica y del contenido metabólico del fruto.
Este trabajo establece que las marcas epigenéticas son necesarias para el proceso de
maduración del fruto de fresa y, por lo tanto, es un punto de partida para el desarrollo de
nuevos trabajos que profundicen en esta regulación.

RESUMEN
45 PhD Thesis Félix Juan Martínez Rivas
Finalmente, el gen FaCXE2, que codifica una enzima de tipo carboxilesterasa
(CXE), fue seleccionado para su estudio en mayor profundidad. Las carboxilesterasas son
enzimas hidrolíticas que pertenecen a la superfamilia α/β hidrolasas y presentan una triada
catalítica en una región conservada GXSXG de la secuencia proteica que constituye el
sitio activo de la enzima. Estas enzimas participan en la degradación de xenobióticos,
respuesta a estrés biótico, así como en la producción de compuestos volátiles. Durante la
maduración de la fresa, se ha determinado que se produce un incremento de la emisión
de compuestos volátiles aunque tan sólo dos alcohol-acil-transferasas (AATs) han sido
descritas en relación con su síntesis. Ninguna CXE relacionada con este proceso ha sido
caracterizada en fresa hasta ahora, lo que deja abierta su posible participación en dicha
biosíntesis durante la maduración del fruto.
Los estudios transcriptómicos realizados previamente en nuestro grupo de
investigación nos permitieron comprobar que FaCXE2 estaba relacionado con el proceso
de maduración y que su expresión se restringía específicamente a fruto. Además, se
comprobó que su expresión estaba regulada positivamente por ABA y negativamente por
auxinas. Mediante estudios de localización subcelular, se comprobó que la enzima
FaCXE2 se encuentra en el citoplasma, al igual que otras enzimas relacionadas con la
producción de volátiles. En este sentido y para comprobar su función, se determinó la
actividad enzimática de la proteína FaCXE2 recombinante lo que nos permitió comprobar
que esta enzima muestra mayor afinidad como sustrato por ésteres de cadena más larga.
En paralelo, se procedió al silenciamiento transitorio de la expresión de FaCXE2
mediante agroinfiltración de frutos de fresa con Agrobacterium conteniendo la
construcción FaCXE2-RNAi. Los frutos con mayor nivel de silenciamiento fueron
seleccionados para determinar su concentración de volátiles. Este análisis nos permitió
observar una disminución de la concentración de ésteres y un incremento de la de
alcoholes en los frutos transgénicos frente a frutos control. Por tanto, el resultado de la
actividad in vitro de FaCXE2 junto con la acumulación de ésteres en los frutos
transgénicos sugieren que esta enzima juega un papel determinante en la concentración
de ésteres durante la maduración del fruto de fresa.


SUMMARY GENERAL INTRODUCTION
47 PhD Thesis Félix Juan Martínez Rivas
SUMMARY GENERAL INTRODUCTION

SUMMARY GENERAL INTRODUCTION
48 Functional characterization of molecular regulatory mechanisms controlling the ripening in strawberry fruit

SUMMARY GENERAL INTRODUCTION
49 PhD Thesis Félix Juan Martínez Rivas
SUMMARY GENERAL INTRODUCTION
The strawberry (Fragaria × ananassa) belongs to the Rosaceae family in the
genus Fragaria. This soft fruit is cultivated in different regions of the world and is part
of the diet of millions of people. Spain is the first producer of strawberries in Europe and
the fifth in the world (FAO, 2018). Moreover, between the 80-90% of the production is
located in Huelva, southwest of Spain. The cultivated strawberry Fragaria × ananassa is
an octoploid cultivar that results of the crossing between four different diploids species,
F. viridis, F. nipponica, F. iinumae and F. vesca. The evolutionary studies reveal that F.
vesca was the last genome to join and that event took place in North America (Edger et
al., 2019). The genome of F. vesca is responsible of the majority of transcript in the
octoploid cultivar. Thus, this genome is used in the transcriptome analysis as its genome
has been sequenced (Edger et al., 2017, v4.0).
Physiologically, strawberry is an herbaceous perennial plant which present a
central stem (crown) from roots, leaves and stolons emerge (Hancock, 1999). The
interaction between temperature and photoperiod determines strawberry development,
being able to reproduce sexually through fruits, or asexually through stolons. Strawberry
fruit is a false fruit where the achenes, the true fruits, are embedded in the receptacle. Up
to 500 achenes might be found and those are developed through the fecundation of the
carpel (Erendorfer, 1983) and are composed in a combination of seed and ovary tissue.
The receptacle presents a pith at the center, a fleshy cortex, the epidermis that contains
the achenes and a system of vascular bundles that connects the plant with the achenes.
The developmental process in soft fruit presents an initial phase of growth and
elongation, followed by a phase of ripening. In strawberry receptacle, the first growing
phase relys on the development of cortex and medulla cells and will determine the final
size of the fruits (Hancock, 1999). The final size will also be determined by the number
and distribution of achenes in the receptacle and the percentage of fertilized carpels.
Therefore, the synthesis of auxins, mainly in the form of indole-3-acetic acid, takes place
in the achenes and is the main responsible of the receptacle growth, as the removal of the
achenes at early stages of development inhibits the fruit growing. Gibberellins, cytokinins

SUMMARY GENERAL INTRODUCTION
50 Functional characterization of molecular regulatory mechanisms controlling the ripening in strawberry fruit
and abscisic acid have a limited role in the fruit growth (Nitsch,1950; Perkins-Veazie,
1995).
In the elongation phase, the cortical cells present an isodiametric growth tied to
structural changes in the cell wall and subcellular structures. On the other hand, the
ripening phase takes 30-40 days to complete from anthesis and is determined by dramatic
physical changes, as in the texture and color; chemical changes, as the production of
aroma and flavor compounds; as well as a variation on gene expression (Knee et al., 1977;
Dennis, 1984). This process is dependent of natural conditions, as temperature and
photoperiod, and the contribution of assimilates and the water balance between the fruit
and the plant.
All the changes produced in the ripening process need the synthesis of new
proteins (Manning, 1993). In this sense, some works have studied the evolution of
transcript along developmental stages and ripening. Three evolution models have been
described those that increases along ripening, those that decreases over ripening and other
that peak at intermediate stage and then decline (Veluthambi and Poovaiah, 1984; Reddy
and Poovaiah, 1990; Reddy et al., 1990; Manning, 1994). Recently, the use of massive
transcriptome analysis and the sequencing of the genome allowed us to identify the
transcriptomic changes during development and ripening stages to select genes for further
characterization in this thesis (Medina Puche et al., 2016, Sanchez Sevilla et al., 2017).
Fruits can be divided into climacteric or non-climacteric depending if a burst of
ethylene is present to trigger the ripening process. In strawberry, the ripening occurs
without an increase on ethylene production, suggesting that this process is independent
of this hormone (Iwata et al., 1969a, 1969b; Villareal et al., 2010). However, ethylene is
produced in low levels in mature fruits, suggesting that this hormone might have a
secondary role in strawberry ripening (Trainotti et al., 2005, Villarreal et al., 2010,
Merchante et al., 2013). Thus, hormonal regulation of ripening is a very active field of
study. Auxins inhibit fruit ripening and when their concentration decline the fruit ripening
begins (Given et al., 1988b). The peak concentration of gibberellins and cytokinins is
present in achenes 7 days after anthesis. This suggests that GA might control the cell
division in auxiliary buds and participates in the differentiation of the auxiliary buds
(Hytönen et al., 2009, Teneira et al., 2017). On the other hand, abscisic acid (ABA) plays

SUMMARY GENERAL INTRODUCTION
51 PhD Thesis Félix Juan Martínez Rivas
many roles regulating different physiological process in plants. It is involved in the
control of seed maturation, vegetative growth, and in the response to different abiotic
stresses (Mishra et al., 2006). In strawberry, the increase of ABA content, around 20 days
post anthesis, is concomitant with the decrease of auxins in both achenes and receptacles.
The ratio ABA/auxins is controlling the ripening process and the genetic changes that
take place in this transition (Perkins-Veazie et al., 1995). The application of exogenous
ABA promotes strawberry ripening, while inhibiting its biosynthesis inhibits the process,
suggesting that ABA is the hormone controlling the process (Jia et al., 2011, Liao et al.,
2018).
Strawberry is one of the most appreciated fruits among consumer due to its
organoleptic properties. The flavor is determined by the complex mixture of volatile acids
and other compounds such as sugars, organic acids, phenolic acids and tannins. The
receptacle is the deposit tissue of the plant. Composed by 90% and 10% soluble solids, it
contains many compounds much appreciated by its nutritional benefits as vitamin C,
soluble sugars and organic acids (Hollman and Venema, 1993: Maas et al., 1996). Also,
high concentrations of anthocyanins and flavonoids are found and compounds whose
health benefits are being studied nowadays (Giampieri et al., 2015). Among those
compounds, carbohydrates are one of the main soluble compounds, not only providing
energy for metabolics pathways also they are important in the flavor of the fruits.
Moreover, organic acids are responsible of the receptacle flavor and participate
determining the color, inhibing some enzymatic activity as those related with cell wall
dissembling. Non volatile acids are more related with the acidic content of the receptacle,
while volatile acids contribute to the aroma. Up to 360 volatile have been found in
strawberry and, while being only up to 0.02% of the fresh weight, little changes in their
composition may change the taste dramatically (Zabetakis and Holden, 1997).
The most noticeable change along ripening is the color change from green to red
characteristic of ripen fruits. This is due to the degradation of chlorophyll and the
synthesis of anthocyanins and flavonoids (Timberlake, 1981, Perkins-Veazie, 1995). Its
biosynthesis takes place in white fruits using precursors from the shikimic acid pathway.
Pelargonidin 3 glucose is the most abundant anthocyanin in strawberry fruit, representing
up to 90% of total anthocyanin content. Anthocyanins concentration varies between
different cultivars but also in response to physiological conditions.

SUMMARY GENERAL INTRODUCTION
52 Functional characterization of molecular regulatory mechanisms controlling the ripening in strawberry fruit
Flowering in strawberry is induced by low temperatures and shorts photoperiods
as the development of the floral buds depend on them. It has been described that flowering
locus T might be the responsible gene that suppress the stolon development and is
associated with independent environmental conditions flowering (Perrote et al.,
2016a).
As sessile organism, plants are exposed to different biotic and abiotic agents in
their habitat. Moreover, in the lately years the global climate change is changing the
environmental conditions dramatically. Those stresses might decrease strawberry
production up to 50% (Vij y Tyagi, 2007). Thus, the studies focusing on physiological,
biochemical and molecular responses to those stresses are growing in an effort to reduce
the lost produced by them. The TF RdreB1Bl has been identified to improve the response
to different stresses, as cold, drought and salinity (Gu et al., 2013, 2015, 2017). Moreover,
transcriptome studies comparing plants subjected to different stresses have identified to
several genes putatively involved to modulate the plant response. More studies are needed
to characterize the role played by them. On the other hand, many diseases and plagues
also affect strawberry crops, causing a high economic impact on farmers, due to pesticide
treatment and fruit losses. Therefore, the improvement of the strawberry natural
resistance by genetic manipulation is an important research objective. For instance, the
loci Rfp1 is associated with the resistance to Phytophthora fragarie (Haymes et al., 1997).
Moreover, both FaRCa1 and FaRCg1 are two loci located in the chromosme 6 related
with the resistance to Colletotrichum acutatum and C. gloeosporioides, respectively
(Anciro et al., 2018, Salinas et al., 2018). Thus, transgenic strawberry plants with high
levels of chitinase reduce the harm effects caused by the mildew fungus (Asao et al.,
1997, 2003).
Improving of the fruit quality have received the most attention in breeding and
biotechnology programs. Taste, thus the combination of sweetness, acidity and aroma are
the most important quality traits to decide whether to purchase or not. Therefore, the
genes involved in those processes are being studied using transgenic plants although this
technology is quite slow due to the time needed to regenerate these plants. Moreover, the
european legislation is still very restrictive, blocking the using of transgenics crops. The

SUMMARY GENERAL INTRODUCTION
53 PhD Thesis Félix Juan Martínez Rivas
development of the CRISPR/Cas9 technology, able to edit the DNA without introducing
exogenous material in the genome, and its application in the octoploid strawberry will
allow to a faster genetic improvement in strawberry (Jinek et al., 2012, Martín-Pizarro et
al., 2018).

54 Functional characterization of molecular regulatory mechanisms controlling the ripening in strawberry fruit

INTRODUCCIÓN
55 PhD Thesis Félix Juan Martínez Rivas
INTRODUCCIÓN

56 Functional characterization of molecular regulatory mechanisms controlling the ripening in strawberry fruit
INTRODUCCIÓN
1. La planta de fresa: generalidades
1.1. Origen, especiación y evolución
La fresa es un fruto de tipo baya de gran importancia económica en todo el mundo. Está
incluido en el género Fragaria L perteneciente a la familia de las rosáceas (Rosaceae), donde
también se incluyen otras especies frutales de gran importancia económica como Prunus
(melocotoneros y albaricoques), Pyrus (peras), Malus (manzanas) y especies de uso ornamental
como el género Rosa. Además, dentro del género Fragaria, se incluyen 23 especies (Tabla 1)
distribuidas geográficamente en el hemisferio norte (Staudt, 1989, 1999a, b; Rousseau-Gueutin
et al., 2009), Sudamérica, sur de África y Australia (Linston et al., 2014). Cada especie se
encuentra restringida a un continente, salvo F. vesca que se encuentra tanto en Eurasia como
América (Staudt, 1962, Staudt, 1989). Se ha realizado un amplio estudio de las especies europeas
y americanas (Staudt et al., 1989; 1999a), así como de las asiáticas (Staudt 1999b, 2003, 2005;
Staudt y Dickoré., 2001), quedando bajo estudio las especies chinas, lo que significaría el análisis
taxonómico mundial (Figura 1).
Tabla 1. Distribución de las especies de fresa en el mundo (Fragaria L.)
(Hummer K.E. y Hancock J., 2009).

INTRODUCCIÓN
57 PhD Thesis Félix Juan Martínez Rivas
Figura 1. Distribución mundial de los componentes del género Fragaria.
Extraído de Liston et al., 2014.
Históricamente, la domesticación de los cultivos comerciales de fresa (Fragaria ×
ananassa) se creía bien documentada. Plantas de la especie nativa americana F. chiloensis fueron
llevadas a Francia desde Chile por el oficial francés Amédée Frézier en 1716. Éste regaló una de
las plantas al director del Real Jardín Botánico de París, Antoine de Jussieu, donde se cruzaron
con clones de F. virginiana Duch dando lugar a la actual F. ananassa (Hancock, 1999). A su vez,
el genoma tetraploide de cada una de estas especies se creía formado por la fusión e interacción
de los genomas diploides de otras dos especies, evento que se dató hace un millón de años
aproximadamente (Njuguna et al., 2013). Así, en un intento por identificar los progenitores de F.
ananassa, se incluyó a F. vesca y a F. iinumae como posibles parentales diploides (Hancock,
1999). No obstante, no se descartan otros eventos evolutivos partiendo de otras especies diploides
como F. viridis (Sargent et al., 2003; Nier et al., 2006) y F. nubicola (Sargent et al., 2004; 2006
y 2007; Vilanova et al., 2008) en las investigaciones genómicas de F. ananassa. De hecho, el
análisis poligénico de secuencias espaciadoras internas de los DNA cloroplásticos y ribosómicos
de ananassa, realizado por Potter et al. (2000), propuso a F. vesca, F. nubicola y F. orientalis
como posibles progenitores de las especies octoploides.
Recientemente, y gracias a la secuenciación por vez primera del genoma completo de la
especie octoploide F. ananassa (Edger et al., 2019), se ha conseguido una potente herramienta
para el estudio del origen filogenético de esta especie. En este trabajo, se han separado por primera
vez cada uno de los cromosomas de fresa y se han secuenciado y ensamblado de manera
independiente. De esta manera, se ha podido identificar a F. vesca, F. Iinumae, F. nipponica y F.
viridis como parentales de F. ananassa. Este estudio, junto a su distribución geográfica y la
historia natural y huella genética de los parentales diploides, ha permitido establecer una teoría

58 Functional characterization of molecular regulatory mechanisms controlling the ripening in strawberry fruit
de la formación cronológica de la especie cultivada. Así, especies tetraploides y hexaploides,
como F. Moschata, pueden ser intermedios evolutivos en la formación de la variedad octoploide.
Además, este estudio sugiere que F. vesca fue el último parental incorporado al genoma y que la
especie octoploide se originó en el norte de América, teoría apoyada por el estudio del ADN
plastidial de dicha especie (Njunga et al., 2008; Edger et al., 2019) (Figura 2).
Figura 2. Modelo de evolución genética y espacial del género Fragaria hasta el origen de F. ananassa.
Extraído de Edger et al., 2019.
Las especies alopoliploides presentan la dificultad de albergar diferentes genomas
parentales, cada uno con sus marcas epigenéticas y diferentes evoluciones dentro del mismo
núcleo. Debido a ello, se ha propuesto la teoría de un subgenoma dominante, lo cual resolvería
alguno de estos problemas (Schnable et al., 2011). Dentro del genoma octoploide, el subgenoma
perteneciente a F. vesca parece ser el dominante en comparación a los otros tres. Este subgenoma
aporta un 20% más de genes codificantes que el resto, lo que indica que ha estado expuesto a una
mayor presión selectiva que los demás (Edger et al., 2019). Así, los genes correspondientes a F.
vesca son responsables de un 88.8% de los genes implicados en la síntesis de antocianinas, un
89.2% de las síntesis de terpenos y un 95.3% de las síntesis de fructosa (Edger et al., 2019).
El uso de herramientas genéticas, empleando como base el genoma de F. Vesca, está
ampliamente extendido en la comunidad científica. El genoma de F. vesca ha sido secuenciado

INTRODUCCIÓN
59 PhD Thesis Félix Juan Martínez Rivas
en diversas ocasiones: Shulaev et al., 2011 v1.0; Tennesen et al., 2014 v2.0 y Edger et al., 2017,
v4.0; esta última separando físicamente los cromosomas antes de su secuenciación. De igual
manera, existe una amplia batería de datos transcriptómicos procedentes de experimentos de
ARN-seq y microarray que permiten, adicionalmente, el estudio comparativo del ADN
recombinante y genómico entre diferentes especies de rosáceas. El depósito de todas las
secuenciaciones y transcriptomas generados ha permitido la creación de una base de datos
específica de rosáceas (www.rosaceae.org) que incluye toda la información genómica de fresa
disponible actualmente.
2. Citología y análisis filogenético
Las especies del género Fragaria presentan un número cromosómico básico de siete (x =
7) (Ichijima, 1926). Aun así, se han identificado diversos grupos de fertilidad: diploides, como F.
vesca (2n = 2x = 14) o F. iinumae (Oosumi et al., 2006); tetraploides (2n = 4x = 28), como F.
Orientalis; hexaploides, como F. moschata (2n = 6x = 42); octoploides (2n = 8x = 56), que
incluyen a F. chiloensis, F. virginiana y el híbrido cultivado F. ananassa y, por último, el
decaploide F. iturupensis (Tabla 1) (Hirakawa et al., 2014). Se han propuesto tres modelos de
distribución cromosómica para F. ananassa, según datos genéticos y citológicos: AABBBBCC
(Federova et al., 1946), AAA´A´BBBB (Senanayake et al., 1967) y AAA´A´BBB´B´ (Bringhurst,
1990). De todos ellos, el tercer modelo es considerado el más probable ya que varios estudios han
mostrado la herencia disómica de un elevado número de marcadores de ADN, lo que sugiere una
composición alopoliploide del genoma de F. ananassa (Hirakawa et al., 2014). En muchos de
estos sistemas se presenta la dificultad de asignar a cada parental qué copia genética le pertenece,
esto es, que homeólogo pertenece a cada parental. En este caso, dentro de la especie cultivada F.
ananassa, cada progenitor presenta un par completo de cromosomas homeólogos, lo cual facilita
la asignación de cada gen a su parental.
En general, los cromosomas del género Fragaria son pequeños, pudiendo variar entre 0,9
a 1,7 micras de longitud, y presentan poca variación morfológica entre especies (Iwatsubo y
Naruhashi, 1989; 1991; Yarnell, 1928). En las especies diploides, no se ha observado ningún
comportamiento cromosómico irregular durante divisiones heterotópicas, donde siempre se
conservan los 14 cromosomas somáticos identificados en metafase. Para especies octoploides, es
difícil identificar el número de cromosomas, debido al empaquetamiento irregular de los mismos,
pero se estimó que pueden ser 56, un número esperable para una especie octoploide con un
numero haploide de cromosomas x = 7.

60 Functional characterization of molecular regulatory mechanisms controlling the ripening in strawberry fruit
Las relaciones filogenéticas de la especie Fragaria han sido estudiadas en diferentes
trabajos usando, principalmente, ADN plastidial y secuencias espaciadoras de transcripción
interna (ITS) de la región nuclear (Harrison et al., 1997; Potter et al., 2000, Sagent, 2005). Estos
primeros estudios solo incluyen especies diploides que son divididas en tres clases. Una de ellas
contiene únicamente a la especie japonesa F. iinumae, otro grupo que contiene a la mayoría de
las especies asiáticas y la última que contiene a F. vesca, F. bucharica y F. viridis. Estudios
posteriores de secuenciación refuerzan los tres grupos presentados anteriormente (Figura 3)
englobando a las especies octoploides como F. ananassa, F. chiloensis y F. virginiana en el grupo
de F. vesca (Njuguna et al., 2013; Russeau-Guertin et al., 2009).
Figura 3. Árbol biogeográfico de diferentes especies del género Fragaria. Las especies han sido
asignadas a tres regiones geográficas A: Este de Asia, B: Europa, C: América.

INTRODUCCIÓN
61 PhD Thesis Félix Juan Martínez Rivas
3. Morfología de la planta de fresa
La planta de fresa es perenne, de porte pequeño y compuesta por diferentes meristemos.
Su desarrollo está controlado tanto por la temperatura como por el fotoperiodo. Su reproducción
puede producirse de manera sexual, mediante frutos, o asexual, mediante estolones. Aunque es
considerada una planta herbácea, en realidad se trata de una especie leñosa perenne con pautas
fisiológicas similares a árboles y arbustos de hoja caduca y un ciclo de vida corto, de doce a veinte
semanas por generación (López-Aranda, 2008). La planta presenta un tallo central, comprimido
en una roseta basal o corona. De ella emergen raíces de tipo fasciculado y hojas trifoliadas
dentadas, de haz glabrescente y envés con pelos aplicados, cuyos peciolos pueden alcanzar 20
centímetros de longitud. En el extremo axilar de cada hoja, se encuentra una yema o meristemo
axilar a partir del cual pueden desarrollarse estolones o inflorescencias, dependiendo de las
condiciones medioambientales. De la misma manera, a partir de los estolones o tallos rastreros,
se producen raíces adventicias que pueden generar nuevas plantas o plantas hijas a través de
reproducción asexual (Figura 4).
Figura 4. Morfología de la planta de fresa.
Los meristemos axilares pueden generar inflorescencias de pétalos blancos, hermafroditas
y receptáculo amarillo. La flor presenta un gineceo coricárpico donde cada carpelo representa un
carpidio y en el que el androceo se ha multiplicado de modo secundario por intercalación (Figura
5A). De cada carpelo fecundado se forma un fruto indehiscente (aquenio) que se dispone sobre la
superficie del eje floral (receptáculo) que adopta un aspecto cónico y textura carnosa para dar
lugar a un fruto múltiple (Erendorfer, 1983) (Figura 5B). La fresa es, por tanto, un fruto blando
que, como otras bayas con estructura de falso fruto carnoso, presenta los verdaderos frutos, los
aquenios, en el exterior (Figura 5B).
Planta hija
Planta madre
Hoja trifoliada
Estolón
Raices
Coronas

62 Functional characterization of molecular regulatory mechanisms controlling the ripening in strawberry fruit
Figura 5. A) Flor completamente desarrollada de la planta de fresa. (1. sépalos, 2. pétalos, 3. estambres,
4. receptáculo, en el que se incluyen los pistilos). B) Estructura del fruto de fresa.
Las condiciones ambientales son las que determinan que la reproducción de la planta se
produzca de forma sexual o asexual. En los cultivares de día corto, las flores aparecen cuando los
días son cortos y las temperaturas bajas, mientras que producen estolones en días largos y
temperaturas más altas. Por otro lado, en los cultivares día neutro, la duración de los días no
influye y se producen flores con un patrón cíclico pero a temperaturas relativamente frías (Tabla
2, Figura 6). Las variedades remontantes, o de día largo, producen flores en días más largos y
estolones desde el principio de la primavera hasta el otoño, con el comienzo de las altas
temperaturas. A diferencia de las variedades de día corto, las de día largo producen menos
estolones y tienden a multiplicar el número de coronas por planta. Los términos neutro y
remontante suelen usarse indistintamente, sin embargo, las variedades remontantes han sido
seleccionadas en zonas continentales y nórdicas, mientras que las de día neutro han sido
seleccionadas mediante mejora genética tradicional, buscando eliminar la dependencia del
fotoperiodo para aumentar la producción durante todo el año.
Tabla 2. Número medio de inflorescencias y estolones en variedades de día corto y neutro sometidas a
diversas temperaturas durante tres meses (Adaptado de Hancock, 1999).
Figura 6. Perfil de floración y crecimiento vegetativo de plantas de fresas a diferentes temperaturas.
(Adaptado de Hancock, 1999)
A
Médula
Parénquima interno
Córtex
Sépalos
Aquenios
B

INTRODUCCIÓN
63 PhD Thesis Félix Juan Martínez Rivas
3.1. Morfología del fruto: aquenios y receptáculo
En la base de cada pistilo, y cuando éste es fecundado, se generan los aquenios. Estos son
una combinación de tejido de la semilla y tejido ovárico y se encuentran embebidos en la capa
epidérmica del receptáculo. A través de haces fibrovasculares, se conectan con el resto del
receptáculo y reciben los nutrientes necesarios para el desarrollo del ovario (Darrow, 1966). El
número de aquenios presente en cada fruto dependerá del cultivar y de las condiciones de
crecimiento de éste, variando entre 20 y 500. Los aquenios presentan un pericarpio grueso, una
delgada testa, una única capa endospérmica y un embrión que completa su desarrollo alrededor
de diez días después de la antesis (Thompson, 1963).
Por otro lado, en el receptáculo, el tejido vascular forma un eje central alrededor del cual
se disponen los tejidos parenquimatoso y epidérmico del córtex (Havis, 1943). Los haces
vasculares se extienden desde el pedicelo, que lo conecta al resto de la planta, atravesando el
tejido parenquimático hasta alcanzar a los aquenios. La epidermis es ligeramente pubescente,
formada por una o dos capas delgadas de células. También, se presentan estomas protuberantes y
abiertos relacionados con la transpiración y respiración del fruto (Perkins-Veazie, 1995).
4. Composición del fruto de fresa
El fruto es el tejido sumidero más importante en la planta de fresa, llegando a acumular
entre el 20-40% de su peso seco. El desarrollo de frutos inhibe la producción de estolones y
coronas pero no afecta al total del peso seco, salvo en la raíz, donde se produce una reducción de
biomasa (Hancock, 1999). Este fruto es uno de los más apreciados por los consumidores,
principalmente, debido al delicado sabor y aroma que presenta y, además, es un alimento muy
saludable debido a su valor nutricional (Giampieri et al., 2014). El fruto maduro está compuesto
por un 90% de agua mientras que, el 10% restante, son sólidos solubles que incluyen numerosos
compuestos importantes en la dieta (Hemphill y Martin, 1992), como un alto contenido en fibra
y fructosa (Tabla 3). Además, los aquenios presentan un alto nivel de ácidos grasos insaturados
de los que el 72% son poliinsaturados (USDA, 2010).
La fresa es rica en vitamina C (ácido ascórbico), siendo una de las frutas con mayor
contenido de esta vitamina. De hecho, 10 fresas proporcionan el 95% de los requerimientos
dietéticos diarios recomendados de vitamina C (Maas et al. 1996). El alto contenido de esta
vitamina es especialmente importante ya que, en humanos, primates y otros mamíferos, la
vitamina C no se puede sintetizar debido a la falta de la última enzima de su ruta de biosíntesis,
la L-gulono-1,4-lactona oxidasa (Chatterjee, 1973). La vitamina C se sintetiza a partir del
precursor D-glucosa-6-fosfato (D-Glu-6-P) a través de diferentes vías: en animales, la D-Glu-6-P

64 Functional characterization of molecular regulatory mechanisms controlling the ripening in strawberry fruit
se sintetiza a partir de ácido D-glucurónico formando el precursor gulono-1,4-lactona. En plantas,
la ruta es más compleja e involucra diferentes glucósidos (fructosa, manosa) hasta llegar a
galactono-1,4-lactona (Wheeler et al., 1998). Se ha propuesto una vía alternativa para la síntesis
de vitamina C en plantas, sugiriendo que la degradación de componentes pectínicos de la pared
celular, como el ácido galacturónico (GalUA) pueden ser precursores de la síntesis de vitamina C
(Agius et al., 2003). El gen GalUA reductasa de fresa (FaGalUR) presenta un patrón de expresión
transcripcional correlacionado con el proceso de maduración, lo que parece indicar una relación
entre este proceso y el aumento del contenido de vitamina C (Agius et al., 2003). Además, la
expresión ectópica en tomate de FaGalUR aumenta moderadamente el contenido de ácido
ascórbico, así como la capacidad antioxidante total de los frutos (Amaya et al., 2014). Por otro
lado, la sobreexpresión de una GDP-L-galactosa fosforilasa de kiwi en plantas de fresa produjo
un aumento de la concentración de vitamina C de hasta dos veces sin generar ningún cambio
fenotípico en el fruto (Bulley et al., 2012). La ruta de síntesis y reciclaje de vitamina C se ha
encontrado también en aquenios, los cuales presentan concentraciones de ácido ascórbico de hasta
un tercio de las presentes en el receptáculo (Aragüaez et al., 2013).
El ácido cítrico es el ácido orgánico principal del fruto de fresa y representa
aproximadamente el 90% del contenido total de ácidos del mismo (Green, 1971). Le siguen en
concentración el ácido málico y el ácido ascórbico (Agius et al., 2003; Ornelas-Paz et al., 2013).
La fresa contiene también importantes niveles de ácido elágico, que posee propiedades
antioxidantes y anticancerígenas (Maas et al., 1991; Basu et al., 2014). No obstante, las
concentraciones de todos estos componentes dependen del estado de maduración del fruto y, en
todo caso, aumentan durante este proceso (Ornelas-Paz et al., 2013).
Los azúcares son otro de los componentes principales del fruto. Glucosa y fructosa son
los principales azúcares solubles de la fresa, constituyendo más del 80% de los azúcares totales y
hasta el 40% del peso seco del fruto (Wrolstad y Shallenberger, 1981). Se encuentran presentes
en todos los estadios de desarrollo y maduración, incrementando ligeramente su concentración
desde el 5% presente en estadio verde hasta el 6.9% de frutos maduros (Kader, 1991, Maas et al.,
1996, Ornelas-Paz et al., 2013). En general, el dulzor del fruto está regulado por la acción de las
invertasas, que controlan el nivel de azúcares en el fruto (Ranwala et al., 1992; Manning, 1998).
Por otra parte, la concentración de sacarosa es generalmente mucho más baja que la de
glucosa y fructosa y muestra un pequeño incremento cerca del desarrollo del fruto (Forney y
Breen, 1985). Esto parece indicar que, pese a su menor concentración, juega un papel clave en la
regulación de la maduración del fruto (Jia et al., 2013). Así, la reducción del contenido de sacarosa
en receptáculos mediante el silenciamiento transitorio de su receptor, FaSUT1, produjo una

INTRODUCCIÓN
65 PhD Thesis Félix Juan Martínez Rivas
disminución de los niveles de ácido abcísico (ABA) que condujo, a su vez, a un retraso de la
maduración. En cambio, la sobreexpresión de FaSUT1 incrementó el contenido de sacarosa y el
de ABA acelerando así el proceso de maduración (Jia et al., 2013). De igual manera, se ha
demostrado que la sobreexpresión del factor de transcripción FaMYB44.2 reprime la expresión
de FaSPS3, un gen clave en la síntesis de sacarosa. Esta sobreexpresión resultó en una menor
acumulación de azúcares, como fructosa, galactosa y sacarosa (Wei et al., 2018a). Además, la
aplicación exógena de sacarosa produjo cambios transcriptómicos y fenotípicos similares a los
producidos por la aplicación de ABA, reduciendo el tiempo de maduración e induciendo la
sobrexpresión de genes clave en el proceso de maduración como FaNCED1, FaSnRK2.2 y
FaCEL1, relacionados con el metabolismo y señalización de ABA y con el reblandecimiento del
fruto, ambos procesos asociados a la maduración (Luo et al., 2020).
Tabla 3. Composición del fruto de fresa (por 100g de peso fresco).
(Hollman y Venema, 1993, Maas et al., 1996).
Nutriente Contenido Nutriente Contenido
Agua
Proteínas
Ácido elágico
92 g
0,6 g
0,09-0,4 mg
Vitaminas
Vitamina C
Otras
56,7 mg
<0,5 mg
Carbohidratos totales 7 g Lípidos
Fibra 0,5 g Saturados 0,02 mg
Minerales (mg) Monoinsaturados 0,052 mg
Ca 14 mg Poliinsaturados 0,186 mg
Fe 0,4 mg Colesterol 0
P
Mg
K
Na
Zn, Cu, Mn
19 mg
10 mg
166 mg
1 mg
<0,5 mg
Fitoesteroles
Aminoácidos
Todos (n=18)
12 mg
522 mg
Las fresas son fuente de compuestos fitoquímicos (ácido elágico, antocianinas, quercetina
y catequina), vitaminas (ácido ascórbico y ácido fólico), polifenoles y antioxidantes. Sin embargo,
hay que tener en cuenta que la concentración de estas moléculas bioactivas puede verse afectada
significativamente por el cultivar, las prácticas agrícolas, el almacenamiento postcosecha de los
frutos y los métodos de procesamiento utilizados (congelación o calor seco).

66 Functional characterization of molecular regulatory mechanisms controlling the ripening in strawberry fruit
La ingestión de fresas tiene efecto positivo en la prevención de la inflamación, de
enfermedades cardiovasculares, de obesidad e incluso de ciertos tipos de cáncer (Giampieri et al.,
2015). De hecho, se ha observado que el consumo controlado de fresas disminuye el contenido
total de colesterol, LDL y triglicéridos en sangre mientras que aumenta el de vitamina C,
atenuando así el estrés oxidativo producido por una dieta rica en grasas, y la hiperlipidemia de
sujetos con factores de riesgo cardiovascular (Álvarez-Suárez et al., 2014). Estos efectos sobre la
salud se pueden atribuir a los efectos sinérgicos de los nutrientes y los fitoquímicos de las fresas.
No obstante, son necesarios más estudios para definir la dosis óptima y la duración apropiada de
la ingesta necesarias para modular los niveles de los citados biomarcadores o las vías relacionadas
con enfermedades crónicas (Basu et al., 2014).
5. Fisiología del fruto de fresa
Los frutos blandos comparten ciertas características comunes a lo largo de su desarrollo.
En general, presentan una fase inicial de crecimiento y elongación del fruto seguida de una fase
de maduración caracterizada por determinados cambios físicos (cambios de textura y color) y
químicos (producción de aromas y sabores), debidos fundamentalmente a la variación de los
patrones de expresión génica característicos de cada tipo de fruto (Gapper et al., 2013).
5.1. Cambios macroscópicos
5.1.1. Crecimiento
El desarrollo del fruto está determinado por el porcentaje de carpelos fertilizados, así
como el número y distribución de los aquenios sobre el receptáculo. Los aquenios son los
responsables primarios de la síntesis de auxinas y esta síntesis viene condicionada por su correcta
fecundación (Nitsch, 1950; Dreher y Poovaiah, 1982; Archbold y Dennis, 1984). Las auxinas se
translocan por el floema basipétalamente desde los aquenios hasta el pedúnculo y son las
responsables del crecimiento del receptáculo (Nitsch, 1950). La separación parcial de aquenios
en frutos verdes da lugar a un receptáculo maduro expandido sólo en las proximidades de los
aquenios presentes, mientras que la separación total de los aquenios aborta el desarrollo del fruto.
La aplicación exógena de auxinas sintéticas restaura el crecimiento del receptáculo a pesar de
habérsele retirado los aquenios (Nitsch, 1950). El crecimiento del fruto ha sido atribuido a la
capacidad de las auxinas para estimular el transporte de nutrientes al mismo. Por ello, las
variaciones en el tamaño del fruto entre los distintos cultivares podrían estar determinadas por la
actividad promotora del crecimiento que ejerce cada uno de los aquenios. Otras hormonas, como
giberelinas, citoquininas y ABA, parecen tener un papel limitado en la regulación del crecimiento
del fruto (Perkins-Veazie, 1995).

INTRODUCCIÓN
67 PhD Thesis Félix Juan Martínez Rivas
El crecimiento del receptáculo depende muy directamente del desarrollo de las células
del córtex y de la médula, siendo ésta última la principal responsable del tamaño final del fruto
(Hancock, 1999). La posición del fruto en la inflorescencia también determina su tamaño, así su
tamaño es menor según se trate de frutos primarios, secundarios o terciarios (Moore et al., 1970)
(Figura 8). Este hecho podría estar relacionado con un periodo de retraso tras la polinización, que
puede ser más largo en el caso del crecimiento del fruto secundario y terciario (Moore et al.,
1970). La eliminación de los frutos primarios de la planta motiva un incremento del peso de los
frutos secundarios, lo que indica que existe una competencia entre frutos (Stutte y Darnell, 1987).
Figura 8. Identificación de los frutos primarios, secundarios y terciarios en una planta de fresa.
Dependiendo de las condiciones medioambientales, el fruto alcanza su tamaño total y
definitivo aproximadamente 30 días después de la antesis. La cinética del crecimiento varía según
el cultivar. Así, algunos presentan una única fase de crecimiento sigmoidal (Woodward, 1972;
Forney y Breen, 1985; Stutte y Darnell, 1987), mientras que otros presentan modelos bifásicos de
crecimiento (Archbold y Dennis, 1984; Perkins-Veazie y Huber, 1987). El crecimiento bimodal
del receptáculo está relacionado con el desarrollo del endospermo y del embrión dentro de los
aquenios (Perkins-Veazie y Huber, 1987), mientras que el segundo periodo de crecimiento
coincide con la maduración del embrión en los aquenios, fenómeno que acompaña a la
maduración del receptáculo.
El peso fresco del fruto crece exponencialmente hasta el décimo día después de la
polinización debido al aumento de la división celular. Posteriormente, el crecimiento del fruto en
tamaño se debe a la expansión celular y, a partir del día 20, comienza una segunda fase de
incremento rápido de peso debido a la acumulación de asimilados fotosintéticos. El cambio de
color se observa a partir del día 25 y, tras 35 días, se completa el proceso de maduración (Knee
et al., 1977) (Figura 9). El tiempo necesario hasta la completa maduración del fruto es variable
ya que depende de las condiciones medioambientales y de la variedad.

68 Functional characterization of molecular regulatory mechanisms controlling the ripening in strawberry fruit
Figura 9. Crecimiento del receptáculo del fruto de fresa durante su desarrollo y maduración.
(Extraído de Jia et al., 2011).
5.1.2. Elongación
Durante la fase de elongación, las células corticales experimentan un crecimiento
isodiamétrico acompañado de importantes cambios en la pared celular y en la estructura
subcelular (Cheng y Breen, 1992). Esta etapa está condicionada por los efectos directos de la
temperatura, del aporte de asimilados fotosínteticos necesarios para el crecimiento o
almacenamiento y del balance hídrico entre el fruto y la planta. El aporte hídrico a la planta se
correlaciona directamente con el crecimiento ya que el estrés hídrico, bien por déficit hídrico y/o
incremento de temperatura, disminuye la tasa de crecimiento y, por lo tanto, el tamaño final del
fruto (Pearce et al., 1993).No obstante, a corto plazo, los efectos de estos factores abióticos
pueden llegar a ser beneficiosos ya que la temperatura acelera la velocidad de división y
elongación celular y. por tanto, del proceso de maduración del fruto; y la irradiancia estimula la
tasa de fotosíntesis y, por tanto, el aporte de carbono al fruto (Cockshull et al., 1992).
5.1.3. Maduración
Fisiológicamente, la maduración es un proceso rápido de corta duración en el que los
frutos desarrollan propiedades organolépticas que los hacen óptimos para su consumo. En fresa,
la maduración concluye 30 - 40 días después de la antesis y transcurre con cambios de color, sabor
y textura en el receptáculo. El proceso debe desarrollarse con el fruto unido a la planta ya que, si
se separa, sus propiedades organolépticas disminuyen drásticamente (Dennis, 1984). Durante la
maduración, se produce un aumento del tamaño de la célula derivado, principalmente, de la

INTRODUCCIÓN
69 PhD Thesis Félix Juan Martínez Rivas
formación de grandes vacuolas necesarias para el almacenamiento de los compuestos sintetizados
en el proceso. Además, se produce una modificación de la pared celular que provoca la oclusión
del espacio intercelular (Neal, 1965).
Una de las propiedades más importantes a la hora de determinar el grado de madurez y la
calidad del fruto es la firmeza. Ésta viene determinada por la turgencia celular y por las
características y composición de la pared celular. Desde el punto de vista del consumidor, la
textura es la principal cualidad requerida para la elección del fruto (Guolao y Oliveira, 2008). El
reblandecimiento no solo determina la vida post-cosecha de la fruta, sino que tiene un gran
impacto económico ya que influye en la frecuencia de la recogida, el procesado industrial de la
fruta y la distancia de transporte para su venta. El reblandecimiento del fruto comienza con la
modificación de la pared celular primaria, debido a la solubilización y despolimerización de los
polisacáridos que forman parte de ella, así como con la perdida de la unión célula-célula, debida
a la disolución de la lámina media. La composición y estructura de los polisacáridos de la pared
celular del fruto han sido estudiadas en tres cultivares con diferente firmeza (“Camarosa”, la más
firme; “Toyonaka”, de firmeza media; y “Pájaro”, la más blanda) durante su desarrollo y
maduración (Rosli et al., 2004). El estudio determinó que las diferencias principales entre ellas
radicaban en el contenido de polisacáridos de la pared. Así, aunque la cantidad de hemicelulosa
y celulosa de la pared disminuyó durante la maduración del fruto en los tres cultivares evaluados,
no hubo diferencias reseñables en su contenido en etapas maduras, lo que sugiere que este
polisacárido no ejerce un papel fundamental en el reblandecimiento del fruto de fresa en etapas
tardías de la maduración (Rosli et al., 2004; Palomer et al., 2006; Mercado et al., 2010; Paniagua
et al., 2014). Sin embargo, sí parece que la degradación de pectinas es el principal responsable
del reblandecimiento del fruto. Las pectinas componen hasta el 60% del total de masa de la pared
celular y son el componente principal de la lámina media (Rosli et al., 2004; Santiago-Doménech
et al., 2008; Quesada et al., 2009).
En las paredes celulares de las plantas se pueden distinguir tres tipos de pectinas:
homogalacturonanos (HGA), ramnogalacturonanos I (RG-I), y ramnogalacturonanos II (RG-II)
(Figura 10). En la lámina media de la pared celular, los HGA son los componentes predominantes
(Vincken et al., 2003). Los HGA contienen grupos heteropoliméricos de cuatro cadenas laterales
de longitud constante. Estas cadenas laterales y los residuos a los que están conectados se conocen
como RG-II (Vincken et al., 2003). Por otro lado, los RG-I están compuestos de una columna
vertebral que alterna residuos de ácido galacturónico y ramnosa con un 20-80% de residuos de
ramnosa sustituidos por cadenas laterales de azúcares neutros. Las pectinas se representan
típicamente como una cadena extendida de RG-I (regiones peludas) y los residuos de ramnosa
aislados interespaciando las regiones de HGA lisas (Mercado et al., 2011). Sin embargo, Vincken
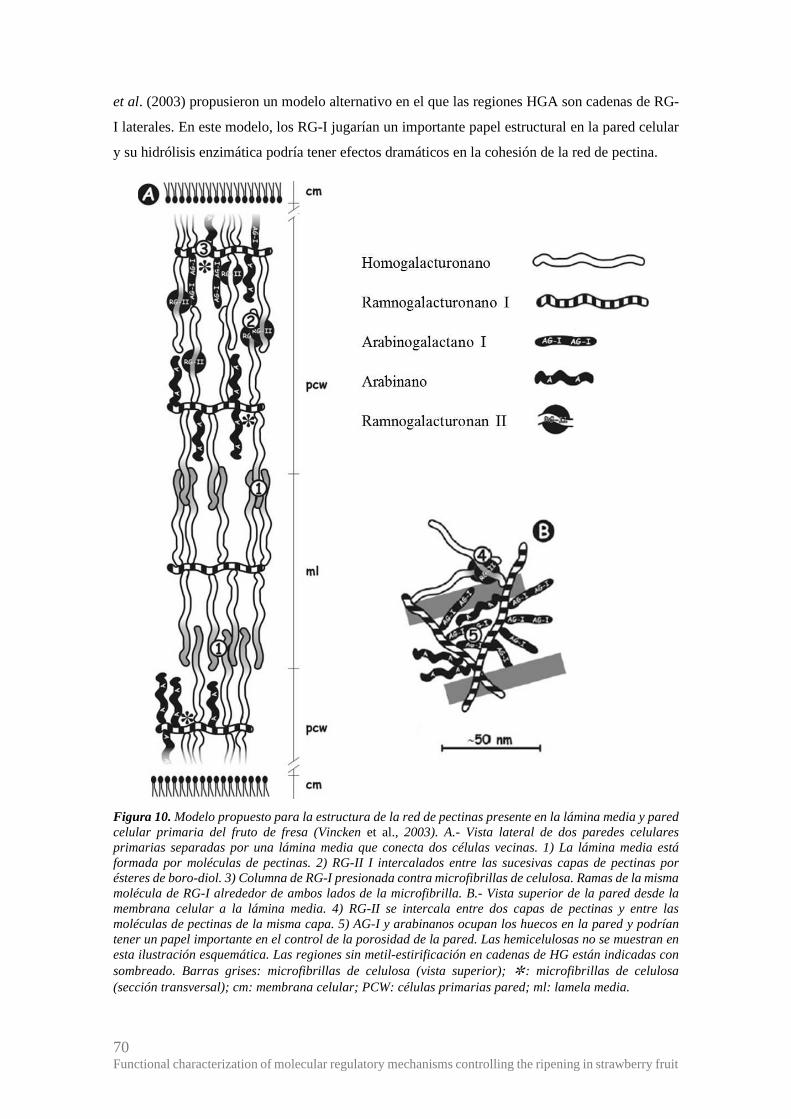
70 Functional characterization of molecular regulatory mechanisms controlling the ripening in strawberry fruit
et al. (2003) propusieron un modelo alternativo en el que las regiones HGA son cadenas de RG-
I laterales. En este modelo, los RG-I jugarían un importante papel estructural en la pared celular
y su hidrólisis enzimática podría tener efectos dramáticos en la cohesión de la red de pectina.
Figura 10. Modelo propuesto para la estructura de la red de pectinas presente en la lámina media y pared
celular primaria del fruto de fresa (Vincken et al., 2003). A.- Vista lateral de dos paredes celulares
primarias separadas por una lámina media que conecta dos células vecinas. 1) La lámina media está
formada por moléculas de pectinas. 2) RG-II I intercalados entre las sucesivas capas de pectinas por
ésteres de boro-diol. 3) Columna de RG-I presionada contra microfibrillas de celulosa. Ramas de la misma
molécula de RG-I alrededor de ambos lados de la microfibrilla. B.- Vista superior de la pared desde la
membrana celular a la lámina media. 4) RG-II se intercala entre dos capas de pectinas y entre las
moléculas de pectinas de la misma capa. 5) AG-I y arabinanos ocupan los huecos en la pared y podrían
tener un papel importante en el control de la porosidad de la pared. Las hemicelulosas no se muestran en
esta ilustración esquemática. Las regiones sin metil-estirificación en cadenas de HG están indicadas con
sombreado. Barras grises: microfibrillas de celulosa (vista superior); ✼: microfibrillas de celulosa
(sección transversal); cm: membrana celular; PCW: células primarias pared; ml: lamela media.

INTRODUCCIÓN
71 PhD Thesis Félix Juan Martínez Rivas
La degradación de la estructura de la pared celular requiere de la participación ordenada
y escalonada de una serie de enzimas (hidrolasas, transglicosilasas, liasas etc) que reconocen su
propio sustrato específico. Así, la acción de unas enzimas deja expuesto el sustrato de las
siguientes. Una de las primeras enzimas que actúan en esta degradación son las expansinas, cuya
actividad se ha detectado a lo largo del proceso de maduración. Hasta siete expansinas diferentes
se han identificado en fresa (FaExp1-7) (Civello et al., 1999; Harrison et al., 2001; Salentijn et
al., 2003; Dotto et al., 2006). Las expansinas están íntimamente implicadas en el proceso de
reblandecimiento de la fresa, existiendo una correlación directa entre la firmeza del fruto y los
niveles de expresión de tres de estas enzimas. De igual forma, variedades de frutos más blandos
como Toyonoka presentan mayores niveles de expresión de estas enzimas que otras más duras,
como Camarosa y Selva (Dotto et al., 2006).
Estudios transcriptómicos entre variedades de diferente firmeza han reportado diferencias
en la expresión de enzimas relacionadas con la degradación de la pared celular (Salentjn et al.,
2003). Entre ellas, FaPG (poligalacturonasa), que cataliza la hidrólisis de los enlaces α(1-4) entre
los residuos de ácido galacturónico de los homogalacturanos, presenta mayor actividad
enzimática en el cultivar más blando (Toyonoka) que en cultivares más duros, donde su actividad
es menor a lo largo de la maduración (Zhou et al., 2015). La expresión de la cinamoil CoA-
reductasa (FaCCR) y cinamil alcohol deshidrogenasa (FaCAD), ambas implicadas en la
biosíntesis de lignina, aumenta (más de 20 veces) en frutos blandos de la variedad Gorella,
mientras que, en variedades más duras como Holyday, no se produce un incremento de expresión
tan brusco. Ambas enzimas catalizan diferentes etapas de la síntesis de lignina y sus diferencias
de expresión pueden traducirse en diferencias en la composición de lignina. Teniendo en cuenta
que la lignina es un componente principal del tejido vascular y que está asociada con la textura
del fruto, las diferencias en su contenido y composición pueden ser importantes al determinar el
grado de firmeza del fruto (Jewell et al., 1973; Aharoni et al., 2002b). También, ha sido
caracterizada una peroxidasa, FaPOD27, como una enzima clave en la biosíntesis de lignina que
podría usarse como herramienta biotecnológica en la mejora de la firmeza de la fresa (Yeh et al.,
2014).
Otra enzima relacionada con la pectina es FaPL (pectato liasa). La expresión de diferentes
FaPLs incrementa a lo largo del proceso de maduración. Tres FaPLs han sido identificadas,
aunque solo una es específica del receptáculo y de maduración (Medina-Escobar et al., 1997,
Benítez-Burraco et al., 2003, Severo et al., 2011). El silenciamiento mediante RNA interferente
de FaPG y FaPL resultó en frutos más duros. Sin embargo, las líneas de silenciamiento de FaPG
mostraron niveles mayores de dureza, sugiriendo un papel preponderante de esta enzima sobre
FaPL (Jiménez-Bermúdez et al., 2002; Posé et al., 2013).

72 Functional characterization of molecular regulatory mechanisms controlling the ripening in strawberry fruit
Por otro lado, las pectín-metilesterasas (FaPMEs) realizan una doble función, alterando
el nivel de metil-esterificación de las pectinas y moviendo grupos acilo de una pectina a otra. La
de-esterificación de las pectinas es un paso crucial para permitir el acceso de otras enzimas como
las PGs (Moya-Leon et al., 2019). La actividad de las PMEs se concentra al final del desarrollo y
al inicio de la maduración, siendo máxima en la etapa de transición entre verde y rojo. De esta
manera, se considera que la acción de las FaPMEs es el desencadenante del resto de reacciones
que ocurrirán a continuación. El metabolismo de las pectinas presenta una organización
sincronizada entre enzimas a lo largo de la maduración, donde PME actúa en primer lugar,
dejando paso a PG y PL (Moya-León et al., 2019) (Figura 11).
Figura 11. Esquema de expresión de enzimas relacionadas en la degradación de la pared celular
durante el proceso de desarrollo y maduración del fruto de fresa. Extraído de Moya-León et al., 2019.
Por otro lado, las ramnogalacturonato liasas catalizan la ruptura de los enlaces α(1-4)
entre la ramnosa y el ácido galacturónico. Tan solo una enzima de este tipo, FaRGL, ha sido
caracterizada en fresa, presentando un patrón de expresión claramente relacionado con la
maduración. Su silenciamiento redujo la disolución de la lámina media en frutos de fresa (Molina-
Hidalgo et al., 2013).
Se ha identificado la capacidad de CBMFaEXP2 (Carbohydrate Binding Module
Expansin 2) de modificar la pared celular de A. thaliana (Nardi et al., 2015). Las CBMs se tratan
de dominios auxiliares con capacidad de plegamiento autónomo y con capacidad de
reconocimiento y unión específica a carbohidratos (Boraston et al., 2004). CBMFaEXP2 presenta
capacidad de unión a diferentes sustratos como son la celulosa microcristalina, xilanos y pectinas
in vitro e interfiere en la actividad de diversas enzimas modificadoras de la pared celular (PGs,

INTRODUCCIÓN
73 PhD Thesis Félix Juan Martínez Rivas
pectinasas y EGasas) a través de dichas uniones (Nardi et al., 2013). Plantas transgénicas de A.
thaliana sobreexpresando CBMFaEXP2, presentan mayor tamaño, así como una pared celular
más gruesa y mayor contenido de pectinas que las plantas control. Adicionalmente, estas plantas
tenían menor actividad de enzimas implicadas en la degradación de la pared celular como son PG,
β-Gal y β-Xyl. Paralelamente, y cómo consecuencia de la mayor integridad de la pared, estas
plantas transgénicas presentaron mayor resistencia frente al hongo Botrytis cinérea (Nardi et al.,
2015).
5.2. Cambios microscópicos
Como se ha indicado previamente, en las primeras fases del desarrollo del fruto, se
produce un crecimiento inicial del receptáculo debido principalmente a la división celular (Knee
et al., 1977). Este proceso está acompañado de cambios importantes en la pared celular y en las
estructuras subcelulares. En los primeros estadios del desarrollo, las células presentan una densa
pared celular y vacuolas pequeñas, los plastos almacenan grandes concentraciones de almidón y
el aparato de Golgi y los ribosomas son abundantes. Durante el desarrollo, y cuando el fruto
aumenta de tamaño, las paredes celulares se engrosan, aunque presentan mayor difusión, lo que
facilita el intercambio de compuestos. Además, el almidón almacenado en los plastos es
hidrolizado completamente, lo que aporta energía y metabolitos para las fases de proliferación y
elongación celular (Knee et al., 1977).
Durante la maduración, los plastos degeneran, pero no llegan a transformarse en
cromoplastos, mientras que las mitocondrias siguen siendo completamente funcionales. Este
proceso se caracteriza por un aumento de la hidratación del fruto, que acumula grandes cantidades
de agua en las vacuolas, así como una mayor solubilidad de la lámina media y la matriz celular,
lo que conlleva un reblandecimiento del fruto (Knee et al., 1977). La lámina media de las células
del parénquima cortical se degrada ampliamente durante la maduración del fruto, lo que provoca
un aumento del espacio intercelular, disminuyendo el área de contacto ente células (Perkins-
Veazie, 1995; Redgwell et al., 1997; Harker et al., 2000; Paniagua et al., 2014). Molecularmente,
los cambios más importantes en la pared celular a lo largo de la maduración se producen en la
fracción de pectina soluble, que aumenta del 30% al 65% del total en el fruto maduro (Huber,
1984).
5.2.1. Cambios organolépticos: desarrollo del olor y sabor
La compleja composición de compuestos volátiles y no volátiles, como azúcares, ácidos
orgánicos, compuestos fenólicos y taninos son los que otorgan el sabor del fruto.

74 Functional characterization of molecular regulatory mechanisms controlling the ripening in strawberry fruit
Carbohidratos
Los componentes solubles principales en el receptáculo de fresa son los carbohidratos.
No solo suministran la energía necesaria para la maquinaria celular, sino que tienen un papel
determinante en el sabor final del fruto. Aproximadamente, seis días después de la polinización
se comienzan a almacenar asimilados fotosintéticos en el receptáculo (Manning, 1993; Darnell y
Martin, 1988). La sacarosa es el principal compuesto glucídico que se almacena en el receptáculo,
actuando como sustrato metabólico en diferentes rutas como la biosíntesis de otros glúcidos
complejos de almacenamiento (Lis y Antoszewski, 1979).
Los transportadores de sacarosa identificados en fresa, FaSUT1-7, facilitan la entrada de
este azúcar a la célula a través del apoplasto (Ofosu-Anim y Yamaki, 1994, Jia et al., 2013). La
mayor parte de la sacarosa es hidrolizada en fructosa y glucosa por acción de la enzima β-
fructofuranosidasa (Forney y Breen, 1986). Al principio del desarrollo, los niveles de sacarosa
son bajos, aumentan rápidamente hasta alcanzar su máximo en el estadio intermedio y disminuyen
de nuevo en estadio rojo. Esta disminución conlleva un aumento en los niveles de glucosa y
fructosa, que son los azúcares más abundantes en el fruto maduro (Forney y Breen, 1986). En
estos frutos, glucosa y fructosa constituyen aproximadamente el 80% del total de azúcares,
llegando a concentraciones de entre 2-2.5g/100 g de peso fresco (Ornelas-Paz et al., 2013). El
resto de azúcares que se encuentran en menor concentración son, entre otros, sacarosa, sorbitol,
xilitol y xilosa (Makinen y Söderling, 1980). Con relación a los glúcidos que presentan menor
concentración, el sorbitol es el más estudiado. Se han identificado genes implicados en su síntesis,
como sorbitol deshidrogenasa (FaSDH) y sorbitol deshidrogenasa-6-fosfato (FaS6PDH). Sin
embargo, solo se ha podido identificar actividad enzimática de FaSDH, tanto en fruto como en
hoja (Duangsrisai et al., 2007). La concentración de sacarosa desencadena el proceso de
maduración, mediado por un incremento en el contenido de ABA (Ofosu-Anim y Yamaki, 1994;
Jia et al., 2013). Las hormonas juegan un papel importante en la captación de azucares durante la
maduración, tanto auxinas como ABA estimulan la incorporación de azúcares al receptáculo,
aunque de maneras diferentes. ABA promueve el incremento en los procesos de difusión, mientras
que las auxinas promueven la incorporación por transporte activo y por difusión (Ofosu-Anim et
al., 1996).
Como principal glúcido de reserva en plantas se encuentra el almidón, que se sintetiza a
partir de monómeros de glucosa en una reacción catalizada por la ADP-glucosa pirofosforilasa.
Las subunidades mayores (FagpL1 y FagpL2) y menor (FagpS) han sido identificadas en fresa.
La expresión génica de FagpL1 y FagpS es elevada y constante en el desarrollo y maduración del
fruto, mientras que FagpL2 presenta una expresión baja y específica de hojas (Park y Kim. 2007).

INTRODUCCIÓN
75 PhD Thesis Félix Juan Martínez Rivas
El silenciamiento de FagpS consiguió disminuir el contenido de almidón y aumentar el de sólidos
solubles en plantas transgénicas (Park et al., 2006). Se ha identificado la actividad de enzimas
clave en el metabolismo de azúcares como son la invertasa ácida soluble, sacarosa sintasa,
hexoquinasa y fructoquinasa, presentando diferentes patrones de actividad en el desarrollo y
maduración (Xie et al., 2007).
Ácidos orgánicos
Otro de los factores determinantes del sabor de la fruta es la concentración de ácidos
orgánicos. La concentración de estos ácidos no solo determina el pH del fruto, sino que condiciona
la estabilidad de los compuestos que dan color, inhibe la actividad de ciertas enzimas e incluso
modifica la textura de este, ya que afectan a las propiedades de las pectinas. Los ácidos orgánicos
que se encuentran en mayor concentración en el fruto son los derivados del ciclo de Krebs.
Mientras que los ácidos no volátiles determinan la acidez final del fruto, los ácidos volátiles
contribuyen mayoritariamente en el aroma del fruto (Mussinan y Walradt, 1975). Se ha
determinado el contenido de ácido cítrico, málico y ascórbico, ácidos mayoritarios en el fruto
durante el proceso de maduración. El ácido málico no altera su concentración durante la
maduración mientras que el ácido cítrico la disminuye y el ácido ascórbico aumenta (Kafkas et
al, 2007; Ornelas-Paz et al., 2013). La alta concentración de ácido ascórbico otorga a la fresa
grandes efectos beneficiosos sobre la salud, aunque hay que tener en cuenta que la concentración
de este ácido es dependiente del cultivar y del tiempo de recogida del fruto (Pincemail et al., 2012;
Ornelas-Paz et al., 2013).
Compuestos fenólicos
Los compuestos fenólicos quizás engloben al conjunto de compuestos más diversos del
fruto de fresa. Dentro de esta categoría se encuentran los polifenoles, las proantocianidinas
(taninos condensados) y ésteres de los ácidos hidroxibenzoicos e hidroxicinámicos. En los
primeros estadios de desarrollo del fruto, la concentración de los compuestos fenólicos es alta y
ésta disminuye a lo largo de la maduración (Spayd y Morris, 1981). Los taninos condensados,
que se concentran en los primeros estadios del desarrollo, son responsables de la astringencia del
fruto, principalmente por la interacción de estos con las proteínas y mucopolisacáridos de la boca
(Ozawa et al., 1987), mientras que las flavonas otorgan el amargor que presentan los frutos verdes
(Ferrer, 1997). Por otro lado, los ácidos fenólicos proporcionan acidez al fruto y derivan de la
fenilalanina por la vía de los ácidos cumárico y cinámico, siendo el cafeico el de mayor
concentración

76 Functional characterization of molecular regulatory mechanisms controlling the ripening in strawberry fruit
Otro grupo de compuestos fenólicos de gran importancia en el fruto de fresa son las
antocianinas. Son derivadas de una serie de reacciones que parten de fenilalanina como precursor.
Son unos de los compuestos más estudiados del fruto ya que son responsables del color rojo del
mismo. La antocianina con mayor concentración es la pelargonidina-3-glucosido, seguida de su
derivado la pelargonidina-(6-malonil)-3-glucósido. En menor concentración aparecen la
cianidina-3-glucósido y su derivado malonilo (Lopes da Silva et al., 2002; Crecente-Campo et
al., 2012). El color rojo brillante del fruto se correlaciona positivamente con el contenido de
pelargonidina-3-glucósido (Crecente-Campo et al., 2012). No obstante, el color que aportan las
antocianinas depende del patrón de hidroxilación de su anillo B. Por otro lado, cabe destacar el
comportamiento del contenido de flavonoles totales en el fruto, que desciende a lo largo del
proceso de maduración. De esta familia, el flavonol con mayor concentración en fresa es la
quercitina-3-glucurónido, seguido por el kaempferol y sus derivados (Lopez da Silva et al., 2002).
Figura 12. Esquema químico de las diferentes antocianinas. Dependiendo de las sustituciones que se
presenten en el anillo B, el compuesto resultante presentara un patrón UV diferente y, por lo tanto, un
color diferente. Extraído de Durst y Wrolstad, 2001.
Compuestos volátiles
La intensidad del sabor del fruto de fresa depende en gran medida de la percepción
olfatoria retronasal de los compuestos volátiles. Pese a suponer tan solo un 0,001-0,01% del peso
fresco del fruto, estos contribuyen a la intensidad y percepción sensorial de la acidez y dulzura
del fruto de forma determinante (Larsen y Poll, 1990). El aroma del fruto de fresa no es
únicamente una característica propia del fruto, sino que es utilizado como un importante aditivo

INTRODUCCIÓN
77 PhD Thesis Félix Juan Martínez Rivas
industrial en otros productos (Hancock, 1999). Mas de 360 compuestos volátiles han sido
identificados en el fruto de fresa, incluyendo ésteres, alcoholes, cetonas, furanos, terpenos,
aldehídos y compuestos sulfurados (Zabetakis y Holden, 1997; Schwieterman et al., 2014). El
tipo y la concentración de compuestos volátiles depende, en gran medida, del grado de
maduración y del cultivar analizado. Aun así, los ésteres son los volátiles más numerosos, hasta
131 han sido identificados (Jetti et al., 2007), mientras que el resto de compuestos presentan
concentraciones más bajas. Las diferencias de concentración en estos compuestos determinan
cambios significativos en el aroma de la fruta (Yan et al., 2018). Así, la concentración de cada
uno de los compuestos genera una huella identificativa de cada cultivar y especie, lo que ha sido
objeto de diversas investigaciones (Larsen y Poll, 1992; Larsen et al., 1992). Las especies
silvestres, como F. vesca y F. virginiana, presentan un aroma más fuerte que las cultivadas. F.
vesca contiene concentraciones altas de acetato de etilo, pero bajas de metil-butirato, etil-butirato
y furanona; mientras que F. nilgerrensis presenta altas concentraciones de etil-acetato y furanona,
pero bajas de metil-butirato y etil-butirato (Hirivi y Honkanen, 1982).
En la especie silvestre F. vesca se han identificado compuestos clave en el aroma del fruto
derivados de los fenilpropanoides. Estos incluyen acetatos de alcoholes de hidroxicinamoil y
fenilpropanos como eugenol e isoeugenol (Pyysalo et al., 1979; Ulrich et al.,1995; 2007). La
producción de eugenol está bien estudiada y es superior en F. vesca que en la variedad cultivada
F. ananassa (Pyssalo et al., 1979; Zorrilla-Fontanesi et al., 2012). Se han identificado dos
enzimas eugenol sintasa con capacidad de sintetizar eugenol in vitro usando coniferil acetato
como sustrato. Estas enzimas presentan patrones de expresión paralelos al incremento del
contenido de eugenol en el aquenio (FaEGS1) y en el receptáculo (FaEGS2) (Aragüaez et al.,
2013).
Por otro lado, se ha demostrado que la expresión de la SAAT, que codifica una enzima
alcohol-acil-transferasa de fresa, es específica de receptáculo, aumenta a lo largo de la maduración
y se expresa 16 veces más en fruto rojo que en fruto verde, lo que sugiere que cataliza los pasos
finales de la síntesis de ésteres volátiles en este fruto (Aharoni et al., 2000). SAAT cataliza la
reacción usando como receptor preferente alcoholes alifáticos de cadena media, ya que presenta
actividades insignificantes con alcoholes aromáticos o monoterpenoles. Sin embargo, en F. vesca
se ha identificado una proteína AAT (VAAT) con actividad distinta a la de SAAT. Esta enzima
presenta mayor actividad con alcoholes de cadena corta, al contrario que SAAT (Beekwilder et
al., 2004). Esta diferencia de actividad explicaría la diferente composición de volátiles en ambas
especies. Estudios posteriores han identificado otra AAT, denominada FaAAT2, con patrón de
expresión génico relacionado con la maduración del fruto (Cumplido-Laso et al., 2012). FaAAT2
presenta actividad enzimática con alcoholes de diferentes tamaños (de 1 a 8 carbonos) usando

78 Functional characterization of molecular regulatory mechanisms controlling the ripening in strawberry fruit
acetil-CoA como donante preferente. El silenciamiento transitorio mediante ARNi redujo la
producción de ésteres volátiles, sugiriendo un papel fundamental de FaAAT2 en la producción de
ésteres implicados en el aroma final del fruto (Cumplido-Laso et al., 2012).
Los ésteres producidos por las AAT son degradados por la acción de las carboxilesterasas
(CXE). Estas enzimas degradan los ésteres para formar los correspondientes alcoholes y ácidos
carboxílicos. En fresa se ha identificado una carboxilesterasa cuya expresión está relacionada con
el proceso de maduración del fruto de fresa. Su caracterización enzimática in vitro determinó que
FaCXE2 presenta mayor afinidad por ésteres de cadena larga. Además, el silenciamiento
transitorio de esta enzima mediante ARNi redujo el contenido de ésteres en el fruto e incrementó
el de ciertos alcoholes (Martínez-Rivas et al., unpublished).
Aunque no ha sido caracterizada enzimáticamente, se ha propuesto que la enzima piruvato
descarboxilasa participa en la formación del aroma a través de su papel en la fermentación
etanólica, ya que la expresión del gen está asociada al proceso de maduración y es regulada por
hormonas (Moyano et al., 2004).
Los terpenoides son otros compuestos volátiles que participan en el aroma del fruto,
pudiendo suponer hasta un 20% del total (Loughrin y Kasperbauer, 2002). Estos compuestos son
derivados de la vía del mevalonato y/o de la plastidial del 2-C-metil-D-eritritol-4-fosfato. Ambas
rutas producen geranil difosfato, precursor de monoterpenos, y farnesil difosfato, precursor de
diterpenos y carotenoides. En receptáculo, se ha identificado una nerolidol sintasa responsable de
la síntesis de mono y sesquiterpenos. Este gen es específico de receptáculo y solo se encuentra en
las variedades octoploides cultivadas y no en las silvestres, lo que explicaría que compuestos
como linalool y nerolidol se encuentren solo en las especies cultivadas (Aharoni et al., 2004).
Otra diferencia entre especies cultivadas y silvestres radica en la presencia o ausencia de genes
que codifican para una terpeno sintasa. En F. vesca, esta enzima produce -pineno que, tras la
acción de una hidrolasa, produce mirtenol. Sin embargo, en F. ananassa la ausencia de terpeno
sintasa impide estas reacciones, lo que produce cambios en el sabor de la fruta (Aharoni et al.,
2004). Esta ausencia parece deberse a una inserción en el gen que codifica la enzima aparecida,
probablemente, en algún momento del proceso de domesticación de la fresa (Aharoni et al., 2004).
El aroma del fruto es una mezcla compleja de diferentes compuestos (Tabla 5). El
recuerdo afrutado lo otorgan diferentes ésteres, como el etil-butanoato, hexil-butanoato y el metil
2-metilbutanoato, el olor a “verde” producido por Z-3-hexenal, dulce por ácido butanoico y 2-
metilbutanoico, melocotón por decalacatona y caramelo por [4-hydroxy-2,5-dimetil-3(2H)-

INTRODUCCIÓN
79 PhD Thesis Félix Juan Martínez Rivas
furanona (HDMF, furaneol)], y 2,5-dietil-4-metoxy-3(2H)-furanona (DMMF)) (Pyysalo et al.,
1979, Larsen et al., 1992). De estos, destaca el HDMF, cuya concentración aumenta a lo largo de
la maduración alcanzando la concentración más alta en fruto maduro, aunque es rápidamente
metalizado a su derivado HDMF-glucósido (Pérez et al., 1996; Roscher et al., 1998). El elevado
número de compuestos relacionados con el aroma del fruto de fresa sugiere que las enzimas
involucradas podrían ser multifuncionales, lo que evitaría un gasto extra de energía en la síntesis
de proteínas nuevas. No obstante, esto también podría ser un reflejo de la falta de especificidad
de algunas enzimas como reductasas, esterasas, oxidasas, etc., implicadas en la producción de
numerosos compuestos involucrados en el aroma del fruto.
Tabla 5. Compuestos más representativos que intervienen en el aroma del fruto de fresa
(Adaptado de Hancock, 1999).
Familia Química Compuestos representativos
Ésteres de bajo peso molecular Etil butanoato
Etil hexanoato
Hexil acetato
Isoamil acetato
Cetonas 2-Heptanona
3-Hidroxibutanoato
Terpenoides Linalool
α-Terpineol
Furanonas Furaneol
Dionas de bajo peso molecular Diacetil
Derivados bencénicos
Aldehídos insaturados
Aldehídos saturados
Alcoholes insaturados
Ésteres insaturados
Furaldehídos
Ácidos grasos volátiles
Ésteres tiólicos
Varios
Benzaldehido
t-2-Hexenal
Hexanal
t-2-Hexen-1-ol
t-2-Hexenil acetato
Furfural
2-Metiltiol acetato
Metiltiol acetato
Etil cinamato
Naftaleno
5.2.2. Metabolismo de los fenilpropanoides: aparición del color
Uno de los cambios más importantes que se producen en el fruto de fresa durante la
maduración es la transición del color verde de los estadios del inicio del desarrollo al rojo presente
en los frutos maduros. Este cambio es debido a la degradación de las clorofilas y a la consecuente
síntesis de antocianinas que se almacenan en las grandes vacuolas presentes en las células del
fruto maduro (Timberlake, 1981; Perkins-Veazie, 1995). La síntesis de antocianinas comienza en

80 Functional characterization of molecular regulatory mechanisms controlling the ripening in strawberry fruit
el estadio blanco de desarrollo y se produce a partir de fenilpropanoides y flavonoides por la vía
del ácido siquímico (Woodward, 1972, Harbone, 1973). La unión de azúcares en diferentes
posiciones a la molécula de antocianina dará lugar a los antocianos, que además pueden acetilarse
con diferentes ácidos fenólicos para dar lugar a complejos pigmentos. Así, en un fenómeno
denominado co-pigmentación, las antocianinas forman complejos con las flavononas produciendo
un efecto crómico que cubre el rango del rojo al azul (Asen et al., 1972). La antocianina que
presenta mayor concentración en fresa es la pelargonidina-3-glucósido, que puede llegar a
suponer el 90% del total (Wrolstad et al., 1970; Green, 1971; Kalt et al., 1993). También se han
encontrado, aunque en menor concentración, cianidina-3-glucósido, peonidina-3-glucósido y
malvidina-3-glucósido (Perkins-Veazie, 1995; Zhang et al., 2010). La variabilidad tanto en
concentración como en composición de las antocianinas es amplia entre las diferentes variedades
de fresa (Bakker et al., 1994). Todos estos metabolitos secundarios han adquirido importancia
debido a su capacidad de prevenir y proteger de enfermedades degenerativas, cardiovasculares,
cáncer, diabetes de tipo II y obesidad (Hannum, 2004; Seeram, 2008; Giampieri et al., 2015).
La acumulación de antocianinas es uno de los rasgos más importantes que convierte a la
fresa en un producto atractivo para el consumidor. La síntesis de los fenilpropanoides comienza
a partir del aminoácido fenilalanina, en una reacción secuencial catalizada por fenilalanina
amonio-liasa (PAL), la ácido cinámico-4-hidroxilasa (C4H) y la p-coumarato:CoA ligasa (4CL).
En estadios tempranos del desarrollo, la actividad PAL está relacionada con la síntesis de
proantocianidinas (PA) (Cheng y Breen, 1991). La concentración de antocianinas está
correlacionada con la expresión del gen FaPAL6 de manera que aquellos cultivares que presentan
mayor expresión de este gen también presentan mayor concentración de antocianinas (Pombo et
al., 2011). En esta parte inicial de la ruta, los compuestos sintetizados pueden ser usados en la
síntesis de flavonoides y/o lignina (Figura 13). Una serie de enzimas multifuncionales como son
la cinamil alcohol deshidrogenasa (CAD), la cumarílico CoA reductasa (CCR), y la peroxidasa
FaPOD27 están implicadas en la biosíntesis de monolignoles y en la lignificación del sistema
vascular, lo que repercute directamente en la firmeza de la fruta (Anterola et al., 2002; Blanco-
Portales et al., 2002; Yeh et al., 2014).
Catalizando los primeros pasos específicos de la ruta de los flavonoides se encuentran
dos enzimas ampliamente estudiadas, la chalcona sintasa (CHS) y la chalcona isomerasa (CHI)
(Figura 13). El silenciamiento de la expresión de FaCHS produce frutos con niveles reducidos de
antocianinas y flavonoides, lo que indica el papel clave de esta enzima en la maduración del fruto
(Hoffmann et al., 2006; Lunkenbein et al., 2006). El resto de enzimas implicadas en la ruta, como
son la dihidroflavonol reductasa (DFR) (Moyano et al., 1998; Hirner et al., 2001; Miosic et al.,
2014), la flavonol 3-hidroxilasa (F3H), la chalcona reductasa (CHR) (Manning, 1998), la UDP-
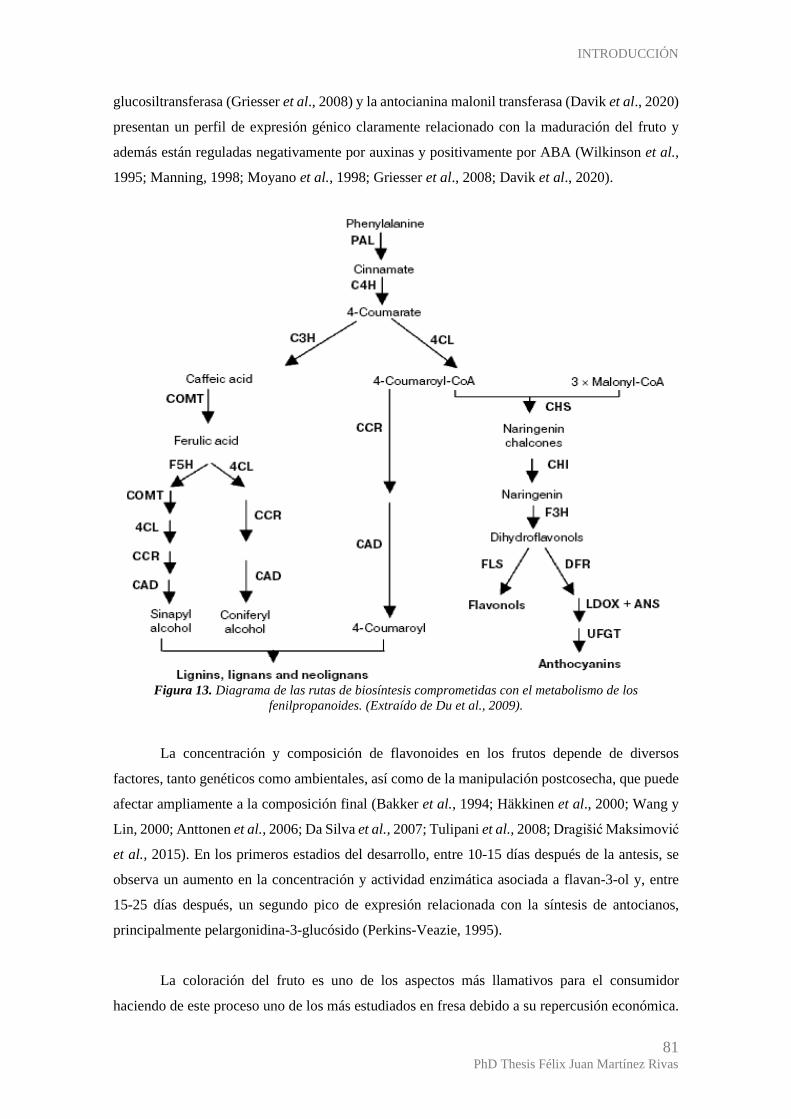
INTRODUCCIÓN
81 PhD Thesis Félix Juan Martínez Rivas
glucosiltransferasa (Griesser et al., 2008) y la antocianina malonil transferasa (Davik et al., 2020)
presentan un perfil de expresión génico claramente relacionado con la maduración del fruto y
además están reguladas negativamente por auxinas y positivamente por ABA (Wilkinson et al.,
1995; Manning, 1998; Moyano et al., 1998; Griesser et al., 2008; Davik et al., 2020).
Figura 13. Diagrama de las rutas de biosíntesis comprometidas con el metabolismo de los
fenilpropanoides. (Extraído de Du et al., 2009).
La concentración y composición de flavonoides en los frutos depende de diversos
factores, tanto genéticos como ambientales, así como de la manipulación postcosecha, que puede
afectar ampliamente a la composición final (Bakker et al., 1994; Häkkinen et al., 2000; Wang y
Lin, 2000; Anttonen et al., 2006; Da Silva et al., 2007; Tulipani et al., 2008; Dragišić Maksimović
et al., 2015). En los primeros estadios del desarrollo, entre 10-15 días después de la antesis, se
observa un aumento en la concentración y actividad enzimática asociada a flavan-3-ol y, entre
15-25 días después, un segundo pico de expresión relacionada con la síntesis de antocianos,
principalmente pelargonidina-3-glucósido (Perkins-Veazie, 1995).
La coloración del fruto es uno de los aspectos más llamativos para el consumidor
haciendo de este proceso uno de los más estudiados en fresa debido a su repercusión económica.

82 Functional characterization of molecular regulatory mechanisms controlling the ripening in strawberry fruit
La regulación del proceso de síntesis de fenilpropanoides por diversos factores de transcripción
ha sido ampliamente descrita. Dentro de los factores de transcripción que regulan el proceso de
maduración, los de tipo MYB han sido los que han recibido mayor atención. FaMYB1 y FaMYB10
codifican dos factores de transcripción de tipo MYB relacionados con la acumulación de
antocianinas en el fruto de fresa durante la maduración (Aharoni et al., 2001; Lin-Wang et al.,
2010; Salvatierra et al., 2013; Medina-Puche et al., 2014). De igual manera, FaMYB123, objeto
de estudio en esta tesis doctoral, controla la síntesis de productos finales de la ruta de las
antocianinas y fenilpropanoides (Martínez Rivas et al., unpublished). También, han sido descritos
dos factores de transcripción de tipo MADS-box, FaMADS9, perteneciente al grupo SEPALLATA
(Seymour et al., 2011), y FaSHP (SHATTERPROOF) (Daminato et al., 2013), que también
regulan procesos relacionados con la formación de color. Todos estos genes muestran un
incremento de su expresión a lo largo del desarrollo y maduración del fruto de fresa, así como
una clara regulación negativa por auxinas y positiva por ABA.
La sobreexpresión de FaMYB1 en hojas de tabaco (Aharoni et al., 2001) dio lugar a la
supresión de la síntesis de antocianinas, sugiriendo que FaMYB1 actúa como represor de la
transcripción y no como activador transcripcional. Por otra parte, el silenciamiento transitorio de
FaMYB10 en frutos de fresa mediante ARNi condujo a una reducción de la expresión de genes
implicados en la producción de antocianinas y fenilpropanoides, así como del contenido de
antocianinas en los mismos (Medina-Puche et al., 2014). Además, la expresión de FaMYB10 no
está regulada por FaMYB1 y viceversa (Medina-Puche et al., 2014). En conjunto, estos datos
indican que FaMYB10 juega un papel regulador general en la ruta de los fenilpropanoides durante
la maduración de la fresa. Debido a este papel clave que juega FaMYB10, este FT ha sido objeto
de diversos estudios funcionales. Se ha descubierto que, en variedades de frutos de color blanco,
la secuencia génica de este gen presenta una inserción de 8 nucleótidos en la parte codificante del
extremo carboxilo de la proteína, lo que genera un codón “stop” prematuro. Las variedades
blancas estudiadas, presentaban esta inserción que sintetiza una proteína incapaz de unirse a
complejos MBW, típicos en las interacciones de los FTs tipo MYB (Wang et al., 2019).
Recientemente, Zhang et al., (2020) ha descrito la capacidad de un FT de tipo RAV (Related to
ABI3/Viviparous 1) para activar la transcripción de FaMYB10 mediante la unión a su promotor.
La sobreexpresión de este FT resultó en un incremento de los niveles transcripcionales de
FaMYB10, mientras que el silenciamiento los redujo considerablemente. Esto fue además
acompañado de un incremento y disminución, respectivamente, de los niveles de antocianinas.
Estos datos demostraron que FaRAV1 estimula la acumulación de antocianinas debido a la
regulación de FaMYB10 (Zhang et al., 2020).

INTRODUCCIÓN
83 PhD Thesis Félix Juan Martínez Rivas
Otro FT de tipo MYB, FaGAMYB, ha sido identificado en fresa. Su silenciamiento
provocó un retraso en la maduración del fruto, inhibiendo la producción de color rojo. Además,
se redujo la síntesis de ABA y de sacarosa, lo cual sugiere que este FT actúa corriente arriba del
ABA en la regulación del proceso de maduración. La aplicación exógena de ABA a frutos
silenciados rescató el fenotipo rojo del fruto (Vallarino et al., 2015). Por último, el silenciamiento
estable de FaMYB123 en plantas de fresa redujo significativamente el contenido de los productos
finales de la ruta de antocianinas y fenilpropanoides, como pelargonidin-(6 malonil)-3-glucósido,
cianidin-(6 malonil)-3-glucósido y derivados malonilos de otros compuestos como el kaempferol.
Estudios de ARN-seq demostraron que las enzimas implicadas en la síntesis de estos compuestos
estaban silenciadas en los frutos transgénicos, tales como FaANS, FaUFGT y FaMalTransf. Esta
disminución está acompañada de un aumento de la expresión de genes relacionados con la síntesis
de proantocianidinas, como FaANR y FaLAR, asociados con una mayor concentración de estos
compuestos en los frutos transgénicos (Martínez-Rivas et al., unpublished).
Por otro lado, se ha demostrado que el silenciamiento de FaMADS9 también provocó una
reducción en el contenido de antocianinas totales en el fruto de fresa maduro (Seymour et al.,
2011). Por otro lado, en el cv. Camarosa, el silenciamiento de FaMADS9 no generó cambios
fenotípicos visibles que si aparecieron en el cv. Calypso (Vallarino et al., 2020). En este caso, el
silenciamiento estable de FaMADS9 produjo cambios en el contenido de ácidos grasos
relacionados con la cutícula del fruto y en la expresión de genes relacionados con este proceso
(Vallarino et al., 2020). Asimismo, el silenciamiento de FaSHP redujo la expresión de FaCHS y
de otros FTs relacionados con la síntesis de pigmentos como FaMYB1, FaMYB10 y FaMADS9,
provocando un retraso en la coloración del fruto (Daminato et al., 2015).
Se han identificado en fresa otros FTs relacionados con la biosíntesis de flavonoides: tres
de la familia de genes myb, cuatro de la familia del gen myc (bHLH) y un factor de transcripción
WD-40 (Baudry et al., 2004). Estos genes son homólogos a otros FTs implicados en la biosíntesis
de flavonoides en otras especies y muestran un patrón de expresión paralelo a la acumulación de
flavonoides durante el desarrollo del fruto de fresa (Baudry et al., 2004). En A. thaliana, la
expresión de los genes de biosíntesis de proantocianidinas es inducida específicamente por un
complejo de proteínas compuesto de AtTT2 (AtMYB123), AtTT8 (AtbHLH042) y AtTTG1
(proteína WD40). En fresa, se han identificado los genes ortólogos correspondientes y, entre los
genes candidatos aislados, cuatro eran similares a AtTT2, AtTT8 y AtTTG1 (FaMYB9 / FaMYB11,
FabHLH3 y FaTTG1, respectivamente) y dos codifican putativos reguladores negativos de la
síntesis de antocianinas (FaMYB5 y FabHLH3Δ) (Schaart et al., 2013).

84 Functional characterization of molecular regulatory mechanisms controlling the ripening in strawberry fruit
Estudios de interacción entre proteínas usando el sistema de doble híbrido de levadura
han demostrado que FabHLH3 es capaz de unirse a FaMYB9 y a FaMYB123. La interacción con
FaMYB9 activaría los genes de síntesis de proantocianidinas, mientras que al interaccionar con
FaMYB123 se inducirían la síntesis de genes de antocianinas (Schaart et al., 2013, Martínez-
Rivas et al., unpublished). Pillet et al., (2015), usando el análisis de redes de co-expresión del
transcriptoma (TCNA; transcriptome co-expression network analysis) acoplado a ensayos de
expresión transitoria en frutos de fresa, han identificado nuevos FTs candidatos (FaTCP11, PCL1-
like y FaSCL8) como posibles reguladores de nodos específicos de la vía de flavonoides. Estos
hallazgos proporcionan nuevas herramientas para modificar el contenido de proantocianidinas y
la calidad del fruto de fresa y a su vez este enfoque podría proporcionar una solución técnica para
dilucidar rutas de interés no tan bien caracterizadas hasta el momento.
5.3. Respiración
De manera general, los frutos se clasifican en climatéricos y no-climatéricos,
dependiendo del modelo de respiración que presentan durante su proceso de maduración (Figura
14).
Figura 14. Gráfica comparativa de la producción de etileno y la respiración durante la maduración de
frutos climatéricos y no climatéricos.
Los frutos climatéricos, tales como tomate, plátano, mango, manzana y aguacate,
presentan un aumento en la producción de etileno y en su actividad respiratoria al inicio de la
maduración (Seymour et al., 1993; Tucker, 1993; Adams-Phillips et al., 2004; Zaharah et al.,
2011) (Figura 14). Este aumento está acompañado de la regulación de genes relacionados con la
biosíntesis de etileno en el inicio de la maduración, lo que resulta en la producción auto catalítica
de esta hormona (Klee y Clark, 2004). Esta regulación se produce también con la aplicación de
etileno exógeno, mientras que la aplicación de etileno a frutos no climatéricos no tiene
consecuencia en el proceso de maduración. En los frutos no climatéricos como cítricos, uvas y

INTRODUCCIÓN
85 PhD Thesis Félix Juan Martínez Rivas
fresa, el aumento de etileno está relacionado con otros procesos relacionados con la maduración,
como el reblandecimiento, defensa frente a patógenos, cambios nutricionales o degradación de
clorofilas (Hobson y Grierson, 1993; Tucker, 1993; Alexander y Grierson, 2002; Giovannoni,
2004). De hecho, se ha observado un pico de etileno antes del envero de la uva, por lo que se
sugiere que esta hormona puede jugar también un papel durante el desarrollo de las bayas
(Chervin et al., 2004). En fresa, en contraste con los frutos climatéricos, la regulación hormonal
del proceso de maduración está relacionada con el balance entre auxinas y ABA (Jia et al., 2011;
Li et al., 2011; Symons et al., 2012).
Por consiguiente, y teniendo en cuenta el modelo de respiración de cada fruto, se podrían
incluir en alguno de estos tres perfiles (Iwata et al., 1969a; 1969b):
- Frutos en los que la respiración desciende gradualmente durante la maduración, como en el caso
de la naranja.
- Frutos en los que los índices de respiración aumentan continuamente hasta la maduración
completa, incluso despues del pico de respiración típico de frutos climatéricos, como en el caso
del tomate.
- Frutos en los que la respiración es máxima en la transición entre los estadios maduros a sobre-
maduros, como en el caso de la fresa.
La respiración climatérica aporta energía metabólica adicional, sin embargo, en fresa la
maduración no presenta un requerimiento aparente de energía. No obstante, sí se ha descrito un
aumento de la actividad ATPasa de hasta 3 veces entre los estadios verde y rojo, lo que podría
estar relacionado con un aumento del requerimiento energético necesario para los procesos de
transporte que aparecen en esta fase (Ben-Arie y Faust, 1980).
5.4. Choque oxidativo
Estudios transcriptómicos realizados entre diferentes estadios de maduración de la fresa
muestran un incremento de la expresión de genes relacionados con la respuesta a estrés oxidativo
(Aharoni et al., 2002a). De hecho, se propone que la inducción de genes relacionados con el
proceso de maduración en este fruto puede deberse en parte por el estrés oxidativo generado
durante la lignificación de sus haces vasculares (Aharoni et al., 2002a). En frutos como el tomate,
la maduración conlleva un aumento de procesos oxidativos como la producción de peróxido de
hidrógeno, la peroxidación de lípidos y la oxidación de proteínas (Jiménez et al., 2002); mientras
que en otros frutos se incrementa la expresión de proteínas antioxidantes y enzimas relacionadas
con la detoxificación de especies reactivas de oxígeno (ROS), lo que apoya que durante este

86 Functional characterization of molecular regulatory mechanisms controlling the ripening in strawberry fruit
proceso se requiere un equilibrio entre la producción y eliminación de ROS (Fonseca et al., 2004;
Moyle et al., 2005).
En fresa, se ha identificado un aumento en la concentración del anión superóxido a lo
largo de la maduración (López-Ráez et al., 2003). Así, se ha identificado una UDP-
glucosa:cinamato glucosiltransferasa (FaGT2) implicada en el metabolismo de compuestos
naturales y xenobióticos en F. ananassa. Esta enzima participa en la detoxificación de compuestos
xenobióticos producidos en condiciones de estrés oxidativo (Landmann et al., 2007). Además, la
expresión de FaGAST2 aumenta con el tratamiento con peróxido de hidrógeno y por la infección
con hongos, lo que sugiere un papel directo de esta proteína en la eliminación de ROS durante el
crecimiento y maduración del fruto y durante la interacción con hongos (Moyano-Cañete et al.,
2013).
6. Control de la floración
Las especies del género Fragaria presentan una respuesta floral variable según la
temperatura y el número de horas de sol lo que se traduce en la existencia de cultivares de día
corto, largo y de fotoperiodo insensible o día neutro (Heide y Sønsteby, 2007). Las hormonas
como las auxinas y citoquininas juegan un papel importante en el control de la floración (Hou y
Huang, 2005; Eshghi y Tafazoli, 2007). Es probable que las auxinas producidas en hojas jóvenes
se transporten a los meristemos apicales regulando su diferenciación a meristemos florales. Esta
teoría se apoya en la existencia e identificación de una proteína de unión a auxina (FaABP1) en
meristemos de plantas de fresa (Lazarus y MacDonald, 1996).
En oposición a las plantas de F. vesca de día corto y floración estacional, existen
variedades de floración perpetua (F. vesca f. semperflorens) que dan flores y frutos desde
comienzos del verano hasta finales del otoño (Brown y Wareing, 1965). Se ha comprobado que
estas variedades de floración perpetua presentan respuestas medioambientales opuestas en
comparación con las plantas de día corto. Dichas variedades son plantas de día largo que florecen
rápidamente bajo fotoperiodos largos y altas temperaturas, en contraposición a las plantas de día
corto que generalmente reprimen la floración bajo tales condiciones (Sønsteby y Heide, 2008;
Mouhu et al., 2009). Estudios genéticos clásicos demostraron que la floración perpetua es causada
por los alelos recesivos de un único gen represor llamado seasonal flowering locus (SFL) (Brown
y Wareing, 1965; Albani et al., 2004). Los cultivares de floración perpetua (a menudo llamados
remontantes, de día neutro o “everbearing”) están también representados en la fresa cultivada.
Estos cultivares han sido considerados cultivares de día neutro o plantas de día largo dependientes

INTRODUCCIÓN
87 PhD Thesis Félix Juan Martínez Rivas
de la temperatura (Sønsteby y Heide, 2007; Weebadde et al., 2008; Bradford et al., 2010; Stewart
y Folta, 2010).
Estudios de genética clásica han revelado que la capacidad de generar flores durante todo
el año está bajo el control de un único locus, FaPFRU (Gaston et al., 2013). Este locus no es
ortólogo de los locus que controlan la floración en la especie diploide F. vesca, lo que sugiere que
existen diferencias significativas en el control de la floración entre ambas especies. La presencia
del locus FaPFRU se correlaciona positivamente con la floración y negativamente con la
producción de estolones, lo que indica que la diferenciación del meristemo en uno u otro sentido
tiene un control fisiológico común. Mediante el estudio de marcadores que cosegregan con
FaFPRU y, por lo tanto, con la producción continua de flores, se ha podido identificar la región
específica del genoma que contiene este QTL (Perrote et al., 2016a). Esta región posee 1108 kb
y 234 genes. El estudio pormenorizado de estos genes ha identificado a flowering locus T (FT1)
como principal regulador de la floración permanente. Los genes de tipo flowering locus T
codifican una proteína de unión a fosfatidiletanolamina, considerada una proteína clave en la
regulación de la floración. De hecho, es la unión de flowering locus T o de terminal flower 1
(TFL1) al factor de transcripción FD, lo que estimulará la expresión de genes que determinarán
la identidad final del meristemo (Figura 15) (Wickland y Hanzawa, 2015).
Figura 15. Resumen del control de la floración entre TFL1-FT1. Extraído de Perrote et al., (2016b).

88 Functional characterization of molecular regulatory mechanisms controlling the ripening in strawberry fruit
TFL1 ha sido identificado en F. vesca como el gen responsable del SEASONAL
FLOWERING LOCUS (SFL), un locus involucrado en el control de la floración. Una deleción de
2 pb en este gen está asociada al fenotipo de floración perpetua en F. vesca (Iwata et al., 2012).
Además, el silenciamiento mediante ARNi de FvTFL1 produjo plantas con floración permanente
demostrando el papel fundamental de este gen en la floración (Koskela et al., 2012). Así, los
resultados obtenidos indicaron que FvTFL1 es el componente clave de la ruta fotoperiódica
perenne de F. vesca que confiere el requisito de día corto para la floración y el control cíclico
entre las fases de reproducción asexual y sexual. Resultados similares se observaron en especies
cultivadas de fresa, donde el silenciamiento de FaTFL1 consiguió eliminar la dependencia
lumínica de la floración sin afectar al número de estolones producidos. Esto demuestra que
FaTFL1 actúa como un represor de la floración sin afectar la reproducción vegetativa (Koskela
et al., 2016).
En plantas donde la reproducción puede llevarse a cabo de manera sexual o asexual, el
meristemo axilar está indiferenciado y puede producir bien un estolón o un ramillete floral.
Recientemente, se ha identificado una enzima de la familia GA20ox (oxidasa 20 de giberelina)
cuya expresión decide el destino del meristemo. Así, la forma activa de la enzima producirá
estolones mientras que la forma inactiva derivará en flores. Su expresión es específica del
meristemo axilar se correlaciona con la capacidad de producir estolones en la especie F. vesca.
Este estudio también demuestra que las giberelinas sintetizadas en el propio meristemo son las
que determinan su destino y no son importadas desde otros tejidos (Teneira et al., 2017). Otro gen
importante en el proceso de floración es AGAMOUS (AG). Este gen está relacionado con el
desarrollo del meristemo, la formación de estambres y la iniciación del carpelo (Battey y Tooke,
2002). En fresa, la expresión de FaAG1 está limitada a estambres, carpelos y frutos en desarrollo,
en consonancia con su papel regulador del desarrollo de los órganos florales (Rosin et al., 2003).
7. Regulación hormonal del desarrollo y maduración del fruto de fresa
Las concentraciones hormonales varían ampliamente en los procesos de desarrollo y
maduración de múltiples frutos y son estas variaciones las que determinan su programa de
desarrollo y maduración (Figura 16). Diferentes estudios han demostrado que durante la
formación del fruto de fresa se incrementa la concentración de auxinas, citoquininas, gibelinas y
brasinoesteroides. Auxinas, giberelinas y brasinoesteroides están relacionados con la regulación
del crecimiento, mientras que para desencadenar la maduración se necesita una inhibición del
transporte de auxinas desde los aquenios y un aumento de ABA en el fruto. Esta regulación
hormonal en fresa es objeto de intensas investigaciones. De hecho, debido a la estructura del fruto,

INTRODUCCIÓN
89 PhD Thesis Félix Juan Martínez Rivas
con los aquenios dispuestos en el exterior del receptáculo, se puede estudiar fácilmente su papel
en el desarrollo ya que se pueden eliminar causando poco daño al resto del fruto.
Figura 16. A. Cambios hormonales que suceden en un fruto genérico durante el desarrollo y
maduración. B. Espectro de dependencia al ABA y etileno durante el proceso de maduración.
(Extraído de McAtee et al., 2013).
7.1. Auxinas
En los primeros estadios del desarrollo del fruto, la auxina ácido 3-indol acético (IAA) se
sintetiza en los aquenios y posteriormente se exporta al receptáculo (Nitsch, 1950). La forma libre
de IAA, considerada como la forma activa, es mayoritaria en el aquenio mientras que la forma
IAA conjugada con algún tipo de amida es la mayoritaria en el receptáculo (Archbold y Dennis,
1984; Park et al., 2006). Además, se ha descrito que los niveles de IAA conjugado presentan una
distribución bimodal, con un pico de concentración en el receptáculo a los 11 días tras la antesis
seguido de un descenso y una posterior acumulación en los últimos estadios de maduración del
fruto (Archbold y Dennis, 1984). Recientemente, se han encontrado genes codificantes para
enzimas aminotransferasas de triptófano (FaTAA1 y FaTAR2), precursor de la síntesis de
auxinas, que presentan alta expresión en estadio rojo. Por otra parte, el estudió del perfil de

90 Functional characterization of molecular regulatory mechanisms controlling the ripening in strawberry fruit
expresión de genes de transporte de auxinas indicó que FaTIR1 tiene un pico de expresión en el
estadio rojo, lo que sugiere un papel clave de las auxinas en el proceso de maduración de este
estadio del fruto (Estrada-Johnson et al., 2019).
Las auxinas inhiben la maduración en un gran número de frutos no climatéricos (Trainotti
et al., 2005). En fresa, a medida que el fruto se desarrolla, las auxinas disminuyen su
concentración hasta un nivel que permite desencadenar el proceso de maduración (Manning,
1993; Symons et al., 2012). Así, las auxinas estimulan la elongación del fruto mientras reprimen
la maduración. Diversos estudios han demostrado que la retirada de los aquenios estimula la
maduración, mientras que el tratamiento exógeno con auxinas sintéticas lo ralentizan (Given et
al., 1993; Manning, 1993). Este comportamiento es común en otros frutos no climatéricos como
uva, donde la aplicación de auxinas sintéticas retrasa la maduración e inhibe el incremento de los
niveles de ABA, sugiriendo que el balance de ambas hormonas controla también el proceso de
maduración en uva (Davies et al., 1997).
Múltiples enzimas y factores de transcripción involucrados en los procesos metabólicos
propios de la maduración o en su control ven inducida su expresión en frutos verdes al retirar los
aquenios, mostrando así una regulación negativa por auxinas. Por ejemplo, enzimas relacionadas
con la síntesis de antocianinas como dihidroflavonol reductasa (FaDFR) (Moyano et al., 1998) o
FaCHS, FaCHI, FaANS (Almeida et al., 2007), relacionadas con la degradación de la pared
celular, como pectato liasas (Fapl) (Medina-Escobar et al., 1997b; Benítez-Burraco et al.,2003),
endoglucanasas (FaEGs) (Harpster et al., 1998; Manning, 1998; Llop-Tous et al., 1999; Trainotti
et al., 1999; Woolley et al., 2001; Spolaore et al., 2003; Palomer et al., 2006), y FaRGLyase1
(Molina-Hidalgo et al., 2013) y genes implicados en otros procesos como Famyb2, FaQR,
FaHyPRP, Fapmsr (Blanco-Portales et al., 2003; López-Ráez et al., 2003; López et al., 2006,
Lunkenbein et al., 2006; Raab et al., 2006). Sin embargo, hay genes relacionados con la
maduración que no están afectados por auxinas, como FaExp2 y FaGAST2, relacionados con la
determinación del tamaño de las células durante el desarrollo y maduración del fruto (Aharoni et
al., 2002b; Moyano-Cañete et al., 2013).
7.2. Giberelinas y citoquininas
Aunque las auxinas son las hormonas que dominan el proceso de crecimiento y desarrollo
de la fresa, sus efectos pueden ser modulados por otras fitohormonas presentes también en el fruto
(Lis et al., 1978). Las giberelinas (GAs) son compuestos tetracíclicos diterpenoides implicados
en la regulación de procesos de desarrollo que tienen lugar durante el ciclo de vida de la planta,
tales como germinación de semillas, división y elongación celular, inducción floral y desarrollo
y crecimiento del fruto (Pharis y King, 1985; Serrani et al., 2007). Más de 100 GAs diferentes
han sido identificadas en plantas sin embargo, sólo unas pocas de ellas son biológicamente activas

INTRODUCCIÓN
91 PhD Thesis Félix Juan Martínez Rivas
(GA1, GA3 y GA4) (Olszewski et al., 2002). La actividad máxima de citoquininas y giberelinas
ha sido detectada 7 días después de la antesis, concentrándose principalmente en aquenios.
Transcurrido este tiempo, la concentración de citoquininas disminuye en aquenios y receptáculos
manteniendo niveles basales hasta que el fruto está maduro (Lis et al., 1978).
Aunque se ha sugerido un papel importante de las GAs en el desarrollo del receptáculo
del fruto de fresa, detectando niveles extremadamente altos de GA4 (Csukasi et al., 2011), la
aplicación externa de giberelina GA3 no estimula el crecimiento del fruto cuando se aplica a frutos
a los que se les han retirado los aquenios (Archbold y Dennis, 1984). De igual manera, la
aplicación de kinetina no induce crecimiento en tejidos vegetativos de fresa ni aplicada a frutos
(Lis y Antoszewski, 1979). Esto apoya la teoría de que las auxinas son las hormonas que controlan
el proceso de crecimiento aunque su efecto pueda ser modulado finamente por la acción de otras
hormonas. De hecho, se ha comprobado que tanto GAs como citoquininas pueden actuar de forma
sinérgica con la auxina 1-naftalenacetamida (1-NAAm) en frutos cultivados in vitro promoviendo
o suprimiendo su crecimiento y maduración respectivamente (Kano y Asahira, 1978).
La aplicación de GA3 a frutos inmaduros provoca un significativo retraso en el desarrollo
del color rojo característico de los frutos de fresa, probablemente como resultado de un retraso en
el incremento de expresión de la enzima PAL, clorofilasa y actividades peroxidasas (Martínez et
al., 1996). Por otra parte, dicha aplicación induce la expresión de genes como FaGAST, que
codifica para una proteína implicada en la elongación celular y el tamaño final del fruto (de la
Fuente et al., 2006), y FaXyl, que codifica para una β-xilosidasa (Bustamante et al., 2009).
Recientemente, se ha demostrado un nuevo papel de las GAs en la regulación de la maduración
del fruto de fresa. Así, la presencia de GA junto con auxinas inhibe la formación de ABA en el
receptáculo por dos vías, mediante la inhibición de las enzimas necesarias para su síntesis, como
FaNCED, y mediante la sobreexpresión de aquellas relacionadas con su degradación como
FaCYP707A4a. De esta manera, se sugiere que es necesario que tanto GAs como auxinas
disminuyan su concentración para promover la síntesis de ABA y desencadenar la maduración
del fruto (Liao et al., 2018).
Aparte del papel que puedan desempeñar en el fruto, se ha propuesto que las GAs podrían
controlar la inducción de la división celular en los tejidos subapicales de las yemas axilares y
actuar como una señal para determinar el destino del meristemo. Además, también se ha
observado que las GAs parecen intervenir en la diferenciación de las yemas axilares reguladas
por el fotoperíodo (Hytönen et al., 2009).

92 Functional characterization of molecular regulatory mechanisms controlling the ripening in strawberry fruit
Por otra parte, se ha considerado que el efecto de la temperatura en el desarrollo de los
aquenios podría estar relacionado con la actividad de las citoquininas sintetizadas en éstos. De
esta forma, la maduración de los frutos que crecen a temperaturas bajas estaría retrasada debido
a la alta concentración de citoquininas presente en los aquenios y por un desarrollo ralentizado de
los mismos (Kano y Asahira, 1979). Además, se ha demostrado que las variaciones de
concentración de las citoquininas durante la inducción floral son importantes para la floración en
plantas de fresa (Eshghi y Tafazoli, 2007). Yamasaki y Yamashita (1993) estudiaron los cambios
en la concentración de citoquininas endógenas en la corona de flores de fresa inducidas en
condiciones de noche fría y día corto. Observaron que un incremento del nivel de zeatina y una
reducción de la zeatina ribósido justo antes de la iniciación floral y un incremento específico de
ribósido zeatina justo después de dicha iniciación, producía la inducción de flores. Estos
resultados sugieren que la ribósido zeatina y zeatina juegan un papel importante en la iniciación
y el desarrollo floral (Yamasaki y Yamashita, 1993).
7.3. Ácido abscísico
El ácido abscísico (ABA) es una fitohormona relacionada con el crecimiento y desarrollo
de las plantas. Aparte de su papel primordial en el control de la maduración del fruto de fresa, en
otras especies vegetales se ha descrito su participación en el proceso de maduración de la semilla,
en la adquisición de tolerancia a la senescencia y en la dormancia de los meristemos. Además,
durante el crecimiento vegetativo, el ABA es la hormona clave en las respuestas fisiológicas que
confieren tolerancia al estrés hídrico (sequía) y osmótico (altos niveles de salinidad) (Mishra et
al., 2006), permitiendo que las plantas puedan colonizar nichos ecológicos donde la
disponibilidad de agua está limitada o es esporádica. De hecho, se ha comprobado en varias
especies de plantas que la concentración endógena de ABA incrementa más de 10 veces a pocas
horas de producirse situaciones de estrés hídrico y que decrece a sus niveles basales con la
posterior rehidratación de la planta (Gómez-Cadenas et al., 1996). El incremento de ABA en
situaciones de estrés hídrico promueve el cierre de los estomas e inhibe su apertura, lo que es vital
para evitar la pérdida de agua y el mantenimiento del estado de hidratación de la planta (Mishra
et al., 2006). Con el problema medioambiental de escasez de agua que se prevé para el siglo XXI,
la modificación de la biosíntesis y del proceso de captación de ABA se presenta como un objetivo
de estudio de gran interés para potenciar la resistencia de los cultivos a la sequía (Shinozaki y
Yamaguchi-Shinozaki, 2007; Leng et al., 2014). Además, el ABA controla ciertas funciones
fisiológicas o de desarrollo en situaciones normales de la planta. Así, se ha descrito que las plantas
deficientes en ABA muestran un fenotipo anormal, incluso en condiciones de buen riego
(Wasilewska et al., 2008). Paralelamente, estudios recientes han revelado que esta hormona es
también activa en respuesta a estreses bióticos dependientes de patógenos (Fan et al., 2009; Lim
y Lee, 2015).

INTRODUCCIÓN
93 PhD Thesis Félix Juan Martínez Rivas
En fresa, se ha observado que el ABA se acumula tanto en aquenios como en receptáculo
a los 20 días postantesis (Archbold y Dennis, 1984; Symons et al., 2012). Este aumento es
coincidente con el descenso del nivel de IAA en ambos tejidos, por lo que se propone que la
relación ABA/IAA es suficiente para dirigir el cambio genético que ocurre durante la transición
de la fase de elongación a la de maduración del fruto (Perkins-Veazie et al., 1995). Además, se
ha comprobado que la aplicación de ABA exógeno acelera la maduración en receptáculos
cultivados in vitro (Kano y Asahira, 1981), y también parece adelantar la maduración en frutos in
vivo (Jia et al., 2011).
Diversos experimentos validan la hipótesis de que el ABA juega un papel crucial en la
regulación de la maduración. La aplicación exógena promueve la maduración del fruto, mientras
que la aplicación del ácido nordihidroguaiaretico (NDGA) la retrasó (Jia et al., 2011). Además,
el silenciamiento del gen FaNCED1, clave en la biosíntesis de ABA, redujo la concentración de
ABA y produjo frutos con un retraso evidente de la maduración, fenotipo que se revertió tras la
aplicación posterior de ABA exógeno (Jia et al., 2011). De igual manera, la sobreexpresión de la
primera enzima de la ruta de biodegradación de esta hormona, FvCYP707A4a, redujo los niveles
de ABA en el fruto que condujo a un retraso de la maduración en frutos transgénicos. Estos datos
revelan la necesidad de ABA para desencadenar este proceso (Liao et al., 2018).
7.4. Etileno
La concentración de etileno es muy baja en el fruto de fresa y su aplicación exógena no
acelera la maduración ni induce la producción autocatalítica de esta hormona. Solo altas dosis de
etileno incrementan ligeramente la tasa respiratoria del fruto (Sas et al., 1992; Villareal et al.,
2009). Durante el desarrollo del fruto, el etileno incrementa su concentración en el estadio verde,
descendiendo ligeramente y volviendo a aumentar una vez se alcanza el día 20 tras la antesis.
Posteriormente, vuelve a producirse un aumento de la concentración, que alcanza su máximo con
el estadio rojo de maduración (Perkins-Veazie et al., 1995). El descenso de la concentración de
etileno al comienzo de la maduración puede estar debido a la compartimentalización del 1-
aminociclopropano-1-ácido carboxilico (ACC), precursor del etileno, o al descenso de la
actividad ACC sintasa o ACC oxidasa (ACO), claves en la síntesis de la hormona (Perkins-Veazie
et al., 1995). Esta última hipótesis es la que más posibilidades tienes debido a que el gen FaACO1
presenta un patrón de expresión coincidente con la acumulación de etileno durante la maduración
(Trainotti et al., 2005).
La aplicación exógena de etileno acelera el proceso de senescencia del fruto mientras que
el inhibidor del receptor, 1-metilciclopropeno, mantiene la firmeza y reduce la acumulación de

94 Functional characterization of molecular regulatory mechanisms controlling the ripening in strawberry fruit
antocianinas y compuestos fenólicos en postcosecha (El-Kazzaz et al., 1983; Jiang et al., 2001;
Villareal et al., 2010). Por otro lado, en frutos postcosecha, el tratamiento con etileno ha
producido diversos resultados dependiendo de la concentración de etileno aportada. Así,
concentraciones muy altas (100 µl/L) no tuvieron efectos significativos en la fruta (Terry et al.,
2007), mientras que concentraciones inferiores a 1 µl/L promovieron su reblandecimiento (Willis
y Kim., 1995). Además, el tratamiento con una concentración media de 50 µl/L produjo un
aumento de ABA que ayudó a mantener la concentración de compuestos fenólicos y redujo la
pérdida de peso fresco (Tosetti et al., 2020). Se ha propuesto que la pequeña cantidad de etileno
producida durante el proceso de maduración de la fresa podría ser suficiente para desencadenar
algunos de los procesos fisiológicos relacionados con la maduración de este fruto (Trainotti et al.,
2005; Villarreal et al., 2010; Merchante et al., 2013).
Aunque la aplicación de etileno no tiene un efecto obvio sobre la maduración, sí que
afecta a la expresión de diferentes genes relacionados con este proceso. La aplicación de etileno
provoca la represión de diferentes genes relacionados con el reblandecimiento del fruto, como β-
galactosidasa, pectin metilesterasa y β-xilosidasa y, consecuentemente, la reducción de la
actividad enzimática de las enzimas que codifican (Trainotti et al., 2001; Castillejo et al., 2004;
Bustamante et al., 2009; Villareal et al., 2010). Sin embargo, no actúa de forma generalizada
sobre la expresión de los genes relacionados con la pared, ya que no altera la expresión de otros
como la expansina, FaEXP2 (Civello et al., 1999).
Se han identificado tres receptores de etileno en fresa, FaETR1, FaETR2 y FaERS1, cuya
expresión es inducida por la aplicación de etileno al fruto (Trainotti et al., 2005). Se ha
sobreexpresado ectópicamente el receptor de etileno etr1-1 de A. thaliana, lo que reprimió la
expresión de los receptores de fresa. Sin embargo, se observaron cambios en la expresión de genes
relacionados con la pared celular y, más concretamente, con las pectinas. Se encontró inducida la
expresión de FaPE1 mientras que se reprimió FaPLa y FaPG2, pero no FaPG1, indicando que
el etileno no afecta de forma similar a todas las enzimas relacionadas con la pared. Esto explicaría
por qué el etileno no afecta a la dureza del fruto (Merchante et al., 2013). Por otro lado, el
descenso de la percepción de etileno redujo el contenido de ácidos tricarboxílicos (cítrico,
succínico y málico) en estadio blanco y de los principales azúcares en el estadio rojo (Merchante
et al., 2013). También, se encontró una disminución en la expresión de FaOMT relacionada con
la síntesis de mesifuranona, lo que se puede asociar con una reducción de la producción de este
compuesto (Zorrilla-Fontanesi et al., 2012).

INTRODUCCIÓN
95 PhD Thesis Félix Juan Martínez Rivas
7.5. Brasinoesteroides
Los brasinoesteroides (BRs) son un grupo de hormonas vegetales esteroideas necesarios
para el desarrollo normal de las plantas (Davies, 2004). En uva, se ha encontrado un aumento
drástico de su concentración al comienzo de la maduración. Además, el tratamiento exógeno con
BR promovió la maduración mientras que el tratamiento con inhibidores de la biosíntesis la
retrasó (Symons et al., 2006). Estos resultados indican que los niveles de BRs tienen un claro
papel sobre el control de la maduración en frutos no climatéricos. En frutos climatéricos como en
tomate, el tratamiento con BRs en frutos insensibles a etileno rescató el fenotipo e incrementó su
contenido de carotenoides (Liu et al., 2014).
En fresa, los niveles de BRs más altos se encuentran en flores, siendo la catasterona el
BR que presenta mayor concentración. Estos niveles disminuyen durante el desarrollo del fruto
alcanzando niveles muy bajos en el estadio rojo (Symons et al., 2012). Recientemente, se ha
descrito el perfil transcripcional de un receptor de BR, FaBR1. Este presenta máxima expresión
en los primeros estadios del desarrollo, coincidiendo con la mayor concentración de esta hormona,
y una ligera reducción en el estadio rojo y en el proceso de maduración. Aun así, el silenciamiento
mediante ARNi del receptor inhibió la maduración del fruto generando frutos de color blanco, lo
que sugiere un papel clave de esta hormona en la maduración del fruto. Este fenotipo fue apoyado
por el retraso de la maduración provocado con inhibidores competitivos de los receptores de BR
(Chai et al., 2013).
8. Control epigenético de la maduración
Los cambios en la metilación del ADN han sido relacionados con el control de la
maduración en diversos frutos. En eucariotas, la metilación del ADN se define como la adición
de grupos metilo en el residuo carboxilo-5 de la citosina, lo que genera 5-metil-citosina. En
plantas, la metilación puede ocurrir en tres contextos diferentes, CG, CHG o CHH, donde H es
cualquier base menos G. En los contextos simétricos, CG y CHG la metilación es mantenida por
las ADN metiltransferasas, siendo las variantes MET 1 y 2 las responsables del contexto CG y
las cromometilasas (CMT3), mediante su unión a kryptonite (KYP) y SUVH5/6 las encargadas
del contexto CHG (Woo et al., 2008; Du et al., 2014). La metilación de novo del ADN así como
la metilación en el contexto asimétrico CHH, requiere de un complejo sistema compuesto por los
modificadores del nucleosoma DRD1 y DDM1, un pequeño ARN guía de 24 nt y la
metiltransfersasa domains rearrenged methyltransferase (DRM2) (Matzke y Mosher, 2014). Este
mecanismo, conocido como RNA directed DNA methylation (RdDM), es especialmente activo en
la metilación de transposones, así como en repeticiones en los promotores, intrones o regiones
codificantes de genes (Matzke y Mosher, 2014).

96 Functional characterization of molecular regulatory mechanisms controlling the ripening in strawberry fruit
La metilación del ADN es eliminada bien cuando la metilación activa no es funcional o
cuando es retirada activamente por la acción de las ADN-demetilasas. Estas enzimas catalizan la
eliminación de las citosinas metiladas que son sustituídas por citosinas no metiladas en el ADN.
En plantas, demeter, demeter-like y repressor of silening (DML, DML-like, ROS1), son las
encargadas de retirar las citosinas metiladas (Choi et al., 2002). Además, se ha descrito que el
nivel final de metilación en el ADN está determinado por la acción coordinada de las ADN
metiltransferasas y demetilasas, donde la expresión de ROS1 puede estar determinada por el nivel
de metilación de su promotor (Williams et al., 2015).
Los mayores avances en el control de la maduración por marcas epigenéticas han sido
realizados en tomate. En un primer momento, se determinó que el grado de metilación es menor
en los frutos maduros que en frutos verdes (Hadfield et al., 1993). Posteriormente, el estudio del
gen Cnr (colorless non ripening, cuyo silenciamiento produce frutos que se mantienen firmes y
no acumulan carotenoides, determinó que no existían diferencias en la secuencia génica. Sin
embargo, se encontró una región altamente metilada en el promotor del gen y que solo se
encontraba en los mutantes inmaduros (Manning et al., 2006). Estos cambios de metilación en el
promotor son suficientes para producir el silenciamiento del gen. Posteriormente, se estudiaron
los cambios epigenéticos globales durante la maduración del fruto de tomate, observando una
pérdida del 30% de metilación en el fruto rojo frente al verde que afectaba a genes claramente
relacionados con el proceso de maduración, tanto en la biosíntesis de etileno como en su
percepción (Teyssier et al., 2008; Zhong et al., 2013). En este caso, es la demetilación de dichos
genes la que induce su expresión debido al silenciamiento de una ADN demetilasa (SlDML2).
Así, este gen, que presenta su pico de expresión durante la maduración, retrasó la maduración del
fruto (Liu et al., 2015). De igual manera, haciendo uso de un compuesto químico, la 5-azacitidina
(5-AZA), adelantó la maduración del fruto (Zhong et al., 2013).
La 5-AZA es un análogo de la citosina que es metabolizado a 5-aza-2’deoxicitidina-
trifosfato e incorporado a la cadena de ADN durante su replicación. Las bases 5-AZA presentan
un átomo de nitrógeno en la posición 5 del anillo pirimidínico. De esta manera, 5-AZA se une
covalentemente a las ADN metiltransferasas en el momento en el que estas tratan de añadirle el
grupo metilo. Esta unión es reconocida por la maquinaria celular que degrada las enzimas
resultando en una pérdida de la metilación del ADN (Veselý and Čihák, 1978; Santi et al., 1984;
Stresemann and Lyko, 2008). Este compuesto ha sido ampliamente usado como agente
demetilante para estudiar el papel de la metilación génica en el proceso de maduración. La
aplicación de este compuesto adelantó la maduración en tomate, manzanas, melocotones y uvas
(Ma et al., 2018; Guo et al., 2019; Zhu et al., 2020). En melocotón y manzana, el adelanto de la

INTRODUCCIÓN
97 PhD Thesis Félix Juan Martínez Rivas
maduración al tratar con 5-AZA se han relacionado con la demetilación en el promotor del gen
MYB10, lo que activa su transcripción y dispara el proceso de maduración.
En fresa, inicialmente se ha descrito un adelanto de la maduración tras la aplicación de 5-
AZA aunque aún no existen pruebas funcionales de este adelanto (Zhong et al., 2013). No
obstante, en este trabajo se ha demostrado que la inyección del compuesto a frutos de fresa en
estadio verde retrasa el proceso de maduración, mantiene a los frutos inmaduros mientras dura el
tratamiento y restituye el proceso cuando la aplicación del compuesto cesa. No sólo paraliza el
proceso de maduración a nivel de la biosíntesis de color, sino que otros genes relacionados con la
degradación de la pared celular y/o la biosíntesis de aromas también fueron silenciados (Martinez-
Rivas et al., unpublished). Además, el estudio metabolómico de los frutos tratados con 5-AZA
mostró la acumulación de metabolitos característicos de los estadios verdes de desarrollo en la
zona tratada y un desequilibrio en el contenido hormonal. Por lo tanto, es posible que la metilación
de ciertos genes sea necesaria para desencadenar el proceso de maduración en el fruto de fresa.
9. Expresión génica durante el desarrollo y la maduración del fruto de fresa
El desarrollo de las denominadas tecnologías ómicas ha permitido que el número de
trabajos centrados en la determinación e identificación de genes diferencialmente expresados
aumenten en los últimos años. Desde la aparición de los primeros estudios, en los que se
estudiaban poblaciones de ARNm en estadios blanco y rojo de maduración (Manning, 1993),
hasta estudios más avanzados con el uso de plataformas de microarray (Medina Puche et al.,
2016) o ARN-seq (Sanchez Sevilla et al., 2017), se ha generado una gran colección de datos
transcriptómicos que nos permite el acceso a gran información acerca del proceso de desarrollo y
maduración del fruto de fresa. De igual manera, se ha desarrollado una base de datos que permite
identificar la expresión de un transcrito en diferentes tejidos vegetativos de la planta y en
receptáculo (http://mb3.towson.edu/efp/cgi-bin/efpWeb.cgi).
A lo largo del desarrollo y maduración del fruto, se describen tres modelos de evolución
de transcritos. El primer grupo se compone de ARNm que aumenta su concentración a lo largo
de la maduración, un segundo grupo que disminuye su concentración a lo largo del proceso y un
tercero que presentan un pico en el estadio intermedio para declinar en estadio rojo (Veluthambi
y Poovaiah, 1984; Reddy et al., 1990; Reddy y Poovaiah, 1990; Manning, 1994). Estos modelos
de expresión indican que el proceso de maduración de la fresa incluye tanto la desaparición de
polipéptidos existentes en los estadios de elongación del fruto, como la síntesis de nuevas
proteínas relacionadas con los procesos específicos de maduración. Enzimas relacionadas con la
degradación de la pared celular (Civello et al., 1995), producción de antocianinas (Given et al.,

98 Functional characterization of molecular regulatory mechanisms controlling the ripening in strawberry fruit
1988a), y metabolismo de la sacarosa (Hubbard et al., 1991) aumentan su actividad durante la
maduración del fruto.
También, se ha realizado otra aproximación molecular a través de proteómica cuantitativa
mediante el marcaje de péptidos por dimetilación con isótopos estables (Li et al., 2013). Entre las
proteínas cuantificadas se observó un incremento de proteínas relacionadas con la biosíntesis de
flavonoides, antocianinas y volátiles, relacionadas con el metabolismo antioxidante, proteínas de
respuesta a estrés y formación de alérgenos a lo largo de la maduración (Li et al., 2013). Por otro
lado, las proteínas que disminuyeron a lo largo de la maduración fueron aquellas responsables del
metabolismo de la metionina, estado redox, metabolismo energético y síntesis de proteínas (Li et
al., 2013). Los resultados obtenidos de este trabajo no sólo muestran que la maduración del fruto
de fresa es un sistema altamente complejo que se puede estudiar a través de cambios en la
expresión de proteínas, sino que además proporciona nuevos conocimientos sobre la regulación
de las proteínas durante la maduración del fruto de fresa asentando las bases para estudios más
específicos. Además, se han llevado a cabo estudios proteómicos más especializados en rutas
metabólicas de especial interés en la maduración del receptáculo. Así, se ha podido relacionar la
concentración de diferentes enzimas con su expresión génica y la cantidad de metabolito final.
Esto ha permitido identificar enzimas clave en la síntesis de compuestos volátiles (Song et al.,
2015a) y de la ruta de producción de fenilpropanoides (Song et al., 2015b).
También, se han caracterizado individualmente un gran número de genes que intervienen
en el proceso de maduración del fruto. Se ha profundizado en la función de genes que codifican
enzimas relacionadas en la degradación de la pared celular (Benítez-Burraco et al., 2003; Quesada
et al., 2009), en la biosíntesis de antocianinas y flavonoides (Moyano-Cañete et al., 1998;
Almeida et al., 2007; Griesser et al., 2007), así como de compuestos volátiles y de otros procesos
relacionados con la maduración (Aharoni et al., 2000; Cumplido-Laso et al., 2012).
Durante el proceso de maduración, la reestructuración de la pared celular es uno de los
procesos más importantes que sufre el fruto y afecta, fundamentalmente, a su composición
pectínica. El reblandecimiento del fruto es una de las principales causas de pérdida de producción
y, por lo tanto, un objetivo principal en el estudio de esta fruta. En nuestro grupo de investigación,
se han aislado y caracterizado varios genes que codifican pectato liasas (plA, plB y plC)
relacionadas con la pérdida de firmeza del fruto durante la maduración (Medina-Escobar et al.,
1997b; Benítez-Burraco et al., 2003). De hecho, su silenciamiento en frutos transgénicos se
tradujo en un incremento de su firmeza y en un retraso en su proceso de maduración (Jiménez-
Bermúdez et al., 2002).
INTRODUCCIÓN
99 PhD Thesis Félix Juan Martínez Rivas
Las poligalacturonasas (PGs) son otro grupo de enzimas relacionadas con la
remodelación de la pared celular y que aumentan su expresión a lo largo de la maduración. Como
ha sido descrito anteriormente, las PGs son enzimas relacionadas con la degradación de la lámina
media. Inicialmente se identificaron dos PGs en fresa y mediante estudios de northern-blot se
comprobó que FaPG1 presentaba un pico de expresión en el estadio blanco de maduración
(Redondo-Nevado et al., 2009). Sin embargo, estudios posteriores mediante qRT-PCR
certificaron que FaPG1 mantiene una expresión alta en estadios rojos y posteriores, siendo su
expresión superior a la de FaPG2 (Quesada et al., 2009). El silenciamiento de FaPG1 en frutos
maduros se tradujo en un incremento de su dureza y en cambios en la estructura de su pared
(Quesada et al., 2009). Igualmente, el silenciamiento de FaPG2 también generó frutos con mayor
dureza aunque el doble silenciamiento FaPG1-FaPG2 no presentó un efecto sinérgico sobre la
dureza (Paniagua et al., 2020).
Paralelamente, han sido aislados y caracterizados varios genes que codifican
endoglucanasas (Cel2) (Llop-Tous et al., 1999; Trainotti et al., 1999; Palomer et al., 2006),
(FaEG3) (Trainotti et al., 1999), (Cel1) (Harpster et al., 1998; Llop-Tous et al., 1999; Woolley
et al., 2001). Dentro de las endoglucanasas, recientemente se ha caracterizado en profundidad
FaEG1. Presentando un marcado perfil relacionado con la maduración del fruto, su expresión fue
mayor en cultivares con menor dureza, como cv. Monterrey, frente a cultivares de mayor dureza,
como cv. Camarosa (Jara et al., 2019).
Otras enzimas caracterizadas son las expansinas. Se han identificado siete expansinas en
fresa (FaEXP1-FaEXP7) (Harrison et al., 2001). De las siete descritas, sólo dos de ellas son
específicas de fruto y aumentan su expresión a lo largo de la maduración (FaEXP2 y FaEXP5)
(Harrison et al., 2001). De hecho, se ha encontrado una correlación entre los niveles de expresión
de FaEXP2 y FaEXP5 y la firmeza del fruto. Así, estudios en diferentes variedades de fresa
indican que ambas expansinas muestran una mayor expresión en las variedades más blandas
(Toyonaka y Gorella) que en cultivares más firmes (Selva, Camarosa, Holiday y Elsanta)
(Salentijn et al., 2003; Dotto et al., 2006). Estos resultados sugieren que las expansinas
contribuyen en la maduración del fruto y pueden ser responsables del grado de reblandecimiento
en los distintos cultivares de fresa (Dotto et al., 2006). Nuevos estudios han validado estos
resultados mostrando que FaEXP5 presenta un patrón de expresión creciente a lo largo de la
maduración relacionado con la perdida de firmeza en el cv. Camarosa. De igual forma, FaEXP5
responde de forma positiva al tratamiento con ABA, hormona clave en el control del proceso. El
estudio del promotor reveló la presencia de dominios de respuesta a ABA y a auxinas, sugiriendo
que ambas hormonas juegan un papel relevante en el control de la expresión de esta enzima
(Valenzuela Riffo et al., 2020).

100 Functional characterization of molecular regulatory mechanisms controlling the ripening in strawberry fruit
Las PME (pectin metil esterasas) catalizan la hidrólisis de los grupos metil éster de las
pectinas dando lugar a una desesterificación de la pared celular (Prasanna et al., 2007). El grado
de esterificación de la pectina es muy importante, debido a que influye en la actividad de otras
enzimas asociadas a la pared como son la PG y las PL (Prasanna et al., 2007). En fresa, se han
identificado hasta seis isoformas de esta enzima a partir de una muestra de extracto de pared.
Entre ellas, la expresión de FaPME1 es específica de fruto y está relacionada con la maduración.
En cambio, las otras isoformas son específicas de hojas (FaPME2) y otros tejidos vegetativos
(FaPME3 y FaPME4) (Castillejo et al., 2004). Además, se ha demostrado que la expresión de la
FaPE1 es inducida por auxinas, al contrario de otros genes relacionados con la pared celular como
la PL (Medina-Escobar et al., 1997; Benítez-Burraco et al., 2002), la PG (Quesada et al., 2009) o
EGasas (Trainotti et al., 1999).
Se han analizado plantas transgénicas de fresa de la variedad silvestre F. vesca con
expresión ectópica de la FaPME1 procedente de F. ananassa. Los frutos obtenidos mostraron
cambios en el grado y patrón de esterificación de sus pectinas y también un incremento de la
expresión de proteínas relacionadas con la respuesta a estrés biótico (Osorio et al., 2008). Esto
sugiere que la FaPME1 participa en la metilación de derivados pectínicos oligogalacturónidos
(OGA) envueltos en procesos de defensa. De hecho, los frutos transgénicos obtenidos fueron más
resistentes a Botrytis cinerea que los frutos control (Osorio et al., 2008; Osorio et al., 2011).
Por otro lado, se ha aislado y caracterizado FaRGlyase1, un gen que codifica una
ramnogalacturonato liasa que se expresa al mismo tiempo que otras hidrolasas involucradas en la
degradación de pectinas (Molina-Hidalgo et al., 2013). Esta coexpresión apoya la idea de que la
degradación enzimática de las paredes celulares del parénquima cortical del fruto maduro influye
en el reblandecimiento. Esta enzima podría actuar sobre los RG-I de la pared celular primaria,
relajando la estructura de la pared celular y permitiendo el acceso a sus sustratos a otras hidrolasas
degradadoras de pectinas. Análisis de QTL mostraron que el gen FaRGlyase1 está ligado a genes
implicados en la firmeza del fruto. Todos estos resultados indican que el gen FaRGlyase1 juega
un papel muy relevante en el proceso de reblandecimiento del fruto de fresa durante la maduración
reduciendo su firmeza (Molina-Hidalgo et al., 2013).
Otras proteínas que participan en la degración de la pared celular son las xiloglucan
endotransglicosilasas/hidroxilasas (XTH). Estas enzimas se relacionan con el desensamblaje de
la matriz celulosa-xiloglucano, contribuyendo al reblandecimiento asociado con la maduración.
Se ha reportado la expresión de dos FaXTH a lo largo de la maduración del fruto, presentando
ambas una mayor expresión en el estadio blanco-intermedio y una reducción en el estadio rojo

INTRODUCCIÓN
101 PhD Thesis Félix Juan Martínez Rivas
(Nardi et al., 2014, Ramos et al., 2018). Además, se ha relacionado una mayor expresión de
FaXTH1 en aquellas variedades que presentan frutos más blandos como cv. Portola y cv.
Monterrey (Ramos et al., 2018).
El proceso de maduración de la fresa va acompañado de un aumento del contenido hídrico
del fruto. Una de las proteínas más estudiadas en relación con el contenido hídrico son las
aquaporinas, que actúan como transportadores de agua a través de la membrana. Cambios en la
expresión de genes que codifican acuaporinas durante los procesos de crecimiento y maduración
del fruto han sido asociados con un incremento del reblandecimiento del fruto originado por la
reducción del turgor celular (Thomas et al., 2006; Saladiè et al., 2007; Wada et al., 2008; 2009).
La disminución del turgor es atribuida a la pérdida de agua que sigue a la acumulación de solutos
en el apoplasto durante la maduración (Wada et al., 2008). En el fruto de fresa, la expresión génica
de dos acuaporinas (FaPIP1 y FaPIP2) fue mayor en frutos de un cultivar más firme (Camarosa)
en comparación con un cultivar más blando (Toyonaka). Además, la co-expresión de los genes
FaPIP1;1 y FaPIP2;1 resultó en un aumento de la permeabilidad al agua en los frutos (Alleva et
al., 2010; Yaneff et al., 2014). Estos datos parecen indicar que ambos genes podrían ser
responsables del control de la homeostasis del agua celular y de su acumulación lo que podría
estar relacionado con el mantenimiento de la turgencia del fruto (Mut et al., 2008; Alleva et al.,
2010).
Se aisló y caracterizó el gen FaNIP1;1, que codifica una acuaporina de tipo nodulin 26-
like y que se expresa a lo largo del proceso de maduración. También, se demostró su incremento
de expresión en condiciones de estrés hídrico en frutos. Todo ello parece demostrar que FaNIP1;1
juega un papel importante en el incremento de la permeabilidad de la membrana plasmática que
permite la acumulación de agua en el receptáculo del fruto de fresa a lo largo del proceso de
maduración (Molina-Hidalgo et al., 2015). Por otro lado, se ha estudiado el perfil de expresión
de varias aquaporinas en una amplia variedad de tejidos vegetativos y durante el proceso de
maduración. Así, en cultivares como Elsanta, las acuaporinas de la familia PIP1;1 disminuyeron
su expresión durante la maduración, mientras que en cultivares como Toyonaka y Camarosa la
aumentaron. En el caso de las proteínas PIP2;1, la expresión es estable en el cv. Elsanta, mientras
que en el cv. Camarosa presenta un pico en el estadio blanco para volver a descender en el rojo
(Mearlen et al., 2018). Finalmente, la expresión del grupo FaTIP fue reprimida a lo largo del
proceso de maduración en los diferentes cultivares estudiados. Esto indica que los patrones de
expresión son altamente variables según cultivares y que pueden estar asociados a la diferencia
en la turgencia de los frutos.
102 Functional characterization of molecular regulatory mechanisms controlling the ripening in strawberry fruit
La ruta de biosíntesis de ácido L-ascórbico, funcional en el estadio rojo, es aquella que
usa el D-galacturonato como sustrato. La contribución de otras rutas a la biosíntesis de ácido L-
ascórbico no ha sido aún descrita. El uso de este intermediario puede estar relacionado con la
degradación de la pared celular, ya que este compuesto es uno de los principales componentes de
las pectinas. Su degradación estaría catalizada por enzimas como la D-galacturonato reductasa
(FaGalUR), la myo-inositol oxygenasa (FaMIOX), y la monodehidroascorbato reductasa
(FaMDHAR), cuya expresión está correlacionada positivamente con un incremento de L-
ascórbico durante la maduración del fruto (Agius et al., 2003; Cruz-Rus et al., 2011). Así, el
máximo nivel de expresión del gen FaGalUR en el estadio rojo coincide con el aumento de
solubilidad de las pectinas, debido a la acción de las PL, y con el máximo contenido de ácido
ascórbico que se observa en el fruto maduro, lo que apoyaría la ruta propuesta para la biosíntesis
del ácido L-ascórbico a partir de D-galacturonato (Agius et al., 2003). Además, la sobreexpresión
del gen de fresa FaGalUR en tomate aumentó la capacidad antioxidante total en los frutos
transgénicos (Amaya et al., 2015).
El proceso de maduración viene acompañado también de un aumento de las antocianinas
presentes en el fruto. Esto supone un incremento de la expresión de genes involucrados en su
síntesis como la PAL, CHS, F3H y DFR, denominados early biosinthetic genes, así como de
ANS, UFGT y Malonil-transferasas, que conforman los late biosinthetic genes (Gong et al., 1997;
Moyano et al., 1998; Mori et al., 2001; Almeida et al., 2006; Griesser et al., 2008; Davik et al.,
2020). Teniendo en cuenta que la síntesis de antocianinas se produce dentro de la ruta de
biosíntesis de los fenilpropanoides, se ha detectado una inducción general de los genes envueltos
en ella durante el proceso de maduración (Anterola et al., 2002; Medina-Puche et al., 2016).
Igualmente, la síntesis de antocianinas durante la maduración parece estar regulada por la síntesis
de novo de la enzima FaPAL (Hirner et al., 2001; Mori et al., 2001), cuya expresión es inhibida
por la aplicación de auxinas (Given et al., 1988a). Esta enzima presenta dos picos de expresión,
el primero en el estadio verde, cinco días después de la antesis cuando existe un nivel muy alto
de fenoles solubles, y un segundo pico aproximadamente 30 días después de la antesis, asociado
al estadio rojo del fruto (Cheng y Breen, 1991).
Por otro lado, se ha aislado y caracterizado el gen que codifica una dihidroflavonol 4-
reductasa (DFR) que cataliza el último paso de la ruta común a la biosíntesis de antocianinas y
taninos condensados (Moyano et al., 1998). FaDFR puede jugar un doble papel dirigiendo la ruta
hacia cada una de las vías. Este doble papel se sugiere debido a que, aunque presenta su máximo
de expresión en el estadio rojo, su expresión se detecta también en frutos en estadio verde. Se ha
demostrado que existen dos variantes del gen DFR y que su ratio de expresión condiciona la
acumulación de pelagornidina en el fruto, sugiriendo diferente especificidad de sustrato (Mioisic

INTRODUCCIÓN
103 PhD Thesis Félix Juan Martínez Rivas
et al., 2014). Por otro lado, se ha identificado la enzima que cataliza la síntesis de pelargonidina-
3-glucosido, la antocianina con mayor concentración en el fruto de fresa. Estudios de
especificidad enzimática entre diferentes UDP::glucosiltransferasas identificaron a FaGT1 como
la enzima que lleva a cabo este paso. Esta enzima tiene un perfil transcriptómico fuertemente
inducible a lo largo de la maduración, alcanzando su máxima expresión en el estadio rojo
(Griesser et al., 2008). Por otro lado, estudios de QTL usando variedades de fresa con diferentes
concentraciones de antocianinas han permitido identificar varias enzimas potencialmente
responsables de la síntesis de compuestos como pelargonidin-(6 malonil)-3-glucósido (Devik et
al., 2020).
El proceso de maduración está regulado por una serie de factores de transcripción como
FaMYB1, FaMYB10, FaMADS9, FaSHP y FaGAMYB, así como el recientemente identificado
FaMYB123, que codifican factores de transcripción de tipo MYB y MADS-box y que podrían
desempeñar funciones reguladoras de la síntesis de antocianinas y flavonoles durante la
maduración del fruto de fresa (Aharoni et al., 2001b; Lin-Wang et al., 2010; Salvatierra et al.,
2013; Seymour et al., 2011; Daminato et al., 2013; Medina-Puche et al., 2014; Vallarino et al.,
2015; Martínez-Rivas et al., unpublished) (Introducción general, apartado 5.2.2). Igualmente,
otros genes implicados en procesos específicos de maduración, como la producción de volátiles
han sido identificados. Estos genes regularían la producción de volátiles relacionados con la
generación del aroma del fruto como FaOMT, FaNES1, SAAT, FaAAT2, FaPDC1 (Aharoni et
al., 2000; Aharoni et al., 2004; Moyano et al., 2004; Cumplido-Laso et al., 2012).
Otro de los procesos relacionados con la maduración es la lignificación de las paredes
celulares. En este proceso se ha caracterizado a FaCAD1, cuyo perfil de expresión e
inmunolocalización de la proteína la relacionan con el proceso de lignificación en frutos y
aquenios durante la maduración (Blanco-Portales et al., 2002). En este mismo contexto, se ha
identificado una proteína híbrida rica en prolina codificada por el gen FaHyPRP relacionada con
el anclaje de polifenoles (ligninas y taninos condensados) a la membrana de las vacuolas y de las
células parenquimáticas del receptáculo (Blanco-Portales et al., 2004). La expresión de este gen
es específica de fruto y sus niveles de transcrito se incrementan en la etapa de maduración. Estos
datos de expresión junto con su localización en los mismos tipos celulares que la enzima FaCAD1,
sugieren que la función de ambas proteínas podría ser complementaria (Blanco-Portales et al.,
2002). El análisis de los genes CCR, CAD y POD de F. ananassa reveló la importancia de
FaPOD27 para la formación de lignina durante el proceso de maduración y para la determinación
de la firmeza de los frutos de fresa, así como su posible función como componente del mecanismo
de defensa del fruto frente a ataques bacterianos (Yeh et al., 2014).

104 Functional characterization of molecular regulatory mechanisms controlling the ripening in strawberry fruit
También, se ha identificado a FaGAST2 (Moyano-Cañete et al., 2013), cuyo perfil
transcriptómico presenta un incremento de expresión a lo largo del desarrollo y la maduración del
fruto. Aunque FaGAST2 y FaGAST1 (de la Fuente et al., 2006) comparten poca homología de
secuencia a nivel aminoacídico (31%) y nucleotídico (15%), ambas proteínas contienen un
péptido señal y un dominio de tipo GASA altamente conservado en el extremo C-terminal. La
expresión de FaGAST2 no está regulada por GA3 ni ABA, pero sí por etefón, un generador
intracelular de etileno, por condiciones de estrés oxidativo y por infección por Colletotrichum, lo
que sugiere que FaGAST2 juega un papel directo en la eliminación de ROS durante el crecimiento
y maduración del fruto y en respuesta a estreses bióticos (Moyano-Cañete et al., 2013). Además,
la sobreexpresión de FaGAST2 produjo un retraso en el crecimiento de la planta y frutos de menor
tamaño. Los análisis histológicos de estos frutos confirmaron un menor tamaño de las células del
parénquima corroborando la hipótesis de que FaGAST2 está relacionada con la elongación celular
y el tamaño final del fruto (Moyano-Cañete et al., 2013).
10. Genes implicados en la mejora de fresa
La familia de las Rosaceas presenta una gran diversidad fenotípica debido a que está
compuesta por diversas especies. Dentro de sus miembros se incluyen árboles de gran interés,
como melocotón, manzana, así como zarzas, rosas, almendras y fresas. Actualmente, y aunque
han mejorado las técnicas de obtención de sistemas transgénicos en esta especie, el número de
genes funcionalmente caracterizados mediante esta metodología es escaso. A pesar de ello,
recientemente se han identificado genes implicados en procesos importantes relacionados con la
producción y la calidad de las frutas mediante transgénesis. No obstante, la evaluación de la
función de genes en plantas transgénicas es un proceso bastante lento, debido al tiempo necesario
para la regeneración de las plantas, aunque proporciona una herramienta muy valiosa para la
selección de genes que puedan determinar una mejora cualitativa de los frutos.
10.1. Mejora de la planta de fresa frente a plagas y enfermedades
10.1.1. Resistencia a agentes abióticos
En su hábitat natural, las plantas de fresa están expuestas a diferentes agentes abióticos
como el déficit hídrico, altas temperaturas, salinidad, metales pesados y daños mecánicos. Se
estima que estas condiciones pueden causar una reducción del rendimiento de producción de hasta
un 50% (Vij y Tyagi, 2007). Por ello, se han realizado estudios fisiológicos, bioquímicos y
moleculares acerca de la tolerancia de las plantas al estrés para poder aclarar así cuales son los
mecanismos intrínsecos de éstas para poder minimizarlos.

INTRODUCCIÓN
105 PhD Thesis Félix Juan Martínez Rivas
Estudios transcriptómicos mediante ARN-seq en plantas sometidas a estrés por bajas
temperaturas revelaron una batería de genes que alteran su expresión en esas circunstancias. Así,
1180 genes se sobreexpresaron, mientras que 1217 disminuyeron su expresión (Zhang et al.,
2019). Los estudios funcionales basados en estos datos revelaron que las categorías génicas que
mostraron mayores diferencias de expresión fueron las de respuesta mediada por hormonas,
biosíntesis de flavonoides y respuesta mediada por proteínas quinasa. Dentro de las hormonas,
aparecieron sobreexpresados los genes relacionados con el ABA, mientras que los de respuesta
regulados por auxinas se redujeron drásticamente (Zhang et al., 2019). En este sentido, se ha
comprobado que la aplicación exógena de ABA desencadena la síntesis de betaína o glicina
betaína, lo que aumenta la supervivencia de las plantas en condiciones de congelación y mejora
su crecimiento (Rajashekar et al., 1999). Igualmente, en condiciones de estrés osmótico o de
sequía también se produce una acumulación significativa de este compuesto en muchas plantas,
lo que ha llevado a proponer que su acumulación sea un mecanismo de adaptación medio
ambiental a diversas situaciones de estrés (Rajashekar et al., 1999). También, se ha observado
una sobreexpresión de la ruta de los flavonoides, indicando que estos compuestos juegan un papel
fundamental en la adaptación de la planta bajas temperaturas (Zhang et al., 2019).
Estudios transcriptómicos en plantas de fresa aclimatadas al frio han permitido identificar
varios genes que presentan expresión diferencial a bajas temperatura, Fcor1, 2 y 3 (NDong et al.,
1997). Mientras que Fcor1 y 2 presentan expresión en todos los tejidos analizados, Fcor3 es
específico de hojas. El tratamiento con frío aumenta la expresión de una proteína quinasa calcio
dependiente (CDPK) expresada en raíces, estolones, meristemos, flores, hojas y frutos a partir del
estadio blanco, que sugiere un papel importante de esta proteína en la adaptación al frío (Llop-
Tous et al., 2002). Para conferir resistencia al frío en plantas de fresa, también se han utilizado
genes foráneos. Por ello ha sido clonado en fresa el factor de transcripción CBF1 que participa en
la aclimatación de A. thaliana a bajas temperaturas (Owens et al., 2002). Sin embargo, el análisis
de los frutos obtenidos a partir de dos líneas transgénicas de fresa sobreexpresando dicho gen no
mostró cambios significativos en su tolerancia a la congelación (Owens et al., 2002).
Por otro lado, el gen de trigo Wcor410a dehidrina ácida, cuyo nivel de expresión se
correlaciona con el grado de tolerancia a la congelación de diferentes genotipos de trigo, fue usado
para obtener líneas transgénicas de fresa sobreexpresando este gen. Estas plantas presentaron un
mayor grado de resistencia al frío y de tolerancia a la congelación (Houde et al., 2004). Además,
se ha identificado el promotor rd29A, que presenta elementos inducibles por estrés
(deshidratación, estrés salino, bajas temperaturas), que unido al gen de arroz RdreB1Bl, que
codifica un FT de tipo DRE (drought responsive elements, elementos de respuesta a la
deshidratación), también mostró una mejora significativa en la tolerancia al frío de plantas de

106 Functional characterization of molecular regulatory mechanisms controlling the ripening in strawberry fruit
fresa (Gu et al., 2013). Así, el análisis transcriptómico de plantas transgénicas transformadas con
la construcción rd29A::RdreB1Bl y sometidas a condiciones de frío extremo (0ºC por 6 horas),
mostró un incremento de la expresión de diversos FTs con elementos de respuesta a frio (DRE)
en sus promotores. Esto indica una clara respuesta transcriptómica derivada de la acción de
RdreB1Bl. También, en los estolones de estas plantas, se observó una acumulación de
antocianinas acompañada de la sobreexpresión de enzimas relacionadas con esta ruta (Gu et al.,
2015). Esta acumulación, a ser compuestos con capacidad antioxidante, puede conllevar ventajas
para el crecimiento de la planta y su resistencia a diferentes estreses abióticos (Misyura et al.,
2013).
Las temperaturas elevadas constituyen otro de los estreses abióticos mas frecuentes a los
que se ven sometidas las plantas. Los organismos responden a estas condiciones mediante la
síntesis de un grupo específico de proteínas denominadas proteínas de choque térmico (HSP). En
fresa, a partir de una genoteca substractiva de ADNc, se ha aislado el gen HSP que muestra una
homología significativa de secuencia con la proteína HSPI citoplasmática de bajo peso molecular
(Medina-Escobar et al., 1998). No obstante, los datos de expresión del gen HSP obtenidos
sugieren que esta clase de proteínas no sólo tienen un papel en la respuesta de la planta al estrés
sino también en su desarrollo, incluyendo la maduración del fruto.
Así, el estudio transcriptómico comparativo entre un cultivar que presenta resistencia al
calor, cv. R Hope, y otro no termotolerante, cv. Festival, mostró que un gran número de proteínas
de la familia HSP presentan una mayor expresión en el cultivar resistente al calor. También, se
encontró un aumento de alérgenos de la familia Fraa a altas temperaturas, pudiendo considerarse
la expresión de este gen como marcador de seguridad sanitaria en el futuro, así como marcador
para la selección de variedades termotolerantes (Kesici et al., 2020). Otro estudio realizado en
plantas de fresa expuestas a estrés térmico ha permitido observar un aumento de la actividad
peroxidasa en las plantas sometidas a este estrés, lo que se ha asociado con los procesos de
aclimatación de la planta al calor (Gülen y Eris, 2004). Esto parece indicar que la transcripción
de algunos genes peroxidasa es dependiente de la temperatura. Por otra parte, la sobreexpresión
heteróloga de FaTHSFA2a y de FaTHSF1a en plantas de Arabidopsis otorgó mayor resistencia a
altas temperaturas. Ambas proteínas consiguieron aumentar la expresión de diversas proteínas
HSP en Arabidopsis, así como aumentar la viabilidad de las plantas sometidas a altas
temperaturas, sugiriendo su posible función en la respuesta al estrés por calor (Liao et al., 2016).
La sequia, así como la salinidad, es otro de los estreses abióticos que más importancia
está tomando en este momento. Se realizaron estudios sometiendo plantas de fresa a ambos tipos
de estreses y se estudiaron los cambios transcriptómicos que ocurrían en el fruto (Galli et al.,
INTRODUCCIÓN
107 PhD Thesis Félix Juan Martínez Rivas
2019). Tanto el rendimiento de la planta como su biomasa se redujeron cuando fueron sometidas
a estrés salino, y aún más en plantas con estrés hídrico. Además, una batería de genes que
responden a estos tratamientos y que presentan un alto interés biotecnológico también
modificaron su expresión (Galli et al., 2019). La respuesta más común a la sequía en las plantas
es el cierre de los estomas de las hojas para minimiza la perdida de agua por evaporación. Plantas
sobreexpresando RdreB1BI presentan una disminución en el número de los estomas y una
reducción de su apertura, lo que supone una ventaja en condiciones de sequía (Gu et al., 2017).
Por otro lado, esta sobreexpresión fue acompañada por una inducción de diversas acuaporinas, lo
que también produce una menor perdida de agua en condiciones de estrés térmico.
La osmotina es una proteína relacionada con la patogénesis que inicialmente fue
identificada en cultivos celulares de tabaco en condiciones de estrés salino. Se ha demostrado que
la expresión de este tipo de proteínas se induce tanto en condiciones de estrés abiótico como por
infecciones microbianas. En fresa, se ha identificado el gen OLP2 (osmotin like protein) que posee
un patrón de expresión ubicuo en la planta (Zhang y Shih, 2007). Este gen responde a diferentes
estímulos abióticos (ABA, ácido salicílico y heridas mecánicas) lo que sugiere que podría ayudar
a proteger a la planta frente a estos estreses. La sobreexpresion ectópica de una osmotina de tabaco
en fresa aumentó la resistencia al estrés salino, lo que apoya la teoría de que estas proteínas juegan
un papel importante en la respuesta dicho estrés (Husaini y Abdin, 2008). Del mismo modo, el
gen de fresa de transferencia no específica de lípidos (F×altp) también es inducido por ABA,
ácido salicílico y heridas mecánicas, aunque es reprimido por el estrés al frío (Yubero-Serrano et
al., 2003).
A su vez, se han identificado transportadores específicos de sodio y de potasio, tanto en
la variedad cultivada como en la ancestral F. chiloensis. Plantas de F. chiloensis sometidas a
estrés salino mostraron una rápida expresión del transportador FaAKT1 de K+ mientras que no
hubo cambios en el transportador de Na+ (Garriga et al., 2017). Esta diferencia de expresión puede
deberse a la necesidad de mantener un balance entre la concentración de sodio y potasio cuando
el sodio extracelular aumenta en condiciones de salinidad.
La sequía, así como otros estreses ambientales suelen estar acompañados por daño
oxidativo dentro de las células. Como se ha descrito anteriormente, la respuesta de la planta ante
ciertos estreses es acompañada por el aumento en la biosíntesis de compuestos antioxidantes como
los flavonoles. Además, la planta también responde protegiéndose del estrés mediante la síntesis
de enzimas protectoras, como la metionina sulfóxido reductasa (PMSR). Esta proteína, cuya
expresión es específica de receptáculos rojos, expresada en E. coli redujo el sulfóxido de
metionina libre a metionina, lo que protegía a las bacterias frente al daño producido por la adición

108 Functional characterization of molecular regulatory mechanisms controlling the ripening in strawberry fruit
de H2O2 (López et al., 2006). Por otro lado, plantas transgénicas sobreexpresando RdreB1BI
presentaron una mayor expresión de enzimas antioxidantes como POD (peroxidasa) y SOD
(superóxido dismutasa) (Gu et al., 2017). La sobreexpresión del factor de transcripción de tipo
WRKY de F. vesca FvWRKY42 en Arabidopsis mejoró sustancialmente la tasa de germinación
en presencia de altas concentraciones de sodio y afectó al tamaño de las raíces haciéndolas más
resistentes a la sequía (Wei et al., 2018b). Además, estas plantas presentaron una mayor
concentración de las enzimas SOD y CAT (Wei et al., 2018b). De nuevo, esta respuesta también
estuvo acompañada de un incremento del cierre de los estomas mediado por la mayor sensibilidad
de estas plantas al ABA. Por consiguiente, los resultados obtenidos coinciden con la hipótesis de
que el programa de transcripción durante la maduración de la fresa induce estrés oxidativo
(Aharoni et al., 2002b).
También, ha sido identificada y caracterizada en fresa una peroxidasa (FaPRX27) (Ring
et al., 2013). Las peroxidasas catalizan la reducción de H2O2 al tomar electrones de varias
moléculas donadoras. En plantas, las peroxidasas de clase III oxidan moléculas donadoras de
electrones como fenoles, precursores de ligninas y otros metabolitos secundarios, como los
flavonoides. Ensayos enzimáticos han confirmado el papel desempeñado por FaPRX27 en la
biosíntesis de lignina a partir de ácido felúrico, coniferil alcohol y ácido cafeico que son
transformados en dihidrodímeros en presencia de H2O2. Por otra parte, análisis de QTL mostraron
que el gen FaPRX27 está vinculado a una región implicada en la disminución del color de la fruta.
Esta aproximación experimental es funcionalmente relevante y confirma a FaPRX27 como una
peroxidasa que interviene en la polimerización de compuestos fenólicos solubles en planta
durante la síntesis de lignina. Por consiguiente, FaPRX27 competiría con las enzimas de la ruta
de biosíntesis de flavonoides y antocianinas por los sustratos y determinaría la intensidad del color
de la fruta roja (Ring et al., 2013).
10.1.2. Resistencia a agentes bióticos
Los cultivos de fresa son susceptibles a diversas enfermedades y plagas responsables de
importantes pérdidas económicas, tanto por el gasto económico que suponen los tratamientos
fitosanitarios para combatirlas como por la reducción que suponen en la producción. La
prohibición del uso de diversos fitoquímicos, como el bromuro de metilo, aumenta las dificultades
para obtener rendimientos aceptables en suelos no fumigados. Por ello, un objetivo muy
importante en la investigación actual es la mejora de la resistencia de la planta de fresa mediante
su manipulación genética.
La antracnosis es una de las principales enfermedades fúngicas que afecta a los cultivos
de fresa. Es causada por tres especies de Colletotrichum (C. acutatum, C. fragariae y C.
INTRODUCCIÓN
109 PhD Thesis Félix Juan Martínez Rivas
gloeosporioides). Sus infecciones se caracterizan por dañar los órganos vegetativos de la planta
y el fruto disminuyendo en gran medida el rendimiento económico del cultivo. Esta infección es
especialmente dañina en los campos de Huelva debido a las condiciones de temperatura y
humedad. El crecimiento de Colletotrichum es especialmente favorable entre los 24 y 28ºC, con
episodios de humedad y, además, las esporas del hongo son fácilmente dispersadas por el riego,
la lluvia, el rocío, insectos y por los trabajadores agrícolas (Smith, 1990; Mertely et al., 2017).
Aun así, se han podido seleccionar variedades resistentes de fresa mediante programas clásicos
de mejora de cultivos (Smith et al., 1996).
La antracnosis es un campo de investigación muy activo. Se han logrado identificar el
papel de diferentes genes que confieren resistencia a esta infección. Estudios realizados con
poblaciones segregantes de F. ananassa mostraron que la resistencia a estos hongos puede ser
tanto poligénica como mendeliana (Giménez y Ballington, 2002; Denoyes-Rothan et al., 2005).
Otro estudio de asociación del genoma (GWAS, Genome Wide Association Studies), usando
variedades con diferentes niveles de sensibilidad al hongo, reportaron una región localizada en el
cromosoma 6 asociada con una menor incidencia de la antracnosis, concretamente la causada por
el hongo C. acutatum, denominado FaRCa1 (Salinas et al., 2018). Un estudio similar, pero
realizado con infecciones de C. gloeosporoides, descubrió otra región en el cromosoma 6 asociada
con mayor resistencia a la antracnosis causada por este hongo (Anciro et al., 2018). Esta región,
denominada FaRCg1, se encuentra a solo10 centimorgan de FaRCa1 lo que sugiere que los genes
que determinan una mayor resistencia a la antracnosis se encuentran en el cromosoma 6 de F.
Vesca. Esta información delimita y estrecha la búsqueda de genes que puedan ser usados para
programas de mejora genética.
Para identificar que genes responden ante la infección por Colletotrichum, diferentes
cultivares fueron sometidos a infecciones de C. gloeosporoides. Los estudios transcriptómicos
comparativos entre el cultivar más resistente (cv. Yanli) y el más susceptible (cv. Benihoppe)
arrojaron un total de 226 genes sobreexpresados a causa de la infección en ambos genes (Wang
et al., 2017). Tres categorías fueron las que mostraron mayor número de genes sobreexpresados:
la respuesta innata mediada por proteínas PRR; los receptores de tipo R, necesarios para que la
planta reconozca al atacante; y los factores de transcripción de tipo WRKY, que también
responden en gran medida al ataque por patógenos. Dentro de esta familia, se ha identificado el
papel que juega FaWRKY1 en la respuesta al ataque por patógenos. Este FT responde
positivamente al ataque por C. acutatum y revierte el genotipo knock-down de AtWRKY75, un FT
responsable de la defensa en A. thaliana (Encinas-Villarejo et al., 2009). En frutos, el
silenciamiento transitorio mediante ARNi de FaWRKY1 aumentó la resistencia de estos a la
infección por C. acutatum. Sin embargo, la sobreexpresión de este gen no produjo ninguna

110 Functional characterization of molecular regulatory mechanisms controlling the ripening in strawberry fruit
diferencia en la resistencia tras 5 días de infección. Estos estudios demuestran el papel como
regulador negativo de FaWRKY1 en la respuesta a C. acutatum (Higuera et al., 2019).
Otro de los métodos de respuesta de las plantas son la secreción de pequeños polipéptidos,
denominados factores de alcalinización rápida (RALF, Rapid Alkalinization Factor), que son
capaces de incrementar el pH extracelular. Dentro de las proteínas tipo RALF identificadas en
fresa, FaRALF33 presenta una rápida respuesta tras la infección con C. acutatum, o B. cinerea.
El silenciamiento de FaRALF33 en frutos de fresa retrasa la colonización del hongo sin embargo,
la sobreexpresión disminuye la resistencia del fruto al hongo y permite su dispersión a lo largo
del fruto, lo que demuestra que FaRALF33 juega un papel fundamental en la resistencia a C.
acutatum (Merino et al., 2019).
Otro hongo patógeno con capacidad de infectar a la fresa es Verticillium dahliae. Este
hongo accede a la planta desde el suelo atacando a los tejidos vasculares y causando graves
pérdidas. La sensibilidad a este hongo varía en diferentes cultivares, identificando a cv.
Redgauntlent como la más resitente y a cv. Hapil como la más susceptible. El cruce entre ambas
variedades y el estudio de QTLs asociado demostró que 11 loci pueden tener relación con la
resistencia al hongo (Antanaviciute et al., 2015). No obstante, son necesarios más estudios sobre
estos loci para tratar de identificar genes candidatos a mejorar la resistencia de la planta al hongo.
Otro estudio similar de QTLs ha identificado como potenciales genes relacionados con la
resistencia a Verticilium a genes de tipo NBS (nucleotide binding sites). Estos genes están
relacionados con las proteínas ricas en leucina (LRR) que son importantes en la primera barrera
de defensa de la planta frente al hongo (Cockerton et al., 2019). Las proteínas de la familia PR
(pathogenesis related) también están relacionadas con la respuesta a diferentes tipos de estreses.
En concreto, las de tipo PR10 están relacionadas con la respuesta a Verticillium. En fresa, la
inoculación de plantas con este hongo activó la transcripción de varios genes de esta familia, con
especificidad de expresión en la raíz, como PR10.02, .06, .08, o en las hojas PR10.03, .11 o .16
(Besbes et al., 2019).
Otros estudios realizados con plantas transgénicas de fresa han mostrado que altos niveles
de quitinasa reducen los daños causados por el hongo oidio (Asao et al., 1997; Asao et al., 2003).
En este sentido, se ha aislado un gen codificante para una quitinasa (pcht28) procedente de
Solanum chilensis que, al ser transferido a plantas de fresa del cv. Joliette, incrementa
significativamente la resistencia de las plantas transgénicas a V. dahliae (Chalavi et al., 2003).
Paralelamente, se obtuvieron líneas transgénicas de fresas expresando independientemente tres
genes de defensa: ch5B, codificante de una proteína quitinasa de judia (Phaseolus vulgaris), gln2
que codifica una glucanasa de tabaco, y ap34 que codifica una taumatina de tabaco. En este

INTRODUCCIÓN
111 PhD Thesis Félix Juan Martínez Rivas
estudio se indica que la expresión del gen ch5B en frutos de fresa transgénicos mejoró la
resistencia de éstos al moho gris aunque no tuvo ningún efecto significativo en su resistencia a la
antracnosis (Ricardo et al., 2006).
Botrytis cinérea, hongo causante del moho gris, causa una enfermedad muy común en las
regiones productoras de fresa y una de las más destructivas. La infección aparece en primer lugar
en flores aunque son los pétalos y los estambres los primeros órganos que se infectan. El
receptáculo se infecta a partir del hongo que crece internamente desde los estambres, aunque la
infección a través de los pétalos también es posible. Aún no se han identificado cultivares de F.
ananassa resistentes a B. cinerea aunque se ha observado diferente grado de susceptibilidad en
varios cultivares, probablemente debido a las características morfológicas de cada uno de ellas.
Ya que la infección por este hongo es latente en las flores y ataca posteriormente a los frutos, se
han estudiado los transcriptomas de frutos de la especie silvestre F. vesca en diferentes estados
de maduración y de flores infectadas con el hongo para conocer qué genes responden al patógeno.
Un total de 987 genes respondieron a la infección en estadio rojo, de los cuales 649 se
sobreexpresaron. De estos genes destacan aquellos relacionados con la traducción de señales,
como proteínas de membrana y receptores, proteínas que modifican la pared celular, como
FaRGLyase1, o genes relacionados con la modulación de la respuesta hormonal (Mehari-Haile et
al., 2019). También, se han obtenido resultados positivos en plantas de fresa del cv. Pegasus
transformadas con la proteína PGIP inhibidora de la poligalacturonasa de pera. Estas plantas
fueron más resistentes a la infección por B. cinerea tras rociar cada flor con una suspensión de
conidios del hongo (Schaart et al., 2005). Además, se ha demostrado que la sobreexpresión
ectópica del gen FaPME1 confiere resistencia frente al ataque de este hongo patógeno ya que
aumenta la producción de oligogalacturonoides demetilados que refuerzan el sistema de defensa
de la planta (Osorio et al., 2011).
La resistencia contra enfermedades bacterianas y plagas de artrópodos ha sido menos
estudiada. No obstante, se han identificado mecanismos de resistencia contra Xanthomonas
fragariae en F. virginiana, F. chiloensis, F. ananassa y otros genotipos octoploides de Fragaria
(Maas et al., 2000; Xue et al., 2006). Por otra parte, también se han estudiado poblaciones
segregantes de F. chiloensis cruzadas con F. ananassa con el objetivo de identificar genes
relacionados con la resistencia a pulgones y ácaros (Barritt y Shanks, 1980; 1981).
Todos estos trabajos abren la puerta a la mejora genética de la planta de fresa debido a la
obtención de resultados prometedores en la resistencia frente a diferentes tipos de infecciones.
Sin embargo, la aplicación de estos resultados está limitada por la falta de una normativa que
regule el uso de cultivos transgénicos en Europa, lo que impide su uso y explotación económica.

112 Functional characterization of molecular regulatory mechanisms controlling the ripening in strawberry fruit
Por tanto, y mientras llega esta regulación, se están llevando a cabo análisis de algunos péptidos
y productos naturales con propiedades antibióticas aislados a partir de la planta de fresa. En este
sentido, se ha evaluado la actividad antifúngica de ciertos compuestos orgánicos volátiles (COV)
producidos por la planta de fresa frente a la infección por C. acutatum, lo que abre nuevas
perspectivas en el control biológico de patógenos. Se ha observado también una inhibición del
crecimiento del micelio y de la germinación de las esporas de este hongo debido a los COV
producidos por una lipoxigenasa a través de la degradación de ácidos grasos de 18 C (Arroyo et
al., 2007). Además, a partir de hojas de fresa, se ha aislado una molécula pequeña de 316 Da con
actividad antibiótica denominada Fragarina que parece participar en respuesta a procesos de estrés
(Filippone et al., 1999).
10.2. Mejora de la floración y fructificación de la planta de fresa
La mejora de la floración y la fructificación es un objetivo a conseguir, no solo para el
cultivo de fresa, sino para cualquier cultivo de interés agronómico. El incremento de la población
mundial aumenta la necesidad de incrementar la producción vegetal para poder asegurar alimento
a toda la humanidad. La floración y fructificación implican múltiples mecanismos que resultan
en diferentes respuestas en función del fotoperiodo y la temperatura (Rantanen et al., 2014; 2015).
Se ha descrito un factor de transcripción de tipo MADS-box, SUPRESSOR OF
OVEREXPRESSION OF CONSTANTS 1 (FaSOC1), como inductor de la floración en fresa (Lei
et al., 2013). La sobreexpresión de este gen en A. thaliana incrementa la expresión de los genes
relacionados con el control de la floración como LEAFY (LFY) y APETALA 1 (AP1) (Lei et al.,
2013). En F. vesca, la sobreexpresión de FvSOC1 reprime el inicio de la floración en condiciones
de día corto mientras que su silenciamiento causa floración continua sin importar la duración del
día, lo que es similar al fenotipo obtenido en las plantas transgénicas con en el represor floral
terminal flower 1 (FvTFL1) silenciado (Mouhu et al., 2013). El análisis molecular de estas plantas
transgénicas reveló que FvSOC1 activa la expresión de FvTFL1 en el meristemo floral
conduciendo a la represión de la floración (Mouhu et al., 2013). A su vez, FvSOC1 está regulado
por el fotoperíodo y por flowering locus T1 (FvFLT1) (Mouhu et al., 2013). Por otro lado, el
silenciamiento de FvTFL1 produjo plantas de fresa con floración permanente (Koskela et al.,
2012).
Mientras que la ruta de inhibición de la floración ha sido ampliamente estudiada en F.
vesca, los factores implicados en su inducción aún son inciertos. Por el momento, en F. ananassa
se ha identificado el locus FaPFRU. Dentro de este locus se encuentra FaFT1 (FLOWERING
LOCUS T) como un posible promotor floral (Nakano et al., 2015). La unión de FaFT1 o de
FaFLT1 al factor de transcripción FD será lo que decida la identidad del meristemo y determinará
así la reproducción sexual o asexual de la planta. (Wickland and Hanzawa, 2015).
INTRODUCCIÓN
113 PhD Thesis Félix Juan Martínez Rivas
La modificación de la época del año en el que la planta puede florecer y fructificar
mejoraría su producción de manera cuantitativa y cualitativa. Para ello, se está estudiando el
efecto que tiene sobre el desarrollo de las plantas y su fructificación la modificación de su
regulación hormonal para conseguir una mejora del cultivo de la fresa, tanto de su capacidad de
adaptación como de la resistencia a las enfermedades. Estas modificaciones pueden lograrse
fácilmente mediante la introducción de genes capaces de alterar la regulación endógena del
crecimiento vegetal (PGRs). Las auxinas son la hormona principal que coordina el crecimiento y
desarrollo de los frutos inmaduros. Recientemente, ha sido demostrado que dos genes YUCCA
están implicados en la floración y desarrollo de la fresa. La sobreexpresión de FvYUC6 produjo
plantas con alto contenido en auxinas, retraso en la floración y esterilidad masculina completa en
F. vesca (Liu et al., 2014); mientras que el silenciamiento inhibió significativamente el
crecimiento vegetativo, el desarrollo floral y los frutos se vieron ampliamente afectados. Además,
se detectó una clara correlación entre el silenciamiento de FvYUC6, la expresión de un grupo de
genes de respuesta a auxinas y los niveles de IAA libre en dichas plantas transgénicas (Liu et al.,
2014). Por otro lado, se ha determinado que el nivel de expresión de la enzima GA20ox está
relacionado que el destino final del meristemo y su diferenciación a flor o estolón y, por lo tanto,
con el contenido de giberelinas en el meristemo (Teneira et al., 2017).
10.3. Mejora de la calidad del fruto de fresa mediante la modificación de sus propiedades
organolépticas
Otra de las prioridades actuales en los programas de mejora genética entre las bayas es la
mejora de la calidad de la fruta. La mejora del sabor, esto es, la combinación de la acidez, dulzor,
y aroma, así como de la firmeza es el objetivo principal de los programas de biotecnología. Estos
caracteres están controlados por una gran cantidad de genes en procesos asociados al desarrollo
y maduración de la fruta (Manning, 1994).
10.3.1. Manipulación del proceso de reblandecimiento
Desde el punto de vista del consumidor, la dureza es la principal característica a tener en
cuenta para la elección del fruto. El reblandecimiento es un proceso asociado a la maduración y
se debe a la solubilización y despolimerización de la pared celular en un proceso ordenado llevado
a cabo por diversas enzimas. Así, mediante el silenciamiento de la expresión de genes
involucrados en la degradación de la pared celular, se está intentando retrasar el reblandecimiento
del fruto (Mathews et al., 1995; Woolley et al., 2001; Jimenez-Bermúdez et al., 2002; Palomer et
al., 2006; Sesmero et al., 2007; Molina-Hidalgo et al., 2013; Posé et al., 2013). Las expansinas
son un grupo de enzimas que favorecen la extensión de la pared celular. Se ha propuesto que estas
proteínas degradan puentes de hidrógeno entre las microfibrillas de celulosa y hemicelulosa in
114 Functional characterization of molecular regulatory mechanisms controlling the ripening in strawberry fruit
vivo lo que resulta en una relajación de la pared celular que permite el movimiento de los
polímeros durante el crecimiento (McQueen-Mason y Cosgrove, 1994; Civello et al., 1999;
Brummell y Harpster, 2001). La función de estas enzimas explica la alta expresión de los genes
que las codifican en tejidos vegetales que presentan una pared celular en crecimiento como
hipocotilos (McQueen-Mason et al., 1992), hojas (Keller y Cosgrove, 1995), raíces (Wu et al.,
1996), y frutas (Rose et al., 1997; Brummell et al., 1999; Civello et al., 1999; Harrison et al.,
2001; Hiwasa et al., 2003). En tomate, se ha comprobado que la expresión de varias expansinas
está relacionada con la hidrólisis de polímeros de pared celular y con el reblandecimiento del fruto
(McQueen-Mason y Cosgrove, 1994; Civello et al., 1999; Brummell y Harpster, 2001; Li et al.,
2003). Igualmente, en fresa se han identificado siete expansinas diferentes en el genoma de las
cuales FaExp2 es la única que presenta un marcado perfil relacionado con la maduración. Esta
enzima presenta una elevada homología de secuencia con una expansina expresada en el
desarrollo temprano del tomate (Civello et al., 1999). Por otra parte, también se ha relacionado
la expresión de expansinas con la dureza del fruto ya que variedades de fresa más blandas
presentan mayor expresión de estos genes al inicio de la maduración (Dotto et al., 2006).
Por otro lado, se han identificado en fresa dos celulasas, también llamadas EGasas,
(FaCel1 y FaCel2) (Harpster et al., 1997; Manning, 1998; Llop-Tous et al., 1999; Trainotti et al.,
1999; Woolley et al., 2001; Spolaore et al., 2003; Palomer et al., 2006). Mientras que FaCel2
presenta un perfil no específico del receptáculo, FaCel1 se expresa principalmente en el proceso
de maduración (Llop-Tous et al., 1999; Trainotti et al., 1999). Por lo tanto, FaCel1 puede estar
implicado en los procesos de degradación y reblandecimiento de la pared celular mientras que
Facel2 se relaciona con las modificaciones necesarias para facilitar el crecimiento celular y la
expansión (Woolley et al., 2001). El estudio de las estructuras secundarias de ambas proteínas ha
determinado que existen diferencias entre ambas proteínas (Llop-Tous et al., 1999). El dominio
celulosa que se presenta en la estructura Facel2 indica que esta enzima puede estar activa en los
xiloglucanos presentes en la celulosa de la pared celular (Trainotti et al., 1999). La acción de
Facel2 hidrolizaría la red de xiloglucanos en los primeros estadios del desarrollo haciéndola más
susceptible a la actividad de Facel1 (Trainotti et al, 1999; Woolley et al, 2001). El silenciamiento
de FaCel1 combinado con el de FaCel2 resultó en frutos que presentan menor actividad celulasa
y cambios en la dureza del fruto (Woolley et al., 2001; Palomer et al., 2006). Esto sugiere que
estas enzimas no son las únicas con actividad celulasa en el proceso de maduración (Palomer et
al., 2006).
Se han aislado y caracterizado en fresa varias poligalacturonasas (PG1, PG2 y PG3)
(Nogata et al., 1993; Salentijn et al., 2003; Quesada et al., 2009) y, mediante análisis
transcriptómicos en varios cultivares de fresa con diferentes firmezas, se ha comprobado su mayor

INTRODUCCIÓN
115 PhD Thesis Félix Juan Martínez Rivas
expresión y actividad en cultivares con frutos más blandos (Salentijn et al., 2003; Zhou et al.,
2015). La obtención de plantas transgénicas con la expresión de FaPG1 silenciada produjo frutos
más firmes y una disminución del reblandecimiento en la postcosecha (Quesada et al., 2009; Posé
et al., 2013). El silenciamiento de este gen redujo la solubilización y despolimerización de las
pectinas de la pared, otorgándole mayor integridad y firmeza (García-Gago et al., 2009). Mas
recientemente se han obtenido plantas transgénicas con el silenciamiento de FaPG2 y un doble
silenciamiento FaPG1-FaPG2. Así, mientras que las plantas transgénicas con FaPG2 silenciada
presentaron un aumento de la dureza del fruto, similar al fenotipo de las plantas ARNi-FaPG1, el
doble silenciamiento de FaPG1-FaPG2 no mostró un efecto sinérgico y los frutos transgénicos
obtenidos mostraron un nivel de dureza similar al obtenido tras el silenciamiento independiente
de FaPG1 o FaPG2 (Paniagua et al., 2020).
Por otro lado, otras de las enzimas relacionadas con la degradación de la pared celular
más estudiadas en fresa son las pectato liasas. Estas enzimas presentan un aumento de su
expresión a lo largo del proceso de maduración del fruto. Además, presentan una localización
asociada a la pared celular lo que indica que tienen una función importante en el proceso de
despolimerización de la pared celular (Medina-Escobar et al., 1997; Benítez-Burraco et al., 2002).
Para obtener más información sobre estas enzimas, se analizaron plantas transgénicas con el gen
FaplC silenciadas. Los frutos transgénicos obtenidos mostraron un aumento de la firmeza y menor
reblandecimiento postcosecha sin presentar diferencias en el color, tamaño o peso (Jiménez-
Bermúdez et al., 2002). Además, plantas transgénicas con una reducción casi completa del nivel
del transcrito de las PL mostraron diferencias en los polímeros de la pectina de la pared y un claro
incremento del grado de firmeza de los frutos transgénicos obtenidos (Santiago-Doménech et al.,
2008). Estos resultados indican que las PL juegan un papel primordial en la degradación de la
pared primaria y de la lámina media durante la maduración.
Otro gen implicado en la degradación de la pared son las ramnogalacuronato liasas. El
silenciamiento transitorio en fresa mantuvo íntegra la lámina media de los frutos maduros en
comparación con los frutos control. Además, se mantuvo intacta la estructura de la pared celular
y el área de contacto entre las células. Esto demuestra que FaRGlyase1 juega un papel crítico en
el reblandecimiento del fruto mediante la degradación de la lámina media (Molina-Hidalgo et al.,
2013). Se hipotetiza que la acción de las pectín metil esterasas es un requisito previo para que las
enzimas hidrolíticas como PG y PL puedan acceder a sus sustratos (Prasanna et al., 2007). Se ha
comprobado que FaPME1 presenta un incremento de expresión en el proceso de maduración
similar al de PL y PGs lo que sugiere que las actividades de estas enzimas están coordinadas para
producir la degradación de la pared. De hecho, este proceso es ordenado y en él participan las
enzimas de forma sucesiva dejando libre el sustrato para la acción de la siguiente. Los estudios
116 Functional characterization of molecular regulatory mechanisms controlling the ripening in strawberry fruit
llevados a cabo con estas enzimas y con las descritas en el apartado 5 de esta introducción las
hacen muy atractivas como dianas biotecnológicas para la mejora del reblandecimiento del fruto,
tanto retrasando como regulando este proceso antes y después de su cosecha.
10.3.2. Mejora de las propiedades organolépticas
El sabor del fruto es una de las principales características que hacen de la fresa una de las
frutas más deseadas entre los consumidores. En la última década, la mejora de sus propiedades
organolépticas ha centrado la atención de diferentes investigaciones, en gran medida debido al
aumento de la demanda del consumidor. El dulzor de la fruta, debido a la concentración de
azucares, juega un papel importante en la determinación del sabor y la calidad. La concentración
de azucares influye indudablemente en el potencial osmótico de las células, lo cual genera un
desajuste en la importación de agua y, por lo tanto, en el crecimiento del fruto. La invertasa es la
enzima responsable de catalizar la sacarosa en sus monómeros, glucosa y fructosa. El intercambio
de sacarosa entre el floema y el interior celular está regulado por una invertasa localizada en la
pared celular que regula la salida de la sacarosa al floema, mientras que otra localizada en la
vacuola regula el almacenamiento (Xie et al., 2007). La introducción de las invertasas vacuolar y
de pared de patata en fresa otorgó diferencias en el crecimiento de la planta, así como en la
composición de azucares y, por lo tanto, en el sabor y calidad del fruto (Graham et al., 1997).
El estudio de una quinasa con dominios serina/treonina (FaSnRK1) ha mostrado su papel
regulador de genes relacionados con la acumulación de azucares. Estas proteínas están
relacionadas con las modificaciones postranscripcionales de enzimas directamente relacionadas
con la síntesis de sacarosa, como sacarosa-fosfotransferasa (SPS) y sacarosa sintasa (SUS)
(Harthtill et al., 2006). La sobreexpresión de esta quinasa incrementó los niveles de sacarosa en
el fruto mientras que su silenciamiento los redujo (Luo et al., 2020). Estudios posteriores
demostraron que FaSnRK1 promueve el transporte de glucosa e inhibe su conversión regulando
la expresión de genes y la actividad de enzimas clave en la síntesis de sacarosa como son SPS y
SUS (Luo et al., 2020). Por otro lado, la sobreexpresión del miRNA399 incrementó la
concentración de azucares, de ácidos y de vitamina C, mejorando así el sabor de la fruta. Este
miRNA, relacionado con el metabolismo del fósforo, parece mejorar la tasa fotosintética y puede
mejorar la acumulación de estos metabolitos (Wang et al., 2017).
El silenciamiento de la pirofosforilasa ADP-glucosa (AGPasa) también modificó el
contenido de azúcares y de almidón en el fruto (Park et al., 2006). Este gen es especialmente
interesante porque se consiguió aumentar el contenido de azúcares y disminuir el de almidón sin
alterar otras características organolépticas clave del fruto. La identificación de estos genes sienta

INTRODUCCIÓN
117 PhD Thesis Félix Juan Martínez Rivas
una base con la identificación de diversas dianas biotecnológicas con las que mejorar el contenido
de azúcares, y por lo tanto el sabor de la fruta.
Además del contenido en azucares, el interés por mejorar otros aspectos organolépticos
del fruto ha llevado a incrementar los esfuerzos biotecnológicos dirigidos en este sentido. Muchos
de ellos usan estrategias genómicas para identificar genes que estén relacionados con el control
del sabor de la fruta. Posteriormente, se buscan marcadores moleculares asociados a estos
caracteres organolépticos para poder seguir estos genes en diferentes poblaciones y así, identificar
más fácilmente variedades con mejoras en el sabor o en el olor. Como ejemplo, asociado con la
γ-decalactona, un volátil que otorga un ligero sabor a melocotón se ha identificado a una
desaturasa de ácidos grasos, FaFAD1. Este gen está presente en variedades donde se ha
identificado la γ-decalactona y ausente en aquellos que no la producen. (Chambers et al., 2014).
De igual manera, se asocia la presencia de una metil trasferasa (FaOMT) asociada al nivel de
mesilfurano, un compuesto volátil que otorga notas de olor a cereza, que aparece en variedades
que presentan esta enzima (Cruz-Rus et al., 2017). De hecho, estos genes se usan como
marcadores para poder identificar variedades que produzcan ambos compuestos y sirven de
método de selección de estas (Cruz-Rus et al., 2017).
El color de la fresa viene determinado principalmente por la síntesis de antocianinas y
flavonoides. La síntesis de estos compuestos presenta dos fases durante el desarrollo y
maduración del fruto. En los primeros estadios del desarrollo se acumulan las proantocianidinas,
asociadas a la defensa del fruto frente a patógenos y herbívoros. Por otro lado, en los receptáculos
maduros se acumulan las antocianinas, que producen el color rojo que atrae a los herbívoros para
dispersar las semillas. El silenciamiento de una de las ramas de síntesis de proantocianidinas,
como es la sintetizada por la antocianidina reductasa (ANR), ha conseguido disminuir la
proporción de unidades de epicatequinas y producir un acortamiento en la longitud de las
proantocianidinas. Este silenciamiento consiguió redirigir la ruta de las proantocianidinas hacia
la síntesis de antocianinas mediante glucosilaciones, consiguiendo una mayor síntesis de
flavonoles (Fischer et al., 2014). De este modo, las líneas transgénicas con el gen ANR silenciado
mediante ARNi proporcionan una herramienta versátil para el estudio de las funciones biológicas
de las proantocianidinas.
Las herramientas biotecnológicas se sólo se usan para la mejora del cultivo, sino también
para el estudio del uso de compuestos o microorganismos que mejoren la composición que otorga
los valores organolépticos al fruto. Por ejemplo, la co-inoculación de plantas de fresa con una
mezcla de hongos microrrícicos y bacterias promotoras del crecimiento vegetal incrementó el
número de flores de la planta y por lo tanto la cantidad de frutos, así como la cantidad de azúcares,

118 Functional characterization of molecular regulatory mechanisms controlling the ripening in strawberry fruit
ácido fólico y ascórbico, las dos vitaminas con mayor producción en fresa (Bona et al., 2015). En
otro estudio, se han encontrado diferentes combinaciones de hongos y bacterias que mejoran
propiedades tan diferentes como la concentración de azúcares o de ácidos orgánicos (Todeschini
et al., 2017).. Así, parece relacionarse a los hongos con la parte vegetativa de la planta mientras
que las bacterias parecen tener mayor relación con las propiedades relacionadas con los frutos,
tanto en la composición de compuestos químicos como en el rendimiento de la planta (Todeschini
et al., 2017). Estos resultados proporcionan parecen indicar que la interacción microorganismos
y la planta afecta positivamente a la calidad del fruto y puede ser una estrategia para aprovechar
en la agricultura sostenible. Al igual que con la mejora del sabor, la interacción entre la planta de
fresa con ciertas especies de Pseudomonas y reduciendo la fertilización del suelo, se ha
conseguido aumentar la concentración de antocianinas, como son pelargonidina-3-glucosido y
cianidina 3-glucosido, abriendo la puerta a un cultivo de fresa donde se use una menor cantidad
de fertilizantes sin perder las cualidades organolépticas del fruto (Lingua et al., 2013).
11. Alérgenos de la fresa
Las alergias alimentarias están incrementándose en los últimos años, principalmente
debido a los componentes proteicos de los alimentos (Mills et al., 2003). Estas alergias son
producidas por un pequeño número de proteínas homólogas entre ellas cuyo principal
representante es Bet v1 de abedul. En fresa, al igual que en otros frutos, también aparecen
proteínas que producen reacciones alérgicas. En este caso, es la familia Fra a1 la que presenta
mayor homología a Bet v1 (Muñoz et al., 2010). Estas proteínas son capaces de unirse a
inmunoglobulinas E y desarrollar la respuesta inmune (Karlsson et al., 2004; Musidlowska-
Persson et al., 2007).
Hasta 8 proteínas Fra a1 se han identificado en fresa pertenecientes a diferentes familias,
desde proteínas PR de repuesta a patógenos a proteínas transportadoras de lípidos (Zuidmeer et
al., 2006). En la búsqueda de variedades con menor contenido de alérgenos, se han realizado
estudios proteómicos en los que se han comparado variedades blancas con variedades rojas. El
contenido de alérgenos fue menor en las variedades blancas que en las rojas, lo que relaciona el
contenido de estos compuestos con la síntesis de antocianinas (Hjernø et al., 2006; Alm et al.,
2007; Muñoz et al., 2010; Seutter von Loetzen et al., 2012; Franz-Oberdorf et al., 2017). Se cree
que las proteínas Fra a pueden formar complejos multiproteicos con enzimas relacionadas con la
biosíntesis de flavonoides, como PAL, CHS y C4H, lo que podría explicar su ausencia en
genotipos blancos. Fra a también puede estar implicado en el transporte de los flavonoides a través
de la célula y jugar un papel regulador en la señalización intracelular debido a su capacidad de
unión específica a estos compuestos (Casañal et al., 2013).

INTRODUCCIÓN
119 PhD Thesis Félix Juan Martínez Rivas
Otros alérgenos presentes en la fresa son las profilinas y las proteínas de transferencia de
lípidos (LTP), que se encuentran muy expresadas en el fruto y se acumulan, principalmente, en
situaciones de estrés abiótico (Yubero-Serrano et al., 2003). No obstante, la expresión en
levaduras de LTPs y profilinas de fresa mostró una menor alergenicidad de estas proteínas que
sus homólogos de manzana o melocotón, por lo que pueden ser empleadas en tratamientos de
inmunoterapia (Zuidmeer et al., 2006).
12. Importancia económica del fruto de fresa
La fresa es una de las frutas más consumidas y forma parte de la dieta de millones de
personas. Su cultivo se extiende a diversas regiones del mundo, desde los polos hasta los trópicos,
aunque se concentra mayoritariamente en el hemisferio norte. No existen barreras genéticas ni
climáticas al cultivo. En los últimos años, el cultivo de fresa ha aumentado año tras año. Tomando
como referencia los 10 últimos años con datos disponibles (2008-2018, FAO 2018), España es el
quinto productor del mundo y primer productor de Europa, con una media de 310 toneladas
anuales, aproximadamente el 30% del total del continente (Figura 17, FAO 2018). La República
Popular de China es el primer productor de fresa en el mundo, con 235 millones de toneladas,
aproximadamente el 25% del total, seguida por Estados Unidos, México, Turquía y España
(Figura 17).
En España, mientras la producción ha aumentado en los últimos años, de unas 200 mil
toneladas en la década de los 90 a 400 mil en los tres últimos años, la superficie cultivada se ha
visto reducida debido a una mejora en el rendimiento del cultivo (FAO, 2018, Figura 18A). Dentro
de la producción española, la provincia de Huelva concentra el 90-95% de la producción total
(Figura 18B, Anuario CAPDR, 2018). De toda la producción, más del 80% de ésta se exporta,
siendo Alemania su principal destino. El valor de las exportaciones asciende a más de 400
millones de euros por lo que el cultivo de la fresa es uno de los principales motores económicos
de Andalucía. Sin embargo, una gran parte de la producción (5-25%) se pierde debido al
reblandecimiento a lo largo de la maduración, por el transporte o a la infección por patógenos
(López-Aranda, 1997).
Tal y como se ha visto en esta introducción, la investigación en la mejora biotecnológica
de este cultivo es un campo activo en la investigación. Aun así, su aplicación es muy limitada
debido al coste económico de los programas de desarrollo. Además, la legislación europea aún
prohíbe el cultivo y comercialización de plantas transgénicas, lo cual hace poco llamativo este
tipo de estudios al público en general. Dentro de todos los frutos, la fresa es especialmente

120 Functional characterization of molecular regulatory mechanisms controlling the ripening in strawberry fruit
interesante para la mejora mediante biotecnología avanzada debido a su alta producción
(Mezzetti, 2003). Actualmente, la transformación de la fresa sigue siendo un proceso lento y
costoso, que puede necesitar de meses para la obtención de brotes e incluso años para el cultivo
de la planta, además de presentar una baja eficiencia (Liu y Sanford, 1988; Nehra et al.,1990;
Barceló et al., 1998; Passey et al., 2003). No obstante, la mejora genética de la fresa sigue siendo
un gran atractivo y se considera un modelo interesante para el desarrollo de la genómica y de
estudios de ADN recombinante entre las diferentes especies de Rosaceas. Esta mejora genética
puede estar motivada por el desarrollo de la tecnología CRISPR/Cas9 que permite la edición
génica sin necesidad de insertar moléculas foráneas en el genoma de la planta (Jinek et al., 2012).
A pesar de ser una tecnología relativamente novedosa, ya se han demostrado las primeras
aplicaciones en fresa, tanto en las especies diploides (F. vesca,) como en las octoploides (F.
ananassa) (Martín-Pizarro et al., 2018; Zhou et al., 2018). Los resultados en la especie octoploide
son especialmente alentadores ya que, a pesar de que teóricamente pueden presentar mayor
dificultad de editado, los resultados obtenidos ponen de manifiesto que la edición mediada por
CRISPR/Cas9 es un sistema que puede usarse en la mejora de F. ananassa.
Figura 17. Principales países productores de fresa en el periodo 2008-2018 (FAO, 2018).
0
500000
1000000
1500000
2000000
2500000
Med
ia d
e p
rod
ucc
ión
an
ual
(Tm
)

INTRODUCCIÓN
121 PhD Thesis Félix Juan Martínez Rivas
Figura 18. A) Producción de fresa y área cultivada en España en el periodo 2008-2018 (FAO, 2018)
B) Producción y área cultivada en la provincia de Huelva en el periodo 2011-2018. (CAPDR, 2018).
6000
6500
7000
7500
8000
8500
0
50000
100000
150000
200000
250000
300000
350000
400000
450000
2008 2009 2010 2011 2012 2013 2014 2015 2016 2017 2018
Are
a cu
ltiv
ada
po
r añ
o
Pro
du
ccuó
n p
or
año
Producción (Tm) Superficie cultivada (Ha)
A
B

122 Functional characterization of molecular regulatory mechanisms controlling the ripening in strawberry fruit
Bibliografía
Adams-Phillips L, Barry C, Giovannoni J. 2004. Signal transduction systems regulating fruit ripening.
Trends in Plant Science 9: 331–338.
Agius F, González-Lamothe R, Caballero JL, Muñoz-Blanco J, Botella MA, Valpuesta V. 2003.
Engineering increased vitamin C levels in plants by overexpression of a D-galacutronic acid reductase.
Nature Biotechnology 21: 177-181.
Aharoni A, Giri AP, Verstappen FW, Bertea CM, Sevenier R, Sun Z, Jongsma MA, Schwab W,
Bouwmeester HJ. 2004. Gain and loss of fruit flavor compounds produced by wild and cultivated
strawberry species. Plant Cell 16: 3110-3131.
Aharoni A, Keizer LCP, van der Broeck HC, Blanco-Portales R, Muñoz-Blanco J, Bois G, Smit, P,
de Vos RCH, O´Conell AP. 2002a. Novel insight into vascular, stress, and auxin-dependent and
independent gene expression programs in strawberry, a non-climacteric fruit. Plant Physiology 129: 1019-
1031.
Aharoni A, Ric de Vos CH, Verhoeven HA, Maliepaard CA, Kruppa G, Bino R, Goodenowe DB.
2002b. Non targeted metabolome analysis by use of fourier transform ion cyclotron mass spectrometry.
OMICS, A Journal of Integrative Biology 6: 217-234.
Aharoni A, O’Connell A. 2002. Gene expression analysis of strawberry achene and receptacle maturation
using DNA microarrays. Journal of Experimental Botany 53: 2073-2087.
Aharoni A, Vorst O. 2001a. DNA microarrays for functional plant genomics. Plant Molecular Biology
48: 99-118.
Aharoni A, De Vos RCH, Wein M, Sun Z, Greco R, Kroon A, Mol JNM, O’Connell A. 2001b. The
strawberry FaMYB1 transcription factor suppresses anthocyanin and flavonol accumulation in transgenic
tobacco. Plant Journal 28: 319-332.
Aharoni A, Keizer LCP, Bouwmeester HJ, Sun ZK, Alvarez-Huerta M, Verhoeven HA, Blaas J, van
Houwelingen A, de Vos RCH, van der Voet H, Jansen RC, Guis M, Mol J, Davis RW, Schena M, van
Tunen AJ, O’Connenell AP. 2000.Identification of the SAAT gene involved in strawberry flavor
biogenesis by use of DNA microarrays. Plant Cell 12: 647-661.
Albani MC, Battey NH, Wilkinson MJ. 2004. The development of ISSR-derived SCAR markers around
the SEASONAL FLOWERING LOCUS (SFL) in Fragaria vesca. Theoretical and Applied Genetics 109:
571–579.
Alexander L, Grierson D. 2002. Ethylene biosynthesis and action in tomato: a model for climacteric fruit
ripening. Journal of Experimental Botany 53: 1039-2055.
Alleva K, Marquez M, Villareal N, Mut P, Bustamante C, Bellati J, Martínez G, Civello M, Amodeo
G. 2010. Cloning, functional characterization, and co-expression studies of a novel aquaporin (FaPIP2;1)
of strawberry fruit. Journal of Experimental Botany 61: 3935-3945.
Alm R, Ekefjard A, Krogh M, Hakkinen J, Emanuelsson C. 2007. Proteomic variation is as large within
as between strawberry varieties. Journal of Proteome Research 6: 3011– 3020.
Almeida J, D’Amico E, Preuss A, Carbone F, Ric de Vos CH, Deiml B. Mourgues F, Perrotta G,
Fischer TC, Bovy AG, Martens S, Rosati C. 2007. Characterization of major enzymes and genes involved

INTRODUCCIÓN
123 PhD Thesis Félix Juan Martínez Rivas
in flavonoid and proanthocyanidin biosynthesis during fruit development in strawberry (Fragaria x
ananassa). Archives of Biochemistry and Biophysics 465: 61–71.
Alvarez-Suarez A, Giampieri F, Tulipani S, Casoli T, Di Stefano G, González Paramás AM, Santos-
Buelga C, Busco F, Quiles JL, Cordero MD, Bompadre S, Mezzetti B, Bettino M. 2014. One-month
strawberry rich anthocyanin supplementation ameliorates cardiovascular risk, oxidative stress marker and
platelet activation in humans. Journal of Nutritional Biochemestry 25: 289-294.
Amaya I, Osorio S, Martinez-Ferri E, Lima-Silva V, Doblas VG, Fernández-Muñoz R, Fernie AR,
Botella MA, Valpuesta V. 2015. Increased antioxidant capacity in tomato by ectopic expression of the
strawberry D-galacturonate reductase gene. Biotechnology Journal 10: 490-500.
Anciro A, Mangandi J, Verma S, Peres N, Whitaker VM, Lee S. 2018. FaRCg1 a quantitative trait locus
conferring resistance to Colletotrichum crown rot caused by Colletotrichum gloeosporoides in octoploid
strawberry. Theoretical and Applied Genetics 131: 2167-2177.
Antanaviciute L, Šurbanovski N, Harrison N, McLeary KJ, Simpsons DW, Wilson F, Sargent DJ,
Harrison RJ. 2015. Mapping QTL associated with Verticillium dahliae resistance in the cultivated
strawberry (Fragaria x ananassa). Horticulture research 2: 15009.
Anterola AM, Jeon JH, Davin LB, Lewis NG. 2002. Transcriptional Control of Monolignol Biosynthesis
in Pinus taeda. Factors affecting monolignol ratios and carbon allocation in phenylpropanoid metabolism.
Journal of Biological Chemistry 277: 18272- 80.
Anttonen MJ, Hoppula KI, Nestby R, Verheul MJ, Karjalainen RO. 2006. Influence of fertilization,
mulch color, early forcing, fruit order, planting date, shading, growing environment, and genotype on the
contents of selected phenolics in strawberry (Fragaria × ananassa Duch.) fruits. Journal of Agricultural
Food Chemistry 54: 2614–2620.
Archbold DD, Dennis FG. 1984. Quantification of free ABA and free and conjugated IAA in strawberry
achene and receptacle tissue during fruit development. Journal of the American Society of Horticultural
Science 109: 330-335.
Arroyo FT, Moreno J, Daza P, Boianova L, Romero F. 2007. Antifungal activity of strawberry fruit
volatile compounds against Colletotrichum acutatum. Journal of Agricultural Food Chemistry 55: 5701–
5707.
Asao HG, Nishizawa Y, Arai S, Sato T, Hirai M, Yoshida K. 1997. Enhanced resistance against a fungal
pathogen Sphaerotheca fumuli in transgenic strawberry expressing a rice chitinase gene. Plant
Biotechnology 14: 145–149.
Asao HG, Arai S, Nishizawa Y. 2003. Environmental risk evaluation of transgenic strawberry expressing
a rice chitinase gene. Seibutsu Kogakkaishi 81: 57–63 (in Japanese with English Abstract).
Asen S, Stewart RN, Norris KH. 1972. Co-pigmentation of anthocyanins in plant tissues and its effect on
colour. Phytochemistry 11: 1139-1144.
Bakker J, Bridle P, Bellworthy SJ. 1994. Strawberry juice colour: A study of the quantitative and
qualitative pigment composition of juices from 39 genotypes. Journal Science Food Agriculture 64: 31–
37.
Barritt BH, Shanks CH. Jr. 1980. Breeding strawberries for resistance to aphids Chaetosiphon fragaefolii
and C. tomassi. HortScience 15: 287–288.

124 Functional characterization of molecular regulatory mechanisms controlling the ripening in strawberry fruit
Barritt BH, Shanks CH. Jr. 1981.Parent selection in breeding strawberries resistant to two-spotted spider
mites. HortScience 16: 323–324.
Basu AA, Nguyen NM, Lyons TJ. 2014. Strawberry as a functional food: an evidence-based review.
Critical Reviews in Food Science and Nutrition 54: 790-806.
Battey NH, Tooke F. 2002. Molecular control and variation in the floral transition. Current Opinion in
Plant Biology 5: 62–68.
Baudry A, Heim MA, Dubreucq B, Caboche M, Weisshaar B, Lepiniec L. 2004. TT2, TT8, and TTG1
synergistically specify the expression of BANYULS and proanthocyanidin biosynthesis in Arabidopsis
thaliana. The Plant Journal 39: 366-380.
Beekwilder J, Álvarez-Huerta M, Neef E, Verstappen FW, Bouwmeester HJ, Aharoni A. 2004.
Functional characterization of enzymes forming volatile esters from strawberry and banana. Plant
Physiology 135: 1865–1878.
Ben-Arie R, Faust M. 1980.ATPase in ripening strawberries. Phytochemistry 19: 1631-1636.
Benítez-Burraco A, Blanco-Portales R, Redondo-Nevado J, Bellido ML, Moyano E, Caballero JL,
Muñoz-Blanco J. 2002. Cloning and characterization of two ripening related strawberry (Fragaria x
ananassa cv Chandler) pectate lyase genes. Journal of Experimental Botany 54: 633-645.
Besbes F, Habegger R, Schwab W. 2019. Induction of PR-10 genes and metabolites in strawberry plants
in response to Verticillium dahliae infection. BMC Plant Biology 19: 128.
Blanco-Portales R, Medina-Escobar N, López-Ráez JA, González-Reyes JA, Villalba JM, Moyano E,
Caballero JL, Muñoz-Blanco J. 2002. Cloning, expression and immunolocalization pattern of a cynnamyl
alcohol dehydrogenase gene from strawberry (Fragaria x ananassa cv. Chandler). Journal of Experimental
Botany 53: 1723–1734.
Blanco-Portales R, Pineda M, Muñoz-Blanco J. 2003. Estudios moleculares sobre dos genes de fresa
(Fragaria x ananassa cv. Chandler) relacionados con el proceso de maduración del fruto. Tesis doctoral,
Universidad de Córdoba.
Blanco-Portales R, López-Ráez JA, Bellido ML, Moyano E, Dorado G, González- Reyes JA,
Caballero JL, Muñoz-Blanco J. 2004. A strawberry fruit-specific and ripening-related gene codes for a
HyPRP protein involved in polyphenol anchoring. Plant Molecular Biology 55: 763-780.
Bombarely A, Merchante C, Csukasi F, Cruz-Rus E, Caballero JL, Medina-Escobar N, Blanco-
Portales R, Botella MÁ, Muñoz-Blanco J, Sanchez-Sevilla J, Valpuesta V. 2010. Generation and
analysis of ESTs from strawberry (Fragaria x ananassa) fruits and evaluation of their utility in genetic and
molecular studies. BMC Genomics 11: 503.
Bona E, Lingua G, Manassero P, Cantamessa S, Marsano F, Todeschini V, Copetta A, D’Agostino G,
Massa N, Avidano L, Gamalero E, Berta G. 2015. AM fungi and PGP pseudomonads increase flowering,
fruit production, and vitamin content in strawberry grown at low nitrogen and phosphorus levels.
Mycorrhiza 25: 181-193.
Bradford E, Hancock JF, Warner RM. 2010. Interactions of temperature and photoperiod determine
expression of repeat flowering in strawberry. Journal of the American Society for Horticultural Science
135: 102–107.
Bringhurst RS. 1990. Cytogenetics and Evolution in American Fragaria. HortScience 25: 879–881.

INTRODUCCIÓN
125 PhD Thesis Félix Juan Martínez Rivas
Brown T, Wareing P. 1965.Genetical control of everbearing habit and 3 other characters in varieties of
Fragaria vesca. Euphyticya 14: 97–112.
Brummell DA, Harpster MH. 2001. Cell wall metabolism in fruit softening and quality and its
manipulation in transgenic plants. Plant Molecular Biology 47: 311-340.
Brummell DA, Harpster M, Dunsmuir P. 1999. Differential expression of expansin gene family members
during growth and ripening of tomato fruit. Plant Molecular Biology 39: 161-169.
Bulley S. Wright M, Rommens C, Yan H, Rassam M, Lin‐Wang K, Andre C, Brewster D,
Karunairetnam S, Allan AC, Laing WA. 2012. Enhancing ascorbate in fruits and tubers through over‐
expression of the l‐galactose pathway gene GDP‐l‐galactose phosphorylase. Plant Biotechnology Journal
10: 390-397.
Bustamante CA, Rosli HG, Añón MC, Civello PM, Martínez GA. 2006. -Xylosidase in strawberry
fruit: isolation of a full-length gene and analysis of its expression and enzymatic activity in cultivars with
contrasting firmness. Plant Science 171: 497-504.
Bustamante CA, Civello PM, Martínez GA. 2009. Cloning of the promoter region of -xylosidase
(FaXyl1) gene and effect of plant growth regulators on the expression of FaXyl1 in strawberry fruit. Plant
Science 177: 49-56.
Casañal A, Zander U, Dupeux F, Valpuesta V, Marquez JA. 2013. Purification, crystallization and
preliminary X-ray analysis of the strawberry allergens Fra a 1E and Fra a 3 in the presence of catechin.
Acta Crystallographica Section F Structural Biology and Cristallization Communications 69: 510-514.
Casañal A, Zander U, Muñoz C, Dupeux F, Luque I, Botella MA, Schwab W, Valpuesta V, Marquez
JA. 2013. The strawberry pathogenesis-related 10 (PR-10) Fra a proteins control flavonoid biosynthesis by
binding to metabolic intermediates. The Journal Biological Chemistry 49: 35322-35332.
Castillejo C, de la Fuente JI, Iannetta P, Botella MA, Valpuesta V. 2004. Pectin esterase gene family
in strawberry fruit: study of FaPE1, a ripening-specific isoform. Journal of Experimental Botany 55: 909-
918.
Chai Y, Zhang Q, Tian L, Li CH, Xing Y, Qin L, Shen YY. 2013 Brassinosteroid is involved in
strawberry fruit ripening. Plant Growth Regulation 69: 63-69.
Chalavi V, Tabaeizadeh Z, Thibodeau P. 2003. Enhanced resistance to Verticillium dahliae in transgenic
strawberry plants expressing a Lycopersicon chilense chitinase gene. Journal of the American Society for
Horticultural Science128: 747–753.
Chambers AH, Pillet J, Plotto A, Bai J, Whitaker VM, Folta KM. 2014. Identification of a strawberry
flavor gene candidate using an integrated genetic-genomic-analytical chemistry approach. BMC Genomics
15: 215-217.
Cheng GW, Breen PJ. 1991. Activity of phenylalanine ammonia-lyase (PAL) and concentrations of
anthocyanins and phenolics in developing strawberry fruit. Journal of the American Society for
Horticultural Science 116: 865-869.
Cheng GW, Breen PJ. 1992. Cell count and size in relation to fruit size among strawberry cultivars.
Journal of the American Society for Horticultural Science 117: 946-950.
Cheng J, Niu Q, Zhang B, Chen K, Yang R, Zhu JK, Zhang Y, Lang Z. 2018. Downregulation of
RdDM during strawberry fruit ripening. Genome Biology 19: 212.

126 Functional characterization of molecular regulatory mechanisms controlling the ripening in strawberry fruit
Chervin C, El-Kereamy A, Roustan JP, Latche A, Lamon J, Bouzayen M. 2004. Ethylene seems
required for the Berry development and ripening in grape, a non-climacteric fruit. Plant Science 167: 1301–
1305.
Choi Y, Gehring M, Johnson L, Hannon M, Harada JJ, Goldberg RB, Jacobsen SE, Fischer RL.
2002. DEMETER, a DNA glycosylase domain protein, is required for endosperm gene imprinting and seed
viability in Arabidopsis. Cell 110:33–42.
Civello PM, Martínez GA, Chaves AR, Añón MC. 1995. Peroxidase from strawberry fruit (Fragaria x
ananassa Duch): Partial purification and determination of some properties. Journal of Agricultural Food
Chemistry 43: 2596-2601.
Civello PM, Powell ALT, Sabehat A, Bennett AB. 1999. An expansin gene expressed in ripening
strawberry fruit. Plant Physiology 212: 1273-1279.
Cockerton HM, Li B, Vickerstaff RJ, Eyre CA, Sargent DJ, Armitage AD, Marina-Montes C, Garcia-
Cruz A, Passey AJ, Simpson DW, Jonathan-Harrison R. 2019 Identifying Verticillium dahliae
resistance in strawberry through disease screening of multiple populations and image-based phenotyping.
Frontiers in Plant Science. 10: 924.
Cockshull KE, Graves CJ, Cave CRJ. 1992. The influence of shading on yield of glasshouse tomatoes.
Journal of Horticultural Science 67: 11-24.
Concha CM, Figueroa NE, Poblete LA, Oñate FA, Schwab W, Figueroa CR. 2013. Methyl jasmonate
treatment induces changes in fruit ripening by modifying the expression of several ripening genes in
Fragaria chiloensis fruit. Plant Physiology and Biochemistry 70: 433-444.
Crecente-Campo J, Nunes-Damaceno M, Romero-Rodríguez MA, Vázquez-Odériz ML. 2012 Color,
anthocyanin pigment, ascorbic acid and total phenolic compound determination in organic versus
conventional strawberries (Fragaria x ananassa Duch, cv Selva). Journal of Food Composition and Analysis
28: 23-30.
Cruz-Rus E, Sesmero R, Ángel-Pérez JA, Sánchez-Sevilla JF, Ulrich D, Amaya I. 2017. Validation of
a PCR test to predict the presence of flavor volatiles mesifurane and γ-decalactone in fruits of cultivated
strawberry (Fragaria x ananassa). Molecular Breeding. 37: 131.
Csukasi F, Osorio S, Gutierrez JR, Kitamura J, Giavalisco P, Nakajima M, Fernie AR, Rathjen JP,
Botella MA, Valpuesta V, Medina-Escobar N. 2011. Gibberellin biosynthesis and signaling during
development of the strawberry receptacle. New Phytologist 191: 376–390.
Cumplido-Laso G, Medina-Puche L, Moyano E, Hoffmann T, Sinz Q, Ring L, Studart-Wittkowski
C, Caballero JL, Schwab W, Muñoz-Blanco J, Blanco-Portales R. 2012. The fruit ripening-related gene
FaAAT2 encodes an acyl transferase involved in strawberry aroma biogenesis. Journal of Experimental
Botany 63: 4275-4290.
da Silva FL, Escribano-Bailn MT, Pérez Alonso JJ, Rivas-Gonzalo JC, Santos- Buelga C. 2007.
Anthocyanin pigments in strawberry. LWT – Food Science Technology 40:374–382.
Daminato M, Guzzo F, Casadoro G. 2013. A SHATTERPROOF-like gene controls ripening in non-
climacteric strawberries, and auxin and abscisic acid antagonistically affect its expression. Journal of
Experimental Botany 64: 3775-3786.

INTRODUCCIÓN
127 PhD Thesis Félix Juan Martínez Rivas
Darnell RL, Martin GC. 1988. Role of assimilate translocation and carbohydrate accumulation in fruit set
of strawberry. Journal of the American Society for Horticultural Science 113: 114-118.
Darrow GM. 1966. The Strawberry. New York: Holt, Rinehart & Winston.
Davies C, Boss PK, Robinson SP. 1997. Treatment of grape berries, a non-climacteric fruit with a synthetic
auxin, retards ripening and alters the expression of developmentally regulated genes. Plant Physiology 115:
1155–1161.
Davies PJ. 2004. Introduction. The plant hormones: their nature, occurrence, and functions. In: Davies PJ,
ed. Plant hormones biosynthesis, signal transduction, action! Dordrecht, The Netherlands: Kluwer
Academic Publishers 1–15.
de la Fuente J, Amaya I, Castillejo C, Sanchez-Sevilla JF, Quesada MA, Botella MA, Valpuesta V.
2006. The strawberry gene FaGAST affects plant growth through inhibition of cell elongation. Journal
Experimental Botany 57: 2401–2411.
Dennis FG. 1984. Fruit development. Physiological basis of crop growth and development. M.B. Tesar,
(Eds.) Madison: American Society of Agronomy 265-288.
Denoyes-Rothan B, Guérin G, Lerceteau-Köhler E, Risser G. 2005. Inheritance of a resistance to
Colletotrichum acutatum in Fragaria x ananassa. Phytopathology 95: 405–412.
Dotto MC, Martínez GA, Civello PM. 2006. Expression of expansin genes in strawberry varieties with
contrasting fruit firmness. Plant Physiology Biochemistry 44: 301– 307.
Dragišić Maksimović J, Poledica M, Mutavdžić D, Mojović M, Radivojević D, Milivojević J. 2015.
Variation in nutritional quality and chemical composition of fresh strawberry fruit: combined effect of
cultivar and storage. Plant Foods for Human Nutrition 70: 77-84.
Dreher TH, Poovaiah BW. 1982. Changes in auxin content during development in strawberry fruit.
Journal of Growth Regulation 1: 267-276.
Du J, Johnson LM, Groth M, Feng S, Hale CJ, Li S, Vashisht AA, Gallego-Bartolomé J, Wohlschlegel
JA, Patel DJ, Jacobsen SE. (2014). Mechanism of DNA methylation-directed histone methylation by
KRYPTONITE. Molecular Cell 55: 495–504.
Du H, Zhang L, Liu L, Tang XF, Yang WJ, Wu YM, Huang YB, Tang YX. 2009. Biochemical and
molecular characterization of plant MYB transcription factor family. Biochemistry 74: 1-11.
Duangsrisai S, Yamada K, Bantog NA, Shiratake K, Kanayama Y, Yamaki S. 2007. Presence and
expression of NAD+-dependent sorbitol dehydrogenase and sorbitol-6-phosphate dehydrogenase genes in
strawberry. Journal Horticultural Science Biotechnology 82: 191–198.
Edger PP, VanBuren R, Colle M, Poorten TJ, Wai CM, Niederhuth CE, Alger EI, Ou S, Acharya
CB, Wang J, Callow P, McKain MR, Shi J, Collier C, Xiong Z, Mower JP, Slovin JP, Hytönen T,
Jiang N, Childs KL, Knapp SJ. 2017. Single-molecule sequencing and optical mapping yields an
improved genome of woodland strawberry (Fragaria vesca) with chromosome-scale contiguity.
GigaScience gix124.
Edger PP, Poorten TJ, VanBuren R, Hardigan MA, Colle M, McKain MR, Smith RD, Teresi SJ,
Nelson ADL, Wai CM, Alger EI, Bird KA, Yocca AE, Pumplin N, Ou S, Ben-Zvi G, Brodt A, Baruch
K, Swale T, Shiue L, Acharya CB, Cole GS, Mower JP, Childs KL, Jiang N, Lyons E, Freeling M,

128 Functional characterization of molecular regulatory mechanisms controlling the ripening in strawberry fruit
Puzey JR, Knapp SJ. 2019. Origin and evolution of the octoploid strawberry genome. Nature Genetics
51: 541-547.
El-Kazzaz MK, Sommer NF, Forlage RJ. 1983. Effect of different atmospheres on postharvest decay and
quality of fresh strawberries. Phytopathology 73: 282-285.
Encinas-Villarejo S, Maldonado AM, Amil-Ruiz F, De los Santos B, Romero F, Pliego-Alfaro F,
Muñoz Blanco J, Caballero JL. Evidence for a positive regulatory role of strawberry (Fragaria x
ananassa) FaWRKY1 and Arabidopsis AtWRKY71 proteins in resistance. Journal of Experimental Botany.
60: 3043-3065.
Erendorfer F. 1983. Sinopsis del reino vegetal. En Tratado de Botánica, Strasburger, E., Noll, F., Schenk,
H., Schimper, A.F.W., Von Denffer, D., Ehrendorfer, F., Bresinsky, A. y Ziegler, H. (Eds.). Barcelona:
Omega, pp: 854-856.
Eshghi S, Tafazoli E. 2007. Possible role of cytokinins in flower induction in strawberry. American
Journal Plant Physiology 2: 167–174.
Estrada-Johnson E, Csukasi F, Pizarro CM, Vallarino JG, Kiryakova Y, Vioque A, Brumos J,
Medina-Escobar N, Botella MA, Alonso JM, Fernie AR, Sánchez-Sevilla JF, Osorio S, Valpuesta V.
2017 Transcriptomic análisis in strawberry fruits reveals active auxin biosynthesis and signaling in the ripe
receptacle. Frontiers in Plant Science 8: 889.
Fan J, Hill L, Crooks C, Doerver P, Lamb C. 2009. Abcisic acid has a key role in modulating diverse
plant-pathogen interaction. Plant Physiology 150: 1750-1761.
FAOSTAT 2018. Base de datos estadísticos de la Organización de las Naciones Unidas para la Agricultura
y la Alimentación (FAO). http://faostat.fao.org.
Federova NJ. 1946. Crossability and phylogenetic relations in the main European species of Fragaria.
Compilation of the National Academy of Sciences USSR 52: 545–547.
Ferrer J. 1997. Las células de los tejidos vegetales. Ed. Vedrá.
Filippone MP, Diaz Ricci J, Mamaní de Marchese A, Farías RN, Castagnaro A. 1999. Isolation and
purification of a 316 Da preformed compound from strawberry (Fragaria x ananassa) leaves active against
plant pathogens. FEBS Letters 459: 115–118.
Fischer TC, Mirbeth B, Rentsch J, Sutter C, Ring L, Flachowsky H, Habegger R, Hoffmann R, Hanke
MV, Schwab W. 2014. Premature and ectopic anthocyanin formation by silencing of anthocyanidin
reductase in strawberry (Fragaria × ananassa). New Phytologist 201: 440-451.
Fonseca S, Hackler L Jr, Zvara A, Ferreira S, Baldé A, Dudits D, Pais MS, Puskás LG. 2004.
Monitoring gene expression along pear fruit development, ripening and senescence using cDNA
microarrays. Plant Science 167: 457-469.
Forney CF, Breen PJ. 1985. Dry matter partitioning and assimilation in fruiting and de-blossomed
strawberry. Journal of the American Society for Horticultural Science 110:181-185.
Forney CF, Breen PJ. 1986. Sugar content and uptake in the strawberry fruit. Journal of the American
Society for Horticultural Science 111: 241-247.
Franz-Oberdorf K, Eberlein B, Edelmann K, Bleichr P, Kurze E, Helm D, Olbricht K, Darsow U,
Ring J, Schwab W. 2017. White-fruited strawberry genotypes are not per se hypoallergenic. Food
Research International 100: 748-756.

INTRODUCCIÓN
129 PhD Thesis Félix Juan Martínez Rivas
Freshuelva 2005. Asociación onubense de productores y exportadores de fresas. http://www.freshuelva.es
Galli V, Messias RS, Guzman F, Perin EC, Margis R, Rombaldi C. 2019. Transcriptome analysis of
strawberry (Fragaria x ananassa) fruits under osmotic stresses and identification of genes related to
ascorbic acid pathway. Physiologia Plantarum 166: 979-995.
Gapper N, McQuinn R, Giovannoni J. 2013. Molecular and genetic regulation of fruit ripening. Plant
Molecular Biology 82: 575-591.
García-Gago JA, Posé S, Muñoz-Blanco J, Quesada MA, Mercado JA. 2009. The polygalacturonase
FaPG1 gene plays a key role in strawberry fruit softening. Plant Signaling & Behavior 4: 766-768.
Garriga M, Raddtz N, Véry AA, Sentenac H, Rubio-Meléndez ME, González W, Dreyer I. 2017.
Cloning and functional charactetization of HKT1 and AKT1 genes of Fragaria spp.- relationship to plant
response to salt stress. Journal of Plant Physiology 210: 9-17.
Gaston A, Perrotte J, Lerceteau-Köhler E, Rousseau-Gueutin M, Petit A, Hernould M, Rothan C,
Denoyes B. 2013. PFRU, a single dominant locus regulates the balance between sexual and asexual plant
reproduction in cultivated strawberry. Journal of Experimental Botany 64: 1837-1848.
Giampieri F, Forbes-Hernandez TY, Gasparrini M, Alvarez-Suarez JM, Afrin S, Bompadre S,
Quiles JL, Mezzetti B, Battino M. 2015. Strawberry as a health promoter: an evidence-based review.
Food & Function 6: 1386-1398.
Giménez G, Ballington JR. 2002. Inheritance of resistance to Colletotrichum acutatum Simmonds on
runners of garden strawberry and its backcrosses. HortScience 37: 686–690.
Giovannoni JJ. 2004. Genetic regulation of fruit development and ripening. The Plant Cell 16: S170–
S180.
Given NK, Venis NA, Grierson D. 1988a. Phenylalanine ammonia-lyase activity and anthocyanin
synthesis in ripening strawberry fruit. Journal of Plant Physiology 133: 25-30.
Given NK, Venis NA, Grierson D. 1988b. Hormonal regulation of ripening in the strawberry, a non-
climateric fruit. Planta 174: 402-404.
Gomez-Cadenas A, Tadeo FR, Talon M, Primo-Millo E. 1996. Leaf abscission induced by ethylene in
water-stressed intact seedlings of cleopatra mandarin requires previous abscisic acid accumulation in roots.
Plant Physiology 112: 401-408.
Gong S, Yamazaki M, Sugiyama M, Tanaka Y, Saito K. 1997. Cloning and molecular analysis of
structural genes involved in anthocyanin biosynthesis and expressed in a forma specific manner in Perilla
frutescens. Plant Molecular Biology 35: 915-927.
Graham J, Machray G, Manoir J. du, Roucou JF, McNicol RJ, Davies H, Du Manoir J. 1997.
Integration of an invertase gene to control sucrose metabolism in strawberry cultivars. Acta Horticulturae
439: 161–163.
Green A. 1971. Soft Fruits. In The Biochemistry of Fruits and theirs Products. A.C. Hulme, ed. London:
Academic Press, pp: 375-409.
Gu X, Chen Y, Gao Z, Qiao Y, Wang X. 2015. Transcription factors and anthocyanin genes related to
low-temperature tolerance in rd29A:RdreB1BI transgenic strawberry. Plant Physiology and Biochemestry
89: 31-43
130 Functional characterization of molecular regulatory mechanisms controlling the ripening in strawberry fruit
Gu X, Gao Z, Zhuang W, Qiao Y, Wang X, Mi L, Zhang Z, Lin Z. 2013. Comparative proteomic
analysis of rd29A:RdreB1BI transgenic and non-transgenic strawberries exposed to low temperature.
Journal of Plant Physiology 170: 696-706.
Gu X, Zhihong G, Yan Y, Wang X, Qiao Y, Chen Y. 2017. RdreB1BI enhances drought tolerance by
activating AQP-related genes in transgenic strawberry. Plant Physiology and Biochemistry 119: 33-42.
Guo DL, Li Q, Zhao HL, Wang ZG, Zhang GH, Yu YH. 2019. The variation of berry development and
DNA methylation after treatment with 5-azaC on ‘Kyoho’ grape. Scientia Horticulturae 246: 265-271.
Hadfield KA, Dandekar AM, Romani RJ. 1993. Demethylation of ripening specific genes in tomato
fruit. Plant Science 92: 13–18.
Häkkinen SH, Kärenlampi SO, Mykkänen HM, Törrönen AR. 2000. Influence of domestic processing
and storage on flavonol contents in berries. Journal of Agriculture and Food Chemistry 48: 2960-2965.
Hancock JF. 1999. Strawberries. Crop Production science in Horticulture. CABI Publishing.
Hannum SM. 2004. Potential impact of strawberries on human health: a review of science. Critical
Reviews in Food Science 44: 1–17.
Harker FR, Redgwell RJ, Hallett IC, Murray SH, Carter G. 2000. Texture of Fresh Fruit. In
Horticultural Reviews. John Wiley & Sons, Inc., pp 121-224.
Harpster MH, Brummell DA, Dunsmuir P. 1998. Expression analysis of a ripening specific, auxin-
repressed endo--1,4-glucanase gene in strawberry. Plant Physiology 118: 1307-1316.
Harrison RE, Luby JJ, Furnier GR. 1997.Chloroplast DNA restriction fragment variation among
strawberry (Fragaria spp.) taxa. Journal of the American Society for Horticultural Science 122: 63–68.
Harrison EP, McQueen-Mason SJ, Manning K. 2001. Expression of six expansin genes in relation to
extension activity in developing strawberry fruit. Journal of Experimental Botany 52: 1437-1446.
Havis AL. 1943. A developmental analysis of strawberry fruit. American Journal of Botany 30: 311-314.
Haymes KM, Henken B, Davis TM, van de Weg WE.1997. Identification of RAPD markers linked to a
Phytophthora fragariae resistance gene (Rpf1) in the cultivated strawberry. Theoretical and Applied
Genetics 94: 1097–1101.
Heide OM, Sønsteby A. 2007. Interactions of temperature and photoperiod in the control of flowering of
latitudinal and altitudinal populations of wild strawberry (Fragaria vesca). Plant Physiology 130: 280–289.
Hemphill R, Martin LH. 1992. Microwave oven-drying method for determining soluble solids in
strawberries. HortScience 27: 1326.
Higuera JJ, Garrido-Gala J, Lekhbou A, Arjona-Girona I, Amil-Ruiz F, Mercado JA, Pliego-Alfaro
F, Muñoz-Blanco J, López-Herrera CJ, Caballero JL. 2019. The strawberry FaWRKY1 transcription
factor negatively regulates resistance to Colletotrichum acutatum in fruit upon infection. Frontiers in Plant
Science 10: 480.
Hirakawa H, Shirasawa K, Kosugi S, Tashiro K, Nakayama S, Yamada M, Kohara M, Watanabe A,
Kishida Y, Fujishiro T, Tsuruoka H, Minami C, Sasamoto S, Kato M, Nanri K, Komaki A, Yanagi
T, Guoxin Q, Maeda F, Ishikawa M, Kuhara S, Sato S, Tabata S, Isobe SN. 2014. Dissection of the
Octoploid Strawberry Genome by Deep Sequencing of the Genomes of Fragaria Species. DNA Research:
An International Journal for Rapid Publication of Reports on Genes and Genomes 21: 169-181.

INTRODUCCIÓN
131 PhD Thesis Félix Juan Martínez Rivas
Hirner AA, Veit S, Seitz HU. 2001. Regulation of anthocyanin biosynthesis in UV-Air radiated cell
cultures of carrot and in organs of intact carrot plants. Plant Science 161: 315-322.
Hiwasa K, Rose JC, Nakano R, Inaba A, Kubo Y. 2003. Differential expression of seven -expansin
genes during growth and ripening of pear fruit. Plant Physiology 117: 564-572.
Hjernø K, Alm R, Canbäck B, Matthiesen R, Trajkovski K, Björk L, Roespstorff P, Emanuelsson C.
2006. Down-regulation of the strawberry Bet v 1-homologous allergen inconcert with the flavonoid
biosynthesis pathway in colorless strawberry mutant. Proteomics 6: 1574–1587.
Hobson G, Grierson D. 1993.Tomato. In: Seymour GB, Taylor JE, Tucker GA, eds. Biochemistry of fruit
ripening. London: Chapman and Hall, 405–442.
Hoffmann T, Kalinowski G, Schwab W. 2006. RNAi-induced silencing of gene expression in strawberry
fruit (Fragaria x ananassa) by agroinfiltration: a rapid assay for gene function analysis. Plant Journal 48:
818–826.
Hollman PCH., Venema DP. 1993. The content of the potentially anticarcinogenic ellagic acid in plant
foods. In: Waldron K.W., Johnson I.T. y Fenwick G.R. (Eds.). En Food and Cancer Prevention: Chemical
and Biological Aspects. Cambridge, UK: Royal Society for Chemistry, pp: 203-208.
Houde M, Dallaire S, N’Dong D, Sarhan F. 2004. Overexpression of the acidic dehydrin WCOR410
improves freezing tolerance in transgenic strawberry leaves. Plant Biotechnology Journal 2: 381- 387.
Hubbard NL, Pharr DM, Huber SC. 1991.Sucrose phosphate synthase and other sucrose metabolizing
enzymes in fruits of various species Plant Physiology 82: 191-196.
Huber DJ. 1984. Strawberry fruit softening: the potential roles of polyuronides and hemicelluloses.
Journal of Food Science 49:1310–1315.
Hummer KE, Hancock JH. 2009. Strawberry genomics: botanical history, cultivation, traditional
breeding, and new technologies, Chap. 11. In: Folta KM, Gardiner SE (eds) Plant genetics and genomics
of crops and models, vol 6: Genetics and genomics of Rosaceae. Springer, Germany, pp 413–435.
Husaini AM, Abdin MZ. 2008. Development of transgenic strawberry (Fragaria x ananassa Duch.) plants
tolerant to salt stress. Plant Science 174: 446–455.
Hytönen T, Elomaa P, Moritz T, Junttila O. 2009. Gibberellin mediates day length-controlled
differentiation of vegetative meristems in strawberry (Fragaria x ananassa Duch). Plant Biology 9:18.
Ichijima K. 1926. Cytological and genetic studies on Fragaria. Genetics 11: 590–603.
Infoagro. 2002. El cultivo de la fresa. http://www.infoagro.com/frutas/frutas_tradicionales/fresas.htm
Iwata T, Omata I, Ogata K. 1969a. Relationship between the ripening of harvested fruits and the
respiratory pattern. II. Respiratory pattern of fruits and its classification. Journal of the Japanese Society of
Horticultural Science 2: 73-80.
Iwata T, Omata I, Ogata K. 1969b. Relationship between the ripening of harvested fruits and the
respiratory pattern. III. Changes of ethylene concentration in fruits and responses to applied ethylene with
relation to the respiratory pattern. Journal of the Japanese Society of Horticultural Science 7: 64-72.
Iwata H, Gaston A, Remay A, Thouroude T, Jeauffre J, Kawamura K, Oyant LH, Araki T, Denoyes
B, Foucher F. 2012. The TFL1 homologue KSN is a regulator of continuous flowering in rose and
strawberry. Plant Journal 69: 116–125.

132 Functional characterization of molecular regulatory mechanisms controlling the ripening in strawberry fruit
Iwatsubo Y, Naruhashi N. 1989. Karyotypes of three species of Fragaria (Rosaceae). Cytologia 54: 493–
497.
Jara K, Castro RI, Ramos P, Parra-Palma C, Valenzuela-Riffo F, Morales-Quintana L. 2019.
Molecular insights into FaEG1, a strawberry endoglucanase enzyme expressed during strawberry fruit
ripening. Planta. 8:140.
Jetti RR, Yang E, Kurnianta A, Finn C, Qian MC. 2007. Quantification of selected aroma-active
compounds in strawberries by headspace solid-phase microextraction gas chromatography and correlation
with sensory descriptive analysis. Journal of Food Science 72:487–496.
Jewell GG, Rantsios A, Scholey J. 1973. Factors influencing the breakdown of fruit in strawberry jam.
Journal of Texture Studies 4: 363–370.
Jia HF, Chai YM, Li CL, Lu D, Luo JJ, Qin L, Shen YY. 2011. Abscisic acid plays an important role in
the regulation of strawberry fruit ripening. Plant Physiology 157:188-99.
Jiang Y, Joyce DC, Terry LA. 2001. 1-Methylcyclopropene treatment affects strawberry fruit decay.
Postharvest Biology and Technology 23: 227-232.
Jiménez-Bermúdez S, Redondo-Nevado J, Muñoz-Blanco J, Caballero JL, López-Aranda JM,
Valpuesta V, Pliego-Alfaro F, Quesada MA, Mercado JA. 2002. Manipulation of strawberry fruit
softening by antisense expression of a pectate lyase gene. Plant Physiology 128: 751-759.
Jiménez A, Creissen G, Kular B, Firmin J, Robinson S, Verhoeyen M, Mullineaux P. 2002. Changes
in oxidative processes and components of the antioxindant system during tomato fruit ripening. Planta 214:
754-758.
Jinek M, Chylinski K, Fonfara I, Hauer M, Doudna JA, Charpentier E. 2012. A programmable dual‐
RNA‐Guided DNA endonuclease in adaptive bacterial immunity. Science 337: 816–821.
Kalt W, Prange RK, Lidster PD. 1993. Postharvest color development of strawberries: The influence of
maturity, temperature and light. Canadian Journal Plant Science 73: 541–548.
Kano Y, Asahira T. 1978. Effect of some growth regulators on the development of strawberry fruits in
vitro culture. Journal of the Japanese Society of Horticultural Science 47: 195-202.
Kano Y, Asahira T. 1979. Effect of the endogenous cytokinins in strawberry fruits on their maturing.
Journal of the Japanese Society of Horticultural Science 47: 433-472
Kano Y, Asahira T. 1981. Roles of cytokinin and abscisic acid in the maturing of strawberry fruits.
Journals of the Japanese Society of Horticultural Science 50: 31-36.
Karlsson AL, Alm R, Ekstrand B, Fjelkner-Modig S, Schiött A, Bengtsson U, Björk L, Hjernø K,
Roepstorff P, Emanuelsson CS. 2004. Bet v 1 homologues in strawberry identified as IgE-binding
proteins and presumptive allergens. Allergy 59: 1277–1284
Keller E, Cosgrove DJ. 1995. Expansins in growing tomato leaves. Plant Journal 8: 795-802.
Kesici M, Ipek A, Ersoy F, Ergin S, Gülen H. 2020. Genotyope dependant gene expression in strawberry
(Fragaria x ananassa) plants under high temperature stress. Biochemical Genetics 58: 848-866.
Klee HJ, Clark DG. 2004. Ethylene signal transduction in fruits and flowers. In: Davies PJ, ed. Plant
hormones biosynthesis, signal transduction, action! Dordrecht, The Netherlands: Kluwer Academic
Publishers, 369–390.

INTRODUCCIÓN
133 PhD Thesis Félix Juan Martínez Rivas
Knee M, Sargent JA, Osborne DJ. 1977. Cell wall metabolism in developing strawberry fruit. Journal of
Experimental Botany 28: 977-996.
Koskela EA, Mouhu K, Albani MC, Kurokura T, Rantanen M, Sargent DJ, Battey NH, Coupland
G, Elomaa P, Hytönen T. 2012. Mutation in TERMINAL FLOWER1 reverses the photoperiodic
requirement for flowering in the wild strawberry Fragaria vesca. Plant Physiology 159: 1043-1054.
Koskela EA, Sønsteby A, Flachowsky H, Heide OM, Hanke MV, Elomaa P, Hytönen T. 2016.
TERMINAL FLOWER1 is a breeding target for novel evervearing trait and tailored flowering responses in
cultivated strawberry (Fragaria × ananassa Dutch.) Plant Biotechnology Journal 14:1852-1861.
Larsen M, Poll L. 1990. Odour thresholds of some important aroma compounds in strawberries. Zeitschrift
fur Lebensmittel-Untersuchung und -Forschung Food Research and Technology 195: 120-123.
Larsen M, Poll L, Olsen CE. 1992. Evaluation of the aroma composition of some strawberry (Fragaria
ananassa Duch.) cultivars by use of odour threshold values. Zeitschriftfur Lebensmittel-Untersuchung und
-Forschung Food Research and Technology 195: 536-539.
Lazarus CM, MacDonald H. 1996. Characterization of a strawberry gene for auxin binding protein, and
its expression in insect cells. Plant Molecular Biology 31: 267–277.
Lei J, Li Y, Du G, Dai H, Deng M. 2005. A natural pentaploid strawberry genotype from the Changbai
Mountains in Northeast China. Science Horticultural 40:1194–1195.
Li Y, Jones L, McQueen-Mason S. 2003. Expansins and cell growth. Current Opinion in Plant Biology
6: 603-610.
Li L, Song J, Kalt W, Forney C, Tsao R, Pinto D, Chisholm K, Campbell L, Fillmore S, Li X. 2013.
Quantitative proteomic investigation employing stable isotope labeling by peptide dimethylation on
proteins of strawberry fruit at different ripening stages. Journal of Proteomics 94: 219-239.
Liao X, Li M, Liu B, Yan M, Yu X, Zi H, Liu R, Yamamuro C. 2018 Interlinked regulatory loops of
ABA catabolism and biosynthesis coordinate fruit growth and ripening in woodland strawberry.
Proceedings of the Natural Academy of Science 49: 11542-11550
Liao WY, Lin LF, Jheng JL, Wang CC, Yang JH, Chou ML. 2016. Identification of heat shock
transcription factor genes involved in thermotolerance of octoploid cultivated strawberry. International
journal of Molecular Sciences. 17: 2130.
Lim CW, Lee SC. 2015. Arabidopsis abscisic acid receptors play an important role in disease resistance.
Plant Molecular Biology 88: 313-324
Lingua G, Bona E, Manassero P, Marsano F, Tofeschini V, Cantamessa S, Copetta A, D’Agostino G,
Gamalero E, Berta G. 2013. Abuscular mycorrhizal fungi and plant growth-promoting pseudomonas
increases anthocyanin concentration in strawberry fruits (Fragaria x ananassa var Selva) in conditions of
reduce fertilization. International Journal of Molecular Science 14: 16207-16225.
Lin-Wang K, Bolitho K, Grafton K, Kortstee A, Karunairetnam S, McGhie TK, Espley RV, Hellens
RP, Allan AC. 2010. An R2R3 MYB transcription factor associated with regulation of the anthocyanin
biosynthetic pathway in Rosaceae. BMC Plant Biology 10: 50.
Lis EK, Borkowska B, Antoszewski R. 1978. Growth regulators in the strawberry fruit. Fruit Science
Report 5: 17-29.

134 Functional characterization of molecular regulatory mechanisms controlling the ripening in strawberry fruit
Lis EK, Antoszewski R. 1979. Modification of the strawberry receptacle accumulation ability by growth
regulators. En Photosynthesis and Plant Development. R. Marcell, H. Clijster, M. van Poucke (Eds.) La
Haya: Dr. W. Junk Ed: 263-270.
Liu ZR, Sanford JC. 1988. Plant regeneration by organogenesis from strawberry leaf and runner tissue.
HortScience 23: 1057-1059.
Llop-Tous I, Domínguez-Puigianer E, Palomer X, Vendrell M. 1999. Characterization of two divergent
endo b-1,4 glucanase cDNA clones highly expressed in the non climateric strawberry fruit. Plant
Physiology 119: 1451-1421.
Llop-Tous I, Dominguez-Puigjaner E, Vendrell M. 2002. Characterization of a strawberry cDNA clone
homologous to calcium-dependent protein kinases that is expressed during fruit ripening and affected by
low temperature. Journal of Experimental Botany 53: 2283–2285.
Lopes da Silva F, de Pascual-Teresa S, Rivas-Gonzalo J, Santos-Buelga C. 2002. Identification of
anthocyanin pigments in strawberry (cv Camarosa) by LC using DAD and ESI-MS detection. European
Food Research and Technology 214: 248-253.
Lopez AP, Blanco-Portales R, Lopez-Raez JA, Medina-Escobar N, Muñoz-Blanco J, Franco AR.
2006. Characterization of a strawberry late-expressed and fruit-specific peptide methionine sulphoxide
reductase. Plant Physiology 126: 129–139.
López-Aranda JM. 1997. Informe final de la mesa de expertos del sector de la fresa. Plan de
Modernización de la Agricultura Andaluza.
López-Aranda JM. 2008. El cultivo de la fresa en Huelva. En: La Fresa de Huelva. Ed: Junta de Andalucía.
Consejería de Agricultura y Pesca.
López-Ráez JA, Moyano E, Muñoz-Blanco J. 2003. Caracterización de genes relacionados con el
metabolismo de los fenilpropanoides en el fruto de la fresa (Fragaria x ananassa cv. Chandler). Tesis
doctoral, Universidad de Córdoba.
Loughrin JH, Kasperbauer MJ. 2002. Aroma of fresh strawberries is enhanced by ripening over red
versus black mulch. Journal of Agricultural Food Chemistry 50: 161–165.
Lunkenbein S, Bellido ML, Aharoni A, Salentijn EMJ, Kaldenhoff R, Colner A, Muñoz-Blanco J,
Schwab W. 2006. Cinnamate metabolism in ripening fruit characterization of an UDP-glucose:cinnamate
glucosyltransferase from strawberry (Fragaria x ananassa). Plant Physiology 140: 1047-1058.
Luo J, Peng F, Zhang S, Xiao Y, Zhang Y. 2020. The protein kinase FaSnRK1a regulates sucrose
accumulation in strawberry fruits. Plant Physiology and Biochemistry. 151: 369-377.
Luo Y, Ge C, Ling Y, Mo F, Yang M, Jiang L, Chen Q, Lin Y, Sun B, Zhang Y, Wang Y, Li M, Wang
X, Tang H. 2020. ABA and sucrose co-regulate strawberry fruit ripening and show inhibition of glycolysis.
Molecular Genetic and Genomics 2: 421-438.
Ma C, Liang B, Chang B, Liu L, Yan J, Yang J, Yang Y, Zhao Z. 2018. Transcriptome profiling reveals
transcriptional regulation by DNA methyltransferase inhibitor 5-aza-2′-deoxycytidine enhancing red
pigmentation in bagged “granny smith” apples (Malus domestica). International Journal of Molecular
Science 19: 3133.
Maas JL, Galletta GJ, Stoner GD. 1991. Ellagic acid, an anticarcinogen in fruits, especially strawberry:
A review. HortScience 26: 10–14.

INTRODUCCIÓN
135 PhD Thesis Félix Juan Martínez Rivas
Maas JL, Wang SY, Galletta GJ. 1996. Health enhancing properties of strawberry fruit. In: Pritts M.P.,
Chandler C.K. and Crocker T.E. (Eds.) Proceedings of the IV North American Strawberry Conference,
Orlando, Florida, pp: 11-18.
Maas JL, Gouin-Behe C, Hartung JS, Hokanson SC. 2000. Sources of resistance for two differentially
pathogenic strains of Xanthomonas fragariae in Fragaria genotypes. HortScience. 35: 128–131.
Makinen KK, Söderling E. 1980. A quantitative study of mannitol, sorbitol, xylitol and xylose in wild
berries and commercial fruits. Journals of Food Science 45: 367-371.
Manning K. 1993. Soft fruits. In Biochemistry of fruit ripening. G. Seymour, J. Taylor and G.A. Tucker,
(Eds.) London: Chapman & Hall, pp: 347-378.
Manning K. 1994. Changes in gene expression during strawberry fruit ripening and their regulation by
auxin. Planta 194: 62-68.
Manning K. 1998. Isolation of a set of ripening-related genes from strawberry: their identification and
possible relationship to fruit quality traits. Planta 205: 622-630.
Manning K, Tör M, Poole M, Hong Y, Thompson AJ, King GJ Giovannoni JJ, Seymour GB. 2006.
A naturally occurring epigenetic mutation in a gene encoding an SBP- box transcription factor inhibits
tomato fruit ripening. Nature Genetics 38: 948–952
Martín‐Pizarro C, Trivino JC, Posé D. 2018. Functional analysis of TM6 MADS‐box gene in the
octoploid strawberry by CRISPR/Cas9 directed mutagenesis. Journal of Experimental Botany 70: 885–895.
Martínez GA, Chaves AR, Añón MC. 1996. Effect of exogenous application of gibberellic acid on color
change and phenylalanine ammonia-lyase, chlorophyllase, and peroxidase activities during ripening of
strawberry fruit (Fragaria x ananassa duch.). Journal of Plant Growth Regulation 15: 139–146.
Martínez GA, Chaves AR, Civello PM. 2004. Beta-xylosidase activity and expression of a beta-
xylosidase gene during strawberry fruit ripening. Plant Physiology and Biochemistry 42: 89-96.
Mathews H, Wagoner W, Kellog J, Bestwick R. 1995. Genetic transformation of strawberry: stable
integration of a gene to control biosynthesis of ethylene. In Vitro Cellular & Developmental Biology – Plant
31: 36–43.
Matzke MA, Mosher RA. 2014. RNA-directed DNA methylation: an epigenetic pathway of increasing
complexity. Nature Reviews in Genetic 15: 394–408.
McAtee P, Karim S, Schaffer R, David K. 2013. A dynamic interplay between phytohormones is required
for fruit development, maturation, and ripening. Frontiers in Plant Science 17: 479.
McQueen-Mason S, Cosgrove DJ. 1994. Disruption of hydrogen bonding between plant cell wall
polymers by proteins that induce wall extension. Proceedings of the National Academy of Sciences 91:
6574-6578.
McQueen-Mason S, Durachko DM, Cosgrove DJ. 1992. Two endogenous proteins that induce cell wall
extension in plants. Plant Cell 4: 1425-1433.
Medina-Escobar N, Cárdenas J, Valpuesta V, Muñoz-Blanco J, Caballero JL. 1997a. Cloning and
characterization of cDNAs from genes differentially expressed during the strawberry fruit ripening process
by a MAST-PCR-SBDS method. Analytical Biochemistry 248: 288-296.

136 Functional characterization of molecular regulatory mechanisms controlling the ripening in strawberry fruit
Medina-Escobar N, Cárdenas J, Moyano E, Caballero. JL, Muñoz-Blanco J. 1997b. Cloning,
molecular characterization and expression pattern of a strawberry ripening-specific cDNA with sequence
homology to pectate lyase from higher plants. Plant Molecular Biology 34: 867-877.
Medina-Escobar N, Cárdenas J, Muñoz-Blanco J, Caballero JL. 1998. Cloning and molecular
characterization of a strawberry fruit ripening-related cDNA corresponding a mRNA for a low molecular-
weight heat-shock protein. Plant Molecular Biology 36: 33–42.
Medina-Puche L, Blanco-Portales R, Molina-Hidalgo FJ, Cumplido-Laso G, García-Caparrós N,
Moyano E, Caballero JL, Muñoz-Blanco J, Franco A. 2016. Extensive transcriptomics studies on the
roles played by abcisic acid and auxins in the development and ripening of strawberry fruits. Functional
and Integrative Genomics 16: 671-692.
Medina-Puche L, Cumplido-Laso G, Amil-Ruiz F, Hoffmann T, Ring L, Rodríguez-Franco A,
Caballero JL, Schwab W, Muñoz-Blanco J, Blanco-Portales R. 2014. MYB10 plays a major role in the
regulation of flavonoids/phenylpropanoid metabolism during ripening of Fragaria × ananassa fruits.
Journal of Experimental Botany 65: 401-417.
Medina-Puche L, Molina-Hidalgo FJ, Boersma M, Schuurink RC, López-Vidriero I, Solano R,
Franco-Zorrilla J-M, Caballero JL, Blanco-Portales R, Muñoz-Blanco J. 2015. An R2R3-MYB
Transcription Factor Regulates Eugenol Production in Ripe Strawberry Fruit Receptacles. Plant Physiology
168: 598-614.
Mehari-Haile Z, Nagpala-De Guzman EG, Moretto M, Sonego P, Engelen K, Zoli L, Moser C,
Baraldi E. 2019. Transcriptome profiles of strawberry (Fragaria vesca) fruit interacting with Botrytis
cinerea at different ripening stages. Frontiers in Plant Science 10: 1131.
Mercado JA, Trainotti L, Jiménez-Bermúdez L, Santiago-Doménech N, Posé S, Donolli R, Barceló
M, Casadoro G, Pliego-Alfaro F, Quesada MA. 2010. Evaluation of the role of the endo-β-(1,4)-
glucanase gene FaEG3 in strawberry fruit softening. Postharvest Biology and Technology 55: 8–14.
Mercado JA, Pliego-Alfaro F, Quesada MA. 2011. Fruit shelf life and potential for its genetic
improvement. In: Jenks MA, Bebeli PJ, eds. Breeding for fruit quality. Ames, Iowa: Wiley-Blackwell 81–
104.
Merchante C, Vallarino JG, Osorio S, Aragüez I, Villarreal N, Ariza MT, Martínez GA, Medina-
Escobar N, Civello MP, Fernie AR, Botella MA, Valpuesta V. 2013.Ethylene is involved in strawberry
fruit ripening in an organ-specific manner. Journal of Experimental Botany 64: 4421-4439.
Merino MC, Guidarelli M, Negrini F, De Biase D, Pession A, Baraldi E. 2019. Induced expression of
the Fragaria x ananassa Rapid alkalinization factor-33-like gene decreases anthracnose ontogenic
resistance of unripe strawberry fruit stages. Molecular Plant Pathology 20: 1252-1263.
Merlaen B, De Keyser E, Van Lebeke MC. 2018 Identification and substrate prediction of new Fragaria
x ananassa aquaporins and expression in different tissues and during strawberry fruit development.
Horticultural Research 5: 20.
Mezzetti B. 2003. Genetic transformation in strawberry and raspberry. In: Plant Genetic Engineering, Vol.
6 Improvement of Fruit Crops. Eds. Pawan K. Jaiwal and Rana P. Singh.S.C.I. Tech Publishing L.L.C.,
Houston, T.X.

INTRODUCCIÓN
137 PhD Thesis Félix Juan Martínez Rivas
Mills E, Madsen C, Shewry P, Wichers H. 2003. Food allergens of plant origin—their molecular and
evolutionary relationships. Trends of Food Science and Technogy 14: 145–156.
Mishra G, Zhang W, Deng F, Zhao J, Wang X. 2006. A bifurcating pathway directs abscisic acid effects
on stomatal closure and opening in Arabidopsis. Science 12: 264-266.
Misyura M, Colasanti J, Rothstein SJ. 2013. Physiological and genetic analysis of Arabidopsis thaliana
anthocyanin biosynthesis mutants under chronic adverse environmental conditions. Journal of
Experimental Botany 64: 229-240.
Molina-Hidalgo FJ, Franco AR, Villatoro C, Medina-Puche L, Mercado JA, Hidalgo MA, Monfort
A, Caballero JL, Muñoz-Blanco J, Blanco-Portales R. 2013. The strawberry (Fragaria × ananassa)
fruit-specific rhamnogalacturonate lyase 1 (FaRGLyase1) gene encodes an enzyme involved in the
degradation of cell walls middle lamellae. Journal of Experimental Botany 64: 1471-1483.
Molina-Hidalgo FJ, Medina-Puche L, Gelis S, Ramos J, Sabir F, Soveral G, Prista C, Iglesias-
Fernández R, Caballero JL, Muñoz-Blanco J, Blanco-Portales R. 2015. Functional characterization of
FaNIP1;1 gene, a ripening-related and receptacle-specific aquaporin in strawberry fruit. Plant Science 238:
198-211.
Moore JN, Brown GR, Brown ED. 1970. Comparison of factors influencing fruit size in large-fruited and
small-fruited clones of strawberry. Journal of the American Society for Horticultural Science 95: 827-831.
Mori T, Sakurai M, Sakuta M. 2001. Effects of conditioned medium on activities of PAL, CHS, DAHP
synthase (DS-Co and DS-Mn) and anthocyanin production in suspension cultures of Fragaria × ananassa.
Plant Science 160: 355-360.
Mouhu K, Hytönen T, Folta K, Rantanen M, Paulin L, Auvinen P, Elomaa P. 2009- Identification of
flowering genes in strawberry, a perennial SD plant. BMC Plant Biology. 9: 122.
Moyano-Cañete E, Bellido ML, García-Caparrós N, Medina-Puche L, Amil-Ruiz F, González-Reyes
JA, Caballero JL, Muñoz-Blanco J, Blanco-Portales R. 2013. FaGAST2, a strawberry ripening-related
gene, acts together with FaGAST1 to determine cell size of the fruit receptacle. Plant & Cell Physiology
54: 218-236.
Moyano E, Encinas S, López JA, Redondo J, Blanco R, Bellido ML, Sanz C, Caballero JL, Muñoz-
Blanco J. 2004. Comparative study between two strawberry pyruvate decarboxylase genes along fruit
development and ripening, post-harvest and stress conditions. Plant Science 166: 835-845.
Moyano E, Portero-Robles I, Medina-Escobar N, Valpuesta V, Muñoz-Blanco J, Caballero JL. 1998.
A fruit-specific putative dihydroflavonol 4-reductase gene is differentially expressed in strawberry during
the ripening process. Plant Physiology 117:711-716.
Moyle R, Fairbairn DJ, Ripi J, Crowe M, Botella JR. 2005. Developing pineapple fruit has a small
transcriptome dominated by metallothionein. Journal of Experimental Botany 56: 101-112.
Muñoz C, Hoffman T, Medina Escobar N, Ludemann F, Botella MA, Valpuesta V, Schwab W. 2010.
The Strawberry fruit Fra a Allergen functions in Flavonoid Biosynthesis. Molecular Plant 3: 113-124.
Musidlowska-Persson A, Alm R, Emanuelsson C. 2007. Cloning and sequencing of the Bet v 1-
homologous allergen Fra a 1 in strawberry (Fragaria × ananassa) shows the presence of an intron and little
variability in amino acid sequence. Molecular Immunology 44: 1245–1252.

138 Functional characterization of molecular regulatory mechanisms controlling the ripening in strawberry fruit
Mussinan CJ, Walradt JP. 1975. Organic acids from fresh California strawberries. Journal of the
Agriculture and Food Chemistry 23: 482-484.
Mut P, Bustamante C, Martinez G, Alleva K, Sutka M, Civello M, Amodeo G. 2008. A fruit-specific
plasma membrane aquaporin subtype PIP1;1 is regulated during strawberry (Fragaria x ananassa) fruit
ripening. Physiologia Plantarum 132: 538-551.
Nakano Y, Higuchi Y, Yoshida Y, Hisamatsu T. 2015 Environmental responses of the FT/TFL1 gene
family and their involvement in flower induction in Fragaria × ananassa. Journal of Plant Physiology
177: 60-66.
Nardi C, Escudero C, Villarreal N, Martínez G, Civello PM. 2013. The carbohydrate-binding module
of Fragaria × ananassa expansin 2 (CBM-FaExp2) binds to cell wall polysaccharides and decreases cell
wall enzyme activities "in vitro". Journal of Plant Research 126: 151-159.
Nardi C, Villareal N, Opazo G, Martinez MA, Moya-León MA, Civello PM. 2014. Expression of
FaXTH1 and FaXTH2 genes in strawberry fruit. Cloning of promoter regions and effect of plant growth
regulators. Scientia Horticulturae 165: 112-122.
Nardi CF, Villarreal NM, Rossi FR, Martínez S, Martínez GA, Civello PM. 2015. Overexpression of
the carbohydrate binding module of strawberry expansin2 in Arabidopsis thaliana modifies plant growth
and cell wall metabolism. Plant Molecular Biology 88: 101-117.
NDong C, Quellet F, Houde M, Sarhan F. 1997. Gene expression during cold acclimation in strawberry.
Plant Cell Physiology 38: 863–870.
Neal GE. 1965. Changes occurring in the cell walls of strawberries during ripening. Journal of Agricultural
and Food Chemistry 16: 604-611.
Nehra NS, Chibbar RN, Kartha KK, Datla RSS, Crosby WL, Stushnoff C. 1990.Genetic
transformation of strawberry by Agrobacterium tumefaciens using a leaf disk regeneration system. Plant
Cell Reports 9: 293–298.
Nier S, Simpson DW, Tobutt KR, Sargent DJ. 2006. Construction of a genetic linkage map of an
interspecific diploid Fragaria BC1 mapping population (F. vesca 815 × [F. vesca 815 × F. viridis 903]) and
its comparison to the Fragaria reference map (FVxFN). Journal of Horticultural Science and
Biotechnology 81: 645–650.
Nitsch JP. 1950. Growth and morphogenesis of the strawberry as related to auxin. American Journal of
Botany 37: 211-215.
Njuguna W, Liston A, Cronn R, Ashman TL, Bassil N. 2013. Insight into phylogeny, sex function and
age of Fragaria bases on whole chloroplast genome sequencing. Molecular phylogenetics and evolution
66: 17-29.
Nogata Y, Ohta H, Voragen AGJ. 1993. Polygalacturonase in strawberry fruit. Phytochemistry 34: 617-
620.
Ofosu-Anim J, Yamaki S. 1994. Sugar content, comparmentation and efflux in strawberry tissues. Journal
of the American Society for Horticultural Science 119: 1024-1028.
Ofosu-Anim J, Kanayama Y, Yamaki S. 1996. Sugar uptake into strawberry fruits is stimulated abscisic
acid and indolacetic acid. Physiologia Plantarum 97: 169-174.

INTRODUCCIÓN
139 PhD Thesis Félix Juan Martínez Rivas
Olías JM, Sanz C, Ríos JJ, Perez AG. 1995. Substrate specificity of alcohol acyltransferase from
strawberry and banana fruits. In Fruit Flavors: Biogenesis, Characterization and Authentication, R.L.
Rouseff and M.M. Leahy, eds. Washington, DC, American Chemical Society, pp. 134–141.
Olszewski N, Sun TP, Gubler F. 2002. Gibberellin signaling biosynthesis, catabolism, and response
pathways. Plant Cell 14: 61–80.
Oosumi T, Gruszewski HA, Blischak LA, Baxter AJ, Wadl PA, Shuman JL, Veilleux RE, Shulaev V.
2006.High-efficiency transformation of the diploid strawberry (Fragaria vesca) for functional genomics.
Planta 223: 1219–1230.
Ornelas-Paz J, Yahia EM, Ramírez-Bustamante N, Pérez-Martínez JD, Escalante-Minakata MP,
Ibarra-Junquera V, Acosta-Muñiz C, Guerrero-Prieto V, Ochoa-Reyes E. 2013. Physical attributes
and chemical composition of organic strawberry fruit (Fragaria x ananassa Duch, Cv. Albion) at six stages
of ripening. Food Chemistry 138:372-81.
Osorio S, Castillejo C, Quesada MA, Medina-Escobar N, Brownsey GJ, Suau R, Heredia A, Botella
MA, Valpuesta V. 2008. Partial demethylation of oligogalacturonides by pectin methyl esterase 1 is
required for eliciting defence responses in wild strawberry (Fragaria vesca). Plant Journal 54: 43–55.
Owens CL, Thomashow MF, Hancock JF, Iezzoni AF. 2002. CPF1 orthologs in sour cherry and
strawberry and the heterologous expression of CBF1 in strawberry. Journal of the American Society for
Horticultural Science 127: 462–710.
Ozawa T, Lilley TH, Haslam E. 1987. Polyphenol interactions: astringency and the lost of astringency in
ripening fruit. Phytochemistry 26: 2937-2942.
Palomer X, Llop-Tous I, Vendrell M, Krens FA, Schaart JG, Boone MJ. 2006. Antisense
downregulation of strawberry endo-β-(1,4)-glucanase genes does not prevent fruit softening during
ripening. Plant Science 171: 640–646.
Paniagua C, Posé S, Morris VJ, Kirby AR, Quesada MA, Mercado JA. 2014. Fruit softening and pectin
disassembly: an overview of nanostructural pectin modifications assessed by atomic force microscopy.
Annals of Botany 114: 1375-1383.
Paniagua C, Ric-Varas P, García-Gago JA, López-Casado G, Blanco-Portales R, Muñoz-Blanco J,
Schückel J, Knox JP, Matas AJ, Quesada MA, Posé S, Mercado JA. 2020. Elucidating the role of
polygalacturonase genes in strawberry fruit softening. Journal of Experimental Botany 71: 7103-7117
Park JI, Kim IJ. 2007. Changes in the expression of ADP-glucose pyrophosphorylase genes during fruit
ripening in strawberry. Food Science Biotechnology 16: 343–348.
Park JI, Lee YK, Chung WI, Lee IH, Choi JH, Lee WM, Ezura H, Lee SP, Kim IJ. 2006. Modification
of sugar composition in strawberry fruit by antisense suppression of an ADPglucose pyrophosphorylase.
Molecular Breeding 17: 269–279.
Passey AJ, Barrett KJ, James DJ. 2003. Adventitious shoot regeneration from seven commercial
strawberry cultivars (Fragaria x ananassa Duch.) using a range of explant types. Plant Cell Reports 21:
397–401.
Pearce BD, Grange RI, Hardwick K. 1993.The growth of young tomato fruit. II. Environmental
influences on glasshouse crops grown in rockwool or nutrient film. Journal of Horticultural Science 118:
245-258.

140 Functional characterization of molecular regulatory mechanisms controlling the ripening in strawberry fruit
Pérez AG, Olías R, Sanz C, Olías JM. 1996. Furanones in strawberries: evolution during ripening and
postharvest shelf life. Journal of Agricultural and Food Chemistry 44: 3620-3624.
Perkins-Veazie P, Huber DJ. 1987. Growth and ripening of strawberry fruit under field conditions.
Proceedings of Florida State Horticultural Society 100: 253-256.
Perkins-Veazie P. 1995. Growth and ripening of strawberry fruit. Horticultural Review 17: 267-297.
Perkins-Veazie P, Huber DJ, Brecht JK. 1995. Characterization of ethylene production in developing
strawberry fruit. Plant Growth Regulation 17: 33-39.
Perkins-Veazie PM, Huber DJ, Brecht JK. 1996. In vitro growth and ripening of strawberry fruit in the
presence of ACC, STS or propylene. Annals of Applied Biology 128: 105-116.
Perrote J, Gaston A, Potier A, Petit, A, Rothan C, Denoyes B. 2016a. Narrowing down the single
homeologous FaPFRU locus controlling flowering in cultivates octoploid strawberry using a selective
mapping strategy. Plant Biotechnology Journal 14: 2176-2189.
Perrote J, Guédeon Y, Gaston A, Denoyes B. 2016b. Identification of successive flowering phases
highlights a new genetic control of the flowering pattern in strawberry. Journal of Experimental Botany 19:
5643-5655.
Pharis RP, King RW. 1985. Gibberellins and reproductive development in seed plants. Annual Review of
Plant Physiology 36: 517–568.
Pillet J, Yu HW, Chambers AH, Whitaker VM, Folta KM. 2015, Identification of candidate flavonoid
pathway genes using transcriptome correlation network analysis in ripe strawberry (Fragaria × ananassa)
fruits. Journal of Experimental Botany 6: 4455-4467.
Posé S, Paniagua C, Cifuentes M, Blanco-Portales R, Quesada MA, Mercado JA. 2013. Insights into
the effects of polygalacturonase FaPG1 gene silencing on pectin matrix disassembly, enhanced tissue
integrity, and firmness in ripe strawberry fruits. Journal of Experimental Botany 64: 3803-3815.
Potter D, Luby JJ, Harrison RE. 2000. Phylogenetic relationships among species of Fragaria (Rosaceae)
inferred from non-coding nuclear and chloroplast DNA sequences. Systematic Botany 25: 337–348.
Prasanna V, Prabha TN, Tharanathan RN. 2007. Fruit ripening phenomena- An overview. Critical
Reviews in Food Science and Nutrition 47: 1-19.
Pyysalo T, Honkanen E, Hirvi T. 1979. Volatiles of wild strawberries, Fragaria vesca L. compared to
those of cultivated berries, Fragaria x ananassa cv. Senga Segana. Journal of Agricultural and Food
Chemestry 27: 19-22.
Quesada MA, Blanco-Portales R, Pose S, García-Gago JA, Jiménez-Bermúdez S, Muñoz-Serrano A,
Caballero JL, Pliego-Alfaro F, Mercado JA, Muñoz-Blanco J. 2009. Antisense down-regulation of the
FaPG1 gene reveals an unexpected central role for polygalacturonase in strawberry fruit softening. Plant
Physiology 150: 1022-1032.
Raab T, López-Ráez JA, Klein D, Caballero JL, Moyano E, Schwab W, Muñoz-Blanco J. 2006. FaQR,
required for the biosynthesis of the strawberry flavor compound 4-hydroxy-2,5-dimethyl-3(2H)-furanone,
encodes an enone oxidoreductase. Plant Cell 18: 1023-1037.
Rajashekar CB, Zhou H, Marcum KB, Prakash O. 1999. Glycine betaine accumulation and induction
of cold tolerance in strawberry (Fragaria x ananassa Duch.) plants. Plant Science 148: 175–183.

INTRODUCCIÓN
141 PhD Thesis Félix Juan Martínez Rivas
Ramos P, Parra Palma C, Figueroa CR, Zuñiga PE, Valenzuela-Riffo F, Gonzalez J, Gaete-Eastman
C, Morales-Quintana L. 2018. Cell wall-related enzymatic activities and transcriptional profiles in four
strawberry (Fragaria x ananassa) cultivars during fruit development and ripening. Scientia Horticulturae
283: 325-332.
Ranwala AP, Suematsu C, Masuda H. 1992. Soluble and wall-bound invertases in strawberry fruit. Plant
Science 84: 59–64.
Rantanen M, Kurokura T, Jiang P, Mouhu K, Hytönen T. 2015. Strawberry homologue of terminal
flower1 integrates photoperiod and temperature signals to inhibit flowering. Plant Journal 82: 163-173
Rantanen M, Kurokura T, Mouhu K, Pinho P, Tetri E, Halonen L, Palonen P, Elomaa P, Hytönen
T. 2014. Light quality regulates flowering in FvFT1/FvTFL1 dependent manner in the woodland strawberry
Fragaria vesca. Frontiers in Plant Science 5: 271.
Reddy ASN, Poovaiah BW. 1990. Molecular cloning and sequencing of a cDNA for a auxin-repressed
mRNA: correlation between fruit growth and repression of the auxin-regulated gene. Plant Molecular
Biology 14: 127-136.
Reddy ASN, Jena PK, Mukherjee SK, Poovaiah BW. 1990. Molecular cloning of cDNAs for auxin-
induced mRNAs and developmental expression of the auxin-inducible genes. Plant Molecular Biology 14:
643-653.
Redgwell RJ, Fischer M, Kendall E, MacRae EA, Perry J, Harker R. 1997. Galactose loss and fruit
ripening: high-molecular weight arabinogalactans in the pectic polysaccharides of fruit cell walls. Planta
203: 174–181.
Redondo-Nevado J, Moyano E, Medina-Escobar N, Caballero JL, Muñoz-Blanco J. 2001. A fruit-
specific and developmentally regulated endopolygalacturonase gene from strawberry (Fragaria x ananassa
cv. Chandler). Journal of Experimental Botany 52: 1941-1945.
Ricardo VG, Ricci JCD, Hernández L, Castagnaro AP. 2006. Enhanced resistance to Botrytis cinerea
mediated by the transgenic expression of the chitinase gene ch5B in strawberry. Transgenic Research
15:57–68.
Ring L, Yeh SY, Hücherig S, Hoffmann T, Blanco-Portales R, Fouche M, Villatoro C, Denoyes B,
Monfort A, Caballero JL, Muñoz-Blanco J, Gershenson J, Schwab W. 2013. Metabolic interaction
between anthocyanin and lignin biosynthesis is associated with peroxidase FaPRX27 in strawberry fruit.
Plant Physiology 163: 43-60.
Roscher R, Bringmann G, Schreier P, Schwab W. 1998. Radiotracer studies of the formation of 2,5-
dimethyl-4-hydroxy-3(2H)-furanone in detached ripening strawberry fruits. Journal of Agricultural and
Food Chemistry 46: 1488-1493.
Rose J, Lee H, Bennett A. 1997. Expression of a divergent expansin gene is fruit-specific and ripening-
regulated. Proceedings of the National Academy of Sciences 94: 5955-5960.
Rosin FM, Aharoni A, Salentijn EMJ, Schaart JG, Boone MJ, Hannapel DJ. 2003. Expression patterns
of a putative homolog of AGAMOUS, STAG1, from strawberry. Plant Science 165: 959–968.
Rosli HG, Civello PM, Martínez GA. 2004. Changes in cell wall composition of three Fragaria ×
ananassa cultivars with different softening rate during ripening. Journal of Physiology and Biochemistry
42: 823–831.

142 Functional characterization of molecular regulatory mechanisms controlling the ripening in strawberry fruit
Rousseau-Gueutin M, Gaston A, Aïnouche A, Aïnouche ML, Olbricht K, Staudt G, Richard L,
Denoyes B. 2009. Origin and evolution of the polyploid Fragarias pecies through phylogenetical analyses
of GBSSI and DHAR low-copy nuclear genes. Molecular and Phylogenetic Evolution 3: 515-530.
Saladié M, Matas AJ, Isaacson T, Jenks MA, Goodwin SM, Niklas KJ, Xiaolin R, Labavitch JM,
Shackel KA, Fernie AR, Lytovchenko A, O'Neill MA, Watkins CB, Rose JK. 2007. A reevaluation of
the key factors that influence tomato fruit softening and integrity. Plant Physiology 144: 1012–1028.
Salentijn EMJ, Aharoni A, Schaart JG, Boone MJ, Krens FA. 2003. Differential gene expression
analysis of strawberry cultivars that differ in fruit-firmness. Plant Physiology 118: 571-578.
Salinas N, Verma S, Peres N Whitaker VM. 2018. FaRCa1: a major subgenome-specific locus conferring
resistance to Colletotrichum acutatum in strawberry. Theoretical and Applied Genetics. 132: 1109-1120
Salvatierra A, Pimentel P, Moya-León MA, Herrera R. 2013. Increased accumulation of anthocyanins
in Fragaria chiloensis fruits by transient suppression of FcMYB1 gene. Phytochemistry 90: 25–36.
Sánchez Sevilla JF, Vallarino J, Osorio S, Bombarely A, Posé D, Merchante C, Botella MA, Amaya
I, Valpuesta V. 2017. Gene expression atlas of fruit ripening and transcriptome assembly from RNA-seq
data in octoploid strawberry (Fragaria × ananassa). Scientific Reports 7: 13737.
Santi D, Norment A, Garrett C. 1984. Covalent bond formation between a DNA-cytosine
methyltransferase and DNA containing 5-azacytosine. Proceedings of the National Academy of Sciences.
81: 6993-6997.
Santiago-Doménech N, Jiménez-Bemúdez S, Matas AJ, Rose JKC, Muñoz-Blanco J, Mercado JA,
Quesada MA. 2008. Antisense inhibition of a pectate lyase gene supports a role for pectin
depolymerization in strawberry fruit softening. Journal of Experimental Botany 59: 2769-2779.
Sargent DJ, Hadonou AM, Simpson DW. 2003. Development and characterization of polymorphic
microsatellite markers from Fragaria viridis, a wild diploid strawberry. Molecular Ecology Notes 3: 550–
552.
Sargent DJ, Geibel M, Hawkins JA, Wilkinson MJ, Battey NH, Simpson DW. 2004. Quantitative and
qualitative differences in morphological traits revealed between diploid Fragaria species. Annals of Botany
94: 787–796
Sargent DJ, Clarke J, Simpson DW, Tobutt KR, Arús P, Monfort A, Vilanova S, Denoyes-Rothan B,
Rousseau M, Folta KM, Bassil NV, Battey NH. 2006. An enhanced microsatellite map of diploid
Fragaria. Theoretical and Applied Genetics 112: 1349–1359.
Sargent DJ, Rys A, Nier S, Simpson DW, Tobutt KR. 2007. The development and mapping of functional
markers in Fragaria and their transferability and potential for mapping in other genera. Theoretical and
Applied Genetics 114: 373–384.
Sas L, Miszczak A, Plich H. 1992. The influence of auxins, exogenous ethylene and light on the
biosynthesis of ethylene and CO2 production in strawberry fruits. Fruit Science Report 19: 47-61.
Schaart JG, Dubos D, Romero De La Fuente I, van Houwelingen AMML, de Vos RHC, Jonker HH,
Xu W, Routaboul JM, Lepiniec L, Bovy AG. 2013. Identification and characterization of MYB-bHLH-
WD40 regulatory complexes controlling proanthocyanidin biosynthesis in strawberry
(Fragaria × ananassa) fruits. New Phytologist 197: 454-467.

INTRODUCCIÓN
143 PhD Thesis Félix Juan Martínez Rivas
Schaart JG, Mehli L, Schouten HJ. 2005. Quantification of allele-specific expression of a gene encoding
strawberry polygalacturonase-inhibiting protein (PGIP) using Pyrosequencing. Plant Journal 41: 493–500.
Seeram NP. 2008. Berry fruits: compositional elements, biochemical activities, and the impact of their
intake on human health, performance, and disease. Journal of Agricultural and Food Chemistry 56: 627–
629.
Serrani JC, Sanjuán R, Ruiz-Rivero O, Fos M, García Martínez JL. 2007. Gibberellin regulation of
fruit set and growth in tomato. Plant Physiology 145: 246–257.
Senanayake YDA, Bringhurst RS.1967. Origin of Fragaria polyploids I. Cytological analysis. American
Journal of Botany 54: 221–228.
Sesmero R, Quesada MA, Mercado JA. 2007. Antisense inhibition of pectate lyase gene expression in
strawberry fruit: characteristics of fruits processed into jam. Journal of Food Engineering 79: 194–199.
Seutter von Loetzen C, Schweimer K, Schwab W, Rösch P, Hartl-Spiegelhauer O. 2012. Solution
structure of the strawberry allergen Fraa1. Bioscience reports 32: 567-575.
Severo J, Tiecher A, Chaves F, Silva J, Rombaldi C. 2011. Gene transcript accumulation associated with
physiological and chemical changes during developmental stages of strawberry cv. Camarosa. Food
Chemestry. 126: 995–1000.
Seymour GB, Taylor JE, Tucker GA, eds.1993. Biochemistry of fruit ripening. London: Chapman &
Hall.
Seymour GB, Ryder CD, Cevik V, Hammond JP, Popovich A, King GJ, Vrebalov J, Giovannoni JJ,
Manning K. 2011. A SEPALLATA gene is involved in the development and ripening of strawberry
(Fragaria x ananassa Duch.) fruit, a non-climacteric tissue. Journal of Experimental Botany 62: 1179-
1188.
Shinozaki K., Yamaguchi- Shinozaki K. 2007. Gene networks involved in drought stress response and
tolerance. Journal of Experimental Botany 58: 221-227.
Shulaev V, Sargent DJ, Crowhurst RN, Mockler TC, Folkerts O, Delcher AL, Jaiswal P, Mockaitis
K, Liston A, Mane SP, Burns P, Davis TM, Slovin JP. Bassil N, Hellens RP, Evans C, Harkins T,
Kodira C, Desany B, Crasta OR, Jensen RV, Allan AC, Michael TP, Setubal JC, Celton J.-M, Rees
DJG, Williams KP, Holt SH, Rojas JJR, Chatterjee M, Liu B, Silva H, Meisel L, Adato A, Filichkin
SA, Troggio M, Viola R, Ashman TL, Wang H, Dharmawardhana P, Elser J, Raja R, Priest HD,
Bryant DW, Fox SE, Givan SA, Wilhelm LJ, Naithani S, Christoffels A, Salama DY, Carter J, Girona
EL, Zdepski A, Wang W, Kerstetter RA, Schwab W, Korban SS, Davik J, Monfort A, Denoyes-
Rothan B, Arus P, Mittler R, Flinn B, Aharoni A, Bennetzen JL, Salzberg SL, Dickerman AW,
Velasco R, Borodovsky M, Veilleux RE, Folta KM. 2010. The genome of woodland strawberry
(Fragaria vesca). Nature Genetics 43: 109–116.
Smith BJ. 1990. Morphological, cultural, and pathogenic variation among Colletotrichum species isolated
from strawberry. Plant Disease 74: 69-76.
Smith BJ, Galletta GJ, Gupton CL. 1996. USDA-ARS strawberry resistance breeding, disease biology
and management progress. In: Proceedings of IV North American Strawberry Conference. University of
Florida, Gainesville, FL, pp 253–258.
144 Functional characterization of molecular regulatory mechanisms controlling the ripening in strawberry fruit
Song J, Du L, Li L, Campbell Palmer L, Forney CF, Fillmore S, Zhang ZQ, Li XH. 2015a. Targeted
quantitative proteomic investigation employing multiple reaction monitoring on quantitative changes in
proteins that regulate volatile biosynthesis of strawberry fruit at different ripening stages. Journal of
Proteomics 3: 288-295.
Song J, Du L, Li L, Kalt W, Campbell Palmer L, Fillmore S, Zhang Y, Zhang ZQ, Li XH. 2015b.
Quantitative changes in proteins responsible for flavonoid and anthocyanin biosynthesis in strawberry fruit
at different ripening stages: A targeted quantitative proteomic investigation employing multiple reaction
monitoring. Journal of Proteomics 3:1-10.
Sønsteby A, Heide OM. 2007. Long-day control of flowering in everbearing strawberries. The Journal of
Horticultural Science and Biotechnology 82: 875–884.
Sønsteby A, Heide OM. 2008. Long-day rather than autonomous control of flowering in the diploid
everbearing strawberry Fragaria vesca ssp semperflorens. The Journal of Horticultural Science and
Biotechnology 83: 360–366.
Spolaore S, Trainotti L, Pavanello A, Casadoro G. 2003. Isolation and promoter analysis of two genes
encoding different endo--1,4-glucanase in the non-climateric strawberry. Journal of Experimental Botany
54: 271-277.
Spayd SE, Morris JR. 1981. Physical and chemical characteristics of pure from onceover harvested
strawberries. Journal of the American Society for Horticultural Science 106: 101-105.
Staudt GS.1989. The species of Fragaria, their taxonomy and geographical distribution. Acta Horticulturae
265: 23–34.
Staudt GS.1999a. Systematics and Geographic Distribution of the American Strawberry Species.
University of California.Publication in Botany. Vol. 81, 162 pp.
Staudt GS.1999b. Notes on Asiatic Fragaria species: Fragaria nilgerrensis Schltdl. ex J. Gay. Botanische
Jahrbücher für Systematik 121: 297–310.
Staudt GS. 2003. Notes on Asiatic Fragaria species: III. Fragaria orientalis Losinsk. And Fragaria
mandshurica spec. nov. Botanische Jahrbücher für Systematik 124: 397–419
Staudt GS. 2005. Notes on Asiatic Fragaria species: IV. Fragaria iinumae Makino. Botanische
Jahrbücher für Systematik 126: 163–175.
Staudt GS, Dickore WB. 2001. Notes on Asiatic Fragaria species: Fragaria pentaphylla Losinsk. and
Fragaria tibetica spec. nov. Botanische Jahrbücher für Systematik 123: 341–354.
Stewart PJ, Folta KM. 2010. A review of photoperiodic flowering research in strawberry (Fragaria spp.).
Critical Reviews in Plant Sciences 29: 1–13.
Stutte GW. Darnell RL. 1987. A non-destructive developmental index for strawberry. HortScience 22:
218-221.
Stresemann C, Lyko F. 2008. Modes of action of the DNA methyltransferase inhibitors azacytidine and
decitabine. International Journal of Cancer. 123: 8-13.
Symons GM, Davies C, Shavrukov Y, Dry IB, Reid JB, Thomas MR. 2006. Grapes on steroids.
Brassinosteroids are involved in grape berry ripening. Plant Physiology 140: 150–158.
Symons GM, Chua YJ, Ross JJ, Quittenden LJ, Davies NW, Reid JB. 2012. Hormonal changes during
non-climateric ripening in strawberry. Journal of Experimental Botany 63: 4741-4750.

INTRODUCCIÓN
145 PhD Thesis Félix Juan Martínez Rivas
Teneira T, Pimenta Lange MJ, Lange T, Bres C, Labadie M, Monfort A, Hernould M, Rothan C,
Denoyes B. 2017. A specific gibberellin 20-oxidase dictates the flowering-runnering decision in diploid
strawberry. Plant Cell 29: 2168-2182.
Terry LA, Chope GA, Giné-Bordonaba J. 2007 Effect of water deficit irrugation and inoculation with
Botrytis cinereal on strawberry (Fragaria x ananassa) fruit quality. Journal of Agricultural Food and
Chemistry 55: 10812-10819.
Teyssier E, Boureauv L, Chen W, Lui r, Degraeve-Guibault C, Stammitti L, Hong Y, Gallusci P.
2015. Epigenetic regulation during fleshy fruit development and ripening. Applied Plant Genomics and
Biotechnology 8: 133-151.
Thomas TR, Matthews MA, Shackel KA. 2006. Direct in situ measurement of cell turgor in grape (Vitis
vinifera L.) berries during development and in response to plant water deficits. Plant, Cell, & Environment
29: 993–1001.
Thompson PA. 1963. The development of embryo, endosperm and nucellus tissues in relation to receptacle
growth in the strawberry. Annals of Botany 27: 589-605.
Timberlake CF. 1981. Anthocyanins in fruit and vegetables. In Recent Advances in the Biochemistry of
Fruit and Vegetables. J. Friend and M.J.C. Rhodes, eds. London: Academic Press, pp: 221-247.
Todeschini V, AitLahmidi N, Mazzucco E, Marsano F, Gosetti F, Robotti E, Bona E, Massa N,
Bonneau L, Marengo E, Wipf D, Berta G, Lingua G. 2018. Impact if beneficial microorganisms on
strawberry growth, fruit production, nutritional quality and volatilome. Frontiers in Plant Science 9: 1611.
Tosetti R, Elmi F, Pradas I, Cools K, Terry LA. 2020 Continuous exposure to ethylene differentially
affects senescence in receptacle and achene tissues in strawberry fruit. Frontiers in Plant Science 11:174
Trainotti L, Pavanello A, Casadoro G. 2005. Different ethylene receptors show an increased expression
during the ripening of strawberries: does such an increment imply a role for ethylene in the ripening of
these non-climacteric fruits? Journal of Experimental Botany 56: 2037-2046.
Trainotti L, Spinello R, Piovan A, Spolaore S, Casadoro G. 2001. - galactosidases with a lectin-like
domain are expressed in strawberry. Journal of Experimental Botany 52: 1635-1645.
Trainotti L, Ferrarese F, Dalla-Vecchia F, Rasico N, Casadoro G. 1999. Two different endo-b-1-4-
glucanases contribute to the softening of the strawberry fruits. Journal of Plant Physiology 154: 355-362.
Tucker GA. 1993. Introduction. In: Seymour GB, Taylor JE, Tucker GA, eds. Biochemistry of fruit
ripening. London: Chapman and Hall, 1–52.
Tulipani S, Mezzetti B, Capocasa F, Bompadre S, Beekwilder J, de Vos CH, Capanoglu E, Bovy A,
Battino M. 2008. Antioxidants, phenolic compounds, and nutritional quality of different strawberry
genotypes. Journal of Agricultural Food Chemistry 56: 696–704.
Valenzuela Riffo F, Parra-Palma C, Ramos P, Morales-Quintana L. 2020. Molecular and structural
insights into FaEXPA5, and alpha-expansin protein related with cell wall disassembly during ripening of
strawberry fruit. Plant physiology and biochemistry 154:589-581.
Vallarino JG, Merchante C, Sánchez-Sevilla JF, Balager MA, Pott, DM, Ariza MT, Casañal A, Posé
D, Vioque A, Amaya I, Willmitzer L, Solano R, Sozzani R, Fernie AR, Botella MA, Giovannoni JJ,
Valpuesta V, Osorio S 2020. Characterizing the involvement of FaMADS9 in the regulation of strawberry
fruit receptacle development. Plant biotechnology journal 18: 929-943.

146 Functional characterization of molecular regulatory mechanisms controlling the ripening in strawberry fruit
Vallarino JG, Osorio S, Bombarely A, Casañal A, Cruz-Rus E, Sánchez-Sevilla JF, Amaya I,
Giavalisco P, Fernie AR, Botella MA, Valpuesta V. 2015. Central role of FaGAMYB in the transition of
the strawberry receptacle from development to ripening. New Phytologist 208: 482-496.
Veluthambi K, Poovaiah BW. 1984. Auxin-regulated polypeptide changes at differential stages of
strawberry fruit development. Plant Physiology 75: 349-353.
Vij S, Tyagi AK. 2007. Emerging trends in the functional genomics of the abiotic stress response in crop
plants. Plant Biotechnology Journal 5: 361–380.
Vilanova S, Arús P, Sargent DJ, Monfort A. 2008. Synteny conservation between two distantly-related
Rosaceae genomes: Prunus (the stone fruits) and Fragaria (the strawberry). BMC Plant Biology 8: 67.
Villarreal NM, Martíınez GA, Civello PM. 2009. Influence of plant growth regulators on
polygalacturonase expression in strawberry fruit. Plant Science 176:749–757.
Villareal NM, Bustamante CA, Civello PM, Matínez GA. 2010. Effect of ethylene and 1-MCP
treatments on strawberry fruit ripening. Journal Science Food Agriculture 90: 683-689.
Vincken JP, Schols HA, Oomen R, McCann MC, Ulvskov P, Voragen A, Visser R. 2003. If
homogalacturonan were a side chain of rhamnogalacturonan I. implications for cell wall architecture. Plant
Physiology 132: 1781–1789.
Vesely J, Cihák A. 1978. 5-Azacytidine: mechanism of action and biological effects in mammalian cells.
Pharmacology and therapeutics, Part A. 2: 813-840.
Wada H, Shackel K, Matthews M. 2008. Fruit ripening in Vitis vinifera: apoplastic solute accumulation
accounts for pre-veraison turgor loss in berries. Planta 227: 1351-1361.
Wada H, Matthews M, Shackel K. 2009. Seasonal pattern of apoplastic solute accumulation and loss of
cell turgor during ripening of Vitis vinifera fruit under field conditions. Journal of Experimental Botany 60:
1773-1781.
Wang F, Zhang F, Chen M, Liu Z, Zhang Z, Fu J, Ma Y. 2017. Comparative transcriptomics reveals
differenctial gene expression related to Colletotichum gloeosporoides resistance in strawberry. Frontiers in
plant science 8: 779.
Wang H, Zhang H, Yang Y, Li M, Zhang T, Liu J Dong J, Li J, Butelli E, Xue Z, Wang A, Wang G,
Martin C, Jin W. 2019. The control of red colour by a family of MYB transcription factors in octopoid
strawberry (Fragaria × ananassa) fruits. Plant Biotechnology Journal 18:1169-1184.
Wang SY, Lin HS. 2000. Antioxidant activity in fruits and leaves of blackberry, raspberry, and strawberry
varies with cultivar and developmental stage. Journal of Agricultural and Food Chemistry, 48:140-146.
Wang ZY, Seto H, Fujioka S, Yoshida S, Chory J. 2001. BRI1 is a critical component of a plasma-
membrane receptor for plant steroids. Nature 410: 380–383.
Wang Y, Zhang J, Cui W, Guan C, Mao W, Zhang Z. 2017 Improvement in fruit quality by
overexpressing miR399 a in woodland strawberry. Journal of Agricultural Food Chemestry 65:7361-7370.
Wasilewska A, Vlad F, Sirichandra C, Redko Y, Jammes F, Valon C, Frei dit Frey N, Leung J. 2008.
An update on abcisic acid signalling in plants and more. Molecular Planta 1: 198-217.
Weebadde CK, Wang D, Finn CE, Lewers KS, Luby JJ, Bushakra J, Sjulin TM, Hancock JF. 2008.
Using a linkage mapping approach to identify QTL for day-neutrality in the octoploid strawberry. Plant
Breeding 127: 94–101.

INTRODUCCIÓN
147 PhD Thesis Félix Juan Martínez Rivas
Wei L, Mao W, Jia M, Xing S, Ali U, Zhao Y, Chen Y, Cao M, Dai Z, Zhang K, Dou Z, Jia W, Li B.
2018a. FaMYB44.2, a transcriptional repressor, negatively regulates sucrose accumulation in strawberry
receptacles through interplay with FaMYB10. Journal of Experimental Botany 20: 4805-4820.
Wei W, Cui MY, Yang H, Gao K, Xie YG, Jiang Y, Feng JY. 2018b. Ectopic expression of FvWRKY42,
a WRKY transcription factor from the diploid woodland strawberry (Fragaria vesca) enhances resistance
to powdery mildew, improves osmotic stress resistances, and increases abcisic acid sensitivity in
Arabidopsis. Plant science 275: 60-74.
Wheeler GL, Jones MA, Smirnoff N. 1998. The biosynthetic pathway of vitamin C in higher plants.
Nature 393: 365–369.
Wickland DP, Hanzawa Y. 2015. The FLOWERING LOCUS T/TERMINAL FLOWER 1 gene family:
functional evolution and molecular mechanisms. Molecular plant 8: 983-997.
Wilkinson JQ, Lanahan MB, Conner TW, Klee HJ. 1995. Identification of mRNAs with enhanced
expression in ripening strawberry fruit using polymerase chain reaction differential display. Plant
Molecular Biology 27: 1097-1108.
Williams BP, Pignatta D, Henikoff S, Gehring M. 2015. Methylation- sensitive expression of a DNA
demethylase gene serves as an epigenetic rheostat. PLoS Genetics 11: e1005142.
Woo HR, Dittmer TA, Richards EJ. 2008. Three SRA- domain methylcytosine-binding proteins
cooperate to maintain global CpG methylation and epigenetic silencing in Arabidopsis. PLoS Genetic. 4:
e1000156.
Woolley LC, James DJ, Manning K. 2001. Purification and properties of an endo--1,4- glucanase from
strawberry and down-regulation of the corresponding gene. Planta 214: 11–21.
Woodward JR. 1972. Physical and chemical changes in developing strawberry fruits. Journal of the
Sciences of Food and Agriculture 23: 465-473.
Wrolstad RE, Shallenberger RS.1981. Free sugars and sorbitol in fruits a compilation from the literature.
Journal of the Association Of Analytical Chemistry 64: 91-103.
Wrolstad RE, Putnam TP, Varseveld GW. 1970. Color quality of frozen strawberries: Effect of
anthocyanin, pH, total acidity and ascorbic acid variability. Journal Food Science 35: 448–452.
Wu Y, Sharp RE, Durachko DM, Cosgrove DJ. 1996. Growth maintenance of the maize primary root at
low wáter potentials involves increases in cell-wall extension properties, expansin activity, and wall
susceptibility to expansins. Plant Physiology 111: 765-772.
Xie M, Chen JW, Qin QP, Jiang GH, Sun CB, Zhang HQ, Xu HX. 2007. The control of sugar
accumulation within strawberry aggregate fruit by invertase and hexokinase. Zhi Wu Sheng Li Yu Fen Zi
Sheng Wu Xue Xue Bao, 33:213-218.
Xue S, Bors RH, Strelkov SE. 2006. Resistance sources to Xanthomonas fragariae in non octoploid
strawberry species. HortScience 40: 1653–1656.
Yamasaki A, Yamashita, M. 1993. Changes in endogenous cytokinins during flower induction of
strawberry. Acta Horticulturae 345: 93-99.
Yan JW, Ban ZJ, Lu HY, Li D, Poverenov E, Luo ZS, Li L. 2018. The aroma volatile repertoire in
strawberry fruit: a review. Journal of the Science of Food and Agriculture. 98:4395-4402.

148 Functional characterization of molecular regulatory mechanisms controlling the ripening in strawberry fruit
Yaneff A, Sigaut L, Marquez M, Alleva K, Pietrasanta LI, Amodeo G. 2014. Heteromerization of PIP
aquaporins affects their intrinsic permeability. Proceedings of the National Academy of Sciences 111: 231-
236.
Yarnell SH. 1928. Notes on the somatic chromosomes of the seven-chromosome group of Fragaria.
Genetics14: 78–83.
Yeh SY, Huang FC, Hoffmann T, Mayershofer M, Schwab W. 2014. FaPOD27 functions in the
metabolism of polyphenols in strawberry fruit (Fragaria sp.) Frontiers in Plant Science 5:518
Yubero-Serrano EM, Moyano E, Medina-Escobar N, Muñoz-Blanco J, Caballero JL. 2003.
Identification of a strawberry gene encoding a non-specific lipid transfer protein that responds to ABA,
wounding and cold stress. Journal of Experimental Botany 54: 1865–1877.
Zabetakis I, Holden MA. 1997. Strawberry flavour: analysis and biosynthesis. Journal Science Food
Agriculture 74: 421–434.
Zaharah SS, Singh Z, Symons GM, Reid JB. 2011. Role of brassinosteroids, ethylene, abscisic acid, and
indole-3-acetic acid in mango fruit ripening. Journal of Plant Growth Regulation 31: 363-372.
Zhang J, Wang X, Yu O, Tang J, Gu X, Wan X, Fang C. 2010. Metabolic profiling of strawberry
(Fragaria × ananassa Duch.) during fruit development and maturation. Journal of Experimental Botany
62: 1103-1118.
Zhang Y, Shih DS. 2007. Isolation of an osmotin-like protein gene from strawberry and analysis of the
response of this gene to abiotic stresses. Journal Plant Physiology 164: 68–77.
Zhang Y, Zhang Y, Lin Y, Luo Y, Wang Z, Chen Q, Sun B, Wang Y, Li M, Tang H. 2019. A
transcriptomic analysis reveals diverse regulatory networks that respond to cold stress in strawberry
(Fragaria x ananassa). International journal of genomics. 2019: 7106092.
Zhang Z, Shi Y, Ma Y, Yang X, Yin X, Zhang Y, Xiao Y, Liu W, Li Y, Li S, Liu Z, Grierson D, Allan
AC, Jiang G, Chen K. 2020. The strawberry transcription factor FaRAV1 positively regulates anthocyanin
accumulation by activation of FaMYB10 and anthocyanin pathway genes. Plant biotechnology journal. 11:
2267-2279.
Zhong S, Fei Z, Chen YR, Zheng Y, Huang M, Vrebalov J, McQuinn R, Gapper N, Liu B, Xiang J,
Shao Y, Giovannoni JJ. 2013. Single-base resolution methylomes of tomato fruit development reveal
epigenome modifications associated with ripening. Nature Biotechnology 31: 154-159.
Zhou HC, Li G, Zhao X, Li LJ. 2015. Comparative analysis of polygalacturonase in the fruit of the
strawberry cultivars. Genetical Molecular Research. 14: 12776-12787.
Zhou J, Wang G, Liu Z 2018. Efficient genome‐editing of wild strawberry genes, vector development,
and validation. Plant Biotechnology Journal 16: 1868–1877.
Zhu YC, Zhang B, Allam AC, Lin-Wang K, Zhao Y, Wang K, Chen KS, Xu CJ. 2020. DNA
demethylation is involved in the regulation of temperature dependent anthocyanin accumulation in peach.
Plant Journal 102: 965-976.
Zorrilla-Fontanesi Y, Rambla JL, Cabeza A, Medina JJ, Sánchez-Sevilla JF, Valpuesta V, Botella
MA, Granell A, Amaya I. 2012.Genetic analysis of strawberry fruit aroma and identification of O-
methyltransferase FaOMT as the locus controlling natural variation in mesifurane content. Plant Physiology
159: 851-870.

INTRODUCCIÓN
149 PhD Thesis Félix Juan Martínez Rivas
Zuidmeer L, Salentijn E, Rivas MF, Mancebo EG, Asero R, Matos CI, Pelgrom KTB, Gilissen LJWJ,
van Ree R. 2006. The role of profilin and lipid transfer proteinin strawberry allergy in the Mediterranean
area. Clinical & Experimental Allergy 36: 666–675.

150 Functional characterization of molecular regulatory mechanisms controlling the ripening in strawberry fruit

OBJETIVES
151 PhD Thesis Félix Juan Martínez Rivas
OBJECTIVES

OBJETIVES
152 Functional characterization of molecular regulatory mechanisms controlling the ripening in strawberry fruit

OBJETIVES
153 PhD Thesis Félix Juan Martínez Rivas
The objectives of this thesis were the following:
Chapter 1
1.1- Identification of the PRE genes in the strawberry genome and analysis of their
transcriptional profiles in fruit receptacles, vegetative tissues and under different
experimental conditions to characterize their spatio-temporal expression pattern and in
response to hormones.
1.2.- Transitory knock-down of FaPRE1 and transcriptomic analysis to determine the
transcriptomic changes produced and identification of genes with expression altered by
it.
1.3.- Determination of the putative FaPRE1 role in the control of ripening process in
strawberry fruit.
Chapter 2
2.1.- Functional characterization of strawberry FaMYB123 gene by the analysis of its
expression in fruit receptacles, achenes, vegetative plant tissues and under different
experimental conditions to characterize its spatio-temporal expression pattern and in
response to hormones.
2.2.- Generation of stable strawberry transgenics plants with the FaMYB123 expression
silenced by RNAi and evaluation of their silenced degree.
2.3.- Gene expression and metabolomic analysis of transgenic strawberry fruits
FaMYB123-RNAi to determine the putative regulatory role played for this transcription
factor in the biosynthetic phenylpropanoid pathway.
2.4.- Determination of the possible interaction between FaMYB123 and FabHLH3 using
yeast two hybrid (Y2H) studies.
Chapter 3
3.1.- Determination of the putative DNA methylation role on the control of ripening
process by injecting of demethylating agent 5-azacytidine (AZA) to strawberry fruits.
3.2.- Evaluation of the strawberry fruit phenotypic and transcriptomic changes driven by
the AZA injection.
3.3.- Determination of strawberry fruit metabolomic and hormonal profiles in response to
AZA treatment.

OBJETIVES
154 Functional characterization of molecular regulatory mechanisms controlling the ripening in strawberry fruit
Chapter 4
4.1.- Functional characterization of strawberry FaCXE2 gene by the analysis of its
expression in fruit receptacles, achenes, vegetative tissues and under different
experimental conditions to determine its expression profiles and hormonal regulation.
4.2.- In vitro enzymatic characterization of FaCXE2 protein and determination of its
enzymatic properties
4.3.- Determination of the metabolomic changes produced in strawberry fruit with the
transiently silenced FaCXE2 expression.

MATERIALES Y MÉTODOS
155 PhD Thesis Félix Juan Martínez Rivas
MATERIALES Y MÉTODOS

156 Functional characterization of molecular regulatory mechanisms controlling the ripening in strawberry fruit

MATERIALES Y MÉTODOS
157 PhD Thesis Félix Juan Martínez Rivas
MATERIALES Y MÉTODOS
1. MATERIALES
1.1. Material químico
1.1.1. Productos químicos
Todos los productos y reactivos utilizados fueron de alta calidad y se adquirieron en las
casas comerciales que aparecen entre paréntesis:
A Acetato amónico (NH4C2H3O2) (Sigma)
Acetato de lítio (LiCH3COO) (Sigma)
Acetato sódico (NaCH3COO) (Merck)
Acetato potásico (KCH3COO) (Merck)
Acetona (C3H6O) (Merck)
Acetonitrilo (C2H3N) (Merck)
Acetosiringona (3’5’-Dimethoxy-4’-hydroxyacetophenona) (C10H10O4) (Aldrich)
Ácido abscísico (C15H20O4) (Sigma)
Ácido acético (C2H4O2) (Panreac)
Ácido bórico (H3BO3) (Sigma)
Ácido clorhídrico (HCl) (Panreac)
Ácido 1,2-diaminociclohexano-N,N,N’,N’-tetraacético (CDTA) (C14H20N2Na2O8) (Sigma)
Ácido etilen-diamino-tetraacético, sal disódica (EDTA-Na2) (C10H14N2O8Na2×2H2O) (Sigma)
Ácido indol-3-butírico (IBA) (C12H13NO2) (Sigma)
Ácido 2-(N-Morfolino) etanosulfónico (MES) (C6H13NO4S)(Sigma)
Ácido 3-(N-Morfolino) propanosulfónico (MOPS) (C7H15NO4S) (Sigma)
Ácido 1-naftalenacético (1-NAA) (Sigma)
Ácido nicotínico (C6H5NO2) (Duchefa)
Ácido nítrico (HNO3) (Merck)
Ácido nordihidroguaiarético (NDGA) (C18H22O4) (Sigma)
Ácido salicílico (C7H7NO3) (Sigma)
Ácido sulfúrico (H2SO4) (Panreac)
ADN de esperma de salmón (sigma)
ADN de fago l digerido con HindIII (Pharmacia)
Agar (Promega)
Agar de plantas (Duchefa)
Agarosa (Promega)
Alcohol isoamílico (C6H11OH) (Sigma)
3-amino-1,2,4-triazol (3-AT) (C2H4N4) (Sigma)

158 Functional characterization of molecular regulatory mechanisms controlling the ripening in strawberry fruit
Ampicilina sal sódica (C16H18N3NaO4S) (Sigma)
Ascorbato sódico (C6H7NaO6) (Sigma)
Adenosina 5'-trifosfato disódica (ATP) (C10H14N5Na2O13P3) (Sigma)
Azacitidina (C8H12N4O5) (Sigma)
B Bacto-triptona (Difco)
Base nitrogenada de levadura sin aminoácidos (Difco)
6-bencil aminopurina (BA) (C12H13NO2) (Sigma)
Bicarbonato sódico (NaHCO3) (Sigma)
5-bromo-4-cloro-3-indolil-β-D-galactopiranósido (X-gal) (C14H15BrClNO6) (Sigma)
Butanol terciario (tert-Butanol) (C4H10O) (Merck)
C Carbenicilina (C26H25N2NaO6S) (Duchefa)
Carbonato de sodio (Na2CO3) (Sigma)
Cloranfenicol (C11H12Cl2N2O5) (Sigma)
Cloroformo (CHCl3) (Merck)
Cloruro cálcico (CaCl2×2H2O) (Sigma)
Cloruro de cobalto (CoCl2×6H2O) (Sigma)
Cloruro de litio (LiCl) (Merck)
Cloruro de magnesio (MgCl2) (USB)
Cloruro potásico (KCl) (Merck)
Cloruro sódico (NaCl) (Panreac)
D Deoxiadenosina 5´-trifosfato (dATP) (Pharmacia)
Deoxinucleótidos trifosfato (dNTPs) (Pharmacia)
Deuteróxido de sódio (hidróxido de sodio deuterado)(NaOD) (Sigma)
4',6-Diamidino-2-fenilindol diclorhidrato (DAPI) (C16H15N5×2HCl) (Sigma)
Dietil pirocarbonato (C6H10O5) (DEPC) (Sigma)
N-N-dimetilformamida (C3H7NO) (Merck)
Dimetil sulfóxido (DMSO) (C2H6SO) (Sigma)
DNasa I RNasa free (InvitrogenTM)
Ditiotreitol (DTT) (C4H10O2S2) (Sigma)
Dodecil sulfato sódico (SDS) (C12H25O4SNa) (Sigma)
E EcoRI (NEB)
Espectinomicina diclorhidrato pentahidrato (C14H24N2O7 · 2HCl · 5H2O) (Sigma)
Estreptomicina sulfato (C21H39N7O12) (Sigma)
Etanol absoluto (CH2OH) (Merck)
Éter dietílico (C4H10O) (Merck)
Etil acetato (C4H802) (Sigma)
Etilenglicol monobutil éter (2-BE) (C6H14O2) (Sigma)

MATERIALES Y MÉTODOS
159 PhD Thesis Félix Juan Martínez Rivas
Extracto de levadura (Difco)
F Fenol (C6H5OH) (Merck)
Fosfatasa alcalina de timo de ternera (CIAP)(InvitrogenTM)
Fosfato monosódico diácido (NaH2PO4) (Panreac)
Fosfato disódico monoácido (Na2HPO4) (Panreac)
Fosfato sódico (Na3PO4) (Sigma)
Fosfato potásico monobásico (KH2PO4) (Sigma)
G Gentamicina sal de sulfato (C21H43N5O7) (Sigma)
Glicerol (C3H8O3) (Panreac)
Glicina (H2NCH2COOH) (Merck)
Glucosa (C6H12O6) (Sigma)
Glutatión reducido (Sigma)
GST-Sepharose (Novogen)
H Hexadeciltrimetil-amonio bromido (CTAB) (C19H42NBr) (Sigma)
Hidróxido sódico (NaOH) (Panreac)
Hidróxido potásico (KOH) (Panreac)
I Isoamil acetato (C8H14O2) (Sigma)
Isopropanol (C3H7OH) (Merck)
Isopropil-b-D-tiogalactósido (IPTG) (C9H18O5S) (Pharmacia)
K Kanamicina monosulfato (C18H36N4O117H2SO47H2O) (Duchefa)
Kinetina (6-furfuril-aminopurina) (Sigma)
L Lanolina (Sigma)
L-Adenina (Sigma)
L-Arginina HCl (Sigma)
L-Fenilalanina (Sigma)
L-Histidina HCl Monohidrato (Sigma)
L-Isoleucina (Sigma)
L-Leucina (Sigma)
L-Lisina HCl (Sigma)
L-Metionina (Sigma)
L-Tirosina (Sigma)
L-Treonina (Sigma)
L-Triptófano (Sigma)
L-Valina (Sigma)
L-Uracilo (Sigma)

160 Functional characterization of molecular regulatory mechanisms controlling the ripening in strawberry fruit
M Maltosa (C12H22O11.H2O) (USB)
Marcador de peso molecular 1 Kb Plus DNA ladder (InvitrogenTM)
Marcador de peso molecular 100 pb (Pharmacia)
Marcador de proteínas (Broad Range 2-212 kDa) (BioLabs)
2-Mercaptoetanol (β-mercaptoetanol) (C2H6OS) (Sigma)
Metanol (CH3OH) (Panreac)
Molibdato de sodio dihidratado (Na2MoO4×2H2O) (Sigma)
Myo-inositol (C6H12O6) (Sigma)
N Neoxantina
Nitrato amónico (NH4NO3) (Sigma)
Nitrato de calcio (Ca(NO3)2×4H2O) (Sigma)
Nitrato potásico (KNO3) (Panreac)
O β-octil glucósido (C14H28O6) (Sigma)
Óxido de deutério (agua pesada) (D2O) (Sigma)
P Piridoxina (vitamina B6) (C8H11NO3) (Sigma)
Polietilenglicol 3350 (PEG-3350) (Panreac)
Polietilenglicol 8000 (PEG-8000) (Panreac)
Progel Tris-Glycin 12% 1.0 mm (ANAMED)
1-Propanol (C3H7OH) (Merck)
R Reactivo de Bradford (“Protein Assay”) (BioRad)
Rifampicina (C43H58N4O12) (Duchefa)
RNasa OUTTM (InvitrogenTM)
RNasa pancreática (Pharmacia)
S Sacarosa (C12H22O11) (Sigma)
Sepharose GST-BindTM Resin (Novogen)
Seroalbúmina bovina (BSA) (Sigma)
Sulfato de cobre (CuSO4×5H2O) (Sigma)
Sulfato de magnesio (MgSO4×7H2O) (Panreac)
Sulfato de manganeso (MnSO4×H2O) (Sigma)
Sulfato de zinc (ZnSO4×7H2O) (Panreac)
Sulfato ferroso (FeSO4×7H2O) (Sigma)
SYBR-Green I (Molecular Probes)
T Tetrahidrato de cloruro de manganeso (MnCl2×4H2O) (Sigma)
Tiamina (vitamina B1) (C12H17ClN4OS×HCl) (Duchefa)
Tricina (C6H13NO5) (Sigma)

MATERIALES Y MÉTODOS
161 PhD Thesis Félix Juan Martínez Rivas
Titriplex (Merck)
Tris(hidroximetil)aminometanoNH2C(CH2OH)3 (Sigma)
Tritón X-100 (Sigma)
Tween-20 (poliexylen-sorbitan-monolaurato) (BioRad)
V 9-cis-violaxantina
X XhoI (NEB)
Z 9-cis-zeaxantina
1.1.2. Antibióticos utilizados
Los antibióticos empleados fueron disueltos siguiendo las fichas técnicas y esterilizados
por filtración a través de un filtro de 0,22 μm de diámetro de poro. Una vez esterilizados, se
repartieron en alícuotas de 1 ml y se mantuvieron almacenados a -20 ºC hasta su uso. La
concentración de almacenamiento de los antibióticos se recoge en la Tabla 1.
Tabla 1: Antibióticos usados en este trabajo.
1.1.3. Kits de biología molecular
Fruit-Mate™ for RNA purification (TaKaRa)
Gateway® BP Clonase® II Enzyme mix (InvitrogenTM)
Gateway® LR Clonase® Enzyme mix (InvitrogenTM)
GeneJET Gel Extraction Kit (Quiagen)
GeneJET PCR Purification Kit (Quiagen)
GeneJET Plasmid Miniprep Kit (Quiagen)
iProofTM High Fidelity DNA Polymerase (Bio-Rad)
iQTM SYBR®Green Supermix (Bio-Rad)
Maxwell® RSC Plant RNA (Promega)
Antibiótico Solvente Concentración de
almacenamiento Concentración final
Ampicilina (Sigma) H2Od 100 mg/ml 100 µg/ml
Kanamicina (Duchefa) H2Od 50 mg/ml 50-100 µg/ml (microorganismos)
25-100 mg/l (plantas)
Rifampicina (Duchefa) DMSO 100 mg/ml 100 µg/ml
Carbenicilina (Duchefa) H2Od 100 mg/ml 250-500 mg/l (plantas)
Cloranfenicol (Sigma) EtOH 15 mg/ml 15 µg/ml
Estreptomicina (Sigma) H2Od 100 mg/ml 100 µg/ml
Espectinomicina (Sigma) H2Od 100 mg/ml 100 µg/ml
Gentamicina (Sigma) H2Od 15 mg/ml 15 µg/ml (bacterias)
10 µg/ml (levaduras)

162 Functional characterization of molecular regulatory mechanisms controlling the ripening in strawberry fruit
One Library Efficiency DH5α Chemically Competent Cells (InvitrogenTM)
One Shot® TOP10 Chemically Competent E. coli (InvitrogenTM)
Phire Plant Direct PCR Kit (Thermo Scientific)
QIAGEN® Plasmid Mini Kit (Qiagen)
QIAquick® Gel Extraction Kit (Qiagen)
RNeasy® Mini Kit (Qiagen)
SsoAdvancedTM SYBR® Green SuperMix (Bio-Rad)
1.2. Material biológico
1.2.1. Material vegetal
Todo el material vegetal empleado procede de plantas de fresa (Fragaria × ananassa) del
cultivar Camarosa y Fortuna, recolectados en la Finca Experimental “El Cebollar” en Moguer,
Huelva (CIFA, Junta de Andalucía). El material vegetativo utilizado para la experimentación
fueron hojas, coronas, estolones, raíces, pétalos, pedicelos, flores y botones florales. Las muestras
biológicas se congelaron en nitrógeno líquido inmediatamente después de su recolección y se
conservaron a -80 ºC hasta el momento de su utilización.
Para la transformación por agroinfiltración en frutos y transformación estavles (Materiales y
Métodos, Apartado 2.10.2 y 2.9.4.2.) se utilizaron plantas de fresa (Fragaria × ananassa) del
cultivar Chandler y para los experimentos realizados para la determinación de ABA (Materiales
y Métodos, Apartado 2.14.2) se utilizaron plantas del cultivar Camarosa. Las plantas utilizadas se
mantuvieron a una temperatura de 25 ºC, con un fotoperiodo de 16 h de luz/8 h de oscuridad y
bajo una irradiancia de 120 μmol m-2 sec-1 proporcionada por lámparas Osram Fuora (Múnich,
Alemania).
Los estadios de desarrollo y maduración de los frutos se establecieron en función de los
siguientes parámetros (Figura 1):
• Verde-1 (V1): fruto pequeño con color verde en primera fase de crecimiento, con
aquenios muy juntos y verdes.
• Verde-2 (V2): fruto elongado con color verde, aquenios muy juntos y verdes.
• Verde-3 (V3): fruto verde de mayor tamaño, con aquenios separados y verdes.
• Blanco (B): fruto de color blanco que ha alcanzado su tamaño definitivo y con aquenios
de color verde a marrón por los efectos de la lignificación.
• Intermedio (I): el fruto presenta zonas coloreadas que se extienden desde el extremo
apical.
• Rojo (R): fruto completamente rojo y maduro y con aquenios lignificados.
• Sobremaduro (SM): fruto rojo intenso de textura blanda y aquenios rojos lignificados.

MATERIALES Y MÉTODOS
163 PhD Thesis Félix Juan Martínez Rivas
• Senescente (SN): fruto de color vino tinto, opaco, aquenios del mismo color.
Figura 1. Estadios de desarrollo y maduración del fruto de fresa (Fragaria × ananassa “Camarosa”).
1.2.2. Estirpes bacterianas
Escherichia coli DH5α: F- supE44 DlacU169 (Ф80lacZΔM15) hsdR17 recA1 endA1
gyrA96 thi-1 relA1. Esta estirpe presenta varias mutaciones que favorecen la estabilidad del ADN
clonado, se emplea generalmente para la replicación de plásmidos. La delección Ф80lacZΔM15
permite la α-complementación con el extremo amino terminal de la β-galactosidasa codificada
por vectores del tipo pGEM®-T Easy.
Escherichia coli BL21 (DE3) pLysS (InvitrogenTM): F-, ompT, hsdS (rB-, mB-), gal (53,
54). Cepa deficiente en las proteasas Ion y ompT, con expresión nula de la proteína cuando no
está inducida por IPTG y con expresión de la lisozima T7 que, entre otras cosas, facilita la rotura
de las paredes celulares bacterianas en la extracción de proteínas. Resistente a Cloranfenicol
(Cmp).
Escherichia coli BL21 (TOP10) (InvitrogenTM): F- mcrA Δ(mrr-hsdRMS-mcrBC)
Ф80lacZΔM15 ΔlacZ74 recA1 araD139 Δ(ara-leu)7697 galU galK rpsL (StrR) endA1 nupG.
Estirpe comercializada en forma de células químicamente competentes para la transformación
con vectores plasmídicos de la tecnología Gateway (InvitrogenTM). Permite la obtención de un
ADN plasmídico de calidad ya que es una estirpe deficiente de la Endonucleasa I no específica
(endA1) y deficiente en los sistemas de recombinación (recA1). Presenta una elevada eficiencia
de transformación con ADN no metilado obtenido por PCR (hsdRMS).
Agrobacterium tumefaciens GV3101 (Koncz y Schell, 1986): pTiC58∆T-DNA Rifr Gentr
Kanr. Estirpe bacteriana resistente a rifampicina y empleada para la expresión transitoria en
Nicotiana benthamiana. Contiene el plásmido Ti desarmado pMP90RK, que confiere resistencia
a gentamicina y kanamicina.
Agrobacterium tumefaciens AGL0 (Lazo et al., 1991): EHA101pTibO542 ΔT-region
Mop+. Estirpe bacteriana resistente a rifampicina y empleada en la transformación y obtención

164 Functional characterization of molecular regulatory mechanisms controlling the ripening in strawberry fruit
de plantas transgénicas de fresa. Contiene el plásmido Ti desarmado pTibO542ΔT que posee una
región correspondiente a los genes de síntesis de monopinas, y una región vir que aporta en trans
las funciones de virulencia necesarias para la transferencia del T-DNA presente en un vector
binario al genoma de la planta.
1.2.3. Estirpes de levaduras
Saccharomyces cerevisiae PJ69-4a (James et al., 1996): MATa trp1-901 leu2-3,112
ura3-52 his3-200 Δgal4 Δgal80 LYS2::GAL1-HIS3 GAL2-ADE2 met2::GAL7-lacZ (Cedida por
el Dr. Jan Schaart, Wageningen UR Plant Breeding).
Saccharomyces cerevisiae PJ69-4α: MATα trp1-901 leu2-3,112 ura3-52 his3-200 Δgal4
Δgal80 LYS2::GAL1-HIS3 GAL2-ADE2 met2::GAL7-lacZ (Cedida por el Dr. Jan Schaart,
Wageningen UR Plant Breeding).
1.3. Vectores de clonación
pGEM®-T Easy (Promega). El vector pGEM®-T Easy (Figura 2) se utilizó para la
clonación de fragmentos de ADN amplificados mediante PCR. Es un plásmido de alto número de
copias que se comercializa en forma linealizada después de haber sido digerido enzimáticamente
con la endonucleasa de restricción EcoRV. Además, la posición 3’ de los extremos romos
resultantes de la actuación de la enzima han sido modificados químicamente adicionando dos
restos de desoxitimidina. Estos residuos incrementan la eficiencia de la ligación de los productos
de PCR debido a que numerosas ADN polimerasas termoestables añaden sistemáticamente un
residuo de deoxiadenosina a los extremos 3’ de los fragmentos amplificados, independientemente
de la secuencia del ADN utilizado como molde.
El sitio de inserción se encuentra flanqueado por un lugar de clonación múltiple que contiene
dianas únicas para 12 endonucleasas de restricción diferentes y puntos de corte duplicados, a
ambos lados del lugar de inserción, para tres enzimas de restricción distintas. En los extremos de
este, aparecen cuatro secuencias promotoras diferentes (cebadores Reverse M13, Forward M13,
T3 y T7). El sitio de clonación múltiple interrumpe la secuencia génica del fragmento amino
terminal α de la β-galactosidasa susceptible de ser α-complementado por el fragmento ω existente
en el genoma de la célula hospedadora, lo que facilita la selección de recombinantes mediante
IPTG y X-Gal. Además, el plásmido pGEM®-T Easy confiere resistencia al antibiótico ampicilina
a las células bacterianas que lo contienen.

MATERIALES Y MÉTODOS
165 PhD Thesis Félix Juan Martínez Rivas
Figura 2. Vector de clonación pGEM®-T Easy.
pCR®8/GW/TOPO® (Gateway® Vector, InvitrogenTM). Este vector (Figura 3A) se
empleó para el subclonaje de fragmentos de ADN amplificados mediante la reacción en cadena
de la polimerasa (PCR). Se comercializa en forma linealizada con extremos protuberantes 3’ de
timidina unidos covalentemente a la enzima topoisomerasa I del virus Vaccinia (Shuman, 1991).
La unión de la topoisomerasa al ADN es eliminada durante el subclonaje de cualquier producto
de PCR que presente un residuo de deoxiadenosina en su extremo 3’ adicionado por la acción
inespecífica de la Taq polimerasa durante la obtención del amplicón. La presencia de estos
residuos aumenta la eficiencia de clonaje en el vector plasmídico.
Junto al sitio de subclonaje del producto de PCR en el plásmido, se encuentran los sitios
attL Gateway® (InvitrogenTM). Esto permite que el vector pCR®8/GW/TOPO® pueda ser
empleado como un Entry vector en el sistema de subclonaje Gateway® (InvitrogenTM) (Figura
3A). El sistema Gateway es una metodología de clonaje universal que emplea el sistema de
recombinación específica del bacteriófago lambda (Landy, 1989). De este modo, el fragmento de
ADN subclonado en este vector puede ser transferido eficazmente mediante recombinación a otro
vector que contenga los sitios attR Gateway® (InvitrogenTM). El fragmento subclonado en este
vector puede ser secuenciado empleando los cebadores universales Forward M13 y Reverse M13
o escindido mediante digestión enzimática con EcoRI. Además, este vector confiere resistencia a
espectinomicina a las células bacterianas que lo contienen.
pDONRTM221 (Gateway® Vector, InvitrogenTM). Este vector (Figura 3B) se empleó para
la clonación de fragmentos de ADN amplificados mediante PCR. Está diseñado para generar
sitios attL que flanqueen al producto de PCR subclonado dentro de él y así poder ser empleado
posteriormente como entry vector en la recombinación basada en la metodología Gateway®. El

166 Functional characterization of molecular regulatory mechanisms controlling the ripening in strawberry fruit
fragmento clonado en este vector puede ser secuenciado empleando los cebadores universales
Forward (M13) y Reverse (M13). Además, este vector confiere resistencia a kanamicina a las
células bacterianas que lo contienen.
Figura 3. A) Vector de clonación pCR®8/GW/TOPO®. B) Vector de clonación pDONRTM221.
1.3.1. Vectores de expresión de proteínas
pGEX-4T-1 (Amersham) (Figura 4). Este vector se emplea en la expresión heteróloga de
proteínas en E. coli mediante el subclonaje del correspondiente ADNc en el sitio de clonaje
múltiple. La expresión de la proteína está bajo control del promotor lac que se induce en presencia
del análogo de la lactosa isopropyl β-D-thiogalactosido (IPTG). Todos los vectores pGEX
incluyen el gen interno lacIq cuyo producto es una proteína represora que se une al operador del
gen lac evitando la expresión del inserto hasta la adición de IPTG y, controlando así, su expresión.
Este vector contiene además el gen de fusión glutatión S-transferasa (GST) que lo
convierte en un sistema muy versátil de expresión, purificación y detección de proteínas
producidas en E. coli. El sistema se basa en la expresión inducible de altos niveles de proteína
recombinante, que conserva siempre su actividad enzimática, fusionada a la GST en el extremo
amino terminal. Posteriormente, la proteína de fusión obtenida se purifica a partir de lisados
bacterianos mediante cromatografía de afinidad utilizando glutatión reducido, lo que permite la
captura específica de la proteína y la eliminación de impurezas presentes en la muestra mediante
varios lavados sucesivos. Este proceso de purificación preserva tanto la antigenicidad como la
actividad de la proteína lo que facilita su posterior análisis. Si es necesario, la GST se puede
eliminar mediante digestión con la proteasa trombina y liberar así la proteína recombinante de
interés para usos posteriores. En general, cualquier proteína de fusión puede ser detectada
mediante colorimetría o empleando métodos inmunológicos.

MATERIALES Y MÉTODOS
167 PhD Thesis Félix Juan Martínez Rivas
En cualquier caso, las construcciones pGEX-4T-1-ADNc obtenidas se transforman
preferentemente en la estirpe bacteriana E.coli BL21 (DE3) pLysS, resistente a cloranfenicol.
Además, la selección de células de E. coli portadoras de este vector se hace en presencia de
ampicilina. Por otra parte, para el análisis mediante PCR de los clones de interés se emplean los
cebadores pGEX 5´y pGEX 3´.
Figura 4. Vector de expresión pGEX-4T-1.
pDESTTM22 (Gateway® Vector, InvitrogenTM) (Cedido por el Dr. Jan Schaart,
Wageningen UR Plant Breeding) (Figura 5). Es un vector de expresión de proteínas en levaduras
que se emplea como destination vector en la metodología Gateway® (InvitrogenTM). La secuencia
completa codificante de los genes a estudiar mediante doble híbrido en levaduras se transfiere
desde el vector pDONRTM221 usando una reacción de recombinación mediada por la enzima LR
clonasa, generando un vector AD-Y. El gen de interés queda fusionado en el mismo marco de
lectura al dominio de activación de la transcripción (AD) de la proteína GAL4. En el sistema del
doble híbrido de levadura, este vector es empleado para escrutar interacciones entre proteínas.
Este vector posee el gen ccdB situado en la región delimitada por los extremos attR (attR1-ccdB-
CmR-attR2) asociado al gen marcador de resistencia a cloranfenicol. Para la selección en células
de E.coli, este vector contiene además un gen marcador de resistencia a ampicilina. Para la
selección en levaduras S. cerevisiae cepa PJ69-4a, contiene un gen marcador de selección por
triptófano.

168 Functional characterization of molecular regulatory mechanisms controlling the ripening in strawberry fruit
Figura 5. Vector pDESTTM22.
pDESTTM32 (Gateway® Vector, InvitrogenTM) (Cedido por el Dr. Jan Schaart,
Wageningen UR Plant Breeding) (Figura 6). Es un vector de expresión de proteínas en levaduras
que se emplea como destination vector en la metodología Gateway® (InvitrogenTM). La secuencia
codificante de los genes a estudiar mediante el doble híbrido en levaduras se transfiere desde el
vector pDONRTM221 mediante una reacción de recombinación mediada por la enzima LR
clonasa, generando un vector BD-X. El gen de interés queda fusionado en el mismo marco de
lectura al dominio de unión al ADN (BD) de la proteína GAL4. En el sistema del doble híbrido
de levadura, este vector es empleado para escrutar interacciones entre proteínas. Este vector posee
el gen ccdB situado en la región delimitada por los extremos attR (attR1-ccdB-CmR-attR2)
asociado al gen marcador de resistencia a cloranfenicol. Para la selección en células de E.coli,
este vector contiene además un gen marcador de resistencia a gentamicina y un gen marcador de
selección por leucina para la selección en levaduras S. cerevisiae cepa PJ69-4α.

MATERIALES Y MÉTODOS
169 PhD Thesis Félix Juan Martínez Rivas
Figura 6. Vector pDESTTM32.
1.3.2. Vectores binarios
pFRN (Cedido por el Dr. Marten Denekamp del Departamento de Biología Celular y
Molecular, Universidad de Utrecht, Países Bajos). Este es un vector binario que se emplea como
destination vector en la metodología Gateway® (InvitrogenTM) (Figura 7). Se utiliza en la
transformación de plantas ya que produce moléculas de ARN interferente (ARNi) en las plantas
transgénicas resultantes, lo que conlleva al silenciamiento génico postranscripcional de los genes
clonados.
Este vector es una modificación del vector pFGC5941 (ChromDB) en el que se ha
sustituido el gen bar, que confiere resistencia a basta, por el gen nptII que confiere resistencia a
kanamicina en la planta transgénica que lo contiene. Posee además cuatro sitios attR Gateway en
posiciones invertidas (attR1-attR2 y attR2-attR1), de manera que el inserto es subclonado en
orientación antisentido y sentido simultáneamente. Así, se produce la formación de moléculas de
ARN de doble cadena (ARNds) desencadenantes del silenciamiento génico por ARNi. Entre las
dos regiones attR Gateway® y separándolas entre sí, se encuentra la secuencia correspondiente a
un intrón del gen ChsA (gen que codifica una chalcona sintasa) y que da lugar a un bucle en la
estructura secundaria del ARNds, necesario para la formación del ARNi. La síntesis del ARNds
está dirigida por el promotor 35s CaMV y OCS 3’ es terminador de la transcripción de dicho
promotor. La región situada entre los extremos LB (borde izquierdo) y RB (borde derecho) es
transferida al genoma de la planta durante la transformación mediada por Agrobacterium.

170 Functional characterization of molecular regulatory mechanisms controlling the ripening in strawberry fruit
Figura 7. Estructura del vector binario pFRN empleado para el silenciamiento génico
postranscripcional mediante ARNi en plantas transgénicas de fresa.
Este vector incluye además dos genes ccdB flanqueados por cada pareja de extremos attR
(attR1-ccdB-CmR-attR2 y attR2-ccdB-CmR-attR1) (Bernard y Couturier, 1992; Bernard et al.,
1993). La proteína codificada por este gen interfiere con la ADN girasa de E. coli, inhibiendo el
crecimiento de la mayoría de las estirpes de E. coli (ej. DH5α y TOP10). Por ello, se almacena en
la estirpe de E. coli DB3.1 que contiene la mutación (gyrA462) que la hace insensible a los efectos
de la proteína ccdB. De esta manera, este gen permite la selección negativa de las células que lo
contienen tras el proceso de recombinación con la LR clonasa Gateway® (Materiales y Métodos,
apartado 2.9.2.1). Además, contiene un gen que confiere resistencia al antibiótico cloranfenicol
junto al gen ccdB, por lo que la presencia de este antibiótico en el medio favorece la estabilidad
del gen ccdB en el ADN plasmídico. Para la selección en bacterias y plantas, este vector contiene
además un gen marcador de resistencia al antibiótico kanamicina.
pK7WGF2.0 (Plant Systems Biology, VIB) (Karimi et al., 2002) (Figura 8). Este vector
binario se emplea como Destination vector en la metodología Gateway® (InvitrogenTM). Se utiliza
en la transformación de plantas para la sobreexpresión de genes de interés dirigida por el promotor
35S, además posee un gen reportero de fluorescencia (Egfp) situado a continuación del promotor
35S y fusionado en el mismo marco de lectura que nuestro gen de interés en su extremo amino
terminal. Este vector, como todos los que utilizan la tecnología Gateway, posee los sitios de
recombinación attR específicos para clonar fragmentos de ADN en una reacción in vitro de la LR
clonase™, de manera eficiente y específica. Los fragmentos se clonan en una orientación dirigida
y marco de lectura predefinido. Además, posee el gen ccdB situado en la región delimitada por
los extremos attR (attR1-ccdB-CmR-attR2) cuyas características se han explicado anteriormente.
Para su selección en bacterias y plantas, este vector contiene además un gen marcador de
resistencia a espectinomicina/estreptomicina y a kanamicina respectivamente.

MATERIALES Y MÉTODOS
171 PhD Thesis Félix Juan Martínez Rivas
Figura 8. Vector de expresión pK7WGF2.0.
pE-SPYNE-Gw y pE-SPYCE-Gw (Cedidos por los Dr. Caroline Mayer and Wolfgang
Dröge-Laser, Universidad de Wurzburgo) (Figura 9). Este vector binario se emplea como
destination vector en la metodología Gateway® (InvitrogenTM). Se utiliza en la transformación de
plantas para la sobreexpresión de genes de interés dirigida por el promotor 35S, además posee la
mitad amino (SPYNE) y carboxilo (SPYCE) del gen reportero YFP situado a continuación del
promotor 35S y fusionado en el mismo marco de lectura que nuestro gen de interés. Así, in vivo,
si se produce interacción entre las proteínas codificadas por ambos vectores, se reconstituye la
proteína fluorescente YFP. Este vector, como todos los que utilizan la tecnología Gateway, posee
los sitios de recombinación attR específicos para clonar fragmentos de ADN en una reacción in
vitro de la LR clonase™, de manera eficiente y específica. Los fragmentos se clonan en una
orientación dirigida y marco de lectura predefinido. Además, posee el gen ccdB situado en la
región delimitada por los extremos attR (attR1-ccdB-CmR-attR2) cuyas características se han
explicado anteriormente. Para su selección en bacterias este vector contiene además un gen
marcador de resistencia a ampicilina.
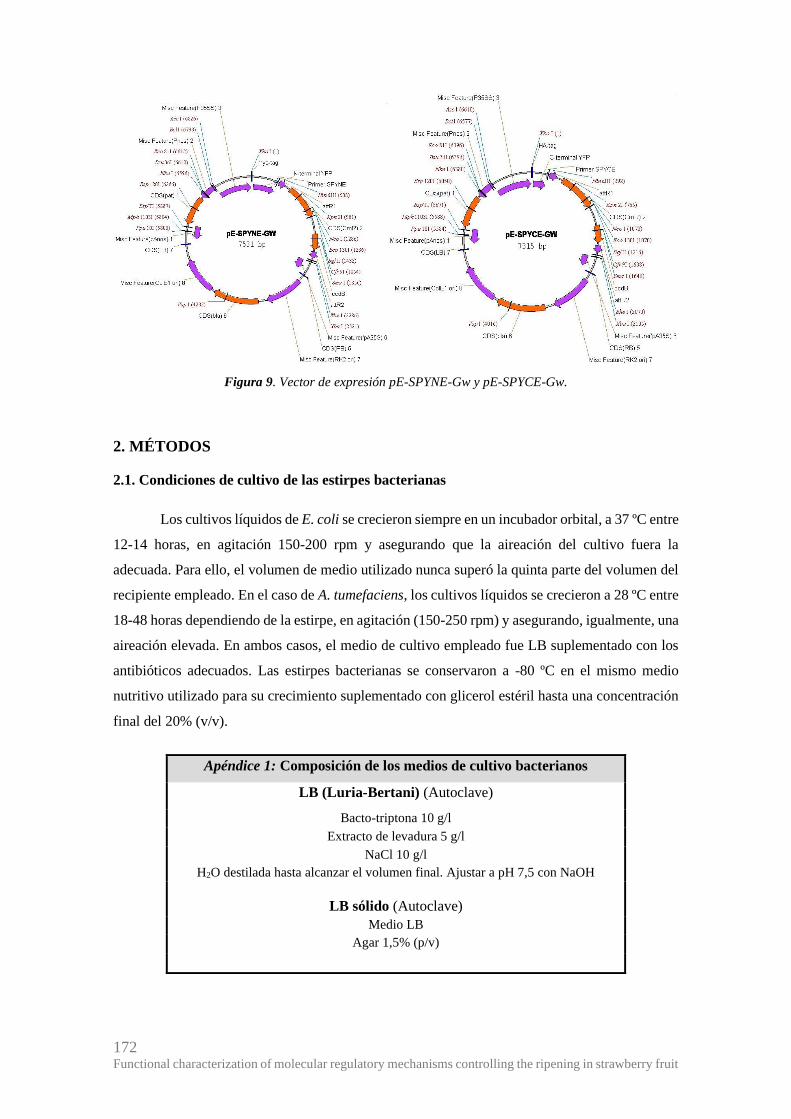
172 Functional characterization of molecular regulatory mechanisms controlling the ripening in strawberry fruit
Figura 9. Vector de expresión pE-SPYNE-Gw y pE-SPYCE-Gw.
2. MÉTODOS
2.1. Condiciones de cultivo de las estirpes bacterianas
Los cultivos líquidos de E. coli se crecieron siempre en un incubador orbital, a 37 ºC entre
12-14 horas, en agitación 150-200 rpm y asegurando que la aireación del cultivo fuera la
adecuada. Para ello, el volumen de medio utilizado nunca superó la quinta parte del volumen del
recipiente empleado. En el caso de A. tumefaciens, los cultivos líquidos se crecieron a 28 ºC entre
18-48 horas dependiendo de la estirpe, en agitación (150-250 rpm) y asegurando, igualmente, una
aireación elevada. En ambos casos, el medio de cultivo empleado fue LB suplementado con los
antibióticos adecuados. Las estirpes bacterianas se conservaron a -80 ºC en el mismo medio
nutritivo utilizado para su crecimiento suplementado con glicerol estéril hasta una concentración
final del 20% (v/v).
Apéndice 1: Composición de los medios de cultivo bacterianos
LB (Luria-Bertani) (Autoclave)
Bacto-triptona 10 g/l
Extracto de levadura 5 g/l
NaCl 10 g/l
H2O destilada hasta alcanzar el volumen final. Ajustar a pH 7,5 con NaOH
LB sólido (Autoclave) Medio LB
Agar 1,5% (p/v)

MATERIALES Y MÉTODOS
173 PhD Thesis Félix Juan Martínez Rivas
2.2. Condiciones de cultivo de las estirpes de levaduras
Los cultivos líquidos de levaduras se crecieron siempre a 30 ºC entre 24-72 horas, en
agitación (150-200 rpm) y asegurando que la aireación del cultivo fuera la adecuada. El medio de
cultivo empleado fue SD glu suplementado con los aminoácidos adecuados. Las estirpes de
levaduras empleadas se conservaron a -80 ºC en el mismo medio nutritivo utilizado para su
crecimiento suplementado con glicerol estéril hasta una concentración final del 20% (v/v).
Apéndice 2: Composición de los medios de cultivo de levaduras
SD glu (Autoclave) Base nitrogenada de levadura sin aminoácidos (Difco) 6,7 g/l
D-glucosa (Sigma) 20 g/l
H2O destilada hasta alcanzar el volumen final.
SD glu sólido (Autoclave) Medio SD glu
Agar 2% (p/v)
Apéndice 3: 10 x “Drop-out solution”
Compuesto Peso (mg/l) Referencia Sigma
L-Isoleucina 300 I2752
L-Valina 1500 V0500
L-Adenina 200 A9126
L-Arginina HCl 200 A5131
L-Histidina HCl Monohidrato 200 H8125
L-Leucina 1000 L8000
L-Lisina HCl 300 L5626
L-Metionina 200 M9625
L-Fenilalanina 500 P2126
L-Treonina 2000 T8625
L-Triptófano 200 T0254
L-Tirosina 300 T3754
L-Uracilo 200 U0750
2.3. Obtención de células competentes y transformación de bacterias
2.3.1. Preparación de células competentes permanentes de E. coli
Una colonia aislada de la estirpe deseada de E. coli se creció en medio LB a 37 ºC y en
agitación durante toda la noche. A la mañana siguiente, se tomó 1 ml de este cultivo y se inoculó
en 100 ml de medio LB fresco y estéril contenido en un matraz de 250 ml y se incubó de nuevo a
37 ºC y en agitación hasta alcanzar una DO600 = 0,48.
Después de enfriar el cultivo en hielo, las células se recolectaron por centrifugación
durante 5 minutos a 4.000 rpm y a 4 ºC y, posteriormente, se resuspendieron en 20 ml de solución
TfbI. Las células se incubaron nuevamente en hielo durante 5 minutos y se volvieron a recoger

174 Functional characterization of molecular regulatory mechanisms controlling the ripening in strawberry fruit
por centrifugación en las mismas condiciones anteriores. A continuación, se resuspendieron en 4
ml de solución TfbII y se mantuvieron en hielo durante 15 minutos. Finalmente, se distribuyeron
en tubos eppendorf estériles en partes alícuotas de 100 μl y se conservaron a -80 ºC hasta su uso.
Las células competentes E.coli DH5α así preparadas se utilizaron para transformaciones
convencionales, mientras que las células competentes E.coli BL21 se emplearon en la
transformación con los plásmidos vacíos, para mantener el gen ccdB en su interior. En el caso de
la transformación de células de E.coli con los vectores plasmídicos del sistema Gateway, siempre
se emplearon las células competentes comerciales One Shot TOP10 Chemically competent E. coli
(InvitrogenTM).
Apéndice 3: Soluciones empleadas en la preparación de células competentes
Ambas soluciones, una vez preparadas, son filtradas y almacenadas a 4 ºC
Solución TfbI
Acetato potásico 30 mM
KCl 100 mM
CaCl2 10 mM
MnCl2 50 mM
Glicerol 15 %
pH 5.8 ajustado con ácido acético
Solución TfbII
MOPS 10 mM
CaCl2 75 mM
KCl 10 mM
Glicerol 15 %
pH 6.5 ajustado con KOH
2.3.2. Transformación de células de E. coli químicamente competentes
En todos los casos, salvo cuando usamos las células One Shot® TOP10 Chemically
Competent E. coli (InvitrogenTM) comerciales (dispensadas en alícuotas de 50 μl), la muestra de
ADN (~50 ng) que se deseaba transformar se mezcló con una parte alícuota de células
competentes (100 μl). La mezcla obtenida se incubó en hielo durante 30 minutos. Seguidamente,
las células se sometieron a un choque térmico de 42 ºC durante 1 minuto e inmediatamente se
enfriaron en hielo durante 2 minutos. A continuación, se les añadió 1 ml de medio SOC estéril y
se incubaron a 37 ºC en agitación constante durante, al menos, 1 hora para reactivar el
metabolismo celular. Una vez transcurrido este tiempo, las células se recogieron por
centrifugación a 15.000 g a temperatura ambiente y se volvieron a resuspender en 150 μl de LB.
Las células se sembraron en medio LB sólido conteniendo los antibióticos adecuados para la
selección de los transformantes positivos y se dejaron crecer a 37 ºC durante 12 horas.

MATERIALES Y MÉTODOS
175 PhD Thesis Félix Juan Martínez Rivas
Apéndice 4: Soluciones empleadas en la obtención de células
competentes y transformación de E. coli. Medios LB líquido y LB sólido
Ver Apéndice 1
Medio SOC (Autoclave) Triptona 2%
Extracto de levadura 0,5%
NaCl 10 mM
KCl 2,5 mM
MgCl2 10 mM
MgSO4 10 mM
Glucosa 20 mM
2.3.3. Preparación de células competentes de A. tumefaciens GV3101 y AGL0
Este protocolo se empleó para obtener células químicamente competentes de varias
estirpes de A. tumefaciens que posteriormente fueron transformadas. Se creció una colonia aislada
de A. tumefaciens a 28 ºC en 50 ml de LB suplementado con los antibióticos correspondientes
según la cepa (Materiales y Métodos, apartado 1.2.2). Una vez alcanzada una DO600 de 0.5, el
cultivo se centrifugó durante 10 minutos a 3.500 rpm y las células recogidas se resuspendieron en
10 ml de NaCl 0.15 M. Las células en suspensión se sometieron nuevamente a centrifugación en
las mismas condiciones descritas anteriormente, pero en esta ocasión, el pellet obtenido se
resuspendió en 1 ml de CaCl2 20 mM frio. La suspensión celular obtenida se distribuyó en
alícuotas de 200 μl y almacenada a -80ºC hasta su uso.
2.3.4. Transformación de células de A. tumefaciens químicamente competentes
La transformación de células competentes de A. tumefaciens se llevó a cabo añadiendo
0.5-1 μg del ADN plasmídico de interés a una alícuota de células y dejándolas incubar en hielo
durante 30 minutos. Transcurrido este tiempo, las células se sometieron a un choque térmico
brusco congelándolas en nitrógeno líquido durante 1 minuto e inmediatamente después
incubándolas a 37 ºC durante 5 minutos. Posteriormente, se añadió 1 ml de LB a la muestra
transformada y se mantuvo a 28 ºC en agitación suave entre 2-4 h para su recuperación. Tras este
tiempo, las células se recogieron mediante una centrifugación, se resuspendieron en 100 μl de LB
fresco, y se sembraron en placas de LB sólido suplementado con los antibióticos adecuados. Las
placas se depositaron en una estufa a 28 ºC y las células se dejaron crecer entre 48-72 horas.
2.3.5. Selección de transformantes bacterianos positivos
La selección de transformantes positivos se realizó en función de los marcadores de
selección contenidos en los vectores plasmídicos empleados para la transformación. Se
consideraron transformantes positivos aquellas células que, además de crecer en las condiciones

176 Functional characterization of molecular regulatory mechanisms controlling the ripening in strawberry fruit
de selección, también portaban el vector plasmídico con el inserto correcto utilizado en la ligación
original.
Inicialmente, la selección de los transformantes positivos se realizó en medio selectivo
LB sólido suplementado con los antibióticos a los que confería resistencia el vector introducido.
En el caso del vector plasmídico pCR®8/GW/TOPO® y el vector binario pK7WGF2.0, portadores
del gen de resistencia a espectinomicina, la selección de los transformantes positivos se llevó a
cabo en medio LB-agar suplementado con espectinomicina (100 μg/ml). Cuando los vectores
empleados en la transformación fueron pDESTTM22, pE-SPYNE-Gw y pE-SPYCE-Gw la
selección de los transformantes positivos se realizó en presencia de ampicilina (100 μg/ml),
mientras que los transformantes portadores del vector pDONR™ 221 y del vector binario pFRN
se seleccionaron en presencia de kanamicina (50 μg/ml), y los transformantes con el vector
pDESTTM 32 se seleccionaron en presencia de gentamicina (25 μg/ml) (Materiales y Métodos,
apartado 1.3.2).
Las cepas de A. tumefaciens empleadas presentan, además, resistencia a rifampicina
(AGL0); rifampicina, gentamicina y kanamicina (GV3101). Así, la selección de transformantes
positivos de Agrobacterium se realizó añadiendo al medio simultáneamente los antibióticos a los
que las cepas empleadas eran resistentes y el antibiótico adecuado en función del vector
introducido en ellas (Materiales y Métodos, apartado 1.3.2).
2.3.6. Identificación de transformantes positivos
2.3.6.1. Identificación de transformantes positivos mediante análisis de restricción
A fin de comprobar que las supuestas colonias positivas incluían los vectores de clonación
con el inserto de interés en cada caso, se aisló ADN plasmídico de cada transformante positivo
seleccionado usando kits comerciales y se digirió con la enzima de restricción adecuada para
liberar el inserto o un fragmento de éste (Materiales y Métodos, apartado 2.5.3). Posteriormente,
éste se visualizó electroforéticamente en gel de agarosa (Materiales y Métodos, apartado 2.7.1).
2.3.6.2. Identificación de transformantes positivos mediante PCR
Para comprobar si los transformantes positivos contenían el vector de clonación con el
inserto de interés correspondiente en cada caso, se procedió a su amplificación mediante PCR a
partir de ADN plasmídico previamente aislado, o bien, directamente a partir de la colonia
seleccionada. Para ello, se emplearon los cebadores universales incluidos dentro del vector (T3,
T7, Forward M13 y Reverse M13) y/o cebadores específicos diseñados a partir de la secuencia
interna del inserto. La reacción de PCR se realizó como se indica en Materiales y Métodos,
apartado 2.5.5) Cuando la PCR se hizo directamente a partir de colonia, fue necesario siempre

MATERIALES Y MÉTODOS
177 PhD Thesis Félix Juan Martínez Rivas
realizar una réplica de la colonia seleccionada en una nueva placa de LB sólido con el antibiótico
de selección para mantener la línea celular.
2.4. Obtención de células competentes y transformación de levaduras
2.4.1. Obtención de células competentes y transformación de Saccharomyces cerevisiae
Las cepas de levaduras PJ69-4a y PJ69-4α se dejaron crecer a 30 ºC durante 24 horas en
medio SD completo hasta alcanzar una DO600 de 0.4-0.6. Para cada transformación, se tomaron 2
ml de dichos cultivos, se centrifugaron durante 5 segundos a máxima velocidad y las células
fueron resuspendidas en 1 ml de acetato de litio 100 mM. Se dejaron incubar durante 5 minutos a
30 ºC y se centrifugaron de nuevo. A continuación, se resuspendieron con la mezcla de
transformación (apéndice 5), se mantuvieron en agitación en vórtex por 1 minuto y se dejaron
incubar durante 20 min a 42 ºC. Las células fueron recogidas de nuevo por centrifugación,
resuspendidas finalmente en 50 µl de H2O MQ, plaqueadas en medio SD de selección e incubadas
durante 3 días a 30 ºC.
Apéndice 5: Mezcla de transformación para levaduras.
Protocolo a pequeña escala
240 l PEG 50% (PEG 3350)
36 l 1 M LiAc
5 l ADN esperma de salmón (10mg/ml)
3 l ADN plasmídico (~500 ng)
76 l H2O MQ
360 µl volumen total
2.4.2. Selección por aminoácidos
La selección de los transformantes positivos se realizó en medio selectivo SD glu sólido
suplementado con todos los aminoácidos excepto con el que confería resistencia a los
transformantes según el vector que se les hubiera introducido. Así, para la selección de
transformantes haploides en el experimento de doble híbrido, el vector pDESTTM22 confiere
viabilidad a los transformantes en ausencia de triptófano mientras que el vector pDESTTM32
confiere viabilidad a los transformantes en ausencia de leucina. Por tanto, los transformantes
diploides que portaban ambos vectores fueron seleccionados en medio SD glu en ausencia de
leucina y triptófano.
2.5. Manipulación de moléculas de ADN
2.5.1. Amplificación por PCR de fragmentos de ADN
La reacción en cadena de la polimerasa (PCR) se utilizó con varios fines: a) en la
comprobación de la orientación de los insertos correspondientes a los genes clonados en vectores

178 Functional characterization of molecular regulatory mechanisms controlling the ripening in strawberry fruit
de expresión; b) en la identificación de transformantes positivos (Materiales y Métodos, apartado
2.3.6); c) en estudios de expresión de los genes objeto de estudio mediante qRT-PCR (Materiales
y Métodos, apartado 2.8.3).
2.5.1.1. Cebadores universales empleados en la amplificación por PCR
Los cebadores universales (Tabla 2) se emplearon para la amplificación y, en algunos
casos, para la secuenciación de fragmentos de ADN incluidos en los vectores pGEM®-T Easy,
pGEX-4T-1, pCR®8/GW/TOPO® y pDONR™221 (Materiales y Métodos, apartados 1.3.2 y
1.3.3) La temperatura de anillamiento siempre fue 55 ºC y el programa de PCR empleado el que
se detalla en la Tabla 4.
Tabla 2. Cebadores universales empleados.
Cebadores universales
T7 5’- GTA ATA CGA CTC ACT ATA GGG C -3’
T3 5’- AAT TAA CCC TCA CTA AAG GG -3’
Reverse (M13) 5’- GGA AAC AGC TAT GAC CAT G -3’
Forward (M13) 5’- GTA AAA CGA CGG CCA GT -3’
Sp6 5’- GAT TTA GGT GAC ACT ATA G -3’
pGEX 5’ 5’- GGG CTG GCA AGC CAC GTT TGG TG -3’
pGEX 3’ 5’- CCG GGA GCT GCA TGT GTC AGA GG -3’
2.5.1.2. Cebadores específicos empleados en la amplificación por PCR
Los cebadores específicos utilizados en todos los casos para la amplificación de
secuencias conocidas se diseñaron empleando el programa Primer designing tool del NCBI o
Primer 3 (Tabla 3). Los oligonucleótidos empleados para la comprobación de las construcciones
generadas en los distintos plásmidos, tanto por PCR como por secuenciación, fueron diseñados
específicamente a partir de la secuencia conocida de cada uno de los plásmidos (Tabla 3).
Tabla 3. Cebadores específicos empleados en la comprobación de construcciones.
Vector Cebador Secuencia
pK7WGF2.0 seq-GFP-Nt 5' - GAC CCC AAC GAG AAG CGC GAT CAC - 3'
seq-GFP-Ct 5' - AAG CACT GCA CGC CGT AGG TCA GGG - 3'
pDESTTM22 PRO500 5' - GCG TTT GGA ATC ACT ACA GG - 3'
PRO501 5' - AAC CTC TGG CGA AGA AGT CC - 3'
pDESTTM32 pDEST32 seq 5' 5' - GAT TGG AGA CTT GAC CAA ACC TCT - 3'
pDEST32 seq 3' 5' - GCC TCT AAC ATT GAG ACA GCA - 3'
pFRN GUS1 up 5' - GCA CAA TCC CAC TAT CCT TC - 3'
pFRN-Term low 5' - CGA AAC CGG CGG TAA GGA TCT GAG CTA C - 3'

MATERIALES Y MÉTODOS
179 PhD Thesis Félix Juan Martínez Rivas
Los cebadores empleados en qRT-PCR fueron diseñados específicamente a partir de la
secuencia conocida de cada uno de los genes, generalmente en el extremo 3’. El amplicón
obtenido fue siempre entre 100 y 200 pb, tamaño recomendado para que la concentración de
reactivos disponibles en la mezcla no sea limitante, no viéndose afectada ni la reacción de PCR
ni la emisión de fluorescencia.
Aunque todos los cebadores específicos fueron diseñados para trabajar con un rango de
temperatura de anillamiento amplio (52-62 ºC), generalmente se utilizó una temperatura de 55 ºC
para trabajar simultáneamente con varias parejas de cebadores. Cuando se observó la aparición
de dímeros de cebadores o de bandas de amplificación inespecífica a esta temperatura,
individualmente se determinó la temperatura óptima de anillamiento para cada pareja de
cebadores. En ocasiones, algunos de estos oligonucleótidos también fueron empleados en la
secuenciación de fragmentos de ADN o para la amplificación de fragmentos que posteriormente
fueron subclonados en vectores plasmídicos. En general, las amplificaciones se llevaron a cabo
en un volumen final de 25 μl (Apéndice 6). La mezcla de reacción incluyó:
Apéndice 6: Mezcla de reacción de PCR
Tampón de PCR [10X] 2,5 μl
MgCl2 25 mM 1,5 μl
Mezcla de dNTPs 5 mM cada uno 1 μl
ADN molde 20-50 ng x μl
Cebador 3’ 2 μM 2,5 μl
Cebador 5’ 2 μM 2,5 μl
Taq polimerasa 2 U y μl
H2O bidestilada estéril hasta 25 μl
Apéndice 7: Soluciones empleadas en la amplificación por PCR de fragmentos de ADN
Tampón de PCR [10X]
Tris-HCl pH 9 100 mM
KCl 500 mM
Autoclavar y añadir posteriormente Tritón X-100 al 15% (v/v)
En todas las amplificaciones rutinarias, salvo excepciones, se utilizó el mismo programa
básico recogido en la Tabla 4. La temperatura de anillamiento de los cebadores se determinó en
función de sus secuencias y de la región de ADN que se iba a amplificar, pudiendo variar en un
rango de 52-70 ºC según la pareja de cebadores empleada.

180 Functional characterization of molecular regulatory mechanisms controlling the ripening in strawberry fruit
Tabla 4. Programa para la amplificación por PCR de fragmentos de ADN.
Temperatura Duración Repeticiones
95 ºC 2-5 min 1
95 ºC 30 seg- 1 min
35-40 ciclos
Tª anillamiento 30 seg - 1 min
72 ºC 1-2 min
72 ºC 5-10 min 1
10 ºC Mantenido 1
Siempre se comprobó que las reacciones de amplificación habían transcurrido de manera
adecuada analizando una alícuota del volumen total de la mezcla de PCR mediante electroforesis
en gel de agarosa (Materiales y Métodos, apartado 2.7.1).
2.5.2. Purificación de fragmentos de ADN
2.5.2.1. Purificación de ADN a partir de geles de agarosa
Independientemente del método de purificación empleado, la muestra de ADN problema
siempre se separó mediante electroforesis en gel de agarosa. A continuación, el fragmento de
ADN de interés se escindió con un bisturí estéril directamente desde el gel mientras éste se
visualizaba con luz ultravioleta de longitud de onda larga (365nm). Cuando el objetivo de la
purificación fue la obtención de ADN de alta calidad a partir del gel, se empleó el kit Thermo
Fisher GeneJET Gel Extraction Kit (Thermo Fisher), siguiendo las instrucciones suministradas
por la casa comercial.
2.5.2.2. Purificación de ADN a partir de una solución acuosa
El uso del sistema Thermo Fisher GenJET PCR Purification Kit (Thermo Fisher)
permitió una eficaz purificación de fragmentos de ADN presentes en soluciones acuosas
(productos de PCR, fragmentos resultantes de digestiones con endonucleasas, etc). El proceso se
llevó a cabo siguiendo las recomendaciones suministradas por la casa comercial. El ADN se
recuperó directamente en H2O estéril.
2.5.3. Concentración de muestras de ADN
Precipitación con etanol y acetato sódico
Las muestras de ADN disueltas en H2O o tampón se precipitaron adicionando 2,5
volúmenes de etanol absoluto y 0,1 volúmenes de acetato sódico 3 M pH 5,6 a la muestra.
Seguidamente, la mezcla se incubó a -80 ºC durante, al menos, 30 minutos y el precipitado se

MATERIALES Y MÉTODOS
181 PhD Thesis Félix Juan Martínez Rivas
recuperó por centrifugación a 15.000 g durante 30 minutos. El ADN recuperado se lavó
sucesivamente con etanol al 70%, para eliminar sales residuales, y con etanol absoluto,
centrifugando cada vez a 15.000 g durante 5 minutos para recuperar la muestra. El etanol residual
se evaporó incubando la muestra en una estufa a 37 ºC. Finalmente, el ADN se resuspendió en el
volumen deseado de tampón o H2O estéril.
Concentración por desecación
El ADN en disolución también se concentró por desecación al vacío a temperatura
ambiente o a 50 ºC, en un secador de vacío SpeedVac SVC100 (Savant).
2.5.4. Digestión de moléculas de ADN con endonucleasas de restricción
Las digestiones con endonucleasas de restricción se realizaron de acuerdo con las
recomendaciones de las casas comerciales correspondientes y durante un período comprendido
entre 2 y 12 horas a 37 ºC (salvo excepciones indicadas por las casas comerciales). Generalmente,
en cada digestión se añadieron 5 U de enzima/μg de ADN para asegurar una digestión completa.
Las digestiones se comprobaron mediante electroforesis en gel de agarosa en tampón TBE [1X]
(Materiales y Métodos, apartado 2.7.1) de una parte alícuota de dicha muestra junto a la misma
muestra sin digerir.
Apéndice 8: Mezcla de digestión enzimática
ADN (0,5-1 µg) x μl
Tampón [10X] 2 μl
Enzima de restricción (5U) 0,5 μl
H2O bidestilada hasta 20 μl
2.5.5. Ligación de moléculas de ADN
Para que se lleve a cabo la ligación de dos moléculas de ADN (vector e inserto) es
necesario digerir ambas previamente con la misma endonucleasa de restricción para generar
extremos cohesivos capaces de unirse entre sí.
Desfosforilación del vector
Durante la ligación, el vector digerido con una única enzima de restricción puede religarse
generando clones que sólo contendrían el plásmido empleado. Por tanto, es recomendable la
desfosforilación del vector en cuestión para evitar un alto número de falsos positivos en los
transformantes generados posteriormente. De esta manera, aumenta la garantía de que el vector
sólo pueda recircularizarse una vez incluya el inserto que se quiere clonar. El proceso de
desfosforilación se realizó añadiendo 1U de fosfatasa alcalina de timo de ternera (CIAP)
(InvitrogenTM) por cada volumen inferior o igual a 100 μl de vector digerido. La mezcla se incubó

182 Functional characterization of molecular regulatory mechanisms controlling the ripening in strawberry fruit
15 minutos a 37 ºC. En el caso de extremos protuberantes 3’, se realizó una incubación adicional
a 56 ºC durante 15 minutos. Para inactivar la enzima, la mezcla se incubó 5 minutos a 70 ºC y se
fenolizó. El vector desfosforilado se recuperó por precipitación con etanol y acetato sódico
(Materiales y Métodos, apartado 2.5.3).
Apéndice 9: Enzimas empleadas en la desfosforilación y ligación de moléculas de ADN
T4 DNA ligasa (InvitrogenTM) 1 U/μl
Fosfatasa alcalina de timo de ternera (CIAP) (InvitrogenTM) 1 U/ml
Reacción de ligación
Las concentraciones de vector e inserto utilizadas para la ligación de fragmentos de ADN
fueron proporcionales a los tamaños de las moléculas que se deseaba ligar. Se aplicó la relación:
ng vector × tamaño del inserto (Kb)
tamaño del vector (Kb) × relacion vector/inserto = ng de inserto
En el caso de ligaciones con el vector pGEM®-T Easy (Promega), se siguieron las
instrucciones indicadas por la casa comercial que recomienda que la relación vector:inserto sea
1:3 para conseguir la mayor eficiencia. Cuando el vector empleado fue pGEX-4T-1(Amershan),
se utilizó una relación 1:5 entre el tamaño del vector y el inserto aplicando la relación:
2 × ADN (gramos)
tamaño del inserto (pb) × 649 (Dalton/pb) × relación vector/inserto = moles de vector
En cualquier caso, la mezcla de ligación se realizó como se indica en el Apéndice 7 y ésta
se incubó a 16 ºC durante 14-16 horas antes de proceder a la transformación de células de E. coli.
Apéndice 10: Reacción de ligación
Vector x μl
Inserto y μl
Tampón de ligación (InvitrogenTM) [5X] 1 μl
T4 ligasa (InvitrogenTM) 1 U/μl 1 μl
H2O destilada estéril hasta 10 μl
2.5.6. Secuenciación
La secuenciación se llevó a cabo con un secuenciador ABI PRISM™ 3130 XL Genetic
Analyzer de Applied Biosystems en el Servicio Central de Apoyo a la Investigación de la
Universidad de Córdoba (SCAI). Las muestras a analizar se prepararon siguiendo fielmente las
instrucciones indicadas en el protocolo del ABI PRISM™ Dye Terminator V 3.1 Cycle Sequencing
Ready Reaction Kit (Thermo Fisher) y posteriormente analizadas con el programa Chromas.

MATERIALES Y MÉTODOS
183 PhD Thesis Félix Juan Martínez Rivas
2.6. Aislamiento de ácidos nucleicos
2.6.1. Extracción de ARN
2.6.1.1. Tratamiento del material y soluciones utilizadas en la extracción de ARN
El material de vidrio utilizado en la extracción de ARN fue cuidadosamente lavado con
agua bidestilada y esterilizado mediante su calentamiento a 180 ºC en un horno durante un periodo
de cinco a seis horas. El material plástico no desechable, como las cubetas de electroforesis, se
trataron por inmersión en solución alcalina de NaOH 50 mM durante un periodo de entre tres y
doce horas, lavándose seguidamente con agua bidestilada. El resto del material fue esterilizado a
121 ºC durante 20 minutos en autoclave.
Las soluciones acuosas fueron tratadas con DEPC a una concentración final de 0,1%
(v/v). Tras una agitación vigorosa, se dejaron reposar en una campana de extracción de gases
durante 16 horas y posteriormente se esterilizaron en autoclave. Los tampones que contenían Tris-
HCl en su composición fueron preparados con agua estéril previamente tratada con DEPC y
posteriormente se esterilizaron de nuevo. El DEPC es una sustancia tóxica y un potente inhibidor
de las RNasas, no obstante, a las condiciones de presión y temperatura que se alcanzan durante la
esterilización en autoclave, éste se descompone en CO2 y CH2OH.
Fenol: cloroformo: alcohol isoamílico (25:24:1; v/v)
Se empleó para eliminar proteínas presentes en las muestras de ácidos nucleicos. El
cloroformo desnaturaliza las sustancias proteicas y facilita la separación de las fases acuosa y
orgánica. El alcohol isoamílico reduce la formación de espuma durante el proceso de extracción.
Se mezcló un volumen de fenol neutro con un volumen de una mezcla 24:1 de cloroformo: alcohol
isoamílico. La mezcla se almacenó a 4 ºC protegido de la luz.
2.6.2. Obtención y purificación de ARN
2.6.2.1. Método de purificación de ARN empleando cloroformo: isoamilalcohol
La extracción de ARN se llevó a cabo siguiendo las indicaciones descritas en Asif et al.,
(2000). El tejido congelado (1g) se homogenizó en presencia de N2 líquido. El polvo obtenido se
transfirió a un tubo Beckman estéril de 50 ml que contenía 10 ml de tampón de extracción
precalentado a 65 ºC y se incubó a esa misma temperatura durante 1 hora con agitación ocasional.
Tras la incubación, el tubo se dejó enfriar a temperatura ambiente y se añadió un volumen de
cloroformo:alcohol isoamílico (24:1). Dicha mezcla se agitó vigorosamente hasta la aparición de
una única fase, y posteriormente se centrifugó a 15.000 g durante 15 minutos a temperatura

184 Functional characterization of molecular regulatory mechanisms controlling the ripening in strawberry fruit
ambiente. La fase acuosa se recuperó en un tubo nuevo y se repitió el lavado con
cloroformo:alcohol isoamílico como anteriormente. Finalmente, la fase acuosa recuperada se
trasvasó a un tubo nuevo, se añadió LiCl hasta una concentración de 3 M, y se incubó durante 16
horas a 4 ºC. El ARN se recuperó mediante centrifugación durante 30 minutos a 17.000 g y 4 ºC.
El precipitado obtenido se resuspendió en 200 µl de H20-DEPC y se lavó con fenol, fenol:
cloroformo (1:1) y cloroformo secuencialmente. Para precipitar los polisacáridos presentes, se
procedió de la siguiente forma: a la fase acuosa obtenida se le añadieron 1/30 volúmenes de
acetato sódico 3 M pH 5,2 y 0,1 volúmenes de etanol. La mezcla se incubó en hielo durante 30
minutos y posteriormente se centrifugó a 4 ºC en una microfuga a máxima velocidad. Por último,
el ARN se precipitó con acetato sódico 0,3 M pH 5,2 y 3 volúmenes de etanol. La mezcla se
incubó durante 3 horas a -80 ºC, y posteriormente el ARN se recuperó mediante centrifugación a
14.000 g durante 45 minutos a 4 ºC. El ARN obtenido se lavó sucesivamente con 1 ml de etanol
70% y 100%, y finalmente se resuspendió en 100 µl de H20-DEPC. La concentración de ARN se
determinó mediante espectrofotometría, midiendo su absorbancia a 260 nm. El ARN se almacenó
a -80 ºC hasta su uso.
Apéndice 11: Soluciones utilizadas para la obtención y purificación de ARN
Tampón de extracción cloroformo:alcoholisoamílico Tris-HCl pH 8,2 100 mM
EDTA-Na2 pH 8 20 mM
NaCl 1,4 M
CTAB 2 % (p/v)
β-mercaptoetanol 1 % (v/v)
2.6.2.2. Purificación de ARN con el método CTAB
Debido a que el método descrito anteriormente requiere de múltiples pasos y parte de una
cantidad alta de tejido fresco, se adoptó otro método de extracción adaptado por lo descrito en
Gambino et al., 2008. En resumen, aproximadamente 100 mg de tejido se extrajeron en 900 µL
de tampón de extracción (2% CTAB, 2.5% PVP-40, 2M NaCl, 0.1M Tris-HCl pH 8, 0.25M
EDTA pH 8 y 2% β-mercaptoetanol), incubados a 65 ºC con agitación esporádica. Posteriormente
se añadió un volumen similar de clorofomo y se centrifugó a 11.000 g durante 10 minutos a 4 ºC.
El sobrenadante se pasó a un tubo limpio y se precipitó diferencialmente el ARN con LiCl 3M, a
4 ºC durante al menos 30 minutos. La mezcla se centrifugó y a 21.000 g durante 20 minutos a 4
ºC y el pellet se resuspendió en 500 µL solución SSTE (10mM Tris-HCl pH 8, 1mM EDTA pH
8, 1% SDS, 1M NaCl), previamente calentado a 65 ºC. Se añadió un volumen igual de cloroformo
y la mezcla se centrifugó a 11.000g durante 10 minutos. El sobrenadante se añadió a un tubo
limpio al que se le añadieron 0.7 volúmenes de isopropanol frio. Finalmente, el ARN se precipitó
por centrifugación a 4 ºC. El ARN obtenido se lavó sucesivamente con 1 ml de etanol 70% y

MATERIALES Y MÉTODOS
185 PhD Thesis Félix Juan Martínez Rivas
100%, y finalmente se resuspendió en 100 µl de H20-DEPC. La concentración de ARN se
determinó mediante espectrofotometría, midiendo su absorbancia a 260 nm. El ARN se almacenó
a -80 ºC hasta su uso.
2.6.2.3. Extracción automatizada de ARN
Adicionalmente, también se puso a punto la extracción automatizada de ARN de alta
calidad usando el aparato Maxwell® RSC (Promega). Este aparato permite extraer de manera
simultánea hasta 16 muestras de ARN de una vez. Las muestras se extraen en unos cartuchos que
contienen los reactivos necesarios, así como partículas magnéticas que se unirán a los ácidos
nucleicos. De esta manera, debido a que el Maxwell® RSC no tiene intercambio de líquidos, sino
que son las partículas metálicas las que capturan el ARN, hay un riesgo mínimo de contaminación
entre las muestras.
La preparación de la muestra se realizó adicionando 1 mL del buffer Fruit-Mate™ for
RNA Purification (TaKaRa) a 100 mg de tejido previamente machacado. La mezcla se agitó
vigorosamente en vórtex y centrifugada a 12.000 g durante 10 minutos a 4 ºC. Se tomaron 500
µL del sobrenadante al que se le añadió 300 µL del tampón de lisis del kit RSC Plant RNA
(Promega). La mezcla se añadió en el cartucho adaptado para la máquina y se cargó en la misma.
El protocolo de extracción hace pasar a la mezcla por los diferentes pocillos de los cartuchos para
finalmente eluir el ARN en agua. La concentración de ARN se determinó mediante
espectrofotometría, midiendo su absorbancia a 260 nm. El ARN se almacenó a -80 ºC hasta su
uso.
2.6.3. Extracción de ADN plasmídico
Las extracciones rutinarias de ADN plasmídico se realizaron siempre empleando kits
comerciales especialmente diseñados para la purificación de pequeñas cantidades de ADN
(miniprep). Cuando la cantidad de ADN plasmídico requerido para experimentación fue mayor,
se emplearon otros kits comerciales diseñados para mejorar el rendimiento del ADN obtenido
basándose, principalmente, en un aumento del volumen de partida del cultivo en cuestión
(midiprep). Siempre se siguieron los protocolos suministrados por las casas comerciales. La
integridad del ADN obtenido fue comprobada mediante electroforesis de una parte alícuota de la
muestra.
2.6.4. Cuantificación de ácidos nucleicos
La concentración de ácidos nucleicos se determinó mediante espectrofotometría
midiendo su absorbancia a 260 nm y considerando un coeficiente de extinción para el ADN
186 Functional characterization of molecular regulatory mechanisms controlling the ripening in strawberry fruit
bicatenario de 50 μg-1cm-1ml y para el ARN de 40 μg-1cm-1ml, para ello se usó un
espectrofotómetro NanoDrop (ND-100 Spectrophotometer).
En el caso de muestras de ARN, paralelamente se realizaron medidas a 230 y 280 nm
para determinar el grado de contaminación de la muestra por polisacáridos y proteínas
respectivamente. La relación Abs260nm/Abs230nm nos indica la presencia de polisacáridos frente a
ácidos nucleicos y su valor recomendado es ~2. La relación Abs260nm/Abs280nm indica la presencia
de proteínas frente a ácidos nucleicos y su valor recomendado es también ~2. Fue absolutamente
imprescindible tener en cuenta estos valores en experimentos de RT-PCR para que las muestras
de ARN empleadas fueran retrotranscribibles.
2.7. Separación electroforética de ácidos nucleicos
2.7.1. Electroforesis de ADN
La separación electroforética del ADN se llevó a cabo de forma horizontal empleando
geles de agarosa en tampón TBE [1X]. El porcentaje de agarosa empleado osciló entre 0,8% y
2% (p/v) en función del tamaño de los fragmentos de ADN a separar. Al gel siempre se le añadió
el agente intercalante RedSafe (IntronBio) a una concentración final de 0,5 μg/ml, el cual permite
visualizar las moléculas de ADN con luz ultravioleta (λ ≤ 400 nm) al intercalarse en ellas.
El ADN, mezclado con tampón de carga [6X], fue sometido a un campo eléctrico
generado mediante una corriente continua de un voltaje comprendido entre 80 y 120 V en función
del tamaño y concentración del gel, así como del tamaño de las moléculas de ADN a separar. El
tiempo empleado para la separación varió y fue inversamente proporcional al voltaje empleado
en cada caso. La visualización de las moléculas de ADN se consiguió por la exposición del gel
correspondiente a luz ultravioleta de rango de emisión entre 260 y 302 nm (onda corta-media).
En el caso de fragmentos que posteriormente iban a ser purificados, clonados o secuenciados, se
empleó luz UV de un rango de emisión de 365 nm (onda larga). Con objeto de estimar la cantidad
y/o tamaño de las moléculas de ADN, en los geles siempre se incluyó un patrón de ADN de
concentración y tamaños moleculares conocidos. Los marcadores de peso molecular más
utilizados fueron el ADN de fago λ digerido con Hind III (Pharmacia) y 1 Kb Plus DNA ladder
(InvitrogenTM).
2.7.2. Electroforesis de ARN
Con objeto de determinar la calidad e integridad de las muestras de ARN aisladas, siempre
se llevó a cabo una electroforesis de ARN en geles de agarosa al 1,2% (p/v) en tampón TBE [1X]
estéril, y en cubetas tratadas con NaOH 50 mM durante al menos 3 horas (el resto del material

MATERIALES Y MÉTODOS
187 PhD Thesis Félix Juan Martínez Rivas
utilizado se trató antes de entrar en contacto con el ARN como se indica en el apartado 2.6.1.1).
La muestra de ARN se cargó en el pocillo del gel junto con tampón de carga [6X] tratado con
DEPC, y se sometió a electroforesis a 80 V durante el tiempo necesario para que las bandas de
ARN ribosómico (ARNr) se separaran suficientemente.
La visualización de las moléculas de ARN se consiguió por la exposición del gel
correspondiente a luz ultravioleta de rango de emisión entre 260 y 302 nm (onda corta-media).
Se consideró que el ARN presentaba una integridad adecuada cuando se observaron al menos dos
bandas correspondientes al ARNr 28S y 18S, siendo óptima una relación de intensidad dos veces
superior para el ARNr 28S con respecto al ARNr 18S. Al igual que en electroforesis de ADN, en
los geles se incluyeron marcadores de peso molecular, con objeto de estimar la cantidad y tamaño
de las moléculas de ARN.
Apéndice 12: Soluciones empleadas en la electroforesis de ácidos nucleicos
Para las muestras de ARN se utilizó el mismo tampón de carga tratado con DEPC al 0,1% (v/v)
y autoclavado posteriormente
Tampón TBE [1X] Tampón de carga [10X]
Tris 44 mM
H3BO3 90 mM
Glicerol 50%
EDTA-Na2 2,2 mM Azul de bromofenol 0,25% (p/v)
Ajustar pH 8 Xilen-cianol (opcional) 0,25% (p/v)
2.8. Estudios de expresión génica
2.8.1. Tratamiento del ARN con DNasaI
Previamente a su retrotranscripción, todas las muestras de ARN usadas se trataron con
DNasaI libre de RNasas (InvitrogenTM) para eliminar cualquier residuo de ADN genómico
arrastrado durante su extracción y así evitar amplificaciones inespecíficas en posteriores
reacciones de amplificación. El tratamiento con DNasaI se aplicó a 40-50 μg de ARN total.
Apéndice 13: Tratamiento de ARN con DNasaI
Muestra de ARN total (40-50 µg) × µl
Tris-HCl [1M] pH 7,5 4 µl
MgCl2 [0,1 M] 6 µl
DNasaI (RNasa free) (InvitrogenTM) [7,5 U/ml] 1 µl
H2O-DEPC hasta 100 µl
La mezcla de reacción se incubó a 37 ºC durante 3 horas, teniendo cuidado de no
sobrepasar este tiempo (un aumento del tiempo de incubación produce cierta degradación y menor
recuperación de ARN). Posteriormente, la muestra fue tratada con igual volumen (1:1) de mezcla

188 Functional characterization of molecular regulatory mechanisms controlling the ripening in strawberry fruit
fenol:cloroformo (v/v) y cloroformo sucesivamente. La fase acuosa recuperada se precipitó con
según lo descrito en Materiales y métodos, Apartado 2.5.1. El ARN precipitado se resuspendió
en 20 µl de H2O estéril tratada con DEPC. La concentración y el grado de pureza del ARN tratado
y precipitado se determinaron con un espectrofotómetro NanoDrop (ND-100 Spectrophotometer).
La integridad de las muestras se determinó mediante su visualización en gel de agarosa al 1%.
2.8.2. Comprobación de la pureza del ARN total
Antes de proceder a la retrotranscripción del ARN tratado con DNasaI, siempre se estimó
el grado de pureza de las muestras correspondientes mediante la determinación de su grado de
contaminación por polisacáridos y proteínas. Para ello se determinó la relación Abs260nm/ Abs230nm
(Materiales y Métodos, apartado 2.6.4). Otro método de determinar la pureza del ARN fue la
determinación del RIN (RNA integrity number), mediante electroforesis capilar se separan los
ARN ribosómicos y se determina el valor RIN según la concentración de ambos. Este valor varía
de 1 a 10, siendo 1 un ARN altamente degradado y 10 un ARN nada degradado. En nuestros
estudios, sólo se usaron ARN con un RIN>8. Esta determinación se realizó en el servicio de
genómica del servicio central de apoyo a la investigación (SCAI, UCO). Finalmente, y una vez
comprobada la calidad de la muestra, el volumen total se diluyó hasta una concentración de
trabajo de 1μg/μl.
2.8.3. RT-PCR cuantitativa en tiempo real
La técnica de PCR cuantitativa en tiempo real (“quantitative real-time PCR”; qRT-PCR),
permite cuantificar la cantidad de ARNm correspondiente a un gen determinado en una muestra.
Esta cuantificación se consigue mediante la medida del incremento de fluorescencia emitida por
el amplicón correspondiente a ese gen en cada ciclo de amplificación.
La cuantificación basada en medidas a tiempo final e inexactas debido a que pueden verse
seriamente afectadas por la limitación de reactivos, posibles diferencias en los componentes de la
reacción o por el número de ciclos. Sin embargo, la cuantificación en tiempo real del número de
copias inicial de un gen se basa en el ciclo umbral (Ct), que se define como el número de ciclos
al cual la fluorescencia es estadísticamente significativa sobre el ruido de fondo. Este valor de Ct
es inversamente proporcional al logaritmo del número de copias iniciales de un gen y, por tanto,
a menor valor de Ct mayor cantidad de moléculas iniciales existen. La información cuantitativa
basada en el Ct es más exacta que la información basada en las determinaciones a tiempo final
debido a que están basadas en medidas tomadas a lo largo de la fase exponencial de amplificación
por PCR, cuando la eficiencia de ésta no se ha visto afectada todavía por la limitación de reactivos,
diferencias en la composición de la reacción o en los ciclos de la PCR.

MATERIALES Y MÉTODOS
189 PhD Thesis Félix Juan Martínez Rivas
Aunque existen varias estrategias de emisión de fluorescencia detectable en la PCR
cuantitativa en tiempo real, en este trabajo se optó por el uso del fluoróforo SYBR-Green I. Este
compuesto se intercala en la doble cadena de ADN emitiendo entonces su señal de fluorescencia.
Debido a que su unión se produce a moléculas de doble cadena, se detectó la señal fluorescente
emitida en el paso de extensión de la PCR (72 ºC). Por esta misma razón, fue también necesario
optimizar la temperatura de anillamiento de los cebadores que se iban a emplear para seleccionar
una temperatura que redujera o eliminara completamente la formación de dímeros de cebadores
y así evitar una interferencia en la señal de emisión. Posteriormente, y en caso de aparición de
dímeros de cebadores, siempre se seleccionó una temperatura de medida de emisión de
fluorescencia ligeramente por encima de la temperatura de disociación de éstos. No obstante, los
dímeros de cebadores, cuando aparecieron, lo hicieron en los ciclos finales de la PCR, donde no
interfirieron con el valor de Ct del amplicón que apareció en los primeros ciclos de la reacción.
2.8.4. Reacción de retrotranscripción
La retrotranscripción de las muestras a analizar se realizó empleando el kit iScript™
cDNA Synthesis Kit (Bio-Rad). La enzima empleada es una transcriptasa reversa que combina
alta sensibilidad y alta termoestabilidad, llegando a sintetizar productos de ADNc de gran longitud
(hasta 14 kb) empleando una mezcla equimolar de cebadores, tanto oligo (dT)18, como random
primers, una combinación de oligos de 6 nucleótidos incluidos en el kit. Debido a su
termoestabilidad, el uso de esta enzima está recomendado para una amplia variedad de moldes
(ARN con regiones ricas en GC y estructuras secundarias). La síntesis de la cadena monocatenaria
de ADNc se realizó siguiendo las instrucciones de la casa comercial.
2.8.4.1. Reacción de amplificación por PCR a partir de ADNc
A partir de los ADNc sintetizados previamente, se llevaron a cabo amplificaciones en
tiempo real que permitieron comparar los niveles de transcrito correspondientes a los genes en
estudio en condiciones experimentales frente a condiciones control. La reacción de amplificación
en tiempo real se realizó en un iCycler iQ system (Bio-Rad) con capacidad para amplificar 96
muestras independientes de forma simultánea a las que se les asignó unas coordenadas
individuales e identificables previamente a iniciar el experimento.
En primer lugar, se diseñó la distribución de las muestras en cada uno de los 96 pocillos
de la placa de experimentación (iQ™ 96-Well PCR Plates, Bio-Rad). En cada placa, se incluyeron
por triplicado tanto las muestras correspondientes al gen control constitutivo, que sirvieron para
normalizar los datos obtenidos, como las correspondientes a los genes en estudio. Así, para cada
gen, se realizaron tres reacciones independientes de PCR cuantitativa a partir de la misma muestra

190 Functional characterization of molecular regulatory mechanisms controlling the ripening in strawberry fruit
de ADNc en cada una de las situaciones experimentales analizadas lo que nos proporcionó una
media del valor de Ct para cada muestra. Obligatoriamente, en cada placa de experimentación
también se incluyó una muestra con 20 ng de ADN plasmídico correspondiente a cada uno de los
genes en estudio incluidos en la placa, y dos muestras control sin ADN, como controles positivos
y negativo, respectivamente. La amplificación de las muestras se llevó a cabo empleando el kit
SsoAdvancedTM SYBR® Green SuperMix (Bio-Rad) y siguiendo las instrucciones de la casa
comercial en cada caso.
Para minimizar los errores por pipeteo, se preparó una mezcla madre para la reacción de
PCR. A partir de ella, se repartieron con una pipeta multicanal 10 μl de reacción por muestra en
cada uno de los pocillos, manteniendo el orden previamente establecido para cada muestra y
evitando la formación de burbujas que impidieran una correcta detección de la fluorescencia
emitida. Posteriormente, la placa se cubrió con una lámina transparente de plástico
(Microseal® 'B' Adhesive Seals, Optical, Bio-Rad) evitando dejar alguna huella sobre la misma
que pudiera interferir en la emisión de fluorescencia. Cuando esta lámina de plástico sufre el
primer calentamiento en el termociclador, la placa se sella completamente evitando la pérdida de
muestra por evaporación. En general, en todas las amplificaciones realizadas se empleó el mismo
programa básico (Tabla 4) y el resultado de cada amplificación se visualizó directamente para
cada ciclo durante el transcurso de la reacción (Figura 10).
Figura 10. Ejemplo de curvas de amplificación en un iCycler iQ system (Bio-Rad). Se muestran las curvas
correspondientes a un gen problema (gen 1) y al gen interespaciador 26S-18S (gen 2). También, se
representa la curva de amplificación correspondiente al control negativo (sin ADNc), cuya señal de
fluorescencia corresponde a la formación de los dímeros de cebadores.

MATERIALES Y MÉTODOS
191 PhD Thesis Félix Juan Martínez Rivas
2.8.4.2. Curva de fusión de las muestras amplificadas
Una vez terminada la amplificación de las muestras, éstas se sometieron a un programa
de desnaturalización progresiva (“programa de melting”) (Tabla 5) que nos proporcionó una curva
de fusión independiente (curva de melting) para cada una de las muestras amplificadas (Figura
11A). Este programa se basa en el aumento progresivo de 0,5 ºC de temperatura por ciclo, desde
una temperatura inicial de 60 ºC hasta una final de 95 ºC. De esta manera, las moléculas de menor
tamaño y con menos puentes de hidrógeno intercatenarios se disociarán antes que las de tamaño
superior, que poseen un mayor número de puentes, detectándose una curva de fusión diferente
para cada una de las especies moleculares existentes en la muestra. Por tanto, las curvas de
“melting” se emplearon para determinar el número de amplicones presentes en una misma
reacción de PCR y detectar posibles contaminantes (Figura 11B). También, fueron útiles para
normalizar la reacción y eliminar el ruido de fondo de los dímeros de cebadores que, al tener
menor tamaño, presentarán una temperatura de melting inferior a la del producto de PCR.
Figura 11. Curva de melting correspondiente a los amplicones generados por qRT-PCR en el sistema
iCycler iQ system (Bio-Rad). Se muestran las curvas de fusión correspondientes a un gen problema (gen
1) y al gen interespaciador 26S-18S (gen 2). A, Señal de fluorescencia frente a temperatura; B, Derivada
de la señal de fluorescencia [-d(RFU)/dT] frente a temperatura. No se observa la aparición de
contaminantes, ya que sólo aparece un pico por muestra. Además, comprobamos que la temperatura de
melting (Tm) es constante para el amplicón correspondiente a cada gen.

192 Functional characterization of molecular regulatory mechanisms controlling the ripening in strawberry fruit
2.8.5. Análisis de los datos
Invariablemente, siempre se analizaron en primer lugar las curvas de fusión obtenidas
para todas las muestras incluidas en la placa en estudio. De esta manera, se determinó la existencia
o no de dímeros de cebadores y de una o varias especies moleculares. Estos datos nos permitieron
confirmar que las amplificaciones cuantificadas se habían realizado de forma específica y que los
valores de Ct obtenidos correspondían únicamente al transcrito del gen en estudio. Los valores de
Ct se obtuvieron automáticamente a partir de una línea base que el programa define por defecto,
aunque estos valores pudieron ser modificados para ajustar el análisis adecuadamente. Se estudió
el comportamiento individualizado de cada curva obtenida a fin de desechar las curvas alteradas.
El hecho de poseer tres datos por muestra permitió comparar los valores de Ct obtenidos en todos
los casos y hacer una media de los valores fiables.
2.8.5.1 Normalización y representación de los datos
Los valores de Ct obtenidos para cada una de las muestras analizadas fueron normalizados
frente a los valores de Ct de un gen control constitutivo. La normalización permite corregir la
concentración de ARN inicial por muestra en la RT y la eficiencia de la reacción de PCR de cada
muestra. En este trabajo se emplearon varios genes como control: el gen NDR1 y el gen que
codifica la región interespaciadora 26S-18S, ambos de expresión constitutiva y constante en todas
las condiciones experimentales analizadas (Amil-Ruiz et al., 2013). En general, la normalización
se llevó a cabo según la siguiente fórmula (Pedersen, 2001).
Una vez normalizados los datos, éstos se expresaron respecto al control del experimento
o respecto a la muestra con menor valor de expresión, al que se le asignó un valor igual a la
unidad. El resto de los valores se representaron por comparación con éste. Para el análisis
estadístico de los datos mediante la t de Student, se empleó el programa GraphPad InStat
considerando un valor de confianza de p < 0.01, lo que nos permitió identificar diferencias
estadísticamente significativas entre ellos.
2.8.6. Generación y análisis de microarray
Las secuencias de ADNc contenidas en la librería del Dr. Kevin Folta (Universidad de
Florida, Estados Unidos, Shulaev et al., 2011) fueron comparadas con las secuencias de ADNc
contenidas en nuestra propia librería (Bombarely et al., 2010). El porcentaje de identidad entre
Incremento de la expresión = 2-Δ(ΔCt)
donde ΔCt = Ct gen problema - Ct gen constitutivo
y Δ(ΔCt)= ΔCt gen inducido - ΔCt control

MATERIALES Y MÉTODOS
193 PhD Thesis Félix Juan Martínez Rivas
las secuencias de ADNc de Fragaria × ananassa y Fragaria vesca fue en todos los casos superior
a 98,6%. De este modo, se decidió generar una plataforma de microarray basada en oligos (60
nucleótidos de longitud) conteniendo un total de 35.234 secuencias únicas correspondientes a las
secuencias publicadas en el proyecto del genoma de fresa Fragaria vesca v1.0
(http://www.strawberry.org).
Para cada secuencia, se diseñaron 4 oligos que fueron hibridados por cada bloque y cuatro
bloques fueron hibridados para cada set de datos. Las muestras de ARN total fueron tratadas con
DNasaI y purificadas por columna RNeasy® Mini Kit (Qiagen) según las indicaciones del
fabricante. El marcaje de las muestras (Cy3), la hibridación con las 4 sondas por secuencia y la
normalización de los datos fueron llevados a cabo por Nimblegen Systems Inc., según el
procedimiento descrito en la sección de análisis de expresión disponible en
http://www.nimblegen.com/.
En general, se procesaron 10 µg de ARN total procedente de receptáculo de fruto de fresa
(Roche cDNA Synthesis System). Este sistema está optimizado para la síntesis de ADNc de doble
cadena que, una vez obtenido, fue purificado con el kit High Pure PCR Product Purification
(Roche) según el protocolo aportado por la casa comercial. Las muestras purificadas se
sometieron a transcripción reversa, llevando a cabo tres reacciones de transcripción reversa por
cada muestra de partida de ARN total. Cada muestra de ADNc obtenida fue marcada por
cebadores al azar con nonámeros de Cy3 usando el kit de marcaje NimbleGen One-Color DNA
Labeling y según el protocolo estándar de Roche NimbleGen. Se empleó 1 µg de ANDc en cada
reacción de marcaje. Cada muestra de ADNc marcada con Cy3 fue aplicada sobre el array
12x135K diseñado mediante asignación al azar (cada cristal contiene 12 arrays independientes,
cada uno con 140856 sondas cubriendo 35214 genes y con 4 sondas por gen diana). La hibridación
del array se llevó a cabo a 42 ºC durante 16 horas, posteriormente fue lavado, secado y escaneado
a una resolución de 2 µm usando un escáner NimbleGen MS 200 Microarray Scanner. Las señales
de fluorescencia a partir de las imágenes escaneadas se extrajeron con el programa NimbleScan
version 2.6 (Roche NimbleGen) y su análisis y la generación de valores de expression génica se
llevó a cabo con el programa Robust Multi-Array (RMA). El análisis RMA se realizó a partir de
las réplicas del array obtenidas para cada condición experimental, muestra y cantidad de partida
(por ejemplo, se realizaron análisis RMA por separado para cada conjunto de datos procedente de
las 3 réplicas de hibridación de ADNc obtenido a partir de 10 µg de ARN total).
El análisis de datos de los estudios de expresión del microarray se llevó a cabo con el
programa de análisis de expresión génica Array Star (DNASTAR). Las pruebas estadísticas t-test
y FDR (Benjamini y Hochberg, 1995) para correcciones de pruebas múltiples fueron realizadas
194 Functional characterization of molecular regulatory mechanisms controlling the ripening in strawberry fruit
con un valor de confianza p˂0.01, que nos permitió identificar diferencias estadísticamente
significativas.
2.8.7. Estudios de RNA-Seq y análisis de genes diferencialmente expresados.
En otras ocasiones, se llevaron a cabo estudios transcriptómicos masivos mediante ARN-
seq, que en este estudio se realizaron siempre mediante la técnica Illumina. A diferencia de los
microarray, que se basan en la hibridación de las poblaciones de ARN mensajero con oligos
diseñados para cada gen, el ARN-seq es una tecnología basada en la secuenciación del ARN
extraído. Para ello, una vez extraído el ARN se necesita elaborar una “librería” de ARN que
contenga los transcritos extraídos. Debido a que los transcritos de ARN mensajero pueden tener
longitudes que dificulten su secuenciación, el primer paso es romper las moléculas de ARN en
otras más pequeñas, y que sean más fáciles de secuenciar. Debido a que en la secuenciación las
primeras bases secuenciadas pueden contener fallos y con el objetivo de identificar las secuencias
de cada librería, a estos fragmentos se les añade una secuencia conocida para, una vez
secuenciados, poder identificar que ARN pertenece al organismo de estudio. La preparación de
la librería y la secuenciación de la muestra se realizó por la empresa AllGenetics, A Coruña,
España.
Brevemente, se usó el kit Illumina TruSeq stranded mRNA library prep kit para la
preparación de las librerías, siguiendo las instrucciones del fabricante. Este kit captura
diferencialmente las poblaciones de ARNm mediante su cola poliA, con colas poliT unidas a
bolitas magnéticas. El ARN mensajero capturado se convirtió en su ADN copia a los que se les
añadió los adaptadores. Estos fragmentos se secuenciaron en un HiSeq-4000 de Illumina,
obteniendo 50 ± 10 millones de lecturas por librería que corresponden aproximadamente a una
cobertura de 40 a 50 veces del genoma de F. vesca. La calidad de la secuenciación se analizó con
FastQC, a las que se le eliminó los adaptadores y/o secuencias de mala calidad con Trimmomatic.
Posteriormente, las secuencias obtenidas se mapearon contra la base de datos de F. vesca. La
expresión diferencial entre los genes fue estudiada usando DE-Seq2. Para obtener los genes
diferencialmente expresados se estableció un límite de log2Fold Change >= 2 y <=-2 y un valor
estadístico p<=0.01.
2.8.8. Anotación de secuencias
Se empleó el programa Blast2GO v2.7.2 para la anotación funcional de las secuencias
usadas tanto en microarray como RNAseq, utilizando BLASTX con un valor de corte esperado
de 1.0E-10 y su propia base de datos pública a fecha de septiembre de 2019 (Conesa et al., 2005).
Se tuvieron en cuenta para este análisis sólo los genes del microarray que presentaban valores de

MATERIALES Y MÉTODOS
195 PhD Thesis Félix Juan Martínez Rivas
expresión superiores o inferiores a ±2 veces. Los datos de GO para cada secuencia fueron
enriquecidos usando ANNEX (Annotation Augmentation) and aquellos incluidos en la base de
datos de InterPro. Los gráficos de datos GO también fueron obtenidos con este programa.
2.9. Generación de plantas transgénicas
2.9.1. Introducción a la metodología Gateway
La tecnología Gateway® es un método de clonación universal que aprovecha las
propiedades específicas de recombinación del bacteriófago λ (Landy, 1989). Este sistema utiliza
una mezcla de enzimas de recombinación constituida por la Integrasa (Int), una Excionasa (Xis)
y la proteína IHF (Integration Host Factor) codificada por E. coli para catalizar la reacción de
recombinación LR clonasa Gateway® in vitro entre un Entry vector (pCR®8/GW/TOPO®), que
contiene el ADN de interés flanqueado por las regiones attL, y un Destination vector (pFRN) que
incluye las regiones attR. Mediante esta recombinación específica entre los sitios att (attR x attL
↔ attB x attP) se genera un vector de expresión destinado a la obtención de plantas transgénicas.
Para optimizar al máximo el rendimiento de la recombinación LR, los vectores Gateway®
contienen entre los dos sitios att, además de un gen que confiere resistencia a cloranfenicol
(CmR), el gen ccdB que permite una selección negativa del Destination vector en E. coli siempre
que la recombinación haya transcurrido adecuadamente. La proteína ccdB interfiere con la ADN
girasa de E. coli inhibiendo así el crecimiento de la mayoría de sus cepas (por ejemplo, DH5α™,
TOP10) (Bernard y Couturier, 1992). Cuando se produce la recombinación LR entre el Entry
vector y el Destination vector, el cassette que contiene al gen ccdB es reemplazado por el gen de
interés generando así el vector de expresión. La selección del vector de expresión obtenido
(pFRN-gen) se realiza en células de E. coli carentes del episoma F’ y en presencia de kanamicina,
seleccionando así solamente aquellas células que incorporan un vector carente del gen ccdB y con
resistencia a kanamicina.
2.9.2. Subclonaje de moléculas de ADN en el vector pCR®8/GW/TOPO®(InvitrogenTM)
El vector pCR®8/GW/TOPO® (InvitrogenTM) se empleó como Entry vector para el
subclonaje de productos de PCR procedentes de la amplificación de una región previamente
seleccionada del gen de interés. El subclonaje de los fragmentos generados por PCR dentro del
vector pCR®8/GW/TOPO® se realizó siempre siguiendo las indicaciones de la casa comercial.
Rutinariamente, tras una purificación previa del fragmento de PCR generado, al programa general
de PCR se le adicionó un paso de poliadenilación a 72 ºC de 30 minutos de duración (Apéndice
14) para asegurar la presencia de un residuo de desoxiadenosina protuberante en el extremo 3’,

196 Functional characterization of molecular regulatory mechanisms controlling the ripening in strawberry fruit
residuo imprescindible para el subclonaje del amplicón obtenido dentro del vector
pCR®8/GW/TOPO®.
Apéndice 14: Poliadenilación
Mezcla de reacción de poliadenilación Programa utilizado
10X PCR 5 µl
Cl2Mg (50 mM) 1,5 µl
dATP (2 mM) 1 µl
DNA polimerasa 1 µl
ADN 27 µl
H2O 14,5 µl
72 ºC, 30 min
Tras la poliadenilación, se procedió de nuevo a la purificación del producto de PCR
obtenido con el kit Thermo Fisher GenJET PCR Purification Kit (Thermo) siguiendo las
indicaciones de la casa comercial. Una vez determinada la concentración del ADN recuperado
mediante espectrofotometría, se procedió a su subclonaje dentro el vector pCR®8/GW/TOPO®
utilizando la mezcla de reacción que se detalla en el Apéndice 15 e incubando la misma durante
toda la noche a temperatura ambiente. Transcurrido este tiempo, se procedió a la transformación
de una alícuota de células competentes One Shot® TOP10 Chemically Competent E. coli
(InvitrogenTM) empleando 2-6 μl de la mezcla de reacción.
Apéndice 15: Mezcla de reacción para el subclonaje de fragmentos
de ADN en el vector pCR®8/GW/TOPO®(InvitrogenTM) Amplicón purificado 2 μl
Solución salina (InvitrogenTM) 1 μl
H2O milli Q 2 μl
pCR®
8/GW/TOPO®
(InvitrogenTM) 1 μl
2.9.2.1. Subclonaje de moléculas de ADN en el vector pFRN mediante la reacción LR clonasa
Gateway (InvitrogenTM)
Una vez generados los Entry vector pCR®8/GW/TOPO® conteniendo el fragmento de
ADN correspondiente, se procedió a su transferencia por recombinación al vector binario pFRN
en una reacción mediada por la LR clonasa Gateway (InvitrogenTM). La recombinación se realizó
empleando la siguiente mezcla de reacción y adicionando los reactivos en el orden indicado:
Apéndice 16: Mezcla de reacción LR InvitrogenTM) pCR®8/GW/TOPO®::inserto (300 ng) x μl
pFRN (300ng) 1 μl
Tampón reacción LR [5X] 4 μl
LR Clonase enzyme mix 1 μl
Tampón TE pH8 hasta 16 μl

MATERIALES Y MÉTODOS
197 PhD Thesis Félix Juan Martínez Rivas
La mezcla se incubó a 25 ºC durante 2-5 horas y, transcurrido este periodo, se incubó
nuevamente a 37 ºC durante 10 minutos en presencia de 2 μl de proteinasa K. A continuación, se
procedió a la transformación de una alícuota de células competentes One Shot® TOP10
Chemically Competent E. coli (InvitrogenTM) con 5 μl de la reacción LR como se describe en
Materiales y Métodos, apartado 2.3.2.
2.9.3. Principios básicos de la transformación genética mediada por Agrobacterium
Uno de los métodos más extendidos para la transformación genética de plantas es el
empleo de Agrobacterium como vector biológico portador del ADN que será transferido a la
planta. Esta metodología se basa en la condición natural que posee esta bacteria para insertar
genes de manera estable en el genoma de las células vegetales. A. tumefaciens es una bacteria
gram-negativa que produce la enfermedad de “agalla de corona” en un amplio rango de especies
dicotiledóneas. Esta enfermedad se produce por la infección de Agrobacterium a través de heridas
preexistentes. Así, la bacteria responde con quimiotactismo positivo a las moléculas de naturaleza
fenólica que la planta libera al sufrir una herida, produciendo proliferación celular en los tejidos
infectados en forma de “tumores”. La utilización de esta bacteria como vector ha sido posible
gracias a la eliminación mediante ingeniería genética de los genes responsables de la formación
del tumor, dejando intacto el resto de los mecanismos moleculares implicados en el proceso de
colonización (Hoekema et al., 1983; Potrykus, 1991; Hooyakaas y Beijersbergen, 1994; Christie,
1997; de la Riva et al., 1998; Gelvin, 2003).
En el plásmido binario desarmado contenido en Agrobacterium, se sitúa la región
denominada T-DNA (Transfer DNA), que es la porción de ADN de dicho plásmido que será
integrada en el genoma de la planta. En este fragmento de ADN, delimitado por los extremos
derecho (RB, right border) e izquierdo (LB, left border), imprescindibles para la transferencia de
éste desde el plásmido binario al genoma de la planta, se localiza un gen de selección (resistencia
a antibióticos, herbicidas, etc.), así como el fragmento de interés correspondiente al gen que se
desea integrar en la planta. En estas construcciones, los genes están incluidos en casetes que
contienen promotores y terminadores reconocibles por la célula vegetal y que son necesarios para
la expresión de los genes introducidos.
La metodología de transformación mediada por Agrobacterium consiste básicamente en
la incubación del explanto vegetal (protoplastos, discos de hoja, callos embriogénicos, etc) con
un cultivo de la bacteria que porta el plásmido adecuado. Para aumentar el número de células del
explanto competentes para la infección y posterior regeneración, el explanto se somete a daño
físico produciéndole heridas que lo predisponen a la infección con Agrobacterium y a la

198 Functional characterization of molecular regulatory mechanisms controlling the ripening in strawberry fruit
incorporación del T-DNA. Este proceso se denomina inducción. Tras la infección, se realiza un
cocultivo del explanto con la bacteria en medio no selectivo para permitir la expresión de los
genes foráneos en las células vegetales que hayan incorporado el T-DNA. Finalmente, de manera
simultánea se realiza la selección de las células transformadas y la eliminación de Agrobacterium
en medio selectivo suplementado con los antibióticos adecuados (El Mansouri et al., 1997;
Caballero et al., 2001).
2.9.4. Transformación estable de plantas de Fragaria × ananassa “Chandler”
2.9.4.1. Obtención y mantenimiento de plántulas de Fragaria × ananassa “Chandler” in
vitro
Las plántulas de Fragaria × ananassa “Chandler” empleadas en este trabajo fueron
cedidas por el Dr. Fernando Pliego Alfaro (Universidad de Málaga) y se obtuvieron mediante la
regeneración de ápices caulinares (López-Aranda et al., 1994; El Mansouri et al., 1997). Las
plántulas se mantuvieron en medio de multiplicación durante cuatro semanas antes de ser
subcultivadas (Materiales y Métodos, apéndice 17). En cada subcultivo, siempre se eliminaron
las raíces y se separaron las plántulas aparecidas en yemas axiales que se usaron para multiplicar
el stock de plántulas. En general, las plántulas se crecieron con un fotoperiodo de 16 h de luz/8 h
de oscuridad, con una irradiación de 25 μmol m-2 s-1 (lámparas Sylvania Gro-lux), y con una
humedad relativa en el interior de la cámara de 60-70% (El Mansouri et al., 1997).
2.9.4.2. Transformación de plantas de Fragaria × ananassa “Chandler” mediante infección
con la cepa AGL1 de A. tumefaciens
La transformación de Fragaria × ananassa “Chandler” mediada por A. tumefaciens se llevó
a cabo según el método descrito por Barceló et al. (1998), que adaptó a fresa la técnica de
transformación previamente descrita por Horsch et al. (1985). El proceso de transformación
consta de cuatro fases diferenciadas:
Precultivo. Durante esta etapa se obtuvieron los explantos foliares a usar posteriormente en
el proceso de transformación. Para ello, a partir de plántulas in vitro de 3-5 semanas de edad, se
seleccionaron hojas trifoliadas jóvenes, de mayor potencial regenerativo (Raviv et al., 1987), que
se cortaron en secciones de 5 mm2. Los explantos obtenidos se colocaron, siempre con el haz
hacia abajo, en placas de Petri con medio de organogénesis (Materiales y Métodos, apéndice 17).
El precultivo se mantuvo durante 8 días a 25 ºC y siempre en oscuridad para reducir la exudación
fenólica y favorecer la morfogénesis de los explantos (Liu y Standford, 1988; George, 1993;
Barceló et al., 1998).

MATERIALES Y MÉTODOS
199 PhD Thesis Félix Juan Martínez Rivas
Infección. Durante esta etapa, los explantos foliares obtenidos en la etapa anterior fueron
infectados con el cultivo de Agrobacterium AGL1 portador del vector binario que contenía
nuestra construcción de interés. Para ello, inicialmente se cultivó la estirpe de Agrobacterium
portadora de nuestra construcción en 5 ml de medio LB líquido suplementado con rifampicina
(100 μg/ml) y kanamicina (50 μg/ml) a 28 ºC y 200 rpm durante 16 h. Transcurrido este tiempo,
se refrescaron varios cultivos empleando como inóculo 200 μl del cultivo anterior. En esta
ocasión, los cultivos se crecieron en 5 ml de medio LB líquido suplementado con los antibióticos
anteriores y con acetosiringona (100 μM), un compuesto de naturaleza fenólica que incrementa
la virulencia de Agrobacterium, y se incubaron a 28 ºC y 200 rpm durante 16 h. Una vez alcanzada
una DO600 entre 0.6-1, los cultivos se diluyeron con medio MS hasta ajustar su DO600 a 0.2 en un
volumen final de 50 ml y se procedió a la infección propiamente dicha. Así, a cada uno de los
cultivos diluidos se les añadió ~40 explantos de hoja (una vez finalizado el precultivo), que se
mantuvieron sumergidos en la solución mediante agitación suave durante 20 minutos. Finalmente,
los explantos se recogieron y se secaron sobre dos papeles secantes estériles para eliminar el
exceso de medio de cultivo e, inmediatamente después, se dispusieron nuevamente sobre medio
de organogénesis manteniendo el haz en contacto con éste.
Cocultivo. Durante esta etapa, los explantos infectados se mantuvieron durante 2 días en
ausencia de antibióticos de selección en medio de organogénesis a 25 ºC y en oscuridad en una
cámara de cultivo.
Selección. Terminado el periodo de cocultivo, durante esta etapa, los explantos se
subcultivaron durante 4 días a 25 ºC y en oscuridad en nuevo medio de organogénesis
suplementado con carbenicilina (500 mg/l), para eliminar a Agrobacterium, y kanamicina (25
mg/l), para seleccionar los explantos transformados. Transcurrido este tiempo, los explantos se
mantuvieron con un fotoperiodo de 16 h de luz/ 8 h de oscuridad a 25 ºC en la cámara de cultivo.
Durante el periodo de organogénesis y regeneración, que puede variar entre 4 y 6 meses, los
explantos se subcultivaron a nuevo medio de organogénesis selectivo cada 4 semanas. Tras cuatro
subcultivos, la concentración de carbenicilina añadida al medio se redujo a 250 mg/l, retirándose
completamente en el sexto subcultivo siempre y cuando no hubiera contaminación con
Agrobacterium. Simultáneamente, en el cuarto subcultivo, la concentración de kanamicina se
incrementó hasta 50-100 mg/l para reducir los eventos de transformación con inestabilidad
genética (Houde et al., 2004). Cuando aparecieron plántulas de 2 cm de longitud, éstas se aislaron
del resto del explanto y se subcultivaron en medio de multiplicación suplementado con kinetina
(0,47 mg/l) y con el antibiótico correspondiente, generalmente kanamicina (100 mg/l). Cada
planta obtenida a partir de un explanto se consideró un evento independiente de transformación,
y por lo tanto una línea independiente.

200 Functional characterization of molecular regulatory mechanisms controlling the ripening in strawberry fruit
2.9.4.3. Aclimatación y multiplicación de las plantas transgénicas
Una vez multiplicadas in vitro para obtener un suficiente número de plantas, se aclimató
una única plántula crecida en medio de multiplicación suplementado con kanamicina (100 mg/l)
por cada evento independiente de transformación. Siempre se sembraron en macetas de 250 ml
con turba y arena (1:1). Las plantas seleccionadas, que siempre tuvieron un sistema radicular bien
desarrollado, se extrajeron del medio de cultivo y sus raíces se lavaron con agua abundante para
eliminar restos de medio y evitar contaminaciones. A continuación, las raíces se introdujeron en
la turba humedecida y, para mantener una humedad elevada, la maceta se cubrió con una bolsa
de plástico transparente. Las macetas se mantuvieron a temperatura ambiente con iluminación
natural y siempre humedecida. La aclimatación de la planta a las condiciones ambientales se
realizó mediante la realización de una abertura de ~1 cm en la bolsa cada dos días hasta retirarla
completamente.
Las plantas transgénicas portadoras de la construcción pFRN-FaMYB123 fueron
generadas tanto en la Universidad de Córdoba (UCO) como en la Universidad de Málaga (UMA)
por el grupo del Dr. Fernando Pliego. Una vez finalizada la aclimatación, las plántulas se
multiplicaron mediante propagación vegetativa en invernaderos del CIFA de Churriana (Málaga).
La temperatura, humedad y fotoperiodo del invernadero fueron las ambientales. Cuando fue
necesario, las plantas se abonaron y fueron sometidas a distintos tratamientos fitosanitarios.

MATERIALES Y MÉTODOS
201 PhD Thesis Félix Juan Martínez Rivas
2.9.4.4. Selección y análisis de plantas transgénicas
La primera selección de las plantas transgénicas se realizó a nivel fenotípico en base a su
resistencia frente a kanamicina. Así, todos los explantos resistentes a kanamicina que mostraron
un aspecto sano y proliferación de microcallos, se subcultivaron periódicamente manteniendo la
presión de selección hasta la generación de plántulas. Cuando éstas presentaron un tamaño
suficiente, se crecieron en medio de multiplicación suplementado con kinetina (0,47 mg/l) y
kanamicina (100 mg/l) y, posteriormente, fueron trasvasadas a maceta. Este periodo tuvo una
duración aproximada de 6-8 meses. Por otro lado, las plántulas necrosadas, etioladas o deformes
fueron desechadas.
Apéndice 17: Medios y soluciones empleadas en la transformación mediada por Agrobacterium
tumefaciens de Fragaria × ananassa “Chandler”.
Medio LB (Apéndice 1)
Acetosiringona (100 mM)
19,6 mg/ml en EtOH 70%. Almacenar a 4 ºC
Medio MS (Murashige y Skoog, 1962) Medio MS de organogénesis
Para Fragaria ×ananassa “Chandler” Añadir al medio MS las hormonas:
Sales minerales Ácido Indol-3-butírico (IBA) 0,5 mg/l
NH4NO3 0,47 g/l 6-bencil aminopurina (BA) 2 mg/l
KNO3 1,31 g/l
MgSO4×7H2O 0,24 g/l Medio MS de multiplicación
KH2PO4 0,13 g/l Añadir al medio MS la hormona:
KCl 0,074 g/l Kinetina 0,47 mg/l
Ca(NO3)2×4H2O 0,59 g/l
NaFe-EDTA 10 ml/l Otros componentes
(de una solución compuesta por: Sacarosa 20 g/l
3,724 g/l de Na2EDTA Titriplex Myo-Inositol 100 mg/l
2,78 g/l de FeSO4) Agar de plantas 7 g/l
Micronutrientes
Añadir 10 ml/l de una solución compuesta por:
MnSO4×H2O 1,690 g/l
ZnSO4×7H2O 0,860 g/l
CuSO4×5H2O 0,0025 g/l
KI 0,0830 g/l
CoCl2×6H2O 0,0025 g/l
H3BO3 0,620 g/l
Na2MoO4×2H2O 0,025 g/l
Stock de vitaminas
Añadir 10 ml/l de una solución compuesta por:
Tiamina×HCl 0,1 g/ml
Piridoxina×HCl 0,05 g/ml
Ácido nicotínico 0,05 g/ml
Glicina 0,2 g/ml
Las hormonas se prepararon a una concentración de almacenamiento de 0,1 mg/l. Para disolverlas, se
añadieron unas gotas de NaOH 1N hasta su disolución y luego se completó el volumen con H2O
destilada. Los antibióticos se añadieron al medio estéril templado antes de solidificar. Posteriormente,
éste se distribuyó en frascos previamente esterilizados.
202 Functional characterization of molecular regulatory mechanisms controlling the ripening in strawberry fruit
Las plantas que presentaron resistencia a kanamicina fueron analizadas posteriormente
mediante PCR para comprobar su naturaleza transgénica. Para ello, se empleó el kit Phire Plant
Direct PCR Kit (Thermo Scientific) siguiendo las instrucciones recomendadas por el fabricante.
De las plantas transgénicas confirmadas, se extrajo ARN y mediante qRT-PCR se determinó el
grado de sobreexpresión del trasgén correspondiente en cada una de ellas (Materiales y Métodos,
apartado 2.8.2). En el caso del silenciamiento del gen FaMYB123, se seleccionaron aquellas
líneas transgénicas que presentaron mayor grado de silenciamiento del gen, siempre por encima
del 90%.
2.10. Transformación transitoria mediante agroinfiltración de frutos Fragaria × ananassa
“Elsanta”
2.10.1. Obtención y mantenimiento de plantas de Fragaria × ananassa “Elsanta”
El cultivar Fragaria × ananassa “Elsanta” se empleó para la transformación de frutos de
fresa mediante agroinfiltración. Las plantas se mantuvieron a una temperatura de 25 ºC, con un
fotoperiodo de 16 h de luz /8 h de oscuridad y bajo una irradiancia de 120 μmol m-2 sec-1
proporcionada por lámparas Osram Fuora (Múnich, Alemania).
2.10.2. Transformación transitoria de frutos de Fragaria × ananassa “Elsanta” a través de
agroinfiltración con A. tumefaciens AGL0
La transformación de Fragaria × ananassa “Elsanta” mediada por A. tumefaciens AGL0
(Lazo et al., 1991) se llevó a cabo según el método descrito previamente por Hoffmann et al.
(2006), que adecuó la técnica de transformación previamente descrita por Spolaore et al. (2001)
a esta especie. La estirpe AGL0 de A. tumefaciens conteniendo las construcciones a agroinfiltrar,
fue cultivada a 28 ºC en 50 ml de medio LB suplementado con los antibióticos adecuados. Cuando
el cultivo alcanzó una DO600 ~ 0.8, las células de Agrobacterium fueron recolectadas mediante
centrifugación a 4000 g durante 10 minutos y, posteriormente, resuspendidas en 10 ml de medio
agar McConkey modificado (MMA) (Apéndice 18) (Spolaore et al., 2001). A continuación, esta
suspensión celular se inyectó en frutos en un estadio intermedio entre verde y blanco,
generalmente alcanzado 14 días después de la polinización. La suspensión se inyectó
uniformemente en el fruto usando una jeringuilla hipodérmica estéril de 2 ml y procurando
pinchar una o dos veces solamente para evitar dañar el fruto en exceso. Tras la inyección, las
plantas se dejaron nuevamente en la cámara de cultivo en las mismas condiciones descritas
previamente.

MATERIALES Y MÉTODOS
203 PhD Thesis Félix Juan Martínez Rivas
Apéndice 18: Medios y soluciones empleadas en la transformación transitoria de
Fragaria × ananassa “Elsanta” con Agrobacterium tumefaciens cepa AGL0 Medio Luria-Bertani (Apéndice 1)
Medio MMA (Spolaore et al., 2001)
Medio MS (Murashige y Skoog, 1962)
10 mmol l-1 MES (ácido 2-(N-Morfolino)etanosulfónico) a pH 5,6
20 g l-1 de Sacarosa
200 μmol l-1 de Acetosiringona
Aunque se hizo un seguimiento diario de la evolución de los frutos inyectados para
comprobar la existencia o no de cambios fenotípicos evidentes, los frutos no se recolectaron hasta
14 días después de la inyección, cuando alcanzaron el estadio rojo. En paralelo y de forma
simultánea, también se inyectaron frutos con un cultivo de la cepa AGL0 de A. tumefaciens sin
transformar usados como control. En cualquier caso, los frutos inyectados, una vez recolectados,
se congelaron a -80 ºC hasta su uso. Paralelamente, se hizo lo mismo con la estirpe utilizada como
control positivo que contenía la construcción pBI-Intrón (Hoffmann et al., 2006). Como control
negativo se utilizaron frutos inyectados con el plasmido vacío pFRN.
El grado de silenciamiento de los genes en estudio se determinó mediante qRT-PCR en
los frutos transgénicos obtenidos en las diferentes transformaciones realizadas y de entre todos
los frutos agroinfiltrados se seleccionaron aquellos que presentaron un grado de silenciamiento
superior al 90% para un análisis transcriptómico detallado mediante microarray.
2.11. Transformación transitoria de hojas de Nicotiana benthamiana a través de
agroinfiltración con A. tumefaciens GV3101
La localización subcelular de la expresión transitoria de los genes en estudio se llevó a
cabo con construcciones derivadas del vector binario pK7WGF2.0 (Materiales y métodos,
apartado 1.3.2.), el cual permite la fusión de la proteína GFP en el extremo amino terminal de la
proteína en estudio.
Las secuencias completas de los ADNc de los genes a estudiar fueron amplificados por
PCR usando cebadores específicos para cada gen con los sitios attB1 y attB2 acoplados. Tras la
amplificación, se procedió a la purificación del producto de PCR obtenido empleando el kit
comercial Thermo Fisher GenJET PCR Purification Kit (Thermo) y a su cuantificación por
espectrofotometría. Entonces, el amplicón purificado fue clonado mediante una reacción BP
clonasa (Gateway® BP Clonase® II Enzyme mix (InvitrogenTM) en el entry vector pDONRTM221
(InvitrogenTM) (Materiales y Métodos, apartado 1.3.2.) utilizando la mezcla de reacción detallada
en el Apéndice 17 e incubando la misma durante toda la noche a 25 ºC en un termociclador.

204 Functional characterization of molecular regulatory mechanisms controlling the ripening in strawberry fruit
Transcurrido este tiempo, se procedió a la transformación de una alícuota de células competentes
One Shot®TOP10 Chemically Competent E. coli (InvitrogenTM) con 2-6 µl de la mezcla de
reacción (Materiales y Métodos, apartado 2.3.2).
Apéndice 19: Mezcla de reacción para el subclonaje de fragmentos de
ADN en el vector pDONRTM221 (InvitrogenTM) Amplicón purificado (producto attB-PCR) 75 ng 1-7 μl
pDONRTM221 (InvitrogenTM) (150 ng/l) 1 μl
Tampón TE pH 8 hasta 10 l
BP clonase enzyme mixII 2 l
Una vez generado el Entry vector pDONRTM221 conteniendo independientemente el
fragmento de ADNc correspondiente a los genes a estudiar, se procedió a su transferencia al
vector binario pK7WGF2.0 mediante la recombinación mediada por la LR clonasa Gateway
(InvitrogenTM). El resultado fue una construcción de fusión 35S::GFP::gen. La recombinación se
realizó empleando la siguiente mezcla de reacción y adicionando los reactivos en el orden
indicado:
Apéndice 20: Mezcla de reacción LR InvitrogenTM) pDONRTM221-ADNc (300 ng) x μl
pK7WGF2.0 (300ng) 1 μl
Tampón reacción LR [5X] 4 μl
LR Clonase enzyme mix 1 μl
Tampón TE pH8 hasta 16 μl
La mezcla se incubó a 25 ºC durante 16 horas y transcurrido este periodo, se incubó
nuevamente a 37 ºC durante 10 minutos en presencia de 2 μl de proteinasa K. A continuación, se
procedió a la transformación con 5 µl del total de la reacción de una alícuota de células
competentes One Library Efficiency DH5α Chemically Competent Cells (InvitrogenTM) como se
describe en Materiales y métodos, apartado 2.3.2. Posteriormente, se seleccionaron
transformantes bacterianos positivos por PCR y se extrajo el vector usando el kit GeneJET
Plasmid Miniprep (Thermo).
Las construcciones generadas fueron testadas mediante secuenciación (Materiales y
Métodos, apartado 2.5.6) antes de llevar a cabo la transformación de hojas de Nicotiana
benthamiana. Cultivos de A. tumefaciens GV3101 (Weigel et al., 2006) conteniendo
independientemente las construcciones pK7WGF2-gen y el vector vacío pK7WGF2 (usado como
control); y cultivos de A. tumefaciens transportando el vector supresor de genes de silenciamiento
pTBSV-p19 (Voinnet et al., 2003) fueron crecidos a 28 °C en medio LB con los antibióticos
apropiados hasta alcanzar una DO600~ 0,8. Las células fueron recuperadas por centrifugación y
resuspendidas en tampón de infiltración (10 mM MgSO4, 10 mM MES y 1 mM acetosiringona)
ajustando su concentración final a una DO600 entre 0,5 y 0,8. Las suspensiones con las

MATERIALES Y MÉTODOS
205 PhD Thesis Félix Juan Martínez Rivas
construcciones de interés y los plásmidos vacíos fueron mezcladas con las células que contenían
el vector pTBSV-p19 a partes iguales e incubadas en oscuridad y a temperatura ambiente entre 2
y 4 horas. Transcurrido este tiempo, las suspensiones bacterianas fueron infiltradas de forma
independiente a través de la cara abaxial de la hoja con una jeringa sin aguja. Las hojas infiltradas
fueron recolectadas cuatro días después de su inyección. Para la localización de los núcleos
celulares de manera precisa, pequeños fragmentos de hojas de de N. benthamiana fueron
incubados en oscuridad con 4',6-Diamidino-2-fenilindol diclorhidrato (DAPI) durante 5 minutos
y lavados luego con agua destilada. Estos fragmentos de hoja tratados fueron observados para la
localización de la proteína GFP con un microscopio de epifluorescencia LSM 5 EXCITER (Carl
Zeiss, Inc., Germany). Los parámetros de excitación/emisión usados para la visualizar la
fluorescencia de la proteína GFP y el DAPI fueron de 488/500–515 nm y 405/449–461 nm
respectivamente.
DAPI es una tinción fluorescente que emite fluorescencia azul tras su unión selectiva al
surco menor del ADN de doble cadena. Este compuesto se une fuertemente a las regiones de ADN
ricas en A-T donde su fluorescencia es aproximadamente 20 veces mayor que en estado libre. Su
selectividad de unión al ADN y su alta permeabilidad permite la tinción de núcleos celulares con
poco ruido de fondo del citoplasma.
2.12. Interacción mediante doble híbrido en levadura
En el estudio de doble híbrido de levadura, el marco abierto de lectura de los genes
FaMYB123, FaEOBII, FabHLH3, FaMYB9 y FaMYB10, subclonados en el vector
pDONR™221, fueron recombinados mediante reacción LR GatewayTM en los vectores “bait”
pBDGAL4 (pDESTTM32; InvitrogenTM), y “prey” pADGAL4 (pDESTTM22; InvitrogenTM),
independientemente (Materiales y Métodos. Apartado 1.3.1) (cedidos por cortesía del Dr.
Schaart; Wageningen UR Plant Breeding, Países Bajos). Los vectores “bait” y “prey” resultantes
fueron transformados en las cepas de levadura PJ69-4a (MATa) y PJ69-4α (MATα)
respectivamente según describe James et al. (1996); y usados en los experimentos de doble
híbrido de levadura tal y como describe Folter et al. (2005). Las levaduras transformantes
obtenidas fueron seleccionadas en placas con medio SD (Materiales y Métodos, apartado 2.4.2)
en ausencia de triptófano y leucina, respectivamente, y comprobadas por PCR con cebadores
específicos.
2.12.1. Ensayos de auto-activación
Antes de llevar a cabo el ensayo del doble híbrido de levadura, la cepa de levadura que
contiene la construcción con nuestro gen de interés (“cebo”) debe ser examinada mediante

206 Functional characterization of molecular regulatory mechanisms controlling the ripening in strawberry fruit
ensayos de auto-activación. La auto-activación se define como la activación detectable de un gen
reportero presente en la construcción “cebo” en ausencia de cualquier interacción con la “presa”.
Las interacciones de fuerza débil a intermedia en los ensayos de auto-activación se aceptan como
ruido de fondo, ya que las interacciones “cebo-presa” específicas confieren uniones más fuertes
que las auto-activaciones. Si el gen reportero que se emplea es HIS3, el ruido de fondo de la auto-
activación puede ser suprimido mediante la adición de 3-AT en el medio de selección de
crecimiento de las levaduras. El 3-AT es un inhibidor competitivo de HIS3.
Los ensayos de auto-activación de todos los “cebos” objeto de estudio deben ser llevados
a cabo de forma simultánea en placas que contengan diferentes concentraciones de 3-amino-1,2,4-
triazol (3-AT). Por ejemplo, se pueden utilizar una serie de titulación con concentraciones de 3-
AT desde 0, 1, 2, 4, 8, 16…hasta 128 mM. La concentración más baja (concentración inhibitoria
mínima) de 3-AT que suprime el crecimiento en esta prueba se utiliza para los posteriores ensayos
de interacción del doble híbrido de levadura, ya que evita el ruido de fondo del crecimiento de las
auto-activaciones, mientras que las verdaderas interacciones siguen siendo detectables.
2.13. Tratamientos hormonales en frutos y plantas
2.13.1. Retirada de aquenios y tratamiento con auxinas
Con el objeto de determinar si los genes estudiados se encuentran regulados por auxinas,
se procedió, sin separar el fruto de la planta, a la retirada cuidadosa de los aquenios en frutos de
estadio de desarrollo V2 usando un bisturí. Posteriormente, se aplicó sobre un grupo de estos
frutos desaquenizados una pasta de lanolina (preparada al 50% en H2O y licuada a 65 ºC) y, sobre
otros frutos también desaquenizados, la misma pasta de lanolina conteniendo la hormona sintética
ácido 1-naftalenacético (1-NAA) 1 mM, disuelta en DMSO al 2% (p/v). Ambos procesos se
realizaron a temperatura ambiente. Los frutos tratados con lanolina más 1-NAA se recogieron
después de 96 horas de la desaquenización y del tratamiento con la hormona. En todos los casos,
los frutos tratados se congelaron inmediatamente después de su recolección en nitrógeno líquido
y posteriormente se almacenaron a -80 ºC hasta su uso.
2.13.2. Tratamiento con NDGA
Con el objetivo de bloquear la biosíntesis de ABA, se inyectaron frutos de fresa (Fragaria
× ananassa “Elsanta”) en estadios verde-blanco con ácido nordihidroguaiarético (NDGA)
(Creelman et al., 1992). El NDGA es un inhibidor de la enzima 9-cis-
epoxycarotenoidedioxygenasa (NCED) que actúa bloqueando completamente la biosíntesis de
ABA. Los frutos de fresa seleccionados para el experimento fueron inyectados con 1-2 ml de
NDGA 100 μM, como previamente había sido descrito para tomate (Zhang et al., 2009), o agua

MATERIALES Y MÉTODOS
207 PhD Thesis Félix Juan Martínez Rivas
destilada (frutos control). Para cada tratamiento se realizaron tres repeticiones. Los frutos
sometidos a tratamiento fueron cosechados tras 8 días de experimentación y empleados para la
determinación de su contenido de ABA y la extracción de ARN. Para ello, los frutos recolectados
fueron congelados con nitrógeno líquido inmediatamente y almacenados a -80°C hasta su uso.
2.13.3. Tratamiento de estrés hídrico
Debido a que las condiciones de estrés hídrico aumentan las concentraciones de ABA, en
los experimentos de estrés hídrico, se emplearon tanto frutos de Fragaria × ananassa “Elsanta”
en estadio verde-blanco, como plantas completas de este mismo cultivar a las que se les retiró el
riego. Los frutos seleccionados para el experimento se mantuvieron con los pedicelos al aire
mientras que los frutos control se mantuvieron con los pedicelos sumergidos en medio MS
(Apéndice 17) enriquecido con sacarosa al 2%. En ambos casos, los pedicelos de los frutos fueron
cortados diariamente para eliminar su extremo necrosado y facilitar la absorción del medio
correspondiente. Tras cuatro días de tratamiento, los frutos fueron recolectados, congelados en
nitrógeno líquido y almacenados a -80 °C hasta la extracción de su ARN.
En el caso del experimento con plantas completas, tanto las sometidas a estrés hídrico
como las control se mantuvieron a una temperatura de 25 ºC, con un fotoperiodo de 16 h de luz/8
h de oscuridad y bajo una irradiancia de 120 μmol m-2 sec-1 proporcionada por lámparas Osram
Fuora (Múnich, Alemania). A las plantas control se les mantuvo el riego diario mientras que a las
plantas problema se les retiró hasta presentar un fenotipo claro de estrés hídrico. Llegado este
momento se recolectaron frutos, se congelaron en nitrógeno líquido y se almacenaron a -80 °C
hasta la extracción de su ARN.
2.13.4. Tratamiento con 5-azacitidina
Para el tratamiento con 5-azacitidina en frutos, se preparó una disolución a una
concentración de 1mM en agua estéril. La solución se esterilizó usando filtros de 0.22 μm de poro.
Aproximadamente 0.5 ml de la solución se inyectó a frutos en estadio V3-B usando una aguja de
HPLC. La aguja se introdujo entre 0.3 a 0.5 cm y una única vez para evitar daño excesivo al fruto.
Solo la mitad del fruto fue inyectada con 5-AZA, mientras que la otra mitad recibió la misma
cantidad de agua como control. El tratamiento se repitió cada 3 días hasta un total de 3 a 5 veces
hasta que la parte control madurase normalmente. Una vez la parte control llegase al estadio rojo,
ambas partes se separaron con un bisturí y se congelaron a -80ºC hasta su uso.

208 Functional characterization of molecular regulatory mechanisms controlling the ripening in strawberry fruit
2.13.5. Tratamientos con giberelinas y paclobutrazol
Se inyectaron frutos de fresa (Fragaria × ananassa) en estadio verde-2 con paclobutrazol
(PAC) y ácido giberélico (GA3). El PAC es un triazol que retarda el crecimiento vegetal debido a
que interfiere, bloqueando la síntesis de giberelinas. Los frutos de fresa seleccionados para el
experimento fueron inyectados con 1-2 ml de PAC 100 μM, GA3 100 μM y agua destilada en el
caso de los frutos control. En todos los tratamientos, se añadió a la solución inyectada 0,02 %
Tween20 y 0,1 % N-dimetilformamida para facilitar la difusión de la solución inyectada a través
de las paredes celulares. Para cada tratamiento se realizaron tres repeticiones. Los frutos tratados
fueron cosechados tras 24 horas de experimentación y empleados para la extracción de ARN. Para
ello, los frutos recolectados fueron congelados con nitrógeno líquido inmediatamente y
almacenados a -80 °C hasta su uso.
Para los experimentos con plantas, se emplearon plantas de fresa (Fragaria × ananassa
“Chandler”) mantenidas en cultivo in vitro. Las plantas fueron tratadas de forma independiente
con GA3 100 μM y PAC 100 μM y se mantuvieron en la cámara de crecimiento durante 11 días
antes de su recolección. Tres grupos de dos plantas cada uno fueron empleadas en cada
tratamiento y fueron comparadas con plantas control no tratadas.
2.14. Extracción de metabolitos y hormonas del fruto de fresa
2.14.1. Extracción de metabolitos
La extracción de metabolitos se realizó siguiendo el protocolo descrito por Lisec et al.,
2006. En resumen, aproximadamente 100 mg de tejido fresco liofilizado se homogeneizó con 300
μL de metanol al 50 % a 70 ºC durante 30 minutos con agitación continua a 900rpm.
Posteriormente, se añadieron 200 μL de cloroformo y 300 μL de agua. Tras una centrifugación
para separar las fases, la fracción polar se evaporó en un speed-vaccum. Se tomaron 2 alícuotas
de la fracción polar, una de 100 μL que se usó para la determinación de compuestos por
Cromatografía de gases acoplada a espectrometría de masas (GC/MS), y otra de 350 μL que fue
usada para cromatografía de líquidos acoplada a espectrometría de masas (LC/MS).
2.14.1.1. Análisis de productos por GC-MS
La fracción polar usada para el análisis por GC/MS fue derivatizada en 40 μL de
metoxamina hidroclorido (20 mg ml-1) disuelta en pirimidina. La mezcla fue incubada 30 minutos
a 37ºC con agitación continua a 900 rpm. Posteriormente, se añadieron 70 μL de MSTFA y todo
se incubó durante 45 minutos a 37ºC con agitación continua a 900rpm. 1 μL de la mezcla fue
inyectado en un cromatógrafo de gases acoplado a un espectrómetro de masas time-of-flight (GC-

MATERIALES Y MÉTODOS
209 PhD Thesis Félix Juan Martínez Rivas
MS, Leco Pegasus HT TOF-MS (LECO Corporation, St. Joseph, MI, USA). El gas usado como
carrier fue helio, usando un ritmo constante de 2 ml/s. La cromatografía se realizó en una columna
DB-35 de 30 m. La temperatura de inyección fue 230 ºC y la de los iones de 250 ºC. La
temperatura inicial del horno se estableció a 85 ºC y fue aumentando gradualmente 15 ºC /min
hasta alcanzar una temperatura final de 360 ºC. Los tres primeros minutos del cromatograma
fueron desechados y, a partir de ese momento, se tomaron 20 medidas por segundo en un rango
de 70-600 m/z. Los espectros de masa se analizaron usando Chroma TOF 4.5 (Leco) y TagFinder
4.2. Los compuestos fueron identificados mediante comparación con los espectros de masa
depositados en las bases de datos correspondientes y empleando la bibliografía publicada.
2.14.1.2. Análisis de productos por LC-MS
La fracción polar restante fue disuelta en 200 μL de metanol 50% e inyectada en un
detector Orbitrap según lo descrito por Giavalisco et al., (2009). El sistema HPLC se equipó con
una columna de fase reversa HSS T3 C18 (100 × 2.1 mm i.d., 1.8-μm filtro, Waters) que fue
operado a una temperatura de 40 ºC. La fase móvil consistió en dos fases: 0.1% de ácido fórmico
en agua (Solvente A) y 0.1% de ácido fórmico en acetonitrilo (Solvente B). Se inyectó 2 μL de
muestra a un ritmo de solvente de 400 μL/min. El HPLC se conectó a un espectrómetro de masas
Exactive Orbitrap (Thermo Fisher Scientific). El espectro de masas se determinó tanto en modo
positivo como negativo en un rango de masas 100 a 1500 m/z. La resolución se determinó en
25.000 y el tiempo máximo de escaneo en 250 ms. El espectro se recogió desde el minuto 0 al 20
en ambos modos. El espectro de masas y tiempo de retención se extrajo usando RefinerMS 5.3,
Gene data y Xcalibur (Thermo Fisher). La identificación de los compuestos se realizó mediante
el uso de compuestos estándares previamente identificados y descritos en la bibliografía sobre
fresa.
2.14.1.3. Extracción de antocianinas y clorofila
Extracción de antocianinas totales
Se tomó un 1 g de tejido (peso fresco) pulverizado en presencia de nitrógeno líquido en
10 ml de 1 mol/l de HCl-metanólico (12N HCl:99,9% MeOH = 1:35) durante 72 h a 4 ºC en
agitación constante. A continuación, las muestras fueron centrifugadas a máxima velocidad y el
sobrenadante fue recuperado. El contenido total de antocianinas de cada muestra fue calculado
espectrofotométricamente a una longitud de onda de 530 nm (Rabino y Mancinelli, 1986) y
aplicando la fórmula A530 – 0,25 A657 para eliminar la influencia de la clorofila contenida en los
extractos analizados (Mancinelli y Schwartz, 1984). Se realizaron, al menos, 3 extracciones

210 Functional characterization of molecular regulatory mechanisms controlling the ripening in strawberry fruit
independientes de cada muestra. Los datos fueron analizados estadísticamente con el programa
informático GraphPad InStat (Materiales y Métodos, apartado 2.16).
2.14.2. Extracción de ABA
Para la extracción de ácido abscísico a partir de frutos de fresa, se empleó como estándar
interno ácido abscísico deuterado (dABA). Durante su preparación, los protones del anillo del
ABA (5 mg) se intercambiaron durante al menos 48 horas en 10 ml de agua pesada (Sigma: pureza
isotópica 99,96%) a temperatura ambiente y en presencia de hidróxido de sodio 1M deuterado
(Sigma: pureza isotópica 99%) (Rock y Zeevaart, 1990). El medio se acidificó a pH 3 con ácido
clorhídrico. La solución ácida se mezcló con éter dietílico (50:50 v/v), se centrifugó a 5000 g
durante 10 minutos a temperatura ambiente y se desecó a 35 ºC. Las muestras que contenían [H]
se disolvieron en metanol. La pureza del [2H6]-ABA fue evaluada mediante HPLC en las
condiciones indicadas a continuación.
En la extracción de ABA se empleó 1 g de fruto de fresa que fue homogenizado en N2
líquido hasta obtener un polvo fino. La muestra triturada fue colocada en un vaso de vidrio de 50
ml y se mezcló con 1,26 nmol del estándar interno (40 μl de 31,5 nmol mL-1) mediante agitación
durante 5 minutos. La mezcla obtenida se extrajo dos veces con 10 ml de metanol / agua pH 5.5
(50:50; v/v) en agitación durante 30 minutos y posteriormente fue centrifugada a 5000 g durante
5 minutos a temperatura ambiente. El sobrenadante fue recogido y extraído por duplicado con 10
ml de diclorometano. Los extractos de diclorometano obtenidos fueron centrifugados a 5000 g
durante 5 minutos a temperatura ambiente y la fase inferior se dejó evaporar a 40 °C. El residuo
se disolvió en 100 μl de acetona 100% y en 250 μl de agua/acetonitrilo (70:30, v/v) (0,1% ácido
fórmico). Finalmente, la muestra se centrifugó a velocidad máxima durante 5 minutos utilizando
el sobrenadante recuperado para su medida por HPLC-MS (1200 L Triple Quadrupole). El
volumen de inyección fue 8 μl y la columna empleada fue C18 Phenomenex, con una i.d. 150x2.1
mm y un tamaño de partícula de 3 μm. La fase móvil empleada estuvo compuesta de
agua/acetonitrilo (70:30; v/v) (0,1% ácido fórmico), con un flujo de 0.2 mL min-1. La MS constó
de un sistema SIM (Selecting Ion Monitopring) y el flujo de N2 empleado (calidad LC-MS) fue
de 50 L/h. La tensión del capilar fue de 5,5 kV. El tiempo de permanencia elegido fue de 1 s/scan.
El ABA fue detectado a una longitud de onda de 263 nm y el dABA a 268-269 nm. Para procesar
los datos cuantitativos obtenidos a partir de los estándares de calibración y las muestras de las
plantas se empleó el software 5.1 Data Analysis (Bruker Daltonics).

MATERIALES Y MÉTODOS
211 PhD Thesis Félix Juan Martínez Rivas
2.14.3. Extracción y análisis de hormonas
Aproximadamente 200 mg de tejido fresco y posteriormente liofilizado se usaron para la
identificación de hormonas, según lo publicado por Plackett et al., 2012. El tejido se incubó con
10 mL de 80% acetonitrilo conteniendo 1% de ácido acético durante 1 hora a 4 ºC en movimiento
continuo. Después de centrifugar a 3000g durante 20 minutos, se retiró el sobrenadante y el
residuo se extrajo de nuevo con la misma mezcla. Se mezclaron ambos sobrenadantes y se
evaporó en un speed-vaccum. El residuo se disolvió en 2mL de 1% ácido acético y fue sonicado
en un baño durante 5 minutos. Tras una centrifugación, el sobrenadante se añadió en una columna
OASIS HLB (60mg, 3cc Waters), posteriormente se lavó con 3ml de acetonitrilo, metanol y 1%
de ácido acético. Las hormonas fueron eluidas de la columna con dos lavados consecutivos de
3mL de una solución 80% acetonitrilo-1% ácido acético. Posteriormente añadieron a la columna
SepPak (100mg, Waters), previamente lavada con metanol y 0.1M de HCl. El extracto fue
añadido en una columna MCX, eluido con acetonitrilo y evaporado en un speed-vaccum. El
residuo se resuspendió en 700 μL de ácido acético al 1% y añadido en una columna Wash WAC
solid-phase, previamente lavada con metanol, 0.1M NaOH y agua. Las hormonas se eluyeron con
80% acetonitrilo conteniendo 1% ácido acético. El eluido se evaporó en un speed-vaccum y
posteriormente se disolvió en 30 μL de 1% ácido acético. El contenido de las diferentes hormonas
se determinó mediante HPLC asociado a un espectrómetro de masas triple quad, siguiendo lo
descrito por Salem et al., 2020.
2.15. Extracción de proteínas y análisis enzimáticos
2.15.1. Extracción de proteínas
El fragmento correspondiente a la región codificante de la proteína FaCXE se amplificó
mediante PCR usando oligos específicos para el inicio y final de la secuencia a los que se le añadió
la secuencia de reconocimiento de las enzimas EcoRI y XhoI en los extremos 5’ y 3’. El fragmento
de PCR fue purificado y clonado en el vector pGEM-T Easy (Promega). Posteriormente, usando
ambos sitios, el fragmento se introdujo en el vector pGEX-4T-1 (Amersham), transformado en E.
coli.
Para la expresión de la proteína recombinante, se incubaron células transformadas de E.
coli con los antibióticos apropiados hasta una densidad óptica OD600 = 0.6, se llevó a una
temperatura de 16ºC e induciendo la proteína con 1 mM IPTG. Después de añadir el IPTG, el
cultivo se dejó durante 12 horas a 16ºC y posteriormente las células se recogieron por
centrifugación y el precipitado se congeló a -80 ºC durante al menos 15 minutos. Posteriormente,
las células recogidas se resuspendieron en 10 mL de una solución de lavado fría (4.3 mM
Na2HPO4·7H2O, 1.47 mM KH2PO4, 0.137 M NaCl, 2.7 mM KCl, pH 7.3) y fueron sonicadas en

212 Functional characterization of molecular regulatory mechanisms controlling the ripening in strawberry fruit
frio al menos 3 veces durante 30s usando un sonicador Sonopuls GM 2017, Bandelin al 10% del
total de su potencia. Las células sonicadas se centrifugaron a 4 ºC, 10.000g durante 20 minutos.
La fracción soluble se incubó en una columna TelosTM SPE Columns con GST-sepharosa durante
al menos 1hr a 4ºC. La proteína unida a la columna se lavó con la solución de lavado y se separó
de la columna usando tampón de elución (50 mM TRIS-HCl, 1 mM glutathione, pH 8). La
proteína eluída se cuantificó usando el reactivo de Bradford y analizada en gel SDS-PAGE.
2.15.2. Análisis enzimático y cinético de la proteína recombinante FaCXE
La actividad enzimática esterasa se determinó, según el método de Gomori, 1953 según
lo modificado por van Asperen, 1962. La mezcla de reacción consiste en 5mL de 0.3mM de 1-
naftil acetato y de 50 a 100 µg de enzima, incubado a 27 ºC por 15 minutos. La reacción se detuvo
añadiendo 1 mL del reactivo DBLS (2 partes de 1% diazo blue B y 5 partes 5% SDS). El producto
de la reacción se determinó mediante absorbancia a 600nm. Una unidad de actividad enzimática
se determina como la cantidad de enzima necesaria para producir 1 µmol de producto por minuto
a pH 7 y 27 ºC. Una vez determinada estas condiciones, se estudió el efecto sobre la actividad
enzimática al cambiar diferentes variables.
2.15.2.1. Efecto del tiempo
La enzima purificada se incubó con naftil-acetato durante 10, 20, 30, 40, 50 y 60 minutos
a 27 grados. La reacción se preparó según lo descrito anteriormente y se incubó de la misma
manera. La cantidad de naftol liberado en cada tiempo se determinó usando una recta patrón.
2.15.2.2. Concentración de enzima
La reacción previamente descrita se llevó a cabo usando 25, 50, 75, 100, 125 y 150 µg de
proteína purificada. La cantidad de naftol liberado en cada tiempo se determinó usando una recta
patrón.
2.15.2.3. Especificidad de sustrato
La especificidad de sustrato se determinó usando naftil acetato, naftil butirato y naftl
hexanoato como sustrato. La reacción se llevó a cabo según lo descrito anteriormente para cada
uno de los substratos a estudiar. La reacción para cada uno de los sustratos se incubó durante 15
minutos a la temperatura óptima. Después de detener la reacción, la intensidad del color formado
se determinó por espectrofotometría a 600nm.

MATERIALES Y MÉTODOS
213 PhD Thesis Félix Juan Martínez Rivas
2.15.2.4. Efecto del pH y la temperatura
El efecto del pH en la actividad de la enzima se determinó usando 3 tampones diferentes.
i) Citrato sódico (0.05M, pH 3.0–6.0) ii) fosfato sódico (0.05 M, pH 6.0–8.0), iii) Tris-HCl (0.05
M, pH 8.0–10.0). La actividad enzimática se determinó usando naftil acetato como sustrato,
mientras que las condiciones de la rección fueron 15 minutos a 27 ºC. La cantidad de naftol
producido se determinó mediante espectrofotometría a 600nm.
Para estudiar el efecto de la temperatura, la proteína recombinante purificada se incubó a
diferentes temperaturas en el rango entre 10 ºC a 50 ºC. La reacción se llevó a cabo usando naftil
acetato como sustrato e incubada durante 60 minutos. La cantidad naftol producido se determinó
mediante espectofotometría a 600nm.
2.15.2.5. Km y Vmax
Una vez determinado las condiciones óptimas para la reacción, la enzima se incubó con
diferentes concentraciones de naftil acetato, naftil butirato y naftil hexanoato durante 20 minutos,
según lo descrito previamente. La concentración de naftol formado se determinó por
espectrofotometría y se calculó la Km y Vmax para cada reacción.
2.16. Análisis estadístico de los datos
Todos los análisis estadísticos fueron llevados a cabo con los programas GraphPad InStat
y SPSS Statistics 17.0. Los análisis estadísticos de caracteres cuantitativos se llevaron a cabo
mediante una prueba “t de Student” donde los valores estadísticos de significación fueron *P-
value ≤ 0.05, **P-value ≤ 0.01 y ***P-value ≤ 0.001 o mediante un análisis de la varianza (one-
way ANOVA) seguido de una prueba de contraste (post-hoc de Scheffe) donde el valor estadístico
de significación fue p < 0.05.

214 Functional characterization of molecular regulatory mechanisms controlling the ripening in strawberry fruit
Bibliografía
Amil-Ruiz F, Garrido-Gala J, Blanco-Portales R, Folta KM, Muñoz-Blanco J, Caballero JL. 2013.
Identification and validation of reference genes for transcript normalization in strawberry (Fragaria x
ananassa) defense responses. Plos One 8: e70603.
Asif MH, Dhawan P, Nath P. 2000. A simple procedure for the isolation of high-quality RNA from
ripening banana fruit. Plant Molecular Biology Reporter 18: 109-115.
Barceló M, El Mansouri I, Mercado JA, Quesada MA, Pliego-Alfaro F. 1998. Regeneration and
transformation via Agrobacterium tumefaciens of the strawberry cultivar Chandler. Plant Cell, Tissue and
Organ Culture 54: 29-36.
Benjamini Y, Hochberg Y. 1995. Controlling the false discovery rate: a practical and powerful approach
to multiple testing". Journal of the Royal Statistical Society, Series B (Methodological) 57: 289–300.
Bernard P, Couturier M. 1992. Cell killing by the F plasmid ccdB protein involves poisoning of DNA-
Topoisomerase II complexes. Journal of Molecular Biology 226: 735-745.
Bernard P, Kezdy KE, Melderen LV, Steyaert J, Wyns L, Pato ML, Higgins PN, Couturier M. 1993.
The F plasmid ccdB protein induces efficient ATP-dependent DNA cleavage by gyrase. Journal of
Molecular Biology 234: 534-541.
Bombarely A, Merchante C, Csukasi F, Cruz-Rus E, Caballero JL, Medina-Escobar N, Blanco-
Portales R, Botella MÁ, Muñoz-Blanco J, Sanchez-Sevilla J, Valpuesta V. 2010. Generation and
analysis of ESTs from strawberry (Fragaria × ananassa) fruits andevaluation of their utility in genetic and
molecular studies. BMC Genomics 11: 503.
Bradford M. 1976. A rapid and sensitive method for the quantification of microgram quantities of protein
utilizing the principle of protein-dye binding Biochemistry 72: 248– 254.
Caballero JL, Valpuesta V, Muñoz-Blanco J. 2001. Introducción a la biotecnología vegetal. Métodos y
aplicaciones. Publicaciones de la Obra Social y Cultural de Cajasur, Córdoba.
Christie PJ. 1997. Agrobacterium tumefaciens T-complex transport apparatus: a paradigm for a new family
of multifunctional transporters in eubacteria. Journal of Bacteriology 179: 3085-3094.
Conesa A, Götz S, García-Gómez JM, Terol J, Talón M, Robles M. 2005. Blast2GO: a universal tool
for annotation, visualization and analysis in functional genomics research. Bioinformatics 21: 3674-3676.
Creelman RA, Bell E, Mullet JE. 1992. Involvement of a lipoxygenase-like enzyme in abscisic acid
biosynthesis. Plant Physiology 99:1258-1260.
de Folter, Immink RG, Kieffer M, Parenicová L, Henz SR, Weigel D, Busscher M, Kooiker M,
Colombo L, Kater MM, Davies B, Angenent GC. 2005. Comprehensive interaction map of the
Arabidopsis MADS Box transcription factors. The Plant Cell 17:1424-1433.
de la Riva GA, González-Cabrera J, Vázquez-Padrón R, Ayra-Pardo C. 1998. Agrobacterium
tumefaciens: a natural tool for plant transformation. Electronic Journal Biotechnology 1: 1-16.
El Mansouri L, Mercadi JA, Valpuesta V, López-Aranda JM, Pliego-Alfaro F, Quesada MA. 1996.
Shoot regeneration and Agrobacterium-mediated transformation of Fragaria vesca L. Plant Cell Reports
15: 642–646.
Gambino G, Perrone I, Gribaudo I. 2008. A rapid and effective method for RNA extraction from
different tissues of grapevine and other woody plants. Phytochmestry anals 19: 520-525.

MATERIALES Y MÉTODOS
215 PhD Thesis Félix Juan Martínez Rivas
Gelvin SB. 2003. Agrobacterium-mediated plant transformation: the biology behind the “Gene-Jockeying”
Tool. Microbiology and Molecular Biology Reviews 67: 16-37.
George EF. 1993. Plant propagation by tissue culture. Part 1 The Technology. Exegetics Ltd. Edington.
England.
Giavalisco P, Kohl K, Hummel J, Seiwert B, Willmitzer L. 2009. 13C isotope labeled metabolomes
allowing for improved compound annotation and relative quantification in liquid chromatography-mass
spectrometry-based metabolomic research. Annal of Chemestry 81: 6546-6551.
Hoekema A, Hirsch PR, Hooykaas PJJ, Schilperoot RA. 1983. A binary plant vector strategy based on
separation Vir and T-region of Agrobacterium tumefaciens To-plasmid. Nature 303: 179-181.
Hoffmann T, Kalinowski G, Schwab W. 2006. RNAi-induced silencing of gene expression in strawberry
fruit (Fragaria × ananassa) by agroinfiltration: a rapid assay for gene function analysis. The Plant Journal
48: 818-826.
Hooyakaas PJJ, Beijersbergen A. 1994. The virulence system of Agrobacterium tumefaciens. Annual
Review of Phytopathology 32: 157-179.
Horobin RW. 1988. Understanding histochemistry: selection, evaluation and design of biological stains.
E. Horwood, 172p.
Horsch RB, Fry JE, Hoffmann N, Wallroth M, Eichholz D, Rogers SG, Fraley RT. 1985. Transferring
genes into plants. Science 227: 1229-1231.
Houde M, Dallaire S, N’Dong D, Sarhan F. 2004. Overexpression of the acidic dehydrin WCOR410
improves freezing tolerance in transgenic strawberry leaves. Plant Biotechnology Journal 2: 381- 387.
James P, Halladay J, Craig EA. 1996. Genomic libraries and a host strain designed for highly efficient
two- hybrid selection in yeast. Genetics 144: 1425-1436.
Karimi M, Inzé D, Depicker A. 2002. Gateway vectors for Agrobacterium-mediated plant transformation.
Trends in Plant Science 7: 193-195.
Koncz C, Schell J. 1986. The promoter TL-DNA gene 5 controls the tissue-specific expression of chimeric
genes carried by a novel type of Agrobacterium vector. Molecular Genetics and Genomics 204: 383-396.
Landy I. 1989. Dynamic, structural, and regulatory aspects of lambda site-specific recombination. Annual
Review of Biochemistry 58: 913-949.
Lazo GR, Pascal AS, Ludwig RA. 1991. A DNA transformation-competent Arabidopsis genomic library
in Agrobacterium. Biotechnology 9: 963-967.
Liu ZR, Sanford JC. 1988. Plant regeneration by organogenesis from strawberry leaf and runner tissue.
HortScience 23: 1057-1059.
Lisec J, Schauer N, Kopka J, Willmitzer L, Fernie AR. 2006. Gas chromatography mass spectrometry–
based metabolite profiling in plants. Nature Protocols 1: 387–396.
López-Aranda JM, Pliego-Alfaro F, López-Navidad I, Barceló-Muñoz M. 1994. Micropropagation of
strawberry (Fragaria × ananassa Duch.). Effect of mineral salts, benzyladenine levels and number of
subcultures on the in vitro and field behavior of the obtained microplants and the fruiting capacity of their
progeny. Journal of Horticultural Science 69: 625-637.
Mancinelli AL, Schwartz OM. 1984. The photoregulation of anthocyanin synthesis. Plant Cell Physiology
25: 93-105.

216 Functional characterization of molecular regulatory mechanisms controlling the ripening in strawberry fruit
Murashige T, Skoog F. 1962. Aided medium for rapid growth and bioassays with tobacco tissue cultures.
Physiologia Plantarum 15: 473-497.
Plackett ARG, Powers SJ, Fernández-García N, Urbanova T, Takebayashi Y, Seo M, Jikumaru Y,
Benlloch R, Nilsson O, Ruiz-Rivero O, Phillips AL, Wilson ZA, Thomas SG, Hedden P. 2012. Analysis
of the developmental roles of the arabidopsis gibberellin 20-oxidases demonstrates that GA20ox1, -2, and
-3 are the dominant paralogs. The Plant Cell 24: 941-960.
Pedersen SB. 2001. Multiplex relative gene expression analysis by real-time RT-PCR using the iCycler
iQ™ detection system. BioRadiations (BioRad) 107: 10-11.
Potrykus I. 1991. Gene transfer to plants: assessment of published approaches and results. Annual Review
of Plant Physiology and Plant Molecular Biology, 42: 205-225.
Rabino I, Mancinelli AL. 1986. Light, temperature and anthocyanin production. Plant Physiology 81:
922-924.
Raviv M, Reuveni O, Goldschmidt EE. 1987. The physiological basis for loss of root ability with age in
avocado seedlings. Tree Physiolgy 3: 115-122.
Rock CD, Zeevaart JAD. 1990. Abscisic (ABA)-aldehyde is a precursor to and 19,49-trans-ABA-diol a
catabolite of abscisic acid (ABA) in apple. Plant Physiology 93: 915-923.
Schaart JG, Dubos C, Romero De La Fuente I, van Houwelingen AM, de Vos RC, Jonker HH, Xu
W, Routaboul JM, Lepiniec L, Bovy AG.2013. Identification and characterization of MYB-bHLH-WD40
regulatory complexes controlling proanthocyanidin biosynthesis in strawberry (Fragaria × ananassa)
fruits.The New Phytologist, 197:454-467.
Shulaev V, Sargent DJ, Crowhurst RN, Mockler TC, Folkerts O, Delcher AL, Jaiswal P, Mockaitis
K, Liston A, Mane SP, Burns P, Davis TM, Slovin JP. Bassil N, Hellens RP, Evans C, Harkins T,
Kodira C, Desany B, Crasta OR, Jensen RV, Allan AC, Michael TP, Setubal JC, Celton J.-M, Rees
DJG, Williams KP, Holt SH, Rojas JJR, Chatterjee M, Liu B, Silva H, Meisel L, Adato A, Filichkin
SA, Troggio M, Viola R, Ashman T-L, Wang H, Dharmawardhana P, Elser J, Raja R, Priest HD,
Bryant DW, Fox SE, Givan SA, Wilhelm LJ, Naithani S, Christoffels A, Salama DY, Carter J, Girona
EL, Zdepski A, Wang W, Kerstetter RA, Schwab W, Korban SS, Davik J, Monfort A, Denoyes-
Rothan B, Arus P, Mittler R, Flinn B, Aharoni A, Bennetzen JL, Salzberg SL, Dickerman AW,
Velasco R, Borodovsky M, Veilleux RE, Folta KM. 2010. The genome of woodland strawberry
(Fragaria vesca). Nature Genetics 43: 109–116.
Salem MA, Yoshida T, Perez de Souza L, Alseeekh S, Bajdzienko K, Fernie AR, Giavalisco P. 2020.
An improved extraction method enables the comprehensive analysis of lipids, proteins, metabolites and
phytohormones from a single sample of leaf tissue under water-deficit stress. The Plant Journal. 103:1614-
1632.
Spolaore S, Trainotti L, Casadoro G. 2001. A simple protocol for transient gene expression in ripe fleshy
fruit mediated by Agrobacterium. Journal of Experimental Botany 52: 845-850.
Shuman S. 1991. Site-specific interaction of vaccinia virus topoisomerase I with duplex DNA. Minimal
DNA substrate for strand cleavage in vitro. The Journal of Biological Chemistry 266: 11372-9.

MATERIALES Y MÉTODOS
217 PhD Thesis Félix Juan Martínez Rivas
Voinnet O, Rivas S, Mestre P, Baulcombe D. 2003. An enhanced transient expression system in plants
based on suppression of gene silencing by the p19 protein of tomato bushy stunt virus. The plant journal
33: 949-956.
Weigel D, Glazebrook J. 2006. In planta transformation of Arabidopsis. Cold Spring Harbor Protocols.
Zhang M, Yuan B, Leng P. 2009. The role of ABA in triggering ethylene biosynthesis and ripening of
tomato fruit. Journal of Experimental Botany 60:1579-1588.

218 Functional characterization of molecular regulatory mechanisms controlling the ripening in strawberry fruit

CHAPTER 1
219 PhD Thesis Félix Juan Martínez Rivas
CHAPTER 1
An atypical HLH transcriptional regulator plays a novel and important
role in strawberry ripened receptacle

CHAPTER 1
220 Functional characterization of molecular regulatory mechanisms controlling the ripening in strawberry fruit
This chapter has been published as
Medina-Puche L*, Martínez-Rivas FJ*, Molina-Hidalgo FJ*, Mercado JA, Moyano E,
Rodríguez-Franco A, Caballero JL, Muñoz-Blanco J, Blanco-Portales R. 2019. An
atypical HLH transcriptional regulator plays a novel and important role in strawberry
ripened receptacle. BMC Plant Biology 19: 586.
*These authors contribute equally to this work.

CHAPTER 1
221 PhD Thesis Félix Juan Martínez Rivas
An atypical HLH transcriptional regulator plays a novel and important role in
strawberry ripened receptacle
Abstract
In soft fruits, the differential expression of many genes during development and ripening
is responsible for changing their organoleptic properties. In strawberry fruit, although some genes
involved in the metabolic regulation of the ripening process have been functionally characterized,
some of the most studied genes correspond to transcription factors. High throughput
transcriptomics analyses performed in strawberry red receptacle (Fragaria x ananassa) allowed
us to identify a ripening-related gene that codes an atypical HLH (FaPRE1) with high sequence
homology with the PACLOBUTRAZOL RESISTANCE (PRE) genes. PRE genes are atypical
bHLH proteins characterized by the lack of a DNA-binding domain and whose function has been
linked to the regulation of cell elongation processes. FaPRE1 sequence analysis indicates that this
gene belongs to the subfamily of atypical bHLHs that also includes ILI-1 from rice, SlPRE2 from
tomato and AtPRE1 from Arabidopsis, which are involved in transcriptional regulatory processes
as repressors, through the blockage by heterodimerization of bHLH transcription factors. FaPRE1
presented a transcriptional model characteristic of a ripening-related gene with receptacle-specific
expression, being repressed by auxins and activated by abscisic acid (ABA). However, its
expression was not affected by gibberellic acid (GA3). On the other hand, the transitory silencing
of FaPRE1 transcription by agroinfiltration in receptacle produced the down-regulation of a group
of genes related to the ripening process while inducing the transcription of genes involved in
receptacle growth and development. In summary, this work presents for the first-time
experimental data that support an important novel function for the atypical HLH FaPRE1 during
the strawberry fruit ripening. We hypothesize that FaPRE1 modulates antagonistically the
transcription of genes related to both receptacle growth and ripening. Thus, FaPRE1 would
repress the expression of receptacle growth promoting genes in the ripened receptacle, while it
would activate the expression of those genes related to the receptacle ripening process.
Introduction
During the processes of development and ripening of soft fruits, many metabolic
pathways that are responsible for organoleptic properties are differentially expressed. In
strawberry fruits, it is very well established that the increase in the ABA/auxins ratio triggers the
transcription of many ripening-related genes involving the different organoleptic properties such
as aroma, color, taste and softening (Koyama et al., 2010; Chai et al., 2011; Chen et al., 2015;
Chen et al., 2011; Jia et al., 2011; Cumplido-Laso et al., 2012; Daminato et al., 2013; Medina-
Puche et al., 2015; Medina-Puche et al., 2014; Molina-Hidalgo et al., 2015). However, except for

CHAPTER 1
222 Functional characterization of molecular regulatory mechanisms controlling the ripening in strawberry fruit
some transcriptional factors (TFs), the functional characterization of genes involved in the
regulation of these metabolic pathway is very scarce until now. Thus, it has been described the
function played by a few transcription factors. FaMYB10, a R2R3 MYB TF related to the
secondary metabolism, is described as a ripening-related master regulatory gene of the structural
flavonoid/phenylpropanoid metabolic pathway genes (Medina-Puche et al., 2014); and the
EMISSION OF BENZENOIDS II (FaEOBII), a positive regulator of flavonoids/phenylpropanoids
volatile-related genes, regulates the CINNAMYL ALCOHOL DEHYDROGENASE (FaCAD1) and
the EUGENOL SYNTHASE 2 (FaEGS2), which controls the production of eugenol, a volatile
phenylpropanoid, in ripe strawberry receptacles (Medina-Puche et al., 2015). Recently, a DOF-
type TF (FaDOF2) has also been identified as a positive regulator of eugenol biosynthesis in
ripened strawberry receptacle. Both FaEOBII and FaDOF2 seem to act synergistically in the
activation of the FaEGS2 gene transcription (Molina-Hidalgo et al., 2017). In this way, an ERF-
MYB TF complex regulates furaneol biosynthesis by means of a quinone reductase transcription
regulation (Zhang et al., 2018).
The functional role played by FcMYB1, another R2R3 MYB TF, was also characterized.
This TF acts as regulator of the branching point of the anthocyanins/proanthocyanidins
biosynthesis (Salvatierra et al., 2013). Also, FaGAMYB has been described as a regulator in the
transition from vegetative growth to ripening process (Vallarino et al., 2015). In addition, it was
demonstrated that the transient down-regulation of the C-type MADS-box TF expression
(SHATTERPROOF-like gene; FaSHP) gave rise to a slightly shorter delay in the time required to
reach the pink stage of ripening (Daminato et al., 2013). Besides, transcription of several ripening-
related genes as well as the content of several metabolites was altered in these transiently modified
fruits (Daminato et al., 2013). It was proposed that SCARECROW-LIKE 8 (FaSCL8) could
modulate the transcription regulation of genes related to the flavonoid/anthocyanin biosynthesis,
probably through their influence on FaMYB10 gene expression (Pillet et al., 2015). Moreover,
FaMYB44.2 has been proposed to interact with FaMYB10 in sucrose accumulation, which would
have an impact on the ripening process. (Wei et al., 2018) On the other hand, four TFs
(FaMYB9/FaMYB11, FabHLH3 and FaTTG1) have been described as positive activators of
genes that are involved in the proanthocyanidins (PAs) biosynthesis in strawberry immature fruits
(Schaart et al., 2013). A comparation between a mutant whited coloured strawberry and a red
natural one has discovered some TF potentially involved in the anthocyanin biosynthesis (Zhao
et al., 2018).
High throughput transcriptomics analyses previously performed by our group (Medina-
Puche et al., 2016) have allowed us to identify a ripening-related gene that codes an atypical HLH
(FaPRE1) belonging to the basic helix-loop-helix/helix-loop-helix (bHLH/HLH) TFs family.

CHAPTER 1
223 PhD Thesis Félix Juan Martínez Rivas
FaPRE1 was selected for its expression characteristics: a) ripening-related; b) receptacle-specific;
c) negatively regulated by auxins, and d) induced by ABA (Medina-Puche et al., 2016).
According to their DNA-binding ability, these proteins are classified into two groups; DNA-
binding bHLH (bHLH) and non-DNA-binding bHLH (HLH) proteins, also called atypical HLH
(Lee et al., 2006; Roig-Villanova et al., 2007; Carretero-Paulet et al., 2010; Zhang et al., 2018;
Wei and Chen, 2018). bHLH TFs contain two clearly differentiated domains, a basic domain
located at the amino terminus of the proteins, which contains 13-17 basic amino acids, and an
HLH region, located at the carboxy terminus that comprises two amphipathic α-helices which are
rich in hydrophobic amino acids and are connected by a loop of variable length. The basic domain
gives the transcription factor the ability to bind to the DNA (Massari and Murre, 2000; Toledo-
Ortiz et al., 2003; Wei and Chen, 2018) while the presence of the HLH motif confers the ability
to establish homo- or heterodimeric interactions with other bHLH proteins, which is essential for
DNA recognition and DNA-binding specificity (Carretero-Paulet et al., 2010; Wei and Chen,
2018).
On the contrary, HLH proteins are particularly diverged at the basic region, that usually
lacked critical sequences for a proper DNA binding domain and, in consequence, they did not
present DNA-binding ability (Massari and Murre, 2000). HLH proteins may dimerize with other
bHLH proteins (Herold et al., 2002; Hernandez et al., 2007; Wei and Chen, 2018; Shin et al.,
2019), thus acting as negative regulators of bHLH protein action through the formation of
heterodimers. This interaction will avoid bHLH protein to interact with other bHLH and, in this
way, with their corresponding cis sequences on the DNA (Castelain et al., 2012; Ikeda et al.,
2012; Ikeda et al., 2013; Wei and Chen, 2018; Shin et al., 2019; Zhu et al., 2017; Zhu et al.,
2019).
Several studies have shown that atypical HLH proteins play important regulatory roles in
hormone signaling and cell elongation (Hyun and Lee, 2006; Lee et al., 2006; Kim et al., 2017;
Lu et al., 2018; Oh et al., 2014), light signaling (Wang et al., 2009), vascular and fruit
development (Castelain et al., 2012; Zhu et al., 2019) or grain size (Heang and Sassa, 2012a; Jang
et al., 2017). In this sense, functional analysis identified AtPRE1 (Arabidopsis
PACLOBUTRAZOL RESISTANCE 1), an atypical HLH protein that plays an activator role of
genes that respond to gibberellin, presumably downstream of DELLA proteins (Lee et al., 2006).
AtPRE1 also regulates organ elongation in response to BRs (Ikeda et al., 2012; Ikeda et al., 2013).
Thus, AtPRE1 interacts with IBH1 (ILI1 binding bHLH 1), another atypical HLH that negatively
regulates ACE1 (Activator of Cell Elongation 1). When AtPRE1 interacts with IBH1, it prevents
its binding to ACE1 and restores the transcription ability of ACE to induce cell elongation (Ikeda

CHAPTER 1
224 Functional characterization of molecular regulatory mechanisms controlling the ripening in strawberry fruit
et al., 2012; Ikeda et al., 2013). Thus, this triantagonistic bHLH system, which is generally used
for these transcriptional regulators to perform its function, seems to be important in determining
the final size of plant cells (Ikeda et al., 2012; Ikeda et al., 2013).
Furthermore, in tomato, the PRE-like gene SlStyle2.1 control both the elongation and
length of floral style and has also been related to the evolution of self-pollination flowers in
cultivated varieties (Chen et al., 2007). In all these cases, the balance of triantagonistic bHLH
proteins might be important to determine both the size of plant cells and the regulation of cell
elongation, acting downstream of multiple external and endogenous signals (Bai et al., 2012;
Ikeda et al., 2012; Ikeda et al., 2013).Very little is known about the role of bHLH/HLH regulators
in fruit ripening. In fruits, only an atypical HLH has been described in tomato (SlPRE2) that seems
to participate in the development of the immature fruit but not in the stages of fruit ripening (Zhu
et al., 2017; Zhu et al., 2019). This transcriptional factor is predominantly expressed in the fruit
development and the silencing of its transcription diminished fruit size due to a thinning of the
fruit pericarp (Zhu et al., 2019). Furthermore, SlPRE2 transcription was GA3-inducible in
immature green fruits. The authors suggest that SlPRE2 may regulate fruit size through the
regulation of the cell expansion (Zhu et al., 2019).
However, the specific role played by the bHLH/HLH in the fruit ripening process is not
known. In this paper, we present the functional characterization, along the ripening of the
strawberry receptacle, of an atypical HLH protein (FaPRE1). The transcription pattern of this
gene is receptacle specific and clearly inducible along the ripening stages. In addition, the
FaPRE1 transcription is regulated positively for the internal concentration of abscisic acid (ABA)
in the receptacle but not for the content of GA3. The transitory silencing of FaPRE1 transcription
by agroinfiltration in receptacle produced the down-regulation of a group of genes related to the
ripening process while it induced the transcription of genes involved in receptacle growth. All
these results indicate that FaPRE1 plays a novel and important pivotal functional role along the
receptacle ripening process differentially coordinating the antagonistic transcription of genes
related to the receptacle growth and of those genes involved in receptacle ripening.
Results
FaPRE genes encode atypical HLH proteins
Bioinformatics analysis of the available Fragaria vesca (v2.0.a2) (Li et al., 2017) and
Fragaria x ananassa genome (v1.0-a1) (Edger et al., 2019) has allowed us to identify three PRE
genes (FaPRE) in strawberry genome that we have named FaPRE1 (gene30478), FaPRE2
(gene28320) and FaPRE3 (gene03986). The comparison of the deduced proteins from FaPRE
genes had a 90% amino acid sequence identity among them (Fig. 1A). Phylogenetic analysis

CHAPTER 1
225 PhD Thesis Félix Juan Martínez Rivas
showed that FaPRE1, FaPRE2 and FaPRE3 proteins can be classified into the atypical HLH
subgroup 16 of the 32 plant bHLH/HLH subfamilies (Carretero-Paulet et al., 2010) (Fig 2,
Additional file 1).
Fig 1. A Alignment of the predicted amino acid sequences of FaPRE1, FaPRE2 and FaPRE3 proteins. b-d
Analysis by qRT-PCR of FaPRE genes expression in different tissues of Fragaria × ananassa “Camarosa”
plants. B Analysis of FaPRE genes expression in some selected developing receptacles compared with
vegetative tissues. Analysis of FaPRE genes expression in receptacles (C) and achenes (D) in different
stages of development. Rec G1 and G1, small-sized green fruit; G2, middle-sized green fruits; G3, full-
sized green fruit (G1 and G3: stages of development); Rec W and W, white stage; Rec R and R, ripe stage;
OR, overripe stage; SN, senescent stage. Results were obtained using 3’UTR specific primers and
quantification is based on Ct values. Relative expression values were calculated relative to receptacles G1
stage Ct value, which was assigned an arbitrary value equal to unity. Values are mean ± SD of five
independent experiments. Statistical significance with respect to the reference sample was determined by
the Student’s t-test: **p < 0.01, ***p < 0.001.

CHAPTER 1
226 Functional characterization of molecular regulatory mechanisms controlling the ripening in strawberry fruit
Fig 2. Phylogenetic tree of 184 bHLH/HLH transcription factors. FaPREs taxa is written in black and grey
clade contains sequences belonging to subgroup 16. The tree was constructed using the IQTREE web
software (http://iqtree.cibiv.univie.ac.at/) by the neighbor-joining method with 1000 bootstrap replicates.
In addition, the analysis of the FaPREs amino acid deduced sequence with InterProScan
software revealed that, as in other similar PRE-like proteins, FaPREs lack the basic region at the
amino terminal end of the protein which is characteristic of the bHLH transcription factors and
responsible for their specific DNA binding ability. The atypical HLHs interact with bHLHs
transcription factors and, in this way, interfere with their regulatory activity by blocking its
binding to the cis-regulatory sequences positioned on the gene promoters that regulate. In this
sense, the existence of a putative helix-loop-helix (HLH) domain, which is important for the
interaction with other HLH transcription factors, was observed in the three FaPREs deduced
proteins (Fig. 3B). It is noteworthy that this HLH domain is highly conserved in all PRE family
members from A. thaliana (Lee et al., 2006), as well as in other plants as rice and grape (Fig. 3C)
(C., Zhang et al., 2018; Wang et al., 2019). Using the Plant-mPLoc program to determine the
bioinformatic prediction of FaPREs, a nuclear subcellular localization for these proteins was

CHAPTER 1
227 PhD Thesis Félix Juan Martínez Rivas
predicted (Fig. 3D), as has previously been described in other plant species (Cui et al., 2016; Xu
et al., 2017).
Fig 3. A. Table containing additional information of the atypical HLH sequences belonging to subgroup
16. B. Screenshot corresponding to the prediction of domains performed with InterProScan database
(version 5) (http://www.ebi.ac.uk/Tools/pfa/iprscan5). C. Sequence alignment of bHLH proteins. Identical
amino acids are shaded in black. The two helices are indicated with sets of black arrows and the loop is
indicated with a grey line. Numbers indicate amino acid positions. D. Screenshot corresponding to the result
of protein localization sites prediction in cells performed with the Plant-mPLoc computer program
(http://www.csbio.sjtu.edu.cn/cgi-bin/PlantmPLoc.cgi).
FaPRE1 protein is located in nucleus
To confirm bioinformatics predictions related to the subcellular location of FaPRE1
protein, we carry out in vivo heterologous studies in N. benthamiana. For that, a N-terminal
translational fusion protein construct between FaPRE1 and GFP proteins was driven under the

CHAPTER 1
228 Functional characterization of molecular regulatory mechanisms controlling the ripening in strawberry fruit
control of a CaMV35S promoter. Confocal imaging analysis of the agroinfiltrated leaves
indicated that the fusion protein co-localized with the nucleus marker DAPI (Fig. 4).
Fig 4. Subcellular localization of FaPRE1-GFP or free GFP upon transient expression in Nicotiana
benthamiana leaves. Leaves from N. benthamiana were agroinfiltrated with translational constructs 35S-
GFP-FaPRE1 and with 35S-GFP as control. Fluorescence signal detected using a confocal microscope.
GFP, green fluorescent protein; DAPI, 4′,6-Diamidino-2-Phenylindole; AF, Autofluorescence; MERGE,
merged view of the GFP and DAPI images. Scale bar: 5 μm
The spatio-temporal expression of FaPRE genes indicates that FaPRE1 is a ripening-related
gene
qRT-PCR studies were performed to determine the spatial expression of the three FaPRE
genes. Our analysis showed that FaPRE2 and FaPRE3 transcription was restricted to vegetative
tissues with a scarce or negligible transcription in the receptacle. However, FaPRE1 was almost
exclusively expressed in ripe receptacle (Fig. 1B). For this reason, a more detailed spatio-temporal
study of FaPRE1 expression was carried out in the strawberry receptacle at different stages of
growth and ripening. The data indicated that the amount of FaPRE1 transcript increased steadily
along the development and receptacle ripening stages, reaching their highest levels of
transcription in the fully ripe stage (R). Afterwards, a slight decrease of transcript was observed
in the overripe stage (OR), that was more pronounced in the senescent stage (SN), where only a
low transcription level was detected (Fig. 1C). In contrast, transcript levels in achenes,
corresponding to the different development and ripening stages, were negligible with respect to
the values observed in the receptacle (Fig. 1D). Besides, the FaPRE1 expression was not
significant in vegetative tissues. All these data taken together suggest the participation of FaPRE1
in the strawberry receptacle ripening process while FaPRE2 and FaPRE3 would develop their
function in the vegetative tissues of the plant.

CHAPTER 1
229 PhD Thesis Félix Juan Martínez Rivas
Hormonal regulation of FaPRE genes transcription
Considering that FaPRE1 is a ripening-related gene, its regulation by auxins and ABA
was studied. It has been previously reported that achenes removal from the surface of immature
G3-stage fruits decreases the inner concentration of auxins in the receptacle, which induces the
transcription of many ripening-related genes (Medina-Puche et al., 2014; Medina-Puche et al.,
2016). Similarly, the FaPRE1 transcription increased in de-achened receptacles (G3-achenes)
with respect to that observed in control receptacles (G3) (Fig. 5A). As expected, this induction
was abolished by the external application of the synthetic auxin IAA (Fig. 5A). Both results
suggest that FaPRE1 gene transcription was negatively regulated by the internal content of auxins
in immature receptacles. On the other hand, and supporting the previous data, the transcription of
FaPRE1 decreased in receptacles where ABA production was diminished either by the
inhibition of FaNCED1 enzymatic activity through the fruit treatment with NDGA or by the
transitory silencing of the FaNCED1 transcription (Fig. 5B) (Medina-Puche et al., 2014). This
differential hormonal expression pattern shows that, as in the case of many ripening-related genes,
FaPRE1 gene transcription is regulated, directly or indirectly, by the ratio ABA/auxins (Medina-
Puche et al., 2016).
Fig 5. Hormonal effects in FaPRE1 gene expression. A. Analysis by qRT-PCR of the effects of removing
achenes from G3 developing fruits on FaPRE1 gene expression. B. Analysis of FaPRE1 and FaNCED1
gene expression (bars) in G-W fruits treated with NDGA in both experimental situations; line indicates the
ABA content in the analyzed fruits. C. Analysis of the effects of gibberellins on FaPRE1 and FaGA2ox3
expression which was used as a control. The increase in the mRNA value was relative to the CONTROL

CHAPTER 1
230 Functional characterization of molecular regulatory mechanisms controlling the ripening in strawberry fruit
Ct value of each experiment. Values are mean ± SD of five independent experiments. Statistical significance
with respect to the reference sample was determined by the Student’s t-test: ***p < 0.001.
In A. thaliana, it has been previously demonstrated that gibberellic acid (GA) regulates
cell elongation through the increase of AtPRE1 transcription (Lee et al., 2006). On the other hand,
SlPRE2 also shows an important role in the cell enlargement along tomato fruit development
through GAs (Zhu et al., 2019). In strawberry fruit receptacles, although endogenous GA content
has been measured along receptacle development and ripening (Csukasi et al., 2011; Symons et
al., 2012), the relationship between GAs and fruit ripening has not been established. To determine
whether FaPRE1 transcription is under the control of GAs, strawberry fruit were injected with
gibberellic acid (GA3) or paclobutrazol (PBZ), a compound that blocks gibberellin biosynthesis.
Interestingly, in both cases, no significant changes were detected in FaPRE1 transcription
between treated fruits versus untreated control fruits while GA2ox3, a control gene related with
the GA degradation in strawberry fruit, was induced by GAs and repressed by PBZ treatment
respectively (Fig. 5C). Besides, no phenotypic changes were observed in treated fruits compared
to controls (data not shown). These results discard that gibberellins affect the FaPRE1 gene
transcription in ripe fruits. This fact was reinforced by the bioinformatic analysis of the pFaPRE1
promoter that showed the absence of GARE cis-regulatory sequences (DNA recognition sites of
gibberellin response) in this promoter (Fig. 6).
Fig 6. Schematic diagram of FvPRE1, FvPRE2 and FvPRE3 promoters from Fragaria vesca. The bar on
top indicates the length of the promoter fragment relative to the ATG codon. ABRE and GARE motif are
marked within their position in promoter sequence
On the contrary, in vitro strawberry plants treated with GA3 showed morphological
changes that resulted in elongated plants while PBZ treated plants displayed a dwarfed phenotype
(Fig. 7A). The analysis of FaPRE genes transcription in leaves, pedicel and root of the treated
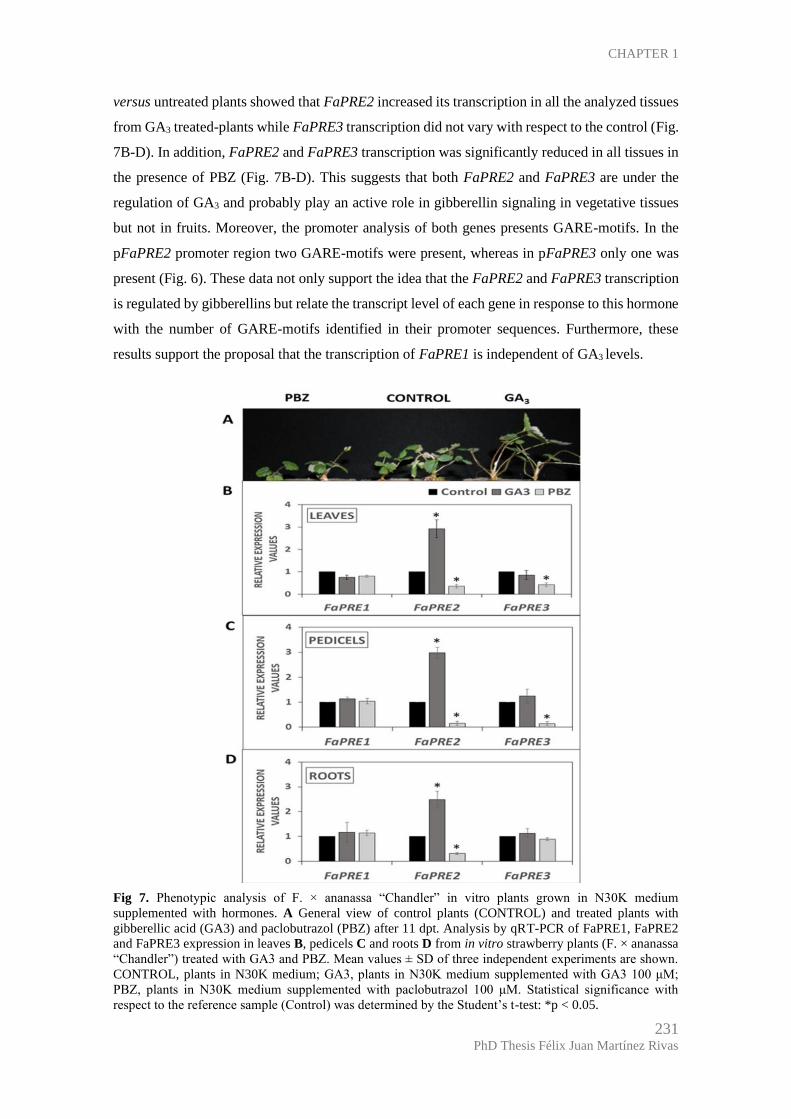
CHAPTER 1
231 PhD Thesis Félix Juan Martínez Rivas
versus untreated plants showed that FaPRE2 increased its transcription in all the analyzed tissues
from GA3 treated-plants while FaPRE3 transcription did not vary with respect to the control (Fig.
7B-D). In addition, FaPRE2 and FaPRE3 transcription was significantly reduced in all tissues in
the presence of PBZ (Fig. 7B-D). This suggests that both FaPRE2 and FaPRE3 are under the
regulation of GA3 and probably play an active role in gibberellin signaling in vegetative tissues
but not in fruits. Moreover, the promoter analysis of both genes presents GARE-motifs. In the
pFaPRE2 promoter region two GARE-motifs were present, whereas in pFaPRE3 only one was
present (Fig. 6). These data not only support the idea that the FaPRE2 and FaPRE3 transcription
is regulated by gibberellins but relate the transcript level of each gene in response to this hormone
with the number of GARE-motifs identified in their promoter sequences. Furthermore, these
results support the proposal that the transcription of FaPRE1 is independent of GA3 levels.
Fig 7. Phenotypic analysis of F. × ananassa “Chandler” in vitro plants grown in N30K medium
supplemented with hormones. A General view of control plants (CONTROL) and treated plants with
gibberellic acid (GA3) and paclobutrazol (PBZ) after 11 dpt. Analysis by qRT-PCR of FaPRE1, FaPRE2
and FaPRE3 expression in leaves B, pedicels C and roots D from in vitro strawberry plants (F. × ananassa
“Chandler”) treated with GA3 and PBZ. Mean values ± SD of three independent experiments are shown.
CONTROL, plants in N30K medium; GA3, plants in N30K medium supplemented with GA3 100 μM;
PBZ, plants in N30K medium supplemented with paclobutrazol 100 μM. Statistical significance with
respect to the reference sample (Control) was determined by the Student’s t-test: *p < 0.05.

CHAPTER 1
232 Functional characterization of molecular regulatory mechanisms controlling the ripening in strawberry fruit
High-throughput transcriptional analysis of transgenic receptacle where the FaPRE1
transcription was silenced
Considering that FaPRE1 is a transcriptional co-regulator, to determine the putative
functional role that FaPRE1 plays along the ripening process, we proceeded to transitorily silence
its transcription in ripened fruit by RNAi-FaPRE1 agroinfiltration approaches. RNAi-FaPRE1
silenced receptacles did not shown any phenotypical changes when compared to control
receptacles (data not shown). Using a custom-made oligo-based microarray platform (Medina-
Puche et al., 2016), a transcriptomic comparison between transgenic receptacle, where the
FaPRE1 transcription was silenced, versus control receptacles was carried out (Fig 8C,
Additional file 2) and the obtained data were validated by qRT-PCR (Table 1).
Table 1. Expression data of selected genes in FaPRE1-silenced receptacles obtained by QRT-PCR and
microarray analysis.
The transcriptomic results and their comparison with red receptacle transcriptomes
(Medina-Puche et al., 2016), showed that the transcription of 227 genes was down-regulated in
FaPRE1 silenced ripen receptacles, out of which 160 (70%) were also ripening-related genes
(Additional file 3, Fig 8A). By way of contrast, the transcription of 276 genes was up-regulated
in RNAi-FaPRE1 receptacles, out of whom 211 (76%) were overexpressed in immature
strawberry receptacles (Additional file 4, Fig 8 B).
Fold array Fold qRT-PCR Annotation
Transcription factors
gene24941 -6,935 -3,281 Zinc finger protein CONSTANS-LIKE 13 [Fragaria vesca subsp. vesca]
gene31413 -4,672 -5,880 R2R3-MYB transcription factor MYB10 [Fragaria x ananassa]
gene28720 -6,114 -4,080 Probable WRKY transcription factor 71 [Fragaria vesca subsp. vesca]
gene04424 -3,100 -3,290 NAC domain-containing protein 100 [Fragaria vesca subsp. vesca]
gene18656 -11,170 -4,545 Homeobox-leucine zipper protein ATHB-12-like [Fragaria vesca subsp. vesca]
gene28435 -3,541 -10,558 Emission of benzenoids II protein (FaEOBII) [Fragaria x ananassa subsp. ananassa]
Cell wall-related genes
gene31030 -4,158 -9,170 Probable rhamnogalacturonate lyase B (FaRGLyase1) [Fragaria vesca subsp. vesca]
gene21638 -12,174 -14,420 Polygalacturonase (FaPG1) [Fragaria x ananassa]
gene03442 -5,179 -1,360 Endoglucanase 11-like [Fragaria vesca subsp. vesca]
gene23967 -8,365 -4,250 Cellulose synthase-like protein H1 [Rosa chinensis]
Aroma-related genes
gene28407 -9,065 -3,219 Quinone oxidoreductase [Fragaria x ananassa]
gene18229 -6,058 -7,420 Short-chain dehydrogenase TIC 32, chloroplastic [Fragaria vesca subsp. vesca]
gene21391 -3,436 -9,040 Quinone oxidoreductase-like protein 2 homolog [Fragaria vesca subsp. vesca]
gene14837 -9,972 -8,299 O-acyltransferase WSD1-like [Rosa chinensis]
gene14266 -3,223 -6,929 NADPH:quinone oxidoreductase-like [Rosa chinensis]
gene07931 -13,792 -8,210 Alcohol acyl transferase (FaAAT2) [Fragaria x ananassa]
gene34009 -4,920 -3,862 Alcohol acyltransferase (FaAAT1) [Fragaria x ananassa]
gene24674 -6,310 -4,824 (3S,6E)-Nerolidol synthase 1, chloroplastic-like isoform X2 [Fragaria vesca subsp. vesca]
Phenylpropanoid-related genes
gene23367 -3,410 -7,990 Chalcone--flavonone isomerase 1
gene14611 -4,091 -6,730 Flavanone 3-hydroxylase [Fragaria x ananassa]
gene26825 -3,492 -9,346 Chalcone synthase [Fragaria x ananassa]
gene20725 -3,604 -2,290 Putative UDP-rhamnose:rhamnosyltransferase 1 [Rosa chinensis]
gene18732 -3,176 -2,451 Glutathione S-transferase [Rosa chinensis]
gene09427 -3,233 -7,265 Glutathione S-transferase [Rosa chinensis]
gene29482 -3,196 -4,230 Cinnamoyl-CoA reductase 1 isoform X2 [Populus trichocarpa]
gene25260 -17,792 -13,090 Eugenol synthase 2 [Fragaria x ananassa] (FaEGS2)
gene13540 -4,382 -6,400 Isoflavone reductase homolog [Rosa chinensis]

CHAPTER 1
233 PhD Thesis Félix Juan Martínez Rivas
Fig 8. Venn diagrams showing the number of genes down- regulated (A) and up-regulated (B) in strawberry
FaPRE1-RNAi receptacles respectively and up-regulated in strawberry red receptacle. C Analysis by qRT-
PCR of FaPRE1, FaPRE2 and FaPRE3 gene expression in strawberry transgenic receptacle agroinfiltrated
with the RNAi-FaPRE1 construct. Control: receptacle agroinfiltrated with the empty pFRN vector; Pool 1,
2 and 3: receptacles agroinfiltrated with FaPRE1-pFRN construct.
Among the ripening related genes whose transcription was downregulated in RNAi-
FaPRE1 ripen receptacles, we found transcription factors as FaMyb10 (gene31413) and FaEOBII
(gene28435) (Medina-Puche et al., 2014; Medina-Puche et al., 2015) (Additional files 2, 3). Both
TFs, with a regulatory role in the flavonoid/phenylpropanoid pathway during ripening, were
significantly down-regulated in transgenic receptacle with FaPRE1 transcription silenced (Table
1). The same behavior was shown by other genes whose function is described in strawberry during
its ripening process, such as gene21638 (FaPG1, polygalacturonase-1; (Quesada et al., 2009))
and gene31030 (FaRGlyaseI, rhamnogalacturonate lyase-1; (Molina-Hidalgo et al., 2013)),
which synthesize hydrolytic enzymes related with the cell wall dismantling during the ripening;
gene28407 (FaQR, Quinone oxidoreductase; (Fu et al., 2017)), gene07931 (FaAAT2, Alcohol
acyl transferase-2; (Cumplido-Laso et al., 2012)) and gene34009 (FaAAT1, Alcohol acyl
transferase-1; (Aharoni et al., 2000)), which synthesize enzymes involved in the biosynthesis of
esters that contribute to the final aroma of the fruit; and gene14611 (FaF3H, Flavanone 3-
hydroxylase; (Almeida et al., 2007)), gene20700 (FaCAD1, cinnamyl alcohol dehydrogenase-1;
(Blanco-Portales et al., 2002)) and gene25260 (FaEGS2, Eugenol synthase-2; (Araguez et al.,
2013)), related to the phenylpropanoids biosynthesis in strawberry ripe fruit (Table 2). All these
results seem to indicate that FaPRE1 gene might have a regulatory function in the strawberry
ripening process.

CHAPTER 1
234 Functional characterization of molecular regulatory mechanisms controlling the ripening in strawberry fruit
Table 2. Selected genes down-regulated in strawberry FaPRE1-RNAi fruits (fold change RNAi) and up-
regulated in strawberry red fruit (fold ripening). Gene ID and corresponding annotations as reported in
Fragaria vesca Genome Database (http://www.strawberrygenome.org)
On the other hand, the FaPRE1 silencing induced the expression of genes whose
transcription was higher in immature green receptacles, in the development and growth stages,
but not in ripening stages. Most of these genes are related with the metabolism and remodeling of
the cell wall, both vital processes for the fruit growth and development. Thus, the FaPRE1
silencing induced clearly the transcription of the gene01986 and gene02631 that encode a
Xyloglucan endotransglucosylase/hydrolase and a Xyloglucan glycosyltransferase respectively
(Table 3).
These genes could be related with the hydroxylation and reconnection of xyloglucan
fragments during the wall growth (Barnes and Anderson, 2018). Similarly, gene23429 (Pectate
lyase) and gene04435 (Expansin-A1) are also up-regulated in FaPRE1-RNAi receptacles. PLs
Gene ID v2.02 Gene ID v4.01Fold FaPRE1-
RNAip-value
Fold
ripeningp-value Annotation
gene31413 FvH4_1g22020 -4.672 0.0063 62,013 up 0.0003 R2R3-MYB transcription factor MYB10 [Fragaria x ananassa]
gene28720 FvH4_6g38370 -6.114 0.0010 24,423 up 0.0001 Probable WRKY transcription factor 71 [Fragaria vesca subsp. vesca]
gene28435 FvH4_6g50930 -3.541 0.0902 46,063 up 0.0001Emission of benzenoids II protein (FaEOBII) [Fragaria x ananassa
subsp. ananassa]
gene24494 FvH4_6g37880 -3.978 0.0018 5,938 up 0.0008 Floral homeotic protein AGAMOUS (similar to)
gene30404 FvH4_3g04920 -3.714 0.0043 3,350 up 0.0023 RING finger protein 141 (probable)
gene31030 FvH4_1g03300 -4.158 0.0017 12,019 up 0.0001Probable rhamnogalacturonate lyase B (FaRGLyase1) [Fragaria vesca
subsp. vesca]
gene21638 FvH4_6g41380 -12.174 0.0015 143,225 up 0.0001 Polygalacturonase (FaPG1) [Fragaria x ananassa]
gene03442 FvH4_3g23380 -5.179 0.0070 68,112 up 0.0001 Endoglucanase 11-like [Fragaria vesca subsp. vesca]
gene23967 FvH4_6g42840 -8.365 0.0023 2,095 up 0.0640 Cellulose synthase-like protein H1 [Rosa chinensis]
gene01127 FvH4_6g41740 -10.229 0.0012 14,391 up 0.0036 Exopolygalacturonase, Precursor (putative)
gene28407 FvH4_6g50700 -9.065 0.0017 24,311 up 0.0057 Quinone oxidoreductase [Fragaria x ananassa]
gene18229 FvH4_6g14170 -6.058 0.0020 9,481 up 0.0002Short-chain dehydrogenase TIC 32, chloroplastic [Fragaria vesca
subsp. vesca]
gene14837 FvH4_3g28240 -9.972 0.0065 936,377 up 0.0001 O-acyltransferase WSD1-like [Rosa chinensis]
gene14266 FvH4_7g03220 -3.223 0.0197 3,626 up 0.0013 NADPH:quinone oxidoreductase-like [Rosa chinensis]
gene07931 FvH4_3g38870 -13.792 0.0011 23,478 up 0.0377 Alcohol acyl transferase (FaAAT2) [Fragaria x ananassa]
gene34009 FvH4_7g18570 -4.92 0.0014 4,079 up 0.0013 Alcohol acyltransferase (FaAAT1) [Fragaria x ananassa]
gene34008 FvH4_7g18560 -3.533 0.0044 10,837 up 0.0006 BAHD acyltransferase At5g47980 (probable)
gene28406 FvH4_6g50700 -3.228 0.0105 2,304 up 0.0221Quinone oxidoreductase-like protein At1g23740, chloroplastic,
Precursor (similar to)
gene24674 FvH4_3g03050 -6.31 0.0019 10,657 up 0.0005(3S,6E)-Nerolidol synthase 1, chloroplastic-like isoform X2 [Fragaria
vesca subsp. vesca]
gene20698 FvH4_1g19270 -4.685 0.0018 10,549 up 0.0001 Probable mannitol dehydrogenase (putative)
gene31672 FvH4_1g27460 -4.427 0.0019 529,169 up 0.0001 glutathione S-transferase F11-like (FaGST1)
gene14611 FvH4_1g11810 -4.091 0.0149 2,749 up 0.0011 Flavanone 3-hydroxylase [Fragaria x ananassa]
gene26825 FvH4_7g01160 -3.492 0.0139 3,092 up 0.0044 Chalcone synthase [Fragaria x ananassa]
gene20725 FvH4_1g19390 -3.604 0.0023 10,787 up 0.0028 Putative UDP-rhamnose:rhamnosyltransferase 1 [Rosa chinensis]
gene29482 FvH4_7g01560 -3.196 0.0060 4,517 up 0.0012 Cinnamoyl-CoA reductase 1 isoform X2 [Populus trichocarpa]
gene25260 FvH4_2g09110 -17.792 0.0016 207,001 up 0.0001 Eugenol synthase 2 [Fragaria x ananassa] (FaEGS2)
gene20700 FvH4_1g19270 -5.07 0.0059 11,743 up 0.0001 Cinnamyl alcohol dehydrogenase-1 (FaCAD1)
gene20698 FvH4_1g19270 -4.685 0.0018 10,549 up 0.0001 Probable mannitol dehydrogenase (putative)
gene26353 FvH4_2g05620 -4.482 0.0082 3,907 up 0.0009 Anthocyanin 3'-O-beta-glucosyltransferase (3'GT) (putative)
gene29483 FvH4_7g01590 -6.681 0.0041 6,188 up 0.0003 Dihydroflavonol-4-reductase (DFR) (probable)
gene33976 FvH4_6g40060 -8.451 0.0021 7,217 up 0.0037 BAHD acyltransferase At5g47980 (probable)
gene23793 FvH4_3g07080 -7.991 0.0011 7,836 up 0.0005 Aquaporin NIP1-1 (similar to)
gene23794 FvH4_3g07080 -7.664 0.0010 8,329 up 0.0005 Aquaporin NIP1-2 (AtNIP1) (similar to)
gene00277 FvH4_3g07080 -6.197 0.0010 6,030 up 0.0004 Aquaporin NIP1-2 (AtNIP1) (similar to)
gene34011 FvH4_7g18640 -5.525 0.0014 4,134 up 0.0331 BAHD acyltransferase At5g47980 (probable)
gene14841 FvH4_3g28210 -5.884 0.0038 6,858 up 0.0007 Gibberellin 3-beta-dioxygenase 4 (AtGA3ox4) (probable)
gene07028 FvH4_4g18550 -4.129 0.0021 106,577 up 0.0001 Multidrug and toxin extrusion protein 1 (MATE-1) (probable)
gene00616 FvH4_4g35840 -2.859 0.0223 2,157 up 0.1670 Probable NAD(P)H-dependent oxidoreductase 1
Miscellaneous
Transcription factors
Cell wall-related genes
Phenylpropanoid-related genes
Aroma-related genes

CHAPTER 1
235 PhD Thesis Félix Juan Martínez Rivas
and Expansins have been related to cell elongation and cell wall extensibility (Barnes and
Anderson, 2018) (Table 3). In addition, the transcription of gene20426 and gene26607 was also
induced in the same receptacles. Both genes encode beta-glucosidases, enzymes that are
potentially involved in cellulose degradation (Barnes and Anderson, 2018) (Table 3). Otherwise,
the transcription of gene09384, gene11861 and gene24005, that encode an Auxin efflux carrier,
an Auxin-responsive protein IAA27, and an Indole-3-acetic acid-amido synthetase GH3.1
respectively, was additionally over-expressed in FaPRE1-RNAi receptacles (Table 2). These
three genes are related to the response to auxins which is the hormone that regulates the strawberry
receptacle growth and development (Perkins-Veazie, 1995).
Table 3. Selected genes up-regulated in strawberry FaPRE1-RNAi receptacles (fold FaPRE1-RNAi) and
down-regulated in strawberry red receptacles (fold ripening). Gene ID and corresponding annotations as
reported in Fragaria vesca Genome Database (http://www.strawberrygenome.org/)
Discussion
In this article, we present the functional characterization of the FaPRE1, a gene belonging
to the strawberry FaPRE family (FaPRE1, FaPRE2 and FaPRE3), which are the putative
orthologous of the AtPRE genes from Arabidopsis thaliana
FaPRE1 gene was classified as member of the subfamily of atypical bHLHs by lacking a
DNA binding domain. In this subfamily are also included both the ILI-1 gene from rice (Ikeda et
Gene ID v2.02 Gene ID v4.01Fold FaPRE1-
RNAip-value Fold ripening p-value Annotation
gene34043 FvH4_3g44790 3,166 0,0117 -2,83 0,0234 Disease resistance response protein 206 (probable)
gene07623 FvH4_2g01540 20,061 0,0028 -7,528 0,0268 Thaumatin-like protein 1, Precursor (similar to)
gene29468 FvH4_7g01430 14,096 0,0105 -2,341 0,0050 Polyamine oxidase (PAO)
gene23429 FvH4_7g18400 9,278 0,0038 -8,326 0,0005 Pectate lyase 12
gene20426 FvH4_2g08690 4,873 0,0024 -2,571 0,0116 Glucan endo-1,3-beta-glucosidase 7 ((1->3)-beta-glucanase 7)
gene14102 FvH4_3g36000 5,079 0,0070 -2,482 0,0094 fasciclin-like arabinogalactan protein
gene18252 FvH4_6g20860 11,107 0,0012 -3,61 0,0038 Fasciclin-like arabinogalactan protein 17
gene15268 FvH4_3g29120 19,349 0,0017 -21,293 0,0004 FASCICLIN-like arabinogalactan protein
gene26607 FvH4_7g22480 11,657 0,0010 -4,075 0,0013 Glucan endo-1,3-beta-glucosidase
gene04435 FvH4_6g48210 6,986 0,0025 -7,725 0,0002 Expansin-A1
gene01986 FvH4_6g43860 14,122 0,0247 -7,025 0,0028 Xyloglucan endotransglucosylase/hydrolase protein 9
gene32082 FvH4_5g04440 7,881 0,0012 -2,172 0,0022 Polygalacturonase
gene29850 FvH4_4g10050 4,234 0,0016 -2,24 0,0349 UDP-glucuronate 4-epimerase 1
gene02631 FvH4_2g32570 5,374 0,0014 -2,845 0,0092 Xyloglucan glycosyltransferase 12
gene09384 FvH4_5g17310 25,473 0,0054 -28,871 0,0007 auxin efflux carrier
gene11861 FvH4_1g05630 7,803 0,0011 -2,256 0,0466 auxin-responsive protein IAA27
gene10566 FvH4_2g25330 9,006 0,0089 -11,331 0,0053 Putative indole-3-acetic acid-amido synthetase GH3.9 (AtGH3-9)
gene30958 FvH4_1g04080 8,532 0,0011 -4,069 0,0455 DELLA protein GAI
gene06210 FvH4_4g34110 3,242 0,0026 -2,707 0,0125 GAI1
gene24005 FvH4_1g16980 26,543 0,0193 -52,235 0,0007 Indole-3-acetic acid-amido synthetase GH3.1
gene15877 FvH4_6g27940 14,144 0,0066 -9,729 0,0022 4-coumarate--CoA ligase 2 (4CL 2)
gene24665 FvH4_3g02980 3,069 0,0402 -11,452 0,0003 Leucoanthocyanidin reductase (LAR)
gene34393 FvH4_3g05830 4,36 0,0014 -13,128 0,0006 UDP-rhamnose:rhamnosyltransferase 1
gene03834 FvH4_6g48750 9,664 0,0060 -5,902 0,0054 isoflavone-7-O-beta-glucoside 6''-O-malonyltransferase
gene12308 FvH4_4g06830 3,167 0,0036 -2,967 0,0121 Probable WRKY transcription factor 11
gene28958 FvH4_3g09890 3,823 0,0028 -2,069 0,0293 BTB/POZ domain-containing protein At1g30440 (similar to)
gene01554 FvH4_1g17280 8,053 0,0023 -3,273 0,0007 BTB/POZ domain-containing protein At5g48800 (probable)
gene23712 FvH4_2g15440 8,28 0,0010 -2,367 0,0266 Aquaporin PIP2-7
gene25767 FvH4_6g31970 16,648 0,0023 -2,439 0,0053 Aquaporin (TIP2;1)
Transporter activity
Cell wall-related genes
Hormones
Phenylpropanoids related genes
Transcription factors
Biotic stress/Plant defense

CHAPTER 1
236 Functional characterization of molecular regulatory mechanisms controlling the ripening in strawberry fruit
al., 2013), SlPRE2 from tomato (Zhu et al., 2017), as well as the members of the Arabidopsis
PRE family (Carretero-Paulet et al., 2010) (Figure 2, 9, Additional file 1). AtPRE1 (Lee et al.,
2006), ATBS1 (Wang et al., 2009), PGL1 and APG (Heang and Sassa, 2012a; Heang and Sassa,
2012b), and IBH1 (Ikeda et al., 2012) which are involved in transcriptional regulatory processes
as repressors, through the blockage by heterodimerization of bHLH transcription factors. As
expected by bioinformatic analysis, a nuclear localization of FaPRE1 (Fig. 3D, 4) supports their
relationship with transcriptional regulatory processes. According to our experimental data the
FaPRE1 could play a similar role in strawberry fruit ripening process.
Fig 9. Phylogenetic tree of some functionally characterized atypical HLH transcription factors. The length
of each pair of branches represents the distance between sequence pairs, while the units at the bottom of
the tree indicate the number of substitution events. FaPRE1 (KM655802; Fragaria x ananassa); FaPRE2
(XM_004296502; F. x ananassa); FaPRE3 (XM_004297270; F. x ananassa); SlStyle2.1 (NM_001247361;
Solanum lycopersicum) (Chen et al., 2007); SlPRE2 (XP_004233358.1; S. lycopersicum) (Zhu et al., 2019);
AtPRE1 (At5g39860; Arabidopsis thaliana) (Lee et al., 2006); BNQ3 (NP_190355.2; A. thaliana) (Mara
et al., 2010); KIDARI (NP_849712; A. thaliana) (Hyun and Lee, 2006); ATBS1 (NP_177590; A. thaliana)
(Ikeda et al., 2013); AtPRE3 (At1g74500; A. thaliana) (Castelain et al., 2012); PGL2 (Os02g0747900;
Oryza sativa) (Heang and Sassa, 2012a); AIF2 (At3g06590; A. thaliana) (Kim et al., 2017); AIF3
(At3g17100; A. thaliana) (Kim et al., 2017); AIF4 (At1g09250; A. thaliana) (Kim et al., 2017); PAR1
(At2g42870; A. thaliana) (Hao et al., 2012); PAR2 (At3g58850; A. thaliana) (Hao et al., 2012). Sequences
were aligned using MegAlign (MegAlign 5.00; DNASTAR).
FaPRE1 and fruit ripening
FaPRE1 presented an expression model characteristic of a ripening-related gene, with
transcription values negligible in both immature receptacles and vegetative tissues, but high in
ripened stages. In strawberry, this is a common transcription pattern that is shared by the vast
majority of ripening-related genes (Medina-Puche et al., 2016). This model of expression is
characterized by being a) ripening-related; b) receptacle-specific; c) negatively regulated by
auxins, and d) induced by ABA. FaPRE1 follows these criteria since the amount of FaPRE1
transcript increases along receptacle ripening (Fig. 1C) and is preferentially expressed in mature

CHAPTER 1
237 PhD Thesis Félix Juan Martínez Rivas
red receptacle (Fig. 1B-C). Otherwise, the FaPRE1 transcription was also negatively regulated
by auxins but positively by ABA (Fig. 5A-B).
The spatial-temporal and the hormonal transcription profile of FaPRE1 are in agreement
with the above-mentioned criteria and are also in accordance with the proposal of (Perkins-
Veazie, 1995), who suggested that the ABA/auxins ratio determines the transition from the
development to the ripening stage in the strawberry receptacle. Thus, auxins would be produced
in immature achenes and released to the receptacle promoting its growth but preventing premature
ripening. Afterwards, the auxin production would be arrested and subsequently the endogenous
biosynthesis of ABA in the receptacle would be stimulated increasing the ABA/auxins ratio and
thus promoting the ripening process (Perkins-Veazie, 1995). This proposal was experimentally
demonstrated recently (Chai et al., 2011; Jia et al., 2011; Medina-Puche et al., 2014). A similar
transcription pattern has been found in other ripening-related genes that encode transcription
factors such as FaMYB10 (Medina-Puche et al., 2014), FaEOBII (Medina-Puche et al., 2015) or
FaDOF2 (Molina-Hidalgo et al., 2017). Furthermore, it has been reported that PRE-like genes
are under the positive regulation of GAs (Lee et al., 2006; Bai et al., 2012). That is not the case
of the FaPRE1 gene since the treatment of receptacles with GA3 did not result in an increase of
its expression, unlike the GA2ox3 control gene, discarding any involvement of this hormone in
the regulation of FaPRE1 transcription in ripe strawberry fruit (Fig. 5C). This assumption is
reinforced by the absence of regulatory sequences response to GAs (GARE-motifs) in the
pFvPRE1 promoter (Fig. 6). However, these motifs are present in the pFvPRE2 and pFvPRE3
promoters, two genes that have a specific expression of vegetative tissues. All these expression
data suggest that FaPRE1 plays a different physiological role than FaPRE2 and FaPRE3, mainly
focused on the process of fruit ripening.
In soft fruits, with the exception of tomato, the functional role played by PRE-like genes
during the fruit ripening process has not been studied. Very recently, the relationship between a
PRE-like atypical HLH gene (SlPRE2) and the growth of tomato fruit has been established (Zhu
et al., 2017; Zhu et al., 2019). Thus, in tomato immature fruit, SlPRE2 seems to have a repressor
role of chlorophyll accumulation and chloroplast development. In addition, it represses the
transcription of genes involved in the carotenoid’s biosynthesis during the fruit ripening process
(Zhu et al., 2017). However, SlPRE2 presents a different expression pattern from that observed
for FaPRE1. Thus, while SlPRE2 was expressed in both fruit and vegetative tissues as root, young
leaf, mature leaf, senescent leaf, flower and sepal, the FaPRE1 transcription was restricted to the
ripened receptacle. In tomato vegetative tissues, the highest transcription levels were found in
young leaf and in flowers where the elongation processes are more active. This is not the case of
FaPRE1, whose transcription is mainly limited to the final stages of receptacle ripening, in which
the processes of cellular elongation are not significant. Besides, SlPRE2 was expressed strongly
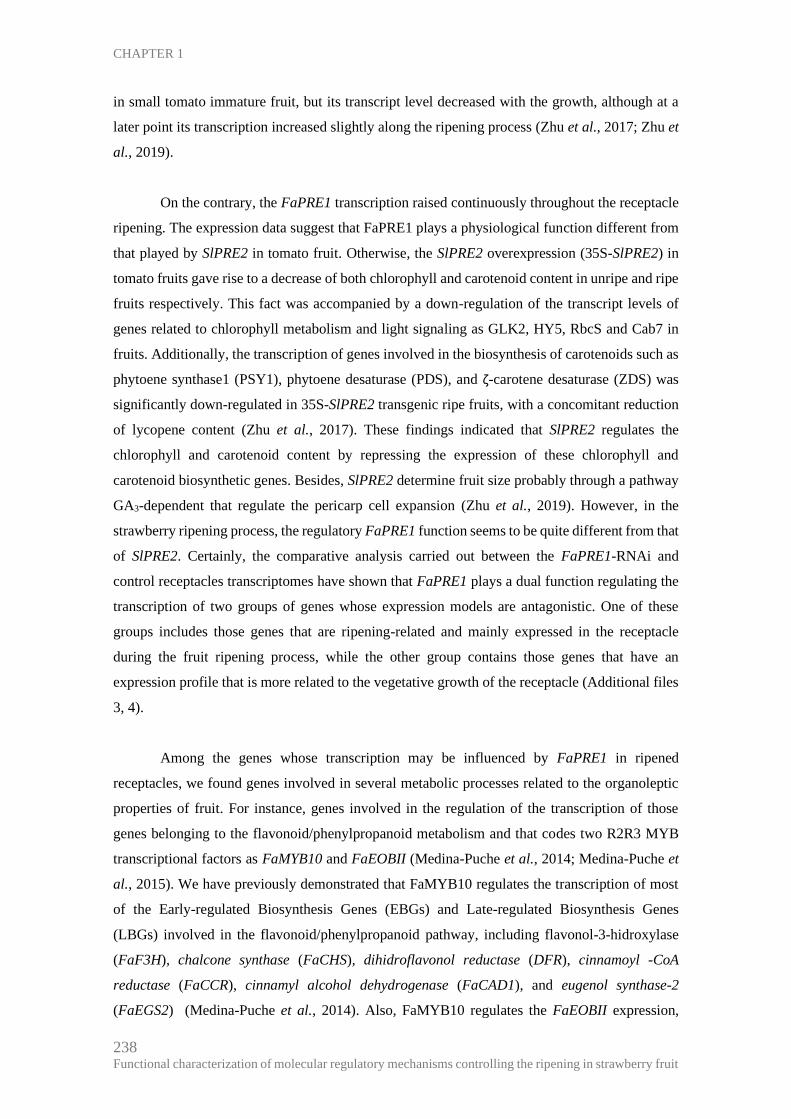
CHAPTER 1
238 Functional characterization of molecular regulatory mechanisms controlling the ripening in strawberry fruit
in small tomato immature fruit, but its transcript level decreased with the growth, although at a
later point its transcription increased slightly along the ripening process (Zhu et al., 2017; Zhu et
al., 2019).
On the contrary, the FaPRE1 transcription raised continuously throughout the receptacle
ripening. The expression data suggest that FaPRE1 plays a physiological function different from
that played by SlPRE2 in tomato fruit. Otherwise, the SlPRE2 overexpression (35S-SlPRE2) in
tomato fruits gave rise to a decrease of both chlorophyll and carotenoid content in unripe and ripe
fruits respectively. This fact was accompanied by a down-regulation of the transcript levels of
genes related to chlorophyll metabolism and light signaling as GLK2, HY5, RbcS and Cab7 in
fruits. Additionally, the transcription of genes involved in the biosynthesis of carotenoids such as
phytoene synthase1 (PSY1), phytoene desaturase (PDS), and ζ-carotene desaturase (ZDS) was
significantly down-regulated in 35S-SlPRE2 transgenic ripe fruits, with a concomitant reduction
of lycopene content (Zhu et al., 2017). These findings indicated that SlPRE2 regulates the
chlorophyll and carotenoid content by repressing the expression of these chlorophyll and
carotenoid biosynthetic genes. Besides, SlPRE2 determine fruit size probably through a pathway
GA3-dependent that regulate the pericarp cell expansion (Zhu et al., 2019). However, in the
strawberry ripening process, the regulatory FaPRE1 function seems to be quite different from that
of SlPRE2. Certainly, the comparative analysis carried out between the FaPRE1-RNAi and
control receptacles transcriptomes have shown that FaPRE1 plays a dual function regulating the
transcription of two groups of genes whose expression models are antagonistic. One of these
groups includes those genes that are ripening-related and mainly expressed in the receptacle
during the fruit ripening process, while the other group contains those genes that have an
expression profile that is more related to the vegetative growth of the receptacle (Additional files
3, 4).
Among the genes whose transcription may be influenced by FaPRE1 in ripened
receptacles, we found genes involved in several metabolic processes related to the organoleptic
properties of fruit. For instance, genes involved in the regulation of the transcription of those
genes belonging to the flavonoid/phenylpropanoid metabolism and that codes two R2R3 MYB
transcriptional factors as FaMYB10 and FaEOBII (Medina-Puche et al., 2014; Medina-Puche et
al., 2015). We have previously demonstrated that FaMYB10 regulates the transcription of most
of the Early-regulated Biosynthesis Genes (EBGs) and Late-regulated Biosynthesis Genes
(LBGs) involved in the flavonoid/phenylpropanoid pathway, including flavonol-3-hidroxylase
(FaF3H), chalcone synthase (FaCHS), dihidroflavonol reductase (DFR), cinnamoyl -CoA
reductase (FaCCR), cinnamyl alcohol dehydrogenase (FaCAD1), and eugenol synthase-2
(FaEGS2) (Medina-Puche et al., 2014). Also, FaMYB10 regulates the FaEOBII expression,

CHAPTER 1
239 PhD Thesis Félix Juan Martínez Rivas
which in turn regulates the transcription of the gene that encodes the FaEGS2, an enzyme involved
in the biosynthesis of the phenylpropanoid volatile eugenol (Araguez et al., 2013; Medina-Puche
et al., 2015). The transcription of all these genes was also down-regulated in FaPRE1-RNAi
receptacles (Table 4).
Table 4. Selected genes down-regulated in strawberry FaPRE1-RNAi receptacles (Fold change FaPRE1-
RNAi), FaMYB10-RNAi receptacles (Fold change FaMYB10-RNAi) and NDGA-treatment receptacles and
up-regulated in strawberry red receptacle (Fold change ripening). Gene ID and corresponding annotations
as reported in Fragaria vesca Genome Database (http://www.strawberrygenome.org/) (Shulaev et al.,
2011). FaMYB10-RNAi data are extracted from (Medina-Puche et al., 2014) while NDGA data are
extracted from (Medina-Puche et al., 2016).
These results suggest that FaPRE1 would play an important regulatory role of the
phenylpropanoids pathway, probably through the regulation of the FaMYB10 transcription
through the sequestering of a bHLH whose function would be to suppress the gene expression of
this FT in immature receptacle. In addition, the expression of cell wall-related genes as FaPG1
and FaRGlyaseI (Quesada et al., 2009; Molina-Hidalgo et al., 2013), that has been previously
demonstrated that are involved in the cell wall disassembly, was also down-regulated in RNAi-
FaPRE1 receptacles (Table 2).
The same behavior was shown by other genes whose function has been described in
strawberry during its ripening process and related with aroma production. For instance, one of the
genes whose transcription was down-regulated in RNAi-FaPRE1 strawberry receptacles was the
ripening-related FaQR gene, that encodes a quinone oxidoreductase. We have demonstrated that
this enzyme is crucial for the furaneol (4-hydroxy-2,5-dimethyl-3(2H)-furanone; HDMF)
biosynthesis, one of the most important components of the strawberry fruit aroma (Raab et al.,
2006). Besides, the transcription of genes which encode two enzymes involved in the biosynthesis
of the key esters that contribute to the final aroma of the ripened fruit, such as FaAAT1 (Alcohol
acyl transferase-1) and FaAAT2 (Alcohol acyl transferase-2) (Aharoni et al., 2000; Cumplido-
Laso et al., 2012), was also down-regulated in RNAi-FaPRE1 strawberry receptacles. All these
genes share a common expression profile as receptacle ripening-related genes (Table 2). In
Gene ID
v2.02Gene ID v4.01
Fold
FaPRE1-
RNAi
p-valueFold
ripeningp-value
Fold
FaMYB10-
RNAi
p-valueFold
NDGAp-value Annotation
Blast Top Hit
Accession
gene14611 FvH4_1g11810 -4,091 0,0149 2,749 0,0011 -111,839 0,0014 -44,072 0,00001 Flavanone 3-hydroxylase AAU04792.1
gene20700 FvH4_1g19270 -5,070 0,0012 11,743 0,0001 -37,965 0,0011 -26,731 0,00000Cinnamyl alcohol
dehydrogenase (FaCAD1)Q9ZRF1
gene25260 FvH4_2g09110 -17,793 0,0016 207,001 0,0001 -8,58 0,0004 -16,476 0,00001Eugenol synthase 2
(FaEGS2)AGV02008.1
gene26826 FvH4_7g01160 -3,492 0,0120 3,019 0,0051 -22,224 0,0010 -5,265 0,00000 Chalcone synthase BAE17122
gene28435 FvH4_6g50930 -3,541 0,0902 46,063 0,0001 -3,58 0,0017 -4,173 0,00049Emission of bencenoids II
(FaEOBII )AJZ73158
gene29482 FvH4_7g01560 -3,196 0,0060 4,517 0,0012 -15,476 0,0021 -2,564 0,00006 Cinnamoyl CoA reductase AAP46143.1
gene31413 FvH4_1g22020 -4,672 0,0063 62,013 0,0003 -419,443 0,0011 -5,166 0,00001R2R3 MYB transcription
factor (FaMYB10)ABX79947

CHAPTER 1
240 Functional characterization of molecular regulatory mechanisms controlling the ripening in strawberry fruit
general, all these results seem to indicate that FaPRE1 gene has a regulatory function in the
strawberry ripening process.
As mentioned above, PREs are HLH proteins which lack the basic domain required for
DNA binding but dimerize with DNA binding factors bHLH to inhibit their DNA binding ability
(Lee et al., 2006; Mara et al., 2010; Zhu et al., 2017; Zheng et al., 2019). In this sense, we
hypothesize that FaPRE1 might exert its transcriptional regulatory properties through the
formation of an inactive FaPRE1 HLH: bHLHa heterodimeric complex that would withdraw the
amount of bHLHa available to form a homo or heterodimeric transcriptionally active complex.
We propose that this heterodimerization should inhibit the formation of a putative heterodimeric
(bHLHa:bHLHb) transcriptional activator. This complex would up-regulate the transcription of
non-ripening related genes that are expressed specifically in the immature receptacle. These genes
are related to the growth and development stages and must be silenced in ripened receptacles. On
the contrary, in ripened receptacles, FaPRE1 would inhibit the formation of another bHLH
heterodimeric negative regulatory complex that determines the down regulation of ripening-
related genes, but in non-ripened immature receptacles. This repressor would be constituted by a
heterodimer of two DNA binding basic helix-loop-helices (bHLHa:bHLHc). Thus, the formation
of a repressor complex in ripened receptacle would be inhibited by sequestering one of the
monomer partners (bHLHa). In this way, the repression of ripening-related genes would be
avoided thus facilitating its expression.
A similar but not identical mechanism of interaction between FaPRE-like genes and
bHLHs in response to different signals, including light, temperature, BRs and GAs, has been
described (Bai et al., 2012; Ikeda et al., 2012; Ikeda et al., 2013). For instance, three PRE genes
(PRE1, PRE3/ATBS1, PRE6/KIDARI), positively regulate organ elongation in response to GAs,
BRs and light signaling (Hyun and Lee, 2006; Lee et al., 2006; Wang et al., 2009) through its
interaction with other bHLH transcription factors that negatively regulate cell elongation, as
AtIBH1, AIFs and HFR1 (Hyun and Lee, 2006; Wang et al., 2009; Zhang et al., 2009). In
Arabidopsis thaliana, a triantagonistic bHLH system cascade negatively regulates cell elongation
in response to multiple hormonal and environmental signaling pathways (Bai et al., 2012). In this
system, the homodimer HBI1:HBI1 is directly bound to the promoter of two EXPANSIN genes
activating its transcription. Otherwise, the interaction of IBH1 with HBI1 inhibits, by
heterodimerization, the production of the activator homodimer which in turn determines the
repression of both EXPANSIN genes. In addition, PRE1 activates the DNA binding capacity of
HBI1 by sequestering its inhibitor IBH1 throughout the PRE1:IBH1 heterodimer formation (Bai
et al., 2012). Also, this triantagonistic system has been demonstrated in the interactions between
the bHLH Activator of Cell Elongation 1 (ACE1) and two atypical HLH proteins, AtIBH1 and
PRE1, in Arabidopsis (Ikeda et al., 2012) and between ACE1 and ATBS1 interaction factors

CHAPTER 1
241 PhD Thesis Félix Juan Martínez Rivas
(AIF2, AIF3 and AIF4) or PRE1 in response to BRs and light (Ikeda et al., 2013). Likewise,
through a similar regulatory system, the ARF/BZR/PIF interaction stimulates the hypocotyl
elongation in Arabidopsis (Oh et al., 2014).
Apparently, in strawberry, FaPRE1 does not play a similar function to that of SlPRE2
and cannot be considered an orthologous gene. However, its function is clearly involved in the
fruit ripening process. In fact, the genes regulated by FaPRE1 are different to those regulated by
SlPRE2.
Conclusions
In summary, this work presents, for the first time in strawberry ripened fruits,
experimental data that support an important novel function for the atypical HLH FaPRE1 during
fruit ripening. FaPRE1 antagonistically coordinated the transcription of genes related to both
receptacle growth and ripening. Thus FaPRE1, in ripened receptacle, represses the transcription
of receptacle growth promoting genes while activating the transcription of those genes related to
the receptacle ripening process.
Methods
Plant material
Fragaria × ananassa Duch. (cv. Camarosa) plants were grown under field conditions in
Huelva (S.W. Spain). Strawberry fruits and achenes were harvested at different stages of
development and ripening: small-sized green fruits (G1, 2-3 g), middle-sized green fruits (G2, 3-
5 g), full-sized green fruits (G3, 4-7 g), white fruits (W, 5-8 g), full-ripe red fruits (R, 10-20 g),
over-ripe fruits (OR, 10-20 g) and senescent fruits (SN, 10-20 g). Flowers, floral buds, petals and
vegetative tissues such as pedicels and expanding leaves were also collected. Nicotiana
benthamiana and strawberry plants (F. × ananassa Duch. cv. Elsanta) used for infiltration were
grown in plant chamber at 25 ºC, 10.000 lux and 80 % humidity. All tissues analyzed were
immediately frozen in liquid nitrogen and then stored at -80 oC. The strawberry plants were
acquired in “Viveros California S.L.” (Huelva, Spain) while Nicotiana benthamiana seeds were
a gift from Dr. Muñoz-Alamillo.
Hormonal treatments
With the objective to eliminate the auxins of the fruit, the achenes were carefully removed
from two sets of 50 full-sized green fruits (G3) each, in accordance with (Medina-Puche et al.,
2014). Briefly, one set of de-achened G3 fruits was covered with lanolin paste containing indole-
3-acetic acid (IAA) 1 mM in 1 % (w/v) dimethyl sulphoxide (DMSO). The other group of de-

CHAPTER 1
242 Functional characterization of molecular regulatory mechanisms controlling the ripening in strawberry fruit
achened fruits (control group) was covered with the same paste but without IAA. Sample
collection and analysis were performed following the instructions by (Medina-Puche et al., 2014).
For the gibberellic acid (GA3) treatment, strawberry fruits were injected at G2 stage with
paclobutrazol (PBZ) 100 µM and GA3100 µM. PBZ is a triazole that slows plant growth blocking
the synthesis of gibberellins (BUTCHER et al., 1990). Control fruits were injected with water.
For each treatment, 30 fruits were infiltrated. Fruits were harvested after 24 hours of
experimentation. In parallel, in vitro strawberry plants (F. × ananassa Duch. cv. Chandler),
micropropagated in a N30K medium supplemented with 2.2 mM kinetin (Barceló et al., 1998),
were treated with gibberellic acid. Two groups of six independent clones were grown in MS
medium supplemented with GA3 (100 µM) and PBZ (100 µM), respectively, and kept in a growth
chamber for 11 days prior harvest. Untreated plants were used as control. All samples and tissues
after collection were immediately frozen in liquid nitrogen and then stored at -80 ºC.
In order to block ABA biosynthesis, 20 strawberry fruits (F. x ananassa cv. Elsanta) in
G3 stage of development were injected with nordihydroguaiaretic acid (NDGA) 100 µM. NDGA
is an ideal inhibitor of the 9-cis-epoxycarotenoid dioxygenase (NCED) enzyme activity
(Creelman et al., 1992) and it has previously been demonstrated to decrease endogenous ABA
concentration in ripe fruit receptacle (Medina-Puche et al., 2014). The fruits were injected with
1-2 ml of NDGA solution or water (control fruits) and harvested after 8d of treatment, frozen in
liquid nitrogen and stored at -80 ºC until use. These samples were used for measurement of the
ABA content and relative expression of FaPREs and FaNCED1 genes.
Quantification of abscisic acid content
Deuterated abscisic acid (dABA) was used as an internal standard. Both the dABA
preparation and ABA extraction from strawberry samples were performed following the
instructions by (Medina-Puche et al., 2014). In order to determine the ABA amount, a HPLC-MS
system (VARIAN 1200L Triple Quadrupole) was used with a column (150 x 2.1 mm i.d.
Phenomenex C18 with 3 µm particle) (California, USA). The conditions and procedure used for
the analysis were the same described by (Medina-Puche et al., 2014).
Bioinformatic resources
Resources of National Center for Biotechnology Information (NCBI) (Bethesda, MD)
(http://www.ncbi.nlm.nih.gov) and the European Bioinformatics Institute server (EBI)
(http://www.ebi.ac.uk/) were used for in silico study of FaPRE genes sequences against
databases. Multiple sequence alignment and phylogenetic tree construction were performed with

CHAPTER 1
243 PhD Thesis Félix Juan Martínez Rivas
the EBI ClustalW2 program or the MegAlign program (from the Lasergene DNASTAR software
package) as well as the FigTree program (http://tree.bio.ed.ac.uk/software/figtree/). The
prediction of domains and functional sites was performed with an InterProScan database (version
4.8) (www.ebi.ac.uk/Tools/pfa/iprscan/) and the prediction of protein localization sites in cells
was performed with a Plant-mPLoc computer program (http://www.csbio.sjtu.edu.cn/cgi-
bin/PlantmPLoc.cgi). BlastN was also used to localize the genes position in F. vesca and F. x
ananassa genome at a GDR databank (https://rosaceae.org). Available F. vesca (v 2.0.a2) genome
(Li et al., 2017) were used to determine FaPRE promoter sequences. The promoter analysis of
FaPRE genes were performed with the PlantCARE database
(http://bioinformatics.psb.ugent.be/webtools/plantcare/html/).
Generation of RNAi constructs and transfection of strawberry fruits by agroinfiltration
A fragment of 626-pb (RNAi-fragment) from FaPRE1 cDNA was PCR amplified and
cloned into pCR®8/GW/TOPO® vector (Invitrogen). Later, the RNAi-fragment was transferred to
the pFRN binary vector (courtesy of Marten Denekamp) by LR recombination. The RNAi
construct (pFRN-FaPRE1) generated was tested by sequencing and restriction analyses prior to
transformation of strawberry fruit. The RNAi-FaPRE1 construct was transformed into
Agrobacterium tumefaciens strain AGL1. RNAi-construct was used to obtain transient transgenic
strawberry fruit with the FaPRE1 expression silenced by agroinfiltration (Hoffmann et al., 2006).
The injection of RNAi-construct was performed with a syringe into the base on the entire fruits
attached to the strawberry plant following the indications of (Hoffmann et al., 2006). 30–40 fruits
were inoculated and analysed of a total of 15–25 strawberry plants.
Subcellular localization analysis
The construct used for localization studies was derived from the binary vector pK7WGF2,
which allows for the N-terminal fusion of the selected protein with GFP (Karimi et al., 2002).
The 282-bp CDS of the strawberry FaPRE1 gene was amplified from F. x ananassa cDNA using
specific primers (Table 5) and cloned into the pDONRTM221. The PCR-product was then
transferred to the pK7WGF2 destination vector, resulting in 35S-GFP-FaPRE1 fusion construct.
The generated construct was tested through sequencing prior to N. benthamiana leaves
agroinfiltration. The procedures used for N. benthamiana agroinfiltration have been previously
described (Medina-Puche et al., 2015; Molina-Hidalgo et al., 2015). N. benthamiana plants were
agroinfiltrated with clones to express FaPRE1-GFP and GFP. The samples were imaged two days
after agroinfiltration on a Leica TCS SP8 point scanning confocal microscope using the pre-set
settings for GFP with Ex:488nm, Em:500-550nm. For nuclear staining, samples were stained with
a solution of 40 µg/ml DAPI 10 minutes before imaging with Ex:405 nm, Em: 448-525 nm.

CHAPTER 1
244 Functional characterization of molecular regulatory mechanisms controlling the ripening in strawberry fruit
Table 5. Primer sequences used in this work. Fw: forward; Rv: reverse. Up: upper; Low: lower.
RNA isolation
Total RNA was isolated from three independent pools (10 fruits per pool) of strawberry
fruits at different development stages and plant vegetative tissues following the indications of
(Asif et al., 2000). When strawberry fruits were used, the achenes were always removed before
extracting the RNA from the samples. In any case, the RNA extracted was always incubated with
DNase I (RNase free) (Invitrogen) to eliminate the genomic DNA contamination following
manufacturer´s instructions. The RNA quality and integrity were checked using an Agilent 2100
Bioanalyzer (Agilent Technologies, Deutschland). Only samples with a RIN value ≥ 8 were used
for subsequent transcriptomic analyses.
Microarray generation and analysis
The transcriptomic changes produced by the FaPRE1 silencing were determined using a
custom-made oligo microarray platform (60-mer length; FraGenomics 35k) containing a total of
34.616 singletons corresponding to those sequences published in the strawberry genome project
Gene Purpose Primer Sequence 5'-3' Product size (bp)
FaPRE1-FL-forward AAGGGTACCACTACATAATATACTCTAGCTTGCTCA
FaPRE1-FL-reverse CCTGGATCCCTAGTGCAAGTCCTTTTTATTAATC
attB-PRE1-fw GGGGACAAGTTTGTACAAAAAAGCAGGCTTAACAATGTCTAGCGGAAGGTCATCAAGCCAGTC
attB-PRE1-rv GGGGACCACTTTGTACAAGAAAGCTGGGTCCTACTGCATAATCAAGCTCCTAAAAATGGC
FaPRE1_3’UTR_Fw CCATGATCATCAAGCAAACG
FaPRE1_3’UTR_Rv GAGCTCTTTGTCTAAGATGGGGTA
FaPRE1up-RNAi AAGGGTACCACTACATAATATACTCTAGCTTGCTCA
FaPRE1low-RNAi CCTGGATCCCTAGTGCAAGTCCTTTTTATTAATC
FaPRE2_3’UTR_Fw CAAGCACGGTTAATTGAGCA
FaPRE2_3’UTR_Rv TTTGCTAGCTAGTGCAAGTCC
FaPRE3_3’UTR_Fw CGACGATCCGCCATAACTA
FaPRE3_3’UTR_Rv GGCTAATGAGCAAACCCTAGC
FaNCED1up GAGCTTGAAGAGTGTGTTGTCCGAAA
FaNCED1low CGGTTCAGCAATGGCGAGATAAGCATA
413fw ACCGTTGATTCGCACAATTGGTCATCG
413rv TACTGCGGGTCGGCAATCGGACG
28407qRT-UP GAAGCTGCTAGCCTTCCCTT
28407qRT-LOW AGCACCCAAGGTTCTCAACA
18229qRT-UP GGCTAAAACCACCGGCATTG
18229qRT-LOW TCCTGGGTGGACTGAGTTGA
21391qRT-UP TTCATCGTCGCCGATCAGTC
21391qRT-LOW ACCTTCCCAATCTGTACCGC
14837qRT-UP ACAGTGCGTGGGATTTCAGT
14837qRT-LOW AAGGCCCAGGAAGATTGCTC
14266qRT-UP CACCGATCTTGAGGACGGAC
14266qRT-LOW AGCAGCTTTATCAGCCCACA
FaAAT2qRT-UP GAAGACGACGCGCAAATCTC
FaAAT2qRT-LOW GCTCCGGCTAGTCCAATGTT
FaAAT1qRT-UP ACAAGCTTACCCTGCTCGAC
FaAAT1qRT-LOW TCGAGCCTCAAGGTATGGGA
24674qRT-UP TGTTCCACTCCACTACTCCTC
24674qRT-LOW AGCGGTTTTCGGATGCTGAG
24941qRT-UP CACCGGAGACTGAGCAACAT
24941qRT-LOW TGACTCGCAGTGCCATCATT
31413qRT-UP CGGCTTCATACGCAAAGCAA
31413qRT-LOW GAGTCTGTGGTGGTGCTGTT
28720qRT-UP CGGACAGAAGGCAGTCAAGAA
28720qRT-LOW GGTCCCGAATCCTCCCAAAA
04424qRT-UP GTGTCCTGCTTCTCCGATCC
04424qRT-LOW TATTTCCGGTGTTCGGTGGG
18656qRT-UP GCAGAGTACTTTGGACTTGA
18656qRT-LOW AGACCAAAAATTCCACCACT
28435qRT-UP ATCAAGCAAGGTGATCAGAG
28435qRT-LOW CATAGACCAGAGATCCTCCA
14611qRT-UP GCGTTTTCCAGATTGTTGAT
14611qRT-LOW TAAATGGCTGGAAACGATGA
23367qRT-UP GAATTGTGTTGCCATTTGGA
23367qRT-LOW CGTCAATGATCCATTTGGTG
26825qRT-UP TGCTTCACAAAATCAAAATGG
26825qRT-LOW AGATTTGTCACTGTTGGTGAT
20725qRT-UP AGGCCACAAGAAACATCCAA
20725qRT-LOW AGTCCTTCATGAGCGATTTT
18732qRT-UP CGATGTTCAAATGCTCTGTC
18732qRT-LOW CTCCTTTGTTAAGAGCTCCA
09427qRT-UP GATGAGACATGGAAGGACAA
09427qRT-LOW CTAGTGGTTCTAGTGCAGAC
29482qRT-UP GAGCATCTGGGTTCATAGC
29482qRT-LOW TCCACTATTACATCAGGAGC
25260qRT-UP CTGGGTCACCATTTAGTCAA
25260qRT-LOW GTTTGGCTTGAACAGAACAA
13540qRT-UP AAATGCAAAGAGCGACCTTA
13540qRT-LOW GCTTCTTAAACGACAAGAGC
RGLqRT-UP CCTTGATCCGTACACTATGG
RGLqRT-LOW ATCCAACATAAGCCGAACTT
21638qRT-UP AATTCTCAAAGACCAAACGTG
21638qRT-LOW TAACTCTACTTGGCGTTGTT
03442qRT-UP GGCCACTATACATCTTGGAG
03442qRT-LOW GAGGTACTGTTTCAGTGTGT
23967qRT-UP TTCTTTGGAAGTATGTCGCA
23967qRT-LOW CCCATTCAAAGCATTAGCAG
FaGA2ox3qRT-UP TCTCCCACAAATCACTCTCCAFaGA2ox3RT-LOW TAATCCTCAACAGCGGAACTG
FaPRE1
RNAi construct 626
FL sequence 654
FaPRE1_3’UTR 83
GFP fusion 282
FaPRE2 FaPRE2_3’UTR
FaPRE3 FaPRE3_3’UTR
119
120
gene18229 qRT-PCR 229
FaNCED1 qRT-PCR 172
Interspacer 26S-18S qRT-PCR 151
gene28407 qRT-PCR 210
197
226
gene31413
qRT-PCR
qRT-PCR
qRT-PCR
qRT-PCR
181
224
221
163
211
gene21391
gene14837
gene28720
gene04424
qRT-PCR
qRT-PCR
qRT-PCR
qRT-PCR
gene14266
FaAAT2
FaAAT1
gene24674
gene24941 qRT-PCR
qRT-PCR
qRT-PCR
qRT-PCR
gene18656
gene28435
gene14611
gene23367
gene26825
gene20725
gene18732
qRT-PCR
qRT-PCR
qRT-PCR
qRT-PCR
qRT-PCR
qRT-PCR
qRT-PCR
qRT-PCR
qRT-PCR
qRT-PCR
qRT-PCR
qRT-PCR
gene21638
gene09427
gene29482
gene25260
gene13540
FaRGLyaseI
FaGA2ox3 qRT-PCR 71
212
172
217
186
190
203
199
148
227
223
249
217
173
189
233
249
164
174
gene03442
gene23967
qRT-PCR

CHAPTER 1
245 PhD Thesis Félix Juan Martínez Rivas
(http://www.strawberry.org). We compared the transcriptomes from control red receptacles
injected with the empty pFRN vector versus red receptacles injected with the RNAi-FaPRE1
construct. The same microarray platform was also used for the transcriptomic analysis of the
strawberry ripening fruit process comparing the transcriptomes from green (G1) receptacle versus
red (R) receptacle (Medina-Puche et al., 2016). The corresponding data were deposited in the
GEO database (www.ncbi.nlm.nih.gov/geo/) with the GSE125995 for silencing data and
GSE126220 for ripening data (Medina-Puche et al., 2016). The criteria for the selection of the
differentially expressed genes were log2 fold change ˃ ±2 and p ≤ 0.05 in both analyses. The
microarray characteristics, hybridization and processing conditions were as described in (Medina-
Puche et al., 2015)
Validation of microarray data and expression analysis by quantitative real-time PCR
Expression analyses of the genes herein studied in different physiological conditions and
for microarray validation were performed by quantitative real-time PCR (qRT-PCR) using
iCycler system (BioRad), as previously described by (Benítez-Burraco et al., 2003) and (Medina-
Puche et al., 2014). Specific primers of the 3´UTR regions were designed to analyze the
expression of the PRE-like genes (FaPRE1, FaPRE2 and FaPRE3) identified in the strawberry
genome. Besides, to validate the expression data obtained in the microarray analysis, specific
primers were designed on several genes that showed differential expression in the experimental
situations analyzed. Table 5 depicts the primer sequences used for all quantitative amplifications.
The relative increase or decrease of gene expression in the samples in comparison to that in the
control gene was calculated in accordance with (Pedersen and Amtssygehus, 2001). Interspacer
26S–18S gene was selected as control gene owing to its constitutive expression.
Statistical analysis of data.
Statistical significance was tested with a Student’s t-test using SPSS software.
Abbreviations
2,4-D, 2,4-dichlorophenoxyacetic acid; ABA, abscisic acid; bHLH, basic helix-loop-
helix; dABA, deuterated abscisic acid; CDS, coding DNA sequence; DAPI, 4´6-diamino-2-
phenylindole dihydrochloride; G1, Green1 stage; G2, Green2 stage; G3, Green3 stage; W, White
stage; R, Ripe stage; OR, Overripe stage; SN, Senescent stage (the seven subjective stages of
strawberry fruit development); GA3, gibberellic acid; GFP, green fluorescent protein; HLH, helix-
loop-helix; NCED, 9-cis-epoxycarotenoid dioxygenase; NDGA, nordihydroguaiaretic acid; PBZ,
paclobutrazol; PRE1, paclobutrazol resistance 1; qRT-PCR, quantitative real time PCR; RNAi,
RNA interference.

CHAPTER 1
246 Functional characterization of molecular regulatory mechanisms controlling the ripening in strawberry fruit
Availability of data and materials
The datasets generated and analyzed during the current study are available in the GEO
repository (www.ncbi.nlm.nih.gov/geo/) (GSE125995 for silencing data and GSE126220 for
ripening data). The data are public from October 18, 2019.

CHAPTER 1
247 PhD Thesis Félix Juan Martínez Rivas
References
Aharoni, A., Keizer, L.C.P., Bouwmeester, H.J., et al. (2000) Identification of the SAAT Gene Involved
in Strawberry Flavor Biogenesis by Use of DNA Microarrays. Plant Cell, 12, 647. Available at:
https://www.jstor.org/stable/10.2307/3870992?origin=crossref.
Almeida, J.R.., D’Amico, E., Preuss, A., et al. (2007) Characterization of major enzymes and genes
involved in flavonoid and proanthocyanidin biosynthesis during fruit development in strawberry (Fragaria
×ananassa). Arch. Biochem. Biophys., 465, 61–71. Available at:
https://linkinghub.elsevier.com/retrieve/pii/S0003986107002317.
Araguez, I., Osorio, S., Hoffmann, T., Rambla, J.L., Medina-Escobar, N., Granell, A., Botella, M.A.,
Schwab, W. and Valpuesta, V. (2013) Eugenol Production in Achenes and Receptacles of Strawberry
Fruits Is Catalyzed by Synthases Exhibiting Distinct Kinetics. Plant Physiol., 163, 946–958. Available at:
http://www.plantphysiol.org/cgi/doi/10.1104/pp.113.224352.
Asif, M.H., Dhawan, P. and Nath, P. (2000) A simple procedure for the isolation of high quality rna from
ripening banana fruit. Plant Mol. Biol. Report., 18, 109–115.
Bai, M.-Y., Fan, M., Oh, E. and Wang, Z.-Y. (2012) A triple helix-loop-helix/basic helix-loop-helix
cascade controls cell elongation downstream of multiple hormonal and environmental signaling pathways
in Arabidopsis. Plant Cell, 24, 4917–29. Available at: http://www.ncbi.nlm.nih.gov/pubmed/23221598.
Barceló, M., El-Mansouri, I., Mercado, J.A., Quesada, M.A. and Pliego-Alfaro, F. (1998) Regeneration
and transformation via Agrobacterium tumefaciens of the strawberry cultivar Chandler. Plant Tissue Cult.
Biotechnol., 54, 29–36. Available at: http://www.banglajol.info/index.php/PTCB/article/view/6888.
Barnes, W.J. and Anderson, C.T. (2018) Release, Recycle, Rebuild: Cell-Wall Remodeling,
Autodegradation, and Sugar Salvage for New Wall Biosynthesis during Plant Development. Mol. Plant,
11, 31–46. Available at: http://www.ncbi.nlm.nih.gov/pubmed/28859907.
Benítez-Burraco, A., Blanco-Portales, R., Redondo-Nevado, J., Bellido, M.L., Moyano, E., Caballero,
J.L. and Muñoz-Blanco, J. (2003) Cloning and characterization of two ripening-related strawberry
(Fragaria x ananassa cv. Chandler) pectate lyase genes. J. Exp. Bot., 54, 633–645.
Blanco-Portales, R., Medina-Escobar, N., López-Ráez, J.A., González-Reyes, J.A., Villalba, J.M.,
Moyano, E., Caballero, J.. and Muñoz-Blanco, J. (2002) Cloning, expression and immunolocalization
pattern of a cinnamyl alcohol dehydrogenase gene from strawberry (Fragaria x ananassa cv. Chandler). J.
Exp. Bot., 53, 1723–34. Available at: http://www.ncbi.nlm.nih.gov/pubmed/12147722.
BUTCHER, D.N., CLARK, J.A. and LENTON, J.R. (1990) Gibberellins and the Growth of Excised
Tomato Roots: Comparison of gib-1 Mutant and Wild Type and Responses to Applied GA 3 and 2 S , 3 S
Paclobutrazol. J. Exp. Bot., 41, 715–722. Available at: https://academic.oup.com/jxb/article-
lookup/doi/10.1093/jxb/41.6.715.
Carretero-Paulet, L., Galstyan, A., Roig-Villanova, I., Martinez-Garcia, J.F., Bilbao-Castro, J.R. and
Robertson, D.L. (2010) Genome-Wide Classification and Evolutionary Analysis of the bHLH Family of
Transcription Factors in Arabidopsis, Poplar, Rice, Moss, and Algae. Plant Physiol., 153, 1398–1412.
Available at: http://www.plantphysiol.org/cgi/doi/10.1104/pp.110.153593.
Castelain, M., Hir, R. Le and Bellini, C. (2012) The non-DNA-binding bHLH transcription factor
PRE3/bHLH135/ATBS1/TMO7 is involved in the regulation of light signaling pathway in Arabidopsis.

CHAPTER 1
248 Functional characterization of molecular regulatory mechanisms controlling the ripening in strawberry fruit
Physiol. Plant., 145, 450–460. Available at: http://doi.wiley.com/10.1111/j.1399-3054.2012.01600.x.
Chai, Y.M., Jia, H.F., Li, C.L., Dong, Q.H. and Shen, Y.Y. (2011) FaPYR1 is involved in strawberry
fruit ripening. J. Exp. Bot., 62, 5079–5089.
Chen, J., Liu, D., Jiang, Y., Zhao, M., Shan, W., Kuang, J. and Lu, W. (2011) Molecular
characterization of a strawberry FaASR gene in relation to fruit ripening. PLoS One, 6, e24649. Available
at: http://www.ncbi.nlm.nih.gov/pubmed/21915355.
Chen, K.-Y., Cong, B., Wing, R., Vrebalov, J. and Tanksley, S.D. (2007) Changes in regulation of a
transcription factor lead to autogamy in cultivated tomatoes. Science (80-. )., 318, 643–5. Available at:
http://www.ncbi.nlm.nih.gov/pubmed/17962563.
Chen, L., Liu, Y., Liu, H., Kang, L., Geng, J., Gai, Y., Ding, Y., Sun, H. and Li, Y. (2015) Identification
and expression analysis of MATE genes involved in flavonoid transport in blueberry plants. PLoS One, 10,
e0118578. Available at: http://www.ncbi.nlm.nih.gov/pubmed/25781331.
Creelman, R.A., Bell, E. and Mullet, J.E. (1992) Involvement of a Lipoxygenase-Like Enzyme in
Abscisic Acid Biosynthesis. Plant Physiol., 99, 1258–1260. Available at:
http://www.plantphysiol.org/cgi/doi/10.1104/pp.99.3.1258.
Csukasi, F., Osorio, S., Gutierrez, J.R., et al. (2011) Gibberellin biosynthesis and signalling during
development of the strawberry receptacle. New Phytol., 191, 376–390.
Cui, J., You, C., Zhu, E., Huang, Q., Ma, H. and Chang, F. (2016) Feedback Regulation of DYT1 by
Interactions with Downstream bHLH Factors Promotes DYT1 Nuclear Localization and Anther
Development. Plant Cell, 28, 1078–93. Available at: http://www.ncbi.nlm.nih.gov/pubmed/27113773.
Cumplido-Laso, G., Medina-Puche, L., Moyano, E., et al. (2012) The fruit ripening-related gene
FaAAT2 encodes an acyl transferase involved in strawberry aroma biogenesis. J. Exp. Bot., 63, 4275–4290.
Available at: https://academic.oup.com/jxb/article-lookup/doi/10.1093/jxb/ers120.
Daminato, M., Guzzo, F. and Casadoro, G. (2013) A SHATTERPROOF-like gene controls ripening in
non-climacteric strawberries, and auxin and abscisic acid antagonistically affect its expression. J. Exp. Bot.,
64, 3775–86. Available at: http://www.ncbi.nlm.nih.gov/pubmed/23888065.
Edger, P.P., Poorten, T.J., VanBuren, R., et al. (2019) Origin and evolution of the octoploid strawberry
genome. Nat. Genet., 51, 541–547. Available at: http://dx.doi.org/10.1038/s41588-019-0356-4.
Fu, X., Cheng, S., Zhang, Y., et al. (2017) Differential responses of four biosynthetic pathways of aroma
compounds in postharvest strawberry ( Fragaria × ananassa Duch.) under interaction of light and
temperature. Food Chem., 221, 356–364. Available at:
https://linkinghub.elsevier.com/retrieve/pii/S0308814616317356.
Hao, Y., Oh, E., Choi, G., Liang, Z. and Wang, Z.-Y. (2012) Interactions between HLH and bHLH
Factors Modulate Light-Regulated Plant Development. Mol. Plant, 5, 688–697. Available at:
https://linkinghub.elsevier.com/retrieve/pii/S1674205214600174.
Heang, D. and Sassa, H. (2012a) An atypical bHLH protein encoded by POSITIVE REGULATOR OF
GRAIN LENGTH 2 is involved in controlling grain length and weight of rice through interaction with a
typical bHLH protein APG. Breed. Sci., 62, 133–41. Available at:
http://www.ncbi.nlm.nih.gov/pubmed/23136524.
Heang, D. and Sassa, H. (2012b) Antagonistic actions of HLH/bHLH proteins are involved in grain length

CHAPTER 1
249 PhD Thesis Félix Juan Martínez Rivas
and weight in rice. PLoS One, 7, e31325. Available at: http://www.ncbi.nlm.nih.gov/pubmed/22363621.
Hernandez, J.M., Feller, A., Morohashi, K., Frame, K. and Grotewold, E. (2007) The basic helix loop
helix domain of maize R links transcriptional regulation and histone modifications by recruitment of an
EMSY-related factor. Proc. Natl. Acad. Sci., 104, 17222–17227. Available at:
http://www.pnas.org/cgi/doi/10.1073/pnas.0705629104.
Herold, S., Wanzel, M., Beuger, V., et al. (2002) Negative regulation of the mammalian UV response by
Myc through association with Miz-1. Mol. Cell, 10, 509–21. Available at:
http://www.ncbi.nlm.nih.gov/pubmed/12408820.
Hoffmann, T., Kalinowski, G. and Schwab, W. (2006) RNAi-induced silencing of gene expression in
strawberry fruit (Fragaria x ananassa) by agroinfiltration: a rapid assay for gene function analysis. Plant J.,
48, 818–26. Available at: http://www.ncbi.nlm.nih.gov/pubmed/17092319.
Hyun, Y. and Lee, I. (2006) KIDARI, Encoding a Non-DNA Binding bHLH Protein, Represses Light
Signal Transduction in Arabidopsis thaliana. Plant Mol. Biol., 61, 283–296. Available at:
http://link.springer.com/10.1007/s11103-006-0010-2.
Ikeda, M., Fujiwara, S., Mitsuda, N. and Ohme-Takagi, M. (2012) A Triantagonistic Basic Helix-Loop-
Helix System Regulates Cell Elongation in Arabidopsis. Plant Cell, 24, 4483–4497. Available at:
http://www.plantcell.org/cgi/doi/10.1105/tpc.112.105023.
Ikeda, M., Mitsuda, N. and Ohme-Takagi, M. (2013) ATBS1 INTERACTING FACTORs negatively
regulate Arabidopsis cell elongation in the triantagonistic bHLH system. Plant Signal. Behav., 8, e23448.
Available at: http://www.tandfonline.com/doi/abs/10.4161/psb.23448.
Jang, S., An, G. and Li, H.-Y. (2017) Rice Leaf Angle and Grain Size Are Affected by the OsBUL1
Transcriptional Activator Complex. Plant Physiol., 173, 688–702. Available at:
http://www.ncbi.nlm.nih.gov/pubmed/27879391.
Jia, H.-F., Chai, Y.-M., Li, C.-L., Lu, D., Luo, J.-J., Qin, L. and Shen, Y.-Y. (2011) Abscisic Acid Plays
an Important Role in the Regulation of Strawberry Fruit Ripening. Plant Physiol., 157, 188–199. Available
at: http://www.plantphysiol.org/lookup/doi/10.1104/pp.111.177311.
Karimi, M., Inzé, D. and Depicker, A. (2002) GATEWAY vectors for Agrobacterium-mediated plant
transformation. Trends Plant Sci., 7, 193–5. Available at: http://www.ncbi.nlm.nih.gov/pubmed/11992820.
Kim, Y., Song, J.-H., Park, S.-U., Jeong, Y.-S. and Kim, S.-H. (2017) Brassinosteroid-Induced
Transcriptional Repression and Dephosphorylation-Dependent Protein Degradation Negatively Regulate
BIN2-Interacting AIF2 (a BR Signaling-Negative Regulator) bHLH Transcription Factor. Plant Cell
Physiol. cell Physiol., 58, 227–239. Available at: https://academic.oup.com/pcp/article-
lookup/doi/10.1093/pcp/pcw223.
Koyama, K., Sadamatsu, K. and Goto-Yamamoto, N. (2010) Abscisic acid stimulated ripening and gene
expression in berry skins of the Cabernet Sauvignon grape. Funct. Integr. Genomics, 10, 367–81. Available
at: http://www.ncbi.nlm.nih.gov/pubmed/19841954.
Lee, Sumin, Lee, Seunghee, Yang, K.-Y., Kim, Y.-M., Park, S.-Y., Kim, S.Y. and Soh, M.-S. (2006)
Overexpression of PRE1 and its Homologous Genes Activates Gibberellin-dependent Responses in
Arabidopsis thaliana. Plant Cell Physiol., 47, 591–600. Available at:
http://academic.oup.com/pcp/article/47/5/591/1844154/Overexpression-of-PRE1-and-its-Homologous-

CHAPTER 1
250 Functional characterization of molecular regulatory mechanisms controlling the ripening in strawberry fruit
Genes.
Li, Y., Wei, W., Feng, J., Luo, H., Pi, M., Liu, Z. and Kang, C. (2017) Genome re-annotation of the wild
strawberry Fragaria vesca using extensive Illumina- and SMRT-based RNA-seq datasets. DNA Res.
Available at: http://www.ncbi.nlm.nih.gov/pubmed/29036429.
Lu, R., Zhang, J., Liu, D., Wei, Y.-L., Wang, Y. and Li, X.-B. (2018) Characterization of bHLH/HLH
genes that are involved in brassinosteroid (BR) signaling in fiber development of cotton (Gossypium
hirsutum). BMC Plant Biol., 18, 304. Available at: http://www.ncbi.nlm.nih.gov/pubmed/30482177.
Mara, C.D., Huang, T. and Irish, V.F. (2010) The Arabidopsis floral homeotic proteins APETALA3 and
PISTILLATA negatively regulate the BANQUO genes implicated in light signaling. Plant Cell, 22, 690–
702. Available at: http://www.ncbi.nlm.nih.gov/pubmed/20305124.
Massari, M.E. and Murre, C. (2000) Helix-Loop-Helix Proteins: Regulators of Transcription in
Eucaryotic Organisms. Mol. Cell. Biol., 20, 429–440. Available at:
http://mcb.asm.org/cgi/doi/10.1128/MCB.20.2.429-440.2000.
Medina-Puche, L., Blanco-Portales, R., Molina-Hidalgo, F.J., Cumplido-Laso, G., García-Caparrós,
N., Moyano-Cañete, E., Caballero-Repullo, J.L., Muñoz-Blanco, J. and Rodríguez-Franco, A. (2016)
Extensive transcriptomic studies on the roles played by abscisic acid and auxins in the development and
ripening of strawberry fruits. Funct. Integr. Genomics, 16, 671–692. Available at:
http://dx.doi.org/10.1007/s10142-016-0510-3.
Medina-Puche, L., Cumplido-Laso, G., Amil-Ruiz, F., et al. (2014) MYB10 plays a major role in the
regulation of flavonoid/phenylpropanoid metabolism during ripening of Fragaria × ananassa fruits. J. Exp.
Bot., 65, 401–417.
Medina-Puche, L., Molina-Hidalgo, F.J., Boersma, M., et al. (2015) An R2R3-MYB Transcription
Factor Regulates Eugenol Production in Ripe Strawberry Fruit Receptacles. Plant Physiol., 168, 598–614.
Available at: http://www.ncbi.nlm.nih.gov/pubmed/25931522.
Molina-Hidalgo, F.J., Franco, A.R., Villatoro, C., et al. (2013) The strawberry (Fragaria×ananassa) fruit-
specific rhamnogalacturonate lyase 1 (FaRGLyase1) gene encodes an enzyme involved in the degradation
of cell-wall middle lamellae. J. Exp. Bot., 64, 1471–1483.
Molina-Hidalgo, F.J., Medina-Puche, L., Cañete-Gómez, C., et al. (2017) The fruit-specific
transcription factor FaDOF2 regulates the production of eugenol in ripe fruit receptacles. J. Exp. Bot., 68,
4529–4543. Available at: http://academic.oup.com/jxb/article/68/16/4529/4067750/The-fruitspecific-
transcription-factor-FaDOF2.
Molina-Hidalgo, F.J., Medina-Puche, L., Gelis, S., et al. (2015) Functional characterization of FaNIP1;1
gene, a ripening-related and receptacle-specific aquaporin in strawberry fruit. Plant Sci., 238, 198–211.
Oh, E., Zhu, J.-Y., Bai, M.-Y., Arenhart, R.A., Sun, Y. and Wang, Z.-Y. (2014) Cell elongation is
regulated through a central circuit of interacting transcription factors in the Arabidopsis hypocotyl. Elife,
3. Available at: http://www.ncbi.nlm.nih.gov/pubmed/24867218.
Pedersen, S. and Amtssygehus, A. (2001) Multiplex Relative Gene Expression Analysis by Real-Time
RT-PCR Using the iCycler iQ Detection System. BioRadiations, 107, 10–11. Available at: http://www.bio-
rad.com/LifeScience/pdf/Bulletin_2696.pdf.
Perkins-Veazie, P. (1995) Growth and Ripening of Strawberry Fruit. In Horticultural Reviews. Oxford,

CHAPTER 1
251 PhD Thesis Félix Juan Martínez Rivas
UK: John Wiley & Sons, Inc., pp. 267–297. Available at:
http://doi.wiley.com/10.1002/9780470650585.ch8.
Pillet, J., Yu, H.-W., Chambers, A.H., Whitaker, V.M. and Folta, K.M. (2015) Identification of
candidate flavonoid pathway genes using transcriptome correlation network analysis in ripe strawberry (
Fragaria × ananassa ) fruits. J. Exp. Bot., 66, 4455–4467. Available at:
http://www.ncbi.nlm.nih.gov/pubmed/25979996.
Quesada, M.A., Blanco-Portales, R., Pose, S., et al. (2009) Antisense Down-Regulation of the FaPG1
Gene Reveals an Unexpected Central Role for Polygalacturonase in Strawberry Fruit Softening. Plant
Physiol., 150, 1022–1032. Available at: http://www.plantphysiol.org/cgi/doi/10.1104/pp.109.138297.
Raab, T., López-Ráez, J.A., Klein, D., Caballero, J.L., Moyano, E., Schwab, W. and Muñoz-Blanco,
J. (2006) FaQR, required for the biosynthesis of the strawberry flavor compound 4-hydroxy-2,5-dimethyl-
3(2H)-furanone, encodes an enone oxidoreductase. Plant Cell, 18, 1023–37. Available at:
http://www.ncbi.nlm.nih.gov/pubmed/16517758.
Roig-Villanova, I., Bou-Torrent, J., Galstyan, A., Carretero-Paulet, L., Portolés, S., Rodríguez-
Concepción, M. and Martínez-García, J.F. (2007) Interaction of shade avoidance and auxin responses:
a role for two novel atypical bHLH proteins. EMBO J., 26, 4756–4767. Available at:
http://emboj.embopress.org/cgi/doi/10.1038/sj.emboj.7601890.
Salvatierra, A., Pimentel, P., Moya-León, M.A. and Herrera, R. (2013) Increased accumulation of
anthocyanins in Fragaria chiloensis fruits by transient suppression of FcMYB1 gene. Phytochemistry, 90,
25–36. Available at: http://www.ncbi.nlm.nih.gov/pubmed/23522932.
Schaart, J.G., Dubos, C., Romero De La Fuente, I., et al. (2013) Identification and characterization of
MYB-bHLH-WD40 regulatory complexes controlling proanthocyanidin biosynthesis in strawberry
(Fragaria × ananassa) fruits. New Phytol., 197, 454–67. Available at:
http://www.ncbi.nlm.nih.gov/pubmed/23157553.
Shin, K., Lee, I., Kim, E., Park, S., Soh, M.-S. and Lee, S. (2019) PACLOBUTRAZOL-RESISTANCE
Gene Family Regulates Floral Organ Growth with Unequal Genetic Redundancy in Arabidopsis thaliana.
Int. J. Mol. Sci., 20, 869. Available at: http://www.mdpi.com/1422-0067/20/4/869.
Shulaev, V., Sargent, D.J., Crowhurst, R.N., et al. (2011) The genome of woodland strawberry (Fragaria
vesca). Nat. Genet., 43, 109–16. Available at: http://www.ncbi.nlm.nih.gov/pubmed/21186353.
Symons, G.M., Chua, Y.-J., Ross, J.J., Quittenden, L.J., Davies, N.W. and Reid, J.B. (2012) Hormonal
changes during non-climacteric ripening in strawberry. J. Exp. Bot., 63, 4741–50. Available at:
https://academic.oup.com/jxb/article-lookup/doi/10.1093/jxb/err313.
Toledo-Ortiz, G., Huq, E. and Quail, P.H. (2003) The Arabidopsis basic/helix-loop-helix transcription
factor family. Plant Cell, 15, 1749–70. Available at: http://www.plantcell.org/cgi/doi/10.1105/tpc.013839.
Vallarino, J.G., Osorio, S., Bombarely, A., et al. (2015) Central role of FaGAMYB in the transition of
the strawberry receptacle from development to ripening. New Phytol., 208, 482–496.
Wang, H., Zhu, Y., Fujioka, S., Asami, T., Li, Jiayang and Li, Jianming (2009) Regulation of
Arabidopsis brassinosteroid signaling by atypical basic helix-loop-helix proteins. Plant Cell, 21, 3781–91.
Available at: http://www.ncbi.nlm.nih.gov/pubmed/20023194.
Wang, M., Yang, D., Ma, F., Zhu, M., Shi, Z. and Miao, X. (2019) OsHLH61-OsbHLH96 influences

CHAPTER 1
252 Functional characterization of molecular regulatory mechanisms controlling the ripening in strawberry fruit
rice defense to brown planthopper through regulating the pathogen-related genes. Rice (N. Y)., 12, 9.
Available at: http://www.ncbi.nlm.nih.gov/pubmed/30796564.
Wei, K. and Chen, H. (2018) Comparative functional genomics analysis of bHLH gene family in rice,
maize and wheat. BMC Plant Biol., 18, 309. Available at:
https://bmcplantbiol.biomedcentral.com/articles/10.1186/s12870-018-1529-5.
Wei, L., Mao, W., Jia, M., et al. (2018) FaMYB44.2, a transcriptional repressor, negatively regulates
sucrose accumulation in strawberry receptacles through interplay with FaMYB10. J. Exp. Bot., 69, 4805–
4820. Available at: https://academic.oup.com/jxb/article/69/20/4805/5063657.
Xu, Z., Liu, X., He, X., Xu, L., Huang, Y., Shao, H., Zhang, D., Tang, B. and Ma, H. (2017) The
Soybean Basic Helix-Loop-Helix Transcription Factor ORG3-Like Enhances Cadmium Tolerance via
Increased Iron and Reduced Cadmium Uptake and Transport from Roots to Shoots. Front. Plant Sci.
Zhang, C., Feng, R., Ma, R., Shen, Z., Cai, Z., Song, Z., Peng, B. and Yu, M. (2018) Genome-wide
analysis of basic helix-loop-helix superfamily members in peach Y. Han, ed. PLoS One, 13, e0195974.
Available at: https://dx.plos.org/10.1371/journal.pone.0195974.
Zhang, L.-Y., Bai, M.-Y., Wu, J., et al. (2009) Antagonistic HLH/bHLH transcription factors mediate
brassinosteroid regulation of cell elongation and plant development in rice and Arabidopsis. Plant Cell, 21,
3767–80. Available at: http://www.ncbi.nlm.nih.gov/pubmed/20009022.
Zhang, Y., Yin, X., Xiao, Y., et al. (2018) An ETHYLENE RESPONSE FACTOR-MYB Transcription
Complex Regulates Furaneol Biosynthesis by Activating QUINONE OXIDOREDUCTASE Expression in
Strawberry. Plant Physiol., pp.00598.2018. Available at:
http://www.plantphysiol.org/lookup/doi/10.1104/pp.18.00598.
Zhao, F., Li, G., Hu, P., Zhao, X., Li, L., Wei, W., Feng, J. and Zhou, H. (2018) Identification of
basic/helix-loop-helix transcription factors reveals candidate genes involved in anthocyanin biosynthesis
from the strawberry white-flesh mutant. Sci. Rep., 8, 2721. Available at:
http://www.nature.com/articles/s41598-018-21136-z.
Zheng, K., Wang, Y. and Wang, S. (2019) The non-DNA binding bHLH transcription factor
Paclobutrazol Resistances are involved in the regulation of ABA and salt responses in Arabidopsis. Plant
Physiol. Biochem., 139, 239–245. Available at: http://www.ncbi.nlm.nih.gov/pubmed/30921735.
Zhu, Z., Chen, G., Guo, X., Yin, W., Yu, X., Hu, J. and Hu, Z. (2017) Overexpression of SlPRE2, an
atypical bHLH transcription factor, affects plant morphology and fruit pigment accumulation in tomato.
Sci. Rep., 7, 5786. Available at: http://www.nature.com/articles/s41598-017-04092-y.
Zhu, Z., Liang, H., Chen, G., Li, F., Wang, Y., Liao, C. and Hu, Z. (2019) The bHLH transcription
factor SlPRE2 regulates tomato fruit development and modulates plant response to gibberellin. Plant Cell
Rep. Available at: http://link.springer.com/10.1007/s00299-019-02425-x

CHAPTER 1
253 PhD Thesis Félix Juan Martínez Rivas
Additional Files legends:
Additional file 1: Subfamily classification of 182 plant bHLH/HLH sequences examined in this
study and additional information.
Data available on the electronic version of the thesis.
Additional file 2. Total microarray data from transcriptomic comparison between transgenic
receptacles agroinfiltrated with FaPRE1-RNAi construct and no-transgenic control receptacles.
Gene ID and corresponding annotations as reported in Fragaria vesca Genome Database
(http://www.strawberrygenome.org/) (Shulaev et al., 2011).
Data available on the electronic version of the thesis.
Additional file 3: All the genes down-regulated in strawberry FaPRE1-RNAi receptacles (fold
change RNAi) and up-regulated in strawberry red receptacle (fold ripening). Gene ID and
corresponding annotations as reported in Fragaria vesca Genome Database
(http://www.strawberrygenome.org/) (Shulaev et al., 2011)
Data available on the electronic version of the thesis.
Additional file 4: All the genes up-regulated in strawberry FaPRE1-RNAi receptacles (fold
change RNAi) and down-regulated in strawberry red receptacle (fold ripening). Gene ID
and corresponding annotations as reported in Fragaria vesca Genome Database
(http://www.strawberrygenome.org/) (Shulaev et al., 2011)
Data available on the electronic version of the thesis.

254 Functional characterization of molecular regulatory mechanisms controlling the ripening in strawberry fruit

CHAPTER 2
255 PhD Thesis Félix Juan Martínez Rivas
CHAPTER 2
The R2R3-MYB transcription factor FaMYB123 regulates anthocyanin
and flavonol biosynthesis in strawberry fruit

CHAPTER 2
256 Functional characterization of molecular regulatory mechanisms controlling the ripening in strawberry fruit
This chapter has been submitted to Plant Journal as:
Martinez-Rivas FJ, Blanco-Portales R, Serratosa MP, Ric-Varas P, Medina-Puche L,
Moyano L, Mercado JA, Alseekh S, Caballero JL, Rodríguez-Franco A, Fernie AR,
Muñoz-Blanco J, Molina-Hidalgo FJ. 2021. The R2R3-MYB transcription factor
FaMYB123 regulates anthocyanin and flavonol biosynthesis in strawberry fruit.

CHAPTER 2
257 PhD Thesis Félix Juan Martínez Rivas
The R2R3-MYB transcription factor FaMYB123 regulates anthocyanin and
flavonol biosynthesis in strawberry fruit
Abstract
Using transcriptomics approaches, we have identified and functionally characterized an
R2R3 MYB transcription factor, FaMYB123, whose expression is ripening-related, receptacle-
specific and hormonally regulated by both abscisic acid and auxin. When FaMYB123 expression
was knocked down by RNAi in ripe strawberry fruit receptacles, the expression of genes that
encode enzymes involved in the final steps of anthocyanin/flavonoid biosynthesis were down
regulated. These fruits showed a concomitant decrease in total anthocyanin and flavonoid content,
noticeable in the malonyl derivates. Additionally, metabolomic results showed an accumulation
of proanthocyanin, propelargonidins and other condensed tannins, mainly related to green
receptacles, in the transgenic receptacles. These results confirm that FaMYB123 is a transcription
factor involved in the anthocyanin/flavonoid production in ripe fruit receptacles along the
ripening stages, regulating key enzymes of these pathways, such as FaANS, FaUFGT and
FaMalTransf. These results provide evidence that FaMYB123 plays a regulatory role in late steps
of phenylpropanoid pathway.

CHAPTER 2
258 Functional characterization of molecular regulatory mechanisms controlling the ripening in strawberry fruit
Introduction
Agriculturally, strawberry fruit is one of the most consumed berries world-wide. Its fruits
are highly appreciated by the consumer, because of the sweetness and complex aroma, flavour,
colour, and firmness that constitute the fruit quality traits. Besides, strawberry fruits are a rich
source of a wide variety of nutritive compounds such as sugars, vitamins, minerals, and non-
nutritive but bioactive and health conferring compounds such as flavonoids, anthocyanins and
phenolic acids. (Giampieri et al., 2012). These compounds exert a synergistic and cumulative
effect on the promotion of human health and in disease prevention. Lately, the effect of the
compounds contained in strawberries are being studied in detail in relation to their effects on
human health. The protective effects of strawberry consumption comprise a wide range of
biological activities in the prevention of inflammation, cardiovascular diseases, obesity,
metabolic syndrome, certain types of cancers and even neurological diseases (Giampieri et al.,
2015).
Strawberry is a non-climacteric fruit whose growth and ripening are regulated by the
antagonistic relationship between auxins and ABA (Perkins Veazie, 1995; Li et al., 2011; Symons
et al., 2012, Medina-Puche et al., 2016). Along the ripening process, ABA biosynthetic pathway
is activated, resulting in an increase of ABA concentration in ripe fruits (Jia et al., 2011; Medina-
Puche et al., 2014). FaNCED1 that encodes a 9- cis-epoxycarotenoid dioxygenase is responsible
of the increase of ABA content in red ripen fruits (Jia et al., 2012; Medina-Puche et al., 2014).
Furthermore, previous transcriptomic studies have demonstrated that the expression of those
genes related to the main organoleptic characteristics of the fruit are ABA-dependent (Medina-
Puche et al., 2016). In plants, the increase of ABA triggers a three-step signal that depend through
its binding and activation of the binary complex RCAR/PYR/PYL ABA receptors and PPC2
phosphatases, that function as coreceptor. Activation of RCAR receptor inactive PPC2 causing
an activation of the kinase SnRK2, that phosphorylate ABA-responsive transcriptional factors
which in turn activates the expression of ABA responsive genes (Ma et al., 2009; Park et al.,
2009; Yoshida et al., 2019). In strawberry fruits, it has been previously reported that an ABA
perception and signalling orthologous core complex is operative (Chai et al., 2011; Jia et al.,
2011, 2013; Hang et al., 2015). Substantial evidence has demonstrated the regulatory role played
by the intracellular sucrose, acting as a signal molecule and regulating the ripening process (Jia
et al., 2013). This regulatory function seems to be contested through the action of the FaSUT1
transporter (Jia et al., 2013). Similarly, Luo et al., (2019) demonstrated the synergistic action
between the content of ABA and sucrose on the co-regulation of strawberry fruit ripening.

CHAPTER 2
259 PhD Thesis Félix Juan Martínez Rivas
DNA-binding transcription factors (TFs) are essential as master regulatory genes,
controlling the network responsible for specific gene expression. These genes would determine
the spatiotemporal expression of other genes, according to additive and cooperative mechanism
in gene regulation. To carry out their specific and dynamic function, TFs often interact with others
TFs, either on the same promoter in a cooperative, additive, or in a combinatorial fashion (Bemer
et al., 2017).MYBs are a large family of TFs found in all eukaryotic organisms and characterized
by one or more repeats of the MYB domain (Lipsick, 1996; Kranz et al., 2000). R2R3 MYBs are
recognisable by their two imperfect MYB repeats that follow the R2 and R3 structure of the c-
MYB (Kranz et al., 2000). To play its regulatory role, MYB TFs interact with other TFs and
proteins involved in the transcription process. In example, the formation of a MBW complex,
composed by MYB and bHLH TFs in combination with WD40 proteins are important to target
gene regulation in different metabolic and developmental pathways such as flavonoid
accumulation, glucosinolate production and trichome production (Xie et al., 2016; Xu et al., 2015;
Matías-Hernández et al., 2017). MYB-bHLH complexes recognize some cis elements on the
promoter of those genes that regulate, determining in this way target gene specificity (Lai et al.,
2014; Bemer et al., 2017). Interestingly, it has been demonstrated that the bHLH FTs can be
responsible for the responses to environmental and hormonal signals via their interaction with
different proteins (Pireyre and Burow, 2015). WD40 proteins are important for stabilization of
MBW complexes, however it is not clear that these proteins interact with both MYB or bHLH
TFs in MBW complexes. MYB TFs, are some of the FTs that present, on the promoters of genes
that regulate, a high degree of interaction with member of other TFs through cross-family
interactions. This is why they are considered as “hubs” TFs (Bemer et al., 2017)
Some MYB and bHLH genes, have also been functionally described in strawberry. The
role of FaMYB1 as repressor of structural genes of the phenylpropanoid/flavonoids/anthocyanins
pathway has been determined (Aharoni et al., 2001). Also, the function played by R2R3
FaMYB10 on the biosynthesis of these compounds in ripe receptacles was demonstrated. Its
function proceeds through the activation of structural genes of this pathway in ripe fruit
receptacles (Lin-Wang et al., 2014; Medina-Puche et al., 2014). Additionally, it has been reported
that FaMYB10 may also regulate expression of structural genes belonging to the biosynthetic
pathway that produces phenylpropanoid volatiles (Medina-Puche et al., 2014). The positive
synergistic action between another R2R3 MYB TF, FaEOBII and FaDOF2 on the regulation of
the metabolic pathway involved in the production of phenylpropanoid volatile eugenol was also
demonstrated (Medina-Puche et al., 2015; Molina-Hidalgo et al., 2017). Both, FaEOBII and
FaDOF2 expression are under the regulation of FaMYB10. On the other hand, four TFs,
FaMYB9/FaMYB11, FabHLH3 and FaTTG1, have been described as positive regulators of

CHAPTER 2
260 Functional characterization of molecular regulatory mechanisms controlling the ripening in strawberry fruit
proanthocyanin biosynthesis, with these compounds representing the main flavonoids produced
in unripe strawberry (Schaart et al., 2013).
In strawberry fruits, the functional role of few TFs involved in ripening has been
elucidated. The function of MADS TFs such as FaSHP (Daminato et al., 2013) and FaMADS9
(Vallarino et al., 2020) has been determined. Two AP2/ERF TFs have been described, one of
them, FaERF9 acts synergistically with FaMYB98 to activate FaQR a quinone reductase, key
gene on the furaneol biosynthesis (Zhang et al., 2018). FaRAV1 has been related as a regulator
on the FaMYB10 expression, regulating the phenylpropanoid pathway (Zhang et al., 2020). In
this way, FaTCP11 regulates flavonol biosynthesis, controlling the expression of
leucoantocyanidin reductase, (FaLAR) and flavonol-3’hydroxylase (FaF3’H). By contrary,
FaSCL8, regulates the expression of genes related to phenylpropanoid biosynthesis, like
phenylammonia lyase (FaPAL) as well as chalcone synthase and isomerase (FaCHS, FaCHI)
(Pillet et al., 2015).
Previous transcriptomic analyses performed in our research group allowed us to identify
several TFs whose expression differentially changed throughout strawberry fruit receptacle
development and ripening (Medina-Puche et al., 2016). This study allows us to detect a ripening-
related R2R3 MYB TF (gene 25060, FvH4_5g32460), hereinafter FaMYB123, that presents a
clear fruit specific and ripening related expression-pattern. Molecular and physiological studies
show that this TF is involved in the regulation of structural genes of the anthocyanins or flavonols
that accumulate in ripen fruit receptacles.
Results
Previous transcriptomic studies performed in our research group (Medina-Puche et al.,
2016), where we compared the transcriptomes of green (G2-stage) and full red-ripe strawberry
fruit receptacles (R-stage) and the transcriptomic changes under hormonal conditions (ABA and
auxin treatments), gave rise to a group of genes with potential interest for further functional
characterizations. Among the TFs identified, only three MYB-type were up-regulated in red-ripe
receptacle and regulated positively by ABA and negatively by auxins, suggesting that they are
involved in different fruit receptacle ripening-related processes. These were FaMYB10
(gene31413, FvH4_1g22020), FaEOBII (gene28435, FvH4_6g50930) and FaMYB123
(gene25060, FvH4_5g32460). FaMYB10 and FaEOBII were characterized in (Medina-Puche et
al., 2014; Medina-Puche et al., 2015) respectively, demonstrating the main role played by both
FTs on controlling major processes during ripening. In this work, we have proceeded to
functionally characterize the MYB TF corresponding to gene25060, hereinafter FaMYB123,
CHAPTER 2
261 PhD Thesis Félix Juan Martínez Rivas
whose expression pattern indicates that could be related with the organoleptic properties that take
part in the ripening process of strawberry.
Sequence and phylogenetic analysis of the FaMYB123
The full-length cDNA sequence of the FaMYB123 gene was amplified from Fragaria ×
ananassa cv Camarosa. The in-silico analysis of the predicted FaMYB123 protein showed the R2
and R3 motifs at the N-terminus, that characterize the R2R3 DNA-binding MYB proteins, and
determine the interaction with cis-regulatory sequences in the promoters (Fig 1A).
Fig 1. (a). Predicted domains in FaMYB123 protein using interpro program. (b). Screenshot of predicted
subcellular localization of FaMYB123 protein using CELLO2Go website.
The corresponding aminoacidic sequence showed significant sequence homology with
other MYB proteins from higher plants and among them, the highest homology with AtTT2,
VvMYBPA2 and DkMYB2 (Fig 2). A phylogeny of full length predicted proteins from
strawberry and A. thaliana was generated, showing that FaMYB123 present the highest homology
with AtTT2 (Fig 3) (Kranz et al., 1998). These proteins had a functional role regulating both
anthocyanin and phenylpropanoid pathways. (Terrier et al., 2009; Appelhagen et al., 2011)
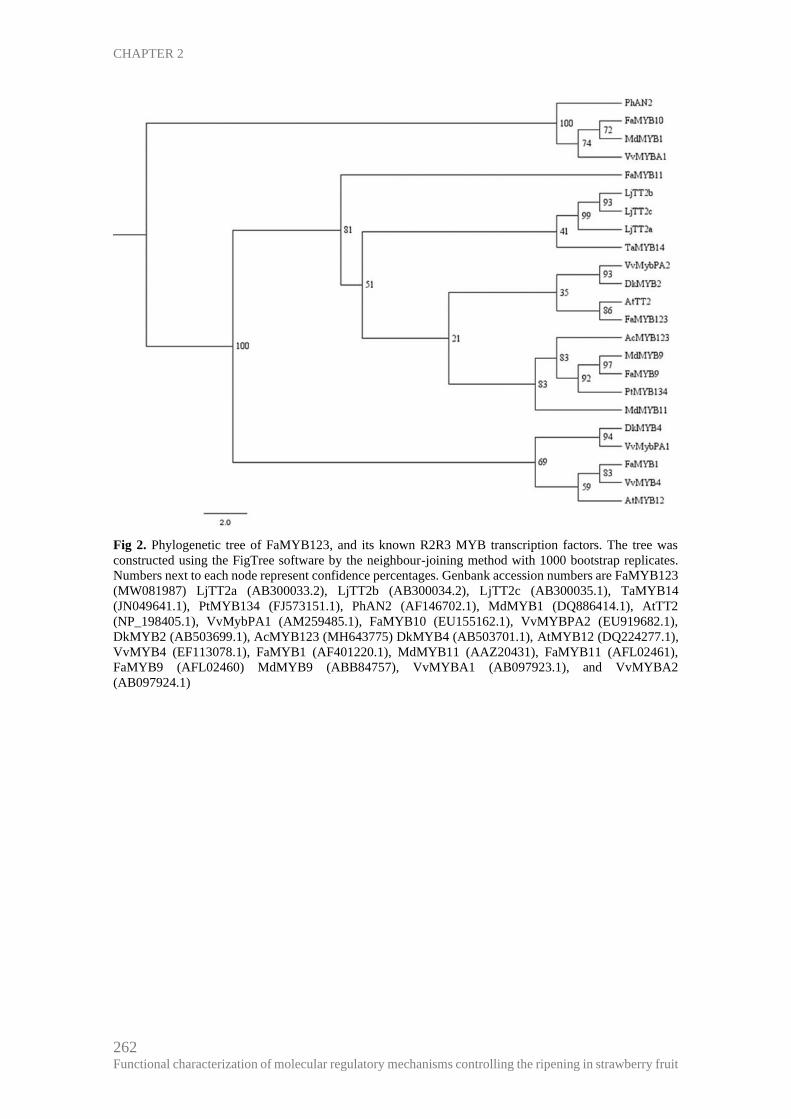
CHAPTER 2
262 Functional characterization of molecular regulatory mechanisms controlling the ripening in strawberry fruit
Fig 2. Phylogenetic tree of FaMYB123, and its known R2R3 MYB transcription factors. The tree was
constructed using the FigTree software by the neighbour-joining method with 1000 bootstrap replicates.
Numbers next to each node represent confidence percentages. Genbank accession numbers are FaMYB123
(MW081987) LjTT2a (AB300033.2), LjTT2b (AB300034.2), LjTT2c (AB300035.1), TaMYB14
(JN049641.1), PtMYB134 (FJ573151.1), PhAN2 (AF146702.1), MdMYB1 (DQ886414.1), AtTT2
(NP_198405.1), VvMybPA1 (AM259485.1), FaMYB10 (EU155162.1), VvMYBPA2 (EU919682.1),
DkMYB2 (AB503699.1), AcMYB123 (MH643775) DkMYB4 (AB503701.1), AtMYB12 (DQ224277.1),
VvMYB4 (EF113078.1), FaMYB1 (AF401220.1), MdMYB11 (AAZ20431), FaMYB11 (AFL02461),
FaMYB9 (AFL02460) MdMYB9 (ABB84757), VvMYBA1 (AB097923.1), and VvMYBA2
(AB097924.1)

CHAPTER 2
263 PhD Thesis Félix Juan Martínez Rivas
Fig 3. Phylogenetic tree of MYB transcription factors from Arabidopsis thaliana (sequences downloaded
from TAIR database) with all Fragaria × ananassa proteins (downloaded from plantTFDB database).
FaMYB123 protein is located in the nucleus
Bioinformatics analyses of FaMYB123 aminoacidic sequence reveal that FaMYB123
was predicted to be located into the nucleus (Fig 1B). This bioinformatic prediction was
confirmed by confocal microscopy experiments where the full-length CDS of FaMYB123 was
fused to GFP at N-terminal region (GFP-FaMYB123) under the control of the 35S promoter.
Fusion proteins were transiently expressed in epidermal cells of Nicotiana benthamiana, and the
fluorescent signal was detected exclusively in nucleus and co-localized with nucleic-specific
DAPI marker (Fig 4).

CHAPTER 2
264 Functional characterization of molecular regulatory mechanisms controlling the ripening in strawberry fruit
Fig 4. Subcellular localization of the FaMYB123 protein in Nicotiana benthamiana leaves. The Nicotiana
benthamiana leaves were agroinfiltrated with translational constructs 35S::GFP:FaMYB123 and with
35S::GFP as control. Leaves infiltrated with Agrobacterium that carried plasmid 35S::GFP:FaMYB123. (A
and C). Infiltrated with 35S::GFP (D and F). GFP: green fluorescent protein; DAPI: 4´,6-Diamidino-2-
Phenylindole (nuclei dye); MERGE: merged view of the GFP and DAPI images.
FaMYB123 expression is strongly expressed in receptacles and hormonally regulated
throughout the fruit growth and ripening
Spatio-temporal expression pattern for FaMYB123 gene was analysed by qRT-PCR.
FaMYB123 is expressed at low level during fruit development (G1, G3 and W), but it drastically
increased its expression at the ripened and senescent stages (R, OR and SE) of receptacle
development, reaching the higher level in OR stage (Fig 5A). In vegetative tissues, such as leaves,
flowers, petals, or runners, FaMYB123 was only expressed at a low level (Fig 5B). However, no
significant expression was detected in achenes when compared against the expression level
observed in red fruit receptacles (Fig 5C). These combined expression results indicate that
FaMYB123 mainly regulates specific ripening-related physiological processes in the fruit
receptacle tissue.

CHAPTER 2
265 PhD Thesis Félix Juan Martínez Rivas
Fig 5. (a). Developmental expression of the strawberry FaMYB123 in fruit receptacle (b). Vegetative tissues
vs green1 and red receptacles (c). Achenes vs green1 and red receptacles. of F. × ananassa cv. Camarosa.
qRT-PCR results were obtained using specific primers for FaMYB123 gene. Quantification is based on Ct
values. The increase in the mRNA value was relative to the receptacle G1-Ct value in all experiments,
which was assigned an arbitrary value equal to unity. Mean values ± SD of five independent experiments
are shown. G1: small-sized green fruit; G3: full-sized green fruit; W: white stage; R: red stage; OR: overripe
stage; SE: senescent stage; REC G1: receptacle G1; REC R: receptacle R; FL: flower; Pe: petal; Run:
runner; Le: Leaf; Ac G1: achenes small-sized green fruit; Ac G3: achenes full-sized green fruit; Ac W:
achenes white stage; Ac R: achenes red stage. Statistical significance was determined by one-way ANOVA.
Letters indicate significant differences (p<0.05, Scheffe post-hoc test).
ABA plays an important role in strawberry fruit ripening regulation (Chai et al., 2011; Jia
et al., 2011) while auxin, produced by achenes, stimulates receptacle growth and subsequently
inhibits fruit ripening (Perkins-Veazie, 1995). The expression of the vast majority of ripening-
related genes associated to the organoleptic and quality properties of the strawberry fruit are
antagonistically regulated by both auxins and ABA (Medina-Puche et al., 2016). To study the
effect of ABA on the FaMYB123 expression, two independent experiments were carried out to
decrease the FaNCED1 enzymatic activity. Injecting the inhibitor NDGA, and silencing
FaNCED1 expression. As expected, a clear decrease in both endogenous ABA content and
FaMYB123 expression was found in both experiments (Fig 6A, B). Water stress is well known to
induce ABA accumulation. For this reason, FaMYB123 gene expression and ABA content were
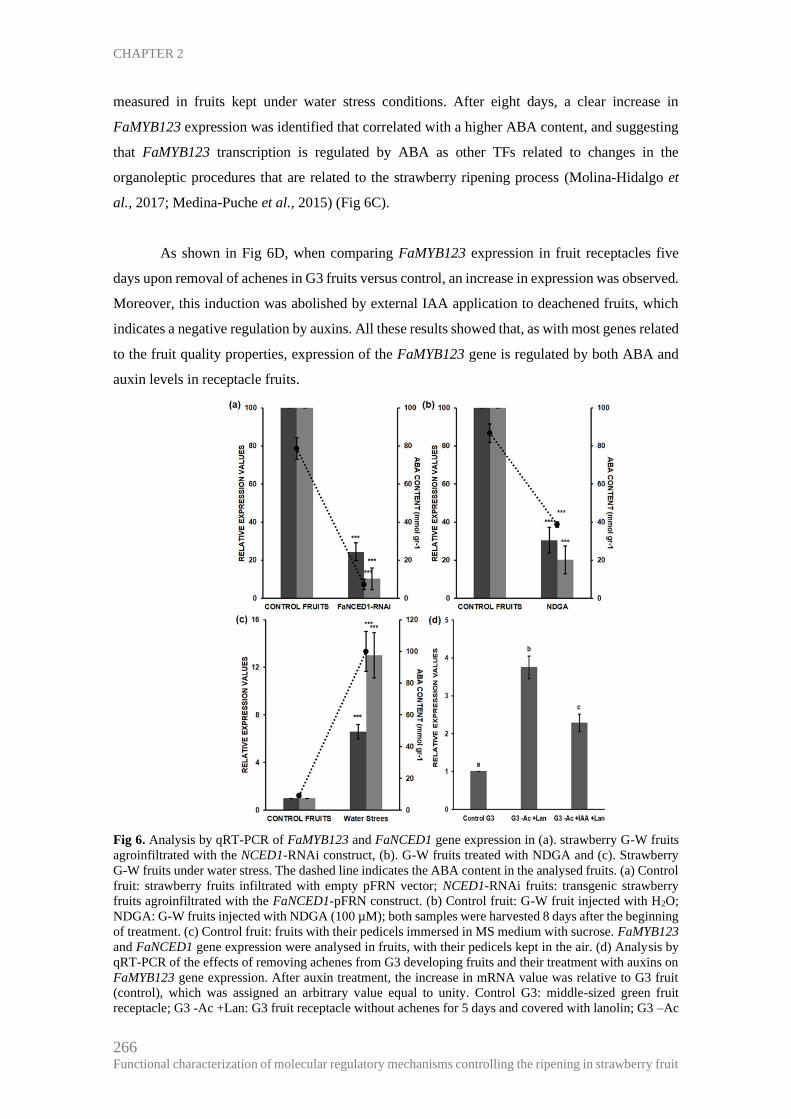
CHAPTER 2
266 Functional characterization of molecular regulatory mechanisms controlling the ripening in strawberry fruit
measured in fruits kept under water stress conditions. After eight days, a clear increase in
FaMYB123 expression was identified that correlated with a higher ABA content, and suggesting
that FaMYB123 transcription is regulated by ABA as other TFs related to changes in the
organoleptic procedures that are related to the strawberry ripening process (Molina-Hidalgo et
al., 2017; Medina-Puche et al., 2015) (Fig 6C).
As shown in Fig 6D, when comparing FaMYB123 expression in fruit receptacles five
days upon removal of achenes in G3 fruits versus control, an increase in expression was observed.
Moreover, this induction was abolished by external IAA application to deachened fruits, which
indicates a negative regulation by auxins. All these results showed that, as with most genes related
to the fruit quality properties, expression of the FaMYB123 gene is regulated by both ABA and
auxin levels in receptacle fruits.
Fig 6. Analysis by qRT-PCR of FaMYB123 and FaNCED1 gene expression in (a). strawberry G-W fruits
agroinfiltrated with the NCED1-RNAi construct, (b). G-W fruits treated with NDGA and (c). Strawberry
G-W fruits under water stress. The dashed line indicates the ABA content in the analysed fruits. (a) Control
fruit: strawberry fruits infiltrated with empty pFRN vector; NCED1-RNAi fruits: transgenic strawberry
fruits agroinfiltrated with the FaNCED1-pFRN construct. (b) Control fruit: G-W fruit injected with H2O;
NDGA: G-W fruits injected with NDGA (100 µM); both samples were harvested 8 days after the beginning
of treatment. (c) Control fruit: fruits with their pedicels immersed in MS medium with sucrose. FaMYB123
and FaNCED1 gene expression were analysed in fruits, with their pedicels kept in the air. (d) Analysis by
qRT-PCR of the effects of removing achenes from G3 developing fruits and their treatment with auxins on
FaMYB123 gene expression. After auxin treatment, the increase in mRNA value was relative to G3 fruit
(control), which was assigned an arbitrary value equal to unity. Control G3: middle-sized green fruit
receptacle; G3 -Ac +Lan: G3 fruit receptacle without achenes for 5 days and covered with lanolin; G3 –Ac
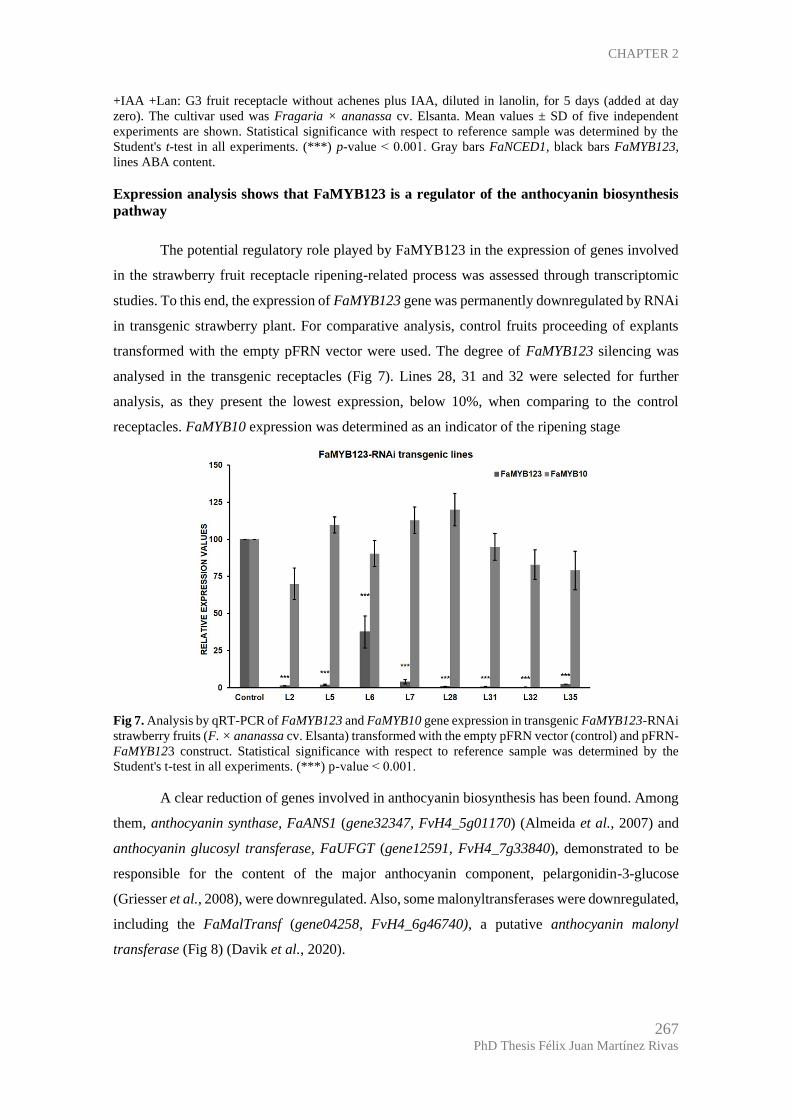
CHAPTER 2
267 PhD Thesis Félix Juan Martínez Rivas
+IAA +Lan: G3 fruit receptacle without achenes plus IAA, diluted in lanolin, for 5 days (added at day
zero). The cultivar used was Fragaria × ananassa cv. Elsanta. Mean values ± SD of five independent
experiments are shown. Statistical significance with respect to reference sample was determined by the
Student's t-test in all experiments. (***) p-value ˂ 0.001. Gray bars FaNCED1, black bars FaMYB123,
lines ABA content.
Expression analysis shows that FaMYB123 is a regulator of the anthocyanin biosynthesis
pathway
The potential regulatory role played by FaMYB123 in the expression of genes involved
in the strawberry fruit receptacle ripening-related process was assessed through transcriptomic
studies. To this end, the expression of FaMYB123 gene was permanently downregulated by RNAi
in transgenic strawberry plant. For comparative analysis, control fruits proceeding of explants
transformed with the empty pFRN vector were used. The degree of FaMYB123 silencing was
analysed in the transgenic receptacles (Fig 7). Lines 28, 31 and 32 were selected for further
analysis, as they present the lowest expression, below 10%, when comparing to the control
receptacles. FaMYB10 expression was determined as an indicator of the ripening stage
Fig 7. Analysis by qRT-PCR of FaMYB123 and FaMYB10 gene expression in transgenic FaMYB123-RNAi
strawberry fruits (F. × ananassa cv. Elsanta) transformed with the empty pFRN vector (control) and pFRN-
FaMYB123 construct. Statistical significance with respect to reference sample was determined by the
Student's t-test in all experiments. (***) p-value ˂ 0.001.
A clear reduction of genes involved in anthocyanin biosynthesis has been found. Among
them, anthocyanin synthase, FaANS1 (gene32347, FvH4_5g01170) (Almeida et al., 2007) and
anthocyanin glucosyl transferase, FaUFGT (gene12591, FvH4_7g33840), demonstrated to be
responsible for the content of the major anthocyanin component, pelargonidin-3-glucose
(Griesser et al., 2008), were downregulated. Also, some malonyltransferases were downregulated,
including the FaMalTransf (gene04258, FvH4_6g46740), a putative anthocyanin malonyl
transferase (Fig 8) (Davik et al., 2020).

CHAPTER 2
268 Functional characterization of molecular regulatory mechanisms controlling the ripening in strawberry fruit
Furthermore, the flavanone 3-hydroxylase, FaFLS (gene01064, FvH4_2g29990;
(Almeida et al., 2007)) responsible for the synthesis of kaempferol, and the flavonoid
3’monooxygenase FaF’3H (gene05304, FvH4_6g34950), were downregulated. The FaUF3GT
(gene11466, FvH4_4g03650), which presents high homology with other kaempferol-3-
glucosyltransferases previously described in Rosa hybrida (Fukuchi-Mizutani et al., 2011), also
appears to be downregulated. These data were corroborated by qRT-PCR analysis (Fig 8),
indicating that FaMYB123 is a putative regulator of anthocyanin/flavonol derivates.
Fig 8. Expression data of selected genes related with phenylpropanoid and flavonoid metabolism in
FaMYB123-silenced receptacles obtained by qRT-PCR. Statistical significance with respect to reference
sample was determined by the Student's t-test in all experiments. (**) p-value ˂ 0.01
In-silico analyses of the gene promoters putatively regulated by FaMYB123: FvUFGT,
FvMalTransf, FvANS and FvUF3GT were obtained from the public databases. Several MYB-
binding boxes were found in these promoters which may indicate that FaMYB123 would directly
transactivate the expression of those genes (Fig 9).
Fig 9. Schematic diagram of FaMalTransf, FvGT1, FvUF3GT, FvANS promoters from Fragaria vesca.
The upper bar shows the length of the promoter fragment relative to the ATG start codon. The location of
the MYB motif is shown using black lines.

CHAPTER 2
269 PhD Thesis Félix Juan Martínez Rivas
Metabolite analysis of FaMYB123-RNAi transgenic fruits
Global metabolomic analysis showed that the total anthocyanin level, in transgenic fruit
receptacles was significantly decreased (Fig 10A). To determine which compounds belonging to
the phenylpropanoid/flavonoid/anthocyanin metabolic pathway present differences between
control and FaMYB123 silenced receptacles, the major soluble phenolic compounds were
identified by LC-MS in three independent transgenics lines as well as in control receptacles. A
principal component analysis of the compounds identified by LC-MS analysis was performed,
following a clear separation between the transgenics and control receptacles was observed (Fig
10B).
Fig 10. (a) Quantification of anthocyanin in control and FaMYB123-RNAi red receptacles; Values are
obtained as absorbance measurement at 515nm. (b) Principal component analysis of metabolites identified
in receptacles of control (red dots) vs transgenics lines (green, blue, and cyan dots). Eight replicates were
used in metabolomic analysis for each condition
We observed in the transgenics receptacles changes in the metabolic contents. Higher
levels of propealargonidins and procyanidins that are dimers and trimers of pelargonidin and
cyanidin were found as well as higher contents of (epi)catechin and (epi)afzelechin (Fig 11,
Additional file 1). These compounds are usually found in the unripe receptacles of strawberry,
and normally they are catabolized to produce the anthocyanin monomers in the ripen receptacles.
Also, epi(catechin), sanguiin and ellagic acids are found in higher concentrations in transgenics
receptacles, showing a general overaccumulation of condensed aggregates and tannins, which are
usually present at minor levels in ripe receptacles
Moreover, the transgenic receptacles showed a clear decrease in pelargonidin-3-glucoside
and an almost total loss of pelargonidin-3-(6’malonylglucoside), the major pelargonidin
derivative, as shown in Fig 11, Additional file 1. Among other results, we observed a decrease in
other derivates of pelargonidin, such as pelargonidin-3-rutenoside and pelargonidin-3,5-

CHAPTER 2
270 Functional characterization of molecular regulatory mechanisms controlling the ripening in strawberry fruit
diglucoside, cyanidin-3-glucoside, cyanidin-3-(6’malonylglucoside) and cyanidin-3-rutenoside
(Fig 11, Additional file 1).
Fig 10. Heatmap representation of the secondary metabolism profiling by LC-MS analysis. Extracted
anthocyanins, flavonols, procyanidin and proanthocyanidins and condensed tannins. The colour scale is
shown on the right; red represents high content; blue represents low content.
Levels of flavonols and flavones were also determined. The main component of flavonol
in strawberry, kaempferol and its derivates, as kaempferol-3-glucose, kaempferol-3-rutenoside,
and kaempferol-3malonylglucose are less abundant in the transgenics than in the control

CHAPTER 2
271 PhD Thesis Félix Juan Martínez Rivas
receptacles. Quercetins present the same pattern for quercitin-3-glucose and quercitin-3-
malonylglucose, which are decreased in the transgenics fruits, as well as flavonoid quercitin-3-
rutenoside (rutin), which also appears less represented (Fig 11, Additional file 1). Due to the
silencing of FaUF3GT, the production of kaempferol-3-glucoside is down-regulated. This results
in a redirection of the metabolic flux in the transgenics plant to the production of kaempferol-3-
coumaryl-glucose, which is presented in higher concentration in the transgenics than in the
control.
FaMYB123 interacts with FabHLH3, a flavonoid related TF
Is has been previously described that the synthesis of proanthocyanins in immature
strawberry receptacles is regulated by the interaction between FabHLH3 and FaMYB9 (an R2R3
TF MYB) (Schaart et al., 2013). Interestingly, the expression of FabHLH3 gene is constitutive
along fruit receptacle growth and ripening while the expression of FaMYB9 drastically decreased
along the different stages of fruit development (Schaart et al., 2013). This suggested the
possibility that FabHLH3 also could interact with FaMYB123. To analyze the in-vitro binding
capacity of FaMYB123 we performed a targeted Y2H experiment. The co-expression of
FaMYB123 fused to the GAL4 DNA-binding domain and FabHLH3 to the GAL4 DNA-
activating domain allowed yeast to grow on synthetic media lacking Leu, His and Trp and
supplemented with 10mM of 3-AT, which was rated as a positive interaction (Fig 12A).
Similarly, we have observed growth between FabHLH3 and FaMYB9, which was used
as a positive control (Schaart et al., 2013). A BiFC assay was additionally performed to test the
interaction between FaMYB123 and FabHLH3 in vivo. Both genes were co-transformed into an
epidermal onion cell by microparticle bombardment. Using confocal microscopy, only YFP
fluorescence was detected in the nucleus (Fig. 12B). No fluorescence was detected in negative
controls. These results showed that both FaMYB123 and FabHLH3 can physically interact, both
in vitro and in vivo.

CHAPTER 2
272 Functional characterization of molecular regulatory mechanisms controlling the ripening in strawberry fruit
Fig 12. (a) Yeast two hybrid assay for the interaction between FaMYB123 with FabHLH3. Open reading
frames of the FaMYB123, FabHLH3 and FaMYB9 TFs were recombined into the bait vector (pDEST32)
and prey vector (pDEST22). The yeast stains used for the drop test were PJ69-4a (MATa) and PG69-4α
(MATα). pDEST32-FabHLH3 and pDEST22-FaMYB9 were used as positive controls. The empty vectors
pDEST22 or pDEST32 were also co-transformed as negative controls. The ability of yeast cells to grow on
synthetic defined medium lacking Leu, Trp, and His but containing 10 mM of 3-AT was scored as a positive
interaction. (b) BiFC. Yellow fluorescent protein (YFP) reconstruction in the nuclei of bombarded onion
(Allium cepa) epidermal cells transformed with constructs containing FaMYB123 and FabHLH3 fused with
halves of YFP. Merge indicates a digital merge of brightfield and fluorescent images.
To test if FabHLH3 was able to bind other MYB TF distinct than FaMYB123, we also
tested the interaction with FaMYB10 and FaEOBII, MYB TF with a ripening related expression
pattern. FabHLH3 did not interact with these TFs, revealing a specificity for FaMYB123 and
FaMYB9 (Fig 13).
Fig 13. Yeast two hybrid assay for the interaction between FaMYB10, FaEOBII with FabHLH3. Open
reading frames of the FaMYB123, FabHLH3 and FaMYB9 TFs were recombined into the bait vector
(pDEST32) and prey vector (pDEST22). The yeast stains used for the drop test were PJ69-4a (MATa) and
PG69-4α (MATα). The empty vectors pDEST22 or pDEST32 were also co-transformed as negative
controls. The ability of yeast cells to grow on synthetic defined medium lacking Leu, Trp, and His but
containing 10 mM of 3-aminotriazole was scored as a positive interaction.

CHAPTER 2
273 PhD Thesis Félix Juan Martínez Rivas
Discussion
During the ripening process, many metabolic pathways are involved to produce the
physiological changes responsible of organoleptic properties of strawberry, such as colour, aroma,
and flavour. The molecular pathways that determine the quality properties of fruit receptacle are
finely regulated by the action of various TFs (Aharoni et al., 2001; Daminato et al., 2013; Medina-
Puche et al., 2014; Medina-Puche et al., 2015, Molina-Hidalgo et al., 2016; Zhang et al., 2018;
Vallarino et al., 2020; Zhang et al., 2020). The results presented here bring out that the strawberry
R2R3 MYB regulator, FaMYB123, interacting with the bHLH protein FabHLH3, are necessary
for anthocyanin/flavonoid production along the ripen stages.
FaMYB123, a MYB-like TF is ripening-related and hormonally regulated.
Bioinformatic analysis of the FaMYB123 deduced protein indicate that it presents the
typical R2R3 MYB domains as other MYB TFs. (Lipsick, 1996). (Fig 1A). The phylogenetic
analysis with protein sequences of MYB TF with inferred function reveals that FaMYB123 show
a high degree of similarity with transparent testa MYB TFs, as the A.thaliana AtTT2 and
V.vinifera VvMYBPA2 (Fig 2). TT2 TF have been related with the regulation of structural genes
related to proanthocyanidin production (Baudry et al., 2004; Terrier et al., 2009). However,
recently there have been described that TT2 are also involved in the production of anthocyanin in
fruits (Wang et al., 2018; Wang et al., 2019).
Most of the genes that encode enzymes related to organoleptic properties of the
strawberry fruit receptacle present a common global gene expression model. This is characterized
by being: (i) induced throughout the fruit receptacle ripening; (ii) fruit specific expression and
(iii) expression activated by ABA and repressed by auxins (Cluster UP ABA+AUX-; (Medina-
Puche et al., 2016). These expression criteria are fulfilled by genes responsible for the
development of fruit colour (FaUFGT, FaANS), flavonols (FaFLS, FaF’3H) and
phenylpropanoids metabolism related genes (FaCAD1, FaCCR, FaEGS2), aroma (FaSAAT,
FaAAT2, FaQR), cell wall disassembly (FaPLB, FaExpansin2, FaPG1 and FaPG2, FaRGlyase1,
Fa 1-4 endoglucanase) (Almeida et al., 2007; Medina-Puche et al., 2016), and references
included in this paper).In addition, TFs functionally characterized throughout the ripening process
as FaMYB10 (Medina-Puche et al., 2014), FaEOBII (Medina-Puche et al., 2015), FaDOF2
(Molina-Hidalgo et al., 2017) as well as FaSCR (Pillet et al., 2015) display identical expression
profiles to that observed for FaMYB123, and all belong to (Cluster UP ABA+AUX-).
Interestingly, these TFs regulate the expression of structural genes belonging to discrete nodes of
the flavonoid biosynthetic pathway and are responsible for some fruit quality characteristics. The
expression of FaMYB123 is predominately found in the late steps of ripening (R, OR), while low
CHAPTER 2
274 Functional characterization of molecular regulatory mechanisms controlling the ripening in strawberry fruit
levels are found in the early stages of the development process (Fig 5A). Moreover, its expression
is related mainly to the receptacle, not being expressed in the achenes of any stages (Fig 5C) and
found only in low expression in the vegetative tissues (Fig 5B). Similar expression profiles to that
observed for FaMYB123 are observed for other TFs that regulate the expression of different genes
belonging to the flavonoid node such and above mentioned. This co-regulation between these
transcription factors, could suggest according to the “guilt by association” principle, that
FaMYB123 would regulate genes belonging to these discrete nodes of the flavonoid biosynthetic
pathway (Pillet et al., 2015).
FaMYB123 partially regulates anthocyanin and flavonol metabolic pathways.
As FaMYB123 protein present high sequence homology with other R2R3 MYB TF
related with the phenylpropanoids/flavonoids/anthocyanins and proantocyanins biosynthesis we
focused the metabolomic analysis on these compounds. Additionally, we have determined the
expression of the genes that codify the enzymes related to those pathways.
The metabolomic results of FaMYB123-RNAi transgenic receptacles displayed a
reduction in total anthocyanin content, as well as an increase of proanthocyanin content (Fig 10,
11, Additional file 1). In strawberry fruits, anthocyanins are synthetized during the ripening
process, while proanthocyanin are related to the early stages of growing and development (Aaby
et al., 2007; Buendía et al., 2010). In our analysis we have found a clear decrease in the
concentration of the predominant anthocyanins in strawberry fruits as pelargonidin-3-glucose,
cyanidin-3-glucose as well as their malonyl derivates pelargonidin 3-(6''-malonylglucoside) and
cyanidin 3-(6''-malonylglucoside) (Fig 11). These results are in line with the down regulation of
FaANS and FaUFGT gene expression that was observed in FaMYB123-RNAi receptacles. Both
are structural genes encoding the last enzymes of the anthocyanin metabolic pathway, catalysing
the synthesis of pelargonidin and pelargonidin-3-glucoside respectively (Almeida et al., 2007;
Griesser et al., 2008). Indeed, the knockdown of FaUFGT by RNAi produced a clear reduction
on the content of pelargonidin-3-glucose and its malonyl derivate, receptacles (Griesser et al.,
2008). Similar pattern in these metabolites were found in FaMYB123-RNAi receptacles.
Recently, in Fragaria vesca, quantitative trait locus studies comparing three different
hybrid population of strawberry (´Carisma x Senga Sengana`; ´Marlate x Senga Sengana` and
¨Saga x Senga Sengana`), revealed a QTL associated with the presence/absence of pelargonidin
3-(6''-malonylglucoside) and located in chromosome 6. In this single major gene locus seven
genes coding putative phenolic glucoside malonyl transferase (FvH4_6g46740.t1;
FvH4_6g46741.t1; FvH4_6g46742.t1; FvH4_6g46743.t1; FvH4_6g46750.t1;
FvH4_6g46770.t1; FvH4_6g46780.t1) were observed (Davik et al., 2020). The expression of

CHAPTER 2
275 PhD Thesis Félix Juan Martínez Rivas
three of them was up-regulated in ripen Fragaria vesca fruits (Hawkins et al., 2017). The
expression of gene04258 (FvH4_6g46740, herein referred as FaMalTransf), was down-regulated
in FaMYB123-RNAi receptacles, supporting that this gene is responsible for the biosynthesis of
pelargonidin 3-(6''-malonylglucoside) in strawberry ripen receptacle (Fig 8).
A clear reduction of flavonol pathway was also observed (Fig 15) concomitant with the
reduction on FaUF3GT transcript level. This gene presents a high sequence homology with a
flavonoid 3-glucosyltransferase from Rosa hybrida (RhUF3GT) responsible for the synthesis of
kampferol-3-glucoside (Fukuchi-Mizutani et al., 2011). Flavonol compounds as kaempferol-3-
glucoside, kaempferol 3-(6''-malonylglucoside) as well as quercitin-3-glucoside and quercitin-3-
(6''-malonylglucoside) were found in less concentration in transgenic receptacles. These results
suggest that FaMYB123 is controlling not only the late steps of the anthocyanin pathway but also
other branch of the flavonoids metabolic pathway, related to the biosynthesis of flavonol
compounds, as kaempferol and quercetin (Fig 15).
When FaMYB123 is knocked down, we observed a higher expression of FaANR,
encoding an anthocyanidin reductase, and FaLAR, encoding a leucoantocyanidin reductase both
enzymes related with the synthesis of epicatechin, epiafzelechin and other related compounds
(Fig 8). Those up regulation in gene expression are in line with the increase of flavan-3-ols as
catechin and epicatechin as well as their monohydroxylated equivalents afzlechin and
epiafzlechin and glycosylated derivatives.
Interestingly, similar results were obtained in transgenic fruit receptacles in which the
expression of FaMYB10 was silenced, where a clear reduction in the quantity of pelargonidin-3-
glucoside, pelargonidin 3-(6''-malonylglucoside), cyanidin-3-glucoside, kaemperol-3-glucose,
kaempferol-3-glucuronide, quercitin-3-glucuronide and (epi)afzelechin-catechin-dimers was
found (Medina-Puche et al., 2014). Besides, an increase of the content of ellagic acid, cinnamoyl-
glucose, caffeoyl-glucose, feruloyl-glucose and (epi)afzelechin-glucoside, was also observed
(Medina-Puche et al., 2014). These changes in metabolites were accompanied by the down-
regulation of receptacle specific and ripening related genes that are involved to the biosynthesis
of these compounds as FaPAL, FaCH4, FaCL, FaCHS, FaCHI, FaDFR, FaANS, FaUFGT
(Medina-Puche et al., 2014). Of these genes FaCL, FaANS and FaUFGT were also down
regulated by FaMYB123, suggesting a synergistic effect between FaMYB10 and FaMYB123 in
activating the promoters that they co-regulate (Fig 14). Similar results were found in receptacles
where the silencing of the TF FaSCL8 gene resulted in an increase of FaANR1 gene expression
(Pillet et al., 2015). This suggests that FaMYB123, as well as FaSCL8, could play additional
regulatory roles, probably related to tannin and quercetin production in fruit receptacle.

CHAPTER 2
276 Functional characterization of molecular regulatory mechanisms controlling the ripening in strawberry fruit
FaMYB123 interacts with FabHLH3 in the nucleus
A model on the regulation of the synthesis of proanthocyanins has been proposed in
strawberry green immature fruits based on the interaction between FaMYB9 and FabHLH3 TFs,
that might be able to activate the FaANR and FaLAR expression (Schaart et al., 2013). This model
was tested using a heterologous system where both TFs were co-expressed enabling the
transactivation of the AtANR promoter (Schaart et al., 2013). In transgenics FaMYB123-RNAi
receptacles, contrary to what happens in red control fruits, the expression of FaANR and FaLAR
was up-regulated. This suggests, that FaMYB123 through its with FabHLH3, would form a
repressive complex of FaLAR and FaANR expression in normal ripe fruit receptacle.
Additionally, we could not determine between FabHLH3 with other ripening related R2R3 MYB
TFs as FaMYB10 and FaEOBII. We propose that FabHLH3, whose expression is constitutive
throughout the developmental and ripening process, would play a pivotal role between the
biosynthetic pathways of pro-anthocyanidins and that of flavonols and anthocyanins. This pivotal
role would depend on the MYB TF interacting with bHLH3, thus, though the interaction with
MYB9 will activate the proanthocyanin biosynthesis and with FaMYB123 the anthocyanin.
Even though TT2 TF have been related with proanthocyanin biosynthesis, it has been
demonstrated that they can regulate the anthocyanin production in kiwifruit (Actinidia chinensis)
through a complex between a R2R3 MYB TF (AcMYB123) and a bHLH TF (AcbHLH42) (Wang
et al., 2019). AcMYB123 is most closely related to the Arabidopsis TT2/AtMYB132 and a
putative orthologous of FaMYB123 and, as in the case of FaMYB123, activates the expression
of structural genes belonging to late biosynthetic steps of the flavonoid pathway (LBG), as AcANS
and AcUFGT (Wang et al., 2019). In their work the authors conclude that both TFs are
components involved in spatiotemporal regulation of anthocyanin biosynthesis in ripen kiwi fruit
Similar results were found in apple, where a TT2-like MdMYBPA1 TF regulates synthesis of
anthocyanin under low-temperature conditions by transactivating MdANS and MdUFGT
promoters and therefore, their expression (Wang et al., 2018). Furthermore, the in silico analysis
of the promoters of FvANS, FvUFGT, FvMalTransf and FvUF3GT related to
anthocyanin/flavonol pathway showed the presence of several MYB recognition boxes (Fig 9),
suggesting that FaMYB123 would act on these promoters, being responsible of that regulation.
In eukaryotes, the regulatory activity of the gene promoters is influenced by their
architecture. In an individual promoter, several different cis-regulatory sequences are contained.
Depending on the synergistically binding of different TF, gene expression is regulated. In this
sense, the expression of both early and late structural genes belonging to the phenylpropanoid
pathway is regulated by a complex regulatory network of TF (Daminato et al., 2013; Medina-
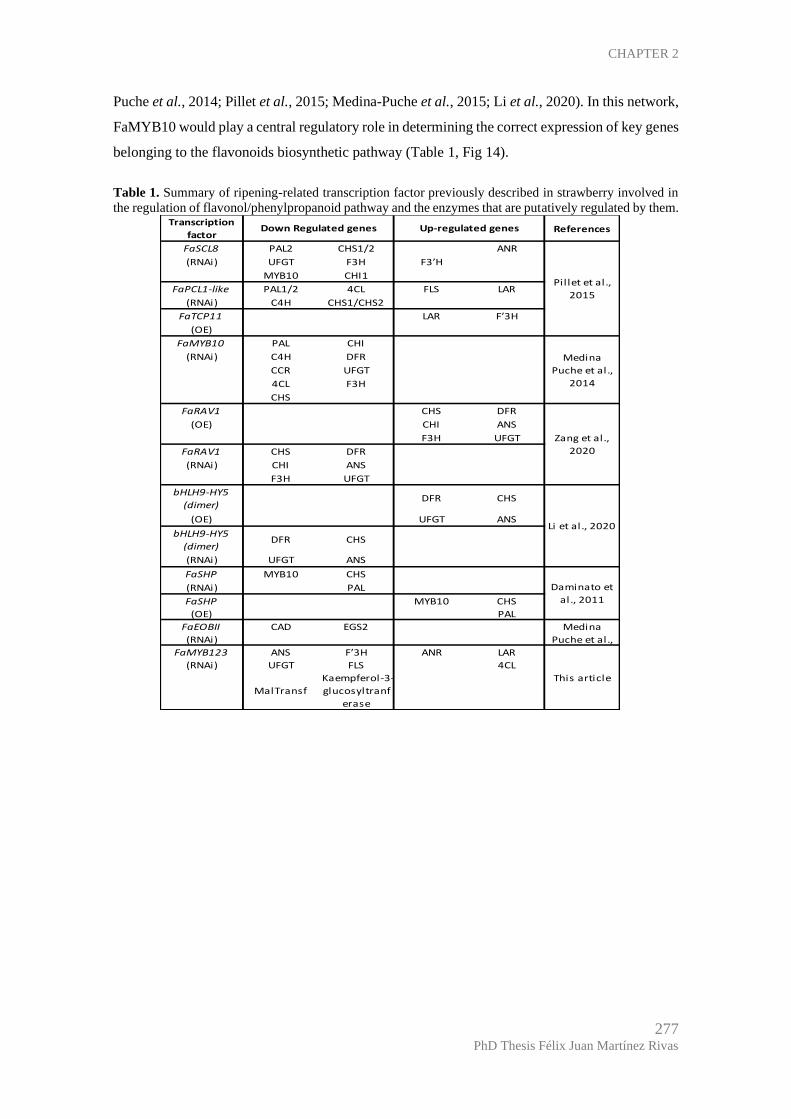
CHAPTER 2
277 PhD Thesis Félix Juan Martínez Rivas
Puche et al., 2014; Pillet et al., 2015; Medina-Puche et al., 2015; Li et al., 2020). In this network,
FaMYB10 would play a central regulatory role in determining the correct expression of key genes
belonging to the flavonoids biosynthetic pathway (Table 1, Fig 14).
Table 1. Summary of ripening-related transcription factor previously described in strawberry involved in
the regulation of flavonol/phenylpropanoid pathway and the enzymes that are putatively regulated by them.
Transcription
factorReferences
FaSCL8 PAL2 CHS1/2 ANR
(RNAi) UFGT F3H F3’H
MYB10 CHI1
FaPCL1-like PAL1/2 4CL FLS LAR
(RNAi) C4H CHS1/CHS2
FaTCP11 LAR F’3H
(OE)
FaMYB10 PAL CHI
(RNAi) C4H DFR
CCR UFGT
4CL F3H
CHS
FaRAV1 CHS DFR
(OE) CHI ANS
F3H UFGT
FaRAV1 CHS DFR
(RNAi) CHI ANS
F3H UFGT
bHLH9-HY5
(dimer)DFR CHS
(OE) UFGT ANS
bHLH9-HY5
(dimer)DFR CHS
(RNAi) UFGT ANS
FaSHP MYB10 CHS
(RNAi) PAL
FaSHP MYB10 CHS
(OE) PAL
FaEOBII CAD EGS2
(RNAi)
FaMYB123 ANS F’3H ANR LAR
(RNAi) UFGT FLS 4CL
MalTransf
Kaempferol-3-
glucosyltranf
erase
This article
Pillet et al.,
2015
Medina
Puche et al.,
2014
Zang et al.,
2020
Li et al., 2020
Down Regulated genes Up-regulated genes
Daminato et
al., 2011
Medina
Puche et al.,

CHAPTER 2
278 Functional characterization of molecular regulatory mechanisms controlling the ripening in strawberry fruit
Fig 14. Transcription factor regulating the flavonoid/anthocyanin/phenylpropanoid pathway based on
previous analysis. Green boxes reveal a downregulation of the enzymes by these TF, while red boxes are
an up-regulation
In turn, the expression of FaMYB10 gene is regulated by other upstream TFs such as
FaSCR, FaRAV and probably also by FaSHP. Additionally, FaRAV1, FaHY5 and FaMYB123
regulates, independently of FaMYB10, the expression of FaANS. Similarly, FaMYB123 regulates
the expression of FaFLS, FaUF3GT, FaF3´H and FaMaltransf without the additional contest of
other functionally characterized TFs (Table 1, Fig 14). This specific regulation of gene expression
was also observed for the case of FaEOBII other strawberry fruit specific and ripening related
R2R3 MYB TF (Medina-Puche et al., 2015). As in the case of FaHY5, FaMYB123 expression
was independent of that of the FaMYB10 suggesting that FaMYB123, FaHY5 and FaMYB10
collaborate together, synergistically regulating the promoter activity of FaDFR, FaUFGT and
FaF3H (Medina-Puche et al., 2015; Li et al., 2020).

CHAPTER 2
279 PhD Thesis Félix Juan Martínez Rivas
Fig 15. Schematic diagram of the phenylpropanoid, flavonoid, and anthocyanin pathway. Enzymes that are
down- and upregulated due to FaMYB123 knockdown are shown in blue and red, respectively. qRT-PCR
data is included in FigS4. Boxplots show the levels of metabolites in control and transgenics receptacles.
Y axis represent the normalized area of each compound in LC-MS analysis. PAL, phenylamonia lyase 4CL,
4-coumaryl-CoA ligase; ANS, anthocyanidin synthase; C4H, cinnamic acid 4-hydroxylase; CHI, chalcone
isomerase; CHS, chalcone synthase; DFR dihydroflavonol reductase; F3H, flavanone 3-hydroxylase; F3’H,
flavonoid3’-hydroxylase; GT1, anthocyanin 3-glucosyltransferase; MT, malonyl transferase; UF3GT,
UDP::flavonol 3 glucosyltransferase. (**) p<0.001.
In summary, this work provides functional data demonstrating that FaMYB123 is a
ripening related, receptacle specific TF that, as in the case of FaMYB10 and FaEOBII, regulates
the late steps of the phenylpropanoid pathway in the strawberry fruit receptacles. FaMYB123 is
strongly regulated by both ABA and auxins, the key hormones that control the ripening process.
The expression analysis combined with the metabolomic data in transgenics receptacles indicate
that FaMYB123 is regulating the branches the late steps of the phenylpropanoid pathway that
produce pelargonidin-3-glucose, cyanidin-3-glucose as well as their malonyl derivates
pelargonidin 3-(6''-malonylglucoside) and cyanidin 3-(6''-malonylglucoside) the most abundant
anthocyanins present in ripen strawberry receptacles and key components of the strawberry

CHAPTER 2
280 Functional characterization of molecular regulatory mechanisms controlling the ripening in strawberry fruit
colour, as well as flavonol compounds as kaempferol-3-glucoside, kaempferol 3-(6''-
malonylglucoside) as well as quercitin-3-glucoside and quercitin-3-(6''-malonylglucoside).
Material and methods
Plant Material and RNA isolation
Strawberry plants (Fragaria × ananassa Duch. cv. Camarosa) were grown under field
conditions in Huelva (S.W. Spain). Fruits at different developmental and ripening stages were
harvested: small-sized green (G1, 2-3 g), full-sized green (G3, 5-8 g), white (W, 8-12 g), full-ripe
red (R, 9-15 g) overripe (OR, 9-15 g) and senescent (SN, 9-15 g). Vegetative tissues, such as
runners, roots, and expanding leaves, were also harvested. All analysed tissues were immediately
frozen in liquid nitrogen upon harvesting and stored at -80 oC. Nicotiana benthamiana plants used
for agroinfiltration were grown in a plant chamber at 25 ºC, 10.000 lux and 80% humidity and
afterwards maintained in a greenhouse. Total RNA was isolated, and further purified, from three
independent pools of strawberry fruits at different developmental and ripening stages (at least 10
fruits per pool), as well as from vegetative tissues, as previously described in (Molina-Hidalgo et
al., 2015).
Hormone treatments
For auxin treatment, achenes of two sets of 50 full-sized green fruits (G3) were carefully
removed from their receptacles with the use of a scalpel. One set of deachened fruits was treated
with indole-3-acetic acid (IAA) in lanolin paste (1 mL) containing 1 mM of auxin IAA in 1 %
(w/v) DMSO. The control group was treated with the same paste, but without IAA. Auxin
treatments, sample collection and analysis were performed according to (Medina-Puche et al.,
2014).
In ABA experiments, three approaches were used to modulate ABA content in fruits, two
of them directly related to altering its biosynthetic pathway: either inhibiting NCED enzyme
activity, by using nordihydroguaiaretic acid (NDGA), (Creelman et al., 1992), or silencing the
FaNCED1 gene expression by RNAi. Fruits at early white stage of ripening were used. Treatment
was performed in accordance with Medina-Puche et al., (2014). On the other hand, water stress
treatments were reported to increase ABA content in fruit (Medina-Puche et al., 2014). For this
purpose, fruits at white stage were harvested along with their pedicels; in the stress group, fruits
were kept with their pedicel outdoors, whereas the control group were immersed in a MS medium
with sucrose, which was changed every two days. The stress treatment condition and sample
analysis were performed as described in Molina-Hidalgo et al., (2015). These samples were used

CHAPTER 2
281 PhD Thesis Félix Juan Martínez Rivas
for ABA measurement and relative expression of FaMYB123 and FaNCED1. ABA extraction
procedure and HPLC-MS conditions was performed as described in Medina-Puche et al., (2014).
Analysis of nucleotide and deduced amino acid sequence of FaMYB123 gene
In-silico analysis of the FaMYB123 gene sequence was made using the available
resources both from the European Bioinformatics Institute server (EBI; http://www.ebi.ac.uk) and
the National Center for Biotechnology Information (NCBI, Bethesda, MD;
(http://www.ncbi.nlm.nih.gov). Prediction of functional sites and domains in the protein sequence
was performed using the InterProScan 5.0 (http://www.ebi.ac.uk/Tools/pfa/iprscan5/).
Subcellular location was predicted using CELLO v.2.5 (http://cello.life.nctu.edu.tw/). We used
the BlastP algorithm to align the amino acid FaMYB123 sequence against databases. The GDR
database using the best available F. vesca genome (v 4.01) (Edger et al., 2019) was used to
localize the promoters used for in-silico studies. Analysis of promoters were performed using the
PlantCARE database (http://bioinformatics.psb.ugent.be/webtools/plantcare/html/). To align
FaMYB123 with other R2R3 MYB TF, sequences from other species with inferred function were
downloaded from the databases. Sequences from A.thaliana were downloaded from TAIR
database. Multiple sequence alignment and phylogenetic tree were performed with EBI Clustal
W2 program. Representation were performed with FigTree
(http://tree.bio.ed.ac.uk/software/figtree), using a bootstrap analysis with 1000 replicates.
Generation of FaMYB123-RNAi construct and silencing of FaMYB123 expression in
strawberry plants
The FaMYB123 gene was cloned into pFRN-RNAi binary vector (courtesy of Marten
Denekamp from Department of Molecular Cell Biology, University of Utrecht, The Netherlands)
using the Gateway technology (Invitrogen). Briefly, a region from the FaMYB123 cDNA was
PCR-amplified and used in the silencing construct (primers listed in Table S3). The resulting
amplicon was cloned into pCR8/GW/TOPO (Invitrogen) and subsequently transferred to the
Gateway pFRN vector using LR clonase (Invitrogen). The RNAi construct generated (pFRN-
FaMYB123) was tested by sequencing prior to strawberry plant transformation. The protocol used
to generate the FaNCED1-RNAi constructs was similar, as described in Medina-Puche et al.,
(2014).
The generated pFRN-FaMYB123 plasmid was introduced into Agrobacterium
tumefaciens AGL1 strain. Then, leaf discs of strawberry plants, cv. Chandler, micropropagated in
vitro were used as explants for Agrobacterium-mediated transformation experiments, following
the protocol described in (Barceló et al., 1998). Explants were inoculated with a diluted culture
of A. tumefaciens and selected in 25mg L−1 kanamycin. After 7–8 months of selection, kanamycin-

CHAPTER 2
282 Functional characterization of molecular regulatory mechanisms controlling the ripening in strawberry fruit
resistant shoots were acclimated and transferred to the greenhouse. Transgenic mother plants were
propagated by runners and the daughter plants were used for phenotypic analysis. The presence
of the transgenes in these putative transgenic lines was confirmed by PCR amplification of a
fragment belonging to the nptII gene.
The A. tumefaciens strain AGL0 (Lazo et al., 1991), containing the pFRN-FaNCED1 was
used to inject strawberry fruit receptacles (Fragaria × ananassa cv. Elsanta), according to
Hoffmann et al., 2006. A total of 15-25 strawberry plants and 30-40 agroinfiltrated fruits were
independently inoculated and analysed. As control, fruits agroinfiltrated with the empty pFRN
vector were used. In all cases, the silencing percentage was determined by comparing the amount
of FaMYB123 or FaNCED1 transcripts in pFRN-FaMYB123 and pFRN-FaNCED1 fruits,
respectively, against those observed in empty pFRN vector transgenic fruits.
Expression analysis by quantitative real-time PCR
Expression analyses of FaMYB123 and the genes herein analysed and studied throughout
all physiological conditions, were performed by quantitative real-time PCR (qRT-PCR) using an
iCycler system (BioRad), as previously described (Benítez-Burraco et al., 2003). First-strand
cDNA was obtained from 2 g total RNA using iScript kit (BioRad), according to manufacturer’s
instructions. Table 3 depicts the primer sequences used for quantitative amplification. Each
reaction was performed, at least, in triplicate, and the corresponding Ct values were normalized
using the Ct value corresponding to an interspacer 26S–18S strawberry RNA gene. This gene was
selected as control owing to its constitutive expression throughout all the different tested
experimental conditions (Amil-Ruiz et al., 2013). All these values were later used to determine
the relative increase or decrease of expression of those genes studied as compared against their
expression in control, in accordance with Pedersen and Amtssygehus, 2001.

CHAPTER 2
283 PhD Thesis Félix Juan Martínez Rivas
Table 3. Primer sequences used in this work. Fw: forward; Rv: reverse. Up: upper; Low: lower.
Total anthocyanin analysis
Approximately 100mg of fresh weight of control and transgenics receptacles was poured
into 1mL of 1% (v/v) hydrochloric acid/methanol and kept at 4ºC in continuous movement for 10
min. The slurry was centrifugated at 1500g at 4ºC for 10 min. The supernatant was saved and the
absorbance at 515nm was determined. The amount of anthocyanin was calculated by using Emolar
= 36000 l mol-1 cm-1 (Woodward, 1972; Bustamante et al., 2009). Six replicates were performed
per each analysis.
Metabolite extraction, HPLC analysis and identification
For LC-MS analysis, approximately 100mg were lyophilized (Christ RVC 2-18) for 24hr,
a total of 8 biological replicates were used. The lyophilized powder was extracted with 800μl of
100% methanol with 0.2μg/mL of isovitexin as internal standard and incubated for 15 min at
70ºC. Then 400µL of water were added and centrifuged at 12.000g for 10 minutes. An aliquot of
400µL was collected and dried under vacuum. After completely dryness, it was suspended in 50%
(v/v) methanol:water.
Gene Purpose Primer Sequence 5'-3'
attB-MYB123-fw GGGGACAAGTTTGTACAAAAAAGCAGGCTTAACAATGAATACAGGAGCTTGGACTattB-MYB123-rv GGGGACCACTTTGTACAAGAAAGCTGGGTCTCAACAGCAAATGGGAGCTCMYB123qRTFw AGGCAACAGGTCTACCACTGCCTTCMYB123qRTRv TTCTTGCCGGATTCGTATGGACTGCFaMYB123RNAiGWFw CACGGCGAAGGAAAGTGGAGCAFaMYB123RNAiGWRv ACGGAACAACAAACCTTCTGTTGGGFaNCED1up GAGCTTGAAGAGTGTGTTGTCCGAAAFaNCED1low CGGTTCAGCAATGGCGAGATAAGCATA413fw ACCGTTGATTCGCACAATTGGTCATCG413rv TACTGCGGGTCGGCAATCGGACG 09753qRT-UP GGCGAAAAGGTCAGGTCAC09753qRT-LOW CTGGCACATAGCTGTGAATACC28093qRT-UP ACCGTGTACGGTGAGCACT28093qRT-LOW GGTGAAGAAAGGAACCGTCA09603qRT-UP TGATATTGACAAGGCGTTGAA09603qRT-LOW CGACGAACAACTGAGTGACC21346qRT-UP GGTGCAGTGGGTTCAGAAGT21346qRT-LOW TAATGGCTTGGAGGTTGTGA12591qRT-UP CACCGATCTTGAGGACGGAC12591qRT-LOW AGCAGCTTTATCAGCCCACA24655qRT-UP AAGGGAGCTTTGATGCTGCT24655qRT-LOW CTCCTTGGACTCCTGGCTTG32347qRT-UP AGCGCTGTTTAATTATGGGTGC32347qRT-LOW ACCACCGGAAAAACACCGAA31413qRT-UP CGGCTTCATACGCAAAGCAA31413qRT-LOW GAGTCTGTGGTGGTGCTGTT14611qRT-UP GCGTTTTCCAGATTGTTGAT14611qRT-LOW TAAATGGCTGGAAACGATGA26825qRT-UP TGCTTCACAAAATCAAAATGG26825qRT-LOW AGATTTGTCACTGTTGGTGAT14712qRT-UP AAATTCCGGAGCCATTAACT14712qRT-LOW CTGATTCTTGATCGTGGAGT18732qRT-UP TCACACTGACAAACAATGGA18732qRT-LOW TTCTCCACACATCATGACTC05304qRT-UP ACACTAACGTCTTGCTCAAA05304qRT-LOW CCCCAATATTCAACACTCCA29482qRT-UP GAGCATCTGGGTTCATAGC29482qRT-LOW TCCACTATTACATCAGGAGC04258qRT-UP CTTCGACTTCGTCCAGGTT04258qRT-LOW ACTTACAGCTACAACCAGTC11466qRT-UP TATCTCACTCTTCTCCGGTT11466qRT-LOW GGTGAGGAACAACCCTATTT15073RT-UP TGCAATCAGTGTGAGGGTGT15073RT-LOW ATTTCGCTATCTTGGCATTTC18167qRT-UP TTTGACGATGGGCCATTT18167qRT-LOW AATGGGATATATGCAATGTCAGC20700qRT-UP CGACTTGATCTTCCGCAGTT20700qRT-LOW TGGAGTTGATGACCACAATGTT29483qRT-UP GTGCTGGAAAGGCACTGG29483qRT-LOW TTGGCAACAACAACTCTTGC19221qRT-UP ATAGGCAAATTGGCTGGGGT19921qRT-LOW GGGTACCCCATTTTCTTGCAC
FaMYB123
GFP construct
qRT-PCR
RNAi construct
gene09753 (FaPAL) qRT-PCR
gene28093 (FaC4H) qRT-PCR
FaNCED1 qRT-PCR
Interspacer 26S-18S qRT-PCR
gene24655 (FaANR) qRT-PCR
gene12591 (FaGT1) qRT-PCR
gene09603 (Fa4CL) qRT-PCR
gene21346 (FaCHI) qRT-PCR
gene14611 (FaF3H) qRT-PCR
gene32347 (FaANS) qRT-PCR
gene31413 (FaMYB10) qRT-PCR
gene01064 (FaFLS) qRT-PCR
gene05304 (FaF'3H) qRT-PCR
gene26825 (FaCHS) qRT-PCR
gene14712 (FaDFR2) qRT-PCR
gene11466 (FaUF3GT) qRT-PCR
gene15073 (FaMATE) qRT-PCR
gene29482 (FaDFR) qRT-PCR
gene04258 (FaMalTransf) qRT-PCR
gene19221 (FaLAR) qRT-PCR
gene29483 (FaCCR) qRT-PCR
gene18167 (FaGST1) qRT-PCR
gene20700 (FaCAD1) qRT-PCR

CHAPTER 2
284 Functional characterization of molecular regulatory mechanisms controlling the ripening in strawberry fruit
Secondary metabolites were profiled by the Waters Acquity UPLC system coupled to the
Q-Exactive Orbitrap mass detector according to the previously published protocol (Giavalisco et
al., 2009). The UPLC system was equipped with an HSS T3 C18 reversed phase column (100 ×
2.1mm i.d., 1.8-µm particle size; Waters) that was operated at a temperature of 40°C. The mobile
phases consisted of 0.1% formic acid in water (Solvent A) and 0.1% formic acid in acetonitrile
(Solvent B). The flow rate of the mobile phase was 400 µL/min, and 2μL of sample was loaded
per injection. The UPLC was connected to an Exactive Orbitrap (Thermo Fisher Scientific) via a
heated electrospray source (Thermo Fisher Scientific). The spectra were recorded using full scan
mode of negative and positive ion detection, covering a mass range from m/z 100 to 1500. The
resolution was set to 25.000, and the maximum scan time was set to 250ms. The sheath gas was
set to a value of 60, while the auxiliary gas was set to 35. The transfer capillary temperature was
set to 150°C, while the heater temperature was adjusted to 300°C. The spray voltage was fixed at
3kV, with a capillary voltage and a skimmer voltage of 25 and 15V, respectively. MS spectra
were recorded from minute 0 to 19 of the UPLC gradient. Molecular masses, retention time, and
associated peak intensities were extracted from the raw files using RefinerMS (version 5.3;
GeneData), and Xcalibur software (Thermo Fisher Scientific). Metabolite identification and
annotation were performed using standard compounds, and extracted from Del Bubba et al., 2012;
D’Urso et al., 2016; Enomoto et al., 2018; Vallarino et al., 2020. Data are reported in a manner
compliant with the standards suggested by Fernie et al., (2011). A complete report of metabolites
identified are shown in Additional file 1.
Cloning the full-length sequence of FaMYB123 and subcellular location of the protein coded
The construct used for transient gene expression and localization studies was derived
from binary vector pK7WGF2.0, which allow N-GFP fusion to FaMYB123 protein (Karimi et
al., 2002). The full length CDS of the strawberry FaMYB123 gene was amplified and cloned into
entry vector pDONRTM221 (Invitrogen) using the BP recombination reaction (Invitrogen). Full-
length cDNA was subsequently transferred to the pK7WGF2.0 vector, using the LR
recombination reaction (Invitrogen), resulting in 35S-GFP-FaMYB123 fusion. Generated GFP
construct was tested through sequencing prior to Nicotiana leaves transformation. The
methodology used for agroinfiltration visualization and subcellular localization of the protein has
been previously described (Molina-Hidalgo et al., 2015).
Yeast-two-hybrid interaction studies
To perform the yeast-two-hybrid (Y2H) studies, the ORF sequence of FaMYB123 was
recombined into the pBDGAL4 bait vector (pDEST32; Invitrogen) and pADGAL4 prey vector
(pDEST22; Invitrogen) by means of an LR reaction. The resulting vectors were transformed into
CHAPTER 2
285 PhD Thesis Félix Juan Martínez Rivas
yeast strains PJ69-4α (MATα) and PJ69-4a (MATa) (James et al., 1996) and used in Y2H studies
as described in de Folter et al., 2005. Briefly, yeast transformant were grown in appropriate
selection liquid media lacking amino acids for selection (-Leu or -Trp) for 6hr and cell density
adjusted to OD600=0.6. Then, a 5µL of the liquid culture of every interaction tested was plated
out on a yeast media lacking His, Leu and Trp and supplemented with 10mM of 3-aminotriazole
(3-AT) to test protein-protein interaction. Plates were incubated at 28ºC for 3d. As positive
control, pDEST32-FabHLH3 and pDEST22-FaMYB9 were used (courtesy of Dr. Jan Schaart;
Wageningen UR Plant Breeding, The Netherlands). GenBank accession numbers for the genes
are: FaMYB9, JQ989281; FabHLH3 JQ989284.
Bimolecular fluorescence complementation assay
FaMYB123 and FabHLH3 were translationally fused to the N- and C-terminal domains
of Yellow Fluorescent Protein (YFP) by LR Gateway recombination reaction between the entry
vector pDONR221, harboring the FaMYB123 and FabHLH3 ORFs, and the destination vectors
pE-SPYCE-GW and pE-SPYNE-GW (courtesy of Drs. Caroline Mayer and Wolfgang Dröge-
Laser; Lehrstuhl für Pharmazeutische Biologie, Julius-Maximilians-Universität Würzburg).
Freshly prepared onion epidermal peels were co-bombarded with 1μm gold particles, coated with
the proper DNA constructs, using a biolistic Helium gun device (DuPont PDS-1000; BioRad,
USA). The fluorescence emission was measured after 48 h of incubation at 22°C in the dark in an
Axio Observer.Z1 motorized inverted microscope.
Statistical analysis of data
Statistical significance was tested with one-way ANOVA and a Scheffe post-hoc test or
with a Student’s t-test using SPSS software
Data statement
Genbank accession number is MW081987 for FaMYB123 sequence

CHAPTER 2
286 Functional characterization of molecular regulatory mechanisms controlling the ripening in strawberry fruit
References
Aaby, K., Ekeberg, D. and Skrede, G. (2007) Characterization of phenolic compounds in strawberry
(Fragaria x ananassa) fruits by different HPLC detectors and contribution of individual compounds to total
antioxidant capacity. J. Agric. Food Chem., 55, 4395–4406.
Aharoni, A., Vos, C.H. De, Wein, M., Sun, Z., Greco, R., Kroon, A., Mol, J.N. and O’Connell, A.P.
(2001) The strawberry FaMYB1 transcription factor suppresses anthocyanin and flavonol accumulation in
transgenic tobacco. Plant J., 28, 319–32. Available at: http://www.ncbi.nlm.nih.gov/pubmed/11722774.
Almeida, J.R.., D’Amico, E., Preuss, A., et al. (2007) Characterization of major enzymes and genes
involved in flavonoid and proanthocyanidin biosynthesis during fruit development in strawberry (Fragaria
×ananassa). Arch. Biochem. Biophys., 465, 61–71. Available at:
https://linkinghub.elsevier.com/retrieve/pii/S0003986107002317.
Amil-Ruiz, F., Garrido-Gala, J., Blanco-Portales, R., Folta, K.M., Muñoz-Blanco, J. and Caballero,
J.L. (2013) Identification and Validation of Reference Genes for Transcript Normalization in Strawberry
(Fragaria × ananassa) Defense Responses. PLoS One, 8.
Appelhagen, I., Lu, G.-H., Huep, G., Schmelzer, E., Weisshaar, B. and Sagasser, M. (2011)
TRANSPARENT TESTA1 interacts with R2R3-MYB factors and affects early and late steps of flavonoid
biosynthesis in the endothelium of Arabidopsis thaliana seeds. Plant J., 67, 406–419. Available at:
http://doi.wiley.com/10.1111/j.1365-313X.2011.04603.x.
Babraham Informatics (2018) FastQC: a quality control tool for high throughput sequence data. Available
at: https://www.bioinformatics.babraham.ac.uk/projects/fastqc/.
Barbera, G. La, Capriotti, A.L., Cavaliere, C., Piovesana, S., Samperi, R., Zenezini Chiozzi, R. and
Laganà, A. (2017) Comprehensive polyphenol profiling of a strawberry extract (Fragaria × ananassa) by
ultra-high-performance liquid chromatography coupled with high-resolution mass spectrometry. Anal.
Bioanal. Chem., 409, 2127–2142.
Barceló, M., El-Mansouri, I., Mercado, J.A., Quesada, M.A. and Pliego-Alfaro, F. (1998) Regeneration
and transformation via Agrobacterium tumefaciens of the strawberry cultivar Chandler. Plant Tissue Cult.
Biotechnol., 54, 29–36. Available at: http://www.banglajol.info/index.php/PTCB/article/view/6888.
Baudry, A., Heim, M.A., Dubreucq, B., Caboche, M., Weisshaar, B. and Lepiniec, L. (2004) TT2, TT8,
and TTG1 synergistically specify the expression of BANYULS and proanthocyanidin biosynthesis in
Arabidopsis thaliana. Plant J., 39, 366–80. Available at: http://www.ncbi.nlm.nih.gov/pubmed/15255866.
Bemer, M., Dijk, A.D.J. van, Immink, R.G.H. and Angenent, G.C. (2017) Cross-Family Transcription
Factor Interactions: An Additional Layer of Gene Regulation. Trends Plant Sci., 22, 66–80. Available at:
http://dx.doi.org/10.1016/j.tplants.2016.10.007.
Benítez-Burraco, A., Blanco-Portales, R., Redondo-Nevado, J., Bellido, M.L., Moyano, E., Caballero,
J.L. and Muñoz-Blanco, J. (2003) Cloning and characterization of two ripening-related strawberry
(Fragaria x ananassa cv. Chandler) pectate lyase genes. J. Exp. Bot., 54, 633–645.
Bray, N.L., Pimentel, H., Melsted, P. and Pachter, L. (2016) Near-optimal probabilistic RNA-seq
quantification. Nat. Biotechnol., 34, 525–527. Available at: http://www.nature.com/articles/nbt.3519.
Brendolise, C., Espley, R. V, Lin-Wang, K., et al. (2017) Multiple copies of a simple MYB-binding site
confers trans-regulation by specific flavonoid-related R2R3 MYBs in diverse species. Front. Plant Sci., 8,

CHAPTER 2
287 PhD Thesis Félix Juan Martínez Rivas
1–15.
Bubba, M. Del, Checchini, L., Chiuminatto, U., Doumett, S., Fibbi, D. and Giordani, E. (2012) Liquid
chromatographic/electrospray ionization tandem mass spectrometric study of polyphenolic composition of
four cultivars of Fragaria vesca L. berries and their comparative evaluation. J. Mass Spectrom., 47, 1207–
1220.
Buendía, B., Gil, M.I., Tudela, J.A., Gady, A.L., Medina, J.J., Soria, C., López, J.M. and Tomás-
Barberán, F.A. (2010) HPLC-MS analysis of proanthocyanidin oligomers and other phenolics in 15
strawberry cultivars. J. Agric. Food Chem., 58, 3916–3926.
Bustamante, C.A., Civello, P.M. and Martínez, G.A. (2009) Cloning of the promoter region of β-
xylosidase (FaXyl1) gene and effect of plant growth regulators on the expression of FaXyl1 in strawberry
fruit. Plant Sci., 177, 49–56. Available at:
https://linkinghub.elsevier.com/retrieve/pii/S0168945209000983.
Chai, Y.M., Jia, H.F., Li, C.L., Dong, Q.H. and Shen, Y.Y. (2011) FaPYR1 is involved in strawberry
fruit ripening. J. Exp. Bot., 62, 5079–5089.
Creelman, R.A., Bell, E. and Mullet, J.E. (1992) Involvement of a Lipoxygenase-Like Enzyme in
Abscisic Acid Biosynthesis. Plant Physiol., 99, 1258–1260. Available at:
http://www.plantphysiol.org/cgi/doi/10.1104/pp.99.3.1258.
D’Urso, G., Maldini, M., Pintore, G., d’Aquino, L., Montoro, P. and Pizza, C. (2016) Characterisation
of Fragaria vesca fruit from Italy following a metabolomics approach through integrated mass spectrometry
techniques. LWT - Food Sci. Technol., 74, 387–395. Available at:
http://dx.doi.org/10.1016/j.lwt.2016.07.061.
Daminato, M., Guzzo, F. and Casadoro, G. (2013) A SHATTERPROOF-like gene controls ripening in
non-climacteric strawberries, and auxin and abscisic acid antagonistically affect its expression. J. Exp. Bot.,
64, 3775–86. Available at: http://www.ncbi.nlm.nih.gov/pubmed/23888065.
Davik, J., Aaby, K., Buti, M., Alsheikh, M., Šurbanovski, N., Martens, S., Røen, D. and Sargent, D.J.
(2020) Major-effect candidate genes identified in cultivated strawberry (Fragaria × ananassa Duch.) for
ellagic acid deoxyhexoside and pelargonidin-3-O-malonylglucoside biosynthesis, key polyphenolic
compounds. Hortic. Res., 7.
Devic, M., Guilleminot, J., Debeaujon, I., Bechtold, N., Bensaude, E., Koornneef, M., Pelletier, G. and
Delseny, M. (1999) The BANYULS gene encodes a DFR-like protein and is a marker of early seed coat
development. Plant J., 19, 387–398. Available at: http://doi.wiley.com/10.1046/j.1365-
313X.1999.00529.x.
Edger, P.P., Poorten, T.J., VanBuren, R., et al. (2019) Origin and evolution of the octoploid strawberry
genome. Nat. Genet., 51, 541–547. Available at: http://www.ncbi.nlm.nih.gov/pubmed/30804557.
Enomoto, H., Sato, K., Miyamoto, K., Ohtsuka, A. and Yamane, H. (2018) Distribution Analysis of
Anthocyanins, Sugars, and Organic Acids in Strawberry Fruits Using Matrix-Assisted Laser
Desorption/Ionization-Imaging Mass Spectrometry. J. Agric. Food Chem., 66, 4958–4965.
Fernie, A.R., Aharoni, A., Willmitzer, L., et al. (2011) Recommendations for Reporting Metabolite Data.
Plant Cell, 23, 2477–2482. Available at: http://www.plantcell.org/lookup/doi/10.1105/tpc.111.086272.
Folter, S. de, Immink, R.G.H., Kieffer, M., et al. (2005) Comprehensive Interaction Map of the

CHAPTER 2
288 Functional characterization of molecular regulatory mechanisms controlling the ripening in strawberry fruit
Arabidopsis MADS Box Transcription Factors. Plant Cell, 17, 1424–1433. Available at:
http://www.plantcell.org/lookup/doi/10.1105/tpc.105.031831.
Fukuchi-Mizutani, M., Akagi, M., Ishiguro, K., Katsumoto, Y., Fukui, Y., Togami, J., Nakamura, N.
and Tanaka, Y. (2011) Biochemical and molecular characterization of anthocyanidin/flavonol 3-
glucosylation pathways in Rosa X hybrida. Plant Biotechnol., 28, 239–244.
Giampieri, F., Forbes-Hernandez, T.Y., Gasparrini, M., Alvarez-Suarez, J.M., Afrin, S., Bompadre,
S., Quiles, J.L., Mezzetti, B. and Battino, M. (2015) Strawberry as a health promoter: an evidence based
review. Food Funct., 6, 1386–98. Available at: http://www.ncbi.nlm.nih.gov/pubmed/25803191.
Giampieri, F., Tulipani, S., Alvarez-Suarez, J.M., Quiles, J.L., Mezzetti, B. and Battino, M. (2012)
The strawberry: Composition, nutritional quality, and impact on human health. Nutrition, 28, 9–19.
Available at: https://linkinghub.elsevier.com/retrieve/pii/S0899900711003066.
Giavalisco, P., Kohl, K., Hummel, J., Seiwert, B. and Willmitzer, L. (2009) 13 C Isotope-Labeled
Metabolomes Allowing for Improved Compound Annotation and Relative Quantification in Liquid
Chromatography-Mass Spectrometry-based Metabolomic Research. Anal. Chem., 81, 6546–6551.
Available at: https://pubs.acs.org/doi/10.1021/ac900979e.
Griesser, M., Hoffmann, T., Bellido, M.L., Rosati, C., Fink, B., Kurtzer, R., Aharoni, A., Munoz-
Blanco, J. and Schwab, W. (2008) Redirection of Flavonoid Biosynthesis through the Down-Regulation
of an Anthocyanidin Glucosyltransferase in Ripening Strawberry Fruit. Plant Physiol., 146, 1528–1539.
Available at: http://www.plantphysiol.org/cgi/doi/10.1104/pp.107.114280.
Hoffmann, T., Kalinowski, G. and Schwab, W. (2006) RNAi-induced silencing of gene expression in
strawberry fruit (Fragaria x ananassa) by agroinfiltration: a rapid assay for gene function analysis. Plant J.,
48, 818–26. Available at: http://www.ncbi.nlm.nih.gov/pubmed/17092319.
James, P., Halladay, J. and Craig, E.A. (1996) Genomic libraries and a host strain designed for highly
efficient two-hybrid selection in yeast. Genetics, 144, 1425–36. Available at:
http://www.ncbi.nlm.nih.gov/pubmed/8978031.
Jia, H.-F., Chai, Y.-M., Li, C.-L., Lu, D., Luo, J.-J., Qin, L. and Shen, Y.-Y. (2011) Abscisic Acid Plays
an Important Role in the Regulation of Strawberry Fruit Ripening. Plant Physiol., 157, 188–199. Available
at: http://www.plantphysiol.org/lookup/doi/10.1104/pp.111.177311.
Karimi, M., Inzé, D. and Depicker, A. (2002) GATEWAY vectors for Agrobacterium-mediated plant
transformation. Trends Plant Sci., 7, 193–5. Available at: http://www.ncbi.nlm.nih.gov/pubmed/11992820.
Kranz, H., Scholz, K. and Weisshaar, B. (2000) c-MYB oncogene-like genes encoding three MYB
repeats occur in all major plant lineages. Plant J., 21, 231–5. Available at:
http://www.ncbi.nlm.nih.gov/pubmed/10743663.
Kranz, H.D., Denekamp, M., Greco, R., et al. (1998) Towards functional characterisation of the members
of the R2R3-MYB gene family from Arabidopsis thaliana. Plant J., 16, 263–76. Available at:
http://www.ncbi.nlm.nih.gov/pubmed/9839469.
Lai, Z., Schluttenhofer, C.M., Bhide, K., Shreve, J., Thimmapuram, J., Lee, S.Y., Yun, D.-J. and
Mengiste, T. (2014) MED18 interaction with distinct transcription factors regulates multiple plant
functions. Nat. Commun., 5, 3064. Available at: http://www.nature.com/articles/ncomms4064.
Lazo, G.R., Stein, P.A. and Ludwig, R.A. (1991) A DNA Transformation–Competent Arabidopsis

CHAPTER 2
289 PhD Thesis Félix Juan Martínez Rivas
Genomic Library in Agrobacterium. Bio/Technology, 9, 963–967. Available at:
http://www.nature.com/doifinder/10.1038/nbt1091-963.
Li, Y., Xu, P., Chen, G., Wu, J., Liu, Z. and Lian, H. (2020) FvbHLH9 Functions as a Positive Regulator
of Anthocyanin Biosynthesis by Forming a HY5–bHLH9 Transcription Complex in Strawberry Fruits.
Plant Cell Physiol., 61, 826–837. Available at: https://academic.oup.com/pcp/article/61/4/826/5722211.
Lin-Wang, K., McGhie, T.K., Wang, M., Liu, Y., Warren, B., Storey, R., Espley, R. V and Allan, A.C.
(2014) Engineering the anthocyanin regulatory complex of strawberry (Fragaria vesca). Front. Plant Sci.,
5, 1–14.
Lipsick, J.S. (1996) One billion years of Myb. Oncogene, 13, 223–35. Available at:
http://www.ncbi.nlm.nih.gov/pubmed/8710361.
Love, M.I., Huber, W. and Anders, S. (2014) Moderated estimation of fold change and dispersion for
RNA-seq data with DESeq2. Genome Biol., 15, 550. Available at:
http://www.ncbi.nlm.nih.gov/pubmed/25516281.
Ma, D. and Constabel, C.P. (2019) MYB Repressors as Regulators of Phenylpropanoid Metabolism in
Plants. Trends Plant Sci., 24, 275–289. Available at:
https://linkinghub.elsevier.com/retrieve/pii/S1360138518302905.
Matías-Hernández, L., Jiang, W., Yang, K., Tang, K., Brodelius, P.E. and Pelaz, S. (2017) AaMYB1
and its orthologue AtMYB61 affect terpene metabolism and trichome development in Artemisia annua and
Arabidopsis thaliana. Plant J., 90, 520–534. Available at: http://doi.wiley.com/10.1111/tpj.13509.
Medina-Puche, L., Blanco-Portales, R., Molina-Hidalgo, F.J., Cumplido-Laso, G., García-Caparrós,
N., Moyano-Cañete, E., Caballero-Repullo, J.L., Muñoz-Blanco, J. and Rodríguez-Franco, A. (2016)
Extensive transcriptomic studies on the roles played by abscisic acid and auxins in the development and
ripening of strawberry fruits. Funct. Integr. Genomics, 16, 671–692. Available at:
http://dx.doi.org/10.1007/s10142-016-0510-3.
Medina-Puche, L., Cumplido-Laso, G., Amil-Ruiz, F., et al. (2014) MYB10 plays a major role in the
regulation of flavonoid/phenylpropanoid metabolism during ripening of Fragaria × ananassa fruits. J. Exp.
Bot., 65, 401–417.
Medina-Puche, L., Molina-Hidalgo, F.J., Boersma, M., et al. (2015) An R2R3-MYB Transcription
Factor Regulates Eugenol Production in Ripe Strawberry Fruit Receptacles. Plant Physiol., 168, 598–614.
Available at: http://www.ncbi.nlm.nih.gov/pubmed/25931522.
Molina-Hidalgo, F.J., Medina-Puche, L., Cañete-Gómez, C., et al. (2017) The fruit-specific
transcription factor FaDOF2 regulates the production of eugenol in ripe fruit receptacles. J. Exp. Bot., 68,
4529–4543. Available at: http://academic.oup.com/jxb/article/68/16/4529/4067750/The-fruitspecific-
transcription-factor-FaDOF2.
Molina-Hidalgo, F.J., Medina-Puche, L., Gelis, S., et al. (2015) Functional characterization of FaNIP1;1
gene, a ripening-related and receptacle-specific aquaporin in strawberry fruit. Plant Sci., 238, 198–211.
Nesi, N., Debeaujon, I., Jond, C., Pelletier, G., Caboche, M. and Lepiniec, L. (2000) The TT8 Gene
Encodes a Basic Helix-Loop-Helix Domain Protein Required for Expression of DFR and BAN Genes in
Arabidopsis Siliques. Plant Cell, 12, 1863–1878. Available at: doi: 10.1105/tpc.12.10.1863.
Pedersen, S. and Amtssygehus, A. (2001) Multiplex Relative Gene Expression Analysis by Real-Time
CHAPTER 2
290 Functional characterization of molecular regulatory mechanisms controlling the ripening in strawberry fruit
RT-PCR Using the iCycler iQ Detection System. BioRadiations, 107, 10–11. Available at: http://www.bio-
rad.com/LifeScience/pdf/Bulletin_2696.pdf.
Perkins-Veazie, P. (1995) Growth and Ripening of Strawberry Fruit. In Horticultural Reviews. Oxford,
UK: John Wiley & Sons, Inc., pp. 267–297. Available at:
http://doi.wiley.com/10.1002/9780470650585.ch8.
Pillet, J., Yu, H.-W., Chambers, A.H., Whitaker, V.M. and Folta, K.M. (2015) Identification of
candidate flavonoid pathway genes using transcriptome correlation network analysis in ripe strawberry (
Fragaria × ananassa ) fruits. J. Exp. Bot., 66, 4455–4467. Available at:
http://www.ncbi.nlm.nih.gov/pubmed/25979996.
Pireyre, M. and Burow, M. (2015) Regulation of MYB and bHLH Transcription Factors: A Glance at the
Protein Level. Mol. Plant, 8, 378–388. Available at:
https://linkinghub.elsevier.com/retrieve/pii/S1674205214000483.
Qiao, Q., Xue, L., Wang, Q., Sun, H., Zhong, Y., Huang, J., Lei, J. and Zhang, T. (2016) Comparative
transcriptomics of strawberries (Fragaria spp.) provides insights into evolutionary patterns. Front. Plant
Sci., 7, 1–10.
Schaart, J.G., Dubos, C., Romero, I., et al. (2013) Identification and characterization of MYB-bHLH-
WD40 regulatory complexes controlling proanthocyanidin biosynthesis in strawberry (Fragaria × ananassa)
fruits. New Phytol., 197, 454–67. Available at: http://www.ncbi.nlm.nih.gov/pubmed/23157553.
Soneson, C., Love, M.I. and Robinson, M.D. (2016) Differential analyses for RNA-seq: transcript-level
estimates improve gene-level inferences. F1000Research, 4, 1521. Available at:
https://f1000research.com/articles/4-1521/v2.
Terrier, N., Torregrosa, L., Ageorges, A., Vialet, S., Verriès, C., Cheynier, V. and Romieu, C. (2009)
Ectopic Expression of VvMybPA2 Promotes Proanthocyanidin Biosynthesis in Grapevine and Suggests
Additional Targets in the Pathway. Plant Physiol., 149, 1028–1041. Available at:
http://www.plantphysiol.org/lookup/doi/10.1104/pp.108.131862.
Vallarino, J.G., Merchante, C., Sánchez-Sevilla, J.F., et al. (2020) Characterizing the involvement of
FaMADS9 in the regulation of strawberry fruit receptacle development. Plant Biotechnol. J., 18, 929–943.
Available at: https://onlinelibrary.wiley.com/doi/abs/10.1111/pbi.13257.
Wang, L., Tang, W., Hu, Y., et al. (2019) A MYB/bHLH complex regulates tissue‐specific anthocyanin
biosynthesis in the inner pericarp of red‐centered kiwifruit Actinidia chinensis cv. Hongyang. Plant J.,
tpj.14330. Available at: https://onlinelibrary.wiley.com/doi/abs/10.1111/tpj.14330.
Wang, N., Qu, C., Jiang, S., et al. (2018) The proanthocyanidin-specific transcription factor MdMYBPA1
initiates anthocyanin synthesis under low-temperature conditions in red-fleshed apples. Plant J., 96, 39–
55. Available at: http://doi.wiley.com/10.1111/tpj.14013.
Woodward, J.R. (1972) Physical and chemical changes in developing strawberry fruits. J. Sci. Food
Agric., 23, 465–473. Available at: http://doi.wiley.com/10.1002/jsfa.2740230406.
Xie, Y., Tan, H., Ma, Z. and Huang, J. (2016) DELLA Proteins Promote Anthocyanin Biosynthesis via
Sequestering MYBL2 and JAZ Suppressors of the MYB/bHLH/WD40 Complex in Arabidopsis thaliana.
Mol. Plant, 9, 711–721. Available at: https://linkinghub.elsevier.com/retrieve/pii/S1674205216000332.
Xu, W., Dubos, C. and Lepiniec, L. (2015) Transcriptional control of flavonoid biosynthesis by MYB–

CHAPTER 2
291 PhD Thesis Félix Juan Martínez Rivas
bHLH–WDR complexes. Trends Plant Sci., 20, 176–185. Available at:
https://linkinghub.elsevier.com/retrieve/pii/S1360138514003124.
Zhang, Y., Yin, X., Xiao, Y., et al. (2018) An ETHYLENE RESPONSE FACTOR-MYB Transcription
Complex Regulates Furaneol Biosynthesis by Activating QUINONE OXIDOREDUCTASE Expression in
Strawberry. Plant Physiol., 178, pp.00598.2018. Available at:
http://www.plantphysiol.org/lookup/doi/10.1104/pp.18.00598.
Zhang, Z., Shi, Y., Ma, Y., et al. (2020) The strawberry transcription factor FaRAV1 positively regulates
anthocyanin accumulation by activation of FaMYB10 and anthocyanin pathway genes. Plant Biotechnol.
J., 1–13

CHAPTER 2
292 Functional characterization of molecular regulatory mechanisms controlling the ripening in strawberry fruit
Additional file 1: Complete data from Liquid chromatography-mass spectrometry analysis
normalized with internal standard and fresh weight. A total of eight replicates were used in each
condition.
Data available on the electronic version of the thesis.

CHAPTER 3
293 PhD Thesis Félix Juan Martínez Rivas
CHAPTER 3
Azacitidine treatment provides evidence that DNA methylation governs
strawberry (Fragaria x ananassa) fruit ripening
CHAPTER 3
294 Functional characterization of molecular regulatory mechanisms controlling the ripening in strawberry fruit
This chapter has been submitted to Frontiers in Plant Science as:
Martínez-Rivas FJ, Blanco-Portales R, Molina-Hidalgo FJ, Caballero JL, Perez de
Souza L, Alseekh S, Fernie AR, Muñoz-Blanco J, Rodríguez-Franco A. 2021. Azacitidine
treatment provides evidence that DNA methylation governs strawberry (Fragaria x
ananassa) fruit ripening.

CHAPTER 3
295 PhD Thesis Félix Juan Martínez Rivas
Azacitidine treatment provides evidence that DNA methylation governs strawberry
(Fragaria x ananassa) fruit ripening.
Abstract
The repetitive injection of the hypomethylating compound N5-Azacytidine (AZA) into
green and unripe Fragaria × ananassa receptacles led to a substantial delay in the ripening of this
fruit. This delay was reversible, as the fruits become fully ripen after few days of cessation of the
AZA treatment. This observation is notably the opposite of that described in other fleshy and
climacteric fruits where the spraying of surfaces of the fruits with AZA promoted their ripening.
This clearly indicates that DNA methylation also governs the ripening of strawberries. An RNA-
Seq analysis done with tissues treated with AZA versus water-treated controls showed over 3275
and 1685 genes up and down regulated, respectively. Many key genes responsible for the
biosynthesis of anthocyanins, phenylpropanoid and hormones, like abscisic acid (ABA) were
affected by the treatment. For ABA, those genes involved in the final steps of its biosynthesis
were down-regulated, and those responsible for its withdrawal either by degradation or
conjugation were up-regulated after the AZA treatment. Similar situations occurred with genes
involved in the biosynthesis of anthocyanins and phenylpropanoids. Many transcription factors
mediating the ripening were also down-regulated in the AZA treated tissues. Taken together all
these observations suggest that the ripening of the strawberry receptacle is governed by the 5mC-
methylation and demethylation of a still unknown group of genes, and that diffusible factors could
participate in the ripening process.

CHAPTER 3
296 Functional characterization of molecular regulatory mechanisms controlling the ripening in strawberry fruit
Introduction
The cultivated strawberry (Fragaria × ananassa) is an important fruit having a quality and
aftermarket shelf life that is strongly linked to the ripening process (Giampieri et al., 2014). Fruit
development and ripening involve irreversible biochemical and genetic processes leading to an
edible and desirable soft receptacle as part of a strategy for seed dispersal (Jia et al., 2011;
Medina-Puche et al., 2014; Molina-Hidalgo et al., 2013). These changes are governed by different
factors such as hormones, temperature, light, and genotype, and depend on the expression of a set
of ripening related genes. How all these factors interact with each other in this process is a very
active field of investigation in strawberry nowadays (Concha et al., 2013; Medina-Puche et al.,
2015; Medina-Puche et al., 2016; Chai et al., 2011). In addition to the appearance of the red color,
many organoleptic changes occurs in the ripening phase, such as the accumulation of sugars,
soluble acids and secondary metabolites responsible for the of aroma and flavor as well as the
alteration of the fruit cell shape, firmness and texture (Moya-León et al., 2019).
Most transcriptomic research on ripening has been done in climacteric fruits such as
bayberry (Feng et al., 2012), banana (Yun et al., 2019), peach (Pei et al., 2019), pear (Xie et al.,
2013), kiwifruit (Zhang et al., 2018), apricot (Q., Zhang et al., 2019), grape (Guo et al., 2019),
apples (Zhang et al., 2015; Busatto et al., 2017) and tomato (Osei et al., 2017; Belouah et al.,
2020). By contrast, the transcriptomic studies on non-climacteric fruit are scarce and limited to
fewer plants such as orange (Yu, et al., 2012), pepper (Lee et al., 2010), jujube (Z., Zhang et al.,
2019), grape (Deluc et al., 2007; Balic et al., 2018; Tornielli et al., 2012) and strawberry (Medina-
Puche et al., 2016; Sánchez-Sevilla et al., 2017). Hormonal control of the ripening process in
strawberry is starting to be disclosed. In non-climacteric plants, ethylene, which plays a major
role in the ripening of climacteric fruits, has little or null effects on ripening (Merchante et al.,
2013; Villarreal et al., 2010; Concha et al., 2013). In strawberry, the auxin/ABA content ratio
controls the development and ripening of the fruit (Symons et al., 2012; Estrada-Johnson et al.,
2017; Jia et al., 2011). The auxin indole-3-acetic acid (IAA), synthesized mainly by fertilized
achenes, is responsible for the development and growth of the fruit while at the same time arrests
ripening (Nitsch, 1950; Given et al., 1988; Perkins-Veazie, 1995; Symons et al., 2012). Therefore,
immature receptacles with detached or unfertilized achenes does not grow and advance their
ripening. This is reversed by the application of exogenous auxin (Nitsch, 1950). The various
active forms of gibberellic also play a critical role in the development of the fruit, being
responsible mainly for the cell expansion taking place after cell divisions and also seems to
arresting ripening (Csukasi et al., 2011; Martínez et al., 1996). ABA is synthetized once the fruit
has fully developed in size and when auxins and gibberellic acid decay, being the main
responsible for the final ripening (Symons et al., 2012; Jia et al., 2011). Therefore, a raise in ABA
contents either by an exogenous application or by submitting plants to drought stress promotes a

CHAPTER 3
297 PhD Thesis Félix Juan Martínez Rivas
premature ripening, whereas the depletion of ABA by silencing or inhibiting the FaNCED1 gene,
responsible for its biosynthesis, contributes to an important delay in this process (Jia et al., 2011).
Ripening in all kind of fruits is also regulated by epigenetic marks (Teyssier et al., 2015; Gallusci
et al., 2016; Huang et al., 2019).
A comprehensive knowledge of development and ripening therefore requires analysis of
methylation in genes and other epigenetic marks such as those involving histones. This epigenetic
regulation is mainly described in tomato fruit (Ecker, 2013; Zhong et al., 2013; Liu et al., 2015),
where the demethylation of the promoter and bodies of the Cnr, Rin and Nor genes, all of them
strongly related to an ethylene-dependent ripening, takes place mainly through the intervention
of the SlDMR2 demethylase (Zhong et al., 2013; Liu et al., 2015). Methylation marks can also be
lost as result of a decay in the activity of de novo and maintenance DNA methyltransferases
(Furner and Matzke, 2011). This seems to be the case in strawberries, where a lower degree of
the DNA methylation in mature fruits compared with immature is linked to a decay in the activity
of the RdDM pathway (Cheng et al., 2018). In this latter work however, a different effect of AZA
on ripening was attained, as the spraying of surfaces with this compound resulted in an
advancement of ripening. The number and the nature of the genes directly regulated by differential
methylation along the ripening in strawberry is still unknown. In addition, to the extent of our
knowledge, no transcriptomic analysis has ever been performed in strawberry receptacles treated
with AZA.
DNA methylation patterns change dramatically after the application of either hyper- or
hypo-methylating drugs. 5-Azacytidine (AZA) is a chemical able to induce a general and
nonspecific DNA hypomethylation (Veselý and Čihák, 1978). This compound acts as a cytidine
analogue, after its metabolization to 5-aza-2’-deoxycytidine-triphosphate, replaces cytosine
during DNA replication. The AZA-derived bases incorporated into DNA cannot incorporate DNA
methylation marks, and these will be lost during DNA replication. In addition, AZA-derived bases
will covalently bind to the DNA methyltransferases, and these are eventually degraded (Veselý
and Čihák, 1978; Santi et al., 1984; Stresemann and Lyko, 2008).
AZA has been used to unravel how the loss of DNA methylation marks could affect the
development and ripening of many fruits. When added to cultured orange cells, a down-regulation
of some genes pertaining to the carotenoid biosynthesis pathway along an up-regulation on those
involved in its degradation take place. Consequently, there is a decline of carotenoids and hence
of the ABA contents that is linked to a loss of the orange color (Xu et al., 2017). The spraying of
fruit surfaces with AZA seems to accelerate ripening in both, climacteric and non-climacteric
fruits. Therefore, AZA sprayed to grape surfaces results in an early ripened phenotype linked to

CHAPTER 3
298 Functional characterization of molecular regulatory mechanisms controlling the ripening in strawberry fruit
an increase of glucose, soluble acids, and anthocyanins (Guo et al., 2019). This also occurs when
green tomatoes are treated with AZA (Zhong et al., 2013; Liu et al., 2015). In addition, the surface
application of this compound to apples and peaches induced an advanced ripening and the early
appearance of red pigments in both fruits (Zhu et al., 2020; Ma et al., 2018). Finally, early
ripening has also been observed when strawberry fruit surfaces are sprayed with AZA (Cheng et
al., 2018).
In the current work, we describe the unexpected and striking observation of a reversible
delay in the ripening of strawberry receptacles when 1mM AZA was repeatedly injected into the
fruit. This application of AZA was done in halves of fruit receptacles that received parallel
injections of water as control in the other half of the same fruit. The so treated receptacles were
left to ripen until the water treated part was fully mature. Thus, both tissues, treated or not with
AZA, were analyzed through RNA-Seq. This revealed that not only changes related to the red
color formation took place in AZA treated tissues, but also a true delay in the ripening. Many
transcripts and metabolites associated to hormone biosynthesis, aroma, flavor and texture were
either reduced or not detected in the AZA treated parts. This included the expression of many
important transcription factors (TFs) involved in ripening. Key and critical genes pertaining to
the ABA biosynthetic pathway were down-regulated, while at the same time those involved in its
biological withdrawal, either by its degradation or inactivation via conjugation, were up-
regulated. The contents of the free and biologically active form of ABA were substantially
reduced, whereas that of inactive and conjugated ABA increased notably in the AZA treated parts.
Products coming from the degradation of ABA were also noticeably present at higher
concentrations in AZA treated parts. Genes related to auxins and gibberellin biosynthesis
pathways were however up-regulated, and so did the contents of these ripening inhibitory
hormones. That a general delay of the ripening took place was also confirmed by metabolomic
studies, where many compounds found in red receptacles were found at low levels in AZA treated
parts.
These results strongly indicate that m5C methylation status of DNA governs strawberry
fruit ripening by mainly controlling hormone content, giving further and strong support that
auxin/ABA ratio as the main force regulating the ripening of this fruit. Data suggest that ripening
could be governed by a change in the methylation status of a reduced number of regulatory genes,
and that there might be diffusible components that can spread through the receptacle that are
contributing to the ripening.

CHAPTER 3
299 PhD Thesis Félix Juan Martínez Rivas
Results
5-azacytidine delayed strawberry ripening promoting changes in transcriptome
The injection of AZA to halves of immature strawberry receptacles at the G3 green stage
was accompanied by a strong delay in the formation of the red color in the receptacle (Fig 1A).
G3 stage corresponds to immature fruits that are high in firmness and fully developed in size but
are still green with no traces of red pigments. This delay was only observed in the AZA treated
parts, whereas the rest of the receptacle, treated with water, ripened at a regular pace, reaching
the red and overripe stages normally. The AZA treated parts remained white as far as the treatment
was repeated every other day. Once we abandoned the AZA treatment at any time, those parts
turned red and ripped normally (Fig 1B). RNA-Seq analysis was performed to explore changes
in the transcriptome in the AZA treated tissues versus the control. A total of 3275 and 1685 genes
were down and up-regulated respectively (Additional file 1) after applying the filtering indicated
in the Materials and Methods section.
Fig 1. (A) AZA treated strawberry fruit receptacles. (B) Treated fruits after abandoning AZA treatment.
Fruits were collected at the green G3 stage (fully developed green receptacles) and kept with pedicels
submerged in a Murashige and Skoog media solution, then a 1mM solution of AZA was injected to halves
of the fruits every other day. These parts remained white while the other halves were injected with water
and used as control ripen at a regular pace acquiring the red color characteristic of mature receptacles.
AZA treatment blocks anthocyanin biosynthesis.
Many key genes pertaining to the anthocyanin pathway were down-regulated or not
induced in the AZA treated tissues. These included FaGT1 coding an essential anthocyanidin
glucosyltransferase (FvH4_7g33480) (Griesser et al., 2008), FaMalTransf (FvH4_6g46740)
(Davik et al., 2020) responsible for the biosynthesis of pelargonidin-3-glucoside and its malonyl
derivative, both major anthocyanin components of the receptacle, and other key genes of this
pathway, as FaPAL (phenylammonia lyase FvH4_6g16060), Fa4CL (4-coumaryl-CoA ligase,
FvH4_6g16460), FaDFR (dihydroflavonol reductase, FvH4_2g39530), FaF3H (flavone 3
hydroxylase, FvH4_1g11810) and FaANS (antocyanin synthase, FvH4_5g01170) (Almeida et al.,
2007; Moyano et al., 1998; Griesser et al., 2008). The expression of the phenylpropanoid
structural genes were also down-regulated in the AZA treated parts, except for FaANR
(FvH4_3g02980), encoding an anthocyanin reductase which was expressed at higher levels
(Table 1).

CHAPTER 3
300 Functional characterization of molecular regulatory mechanisms controlling the ripening in strawberry fruit
Table 1. Phenylpropanoid related genes extracted from total RNAseq data. Gene ID and corresponding
annotations as reported in Fragaria vesca v4.0 Genome Database (https://www.rosaceae.org/)
AZA treatments alter the expression of transcription factors regulating the strawberry
ripening process
Many important and key genes coding for TFs involved in ripening had lower
transcription levels in AZA treated tissues (Table 2). Among these, highlights FaMYB10
(FvH4_1g22020), which is described as a master regulator of the phenylpropanoid pathway
responsible for the biosynthesis of many red-colored pigments (Medina-Puche et al., 2014).
Another lower expressed TF was FaDOF2 (FvH4_2g14390) which synergistically along with
FaEOBII (FvH4_6g50930), controls the expression of FaEGS2 (FvH4_2g09110, encoding
eugenol synthase 2), a major enzyme involved in the biosynthesis of eugenol, an important
phenylpropanoid volatile present in ripened strawberries that is responsible for the characteristic
strawberry aroma (Molina-Hidalgo et al., 2017; Medina-Puche et al., 2015). The TF FaGAMYB
(FvH4_7g04470) was also expressed at lower levels and its silencing by means of RNAi lead to
white and un-ripened fruits (Vallarino et al., 2015). Similar results were observed for FaASR
(FvH4_2g13410), a TF involved in sucrose metabolism that, after being silenced by means of
RNAi, lead to immature and white fruits as well (Jia et al., 2016).
The list of TF significantly down-regulated in AZA treated tissues that are usually
induced throughout the ripening can be extended to FaMADS9 (FvH4_6g46420), which is
responsible for the deposition of sugars and waxes along maturation (Vallarino et al., 2020),
FaPRE1 (FvH4_3g04310) whose silencing lead to the repression of ripening related genes
(Medina-Puche et al., 2019), and FaSHP (FvH4_6g37880) whose silencing produced white
receptacles. (Daminato et al., 2013) (Table 2). Notably, AZA treatment induced the expression
of FaMYB9 (FvH4_2g31130) and FaMYB11 (FvH4_6g34650) (Table 2). Both TFs are involved
in the biosynthesis of proanthocyanidins, and are mainly expressed in immature and green
receptacles (Schaart et al., 2013; Medina-Puche et al., 2016).
Gene ID log2 foldchange p -value AnnotationFvH4_6g16060 -1,242 1,48E-11 FaPALFvH4_3g40570 -0,375 2,67E-01 FaC4HFvH4_6g16460 -6,399 5,30E-26 Fa4CLFvH4_7g01160 -1,148 6,20E-03 FaCHSFvH4_7g20870 0,366 5,87E-01 FaCHIFvH4_1g11810 -2,389 5,90E-14 FaF3HFvH4_2g39530 -3,968 2,82E-43 FaDFRFvH4_5g01170 -1,558 7,17E-06 FaANSFvH4_7g33840 -5,765 2,10E-20 FaUFGTFvH4_6g46740 -3,242 3,80E-23 FaMalTransfFvH4_6g34950 1,098 2,11E-01 FaF'3HFvH4_2g29990 -2,454 3,14E-20 FaFLSFvH4_3g02980 6,599 4,13E-32 FaANRFvH4_4g28110 -0,656 2,73E-02 FaLARFvH4_4g03650 -3,357 6,21E-11 FaUF3GT
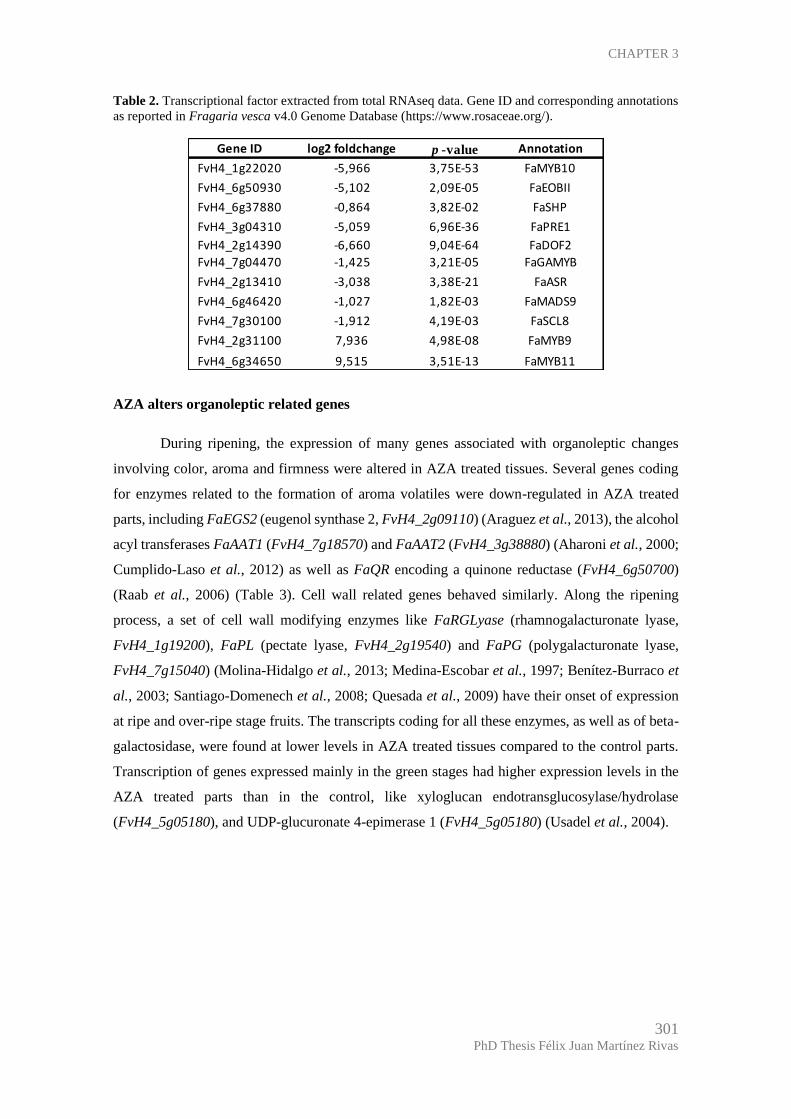
CHAPTER 3
301 PhD Thesis Félix Juan Martínez Rivas
Table 2. Transcriptional factor extracted from total RNAseq data. Gene ID and corresponding annotations
as reported in Fragaria vesca v4.0 Genome Database (https://www.rosaceae.org/).
AZA alters organoleptic related genes
During ripening, the expression of many genes associated with organoleptic changes
involving color, aroma and firmness were altered in AZA treated tissues. Several genes coding
for enzymes related to the formation of aroma volatiles were down-regulated in AZA treated
parts, including FaEGS2 (eugenol synthase 2, FvH4_2g09110) (Araguez et al., 2013), the alcohol
acyl transferases FaAAT1 (FvH4_7g18570) and FaAAT2 (FvH4_3g38880) (Aharoni et al., 2000;
Cumplido-Laso et al., 2012) as well as FaQR encoding a quinone reductase (FvH4_6g50700)
(Raab et al., 2006) (Table 3). Cell wall related genes behaved similarly. Along the ripening
process, a set of cell wall modifying enzymes like FaRGLyase (rhamnogalacturonate lyase,
FvH4_1g19200), FaPL (pectate lyase, FvH4_2g19540) and FaPG (polygalacturonate lyase,
FvH4_7g15040) (Molina-Hidalgo et al., 2013; Medina-Escobar et al., 1997; Benítez-Burraco et
al., 2003; Santiago-Domenech et al., 2008; Quesada et al., 2009) have their onset of expression
at ripe and over-ripe stage fruits. The transcripts coding for all these enzymes, as well as of beta-
galactosidase, were found at lower levels in AZA treated tissues compared to the control parts.
Transcription of genes expressed mainly in the green stages had higher expression levels in the
AZA treated parts than in the control, like xyloglucan endotransglucosylase/hydrolase
(FvH4_5g05180), and UDP-glucuronate 4-epimerase 1 (FvH4_5g05180) (Usadel et al., 2004).
Gene ID log2 foldchange p -value Annotation
FvH4_1g22020 -5,966 3,75E-53 FaMYB10
FvH4_6g50930 -5,102 2,09E-05 FaEOBII
FvH4_6g37880 -0,864 3,82E-02 FaSHP
FvH4_3g04310 -5,059 6,96E-36 FaPRE1
FvH4_2g14390 -6,660 9,04E-64 FaDOF2
FvH4_7g04470 -1,425 3,21E-05 FaGAMYB
FvH4_2g13410 -3,038 3,38E-21 FaASR
FvH4_6g46420 -1,027 1,82E-03 FaMADS9
FvH4_7g30100 -1,912 4,19E-03 FaSCL8
FvH4_2g31100 7,936 4,98E-08 FaMYB9
FvH4_6g34650 9,515 3,51E-13 FaMYB11

CHAPTER 3
302 Functional characterization of molecular regulatory mechanisms controlling the ripening in strawberry fruit
Table 3. Organoleptic propierties related genes extracted from total RNAseq data. Gene ID and
corresponding annotations as reported in Fragaria vesca v4.0 Genome Database
(https://www.rosaceae.org/)
AZA altered key genes involved in the biosynthesis of hormones
The transcription of many key genes involved in the biosynthesis of ripening-related
hormones were expressed at lower levels in AZA treated parts. All the enzymes involved in ABA
biosynthesis via its carotenoid precursors were down regulated. These included phytoene synthase
(FvH4_6g38780) zeaxanthin epoxidase (FvH4_1g16080) neoxanthin synthase (FvH4_5g20670),
short chain dehydrogenase/reductase (FvH4_5g01930), and abscisic-aldehyde oxidase
(FvH4_3g26980) (Table 4). There are two enzymes related to withdrawing bioactive ABA from
within the cells, and they were both expressed at higher levels after the AZA treatment. These
corresponds to ABA 8’ hydroxylase (a cytochrome P450, FvH4_2g34420), which irreversibly
degrades ABA, and ABA beta-glucosyltransferase (FvH4_2g05690), which inactivates ABA in
a reversible reaction. The oxidative degradation of ABA initially catalyzed by the hydroxylase
lead to the formation of 8′-hydroxy ABA, phaseic acid and dihydrophaseic acid (Perin et al.,
2018). The glycosylation of ABA forms the biologically inactive ABA glucose ester, which can
be reversibly deconjugated through a β-glucosidase (Nambara and Marion-Poll, 2005).
Table 4. Abscisic acid related genes extracted from total RNAseq data. Gene ID and corresponding
annotations as reported in Fragaria vesca v4.0 Genome Database (https://www.rosaceae.org/)
Gene ID log2 foldchange p -value AnnotationFvH4_2g09110 -1,534 1,01E-03 FaEGS2FvH4_7g18570 -3,026 7,25E-04 FaAAT1FvH4_3g38880 -6,250 5,64E-61 FaAAT2FvH4_6g50700 -1,134 1,81E-54 FaQRFvH4_4g33940 -1,359 8,15E-11 endo-1,4-beta-glucanase FvH4_7g25860 -4,358 1,15E-08 expansin 2FvH4_2g19540 -3,531 8,48E-11 FaPLBFvH4_7g15040 -5,816 3,34E-48 FaPG2FvH4_1g19200 -3,299 1,68E-06 FaRGlyaseFvH4_1g02100 3,544 6,10E-16 Glucuronidase 3 isoform 2FvH4_4g10050 2,943 6,47E-06 UDP-glucuronate 4-epimerase 1
FvH4_5g05180 3,747 1,05E-04Xyloglucan
endotransglucosylase/hydrolase
Gene ID log2 foldchange p -value Annotation
FvH4_3g26980 -2,688 4,08E-14 Abscisic-aldehyde oxidase (AO-3) (putative)FvH4_5g20080 -3,672 1,37E-05 Zeaxanthin epoxidase, chloroplastic, Precursor (probable)FvH4_1g23750 -5,672 2,92E-08 Zeaxanthin epoxidase, chloroplastic, Precursor (probable)FvH4_1g16080 -2,633 5,29E-07 Zeaxanthin epoxidase, chloroplastic, Precursor (similar to)FvH4_6g38780 -2,583 1,48E-09 Phytoene synthase, chloroplastic, Precursor (putative)FvH4_3g05440 -2,002 1,18E-04 9-cis-epoxycarotenoid dioxygenase NCED1, chloroplastic, Precursor (similar to)FvH4_5g01930 -1,216 1,49E-04 Short chain dehydogenase/reductaseFvH4_5g20670 -2,099 7,14E-05 NSY
FvH4_2g34420 3,142 8,61E-07FvH4_5g25150 4,267 1,03E-05FvH4_2g06010 8,025 9,24E-13
FvH4_2g05690 3,266 3,30E-32
Abcisic acid biosynthesis
Abcisic acid hydroxylase
Abcisate beta-glucosyltransferase

CHAPTER 3
303 PhD Thesis Félix Juan Martínez Rivas
Auxins are synthesized following two different pathways. One uses tryptophan as a
precursor (Mano and Nemoto, 2012). Both pathways are expressed at higher levels in the AZA
treated tissues. Transcripts levels of Trp decarboxylase I (FvH4_3g09540) and amidase I
(FvH4_2g01730), two of the key enzymes for auxin biosynthesis, were expressed at higher levels
in AZA treated parts, as well as YUCCA10 (FvH4_2g24750), a gene coding for a flavin-
monooxygenase involved in auxin biosynthesis. Auxin receptors as FaPIN1 (FvH4_5g17310),
FaPIN4 (FvH4_4g32450), and FaPIN5 (FvH4_6g00660) were also expressed at higher levels, as
well as those genes involved in the conjugation of auxin (Table 5).
Table 5. Auxin related genes extracted from total RNAseq data. Gene ID and corresponding annotations
as reported in Fragaria vesca v4.0 Genome Database (https://www.rosaceae.org/)
Some genes related to gibberellins biosynthesis were also up-regulated in AZA treated
tissues, as is the case of gibberellin-3-beta-dioxygenase I (FvH4_2g30040) and IV
(FvH4_3g36530) as well as some gibberellin receptors (FvH4_2g06540, FvH4_2g06530). In
contrast, transcript levels of enzymes involved in gibberellin degradation such as gibberellin 2
beta dioxygenase (FvH4_4g14690), were slightly down-regulated in the AZA treated parts (Table
6).
Gene ID log2 foldchange p -value Annotation
FvH4_2g01730 7.290 2.13E-18 Amidase1FvH4_2g24750 1.824 3.57E-06 FaYUC10FvH4_3g09540 9.324 1.73E-07 Trp decarboxylase
FvH4_5g17310 4.241 1.54E-12 FaPIN1FvH4_4g32450 1.896 1.03E-12 FaPIN4FvH4_6g00660 3.869 4.63E-06 FaPIN5FvH4_2g26410 2.633 6.75E-06 FaAUX/LAX3
FvH4_2g04750 3.324 1.66E-04 FaGH3.1FvH4_6g44990 4.385 6.60E-05 FaGH3.5FvH4_2g24250 2.872 5.37E-24 FaGH3.6aFvH4_2g25330 2.831 6.87E-06 FaGH3.9FvH4_4g22430 2.123 3.29E-07 FaGH3.17FvH4_1g06730 0.516 7.94E-03 FaIAR3
Synthesis
Conjugation
Transport

CHAPTER 3
304 Functional characterization of molecular regulatory mechanisms controlling the ripening in strawberry fruit
Table 6. Giberellin related genes extracted from total RNAseq data. Gene ID and corresponding
annotations as reported in Fragaria vesca v4.0 Genome Database (https://www.rosaceae.org/)
Metabolic analysis shows differences between treated and non-treated part
A profiling of the primary metabolism content was next performed in AZA treated and
control parts. AZA-treated tissues had higher levels of phenylalanine, isoleucine, and lysine than
control tissues. These amino acids accumulate in the green stages and decrease along the ripening
(Merchante et al., 2013; Vallarino et al., 2020). Asparagine, proline, and threonine were also
present at higher concentrations in the AZA treated parts. This pattern was also followed by
putrescine and glucose 6-phosphate, which clearly accumulated in the AZA treated part at higher
concentrations than in the control red part. These content patterns are similar to that found in the
ripening process (Merchante et al., 2013) (Table 7), demonstrating that the metabolite profile of
AZA treated parts is similar to the white stages of ripening than to mature fruits. Glucose, fructose,
and sucrose are the main sugars present in strawberry receptacles, with concentrations increasing
along ripening (Jia et al., 2013). In AZA treated tissues, we found half of sucrose concentrations
relative to the control. This could be due to lower transcript levels of sucrose-6-phosphate
synthase (FaSPS, FvH4_2g04920, FvH4_2g28820) sucrose synthase (FaSUS, FvH4_2g26000)
and the sucrose transporter (FaSUT, FvH4_5g33660) (Table 8). No significant variation of
fructose and glucose were found (Table 7).
Gene ID log2 foldchange p -value Annotation
FvH4_2g30040 6.204 2.57E-03 Gibberellin 3-beta-dioxygenase 1 (AtGA3ox1) (probable)FvH4_2g30020 3.647 1.02E-02 Gibberellin 3-beta-dioxygenase 1 (AtGA3ox1) (probable)FvH4_2g30010 6.672 4.75E-06 Gibberellin 3-beta-dioxygenase 1 (AtGA3ox1) (probable)FvH4_6g30780 3.897 9.18E-10 Gibberellin 3-beta-dioxygenase 1 (AtGA3ox1) (putative)FvH4_3g28220 3.134 7.14E-14 Gibberellin 3-beta-dioxygenase 4 (AtGA3ox4) (probable)FvH4_3g36530 4.517 4.44E-03 Gibberellin 3-beta-dioxygenase 4 (AtGA3ox4) (probable)FvH4_6g42670 1.111 1.33E-03 Gibberellin 3-beta-dioxygenase 4 (AtGA3ox4) (probable)FvH4_3g36530 4.517 4.44E-03 Gibberellin 3-beta-dioxygenase 4 (AtGA3ox4) (probable)
FvH4_4g14690 2.066 5.41E-02 Gibberellin 2-beta-dioxygenase 8 (probable)FvH4_3g38920 2.583 2.78E-06 Gibberellin 2-beta-dioxygenase 8 (probable)
FvH4_2g06540 8.473 2.28E-11 Probable gibberellin receptor GID1L2FvH4_2g06530 8.295 2.27E-08 Probable gibberellin receptor GID1L2FvH4_4g15010 7.454 4.15E-09 Probable gibberellin receptor GID1L2FvH4_3g28600 7.423 2.10E-03 Probable gibberellin receptor GID1L3FvH4_7g04040 7.050 9.24E-04 Probable gibberellin receptor GID1L3FvH4_6g21100 6.732 4.89E-08 Probable gibberellin receptor GID1L2FvH4_2g06490 5.685 2.51E-09 Probable gibberellin receptor GID1L1FvH4_2g06400 4.068 1.31E-05 Probable gibberellin receptor GID1L2FvH4_4g27710 4.190 1.97E-05 Probable gibberellin receptor GID1L3
Synthesis
Degradacion
Receptors

CHAPTER 3
305 PhD Thesis Félix Juan Martínez Rivas
Table 7. Changes in primary metabolism in AZA treated parts relative to the control. Data are normalized
to the mean response calculated for controls in GC-MS chromatogram area normalized to internal standard
ribitol. Values presented are fold change means±SE of three biological replicates. Values in bold denote
significant differences as determined by t-test analysis (p < 0.05). The colors indicate the proportional
content of each identified metabolite among the samples. Lower values are depicted at different red
intensities and higher at different green intensities.
Table 8. Sucrose related genes extracted from total RNAseq data. Gene ID and corresponding annotations
as reported in Fragaria vesca v4.0 Genome Database ()
Effects of AZA in secondary metabolism
We subsequently identified the major soluble phenolic compounds by LC-MS in the AZA
and control tissues. As expected, anthocyanin pelargonidin-3-glucose, the main compound
responsible for the red color (Aaby et al., 2007; La Barbera et al., 2017), as well as pelargonidin-
3-(6’malonylglucoside), pelargonidin-3-rutenoside, pelargonidin-3,5-diglucoside, cyanidin-3-
glucose, cyanidin-3-(6’malonylglucoside) and cyanidin-3-rutenoside were all either detected at
negligible levels or were not detected in AZA treated parts (Table 9). were found at negligible
levels or were even missing in AZA treated parts (Table 9). Cyanidins are a group of anthocyanins
found in strawberry receptacles.
Alanine 1.20±0.05 Maltose 0.63±0.06Arginine 1.05±0.13 Methionine 1.89±0.11
Asparagine 1.62±0.03 Phenylalanine 3.17±0.10Aspartic acid 1.46±0.05 Phosphoric acid 0.93±0.02
Citric Acid 1.13±0.03 Proline 1.47±0.10Dehydroascorbic acid 1.12±0.03 Putrescine 3.18±0.35
Fructose 0.80±0.01 Pyroglutamic acid 0.91±0.04Fumaric acid 1.09±0.08 Pyruvic acid 1.22±0.09
Glucose 0.75±0.02 Raffinose 1.14±0.56Glucose-6-phosphate 2.12±0.12 Rhamnose 0.72±0.05
Glutamic Acid 1.29±0.07 Serine 1.28±0.05Glutamine 1.02±0.04 Succinic acid 1.30±0.04
Glycine 1.05±0.04 Sucrose 0.49±0.01Histidine 1.28±0.28 Threonic Acid 1.87±0.14
Isoleucine 2.13±0.26 Threonine 1.39±0.07Leucine 0.52±0.04 Tyrosine 0.96±0.03Lysine 2.27±0.05 Valine 1.84±0.08
Malic Acid 0.62±0.01 Xylose 0.69±0.04
Gene ID log2 foldchange p -value
FvH4_5g33660 -1.25 7.91E-06FvH4_2g12320 -0.59 5.11E-01
FvH4_2g28820 -2.30 1.37E-05FvH4_2g04920 -3.93 2.78E-13FvH4_4g13520 -1.85 5.42E-07FvH4_6g48900 -2.77 1.43E-03
FvH4_2g26000 -1.01 4.69E-03
Sucrose transporters
sucrose-6-phosphate synthase
Sucrose synthase

CHAPTER 3
306 Functional characterization of molecular regulatory mechanisms controlling the ripening in strawberry fruit
In red fruits, pelargonidin are found at higher levels than cyanidin. Major flavonols found
in strawberry receptacles, all kaempferol or quercetin derivatives, were mostly present at lower
levels in AZA treated samples (Table 8). A higher concentration of dimers and trimers of
pelargonidin and cyanidin, as well as proanthocyanins have been found in AZA treated parts
(Table 9). These compounds are synthesized and accumulated in the green stages and are
catabolized to produce the anthocyanin monomers that accumulate during ripening (Schaart et
al., 2013). The building blocks of proanthocyanins, (epi)afzelecin and epi(catechin), were also
present at higher levels in treated parts (Table 9).
Table 9. Changes in secondary metabolism in AZA treated parts relative to the control. Data are normalized
to the mean response calculated for controls. Values presented are fold change means±SE of three
replicates. Values in bold denote significant differences as determined by t-test analysis (P < 0.05). The
colours indicate the proportional content of each identified metabolite among the samples. Lower values
are despicted at different red intensities and higher at different green intensities.
AZA treatment alters hormone contents
We determined hormones content in control and AZA treated tissues as well as in
different ripening stages. Total ABA content (both free ABA and conjugated ABA) increased
along ripening process, reaching maximum levels at the red stage (Fig 2A). A 30% reduction of
total ABA contents was found in the AZA treated parts in relation to the controls (Fig 2A).
(epi)afzelechin 2.70±0.39 Pelargonidin-3-malonylglucoside 0.01±0.00(epi)catechin 2.60±0.38 Pelargonidin 3-5 diglucoside 0.02±0.00
(Epi)catechin hexose 0.72±0.10 Phaseic acid 2.26±0.10ABA 0.55±0.05 Proanthocyanidin trimer 1.35±0.09
ABA-glucoside 3.59±0.21 ProanthocyanidinB3 1.28±0.09Agrimoniin(sanguiin) 1.17±0.20 Procyanidin B1 1.37±0.08
Bis(HHDP)-glucose 1.35±0.27 Procyanidin dimer (1) 2.38±0.16Castalagin 1.36±0.38 Procyanidin dimer (2) 1.38±0.12
Cinnamic acid hexose 0.23±0.00 Procyanidin dimer (3) 1.33±0.10Coumaric acid hexose 0.09±0.00 procyanidin tetramer 1.57±0.27
Cyanidin-3-glucose 0.04±0.00 Procyanidin trimer 1.42±0.19Cyanidin3-3malonylglucose 0.12±0.01 procyanidin trimer 1.65±0.16
Cyanidin-3-rutenoside 0.04±0.00 ProcyanidinB2 1.17±0.05Dihydrophaseic acid 2.22±0.27 Propelargonidin dimer (1) 0.48±0.05
Dihydroxybenzoic acid 1.03±0.08 Propelargonidin dimer (2) 1.16±0.15ellagic acid 1.94±0.12 Propelargonidin dimer (3) 1.07±0.14Ferulic acid 0.25±0.03 Propelargonidin dimer (4) 0.37±0.03
Galloyl-bis(HHDP)-glucose 1.17±0.18 Propelargonidin trimer (1) 1.66±0.55Hydroxybenzylhexose 0.99±0.03 Propelargonidin trimer (2) 0.37±0.06
Kaempferol-3-malonylglucose 0.13±0.06 Quercitin-3-glucuronide 1.39±0.17Kaempferol-3-rutenoside 0.05±0.00 Quercitin-3-glucose 0.53±0.07
Kaempferol-3-acetylglucose 0.04±0.01 Quercitin acetylglucose 0.15±0.09Kaempferol-3-coumarylglucose 46.08±10.08 Quercitin-3-malonylglucose 0.10±0.05
Kaempferol-3-glucose 0.32±0.02 Quercitin-3-rhamnoside 0.43±0.12Naringenin chalcone hexose 0.03±0.00 Rutin 0.23±0.02
p-coumarylhexose 0.15±0.00 Sesquiterpenoid hexose 0.13±0.00Pelargonidin-3-glucose 0.03±0.00 Sesquiterpenoid hexose 0.15±0.01
Pelargonidin-3-rutenoside 0.03±0.00 Sinaptic acid derivative 0.01±0.00Pelargonidin-3-acetylglucoside 0.001±0.0001 Sinaptic acid hexose 0.02±0.00

CHAPTER 3
307 PhD Thesis Félix Juan Martínez Rivas
Notably, we observed higher levels of compounds coming from the degradation of ABA as
phaseic acid, dihydrophaseic and that of conjugated ABA in AZA treated tissues (Fig 2B-D).
Fig 2. Relative hormone abundance throughout different stages of strawberry receptacle development and
ripening. A. Total ABA (free + conjugated) B. Phaseic acid C. Β-glucosyl-ABA (conjugated ABA) D.
Dihydrophaseic acid. Y axis shows (A) means±SE of total area of chromatography normalized by fresh
weight and (B-D) means±SE of total area normalized by fresh weight and internal standard isovitexin.
Three biological replicates were used. ** statistical differences p<0.05 in ANOVA studies ns no statistical
differences. G1, G3, W, R and SE stands for Green1, Green3, White, Red and Senescent receptacles,
respectively.
Auxins exhibit an antagonist concentration pattern in relation to ABA along the different
developmental and ripening stages. Auxins peaks at the G3 stage and reduces their contents in the
red and senescent stages, being 400% less concentrated in the red than in the G3 stage (Symons
et al., 2012). When AZA was injected to strawberry fruits, the concentration of auxins remained
the same as in the white stages, (Fig 3A). In control tissues, auxins levels dropped to
concentrations similar to that found in red tissues. This pattern is followed for gibberellins which
have their higher concentration at the G1 stage and diminish to lower levels at the G3 and W
stages, and even lower in red and senescent stages. In the AZA treated part, the concentrations of
gibberellins were higher than those found in the white stages and even higher than the red control
tissues. The concentrations in the red parts are similar to the concentration in the non-treated red
stage (Fig 3B).
Fig 3. Relative hormone abundance throughout different stages of strawberry receptacle development and
ripening. A. Auxins (IAA) B. Gibberellins (GA4) Y axis shows the means±SE of total area of
chromatography, normalized by fresh weight. Three biological replicates were used. ** statistical
differences p<0.05 in ANOVA studies ns no statistical differences. G1, G3, W, R and SE stands for Green1,
Green3, White, Red and senescent receptacles, respectively.

CHAPTER 3
308 Functional characterization of molecular regulatory mechanisms controlling the ripening in strawberry fruit
Discussion
A global demethylation mediated by AZA delay strawberry fruit ripening
In all fleshy fruits analysed to date, a decay in the global 5mC levels takes place at the
onset of the ripening, which coincides with a timely, specific and directed demethylation of a
group of key and specific regulatory genes required for the fruit to mature. In tomato, this is
mediated by specific demethylases such as SlDML2 (Liu et al., 2015). In strawberry however,
this demethylation decrease seems to be mediated by a general decay in the de novo and
maintenance of the RdDM methylation pathway (Cheng et al., 2018). The degree of methylation
can also be altered using drugs that either methylate or demethylate DNA. This has been exploited
in many cases to gain important information about different processes. 5-azacitidine (AZA) is a
compound that can efficiently reduce or even eradicate all traces of m5C DNA methylation
(Veselý and Čihák, 1978; Santi et al., 1984; Lavelle et al., 2008).
AZA has been widely used to alter DNA methylation patterns in plant tissues. For
example, Arabidopsis seedlings treated with AZA presented an altered gene expression profile
with the up-regulated expression of many transposable elements (Hudson et al., 2011). Fruit
tissues treated with AZA exhibited different results depending on the concentration as well as the
mode and time of administration. AZA applied to the surfaces of tomatoes activated phytoene
synthase expression triggering and accelerating fruit ripening (Zhong et al., 2013). Surface
application of AZA had also similar effects in apples and peaches, where an activation of the
phenylpropanoid pathway and therefore a rise in the content of anthocyanins took place (Ma et
al., 2018; Zhu et al., 2020). This also extended to strawberries, where an advancement of the
ripening and the appearance of the red pigments was observed when AZA was sprayed to the
surfaces of immature fruits (Cheng et al., 2018). However, when AZA was injected into the
commercial strawberry (Fragaria × ananassa) fruit receptacles, we observed the opposite
phenotype. Injected AZA fulfilled a complete stop of the ripening process. The white stage of
development was maintained as long as we keep injecting AZA into the fruit receptacle. This lack
of color formation is similar to that of orange callus treated with AZA (Xu et al., 2017). Such
contrasting phenotypes are not a complete surprise when considering the complexity of
spatiotemporal regulation of developmental processes affected by DNA-methylation. Injecting
AZA can reach different tissue layers, including tissues possibly involved in ripening regulation.
In addition, it has been reported a wide range of effects produced by AZA depending on the dose
and time of exposition (Solís et al., 2015).
An interesting observation is that AZA did not kill the tissues, as these were able to
resume normal development once the treatment ceased (Fig 1). Moreover, we hypothesise that

CHAPTER 3
309 PhD Thesis Félix Juan Martínez Rivas
control tissues were driving the ripening of the AZA treated tissues, possibly through the diffusion
of compounds produced by the former. Conjugated ABA has been described as both a form of
reducing bioactive ABA from within the cells, but also of transporting it to nearby tissues through
the xylem sap (Sauter et al., 2002). In addition, the conjugated ABA accumulated into treated
tissues could also be an additional source of the bioactive form of the hormone triggering the
ripening. Another possibility is that the methylation status of the cells is being restored through
unknown mechanisms. Further investigations are needed to clarify these observations and to
attain deeper insight into the molecular mechanism that underlie them.
The AZA treated tissues remained white due to the downregulation of many genes coding
for TF responsible for the biosynthesis of the red colored pigments such as FaMYB10, FaGAMYB
and FaSHP (Daminato et al., 2013; Medina-Puche et al., 2014; Vallarino et al., 2015) (Table 2).
A delay of the ripening process rather than only impairment of pigment production was supported
by the down-regulation of many other ripening-related processes. These include the formation of
aroma (FaAAT1 and FaAAT2) (Aharoni et al., 2000; Cumplido-Laso et al., 2012), volatile acids
(FaDOF2, FaEOBII and FaEGS2) (Molina-Hidalgo et al., 2017; Medina-Puche et al., 2015;
Araguez et al., 2013), biosynthesis, and some implied in the cell-wall softening (FaPG and
FaRGLyase) (Quesada et al., 2009; Molina-Hidalgo et al., 2013) (Table 3).
A delay of the ripening process is also suggested by the observed hormone profiles.
Auxins and gibberellin both hormones able to arrest ripening, were present at higher levels in the
AZA treated tissues. In contrast, ABA was present at lower concentrations in AZA treated tissues,
with key transcripts involved in its biosynthesis being down-regulated whilst some of the
transcripts responsible for its degradation or conjugation were up-regulated (Fig 4). As expected,
this was accompanied by a substantial increase in the levels of conjugated ABA and its
degradation products such as phaseic acid and the β-glucosyl-ABA (Fig 2).

CHAPTER 3
310 Functional characterization of molecular regulatory mechanisms controlling the ripening in strawberry fruit
Fig 4. Schematic diagram of the ABA biosynthetic and degradation pathway. Enzymes that are down
regulated due to AZA treatment are shown in blue, while up-regulated are shown in red. Boxplots show the
levels of metabolites in control and treated receptacles, Y axis represent the means±SE of normalized area
of each compound with internal standard isovitexin in LC-MS analysis. Three biological replicates were
used. ZEP zeaxanthin epoxidase, NSY neoxanthin synthase, NCED 9-cis-epoxycarotenoid dioxygenase,
SDR Short chain dehydrogenase reductase, AAO Abscisic aldehyde oxidase. Significant differences as
determined by t-test analysis (**) p<0.05.
Demethylation in the MYB10 promoter can trigger anthocyanin accumulation in other
fruits (Ma et al., 2018). FaMYB10 induction was not observed in AZA injected strawberry fruits.
An induction of this same TF was, however, observed when AZA was sprayed to the surface of
apple and peach (Zhu et al., 2020; Ma et al., 2018) which can explain the appearance of the red
color in these latter fruits. In strawberry, red pigmentation is conferred mainly by pelargonidin-
3-glucoside and their derivatives, which accumulate in the receptacle throughout the ripening
process (Aaby et al., 2005; D’Urso et al., 2016).
The phenylpropanoid pathway has been studied extensively and most of their enzymes
are well characterized (Almeida et al., 2007; Griesser et al., 2008; Moyano et al., 1998). During
this process, phenylpropanoid and flavonols are present at low concentrations in unmatured fruits
but accumulate in the red and mature receptacles. Proanthocyanidins and condensed tannins are
mainly present in the green stages (Aaby et al., 2005; Buendía et al., 2010; Schaart et al., 2013).

CHAPTER 3
311 PhD Thesis Félix Juan Martínez Rivas
AZA treated tissues have higher levels of proanthocyanins and condensed tannins, and reduced
contents of anthocyanin and flavonols (Table 7). This reduction correlated with a decrease in the
expression of genes coding for enzymes related to the biosynthesis of phenylpropanoids and
flavonols such as FaANS (anthocyanidin synthase), Fa3GT (antocyanin glucosyltransferase), and
FaMalTransf (antocyanin malonyltransferase) (Table 1, Fig 5). Low levels of anthocyanins are
also present in FaGAMYB and FaMYB10 RNAi-silenced fruits (Vallarino et al., 2015; Medina-
Puche et al., 2014), these TF levels are also lower after AZA treatment. The increase of
proanthocyanins in treated tissues can be explained by the induction of FaMYB9 (Schaart et al.,
2013).
Fig 5. Schematic diagram of the phenylpropanoid, flavonoid, and anthocyanin pathway. Enzymes that are
down regulated due to AZA treatment are shown in blue. Boxplots show the levels of metabolites in control
and treated receptacles; Y axis represent the normalized area of each compound with internal standard
isovitexin and fresh weight in LC-MS analysis. Three biological replicates were used. PAL, phenylamonia
lyase 4CL, 4-coumaryl-CoA ligase; ANS anthocyanidin synthase; C4H, cinnamic acid 4-hydroxylase; CHI,
chalcone isomerase; CHS, chalcone synthase; DFR dihydroflavonol reductase; F3H, flavanone 3-
hydroxylase; F3’H, flavonoid3’-hydroxylase; GT1, anthocyanin 3-glucosyltransferase; MT, malonyl
transferase; UF3GT, UDP::flavonol 3 glucosyltransferase. Significant differences as determined by t-test
analysis (**) p<0.05.
Along the strawberry fruit ripening, a decrease in the amino acid concentrations as well
as that of putrescine and glucose-6-phosphate is observed (Merchante et al., 2013; Vallarino et

CHAPTER 3
312 Functional characterization of molecular regulatory mechanisms controlling the ripening in strawberry fruit
al., 2020). These compounds are found in higher concentration in the AZA treated parts than in
the control (Table 8). The metabolic profile with AZA resembles that of fruits at early stages of
ripening. Control tissues showed a normal amino acid profile. Sucrose has been described as an
important regulator of strawberry fruit ripening (Jia et al., 2013; Jia et al., 2016). The addition of
sucrose to strawberry fruits induces ripening via activation of FaNCED1, a crucial gene
responsible for the biosynthesis of ABA. This was accompanied by a repression of the genes
responsible for the withdrawal of bioactive ABA, such as the ABA-glucosyltransferases. When
the gene FaSUT1, coding for a sucrose transporter, is silenced by RNAi, strawberry fruits fail to
ripen and do not turn to red (Jia et al., 2013). Notably, AZA treated tissues have a substantial
reduction in sucrose levels possible due to the down-regulation of its biosynthetic pathway genes,
as well as FaSUT1, a glucose transporter (Table 8). Thus, those genes activated depending on the
sucrose signalling, like FaASR, and FaNCED1, were clearly down-regulated in the treated part,
impeding the sucrose signalling in strawberry ripening and therefore not promoting ripening.
In strawberry, hormonal content is the key element controlling the ripening process. It
has been proved that a disbalance on hormonal content would stop or accelerate the amount of
time needed to fulfil ripening (Jia et al., 2016). The ratio ABA/auxin and the fine control of the
spatial/temporal biosynthesis of these hormones govern the whole process. Normally, ABA levels
rises along the ripening process, having a peak at the fully red ripen receptacle (Fig 2A). Other
hormones present at early stages of development, as gibberellin and auxins, have higher
concentrations at the green/white stages (Symons et al., 2012). Changes in the hormones content
occurs when AZA was injected into fruits. Treated parts present auxin and gibberellin levels
similar to those found in the green and white stages, while total ABA content (free ABA plus
conjugated ABA) is around 30% lower than that found in red ripen receptacles. Hormone levels
in control parts treated with water were similar to that found in untreated fruits at the red stages
(Fig 2-C).
It has been proposed a model of an interlinked regulatory loop between ABA catabolism
and gibberellin and auxin levels in strawberry receptacles (Liao et al., 2018). According this
model, and at the early stages of development, auxin levels would maintain high gibberellin levels
in the strawberry receptacles. These will activate the expression of gene FaCYP707A4a, coding
an enzyme involved in the degradation of ABA, and the repression of FaNCED responsible for
the ABA biosynthesis. This situation (high auxin and gibberellic, low ABA contents) arrests the
ripening. Similar phenotype on down-regulation of NCED enzymes and a less concentration of
ABA content has been described on citrus callus treated with AZA (Xu et al., 2017). Once the
receptacle fully grows in size, auxins and gibberellin levels drop dramatically and this led to the
biosynthesis of bioactive ABA. Thus, the ripening process triggers. When AZA was injected to

CHAPTER 3
313 PhD Thesis Félix Juan Martínez Rivas
strawberry receptacles, we observed an increase in auxins and gibberellin that reached similar
levels to that found in green and white stages of development. This was also accompanied by a
reduction of the ABA content in the AZA treated part that was due to a lower biosynthesis and an
enhanced withdrawal by means of oxidation and conjugation, suggesting that, as previously
described, this loop between gibberellin and ABA levels is active in AZA treated parts arresting
the normal ripening.
In summary, AZA treatment lead to the production of high levels of auxin and gibberellic,
hormones able to arrest or inhibit the ripening. Noticeably, it also reduces the concentration of
biologically active ABA because it represses those genes responsible for its biosynthesis and
induces the two kind of activities responsible for its withdrawal as a bioactive form. This
hormonal balance lead to a repression of many TFs implied in the ripening. And eventually many
genes coding for the biosynthesis of pigments, aroma and cell-wall modifying enzymes depending
upon these regulatory TFs are expressed at negligible or low levels. Whether these alterations are
directly mediated by a loss of the demethylation at the promoter and/or bodies of these same
genes, or indirectly by one or a set of regulatory master genes is still to be determined by running
a whole genome bisulfite sequencing or a similar experiment.
Material and methods
Plant material
Strawberry plants (Fragaria × ananassa Duch. cv Fortuna, an octoploid and commercial
cultivar) were grown under field conditions in the experimental farm “El Cebollar”, Moguer,
Huelva, SW of Spain. Full sized fruits at the green stage were harvested along with their pedicels,
which were submerged in Murashige and Skoog (MS) medium (Higuera et al., 2019). Those fruits
were kept in a plant chamber at 25 ºC with a 16/8h light/dark period. Fruits at different stages of
development and ripening were also harvested and immediately frozen in liquid nitrogen for
transport and in -80 ºC until use. Fig 6 shows the different stages used in this work.
Fig 6. Ripening stages used in this work. G1, G3, W, R and SE stands for Green1, Green3, White, Red and
senescent receptacles, respectively.
CHAPTER 3
314 Functional characterization of molecular regulatory mechanisms controlling the ripening in strawberry fruit
5-azacytidine treatments
5-azacytidine (AZA, Sigma-Aldrich Cat Nº A2385) was dissolved at 1 mM in sterile
water. This solution was filtered through 0.22µm polyethersulfone filters and approximately 0.5
mL was carefully injected into the green strawberry receptacles using a HPLC syringe by
introducing the needle around 0.3 to 0.5 cm into the fruit. Only half of each fruit was injected
with AZA, whereas the opposite part of the same fruit received sterile water and were used as
control. The AZA injections were repeated every other day for a total of 3-5 times until the water
injected part of the fruit was fully ripened. Thus, both parts were separated with the use of a
scalpel considering their color, frozen in liquid nitrogen, and stored at -80 ºC until use. Achenes
were carefully removed from the surface of the frozen fruits with the help of a scalpel.
RNA extraction
Total RNA was isolated and purified from 3 independent biological replicates in
accordance with (Gambino et al., 2008). Total RNA isolated was treated with DNAseI (RNase
free; Invitrogen) according to the manufacturer’s instructions. RNA samples were considered
DNA-free when no amplicons corresponding to the analyzed genes were detected through PCR
reactions.
RNA-Seq and analysis of differentially expressed genes (DEGs)
An Illumina’s TruSeq Stranded mRNA Library Prep Kit was used to prepare the libraries
following the manufacturer’s instructions. Briefly, each sample was enriched in mRNA by
selection 3’ poly(A) tails using poly(T) magnetic beads. Captured mRNAs were then converted
into cDNA, and sequencing adaptors were added to their ends to make the molecules ready for
sequencing. Samples were dual-indexed for post-sequencing demultiplexing. The fragment size
distribution and concentration of the libraries were checked in an Agilent 2100 Bioanalyzer using
the Agilent DNA 1000 kit. These were sequenced into a HiSeq-4000 Illumina platform as 2x100b
paired-end sequences. A total of 50±10 million of reads were obtained for each one of the libraries
which corresponded to approximately 40-50X coverage of the total haploid genome size. These
were analyzed with FastQC (Babraham Informatics, 2018) and trimmed with Trimmomatic
(Bolger et al., 2014) when required to get rid of low-quality bases and/or adapters. Reads were
then mapped to the fasta coding sequences corresponding to version 4.0.a1 of the Fragaria vesca
genome (Edger et al., 2018) using Kallisto v0.46.1; (Bray et al., 2016). That Fragaria × ananassa
reads can be mapped to the Fragaria vesca genome has been validated in many different
occasions and is supported by the very high homology found between the two genomes (Medina-
Puche et al., 2016; Sánchez-Sevilla et al., 2017). Differential expression was then analyzed using
the R package DESeq2 (Love et al., 2014) after importing the data with the tximport package

CHAPTER 3
315 PhD Thesis Félix Juan Martínez Rivas
(Soneson et al., 2016). A threshold cut-off was set for genes differentially expressed using a
log2FoldChange >=2 or <=-2, and an adjusted p-value <= 0.01. The fasta sequences
corresponding to the coding sequences for each of the genes were downloaded from the rosaceae
web page (http://bit.ly/2uSHd2n). Sequences and mapped data have been deposited in the public
GEO database GSE151534. Additional file 1 depict the total RNA-seq results.
Metabolites and Hormones determination
Primary metabolite determination
Extraction and analysis by gas chromatography coupled with mass spectrometry
performed using the same equipment set up and exact same protocol as described in (Lisec et al.,
2006). Briefly, frozen ground material from three biological replicates were homogenized in 300
μL of methanol at 70 °C for 15 min and 200 μL of chloroform followed by 300 μL of water were
added. The polar fraction was dried under vacuum, and the residue derivatized for 120 min at 37
°C (in 40 μL of 20 mg ml-1 methoxyamine hydrochloride in pyridine) followed by a 30 min
treatment at 37 °C with 70 μL of MSTFA. An autosampler Gerstel Multi-Purpose system (Gerstel
GmbH & Co.KG, Mülheim an der Ruhr, Germany) was used to inject the samples into a gas
chromatograph coupled to a time-of-flight mass spectrometer (GC-MS) system (Leco Pegasus
HT TOF-MS (LECO Corporation, St. Joseph, MI, USA). Helium was used as carrier gas at a
constant flow rate of 2 ml/s and gas chromatography was performed on a 30 m DB-35 column.
The injection temperature was 230 °C and the transfer line and ion source were set to 250 °C. The
initial temperature of the oven (85 °C) increased at a rate of 15°C/min up to a final temperature
of 360 °C. After a solvent delay of 180 sec mass spectra were recorded at 20 scans s-1 with m/z
70-600 scanning range. Mass chromatograms were evaluated using Chroma TOF 4.5 (Leco) and
TagFinder 4.2 software.
Secondary metabolites determination
Secondary metabolites were profiled using a Waters Acquity UPLC system coupled to
the Q-Exactive Orbitrap mass detector according to the previously published protocol (Giavalisco
et al., 2009). The UPLC system was equipped with an HSS T3 C18 reversed phase column (100
× 2.1 mm i.d., 1.8-µm particle size; Waters) that was operated at a temperature of 40 °C. The
mobile phases consisted of 0.1% formic acid in water (Solvent A) and 0.1% formic acid in
acetonitrile (Solvent B). The flow rate of the mobile phase was 400 µL/min, and 2 μL of sample
was loaded per injection. The UPLC was connected to an Exactive Orbitrap (Thermo Fisher
Scientific) via a heated electrospray source (Thermo Fisher Scientific). The spectra were recorded
using full scan mode of negative ion detection, covering a mass range from m/z 100 to 1500. The
resolution was set to 25,000, and the maximum scan time was set to 250 ms. The sheath gas was

CHAPTER 3
316 Functional characterization of molecular regulatory mechanisms controlling the ripening in strawberry fruit
set to a value of 60, while the auxiliary gas was set to 35. The transfer capillary temperature was
set to 150°C, while the heater temperature was adjusted to 300 °C. The spray voltage was fixed
at 3 kV, with a capillary voltage and a skimmer voltage of 25 and 15 V, respectively. MS spectra
were recorded from minute 0 to 19 of the UPLC gradient. Molecular masses, retention time, and
associated peak intensities were extracted from the raw files using RefinerMS (version 5.3;
GeneData), and Xcalibur software (Thermo Fisher Scientific). Metabolite identification and
annotation were performed using standard compounds, literature, and strawberry metabolomics
references (Aaby et al., 2005; Aaby et al., 2007; Vallarino et al., 2020; Merchante et al., 2013;
D’Urso et al., 2016; Enomoto et al., 2018; Perin et al., 2018). Data are reported in a manner
compliant with the standards suggested by (Fernie et al., 2011).
Hormone determination
About 200 mg of fresh‐frozen materials from three biological replicates were used to
extract and purify the hormones, as described by (Plackett et al., 2012), with the following minor
modifications: material was extracted with 80% acetonitrile containing 1% acetic acid (10 ml) for
1 h at 4 °C. After centrifugation at 3000 g for 20 min and collection of the supernatant, the residue
was re‐extracted by mixing with the same solvent, followed by centrifugation. The acetonitrile
was evaporated, and the residue dissolved in 2 ml of water containing 1% acetic acid, followed
by sonication for few minutes. The aqueous residue was loaded onto an OASIS HLB cartridge
(60 mg, 3 cc; Waters) and prewashed/equilibrated consecutively with 3 ml of acetonitrile,
methanol and 1% aqueous acetic acid. After washing with 1% aqueous acetic acid (3 ml),
hormones were eluted with 80% acetonitrile containing 1% acetic acid (2 × 3 mL). The dried
eluate was dissolved in 700 µL of water containing 1% acetic acid and passed through a SepPak
silica cartridge (100 mg; Waters), prewashed with MeOH (2 × 700 µl) and 0.1 m HCl (700 µl).
The extract was loaded onto an equilibrated MCX column, eluted by acetonitrile and evaporated.
The residue was dissolved in 700 µL of water containing 1% acetic acid. The aqueous residue
was loaded onto a Wash WAX solid‐phase column after prewashing with MeOH and then 0.1 M
NaOH, and then equilibrated by water. The column was then washed by MeOH and eluted by
80% acetonitrile containing 1% acetic acid, and the eluted fraction was evaporated and dissolved
in 30 µL of water containing 1% acetic acid. The levels of hormones were quantified with the
UPLC system coupled to a Triple Quad MS, as described in (Salem et al., 2020). Statistical
significance was tested with a Student’s t-test using Graphpad 8.0.

CHAPTER 3
317 PhD Thesis Félix Juan Martínez Rivas
References
Aaby, K., Ekeberg, D. and Skrede, G. (2007) Characterization of phenolic compounds in strawberry
(Fragaria x ananassa) fruits by different HPLC detectors and contribution of individual compounds to total
antioxidant capacity. J. Agric. Food Chem., 55, 4395–4406.
Aaby, K., Skrede, G. and Wrolstad, R.E. (2005) Phenolic composition and antioxidant activities in flesh
and achenes of strawberries (Fragaria ananassa). J. Agric. Food Chem., 53, 4032–40. Available at:
http://www.ncbi.nlm.nih.gov/pubmed/15884835.
Aharoni, A., Keizer, L.C.P., Bouwmeester, H.J., et al. (2000) Identification of the SAAT Gene Involved
in Strawberry Flavor Biogenesis by Use of DNA Microarrays. Plant Cell, 12, 647. Available at:
https://www.jstor.org/stable/10.2307/3870992
Almeida, J.R.., D’Amico, E., Preuss, A., et al. (2007) Characterization of major enzymes and genes
involved in flavonoid and proanthocyanidin biosynthesis during fruit development in strawberry (Fragaria
×ananassa). Arch. Biochem. Biophys., 465, 61–71. Available at:
https://linkinghub.elsevier.com/retrieve/pii/S0003986107002317.
Araguez, I., Osorio, S., Hoffmann, T., Rambla, J.L., Medina-Escobar, N., Granell, A., Botella, M.A.,
Schwab, W. and Valpuesta, V. (2013) Eugenol Production in Achenes and Receptacles of Strawberry
Fruits Is Catalyzed by Synthases Exhibiting Distinct Kinetics. Plant Physiol., 163, 946–958. Available at:
http://www.plantphysiol.org/cgi/doi/10.1104/pp.113.224352.
Babraham Informatics (2018) FastQC: a quality control tool for high throughput sequence data. Available
at: https://www.bioinformatics.babraham.ac.uk/projects/fastqc/.
Balic, I., Vizoso, P., Nilo-Poyanco, R., et al. (2018) Transcriptome analysis during ripening of table grape
berry cv. Thompson Seedless P. Kalaitzis, ed. PLoS One, 13, e0190087. Available at:
https://dx.plos.org/10.1371/journal.pone.0190087.
Barbera, G. La, Capriotti, A.L., Cavaliere, C., Piovesana, S., Samperi, R., Zenezini Chiozzi, R. and
Laganà, A. (2017) Comprehensive polyphenol profiling of a strawberry extract (Fragaria × ananassa) by
ultra-high-performance liquid chromatography coupled with high-resolution mass spectrometry. Anal.
Bioanal. Chem., 409, 2127–2142.
Belouah, I., Bénard, C., Denton, A., et al. (2020) Transcriptomic and proteomic data in developing tomato
fruit. Data Br., 28, 105015. Available at:
https://linkinghub.elsevier.com/retrieve/pii/S235234091931371X.
Benítez-Burraco, A., Blanco-Portales, R., Redondo-Nevado, J., Bellido, M.L., Moyano, E., Caballero,
J.L. and Muñoz-Blanco, J. (2003) Cloning and characterization of two ripening-related strawberry
(Fragaria x ananassa cv. Chandler) pectate lyase genes. J. Exp. Bot., 54, 633–645.
Bolger, A.M., Lohse, M. and Usadel, B. (2014) Trimmomatic: a flexible trimmer for Illumina sequence
data. Bioinformatics, 30, 2114–2120. Available at: https://academic.oup.com/bioinformatics/article-
lookup/doi/10.1093/bioinformatics/btu170.
Bray, N.L., Pimentel, H., Melsted, P. and Pachter, L. (2016) Near-optimal probabilistic RNA-seq
quantification. Nat. Biotechnol., 34, 525–527. Available at: http://www.nature.com/articles/nbt.3519.
Buendía, B., Gil, M.I., Tudela, J.A., Gady, A.L., Medina, J.J., Soria, C., López, J.M. and Tomás-
Barberán, F.A. (2010) HPLC-MS analysis of proanthocyanidin oligomers and other phenolics in 15

CHAPTER 3
318 Functional characterization of molecular regulatory mechanisms controlling the ripening in strawberry fruit
strawberry cultivars. J. Agric. Food Chem., 58, 3916–3926.
Busatto, N., Tadiello, A., Trainotti, L. and Costa, F. (2017) Climacteric ripening of apple fruit is
regulated by transcriptional circuits stimulated by cross-talks between ethylene and auxin. Plant Signal.
Behav., 12, e1268312. Available at: doi: 10.1080/15592324.2016.1268312.
Chai, Y.M., Jia, H.F., Li, C.L., Dong, Q.H. and Shen, Y.Y. (2011) FaPYR1 is involved in strawberry
fruit ripening. J. Exp. Bot., 62, 5079–5089.
Cheng, J., Niu, Q., Zhang, B., Chen, K., Yang, R., Zhu, J.-K., Zhang, Y. and Lang, Z. (2018)
Downregulation of RdDM during strawberry fruit ripening. Genome Biol., 19, 212. Available at:
https://genomebiology.biomedcentral.com/articles/10.1186/s13059-018-1587-x.
Concha, C.M., Figueroa, N.E., Poblete, L.A., Oñate, F.A., Schwab, W. and Figueroa, C.R. (2013)
Methyl jasmonate treatment induces changes in fruit ripening by modifying the expression of several
ripening genes in Fragaria chiloensis fruit. Plant Physiol. Biochem., 70, 433–444.
Csukasi, F., Osorio, S., Gutierrez, J.R., et al. (2011) Gibberellin biosynthesis and signalling during
development of the strawberry receptacle. New Phytol., 191, 376–390.
Cumplido-Laso, G., Medina-Puche, L., Moyano, E., et al. (2012) The fruit ripening-related gene
FaAAT2 encodes an acyl transferase involved in strawberry aroma biogenesis. J. Exp. Bot., 63, 4275–4290.
Available at: https://academic.oup.com/jxb/article-lookup/doi/10.1093/jxb/ers120.
D’Urso, G., Maldini, M., Pintore, G., d’Aquino, L., Montoro, P. and Pizza, C. (2016) Characterisation
of Fragaria vesca fruit from Italy following a metabolomics approach through integrated mass spectrometry
techniques. LWT - Food Sci. Technol., 74, 387–395. Available at: dx.doi.org/10.1016/j.lwt.2016.07.061.
Daminato, M., Guzzo, F. and Casadoro, G. (2013) A SHATTERPROOF-like gene controls ripening in
non-climacteric strawberries, and auxin and abscisic acid antagonistically affect its expression. J. Exp. Bot.,
64, 3775–86. Available at: http://www.ncbi.nlm.nih.gov/pubmed/23888065.
Davik, J., Aaby, K., Buti, M., Alsheikh, M., Šurbanovski, N., Martens, S., Røen, D. and Sargent, D.J.
(2020) Major-effect candidate genes identified in cultivated strawberry (Fragaria × ananassa Duch.) for
ellagic acid deoxyhexoside and pelargonidin-3-O-malonylglucoside biosynthesis, key polyphenolic
compounds. Hortic. Res., 7.
Deluc, L.G., Grimplet, J., Wheatley, M.D., et al. (2007) Transcriptomic and metabolite analyses of
Cabernet Sauvignon grape berry development. BMC Genomics, 8, 429. Available at:
http://www.ncbi.nlm.nih.gov/pubmed/18034876.
Ecker, J.R. (2013) Epigenetic trigger for tomato ripening. Nat. Biotechnol., 31, 119–120. Available at:
http://dx.doi.org/10.1038/nbt.2497.
Edger, P.P., VanBuren, R., Colle, M., et al. (2018) Single-molecule sequencing and optical mapping
yields an improved genome of woodland strawberry (Fragaria vesca) with chromosome-scale contiguity.
Gigascience, 7. Available at: doi/10.1093/gigascience/gix124/4739363.
Enomoto, H., Sato, K., Miyamoto, K., Ohtsuka, A. and Yamane, H. (2018) Distribution Analysis of
Anthocyanins, Sugars, and Organic Acids in Strawberry Fruits Using Matrix-Assisted Laser
Desorption/Ionization-Imaging Mass Spectrometry. J. Agric. Food Chem., 66, 4958–4965.
Estrada-Johnson, E., Csukasi, F., Pizarro, C.M., et al. (2017) Transcriptomic Analysis in Strawberry
Fruits Reveals Active Auxin Biosynthesis and Signaling in the Ripe Receptacle. Front. Plant Sci., 8, 142–

CHAPTER 3
319 PhD Thesis Félix Juan Martínez Rivas
149. Available at: http://doi.wiley.com/10.1111/j.1467-8330.1974.tb00606.x.
Feng, C., Chen, M., Xu, C., Bai, L., Yin, X., Li, X., Allan, A.C., Ferguson, I.B. and Chen, K. (2012)
Transcriptomic analysis of Chinese bayberry (Myrica rubra) fruit development and ripening using RNA-
Seq. BMC Genomics, 13, 19. Available at: http://bmcgenomics.biomedcentral.com/articles/10.1186/1471-
2164-13-19.
Fernie, A.R., Aharoni, A., Willmitzer, L., et al. (2011) Recommendations for Reporting Metabolite Data.
Plant Cell, 23, 2477–2482. Available at: http://www.plantcell.org/lookup/doi/10.1105/tpc.111.086272.
Furner, I.J. and Matzke, M. (2011) Methylation and demethylation of the Arabidopsis genome. Curr.
Opin. Plant Biol., 14, 137–141. Available at:
https://linkinghub.elsevier.com/retrieve/pii/S1369526610001755.
Gallusci, P., Hodgman, T.C., Teyssier, E. and Seymour, G. (2016) DNA methylation and chromatin
regulation during fleshy fruit development and ripening. Front. Plant Sci., 7, 807.
Gambino, G., Perrone, I. and Gribaudo, I. (2008) A rapid and effective method for RNA extraction from
different tissues of grapevine and other woody plants. Phytochem. Anal., 19, 520–525. Available at:
https://onlinelibrary.wiley.com/doi/abs/10.1002/pca.1078.
Giampieri, F., Alvarez-suarez, J.M., Battino, M., Agrarie, S., Ambientali, A., Politecnica, U. and
Ranieri, V. (2014) Strawberry and Human Health : Effects beyond Antioxidant Activity. J. Agric. Food
Chem., 64, 3867–3876.
Giavalisco, P., Kohl, K., Hummel, J., Seiwert, B. and Willmitzer, L. (2009) 13 C Isotope-Labeled
Metabolomes Allowing for Improved Compound Annotation and Relative Quantification in Liquid
Chromatography-Mass Spectrometry-based Metabolomic Research. Anal. Chem., 81, 6546–6551.
Available at: https://pubs.acs.org/doi/10.1021/ac900979e.
Given, N.K., Venis, M.A. and Gierson, D. (1988) Hormonal regulation of ripening in the strawberry, a
non-climacteric fruit. Planta, 174, 402–406. Available at: http://link.springer.com/10.1007/BF00959527.
Griesser, M., Hoffmann, T., Bellido, M.L., Rosati, C., Fink, B., Kurtzer, R., Aharoni, A., Munoz-
Blanco, J. and Schwab, W. (2008) Redirection of Flavonoid Biosynthesis through the Down-Regulation
of an Anthocyanidin Glucosyltransferase in Ripening Strawberry Fruit. Plant Physiol., 146, 1528–1539.
Available at: http://www.plantphysiol.org/cgi/doi/10.1104/pp.107.114280.
Guo, D.L., Li, Q., Ji, X.R., Wang, Z.G. and Yu, Y.H. (2019) Transcriptome profiling of “Kyoho” grape
at different stages of berry development following 5-azaC treatment. BMC Genomics, 20, 1–15.
Higuera, J.J., Garrido-Gala, J., Lekhbou, A., et al. (2019) The Strawberry FaWRKY1 Transcription
Factor Negatively Regulates Resistance to Colletotrichum acutatum in Fruit Upon Infection. Front. Plant
Sci., 10. Available at: https://www.frontiersin.org/article/10.3389/fpls.2019.00480/full.
Huang, H., Liu, R., Niu, Q., Tang, K., Zhang, B., Zhang, H., Chen, K., Zhu, J.-K. and Lang, Z. (2019)
Global increase in DNA methylation during orange fruit development and ripening. Proc. Natl. Acad. Sci.,
116, 1430–1436. Available at: http://www.pnas.org/lookup/doi/10.1073/pnas.1815441116.
Hudson, K., Luo, S., Hagemann, N. and Preuss, D. (2011) Changes in Global Gene Expression in
Response to Chemical and Genetic Perturbation of Chromatin Structure A. Imhof, ed. PLoS One, 6, e20587.
Available at: https://dx.plos.org/10.1371/journal.pone.0020587.
Jia, H.-F., Chai, Y.-M., Li, C.-L., Lu, D., Luo, J.-J., Qin, L. and Shen, Y.-Y. (2011) Abscisic Acid Plays
CHAPTER 3
320 Functional characterization of molecular regulatory mechanisms controlling the ripening in strawberry fruit
an Important Role in the Regulation of Strawberry Fruit Ripening. Plant Physiol., 157, 188–199. Available
at: http://www.plantphysiol.org/lookup/doi/10.1104/pp.111.177311.
Jia, H., Jiu, S., Zhang, C., Wang, C., Tariq, P., Liu, Z., Wang, B., Cui, L. and Fang, J. (2016) Abscisic
acid and sucrose regulate tomato and strawberry fruit ripening through the abscisic acid-stress-ripening
transcription factor. Plant Biotechnol. J., 14, 2045–2065.
Jia, H., Wang, Y., Sun, M., et al. (2013) Sucrose functions as a signal involved in the regulation of
strawberry fruit development and ripening. New Phytol., 198, 453–465.
Lavelle, D., Saunthararajah, Y. and Desimone, J. (2008) DNA methylation and mechanism of action of
5-azacytidine. Blood, 111, 2485.
Lee, S., Chung, E.-J., Joung, Y.-H. and Choi, D. (2010) Non-climacteric fruit ripening in pepper:
increased transcription of EIL-like genes normally regulated by ethylene. Funct. Integr. Genomics, 10,
135–146. Available at: http://link.springer.com/10.1007/s10142-009-0136-9.
Liao, X., Li, M., Liu, B., Yan, M., Yu, X., Zi, H., Liu, R. and Yamamuro, C. (2018) Interlinked
regulatory loops of ABA catabolism and biosynthesis coordinate fruit growth and ripening in woodland
strawberry. Proc. Natl. Acad. Sci., 115, E11542–E11550. Available at:
http://www.pnas.org/lookup/doi/10.1073/pnas.1812575115.
Lisec, J., Schauer, N., Kopka, J., Willmitzer, L. and Fernie, A.R. (2006) Gas chromatography mass
spectrometry–based metabolite profiling in plants. Nat. Protoc., 1, 387–396. Available at:
http://www.nature.com/articles/nprot.2006.59.
Liu, R., How-Kit, A., Stammitti, L., et al. (2015) A DEMETER-like DNA demethylase governs tomato
fruit ripening. Proc. Natl. Acad. Sci., 112, 10804–10809. Available at:
http://www.pnas.org/lookup/doi/10.1073/pnas.1503362112.
Love, M.I., Huber, W. and Anders, S. (2014) Moderated estimation of fold change and dispersion for
RNA-seq data with DESeq2. Genome Biol., 15, 550. Available at:
http://genomebiology.biomedcentral.com/articles/10.1186/s13059-014-0550-8.
Ma, C., Liang, B., Chang, B., Liu, L., Yan, J., Yang, Y. and Zhao, Z. (2018) Transcriptome profiling
reveals transcriptional regulation by DNA methyltransferase inhibitor 5-aza-2′-deoxycytidine enhancing
red pigmentation in bagged “granny smith” apples (Malus domestica). Int. J. Mol. Sci., 19.
Mano, Y. and Nemoto, K. (2012) The pathway of auxin biosynthesis in plants. J. Exp. Bot., 63, 2853–
2872. Available at: https://academic.oup.com/jxb/article-lookup/doi/10.1093/jxb/ers091.
Martínez, G.A., Chaves, A.R. and Añón, M.C. (1996) Effect of exogenous application of gibberellic acid
on color change and phenylalanine ammonia-lyase, chlorophyllase, and peroxidase activities during
ripening of strawberry fruit (Fragaria ×ananassa Duch.). J. Plant Growth Regul., 15, 139–146.
Medina-Escobar, N., Cárdenas, J., Moyano, E., Caballero, J.L. and Muñoz-Blanco, J. (1997) Cloning,
molecular characterization and expression pattern of a strawberry ripening-specific cDNA with sequence
homology to pectate lyase from higher plants. Plant Mol. Biol., 34, 867–877.
Medina-Puche, L., Blanco-Portales, R., Molina-Hidalgo, F.J., et al. (2016) Extensive transcriptomic
studies on the roles played by abscisic acid and auxins in the development and ripening of strawberry fruits.
Funct. Integr. Genomics, 16, 671–692. Available at: http://dx.doi.org/10.1007/s10142-016-0510-3.
Medina-Puche, L., Cumplido-Laso, G., Amil-Ruiz, F., et al. (2014) MYB10 plays a major role in the

CHAPTER 3
321 PhD Thesis Félix Juan Martínez Rivas
regulation of flavonoid/phenylpropanoid metabolism during ripening of Fragaria × ananassa fruits. J. Exp.
Bot., 65, 401–417.
Medina-Puche, L., Martínez-Rivas, F.J., Molina-Hidalgo, F.J., Mercado, J.A., Moyano, E.,
Rodríguez-Franco, A., Caballero, J.L., Muñoz-Blanco, J. and Blanco-Portales, R. (2019) An atypical
HLH transcriptional regulator plays a novel and important role in strawberry ripened receptacle. BMC Plant
Biol., 19, 586.
Medina-Puche, L., Molina-Hidalgo, F.J., Boersma, M., et al. (2015) An R2R3-MYB Transcription
Factor Regulates Eugenol Production in Ripe Strawberry Fruit Receptacles. Plant Physiol., 168, 598–614.
Available at: http://www.ncbi.nlm.nih.gov/pubmed/25931522.
Merchante, C., Vallarino, J.G., Osorio, S., et al. (2013) Ethylene is involved in strawberry fruit ripening
in an organ-specific manner. J. Exp. Bot., 64, 4421–4439.
Molina-Hidalgo, F.J., Franco, A.R., Villatoro, C., et al. (2013) The strawberry (Fragaria×ananassa) fruit-
specific rhamnogalacturonate lyase 1 (FaRGLyase1) gene encodes an enzyme involved in the degradation
of cell-wall middle lamellae. J. Exp. Bot., 64, 1471–1483.
Molina-Hidalgo, F.J., Medina-Puche, L., Cañete-Gómez, C., et al. (2017) The fruit-specific
transcription factor FaDOF2 regulates the production of eugenol in ripe fruit receptacles. J. Exp. Bot., 68,
4529–4543. Available at: http://academic.oup.com/jxb/article/68/16/4529/4067750/The-fruitspecific-
transcription-factor-FaDOF2.
Moya-León, M.A., Mattus-Araya, E. and Herrera, R. (2019) Molecular events occurring during
softening of strawberry fruit. Front. Plant Sci., 10.
Moyano, E., Portero-robles, I., Medina-Escobar, N., et al. (1998) A Fruit-Specific Putative
Dihydroflavonol 4-Reductase Gene is differentially expressed in strawberry during the ripening process.
Plant Physiol., 117, 711–716.
Nambara, E. and Marion-Poll, A. (2005) ABSCISIC ACID BIOSYNTHESIS AND CATABOLISM.
Annu. Rev. Plant Biol., 56, 165–185. Available at: doi: 10.1146/annurev.arplant.56.032604.144046.
Nitsch, J.P. (1950) Growth and morphogenesis of the strawberry as related to auxin. Am. J. Bot., 37, 211–
215. Available at: https://onlinelibrary.wiley.com/doi/abs/10.1002/j.1537-2197.1950.tb12183.x.
Osei, M.., Danquah, A., Blay, E.., Danquah, E. and Adu-Dapaah, H. (2017) An overview of tomato
fruit-ripening mutants and their use in increasing shelf life of tomato fruits. African J. Agric. Res., 12, 3520–
3528. Available at: http://academicjournals.org/journal/AJAR/article-abstract/0714CAF67131.
Pei, M., Gu, C. and Zhang, S. (2019) Genome-wide identification and expression analysis of genes
associated with peach (Prunus persica) fruit ripening. Sci. Hortic. (Amsterdam)., 246, 317–327. Available
at: https://linkinghub.elsevier.com/retrieve/pii/S0304423818307738.
Perin, E.C., Crizel, R.L., Galli, V., Silva Messias, R. da, Rombaldi, C.V. and Chaves, F.C. (2018)
Extraction and Quantification of Abscisic Acid and Derivatives in Strawberry by LC-MS. Food Anal.
Methods, 11, 2547–2552.
Perkins-Veazie, P. (1995) Growth and Ripening of Strawberry Fruit. In Horticultural Reviews. Oxford,
UK: John Wiley & Sons, Inc., pp. 267–297. Available at:
http://doi.wiley.com/10.1002/9780470650585.ch8.
Plackett, A.R.G., Powers, S.J., Fernandez-Garcia, N., et al. (2012) Analysis of the Developmental Roles

CHAPTER 3
322 Functional characterization of molecular regulatory mechanisms controlling the ripening in strawberry fruit
of the Arabidopsis Gibberellin 20-Oxidases Demonstrates That GA20ox1 , -2 , and -3 Are the Dominant
Paralogs. Plant Cell, 24, 941–960. Available at: doi/10.1105/tpc.111.095109.
Quesada, M.A., Blanco-Portales, R., Pose, S., et al. (2009) Antisense Down-Regulation of the FaPG1
Gene Reveals an Unexpected Central Role for Polygalacturonase in Strawberry Fruit Softening. Plant
Physiol., 150, 1022–1032. Available at: http://www.plantphysiol.org/cgi/doi/10.1104/pp.109.138297.
Raab, T., López-Ráez, J.A., Klein, D., Caballero, J.L., Moyano, E., Schwab, W. and Muñoz-Blanco,
J. (2006) FaQR, required for the biosynthesis of the strawberry flavor compound 4-hydroxy-2,5-dimethyl-
3(2H)-furanone, encodes an enone oxidoreductase. Plant Cell, 18, 1023–37. Available at:
http://www.ncbi.nlm.nih.gov/pubmed/16517758.
Salem, M.A., Yoshida, T., Perez de Souza, L., Alseekh, S., Bajdzienko, K., Fernie, A.R. and
Giavalisco, P. (2020) An improved extraction method enables the comprehensive analysis of lipids,
proteins, metabolites and phytohormones from a single sample of leaf tissue under water‐deficit stress.
Plant J., tpj.14800. Available at: https://onlinelibrary.wiley.com/doi/abs/10.1111/tpj.14800.
Sánchez-Sevilla, J.F., Vallarino, J.G., Osorio, S., Bombarely, A., Posé, D., Merchante, C., Botella,
M.A., Amaya, I. and Valpuesta, V. (2017) Gene expression atlas of fruit ripening and transcriptome
assembly from RNA-seq data in octoploid strawberry (Fragaria × ananassa). Sci. Rep., 7, 13737. Available
at: http://www.nature.com/articles/s41598-017-14239-6.
Santi, D. V, Norment, A. and Garrett, C.E. (1984) Covalent bond formation between a DNA-cytosine
methyltransferase and DNA containing 5-azacytosine. Proc. Natl. Acad. Sci. U. S. A., 81, 6993–7. Available
at: http://www.ncbi.nlm.nih.gov/pubmed/6209710.
Santiago-Domenech, N., Jimenez-Bemudez, S., Matas, A.J., Rose, J.K.C., Munoz-Blanco, J.,
Mercado, J.A. and Quesada, M.A. (2008) Antisense inhibition of a pectate lyase gene supports a role for
pectin depolymerization in strawberry fruit softening. J. Exp. Bot., 59, 2769–2779. Available at:
https://academic.oup.com/jxb/article-lookup/doi/10.1093/jxb/ern142.
Sauter, A., Dietz, K.-J. and Hartung, W. (2002) A possible stress physiological role of abscisic acid
conjugates in root-to-shoot signalling. Plant, Cell Environ., 25, 223–228. Available at:
http://doi.wiley.com/10.1046/j.1365-3040.2002.00747.x.
Schaart, J.G., Dubos, C., Romero De La Fuente, I., et al. (2013) Identification and characterization of
MYB-bHLH-WD40 regulatory complexes controlling proanthocyanidin biosynthesis in strawberry
(Fragaria × ananassa) fruits. New Phytol., 197, 454–67. Available at:
http://www.ncbi.nlm.nih.gov/pubmed/23157553.
Solís, M.-T., El-Tantawy, A.-A., Cano, V., Risueño, M.C. and Testillano, P.S. (2015) 5-azacytidine
promotes microspore embryogenesis initiation by decreasing global DNA methylation, but prevents
subsequent embryo development in rapeseed and barley. Front. Plant Sci., 6. Available at:
http://journal.frontiersin.org/Article/10.3389/fpls.2015.00472/abstract.
Soneson, C., Love, M.I. and Robinson, M.D. (2016) Differential analyses for RNA-seq: transcript-level
estimates improve gene-level inferences. F1000Research, 4, 1521. Available at:
https://f1000research.com/articles/4-1521/v2.
Stresemann, C. and Lyko, F. (2008) Modes of action of the DNA methyltransferase inhibitors azacytidine
and decitabine. Int. J. Cancer, 123, 8–13.

CHAPTER 3
323 PhD Thesis Félix Juan Martínez Rivas
Symons, G.M., Chua, Y.-J., Ross, J.J., Quittenden, L.J., Davies, N.W. and Reid, J.B. (2012) Hormonal
changes during non-climacteric ripening in strawberry. J. Exp. Bot., 63, 4741–50. Available at:
http://www.ncbi.nlm.nih.gov/pubmed/22791823.
Teyssier, E., Boureauv, L., Chen, W., Lui, R., Degraeve-Guibault, C., Stammitti, L., Hong, Y. and
Gallusci, P. (2015) Epigenetic regulation during fleshy fruit development and ripening. In Applied Plant
Genomics and Biotechnology. Elsevier, pp. 133–151. Available at:
https://linkinghub.elsevier.com/retrieve/pii/B9780081000687000082.
Tornielli, G.B., Zamboni, A., Zenoni, S., Delledonne, M. and Pezzotti, M. eds. (2012) Transcriptomics
and Metabolomics for the Analysis of Grape Berry Development. In The Biochemistry of the Grape Berry.
BENTHAM SCIENCE PUBLISHERS, pp. 218–240. Available at:
http://www.eurekaselect.com/node/98490.
Usadel, B., Schlüter, U., Mølhøj, M., Gipmans, M., Verma, R., Kossmann, J., Reiter, W.-D. and
Pauly, M. (2004) Identification and characterization of a UDP- d-glucuronate 4-epimerase in Arabidopsis.
FEBS Lett., 569, 327–331. Available at: http://doi.wiley.com/10.1016/j.febslet.2004.06.005.
Vallarino, J.G., Merchante, C., Sánchez-Sevilla, J.F., et al. (2020) Characterizing the involvement of
FaMADS9 in the regulation of strawberry fruit receptacle development. Plant Biotechnol. J., 18, 929–943.
Available at: https://onlinelibrary.wiley.com/doi/abs/10.1111/pbi.13257.
Vallarino, J.G., Osorio, S., Bombarely, A., et al. (2015) Central role of FaGAMYB in the transition of
the strawberry receptacle from development to ripening. New Phytol., 208, 482–496.
Veselý, J. and Čihák, A. (1978) 5-azacytidine: Mechanism of action and biological effects in mammalian
cells. Pharmacol. Ther. Part A Chemother. Toxicol., 2, 813–840.
Villarreal, N.M., Bustamante, C.A., Civello, P.M. and Martínez, G.A. (2010) Effect of ethylene and 1-
MCP treatments on strawberry fruit ripening. J. Sci. Food Agric., 90, 683–689. Available at:
http://doi.wiley.com/10.1002/jsfa.3868.
Xie, M., Huang, Y., Zhang, Y., Wang, X., Yang, H., Yu, O., Dai, W. and Fang, C. (2013) Transcriptome
profiling of fruit development and maturation in Chinese white pear (Pyrus bretschneideri Rehd). BMC
Genomics, 14, 823. Available at: http://bmcgenomics.biomedcentral.com/articles/10.1186/1471-2164-14-
823.
Xu, J., Wang, X., Cao, H., Xu, H., Xu, Q. and Deng, X. (2017) Dynamic changes in methylome and
transcriptome patterns in response to methyltransferase inhibitor 5-azacytidine treatment in citrus. DNA
Res., 24, 509–522.
Yun, Z., Li, T., Gao, H., Zhu, H., Gupta, V.K., Jiang, Y. and Duan, X. (2019) Integrated Transcriptomic,
Proteomic, and Metabolomics Analysis Reveals Peel Ripening of Harvested Banana under Natural
Condition. Biomolecules, 9. Available at: http://www.ncbi.nlm.nih.gov/pubmed/31052343.
Zhang, A., Wang, W., Tong, Y., Li, M., Grierson, D., Ferguson, I., Chen, K. and Yin, X. (2018)
Transcriptome Analysis Identifies a Zinc Finger Protein Regulating Starch Degradation in Kiwifruit. Plant
Physiol., 178, 850–863. Available at: http://www.plantphysiol.org/lookup/doi/10.1104/pp.18.00427.
Zhang, Q., Feng, C., Li, W., Qu, Z., Zeng, M. and Xi, W. (2019) Transcriptional regulatory networks
controlling taste and aroma quality of apricot (Prunus armeniaca L.) fruit during ripening. BMC Genomics,
20, 45. Available at: https://bmcgenomics.biomedcentral.com/articles/10.1186/s12864-019-5424-8.

CHAPTER 3
324 Functional characterization of molecular regulatory mechanisms controlling the ripening in strawberry fruit
Zhang, Z., Jiang, S., Wang, N., et al. (2015) Identification of Differentially Expressed Genes Associated
with Apple Fruit Ripening and Softening by Suppression Subtractive Hybridization X. Zhang, ed. PLoS
One, 10, e0146061. Available at: https://dx.plos.org/10.1371/journal.pone.0146061.
Zhang, Z., Kang, C., Zhang, S. and Li, X. (2019) Transcript analyses reveal a comprehensive role of
abscisic acid in modulating fruit ripening in Chinese jujube. BMC Plant Biol., 19, 189. Available at:
https://bmcplantbiol.biomedcentral.com/articles/10.1186/s12870-019-1802-2.
Zhong, S., Fei, Z., Chen, Y., et al. (2013) Single-base resolution methylomes of tomato fruit development
reveal epigenome modifications associated with ripening. Nat. Biotechnol., 31, 154–159. Available at:
http://dx.doi.org/10.1038/nbt.2462.
Zhu, Y.-C., Zhang, B., Allan, A.C., Lin‐Wang, K., Zhao, Y., Wang, K., Chen, K.-S. and Xu, C.-J.
(2020) DNA demethylation is involved in the regulation of temperature‐dependent anthocyanin
accumulation in peach. Plant J., 102, 965–976. Available at:
https://onlinelibrary.wiley.com/doi/abs/10.1111/tpj.14680.

CHAPTER 3
325 PhD Thesis Félix Juan Martínez Rivas
Additional files
Additional file 1: Total RNA-seq data. Gene ID and corresponding annotations as reported in
Fragaria vesca v4.0 Genome Database (https://www.rosaceae.org/)
Data available on the electronic version of the thesis.

CHAPTER 4
326 Functional characterization of molecular regulatory mechanisms controlling the ripening in strawberry fruit

CHAPTER 4
327 PhD Thesis Félix Juan Martínez Rivas
CHAPTER 4
A novel carboxylesterase is involved in volatile production in strawberry
fruit

CHAPTER 4
328 Functional characterization of molecular regulatory mechanisms controlling the ripening in strawberry fruit
Martínez-Rivas FJ, Blanco-Portales R, Caballero JL, Alseekh S, Fernie AR, Schawb W,
Muñoz-Blanco J, Molina-Hidalgo FJ. 2021. A novel carboxylesterase is involved in
volatile production in strawberry fruit

CHAPTER 4
329 PhD Thesis Félix Juan Martínez Rivas
Introduction
As part of a variable diet, strawberry is becoming one of the most considerable fruit in
the world. Consumers appreciate it because of its unique flavor and nutritional quality.
Nevertheless, a decline in strawberry sales has focused scientific studies and producers’ urges in
prolonging shelf life, and improving yield, (Qin et al., 2008). Those studies have put aside
breeding objectives in regards with flavor characteristics. Meanwhile consumer most valuable
feature to buy or not this fruit is taste (Yan et al., 2018). More than a 90% of consumers prefer
strawberries with “intense” aroma, and this quality is even more important than the size or shape
of the fruit. (Bhat et al., 2015) Strawberry fruit ripening culminates as the flesh softens, volatile
emission peaks, and sugars accumulate. This highly coordinated process results in fruit with
strong liking due primarily to texture, flavor, and sweetness (Schwieterman et al., 2014).
The strawberry unique flavor is due to sugar, acids and volatile compounds. The content
and balance of those compounds would define their taste. The predominant sweet compound are
sugars, in the form of glucose, fructose and sucrose. Sour metabolite major compounds are acids,
especially citric and malic acid (Giampieri et al., 2012; Mikulic-Petkovsek et al., 2012). Although
volatiles are found in a very low concentration, only 0.001-0.01% in fresh weight, little changes
in their composition may change the taste dramatically (Larsen and Poll, 1990). More than 360
volatiles are found in strawberry fruits, and these compounds include esters, alcohols, ketones,
furans, terpenes, aldehydes and sulfur compounds (Zabetakis and Holden, 1997). Volatiles are
not only involved in taste, but also in plant defense (both herbivores and pathogens), plant-to-
plant interactions and attraction to seed dispersers and pollinators (Dudareva and Pichersky, 2008;
Kessler, 2001; Raguso, 2008).
In most fruits, as is the case with strawberry, the emission of volatiles begins and increase
with the process of fruit ripening. Strawberry volatiles are mainly composed by esters which,
depending on the cultivar, make up between 25-90% of total volatile content in strawberry (Jetti
et al., 2007). These esters are synthetized by alcohol acyltransferases and are broken down by
carboxylesterases (D’Auria, 2006), being the relationship between the two antagonistic enzymatic
activities what would determine the amount of volatile esters and alcohols. In strawberry
(Fragaria x annassa), Two genes coding for alcohol acyltransferases have been characterized,
SAAT and AAT2, (Aharoni et al., 2000; Cumplido-Laso et al., 2012), while, in wild F.vesca, has
only been characterized the enzyme VAAT and its corresponding gene FvAAT (Beekwilder et al.,
2004) and in F.chiloensis (González et al., 2009). Both F. ananassa enzymes increases their
expression along the ripening process and their expression is negatively regulated by auxins.
While FaAAT2 is more active with C6-C10 alcohols and shows less activity with short-chain

CHAPTER 4
330 Functional characterization of molecular regulatory mechanisms controlling the ripening in strawberry fruit
alcohols, FaSAAT present a higher activity with short alcohols. Thus, esters present in the fruits
depends on the availability of substrates and specificity of the AAT enzymes (Aharoni et al.,
2000; Cumplido-Laso et al., 2012). But, until this point, no carboxylesterase has been previously
characterized in strawberry, leaving unknown the functional activities of those enzymes in
strawberry fruit.
Plant carboxylesterases (CXE, EC 3.1.1.1) are hydrolytic enzymes that belong to the α/β
hydrolase fold superfamily of proteins. In the presence of water, these enzymes catalyze the
hydrolysis of carboxylic esters into their corresponding alcohols and carboxylic acids.
Structurally, CXEs present a conserved catalytic triad, contained in the conserved sequence
GXSXG, formed by serine, an acidic amino acid, and a histidine, and that constitutes the active
site of these enzymes (Ileperuma et al., 2007; Marshall et al., 2003; Oakeshott et al., 1999). In
plants, the functions of CXE enzymes are poorly understood. However, it has been suggested that
they could be related to important biochemical and physiological functions in plants as
xenobiotics degradation, biotic stresses, as well as with the production of volatiles compound that
are components of the ripen fruits aroma (Cunnac et al., 2007; Souleyre et al., 2011; Cao, Duan,
et al., 2019; Cao, Xie, et al., 2019).
In Arabidopsis thaliana, the carboxylesterase enzymes were classified in three clades;
Clade I, included those CXE related with the xenobiotic responses, scent volatiles degradation
and others metabolites modification; Clade II contains salicylic acid binding protein with CXE
activitiy as well as methyl esterases (MES), this esterases play important roles in the interactions
between plants and pathogens; while Clade III includes the GDLipases those which present
carboxyl esterase enzymatic activity (Marshall et al., 2003; Gershater and Edwards, 2007)
Plants CXE clade 1 and 3 could, preferably, catalyze the hydrolysis of a wider range
esters, for instance those composed by different acyl group combined to linear chain of fatty acids
(C1-C16), branched chain, or aryl esters (Cummins et al., 2007; Ileperuma et al., 2007). The
putative involvement of the CXEs clade 2 in the defensive plant responses against some fungal
pathogens it has been proposed. The Arabidopsis thaliana carboxylesterase AtCXE8 is part from
the plant response against the fugal pathogens Botrytis cinera (Lee et al., 2013). The resistance
observed by transgenic pepper fruits, overexpressing the gene PepESTs, in its interaction with the
fungal pathogen Colletotrichum gloesporoides, was, at least, partially mediated by an increase in
the amount of the encoded CXE enzyme (PepEST) (Ko et al., 2016)
The functional role played by CXEs throughout the fruit ripening has been poorly studied.
In Malus it has been demonstrated that a ripening-related carboxylesterases (MdCXE1) could be

CHAPTER 4
331 PhD Thesis Félix Juan Martínez Rivas
associated to flavor esters hydrolysis, mainly butyl and hexyl acetated that are components of the
ripen fruit aroma (Souleyre et al., 2011). In a similar way, in tomato (Solanum lycopersicum),
SlCXE1is responsible for the regulation of the fruit volatile acetate ester content (Goulet et al.,
2012). Moreover, in prunus a CXE has been related with ester production in the ripening process,
whose overexpression reduces the amount of esters produced (Cao, Xie, et al., 2019)
Previous transcriptomic studies performed in our research group (Medina-Puche et al.,
2016) enabled us to identify a ripening-related carboxylesterase in strawberry fruit, which
displayed significant sequence homology with carboxylesterases from higher plants. In this study,
we report the isolation and biochemical characterization of one of them, FaCXE2 that is expressed
during the strawberry fruit growth and ripening and has a specific expression pattern related to
the fruit. The semi-purified recombinant enzyme has been obtained and its enzymatic affinity for
different substrates studied. Our results show that FaCXE2 is an enzyme with biochemical
activity, able to hydrolyze esters in vitro, supporting the possibility that the FaCXE2 protein could
play a role in the production of volatile compounds during the ripening in strawberry fruit.
Transient transgenic silenced fruits exhibit a down regulation of FaCXE2 concomitant with an
increase of esters, as methyl hexanoate, methyl butanoate and ethyl hexanoate, among others as
well as an increase of alcohols, hexenol and linanool, proving that FaCXE2 plays a role regulating
volatile content in strawberry.
Results
Bioinformatics and phylogenetics analysis of the FaCXE2 gene and protein
Previous analyses comparing transcriptomes of green immature versus red-ripened
strawberry receptacles using a 35k microarray oligo-based platform enabled us to identify a gene
encoding a carboxylesterase putative (FaCXE2) (Medina-Puche et al., 2014). This gene was
strongly up-regulated in ripened fruits. The cDNA sequence of the FaCXE2 gene contains an
open reading frame of 981bp, encodes a polypeptide of 326 amino acids and has a predicted
molecular mass of 37.06 KDa. An InterPro scan revealed that this sequence had signatures
resembling to proteins that belong to the family of carboxylesterases, including in the α/β
hydrolase fold superfamily. InterPro scan find homology with the subgroup GDXG family of
lipolytic enzymes and a transmembrane region (Fig 1). In addition, a BLASTP search showed a
high degree of similarity between this FaCXE2 and carboxylesterases from higher plants, with
identities ranging from 50 % to 78 %.

CHAPTER 4
332 Functional characterization of molecular regulatory mechanisms controlling the ripening in strawberry fruit
Fig 1. Predicted domain present in FaCXE2 aminoacidic sequence using InterProScan. An alpha/beta
hydrolase domain is present in the sequence.
Phylogenetic analysis of the predicted sequence of FaCXE2, together with plant CXEs of
known function, 16 apple CXEs described in (Souleyre et al., 2011), and the 20 A. thaliana CXEs
described in (Marshall et al., 2003) was conducted (Fig 2). FaCXE2 is related to the dehydratases,
MdCXE8, HIDM and HIDH, involved in isoflavanone biosynthesis in soybean and liquorice
including in the clade III, following the classification of (Souleyre et al., 2011). These proteins
have similar molecular weight, similar isoelectric point and the same prediction for its subcellular
localization than FaCXE2 (Table 1). The predicted catalytic triad residues (Ser, Acid, and His)
including the pentapeptide sequence (GXSXG) surrounding the nucleophilic serine is present in
the aminoacidic sequence (Fig 3). FaCXE2, as MdCXE8 has a serine at its active center like
almost all other carboxylesterase-like proteins, rather than a threonine as the dehydratases HIDM
and HIHD possess (Fig 3). A conserved sequence (Gly-82- Gly-83) constituting an oxyanion hole
within the carboxylesterase motif, and a conserved carboxyl-terminal KDEL-tetrapeptide motif
is present too in the protein (Satoh and Hosokawa, 2006).
Table 1. Predicted properties of different carboxyl esterase characterized in plants and the prediction of the
intracellular localization of the proteins using two different websites.
FaCXE2 MdCXE8 GeHIDM PpCXE1 GmHIDH
NCBI Acc. No XP_004290227.1 ES789984 BAD80839.1 ONH91534.1 BAD80840.1
Protein size (aa) 325 339 328 315 319
pI 5.29 5.46 5.41 6.15 5.75
MW (Da) 35789.38 37528.71 36060.81 34469.3 35138.09
Cello2Go cytoplasme chloroplast cytoplasme cytoplasme cytoplasme
WolfPSORT cytoplasme chloroplast cytoplasme cytoplasme cytoplasme
Prediction of intracellular localization of the proteins

CHAPTER 4
333 PhD Thesis Félix Juan Martínez Rivas
Fig 2. Phylogenetic tree of plant CXE family members. CXE protein sequences predicted from cDNA
sequences. Abbreviations for species, carboxylesterase names, and their GenBank accessions are as
follows: strawberry (Fragaria × ananassa; FaCXE2) apple (Malus domestica carboxylesterase; MdCXE1:
ES789959; MdCXE2: ES789969; MdCXE3: ES789964; MdCXE4: ES789967; MdCXE5: ES789968;
MdCXE6: ES789979; MdCXE7: ES789974; MdCXE8: ES789984; MdCXE9: ES789966; MdCXE10:
ES789970; MdCXE11: EG631279; MdCXE12: ES790010, MdCXE13: ES789965; MdCXE14:
EG631362; MdCXE15: CN942679; MdCXE16: EB106571); Arabidopsis (Arabidopsis thaliana
carboxylesterase; AtCXE1: NP_173353.1; AtCXE2: NP_564507.1; AtCXE3: NP_175387.1; AtCXE4:
NP_564552.1; AtCXE5: NP_175389.1; AtCXE6: NP_564936.1; AtCXE7: NP_178453.1; AtCXE8:
NP_566047.1; AtCXE9: NP_182085.1; AtCXE10: NP_187163.1; AtCXE11: NP_180300.1; AtCXE12:
NP_190438.1; AtCXE13: NP_190439.1; AtCXE14: NP_191860.1; AtCXE15: NP_196275.1; AtCXE16:
NP_568298.1; AtCXE17: NP_197112.1; AtCXE18: NP_197744.1; AtCXE19: NP_198084.1; AtCXE20:
NP_201024.1); grape (Vitis vinifera BIG8.1; VvBIG8.1: AF487826.1); kiwifruit (Actinidia eriantha
carboxylesterase, AeCXE1: DQ279914); licorice (Glycyrrhiza echinate HIDM; GeHIDM: BAD80839.1);
pepper (Capsicum annuum PepEST; CaPepEST, AAF77578.1); pine (Pinus radiate PrMC3; PrMC3:
AAD04946.2); soybean (Glycine max HIDH; GmHIDH: BAD80840.1); tobacco (Nicotiana tabacum
hsr203j; hsr203j, AAF62404.1); rice (Oryza sativa GID1: AAV59435.1).
Clade III

CHAPTER 4
334 Functional characterization of molecular regulatory mechanisms controlling the ripening in strawberry fruit
Fig 3. Aligment of the amino acid sequence of FaCXE2, MdCXE8, GeHIDM and GmHIDH. Putative
residues that constitute the catalytic triad (Ser/Thr, Asp, and His) are indicated with a point (●), the
GXS/TXG sequence, the oxyanion hole (Gly- Gly) and the KDEL-motif are underlined.
Spatio-temporal expression profile of FaCXE2 gene
In fruit receptacles, the amount of FaCXE2 transcript was found very low during the fruit
elongation and developmental stages (G1 and G3), higher during the ripening stages (W and R),
and maximal in the overripe and senescence stage (OR, SN) (Fig 4). FaCXE2 gene was strongly
expressed in the fruit achenes. In addition, FaCXE2 is a fruit related gene as minimal expression
has been found on all vegetative tissues studied. In all such tissues, FaCXE2 expression was very
low and similar to that observed in receptacles at the G1-stage (Fig 4).

CHAPTER 4
335 PhD Thesis Félix Juan Martínez Rivas
Fig 4. Developmental expression of the strawberry FaCXE2 in fruit receptacle (A), achenes (B) and
vegetative tissues (C) of F. × ananassa cv. Camarosa. QRT-PCR results were obtained using specific
primers for FaCXE2 gene. Quantification is based on Ct values, as described in Materials and Methods.
The increase in the mRNA value was relative to the receptacle G1-Ct value in all experiments, which was
assigned an arbitrary value equal to unity. Mean values ± SD of five independent experiments are shown.
G1: small-sized green fruit; G3: full-sized green fruit (both stages of development); W: white stage; R: red
stage; OR: overripe stage; SN: senescent stage; Ac G1: achenes in G1 stage; Ac G3: achenes in G3 stage;
Ac W: achenes in W stage; Ac R: achenes in R stage. Statistical significance with respect to the reference
sample was determined by the Student´s t-test. (*) p-value < 0.1 (**) p-value < 0.01 and (***) p-value <
0.001.
FaCXE2 gene expression is hormonally regulated by auxins and ABA
It has been proposed that the ABA/auxin ratio in receptacles could be a signal that triggers
the strawberry fruit ripening process (Perkins-Veazie, 1995). Auxins are mainly produced by the
achenes and released afterwards to the receptacles, fostering receptacle to growth and
development while preventing premature ripening. To analyze the in vivo effects of auxins, we
performed a comparative gene expression analysis between control and de-achened green fruits
at the G3-stage that were externally treated with or without the auxin NAA. A clear increase in

CHAPTER 4
336 Functional characterization of molecular regulatory mechanisms controlling the ripening in strawberry fruit
FaCXE2 amount transcripts was detected in de-achened G3-fruits (Fig 5). However, this increase
in gene expression was prevented when the deachened fruits were treated with a lanonin paste
containing NAA. These results clearly indicated that the expression of this gene is negatively
regulated by auxins.
Fig. 5. Analysis of the effects of removing achenes from G3 developing fruits and their treatment with
auxins on FaCXE2 gene expression by qRT-PCR. After auxin treatment, the increase in mRNA value was
relative to G3 fruit (control), which was assigned an arbitrary value equal to unity. G3-Control: middle-
sized green fruit receptacle; G3-Achenes: G3 fruit receptacle without achenes for 5 days; G3-
Achenes+NAA: G3 fruit receptacle without achenes plus NAA for 5 days (added at day zero). Statistical
significance with respect to the control sample (G3 fruits) was determined by the Student´s t-test. (**) p-
value < 0.01 (***) p-value ˂ 0.001.
To assess the role played by ABA in the regulation of FaCXE2 expression, this work
modulated ABA content (up and down) through three experimental approaches: i) depleting plants
of water, as water stress is known to increase ABA content in the plants (Fig. 6A); ii) transiently
silencing the expression of FaNCED1 coding 9-cis-epoxycarotenoid dioxygenase, the key
enzyme responsible for ABA biosynthesis (Fig. 6B); and iii) adding NDGA, a well-known
inhibitor of 9-cis-epoxycarotenoid dioxygenase activity (Fig. 6C). All of these experiments were
accompanied by the measurement of ABA content in fruit receptacles and the FaNCED1 gene
relative expression as marker of the biosynthesis of ABA. An early appearance as well as a
substantial increase of fruit red colouration appear in fruits subjected to water stress. In contrast,
a lack of red colouration was observed in fruits that were either agroinfiltrated with FaNCED1-
RNAi constructs or treated with the inhibitor NDGA. Substantial changes in ABA content (either
increase or decrease) in receptacles occurred under the three different experimental procedures
described above. In all of these cases, FaCXE2 expression always correlated with that of ABA
content and the expression of FaNCED1 was always parallel. These results strongly suggest that
ABA presence in the receptacles can positively regulate the expression of FaCXE2.

CHAPTER 4
337 PhD Thesis Félix Juan Martínez Rivas
Fig. 6. Analysis by qRT-PCR of FaCXE2 and FaNCED1 gene expression in (A) strawberry G-W fruits
under water stress. (B) strawberry G-W fruits agroinfiltrated with the NCED1-RNAi construct and (C) G-
W fruits treated with NDGA. In each experimental situation, the dashed line indicates the ABA content in
the fruits analyzed. (A) Control fruit: fruits with their pedicels immersed in MS medium with sucrose.
FaCXE2 and FaNCED1 gene expression was analyzed in fruits with their pedicels kept in the air. Both
samples were harvested 4 days after the beginning of treatment. (B) Control fruit: strawberry fruits
infiltrated with empty pFRN vector; NCED1-RNAi fruits: transgenic strawberry fruits agroinfiltrated with
the FaNCED1-pFRN construct. (C) Control fruit: G-W fruit injected with H2O; Fruit + NDGA: G-W fruits
injected with NDGA (100 µM); both samples were harvested 8 days after the beginning of treatment. The
cultivar used in both experiments was Fragaria × ananassa cv. Elsanta. Statistical significance with respect
to reference sample was determined by the Student's t-test in all experiments. (***) p-value ˂ 0.001.
Taken together, these results indicate that, as in the case of other strawberry ripening-
related genes, the expression of FaCXE2 gene is clearly regulated by both ABA and auxin content
of the fruit receptacle, supporting the proposal of (Perkins-Veazie, 1995) and the findings
described by (Chai et al., 2011; Jia et al., 2011; Medina-Puche et al., 2014)
Subcellular location of FaCXE2 protein
One of the main applications of the transient gene assay tools is to monitor the localization
of proteins to subcellular compartments in living cells. To determine the subcellular localization
pattern, amino acid sequence analysis of FaCXE2 protein suggested one putative transmembrane
region located. Moreover, the common carboxyl-terminal sequence KDEL, is an essential
structural motif for retention of the protein in the luminal site of endoplasmic reticulum through
0
20
40
60
80
100
120
0
200
400
600
800
1000
1200
CONTROL FRUITS + WATER STRESS
AB
A C
ON
TE
NT
(mm
ol*
gr-1
)R
EL
AT
IVE
EX
PR
ES
SIO
N V
AL
UE
S
FaCXE2 FaNCED1 ABA CONTENT
0
10
20
30
40
50
60
70
80
90
100
0
20
40
60
80
100
120
CONTROL FRUI TS NCED1-RNAiFRUITS
RE
LA
TIV
E E
XP
RE
SS
ION
VA
LU
ES
0
10
20
30
40
50
60
70
80
90
100
0
20
40
60
80
100
120
CONTROL FRUI TS FRUITS + NDGA
AB
A C
ON
TE
NT
(mm
ol*
gr-1
)
A
B C
** *
***
******* **
** *
** *
***
***
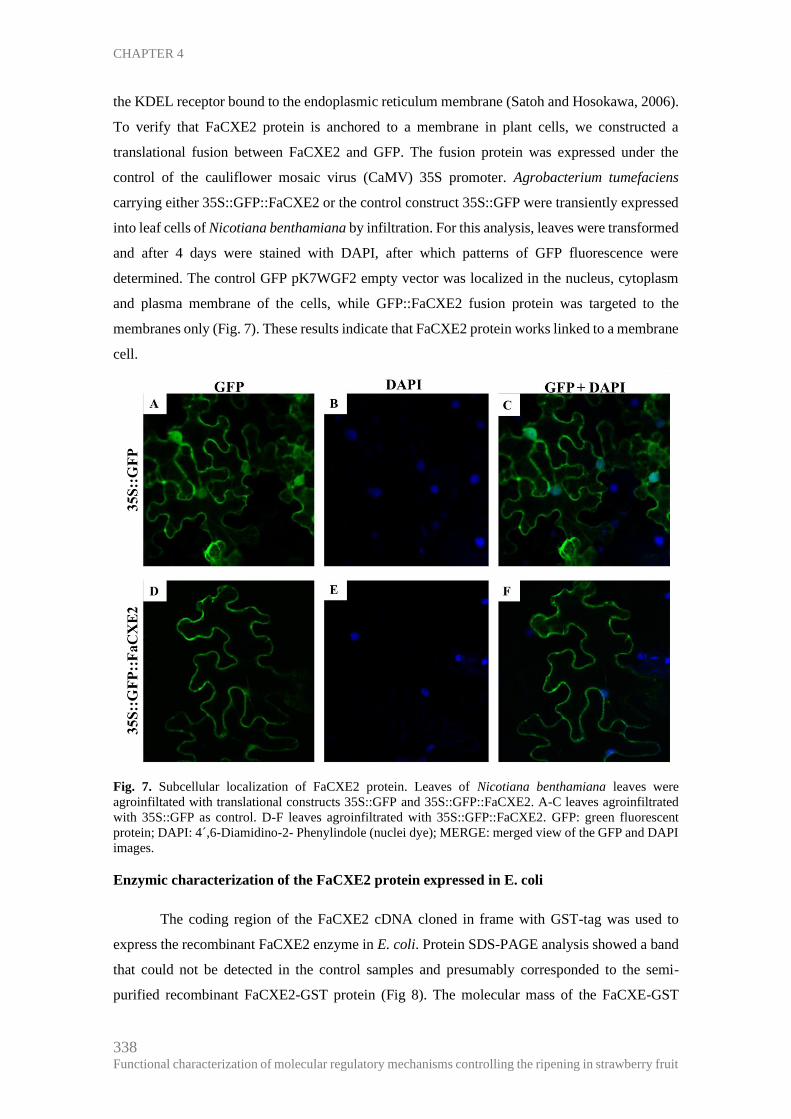
CHAPTER 4
338 Functional characterization of molecular regulatory mechanisms controlling the ripening in strawberry fruit
the KDEL receptor bound to the endoplasmic reticulum membrane (Satoh and Hosokawa, 2006).
To verify that FaCXE2 protein is anchored to a membrane in plant cells, we constructed a
translational fusion between FaCXE2 and GFP. The fusion protein was expressed under the
control of the cauliflower mosaic virus (CaMV) 35S promoter. Agrobacterium tumefaciens
carrying either 35S::GFP::FaCXE2 or the control construct 35S::GFP were transiently expressed
into leaf cells of Nicotiana benthamiana by infiltration. For this analysis, leaves were transformed
and after 4 days were stained with DAPI, after which patterns of GFP fluorescence were
determined. The control GFP pK7WGF2 empty vector was localized in the nucleus, cytoplasm
and plasma membrane of the cells, while GFP::FaCXE2 fusion protein was targeted to the
membranes only (Fig. 7). These results indicate that FaCXE2 protein works linked to a membrane
cell.
Fig. 7. Subcellular localization of FaCXE2 protein. Leaves of Nicotiana benthamiana leaves were
agroinfiltated with translational constructs 35S::GFP and 35S::GFP::FaCXE2. A-C leaves agroinfiltrated
with 35S::GFP as control. D-F leaves agroinfiltrated with 35S::GFP::FaCXE2. GFP: green fluorescent
protein; DAPI: 4´,6-Diamidino-2- Phenylindole (nuclei dye); MERGE: merged view of the GFP and DAPI
images.
Enzymic characterization of the FaCXE2 protein expressed in E. coli
The coding region of the FaCXE2 cDNA cloned in frame with GST-tag was used to
express the recombinant FaCXE2 enzyme in E. coli. Protein SDS-PAGE analysis showed a band
that could not be detected in the control samples and presumably corresponded to the semi-
purified recombinant FaCXE2-GST protein (Fig 8). The molecular mass of the FaCXE-GST
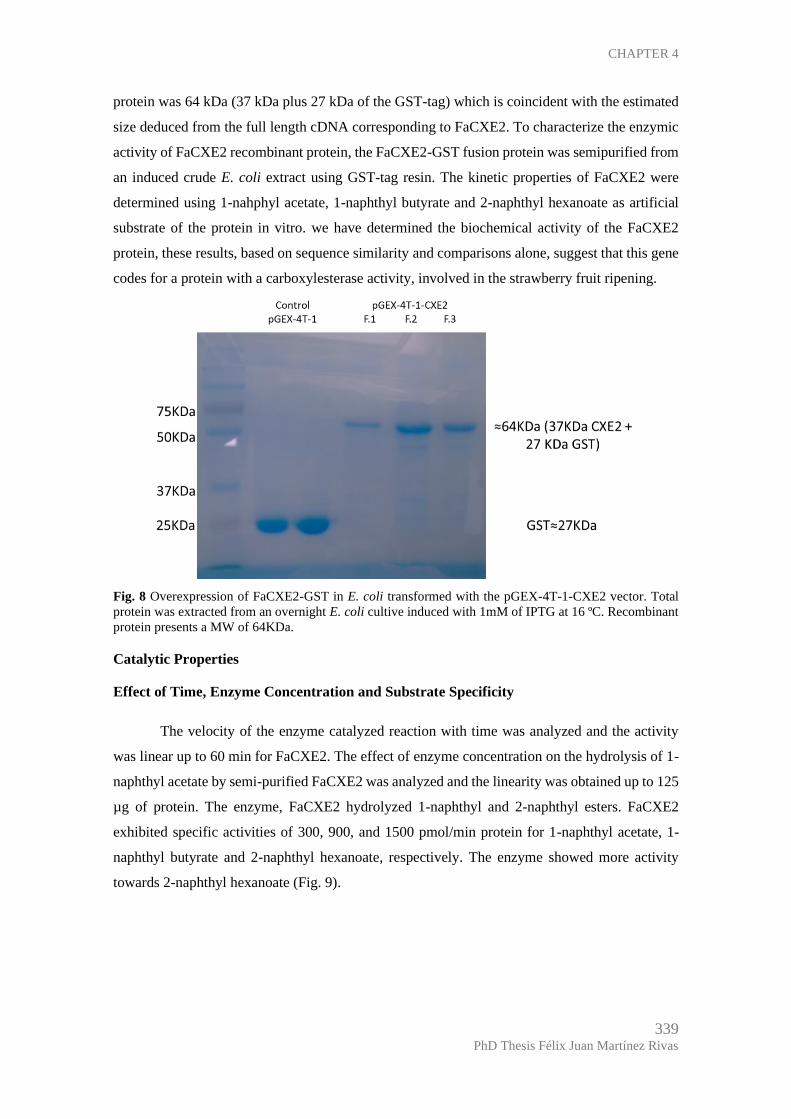
CHAPTER 4
339 PhD Thesis Félix Juan Martínez Rivas
protein was 64 kDa (37 kDa plus 27 kDa of the GST-tag) which is coincident with the estimated
size deduced from the full length cDNA corresponding to FaCXE2. To characterize the enzymic
activity of FaCXE2 recombinant protein, the FaCXE2-GST fusion protein was semipurified from
an induced crude E. coli extract using GST-tag resin. The kinetic properties of FaCXE2 were
determined using 1-nahphyl acetate, 1-naphthyl butyrate and 2-naphthyl hexanoate as artificial
substrate of the protein in vitro. we have determined the biochemical activity of the FaCXE2
protein, these results, based on sequence similarity and comparisons alone, suggest that this gene
codes for a protein with a carboxylesterase activity, involved in the strawberry fruit ripening.
Fig. 8 Overexpression of FaCXE2-GST in E. coli transformed with the pGEX-4T-1-CXE2 vector. Total
protein was extracted from an overnight E. coli cultive induced with 1mM of IPTG at 16 ºC. Recombinant
protein presents a MW of 64KDa.
Catalytic Properties
Effect of Time, Enzyme Concentration and Substrate Specificity
The velocity of the enzyme catalyzed reaction with time was analyzed and the activity
was linear up to 60 min for FaCXE2. The effect of enzyme concentration on the hydrolysis of 1-
naphthyl acetate by semi-purified FaCXE2 was analyzed and the linearity was obtained up to 125
µg of protein. The enzyme, FaCXE2 hydrolyzed 1-naphthyl and 2-naphthyl esters. FaCXE2
exhibited specific activities of 300, 900, and 1500 pmol/min protein for 1-naphthyl acetate, 1-
naphthyl butyrate and 2-naphthyl hexanoate, respectively. The enzyme showed more activity
towards 2-naphthyl hexanoate (Fig. 9).

CHAPTER 4
340 Functional characterization of molecular regulatory mechanisms controlling the ripening in strawberry fruit
Fig 9. Effect of time and substrate specificity of strawberry recombinant protein, FaCXE2. 0.3 mM
substrate solution, 0.05 M sodium phosphate buffer, pH 7.0, 27 °C of temperature. Controls were prepared
using GST protein to determine the non-enzymatic hydrolysis of the substrate. 1-naphthol formed was
determined colorimetrically. Error bars represent the standard error of the mean calculated from a minimum
of three replicates over three experiments
Influence of pH and Temperature on the Activity of Purified Esterase
To assess the optime pH and temperature for the FaCXE2 enzyme, we tested several
conditions. We found that an optimum pH between 7 to 7.5 was observed for FaCXE2 protein
(Fig 10A). Meanwhile a ranging temperature between 25 to 30°C was the optimal for this enzyme.
These two characteristics are the physiological condition of a strawberry fruit. (Fig. 10B).
Fig 10. Temperature and pH activity profiles for strawberry FaCXE2. (A) Activity of strawberry
recombinant protein, FaCXE2, at different temperatures, 0.3 mM substrate solution, 0.05 M sodium
phosphate buffer, pH 7.0. (B) Activity of strawberry recombinant protein, FaCXE2, at different pH, 0.3
mM substrate solution, 27 °C of temperature. Controls were prepared using GST protein to determine the
non-enzymatic hydrolysis of the substrate. 1-naphthol formed was determined colorimetrically. Error bars
represent the standard error of the mean calculated from a minimum of three replicates over three
experiments.

CHAPTER 4
341 PhD Thesis Félix Juan Martínez Rivas
Km and Vmax
The Km and Vmax values were determined using the program Graphpad Prism 6. The
Km of FaCXE2 for 1-naphthyl acetate, 1-naphthyl butyrate and 2-naphthyl hexanoate were 0.68,
1.58, and 0.57 µM respectively. The Vmax of FaCXE2 were 14.43, 59.44 and 130.0 pmol/min/µg
respectively (Table 2).
Table 2. Kinetic parameters of semi-purified recombinant FaCXE2 for different naphthil ester hydrolysis.
Standard errors represent the standard error of the mean calculated from a minimum of three replicates.
Transient silencing of FaCXE2 alters volatile content
The expression of FaCXE2 was transiently downregulated by agroinfiltration in fruits by
RNAi, using the construction pFRN-FaCXE2. Control fruits were agroinfiltrated with the pFRN
empty vector. The degree of FaCXE2 expression was analyzed in the transgenic fruits versus the
control (Fig 10). For comparative analysis, three pools of silenced fruits (three fruits per pool)
and one pool of control fruits were used.
Fig 10. Analysis by qRT-PCR of FaCXE2 gene expression in transgenic FaCXE2-RNAi strawberry fruits
(F. × ananassa cv. Elsanta) agroinfiltred with the empty pFRN vector (control) and pFRN-FaCXE2
construct. Statistical significance with respect to reference sample was determined by the Student's t-test in
all experiments. (*) p-value ˂ 0.01.

CHAPTER 4
342 Functional characterization of molecular regulatory mechanisms controlling the ripening in strawberry fruit
Knock-down of FaCXE2 in strawberry fruits was used to further validate the in-vivo
function of this enzyme. After transient silencing, volatile content was determined in the
agroinfiltred fruits. A principal component analysis (PCA) shows a clear difference between the
controls and the silenced fruits (Fig 12), showing a clear implication of FaCXE2 in the volatile
production in strawberry fruits.
Fig 12. Principal component analysis of metabolites identified in receptacles of control (cyan dots) vs
transgenics lines (green, blue, and red dots). Three replicates were used in metabolomic analysis for each
condition
The analysis of individual esters identified that, in transgenic fruits, the concentration of
different esters as methyl and ethyl hexanoate, ethyl acetate, butyl butanoate, methyl octanoate
and methyl butanoate were significantly less concentrated rather than in control fruits.
Furthermore, the concentration of compound containing alcohol groups, as linanool and 3-
hexanol were less concentrated in the transgenics fruits than in the control (Fig 13). Other key
compounds of strawberry volatilome, as γ-decalactone, ethanol and hexanoic acid, among did not
present significative changes between the transgenic fruits and control ones. As seen on Fig 13,
the content of esters is inversely correlated with those of alcohol contaning groups as nerodilool,
linanool and benzylalcohol.

CHAPTER 4
343 PhD Thesis Félix Juan Martínez Rivas
Fig 13. A) Relative concentration of diverse esters and alcohol compounds in trsngenics (P1, P2, P3) and
control (WT) receptacles. B) Correlation of volatile compounds identified in transgenics versus control
receptacles.

CHAPTER 4
344 Functional characterization of molecular regulatory mechanisms controlling the ripening in strawberry fruit
Discussion
Carboxylesterases (CXE) comprise a large family of hydrolytic enzymes in plants that
are members of the α/β hydrolase fold superfamily of proteins (Marshall et al., 2003). In
strawberry, our comparative transcriptomic analysis between immature (green) and ripen (red)
revealed several genes encoding putatively carboxylesterases whose expression was strongly up-
regulated in ripen fruits, suggesting the possibility that these genes may play an important role in
strawberry in fruit softening and ripening (Medina-Puche et al., 2016). Volatile esters are key
compounds that not only determine consumer preferences but are also associated with enhanced
defense against biotic stresses (Ko et al., 2016).
Bioinformatics analyses have shown that the deduced protein of the FaCXE2 gene
contains well-conserved functional domains, such as α/β hydrolase fold domain and a GDXG
lipolytic domain. This sequence also presents a putative conserved transmembrane region. These
data provided us with evidence that the protein coded by the FaCXE2 gene may has
carboxylesterase activity, that it works linked to the membrane of the cells and that it might be
located in the fruit receptacle cell wall. The enzymatic activity assays have been performed in
order to assign a carboxlesterase role to this protein.
The phylogenetic relationships among plant carboxylesterases are essentially in
agreement with the reported classification (Marshall et al., 2003), which identified up to eight
clades. HIDs are located in a small group of proteins from leguminous plants in clade III. FaCXE2
is included in this same clade. HIDM and HIDH display different substrate specificities to 2-
hydroxyisoflavanones. The substrate preferences reflect the structures of isoflavonoids contained
in each plant species. The spontaneous dehydration of the substrates was slow compared to the
enzyme-catalyzed reaction, suggesting that dehydration of 2-hydroxyisoflavanones to form
isoflavones in plant cells is primarily enzyme dependent (Akashi et al., 2005).
Two HIDH enzymes from legumes, Glycine max and Glycyrrhiza echinate, have been
identified and cloned, sharing 30% to 40% amino acid identity with some AtCXES (Akashi et al.,
2005) As well as classical carboxylesterase activity, as these enzymes are able to hydrolyzes pNP
butyrate, HIDH and HIDM possess 2-hydroxyisoflavanone dehydratase activities, which converts
2-hydroxyisoflavanones to isoflavones (Akashi et al., 2005). HIDM has high specificity towards
2,7-dihydroxy-4'-methoxyisoflavanone to produce formononetin, while HIDH has high specific
activity towards 2,5,7,4'-tetrahydroxyisoflavanone to produce genistein. lsoflavonoids in plants
have roles associated with environmental adaptation, including acting as plant defense
compounds. Interestingly, the catalytic triad nucleophile for the HlDs is a threonine rather than

CHAPTER 4
345 PhD Thesis Félix Juan Martínez Rivas
the serine identified in all other members of the plant CXE carboxylesterase family (Akashi et al.,
2005; Marshall et al., 2003). Even though FaCXE is located in the clade III with HIDH enzymes,
it presents a serine in the catalytic triad, instead of the threonine presented by HIDH. This
difference confers the ability to bind acids instead.
FaCXE2 is a receptacle specific gene and hormones regulate its expression
The FaCXE2 gene displayed an expression pattern clearly related to ripening. This gene
was predominantly expressed in fruit receptacle and achenes, and it was weakly or not expressed
in any of the analyzed vegetative tissues. This expression pattern is coincident with those reported
previously for other strawberry ripening-related genes, many of them related with the organoleptic
properties of the strawberry fruit (Cumplido-Laso et al., 2012; Molina-Hidalgo et al., 2017;
Medina-Puche et al., 2014; Medina-Puche et al., 2015; Raab et al., 2006; Blanco-Portales et al.,
2004).
As a non-climateric fruit, strawberry ripening process did not overcome with a peak of
ethylene production. Instead, it has been purposed that the ratio ABA/Auxins is the responsible
to trigger this process. (Perkins-Veazie, 1995; Chai et al., 2011; Jia et al., 2011; Medina-Puche et
al., 2016). From one side, auxins produced by the achenes are released into the strawberry
receptacle and are responsible for the main changes occurring in early fruit development. Once
fruits reach the white stage, a decline in auxin production occurs, and this trigger the ripening
process (Perkins-Veazie, 1995). Several studies have shown that the expression of many ripening
related strawberry genes (Cumplido-Laso et al., 2012; Molina-Hidalgo et al., 2017; Molina-
Hidalgo et al., 2013; Medina-Puche et al., 2014; Medina-Puche et al., 2015) were prematurely
induced upon removal of the achenes. FaCXE2 was also prematurely induced in receptacles when
achenes were removed in early stages of fruit development. However, this induction was reverted
when auxin NAA was applied to these de-achened fruits, which indicates that this gene was also
regulated by auxins (Fig 5).
On the other side, ABA levels gradually increase concurrently with the ripening process
in strawberry fruit (Chai et al., 2011; Symons et al., 2012; Jia et al., 2011). To determine the role
of ABA on FaCXE2 expression, we carried out three experiment that modulate ABA quantity on
fruits. Two of them are directly related with its biosynthetic pathway, either inhibiting NCED
activity or silencing it by RNAi. (Creelman et al., 1992) Both experiments result in a decrease of
ABA levels, as well as FaNCED1 and FaCXE2 expression levels (Fig 6). Water stress experiment
produces an increase in ABA levels and on FaNCED1 and FaCXE2. Taken together, these results
indicate a clear impact of hormone levels on FaCXE2 expression, which is negatively regulated

CHAPTER 4
346 Functional characterization of molecular regulatory mechanisms controlling the ripening in strawberry fruit
by auxins and positivity regulated by ABA. This expression patterns are the same as presented by
other genes related to organoleptic properties of strawberry (Cumplido-Laso et al., 2012; Aharoni
et al., 2000; Medina-Puche et al., 2015; Molina-Hidalgo et al., 2017).
Subcellular localization
Our experiments aimed to determine the subcellular localization of FaCXE2 were made
with GFP fusion protein. FaCXE2 was targeted in the cellular membrane or cell wall. This is
coherent with the predicted localization obtained in different predictor servers, and with the
presence of the KDEL motif in the sequence, that indicates is possible situation in a membrane
cell. It is described that Prunus PpCXE1 is also localizated at the cytosol (Cao, Xie, et al., 2019).
This localization is similar to that of other Alcohol acyltransferases, suggesting that this
colocalization of biosynthetic and hydrolytic enzymes might create a cycle between esters and
alcohols modulating the volatile composition (Bontpart et al., 2015; Goulet et al., 2015).
Previously, Flavonol synthase 1, chalcone synthase and chalcone isomerase were
localized in Arabidopsis nuclei. A flavonoid- 3´-hydroxylase was localized in the tonoplast in the
hilum region of the soybean immature seed coat (Falcone Ferreyra et al., 2012). In grape, PAL
was primarily present in the cell walls, secondarily thickened walls, and the parenchyma cells of
berry mesocarp cells, while C4H was distributed in the chloroplast (plastid) and nucleus and 4CL
mainly in the secondarily thickened walls and parenchyma cells of the mesocarp vascular tissue,
suggesting that the distributions of PAL, C4H, and 4CL were compartmental (Chen et al., 2006).
However, because little was known about the subcellular localization and the relationship with
the molecular mechanisms of these enzymes and their action in fruits. It is still difficult to propose
the physiological significance of the subcellular distribution.
Recombinant FaCXE2
The production of recombinant FaCXE2 in bacteria and its semi-purification has allowed
the characterization of its carboxylesterase activity. The optimal pH for its activity was 7.5.
Carboxylesterases from other organisms generally show a pH optimum between pH 7.0 and 9.0
(Kim and Lee, 2004; Souleyre et al., 2011; Cao, Xie, et al., 2019) This neutral to basic optimal
pH range is consistent with the hydrolytic mechanism for carboxylesterases, where the catalytic
triad requires a deprotonated histidine (pKa = 6.0) to activate the active site serine (Matthews et
al., 2013). On the other hand, FaCXE2 present an optimal temperature between 25-30°C, which
is consistent with the physiological temperature of strawberry crops. FaCXE2 showed most
affinity towards the longer chain naphthyl esters and among these, the preferred substrate was 2-
naphthyl hexanoate. This activity may be important for the hydrolysis of chain fatty acid esters

CHAPTER 4
347 PhD Thesis Félix Juan Martínez Rivas
during ripening. Those catalytic properties are similar to the ones present by others
carboxylesterases on apple (Souleyre et al., 2011) and peach (Cao, Xie, et al., 2019).
FaCXE2 has a role on volatile production in strawberry
We have investigated a role for CXEs of strawberry in the hydrolysis of esters that make
up an important component of the flavour volatiles produced by ripening strawberry fruit. Two
of the CXEs from strawberry were identified previously as expressed in strawberry fruit, with
increasing gene expression during the ripening. Both FaCXE1 and FaCXE2 are expressed in
strawberry fruit, but only FaCXE2 shows an expression profile similar to ripening-related genes
and is controlled by ABA and auxin.
Recently, two fruit related carboxylesterases are been characterized. Malus MdCXE1 and
Prunus PpCXE1. Both are ripening-related and their expression patterns are modulated by the
action of hormones, presenting a similar pattern as strawberry FaCXE2 (Cao, Xie, et al., 2019;
Souleyre et al., 2011). Overexpression of PpCXE1 both transiently in peach and stable in tomato
decreased the content of volatile esters, indicating that is a regulator of volatile content (Cao, Xie,
et al., 2019). The in-vitro activity of the recombinant FaCXE2 protein suggest that it could play
a role in volatile production during ripening process. Transient downregulation of strawberry
FaCXE2 shows clear differences in the volatile content between the transgenics receptacles and
the controls. A higher accumulation of esters compounds in transgenics fruits, were found, and
alcohol compounds were less concentrated, revealing that FaCXE2 plays a vital role in their
degradation. Moreover, other volatile compounds did not present any differences, showing that
FaCXE2 activity is very specific and restricted to some esters.
The in vitro activity of FaCXE2 in hydrolyzing esters, together with the increase of esters
in vivo caused by the knock-down of FaCXE2, indicates that this CXE is a regulator of volatile
ester content in strawberry. FaCXE2 would contribute to the production of these increased
alcohols through the hydrolysis of increasingly abundant esters during ripening. This hypothesis
remains to be tested directly through the use of natural substrates of strawberry that could be the
potential target of this enzyme.
Conclusions
The carboxylesterases represent a large, diverse and complex group of enzyme molecules
with overlapping substrate specificities and very little is known about their natural substrates.
Strawberry fruit express at least two members of the CXE family (FaCXE1 and FaCXE2). The
expression of FaCXE2 increases substantially upon fruit ripening and it is hormonally regulated

CHAPTER 4
348 Functional characterization of molecular regulatory mechanisms controlling the ripening in strawberry fruit
positively by ABA and negatively by auxins. Furthermore, the FaCXE2 enzyme is able to
hydrolyse artificial ester substrates that are similar to those produced by ripe strawberry fruit.
Together these results suggest that FaCXE2 has a role in ester metabolism in ripe fruit, modifying
the ester profile produced by strawberries.
Materials and methods
Plant material
Strawberry plants (F. × ananassa Duch. cv. Camarosa, an octoploid cultivar) were grown
under field conditions at Huelva, SW Spain. Different developmental and ripening stages were
harvested: small-sized green fruit (green 1; 2-3 g), full-sized green fruit (green 3; 4-7 g), white
fruit (5-8 g), full-ripe red fruit (6-10 g) and overripe fruit (6-10 g). Overripe fruits were softer and
dark redder than red ones. Vegetative tissues, such as expanding leaves, crowns, roots, runners,
flowers and petals were also harvested. All analysed tissues were immediately frozen in liquid
nitrogen after harvesting and stored at -80 oC until use. Nicotiana benthamiana and F. × ananassa
plants used for agroinfiltration were grown in a plant chamber at 25 ºC, 10000 lux, 80 % humidity
and with a photoperiod of 16 hours light and 8 hours dark.
Hormone related experiments
For auxins related experiment, two sets of 50 full-sized green fruits (Green 3) each were
used, still attached to the plant. Achenes were carefully removed from their receptacles, in
accordance with (Medina-Puche et al., 2014). One set was treated with indole-3-acetic acid (IAA)
in lanolin paste (1 mL) containing 1 mM of auxin IAA in 1 % (w/v) dimethyl sulphoxide. The
other set, the control group, was treated with the same paste, but without IAA. The auxin
treatment, collection and analysis of samples were performed following the instructions by
(Medina-Puche et al., 2014)
On the other hand, ABA related experiment were performed both up and downregulating
it concentration. To downregulate ABA levels, two approximations were used, in the first one,
nordihydroguaiaretic acid (NDGA) treatment was applied, as is an ideal inhibitor of the 9-cis-
epoxycarotenoid dioxygenase (NCED1) enzyme, which is a crucial step on ABA biosynthesis,
and was used to block ABA biosynthesis (Creelman et al., 1992). Strawberry fruits (Fragaria ×
ananassa cv. Elsanta) were used at mature G stages for this study. The other approach was
silencing FaNCED1 expression by RNAi. These approaches has been demonstrated to decrease
ABA levels on ripen fruits. (Li et al., 2015; Medina-Puche et al., 2014) The treatments were
performed in accordance with (Medina-Puche et al., 2014). The treated fruits were used for ABA
content measurement and relative expression of FaNCED1, FaCXE1 and FaCXE2 gene.

CHAPTER 4
349 PhD Thesis Félix Juan Martínez Rivas
To up regulate ABA content, fruits at the G3-W stages from F. × ananassa cv. Elsanta
were harvested along with their pedicels. Water stressed fruits were kept with pedicel on air whilst
control fruits maintained pedicels immersed in MS medium with sucrose (renewed every two
days). The conditions of stress treatment and the samples analysis were performed following the
instructions by (Medina-Puche et al., 2014).
Preparation of deuterated abscisic acid, ABA extraction procedure and HPLC-MS
conditions
Deuterated abscisic acid (dABA) was used as an internal standard. Both the dABA
preparation and ABA extraction from strawberry samples were performed following the
instructions by (Medina-Puche et al., 2014). In order to determine the ABA amount in strawberry
fruits, we used an HPLC-MS system (VARIAN 1200L Triple Quadrupole) with a column (150 x
2.1 mm i.d. Phenomenex C18 with 3 µm particle) (California, USA). The conditions and procedure
used for the analysis were the same as described by (Medina-Puche et al., 2014)
RNA isolation
Achenes were always removed from frozen fruit surface and only receptacle RNA was
extracted and purified. Total RNA was isolated from independent pools of strawberry receptacles
at different growth and ripening stages and from vegetative tissues, in accordance with (Asif et
al., 2000). The total RNA obtained was treated with DNase I (RNase free) (Invitrogen), according
to manufacturer's instructions, to remove genomic DNA contamination, after which it was
purified by using the RNeasy Mini kit (Qiagen). RNA samples were considered DNA-free when
no amplicons corresponding to the analysed genes were observed using RNA as template in a
standard PCR reaction.
Expression analysis by quantitative real time PCR (qRT-PCR)
Gene expression analysis of all genes herein studied were performed by quantitative real
time PCR (qRT-PCR) using the iCycler (BioRad) system, as previously described (Benítez-
Burraco et al., 2003). First strand cDNA was obtained using 2 µg of total RNA and the iScript
kit (BioRad), in accordance with the manufacturer’s instructions. Each reaction was performed,
at least, in triplicate, and the corresponding Ct values were normalized using the Ct value
corresponding to an interspacer 26S-18S strawberry RNA gene (housekeeping gene), selected as
control gene owing to its constitutive expression throughout all of the different tested
experimental conditions (Amil-Ruiz et al., 2013). All of these values were subsequently used to
determine the relative increase or decrease in gene expression in the all samples in comparison to
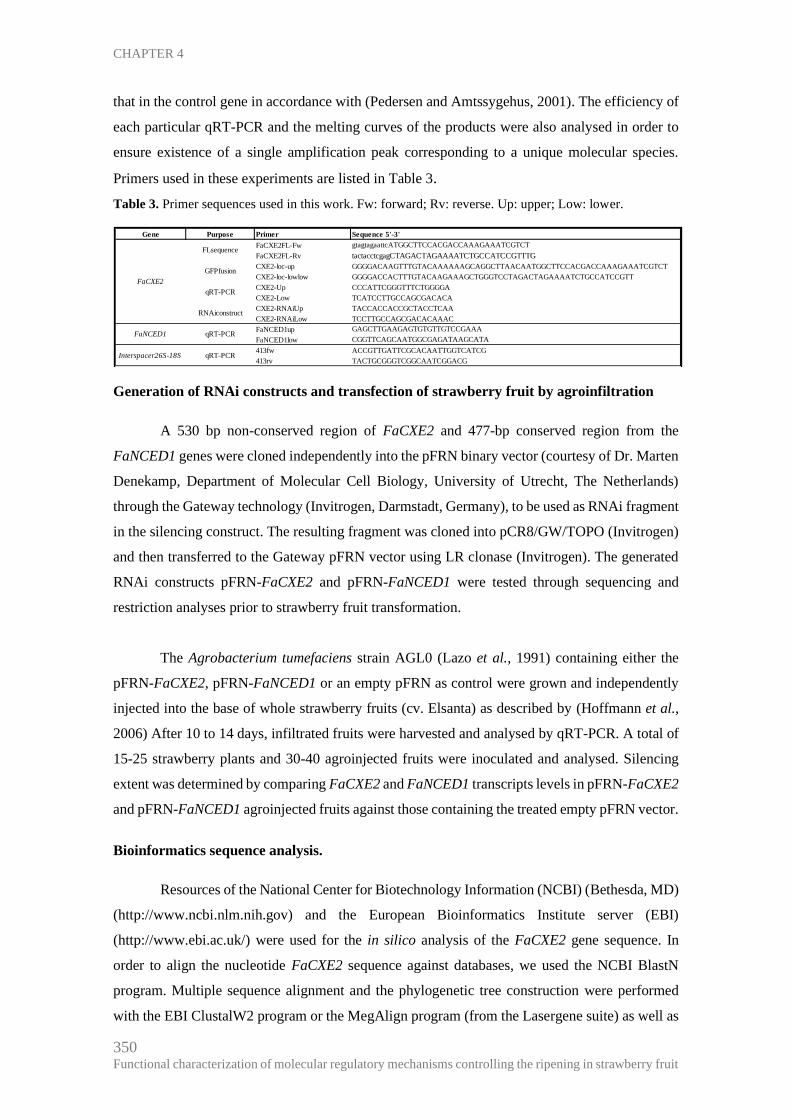
CHAPTER 4
350 Functional characterization of molecular regulatory mechanisms controlling the ripening in strawberry fruit
that in the control gene in accordance with (Pedersen and Amtssygehus, 2001). The efficiency of
each particular qRT-PCR and the melting curves of the products were also analysed in order to
ensure existence of a single amplification peak corresponding to a unique molecular species.
Primers used in these experiments are listed in Table 3.
Table 3. Primer sequences used in this work. Fw: forward; Rv: reverse. Up: upper; Low: lower.
Generation of RNAi constructs and transfection of strawberry fruit by agroinfiltration
A 530 bp non-conserved region of FaCXE2 and 477-bp conserved region from the
FaNCED1 genes were cloned independently into the pFRN binary vector (courtesy of Dr. Marten
Denekamp, Department of Molecular Cell Biology, University of Utrecht, The Netherlands)
through the Gateway technology (Invitrogen, Darmstadt, Germany), to be used as RNAi fragment
in the silencing construct. The resulting fragment was cloned into pCR8/GW/TOPO (Invitrogen)
and then transferred to the Gateway pFRN vector using LR clonase (Invitrogen). The generated
RNAi constructs pFRN-FaCXE2 and pFRN-FaNCED1 were tested through sequencing and
restriction analyses prior to strawberry fruit transformation.
The Agrobacterium tumefaciens strain AGL0 (Lazo et al., 1991) containing either the
pFRN-FaCXE2, pFRN-FaNCED1 or an empty pFRN as control were grown and independently
injected into the base of whole strawberry fruits (cv. Elsanta) as described by (Hoffmann et al.,
2006) After 10 to 14 days, infiltrated fruits were harvested and analysed by qRT-PCR. A total of
15-25 strawberry plants and 30-40 agroinjected fruits were inoculated and analysed. Silencing
extent was determined by comparing FaCXE2 and FaNCED1 transcripts levels in pFRN-FaCXE2
and pFRN-FaNCED1 agroinjected fruits against those containing the treated empty pFRN vector.
Bioinformatics sequence analysis.
Resources of the National Center for Biotechnology Information (NCBI) (Bethesda, MD)
(http://www.ncbi.nlm.nih.gov) and the European Bioinformatics Institute server (EBI)
(http://www.ebi.ac.uk/) were used for the in silico analysis of the FaCXE2 gene sequence. In
order to align the nucleotide FaCXE2 sequence against databases, we used the NCBI BlastN
program. Multiple sequence alignment and the phylogenetic tree construction were performed
with the EBI ClustalW2 program or the MegAlign program (from the Lasergene suite) as well as
Gene Purpose Primer Sequence 5'-3'
FaCXE2FL-Fw gtagtagaattcATGGCTTCCACGACCAAAGAAATCGTCT
FaCXE2FL-Rv tactacctcgagCTAGACTAGAAAATCTGCCATCCGTTTG
CXE2-loc-up GGGGACAAGTTTGTACAAAAAAGCAGGCTTAACAATGGCTTCCACGACCAAAGAAATCGTCT
CXE2-loc-lowlow GGGGACCACTTTGTACAAGAAAGCTGGGTCCTAGACTAGAAAATCTGCCATCCGTT
CXE2-Up CCCATTCGGGTTTCTGGGGA
CXE2-Low TCATCCTTGCCAGCGACACA
CXE2-RNAiUp TACCACCACCGCTACCTCAA
CXE2-RNAiLow TCCTTGCCAGCGACACAAAC
FaNCED1up GAGCTTGAAGAGTGTGTTGTCCGAAA
FaNCED1low CGGTTCAGCAATGGCGAGATAAGCATA
413fw ACCGTTGATTCGCACAATTGGTCATCG
413rv TACTGCGGGTCGGCAATCGGACG
FaNCED1 qRT-PCR
Interspacer26S-18S qRT-PCR
FaCXE2
RNAiconstruct
FLsequence
qRT-PCR
GFPfusion

CHAPTER 4
351 PhD Thesis Félix Juan Martínez Rivas
the FigTree program (http://tree.bio.ed.ac.uk/software/figtree/), respectively, using a bootstrap
analysis with 1000 replicates. Prediction of domains and functional sites was performed with the
InterPro database (version 76). The MEME program was used to identify conserved motifs and
to validate the phylogenetic trees results. Default parameters were used with the following
exception: the maximum numbers of motives to find was set to 20 and the minimum width was
set to 8 amino-acid residues (Bailey et al., 2009) (http://meme.nbcr.net/meme/cgi-bin/meme.cgi).
Major characteristic of proteins are listed in Table 1. Subcellular location was predicted by Cello
(http://cello.life.nctu.edu.tw/), and Wolfpsort (http://genscript.com/psort/wolf_psort.html), and
both pI and Mw were calculated using Compute pI/Mw tool
(http://www.expasy.ch/tools/pi_tool.html).
Subcellular location
The construct used for transient gene expression and localization studies was derived
from binary vector pK7WGF2, which allows for the N-terminal fusion of the protein of choice
with GFP (Karimi et al., 2002). The 981-bp CDS of the strawberry FaCXE2 gene was amplified
and the PCR products were cloned into the entry vector pDONRTM221 (Invitrogen). The product
was then transferred to the pK7WGF2 vector by LR recombination reaction (Invitrogen),
resulting in a 35S::GFP::FaCXE2 fusion construct. The generated construct was tested through
sequencing prior to Nicotiana leaves transformation.
The A. tumefaciens strain GV3101 (Weigel and Glazebrook, 2006) containing either the
pK7WGF2-FaCXE2 or an empty pK7WGF2 for control plants, and A. tumefaciens strain GV3101
carrying the silencing suppressors genes vector pTBSV-p19 (Qiu et al., 2002), were grown at 28
°C in a LB medium with appropriate antibiotics. The p19 protein from TBSV was used to suppress
gene silencing. The cells were harvested and re-suspended in an infiltration buffer (10 mM
MgSO4, 10 mM MES and 1mM acetosyringone). This step was repeated once and the
concentration of bacterial suspension was measured by spectroscopy (OD600) and adjusted to a
final concentration of 0.5-0.8. Then, the cells carrying the pK7WGF2-FaCXE2 and the empty
pK7WGF2 constructs were mixed with the cell containing the p19 vector in pairwise, and left at
room temperature for 2-4 h in darkness. The bacterial suspension was taken in a syringe without
a needle and infiltrated through the abaxial surface of the leaf. Four days after, the localization
of GFP-fused proteins was collected. To accurately locate nuclei, N. benthamiana leaf tissues
were incubated with 4′,6-Diamidino-2-phenylindole dihydrochloride (DAPI). Leaves were
observed by epifluorescence microscope LSM 5 EXCITER (Carl Zeiss, Inc., Germany), with
excitation/emission settings of 488/500–515 nm for GFP and 405/449–461 nm for DAPI.

CHAPTER 4
352 Functional characterization of molecular regulatory mechanisms controlling the ripening in strawberry fruit
Cloning of full-length cDNA of FaCXE2
The full-length cDNA of FaCXE2 was amplified from total cDNA of strawberry red fruit
by using primers specially designed to match the initial and final transcription zones of the gene
and then sequenced, these oligonucleotides introduced an EcoRI and an XhoI restriction site at
the 5´ and 3´ ends of the FaCXE2 PCR fragment, respectively. The PCR fragment obtained was
separated by gel electrophoresis, purified using the QIAquick Gel Extraction kit (Qiagen), and
cloned into pGEM-T Easy vector (Promega) for sequencing.
Expression of recombinant FaCXE2 protein in Escherichia coli
The vector pGEX-4T-1 (Amersham) was used for the expression of recombinant FaCXE2
protein in E. coli cells (Blb21 Gold DE3 strain, Stratagene). The empty pGEX-4T-1 vector served
as control for the experiments. The restriction sites EcoRI and a XhoI introduced in the pGEM-T
easy construct with the FaCXE2 gene sequence at the 5´ and 3´ ends respectively, were
complementary to the restriction sites in the vector pGEX-4T-1 to obtain a frame fusion protein
at the N-terminus. The expression construct (pGEX-4T-1-FaCXE2) was verified by restriction
enzyme analysis and DNA sequencing before transformation into E. coli. For recombinant
FaCXE2 protein expression, 5 ml of an overnight liquid culture of transformed E. coli cells were
grown in fresh LB medium supplied with appropriate antibiotics at 37°C until OD600 = 0.6. Then,
the culture was equilibrated to 16°C and induced with 1 mM isopropyl-b-D-thiogalactoside
(IPTG). After 12 hours of growth at 16°C, cells were harvested by centrifugation and the pellet
was frozen for 15 min at –80°C. After this time, the cells were resuspended in 10 ml of 1 x ice-
cold wash buffer (4.3 mM Na2HPO4·7H2O, 1.47 mM KH2PO4, 0.137 M NaCl, 2.7 mM KCl, pH
7.3) and sonicated on ice at least three times for 30 s with 10% energy using a sonicator (Sonopuls
GM 2017, Bandelin). The sonicated cells were centrifuged at 4°C and 10 000g for 20 min. The
soluble protein fraction (supernatant) was incubated in Telos filtration columns 15ml (TelosTM
SPE Columns) with GST-sepharose (Novogen) for at least 60 min at 4°C. The protein attached to
the sepharose was washed three times with 8 ml of 1 x ice-cold wash buffer at 4°C. Finally, the
sepharose-bound protein was released by incubating for 5 min in 300 µl of 1x elution buffer (50
mM TRIS-HCl, 1 mM glutathione, pH 8) at room temperature. The eluated was quantified by
Bradford’s method (Bradford, 1976) and analysed by SDS-PAGE (12% Progel TRIS-Glycine,
1.0 mm, Anamed).
Enzyme Assay
Esterase activity was assayed according to the method of (Gomori, 1953) as modified by
(van Asperen, 1962). The assay mixture consisting of 5 mL of 0.3 mM 1-naphthyl acetate (a stock
solution of 30 mM 1-naphthyl acetate prepared in acetone and diluted in 0.05 M sodium phosphate

CHAPTER 4
353 PhD Thesis Félix Juan Martínez Rivas
buffer pH 7.0) and 50–100 µg of enzyme was incubated at 27 °C for 15 min. The reaction was
stopped by addition of 1 mL of DBLS reagent (2 parts of 1% diazo blue B and 5 parts of 5%
sodium lauryl sulphate). The absorbance of the developed color was measured at 600 nm. One
unit of enzyme activity was defined as the amount of enzyme that released 1 µmol of product per
min at pH 7.0 and 27 °C. Protein concentration was determined according to the Bradford’s
method (Bradford, 1976).
Kinetic Studies
Effect of Time
The purified esterase was incubated with 1-naphthyl acetate for 10, 20, 30, 40, 50 and 60
mins at 27 °C. The reaction mixture in each case contained 5 mL of 0.3 mM substrate solution (a
stock solution of 30 mM 1-naphthyl acetate was prepared in acetone and diluted to 100 fold with
0.05 M sodium phosphate buffer, pH 7.0) and 1 mL of purified esterase. The reaction was stopped
by the addition of 1 mL of DBLS reagent (2 parts of 1% diazo blue-B (O-dianisidine, tetrazotised)
and 5 parts of 5% sodium lauryl sulphate). The amount of 1-naphthol released for each time of
incubation was determined from the standard graph of 1-naphthol.
Enzyme Concentration
A typical esterase assay as described previously was carried out for purified esterase
containing 25, 50, 75, 100, 125 and 150 µg of protein. The amount of 1-naphthol released in each
case was determined as described previously.
Substrate Specificity
The substrate specificity of the purified esterase was tested using 1-naphthyl acetate, 1-
naphthyl butyrate and 2-naphthyl hexanoate. Esterase assay using 1-naphthyl acetate as substrate
was done as described previously.
Esterase activity was measured by incubating the enzymes with 1-naphthyl butyrate and
2-naphthyl hexanoate as substrate. The typical assay mixture in each case contained 5 mL of 0.3
mM substrate solution (a stock solution of 30 mM 1-naphthyl butyrate and 2-naphthyl hexanoate
were prepared in acetone and diluted to 100 fold with 0.05 M sodium phosphate buffer, pH 7.0)
and 1 mL of enzyme extract. The reaction mixture was incubated for 15 min at optimum
temperature and the reaction was arrested by the addition of 1 mL of DBLS reagent (2 parts of
1% diazo blue-B (Odianisidine, tetrazotised) and 5 parts of 5% sodium lauryl sulphate). The
reaction mixture was allowed to stand for 30 min and the intensity of the color formed was
determined at 600 nm.

CHAPTER 4
354 Functional characterization of molecular regulatory mechanisms controlling the ripening in strawberry fruit
Influence of pH and Temperature on the Activity of Purified Esterase
The effect of pH on the activity of the purified esterase was studied using the following
buffers: (1) sodium citrate (0.05 M, pH 3.0–6.0), (2) sodium phosphate (0.05 M, pH 6.0–8.0), (3)
Tris–HCl (0.05 M, pH 8.0–10.0). The catalytic activity of the enzyme in the above buffers was
determined with 1-naphthyl acetate as substrate. Suitable controls were prepared using GST
protein to determine the non-enzymatic hydrolysis of the substrate. The reaction was carried out
at 27 °C for 15 min and 1-naphthol formed was determined colorimetrically.
Similarly, the effect of temperature on the activity of the purified esterase was studied at
different temperatures ranging between 10 °C and 50 °C. The enzyme was diluted suitably and
incubated with substrate, 1-naphthyl acetate at different temperature for 60 min. The amount of
1-naphthol released was measured colorimetrically. The incubated samples were rapidly cooled
to -20 °C and assayed at optimum temperature. The amount of 1-naphthol released was measured
colorimetrically.
Km and Vmax
The purified esterase was incubated with different concentrations of 1-naphthyl acetate,
1-naphthyl butyrate and 2-naphthyl hexanoate for 20 mins at optimum temperature and pH and
the assay was carried out as described previously. The 1-naphthol formed in each concentration
was determined colorimetrically.
Volatile extraction and identification
For volatile determination, approximately 300mg of lyophilizate receptacle were
transferred to 20mL glass vial and the protocol described by (Vallarino et al., 2018) was followed.
Briefly, for data acquisition, the vials were incubated at 50ºC with agitation at 250rpm in an
autosampler. The SPME holder is inserted 24 mm into the vial and keep for 20 min (extraction
time), then the sample is injected in pulsed splitless mode, with the helium carrier gas flow set to
1mL/min. The injection temperature is set to 250ºC and the Helium flow goes through the fiber
at 250 °C for 5 min. Chromatography uses a 60 m DB-624 capillary column. The temperature
program should be isothermal for 2 min at 40 °C, followed by a 10 °C per min ramp to 260 °C,
and holding at this temperature for 10 min. Cooling should be as rapid as the instrument
specifications allow. The recorded mass range should be m/z 30–300 at 2 scan per s. The
compounds were identified using standards and/or GMD and NIST in our conditions as described
by (Vallarino et al., 2018).
Statistical analysis
All statistical analyses were performed with the GraphPad Instat program.

CHAPTER 4
355 PhD Thesis Félix Juan Martínez Rivas
References
Aharoni, A., Keizer, L.C.P., Bouwmeester, H.J., et al. (2000) Identification of the SAAT Gene Involved
in Strawberry Flavor Biogenesis by Use of DNA Microarrays. Plant Cell, 12, 647. Available at:
https://www.jstor.org/stable/10.2307/3870992?origin=crossref.
Akashi, T., Aoki, T. and Ayabe, S. (2005) Molecular and Biochemical Characterization of 2-
Hydroxyisoflavanone Dehydratase. Involvement of Carboxylesterase-Like Proteins in Leguminous
Isoflavone Biosynthesis. Plant Physiol., 137, 882–891. Available at: doi: 10.1104/pp.104.056747.
Amil-Ruiz, F., Garrido-Gala, J., Blanco-Portales, R., Folta, K.M., Muñoz-Blanco, J. and Caballero,
J.L. (2013) Identification and Validation of Reference Genes for Transcript Normalization in Strawberry
(Fragaria × ananassa) Defense Responses. PLoS One, 8.
Asif, M.H., Dhawan, P. and Nath, P. (2000) A simple procedure for the isolation of high quality rna from
ripening banana fruit. Plant Mol. Biol. Report., 18, 109–115.
Asperen, K. van (1962) A study of housefly esterases by means of a sensitive colorimetric method. J.
Insect Physiol., 8, 401–416.
Bailey, T.L., Boden, M., Buske, F.A., Frith, M., Grant, C.E., Clementi, L., Ren, J., Li, W.W. and
Noble, W.S. (2009) MEME SUITE: tools for motif discovery and searching. Nucleic Acids Res., 37, W202–
W208. Available at: https://academic.oup.com/nar/article-lookup/doi/10.1093/nar/gkp335.
Beekwilder, J., Alvarez-Huerta, M., Neef, E., Verstappen, F.W.A., Bouwmeester, H.J. and Aharoni,
A. (2004) Functional Characterization of Enzymes Forming Volatile Esters from Strawberry and Banana.
Plant Physiol., 135, 1865–1878.
Benítez-Burraco, A., Blanco-Portales, R., Redondo-Nevado, J., Bellido, M.L., Moyano, E., Caballero,
J.L. and Muñoz-Blanco, J. (2003) Cloning and characterization of two ripening-related strawberry
(Fragaria x ananassa cv. Chandler) pectate lyase genes. J. Exp. Bot., 54, 633–645.
Bhat, R., Geppert, J., Funken, E. and Stamminger, R. (2015) Consumers Perceptions and Preference
for Strawberries—A Case Study from Germany. Int. J. Fruit Sci., 15, 405–424.
Blanco-Portales, R., López-Raéz, J.A., Bellido, M.L., Moyano, E., Dorado, G., González-Reyes, J.A.,
Caballero, J.L. and Muñoz-Blanco, J. (2004) A strawberry fruit-specific and ripening-related gene codes
for a HyPRP protein involved in polyphenol anchoring. Plant Mol. Biol., 55, 763–780. Available at:
http://link.springer.com/10.1007/s11103-005-1966-z.
Bontpart, T., Cheynier, V., Ageorges, A. and Terrier, N. (2015) BAHD or SCPL acyltransferase? What
a dilemma for acylation in the world of plant phenolic compounds. New Phytol., 208, 695–707. Available
at: http://doi.wiley.com/10.1111/nph.13498.
Bradford, M. (1976) A Rapid and Sensitive Method for the Quantitation of Microgram Quantities of
Protein Utilizing the Principle of Protein-Dye Binding. Anal. Biochem., 72, 248–254.
Cao, X., Duan, W., Wei, C., Chen, K., Grierson, D. and Zhang, B. (2019) Genome-Wide Identification
and Functional Analysis of Carboxylesterase and Methylesterase Gene Families in Peach (Prunus persica
L. Batsch). Front. Plant Sci., 10, 1–13.
Cao, X., Xie, K., Duan, W., Zhu, Y., Liu, M., Chen, K., Klee, H. and Zhang, B. (2019) Peach
Carboxylesterase PpCXE1 Is Associated with Catabolism of Volatile Esters. J. Agric. Food Chem., 67,
5189–5196.
CHAPTER 4
356 Functional characterization of molecular regulatory mechanisms controlling the ripening in strawberry fruit
Chai, Y.M., Jia, H.F., Li, C.L., Dong, Q.H. and Shen, Y.Y. (2011) FaPYR1 is involved in strawberry
fruit ripening. J. Exp. Bot., 62, 5079–5089.
Chen, J.-Y., Wen, P.-F., Kong, W.-F., Pan, Q.-H., Wan, S.-B. and Huang, W.-D. (2006) Changes and
subcellular localizations of the enzymes involved in phenylpropanoid metabolism during grape berry
development. J. Plant Physiol., 163, 115–127. Available at:
https://linkinghub.elsevier.com/retrieve/pii/S0176161705002403.
Creelman, R.A., Bell, E. and Mullet, J.E. (1992) Involvement of a Lipoxygenase-Like Enzyme in
Abscisic Acid Biosynthesis. Plant Physiol., 99, 1258–1260. Available at:
http://www.plantphysiol.org/cgi/doi/10.1104/pp.99.3.1258.
Cummins, I., Landrum, M., Steel, P.G. and Edwards, R. (2007) Structure activity studies with
xenobiotic substrates using carboxylesterases isolated from Arabidopsis thaliana. Phytochemistry, 68, 811–
818. Available at: https://linkinghub.elsevier.com/retrieve/pii/S0031942206007886.
Cumplido-Laso, G., Medina-Puche, L., Moyano, E., et al. (2012) The fruit ripening-related gene
FaAAT2 encodes an acyl transferase involved in strawberry aroma biogenesis. J. Exp. Bot., 63, 4275–4290.
Available at: https://academic.oup.com/jxb/article-lookup/doi/10.1093/jxb/ers120.
Cunnac, S., Wilson, A., Nuwer, J., Kirik, A., Baranage, G. and Mudgett, M.B. (2007) A Conserved
Carboxylesterase Is a SUPPRESSOR OF AVRBST-ELICITED RESISTANCE in Arabidopsis. Plant Cell,
19, 688–705. Available at: http://www.plantcell.org/lookup/doi/10.1105/tpc.106.048710.
D’Auria, J.C. (2006) Acyltransferases in plants: a good time to be BAHD. Curr. Opin. Plant Biol., 9, 331–
340.
Dudareva, N. and Pichersky, E. (2008) Metabolic engineering of plant volatiles. Curr. Opin. Biotechnol.,
19, 181–189.
Falcone Ferreyra, M.L., Rius, S.P. and Casati, P. (2012) Flavonoids: biosynthesis, biological functions,
and biotechnological applications. Front. Plant Sci., 3. Available at: doi: 10.3389/fpls.2012.00222/abstract.
Gershater, M.C. and Edwards, R. (2007) Regulating biological activity in plants with carboxylesterases.
Plant Sci., 173, 579–588. Available at: https://linkinghub.elsevier.com/retrieve/pii/S0168945207002385.
Giampieri, F., Tulipani, S., Alvarez-Suarez, J.M.J.M., Quiles, J.L.J.L., Mezzetti, B. and Battino, M.
(2012) The strawberry: Composition, nutritional quality, and impact on human health. Nutrition, 28, 9–19.
Available at: https://linkinghub.elsevier.com/retrieve/pii/S0899900711003066.
Gomori, G. (1953) Human esterases. J. Lab. Clin. Med., 42, 445–53.
González, M., Gaete-Eastman, C., Valdenegro, M., Figueroa, C.R., Fuentes, L., Herrera, R. and
Moya-León, M.A. (2009) Aroma development during ripening of Fragaria chiloensis fruit and
participation of an alcohol acyltransferase (FcAAT1) gene. J. Agric. Food Chem., 57, 9123–9132.
Available at: https://pubs.acs.org/doi/10.1021/jf901693j.
Goulet, C., Kamiyoshihara, Y., Lam, N.B., Richard, T., Taylor, M.G., Tieman, D.M. and Klee, H.J.
(2015) Divergence in the Enzymatic Activities of a Tomato and Solanum pennellii Alcohol Acyltransferase
Impacts Fruit Volatile Ester Composition. Mol. Plant, 8, 153–162. Available at:
https://linkinghub.elsevier.com/retrieve/pii/S1674205214000082.
Goulet, C., Mageroy, M.H., Lam, N.B., Floystad, A., Tieman, D.M. and Klee, H.J. (2012) Role of an
esterase in flavor volatile variation within the tomato clade. Proc. Natl. Acad. Sci. U. S. A., 109, 19009–

CHAPTER 4
357 PhD Thesis Félix Juan Martínez Rivas
19014.
Hoffmann, T., Kalinowski, G. and Schwab, W. (2006) RNAi-induced silencing of gene expression in
strawberry fruit (Fragaria x ananassa) by agroinfiltration: a rapid assay for gene function analysis. Plant J.,
48, 818–26. Available at: http://www.ncbi.nlm.nih.gov/pubmed/17092319.
Ileperuma, N.R., Marshall, S.D.G., Squire, C.J., Baker, H.M., Oakeshott, J.G., Russell, R.J.,
Plummer, K.M., Newcomb, R.D. and Baker, E.N. (2007) High-Resolution Crystal Structure of Plant
Carboxylesterase AeCXE1, from Actinidia eriantha , and Its Complex with a High-Affinity Inhibitor
Paraoxon. Biochemistry, 46, 1851–1859. Available at: https://pubs.acs.org/doi/10.1021/bi062046w.
Jetti, R.R., Yang, E., Kurnianta, A., Finn, C. and Qian, M.C. (2007) Quantification of Selected Aroma-
Active Compounds in Strawberries by Headspace Solid-Phase Microextraction Gas Chromatography and
Correlation with Sensory Descriptive Analysis. J. Food Sci., 72, S487–S496.
Jia, H.-F., Chai, Y.-M., Li, C.-L., Lu, D., Luo, J.-J., Qin, L. and Shen, Y.-Y. (2011) Abscisic Acid Plays
an Important Role in the Regulation of Strawberry Fruit Ripening. Plant Physiol., 157, 188–199. Available
at: http://www.plantphysiol.org/lookup/doi/10.1104/pp.111.177311.
Karimi, M., Inzé, D. and Depicker, A. (2002) GATEWAY vectors for Agrobacterium-mediated plant
transformation. Trends Plant Sci., 7, 193–5. Available at: http://www.ncbi.nlm.nih.gov/pubmed/11992820.
Kessler, A. (2001) Defensive Function of Herbivore-Induced Plant Volatile Emissions in Nature. Science
(80-. )., 291, 2141–2144.
Kim, S. and Lee, S.B. (2004) Thermostable Esterase from a Thermoacidophilic Archaeon: Purification
and Characterization for Enzymatic Resolution of a Chiral Compound. Biosci. Biotechnol. Biochem., 68,
2289–2298. Available at: http://www.tandfonline.com/doi/full/10.1271/bbb.68.2289.
Ko, M., Cho, J.H., Seo, H.-H., Lee, H.-H., Kang, H.-Y., Nguyen, T.S., Soh, H.C., Kim, Y.S. and Kim,
J.-I. (2016) Constitutive expression of a fungus-inducible carboxylesterase improves disease resistance in
transgenic pepper plants. Planta, 244, 379–392. Available at: http://link.springer.com/10.1007/s00425-
016-2514-6.
Larsen, M. and Poll, L. (1990) Odour thresholds of some important aroma compounds in raspberries. Z.
Lebensm. Unters. Forsch., 191, 129–131.
Lazo, G.R., Stein, P.A. and Ludwig, R.A. (1991) A DNA Transformation–Competent Arabidopsis
Genomic Library in Agrobacterium. Bio/Technology, 9, 963–967. Available at:
http://www.nature.com/doifinder/10.1038/nbt1091-963.
Lee, S., Hwang, S., Seo, Y.W., Jeon, W.B. and Oh, B.-J. (2013) Molecular characterization of the
AtCXE8 gene, which promotes resistance to Botrytis cinerea infection. Plant Biotechnol. Rep., 7, 109–119.
Available at: http://link.springer.com/10.1007/s11816-012-0253-0.
Li, D., Li, L., Luo, Z., Mou, W., Mao, L. and Ying, T. (2015) Comparative Transcriptome Analysis
Reveals the Influence of Abscisic Acid on the Metabolism of Pigments, Ascorbic Acid and Folic Acid
during Strawberry Fruit Ripening W. Lu, ed. PLoS One, 10, e0130037. Available at:
http://dx.plos.org/10.1371/journal.pone.0130037.
Marshall, S.D., G.Putterill, J.J., Plummer, K.M. and Newcomb, R.D. (2003) The Carboxylesterase
Gene Family from Arabidopsis thaliana. J. Mol. Evol., 57, 487–500. Available at:
http://link.springer.com/10.1007/s00239-003-2492-8.

CHAPTER 4
358 Functional characterization of molecular regulatory mechanisms controlling the ripening in strawberry fruit
Matthews, C.K., Holde, K.E. van, Appling, D.R. and Anthony-Cahill, S.J. (2013) Biochemestry 4th ed.,
Pearson Benjamin Cummings.
Medina-Puche, L., Blanco-Portales, R., Molina-Hidalgo, F.J., Cumplido-Laso, G., García-Caparrós,
N., Moyano-Cañete, E., Caballero-Repullo, J.L., Muñoz-Blanco, J. and Rodríguez-Franco, A. (2016)
Extensive transcriptomic studies on the roles played by abscisic acid and auxins in the development and
ripening of strawberry fruits. Funct. Integr. Genomics, 16, 671–692. Available at:
http://dx.doi.org/10.1007/s10142-016-0510-3.
Medina-Puche, L., Cumplido-Laso, G., Amil-Ruiz, F., et al. (2014) MYB10 plays a major role in the
regulation of flavonoid/phenylpropanoid metabolism during ripening of Fragaria × ananassa fruits. J. Exp.
Bot., 65, 401–417.
Medina-Puche, L., Molina-Hidalgo, F.J., Boersma, M., et al. (2015) An R2R3-MYB Transcription
Factor Regulates Eugenol Production in Ripe Strawberry Fruit Receptacles. Plant Physiol., 168, 598–614.
Available at: http://www.ncbi.nlm.nih.gov/pubmed/25931522.
Mikulic-Petkovsek, M., Schmitzer, V., Slatnar, A., Stampar, F. and Veberic, R. (2012) Composition
of Sugars, Organic Acids, and Total Phenolics in 25 Wild or Cultivated Berry Species. J. Food Sci., 77.
Molina-Hidalgo, F.J., Franco, A.R., Villatoro, C., et al. (2013) The strawberry (Fragaria×ananassa) fruit-
specific rhamnogalacturonate lyase 1 (FaRGLyase1) gene encodes an enzyme involved in the degradation
of cell-wall middle lamellae. J. Exp. Bot., 64, 1471–1483.
Molina-Hidalgo, F.J., Medina-Puche, L., Cañete-Gómez, C., et al. (2017) The fruit-specific
transcription factor FaDOF2 regulates the production of eugenol in ripe fruit receptacles. J. Exp. Bot., 68,
4529–4543. Available at: http://academic.oup.com/jxb/article/68/16/4529/4067750/The-fruitspecific-
transcription-factor-FaDOF2.
Oakeshott, J.G., Claudianos, C., Russell, R.J. and Robin, G.C. (1999) Carboxyl/cholinesterases: a case
study of the evolution of a successful multigene family. BioEssays, 21, 1031–1042. Available at:
http://doi.wiley.com/10.1002/%28SICI%291521-1878%28199912%2922%3A1%3C1031%3A%3AAID-
BIES7%3E3.0.CO%3B2-J.
Pedersen, S. and Amtssygehus, A. (2001) Multiplex Relative Gene Expression Analysis by Real-Time
RT-PCR Using the iCycler iQ Detection System. BioRadiations, 107, 10–11. Available at: http://www.bio-
rad.com/LifeScience/pdf/Bulletin_2696.pdf.
Perkins-Veazie, P. (1995) Growth and Ripening of Strawberry Fruit. In Horticultural Reviews. Oxford,
UK: John Wiley & Sons, Inc., pp. 267–297. Available at: doi.wiley.com/10.1002/9780470650585.ch8.
Qin, Y., Teixeira da Silva, J.A., Zhang, L. and Zhang, S. (2008) Transgenic strawberry: State of the art
for improved traits. Biotechnol. Adv., 26, 219–232.
Qiu, W., Park, J.-W. and Scholthof, H.B. (2002) Tombusvirus P19-Mediated Suppression of Virus-
Induced Gene Silencing Is Controlled by Genetic and Dosage Features That Influence Pathogenicity. Mol.
Plant-Microbe Interact., 15, 269–280.
Raab, T., López-Ráez, J.A., Klein, D., Caballero, J.L., Moyano, E., Schwab, W. and Muñoz-Blanco,
J. (2006) FaQR, required for the biosynthesis of the strawberry flavor compound 4-hydroxy-2,5-dimethyl-
3(2H)-furanone, encodes an enone oxidoreductase. Plant Cell, 18, 1023–37. Available at:
http://www.ncbi.nlm.nih.gov/pubmed/16517758.

CHAPTER 4
359 PhD Thesis Félix Juan Martínez Rivas
Raguso, R.A. (2008) Wake Up and Smell the Roses: The Ecology and Evolution of Floral Scent. Annu.
Rev. Ecol. Evol. Syst., 39, 549–569.
Satoh, T. and Hosokawa, M. (2006) Structure, function and regulation of carboxylesterases. Chem. Biol.
Interact., 162, 195–211.
Schwieterman, M.L., Colquhoun, T.A., Jaworski, E.A., et al. (2014) Strawberry flavor: Diverse
chemical compositions, a seasonal influence, and effects on sensory perception M. Kusano, ed. PLoS One,
9, e88446.
Souleyre, E.J.F., Marshall, S.D.G., Oakeshott, J.G., Russell, R.J., Plummer, K.M. and Newcomb,
R.D. (2011) Biochemical characterisation of MdCXE1, a carboxylesterase from apple that is expressed
during fruit ripening. Phytochemistry, 72, 564–571. Available at: doi: 10.1016/j.phytochem.2011.01.020.
Symons, G.M., Chua, Y.-J., Ross, J.J., Quittenden, L.J., Davies, N.W. and Reid, J.B. (2012) Hormonal
changes during non-climacteric ripening in strawberry. J. Exp. Bot., 63, 4741–50. Available at:
https://academic.oup.com/jxb/article-lookup/doi/10.1093/jxb/err313.
Vallarino, J.G., Erban, A., Fehrle, I., Fernie, A.R., Kopka, J. and Osorio, S. (2018) Acquisition of
Volatile Compounds by Gas Chromatography–Mass Spectrometry (GC-MS). In Plant Metabolomics. pp.
225–239. Available at: http://link.springer.com/10.1007/978-1-4939-7819-9_16.
Weigel, D. and Glazebrook, J. (2006) In Planta Transformation of Arabidopsis. Cold Spring Harb.
Protoc., 2006, pdb.prot4668-pdb.prot4668.
Yan, J. wei, Ban, Z. jun, Lu, H. yan, Li, D., Poverenov, E., Luo, Z. sheng and Li, L. (2018) The aroma
volatile repertoire in strawberry fruit: a review. J. Sci. Food Agric., 98, 4395–4402.
Zabetakis, I. and Holden, M.A. (1997) Strawberry flavour: Analysis and biosynthesis. J. Sci. Food Agric.,
74, 421–434.

360 Functional characterization of molecular regulatory mechanisms controlling the ripening in strawberry fruit

CONCLUSIONS
361 PhD Thesis Félix Juan Martínez Rivas
CONCLUSIONS

362 Functional characterization of molecular regulatory mechanisms controlling the ripening in strawberry fruit

CONCLUSIONS
363 PhD Thesis Félix Juan Martínez Rivas
CONCLUSIONS
CHAPTER 1
1.- Three FaPRE genes with high homology level between them have been found in the
strawberry genome.
2.- FaPRE1 expression pattern is receptacle-specific, ripening-related and regulated by
ABA and auxins while FaPRE2 and FaPRE3 expression is specific of vegetative tissues.
3.- FaPRE1 antagonistically coordinates the transcription of genes related to both
receptacle growth and ripening.
4.- FaPRE1, in ripened receptacle, represses the transcription of receptacle growth
promoting genes while activating the transcription of those genes related to the receptacle
ripening process.
CHAPTER 2
5.- FaMYB123 is an R2-R3 MYB TF whose gene expression is ripening related, restricted
to the receptacle and positively regulated by ABA and negatively by auxins.
6.- FaMYB123 control the expression of the late genes of the phenylpropanoid pathway,
specifically the malonyl transferases.
7.- In FaMYB123-RNAi transgenics receptacles there is a disbalance between
anthocyanin and proanthocyanin contents.
8.- FaMYB123 is able to interact both in-vitro and in-vivo with FabHLH3, a regulator
of proanthocyanin production.
CHAPTER 3
9.- The injection of the demethylating compound 5-azacytidine lead to a complete stop
of the ripening process.
10.- Transcriptome analysis revealed that transcriptional factor and enzymes related with
ripening were repressed in the treated parts.
11.- Metabolomic studies showed an alteration of the primary and secondary metabolites,
whose profiles were more similar to non-ripened receptacles.
12.- A disbalance between ABA and auxins was produced. A higher concentration of
auxins and gibberellins while lower concentrations of ABA were accumulated in response
to AZA treatment.

364 Functional characterization of molecular regulatory mechanisms controlling the ripening in strawberry fruit
CHAPTER 4
13.- FaCXE2 is a gene that encodes an α/β hydrolase similar to other carboxylesterases
previously described.
14.- The FaCXE2 expression is ripening-related, preferentially expressed in fruit and
hormonally regulated positively by ABA and negatively by auxins.
15.- In-vitro FaCXE2 activity reveals an optimal pH of 7.5 and an optical temperature of
25ºC. The recombinant protein shows most affinity towards longer chain esters.
16.- Transient downregulation of strawberry FaCXE2 shows clear differences in the
volatile content, presenting higher accumulation of esters and alcohol compounds were
less concentrated.

365 PhD Thesis Félix Juan Martínez Rivas

366 Functional characterization of molecular regulatory mechanisms controlling the ripening in strawberry fruit