Development and Ultrastructure of Cucurbita pepo Nectaries of Male Flowers
Upload
khangminh22Category
view
0download
0
1
DENTINAL ULTRASTRUCTURE IN
OSTEOGENESIS IMPERFECTA AND
DENTINOGENESIS IMPERFECTA
Submitted in partial fulfilment of the requirements for the Degree of
Clinical Doctorate in Dentistry (Paediatric Dentistry)
Eastman Dental Institute
University College London
Submitted by:
NABILAH SAWANI HARITH
DDS (Malaysia), MFDSRCS (Edinburgh)
2
DECLARATION OF ORIGINALITY I hereby declare that the work presented in this thesis was carried out by myself.
Information derived from the published and unpublished work of others has been
acknowledged in the text and the relevant references are included in this thesis.
Nabilah Sawani Harith Eastman Dental Institute, University College London September 2013.

3
ABSTRACT Osteogenesis Imperfecta (OI) associated with Dentinogenesis Imperfecta, type I (DI)
is a rare genetic condition, where mutations of COL1A1 and COL1A2 genes result in
variations in the amino sequence of the collagen α-chains. The collagen fibrils are
expected to be abnormally thin due to defective collagen formation. These alterations
have been shown to affect the bones, but have not yet been elucidated in the
dentinal collagen.
Objectives: Evaluation of demineralisation protocols to expose dentinal collagen for
permanent and primary teeth and to characterise the morphology of dentinal collagen
ultrastructure in primary DI type I vs. control primary teeth using Atomic Force
Microscopy (AFM).
Methods: Primary (6) and permanent (6) control teeth plus one DI type I primary
tooth have been used to date in this on-going project. To reveal the dentinal collagen
structure, four demineralisation approaches have been evaluated: 1) two blocks of
dentine were treated with 10 vol% citric acid for 15second (s) and 6.5 vol% NaOCLaq
for 120s; 2) dentine blocks treated with commercial etchant (37% phosphoric acid)
and controlled 6.5 vol% NaOCLaq. Raman spectroscopy was used to assess the
degree of demineralisation. These demineralised dentine were characterized using
AFM imaging; 3) demineralisation protocol in which the teeth were left in 17%
Ethylenediaminetetraacetic acid (EDTA) for 12 months before being histology
sectioned and stained with Picrosirius red; and 4) dentine block was treated with 17%
EDTA for 10 minutes. Both demineralised samples were characterised using
scanning electron microscopy (SEM).

4
Results: All demineralisation protocols achieved partial or complete demineralisation
of the dentine. Demineralisation with commercial etchant and NaOCI produced
visibly defined collagen fibrils in primary and permanent teeth. A shorter time was
sufficient for demineralisation in primary teeth. No signs of degradation of the fibrils
suggesting that the demineralisation protocol will be adequate for our DI/OI teeth.
In the ultrastucture findings of OI associated DI primary teeth; AFM images revealed
an area of thickened dentinal collagen fibrils that distributed at only one a direction
with a wide distribution of D-banding separations distance, suggesting the DI
collagen banding was less regular in pattern.
Conclusion: The difference in dentinal collagen fibril arrangement and D-banding
distance in the affected primary tooth may lead explain the altered mineralization.

5
ACKNOWLEDGEMENTS
Over the last three years, finally my journey reached to the end. There were a lot of
people who helped me both direct and indirectly throughout this work. May God bless
all of them.
First and foremost, this thesis is dedicated especially to my parents ( Harith bin Abdul
Jalil and Salomee Hasbullah) for their unceasing love, encouragement and support.
They always be with me in every single step of the way. To both of you, I owe
everything.
My special thanks go to my supervisor, Dr Laurent Bozec and Dr Susan Parekh, for
their brilliant ideas, enthusiasm guidance and great mentorship during the completion
of this thesis. I really appreciated their assistance and support that always inspired
me.
My gratitude to Dr Paul Ashley, Graham Palmer and Nicky Morden who help me in
my experimental work and special thank you, especially to Nurjehan Ibrahim,
Hashimatul Fatma, Mohd Ridzuan, Mazlina, Nor Azlina, Azra, Eyad Nayif, Mai
Rozyhasniza, Muhammad Hasbullah, Mohd Azri and all my friends that I met here in
London for their advice and more importantly , good friendship.
I also would like to acknowledge Ministry of Health, Malaysia for their sponsorship.
My deepest gratitude goes to Dr Ganasalingam and Dr Jamilah Omar who always
encourages and convinces me to pursue my career in Paediatric Dentistry. Last but
not least to my beloved family ( Norahiza, Hazrin, Hadri, Nadirah, Nabihah, Shahrin,
Alfian ) for their encouragement and faithful support to this success.

6
CONTENTS
DECLARATION OF ORIGINALITY ........................................................................... 2 ABSTRACT ............................................................................................................... 3 ACKNOWLEDGEMENTSCONTENTS ........................................................................ 5 LIST OF FIGURE ....................................................................................................... 6 LIST OF TABLES ....................................................................................................... 9 LIST OF ABBREVIATIONS ...................................................................................... 13
CHAPTER 1: INTRODUCTION ............................................................................... 14 1.0 Introduction ......................................................................................................... 15
1.1 Osteogenesis Imperfecta ............................................................................... 16 1.1.1 History and classification ......................................................................... 16 1.1.2 Mutations of gene in Osteogenesis Imperfecta ............................................. 21 1.1.3 Effect of mutation on Type I collagen ........................................................ 22 1.1.4 Bone collagen in relation to Osteogenesis Imperfecta ................................... 24 1.1.5 An overview of organic matrix in bone and dentine ..................................... 26
1.2 Dentinogenesis Imperfecta ............................................................................ 27 1.2.1 Dentinogenesis Imperfecta in association with Osteogenesis Imperfecta ......... 27 1.2.2 Dentinogenesis Imperfecta Type II ............................................................ 30 1.2.3 Dentinogenesis Imperfecta Type III ........................................................... 31
1.3 Dentinogenesis and dentine ........................................................................... 32 1.3.1 Dentinogenesis ........................................................................................ 32 1.3.2 Composition, types and histology of the dentine .......................................... 34 1.3.3 Dentine in primary teeth and permanent teeth ............................................. 39
1.4 Dentinal collagen ......................................................................................... 40 1.4.1 Role of dentinal collagen in clinical dentistry .............................................. 40 1.4.2 Ultrastructure studies on dentinal collagen .................................................. 41 1.4.3 Knowing the collagen .............................................................................. 42 1.4.4 Dentinal collagen in relation to OI and DI .................................................. 47 1.4.5 Overview of dentinal collagen and bone collagen in OI and DI ..................... 49
1.5 Experimental design in dentinal collagen studies ............................................. 50 1.5.1 Atomic Force Microscopy (AFM) ............................................................. 51 1.5.2 Raman spectroscopy ................................................................................ 54 1.5.3 Scanning Electron Microscopy (SEM) ....................................................... 55
1.6 Effect of demineralising agents ..................................................................... 57 1.6.1 Effect of dentine etching ........................................................................... 57 1.6.2 Effect of sodium hypochlorite ................................................................... 58 1.6.3 Effect of Ethylenediaminetetraacetic acid (EDTA) ...................................... 58
1.7 Aims of the study ........................................................................................ 59
CHAPTER 2: MATERIAL AND METHODS .............................................................. 60 2.0 Materials and methods .......................................................................................... 61
2.1 Development of the database ......................................................................... 61 2.1.1 Study registration and ethical approval ....................................................... 61 2.1.2 Sample selection ..................................................................................... 61 2.1.3 Anomalies clinic and data collection .......................................................... 62
2.2 Teeth samples ............................................................................................. 63 2.2.1 Teeth selection ........................................................................................ 63 2.2.2 Sample storage ........................................................................................ 63 2.2.3 Preparation of teeth in epoxy resin ............................................................. 63 2.2.4 Preparation of teeth for histopathology sections ........................................... 66
2.3 Experimental design for demineralisation study ............................................... 67

7
2.3.1 List of solutions: ...................................................................................... 67 2.3.2 Demineralisation using published protocol.................................................. 67 2.3.3 Demineralisation of experimental protocol using commercial etchant (37%
phosphoric acid) ...................................................................................... 67 2.3.4 Further steps in the experimental protocol with 6.5vol% of NaoCI................. 69 2.3.5 Comparing the demineralisation protocols with 17% EDTA ......................... 70
2.4 Topological assessment of demineralised dentine ............................................ 70 2.4.1 Atomic Force Microscopy (AFM) ............................................................. 70 2.4.2 Scanning Electron Microscopy (SEM) ....................................................... 72
CHAPTER 3: EVALUATION OF DEMINERALISATION PROTOCOLS FOR
PERMANENT TEETH .............................................................................................. 74 3.0 Evaluation of demineralisation protocols for permanent teeth .................................... 74
3.1 Introduction ................................................................................................ 75 3.2 Materials and methods ................................................................................. 77
3.2.1 Demineralisation using published protocols ................................................ 77 3.2.2 Demineralisation of experimental group using commercial etchant ................ 77 3.2.3 Demineralisation using 17% EDTA for 12 months ...................................... 77 3.2.4 Demineralisation using 17% EDTA for 10 minutes ...................................... 78
3.3 Results ......................................................................................................... 78 3.3.1 Demineralisation using published protocols ................................................ 79 3.3.2 Demineralisation using commercial etchant ................................................ 81 3.3.3 Demineralisation using 17% EDTA for 12 months ...................................... 89 3.3.4 Demineralisation using 17% EDTA for 10 minutes ...................................... 92
3.4 Discussion .................................................................................................. 94 3.4.1 Demineralisation using published protocols ................................................ 94 3.4.2 Demineralisation of experimental group using commercial etchant ................ 94 3.4.3 Demineralisation using 17% EDTA for 12 months ...................................... 97 3.4.4 Demineralisation using 17% EDTA for 10 minutes ...................................... 98 3.4.5 Potential issues ...................................................................................... 100
3.5 Conclusion ............................................................................................... 104
CHAPTER 4: EVALUATION OF DEMINERALISATION PROTOCOLS FOR PRIMARY
TEETH................................................................................................................... 106 4.0 Evaluation of demineralisation protocols for primary teeth ...................................... 107
4.1 Introduction .............................................................................................. 107 4.2 Materials and methods ............................................................................... 108
4.2.1 Demineralisation using published protocols .............................................. 108 4.2.2 Demineralisation of experimental group using commercial etchant .............. 108 4.2.3 Demineralisation using 17% EDTA for 12 months .................................... 108 4.2.4 Demineralisation using 17% EDTA for 10 minutes .................................... 108
4. 3. Results ..................................................................................................... 110 4.3.1 Demineralisation using published protocols .............................................. 110 4.3.2 Demineralisation of experimental group using commercial etchant .............. 111 4.3.3 Demineralisation using 17% EDTA for 12 months .................................... 118 4.3.4 Demineralisation using 17% EDTA for 10 minutes .................................... 121
4.4 Discussion ................................................................................................ 122 4.4.1 Demineralisation using published protocols .............................................. 122 4.4.2 Demineralisation of experimental group using commercial etchant .............. 123 4.4.3 Demineralisation using 17% EDTA for 12 months .................................... 124 4.4.4 Demineralisation using 17% EDTA for 10 minutes .................................... 125 4.4.5 Potential issues ...................................................................................... 126
4.5 Conclusion ............................................................................................... 128
8
CHAPTER 5: CHARACTERISATION OF DENTINAL COLLAGEN OF OI AND DI
USING AFM .......................................................................................................... 129 5.0 Characterisation of dentinal collagen of OI and DI using AFM ................................ 130
5.1 Introduction .............................................................................................. 130 5.2 Materials and methods ............................................................................... 131
5.2.1 Tooth preparation .................................................................................. 131 5.2.2 Demineralisation protocols –Effect of 10vol% of citric acid for 15s ............. 131 5.2.3 Measuring the D-banding ....................................................................... 131
5.3 Results ..................................................................................................... 132 5.3.1 Assessment of dentinal structure of DI type I of primary teeth before
demineralisation .................................................................................... 132 5.3.2 The effect of 10vol% citric acid for 15 seconds on primary DI type I ........... 133 5.3.3 Measuring the D-banding distance of primary DI and control ...................... 135
5.4 Discussion ................................................................................................ 138 5.4.1 Characterisation of DI type I ................................................................... 138 5.4.2 The effect of 10vol% citric acid for 15 seconds on primary DI type I ........... 140 5.4.3 Potential issue ....................................................................................... 142
5.5 Conclusions .............................................................................................. 143
CHAPTER 6: FINAL CONCLUSION AND FUTURE WORK .................................... 144
CHAPTER 7: REFERENCES ................................................................................... 155
CHAPTER 8: APPENDIX ........................................................................................ 167
Appendix 1 .......................................................................................................... 168 Appendix 2 .......................................................................................................... 171 Appendix 3 .......................................................................................................... 173

9
LIST OF FIGURE FIGURE 1.1:MUTATIONS THAT SHOWS DECREASED SYNTHESIS OF NORMAL
COLLAGEN RESULTS IN OI TYPE I AND MUTATIONS THAT AFFECT THE
COLLAGEN STRUCTURE THAT RESULTS IN OI TYPE II, III AND IV . ............. 23
FIGURE 1.2: HUMAN ODONTOBLASTS IN TEETH ...................................................................... 33
FIGURE 1.3: (A)DENTINAL TUBULES WHICH SURROUNDED BY HIGHLY MINERALISED
PERITUBULAR DENTINE AND INTERTUBLULAR DENTINE (B) PARTIALLY
DEMINERALISEDDENTINE AFTER TREATED WITH 15S PHOSPHORIC ACID 38
FIGURE 1.4: THREE POLYPEPTIDE CHAINS THAT COILED TOGETHER INTO A TRIPLE
HELIX ............................................................................................................................. 43
FIGURE 1.5: CHEMICAL STRUCTURE OF COLLAGEN AMINO ACID GLYSINE-PROLINE
HYDROXYPROLINE ..................................................................................................... 44
FIGURE 1.6:A) TRANSMISSION ELECTRON MICROSCOPY (TEM) IMAGE OF SINGLE
FIBRILS WITH THE 67 NM D-PERIOD VISIBLE. (B) SCHEMATIC
REPRESENTATION OF THE TWO-DIMENSIONAL AXIAL ARRANGEMENT OF
COLLAGEN MOLECULES IN A MICROFIBRIL........................................................ 45
FIGURE 1.7:3D REPRESENTATION OF THE MOLECULAR ARRANGEMENT OF TYPE I
COLLAGE. RIGHT, THE CYCLIC SET OF THE FINAL MODEL AND THE
TELOPEPTIDE DIRECTIONS ....................................................................................... 46
FIGURE 1.8: COLLAGEN GEL FROM RAT TAIL UNDER ATOMIC FORCE MICROSCOPY
(AFM) .............................................................................................................................. 46
FIGURE 1.9: BIOSYNTHESIS OF DENTINAL COLLAGEN ........................................................... 48
FIGURE 1.10:AFM DETECTION METHOD SHOWING TIP OF CANTILEVER
APPROACHINGSAMPLESURFACES ......................................................................... 52
FIGURE 2.1: SAMPLE PREPARATION IN EPOXY RESIN ............................................................. 65
FIGURE 2.2: DEMINERALISATION TECHNIQUE SEQUENCE USING COMMERCIAL
ETCHING ........................................................................................................................ 69
FIGURE 2.3: XE-100 AFM (PARK INSTRUMENT KOREA) ........................................................... 71
FIGURE 2.4: DIMENSION 3100 AFM (VEECO, SANTA BARBARA, CA) .................................... 72
FIGURE 2.5: EXPERIMENTAL DESIGN FOR DEMINERALISATION STUDIES ........................ 73
FIGURE 3.1: EXPERIMENTAL GROUPS FOR CONTROL PERMANENT TEETH ...................... 78
FIGURE 3.2: CONTACT MODE AFM IMAGES OF OCCLUSAL SECTION OF PERMANENT
HUMAN DENTINE. ....................................................................................................... 79
FIGURE 3.3: CONTACT MODE AFM IMAGES OF PERMANENT TEETH AFTER SAMPLE
PREPARATION. ............................................................................................................. 80
FIGURE 3.4 : RAMAN SPECTRA OF PERMANENT TEETH WITH PHOSPHATE, CARBONATE
AND AMIDE III PEAK .................................................................................................. 81

10
FIGURE 3.5: SCHEMATIC RAMAN SPECTRA AT DIFFERENT TIMES OF
DEMINERALISATION WITH ACID PHOSPHORIC 37% ON PERMANENT TEETH
......................................................................................................................................... 82
FIGURE 3.6: GRAPH SHOWING THE RATIO DATA OF PHOSPHATE PEAK AND AMIDE III 83
FIGURE 3.7:CONTACT MODE AFM IMAGES OF DEMINERALISATION SEQUENCES IN
COMMERCIAL ETCHANT (37% PHOSPHORIC ACID) OF CONTROL
PERMANENT TEETH. AN ASSAY OF ETCHING TIMES ........................................ 84
FIGURE 3.8: AFM IMAGES OF DEMINERALISED DENTINE SURFACE IN 37% PHOSPHORIC
ACID AT 5 MINUTES WITH DEPROTEINISATION TREATMENT IN 6.5 VOL%
SODIUM HYPOCHLORITE. ......................................................................................... 86
FIGURE 3.9:CONTACT MODE XE-100 PARK AFM IMAGES OF PERMANENT HUMAN
DENTINE AFTER PARTIAL DEMINERALISATION BY 37%PHOSPHORIC ACID
FOR 5 MINUTES AND SUBSEQUENTLY TREATED WITH 6.5 VOL% NAOCI FOR
100 SECONDS.. .............................................................................................................. 87
FIGURE 3.10: COLLAGEN FIBRILS CAN BE OBSERVED SHOWING THE REPEAT PATTERN
AND RANDOM DISTRIBUTION OF FIBRILS IN THE INTERTUBULAR DENTINE.
......................................................................................................................................... 88
FIGURE 3.11 :SECTIONAL ANALYSIS ALONG THE FIBRILS SHOWS D-BANDING
DISTANCE ALONG COLLAGEN FIBRIL BY WSXM ANALYSIS .......................... 88
FIGURE 3.12: PICROSIRIUS RED STAINED HISTOPATHOLOGY CROSS- SECTION OF
PERMANENT TEETH AFTER BEEN STORED IN 17% EDTA FOR 12 MONTHS.).
......................................................................................................................................... 90
FIGURE 3.13: EXPERIMENTAL PROCEDURE OF PERMANENT TEETH STORED IN 17%
EDTA FOR 12 MONTH.................................................................................................. 91
FIGURE 3.14: EFFECT OF 17% EDTA FOR 10 MINUTES ON THE DENTINAL SURFACE OF
CONTROL PERMANENT TOOTH. .............................................................................. 93
FIGURE 3.15: THE SAMPLES DID NOT MOVE SIMULTENOUSLY WITH THE SCANNER,
THE IMAGE BECAME NOT CLEAR.. ....................................................................... 102
FIGURE 3.16: SEM IMAGE SHOWING PRECIPITATION ON THE SAMPLE SURFACE. THIS
MAY BE THE EFFECT OF CUTTING DURING SAMPLE PREPARATION. ......... 103
FIGURE 3. 17: A) PARTIALLY DEMINERALISED WITH PHOSPHORIC ACID AND NAOCI, B)
PARTIALLY DEMINERALISED WITH CITRIC ACID AND NAOCI C) EDTA
DEMINERALISATION FOR 12 MONTH D) EDTA DEMINERALISATION FOR 10
MINUTES ...................................................................................................................... 105
FIGURE 4.1: EXPERIMENTAL GROUPS FOR CONTROL PRIMARY TEETH .......................... 109
FIGURE 4.2: CONTACT MODE AFM IMAGES SHOWING THE OCCLUSAL SECTION OF
PRIMARY TEETH AFTER DEMINERALISATION BY ACID ETCHING WITH
CITRIC ACID AND DEPROTEINISATION OF 6.5 VOL% NAOCI… ..................... 110
FIGURE 4.3: CONTACT MODE AFM IMAGES OF PRIMARY TEETH AFTER SAMPLE
PREPARATION. ........................................................................................................... 111
FIGURE 4.4: RAMAN SPECTRA OF CONTROL PRIMARY TEETH WITH PHOSPHATE,
CARBONATE AND AMIDE III PEAK ....................................................................... 112

11
FIGURE 4.5: REPRESENTATIVE RAMAN SPECTRA OBTAINED AT DIFFERENT TIMES OF
DEMINERALISATION WITH COMMERCIAL ETCHANT (37% ACID
PHOSPHORIC) ON CONTROL PRIMARY TEETH .................................................. 113
FIGURE 4.6: GRAPH SHOWING THE RATIO DATA OF PHOSPHATE PEAK AND AMIDE III
....................................................................................................................................... 114
FIGURE 4.7: CONTACT MODE AFM IMAGES OF DEMINERALISATION USING
COMMERCIAL ETCHANT (37% PHOSPHORIC ACID) OF CONTROL PRIMARY
TEETH AT 2 MINUTES.. ............................................................................................. 115
FIGURE 4.8: AFM IMAGES OF DEMINERALISED DENTINE SURFACE USING
COMMERCIAL ETCHANT AT 2 MINUTES WITH DEPROTEINISATION
TREATMENT IN 6.5 VOL% NAOCI. ......................................................................... 116
FIGURE 4.9: CONTACT MODE XE-100 PARK AFM IMAGES OF CONTROL PRIMARY TEETH
AFTER PARTIAL DEMINERALISATION BY 37%PHOSPHORIC ACID FOR 2
MINUTES AND SUBSEQUENTLY TREATED WITH 6.5 VOL% NAOCI FOR 80
SECONDS. .................................................................................................................... 117
FIGURE 4.10: HISTOLOGY SECTION OF CONTROL PRIMARY TOOTH ................................. 118
FIGURE 4.11: EXPERIMENTAL PROCEDURE OF CONTROL PRIMARY TEETH STORED IN
17% EDTA FOR 12 MONTH ....................................................................................... 120
FIGURE 4.12: EFFECT OF 17% EDTA FOR 10 MINUTES ON THE CONTROL PRIMARY
TOOTH. ......................................................................................................................... 121
FIGURE 4.13: COMPARING RESULTS BETWEEN PRIMARY AND PERMANENT TEET. ..... 127
FIGURE 5.1: AFM IMAGES OF LOWER PRIMARY TOOTH OF A PATIENT WITH DI TYPE I.
THE DENTINAL ........................................................................................................ 132
FIGURE 5.2: DI TYPE I DENTINE TREATED WITH 10VOL% CITRIC ACID FOR 15 SECONDS
AT TWO DIFFERENT AREAS .................................................................................... 133
FIGURE 5.3: CONTROL PRIMARY TOOTH IMAGES OF INTERTUBULAR DENTINE
TREATED WITH 15S OF 10 VOL% OF CITRIC ACID ........................................... 134
FIGURE 5.4: MEASUREMENT OF D-BANDING DISTANCE ALONG THE COLLAGEN FIBRIL
IN DI TYPE I BY WSXM ANALYSIS. ....................................................................... 135
FIGURE 5.5:IMAGES SHOWING THICK DENTINAL COLLAGEN WITH REPEATED
PATTERN THAT DIRECTED IN ONE ANGLE IN DI TYPE I WHILST LEFT;
SHOWING INTERLOCKING FIBRILS WITH REPEATED PATTERN AND
RANDOM DISTRIBUTIONIN NORMAL PRIMARY TEETH .................................. 139

12
LIST OF TABLES
TABLE 1.1: CLINICAL CLASSIFICATION OF OSTEOGENESIS IMPERFECTA ........................... 20
TABLE 1.2: RAMAN SPECTRA PEAK THAT RELEVANT TO DENTAL RESEARCH .................. 55
TABLE 5.1: DISTRIBUTION OF D-BANDING LENGTH OF DI TYPE I IN PRIMARY TEETH... 136
TABLE 5.2: DISTRIBUTION OF D-BANDING LENGTH OF CONTROL PRIMARY TEETH ...... 137

13
LIST OF ABBREVIATIONS α Alpha
% Percentage
µm Micrometer
mm Milimeter
cm Centimetre
nm Nanometer
H Hydrogen
s Seconds
NH Amide
C=O Carbonyl
3D three dimensional
AFM atomic force microcopy
BMP1 bone morphogenetic protein 1
BSP bone sialoprotein
calcium
hydroxyapatite,
Ca10 (PO4)6 (OH) 2
CRTAP cartilage associated protein
COL1A1 collagen type 1, alpha 1
COL1A2 collagen type 1, alpha 2
DEJ dento-enamel junction
DI Dentinogenesis Imperfecta
DMP1 dentine matrix protein 1
DPP dentine phosphoprotein
DSPP dentine sialophosphoprotein
DSP dentine sialoprotein
ECM extracellular matrix
ECF extracellular fluid
EDH Eastman Dental Hospital
EDTA Ethylenediaminetetraacetic acid
ER endoplasmic reticulum
FKBP10 FK506 binding protein 10, 65 kDa
GAG glycosaminoglycan
hyald hydroxylysine- aldehyde

14
KHN Knoop Hardness Number
mRNA messenger ribo-nucleic acid
min Minutes
NaOCI Sodium hypochlorite
NHS National Health Service
OI Osteogenesis Imperfecta
OPN Osteopontin
PLOD2 procollagen-lysine, 2-oxoglutarate 5-dioxygenase 2
SEM scanning electron microscopy
SERPINF1 serpin peptidase inhibitor, clade F, member 1
SMPD3 sphingomyelin phosphodiesterase 3
SP7 Sp7 transcription factor
TEM transmission electron microscopy
vol Volume

15
CHAPTER 1
INTRODUCTION

16
1.0 INTRODUCTION
1.1 Osteogenesis Imperfecta
1.1.1 History and classification
Osteogenesis Impefecta (OI) is a genetic disorder characterised by abnormal
connective tissue development that leads to osseous fragility and bone fracture.
These features have led to the trivial name of ‘Brittle Bone Disease’ (Rauch and
Glorieux, 2004) Other secondary features that may present in OI patients include
short stature, loose ligaments, hypermobility, hearing deficit, blue sclera, skin
hyperlaxity and Dentinogenesis Imperfecta (Byers, 2000)
The study of OI began in 1788, where the Swede Olof Jakob Ekman, described the
condition of congenital osteomalacia with hereditary bone fragility, in his doctoral
thesis and mentioned cases dating back to 1678. Since then, many other names
have been used to describe the condition. Among some of the common alternatives
names are Ekman-Lobstein syndromes, Vrolik syndrome and glass bone disease.
These names were recognised during the 18th century by Lobstein and Vrolik who
lent their names to the syndrome (Byers, 1995).In 1906, further studies proposed by
Looser postulated two category of OI; congenital (severe) and tarda (mild). The
important milestone in OI research has been the classification of OI into four types
which was based on the mode of inheritance, clinical presentation and radiographic
findings as characterised by Sillence (Sillence et al., 1979a). With advances in
molecular genetic analyses today, attempts have been made to further classify OI,
although the Sillence classification is still in used in an adjusted and extended form
(Rauch and Glorieux, 2004)

17
It was reported that the prevalence of OI was approximately 6-7 per 100,000 live
births (Steiner et al., 1993). According to Steiner, each of the OI types has different
prevalence from each other (Steiner et al., 1993). In 1979, the prevalence of OI type I
was reported to be approximately 3-4 per 100,000 live births (Sillence et al., 1979b)
The prevalence of type II and type III were about 2-3 per 100, 000 live births (Steiner
et al., 1993). Other reports showed that the general prevalence of OI ranged from
one per 10 000 to one per 20 000 live birth (Engelbert et al., 1998). Recent accurate
prevalence data for OI are currently not available.
The Sillence classification distinguished OI into four types; type I, II, III and IV. Type I
is autosomal dominant and the mildest form of the disease. Normally, affected
individuals have blue sclera, normal or close to normal stature and infrequently
Dentinogenesis Imperfecta. Vertebral fractures are common and can lead to mild
scoliosis. The fractures are rarely seen at birth, however begin when the affected
child starts to walk and stand. Fractures commonly affect the long bones, ribs and
small bones of the feet and hands. The incidence of fracture decreases following
puberty. Radiographic bone morphology is generally normal although mild femoral
bowing may occur in newborns while in adults the classic ‘cod-fish’ appearance
(vertebral deformity) often develops accompanied with a loss in height (Sillence et
al., 1979b).
Type II is the perinatal lethal form of OI that affects newborn infants. The mode of
inheritance may be autosomal dominant or autosomal recessive. Affected infants
exhibit severe skeletal deformities with short extremities, bowed legs and flexed and
abducted hips. Prematurity and low birth weights are common. Radiographic findings
showed bowed tibias, short femurs and an absence of mineralisation. The survival
rate of infant beyond a year is extremely rare (Sillence et al., 1979b).

18
Type IIII is the progressive form of OI, which can be autosomal dominant or
autosomal recessive. The features are characterised by severe progressive skeletal
deformities which often start from conception. This results in in-utero fractures. The
incidences of fractures remain high during growth until adulthood. The affected
individuals are normally very short with blue sclera at birth and deformities can cause
severe scoliosis. Dentinogenesis Imprefecta is common and involves primary and
permanent teeth. Radiographs at birth generally demonstrate decreased mineralised
calvarium with large fontanelle and features of Wormian bones which showed thin
ribs with sign of fractures. Individuals with type III are at risk of respiratory problems
and brain stem compression due to bone deformation at associated organs (Sillence
et al., 1979b).
Type IV is autosomal dominant with the most clinically diverse group. The features
include normal or grayish sclera, mild to moderate deformity, short stature and
Dentinogenesis Imperfecta. The incidence of fractures can be variable. Fractures are
common during birth and cease during adult life. The life span of individuals with OI
type IV is nearly normal (Sillence et al., 1979b).
In 2004, the Sillence classification was expanded and to recognize three more types
of OI; type V to VII (Rauch and Glorieux, 2004). Type V is autosomal dominant and a
moderately deforming disease. The main features of type V are frequent
development of hypertrophic calluses at fracture sites, calcification of the
interosseous membranes between the bones of the forearm which may lead to
dislocation of the radial head, and patients generally have short stature. Blue sclera
and Dentinogenesis Imperfecta are not present in type V (Rauch and Glorieux, 2004)
Type VI is autosomal recessive with moderate to severe skeletal deformities without
blue sclera and Dentinogenesis Imperfecta. The distinct features of this type are the

19
presence of excessive osteoid accumulation on bone-forming surfaces and fishscale-
like appearance of the bone lamellae (Rauch and Glorieux, 2004).
Type VII is autosomal recessive with moderate deforming OI. Individuals present with
mild short stature, bone fragility and lack blue sclera and dentinogenesis imperfecta.
The distinct feature is a shortening of the humerus and the femur. Infants with type
VII may develop respiratory insufficiency in the neonatal and postnatal periods and is
frequently fatal, as a result of underlying problems such as pulmonary anomalies and
infectious disease (Rauch and Glorieux, 2004).
In 2007, Type VIII was proposed as an additional type of OI (Cabral et al., 2007a).
This type of OI is described as autosomal recessive and severe deforming lethal
type. Patients may present with white sclera, extremely short stature and severe
osteoporosis. To date, Type VIII has only been observed in a community of Native
Americans in northern Quebec (Glorieux, 2008).

20
Type Genetics Clinical findings
OI I
Autosomal dominant Blue sclera, normal or close to normal stature, DI (infrequent), fracture with little or no limb deformity
OI II
Autosomal dominant Lethal perinatal type; affect newborn infants, severe skeletal deformities, short extremities, bowed legs, premature infant Radiograph : absence of bone mineralisation
OI III
Autosomal dominant or autosomal recessive
Progressive skeletal deformities at birth, scleral hue varies, very short stature, DI Radiograph: decreased mineralised calvarium, wormian bone ( thin ribs with sign of fracture)
OI IV
Autosomal dominant Normal sclerae, mild/moderate limb deformity with fracture, variable short stature, DI, hearing loss.
OI V
Autosomal dominant Frequent development of hypertrophic callus at fracture sites, calcification of intraosseous membrane of bones, dislocation of bone, short stature
OI VI
Autosomal recessive Moderate to severe skeletal deformities without DI and blue sclera, excessive osteoid accumulation form fishscale-like appearance
OI VII
Autosomal recessive Moderate deforming OI, bone fragility, congenital fractures, shortening of humerus and femur, respiratory insufficiency
OI VIII
Autosomal recessive White sclera, extremely short, severe osteoporosis
Table 1. 1: Clinical classification of Osteogenesis Imperfecta

21
1.1.2 Mutations of gene in Osteogenesis Imperfecta
OI is associated with abnormalities of type I collagen, with the majority of patients
having mutations in one of the two genes, COL1A1 and COL1A2 that encode Type 1
collagen chains. The remaining may be due to recessive variants in other genes such
as cartilage-associated protein (CRTAP) and leucine proline-enriched proteoglycan
(LEPRE) which were found in Type VII and Type VIII OI (Van Dijk et al., 2010).
Recently, molecular and biochemical studies have identified types of OI that are not
associated with a defect in collagen gene COL1A1 and COL1A2. These types of OI
have an association with deficiency of genes that encode component of collagen. In
2006, partial loss of function cartilage-associated protein (CRTAP) mutations
encodes prolyl-3-hydroxylase-1(P3H1) hydroxylation of proline residue in procollagen
chain found to cause OI type VII (Morello et al., 2006). The following year, LEPRE1
mutations that encode P3H1 was described in OI type VIII (Cabral et al., 2007b). To
date, a few new genes have been determined causing autosomal recessive forms of
OI (Byers and Pyott, 2012) ;
Mineralisation defect- Type VI OI (serpin peptidase inhibitor, clade F, member
1 (SERPINF1),
Collagen P3H1 defects- Type VII, VIII and IX OI ( CRTAP, LEPRE1, Peptidyl-
prolyl cis-trans isomerase B (PPIB),
Collagen chaperone defects – Type X and XI OI ( SERPINF1 and FKBP10),
C-propeptide cleavage enzyme defect – Type XII OI (Bone morphogenetic
protein 1 (BMP1),
Frameshift mutations – unclassified OI types (Sp7 transcription factor (SP7).
22
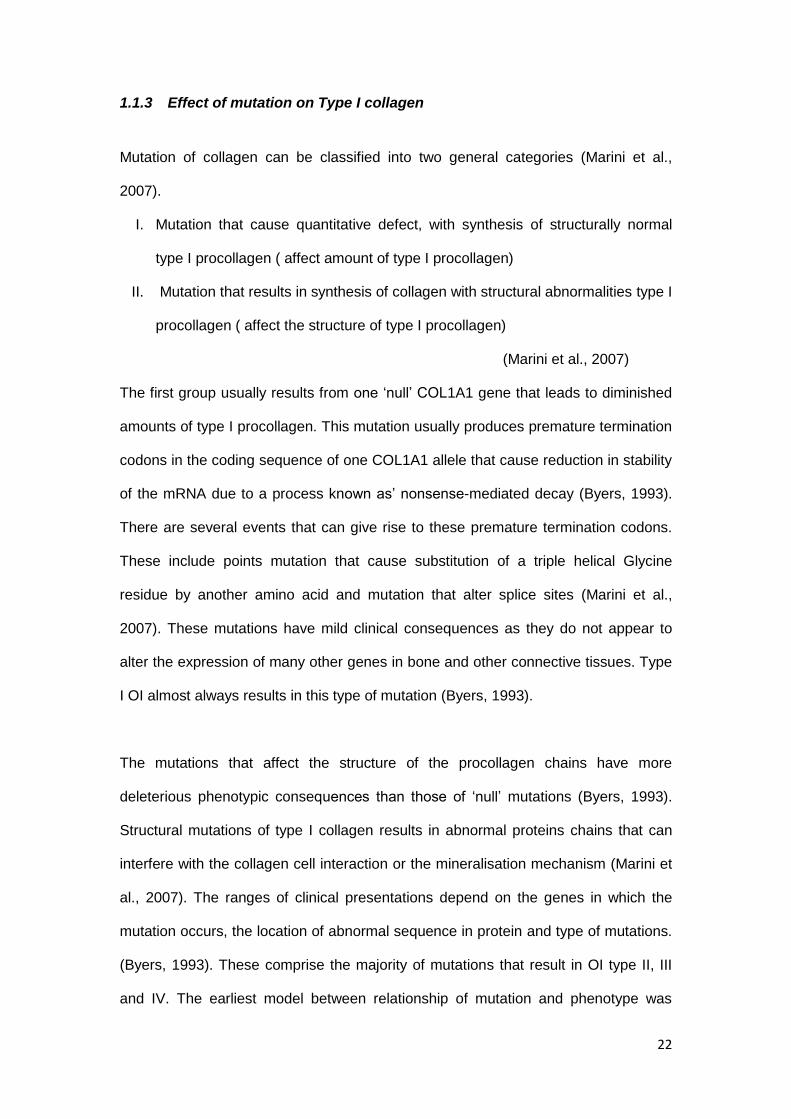
1.1.3 Effect of mutation on Type I collagen
Mutation of collagen can be classified into two general categories (Marini et al.,
2007).
I. Mutation that cause quantitative defect, with synthesis of structurally normal
type I procollagen ( affect amount of type I procollagen)
II. Mutation that results in synthesis of collagen with structural abnormalities type I
procollagen ( affect the structure of type I procollagen)
(Marini et al., 2007)
The first group usually results from one ‘null’ COL1A1 gene that leads to diminished
amounts of type I procollagen. This mutation usually produces premature termination
codons in the coding sequence of one COL1A1 allele that cause reduction in stability
of the mRNA due to a process known as’ nonsense-mediated decay (Byers, 1993).
There are several events that can give rise to these premature termination codons.
These include points mutation that cause substitution of a triple helical Glycine
residue by another amino acid and mutation that alter splice sites (Marini et al.,
2007). These mutations have mild clinical consequences as they do not appear to
alter the expression of many other genes in bone and other connective tissues. Type
I OI almost always results in this type of mutation (Byers, 1993).
The mutations that affect the structure of the procollagen chains have more
deleterious phenotypic consequences than those of ‘null’ mutations (Byers, 1993).
Structural mutations of type I collagen results in abnormal proteins chains that can
interfere with the collagen cell interaction or the mineralisation mechanism (Marini et
al., 2007). The ranges of clinical presentations depend on the genes in which the
mutation occurs, the location of abnormal sequence in protein and type of mutations.
(Byers, 1993). These comprise the majority of mutations that result in OI type II, III
and IV. The earliest model between relationship of mutation and phenotype was

23
focused on the chain in which mutation occurred. Mutations of COL1A1 gene may
have more severe phenotypic consequences and may even be lethal, because they
compromise three-quarters of all type I collagen (Prockop et al., 1989). However, if
the similar mutation occurs in COL1A2, the effect will be mild as it only causes
decreased amounts of collagen production. Figure 1.1 describes the mutation in OI
type I which due to decreased synthesis of collagen and in type II,III and IV which
were due to mutation that affect the collagen structure (Gajiko-Galicka, 2002). Later,
it was proposed that the clinical severity of OI depends on the position of mutation
along the chain, with the mutations closest to the carboxyl terminal end resulting in
more severe phenotypes than those closer to the amino-terminal end, that result in
moderate to mild cases (Starman et al., 1989).
OI type I is mostly characterised by the reduction in the amount of collagen whilst OI
type II, III and IV were results from abnormal production of collagen type I (Marini et
al., 2007).
Figure 1.1: Mutations that shows decreased synthesis of normal collagen results in OI type I and mutations that affect the collagen structure that results in OI type II, III and IV (Adapted from Galicka et al, 2002).

24
1.1.4 Bone collagen in relation to Osteogenesis Imperfecta
Bone is a dynamic tissue, which continuously remodels. Bone has long been known
to be responsive to mechanical loading to resist mechanical forces and fractures.
Strength is dependent on the bone density and quality of the bone which is
characterised by the shape and microarchitecture of the bone and also the turnover
of mineral and collagen (Carbonare Dalle L, 2004).
Bone contains complex biominerals and is highly hierarchical in structure. The
organic component is primarily composed of type I collagen with minor amounts of
type III and type V collagen (Saito and Marumo, 2010). The collagen molecules in
bone are typically fibrillar type I collagen which is reinforced with nanoscale
hydroxyapatite particles. Collagen type I formed by the osteoblast is typically
deposited in parallel or concentric lamellar layers arranged in trabecular and cortical
bone (Tzaphlidou, 2008).
The role of type I collagen in the pathogenesis of OI has long been investigated. The
strength of the collagen fibrils is derived mainly from intermolecular cross-links.
Cross-linking is results of specific three-dimensional arrangements of collagens
within the fibril; only molecules that are correctly aligned are able to form cross-links
(Bank et al., 2000). These cross links involved the aldehyde side chains which react
with amine groups of parallel collagen molecules. Cross links can be divided into two
types; enzymatic cross link (lysine hydroxylases and lysyl oxidase) and non-
enzymatic cross links (glycation end product) (Bank et al., 2000). A breakdown or
reduction in cross-links has been revealed to lead to a loss of strength (Oxlund et al.,
1995). The failure of the regulatory mechanism that controls lysyl hydroxylation of the
crosslinking in collagen was shown to have close association with bone abnormalities
and bone fragility disorder such as OI (Knott and Bailey, 1998)
25
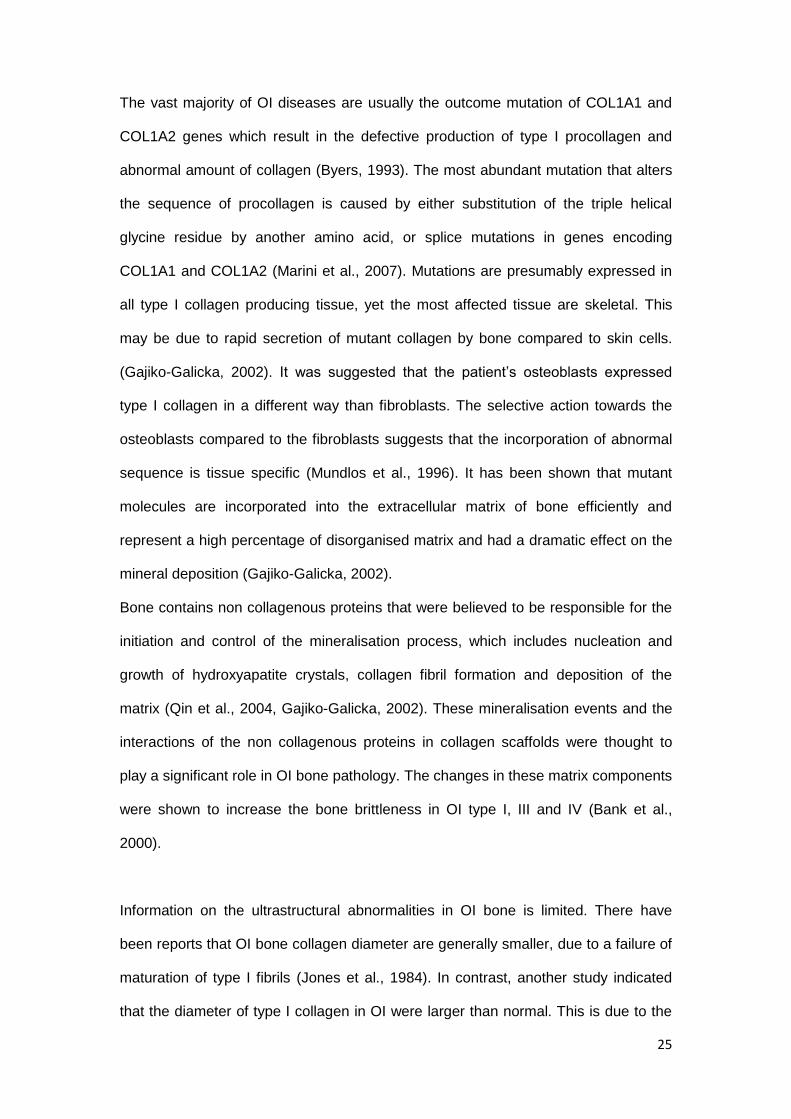
The vast majority of OI diseases are usually the outcome mutation of COL1A1 and
COL1A2 genes which result in the defective production of type I procollagen and
abnormal amount of collagen (Byers, 1993). The most abundant mutation that alters
the sequence of procollagen is caused by either substitution of the triple helical
glycine residue by another amino acid, or splice mutations in genes encoding
COL1A1 and COL1A2 (Marini et al., 2007). Mutations are presumably expressed in
all type I collagen producing tissue, yet the most affected tissue are skeletal. This
may be due to rapid secretion of mutant collagen by bone compared to skin cells.
(Gajiko-Galicka, 2002). It was suggested that the patient’s osteoblasts expressed
type I collagen in a different way than fibroblasts. The selective action towards the
osteoblasts compared to the fibroblasts suggests that the incorporation of abnormal
sequence is tissue specific (Mundlos et al., 1996). It has been shown that mutant
molecules are incorporated into the extracellular matrix of bone efficiently and
represent a high percentage of disorganised matrix and had a dramatic effect on the
mineral deposition (Gajiko-Galicka, 2002).
Bone contains non collagenous proteins that were believed to be responsible for the
initiation and control of the mineralisation process, which includes nucleation and
growth of hydroxyapatite crystals, collagen fibril formation and deposition of the
matrix (Qin et al., 2004, Gajiko-Galicka, 2002). These mineralisation events and the
interactions of the non collagenous proteins in collagen scaffolds were thought to
play a significant role in OI bone pathology. The changes in these matrix components
were shown to increase the bone brittleness in OI type I, III and IV (Bank et al.,
2000).
Information on the ultrastructural abnormalities in OI bone is limited. There have
been reports that OI bone collagen diameter are generally smaller, due to a failure of
maturation of type I fibrils (Jones et al., 1984). In contrast, another study indicated
that the diameter of type I collagen in OI were larger than normal. This is due to the

26
alteration the primary structure of type I collagen (amino acid sequence) that can
reflect changes in the quarternary collagen structure (fibril) which modified the
diameter (Cassella et al., 1994).
In the severe forms of OI, abnormal collagen can be seen in the loose fibrous
unmineralised regions in lamellar bone of the femoral diaphysis. The abnormal
collagen were described as ‘pseudo-fibrils’ that suggest structural defects featuring
thin and fine fibrils (Traub et al., 1994). In OI type III, the collagen fibrils
demonstrated abnormal collagen fibrils with flower like, twisted, spiralled and
sparsely distributed pattern throughout a very thick osteoid (Sarathchandra and
Pope, 2005). However, this was not in the case of OI type I, which demonstrated
abnormal thickened type I collagen fibrils, with kinks in the fibrils extending to right
angle deformities. These fibrils were closely related to normal collagen molecules
with overall D- band periodicity of approximately 67nm (Cassella et al., 1994).
1.1.5 An overview of organic matrix in bone and dentine
Dentine and bone are composite materials that are composed of extracellular matrix
(ECM), which primarily comprises of organic matrix (collagen) and an inorganic
mineralised phase (hydroxyapatite) (McKee MD et al., 2005). Both are mineralised
tissues that are closely related in several aspects. At the ultrastructure scale, the
main component of organic matrix in bone and dentine is the collagen type I. This
collagen is secreted by well differentiated cells; the osteoblast and odontoblast during
osteogenesis and dentinogenesis process respectively (Opsahl Vital et al., 2012).
The remaining organic matrix component consists of non-collagenous protein. Some
of the proteins include osteopontin (OPN) and bone sialoprotein (BSP) which are
believed to be responsible for mineralisation of bone and dentine matrix protein 1

27
(DMP1) and dentine sialophosphoprotein (DSPP) which are involved in the
mineralisation of the dentine (Qin et al., 2004).
Interestingly, the collagen in bone and dentine are interrelated, therefore any bone
disease that involves the collagen may disturb the collagen in the dentine too. This
can be seen in the condition of Osteogenesis Imperefecta (OI) where one of the
important oral finding can be the presence of Dentinogenesis Imperfecta (DI).
1.2 Dentinogenesis Imperfecta
1.2.1 Dentinogenesis Imperfecta in association with Osteogenesis Imperfecta
As mentioned previously, OI results from various gene mutations leading to defects
in type I collagen, which is the major component in bone and dentine. The important
oral finding in OI is the presence of Dentinogenesis Imperfecta (DI). DI associated
with OI is called DI type I (OMIM 166240).
Clinical features: Clinically, affected teeth have an abnormal colour ranging from
grey-brown to opalescent blue and have bulbous crowns (Barron et al., 2008). The
condition affects both primary and permanent teeth although the primary teeth are
often more severely affected (Hart and Hart, 2007). The affected teeth show signs of
excessive wear, due to enamel chipping and fracture. The enamel layer is normal but
the dentino-enamel junction (DEJ) and the underlying dentine are not. When
subjected to occlusal stresses, the dentine is easily exposed as the enamel shears
off and cracks away from the dentine (Shields et al., 1973). The dentine also will
obliterate the pulp, causing a loss of sensation in the tooth soon after eruption or
prior to tooth eruption (Kim and Simmer, 2007).
28
Radiographic features: DI features altered root morphology with short and
constricted roots in both dentitions .The degree of pulp of obliteration varies and
occurs soon after eruption or sometimes before eruption (Witkop, 1975, Barron et al.,
2008).
Pathologic features:
The first layer of dentine, the mantle dentine, which forms when dentine forms in the
tooth germ, lacks any tubular structures. The mantle dentine is formed by newly
differentiated odontoblasts and less mineralized. The mantle dentine has been
reported to be normal in patients with DI (Hall et al., 2002) whereas dysplastic
manifestations in mantle dentine have been found by others (Malmgren and
Lindskog, 2003). The normal appearing mantle dentine suggests an initial normal
function of odontoblasts that may be possibly related to different mechanism of
‘startup’ matrix formation (Hall et al., 2002). The mantle dentine merges with a
dysplastic form of dentine which finally becomes hypertrophic and obliterates the
pulp chamber and pulp canal (Kim and Simmer, 2007). During initial dentine
formation, mesenchymal cells differentiate to form odontoblasts. Clusters of
odontoblasts fail to produce regular predentine matrix that may explained changes in
further dentine mineralisation process (Wright and Gantt, 1985). The odontoblast
differentiation also is controlled by gene expression that may explain the dysplastic
manifestations in the dentine.
In an ultrastucture study (using transmission electron microscopy), the collagen
observed in the dentine was smaller in diameter than normal (Waltimo et al., 1996).
This corresponds with earlier findings on the small diameter of collagen fibril in bone
of OI patient (Jones et al., 1984) .

29
Genetics: DI type I is an autosomal dominant trait, associated with OI (type I, III and
IV). Individuals with the mutation in type I collagen genes (COL1A1 and COL1A2)
and in some other genes which involved in the formation of the collagen and the
maturation of collagen can be associated with DI. It is hypothesised that the
metabolic pathways involved in dentine and bone matrix formation probably have
defects (Bixler, 1976). However, the severity of the dentine and bone defect
displayed by the patients varies widely (Marini, 2004). Despite type I collagen being
the main organic matrix in bone and dentine, the majority of OI patients have normal
teeth (Waltimo et al., 1996). The relationship between how type I collagen mutations
effect bone and dentine is poorly understood as it can result in severe bone defects
with only mild DI or, DI can be the most penetrant feature in OI (Barron et al., 2008).
The gene mutation can be expressed differently in bone and in dentine which can be
assigned partly to specific cell type differences in the transcription of mutated genes
(Waltimo, 1996, Waltimo et al., 1996). This was supported by a study showing that
tissue specificity exists for mutated collagen, which can be expressed differently in
bone and skin (Mundlos et al., 1996). A report of possible mechanisms of dentinal
defects due to odontoblast dysfunction was hypothesised to cause the histological
changes in DI type I. As the result of the collagen mutation, the dysfunctional
odontoblasts may dilate, due to the intracellular accumulation of abnormal
procollagen in the rough endoplasmic reticulum. The secreted abnormal matrix
mineralizes eventually enveloping the dilated odontoblasts and its process and
preventing further collagen secretion (Hall et al., 2002, Majorana et al., 2010). In DI
type I, the phenotype presentation of DI can relate to the collagen abnormalities
however there is still no strong link between mutations of collagen gene and dental
phenotype (Ben Amor et al., 2013).

30
1.2.2 Dentinogenesis Imperfecta Type II
DI type II (OMIM 125490) can occur as an isolated effect due to mutation of dentine
sialophosphoprotein (DSPP).
Clinical features: The clinical and radiographic tooth phenotype is indistinguishable
from DI type I (Hart and Hart, 2007). Certain characteristics that are recognized in DI
type II are:
a) Osteogenesis Imperfecta is not related to DI type II (Bixler, 1976, Witkop, 1975)
b) The severity, colouration and attrition are more profound in DI II (Bixler, 1976)
whereas more variable in DI type I
Radiographic features: Obliteration of the pulp chamber can begin prior to tooth
eruption. Abnormal crown and root morphology is noted with bulbous crowns, a
typical feature, with marked cervical constriction. The roots are often narrow with
small and short obliterated root canals.
Genetics: The non-collagenous part of the organic matrix in the dentine is
composed of various proteins with dentine sialophosphoprotein (DSPP)
predominating about 50%. DSPP is a human gene that encodes two smaller
proteins; dentin sialoprotein (DSP) and dentin phosphoprotein (DPP). These
proteins are the main component of the organic matrix which plays an essential role
in tooth development. Dentine phosphoprotein helps in the deposition of mineral
crystals among the collagen fibrils. Defects in the DSPP gene had been suggested
as a causative factor in DI type II (Xiao et al., 2001, Malmgren et al., 2004). Bone
defects appear to be absent in individuals with dentine disorder involving mutation of
DSPP despite DSPP expression in this tissue. This may due to low expression level

31
of DSPP in bone and explained the exclusive isolated effect in dentine only in DI type
II (Kim and Simmer, 2007).
1.2.3 Dentinogenesis Imperfecta Type III
DI type III (OMIM 125500) is a form of DI found in a triracial isolate from southern
Maryland and Washington DC known as the Brandywine isolate (Witkop et al., 1966).
Clinical features: Typically severe signs of wear develop on occlusal and incisal
surfaces although most of the clinical features are similar to DI type I and DI type II
(Levin et al., 1983). The newly erupted crowns have bulbous shape and thickness
but are reduced in height as the tooth surface wears over time. Hursey et al reported
on a case of DI type III in children where enamel was only present at the gingival
margins and the dentine was amber brown in colour without evidence of caries
(Hursey et al., 1956). The clinical presentation varies, including a large pulp chamber
in the primary teeth, obliteration of the pulp chamber and root canals. The incidence
of pulp exposure is high, as the tooth surfaces wear rapidly, especially in the primary
teeth (Shields et al., 1973).
Radiographic features: Primary teeth in DI type III show considerable variation in
appearance, ranging from normal to pulpal obliteration and even to shell teeth
(Shields et al., 1973) which manifest as an enlarged pulp chambers surrounded by
only a thin layer of dentine. These features were found only in young children
(Witkop, 1975).
Genetics: The dentine sialophosphoprotein (DSPP) gene has been identified in a
family with Dentinogenesis Imperfecta type III (DI type III). Linkage analyses showed
that this gene is located on human chromosome 4q21 (MacDougall M et al., 1999). In

32
DI type III, only DPP level is altered with normal levels of DSP. This alteration affects
dentine matrix mineralization and the colour of the teeth (Levin et al., 1983).
It is helpful to consider the formation and structure of normal dentine in order to have
a better understanding of the effects of abnormal dentine formation.
1.3 Dentinogenesis and dentine
1.3.1 Dentinogenesis
Odontoblasts are the cells which are responsible for the formation of the dentine and
dentine’s constituents. These cells are differentiated from the ectomesenchymal cells
of the dental papilla in the inner dental epithelium. The ectomesenchymal cells will
enlarge and elongate to become the pre-odontoblasts cells, which in turn change the
cytoplasmic volume and mature to become odontoblasts. Odontoblasts are columnar
in shape, and form the interface between mineralised dentine and pulp (Steve
Weiner et al., 1999).The nucleus of the cell is located at the proximal end of the cells,
and the cell is rich with Golgi apparatus and endoplamic reticulum. These organelles
are responsible for the protein secretion during the formation of the dentine (Nanci,
2008). The odontoblastic process extends in the tubular as the dentinal tubules
extend. The odontoblastic processes are long and straight in the crown region and
shorter and more sigmoidal in the root (Byen and Sugaya, 1994). The main functions
of odontoblasts are their involvement in synthesis and secretion of the dentine
extracellular matrix (Butler and Ritchie, 1995). During formation of dentine,
odontoblasts will secrete the organic matrix that is composed of collagen and non-
collagenous proteins. The odontoblasts differentiate at the bell stage secrete the
organic predentine matrix. The predentine is an unmineralised region containing type
I collagen and non collagenous proteins that is thought to act as a nucleator of

33
hydroxyapatite crystals during mineralisation process. As the dentinogenesis
continues, the odontoblasts continue to migrate deeper into the pulp cavity,
extending their process as they go, while secreting the new dentine matrix. As the
odontoblasts migrate further, the matrix they secrete becomes dominated by type I
collagen orientated parallel to the dentine-enamel junction, resulting in a denser
mineralised dentine known as primary dentine (Barron et al., 2008).
Mutations in the genes which encode for the organic matrix seem to underlie most of
the hereditary dentine defects. The molecular defects in OI involve mutation in type I
collagen and genes involved in formation of the collagen can be associated with DI
type I. On the other hand, the allelic mutation of DSPP gene that encode dentine
sialophosphoprotein ; the most abundant non- collagenous protein in the dentine can
be linked to DI type II and DI type III (Barron et al., 2008).
http://doctorspiller.com/Tooth_Anatomy/tooth_anatomy.htm
Figure 1.2: Human odontoblasts in teeth

34
1.3.2 Composition, types and histology of the dentine
Dentinal matrix composition
Mature dentine is composed of 70% inorganic matrix material, 20% organic matrix
and 10 %water on a weight basis and about 45%, 33% and 22% on a volume basis
respectively (Nanci, 2008, Rauch and Glorieux, 2004). The inorganic matrix is
composed of hydroxyapatite, Ca10 (PO4)6 (OH) 2 which can be described as small
flattened plates each of 60 to 70nm in length, 20 to 30nm in width and 3 to 4nm in
thickness (Avery, 2002).
On the other hand, the organic matrix is composed of 90% of collagen. The most
abundant type of collagen found is type I with minor amounts of type III and V. The
basic structure of type I collagen consists of polypeptide chains of two α1 (I) chains
and one α 2(I) chain that coil together to form a triple helix (Rest and Garrone,
1991a). These collagens are staggered in an organised manner to form microfibrils.
About 10% of the organic matrix is composed of non-collagenous protein. The non-
collagenous protein is mainly made up of dentine phosphoprotein (DPP), dentine
sialoprotein (DSP), proteoglycan and other serum proteins.The non-collagenous
proteins are produced by odontoblasts and play a role in regulating mineral
deposition in dentine (Nanci, 2008). DPP and DSP are the most abundant non
collagenous proteins found in dentine. Both proteins are the product of the dentine
sialophosphoprotein (DSPP) molecule. DPP is the C- terminal proteolytic cleavage
product of DSPP while the DSP is the N-terminal proteolytic cleavage product (M.
MacDougall et al., 1997). DPP has been suggested to have a possible role in the
dentine mineralisation because its capability to bind to large amounts of calcium
(Milan A.M et al., 2006). However, the DSP function is still not clear. It was said that
the DSP, which is predominant in the peritubular area have the possibility to promote

35
the growth of hydroxyapatite crystals when bound to collagen fibrils in vitro as a role
in the matrix mineralization reaction (A. Boskey et al., 2000).
Proteoglycan is one of the non-collagenous proteins which containing a polypeptide
core that attached to one or more attached glycosaminoglycan (GAG) chain. It has a
few functional roles in the dentine matrix. The main involvement is maintaining and
stabilizing collagen fibres. Proteoglycan can be found abundantly in the predentine
area of the dentine.
Types of dentine
1) Primary dentine
Most part of dentine is composed of the primary dentine. It is the developmental
dentine that formed during the formation of teeth. The first layer that forms in the
primary dentine is the mantle dentine which can be found at the dentine-enamel
junction (DEJ). This region is less mineralised area which consists of the non-
collagenous proteins and collagen. The organic component is produced by the young
active odontoblasts which will disappear at more mature stage (Linde and Goldberg,
1993).
2) Secondary dentine
Secondary dentine is the subsequent dentine that formed once root formation has
occurred and as the teeth start to erupt in the mouth. The deposition of the dentine
continues at a slow rate. This occurs as the results of normal physiological factor.
This can be contribute by the stimuli from the tooth eruption and age factor (Avery,
2002). The secondary dentine has an uneven deposition of organic matrix and

36
irregular tubules. The changes of the deposition in secondary dentine is obviously
can be seen around the periphery of the pulp chamber (Nanci, 2008).
3) Tertiary dentine
The tertiary dentine is the dentine that deposited as the results of pathological stimuli.
Among the factors that can cause the reaction is attrition, caries, or dental
procedures. The undifferentiated cells in the pulp will differentiated and become
secondary odontoblasts. Tertiary dentin is irregular in structure and the reaction
localized to the affected dentinal tubules. The tertiary dentine may have the
continuous tubules with the secondary dentine, irregular arrangement of tubules or
no tubules at all (Mjör, 2009).
Histology of dentine
1) Dentine tubules
Dentine tubules are the cylindrical channels which extend through the entire
thickness from DEJ to the pulp. The diameter of the dentinal tubule is depend on the
age (young or old) and their location, approximately 2.5µm near the pulp, 1.2µm in
the midportion and 900nm near to the DEJ (Nanci, 2008). The tubules increased in
number from about 20,000 in the DEJ to above 50,000 per mm2 towards pulp,
respectively (Marshall et al., 1997b). The configuration of the dentinal tubules can be
seen in two curvatures which are the primary curvature that is in S shaped and the
secondary curvature which is wrinkled in texture. In the crown, the tubules follow the
slight curve shape or sometimes take on the S-shaped curvature from the DEJ to
dentine-predentine junction (Avery, 2002). The shapes of the tubules are almost
straight beneath the incisal edge, the cusps and at the dentine root surface. The
curvature shape is made up by the odontoblast during the formation of the dentine.
The feature of the tubules in the dentine is depending on the odontoblast process

37
that embeds into the extracellular matrix which involve during and after mineralisation
(Habelitz et al., 2007)The dentinal tubules are divided into a branching system. The
major branches more frequently found peripherally, the fine branches were numerous
in the root area and the microbranches extended in all part of the dentine (Mjör and
Nordahl, 1996).The dentinal tubules are occupied by the nerve fibers in association
with the odontoblastic process and the extracellular fluid (ECF). These components
are important to provide nutrients and giving the sensation of the tooth (Tidmarsh,
1981).
2) Peritubular dentine
The peritubular dentine which is also known as the intratubular dentine is the term
used to describe the area of dentine which surrounds the dentinal tubules. This area
extends about 1 to 2 μm. The amount of the peritubular dentin varies in location and
it is increased from about 3 vol% at the DEJ to at least 60 vol% close to the pulp
(Gotliv et al., 2006). Peritubular dentine is composed of hydroxyapatite integrated
with small amount of collagen fibre. It comprises less water and less organic material
than the intertubular dentine. At least 60 vol% of hydroxyapatite is present in
peritubular dentin (GW Marshall et al., 1997). In the dual secretion model suggested
Linde (1989), the peritubular dentine is hypothesised to be formed by non-
collagenous and glutamic-acid-rich proteins. This component plays an important role
as an inducer for mineralisation where they will induce the apatite nucleation. This
results in higher degree of mineralisation at the peritubular area (Linde, 1989). The
odontoblasts are dominantly involved in formation of collagen at early stage of
dentinogenesis and plays an important role in formation of non-collagenous protein
towards the end of crown formation which causing the peritubular area to be less
prominent in the root area (Steve et al., 1999).
38
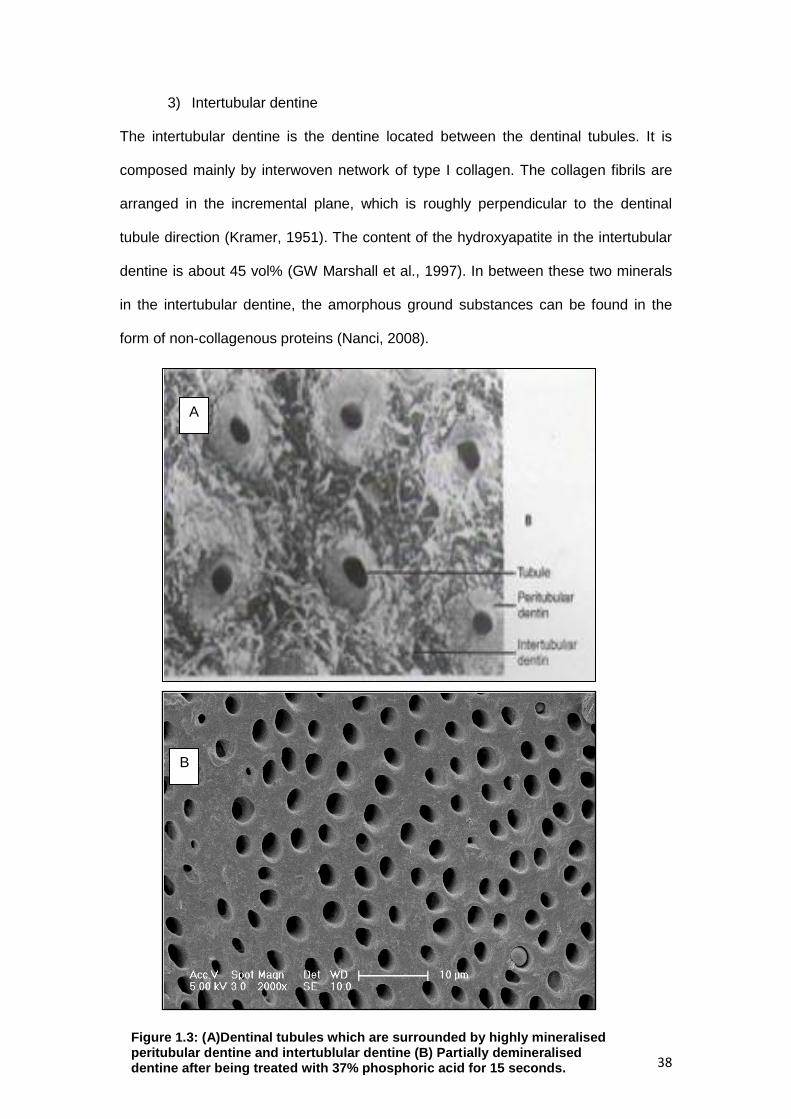
3) Intertubular dentine
The intertubular dentine is the dentine located between the dentinal tubules. It is
composed mainly by interwoven network of type I collagen. The collagen fibrils are
arranged in the incremental plane, which is roughly perpendicular to the dentinal
tubule direction (Kramer, 1951). The content of the hydroxyapatite in the intertubular
dentine is about 45 vol% (GW Marshall et al., 1997). In between these two minerals
in the intertubular dentine, the amorphous ground substances can be found in the
form of non-collagenous proteins (Nanci, 2008).
B
Figure 1.3: (A)Dentinal tubules which are surrounded by highly mineralised peritubular dentine and intertublular dentine (B) Partially demineralised dentine after being treated with 37% phosphoric acid for 15 seconds.
A

39
1.3.3 Dentine in primary teeth and permanent teeth
The primary dentine was reported to have substantial microstructural difference to
the permanent teeth. Primary dentine has been described to be smaller in size with
less thickness of dentinal surface from the dentinoenamel junction to the pulp. The
longitudinal ground section of permanent teeth show that the dentinal tubules follows
an ‘’S’’-shaped curve whilst most of the primary teeth exhibited straight course
dentinal tubules .This suggests that the ‘’S’’ shaped is the results of the crowding of
odontoblasts as they moves from the periphery towards the center of the pulp (Nanci,
2008). However, the primary teeth tubules follow a straight path as the result of less
crowding of the odontoblasts and significant thin dentine layer towards the pulp
(Chowdhary and Reddy, 2010 ).
The tubules diameter in the primary teeth appears to be greater compare to the
permanent teeth (Sumikawa et al., 1999). Analysis in the density of the tubules
reported that the number of density appears to be greater in primary teeth than
permanent. However, most of the study did not mention the exact location of
measurement whether in the middle layer of the dentine, outer layer or inner part of
the dentine (Sumikawa et al., 1999). In one of the study, the primary dentine has
been described to have lower tubular density at a distance of 0.4 to 0.5mm from the
pulpal surface when compared with permanent teeth (Koutsi V et al., 1994).
The dentine hardness in the circumpulpal and peripheral area in both primary and
permanent teeth are similar except for the central area of the dentine in the crown
and the root area. This is the related to the fact that this area in the permanent teeth
is more mineralised (Sumikawa et al., 1999). The concentration of the inorganic
mineral in the peritubular and intertubular dentine in primary teeth are lower than the
permanent teeth (Hirayama, 1990). A hardness property of the teeth is believed to be
related to the degree of mineralisation. The comparison hardness value in the central

40
dentine area was 60KHN (Knoop Hardness Number) in the primary teeth and
69KHN to 83KHN in the permanent teeth (Johnsen, 1988).
1.4 Dentinal collagen
The organic matrix of the dentine is composed of 90% of collagen. The most
abundant type of collagen found is type I with minor amounts of type III and V.
Compared to bone, the dentinal collagen is more interwoven with crossing fibrils
(Habelitz et al., 2002). The primary function of dentinal collagen is structural; it holds
the extracellular protein matrix together as a functional unit for mineralisation (Silver
et al., 2003). The extracellular matrix (ECM) is a complex network that occupies the
space between cells and is composed of different combinations of collagen and non-
collagenous protein like proteoglycans and other glycoproteins. Dentinal collagen
also provides nucleation sites that induce the nucleation of hydroxyapatite (Silver and
Landis, 2011).
1.4.1 Role of dentinal collagen in clinical dentistry
In dentine adhesive systems, dentinal collagen plays an important role to maintain
the bond strength and its durability. The efficiency of this bonding system depends
on the micromechanical retention promoted by resin infiltration in partially
demineralised dentin, that lead to the formation of the hybrid layer and tags (Pashley
et al., 1995). The hybrid layer was described by Nakabayshi as a layer that allow the
impregnation of the resin monomer into the intertubular collagen network and
dentinal tubules (Nakabayashi et al., 1982). This layer was formed as the results of
acid etching that is used to expose the collagen network by removal of the smear
layer on the dentine surface.

41
Several studies have been performed to establish an ideal protocol for adhesive
system (Nor et al., 1996, Hosoya et al., 2000, Pioch et al., 2003). In order to expose
the dentinal collagen, an ideal etching time is needed (Van Meerbeek et al., 1992).
When the tooth was treated in a longer time, the smear layer will be remove
completely and subsequently cause unnecessarily excessive demineralisation of the
intertubular and peritubular dentine (Perdigao and Lopes, 2001). The impact of this
will cause severe collapse of dentinal collagen and formation of thick hybrid layer
which increased the susceptibility to failure (Hashimoto et al., 2000). Therefore, the
preservation of the dentinal collagen structural integrity is very essential to ensure the
success of a restoration.
1.4.2 Ultrastructure studies on dentinal collagen
A number of studies had been reported to observe the dentinal collagen structure by
using electron microscopy (Lin et al., 1993, Perdigao et al., 1999). The used of AFM
has facilitate imaging and analysis of dentinal collagen. Gwinnett reported that
dehydrated collagen may cause dentinal collagen structure to collapse.This condition
can be avoided by maintaining the dentine surface under the wet-state (Gwinnett,
1994). In 1998, El, Feninat demonstrated the effect of etching time on dentinal
collagen. When there was an increased in etching time, the dentinal collagen
structure showed signs of damage; this was reflected by the showing an inability to
detect or observe any collagen fibrils (El Feninat et al., 1998). The study of dentinal
collagen in permanent teeth was further reported by Habelitz where the images of
collagens were achieved by using etching and controlled deproteinisation. A narrow
distribution of D-banding between 67 and 68nm were present in hydrated fibrils whilst
in dehydrated samples, the D-banding were divided into three groups which were
57nm, 62nm and 67nm (Habelitz et al., 2002). Besides imaging, the AFM also was
used for the study of mechanical changes of dentinal collagen on permanent teeth

42
particularly in D-banding area (Marshall et al., 1993, Balooch et al., 2008, Fawzy,
2010, Bertassoni et al., 2012). Yet, to date, little is known about the detail of
ultrastructure study of the dentinal collagen in primary teeth.
1.4.3 Collagen composition and ultrastructure
There are more than 20 genetically distinct type of collagen which can be found in
tissues and these can be divided into the fibril forming collagens (including types I, II,
III ) and non-fibril forming collagens ( including types IV, VIII, X). The majority of
collagens in vetebrates belong to the fibril forming collagen group, of which the most
common type of collagen found is Type I (Henkel and Glanville, 1982). Type I
collagen molecules can be found in the dentine, bone, skin, and tendon. This
collagen may produce a variety of fibril organisation with different ultrastructure
morphology (Kadler, 2007).The basic structure of type I collagen are polypeptide
chains of two α1 (I) chains and one α 2(I) chain that coil together to form triple helix
(Rest and Garrone, 1991b). Each collagen polypeptide has a large number of
repeating amino acid sequences, often follows the pattern Glycine-Proline-X or
Glycine-X- Hydroxyproline, where X may be any of various other amino acid
residues. For the three polypeptide chains to coil together into a triple helix, they
must have the smallest amino acid; glycine (Rest and Garrone, 1991b).
Figure 1.4: Three polypeptide chains that coiled together into a triple helix

43
Glycine gives flexibility to twist and form the triple helix structure where there is no
space for a larger amino acid. The side chain of glycine, an H atom linking the
peptide bond NH of a glycine residue with a peptide carboxy (C═O) group in an
adjacent polypeptide to form a helix. Its repetition at every third position on the
sequence allows close package of chains into helix structure. Any replacement of
amino acid at the fixed chain of this C – N peptidyl-proline or peptidyl-hydroxyproline
will inhibit triple helical formation (Kadler et al., 1996).
Figure 1.5: Chemical structure of collagen amino acid Glysine-Proline Hydroxyproline
The regular banding pattern in collagen fibril can be observed in transmission
electron microscopy (TEM) (Schmitt et al., 1942) and atomic force microscopy (AFM)
(Chernoff et al., 1992). The first two dimensional (2D) stacking model adapted by
Hodge and Petruska, observed five tropocollagen molecules which are staggered
together side by side with the offset distances (D banding) 67nm between two
neighbouring collagen molecules (Hodge and Petruska, 1963). The alignment and
periodicity shows a dark region known as a ‘gap’ and a light band region known as
‘overlap’. The overlap contains higher collagen molecules density than the gap
region.

44
Figure 1.6: A) Transmission electron microscopy (TEM) image of single fibrils with the 67 nm D-period visible. (B) Schematic representation of the two-dimensional axial arrangement of collagen molecules in a microfibril. Arrows show the gap regions. The D-period originates from the staggered aggregation of the collagen molecules in microfibrils (Hodge et al,1963)
In the overlap region, the collagen molecule regions are tightly packed. The model of
packing of the molecule microfibrils in three dimensional stacking was first introduced
by Smith (Smith, 1968.). In 1998, a model describing compressed microfibrils was
explained. The five molecules in a microfibril are tightly packed in the overlap region,
forming a crystalline structure while in the gap region; the molecular segments follow
an individual path. According to the model, the microfibrils are interconnected by
telopeptides that may explain the difficulty in isolating individual microfibrillar
structures (Wess et al., 1998).

45
Figure 1.7: Left, a 3D representation of the molecular arrangement of type I collage. Right, the cyclic set of the final model and the telopeptide directions (West et al, 1998)
Bozec et al further proposed a three dimensional stacking model of the collagen
fibrils. The modelling shows that the collagen fibrils forming a rope like structure.
According to the model, it appears that topological characteristics of the collagen fibril
are driven by the inherent and repetitive twist of the collagen molecule as well as the
interactions between the strands (Bozec et al., 2005).
Figure 1.8: Collagen gel from rat tail under atomic force microscopy (AFM) showing presence of clear fibrils arrangement with periodicity of gap and overlap zone, D-banding which indicated by the arrows

46
In teeth, collagen is synthesized by the odontoblasts and secreted into predentin,
where the collagen molecules are arranged into fibres (Leblond, 1989). The collagen
molecules are long, rod like structure with a diameter of ~ 1.5 nm and are
approximately 300nm in length. The collagenous network is less dense adjacent to
the odontoblast cell bodies but reaches its full density closer to the predentin/dentin
interface (Avery, 2002)
Dentinal collagen forms from procollagen (proprotein). The biosynthesis of dentinal
collagen is initiated within rough endoplasmic reticulum(ER). The dentinal collagen is
synthesized and subsequently controlled by the odontoblasts. The procollagen chain
consists of a short signal peptide; a central α chain segment and two terminal ends;
carboxy (C-terminal) and amino propeptides (N-terminal). The disulphide bond
between the C-terminal and N-terminal propeptide sequences align the chain to form
a triple helix. As the chains are synthesized, they are translocated into the lumen of
the ER, where postranslation modification occurs. The procollagen removes the C-
terminal and N-terminal propeptides and the chain is often called tropocollagen. In
the extracellular zone, the tropocollagens will assemble in a staggered to form
making a microfibril (Minor, 1980).
Three important post translational modifications of collagen seem to occur
extracellularly; removal of the N- and C- propeptides, mediated by specific
endopeptidases, and the oxidation of lysine residues by the enzyme lysyl oxidase.
This enzyme acts on lysines and hydroxylysines producing aldehyde groups, which
will eventually undergo covalent bonding between tropocollagen molecules and
staggering to form collagen fibrils (Minor, 1980). The dentinal collagens are stabilised
in fibrils by inter-covalent molecular cross-linking. The collagen crosslinking is
initiated with the conversion of specific lysine and hydroxylysine residues. The major
collagen cross-linking in dentine is derived from hydroxylysine-aldehyde (Hylald). The
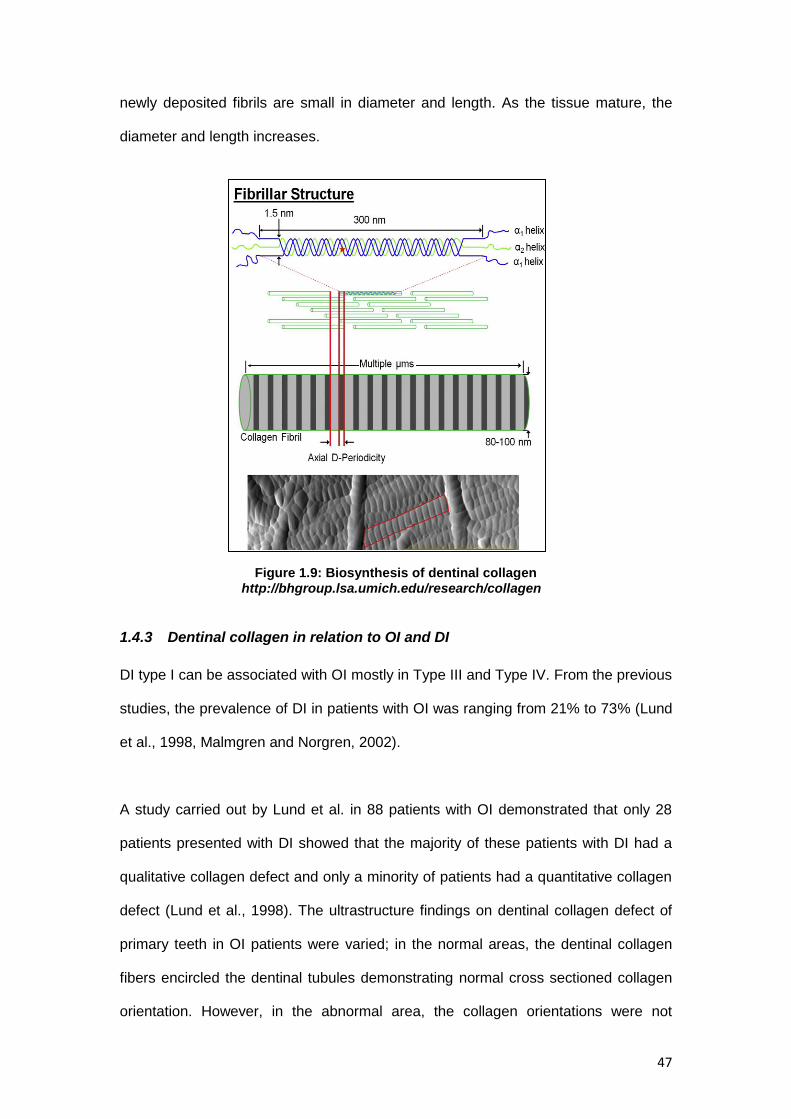
47
newly deposited fibrils are small in diameter and length. As the tissue mature, the
diameter and length increases.
Figure 1.9: Biosynthesis of dentinal collagen http://bhgroup.lsa.umich.edu/research/collagen
1.4.3 Dentinal collagen in relation to OI and DI
DI type I can be associated with OI mostly in Type III and Type IV. From the previous
studies, the prevalence of DI in patients with OI was ranging from 21% to 73% (Lund
et al., 1998, Malmgren and Norgren, 2002).
A study carried out by Lund et al. in 88 patients with OI demonstrated that only 28
patients presented with DI showed that the majority of these patients with DI had a
qualitative collagen defect and only a minority of patients had a quantitative collagen
defect (Lund et al., 1998). The ultrastructure findings on dentinal collagen defect of
primary teeth in OI patients were varied; in the normal areas, the dentinal collagen
fibers encircled the dentinal tubules demonstrating normal cross sectioned collagen
orientation. However, in the abnormal area, the collagen orientations were not

48
uniform; some collagen fibers were densely packed and some may appeared loose.
Most of the fibres in the loosly textured area can be divided in two groups with normal
diameter of 80-100nm or those with reduced diameter about 40nm (Waltimo et al.,
1996).
Dentinal collagen defect due to odontoblast dysfunction has also been theorized to
be the reason of histological changes in DI type I (Hall et al., 2002, Majorana et al.,
2010). Majorana carried out a study in sixteen children who were diagnosed with OI.
The findings showed that the orientation of the collagen was parallel to the long axis
when near to the dentinal tubules and randomly oriented when away from the tubules
(Majorana et al., 2010).
However, to date, the topological and characterisation of affected dentinal collagen
on DI associated with OI in both primary and permanent teeth has not been reported.
Further studies regarding the dentinal collagen topological and ultrastucture findings
in the dentinal collagen in DI type I are required. Therefore, with high resolution
electron microscopy, the dentine collagen structure and topography can be imaged to
obtain the information about the collagen fibrils in the affected dentine (DI type I) and
the reaction of the dentinal collagen towards chemical treatment. With better
understanding of the collagen structure in DI and OI, it is relevant to help in providing
the importance of structure- properties relationship of collagen fibrils in aspect of
selective disease and restorative treatment such as etching and bonding.

49
1.4.4 Overview of dentinal collagen and bone collagen in OI and DI
Reviews of a few studies in the previous literature were summarized as below:
Fibril diameter
Bone collagen in OI: Generally, in the normal human bone, the fibrils show uniform
diameter ranging from 100-300nm (Traub et al., 1994). The results of diameter of
bone collagen in OI were varied. There have been reports that generally the bone
collagen diameters were smaller due to failure of maturation of type I fibrils (Jones et
al., 1984). This was in agreement with Sarathchandra, who also demonstrated
significantly reduced diameters of bone collagen in OI (Sarathchandra et al., 1999).
However, there were also reports that showed that the diameter of type I collagen
were larger due to alteration of the primary structure of type I collagen (Cassella et
al., 1994).
Dentinal collagen in DI type I/ DI associated with OI: In 2002, Habelitz demonstrated
that the hydrated fibril diameters in human dentinal collagen were spread between
75nm to 105nm (Habelitz et al., 2002). For the dehydrated sample, the diameters
were ranged between 50nm and 100nm (Pashley, 1991, Perdigao et al., 1996).
Waltimo observed slightly reduced diameters of dentinal collagen in patient with mild
DI associated with OI (Waltimo et al., 1996). The normal fibril diameters were ranging
between 80-100nm whilst the reduced dentinal collagen fibrils diameter were about
40nm.
Fibril architectures
Bone collagen in OI : The lamellar structure in the bone can be divide into two
different architectures known as ‘plywood’ like structure ; ‘ classical plywood’ ;
collagen fibrils are parallel in each lamella and ‘twisted plywood’; fibrils are helical in
nature and continuously change their direction (Giraud-Guille, 1988). In OI bones,

50
Traub reported that there was a good normal lamellar bone structure even in severe
OI. However, in OI type III, there was an abnormal thin collagen in loose fibrous
regions described as ‘pseudo-fibrils’ that suggest structural defective features of
fibrils (Traub et al., 1994). The abnormal findings in OI type III were also reported by
Sarathchandra in which the collagen fibrils appeared unravelled in longitudinally
sectioned bundles with no periodicity and in transversely sectioned bundles they
were flower-like with some fused, composite fibrils. In some areas, the collagen fibre
bundles appeared twisted and loosely packed throughout a very thick osteoid
(Sarathchandra and Pope, 2005). In OI type I, the collagen fibres were organised
within thin osteoid lining (Sarathchandra et al., 2000).
Dentinal collagen in DI type I / DI associated with OI: The dentinal collagens were
arranged in interwoven arrangements with numerous crossing of fibrils (Kramer,
1951). The minerals in the dentine (hydroxyapatite) located in the gaps between
collagen molecles (intrafibrillar) or attached to the collagen fibrils (extrafibrillar). In
hydrated fibrils, the D-banding distance between 67and 68 nm was recorded
(Chernoff et al., 1992, Habelitz et al., 2002). In the DI type I patient, the dentinal
collagen defects were varied. In the TEM findings by Waltimo, the affected DI teeth
showed in loose texture area, there were variations of density and thickness of
collagen fibres; some were densely packed and some appeared loose. In the normal
area, the dentinal collagen fibers encircled the dentinal tubules, demonstrating the
normal cross section (Waltimo et al., 1996). In another ultrastructure findings of DI
type I, the collagen fibrils orientation were described to appear in random orientation
when away from the tubules (Majorana et al., 2010). Overall, the ultrastructure
findings on the dentinal collagen are still limited and further study will be required.

51
1.5 Experimental design in dentinal collagen studies
1.5.1 Atomic Force Microscopy (AFM)
AFM produces high-resolution, three dimensional images by scanning a sharp tip
over the sample surface with feedback mechanism that enables the tip to track the
sample surface in a controlled manner. The images are obtained by measuring
changes in magnitude of the tip position when dragged over the sample surface. A tip
is attached to the underside of a reflective cantilever which is mounted on a
cylindrical piezoelectric tube. A diode laser is focused onto the back of a reflective
cantilever. As the tip scans the sample surface, the deflection of the tip is measured
by the laser, reflected onto a photodiode. The photo detector measures the
difference in light intensities between the upper and lower photo detectors, and then
converts to voltage. Voltages applied to the X and Y electrodes on the piezoelectric
tube deflect the tube horizontally to produce a precise raster scan over the sample
surface. A voltage applied to the Z electrode on the piezo tube controls the vertical
height of tip. The information feedback through a software control from the computer,
enables the tip to maintain either a constant force or constant height above the
sample.
Figure 1.10: AFM detection method showing tip of cantilever approaching sample surfaces (http://www.freesbi.ch/en/illustration/figures)

52
AFM, which uses a sharp tip to probe the surface features by raster scanning, can
image the surface topography with extremely high magnifications, up to 1,000,000
times comparable or even better than electronic microscopes. The measurement of
an AFM is made in three dimensions, the horizontal X-Y plane and the vertical Z
dimension. AFM produces precise topographic images of a sample by scanning the
surface with a nanometer-scale probe (lateral resolution ~ 1 nm, vertical ~ 0.1 nm).
Examples of sample that can be imaged under AFM are polymers, biomolecules,
fibres, cells, minerals and ceramics. A unique advantage of AFM is that it enables
imaging with minimal sample preparation, in air or liquid environment.
In comparison, with other forms of microscopy, the AFM is better or comparable:
AFM versus Scanning Electron Microscopy (SEM): AFM provides
extraordinary topographic contrast, direct height measurements, without
complicated sample preparation being required (no coating is necessary).
AFM versus Transmission Electron Microscopy (TEM): Three dimensional
AFM images are obtained without expensive sample preparation and yield
more information than two dimensional profiles from TEM.
AFM can be operated in a few modes such as contact mode and tapping mode
depends on the application(Veeco, 2000);
1. The contact mode is common mode used on solid and static surfaces.
This mode was used extensively in this study. Basically, the cantilever is
constantly in contact with the sample during imaging whether at the
constant height mode where the height of the tip is fixed whereas the
cantilever deflection will generate data or at the constant force mode
where the deflection of the cantilever is fixed whereas the scanner
movement is recorded. When the tip of cantilever scans through uneven
surface, the deflection of the cantilever increased and the feedback

53
system will move the whole cantilever and adjusted back to original
position. This can minimized the scratching on the sample surface which
may happened when the cantilever deflects more as the tip scans over
bumpy surface areas. Advantages of the contact mode; the skills of
operating are simple and direct, can scan quite fast and easily. However,
there will be possibility to damage sample surface because the tip of
cantilever is constantly contact with the samples.
2. In the non contact mode, the probe does not touch the sample surface,
but oscillates above the surface during scanning. The vibrating tip is
brought near to the sample surface and induces a frequency shift in
resonant frequency. Surface topography can be measured by using the
feedback loop to monitor the amplitude of the cantilever oscillation. The
total force between the tip and the sample is very low which is suitable for
the soft dry samples. However, due to the oscillation measurement,
contamination layer on samples can have a great effect on the reading.
3. In the tapping mode (intermittent contact mode, AC mode, vibrating), the
cantilever does make contact with the sample surface but the tip oscillates
up and down (bounces up and down) very fast in short period during slow
lateral scanning. Data obtained by measuring the change in oscillation
amplitude detected by laser beam to photodiode. Advantages are; this
method is suitable for soft sample surface and the tip does no scratch the
samples. The operating mode is more intensive and the tip is more
expensive and scanning will need more time.

54
1.5.2 Raman spectroscopy
Raman spectroscopy is a light scattering technique that is based on the interaction
between photons of light which interact with a sample to produce scattered radiation
of different wavelengths. During this process, the laser will interact with a sample;
energy is exchanged between the photon and molecules such that the scattered
photon will have the same frequency / energy as the incident radiation or there is
energy exchanged between the photon during the collision. The difference in energy
is made up by a change in the rotational and vibrational energy of the molecule. The
scattering process without any change of frequency is called the Rayleigh scattering
whilst when there is a shift of frequency; is known as Raman scattering. Some
advantages of the Raman technique include little or no special sample preparation
needed, non-destructive sample, linear response to mineral/chemical concentrations
(Tsuda and Arends, 1997) and capable to identify distributions of organic and
inorganic compunds (Tsuda et al., 1993, Karan et al., 2009).
Various Raman spectra studies on mineral relevant to dental research were reported
(Tsuda et al., 1996, Wang et al., 2006). In dentin spectrum, the bands associated
with collagen occur at 1667 (amide I), 1273 (amide III), and 1240cm−1 (amide III)
whilst the bands associated with mineral occur at 1070 (carbonate)
and 961cm−1 (P—O) (Tsuda and Arends, 1997, Wang et al., 2006).

55
Table 1. 2: Raman spectra peak that relevant to dental research
These analyses are useful for chemical identification and quantification to investigate
chemical changes of mineral and organic content in the dentine
1.5.3 Scanning Electron Microscopy (SEM)
SEM uses a beam of highly energetic electrons to form an image at a micron scale.
The principle of field emission SEM instrument is based on the interaction of electron
beam and the atoms on the sample surfaces. The electrons that produce by the
electron gun (electron probe) will travel through an electromagnetic field and
secondary electrons will be emitted from the sample surface. The output signals from
the secondary electron detector are amplified and transferred to display unit. The
topography of the surface can be observed in two-dimensional scanning that will be
generated on screen.
Peak
Wavenumber cm̄ ¹
Amide I
1667
Amide III C-N
1273
Amide III N-H
1240
Carbonate
1070
Phosphate
960

56
In terms of sample preparation, the samples must have conductivity in principle. The
most typical method in preparing the sample for SEM imaging is coating the non-
conductive specimen with highly conductive thin metal film such as palladium or gold.
The reason for using a noble metal is that it is highly stable and it can produce a
quality images without any distortion.

57
1.6 Effect of demineralising agents
1.6.1 Effect of dentine etching
Compared to the highly complex hierarchical structure of bone, tooth dentine has a
rather simple microstructure, the mineralised collagen fibrils being oriented in a plane
perpendicular to the direction of dentine formation. It is believed that approximately
70 to 75% of the mineral may be extra-fibrillar. The apatite minerals have been found
to be needle-like near the pulp, but plate-like near the enamel (Lin et al., 1993,
Kinney et al., 2001).
It is important to realise that the action of acid on the dentine occurs mostly on the
mineralised component. Initial stages of dissolution involved a process of mineral
softening where the diffusion of acid solution into the structure results in loss of
calcium and phosphate ions (Eisenburger et al., 2004). The action of the acid also
reacts with the organic components of the dentine, contributing to changes in the
morphology of peritubular and intertubular dentine. It was known that after
demineralisation, the dentinal tubules opened and increased in diameter. The
collagen network resulting from the demineralisation protocol was left intact
(Nakabayashi and Pashley, 1998). A linear etching time with the depth of
demineralisation was reported by Marshall. When the time was increased, rapid
dissolution of the peritubular zone leaves widened dentinal tubules and collapse of
collagen was shown at intertubular area (Marshall et al., 1993). In 2004, Nakabayshi
reported that phosphoric acid partially solublizes the non collagenous
phosphoproteins, glycosaminoglucans and low molecular weight peptides including
collagen (Nakabayashi et al., 2004).This was supported by Spencer, i.e; suggested
that phosphoric acid could modify the organic components of the collagen molecule
(Sencer et al., 2001).

58
1.6.2 Effect of sodium hypochlorite
Sodium hypochlorite solutions are widely used in dental procedures especially in
endodontic treatment. Sodium hypochlorite (NaOCl) exhibits a dynamic balance as
shown below:
NaOCI + H₂O ↔ NaOH + HOCI ↔ Na⁺ + OH־ + H⁺ +OCI־
It have been believed that hypochlorous acid (HOCl) in sodium hypochlorite solution
acts as a solvent by forming chloramines (ion chlorine that combined with protein
amino group) which then lead to amino acid degradation (Estrela et al., 2002). Due to
their non- specific deproteinising action, the effects of sodium hypochlorite may affect
the mechanical properties of the dentine. Several studies have been reported on the
detrimental effect of NaOCI, which alter the modulus and hardness of the dentine
(Marshall et al., 2001, Sim et al., 2001, Correr et al., 2004). It also could affect the
resin penetration into the dentine structure and subsequently influence the quality of
restoration (Sim et al., 2001). The effect of NaOCI treatment has also been shown to
alter the organic substrate without changing the molecular content in the inorganic
material (O’Driscoll et al., 2002, Ramirez-Bommer et al., 2007, Morgan A et al.,
2010).
1.6.3 Effect of Ethylenediaminetetraacetic acid (EDTA)
EDTA is generally accepted as the most effective chelating agent at the neutral pH. It
is used to demineralise the smear layers, open the dentinal tubules, softening the
dentine and increased the dentine permeability (Calt and Serper, 2002, Hulsmann et
al., 2003). It was first introduced clinically in 1957 (Ostby, 1957).
The major factors that contribute to the properties of EDTA are the chelating
mechanism and protonation mechanisms. At neutral pH, the binding of calcium ions
to EDTA solution will increase the dissociation of hydroxyapatite. This will cause the

59
pH decrease as the results of EDTA’s proton (H ⁺) exchange with the calcium ions.
As the reaction proceeds, increased hydrogen ion as the results of the dissociation
will cause the protonation mechanism to prevail. This is because the chelating
mechanism may be limited by the availability of calcium ions (Cury et al., 1981).
Once the process reached the equilibrium between chelating mechanism and
protonation mechanism, EDTA was said to limit the amount of dissolves dentine
(Carvalho et al., 1996).
1.7 Aims of the study
The aim of this project was to characterise the morphology of the dentinal collagen
ultrastructure in affected OI and DI teeth using Atomic Force Microscopy (AFM).
Specific objectives were to:
1. establish the demineralisation techniques to reveal collagen ultrastructure in
permanent teeth
2. establish the demineralisation techniques to reveal collagen ultrastructure in
primary teeth
3. compare the topological of dentinal collagen ultrastructure of control teeth and
affected OI teeth under AFM

60
CHAPTER 2
MATERIAL AND METHODS

61
2.0 Materials and methods This chapter outlines the materials and methods that were used throughout this
project.
2.1 Development of the database
2.1.1 Study registration and ethical approval
This study was designed and conducted in the Department of Paediatric Dentistry,
Eastman Dental Hospital’s (EDH), University College London Hospital NHS
Foundation Trust. Ethical approval for this study was obtained from the National
Health Services Research Ethics Committee (NHS REC) registration reference
number 11/LO/0777. The lists of documents approved by the committee were;
1. participant consent form; Parent Consent Form
2. participant consent form; Patient Consent Form
3. participant consent form for the Phenodent database,
4. participant information sheet ; Main study ; Parent
5. participant information sheet ; Main study ; Patient
6. participant information sheets ; Colour spectroscopy ; Parent
7. participant information sheets ; Colour spectroscopy ; Patient
2.1.2 Sample selection
All patients referred to the Department with dental anomalies were allocated to the
dedicated dental anomalies clinics. Patients attending for dental appointments were
also invited to participate in this study. Inclusion criteria included:
Patients with DI and /or OI
Patient and parents with sufficient English to give informed consent to
participate in the study

62
2.1.3 Anomalies clinic and data collection
The dental anomalies clinics were held once a month. All clinicians involved in this
study underwent training and calibration sessions on how to use the forms and how
to obtain consent and the procedures required for data collection.
Any patients and parents who attended the clinic were informed about the study at
the beginning of the appointment. Information leaflets were provided (Appendix 1)
and the voluntary nature of their participation was reinforced. Once they agreed,
written consents were obtained (Appendix 2), one copy was given to the
patient/parent, another copy was filed in the patient’s notes and one copy was stored
by supervisor in a filing cabinet in a locked office.
All data information obtained from the patient was collected using a modified version
of the Phenodent form (Appendix 3). This form contained the demographic details of
the patient, extra oral examination findings, intra- oral examination including specific
information regarding the enamel and dentine defects, radiographic appearance,
diagnosis of the patient and treatment plan. The extra oral (profile view) and intra-oral
photograph (upper and lower arch) were taken after the completion of the dental
examination. All of the data obtained from the patient were transferred to an
electronic database under the control of the second supervisor. Patient’s details
remained anonymous using a coding number. At the end of the appointment, patients
were given a plastic container as a storage medium for any exfoliated teeth and
saliva was also collected as part of the study protocol.

63
2.2 Teeth samples
2.2.1 Teeth selection
Any primary or permanent teeth that were extracted as part of the patient’s treatment,
or had exfoliated and for whom consent had been obtained were included in this
study. Healthy teeth extracted for orthodontic purposes were included for control
samples.
2.2.2 Sample storage
Teeth were stored according to the protocols approved by the Human Tissue Act
2004 in Eastman Dental Institute, 256 Gray’s Inn Road, London. All samples were
thoroughly cleaned before storage. Remnants of the soft tissues that were attached
to the root surface of the sample were removed with the scalpel blade. Teeth were
then stored in 70% of ethanol at 4°C in locked refrigerator on the premises for 7
days. After this stage, the teeth were stored in Thymol 0.01% until prepared.
2.2.3 Preparation of teeth in epoxy resin
Teeth were placed in a vertical position and were embedded in an acrylic block using
an ultra-low shrinkage, dry-curing epoxy resin (Epofix, Electron Microscopy Sciences,
Fort Washington, PA). The blocks were left set for 24 hours at room temperature.
Bisecting the embedded samples using a rotary saw with twin-mounted, diamond-
tipped copper blades (Testbourne, UK) exposed the coronal dentine surface as well
as levelling the surface on the samples. The samples were sectioned again to
produce of 10mm thickness.
Polishing removed any scratches present on the dentine surfaces following cutting
and any superficial debris. The samples were polished using a polishing machine
under flowing water coolant (MD Fuga, MD Largo) according to a series of silicone-
carbide grit paper (500, 1200grade and 2400 grade).

64
The outer surfaces of the samples then were cut to produce 5x5x5mm size of dentine
blocks, leaving only the flat surface of the exposed dentine block. Finally, the
samples were cleaned in the ultrasonic bath for 30 seconds. Once ultrasonication
completed, the samples were left in plastic container filled with ultra high quality
(UHQ) water until imaging.

65
Figure 2.1: Sample preparation in epoxy resin
SAMPLE PREPARATION IN EPOXY RESIN

66
2.2.4 Preparation of teeth for histopathology sections From the sample, two primary and two permanent control teeth were immersed in
17% Ethylenediaminetetraacetic acid (EDTA) solution and were kept at room
temperature for 12 months. The EDTA was changed on weekly basis and the
samples were placed on the rocking plate in order to allow the maximum effect of the
EDTA solution.
After the storage period, the teeth were sent to the Pathology department, Queens
Mary Hospital, Barts and the Royal London NHS trust for histopathology sections.
The teeth were prepared into sections with the thickness of 5µm mounted on the
glass slide, and stained with Picrosirius red.
Picrosirius red staining was used because of the Sirius red, an elongated molecule
that contains strong cationic dye reacts with basic amino acid in the collagen
molecules. The reaction promotes an enhancement of normal birefringence due to
the fact that many dye molecules are attached to the collagen fibres in such way that
their long axes are parallel (Junqueira et al., 1979).
.

67
2.3 Experimental design for demineralisation study
This protocol aimed to assess the most suitable demineralisation technique to image
the collagen in the dentine of primary and permanent teeth.
2.3.1 List of solutions used in the demineralisation protocols:
1) 10 vol% citric acid
2) 6.5 vol% sodium hypochlorite
3) 17% EDTA
4) Commercial etchant (37% phosphoric acid)
2.3.2 Demineralisation using published protocol
The initial demineralisation protocol was set out to replicate a method previously
published (Habelitz et al., 2002).This protocol appears to be a valid method to
expose collagen in partially demineralised human dentine. The dentine blocks were
etched with 10%vol citric acid for 15 seconds. The purpose of etching was to dissolve
the mineral content in the dentine. Then, the blocks were cleaned under steady flow
of ultra high quality (UHQ) water before being treated with 6.5%vol sodium
hypochlorite (NaOCL) for 120 seconds. The sodium hypochlorite was used as a
deproteinising agent which removes the non-collagenous matrix proteins covering
the collagen fibrils (Marshall et al., 2001). Finally, ultrasonic treatments in UHQ water
for 10 seconds were used to clean the surface area.
2.3.3 Demineralisation of experimental protocol using commercial etchant
(37% phosphoric acid)
Dentine etching is a common technique used in dental treatment for providing a
better substrate for bonding to dental adhesives (Marshall et al., 1997a). In this
group, a commercial etchant was used as demineralisation agent. The main
component of the etchant was 37% phosphoric acid. Dentine blocks were treated

68
with the commercial etchant according to an assay of etching times. The assay was
developed using the following sequence; 1 minute, 3 minutes, 5 minutes and
onwards with the interval of 2 minutes of each exposure until the calcium phosphate
inorganic mineral were totally dissolved. For each defined times point of exposure,
Raman microspectroscopy measurements were carried out to measure the degree of
mineralisation of the dentine.
Assessment of etching time with Raman spectroscopy
In this study, the degree of the demineralisation of the dentine was determined using
Raman spectroscopy (HR 800, Jobin Yvon, Horiba, Japan) calibrated with known
lines of silicone. The spectrometer was operated with monochromatic radiation by
He-Ne laser with 633nm wave length at 20mW (Balooch et al., 2008). Spectra were
obtained under a focusing laser beam of 50x optical lens (Nikon) and all spectra were
offset from 500 and 1600 cm¹־. The sample dentine block was set on the glass slide
and immobilized with Blu-Tack® (Bostik S. A., Paris, France). Once all of the spectra
had been recorded, they were analysed using LabSpec5® Raman software (Jobin
Yvon, Horiba, France). All spectra were adjusted using polynomial baseline
correction and were arranged for direct visual comparison. All spectra were
normalised on the carbonate (CO2 -3) peaks (1072 cm¹־.) and at 8-point of spectral
smoothing. The peak maxima absorbance for the phosphate (1667 cm¹־) and amide
III (1243 cm¹־) were recorded. The data were then exported to Microsoft
Excel®(Microsoft Inc., Redmond, WA, USA) software. Data also have been analysed
using OriginLab® (OriginLab Corporation, Northampton, MA, USA) software.

69
Figure 2.2: Demineralisation technique sequence using commercial etching
2.3.4 Further steps in the experimental protocol with 6.5vol% of NaoCI
Once the whole demineralisation assay was completed, the dentine blocks were
rinsed with UHQ water and dried in air for 1 min. According to Marshall, the
dissolution of most of the mineral phase followed by gradual removal of the non-
collagenous matrix proteins, should expose the collagen. Sodium hypochlorite was
suggested, based on their deproteinising action (Marshall et al., 2001). Therefore, the
dentine blocks were then treated with 6.5%vol sodium hypochlorite. The samples
were immersed at time intervals of 20 seconds for up to 120 seconds total time.
Finally, the blocks were ultrasonicated in UHQ water for 10 seconds and were air
dried for 1 second. The prepared blocks were imaged using AFM.
Demineralisation with phosphoric acid (37%)
Demineralisation assay
0min, 1min, 3min, 5min,…
Raman Microspectroscopy
-to determine degree
of mineralisation

70
2.3.5 Comparing the demineralisation protocols with 17% EDTA
EDTA is a chelating agent with a neutral pH that removes the calcium ions of the
collagen dentin matrix more selectively and can be used to remove the smear layer
(Calt and Serper, 2002). In this study, two groups of samples were allocated to
assess the effects of demineralisation using 17% of EDTA at pH 7:
a) One permanent and one primary tooth were stored in 17% EDTA for 12
month at room temperature. Samples were prepared as described in section
2.2.3.
b) One permanent and one primary tooth were prepared in epoxy resin
(section 2.2.2) and the prepared samples were immersed in 17% EDTA for 10
minutes. Ultrasonic treatment in UHQ water were used to clean the surfaces
(Serper and Calt, 2002).
2.4 Topological assessment of demineralised dentine
2.4.1 Atomic Force Microscopy (AFM)
Collagen imaging was performed by using two type of AFM which were Dimension
3100 AFM (Bruker, Santa Barbara, CA) and XE-100 AFM (Park Instrument Korea)
shown in figure 2.3 and 2.4 respectively, as used in a previous study (Bozec et al.,
2005). Initially, excess water from the ultrasonic treatments was removed by gentle
blotting with absorbent paper, leaving the dentine surface visibly moist. Then, the
partially demineralised dentine blocks were mounted on a glass slide for AFM
imaging. Thin double sided tapes were placed on the bottom of the dentine blocks to
hold the sample securely on the glass slide. For imaging purpose, silicone nitride
(Si3N4) tips with a spring constant of 0.6N.m-1 were used (μMasch, Talinn, Estonia).
Typically scan rates up to 2.5Hz were employed. The integral and proportional gains
were adjusted accordingly to keep the height and the deflection of the cantilever

71
feedback nearly constant. The deflection set point used was optimised to minimise
the contact force and typical set up at 2nN. Images were scanned up to area of 50
µm² at a resolution of 512 x 512 pixels with a typical Z-servo gain of 1.5 (XE-100
AFM (Park Instrument Korea). Topography images were recorded and analysed
using Nanoscope Analysis Software (Version v140r1). All images were subjected to a
standard image processing technique. This process involved plane flattening and
optimization of the images contrast and brightness (Habelitz et al., 2002).
Measuring D-banding distance
The collagen fibril D-banding distances were measured from the profile of the fibrils
in modified images. Analysis was made by determining the step height of individual
fibrils. The length of the sections were recorded and divided by the number of bands
present as shown in section 3.2.4 (b)
Figure 2.3: XE-100 AFM (Park Instrument Korea)

72
Figure 2.4: Dimension 3100 AFM (Veeco, Santa Barbara, CA)
2.4.2 Scanning Electron Microscopy (SEM)
High resolution SEM images were employed for the histopathology sections. The
Philips XL30 Field Emission SEM was used for imaging at 20 kV. The histopathology
slides were cut into small square sections. The sectioned samples were sputter-
coated with gold-pallidium (Au(95%) / Pd (5%) prior to visualisation. The prepared
samples should be mounted on the stubs. The SEM employed 5 kV for imaging and
the magnification used were between 2000x – 15000x.

73
Collection of documented
teeth
Group I -prepared in epoxy
resin
Group II -prepared in epoxy
resin
Group III -stored in 17% EDTA
for 12 month
10 vol% of citric acid 15s and 120s of 6.5
vol% of sodium hypochlorite
37 vol% of phosphoric acid (commercial
etchant) - an assay of etching
time
An assay of etching times
Raman microspectroscopy at each of etching
time
Treated with 6.5 vol% of
sodium hypochlorite at time interval 20s
AFM imaging
Samples prepared in histopathology
sections
SEM/AFM imaging
AFM imaging at each interval times
Group IV -prepared in epoxy
resin
17% EDTA for 10 minutes
SEM/AFM imaging
The sequence for collection, preparation and imaging of four experimental groups is
shown in the following figure 2.5.
Figure 2.5: Experimental design for demineralisation studies

74
CHAPTER 3
EVALUATION OF DEMINERALISATION
PROTOCOLS FOR PERMANENT TEETH

75
3.0 Evaluation of demineralisation protocols for permanent
teeth
3.1 Introduction
Dentine has been characterised as a biological composite consisting of tubules, a
highly mineralised zone of peritubular dentine and the intertubular dentine (Ten Cate,
1994). The mineral component in the dentine is exclusively hydroxyapatite. The
mineral in the dentine occupies in two sites within the collagen scaffold; intrabrillar
(inside the gap between the collagen fibril) and extrafibrillar ( attached to collagen
fibrils) (Lees et al., 1997, Wassen et al., 2000). The shapes of the mineral crystallites
were reported to look like a needle when near to the pulp; and changes to a plate-like
appearance nearer to the enamel (LeGeros, 1991, Kinney et al., 2001). The dense
matrix of collagen fibrils lies in the intertubular dentine located in between the
dentinal tubules. The collagen is associated with non collagenous proteins such as
DPP, DSP, glysaminoglycans and proteoglycan that cover the collagen fibril and are
reinforced by the incorporation of hydroxyapatite.
The concept of dentine demineralisation has been introduced in bonding systems
(Pashley, 1992, Van Meerbeek et al., 1999). The purpose of the procedure were to ;
1) eliminate the smear layer that contains large quantity of organic and inorganic
substances and create micropores on the enamel and dentine surface ,2) uncover
the collagen and expose the dentinal tubules so that resin can infiltrate and form a
hybrid layer (Nakabayashi et al., 1991).During dentine etching, the demineralisation
process dissolved the inorganic content at certain depths and caused morphological
changes on the dentine surface (Marshall et al., 1993). After the removal of the
inorganic content, the dentinal collagen becomes destabilized and exposed to
enzymatic degradation. Some studies have reported that dentine demineralisation
results in shrinkage of the dentine structure due to collapse of the collagen matrix

76
(Garberoglio and Brannstrom, 1976a). Another study reported that the intrafibrillar
minerals act to stabilize the dentinal collagen and protect it from the extracellular
fluids (Balooch et al., 2008).
Published studies that have suggested dentine demineralisation protocols have been
mainly in collagen network research (Marshall et al., 1993, El Feninat et al., 2001,
Habelitz et al., 2001, Ma et al., 2009, Fawzy, 2010). These protocols induce
important changes including exposing the collagen matrix and even alteration of the
collagen structure and properties (Nakabayashi et al., 1982, Balooch et al.,
2008).The quality of demineralisation depends on the demineralising agents used,
demineralisation time, the composition of the dentine surface and sometimes
depends on the acid concentrations (Garberoglio and Brannstrom, 1976a, Van
Meerbeek et al., 1999). Common demineralisation agents used include citric acid,
maleic acid, phosphoric acid, nitric acid and EDTA.
In this chapter, assessment for the demineralisation protocols on the control
permanent teeth were carried out; to determine which protocol exposed the dentinal
collagen without inducing any changes or minimal changes in the morphology of the
collagen fibrils. Images of collagen fibrils of a rat tails were used as a form of
baseline image. Selective demineralisation protocols were used in order to reveal the
collagen networks that are shielded by inorganic and non collagenous proteins in the
dentine.

77
3.2 Materials and methods
The sequence for collection, preparation and imaging of four experimental groups in
control permanent teeth are shown in the figure 3.1. Total of six control permanent
teeth were involved in the chapter.
3.2.1 Demineralisation using published protocols
In this demineralisation study, two control permanent teeth were embedded in epoxy
resin as described in section 2.2.3. Then, the prepared teeth were treated based on
replicated protocols from the published study described in section 2.3.2 (Habelitz et
al., 2002).
3.2.2 Demineralisation of experimental group using commercial etchant
The purpose of this protocol was to investigate the reaction of teeth using
commercial etchant that have been used in our clinical setting. Two control
permanent teeth were embedded in epoxy resin as described in section 2.2.3. The
prepared samples were etched using the method in 2.3.3 and images were recorded
using AFM. To relate our findings to the chemical composition of the dentine, Raman
spectroscopy was recorded at every etching time. Then, the samples were treated
using 6.5 vol% NaOCI as mentioned in section 2.3.4 and images were recorded by
using AFM.
3.2.3 Demineralisation using 17% EDTA for 12 months
One control permanent tooth was stored in 17% EDTA followed the protocol in
section 2.3.5 (a), after which the tooth were prepared for histopathology section as
described in section 2.2.4. Images were recorded by using light microscope and
SEM.

78
3.2.4 Demineralisation using 17% EDTA for 10 minutes
One control permanent tooth was embedded in epoxy resin as described in section
2.2.3. The prepared sample was treated with 17% EDTA for 10 minutes and images
were recorded using SEM.
The sequence for collection, preparation and imaging of four experimental groups for
control permanent teeth is shown in the following figure 3.1.
Figure 3.1: Experimental groups for control permanent teeth

79
3.3 Results
3.3.1 Demineralisation using published protocols
The results of replicated protocols from the published study as mentioned in 3.2.1
were demonstrated in Figure 3.2. The purpose of this protocol was to evaluate the
published methods that proved to enable in situ imaging of dentinal collagen.
Figure 3.2: Contact mode AFM images of occlusal section of permanent human dentine. Pictures showing polished samples after partially demineralised by 10vol% of citric acid for 15 s, and subsequently treated with 6.5 vol% of sodium hypochlorite for 120 s. (a) polished samples at 20µm, increased diameter of dentinal tubules( indicated in circle) (b) at 5µm Presence of D-banding (arrows) at lower scan size. Images were obtained using Dimension 3100 AFM (Veeco, Santa Barbara, CA).
In this protocol, contact mode images at different scan size were obtained. At 20 µm,
dissolved peritubular dentine after demineralisation and deproteinisation treatments
can be seen. The diameters of dentinal tubules were increased due to recession of
the peritubular dentine (indicated in circle). At lower scan size, we suggested that the
fibrils can only be seen in certain areas (indicated by arrows). The images contrasts
were not strong enough to reveal the clear collagen fibrils. The aim to expose the
collagen network as mentioned in the published data was not fully achieved.
C
20µm
5 µm
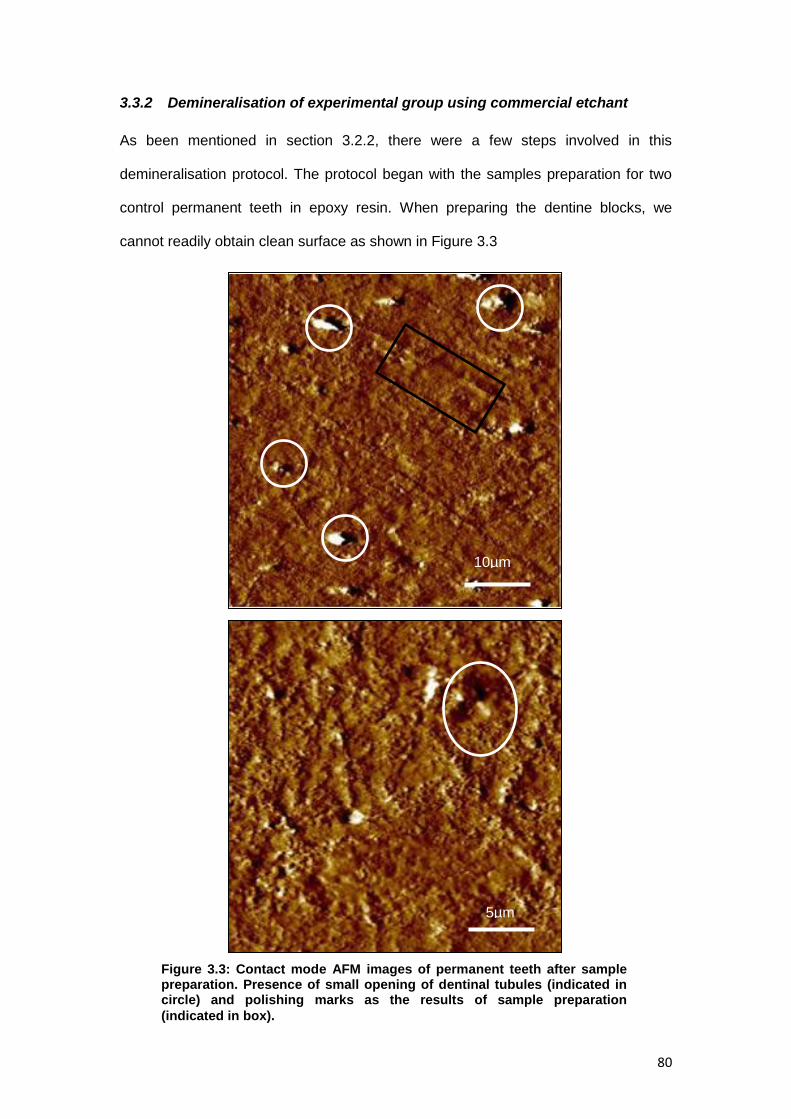
80
3.3.2 Demineralisation of experimental group using commercial etchant
As been mentioned in section 3.2.2, there were a few steps involved in this
demineralisation protocol. The protocol began with the samples preparation for two
control permanent teeth in epoxy resin. When preparing the dentine blocks, we
cannot readily obtain clean surface as shown in Figure 3.3
Figure 3.3: Contact mode AFM images of permanent teeth after sample preparation. Presence of small opening of dentinal tubules (indicated in circle) and polishing marks as the results of sample preparation
(indicated in box).
10µm
5µm

81
During sample preparation, smear layers that contain inorganic and organic
substances were produced and as a result it was not possible to identify the collagen
fibrils. To relate our structural findings to the chemical composition of the dentine,
baseline Raman spectra of the permanent dentine was recorded as shown in figure
3.4.
Figure 3.4 : Raman spectra of permanent teeth with phosphate, carbonate and amide III
peak
Figure 3.4: Raman spectra of permanent teeth with phosphate, carbonate and amide III
peak
The spectra were normalized against the carbonate peak (CO2
3-) at 1072 cm-1 which
is considered a stable hydroxyapatite (Ca10(PO4)6(OH)2) spectrum. For clarity and
ease of interpretation, the x-axis has been rescaled to show only wavenumbers from
500 cm-1 to 1500 cm-1 and two main characteristic peaks; phosphate (PO43-) at 960
cm-1 and amide III at 1240 cm-1 were identified.
0
200
400
600
800
1000
1200
1400
1600
500 700 900 1100 1300 1500Wavenumber cmˉ¹
Inte
nsi
ty
Amide III
Phosphate peak
Carbonate peak

82
Based on the protocol in section 3.2.2, once samples were embedded in epoxy resin,
the clinical application of commercial etching that contains 37% phosphoric acid was
undertaken. The effects of different etching time were obtained using Raman
spectroscopy. At a different etching time, the effects of the Raman spectral would be
expected to show a significant different at both peaks; phosphate band (PO43) at 960
cm-1 and amide III band at 1240 cm-1
Figure 3.5: Schematic raman spectra at different times of demineralisation with acid
phosphoric 37% on permanent teeth
The ratio of phosphate band to amide III was shown in Figure 3.6 to determine
significant changes of minerals during demineralisation. As stated by Kinney et al,
during demineralisation about 70-75% of minerals were removed rapidly while the
remaining minerals were removed at lower rate (Kinney et al., 1995) This observation
potentially explained that at certain particular time, we can observe significant
changes of minerals in the dentine. Although etching can be a method to reveal the
dentinal collagen, it also can interfere with the original features of the collagen (El
Feninat et al., 2001) In a condition where the sample surface was over etched, the
Phosphate peak
Amide III

83
Ratio of Phosphate to Amide III
0
5
10
15
20
25
30
0 1 2 3 4 5 6 7 8 9 10 11 12 13
Time(min)
Rati
o
ph
osp
hate
/am
ide I
II
collagen fibrils were totally lost or altered their shape and distribution. Therefore, an
appropriate time was needed to avoid the denaturating of collagen fibrils.
Ratio of Phosphate band / Amide III band
As mentioned in Figure 3.5, a band can be observed in the Raman spectra at
1240cm ̄ 1, which relates to amide III (N-H). The band was weak in Raman spectra
and was not been observed previously because of the overlapping of the spectra. In
order to assess the efficiency of the demineralisation protocol, it was decided to take
the ratio of the Phosphate band (which should decrease in intensity as a function of
the demineralisation time) to the Amide III band (which is related to the presence of
collagen in the dentine and should not vary unless the demineralisation agent start
denaturing the collagen). The ratio between intensity of phosphate peak at 960 cm−1
and the amide III peak at 1240cm ̄ 1 were compared and result was shown in figure
3.6.
Figure 3.6 : Graph showing the ratio data of phosphate peak and amide III
Figure 3.6 shows the ratio of phosphate band intensity to amide III intensity. From the
graph, it shows that the intensity of the phosphate band decreased with time. After 5
minutes, the intensity of phosphate band to amide III was not consistent. It can be
hypothesised that after 5 minutes, changes in dissolution of phosphate minerals in
hydroxyapatite in the dentine became unchanged.

84
For each demineralisation treatment with commercial etchant on control permanent
teeth, Raman spectra were obtained and were followed by observation of topological
surfaces by using AFM. The purpose of imaging at each demineralisation time was to
observe the morphology changes on the dentinal surface of control permanent teeth.
Figure 3.7: Contact mode AFM images of demineralisation sequences in commercial etchant (37% phosphoric acid) of control permanent teeth. An assay of etching times starting from Figure (A) demineralisation at 1 min, (B) 3min and (C) 5 min. Changes of dentinal surface where the granulated particle (smear plugs) became more obvious and rounded (indicated by circle)
B) 3 min
C) 5 min
50µm 10µm
10µm 50µm
10µm 50µm
A) 1 min

85
The images shows a series of two different scan sizes which were 50x50 µm and
10x10 µm of control permanent teeth after treated by commercial etchant (37%
phosphoric acid). The teeth were exposed according to an assay of etching time:
Figure (A) shows the microstructure of the dentine after acid treatment for 1 minute.
The granulated particles (smear plugs) became more obvious. Some opening of the
dentinal tubules can be seen which suggest partial removal of smear layer and
smear plugs. Figure (B), demonstrates the dentinal tubules opening that became
clearer with removal of smear layer and in Figure (C), massive particles of smear
layer that covered the intertubular dentine can be clearly distinguished. The particle
became rounded. These features suggested that the dentine surface reacted
towards the commercial etchant which caused topological changes on the surface.
However, no presence of collagen can be seen at this stage.
Further experimental protocol with 6.5 vol% NaOCI Further step in the experimental group with commercial etchant was continued with
deproteinisation protocol as described in section 2.3.4. The partially demineralised
control permanent teeth were treated with 6.5vol% NaOCI at different time with
intervals of 20seconds in each sequence. For each interval, topological surfaces of
control permanent teeth were imaged by using AFM.
Initial image of the treatment was compared to the image when collagen network
became visible was shown in figure 3.8. At 20 seconds exposure to 6.5 vol% NaOCI,
the surface was covered with dispersive particles. When the time was increased to
100 seconds, the topology of the dentine surface showed significant changes
whereby the interwoven collagen network became visible.

86
Figure 3.8: AFM images of demineralised dentine surface in 37% phosphoric acid at 5 minutes with deproteinisation treatment in 6.5 vol% sodium hypochlorite. Topological surface at intervals of 20 seconds (above picture) and 100 seconds (below picture)

87
Samples treated with NaOCI for 100 seconds were observed at lower scan size. The
generalized appearance of interwoven area of collagen fibrils at 10µm (indicated in
circle in figure 3.7) was hypothesised to allow clear pattern of D-banding distance at
lower scan size.
Figure 3.9: Contact mode XE-100 Park AFM images of permanent human dentine after partial demineralisation by 37%phosphoric acid for 5 minutes and subsequently treated with 6.5 vol% NaOCI for 100 seconds. Collagen fibrils were revealed.
5µm
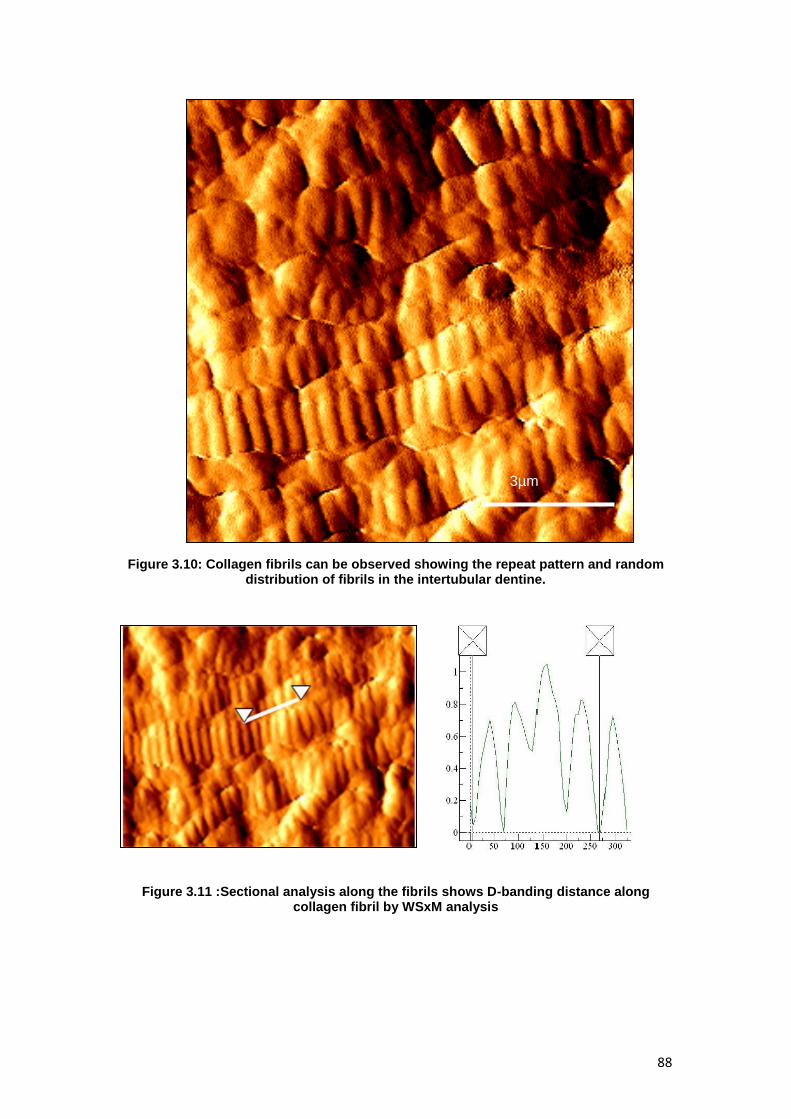
88
Figure 3.10: Collagen fibrils can be observed showing the repeat pattern and random
distribution of fibrils in the intertubular dentine.
Figure 3.11 :Sectional analysis along the fibrils shows D-banding distance along collagen fibril by WSxM analysis
3µm

89
Figure 3.9 and 3.10 shows dentinal collagen topography at lower scan size. The
images showed the repeat pattern and random distribution of collagen fibrils. This is
a novel result that shows the topographic profile of collagen fibrils were able to be
viewed under AFM by using commercial etchant (37% phosphoric acid) at 5 minutes
and controlled deproteinisation agent, 6.5vol% NaOCI for 100 seconds. With clear
and descent collagen images, the D-banding distance can be measured.
Figure 3.11, shows the measurement of D-banding distance of control permanent
teeth at one collagen fibril (indicated by arrow) that can be determined at 65.03nm.
Further analysis about the distribution of D-banding distance in control permanent
teeth will be needed for comparison purpose to permanent teeth of DI type I.
3.3.3 Demineralisation using 17% EDTA for 12 months
In this group, the effect of 17% EDTA on one control permanent tooth was evaluated.
The tooth was stored in 17%EDTA for 12 months and was prepared into
histopathology section, followed the protocol described in section 3.2.3. The section
was viewed under light microscope before SEM images were taken.
Light microscopy for control histopathology section The image obtained using light microscope revealed the demineralised layer, stained
red. The results demonstrated a uniform and organised pattern of dentinal tubules
with network of extracellular matrix in between the tubules as shown in figure 3.11.

90
Figure 3.12: Picrosirius red stained histopathology cross- section of permanent teeth after been stored in 17% EDTA for 12 months. The bright red field manifested in between dentinal tubules (white rounded area).
Imaging control histopathology section using SEM In order to obtained images from the SEM, histopathology section was prepared
using protocol in section 2.42. Images were recorded in two scan sizes; 10µm at
2500x magnification and 2µm at 15000x magnification
A
X 20 000

91
Figure 3.13: Experimental procedure of permanent teeth stored in 17% EDTA for 12 month (A) Enlargement of dentinel tubule openings with sign of erosion of peritubular and intertubular dentine. Projection of odontoblastic process can be seen in certain dentinal tubules openings. (B) Higher magnification of this specimen at intertubular dentine showing localised collagen scaffold that surrounded by irregular variation structure which scattered almost at all areas.
In order to investigate the effects of prolonged application of EDTA, the control
permanent tooth was stored in 17% EDTA (pH 7) for 12 months. The histopathology
section of the control permanent tooth demonstrated excessive erosive effect of
intertubular and peritubular dentine that leads to the enlargement of dentinal tubule
openings. The intertubular dentine almost completely disappears between the
tubules as the result of longer demineralisation effect. At lower scan size, the
sporadic pattern of collagen scaffold at the intertubular areas can be observed.
However, most of the region was covered with irregular surfaces which may be due
to the results of denaturation.
B

92
3.3.4 Demineralisation using 17% EDTA for 10 minutes
In this group, one of the control permanent tooth was prepared in epoxy resin as
described in 2.2.3. Then, the prepared sample was treated with 17% EDTA for 10
minutes and imaging were obtained using SEM
A

93
.
Figure 3.14: Effect of 17% EDTA for 10 minutes on the dentinal surface of control permanent tooth (A)The smear layer was almost completely removed and overall the tubule openings were clearly visible (B) At higher magnification, no presence of collagen can be noted in the intertubular area, however the collagen fibrils arragement begin to appear at the peritubular area.
SEM observation shows that the smear layer was almost completely removed and
the dentinal tubule openings were clearly visible. There were slight increased in the
dentinal tubules opening observed surrounding the tubules. At 2µm, collagen scaffold
begins to appear at the peritubular areas however at the intertubular areas, no
defined collagen fibrils can be detected. In this area, it was hypothesised that the
area may not be demineralised yet.
B

94
3.4 Discussion
3.4.1 Demineralisation using published protocols
The combined techniques of demineralisation (10 vol% citric acid) and controlled
deproteinisation (6.5 vol% sodium hypochlorite) of dentine has been reported to
enable imaging of dentinal collagen under AFM. The suggestion that dissolution of
most mineral with demineralisation protocol followed by gradually removal of non-
collagenous proteins with deproteinisation procedure allowed in situ study of dentinal
collagen (Habelitz et al., 2002). The same approach was repeated in this chapter
and results proved the presence of collagen scaffold under contact mode AFM. The
image qualities shown in section 3.2 were of poor contrast. These findings showed
that the collagen fibrils only can be viewed at certain areas with some of the fibrils
demonstrated irregular appearance. It was assumed that the collagen may go
through changes as the results of the non specific effect of the sodium hypochlorite
agent.
3.4.2 Demineralisation of experimental group using commercial etchant
Smear layers were created as the results of cutting during sample preparation steps.
This layer contains tenacious debris with organic and inorganic substances (Pashley,
1992). During the sample preparation in epoxy resin, I cannot readily obtain a clean
surface because the exposed mineralised dentine surfaces were covered by the
smear layer. This was shown in the findings in section 3.3. Therefore, in this study,
the smear layer must be removed.
As part of restorative procedures, chemical treatment by acid etching was introduced
to remove and dissolved the smear layer allowing exposure of partially demineralised
dentine (Nakabayashi et al., 1991, Pashley, 1992). To date, the etching methods
have been extensively used in restorative dental treatment. Etching with 30-40%
95
orthophosphoric acid has commonly been used in the modern adhesive restoration
(Meerbeek et al, 2000). The use of phosphoric acid in clinics was well documented
(Nakabayashi and Pashley, 1998, Sasaki et al., 2008).
In this study, demineralisation protocol using a commercial etchant gel (37%
phosphoric acid) that commonly used in our clinical setting was investigated. The
conventional method reported that 15 seconds application of 37% phosphoric acid to
etch the enamel was required in order to provide a better substrate for bonding to
dental adhesives (Buonocore, 1955). In routine studies of etched dentine, it was
necessary to remove the smear layers completely so that the collagen fibrils network
can be exposed. The first step of this experiment mirrored the published protocol in
which the ultrastructure collagen network on demineralised dentine can be observed
at 60 seconds of etching time in phosphoric acid (Ma et al, 2009). The results were
inconclusive as dispersive particles (smear layer and smear plugs) still can be
observed on the dentine surface at similar etching time. This may be affected by the
viscosity of the phosphoric acid, in which gel solution provide less etching effects
than liquid solution and did require longer application time ( Pashley et al, 1992)
The ratio of phosphate band to amide III was shown in Figure 3.6 to determine
significant changes of minerals during demineralisation. As stated by Kinney et al,
during demineralisation about 70-75% of minerals were removed rapidly while the
remaining minerals were removed at lower rate (Kinney et al., 1995). This
observation potentially explained that at certain particular time, we can observe
significant changes of minerals in the dentine. Although etching can be a method to
reveal the dentinal collagen, it also can interfere with the original features of the
collagen (El Feninat et al., 2001). In a condition where the sample surface was over
etched, the collagen fibrils were totally lost or altered their shape and distribution.

96
Therefore, an appropriate time was needed to avoid the denaturating of collagen
fibrils.
Further experimental protocol with 6.5 vol% NaOCI
The body of this chapter has shown that etching alone would not completely expose
the dentinal collagen. This was supported by the results in Figure 3.7 that
demonstrated the presence of smear layers and smear plugs after treatment using
commercial etchant (37% phosphoric acid) for 5 minutes. No collagen fibrils can be
observed. Attempted to track the collagen fibrils in varies of location on the samples
were carried out but no defined collagen images can be obtained throughout the
experiment. This study confirms the previous speculation that the application of acid
treatment would only dissolves the minerals in the dentine while non-collagenous
proteins appear remain associated with the collagen network which hindered the
imaging of collagen fibrils by AFM (Habelitz et al , 2003). As there have been
difficulties of imaging the collagen fibrils, deprotienisation technique was suggested
to facilitate immediate AFM imaging. In contrast, Bertasssoni et al suggested no
further enzymatic treatments of the dentine substrate were required in order to reveal
the collagen fibrils. Yet, they failed to reproduce the physiological conditions of the
dentine as the results of dry specimens in the study (Bertassoni et al., 2012).
The method of deproteinisation provides guidance for the further experiment on
demineralised samples in 37% phosphoric acid for 5 minutes. The concept of using
NaOCI after etching leads to removal of non collagenous proteins in extracellular
matrix. The initial etching treatment showed enlarged dentinal tubules as the results
of recession of peritubular dentine. This can be observed in Figure 3.7. However,
acid treatment alone would not completely open the tubules since they remained filed
with the proteins. On the other hand, deprotenisation alone does not open the

97
dentinal tubules since minerals closely integrated with the proteins. Having to said,
the etching serves a precondition area to the NaOCI treatment which allows
exposure of the collagen after the removal of non collagenous proteins (Toledano et
al., 1999, Marshall et al., 2001, Fawzy, 2010). My observation showed that at time
interval between 80 seconds and 100 seconds in 6.5 vol% NaOCI, the fibrous
collagen network can be revealed using AFM. The organisations of the collagen
scaffold were randomly distributed and interlocking with each other. At lower scan
size, the fibrils D-banding distance can be observed clearly. This observation may
allow further study in characterising the topographic and subsequently assessing the
mechanical properties of the collagen fibrils. However, uncontrolled deproteinisation
led to total removal of collagen fibrils, leaving a ‘moth eaten’ appearance of dentine.
This was supported by Habelitz et al when similar images occured during bleaching
as the time increased to 240 seconds (Habelitz et al., 2002). In addition, previous
studies reported that mechanical properties such as hardness (Oliveira et al., 2007)
strength and elasticity of the dentine (Sim et al., 2001, Marending et al., 2007) were
significantly reduced with the used of the NaOCI. In view of this, further follow up
studies may take into account to measure the mechanical properties of the collagen
fibrils revealed by these protocols.
3.4.3 Demineralisation using 17% EDTA for 12 months
Another demineralising agent that has been used in the clinic is
Ethylenediaminetetraacetic acid (EDTA). It was first introduced clinically in 1957.
(Ostby, 1957). The purpose of EDTA demineralisation protocols was to compare the
effect of 17% EDTA (pH7) with respect to the duration of application. In this
experimental study, the control permanent tooth was stored in EDTA for 12 months.
It was hypothesised that with the changing of EDTA in weekly basis, the binding of
calcium will continue till all the calcium ions completely attached to the EDTA. The
chelating action of EDTA will bound the non collagneous proteins together as these

98
proteins intimately integrated with the hydroxyapatite. Based on this experimental
study, the tooth was prepared for histopathology sections as the results of softening
effect on the dentinal surface by EDTA activity. The findings proved the presence of
sporadic collagen scaffold on the dentine surface. These collagen fibrils presented in
normal cross banding pattern however the distributions of collagens were hindered
by random precipitations on and within the demineralised dentine surface. These
precipitations may due to the calcium ion precipitation as the results of binding to
EDTA. One could argue that it maybe the sign of collagen denaturation as the
erosive effect of EDTA can directly be observed in within 10 minutes of EDTA
application. Some would assume that it may due to the histopathology protocol that
could cut the collagen network and leave the irregular random structure of the
dentine.
3.4.4 Demineralisation using 17% EDTA for 10 minutes
The major factors that contribute to the properties of EDTA are the chelating
mechanism and protonation mechanism as been explained in previous literature.
Study conducted by Serper and Calt showed that the phosphorous releasing effect of
EDTA rapidly rises in within 1 minute, and further exposure to EDTA only doubled
this effect at 15 minutes exposure (Serper and Calt, 2002). This was probably due to
the rapid removal action of smear layer in the first one minute and then followed by
slower released of phosphorus as the results of chelating mechanism (Serper and
Calt, 2002).In 2004, the same study was repeated to see the liberation of phosphorus
at longer time and the results showed that further exposure till 25 minutes did not
cause any significant increase in dentine demineralisation (Parmar and Chhatariya,
2004) . Another study of time dependent effects of EDTA on dentine structure proved
that a 10 minutes application of 17% EDTA, pH 7.4 caused excessive peritubular and
intertubular dentinal erosion under SEM imaging (Calt and Serper, 2002).This study

99
was in agreement with the previous authors about the effect of erosion at the dentinal
tubules when the control permanent tooth was treated using 17% EDTA (pH) for 10
minutes. However the findings did not achieved to demineralise the dentine
completely up to the extent where the collagen scaffold can be exposed. As the
peritubular dentine is more mineralised than the intertubular dentine, collagen
arrangement can only be observed at the peritubular area at this point.
Demineralised groups with EDTA were observed under SEM imaging. Significant
amount of work were put into this protocol to enable imaging under AFM however up
to this extent, no defined images can be detected. A better result perhaps can be
achieved if the effect on the dentine structure according to an assay of time exposure
to 17% EDTA can be obtained.

100
3.4.5 Potential issues In this section, several potential concerns that may be relevant to the findings were
discussed.
1) Sample preparation According to the Centers for Disease Control and Prevention (CDC) guideline, teeth
that were used in research need to be stored in solution for infection control purposes
(Lee et al., 2007). At the same time, the choice of solutions also needs to have the
ability to conserve the integrity of the tooth’s surfaces. In 1993, Goodis reported that
among five common storage solutions (ethanol, formalin, distilled water, distilled
water with thymol, phosphate-buffered saline with thymol), saline storage resulted in
large significant decreased in permeability (Goodis et al., 1993).Various type of
common solutions were also discussed in a previous studies include ethanol, gamma
irradiation, distilled water, formalin and saline (Addy and Mostafa, 1988, Cooley and
Dodge, 1989, White et al., 1994). In this study, 70% of ethanol was used as a short
term disinfectant medium for 7 days (Strawn et al., 1996). Ethanol is also known as a
fixation solution. It can affect the natural composition of the dentine by breaking the
hydrogen bonds on proteins molecules (Kiernan, 1981). As for this reason, the teeth
were placed in 0.01% Thymol after remained in the ethanol for 1 week until prepared.
Hydrated samples
Moist bonding techniques have been reported to be effective in maintaining collagen
fibril structure during dentin bonding procedures (Kanca, 1992, Gwinnett and Kanca,
1992). It also was reported that the technique can prevent the collapse of
demineralised dentin matrix that occurs as a result of drying during sample
preparation (Garberoglio and Brannstrom, 1976a, Pashley et al., 1993). In situ
observation of dentinal collagen for hydrated and dehydrated collagen fibrils were
reported by Habelitz showed that dehydration induced significant changes to the
collagen fibrils (Habelitz et al., 2002). In this study, the prepared samples were stored

101
in plastic container that filled with purified water and dried in air for 1 second before
imaging. It was hypothesised that without air-blowing and air drying for more than 1
second, the samples can still sustain its hydration.
2) Imaging
AFM imaging
The advent of AFM has opened new perspective in investigating the collagen at high
resolution. The quality of images taken by AFM is important in data analysing. Good
images are those with sharp and clear characteristics of the sample surfaces.
Recording the topography may carry the possibility of the surface deformation.
Essentially, one should recognise any sources of artefacts which can appear in the
images. Selection of the tip is critical and important to ensure that the images can
resemble closely to the sample topography (Keller and Cung, 1991). One of the
troubleshooting that we encountered was contamination of the probe tip. Probe tip
should be clean and sharp as any debris that contaminated by the tip will generated
unusual images. This may continue along the scanning which can mislead the data
analysis.

102
Figure 3.15: The samples did not move simultenously with the scanner, the image became not clear. Scratch marks on the sample surface can be observed.

103
SEM imaging The observation on the SEM images showed that there were sign of unusual findings
that indicated by circle in Figure 3.15. It was hypothesised that these artefacts may
due to the effect of cutting steps during histopathology section preparation.
Figure 3.16: SEM image showing irregular pattern or disarrangement on the sample surface. This may be the effect of cutting during sample preparation.

104
3.5 Conclusion Finalised new protocol for permanent demineralisation to expose collagen This chapter has shown the comparison of demineralisation protocols to investigate
the feasibility of topological assessment of collagen fibrils in the dentine of permanent
teeth. This work has been set out to verify different chemical treatments to expose
collagen fibrils in the dentine. The initial assessment of demineralised dentine with
commercial etchant suggested that further deproteinisation were required to reveal
the D-banding distances of the collagen fibrils. By combining Raman spectroscopy, a
comprehensive representation of topological changes of the dentine substrate can be
obtained at high resolution electron microsocpy. Etching protocol with 10% citric acid
and controlled deproteinisation also enabled the imaging of collagen structure under
AFM however the contrast were poor. The comparison results with EDTA
demineralisation protocols were restricted as images using AFM could not be
obtained, however this study proved the presence of the interlocking collagen
scaffold under SEM for 17% EDTA in 12 months. I assumed that the difficulty in
imaging the topography may attribute to certain circumstances which include the
methodology of samples preparation.
All of the images in this study were generated using contact mode AFM. The skills
operating in contact mode were more direct and simple. These findings provide
additional insight tools to discover the topological assessment just using the contact
mode. The limitation that needs to be highlighted was that this study did not discuss
about the analysis of the collagen fibrils. The work just focused on characterising the
morphology of dentinal collagen in permanent teeth. In conclusion, the most effective
demineralising protocol for control permanent teeth in this study was the
demineralisation using commercial etchant (37% phosphoric acid) followed by 6.5
vol% of NaOCI. With the established protocols described, studies on the primary
teeth will be further explored in the next chapter.
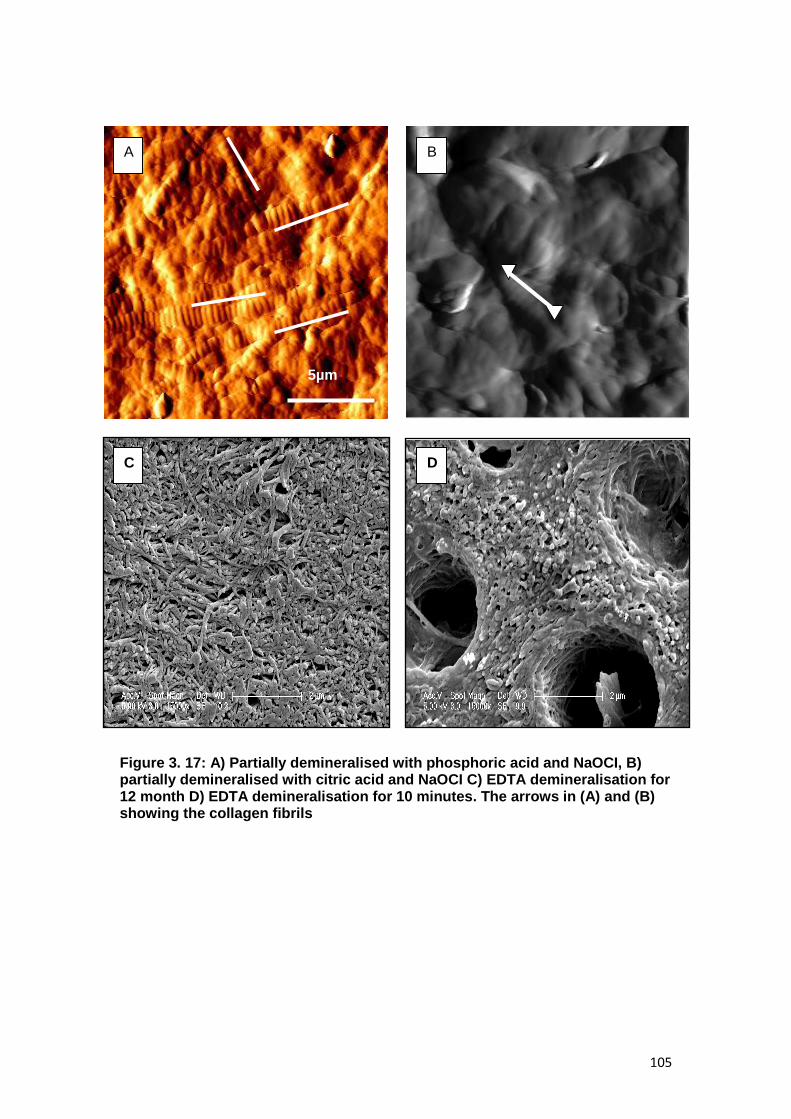
105
Figure 3. 17: A) Partially demineralised with phosphoric acid and NaOCI, B) partially demineralised with citric acid and NaOCI C) EDTA demineralisation for 12 month D) EDTA demineralisation for 10 minutes. The arrows in (A) and (B) showing the collagen fibrils
B
5µm
A
C D

106
CHAPTER 4
EVALUATION OF DEMINERALISATION
PROTOCOLS FOR PRIMARY TEETH

107
4.0 Evaluation of demineralisation protocols for primary teeth
4.1 Introduction
Chapter 3 detailed the application of demineralisation protocols which enabled the
imaging of fibrous collagen network of control permanent teeth by using AFM.
Demineralisation was carried out in order to remove the smear plugs and smear
layers and at the same time to demineralise the dentine surface. This will lead to the
enlargement of dentinal tubules and produce zones consisting of organic minerals
that rich with collagen network. Gradual removals of non collagenous matrix proteins
in the collagen rich zone have been proven to expose the organisation of collagen
framework as suggested in the previous literature.
There were established substantial microstructural differences between permanent
and primary teeth as discussed in Section 1.3.3. Primary dentine has been described
to be slightly less mineralised than the permanent human dentine (Hosoya et al.,
2000, Angker et al., 2003). The concentration of calcium and phosphorus in the
peritubular dentine and intertublular dentine were showed to be reduced in primary
teeth (Hirayama et al, 1990). When the primary teeth were exposed to acid etching,
the smear layers were removed more quickly and the teeth demineralised more
easily, causing deeper demineralisation in the dentine (Koutsi et al., 1994, Nor et al.,
1996, Osorio et al., 2010, Shashikiran et al., 2002). With the variation in micro
morphology and chemical reaction of primary teeth, the protocols for imaging the
collagen network on the dentine surface of primary teeth may differ from the
permanent teeth. For this reason, this chapter set out to assess the demineralisation
protocols to image the collagen network in primary teeth. It will aim to repeat the
basic protocols in chapter 3 and latter should provide a comparison imaging of
fibrous network of partially demineralised dentinal collagen by AFM between primary
and permanent teeth.

108
4.2 Materials and methods
Six control primary teeth were involved in this study. The material and methods for
each experimental group in control primary teeth were discussed as below:
4.2.1 Demineralisation using published protocols
Two control primary teeth were embedded in epoxy resin as described in section
2.2.3. The same replicated protocol in control permanent teeth in section 3.2.1 was
repeated (Habelitz et al., 2002).
4.2.2 Demineralisation of experimental group using commercial etchant
In this demineralisation group, several steps were involved. Two control primary teeth
were embedded in epoxy resin and the same steps in section 3.2.2 were followed.
The sequences of steps that involved in this group were shown in figure 4.1.
4.2.3 Demineralisation using 17% EDTA for 12 months
One control primary tooth was stored in 17% EDTA followed the protocol in section
2.3.5 (a), after which the tooth were prepared for histopathology section as described
in section 2.2.4. Images were recorded by using light microscope and SEM.
4.2.4 Demineralisation using 17% EDTA for 10 minutes
One control primary tooth was prepared as described in section 2.2.3 and
demineralisation protocol explained in section 3.2.4 was repeated.

109
The sequence for collection, preparation and imaging of four experimental groups for
control primary teeth is shown in the following figure 4.1.
Figure 4.1: Experimental groups for control primary teeth

110
4. 3. Results
4.3.1 Demineralisation using published protocols
The results of replicated protocols from the published study as mentioned in 4.2.1
were demonstrated in Figure 4.2.
Figure 4.2: Contact mode AFM images showing the occlusal section of primary teeth after demineralisation by acid etching with citric acid and deproteinisation of 6.5 vol% NaOCI. Right: showing partially demineralised primary dentine that treated with 10vol% of citric acid at 15s followed by 6.5vol% of sodium hypochlorite at 80s. Left: revealing the collagen fibrils as shown by the arrows at lower scan size.
Figure 4.2 shows AFM images that revealed a demineralised collagen fibrils network
structure after treated with 10vol% of citric acid for 15s, and subsequently treated
with 6.5 vol% of sodium hypochlorite at time interval of 80s. At 20µm, the diameter of
dentinal tubules were increased due to recession of peritubular dentine (indicated in
circle) .At 5 µm, the collagen fibrils network can be revealed (indicated in arrows).
However at this point, the D-banding distances cannot be determined due to difficulty
in obtaining a defined image at lower scan size.
20µm
5µm
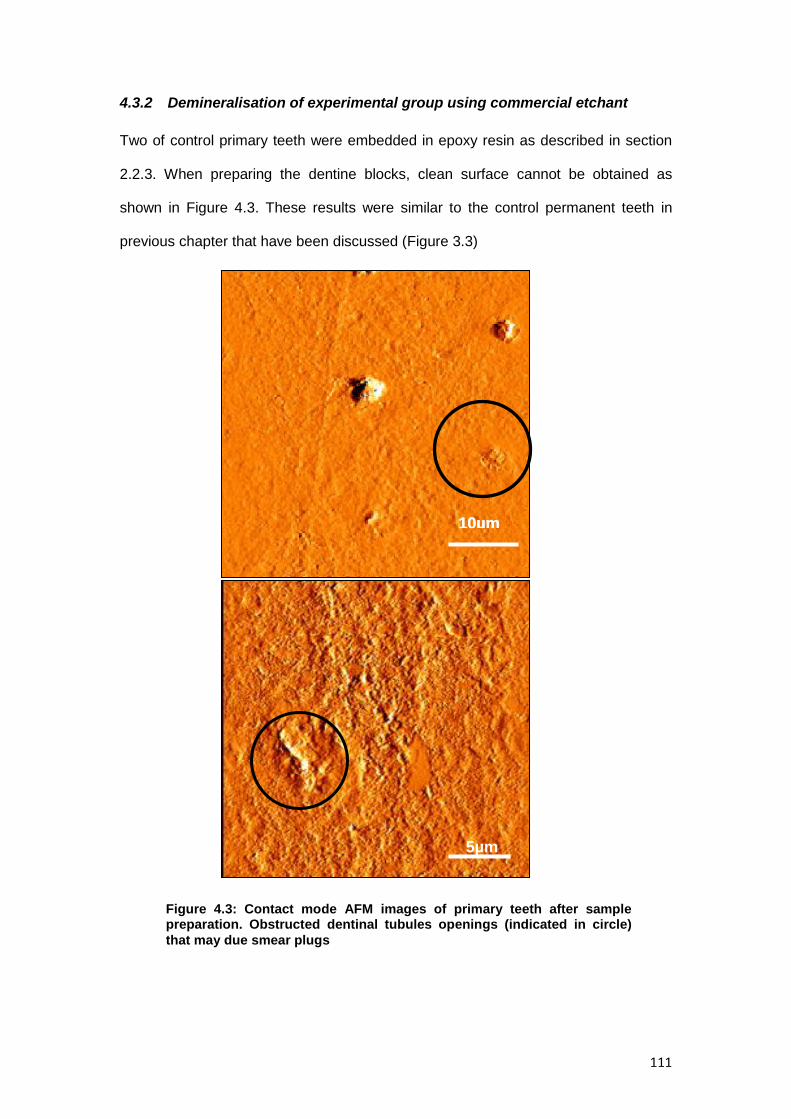
111
4.3.2 Demineralisation of experimental group using commercial etchant
Two of control primary teeth were embedded in epoxy resin as described in section
2.2.3. When preparing the dentine blocks, clean surface cannot be obtained as
shown in Figure 4.3. These results were similar to the control permanent teeth in
previous chapter that have been discussed (Figure 3.3)
A
10µm
10µm
5 µm Figure 4.3: Contact mode AFM images of primary teeth after sample preparation. Obstructed dentinal tubules openings (indicated in circle)
that may due smear plugs
5µm
10µm 10µm

112
To relate these topological findings of polished samples to the chemical composition
of the dentine, baseline Raman spectra of the control primary dentine was recorded
as shown in figure 4.4.
Figure 4.4: Raman spectra of control primary teeth with phosphate, carbonate and amide III peak
In this study, spectra from the control primary dentine were analysed using
phosphate stretching band at ~960 cm−1. The data was normalised in order to make
sure that the intensity of the spectra will be on the similar scale. The spectra were
normalized against the carbonate peak (CO23-) at 1072 cm -1 which is considered a
stable hydroxyapatite (Ca10(PO4)6(OH)2) spectrum. The x-axis has been rescaled to
show only wavenumber from 500 cm-1 to 1500 cm-1 and two main characteristic
peaks; phosphate (PO43-) at 960 cm-1 and amide III at 1240 cm-1 were identified.
0
200
400
600
800
1000
1200
1400
1600
500 700 900 1100 1300 1500
Wavenumber cm‾¹
Inte
nsit
y
Phosphate band
Amide III
Carbonate band

113
In this study, the prepared samples were treated with commercial etchant as
described in section 2.3.3. The effects of different etching time were obtained using
Raman spectroscopy.
Figure 4.5: Representative raman spectra obtained at different times of demineralisation with commercial etchant (37% acid phosphoric) on control primary
teeth
Raman spectra were obtained from control primary teeth at different times of
demineralisation using commercial etchant (37% phosphoric acid). A strong defined
phosphate band was identified. The intensity of the peak decreased with the
increased of exposure time to commercial etchant. After 3 minutes of acid exposure,
the peak intensity reduced to nearly 70% and at 7 minutes, the peak of ~960 cm−1
was not distinguishable from the background. This suggests that at this point, the
inorganic material in the control primary teeth were almost completely removed.
PO₄³־(phosphate band)

114
Ratio of Phosphate band / Amide III band The ratio between phosphate band and amide III was obtained to observe the
changes of minerals in the dentine. As described earlier, amide III band can be
observed at 1240cm-1, which relates the collagen fingerprint. This ratio can provide
significant changes of minerals in relation to time.
Ratio of Phosphate to Amide III
0
5
10
15
20
0 1 2 3 4 5 6 7 8
Time (min)
Rati
o p
ho
sp
hate
to
am
ide
III
Figure 4.6: Graph showing the ratio data of phosphate peak and amide III
Figure 4.6 shows the ratio of phosphate band intensity to amide III intensity. From the
graph, it shows that the intensity of the phosphate band decreased with time. This
was in agreement with the results achieved for the control permanent teeth in Figure
3.6. It was hypothesised that the significant time to observe mineral changes would
be at 2-3 minutes. After 3 minutes, the intensity of the phosphate band to amide III
started to show a massive decline, which was nearly 90% decreased from the initial
intensity value.

115
Images for the demineralisation protocol using commercial etchant were observed
under AFM. The images were observed at 2 minutes which was hypothesised to
produce significant changes based on the previous result.
.
Figure 4.7: Contact mode AFM images of demineralisation using commercial etchant (37% phosphoric acid) of control primary teeth at 2 minutes. Images were recorded and shows sign of peritubular erosion (indicated by circle) and noted the presence of granulated particles on the dentine surface (indicated in box).
Polished control primary tooth shows the microstructure of dentine surface after acid
treatment with commercial etchant for 2 minutes. The images show the dentinal
tubules diameter increased with sign of peritubular recession (indicated in circle) and
granulated particles can be observed on the dentine surface. It was hypothesised
that the changes were due to the reaction of the acid towards dentine surface. Yet, at
this point no collagen fibrils can be observed.
Further experimental protocol with 6.5 vol% NaOCI
The following step in this group was continued with deproteinisation protocol as
described in 2.3.4. The effect of 6.5vol% NaOCI has been proved to enable imaging
of fibrous network of partially demineralised dentine by AFM (Habelitz et al., 2002).
This was in agreement with the results discussed in chapter 3. The results of
deproteinisation on control primary teeth were shown in Figure 4.8.
50µm 10µm
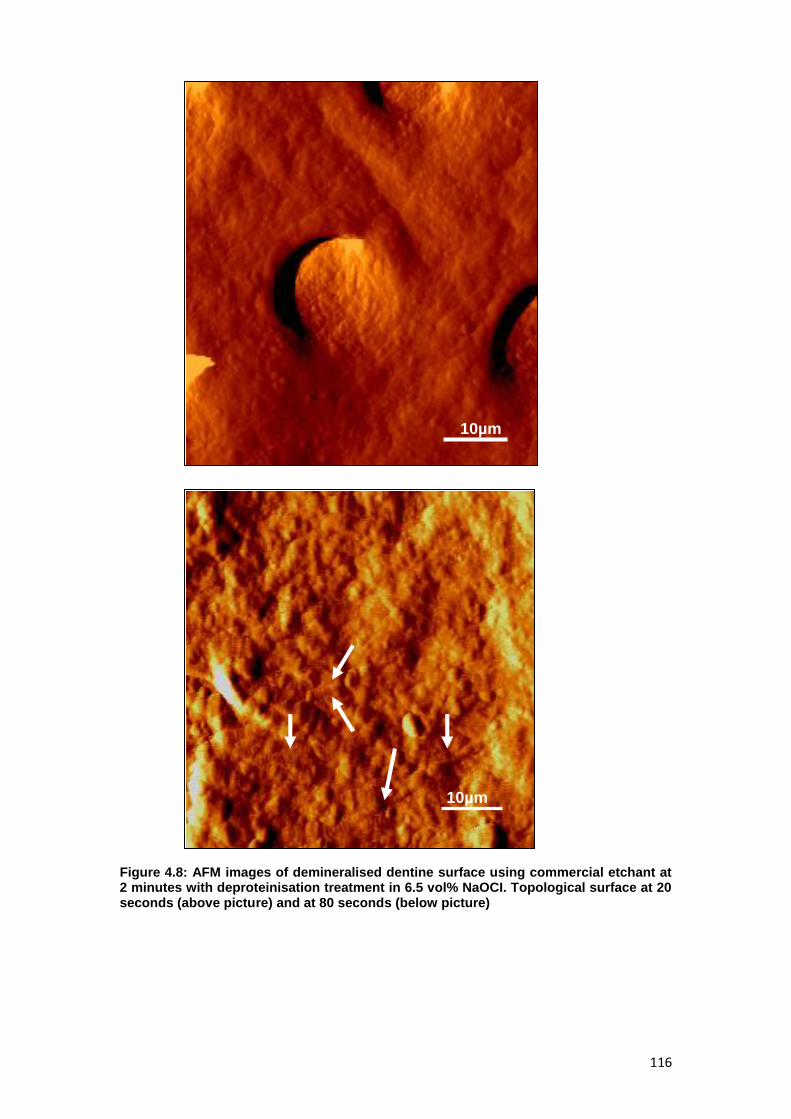
116
Figure 4.8: AFM images of demineralised dentine surface using commercial etchant at 2 minutes with deproteinisation treatment in 6.5 vol% NaOCI. Topological surface at 20 seconds (above picture) and at 80 seconds (below picture)
10µm
10µm

117
Partially demineralised control primary teeth were treated with 6.5 vol% sodium
hypochlorite at time intervals of 20 seconds. Figure 4.8 shows generalized particles
surrounding the dentinal tubules (above image) at 20s and collagen fibrils network
appeared visible at 80s. All images were obtained under contact mode.
In the next step, partially demineralised control primary teeth treated using 6.5 vol%
NaOCI for 80 seconds were observed at lower scan size.
Figure 4.9: Contact mode XE-100 Park AFM images of control primary teeth after partial demineralisation by 37%phosphoric acid for 2 minutes and subsequently treated with 6.5 vol% NaOCI for 80 seconds. Collagen fibrils can be observed showing the repeat pattern and random distribution of fibrils in the intertubular dentine (arrows).
5µm
3µm
5 µm

118
At lower scan size, interlocking pattern of dentinal collagen can be observed.
Collagen fibrils show repeat pattern and random distribution at intertubular dentine.
The arrangement of dentinal collagen fibrils were in accordance with previous studies
(Kramer, 1951, Habelitz et al., 2002).The image contrast of the collagen fibrils in this
group was greater than the previous group (treated using 10vol% citric acid).
Therefore, the images were suitable for measuring D-banding distances of fibrils.
Further details on D-banding measurement in control primary teeth will be discussed
in the following chapter.
4.3.3 Demineralisation using 17% EDTA for 12 months
In this group, the effect of demineralisation using 17% EDTA for 12 months on one
control primary tooth was observed. Protocol in section 4.2.3 was followed.
Light microscopy for control primary histopathology section
Figure 4.10: Histology section of control primary tooth under light microscopy
X 20 000

119
Representative histopathology section of primary teeth is displayed in above figure
after stained with Picrosirius red (PSR). The PSR stain was viewed under light
microscope resulting in orange fibers immediately beneath dentinal tubules (red
colour) and appeared in straight aligned pattern.
Imaging control histopathology section using SEM In order to obtain images from SEM, histopathology section was prepared using
protocol in section 2.4.2. Images were recorded in two scan sizes; 5µm at 5000x
magnification and 2µm at 15000x magnification as shown in Figure 4.11.
A

120
Figure 4.11: Experimental procedure of control primary teeth stored in 17% EDTA for 12 month (A) Enlargement of dentinel tubule openings with sign of erosion of peritubular and intertubular dentine. (B) Higher magnification of this specimen showing localised collagen scaffold that surrounded by irregular variation structure which scattered almost at intertubular dentine
SEM observation on control primary tooth after 12 months of storage in 17% EDTA
revealed presence of collagen fibril in intertubular dentine. In this specimen, there
were also sign of slight erosive effects at peritubular dentine which lead to increased
diameter of dentinal tubules. The quality image of fibrillar network improved at higher
magnification. However, the morphology of some collagen fibrils appeared to show
sign of irregular pattern or disarrangement.
B

121
B
A
4.3.4 Demineralisation using 17% EDTA for 10 minutes
In this group, one of the control primary tooth was prepared in epoxy resin as
described in 2.2.3. Then, the prepared sample was treated with 17% EDTA for 10
minutes and imagings were obtained using SEM.
Figure 4.12: Effect of 17% EDTA for 10 minutes on the control primary tooth. Excessive erosion of intertubular and peritubular dentine was seen which lead to widening of

122
tubular diameters. The demineralisation effects in some extent cause the intertubular dentine to completely disappear (indicated in circle).At 2µm, the collagen network only can be seen at peritubular area
At 10µm, the dentinal tubules opening of control primary tooth demonstrate
increased in diameters which were in agreement with the previous study (Calt and
Serper, 2002). Although smear layer was removed and the dentine contents were
dissolved by the action of EDTA, the collagen networks were still cannot be revealed.
It was hypothesised to be due to calcium ion binding to EDTA (indicated by box).
4.4 Discussion
This study represents the different demineralisation protocols to investigate the
feasibility to image the dentinal collagen fibrils in control primary teeth. In the clinical
indication of dentine adhesion restorations, the same protocols of acid etching have
been used for primary and permanent teeth. However, there were evidence
suggesting significant chemical and morphology differences between the permanent
and primary teeth which have been discussed in previous literature. Prior to this, the
objective were to simply test different demineralisation protocols that were used in
chapter 3, to evaluate whether specific demineralisation protocol required for the
control primary teeth and to determine the most effective methods to image the
dentinal collagen in primary teeth.
4.4.1 Demineralisation using published protocols
In regards to the citric acid reaction, the results of this study as shown in section
4.3.1 was similar to the phosphoric acid that suggests further chemical treatments of
dentine substrate were required to reveal collagen fibrils.
123
4.4.2 Demineralisation of experimental group using commercial etchant
With less mineralised dentine in primary teeth, the chemical reaction seemed to be
more intense causing deeper demineralisation of intertubular and peritubular dentine
(Angker et al., 2003). Based on this fact, it was hypothesised that etching time for
control primary teeth in this experimental study would be shorter compared to the
control permanent teeth. This was in agreement with the results in section 4.5, that
showing reduction of nearly 70% of phosphate minerals in primary teeth after been
treated for 3 minutes with commercial etchant (37% phosphoric acid). Due to high
reactivity to etchant, optimum periods of etching time was determined based on the
ratio of phosphate band to amide III. This can allow significant changes of mineral in
control primary dentine without causing denaturation or severe collapse in collagen
fibrils framework. The results showed that the control primary teeth were more
susceptible to acid etching. However, at suggested time of 2 minutes, increased
diameters of dentinal tubules due to recession of peritubular dentine under AFM can
be observed. At this point, acid etching dissolves the mineral content and leaves the
partially demineralised layers which consist predominantly of collagen and other non-
collagenous matrix. It was suggested that the composite natures of collagen fibrils
that have been covered by the non-collagenous proteins may hindered the
topological imaging of the fibrils as have been described in previous work by Marshall
(Marshall et al., 2001).
On the other hand, the significant removal of mineral phase in the primary dentine at
a shorter time can contribute to the clinical indication for dentine bonding protocols in
dental restoration. The results stated that there was a different reaction between
primary and permanent teeth during the application of etching as shown in Raman
spectra in section 3.3.2 and 4.3.2. This was in concurrence to the published study
that suggested primary teeth required shorter etching time than permanent teeth (Nor
et al., 1996). From clinical point of view, this protocol can benefit the performance of

124
the restoration especially in paediatric patient. Moreover, it have been established
that longer etching times in primary teeth results in formation of thicker hybrid layer
that leads to unstable demineralised zone and consequently increased the
susceptibility of failures (Nor et al., 1996, Sardella et al., 2005, Gateva and Rossitza,
2012).
Further experimental protocol with 6.5 vol% NaOCI
Due to different reaction of acid etching in primary teeth, it can be postulated that it
was likely that the application of sodium hypochlorite solution to control primary
dentine would produce different alteration when compared to control permanent
dentine. In this chapter, the significant effects on micromorphology aspect of primary
dentine after the application of sodium hypochlorite solution were identified. It could
be noticed that the collagen fibrils became visible just after the control primary
dentine was treated with 6.5vol% sodium hypochlorite for 20s. When the application
of sodium hypochlorite was gradually increased to 80s, the collagen fibrils became
more obvious. The deprotenisation time was limited to 80s as some studies
demonstrated total removal of collagen on primary dentine after the application of 5
vol% sodium hypochlorite was at 120s (Perdigao et al., 1999, Correr et al., 2006).
Improvement in the quality of images of the collagen fibrils in this method exhibit the
characteristic structure of collagen fibrils and is suitable for measuring the dimension
of collagen fibrils features. The latter chapter will discuss in detail about the
topological findings and D-banding features of control primary teeth.
4.4.3 Demineralisation using 17% EDTA for 12 months
Based on the literature on permanent teeth and on the results achieved in chapter 3,
the highly mineralised peritubular dentine on control permanent teeth was dissolved
by the action of EDTA and resulting in increased diameters of dentinal tubules.
These can be showed by the appearance of excessive dentinal tubular erosive

125
effects on the dentine surfaces (Calt and Serper, 2002). Despite the lacked of
published data on primary teeth, the micro morphology differences between primary
and permanent teeth should logically reflected the reaction towards EDTA. It might
be reasonable to assume that once the smear layer was removed, the dentinal tubule
openings could created more easily compared to permanent teeth (Kennedy et al.,
1986). The findings observed in control primary tooth which was stored in 17% EDTA
for 12 months was quite interesting as the dentinal tubules showed less erosive
effects and the collagen networks were still intact. It was hypothesised that with less
mineral composition in the primary teeth, the collagen may be denaturated and
resulting in a degradation of collagen fibrils and disarrangement of the collagen
network. In contrast, the collagen networks in this study were preserved. Further
works need to be carried out with more samples size in order to discover the
reproducibility of the findings.
4.4.4 Demineralisation using 17% EDTA for 10 minutes
Observations in control primary teeth during demineralisation protocol using
17%EDTA for 10 minutes were in accordance to the previous study (Calt and Serper,
2002). The results showed erosive effects of the dentinal tubules. In this group, the
collagen network can only be seen at peritubular dentine. Lower collagen content
makes peritubular dentine more quickly to dissolve than intertubular dentine. These
results were in agreement with the findings observed in control permanent teeth. It
was suggested that the dentine surface did not demineralised completely up to the
extent where the collagen scaffold can be revealed and the presence of precipitation
over the dentine surface may hinder the collagen network.

126
4.4.5 Potential issues
In this chapter, some potential issues that relevant to the findings will be discussed.
1) Etching time
Different etching times using the same acid etching concentration result in different
morphological changes in demineralised dentin surface. In 1993, Marshall reported
that prolonged etching time causes morphological changes to dentin surface. Such
changes have, in turn, a detrimental effect to the properties of the dentine (Marshall
et al., 1993). The effects will results in excessive demineralisation of peritubular and
intertubular dentine which may leads to collapse of dentinal collagen (Nor et al.,
1996). In this study the etching time was determined according to the protocols
provided in previous studies and new protocols that were generated based on
experimental study design as explained before.
2) pKa of the acid
pKa is the ability of the acid to dissociate the hydrogen ion [H+]. The higher the pKa
value, the greater the potential proton will be available and making the solution more
effective. The strong acid will have negative pKa values whilst the weak acid will have
a larger positive value. With the ability of the acid to generate the hydrogen ion, the
pKa can reflect the efficacy of certain acids to dissolve the enamel. Optimum pH for
dentine demineralisation is important as different pH and concentration will results in
different demineralising effect (Cury et al., 1981, Marshall et al., 1997c)

127
Teeth 10vol% of citric acid and
6.5vol% of NaOCI
37 %phosphoric acid and
6.5vol % of NaOCI
17%EDTA for 12 month 17% EDTA for 10 minutes
Primary 15s for citric acid+ 80s NaOCI 2 minutes phosphoric acid+80s
NaOCI
Permanent 15s for citric acid+ 120s NaOCI 5 minutes phosphoric acid+ 100s
NaOCI
Figure 4.13: Comparing results between primary and permanent teeth

128
4.5 Conclusion
On the basis results obtained in this study, the images of collagen were feasible
irrespective of the demineralisation protocols used. In summary, the effective
protocol to allow in situ imaging of the collagen both in control primary and
permanent teeth in this study were the chemical treatment with 37% phosphoric acid
(commercial etchant) followed by controlled deproteinisation protocols with 6.5vol%
of sodium hypochlorite. A shorter protocol for chemical treatment in primary teeth
showed a significant different in chemical reaction between primary and permanent
teeth. Comparison results with EDTA demineralisation protocols were restricted as
this study unable to expose collagen under AFM, however microscopic observation
under SEM suggested that there were differences between primary and permanent
teeth when the teeth were exposed at same time and concentration. The hypothesis
of EDTA still need to be confirmed in the future works. Despite the limitation of the
results, the protocol appeared to be an effective tool to gain understanding of the
collagen structure and for further analysis of the mechanical properties of the
collagen in the future works.

129
CHAPTER 5
CHARACTERISATION OF DENTINAL
COLLAGEN OF OI AND DI USING AFM

130
5.0 Characterisation of dentinal collagen of OI and DI using
AFM
5.1 Introduction
OI is a clinical and inherited disorder results from the quantitative and/ or qualitative
defect of type I collagen (Byers, 2000). OI type I has been shown to cause the
mildest abnormalities in bone ultrastructure whilst OI type III has a distinctive
structural abnormalities in collagen (Sarathchandra et al., 2000)
The range of severity of dental phenotype in OI is extensive. Although the varieties of
clinical, radiographic as well as genetics findings have been described in details in
chapter I, the ultrastructure findings of the dentinal collagen structure is still limited.
While considerable attention has been focused on characterizing collagen bones in
OI, the dentinal collagen of the teeth remain poorly characterised. One available
method to study the ultrastructure characteristics of the dentinal collagen is by using
the AFM (Marshall et al., 1993, Kinney et al., 1993, Habelitz et al., 2002)As expected
in DI type I in which the collagens is defective, AFM imaging of the dentinal collagen
in these patients would be expected to show similar changes seen in the bone in the
dentine as well.
To further delineate the range of dentinal collagen in DI type I, in this chapter,
observation on primary teeth of DI type I using the AFM was carried out. The aim of
this study was to investigate the morphological appearance of the dentine in primary
teeth of DI type I from normal control teeth using AFM. In addition to understand the
abnormalities of these affected teeth, the demineralisation protocols which enable the
imaging of the collagen fibrils (citric acid/commercial etchant ) in chapter 4 were used
as a baseline guideline in this chapter.

131
5.2 Materials and methods
5.2.1 Tooth preparation
One exfoliated lower primary tooth DI type I (OI type III) was prepared in epoxy resin
as been described in section 2.2.2.
5.2.2 Demineralisation protocols –Effect of 10vol% of citric acid for 15s
The prepared sample was etched with 10vol% citric acid for 15 seconds and was
washed under steady flow of ultra high quality (UHQ) water for a few seconds. Then
the sample was ultrasonicated in UHQ water for 10 seconds. The image of the
sample was obtained by using AFM.
5.2.3 Measuring the D-banding
Collagen fibril D-banding distances were measured from the obtained images. The
average of the D-banding distance was obtained by taking the profile of the fibrils
parallel to their length from various height images. The lengths of these profiles were
recorded and divided by the number of bands present. The mean of the D-banding
was calculated and recorded using WSxM analysis programme.

132
5.3 Results
5.3.1 Assessment of dentinal structure of DI type I of primary teeth before
demineralisation
Images of the dentine in DI type I tooth were obtained using AFM. Since the tooth
had exfoliated naturally, only the crown of the tooth was available for sample
preparation as described in 2.2.2. After preparing the sample, the surface obtained
was not clean enough to show the collagen fibrils as shown in Figure 5.1
Figure 5.1: AFM images of lower primary tooth of a patient with DI type I. The dentinal tubules (indicated by star) were obstructed with the smear plugs. The dentine surface was covered by smear layer (indicated by circle area).
The image of the dentine surface showed that the surface was covered by a smear
layer and smear plugs. At this point, it was not possible to identify the collagen fibril
network.
10µm

133
5.3.2 The effect of 10vol% citric acid for 15 seconds on primary DI type I
The purpose of the demineralisation protocol with 10 vol% of citric acid was to
remove the smear layer in the dentine surface. The cross section sample of DI type I
tooth was treated with 10vol% of citric acid for 15 seconds and the images were
obtained in two different area of the dentinal surface as shown in Figure 5.2.
Figure 5.2: DI type I dentine treated with 10vol% citric acid for 15 seconds at two different areas (A) at 10µm, collagen fibrils was densely packed in one orientation (B) The image showing the distribution of the collagen fibrils ( indicated in arrows)
in the intertubular dentine at lower scan size; 5µm.
10µm
5µm 5µm
A A
B B
10µmmmm
A

134
For a comparison, a prepared control primary tooth in epoxy resin also was treated
with the same protocol. Images were shown in Figure 5.3.
Figure 5.3: Control primary tooth images of intertubular dentine treated with 15s of 10 vol% of citric acid (A) The partially demineralised dentine did not reveal any collagen fibrils (B) At lower scan size, the image showing the smear plugs (indicated in circle). and smear layer covering the dentine and hindered the collagen network. Arrows suggesting the possibility of collagen fibril.
10µm
5 µm

135
The findings showed that the dentine surfaces can be influenced by the treatment of
10 vol% citric acid for 15 seconds. The test sample in figure 5.2 resulted in thickened
dentinal collagen fibrils that were distributed in only one direction. No obvious
interlocking areas were noticed. At different areas of the dentinal surface of the same
tooth, the same morphology was noted. However, in the control primary tooth, the
partially demineralised dentine was covered by hydroxyapatite and non collagenous
proteins suggesting that the smear layer and smear plugs had not been fully
removed. This increased the difficulty of imaging using AFM.
5.3.3 Measuring the D-banding distance of primary DI and control
D-banding distance of the collagen fibrils were measured from the profile of the fibrils
in the images. Analysis was made by determined the step height of individual fibrils
as an example shown in Figure 5.4.
Figure 5.4: Measurement of D-banding distance along the collagen fibril in DI type I by WSxM analysis.

136
The distribution of the D-banding distances for the DI type I and control primary teeth
are shown in Tables 5.1 and 5.2 respectively.
Table 5.1: Distribution of D-banding length of DI type I in primary teeth
Table 5.1 shows the measurement of the D-banding distance of collagen fibrils in the
DI type I primary tooth. The D-banding measurements were taken from the collagen
fibrils at different area in the test sample. The distribution of D-banding distance
appeared in the range of 61nm to 85nm with the mean value was hence found to be
64.74nm ± 8.4.
DI type I Total banding length (nm) Bands
Banding length (nm)
1 550.4 8 68.8
2 485.5 6 80.9
3 427.6 5 85.5
4 240.2 3 80.1
5 310.0 5 62.0
6 341.0 5 68.2
7 208.2 3 69.4
8 308.2 5 61.6
9 184.1 3 61.4
10 425.2 6 70.9
Mean
64.7
Standard deviation 8.4

137
Table 5.2: Distribution of D-banding length of control primary teeth
Table 5.2 shows the measurement of the D-banding distance of collagen fibrils in the
control primary tooth. The distribution of D-banding distance appeared in the range of
59nm to 70nm with the mean value was hence found to be 66.42nm ± 3.7.
Control primary teeth Total banding length (nm) Bands Banding length (nm)
1 390.2 6 65.0
2 210.7 3 70.2
3 138.4 2 69.2
4 638.9 10 63.9
5 140.4 2 70.2
6 206.1 3 68.7
7 177.9 3 59.3
8 192.4 3 64.1
9 279.6 4 69.9
10 254.0 4 63.5
Mean 66.42
Standard deviation 3.7

138
5.4 Discussion
5.4.1 Characterisation of DI type I
A remarkable finding of this chapter is in the characterisation of the morphology of
dentinal collagen ultrastructure in DI type I teeth. The aberrations found were
primarily abnormal organisation of dentinal collagen and wide distribution of D-
banding distance of the collagen fibrils. The results revealed thickened collagen fibrils
in a network. There was no obvious interlocking of fibrils, as the organisation of the
collagen appeared to be aligned in the same direction. In a previous study using
transmission electron microscopy (TEM), some of the affected dentinal collagen
areas were found to be densely thick which supported our findings however the
collagen were in haphazard orientation (Waltimo et al., 1996).
The morphology of bone collagen fibrils in OI type III appeared to have a different
organization, described as flower-like with some fused, composite fibrils. The
collagen fibre bundles were also twisted and spiralled but loosely packed throughout
a very thick osteoid (Sarathchandra and Pope, 2005).The findings achieved by
Majorana using confocal laser scanning microscopy (CLSM) in OI (OI type I, type III
and OI type IV) showed that no histological differences were noted in the teeth
among three of types of OI. The dentinal collagen in all of the teeth were randomly
orientated when away from the odontoblastic process i.e; resembles in dilated
structure in the histological sections, and was parallel inside the channel (Majorana
et al., 2010).
In this study, it was assumed that the orientation of the collagen fibrils in primary
teeth of DI type I were parallel and less interlocked with each other. Comparison of
these findings to the normal primary control tooth revealed that the orientations of the
collagen fibrils in the control tooth were more interwoven with numerous crossings of

139
the fibrils. The dentinal collagen fibrils were reported to show repeat pattern and
random distribution of fibrils in the intertubular dentine (Kramer, 1951, Habelitz et al.,
2002).
The findings of this study can provide substantial supporting morphological evidence
that the dentinal collagen orientation of DI type I tooth are densely packed with an
aligned organisation. Less interlocking of collagen fibrils can be observed in the
intertubular area. It can be postulated that the differences in the organisation of
dentinal collagen between the dentine in normal control and test sample can
contribute to the variation of collagen morphology that was affected as the results of
mutation of genes in OI.
Figure 5.5: Right; showing thick dentinal collagen with repeated pattern that directed in one angle in DI type I whilst Left; showing interlocking fibrils with repeated pattern and random distributionin normal primary teeth
Data on the D-banding distances for the test and control primary teeth were also
obtained. Analyses of contact mode AFM images exhibited significant differences in
the distribution of fibril D-banding distances in DI type I. The D-banding distance of DI
type I varied between 61nm to 85nm with mean value of 64.7nm ± 8.4nm. The

140
control primary sample showed that the D-banding distances were ranged between
59nm to 70nm with the mean value of 66.42± 3.2nm. This implied to a suggestion
that dentinal collagen in DI type I have a wider range distribution of the D-banding
distance when compared to the control primary tooth. It was hypothesised that the
variability of the D-banding distances results in less regular pattern of fibrils.
However, the results cannot be conclusive as this study has a very limited amount of
samples.
This was in agreement with the findings in OI affected mice that showed significantly
greater variability of D banding distances of bone collagen (ranging from 56 to 75nm)
(Wallace, 2012). By characterising the mean fibril D-banding and the distribution of
fibril morphologies in the bone of normal mice and mice that were heterozygous for a
specific COL1A1 point mutation (G349C), phenotypic changes in the collagen fibril
ultrastructure were detected (Wallace, 2012).
The alteration of Type I collagen structure as a result of mutations of genes
associated with OI were directly related to the wide distribution of the D-banding
distance in the dentinal collagen as shown in Table 5.1.To date, no studies have
related the dentinal collagen morphologies in DI type I by measuring the fibril D-
banding distance.
Further studies are currently underway to link the features in the ultrastructure
morphology to the alteration in the nanosacle mechanical behaviour of type I
collagen.
5.4.2 The effect of 10vol% citric acid for 15 seconds on primary DI type I
Despite the large number of studies focused on the mutation of the helical domain of
type I collagen in OI, only a few studies have reported on the ultrastructure studies of
dentinal collagen in OI/ DI type I. In 1994, Waltimo carried out a TEM study of the
dentine matrix and its collagen on six exfoliated teeth of OI type IV and one incisor

141
tooth of type I OI. In this study, the teeth were partially demineralised by EDTA for
eight weeks and samples were prepared for fixation to allow TEM examination
(Waltimo, 1994).The ultrastructure findings of large vesicular and hyperfibres were
reported in abnormal areas of the dentine. The dentine appeared irregular in shape
and the tubules were poorly organized. This hyperfibres may have possibly arisen
from uncontrolled growth of collagen.
The same protocol was repeated by Majorana using EDTA as a decalcifying agent to
observe the ultrastructural dentine changes in DI type I using optical microscopy and
confocal laser scanning microscopy. Collagen defects with randomly orientated
collagen fibrils due to odontobast dysfunction was theorized in this study (Majorana
et al., 2010). This was also in agreement with another study using polarized –light
microscopy, SEM and TEM (Hall et al., 2002). Lygidakis et al reported on SEM
observation of twelve teeth from patients with OI type I. Some of the samples were
treated with 10% phosphoric acid and some were deproteinised with 5 vol% of
NaOCI. The findings did not report on the collagen network however, they marked a
reduction in number and irregular dentinal tubules in affected opalescent and non
opalescent teeth (Lygidakis et al., 1996).
Most of the dentinal collagen studies in DI type I were carried out using electron
microscopy. The results proved that acid etching with 10vol% of citric acid for 15
seconds can expose the collagen fibrils in a DI type I primary tooth. This was not the
case for the control primary teeth, where at the same etching time, the fibrils were
still been covered by non-collagenous matrix proteins and hydroxyapatite. The effect
of the acid treatment may relate to the calcium to phosphorus ratio that has been
shown to be lower in OI patients (Cassella and Ali, 1992). Because the
hydroxyapatite growth is closely associated to collagen fibril formation, the defect in
fibril formation in OI patients may interrupt hydroxyapatite growth (Byers et al., 1988)
When there is a reduction in the amount of minerals, then the demineralisation will be

142
faster. This observation was in agreement with bone collagen of OI type III, where
the treatment with 2.5 vol% of NaOCI removed the organic material, leaving no
residue of mineral crystal (hydroxyapatite) whilst the same treatment on normal bone,
will still leave the minerals on the surface area (Traub et al., 1994).
5.4.3 Potential issue
1) Number of samples
The main limitation of this study that needs to be highlighted was the sample number.
Much effort was carried out to collect DI teeth from patients as mentioned in 2.1.2. In
addition, patients who were seen in Great Ormond Street Hospital by the Paediatric
dentistry consultant from EDH were also invited to take part in this study. Still, there
were important issues to the number of patients reported here. Firstly, the ethical
considerations for patients need to be considered; it was only possible to obtain DI
teeth from patients that required extraction as part of their treatment plan, or were
happy to donate their exfoliated primary teeth. Unfortunately this meant, that there
were very few patients that could contribute teeth during the study period. Second,
some of the patients that fit the criteria declined to take part in this study. Third, the
sources of sample for permanent affected teeth were restricted with the fact that the
DI Type I is more prevalent in primary teeth than permanent.
2) Selection of demineralisation technique
With only one primary tooth of DI type I (OI type III), the description of the
ultrastructure findings was limited to only the effect of demineralisation using citric
acid. Although the established protocol with commercial etchant in control primary
teeth was reported in chapter 4, the intention to commence this study with published
protocol was carried out first in this chapter to help to clarify the ultrastructure
variation of DI type I teeth in response to the chemical treatment. As this is an

143
ongoing project, further demineralisation protocols for primary teeth as established in
chapter 4 will be performed once more sample received from DI patients. Future
study was planned to compare the findings between DI patients to the findings in
normal primary teeth as described in chapter 4. This study should form the baseline
protocols and information for the future work in characterizing the ultrastructure
findings of DI type I teeth.
5.5 Conclusions
The ultrastructure findings of dentinal collagen organisation and a suggestion of wide
distribution of D-banding distances in DI type I can provide additional understanding
of the alteration in dentinal collagen in this disease. The differences in mineral
content in test DI Type I and control primary teeth indicate that different
demineralisation protocols are required for affected teeth. The marked ultrastructure
variations noted can be a basis form to the future work.
.

144
CHAPTER 6
FINAL CONCLUSION AND FUTURE WORK

145
The work presented in this study was carried out in order to characterise the
morphology of the dentinal collagen ultrastructure in primary and permanent control
teeth, and affected OI and DI teeth using AFM. Dentine is a calcified tissue where
collagen fibrils are covered by hydroxyapatite and non-collagenous matrix proteins.
In order to reveal dentinal collagen ultrastructure, it is essential to ensure that
demineralisation protocols used does not affect the morphology of the fibrils
themselves. At the same time, it is also important that all non-collagenous proteins
are removed so that topological assessment of collagen can be performed.
In this study, the first objective was to evaluate the demineralisation protocols for
control permanent teeth. Four demineralisation protocols were evaluated;
1) published protocol in which blocks of dentine were treated with 10 vol%
citric acid for 15 s and 6.5 vol% NaOCLaq for 120s;
2) experimental protocol in which dentine blocks were treated with
commercial etchant (37% phosphoric acid) and subsequent treatment with
6.5 vol% NaOCLaq for 100s. Raman spectroscopy was used to assess the
degree of demineralisation.
3) demineralisation protocol where teeth were stored in 17% EDTA for a 12
month period before being histology sectioned and stained with Picrosirius
red; and
4) demineralisation protocol in which dentine blocks was treated with EDTA
for 10 minutes.
AFM observation revealed well-defined collagen fibril networks during the topological
assessment of demineralised dentine using commercial etchant (37% phosphoric
acid) and 6.5 vol% of NaOCI. In this particular experimental group, Raman
spectroscopy was used to assess the degree of demineralisation of the dentine as a
function of exposure time to commercial etchant. The results revealed that at 5

146
minutes, significant changes in mineral can be obtained. Further controlled
deproteinisation protocol was required to allow the feasibility of collagen fibrils by
using 6.5 vol% NaOCI. In comparison with the published protocol using 10 vol% citric
acid and NaOCI, the images that recorded using AFM were very poor in contrast and
we were not able to reproduce details on the dentinal collagen fibrils. Likewise, the
results on the control permanent tooth treated by 17% EDTA for 12 months also
failed to generate good quality images by the AFM. Therefore, SEM was used as an
alternative method to reveal the topological changes on the dentine surface. Direct
comparison between the four protocols proved that all of the protocols achieved
partial or complete demineralised dentine as verified by AFM and SEM.
Next, the evaluation of demineralisation protocols in primary teeth was carried out.
The results in both protocols with acid etching (citric/commercial etchant) and
deproteinising agent (NaOCI) enabled imaging of a defined dentinal collagen scaffold
with interlocking between collagen fibrils. A shorter protocol for chemical treatment in
primary teeth showed a significant difference in the chemical reaction between
primary and permanent teeth. When the teeth were exposed to the same time and
concentration of EDTA, the microscopic observation under SEM suggested that there
were differences between primary and permanent teeth. An interesting finding in the
primary teeth stored in 17% EDTA for 12 months was the preservation of the
collagen fibrils, as it was hypothesised that they would denature as the result of lower
mineral content. This hypothesis still needs to be confirmed in the future work.
It is important to highlight that the intention to evaluate the demineralisation protocols
for both primary and permanent teeth was to determine the most suitable method to
reveal dentinal collagen fibrils without causing any denaturation of the structure. The
established method was applied to obtain further information about the collagen
fibrils organisation under high magnification microscope. Chapter 3 and chapter 4

147
compared the reaction of demineralisation protocols between primary and permanent
teeth. The most appropriate method was then used to demineralise the DI Type I
teeth and provide a tool to characterise the morphology of the dentinal collagen
ultrastructure in affected teeth using AFM.
In the ultrastucture findings of the DI Type I tooth, the results showed that only acid
treatment protocol was needed to image the dentinal collagen. The AFM images
revealed an area of thickened dentinal collagen fibrils that was only distributed in one
direction. No obvious fibrils interlocking were noticed. The D-banding periodicity of
these collagen fibres resulted in a wide range distribution between 62nm to 85nm
with mean value of 64.7nm ± 8.4nm that can be hypothesised to produce a less
regular pattern of collagen fibrils.
The difference in dentinal collagen fibril arrangement and wide range distribution on
affected primary tooth can contribute to the diversity of defects in collagen formation
in DI type I. This characteristic may lead to an alteration in mineralization. This type
of DI has an associated with the mutation of genes that encode collagen type I. In
another form of DI, which is not associated with OI, the gene involved appears to be
from mutation in the gene encoding dentine sialophosphoprotein (DSPP). In this
condition, the differentiated odontoblasts may secrete irregular predentine matrix
which is not conducive to form normal mineralisation of tissue and may produce
dentine at a faster rate which would explain the frequent pulp obliteration in DI teeth.
With the limitation of the sample size in this study, the interpretation of the analysis
must be viewed with caution. However it forms the basis for future work that is
currently underway to collect more teeth and identify more ultrastructure features of
dentinal collagen in DI Type I, such as the diameter of collagen fibrils, and
subsequently linking these features to the alteration in the nanoscale mechanical
behaviour of Type I collagen.

148
Clinical consideration and implication
The utilization of composite resin systems in dentistry has dramatically increased the
improvements in physical and mechanical properties of tooth-coloured restorations.
Because of these advancements, contemporary restorative materials and techniques
allow minimal preparation of tooth structure and improvement in the longevity and
aesthetics of the restoration. A key factor for the clinical outcome of bonded aesthetic
restoration is the ability of the adhesive system to prevent the opening of the
interfacial gaps.
The adhesive system is based on a process that includes two phases. When acid is
applied to the enamel and dentine, the inorganic substances and the mineral
components are partially removed, exposing the collagen mesh. It is followed by the
hybridization phase, where the adhesive penetrates and infiltrates into the dentine to
form the hybrid layer. The acid etching is fundamental for effective bonding and times
for application, concentration and composition of acidic solution should be carefully
controlled. The contemporary method reported that 15 seconds application of 30-
40% orthophosphoric acid was required in order to provide a better substrate for
bonding to dental adhesives (Buonocore, 1955). Unfortunately, manufacturers do not
provide specific instructions for the use of their adhesives in primary dentition, even
though some microstructural and micro- mechanical characteristics of dentine in
primary teeth differ from those of permanent teeth.
In this study, the results of different demineralisation protocols for acid etching of
permanent and primary teeth showed that a longer time is needed in order to expose
the collagen of the dentine. Significant differences of demineralisation techniques
were observed between primary and permanent teeth. The topography of the dentine
surfaces were obtained with AFM and SEM on the samples with different etching
times and etching agent. When the commercial etchant was applied, the results

149
showed that the effective etching time of the dentine surface appears to be 2 minutes
for the primary teeth and 5 minutes for the permanent teeth. The inorganic
substances changes can be seen after 1 minute of acid exposure for both primary
and permanent teeth. Yet, at these points, the smear layers have not been removed
completely. These showed that the conventional etching times of 15 seconds prove
to be insufficient. Based on the results obtained, it could be suggested that a longer
etching time may have beneficial effects on the performance of composite
restorations.
During the restorative procedure, it is also necessary to uncover the collagen and
expose the dentinal tubules so that resin can infiltrate into the partially demineralised
dentine and form a hybrid layer (intercalation between dentine surface and resin).
This study prove that etching and controlled deproteinisation of dentine with sodium
hypochlorite enabled the in situ imaging of fibrous network of partially demineralised
dentine collagen by AFM. The effects of sodium hypochlorite on partially
demineralised dentine exposed the collagen fibrils. The results demonstrated that
etching alone would not completely open the dentinal tubules since they remain filled
with the protein, whereas deproteinisation alone does not open the tubules since
mineral binds with the proteins. In relevance to the bonding system, this may lead to
a suggestion that deproteinisation may allow better penetration of resin into partially
demineralised dentine that has been exposed by etching. This hypothesis still needs
to be confirmed through well conducted randomized clinical trials in order to evaluate
the effects of deproteinisation of etched dentine on adhesive restoration.
EDTA is generally accepted as the most effective chelating agent and also used as
demineralising agent. On the basis of the clinical etching procedures, this study
demonstrated the demineralisation effect caused by EDTA on the structure of
primary and permanent dentine. The action is not selective for removal of smear

150
layer but also demineralised the dentine surface. These can provide space for
dentine infiltration and so that such hybrid layer can be formed. However, when the
samples were stored longer in EDTA solution, excessive demineralisation effects
were observed in which it can more likely affect the sealing ability of adhesive
material. This study leads to the suggestion that EDTA could be a potential etching
agent provided that the dentine were expose for the appropriate time. Longer etching
times will result in formation of a thicker hybrid layer, leading to an unstable
demineralised zone and consequently increasing the susceptibility of restoration
failure.
In summary, this study has elucidated the effects of demineralising agents on the
dentine surface. Current dentine bonding systems rely on hybrid layer formation by
acid etching procedure that mainly involves 37% phosphoric acid for 15 seconds. In
this study, optimal etching time (37% phosphoric acid) to enable imaging of collagen
was shown to be at 2 minutes for primary teeth and 5 minutes for permanent teeth. It
also showed that controlled deproteinisation facilitates the exposed collagen fibrils.
Ideally, the application of etching will remove the smear layer and is followed by
demineralisation of the dentine surface so that the network of collagen can be
revealed. Although most studies use common acids such as citric acid, phosphoric
acid and maleic acid, in this study the use of EDTA as an etching agent was
observed. Based on the results obtained, EDTA also can provide the same effects as
the other demineralising agents. Further studies are necessary to determine the
effect of bond strength of restorative materials for agents that were used in this study.

151
Future work
The comparison of the demineralisation protocols on both primary and permanent
teeth was validated using the direct comparison between AFM (citric acid/
commercial etchant) and SEM (EDTA) images. Future work of gaining images from
both tools for each of the demineralisation group is strongly recommended. However
the difficulties in obtaining quality images from experimental work in test samples
stored in long term application of EDTA would probably necessitate the development
of an additional protocol so that the samples were fixed upon the preparation.
Since the comparison of samples using EDTA was generated in two different groups;
long term application of EDTA and another group treated for just 10 minutes, an
assay of the exposure time of 17% EDTA is highly suggested. Such techniques
would prove benefits in order to monitor the topological changes of the dentine
surface in achieving collagen fibrils without any detrimental effect of the structure.
Finally, with the limitation expansion of the experimental work due to the restricted
sample size, increasing the number of DI Type I teeth would permit an accurate
description and understanding on the morphology of the affected dentinal collagen,
and allow subsequent impact to the mechanical properties of the collagen. With a
better understanding of the collagen structure in OI associated with DI, it is an
effective tools to provide information on the importance of structure- properties
relationship of collagen fibrils in clinical relevant such as in restorative treatment.
Our findings confirm that etching and controlled deproteinisation protocols enabled
collagen imaging for both primary and permanent teeth. On the basis of the
experiments that have been performed on the control teeth, it can be summarised
that the most effective time for etching using commercial etchant was at 5 minutes for
permanent teeth and 2 minutes for primary. The optimum deproteinisation time was

152
ranged between 80s to 100 seconds. This protocol appeared to prove that there were
no obvious sign of collagen fibrils degradation suggesting that the demineralisation
protocol will be adequate for DI/OI teeth.
Establishing a demineralisation protocol was the first step required in order to
elucidate the dentinal collagen ultrastructure in OI and DI patients. This study found
an ultrastucture variation in the DI Type I primary tooth. Further work will establish
the ultrastructure features of dentinal collagen using larger sample sizes and relate
these features to the mechanical properties of the collagen in the dentine.

153
CHAPTER 7: REFERENCES

154
A. BOSKEY, L. SPEVAK, M. TAN, S.B. DOTY & BUTLER, W. T. 2000. Dentin sialoprotein (DSP) has limited effects on in vitro apatite formation and growth. Calcif. Tissue Int., 67, 472-478.
ADDY, M. & MOSTAFA, P. 1988. Dentine hypersensitivity. I. Effects produced by the uptake in vitro of metal ions, fluoride and formaldehyde onto dentine. J Oral Rehab, 15, 575-85.
ANGKER, L., SWAIN, M. V. & KILPATRICK, N. 2003. Micro-mechanical characterisation of the properties of primary tooth dentine. J Dent, 31, 261-7.
AVERY, J. K. (ed.) 2002. Oral development and histology: Thieme.
BALOOCH, M., HABELITZ, S., KINNEY, J. H., MARSHALL, S. J. & MARSHALL, G. W. 2008. Mechanical properties of mineralized collagen fibrils as influenced by demineralization. J Struct Biol, 162, 404-10.
BANK, R. A., TEKOPPELE, J. M., JANUS, G. J., WASSEN, M. H., PRUIJS, H. E., VAN DER SLUIJS, H. A. & SAKKERS, R. J. 2000. Pyridinium cross-links in bone of patients with osteogenesis imperfecta: evidence of a normal intrafibrillar collagen packing. J Bone Miner Res, 15, 1330-6.
BARRON, M. J., MCDONNELL, S. T., MACKIE, I. & DIXON, M. J. 2008. Hereditary dentine disorders: dentinogenesis imperfecta and dentine dysplasia. Orphanet J Rare Dis, 3, 31.
BEN AMOR, M., RAUCH, F., MONTI, E. & ANTONIAZZI, F. 2013. Osteogenesis imperfecta. Pediatr Endocrinol Rev, 10 Suppl 2, 397-405.
BERTASSONI, L. E., MARSHALL, G. W. & SWAIN, M. V. 2012. Mechanical heterogeneity of dentin at different length scales as determined by AFM phase contrast. Micron, 43, 1364-71.
BIXLER, D. (ed.) 1976. Heritable disorders affecting dentin: Mosby.
BORDIN-AYKROYD, S., SEFRON, J. & DAVIES, E. 1992. In vitro bond strengths of three current dentin adhesives to primary and permanent teeth. J Dent Mater 8, 74-78.
BOZEC, L., DE GROOT, J., ODLYHA, M., NICHOLLS, B., NESBITT, S., FLANAGAN, A. & HORTON, M. 2005. Atomic force microscopy of collagen structure in bone and dentine revealed by osteoclastic resorption. Ultramicroscopy, 105, 79-89.
BUONOCORE, M. G. 1955. A simple method of increasing the adhesion of acrylic filling materials to enamel surfaces. J Dent Res, 34, 849-53.
BUTLER, W. T. & RITCHIE, H. 1995. The nature and functional signiticance of dentin extracellular matrix proteins. Int. J. Dev. Bioi, 39, 169-179.
BYEN, M. & SUGAYA, A. 1994. Fluorescent Di-I shows odontoblast process length and crown-root differences. J Dent Res, 73, 121.

155
BYERS, P.H (ed.) 1993. Connective Tissue and Its Heritable Disorder; Molecular, Genetic and Medical Aspects.: Wiley-Liss.
BYERS, P. H. 1995. Etiology of osteogenesis imperfecta: an overview of biochemical and molecular genetic analyses. Connect Tissue Res, 31, 257-9.
BYERS, P. H. 2000. Osteogenesis imperfecta: perspectives and opportunities. Curr Opin Pediatr, 12, 603-9.
BYERS, P. H. & PYOTT, S. M. 2012. Recessively inherited forms of osteogenesis imperfecta. Annu Rev Genet, 46, 475-97.
BYERS, P. H., STARMAN, B. J., COHN, D. H. & HORWITZ, A. L. 1988. A novel mutation causes a perinatal lethal form of osteogenesis imperfecta. An insertion in one alpha 1(I) collagen allele (COL1A1). J Biol Chem, 263, 7855-61.
CABRAL, W. A., CHANG, W., BARNES, A. M., WEIS, M., SCOTT, M. A., LEIKIN, S., MAKAREEVA, E., KUZNETSOVA, N. V., ROSENBAUM, K. N., TIFFT, C. J., BULAS, D. I., KOZMA, C., SMITH, P. A., EYRE, D. R. & MARINI, J. C. 2007a. Prolyl 3-hydroxylase 1 deficiency causes a recessive metabolic bone disorder resembling lethal/severe osteogenesis imperfecta. Nat Genet, 39, 359-65.
CABRAL, W. A., CHANG, W., BARNES, A. M., WEIS, M., SCOTT, M. A., LEIKIN, S., MAKAREEVA, E., KUZNETSOVA, N. V., ROSENBAUM, K. N., TIFFT, C. J., BULAS, D. I., KOZMA, C., SMITH, P. A., EYRE, D. R. & MARINI, J. C. 2007b. Prolyl 3-hydroxylase 1 deficiency causes a recessive metabolic bone disorder resembling lethal/severe osteogenesis imperfecta. Nat Genet, 39, 359-65.
CALT, S. & SERPER, A. 2002. Time-dependent effects of EDTA on dentin structures. J Endod, 28, 17-9.
CARBONARE DALLE L, G. S. 2004. Bone microarchitecture as an important determinant of bone strength. J Endocrinol Invest., 27.
CARVALHO, R. M., YOSHIYAMA, M., PASHLEY, E. L. & PASHLEY, D. H. 1996. In vitro study on the dimensional changes of human dentine after demineralization. Archives of oral biology, 41, 369-77.
CASSELLA, J. P. & ALI, S. Y. 1992. Abnormal collagen and mineral formation in osteogenesis imperfecta. Bone Miner, 17, 123-8.
CASSELLA, J. P., BARBER, P., CATTERALL, A. C. & ALI, S. Y. 1994. A morphometric analysis of osteoid collagen fibril diameter in osteogenesis imperfecta. Bone, 15, 329-34.
CHERNOFF, E.A.G & CHERNOFF., D. A. 1992. Atomic force microscope images of collagen fibers. J. Vac. Sci. Technol. A, 10, 596–599.
CHOWDHARY, N. & REDDY, V. S. 2010 Dentin comparison in primary and permanent molars under transmitted and polarised light microscopy: an in vitro study. J Indian Soc Pedod Prev Dent., 28, 167-172.

156
COOLEY, R. L. & DODGE, W. W. 1989. Bond strength of three dentinal adhesives on recently extracted versus aged teeth. Quintessence international, 20, 513-6.
CORRER, G. M., ALONSO, R. C., GRANDO, M. F., BORGES, A. F. & PUPPIN-RONTANI, R. M. 2006. Effect of sodium hypochlorite on primary dentin--a scanning electron microscopy (SEM) evaluation. J Dent, 34, 454-9.
CORRER, G. M., PUPPIN-RONTANI, R. M., CORRER-SOBRINHO, L., SINHORET, M. A. & CONSANI, S. 2004. Effect of sodium hypochlorite on dentin bonding in primary teeth. J Adhsive Dent, 6, 307-12.
CURY, J. A., BRAGOTTO, C. & VALDRIGHI, L. 1981. The demineralizing efficiency of EDTA solutions on dentin. I. Influence of pH. Oral Surg Oral Med Oral Pathol, 52, 446-8.
EISENBURGER, M., SHELLIS, R. P. & ADDY, M. 2004. Scanning electron microscopy of softened enamel. Caries research, 38, 67-74.
EL FENINAT, F., ELLIS, T. H., SACHER, E. & STANGEL, I. 1998. Moisture-dependent renaturation of collagen in phosphoric acid etched human dentin. J Biomed Mater Res, 42, 549-53.
EL FENINAT, F., ELLIS, T. H., SACHER, E. & STANGEL, I. 2001. A tapping mode AFM study of collapse and denaturation in dentinal collagen. J Dent Mater, 17, 284-8.
ENGELBERT, R. H., PRUIJS, H. E., BEEMER, F. A. & HELDERS, P. J. 1998. Osteogenesis imperfecta in childhood: treatment strategies. Arch Phys Med Rehabil, 79, 1590-4.
ESTRELA, C., ESTRELA, C. R., BARBIN, E. L., SPANO, J. C., MARCHESAN, M. A. & PECORA, J. D. 2002. Mechanism of action of sodium hypochlorite. Brazil Dent J, 13, 113-7.
FAWZY, A. S. 2010. Variations in collagen fibrils network structure and surface dehydration of acid demineralized intertubular dentin: effect of dentin depth and air-exposure time. J Dent Mater, 26, 35-43.
GAJIKO-GALICKA, A. 2002. Mutation in type I collagen genes resulting in Osteogenesis Imperfecta in human. Acta Biochem, 49, 433-441.
GARBEROGLIO, R. & BRANNSTROM, M. 1976a. Scanning electron microscopic investigation of human dentinal tubules. . Arch Oral Biol, 21, 355-362.
GARBEROGLIO, R. & BRANNSTROM, M. 1976b. Scanning electron microscopic investigation of human dentinal tubules. . Arch Oral Biol, 21, 355-362.
GATEVA, N. & ROSSITZA, K. 2012. Hybrid Layer Thickness in Primary and Permanent Teeth- A Comparison Between Total Etch Adhesives. Jof MAB, 18, 191-199.
GIRAUD-GUILLE, M. M. 1988. Twisted plywood architecture of collagen fibrils in human compact bone osteons. Calcified tissue international, 42, 167-80.
GLORIEUX, F. H. 2008. Osteogenesis imperfecta. Best Pract Res Clin Rheumatol, 22, 85-100.

157
GOODIS, H. E., MARSHALL, G. W., JR., WHITE, J. M., GEE, L., HORNBERGER, B. & MARSHALL, S. J. 1993. Storage effects on dentin permeability and shear bond strengths. Dental materials : official publication of the Academy of Dental Materials, 9, 79-84.
GOTLIV, ROBACH JS & A, V. 2006. The composition and structure of bovine peritubular dentin: mapping by time of flight secondary ion mass spectroscopy. J Struct Biol. , 156, 320-333.
GW MARSHALL, JR, M. S., KINNEY JH & M., B. 1997. The dentin substrate: structure and properties related to bonding. J Dent. Res, 25, 441-458.
GWINNETT, A. J. 1994. Dentin bond strength after air drying and rewetting. Am J Dent, 7, 144-8.
GWINNETT, A. J. & KANCA, J. A., 3RD 1992. Micromorphology of the bonded dentin interface and its relationship to bond strength. Am J Dent, 5, 73-7.
HABELITZ, S., B.J. RODRIGUEZ, S.J. MARSHALL, G.W. MARSHALL, S.V. KALININ & GRUVERMAN3, A. 2007. Peritubular Dentin Lacks Piezoelectricity. J Dent Res, 86, 908-911.
HABELITZ, S., BALOOCH, M., MARSHALL, S. J., BALOOCH, G. & MARSHALL, G. W., JR. 2002. In situ atomic force microscopy of partially demineralized human dentin collagen fibrils. J Struct Biol, 138, 227-36.
HABELITZ, S., MARSHALL, S. J., MARSHALL, G. W., JR. & BALOOCH, M. 2001. Mechanical properties of human dental enamel on the nanometre scale. Arch Oral Biol, 46, 173-83.
HALL, R. K., MANIERE, M. C., PALAMARA, J. & HEMMERLE, J. 2002. Odontoblast dysfunction in osteogenesis imperfecta: an LM, SEM, and ultrastructural study. Connect Tissue Res, 43, 401-5.
HART, P. S. & HART, T. C. 2007. Disorders of human dentin. Cells Tissues Organs, 186, 70-7.
HASHIMOTO, M., OHNO, H., ENDO, K., KAGA, M., SANO, H. & OGUCHI, H. 2000. The effect of hybrid layer thickness on bond strength: demineralized dentin zone of the hybrid layer.J Dent Mater, 16, 406-11.
HENKEL, W. & GLANVILLE, R. W. 1982. Covalent crosslinking between molecules of type I and type III collagen. The involvement of the N-terminal, nonhelical regions of the alpha 1 (I) and alpha 1 (III) chains in the formation of intermolecular crosslinks. Eur J Biochem, 122, 205-13.
HIRAYAMA, A. 1990. Experimental analytical electroni microscopic studies on the quantitative analysis of elemiental concenitrationis in biological thini specimens and its application to dental science. Shlikzan Gahuko, 90, 1019-1036.
HODGE, A. J. & PETRUSKA, J. A. (eds.) 1963. Recent studies with the electron microscope on ordered aggregates of the tropocollagen molecule: Academic Press.

158
HOSOYA, Y., MARSHALL, S. J., WATANABE, L. G. & MARSHALL, G. W. 2000. Microhardness of carious deciduous dentin. Oper Dent, 25, 81-9.
HULSMANN, M., HECKENDORFF, M. & LENNON, A. 2003. Chelating agents in root canal treatment: mode of action and indications for their use. Int Endo J, 36, 810-30.
HURSEY, R. J., JR., WITKOP, C. J., JR., MIKLASHEK, D. & SACKETT, L. M. 1956. Dentinogenesis imperfecta in a racial isolate with multiple hereditary defects. Oral Surg Oral Med Oral Pathol, 9, 641-58.
JOHNSEN, D. (ed.) 1988. Comparisoni of primary and permanent teeth. In: Oral developmeint and histology: Philadelphia: B.C. Decker.
JONES, C. J., CUMMINGS, C., BALL, J. & BEIGHTON, P. 1984. Collagen defect of bone in osteogenesis imperfecta (Type I). An electron microscopic study. Clin Orthop Relat Res, 208-14.
JUNQUEIRA, L. C., BIGNOLAS, G. & BRENTANI, R. R. 1979. Picrosirius staining plus polarization microscopy, a specific method for collagen detection in tissue sections. Histochem J, 11, 447-55.
KADLER, K. 2007. Collagen pretzels revealed by electron microscopy. Biochem J, 404, e7-8.
KADLER, K. E., HOLMES, D. F., TROTTER, J. A. & CHAPMAN, J. A. 1996. Collagen fibril formation. Biochem J, 316 ( Pt 1), 1-11.
KANCA, J., 3RD 1992. Resin bonding to wet substrate. 1. Bonding to dentin. Quintessence Int, 23, 39-41.
KARAN, K., YAO, X., XU, C. & WANG, Y. 2009. Chemical profile of the dentin substrate in non-carious cervical lesions. Dental materials : official publication of the Academy of Dental Materials, 25, 1205-12.
KELLER, D. & CUNG, C. C. 1991. Reconstruction of STM and AFM images distorted by finite-size tip. Surface Science, 253, 353-364.
KENNEDY, W. A., WALKER, W. A., 3RD & GOUGH, R. W. 1986. Smear layer removal effects on apical leakage. J Endod, 12, 21-7.
KIERNAN, J. A. (ed.) 1981. Histological and Histochemical Methods, Theory and Practice: Pergamon Press, Oxford.
KIM, J. W. & SIMMER, J. P. 2007. Hereditary dentin defects. J Dent Res, 86, 392-9.
KINNEY, J. H., BALOOCH, M., HAUPT, D. L., JR., MARSHALL, S. J. & MARSHALL, G. W., JR. 1995. Mineral distribution and dimensional changes in human dentin during demineralization. J Dent Res, 74, 1179-84.
KINNEY, J. H., BALOOCH, M., MARSHALL, G. W. & MARSHALL, S. J. 1993. Atomic-force microscopic study of dimensional changes in human dentine during drying. Arch Oral Biol, 38, 1003-7.

159
KINNEY, J. H., POPLE, J. A., MARSHALL, G. W. & MARSHALL, S. J. 2001. Collagen orientation and crystallite size in human dentin: a small angle X-ray scattering study. Calcified tissue international, 69, 31-7.
KNOTT, L. & BAILEY, A. J. 1998. Collagen cross-links in mineralizing tissues: a review of their chemistry, function, and clinical relevance. Bone, 22, 181-7.
KOUTSI V, NOONAN RG, HORNER JA, SIMPSON MD, MATTHEWS WG & DH, P. 1994. The effect of dentin depth on the permeability and ultrastructure of primary molars. Pediatric Dent Material, 16, 29-35.
KOUTSI, V., NOONAN, R. G., HORNER, J. A., SIMPSON, M. D., MATTHEWS, W. G. & PASHLEY, D. H. 1994. The effect of dentin depth on the permeability and ultrastructure of primary molars. Pediatr Dent, 16, 29-35.
KRAMER, I. R. H. 1951. The distribution of collagen fistrils in the dentin matrix. Brit. Dent. J, 91, 1-7.
LEBLOND, C. P. 1989. Synthesis and secretion of collagen by cells of connective tissue, bone, and dentin. The Anatomical record, 224, 123-38.
LEE, J. J., NETTEY-MARBELL, A., COOK, A., JR., PIMENTA, L. A., LEONARD, R. & RITTER, A. V. 2007. Using extracted teeth for research: the effect of storage medium and sterilization on dentin bond strengths. Am Dent J, 138, 1599-603.
LEES, S., CAPEL, M., HUKINS, D. W. & MOOK, H. A. 1997. Effect of sodium chloride solutions on mineralized and unmineralized turkey leg tendon. Calcified tissue international, 61, 74-6.
LEGEROS, R. Z. 1991. Calcium phosphates in oral biology and medicine. Monographs in oral science, 15, 1-201.
LEVIN, L. S., LEAF, S. H., JELMINI, R. J., ROSE, J. J. & ROSENBAUM, K. N. 1983. Dentinogenesis imperfecta in the Brandywine isolate (DI type III): clinical, radiologic, and scanning electron microscopic studies of the dentition. Oral Surg Oral Med Oral Pathol, 56, 267-74.
LIN, C. P., DOUGLAS, W. H. & ERLANDSEN, S. L. 1993. Scanning electron microscopy of type I collagen at the dentin-enamel junction of human teeth. J Histochem Cytochem, 41, 381-8.
LINDE, A. 1989. Dentin matrix proteins: composition and possible functions in calcification. . Anat Rec, 224, 154-166.
LINDE, A. & GOLDBERG, M. 1993. Dentinogenesis. Critical Reviews in Oral Biology and Medicine,, 4, 679-728.
LUND, A. M., JENSEN, B. L., NIELSEN, L. A. & SKOVBY, F. 1998. Dental manifestations of osteogenesis imperfecta and abnormalities of collagen I metabolism. J Craniofacial Genet and Dev Bio , 18, 30-7.

160
LYGIDAKIS, N. A., SMITH, R. & OULIS, C. J. 1996. Scanning electron microscopy of teeth in osteogenesis imperfecta type I. Oral Surg Oral Med Oral Pathol Oral Radiol Endod, 81, 567-72.
M. MACDOUGALL, D. SIMMONS, X. LUAN, J. NYDEGGER, J. FENG & GU, T. T. 1997. Dentin phosphoprotein and dentin sialoprotein are cleavage products expressed from a single transcript coded by a gene on human chromosome 4. Dentin phosphoprotein DNA sequence determination). J. Biol. Chem, 272, 835-842.
MA, S., CAI, J., ZHAN, X. & WU, Y. 2009. Effects of etchant on the nanostructure of dentin: an atomic force microscope study. Scanning, 31, 28-34.
MACDOUGALL M, JEFFORDS LG, GU TT, KNIGHT CB, FREI G, REUS BE, OTTERUD B, LEPPERT M & RJ., L. 1999. Genetic linkage of the dentinogenesis imperfecta type III locus to chromosome 4q. J Dent Res, 78, 1277-1282.
MAJORANA, A., BARDELLINI, E., BRUNELLI, P. C., LACAITA, M., CAZZOLLA, A. P. & FAVIA, G. 2010. Dentinogenesis imperfecta in children with osteogenesis imperfecta: a clinical and ultrastructural study. Int J Paediatr Dent, 20, 112-8.
MALMGREN, B., LINDSKOG, S., ELGADI, A. & NORGREN, S. 2004. Clinical, histopathologic, and genetic investigation in two large families with dentinogenesis imperfecta type II. Hum Genet, 114, 491-8.
MALMGREN, B. & NORGREN, S. 2002. Dental aberrations in children and adolescents with osteogenesis imperfecta. Acta odontologica Scandinavica, 60, 65-71.
MARENDING, M., LUDER, H. U., BRUNNER, T. J., KNECHT, S., STARK, W. J. & ZEHNDER, M. 2007. Effect of sodium hypochlorite on human root dentine--mechanical, chemical and structural evaluation. Int Endo J, 40, 786-93.
MARINI, J. (ed.) 2004. Osteogenesis Imperfecta: Philadelphia:Sauders.
MARINI, J. C., FORLINO, A., CABRAL, W. A., BARNES, A. M., SAN ANTONIO, J. D., MILGROM, S., HYLAND, J. C., KORKKO, J., PROCKOP, D. J., DE PAEPE, A., COUCKE, P., SYMOENS, S., GLORIEUX, F. H., ROUGHLEY, P. J., LUND, A. M., KUURILA-SVAHN, K., HARTIKKA, H., COHN, D. H., KRAKOW, D., MOTTES, M., SCHWARZE, U., CHEN, D., YANG, K., KUSLICH, C., TROENDLE, J., DALGLEISH, R. & BYERS, P. H. 2007. Consortium for osteogenesis imperfecta mutations in the helical domain of type I collagen: regions rich in lethal mutations align with collagen binding sites for integrins and proteoglycans. Hum Mutat, 28, 209-21.
MARSHALL, G., MARSHALL, S., KINNEY, J. & BALOOCH, M. 1997a. The dentin substrate: structure and properties related to bonding. J Dentist, 25, 441-458.
MARSHALL, G., MARSHALL, S., KINNEY, J. & BALOOCH, M. 1997b. The dentin substrate: structure and properties related to bonding. J Dentist 25, 441-458.
MARSHALL, G. W., JR., BALOOCH, M., TENCH, R. J., KINNEY, J. H. & MARSHALL, S. J. 1993. Atomic force microscopy of acid effects on dentin. J Dent Mater, 9, 265-8.
161
MARSHALL, G. W., JR., INAI, N., WU-MAGIDI, I. C., BALOOCH, M., KINNEY, J. H., TAGAMI, J. & MARSHALL, S. J. 1997c. Dentin demineralization: effects of dentin depth, pH and different acids. J Dent Mater, 13, 338-43.
MARSHALL, G. W., YUCEL, N., BALOOCH, M., KINNEY, J. H., HABELITZ, S. & MARSHALL, A. 2001. Sodium Hypochlorite alterations of dentine and dentine collagen. Surf Science, 491, 444-455.
MCKEE MD, ADDISON WN & MT, K. 2005. Hierarchies of extracellular matrix and mineral organization in bone of the craniofacial complex and skeleton. Cells Tissues Organs, 181, 176-188.
MILAN A.M, SUGARS R.V, EMBERY G & R.J, W. 2006. Adsorption and interactions of dentine phosphoprotein with hydroxyapatite and collagen. Eur. J. Oral. Sci, 114, 223-231.
MINOR, R. 1980. Collagen metabolism:a comparison of disease of collagen and disease affecting collagen. Am J Patho, 98, 227-280.
MJÖR, I. & NORDAHL, I. 1996. The density and branching of dentinal tubules in human teeth. Arch Oral Biol, 41, 401-412.
MJÖR, I. A. 2009. Dentin Permeability: The Basis for Understanding Pulp Reactions and Adhesive Technology. Braz Dent J, 20, 3-16.
MORELLO, R., BERTIN, T. K., CHEN, Y., HICKS, J., TONACHINI, L., MONTICONE, M., CASTAGNOLA, P., RAUCH, F., GLORIEUX, F. H., VRANKA, J., BACHINGER, H. P., PACE, J. M., SCHWARZE, U., BYERS, P. H., WEIS, M., FERNANDES, R. J., EYRE, D. R., YAO, Z., BOYCE, B. F. & LEE, B. 2006. CRTAP is required for prolyl 3- hydroxylation and mutations cause recessive osteogenesis imperfecta. Cell, 127, 291-304.
MORGAN A, BOZEC L, NG Y-L & K, G. 2010. Development of an ex-vivo model to study the nature and depth of changes in dentine following sodium hypochlorite root canal irrigation. Int Endo J, 43.
MUNDLOS, S., CHAN, D., WENG, Y. M., SILLENCE, D. O., COLE, W. G. & BATEMAN, J. F. 1996. Multiexon deletions in the type I collagen COL1A2 gene in osteogenesis imperfecta type IB. Molecules containing the shortened alpha2(I) chains show differential incorporation into the bone and skin extracellular matrix. J Biol Chem, 271, 21068-74.
N'OR J. E, R.J. FEIGAL, J.B. DENNISON' & EDWARDS, C. A. 1996. Dentin Bonding:SEM Comparison of the Resin-Dentin Interface in Primary and Permanent Teeth. J Dent Res, 75, 1396-1403.
NAKABAYASHI, N., KOJIMA, K. & MASUHARA, E. 1982. The promotion of adhesion by the infiltration of monomers into tooth substrates. J Biomed Mater Res, 16, 265-73.
NAKABAYASHI, N., NAKAMURA, M. & YASUDA, N. 1991. Hybrid layer as a dentin-bonding mechanism. J Esth Dent, 3, 133-8.

162
NAKABAYASHI, N. & PASHLEY, A. (eds.) 1998. A Hybridization of Dental Hard Tissues: Tokyo:Quintessence.
NAKABAYASHI, N., WATANABE, A. & IGARASHI, K. 2004. AFM observation of collapse and expansion of phosphoric acid-demineralized dentin. J Biomed Material. Part A, 68, 558-65.
NANCI, A. (ed.) 2008. Ten Cate's Oral Histology, Development, Structure, and Function: Mosby.
NOR, J. E., FEIGAL, R. J., DENNISON, J. B. & EDWARDS, C. A. 1996. Dentin bonding: SEM comparison of the resin-dentin interface in primary and permanent teeth. J Dent Res, 75, 1396-403.
O’DRISCOLL , C., DOWKER SEP, ANDERSON P, WILSON RM & K, G. 2002. Effects of sodium hypochlorite on root dentine composition. J Mat Sci, 13, 219-223.
OLIVEIRA, L. D., CARVALHO, C. A., NUNES, W., VALERA, M. C., CAMARGO, C. H. & JORGE, A. O. 2007. Effects of chlorhexidine and sodium hypochlorite on the microhardness of root canal dentin. Oral surgery, oral medicine, oral pathology, oral radiology, and endodontics, 104, e125-8.
OPSAHL VITAL, S., GAUCHER, C., BARDET, C., ROWE, P. S., GEORGE, A., LINGLART, A. & CHAUSSAIN, C. 2012. Tooth dentin defects reflect genetic disorders affecting bone mineralization. Bone, 50, 989-97.
OSORIO, R., AGUILERA, F. S., OTERO, P. R., ROMERO, M., OSORIO, E., GARCIA-GODOY, F. & TOLEDANO, M. 2010. Primary dentin etching time, bond strength and ultra-structure characterization of dentin surfaces. J Dent, 38, 222-31.
OSTBY, N. 1957. Chelating in Root Canal Therapy. Odont. Tidskr, 65, 3-11.
OXLUND, H., BARCKMAN, M., ORTOFT, G. & ANDREASSEN, T. T. 1995. Reduced concentrations of collagen cross-links are associated with reduced strength of bone. Bone, 17, 365S-371S.
PARMAR, G. & CHHATARIYA, A. 2004. Demineralising effect of EDTA at different concentration and pH – a spectrophotometer study. Endod 2004, 16, 54-57.
PASHLEY, D. H. 1991. Clinical correlations of dentin structure and function. J Pros Dent, 66, 777-81.
PASHLEY, D. H. 1992. Smear layer: overview of structure and function. Proceedings of the Finnish Dental Society. Suomen Hammaslaakariseuran toimituksia, 88 Suppl 1, 215-24.
PASHLEY, D. H., CIUCCHI, B., SANO, H., CARVALHO, R. M. & RUSSELL, C. M. 1995. Bond strength versus dentine structure: a modelling approach. Arch Oral Biol, 40, 1109-18.
PASHLEY, D. H., CIUCCHI, B., SANO, H. & HORNER, J. A. 1993. Permeability of dentin to adhesive agents. Quintessence Int, 24, 618-31.

163
PERDIGAO, J., LAMBRECHTS, P., VAN MEERBEEK, B., TOME, A. R., VANHERLE, G. & LOPES, A. B. 1996. Morphological field emission-SEM study of the effect of six phosphoric acid etching agents on human dentin. Dental materials : official publication of the Academy of Dental Materials, 12, 262-71.
PERDIGAO, J. & LOPES, M. 2001. The Effect of Etching Time on Dentine Demineralisation. Quintessence Int, 32, 19-26.
PERDIGAO, J., THOMPSON, J. Y., TOLEDANO, M. & OSORIO, R. 1999. An ultra-morphological characterization of collagen-depleted etched dentin. Am J Dent, 12, 250-5.
PIOCH, T., GARCIA-GODOY, F., DUSCHNER, H., KOCH, M. J., STAEHLE, H. J. & DORFER, C. E. 2003. Effect of cavity preparation instruments (oscillating or rotating) on the composite-dentin interface in primary teeth. J Dent Mater, 19, 259-63.
PROCKOP, D. J., CONSTANTINOU, C. D., DOMBROWSKI, K. E., HOJIMA, Y., KADLER, K. E., KUIVANIEMI, H., TROMP, G. & VOGEL, B. E. 1989. Type I procollagen: the gene-protein system that harbors most of the mutations causing osteogenesis imperfecta and probably more common heritable disorders of connective tissue. Am J Med Genet, 34, 60-7.
QIN, C., BABA O & WT., B. 2004. Post-translational modifications of sibling proteins and their roles in osteogenesis and dentinogenesis. Crit Rev Oral Biol Med, 15, 126-136.
RAMIREZ-BOMMER, C., GULABIVALA K, FIGUIEREDO JAP & A, Y. 2007. The influence of sodium hypochlorite and EDTA on the chemical composition of dentine. Int Endo J, 40, 404-405.
RAUCH, F. & GLORIEUX, F. H. 2004. Osteogenesis imperfecta. Lancet, 363, 1377-85.
REST, M. V. D. & GARRONE, R. 1991a. Collagen family of proteins. FASEB J. , 5, 2814-2823.
SAITO, M. & MARUMO, K. 2010. Collagen cross-links as a determinant of bone quality: a possible explanation for bone fragility in aging, osteoporosis, and diabetes mellitus. Osteoporos Int, 21, 195-214.
SARATHCHANDRA, P. & POPE, F. M. 2005. Unexpected ultrastructral changes in bone osteiod collagens in osteogenesis imperfecta. Micron, 36, 696-702.
SARATHCHANDRA, P., POPE, F. M. & ALI, S. Y. 1999. Morphometric analysis of type I collagen fibrils in the osteoid of osteogenesis imperfecta. Calcified tissue international, 65, 390-5.
SARATHCHANDRA, P., POPE, F. M., KAYSER, M. V. & ALI, S. Y. 2000. A light and electron microscopic study of osteogenesis imperfecta bone samples, with reference to collagen chemistry and clinical phenotype. J Pathol, 192, 385-95.
SARDELLA, T. N., DE CASTRO, F. L., SANABE, M. E. & HEBLING, J. 2005. Shortening of primary dentin etching time and its implication on bond strength. J Dent, 33, 355-62.
164
SASAKI, L. H., LOBO, P. D., MORIYAMA, Y., WATANABE, I. S., VILLAVERDE, A. B., TANAKA, C. S., MORIYAMA, E. H. & BRUGNERA, A., JR. 2008. Tensile bond strength and SEM analysis of enamel etched with Er:YAG laser and phosphoric acid: a comparative study in vitro. Brazil Dent J, 19, 57-61.
SAUK, J. J. 1980. Immunohistochemical localization of C-chain collagen peptides in gingiva and the dental-epithelial attachment. J Dent Res, 59, 1997-8.
SCHMITT, F. D., C. E., HALL, A. & JAKNS., M. A. 1942. Electron microscopy investigations of the structure of collagens. . J. Cell. Comp. Physiol., 20, 11–33.
SPENCER, P., WANG, Y., WALKER, M. P. & SWAFFORD, J. R. 2001. Molecular structure of acid-etched dentin smear layers--in situ study. J Dent Res, 80, 1802-7.
SERPER, A. & CALT, S. 2002. The demineralizing effects of EDTA at different concentrations and pH. J Endod, 28, 501-2.
SHASHIKIRAN, N. D., GUNDA, S. & SUBBA REDDY, V. V. 2002. Comparison of resin-dentine interface in primary and permanent teeth for three different durations of dentine etching. J Indian Soc Pedod Prev Dent, 20, 124-31.
SHIELDS, E. D., BIXLER, D. & EL-KAFRAWY, A. M. 1973. A proposed classification for heritable human dentine defects with a description of a new entity. Arch Oral Biol, 18, 543-53.
SILLENCE, D. O., RIMOIN, D. L. & DANKS, D. M. 1979a. Clinical variability in osteogenesis imperfecta-variable expressivity or genetic heterogeneity. Birth defects original article series, 15, 113-29.
SILLENCE, D. O., SENN, A. & DANKS, D. M. 1979b. Genetic heterogeneity in osteogenesis imperfecta. J Med Genet, 16, 101-16.
SILVER, F. H., FREEMAN, J. W. & SEEHRA, G. P. 2003. Collagen self-assembly and the development of tendon mechanical properties. J Biomech, 36, 1529-53.
SILVER, F. H. & LANDIS, W. J. 2011. Deposition of apatite in mineralizing vertebrate extracellular matrices: A model of possible nucleation sites on type I collagen. Connect Tissue Res, 52, 242-54.
SIM, T., KNOWLES JC, NG YL, SHELTON J & K., G. 2001. Effect of sodium hypochlorite on mechanical properties of dentine and tooth surface strain. Int Endod J. 2001, 34, 120-132.
SMITH, J. 1968. Molecular pattern in native collagen. J Nat, 219, 157-158.
STARMAN, B. J., EYRE, D., CHARBONNEAU, H., HARRYLOCK, M., WEIS, M. A., WEISS, L., GRAHAM, J. M., JR. & BYERS, P. H. 1989. Osteogenesis imperfecta. The position of substitution for glycine by cysteine in the triple helical domain of the pro alpha 1(I) chains of type I collagen determines the clinical phenotype. J Clin Invest, 84, 1206-14.

165
STEINER, R. D., ADSIT, J. & BASEL, D. 1993. COL1A1/2-Related Osteogenesis Imperfecta(Book Chapter)
STEVE WEINER, ARTHUR VEIS, ELIA BENIASH, TALMON ARAD, JERRY W. DILLON, BORIS SABSAY & SIDDIQUI, F. 1999. Peritubular Dentin Formation: Crystal Organization and the Macromolecular Constituents in Human Teeth. J Struct Biol, 126, 27-41.
STRAWN, S. E., WHITE, J. M., MARSHALL, G. W., GEE, L., GOODIS, H. E. & MARSHALL, S. J. 1996. Spectroscopic changes in human dentine exposed to various storage solutions--short term. J Dent, 24, 417-23.
SUMIKAWA, D., MARSHALL, G., GEE, L. & MARSHALL, S. 1999. Microstructure of primary tooth dentin. Pediatr Dent, 21, 439-444.
TIDMARSH, B. G. 1981. Contents of human dentine tubules. Int Endo J, 14, 191-196.
TOLEDANO, M., OSORIO, R., PERDIGAO, J., ROSALES, J. I., THOMPSON, J. Y. & CABRERIZO-VILCHEZ, M. A. 1999. Effect of acid etching and collagen removal on dentin wettability and roughness. J Bio Mat Res, 47, 198-203.
TRAUB, W., ARAD, T., VETTER, U. & WEINER, S. 1994. Ultrastructural studies of bones from patients with osteogenesis imperfecta. Matrix Biol, 14, 337-45.
TSUDA, H. & ARENDS, J. 1997. Raman spectroscopy in dental research: a short review of recent studies. Advances in dental research, 11, 539-47.
TSUDA, H., JONGEBLOED, W. L., STOKROOS, I. & ARENDS, J. 1993. Combined Raman and SEM study on CaF2 formed on/in enamel by APF treatments. Caries research, 27, 445-54.
TSUDA, H., RUBEN, J. & ARENDS, J. 1996. Raman spectra of human dentin mineral. Europe J Oral Scien, 104, 123-31.
TZAPHLIDOU, M. 2008. Bone architecture: collagen structure and calcium/phosphorus maps. J Biol Phys, 34, 39-49.
VAN DIJK, F. S., PALS, G., VAN RIJN, R. R., NIKKELS, P. G. & COBBEN, J. M. 2010. Classification of Osteogenesis Imperfecta revisited. Eur J Med Genet, 53, 1-5.
VAN MEERBEEK, B., INOKOSHI, S., BRAEM, M., LAMBRECHTS, P. & VANHERLE, G. 1992. Morphological aspects of the resin-dentin interdiffusion zone with different dentin adhesive systems. J Dent Res, 71, 1530-40.
VAN MEERBEEK, B., YOSHIDA, Y., SNAUWAERT, J., HELLEMANS, L., LAMBRECHTS, P., VANHERLE, G., WAKASA, K. & PASHLEY, D. H. 1999. Hybridization effectiveness of a two-step versus a three-step smear layer removing adhesive system examined correlatively by TEM and AFM. J Adhesive Dent, 1, 7-23.
VEECO (ed.) 2000. Dimension 3100 Manual.
WALLACE, J. M. 2012. Applications of atomic force microscopy for the assessment of nanoscale morphological and mechanical properties of bone. Bone, 50, 420-7.

166
WALTIMO, J. 1994. Hyperfibers and vesicles in dentin matrix in dentinogenesis imperfecta (DI) associated with osteogenesis imperfecta (OI). J Oral Pathol Med, 23, 389-93.
WALTIMO, J. 1996. Unusual forms of collagen in human dentin. Matrix Biol, 15, 53-6.
WALTIMO, J., OJANOTKO-HARRI, A. & LUKINMAA, P. L. 1996. Mild forms of dentinogenesis imperfecta in association with osteogenesis imperfecta as characterized by light and transmission electron microscopy. J Oral Pathol Med, 25, 256-64.
WANG, L. J., TANG, R., BONSTEIN, T., BUSH, P. & NANCOLLAS, G. H. 2006. Enamel demineralization in primary and permanent teeth. J Dent Res, 85, 359-63.
WASSEN, M. H., LAMMENS, J., TEKOPPELE, J. M., SAKKERS, R. J., LIU, Z., VERBOUT, A. J. & BANK, R. A. 2000. Collagen structure regulates fibril mineralization in osteogenesis as revealed by cross-link patterns in calcifying callus. Journal of bone and mineral research : the official journal of the American Society for Bone and Mineral Research, 15, 1776-85.
WESS, T. J., HAMMERSLEY, A. P., WESS, L. & MILLER, A. 1998. Molecular packing of type I collagen in tendon. J Mol Bio, 275, 255-67.
WHITE, J. M., GOODIS, H. E., MARSHALL, S. J. & MARSHALL, G. W. 1994. Sterilization of teeth by gamma radiation. J Dent Res, 73, 1560-7.
WITKOP, C. J., JR. 1975. Hereditary defects of dentin. Dent Clin North Am, 19, 25-45.
WITKOP, C. J., JR., MACLEAN, C. J., SCHMIDT, P. J. & HENRY, J. L. 1966. Medical and dental findings in the Brandywine isolate. Ala J Med Sci, 3, 382-403.
XIAO, S., YU, C., CHOU, X., YUAN, W., WANG, Y., BU, L., FU, G., QIAN, M., YANG, J., SHI, Y., HU, L., HAN, B., WANG, Z., HUANG, W., LIU, J., CHEN, Z., ZHAO, G. & KONG, X. 2001. Dentinogenesis imperfecta 1 with or without progressive hearing loss is associated with distinct mutations in DSPP. Nat Genet, 27, 201-4.

167
CHAPTER 8: APPENDIX

168
Appendix 1

169

170

171
Appendix 2
Version 1
Study Number Patient Identification Number for this trial: ………
PARENTCONSENT FORM
Title of Project:
A Study of the genotype and phenotype in Amelogenesis Imperfecta& Dentinogenesis Imperfecta
Name of Researchers: Dr Susan Parekh, Dr Agnes Bloch-Zupan, Dr Peter Brett, Dr Laurent Bozec, Miss Amanda O`Donnell, MashaelAbdullatif, Nurjehan Mohamed Ibrahim and NabilahHarith. _________________________________________________________________________________
Please initial box
1. I confirm that I have read and understood the information sheet dated 21/12/10
(version 1) for the study. I have been allowed some time to think about this, ask questions, and have had these answered in a way that I understand.
2. I understand that my child’s is voluntary and that I am free to withdraw at
any time, without giving any reason , without their medical care or legal rights being affected.
3 . I understand that sections of any medical notes may be looked at by the researchers
and responsible individuals from regulatory authorities where it is relevant to my child taking part in research. I give permission for these individuals to have access to my child’s records.
4. I give permission to the investigators to pass clinical data collected from my child’s
examination to my General Practitioner or General Dental Practitioner
5. I understand that the samples taken from my child may be stored and used for the
purpose of further research at a later date. I understand that these results will also remain anonymous.
6. I understand that (this project or future research) will include genetic research aimed at
understanding the genetic influences on dental defects in children.
7. I agree for my child to take part in the above study.
The Eastman Dental Hospital 256 Gray's Inn road London WC1X 8LD
Telephone: 020 3456 7899 Direct Line: 020-3456-1067
Fax: 020-3456-2329
Web-site: www.uclh.nhs.uk

172
_______________ ________________ ____________________________________________ Name of Patient Date Signature of parent _________________ ________________ __________________________________________ Name of Person Date Signature taking consent When completed, 1 for patient; 1 for researcher site file; 1 (original) to be kept in medical notes
For further information about this study please contact Dr Susan Parekh
Phone : 020 3456 1067 email: [email protected]
UCLH welcomes feedback from their patients who have been involved in research. In the first
instance, you should inform the Principal Investigator. If you are not satisfied with the
response of the research team then you should address your complaints to the UCLH
complaints manager at UCLH postal address or through our website
http://www.uclh.nhs.uk/Contact+us/. To help us identify the research study you have been
involved in, please mention the title and the name of the research doctor or principal
investigator. You can find this information on the Patient Information Sheet.

173
Appendix 3
Dental anomalies proforma
Study ID:.............................
Date of clinic:……………………. Pt sticker:
Clinician name:……………………………..
Ethnicity: White Mixed Black Asian Chinese
Other....................................................
Referred by: GDP CDS HDS GP
Other:………………………………..
c/o: Nil pain sens appearance
Other:………………………..
Relevant medical history:………………………………………………………..
...................................................................................................................
.......................................................................................................................................
.....................
Fluoride history: supp Y/N water Y/N toothpaste child/adult
Dental history: restn Y/N ext Y/N LA Y/N sed Y/N GA Y/N
Family history (inc family tree): Plaque
score:
Extra-oral features: Skeletal pattern I II III
Hair: normal/sparse skin:…………………
face:…………. hands/nails:…………. Other:……………
Introral features: lips gingiva palate m
ucosa sali

174
Eruption: early Y/N delayed Y/N infraoccluded Y/N
impacted Y/N
General/local Mild/mod/sev; teeth:……….
Teeth:…………….
Occlusion: Class I Class IIi ClassIIii ClassIII OJ= OB:
complete / incomplete
AOB Y/N
Dentine:
discoloured: Y/N abscess: Y/N tooth wear: mild / mod / sev
(which teeth):
Enamel:
18 17 16 15 14 13 12 11 21 22 23 24 25 26 27 28
DDE index:
Location (L): 1
incisal ½;
2 gingival ½; 3
whole surface.
Demarcation of
defect (D): 1
demarcated;2
diffuse;3 both
55 54 53 52 51 61 62 63 64 65 Extent of defect(E):
1<⅓;2⅓ – ⅔;3 at
least ⅔.
Wear:mildmild;
Sevsevere
85 84 83 82 81 71 72 73 74 75
48 47 46 45 44 43 42 41 31 32 33 34 35 36 37 37
Type of defect:0 normal;1 opacity (white/cream);2 opacity (yellow/brown);3 hypoplasia (pits); 4 hypoplasia
(horizontal grooves);5 hypoplasia (vertical groves);6 hypoplasia (missing enamel);7discoloured enamel (not
assoc. with opacity);8 post-eruptive breakdown;9 other defects;

175
Number /Form /size:
Radiographic findings: taurodont Y/N thin enamel Y/N
short roots Y/N pulp stones Y/N
apical area Y/N resorption Y/N
Diagnosis:
Proposed treatment plan:
Treatment to date:
Allocated to:
Review on anomalies clinic: Y/N when?
Photographs Y/N Saliva Y/N
Consents : Y/N
18 17 16 15 14 13 12 11 21 22 23 24 25 26 27 28
55 54 53 52 51 61 62 63 64 65
85 84 83 82 81 71 72 73 74 75
48 47 46 45 44 43 42 41 31 32 33 34 35 36 37 37
con conical;shovshovel;dbldouble;rog rounded or bulbous;taptapered;cet talon cusp;can abnormal
cusp;nocnotched;micmicrodont;macmicrodont;invinvagination;envevagination;mihenlarged mamelons;pem
enamel pearls;supsupernumerary;hyphypodontia
Copyright © 2022 FDOKUMEN