Treatment of Alzheimer’s Disease with Anti-Homocysteic acid Antibody
Upload
independentCategory
view
1download
0
Demyelination in Mild Cognitive Impairment SuggestsProgression Path to Alzheimer’s DiseaseCristian Carmeli1, Alessia Donati2, Valerie Antille3, Dragana Viceic4, Joseph Ghika4, Armin von Gunten2,
Stephanie Clarke3, Reto Meuli5,6, Richard S. Frackowiak1, Maria G. Knyazeva1,6*
1 LREN, Department of Clinical Neurosciences, Centre Hospitalier Universitaire Vaudois (CHUV), and University of Lausanne, Lausanne, Switzerland, 2 Service of Old Age
Psychiatry, Department of Psychiatry, Centre Hospitalier Universitaire Vaudois (CHUV) and University of Lausanne, Switzerland, 3Neuropsychology and
Neurorehabilitation Service, Department of Clinical Neurosciences, Centre Hospitalier Universitaire Vaudois (CHUV) and University of Lausanne, Lausanne, Switzerland,
4Neurology Service, Department of Clinical Neurosciences, Centre Hospitalier Universitaire Vaudois (CHUV) and University of Lausanne, Lausanne, Switzerland, 5CIBM
(Centre d’Imagerie Biomedicale), CHUV unit, Lausanne, Switzerland, 6Department of Radiology, Centre Hospitalier Universitaire Vaudois (CHUV), and University of
Lausanne, Lausanne, Switzerland
Abstract
The preclinical Alzheimer’s disease (AD) - amnestic mild cognitive impairment (MCI) - is manifested by phenotypes classifiedinto exclusively memory (single-domain) MCI (sMCI) and multiple-domain MCI (mMCI). We suggest that typical MCI-to-ADprogression occurs through the sMCI-to-mMCI sequence as a result of the extension of initial pathological processes. Tosupport this hypothesis, we assess myelin content with a Magnetization Transfer Ratio (MTR) in 21 sMCI and 21 mMCIpatients and in 42 age-, sex-, and education-matched controls. A conjunction analysis revealed MTR reduction shared bysMCI and mMCI groups in the medial temporal lobe and posterior structures including white matter (WM: splenium,posterior corona radiata) and gray matter (GM: hippocampus; parahippocampal and lingual gyri). A disjunction analysisshowed the spread of demyelination to prefrontal WM and insula GM in executive mMCI. Our findings suggest thatdemyelination starts in the structures affected by neurofibrillary pathology; its presence correlates with the clinical pictureand indicates the method of MCI-to-AD progression. In vivo staging of preclinical AD can be developed in terms of WM/GMdemyelination.
Citation: Carmeli C, Donati A, Antille V, Viceic D, Ghika J, et al. (2013) Demyelination in Mild Cognitive Impairment Suggests Progression Path to Alzheimer’sDisease. PLoS ONE 8(8): e72759. doi:10.1371/journal.pone.0072759
Editor: Yong He, Beijing Normal University, Beijing, China
Received April 19, 2013; Accepted July 16, 2013; Published August 30, 2013
Copyright: � 2013 Carmeli et al. This is an open-access article distributed under the terms of the Creative Commons Attribution License, which permitsunrestricted use, distribution, and reproduction in any medium, provided the original author and source are credited.
Funding: This work was supported by the Swiss National Foundation Grants No 320030-127538/1 and 3200B0-122263. The funders had no role in study design,data collection and analysis, decision to publish, or preparation of the manuscript.
Competing Interests: The authors have declared that no competing interests exist.
* E-mail: [email protected]
Introduction
In the last decade, mild cognitive impairment (MCI) has
received special attention as a likely precursor of Alzheimer’s
disease (AD). MCI is classified into several phenotypic subtypes, of
which the amnestic (aMCI) is the most strongly linked to AD [1],
[2], [3]. Within this category, there are a number of forms varying
from an exclusive memory deficit (single-domain aMCI or sMCI
hereafter) to its combinations with inadequate performance in
other cognitive domain(s) (multiple-domain aMCI or mMCI
hereafter). The typical progression to AD starts with memory and
learning problems, followed by deficits in executive functions,
language, and praxis; ultimately, the entire cognitive sphere is
affected [4], [5], [6]. Consistent with this dynamic, sMCI shows a
higher incidence of improvement and carries a lower risk of
conversion to AD than does mMCI [7], [8], [9], [10].
Yet this cognition-based classification is diagnostically unstable
and has limited predictive validity in the general population [10],
[11], [12]. Better performance is to be expected from an improved
understanding of the neurobiological substrates of clinical aMCI
phenotypes. To this end, neuroimaging of gray matter (GM) has
been used. Volumetric voxel-based morphometry (VBM) studies
have shown GM atrophy to be mainly restricted to the medial
temporal lobe (MTL) in sMCI in contrast to a more extensive
pattern of atrophy in mMCI individuals [13], [14]. A more recent
VBM study of an aMCI population failed to show GM atrophy in
sMCI, but did demonstrate atrophy in the hippocampus and
temporal and frontal cortices in mMCI subjects [15]. Thus, the
limited literature reporting on GM atrophy in aMCI suggests that
individuals with this clinical syndrome may pass through different
stages in progressing to AD [16].
When cortical cells die, their axons degenerate, so there must be
destruction of myelin sheaths and failure of inter-regional cortical
connectivity. In AD, white matter (WM) damage spreads in a
relatively predictable pattern, with the latest structures to mature
being the first to degenerate [16], [17], [18], [19]. The
accompanying failure of cerebral connectivity interferes with
cognition [20], [21], [22], so that extension of demyelination is to
be expected in the progression from sMCI to mMCI.
To estimate the structural integrity of cerebral connections in
aMCI, diffusion tensor imaging (DTI) has been used widely [23],
[24], [25], [26], [27], reviewed in [28], [29]. The WM
abnormalities are consistently found in posterior regions including
the MTL, the splenium of the corpus callosum (CC), the posterior
cingulum, and parietal WM, i.e., in regions typically affected by
AD. Some authors emphasize that among DTI parameters, radial
PLOS ONE | www.plosone.org 1 August 2013 | Volume 8 | Issue 8 | e72759

diffusivity, associated with myelin breakdown, is particularly
sensitive to aging and MCI-related WM changes [30], [31],
[27]. Alternatively, myelin breakdown can be estimated by
magnetization transfer imaging (MTI), which provides a myelin-
based contrast independent of the spatial organization of WM
fibers [32]. MTI permits an accurate evaluation of demyelination
in aging and in populations with myelination abnormalities [33],
[34], [22]. Animal models and postmortem studies of patients with
AD or multiple sclerosis document that both DTI and MTI
correlate with demyelination and axonal loss [33], [35], [36]. For
whole brain mapping, MTI is an optimal choice, because it does
not depend on fiber orientation and preserves accuracy through-
out the entire brain space. Thus far, neither DTI nor MTI results
have been compared between aMCI subtypes.
In this study, we therefore analyze the myelination state across
different aMCI subtypes. The analysis framework is based on the
hypothesis that demyelination in the progression from aMCI to
AD originates from a single source and follows a common
scenario. At the clinical level, this is manifested by a uniformly
ordered sequence of cumulative cognitive deficits, beginning with
an initially affected cognitive domain [37], [38]. Based on
structure-function relationships, we take the multiplicity of affected
cognitive domains to be the result of this spread of an initial local
pathological process in the brain. If the hypothesis of ‘‘single
source–common path’’ is correct for typical aMCI-to-AD progres-
sion, a common region of demyelination should exist in all aMCI
subtypes. The subsequent spread of demyelination can be deduced
from a comparison between mMCI and sMCI subjects (Fig. 1). It
should be mentioned that by suggesting typical aMCI-to-AD
progression path, the hypothesis implies neither equivalence
between MCI and AD, nor strict uniformity of the progression
path.
Predictions from the ‘‘single source–common path’’ hypothesis
include (1) a conjoint region of demyelination across the entire
aMCI sample and (2) a differential pattern of regional demyelination
in mMCI that represents its spread along a typical path from
aMCI to mMCI. To test these predictions formally, we use
conjunction/disjunction MTI analysis of both subcortical WM
and intracortical myelin.
Methods
2.1. Ethics StatementAll investigative methods and procedures applied in this study
conform to the Declaration of Helsinki (1964) of the World
Medical Association concerning human experimentation. The
authors state that they have obtained approval from the local
Ethics Committee of Lausanne University. All study subjects gave
written informed consent at the time of enrollment for the research
project 320030-127538/1 ‘‘Cerebral network function in neuro-
degeneration: A multimodal approach’’ funded by Swiss National
Science Foundation. All potential participants who declined to
participate or otherwise did not participate were eligible for
treatment and were not disadvantaged in any other way by not
participating in the study. The consent capacity of MCI subjects
and controls has been determined by the physician (JG or AvG)
and neuropsychologist (VA or AD) based on the interview of a
potential subject (supplemented, when possible, by that of an
informant in the case of MCI) and confirmed by a comprehensive
neuropsychological assessment of the subject’s cognitive abilities
(see Section 2.3.). All controls and MCI subjects from the sample
reported here were able to understand the essential information
about the research project and to make and communicate a valid
consent.
2.2. MCI and Control SubjectsHere we present cross-sectional results of a larger study that
includes a follow-up analysis of demyelination in the sample
screened for clinical MCI syndrome. Considering demyelination
pattern as a potential biomarker for AD pathology, we avoided
restricting our clinical MCI sample by introducing other
biomarkers to qualify underlying AD pathology. Forty-two
subjects (50 years and older) diagnosed with MCI were recruited
from the Memory Clinic of the Neurology service, the Old Age
Psychiatry service, and Neuropsychology and Neurorehabilitation
service of the CHUV in Lausanne, and 42 age-, gender-, and
education-matched control subjects, selected from partners,
caregivers, and family members, were enrolled (Table 1).
The clinical diagnosis of MCI was based on the criteria
proposed by [1] and confirmed in the recent recommendations of
the National Institute on Aging and Alzheimer’s Association
workgroups [39]. The selected aMCI groups were also character-
ized using MRI-based volumetric measurements of the hippo-
campus as a structural biomarker of AD (see Section 3.1.). MCI
was diagnosed in individuals with mild cognitive decline (as
corroborated by an informant), and confirmed by a neuropsycho-
logical examination including the Mini-Mental State Examination
(MMSE). Only individuals who did not satisfy the NINCDS–
ADRDA criteria for AD or other types of dementia were selected
for MCI diagnosis [40]. Specifically, MMSE scores between 24
and 26 for low-level education and between 24 and 28 for high-
level education would qualify. Our MCI sample included single-
domain amnestic MCI (sMCI, 21 subjects) and multiple-domain
amnestic MCI (mMCI, 21 subjects), determined by neuropsycho-
logical testing as described in Section 2.2.
Clinical laboratory investigations and diagnostic neuroimaging
(CT or MRI and Metrizamide SPECT) were performed to
exclude subjects with other causes of cognitive deficit (stroke,
expanding processes, etc.), severe physical illness, psychiatric or
other neurological disorders potentially associated with cognitive
dysfunction, and non-AD dementing conditions (fronto-temporal
dementia, dementia associated with Parkinsonism, Lewy body
disease, pure vascular or prion associated dementia, etc.). Alcohol/
drug abuse and regular use of neuroleptics, antidepressants with
anticholinergic action, benzodiazepines, stimulants, or b-blockerswere also exclusion criteria.
To confirm the absence of psychoactive drug use or other
diseases that interfere with cognitive functions, potential control
subjects underwent a brief clinical interview including the MMSE
and a brain MRI. Only individuals with no cognitive complaints,
normal activities of daily living assessed by the BADL and IADL
scales [41], and an MMSE score $26 for low and $28 for high
level of education were accepted as controls.
2.3. Neuropsychological TestingAll participants were administered an extended battery of
neuropsychological tests, comprehensively covering 5 cognitive
domains (memory, executive functions, language, praxis, and
gnosias). Episodic memory was assessed by a verbal RI-48 and/or
RL/RI 16-item task [42] and by visuo-spatial tasks from the Doors
test (the Doors and People battery [43]). Short-term memory was
assessed by a verbal digit span task [44], a visuo-spatial span task
[45], and the verbal reverse digit span task from the WAIS-III
[46].
To assess executive functions, we used three tests proposed by the
GREFEX manual [47]: a verbal fluency task (categorical and
literal fluency in 2 minutes), a flexibility task (the Trail Making
Test part 2), and an inhibition task (the Stroop test). Language was
assessed by an object denomination (Lexis test, [48]). We assessed
Demyelination in Amnestic MCI
PLOS ONE | www.plosone.org 2 August 2013 | Volume 8 | Issue 8 | e72759

praxis by using a brief clinical scale for gestural abilities of the
upper limbs (the Bbep, [49]). Gnosias were assessed by a test of
discrimination of overlapping figures (subtest of the BEN [50]).
Testing was completed by the Mini-Mental State Examination
(MMSE, [51]) in French adaptation [52]. The BADL/IADL scales
[41] were used to assess the impact of deficits on daily living
Figure 1. Progression of amnestic mild cognitive impairment to Alzheimer’s disease. A represents schematically the typical progressionfrom amnestic MCI to AD manifested at the clinical level by a uniformly ordered sequence of cognitive phenotypes with deficits in domains D1, D2,D3, …, which accumulate in that order beginning with the initially affected memory domain (D1). Ideally, all multiple-domain MCI (mMCI) individualswill show at least D1 (memory deficit designated with yellow circle) and, D2, the next affected domain. If affected cognitive domains accumulate dueto the spreading of an initial local pathological process, the spreading beyond the sMCI stage can be deduced from a comparison between mMCI andsingle-domain MCI (sMCI) groups. However, as shown in B, some mMCI subjects manifest atypical combinations of affected cognitive domains,suggesting causes other than prodromal AD. B depicts a sample of 42 aMCI individuals, 21 of whom (encircled on the left) have sMCI and 21 havemMCI. In the latter group, subjects with atypical clinical phenotypes are in dashed circles. According to the hypothesis of ‘‘single source–commonpath’’ for typical aMCI-to-AD progression, a contrast between sMCI and the largest mMCI subgroup with two common deficits (here D1+ D2) shouldtarget the next stage along the progression path.doi:10.1371/journal.pone.0072759.g001
Table 1. Demographic and clinical characteristics of MCI and control subjects.
Feature sMCI mMCI Executive mMCI Controls Statistical comparisons
# of subjects 21 21 16 42 _
Gender M/W 8/13 8/13 8/8 16/26 *NS **NS ***NS
Age in years 70.461.6 70.861.7 72.962.0 69.461.1 *NS **NS ***NS
Education #1/#2/#3 2/15/4 #1/#2/#3 3/11/7 #1/#2/#3 3/8/5 #1/#2/#3 5/23/14 *NS **NS ***NS
MMSE 286.3 27.36.4 27.26.4 29.06.2 *NS **P,.005 ***P,.0002
BADL 660 660 660 660 *NS **NS ***NS
IADL 860 860 860 860 *NS **NS ***NS
HAD 8.761.1 9.861.7 9.961.9 7.86.8 *NS **NS ***NS
Columns present group characteristics (mean6 standard error of the mean). ‘‘M’’ stands for men, ‘‘W,’’ for women. Educational status was determined by 3 categories: 1– primary/secondary school without or with short (,3 years) professional training; 2 – primary/secondary school with professional training (.3 years); 3– high schooland tertiary education.*stands for the contrast sMCI.mMCI;**for controls.sMCI, and ***controls.mMCI. ‘‘NS’’ stands for ‘‘not significant’’ (P$.05, non-parametric ANOVA with three levels and x2 test with Bonferroni correction forthe three pairs of comparisons). We applied 10000 permutations to estimate the distributions of the t-contrasts. There were no significant differences between any aMCIsubgroups for the parameters presented in the table.doi:10.1371/journal.pone.0072759.t001
Demyelination in Amnestic MCI
PLOS ONE | www.plosone.org 3 August 2013 | Volume 8 | Issue 8 | e72759

activities, and a depression and anxiety self-assessment was done
with the HAD scale [53], to exclude major depression and also to
quantify subtle fluctuations of mood among serial evaluations.
An individual was diagnosed with amnestic MCI if (s)he met the
following three criteria: 1) had at least one score on an episodic
memory task of $1.5 standard deviation (SD) below normative
values; 2) lost #2 points on the BADL/IADL scale; 3) had
24#MMSE#26 for a low level and 24#MMSE#28 for a high
level of education.
The distinction between sMCI and mMCI was based on the
summarized scores of all tests. Individuals with a score $1.5 SD
below the respective normative value in at least one episodic
memory test but normal scores in other domains were classified as
sMCI. Alternatively, individuals with scores below the 1.5 SD in at
least one episodic memory test in association with impaired
performance in at least one other domain were considered mMCI.
2.4. Magnetic Resonance ImagingAll MCI and control subjects were scanned on a 3 Tesla
Siemens Trio scanner with a 32-channel head coil. A high-
resolution T1-weighted two inversion-contrast Magnetization
Prepared Rapid Gradient Echo (MP2RAGE) sequence was
acquired (TR=5000 ms, TE=2.84 ms, FoV=25662406160,
voxel size = 16161.2 mm3). The MP2RAGE acquisition corrects
B1 field inhomogeneities for T1-mapping [54]. MTI was acquired
through Multiple echo Fast Low Angle SHot (FLASH) Magnetic
Resonance Imaging (TR=48ms, TEs= 2.33, 5.3, 8.2, 11.2, 14.2,
17.1, 20.1, 23.1 ms; FoV=1206128696, voxel size = 26262
mm3) as described in [55]. The protocol included running this
gradient-echo sequence twice: first with and then without a radio-
frequency (RF) pulse. Since the effect of MT depends mainly on
restricting the mobility of water protons by macromolecules, a
large contribution comes from myelin [32]. Water protons bound
to macromolecules exhibit a much broader absorption spectrum
than free-water protons when saturated using an off-resonance RF
pulse. Consequently, MT will be weaker with the RF pulse applied
than without. The resulting contrast allows for quantification of
the amount of myelin with the MT ratio (MTR) [32].
We averaged multiple (8 TEs) gradient echo MTI acquisitions
to increase signal-to-noise ratio [56]. These images were co-
registered to the high-resolution MP2RAGE T1w scans. We
calculated the MTR in every voxel (vol = 8 mm3) using the
expression
MTR~(M0{MS)
M0� 100,
where M0 stands for the intensity of a voxel without saturation and
MS with saturation. By definition, the ratio indicates the
percentage loss of signal intensity attributable to the MT effect.
Since this effect is mainly dependent on myelin [32] a decrease in
MTR values is considered to be a sign of demyelination.
For population analysis, the MTR images of each subject were
non-linearly transformed to standard MNI space using the
diffeomorphic registration algorithm (DARTEL; [57]) implement-
ed in SPM8 (www.fil.ion.ucl.ac.uk/spm). The applied DARTEL
flow field was previously estimated by the simultaneous inter-
subject alignment of gray matter (GM) and white matter (WM)
maps, resulting from the segmentation of the T1-weighted images
into GM, WM, and cerebrospinal fluid (CSF) [58]. To enhance
the specificity of tissue class and to account for the partial volume
contribution to each voxel, a combined weighting/smoothing
procedure was implemented [59]. Specifically, for each subject,
the MTR map normalized to MNI space was, first, multiplied by
the normalized tissue maps (GM, WM), second, modulated by the
Jacobian determinant of the DARTEL deformation field, and
third, smoothed with an isotropic Gaussian kernel of 4 mm full-
width at half-maximum (FWHM). Finally, we divided each of the
two MTR maps (GM, WM) by the smoothed, modulated, and
weighted tissue map.
2.5. Statistical Design and InferenceTo exploit the commonality and heterogeneity of the amnestic
MCI cohort, we implemented a conjunction/disjunction inferen-
tial approach [60] through a one-way statistical design with three
levels: sMCI, mMCI, and controls. The logical ‘‘AND’’ (conjunc-
tion) of the two contrasts controls.sMCI and controls.mMCI shows
common structural changes for sMCI and mMCI individuals, i.e.,
core features of the entire MCI group. The structural changes
specific to sMCI or mMCI subjects are revealed by a contrast
between these groups (i.e., the logical ‘‘NOT’’ – disjunction).
The voxel-based statistical analysis was embedded in the
General Linear Model framework of SPM8. To avoid contami-
nation by misclassified voxels, we masked the MTR images by
corresponding tissue maps (GM or WM) thresholded at P= .2.
This threshold ensures the inclusion of voxels most likely
representing the tissue of interest.
Statistical inference was based on the threshold-free cluster
enhancement (TFCE) statistic [61]. Contrary to cluster inference
approaches based on random field theory, the TFCE method
allows cluster-level inference without applying an arbitrary cluster-
forming threshold (thc) and it is robust to non-stationary
smoothness in brain images [62]. TFCE avoids an arbitrary
choice of a single thc value by gathering cluster size information
within the range of possible thc values. The method provides a
voxel-wise image, in which each voxel value represents the
cumulative cluster-like evidence within its spatial neighborhood
over the range of cluster-forming thresholds. To assay inference at
the family-wise error (FWE) significance level of 95%, the null
distribution of the maximum TFCE value across the volumes of
interest (GM, WM) was estimated through 10000 random re-
labelings of group membership (aMCI, mMCI, and controls), and
the 95th percentile of such a null distribution was applied to
threshold the actual TFCE images. The computations were
performed with a TFCE toolbox for Matlab (http://dbm.neuro.
uni-jena.de/tfce/).
We analyzed the association between MTR maps and
neuropsychological scores of interest with multiple linear regres-
sion models. In all the models, age, gender, and level of education
were included as covariates in order to adjust for their impact. In
one model, the MTR maps were regressed with scores from the
delayed cued recall of the RI-48 test, available for 69 subjects (27
MCI and 42 controls) (Table S1). To increase specificity of
changes associated with the delayed recall, we included the
immediate recall score as a covariate. Statistics were performed as
described for the conjunction design.
We estimated the effect size of the cluster-wise conjunction/
disjunction effects through the Mahalanobis distance D, a
multivariate generalization of Cohen’s univariate effect size.
Specifically, D represents the standardized difference between
two groups along the discriminating axis (here, along MTR); for
example, D= 1 means that the two group centroids are one
standard deviation apart along the MTR axis. In the formula
D~ffiffiffiffiffiffiffiffiffiffiffiffiffiffiffi
d ’S{1dp
d is the vector of univariate differences and S is the pooled
Demyelination in Amnestic MCI
PLOS ONE | www.plosone.org 4 August 2013 | Volume 8 | Issue 8 | e72759

covariance matrix. Since there were more voxels than samples at
each cluster of interest, we computed a regularized estimation of S
[63]. Further, as for the magnitude of the effects, we estimated the
precision of D (that is, confidence intervals) through 5000
bootstrap samples [64].
For anatomical labeling we used the AAL atlas [65] and the
ICBM DTI-81 atlas [66].
Results
3.1. Main Neuropsychological and StructuralCharacteristics of aMCI SubtypesConsistent with our diagnostic criteria, both sMCI and mMCI
groups significantly differed from controls on the MMSE scores
(P,.05, Bonferroni corrected) and in episodic memory perfor-
mance (both immediate and delayed cued recall in RI-48) (P,.05,
Bonferroni corrected; Tables 1 and S1). However, these scores did
not differ between aMCI sub-groups. In contrast, executive
functions were impaired not only in sMCI and mMCI compared
to controls (P,.05, Bonferroni corrected), but in mMCI compared
to sMCI (P,.01, Bonferroni corrected; Table S2). The BADL/
IADL and HAD scales did not differ among the three groups.
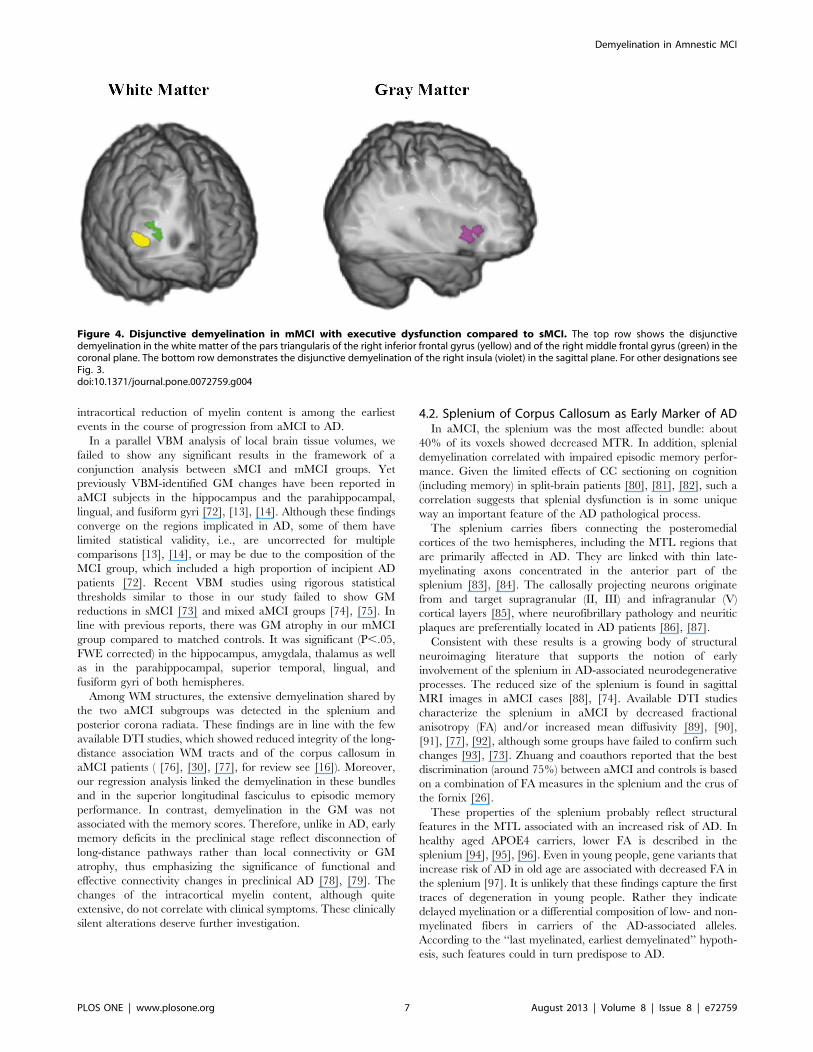
Hippocampal atrophy is an in vivo surrogate indicator of the
neurodegenerative aspect of AD pathology. To validate the
condition of our amnestic MCI sample as a prodromal stage to
AD, we additionally measured the hippocampal volume in all the
participants of this study. The total volume of the hippocampus
was estimated using SPM8 through the following steps. First, a
mask of the two hippocampi in the MNI space was obtained using
the AAL atlas [65]. This mask was projected into each subject’s
space through the inverse deformation fields delivered by the
unified segmentation routine of SPM8. Finally, the individual
volume of the hippocampus corresponded to the amount of voxels
extracted via the subject-specific mask. The estimated hippocam-
pal volumes are shown in Fig. 2. The values in our control group
match those obtained in other cohorts with manual segmentation
and/or automatized techniques [67], [68]. We evaluated the
between-group differences within the framework of the General
Linear Model, including the total intracranial volume as a
covariate. The distribution of the contrasts of interest was
estimated through 109000 permutations. In the sMCI group, the
hippocampal volume was 8% lower than in control subjects at P,0.013, while in mMCI it was 15% lower at P,0.0001. The
average volume reduction in our MCI sample is similar to 11–13%
as previously demonstrated for MCI subjects [69].
3.2. Conjunction and Disjunction Analysis of AmnesticMCIAcross the whole brain volume, we found an MTR decrease at
P,.05 (FWE corrected) in the medial temporal lobe (MTL) and
posterior parts of the brain bilaterally (Fig. 3, Table S3). The
magnitude of the effect size in all significant clusters was reliably
large (Table S4). Specifically, among the WM structures (Fig. 3,
top row), the splenium of the CC in both hemispheres, and the
right posterior corona radiata (specifically, fibers connecting the
precuneus) showed reduced MTR values. Within the GM
compartment, MTR was decreased in the hippocampus and in
the parahippocampal and lingual gyri bilaterally, but more
extensively in the left hemisphere, as well as in the thalamus and
fusiform gyrus (Fig. 3, bottom row; Table S3).
We found no group-specific clusters differentiating the sMCI
group from the entire mMCI group in any of the two
compartments. Given that some individuals might have had
aMCI due to other than prodromal AD causes (Fig. 1), an
alternative contrast that targets the next stage along the
progression to AD is that between sMCI and the largest
homogenous mMCI subgroup in the population at large.
In our sample, the most numerous category of mMCI subjects
(16 individuals) consisted of those with executive dysfunctions.
Individuals were considered executive mMCI if they had scores
below the 1.5 SD in at least one episodic memory test and one of
the 3 executive tests (see Section 2.3.). In so doing, we also
included patients with additional impairments in other domains. A
post-hoc disjunction analysis showed a significant (P,.05, FWE
corrected) MTR decrease in executive mMCI compared to the
sMCI group in the right prefrontal WM and GM (Fig. 4, Table
S3). Specifically, the disjunctive clusters spanned the WM below
the pars triangularis of the inferior frontal gyrus and the middle
frontal gyrus. In the GM, a disjunctive cluster was located in the
insula. The magnitudes of effect size were large in both
compartments (1.1–4.3 at 95% confidence intervals).
3.3. Classification of Amnestic MCI SubjectsTo evaluate how well MTR maps discriminated between sMCI,
executive mMCI, and controls, we applied a classification
algorithm based on a combined feature selection and linear
discriminant analysis (LDA) approach [70] (for details see Text
S1). We assessed the accuracy of the three binary classifications
controls vs. sMCI, sMCI vs. executive mMCI, and controls vs. executive
mMCI (Table S5) by a leave-one-out cross-validation procedure.
This showed that executive mMCI can be accurately predicted
with respect to controls (accuracy of about 70% for both GM and
WM compartments at P,.0001). The sMCI and executive mMCI
groups were classified with an accuracy of 61%, at P= .055, while
sMCI and controls were not distinguishable. There are potential
technical improvements, including the use of quantitative MTI
[71] and a reduction of feature dimensionality by brain
parcellation that might increase the discriminative potential of
MTI.
Figure 2. Hippocampal volume in control subjects and insubjects with amnestic mild cognitive impairment. The total (lefthemisphere+right hemisphere) volume of the hippocampus is shownfor the control, sMCI and mMCI groups. For each group, the estimatedindividual values are shown with empty black-bordered circles. Theblack lines represent the group mean, the light gray boxes representthe interval spanned by Mean 61 SD, and the dark gray boxes, Mean61.96 SD. Both between-group contrasts (sMCI,Controls and mMCI,-Controls) are significant (for details see Section Results).doi:10.1371/journal.pone.0072759.g002
Demyelination in Amnestic MCI
PLOS ONE | www.plosone.org 5 August 2013 | Volume 8 | Issue 8 | e72759

3.4. Voxel-based MorphometryWe repeated the above-described analysis of GM and WM
volumes, computed by smoothing the modulated GM and WM
T1-weighted images with a Gaussian kernel of 4 mm (FWHM).
The statistical design included total intracranial volume as a
nuisance covariate and the inference was again based on TFCE
statistics (see Section 2.5.). No conjunction or disjunction (across
sMCI, mMCI or executive mMCI) was found (P..05, FWE
corrected).
3.5. Multiple Linear Regression AnalysisThe delayed cued recall scores of the RI-48 test from 69 subjects
explained the MTR reduction in projection, association, and
commissural pathways including the splenium of the CC, the
superior longitudinal fasciculus (predominantly in the right
hemisphere), the posterior corona radiata, the posterior thalamic
radiation, and the fornix of the limbic system bilaterally (Fig. 5 and
S1, Table S6). The MTR in the inferior longitudinal and inferior
fronto-occipital fasciculi and in the precuneus correlated with
episodic memory performance only unilaterally. No correlations
were found in GM.
Discussion
4.1. Demyelination Shared by Single- and Multiple-domain aMCIRegardless of subtype, the aMCI patients showed common sites
of demyelination in both studied cerebral compartments. Specif-
ically, the GM was bilaterally affected in the MTL (including the
hippocampi and the parahippocampal gyri) and in the lingual gyri.
This pattern of changes, together with the hippocampal atrophy
documented in both aMCI groups, is typical for AD and therefore,
consistent with the concept that in most patients aMCI represents
prodromal AD. This observation supports the idea that significant
Figure 3. Conjunctive demyelination in sMCI and mMCI subjects. The conjunction effects are rendered in different colors corresponding todifferent anatomical structures. Here and hereafter, for presentation purposes, the SPM (P,0.05, FWE corrected) is overlaid on a single subject T1-weighted image rendered by means of the mricrogl software (http://www.mccauslandcenter.sc.edu/mricrogl/). The colored regions are projected onthe shown brain section. The top row shows the conjunctive demyelination of the splenium (yellow) and posterior corona radiata (green) in themedial (left) and posterior (right) view. The bottom row shows the conjunctive demyelination of the hippocampus (yellow), the parahippocampalgyrus (violet), and the lingual gyrus (green) in the medial view (left and right hemispheres on the left and right, respectively).doi:10.1371/journal.pone.0072759.g003
Demyelination in Amnestic MCI
PLOS ONE | www.plosone.org 6 August 2013 | Volume 8 | Issue 8 | e72759
intracortical reduction of myelin content is among the earliest
events in the course of progression from aMCI to AD.
In a parallel VBM analysis of local brain tissue volumes, we
failed to show any significant results in the framework of a
conjunction analysis between sMCI and mMCI groups. Yet
previously VBM-identified GM changes have been reported in
aMCI subjects in the hippocampus and the parahippocampal,
lingual, and fusiform gyri [72], [13], [14]. Although these findings
converge on the regions implicated in AD, some of them have
limited statistical validity, i.e., are uncorrected for multiple
comparisons [13], [14], or may be due to the composition of the
MCI group, which included a high proportion of incipient AD
patients [72]. Recent VBM studies using rigorous statistical
thresholds similar to those in our study failed to show GM
reductions in sMCI [73] and mixed aMCI groups [74], [75]. In
line with previous reports, there was GM atrophy in our mMCI
group compared to matched controls. It was significant (P,.05,
FWE corrected) in the hippocampus, amygdala, thalamus as well
as in the parahippocampal, superior temporal, lingual, and
fusiform gyri of both hemispheres.
Among WM structures, the extensive demyelination shared by
the two aMCI subgroups was detected in the splenium and
posterior corona radiata. These findings are in line with the few
available DTI studies, which showed reduced integrity of the long-
distance association WM tracts and of the corpus callosum in
aMCI patients ( [76], [30], [77], for review see [16]). Moreover,
our regression analysis linked the demyelination in these bundles
and in the superior longitudinal fasciculus to episodic memory
performance. In contrast, demyelination in the GM was not
associated with the memory scores. Therefore, unlike in AD, early
memory deficits in the preclinical stage reflect disconnection of
long-distance pathways rather than local connectivity or GM
atrophy, thus emphasizing the significance of functional and
effective connectivity changes in preclinical AD [78], [79]. The
changes of the intracortical myelin content, although quite
extensive, do not correlate with clinical symptoms. These clinically
silent alterations deserve further investigation.
4.2. Splenium of Corpus Callosum as Early Marker of ADIn aMCI, the splenium was the most affected bundle: about
40% of its voxels showed decreased MTR. In addition, splenial
demyelination correlated with impaired episodic memory perfor-
mance. Given the limited effects of CC sectioning on cognition
(including memory) in split-brain patients [80], [81], [82], such a
correlation suggests that splenial dysfunction is in some unique
way an important feature of the AD pathological process.
The splenium carries fibers connecting the posteromedial
cortices of the two hemispheres, including the MTL regions that
are primarily affected in AD. They are linked with thin late-
myelinating axons concentrated in the anterior part of the
splenium [83], [84]. The callosally projecting neurons originate
from and target supragranular (II, III) and infragranular (V)
cortical layers [85], where neurofibrillary pathology and neuritic
plaques are preferentially located in AD patients [86], [87].
Consistent with these results is a growing body of structural
neuroimaging literature that supports the notion of early
involvement of the splenium in AD-associated neurodegenerative
processes. The reduced size of the splenium is found in sagittal
MRI images in aMCI cases [88], [74]. Available DTI studies
characterize the splenium in aMCI by decreased fractional
anisotropy (FA) and/or increased mean diffusivity [89], [90],
[91], [77], [92], although some groups have failed to confirm such
changes [93], [73]. Zhuang and coauthors reported that the best
discrimination (around 75%) between aMCI and controls is based
on a combination of FA measures in the splenium and the crus of
the fornix [26].
These properties of the splenium probably reflect structural
features in the MTL associated with an increased risk of AD. In
healthy aged APOE4 carriers, lower FA is described in the
splenium [94], [95], [96]. Even in young people, gene variants that
increase risk of AD in old age are associated with decreased FA in
the splenium [97]. It is unlikely that these findings capture the first
traces of degeneration in young people. Rather they indicate
delayed myelination or a differential composition of low- and non-
myelinated fibers in carriers of the AD-associated alleles.
According to the ‘‘last myelinated, earliest demyelinated’’ hypoth-
esis, such features could in turn predispose to AD.
Figure 4. Disjunctive demyelination in mMCI with executive dysfunction compared to sMCI. The top row shows the disjunctivedemyelination in the white matter of the pars triangularis of the right inferior frontal gyrus (yellow) and of the right middle frontal gyrus (green) in thecoronal plane. The bottom row demonstrates the disjunctive demyelination of the right insula (violet) in the sagittal plane. For other designations seeFig. 3.doi:10.1371/journal.pone.0072759.g004
Demyelination in Amnestic MCI
PLOS ONE | www.plosone.org 7 August 2013 | Volume 8 | Issue 8 | e72759

Cumulatively, these data run counter to the recent proposal of
Di Paola and colleagues that the posterior CC subregion is
damaged solely by Wallerian degeneration in AD [98]. Instead, we
suggest that both Wallerian degeneration and myelin breakdown,
affecting later-myelinating CC subregions, contribute to the
pathological alterations and dysfunction of the splenium, thus
explaining its early involvement in aMCI-AD. Therefore, being
well defined anatomically, comprehensively studied in human and
animal models, and easily measurable with noninvasive neuroim-
aging techniques, the splenium of the CC represents an attractive
candidate marker of Alzheimer risk and of progression to manifest
disease. One issue that requires definition in future work is the
Figure 5. Statistical parametric map of dependence between episodic memory performance and demyelination. The brain regionswith a voxel-wise positive linear dependence (P,.05, FWE corrected) between MTR and the delayed cued recall in the RI-48 test for 69 subjects arerendered in different colors corresponding to different anatomical structures. For each brain region, a scatterplot of the MTR values of ten voxels withthe highest values of the TFCE statistic are shown for sMCI (circles), mMCI (diamonds), and controls (crosses). The two upper images on the left showthe involved parts of the splenium (in yellow) and of the posterior corona radiata (in green). The average (over the selected ten voxels) slope of thelinear dependence is .13 for the splenium and .12 for the posterior corona radiata, while the average R2 is .29 and .18, respectively. The third image(from the top) shows the dependence map in the white matter of the precuneus (in blue, the sagittal view). The average slope of the lineardependence is .16 and the average R2 is .29 for the precuneus. The bottom brain image shows the longitudinal superior fasciculus, for which theaverage linear slope is .11 and the average R2 is .14.doi:10.1371/journal.pone.0072759.g005
Demyelination in Amnestic MCI
PLOS ONE | www.plosone.org 8 August 2013 | Volume 8 | Issue 8 | e72759

nature of the temporal dynamics of pre-MCI changes in the
splenium in the normal aging population.
4.3. Progression of Demyelination and MCI-AD StagingIn the mMCI group, the hippocampal volume was lower than
in control subjects and in the sMCI group, suggesting progression
of the underlying pathology. If the typical sequence of cognitive
deficits in AD results from the spread of AD pathology throughout
the brain, the largest proportion of mMCI individuals should
present a memory deficit (characteristic of sMCI) and an
additional common deficit. In our sample, the largest mMCI
group (16 subjects) showed memory and executive dysfunctions.
Additional structural changes were expected in the executive
mMCI patients compared to those with sMCI in prefrontal
regions, known to be critical for such functions [99], [100]. Our
disjunction analysis showed significant demyelination in the WM
of the right inferior and middle frontal gyri and in the GM of the
right insula, while there were no differences in GM or WM
volumes. The fact that we and others [14] have failed to find a
differential GM atrophy pattern in sMCI and executive mMCI
suggests that early executive deficits result initially from a partial
disconnection of the prefrontal cortex that precedes its atrophy,
similarly to our sMCI patients with changes in the splenium of the
CC in the absence of posteromedial cortical atrophy in sMCI. A
recently shown reduction in glucose metabolism within distributed
prefrontal networks, correlating with impairment of executive
functions in MCI and AD patients [101], supports this interpre-
tation. In the absence of atrophy, hypo-metabolism can result from
partial isolation of a region due to disconnection.
To answer the question of whether a progression of demyelin-
ation into the prefrontal white matter associated with executive
dysfunction captures the trajectory of AD progression, we must ask
to what extent the predominance of executive mMCI subjects in
our sample reflects the usual progression of pathological events. In
short, is our sample biased? Community studies show that
executive dysfunction is among the earliest signs of preclinical
AD. In the Framingham cohort, which included more than two
thousand individuals followed for 22 years, memory and abstract
reasoning were the best predictors of AD, 10 and 5 years
respectively, before the diagnosis [102]. Chen and coauthors
tracked a non-demented cohort of more than 500 individuals for
10 years [103]. Those diagnosed with AD (68 individuals) showed
earliest decline in memory and executive function 3.5 and 1.5
years before diagnosis, respectively. In the 187 participants of the
Berlin aging study, attentional and executive tests predicted AD
onset better than episodic memory tests 4 years before diagnosis
[104]. Thus, the relative size of our executive mMCI group is
consistent with representative community studies and corresponds
to a common progression from sMCI. We find that it is
characterized by demyelination spreading through the postero-
medial region (in common with sMCI) and the inferior prefrontal
regions.
The existing neurobiological staging of AD, based on the
extension of neurofibrillary pathology, correlates with the deteri-
oration of cognition on a coarse scale [105], [106]. According to
this scheme, the MTL is the anatomical location of initial
pathological changes in AD, which emerge years or even decades
before the diagnosis [107], [108]. An in vivo staging of preclinical
AD based on reliable neuropathological features is currently
unavailable. Our findings suggest that demyelination, which
reflects the loss of inter-regional cortico-cortical and cortico-
subcortical connections, and is quantifiable by MRI, is a candidate
feature that can be used ethically and non-invasively in life. Work
must now be done to generalize the group results we report here to
individual patient studies. As this has already happened in AD
with VBM studies by means of machine learning based
classification algorithms, this is not a far-fetched idea. Demyelin-
ation is initiated in the same structures that accumulate
neurofibrillary pathology, it correlates with clinical features on a
fine scale, and suggests a mechanism for the process of aMCI to
AD progression. Therefore, we suggest that in vivo staging of
preclinical AD by assessment of the spread of WM damage is a
promising route for further research and development.
4.4. Limitations of the StudyIn this cross-sectional study, we consider sMCI and mMCI
samples as the snapshots of underlying pathological process at
different progression stages. We attempt to reconstruct their
natural sequence with the conjunction/disjunction analysis sup-
plemented by a comparative analysis of our findings with the
relevant longitudinal studies of MCI and AD cohorts. Although
our conclusion about sMCI to mMCI to AD as a typical
progression path agrees with the data from available longitudinal
studies, this requires direct confirmation through longitudinal
research. Furthermore, the relevance of amnestic MCI condition
of our subjects to the underlying AD is supported by one of the
early biomarkers – i.e., by the significant reduction of the
hippocampal volume – which effectively predicts AD diagnosis
and progression [109], [110], [67], as well as correlates with the
burden of neuro-fibrillary tangles [111], [112], [113]. However,
hippocampal atrophy does not reliably differentiate AD from
frontotemporal dementia [114]. The imaging of WM may have
better specificity. This calls for further studies comparing the 3D
patterns of demyelination across the various neurodegenerative
diseases of old age. On the other hand, the relationship between
demyelination spread and non-structural biological features of AD
should be detailed. Specifically, our findings can be refined further
based on a strict sample selection due to the application of the new
criteria including biological evidence of AD pathology for aMCI
patients and its absence for control participants.
Supporting Information
Figure S1 Statistical parametric map of dependencebetween episodic memory performance and demyelin-ation. Brain regions with a significant positive voxel-wise
dependence (P,.05, FWE corrected) between MTR and the
delayed cued recall in the RI-48 test for 69 subjects are rendered
in different colors corresponding to different anatomical structures.
The involved parts of the posterior thalamic radiation (cyan) and
of the fornix (violet) are shown in the coronal view. For the
posterior thalamic radiation, the average linear slope is.11 and the
average R2 is.12. For the fornix, the average linear slope is.13 and
the R2 is.10. For other designations see Fig. 2.
(TIF)
Table S1 Neuropsychological memory scores of amnestic MCI
and control subjects. Columns present group characteristics (mean
6 standard error, ‘‘n’’ stands for a number of subjects). Statistical
comparisons are reported as for Table 1. ‘‘NS’’ stands for ‘‘not
significant’’ (P$.05). *refers to sMCI.mMCI, **, controls.sMCI,
and ***, controls.mMCI.
(DOCX)
Table S2 Neuropsychological executive scores of aMCI and
control subjects. * refers to sMCI vs. executive mMCI, ** sMCI vs.
controls, and *** executive mMCI vs. controls. For other
designations see Tables 1 and S1.
(DOCX)
Demyelination in Amnestic MCI
PLOS ONE | www.plosone.org 9 August 2013 | Volume 8 | Issue 8 | e72759

Table S3 Demyelination in amnestic MCI patients: Conjunc-
tion/Disjunction effects. The table shows the number of voxels
with significant changes of MTR (P,.05, FWE corrected) and
their percentage relative to the total number of voxels spanning
respective anatomical structure based on the AAL atlas [62] and
the ICBM DTI-81 atlas [63]. Anatomical structures with the size
of affected volume $1% are included. For other designations see
Tables 1 and S1.
(DOCX)
Table S4 Effect size of MTR decrease common to sMCI and
mMCI. The multivariate effect size D (Mahalanobis distance, see
Section 2.4.) and 95% confidence interval (CI) are reported for the
conjunction effect in WM and GM. The lower end of all
confidence intervals is larger than 1, showing that all effect sizes
are large. Given their overlapping CI, all effect sizes are of similar
magnitudes. ‘‘LH’’ stands for the left hemisphere, ‘‘RH,’’ for the
right hemisphere.
(DOCX)
Table S5 Classification of amnestic MCI. For each binary
classification (rows) and brain ROI (columns), three parameters
are reported: BA, the mean balanced accuracy (mean of the
probability distribution of the balanced accuracy); CI, the
confidence interval (95% of mass of the probability distribution
of the balanced accuracy); P, the P-value of falsely rejecting a
chance level performance. BA and CI are reported as a
percentage.
(DOCX)
Table S6 Multiple linear regression analysis: Episodic memory
performance vs. demyelination of white matter. The table shows
the number of voxels with significant positive dependence of MTR
values on delayed cued recall scores of the RI-48 test (P,.05, FWE
corrected) and their percentage relative to the total number of
voxels spanning the respective anatomical structure. For other
designations see Tables S1 and S3.
(DOCX)
Text S1 Classification of amnestic MCI subjects.
(DOCX)
Acknowledgments
We are indebted to Dr. Raphael Heinzer for the recruitement and Ms.
Mesot for the neuropsychological testing of patients and controls. We
greatly acknowledge all the patients and controls, who kindly agreed to
participate in the study.
Author Contributions
Conceived and designed the experiments: CC MK. Performed the
experiments: CC AD VA DV. Analyzed the data: CC MK. Contributed
reagents/materials/analysis tools: CC RM. Wrote the paper: CC AD VA
DV JG AvG SC RM RF MK.
References
1. Winblad B, Palmer K, Kivipelto M, Jelic V, Fratiglioni L, et al. (2004) Mild
cognitive impairment - beyond controversies, towards a consensus: report of the
International Working Group on Mild Cognitive Impairment. J Intern Med
256: 240–246.
2. Mortimer JA, Petersen RC (2008) Detection of prodromal Alzheimer’s disease.
Ann Neurol 64: 479–480.
3. Petersen RC, Roberts RO, Knopman DS, Boeve BF, Geda YE, et al. (2009)
Mild cognitive impairment: ten years later. Arch Neurol 66: 1447–1455.
4. Amieva H, Le Goff M, Millet X, Orgogozo JM, Peres K, et al. (2008)
Prodromal Alzheimer’s disease: successive emergence of the clinical symptoms.
Ann Neurol 64: 492–498.
5. Storandt M (2008) Cognitive deficits in the early stages of Alzheimer’s disease.
Current Directions in Psychological Science 17: 198–202.
6. Jacobson MW, McEvoy LK, Dale A, Fennema-Notestine C (2009) Cognitive
phenotypes, brain morphometry and the detection of cognitive decline in
preclinical AD. Behav Neurol 21: 29–37.
7. Backman L, Jones S, Berger A, Laukka E, Small B (2004) Multiple cognitive
deficits during transition to Alzheimer’s disease. J Intern Med 256: 195–204.
8. Tabert MH, Manly JJ, Liu X, Pelton GH, Rosenblum S, et al. (2006)
Neuropsychological prediction of conversion to Alzheimer disease in patients
with mild cognitive impairment. Arch Gen Psychiatry 63: 916–924.
9. Palmer K, Backman L, Winblad B, Fratiglioni L (2008) Mild cognitive
impairment in the general population: occurrence and progression to
Alzheimer disease. Am J Geriatr Psychiatry 16: 603–611.
10. Han JW, Kim TH, Lee SB, Park JH, Lee JJ, et al. (2012) Predictive validity and
diagnostic stability of mild cognitive impairment subtypes. Alzheimers Dement
8: 553–559.
11. Davis HS, Rockwood K (2004) Conceptualization of mild cognitive
impairment: a review. Int J Geriatr Psychiatry 19: 313–319.
12. Mitchell AJ (2009) A meta-analysis of the accuracy of the mini-mental state
examination in the detection of dementia and mild cognitive impairment.
J Psychiatr Res 43: 411–431.
13. Whitwell JL, Petersen RC, Negash S, Weigand SD, Kantarci K, et al. (2007)
Patterns of atrophy differ among specific subtypes of mild cognitive
impairment. Arch Neurol 64: 1130–1138.
14. Brambati SM, Belleville S, Kergoat MJ, Chayer C, Gauthier S, et al. (2009)
Single-and multiple-domain amnestic mild cognitive impairment: two sides of
the same coin. Dement Geriatr Cogn Disord 28: 541–549.
15. Zhang H, Sachdev PS, Wen W, Kochan NA, Crawford JD, et al. (2012) Gray
matter atrophy patterns of mild cognitive impairment subtypes. J Neurol Sci
315: 26–32.
16. Filippi M, Agosta F (2011) Structural and functional network connectivity
breakdown in Alzheimer’s disease studied with magnetic resonance imaging
techniques. J Alzheimers Dis 24: 455–474.
17. Reisberg B, Franssen EH, Souren L, Auer SR, Akram I, et al. (2002) Evidence
and mechanisms of retrogenesis in Alzheimer’s and other dementias:
management and treatment import. Am J Alzheimers Dis Other Demen 17:
202–212.
18. Stricker NH, Schweinsburg BC, Delano-Wood L, Wierenga CE, Bangen KJ, et
al. (2009). Decreased white matter integrity in late-myelinating fiber pathways
in Alzheimer’s disease supports retrogenesis. Neuroimage 45: 10–16.
19. Bartzokis G (2011) Alzheimer’s disease as homeostatic responses to age-related
myelin breakdown. Neurobiol Aging 32: 1341–1371.
20. Bartzokis G (2004) Age-related myelin breakdown: a developmental model of
cognitive decline and Alzheimer’s disease. Neurobiol Aging 25: 5–18.
21. Fields RD (2008) White matter in learning, cognition and psychiatric disorders.
Trends Neurosci 31: 361–370.
22. Fornari E, Maeder P, Meuli R, Ghika J, Knyazeva MG (2012) Demyelination
of superficial white matter in early Alzheimer’s disease: A magnetization
transfer imaging study. Neurobiol Aging 33: 428.e7–19.
23. Medina D, DeToledo-Morrell L, Urresta F, Gabrieli JD, Moseley M, et al.
(2006) White matter changes in mild cognitive impairment and AD: A diffusion
tensor imaging study. Neurobiol Aging 27: 663–672.
24. Rose SE, McMahon KL, Janke AL, O’Dowd B, de Zubicaray G, et al. (2006)
Diffusion indices on magnetic resonance imaging and neuropsychological
performance in amnestic mild cognitive impairment. J Neurol Neurosurg
Psychiatry 77: 1122–1128.
25. Huang J, Auchus AP (2007) Diffusion tensor imaging of normal appearing
white matter and its correlation with cognitive functioning in mild cognitive
impairment and Alzheimer’s disease. Ann N Y Acad Sci 1097: 259–264.
26. Zhuang L, Wen W, Zhu W, Trollor J, Kochan N, et al. (2010) White matter
integrity in mild cognitive impairment: a tract-based spatial statistics study.
Neuroimage 53: 16–25.
27. Bosch B, Arenaza-Urquijo EM, Rami L, Sala-Llonch R, Junque C, et al. (2012)
Multiple DTI index analysis in normal aging, amnestic MCI and AD.
Relationship with neuropsychological performance. Neurobiol Aging 33: 61–
74.
28. Chua TC, Wen W, Slavin MJ, Sachdev PS (2008) Diffusion tensor imaging in
mild cognitive impairment and Alzheimer’s disease: a review. Curr Opin
Neurol 21: 83–92.
29. Stebbins GT, Murphy CM (2009) Diffusion tensor imaging in Alzheimer’s
disease and mild cognitive impairment. Behav Neurol 21: 39–49.
30. Pievani M, Agosta F, Pagani E, Canu E, Sala S, et al. (2010) Assessment of
white matter tract damage in mild cognitive impairment and Alzheimer’s
disease. Hum Brain Mapp 31: 1862–1875.
31. Salat DH (2011) The Declining Infrastructure of the Aging Brain. Brain
Connect 1: 279–293.
Demyelination in Amnestic MCI
PLOS ONE | www.plosone.org 10 August 2013 | Volume 8 | Issue 8 | e72759

32. Stanisz GJ, Kecojevic A, Bronskill MJ, Henkelman RM (1999) Characterizing
white matter with magnetization transfer and T(2). Magn Reson Med 42:
1128–1136.
33. Schmierer K, Tozer DJ, Scaravilli F, Altmann TR, Barker GJ, et al. (2007)
Quantitative magnetization transfer imaging in postmortem multiple sclerosis
brain. J Magn Reson Imaging 26: 41–51.
34. Wozniak JR, Lim KO (2006) Advances in white matter imaging: a review of
in vivo magnetic resonance methodologies and their applicability to the study
of development and aging. Neurosci Biobehav Rev 30: 762–774.
35. Gouw AA, Seewann A, Vrenken H, van der Flier WM, Rozemuller JM, et al.
(2008) Heterogeneity of white matter hyperintensities in Alzheimer’s disease:
post-mortem quantitative MRI and neuropathology. Brain 131: 3286–3298.
36. Holland PR, Bastin ME, Jansen MA, Merrifield GD, Coltman RB, et al.
(2011). MRI is a sensitive marker of subtle white matter pathology in
hypoperfused mice. Neurobiol Aging 32: 2325.e1-6.
37. Albert M, Blacker D, Moss MB, Tanzi R, McArdle JJ (2007) Longitudinal
Change in Cognitive Performance Among Individuals With Mild Cognitive
Impairment. Neuropsychology 21: 158–169.
38. Johns EK, Phillips NA, Belleville S, Goupil D, Babins L, et al. (2012). The
profile of executive functioning in amnestic mild cognitive impairment:
disproportionate deficits in inhibitory control. J Int Neuropsychol Soc 18:
541–555.
39. Albert MS, DeKosky ST, Dickson D, Dubois B, Feldman HH, et al. (2011) The
diagnosis of mild cognitive impairment due to Alzheimer’s disease: Recom-
mendations from the National Institute on Aging-Alzheimer’s Association
workgroups on diagnostic guidelines for Alzheimer’s disease. Alzheimers
Dement 7: 270–279.
40. McKhann GM, Knopman DS, Chertkow H, Hyman BT, Jack CR, et al.
(2011) The diagnosis of dementia due to Alzheimer’s disease: Recommenda-
tions from the National Institute on Aging-Alzheimer’s Association workgroups
on diagnostic guidelines for Alzheimer’s disease. Alzheimers Dement 7: 263–
269.
41. Lawton MP, Brody EM (1969) Assessment of older people : self-maintaining
and instrumental activities of daily living. Gerontologist 9: 179–186.
42. Van der Linden M, Adam S, Agniel A, Baisset-Mouly C, Bardet F, et al. (2004)
L’evaluation des troubles de la memoire. Presentation de quatre tests de
memoire episodique (avec leur etalonnage). Marseille: editions Solal.
43. Baddeley AD, Emslie H, Nimmo-Smith I (2004) Doors and people: A test of
visual and verbal recall and recognition. Harcourt Ass., Flempton, Bury St.
Edmunds.
44. Hebb DO (1961) Distinctive features of learning in the higher animal. In:
Delafresnaye JF, editor. Brain Mechanisms and Learning, Blackwell Scientific
Publication. Oxford, 37–46.
45. Corsi PM (1972) Human memory and the medial temporal region of the brain.
Dissertation Abstracts International 34, 891B. (University Microfilms No.
AAI05–77717).
46. Wechsler DA (1997) Wechsler Adult Intelligence Scale. San Antonio, TX: The
Psychological Corporation.
47. Godefroy O, Azouvi P, Robert P, Roussel M, LeGall D, et al. (2010)
Dysexecutive syndrome: diagnostic criteria and validation study. Ann Neurol
68: 855–864.
48. De Partz MP, Bilocq V, de Wilde V, Seron X, Pillon A (2002) LEXIS: Tests
pour le diagnostic des troubles lexicaux chez le patient aphasique. Marseille:
editions Solal.
49. Mahieux-Laurent F, Fabre C, Galbrun E, Dubrulle A, Moroni C (2009)
[Validation of a brief screening scale evaluating praxic abilities for use in
memory clinics. Evaluation in 419 controls, 127 mild cognitive impairment and
320 demented patients]. Rev Neurol (Paris) 165: 560–567.
50. Rousseaux M, Beis JM, Pradat-Diehl P, Martin Y, Bartolomeo P, et al. (2001)
Presentation d’une batterie de depistage de la negligence spatial. Normes et
effets de l’age, du niveau d’education, du sexe, de la main et de la lateralite.
Revue Neurologique (Paris) 157: 1385–1400.
51. Folstein MF, Folstein SE, McHugh PR (1975) Mini-mental state: a practical
method for grading the cognitive state of patients for clinicians. J Psychiatr Res
12: 189–198.
52. Derouesne C, Poitrenaud J, Hugonot L, Kalafat M, Dubois B, et al. (1999)
Mini-mental state examination (MMSE) : un outil pratique pour l’evaluation
des patients par le clinicien. Version francaise consensuelle. Presse Med 28:
1141–1148.
53. Zigmond AS, Snaith RP (1983) The hospital anxiety and depression scale. Acta
Psychiatr Scand 67: 361–370.
54. Marques JP, Kober T, Krueger G, van der Zwaag W, Van de Moortele PF,
Gruetter R (2010) MP2RAGE, a self bias-field corrected sequence for
improved segmentation and T1-mapping at high field. Neuroimage 49:
1271–1281.
55. Helms G, Dathe H, Kallenberg K, Dechent P (2008) High-resolution maps of
magnetization transfer with inherent correction for RF inhomogeneity and T1
relaxation obtained from 3D FLASH MRI. Magn Reson Med 60: 1396–1407.
56. Helms G, Dechent P (2009) Increased SNR and reduced distortions by
averaging multiple gradient echo signals in 3D FLASH imaging of the human
brain at 3T. J Magn Reson Imaging 29: 198–204.
57. Ashburner J (2007) A fast diffeomorphic image registration algorithm.
Neuroimage 38: 95–113.
58. Ashburner J, Friston KJ (2005) Unified segmentation. Neuroimage 26: 839–
851.
59. Draganski B, Ashburner J, Hutton C, Kherif F, Frackowiak RSJ, et al. (2011)
Regional specificity of MRI contrast parameter changes in normal ageing
revealed by voxel-based quantification (VBQ). NeuroImage 55: 1423–1434.
60. Nichols T, Brett M, Andersson J, Wager T, Poline JB (2005). Valid conjunction
inference with the minimum statistic. Neuroimage 25: 653–660.
61. Smith SM, Nichols TE (2009) Threshold-free cluster enhancement: addressing
problems of smoothing, threshold dependence and localisation in cluster
inference. Neuroimage 44: 83–98.
62. Salimi-Khorshidi G, Smith SM, Nichols TE (2011) Adjusting the effect of
nonstationarity in cluster-based and TFCE inference. Neuroimage 54: 2006–
2019.
63. Schafer J, Strimmer K (2005) A shrinkage approach to large-scale covariance
matrix estimation and implications for functional genomics. Stat Appl Genet
Mol Biol 4.
64. Higgins JJ (2004) Introduction to modern nonparametric statistics. Pacific
Grove: Brooks/Cole-Thomson Learning. 366 p.
65. Tzourio-Mazoyer N, Landeau B, Papathanassiou D, Crivello F, Etard O, et al.
(2002) Automated anatomical labeling of activations in SPM using a
macroscopic anatomical parcellation of the MNI MRI single-subject brain.
Neuroimage 15: 273–289.
66. Mori S, Oishi K, Jiang L, Li X, Akhter K, et al. (2008) Stereotaxic white matter
atlas based on diffusion tensor imaging in an ICBM template. Neuroimage 40:
570–582.
67. Jack CR, Vemuri P, Wiste HJ, Weigand SD, Lesnick TG, et al. (2012) Shapes
of the trajectories of five major biomarkers of Alzheimer’s disease. Arch Neurol
69: 856–867.
68. Moretti DV, Zanetti O, Binetti G, Frisoni GB (2012) Quantitative EEG
markers in mild cognitive impairment: degenerative versus vascular brain
impairment. Int J Alzheimers Dis 2012: 917537.
69. Shi F, Liu B, Zhou Y, Yu C, Jiang T (2009) Hippocampal volume and
asymmetry in mild cognitive impairment and Alzheimer’s disease: Meta-
analyses of MRI studies. Hippocampus 19: 1055–1064.
70. Ahdesmaki M, Strimmer K (2010) Feature selection in omics prediction
problems using cat scores and false non discovery rate control. The Annals of
Applied Statistics 4: 503–519.
71. Wiest R, Burren Y, Hauf M, Schroth G, Pruessner J, et al. (2013) Classification
of mild cognitive impairment and Alzheimer disease using model-based MR
and magnetization transfer imaging. Am J Neuroradiol 34: 740–746.
72. Chetelat G, Landeau B, Eustache F, Mezenge F, Viader F, et al. (2005) Using
voxel-based morphometry to map the structural changes associated with rapid
conversion in MCI: a longitudinal MRI study. Neuroimage 27: 934–946.
73. Zhang Y, Schuff N, Jahng GH, Bayne W, Mori S, et al. (2007) Diffusion tensor
imaging of cingulum fibers in mild cognitive impairment and Alzheimer
disease. Neurology 68: 13–19.
74. Di Paola M, Luders E, Di Iulio F, Varsi AE, Sancesario G, et al. (2010) Callosal
atrophy in mild cognitive impairment and Alzheimer’s disease: Different effects
in different stages. Neuroimage 49: 141–149.
75. Bozzali M, Giulietti G, Basile B, Serra L, Spano B, et al. (2012) Damage to the
cingulum contributes to Alzheimer’s disease pathophysiology by deafferenta-
tion mechanism. Hum Brain Mapp 33: 1295–1308.
76. Kiuchi K, Morikawa M, Taoka T, Nagashima T, Yamauchi T, et al. (2009)
Abnormalities of the uncinate fasciculus and posterior cingulate fasciculus in
mild cognitive impairment and early Alzheimer’s disease: a diffusion tensor
tractography study. Brain Res 1287: 184–191.
77. Liu Y, Spulber G, Lehtimaki KK, Kononen M, Hallikainen I, et al. (2011)
Diffusion tensor imaging and Tract-Based Spatial Statistics in Alzheimer’s
disease and mild cognitive impairment. Neurobiol Aging 32: 1558–1571.
78. Rytsar R, Fornari E, Frackowiak RS, Ghika JA, Knyazeva MG (2011)
Inhibition in early Alzheimer’s disease: An fMRI-based study of effective
connectivity. Neuroimage 57: 1131–1139.
79. Knyazeva MG, Carmeli C, Khadivi A, Ghika J, Meuli R, et al. (2013)
Evolution of source EEG synchronization in early Alzheimer’s disease.
Neurobiol Aging 34: 694–705.
80. Jha AP, Kroll NE, Baynes K, Gazzaniga MS (1997) Memory encoding
following complete callosotomy. J Cogn Neurosci 9: 143–159.
81. Funnell MG, Corballis PM, Gazzaniga MS (2000) Cortical and subcortical
interhemispheric interactions following partial and complete callosotomy. Arch
Neurol 57: 185–189.
82. Miller MB, Kingstone A, Gazzaniga MS (2002) Hemispheric encoding
asymmetry is more apparent than real. J Cogn Neurosci 14: 702–708.
83. Lamantia AS, Rakic P (1990) Cytological and quantitative characteristics of
four cerebral commissures in the rhesus monkey. J Comp Neurol 291: 520–
537.
84. Aboitiz F, Scheibel AB, Fisher RS, Zaidel E (1992) Fiber composition of the
human corpus callosum. Brain Res 598: 143–153.
85. Fame RM, MacDonald JL, Macklis JD (2011) Development, specification, and
diversity of callosal projection neurons. Trends Neurosci 34: 41–50.
86. Arnold SE, Hyman BT, Flory J, Damasio AR, Van Hoesen GW (1991) The
topographical and neuroanatomical distribution of neurofibrillary tangles and
neuritic plaques in the cerebral cortex of patients with Alzheimer’s disease.
Cereb Cortex 1: 103–116.
Demyelination in Amnestic MCI
PLOS ONE | www.plosone.org 11 August 2013 | Volume 8 | Issue 8 | e72759

87. Braak H, Del Tredici K (2011) Alzheimer’s pathogenesis: is there neuron-to-
neuron propagation? Acta Neuropathol 121: 589–595.
88. Wang PJ, Saykin AJ, Flashman LA, Wishart HA, Rabin LA, et al. (2006)
Regionally specific atrophy of the corpus callosum in AD, MCI and cognitive
complaints. Neurobiol Aging 27: 1613–1617.
89. Ukmar M, Makuc E, Onor ML, Garbin G, Trevisiol M, et al. (2008)
Evaluation of white matter damage in patients with Alzheimer’s disease and in
patients with mild cognitive impairment by using diffusion tensor imaging.
Radiol Med 113: 915–922.
90. Parente DB, Gasparetto EL, da Cruz LCH, Domingues RC, Baptista AC, et al.
(2008) Potential role of diffusion tensor MRI in the differential diagnosis of mild
cognitive impairment and Alzheimer’s disease. Am J Roentgenol 190: 1369–
1374.
91. Cho H, Yang DW, Shon YM, Kim BS, Kim YI, et al. (2008) Abnormal
integrity of corticocortical tracts in mild cognitive impairment: A diffusion
tensor imaging study. J Korean Med Sci 23: 477–483.
92. Preti MG, Baglio F, Lagana MM, Griffanti L, Nemni R, et al. (2012) Assessing
corpus callosum changes in Alzheimer’s disease: comparison between tract-
based spatial statistics and atlas-based tractography. PloS ONE 7, e35856.
93. Sugihara S, Kinoshita T, Matsusue E, Fujii S, Ogawa T (2004) Usefulness of
diffusion tensor imaging of white matter in Alzheimer disease and vascular
dementia. Acta Radiol 45: 658–663.
94. Nierenberg J, Pomara N, Hoptman MJ, Sidtis JJ, Ardekani BA, et al. (2005)
Abnormal white matter integrity in healthy apolipoprotein E epsilon4 carriers.
Neuroreport 16: 1369–1372.
95. Persson J, Lind J, Larsson A, Ingvar M, Cruts M, et al. (2006) Altered brain
white matter integrity in healthy carriers of the APOE epsilon4 allele: a risk for
AD? Neurology 66: 1029–1033.
96. Smith CD, Chebrolu H, Andersen AH, Powell DA, Lovell MA, et al. (2010)
White matter diffusion alterations in normal women at risk of Alzheimer’s
disease. Neurobiol Aging 31: 1122–1131.
97. Braskie MN, Jahanshad N, Stein JL, Barysheva M, McMahon KL, et al. (2011)
Common Alzheimer’s disease risk variant within the CLU gene affects white
matter microstructure in young adults. J Neurosci 31: 6764–6770.
98. Di Paola M, Di Iulio F, Cherubini A, Blundo C, Casini AR, et al. (2010) When,
where, and how the corpus callosum changes in MCI and AD: a multimodal
MRI study. Neurology 74: 1136–1142.
99. Aron AR, Robbins TW, Poldrack RA (2004) Inhibition and the right inferior
frontal cortex. Trends in Cognitive Sciences 8: 170–177.
100. Levy BJ, Wagner AD (2011) Cognitive control and right ventrolateral
prefrontal cortex: reflexive reorienting, motor inhibition, and action updating.Ann N Y Acad Sci 1224: 40–62.
101. Schroeter ML, Vogt B, Frisch S, Becker G, Barthel H, et al. (2012) Executive
deficits are related to the inferior frontal junction in early dementia. Brain 135:201–215.
102. Elias MF, Beiser A, Wolf PA, Au R, White RF, et al. (2000) The preclinicalphase of Alzheimer disease: a 22-year prospective study of the Framingham
Cohort. Arch Neurol 57: 808–813.
103. Chen P, Ratcliff G, Belle SH, Cauley JA, DeKosky ST, et al. (2001) Patterns ofcognitive decline in presymptomatic Alzheimer disease: a prospective
community study. Arch Gen Psychiatry 58: 853–858.104. Rapp MA, Reischies FM (2005) Attention and executive control predict
Alzheimer disease in late life. Am J Geriatr Psychiatry 13: 134–141.105. Braak H, Braak E (1991) Neuropathological staging of Alzheimer related
changes. Acta Neuropathol 82: 239–259.
106. Braak H, Alafuzoff I, Arzberger T, Kretzschmar H, Del Tredici K (2006)Staging of Alzheimer disease-associated neurofibrillary pathology using paraffin
sections and immunocytochemistry. Acta neuropathologica 112: 389–404.107. Bobinski M, Wegiel J, Tarnawski M, de Leon MJ, Reisberg B, et al. (1998)
Duration of neurofibrillary changes in the hippocampal pyramidal neurons.
Brain Res 799: 156–158.108. Morsch R, Simon W, Coleman PD (1999) Neurons may live for decades with
neurofibrillary tangles. J Neuropathol Exp Neurol 58: 188–197.109. Frisoni GB, Fox NC, Jack CR, Scheltens P, Thompson PM (2010) The clinical
use of structural MRI in Alzheimer disease. Nat Rev Neurol 6: 67–77.110. den Heijer T, van der Lijn F, Koudstaal PJ, Hofman A, van der Lugt A, et al.
(2010) A 10-year follow-up of hippocampal volume on magnetic resonance
imaging in early dementia and cognitive decline. Brain 133: 1163–1172.111. Csernansky J G, Hamstra J, Wang L, McKeel D, Price JL, et al. (2004)
Correlations between antemortem hippocampal volume and postmortemneuropathology in AD subjects. Alzheimer Dis Assoc Disord 18: 190–195.
112. Whitwell JL, Josephs KA, Murray ME, Kantarci K, Przybelski SA, et al. (2008)
MRI correlates of neurofibrillary tangle pathology at autopsy: a voxel-basedmorphometry study. Neurology 71: 743–749.
113. De Souza LC, Chupin M, Lamari F, Jardel C, Leclercq D, et al. (2011) CSFtau markers are correlated with hippocampal volume in Alzheimer’s disease.
Neurobiol Aging 33: 1253–1257.114. De Souza LC, Chupin M, Bertoux M, Lehericy S, Dubois B, et al. (2013) Is
hippocampal volume a good marker to differentiate Alzheimer’s disease from
frontotemporal dementia? J Alzheimers Dis 36: 57–66.
Demyelination in Amnestic MCI
PLOS ONE | www.plosone.org 12 August 2013 | Volume 8 | Issue 8 | e72759
Copyright © 2022 FDOKUMEN