Prevalence and prognosis of Alzheimer’s disease at the mild cognitive impairment stage
53
For Peer Review Prevalence and prognosis of Alzheimer’s disease at the mild cognitive impairment stage Journal: Brain Manuscript ID: BRAIN-2014-01616.R1 Manuscript Type: Original Article Date Submitted by the Author: 27-Nov-2014 Complete List of Authors: Vos, Stephanie; Maastricht University, Verhey, Frans; Maastricht University Medical Center, Psychiatry & Neuropsychology Frölich, Lutz; Central Institute of Mental Health, Medical Faculty Mannheim, University of Heidelberg, 4Division of Geriatric Psychiatry Kornhuber, Johannes; Friedrich-Alexander University of Erlangen, Jens, Wiltfang; Uni Göttingen, Maier, Wolfgang; University of Bonn, Peters, Oliver; Charité – Universitätsmedizin Berlin, Psychiatry and Psychotherapy Ruether, Eckart; University of Göttingen, Nobili, Flavio; University of Genoa, Clinical Neurophysiology Unit, Dept of Neurosciences, Ophthalmology and Genetics Morbelli, Silvia; University of Genoa, Nuclear Medicine Unit, Dept. of Internal Medicine Frisoni, Giovanni; IRCCS Fatebenefratelli, Epidemiology and Neuroimaging Drzezga, Alexander; University of Cologne, Didic, Mira; AP-HM Timone, Service de Neurologie et de Neuropsychologie van Berckel, Bart; VU University Medical centre, Nuclear Medicine & PET research; Simmons, Andy; Institute of Psychiatry, Soininen, Hilkka; University of Eastern Finland and Kuopio University Hospital, Department of Neurology Kloszewska, Iwona; Medical University of Lodz, Mecocci, Patrizia; University of Perugia, Tsolaki, Magda; Aristotle University of Thessaloniki, Vellas, Bruno; CHU Toulouse, Alzheimer Disease Research and Clinical Center Lovestone, Simon; King's College London, Old Age Psychiatry Muscio, Cristina; IRCCS San Giovanni di Dio Fatebenefratelli, Herukka, Sanna-Kaisa; University of Eastern Finland, Department of Neurology Salmon, Eric; Université de Liège, Bastin, Christine; University of Liège, Cyclotron Research Centre; Wallin, Anders; University of Gothenburg, Nordlund, Arto; Sahlgrenska Academy, Institute of Clinical Neuscience Mendonca, alexandre; University of Lisbon, Silva, Dina; University of Lisbon, ScholarOne, 375 Greenbrier Drive, Charlottesville, VA, 22901 Support (434) 964 4100 Brain
-
Upload
independent -
Category
Documents
-
view
0 -
download
0
Transcript of Prevalence and prognosis of Alzheimer’s disease at the mild cognitive impairment stage
For Peer Review
Prevalence and prognosis of Alzheimer’s disease at the mild
cognitive impairment stage
Journal: Brain
Manuscript ID: BRAIN-2014-01616.R1
Manuscript Type: Original Article
Date Submitted by the Author: 27-Nov-2014
Complete List of Authors: Vos, Stephanie; Maastricht University, Verhey, Frans; Maastricht University Medical Center, Psychiatry & Neuropsychology Frölich, Lutz; Central Institute of Mental Health, Medical Faculty Mannheim, University of Heidelberg, 4Division of Geriatric Psychiatry Kornhuber, Johannes; Friedrich-Alexander University of Erlangen, Jens, Wiltfang; Uni Göttingen, Maier, Wolfgang; University of Bonn, Peters, Oliver; Charité – Universitätsmedizin Berlin, Psychiatry and Psychotherapy Ruether, Eckart; University of Göttingen, Nobili, Flavio; University of Genoa, Clinical Neurophysiology Unit, Dept of Neurosciences, Ophthalmology and Genetics Morbelli, Silvia; University of Genoa, Nuclear Medicine Unit, Dept. of Internal Medicine Frisoni, Giovanni; IRCCS Fatebenefratelli, Epidemiology and Neuroimaging Drzezga, Alexander; University of Cologne, Didic, Mira; AP-HM Timone, Service de Neurologie et de Neuropsychologie van Berckel, Bart; VU University Medical centre, Nuclear Medicine & PET research; Simmons, Andy; Institute of Psychiatry, Soininen, Hilkka; University of Eastern Finland and Kuopio University Hospital, Department of Neurology Kloszewska, Iwona; Medical University of Lodz, Mecocci, Patrizia; University of Perugia, Tsolaki, Magda; Aristotle University of Thessaloniki, Vellas, Bruno; CHU Toulouse, Alzheimer Disease Research and Clinical Center Lovestone, Simon; King's College London, Old Age Psychiatry Muscio, Cristina; IRCCS San Giovanni di Dio Fatebenefratelli, Herukka, Sanna-Kaisa; University of Eastern Finland, Department of Neurology Salmon, Eric; Université de Liège, Bastin, Christine; University of Liège, Cyclotron Research Centre; Wallin, Anders; University of Gothenburg, Nordlund, Arto; Sahlgrenska Academy, Institute of Clinical Neuscience Mendonca, alexandre; University of Lisbon, Silva, Dina; University of Lisbon,
ScholarOne, 375 Greenbrier Drive, Charlottesville, VA, 22901 Support (434) 964 4100
Brain
For Peer Review
Santana, Isabel; Coimbra University Hospital, Lemos, Raquel; University of Coimbra, Engelborghs, Sebastiaan; University of Antwerp, Van der Mussele, Stefan; University of Antwerp, Freund-levi, Yvonne; Karolinska University Hospital Huddinge, Wallin, Asa; Lund University, Hampel, Harald; Université Pierre et Marie Curie-Paris, van der Flier, W,M.; VUmc, Scheltens, Philip; Vumc, Visser, Pieter Jelle; Maastricht University,
Subject category: Dementia
To search keyword list, use whole or part words followed
by an *:
Dementia: biomarkers < DEMENTIA, Mild cognitive impairment < DEMENTIA, Neurodegeneration: biomarkers < NEURODEGENERATION: CELLULAR AND MOLECULAR, Alzheimer's disease < DEMENTIA, Dementia: structural MR imaging < DEMENTIA
Page 1 of 51
ScholarOne, 375 Greenbrier Drive, Charlottesville, VA, 22901 Support (434) 964 4100
Brain

For Peer Review
1
Prevalence and prognosis of Alzheimer’s disease at the mild cognitive
impairment stage
Stephanie J. B. Vos,1 Frans Verhey,1 Lutz Frölich,2* Johannes Kornhuber,3* Jens Wiltfang,4*
Wolfgang Maier,5* Oliver Peters,6* Eckart Rüther,7* Flavio Nobili,8† Silvia Morbelli,9 † Giovanni B.
Frisoni,10,11† Alexander Drzezga,12† Mira Didic,13† Bart N. M. van Berckel,14† Andrew Simmons,15ǂ
Hilkka Soininen,16ǂ Iwona Kłoszewska,17ǂ Patrizia Mecocci,18ǂ Magda Tsolaki,19ǂ Bruno Vellas,20ǂ
Simon Lovestone,21ǂ Cristina Muscio,10,22,23 Sanna-Kaisa Herukka,16 Eric Salmon,24,25 Christine
Bastin,25 Anders Wallin,26 Arto Nordlund,26 Alexandre de Mendonça,27 Dina Silva,27 Isabel
Santana,28 Raquel Lemos,29 Sebastiaan Engelborghs,30,31 Stefan Van der Mussele,30 The
Alzheimer’s Disease Neuroimaging Initiative,ѱ Yvonne Freund-Levi,32 Åsa K. Wallin,33 Harald
Hampel,34 Wiesje van der Flier,35 Philip Scheltens35 and Pieter Jelle Visser1,35
See Schott for a scientific commentary on this article (doi:10.1093/brain/).
Abstract
Three sets of research criteria are available for diagnosis of Alzheimer’s disease in subjects with
mild cognitive impairment: the International Working Group-1, International Working Group-2,
and National Institute of Aging-Alzheimer Association criteria. We compared the prevalence and
prognosis of Alzheimer’s disease at the mild cognitive impairment stage according to these
criteria. Subjects with mild cognitive impairment (n = 1607), 766 of whom had both amyloid and
neuronal injury markers, were recruited from 13 cohorts. We used cognitive test performance and
available biomarkers to classify subjects as prodromal Alzheimer’s disease according to
International Working Group-1 and International Working Group-2 criteria and in the high
Alzheimer’s disease likelihood group, conflicting biomarker groups (isolated amyloid pathology
or suspected non-Alzheimer pathophysiology), and low Alzheimer’s disease likelihood group
according to the National Institute of Ageing-Alzheimer Association criteria. Outcome measures
were the proportion of subjects with Alzheimer’s disease at the mild cognitive impairment stage
and progression to Alzheimer’s disease-type dementia. We performed survival analyses using Cox
proportional hazards models. According to the International Working Group-1 criteria, 850 (53%)
subjects had prodromal Alzheimer’s disease. Their 3-year progression rate to Alzheimer’s disease-
Page 2 of 51
ScholarOne, 375 Greenbrier Drive, Charlottesville, VA, 22901 Support (434) 964 4100
Brain

For Peer Review
2
type dementia was 50% compared to 21% for subjects without prodromal Alzheimer’s disease.
According to the International Working Group-2 criteria, 308 (40%) subjects had prodromal
Alzheimer’s disease. Their 3-year progression rate to Alzheimer’s disease-type dementia was 61%
compared to 22% for subjects without prodromal Alzheimer’s disease. According to the National
Institute of Ageing-Alzheimer Association criteria, 353 (46%) subjects were in the high
Alzheimer’s disease likelihood group, 49 (6%) in the isolated amyloid pathology group, 220
(29%) in the suspected non-Alzheimer pathophysiology group, and 144 (19%) in the low
Alzheimer’s disease likelihood group. The 3-year progression rate to Alzheimer’s disease-type
dementia was 59% in the high Alzheimer’s disease likelihood group, 22% in the isolated amyloid
pathology group, 24% in the suspected non-Alzheimer pathophysiology group, and 5% in the low
Alzheimer’s disease likelihood group. Our findings support the use of the proposed research
criteria to identify Alzheimer’s disease at the mild cognitive impairment stage. In clinical settings,
the use of both amyloid and neuronal injury markers as proposed by the National Institute of
Ageing-Alzheimer Association criteria offers the most accurate prognosis. For clinical trials,
selection of subjects in the National Institute of Ageing-Alzheimer Association high Alzheimer’s
disease likelihood group or the International Working Group-2 prodromal Alzheimer’s disease
group could be considered.
Author affiliations:
1Department of Psychiatry and Neuropsychology, Maastricht University, School for Mental
Health and Neuroscience, Alzheimer Centre Limburg, Maastricht, The Netherlands
2Department of Geriatric Psychiatry, Zentralinstitut für Seelische Gesundheit, University of
Heidelberg, Mannheim, Germany
3Department of Psychiatry and Psychotherapy, Friedrich-Alexander University of Erlangen,
Erlangen, Germany
4Department of Psychiatry and Psychotherapy, University Medical Centre (UMG), Georg-August-
University, Göttingen, Germany
5Department of Psychiatry and Psychotherapy, University of Bonn, German Centre for
Neurodegenerative Diseases (DZNE), Bonn, Germany
6Department of Psychiatry and Psychotherapy, Charité Berlin, Berlin, Germany
7Department of Psychiatry and Psychotherapy, University of Göttingen, Göttingen, Germany
Page 3 of 51
ScholarOne, 375 Greenbrier Drive, Charlottesville, VA, 22901 Support (434) 964 4100
Brain
For Peer Review
3
8Clinical Neurophysiology Service, Department of Neurosciences, Ophthalmology and Genetics,
University of Genoa, Genoa, Italy
9Nuclear Medicine, Department of Internal Medicine, University of Genoa, Genoa, Italy
10IRCCS San Giovanni di Dio Fatebenefratelli, Brescia, Italy
11University Hospitals and University of Geneva, Geneva, Switzerland
12Department of Nuclear Medicine, University of Cologne, Cologne, Germany
13Service de Neurologie et Neuropsychologie, Pôle de neurosciences cliniques, AP-HM Timone,
U1106, Aix-Marseille Univ Marseille, France
14Department of Nuclear Medicine and PET Research, VU University Medical CentRE,
Amsterdam, The Netherlands
15Department of Neuroimaging, Centre for Neuroimaging Science, King’s College London,
Institute of Psychiatry, London, UK
16Institute of Clinical Medicine, Neurology, University of Eastern Finland and Neurocenter,
Neurology, Kuopio University Hospital, Kuopio, Finland
17Medical University of Lodz, Lodz, Poland
18Institute of Gerontology and Geriatrics, University of Perugia, Perugia, Italy
19Aristotle University of Thessaloniki, Memory and Dementia Center, 3rd Department of
Neurology, “G Papanicolaou” General Hospital, Thessaloniki, Greece
20UMR INSERM 1027, CHU Toulouse, Toulouse, France
21University of Oxford, Department of Psychiatry, Oxford, UK
22Fondazione Europea Ricerca Biomedica (FERB), Centro di Eccellenza Alzheimer, Ospedale
Briolini, Gazzaniga, Bergamo, Italy
23Department of Molecular and Translational Medicine, University of Brescia, Brescia, Italy
24Memory Clinic, Department of Neurology, CHU Liège, Belgium
25Cyclotron Research Centre, University of Liège, Liège, Belgium
26Department of Psychiatry and Neurochemistry, Institute for Neuroscience and Physiology,
Sahlgrenska Academy, University of Gothenburg, Gothenburg, Sweden
27Institute of Molecular Medicine, Faculty of Medicine, University of Lisbon, Portugal
Page 4 of 51
ScholarOne, 375 Greenbrier Drive, Charlottesville, VA, 22901 Support (434) 964 4100
Brain

For Peer Review
4
28Department of Neurology, Coimbra University Hospital, Coimbra, Portugal
29Faculty of Psychology and Educational Sciences, University of Coimbra, Coimbra, Portugal
30Reference Centre for Biological Markers of Dementia (BIODEM), Laboratory of
Neurochemistry and Behaviour, Institute Born-Bunge, University of Antwerp, Antwerp, Belgium
31Department of Neurology and Memory Clinic, Hospital Network Antwerp, Middelheim and
Hoge Beuken, Antwerp, Belgium
32Department of Neurobiology, Caring Sciences and Society (NVS), Division of Clinical
Geriatrics, Karolinska Institutet, and Department of Geriatric Medicine, Karolinska University
Hospital Huddinge, Stockholm, Sweden
33Lund University, Clinical Sciences Malmö, Clinical Memory Research Unit, Lund, Sweden
34Centre des Maladies Cognitives et Comportementales, Institut du Cerveau et de la Moelle
épinière, Paris, France; Université Pierre et Marie Curie-Paris 6, AP-HP, Hôpital de la Salpêtrière,
Paris, France
35Alzheimer Centre and Department of Neurology, Neuroscience Campus Amsterdam, VU
University Medical Center, Amsterdam, The Netherlands
*On behalf of the German Dementia Competence Network.
†On behalf of the EADC-PET consortium.
ǂOn behalf of the AddNeuroMed consortium.
ѱData used in preparation of this article were partially obtained from the Alzheimer’s Disease
Neuroimaging Initiative (ADNI) database (adni.loni.usc.edu). As such, the investigators within the
ADNI contributed to the design and implementation of ADNI and/or provided data but did not
participate in analysis or writing of this report. A complete listing of ADNI investigators can be
found at: http://adni.loni.usc.edu/wpcontent/uploads/how_to_apply/
ADNI_Acknowledgement_List.pdf
Correspondence to: Stephanie J. B. Vos, PhD
Department of Psychiatry and Neuropsychology, Maastricht University, School for Mental Health
and Neuroscience, Alzheimer Centre Limburg
Page 5 of 51
ScholarOne, 375 Greenbrier Drive, Charlottesville, VA, 22901 Support (434) 964 4100
Brain
For Peer Review
5
P.O. Box 616, 6200 MD Maastricht, The Netherlands
E-mail: [email protected]
Running title: Comparing diagnostic research criteria
Keywords: Alzheimer’s disease; MCI; biomarkers; diagnostic criteria; prognosis
Abbreviations: FDG = 18F-fluorodeoxyglucose; IAP = isolated Alzheimer pathology; IWG-1 =
International Working Group-1; IWG-2 = International Working Group-2; MCI = mild cognitive
impairment; NIA-AA = National Institute of Ageing-Alzheimer Association; SNAP = suspected
non-Alzheimer pathophysiology.
Introduction
In recent years three sets of research criteria for diagnosis of Alzheimer’s disease in subjects with
mild cognitive impairment (MCI) have been proposed: the International Working Group (IWG)-1
(Dubois et al., 2007, 2010), IWG-2 (Dubois et al., 2014), and National Institute of Ageing-
Alzheimer Association (NIA-AA) criteria (Albert et al., 2011). The criteria include biomarkers of
Alzheimer’s disease pathology to increase the confidence that subjects with MCI have
Alzheimer’s disease as underlying cause. However, they differ in the definition of MCI and
biomarker abnormality (Visser et al., 2012) (Table 1). A direct comparison between the criteria is
lacking and it remains unclear which criteria are best to use.
The IWG criteria use the term prodromal Alzheimer’s disease for diagnosis of Alzheimer’s
disease and were designed to serve as research criteria. The IWG-1 criteria require episodic
memory impairment and at least one abnormal Alzheimer’s disease biomarker. This biomarker
can be a topographical marker [i.e. medial temporal lobe atrophy on MRI or parieto-temporal
hypoperfusion on 18F-fluorodeoxyglucose (FDG)-PET] or a pathophysiological marker (i.e.
decreased CSF amyloid-β1-42, increased CSF tau, or increased amyloid PET uptake) (Dubois et al.,
2007, 2010). The updated IWG-2 criteria require cognitive impairment in any cognitive domain
and either both decreased CSF amyloid-β1-42 and increased tau, or increased amyloid PET uptake
(Dubois et al., 2014). These criteria specify two subtypes: typical prodromal Alzheimer’s disease
if impairment on a memory test is present; and atypical prodromal Alzheimer’s if only impairment
on a non-memory test is present. The NIA-AA criteria use the term ‘mild cognitive impairment
due to Alzheimer’s disease’ and were designed for both clinical and research use. They require
cognitive impairment in any cognitive domain and abnormal amyloid markers (i.e. decreased CSF
Page 6 of 51
ScholarOne, 375 Greenbrier Drive, Charlottesville, VA, 22901 Support (434) 964 4100
Brain
For Peer Review
6
amyloid-β1-42 or increased amyloid PET uptake) or neuronal injury markers (i.e. medial temporal
lobe atrophy on MRI, increased CSF tau, or parietotemporal hypoperfusion on FDG-PET). They
relate the number of abnormal biomarkers to the likelihood that MCI is due to Alzheimer’s disease
(Albert et al., 2011) (Table 1).
Preliminary studies have shown that the IWG-1 and NIA-AA criteria have a fair to good
predictive ability for progression to Alzheimer’s disease-type dementia in subjects with MCI
(Bouwman et al., 2010; Oksengard et al., 2010; Petersen et al., 2013; Prestia et al., 2013). The
validity of the IWG-2 criteria has not yet been tested. The aim of the present study is to compare
the IWG-1, IWG-2 and NIA-AA criteria on prevalence and outcome of Alzheimer’s disease at the
MCI stage by means of a large multicentre study.
Material and methods
Subjects
Subjects were recruited from five multicentre studies: DESCRIPA (Visser et al., 2008),
AddNeuroMed (Lovestone et al., 2009), German Dementia Competence Network (DCN;
Kornhuber et al., 2009), the European Alzheimer’s Disease Consortium (EADC)-PET (Morbelli
et al., 2012), and American Alzheimer’s Disease Neuroimaging Initiative (ADNI-1) study
(Mueller et al., 2005; Supplementary material); and from eight centres of the EADC: Amsterdam
(van der Flier et al., 2014), Antwerp (Van der Mussele et al., 2014), Brescia (Frisoni et al., 2009),
Coimbra (Baldeiras et al., 2008), Gothenburg (Eckerström et al., 2010), Kuopio (Seppälä et al.,
2011), Liège (Bastin et al., 2010), and Lisbon (Maroco et al., 2011). If a subject participated in
more than one study, we used data from the study with the longest follow-up.
Inclusion criteria of the present study were diagnosis of MCI, availability of at least one of the
following biomarkers: amyloid-β1-42 and tau in CSF, qualitative or quantitative measures of medial
temporal lobe atrophy on MRI [visual rating scale (medial temporal lobe atrophy score) or
hippocampal volume], or cerebral glucose metabolism on brain FDG-PET; and at least one
clinical follow-up assessment. Exclusion criteria were diagnosis of dementia at baseline or any
other vascular, somatic, psychiatric or neurological disorder that might have caused the cognitive
impairment.
Clinical assessment
Clinical assessment was performed according to the routine protocol at each site, including a
Page 7 of 51
ScholarOne, 375 Greenbrier Drive, Charlottesville, VA, 22901 Support (434) 964 4100
Brain
For Peer Review
7
clinical interview, Mini-Mental State Examination scoring, and neuropsychological assessment.
Baseline diagnosis of MCI was made according to the criteria of Petersen et al. (2004). Raw
scores on neuropsychological tests were converted to Z-scores at each centre. Cognitive
impairment was defined as Z-score < −1.5 [standard deviation (SD)] on at least one cognitive test
(Supplementary Table 1). Subjects with a Z-score < −1.5 SD on a memory test were classified as
having amnestic MCI. Subjects with a Z-score < −1.5 SD on a non-memory test only were
classified as having non-amnestic MCI.
Primary outcome measures were the proportion of subjects with Alzheimer’s disease at the MCI
stage based on the IWG-1, IWG-2 and NIA-AA criteria and progression to Alzheimer’s disease-
type dementia according to the Diagnostic and Statistical Manual of Mental Disorders, Fourth
Edition (APA, 1994) and National Institute of Neurological and Communicative Disorders and
Stroke - Alzheimer’s Disease and Related Disorders Association criteria (McKhann et al., 1984).
Secondary outcome measure was cognitive decline on the Mini-Mental State Examination.
The medical ethics committee at each centre approved the study. All subjects provided informed
consent.
Biomarker assessment
Biomarker assessment was performed according to the routine protocol at each site. PET scans
were rated centrally. We used centre-specific cut-offs to define abnormal biomarkers
(Supplementary Table 2). Visual assessments of medial temporal lobe atrophy on MRI and
cerebral glucose metabolism on FDG-PET were performed by experienced clinicians who were
blinded to clinical and CSF biomarker data.
Subject classification
According to the IWG-1 criteria, subjects were classified as ‘prodromal Alzheimer’s disease’ if
they had episodic memory impairment and at least one abnormal biomarker. This could be a
topographical or pathophysiological marker (Table 1). Although the IWG-1 criteria recommended
a cued recall test to define memory impairment, such tests were not available for most studies and
we used non-cued memory tests as well. According to the IWG-1 update of 2010, we defined
atypical prodromal Alzheimer’s disease as non-amnestic MCI with abnormal biomarkers in a post
hoc analysis.
According to the IWG-2 criteria, subjects were classified as ‘prodromal Alzheimer’s disease’ if
they had impairment in memory (typical prodromal Alzheimer’s disease) or non-memory domains
Page 8 of 51
ScholarOne, 375 Greenbrier Drive, Charlottesville, VA, 22901 Support (434) 964 4100
Brain

For Peer Review
8
(atypical prodromal Alzheimer’s disease) and abnormal CSF amyloid-β1-42 and tau biomarkers
(Table 1). In the main analysis we pooled typical and atypical prodromal Alzheimer’s disease but
we also performed analyses for each subgroup separately.
According to the NIA-AA criteria, we distinguished between amyloid (i.e. CSF amyloid-β1-42) and
neuronal injury markers (i.e. CSF tau, cerebral glucose metabolism on FDG-PET, medial temporal
lobe atrophy score or hippocampal volume). Subjects with MCI in any domain were classified in
the low Alzheimer’s disease likelihood group if both amyloid and neuronal injury markers were
normal, in the high Alzheimer’s disease likelihood group if amyloid and at least one neuronal
injury marker were abnormal, and in one of the two conflicting biomarker groups if the amyloid
marker was abnormal and neuronal injury markers normal [isolated amyloid pathology group
(IAP)] or if at least one neuronal injury marker was abnormal and the amyloid marker normal
[suspected non-Alzheimer pathophysiology group (SNAP)] (Jack et al., 2012; Petersen et al.,
2013; Vos et al., 2013a). Of the subjects who had only one biomarker available, subjects were
classified in the intermediate Alzheimer’s disease likelihood group if the marker that was tested
was abnormal and in the uninformative/inconclusive group if the marker was tested normal (Table
1).
Statistical analyses
Statistical analyses were done with SPSS version 20.0 (Chicago, IL, USA) with significance set at
P < 0.05. Baseline differences between the biomarker subgroups were analysed using ANOVA for
continuous variables and χ2 tests or logistic regression models for categorical variables. Cox
proportional hazards models were used to test the predictive ability for Alzheimer’s disease-type
dementia. The relation of the criteria with change on the Mini-Mental State Examination was
assessed by slope analyses with general linear mixed models including the baseline and last
follow-up score. The model was specified with a random intercept and slope and with centre as a
random effect because this model provided the best −2 log-likelihood compared with models with
simpler covariance structures. All analyses were adjusted for age, gender, education and centre.
Additionally, we calculated the sensitivity, specificity, positive and negative predictive value, and
Youden index (sensitivity + specificity−1) for Alzheimer’s disease-type dementia after 3 years.
Results
Sample demographics
Page 9 of 51
ScholarOne, 375 Greenbrier Drive, Charlottesville, VA, 22901 Support (434) 964 4100
Brain
For Peer Review
9
We included 1607 subjects with a mean follow-up of 2.4 years (SD 1.3, range 0.5–9). One
thousand five hundred and eleven subjects had a 1-year follow-up, 1069 a 2-year follow-up, 594 a
3-year follow-up, 170 a 4-year follow-up, 70 a 5-year follow-up, and 44 subjects had a follow-up
longer than 5 years. Seven hundred and sixty-six subjects had data on amyloid and neuronal injury
markers (CSF amyloid-β1-42 with CSF tau, medial temporal lobe, or FDG-PET) and 841 subjects
had data on only a neuronal injury marker (medial temporal lobe n = 698; FDG-PET n = 143).
Supplementary Tables 3 and 4 show the number of subjects for each biomarker by centre and the
characteristics for the total sample and separate biomarker groups.
Prevalence and outcome
Table 2 shows the classification and characteristics of subjects according to the criteria and Table
3 shows the outcome according to the criteria classification. Eight hundred and fifty (53%)
subjects had prodromal Alzheimer’s disease according to the IWG-1 criteria, and 308 (40%)
subjects according to the IWG-2 criteria, either typical or atypical (Table 2). Subjects with
prodromal Alzheimer’s disease were more likely to progress to Alzheimer’s disease-type dementia
(Table 3, Fig. 1) and showed a larger decline on the Mini-Mental State Examination
(Supplementary Table 5 and Supplementary Fig. 1) than subjects without prodromal Alzheimer’s
disease.
According to the NIA-AA criteria, of the subjects with amyloid and injury markers available, 353
(46%) subjects were classified in the high Alzheimer’s disease likelihood group, 49 (6%) in the
IAP group, 220 (29%) in the SNAP group, and 144 (19%) in the low Alzheimer’s disease
likelihood group (Table 2). Of the subjects with only a neuronal injury marker available, 459
(55%) were classified in the intermediate Alzheimer’s disease likelihood group and 382 (45%) in
the inconclusive group. Subjects in the high Alzheimer’s disease likelihood group were more
likely to progress to Alzheimer’s disease-type dementia than subjects in all other groups (Table 3
and Fig. 1). When the NIA-AA categories were dichotomized, subjects with high Alzheimer’s
disease likelihood had a higher progression rate compared to subjects in the low Alzheimer’s
disease likelihood and conflicting biomarker groups and subjects in the high Alzheimer’s disease
likelihood and conflicting biomarker groups had a higher progression rate than subjects in the low
Alzheimer’s disease likelihood group (Supplementary Table 5). The high and intermediate
Alzheimer’s disease likelihood groups showed a larger decline on the Mini-Mental State
Examination compared to all other groups (Supplementary Table 6 and Supplementary Fig. 1).
Head-to-head comparison of criteria
Page 10 of 51
ScholarOne, 375 Greenbrier Drive, Charlottesville, VA, 22901 Support (434) 964 4100
Brain

For Peer Review
10
In the subgroup of subjects with both amyloid and injury markers (n = 766), the Cox regression
prediction model showed a slightly better fit for the NIA-AA criteria than for the IWG-2 and
IWG-1 criteria because the −2 log-likelihood or deviance (a measure for unexplained variance)
was lowest for the NIA-AA criteria (2906 versus 2926 and 2982, respectively). Table 4 shows the
overlap in classification between the criteria by outcome after 3 years. The requirement of
memory impairment for IWG-1 prodromal Alzheimer’s disease and the requirement of abnormal
CSF amyloid-β1-42 and tau markers for IWG-2 prodromal Alzheimer’s disease resulted in
differences in classification compared to the NIA-AA criteria. Furthermore, the NIA-AA
conflicting biomarker groups are considered prodromal Alzheimer’s disease according to the
IWG-1 criteria but not according to the IWG-2 criteria. In subsequent analyses, we dichotomized
the NIA-AA criteria in two ways: (i) high Alzheimer’s disease likelihood group versus conflicting
and low Alzheimer’s disease likelihood groups; and (ii) high Alzheimer’s disease likelihood and
conflicting groups versus low Alzheimer’s disease likelihood group. Table 5 shows that the
specificity and positive predictive value were highest for IWG-2, whereas the sensitivity and
negative predictive value were highest for NIA-AA (ii). NIA-AA (i) showed the highest Youden
index.
In the subgroup of subjects with only a neuronal injury marker (n = 841), the Cox regression
model fit was slightly better for IWG-1 (−2 log-likelihood 3000) than for NIA-AA (−2 log-
likelihood 3012). The specificity was higher for IWG-1 than NIA-AA (Table 5).
Typical versus atypical Alzheimer’s disease
Of the subjects without IWG-1 prodromal Alzheimer’s disease, subjects with non-amnestic MCI
and abnormal biomarkers (atypical prodromal Alzheimer’s disease according to the IWG-1
update, n = 231) were more likely to progress to Alzheimer’s disease-type dementia (3-year
progression rate 31%) than subjects with amnestic or non-amnestic MCI with normal biomarkers
(n = 526, 3-year progression 17%, hazard ratio = 1.9, 95% CI 1.3–2.7, P < 0.0001; Supplementary
Fig. 2). Subjects with IWG-2 atypical prodromal Alzheimer’s disease (n = 49) had a similar
progression rate as subjects with IWG-2 typical prodromal Alzheimer’s disease (n = 259; 3-year
progression rate 63 versus 61%, P = 0.78; Supplementary Fig. 2).
Progression to non-Alzheimer’s disease dementia
Page 11 of 51
ScholarOne, 375 Greenbrier Drive, Charlottesville, VA, 22901 Support (434) 964 4100
Brain
For Peer Review
11
Using the IWG-2 criteria, progression to non-Alzheimer’s disease dementia was higher for
subjects without prodromal Alzheimer’s disease than for subjects with prodromal Alzheimer’s
disease (Table 2; 3-year progression rate 13% versus 3%; hazard ratio = 3.4, 1.3–8.8, P = 0.011).
Using the NIA-AA classification, progression to non-Alzheimer’s disease dementia was higher in
the low Alzheimer’s disease likelihood (3-year progression rate 14%) and SNAP (3-year
progression 13%) groups compared to the high Alzheimer’s disease likelihood and inconclusive
groups (3-year progression both 4%; Table 2; low: hazard ratio = 3.0, 1.3–6.9, P = 0.011
compared to high, hazard ratio = 2.8, 1.2–6.5, P = 0.016 compared to inconclusive; SNAP: hazard
ratio = 2.6, 1.2–5.6, P = 0.013 compared to high, hazard ratio = 2.5, 1.1–5.3, P = 0.021 compared
to inconclusive). Using the IWG-1 criteria, no difference in progression to non-Alzheimer’s
disease dementia was found between subjects without and with prodromal Alzheimer’s disease
(Table 2; 3-year progression rate 8% versus 7%; hazard ratio = 1.2, 0.8–1.9, P = 0.35).
Effect of neuronal injury marker
Subject classification based on an amyloid marker in combination with CSF tau or with medial
temporal lobe was generally the same (Table 6). Of the subjects with an abnormal amyloid marker
and two neuronal injury markers, 29% had only one injury marker abnormal, with tau being more
often abnormal than the medial temporal lobe (Table 7). Both these neuronal injury groups had a
similar outcome. Subjects with abnormal CSF amyloid-β1-42 and both abnormal CSF tau and
medial temporal lobe atrophy had a higher progression rate to Alzheimer’s disease-type dementia
than those with only one abnormal neuronal injury marker (68% versus 36–41%, P <0 .0001).
Similar findings were obtained in subjects with a normal amyloid marker (Table 7).
SNAP characterization
Because the SNAP group showed a relatively high progression rate to Alzheimer’s disease-type
dementia, we investigated CSF amyloid-β1-42 levels between subjects with and without progression
by comparing how much amyloid-β1-42 levels were above the cut-off. Analyses were restricted to
subjects for whom biomarkers were analysed by ELISA (n = 185), as the number of subjects with
suspected non-Alzheimer pathophysiology for whom biomarkers were analysed by xMAP was
relatively small (n = 35). Subjects with SNAP who progressed to Alzheimer’s disease-type
dementia had amyloid-β1-42 levels closer to the cut-off than subjects who did not progress and
Page 12 of 51
ScholarOne, 375 Greenbrier Drive, Charlottesville, VA, 22901 Support (434) 964 4100
Brain
For Peer Review
12
subjects who progressed to non-Alzheimer’s disease dementia [158 (SD 142) above the cut-off
versus 336 (SD 257) and 381 (SD 259) pg/ml above the cut-off, P < 0.0001; Fig. 2].
Discussion
This is the first large-scale multicentre study to compare the IWG-1, IWG-2 and NIA-AA criteria
for prodromal Alzheimer’s disease in subjects with MCI. We noted marked differences between
the criteria in Alzheimer’s disease prevalence and predictive accuracy for Alzheimer’s disease-
type dementia.
The IWG criteria were designed to identify individuals with a high probability of having
Alzheimer’s disease for research purposes. Indeed, we found relatively high progression rates for
Alzheimer’s disease-type dementia in subjects with prodromal Alzheimer’s disease but we found
also that a substantial part of the subjects not meeting prodromal Alzheimer’s disease criteria
progressed to Alzheimer’s disease-type dementia. For the IWG-1 criteria, we demonstrated that
the high progression rate in subjects without prodromal Alzheimer’s disease is likely due to the
presence of subjects with non-amnestic MCI with abnormal biomarkers. For the IWG-2 criteria,
we demonstrated that this is likely due to the inclusion of subjects with IAP and SNAP in this
group. A remarkable finding was the similar predictive accuracy of IWG-2 typical and atypical
prodromal Alzheimer’s disease. This corroborates a previous study (Vos et al., 2013b) and
supports the use of non-amnestic MCI as Alzheimer’s disease clinical phenotype.
The NIA-AA criteria were designed both for research and clinical purposes. The prognosis of the
low, high and intermediate Alzheimer’s disease likelihood subgroups nicely fitted with the
proposed terminology.
In the subsample with both amyloid and neuronal injury markers available, differences in
sensitivity, specificity, positive predictive value, and negative predictive value between the criteria
can be explained by whether one or two biomarkers needed to be abnormal. If both were required
to be abnormal (as was the case for IWG-2 and NIA-AA high Alzheimer’s disease likelihood
versus low Alzheimer’s disease likelihood and conflicting biomarker groups), positive predictive
value and specificity were high and sensitivity and negative predictive value low, consistent with
previous findings (van Rossum et al., 2012). If one biomarker was required abnormal (as was the
case for IWG-1, NIA-AA, high Alzheimer’s disease-likelihood and conflicting biomarker groups
versus low-Alzheimer’s disease-likelihood group), positive predictive value and specificity were
low and sensitivity and negative predictive value high.
Page 13 of 51
ScholarOne, 375 Greenbrier Drive, Charlottesville, VA, 22901 Support (434) 964 4100
Brain

For Peer Review
13
In the subsample with only a neuronal injury marker available, the higher specificity for IWG-1
compared to NIA-AA (intermediate Alzheimer’s disease likelihood group versus inconclusive
group) likely reflects the requirement of memory impairment for IWG-1 prodromal Alzheimer’s
disease. The progression rate to Alzheimer’s disease-type dementia in the NIA-AA intermediate
Alzheimer’s disease likelihood group was similar to that of the high Alzheimer’s disease
likelihood group and suggests that many subjects also had abnormal amyloid markers
The relatively high progression rate (~20%) for subjects with SNAP is intriguing, as the
biomarker profile suggests that non-Alzheimer’s disease pathology is likely (Petersen et al.,
2013). We found that subjects with SNAP who progressed to Alzheimer’s disease-type dementia
had CSF amyloid-β1-42 levels just above the cut-off. This indicates that the amyloid-β1-42 cut-offs
may have been too conservative, although using a more lenient cut-off would also lead to more
false positives. Alternatively, it could be that these subjects have comorbidities so that less
amyloid pathology is needed to progress to Alzheimer’s disease-type dementia. SNAP could also
be an atypical form of Alzheimer’s disease with less pronounced amyloid pathology. It is also
possible that these subjects have non-Alzheimer’s disease pathology with minimal amyloid
deposits and are misclassified as Alzheimer’s disease-type dementia at follow-up.
Only a small group of subjects was classified in the IAP group, likely because most subjects with
Alzheimer’s disease already have neuronal injury at the MCI stage. Approximately 20% of the
subjects with IAP progressed to Alzheimer’s disease-type dementia. A previous MCI study did
not find any converters with IAP, although this could be due to their relatively short follow-up (1
year; Petersen et al., 2013). Studies with longer follow-up are needed to see whether all subjects
with IAP will eventually progress to Alzheimer’s disease-type dementia or have some amyloid
pathology unrelated to Alzheimer’s disease.
Availability of only one biomarker is a common clinical situation. As amyloid assessment is
relatively invasive and expensive, often only neuronal injury markers will be measured. In
subjects with only injury markers, the prognostic accuracy of the NIA-AA intermediate
Alzheimer’s disease likelihood and inconclusive groups was very similar to that of the IWG-1
groups.
A higher progression rate to non-Alzheimer’s disease dementia was found in subjects without
IWG-2 prodromal Alzheimer’s disease compared to those with prodromal Alzheimer’s disease
and in subjects in the NIA-AA low Alzheimer’s disease likelihood and SNAP groups compared to
the high Alzheimer’s disease likelihood group. This is in-line with what is expected based on the
Page 14 of 51
ScholarOne, 375 Greenbrier Drive, Charlottesville, VA, 22901 Support (434) 964 4100
Brain
For Peer Review
14
biomarker profiles. In general, the progression rate to non-Alzheimer’s disease dementia at
follow-up was rather low, which could be because the cohorts were designed to study Alzheimer’s
disease.
We found that 29% of the subjects with abnormal CSF amyloid-β1-42 and two neuronal injury
markers (CSF tau and MTL) had only one of the abnormal injury markers. This is likely because
the neuronal injury biomarkers measure different pathophysiologies, and abnormality in one does
not always mean that the other is abnormal as well, at least at the MCI stage. Subjects with both
abnormal injury markers had higher Alzheimer’s disease progression rates compared to those with
only one abnormal injury marker in combination with amyloid pathology. This is in-line with
previous studies (Scott et al., 2010; van Rossum et al., 2012) and suggests that the former group is
further in the disease process or has a more aggressive form of Alzheimer’s disease.
The lack of standardized biomarker cut-offs is a known drawback in the field. We applied centre-
specific biomarker cut-offs to correct for possible differences in lab procedures. Use of the same
CSF ELISA cut-off for all centres would have led to essentially the same results (Supplementary
Table 7). Although the use of predefined cut-offs likely resulted in somewhat lower sensitivities
and specificities compared to other studies that used cut-offs defined within the sample, our study
may better reflect the real diagnostic accuracy of biomarkers/the criteria.
This study has several limitations. Because the findings were based on memory clinic or research
populations, they may not be generalizable to other settings. For some subjects a MRI assessment
was not performed or data were not provided to us, although this is normally part of clinical
routine. No autopsy data were available, which might have led to misclassification of Alzheimer’s
disease. Furthermore, we used retrospective data so centres used different cognitive tests and
biomarker protocols. While this reflects current clinical practice, it could have introduced
variability. Analyses for the largest cohorts separately showed some variability in prevalence and
outcome of Alzheimer’s disease in subjects with MCI (Supplementary Tables 8 and 9). However,
as this variability is typically random, pooling data from all centres is likely to balance out on
average. Furthermore, as our main aim was to compare the sets of criteria, variability in
operationalization will affect each of the criteria similarly. Standardization of cognitive tests and
biomarkers will be an important goal to achieve in the future and many initiatives have started
working on this. But even after standardization the criteria may still perform differently in specific
settings. Because we used retrospective data, access to tests that measure non-memory domains
was limited. Our operationalization of atypical prodromal Alzheimer’s disease may therefore not
entirely reflect the clinical variants described in the IWG-2 criteria and may be less sensitive to
Page 15 of 51
ScholarOne, 375 Greenbrier Drive, Charlottesville, VA, 22901 Support (434) 964 4100
Brain
For Peer Review
15
detect atypical cognitive profiles. While the IWG-1 criteria recommended a cued recall test to
define memory impairment, such tests were not available for most studies and we used non-cued
memory tests as well. New prospective studies should include a wider range of cognitive tests to
improve operationalization of the criteria. We used CSF amyloid-β1-42 as amyloid marker while
use of amyloid-PET could have led to different results and would be interesting in light of the
IWG-2 criteria. The major strengths of our study include the large sample size of well-
characterized subjects and relatively long follow-up.
Our findings have several implications. While the IWG-1, IWG-2 and NIA-AA criteria for
prodromal Alzheimer’s disease can all be used to select subjects for therapeutic trials or clinical
follow-up as they all predict cognitive decline with reasonable accuracy, a certain set of criteria
may be preferred for specific purposes. In clinical trials, a high conversion rate is needed. If both
amyloid and neuronal injury markers are available, one could best select subjects according to the
IWG-2 prodromal Alzheimer’s disease group or NIA-AA high Alzheimer’s disease likelihood
group. This means that subjects with any MCI can be included. If only neuronal injury markers are
available, the IWG-1 criteria should be considered rather than the NIA-AA criteria because of the
higher specificity due to requirement of amnestic MCI for prodromal Alzheimer’s disease. In
clinical settings, a refined prognosis is needed and exclusion of the disease is important to reassure
patients. The NIA-AA criteria will then offer the most accurate prognosis. As Alzheimer’s disease
at the MCI stage can manifest as non-memory impairment, a broad definition of MCI should be
applied.
IAP and SNAP are heterogeneous conditions with subgroups progressing to Alzheimer’s disease-
type dementia and further studies are needed to characterize these subjects’ prognosis and
underlying pathophysiology.
Funding
The research leading to these results has received support from the Innovative Medicines Initiative
Joint Undertaking under EMIF grant agreement n° 115372, resources of which are composed of
financial contribution from the European Union's Seventh Framework Programme (FP7/2007-
2013) and EFPIA companies’ in kind contribution.
This research was performed within the framework of CTMM, The Centre for Translational
Molecular Medicine (www.ctmm.nl), project LeARN (grant 02N-101).
Page 16 of 51
ScholarOne, 375 Greenbrier Drive, Charlottesville, VA, 22901 Support (434) 964 4100
Brain
For Peer Review
16
The DESCRIPA study was funded by the European Commission within the 5th framework
program (QLRT-2001- 2455).
The AddNeuroMed study was funded by InnoMed (Innovative Medicines in Europe), an
Integrated Project funded by the European Union of the Sixth Framework program priority FP6-
2004-LIFESCIHEALTH-5, Life Sciences, Genomics and Biotechnology for Health.
The Coimbra Centre was funded by Project PIC/IC/ 83206/2007 da Fundação para a Ciência e
Tecnologia – Portugal.
Research of the VUmc Alzheimer centre is part of the neurodegeneration research program of the
Neuroscience Campus Amsterdam. The VUmc Alzheimer Centre is supported by Alzheimer
Nederland and Stichting VUmc fonds. The clinical database structure was developed with funding
from Stichting Dioraphte.
The Alzheimer's Disease Neuroimaging Initiative (ADNI; National Institutes of Health Grant U01
AG024904 and DOD ADNI Department of Defense award number W81XWH-12-2-0012) was
funded by the National Institute on Aging, the National Institute of Biomedical Imaging and
Bioengineering, and through generous contributions from the following: Alzheimer’s Association;
Alzheimer’s Drug Discovery Foundation; BioClinica, Inc.; Biogen Idec Inc.; Bristol-Myers
Squibb Company; Eisai Inc.; Elan Pharmaceuticals, Inc.; Eli Lilly and Company; F. Hoffmann-La
Roche Ltd and its affiliated company Genentech, Inc.; GE Healthcare; Innogenetics, N.V.; IXICO
Ltd.; Janssen Alzheimer Immunotherapy Research & Development, LLC.; Johnson & Johnson
Pharmaceutical Research & Development LLC.; Medpace, Inc.; Merck & Co., Inc.; Meso Scale
Diagnostics, LLC.; NeuroRx Research; Novartis Pharmaceuticals Corporation; Pfizer Inc.;
Piramal Imaging; Servier; Synarc Inc.; and Takeda Pharmaceutical Company. The Canadian
Institutes of Health Research is providing funds to Rev December 5, 2013 support ADNI clinical
sites in Canada. Private sector contributions are facilitated by the Foundation for the National
Institutes of Health (www.fnih.org). The grantee organization is the Northern California Institute
for Research and Education, and the study is coordinated by the Alzheimer's Disease Cooperative
Study at the University of California, San Diego. ADNI data are disseminated by the Laboratory
for Neuro Imaging at the University of Southern California.
Supplementary material
Supplementary material is available at Brain online.
Page 17 of 51
ScholarOne, 375 Greenbrier Drive, Charlottesville, VA, 22901 Support (434) 964 4100
Brain
For Peer Review
17
References
1. Dubois B, Feldman HH, Jacova C, DeKosky ST, Barberger-Gateau P, Cummings J, et al.
Research criteria for the diagnosis of Alzheimer's disease: revising the NINCDS-ADRDA
criteria. Lancet Neurol 2007; 6: 734-46.
2. Dubois B, Feldman HH, Jacova C, Cummings J, DeKosky ST, Barberger-Gateau P, et al.
Revising the definition of Alzheimer's disease: a new lexicon. Lancet Neurol 2010; 9: 1118-
27.
3. Dubois B, Feldman HH, Jacova C, Hampel H, Molinuevo JL, Blennow K, et al. Advancing
research diagnositic criteria for Alzheimer’s disease: the IWG-2 criteria. Lancet Neurol
2014; 13: 614-29.
4. Albert MS, DeKosky ST, Dickson D, Dubois B, Feldman HH, Fox NC, et al. The diagnosis
of mild cognitive impairment due to Alzheimer's disease: recommendations from the
National Institute on Aging and Alzheimer's Association workgroup. Alzheimers Dement
2011; 7: 270-79.
5. Visser PJ, Vos SJB, van Rossum I, Scheltens P. Comparison of international Working
Group criteria and National Institute on Aging-Alzheimer’s Association criteria for
Alzheimer’s disease. Alzheimers Dement 2012; 8: 560-3.
6. Oksengard AR, Cavallin L, Axelsson R, Andersson C, Nägga K, Winblad B, et al. Lack of
accuracy for the proposed 'Dubois criteria' in Alzheimer's disease: a validation study from
the Swedish brain power initiative. Dement Geriatr Cogn Disord 2010; 30: 374-80.
7. Bouwman FH, Verwey NA, Klein M, Kok A, Blankenstein MA, Sluimer JD, et al. New
research criteria for the diagnosis of Alzheimer’s disease applied in a memory clinic
population. Dement Geriatr Cogn Disord 2010; 30: 1–7.
Comment [j1]: these need to be arranged
alphabetically
Page 18 of 51
ScholarOne, 375 Greenbrier Drive, Charlottesville, VA, 22901 Support (434) 964 4100
Brain
For Peer Review
18
8. Prestia A, Caroli A, van der Flier WM, Ossenkoppele R, Van Berckel B, Barkhof F, et al.
Prediction of dementia in mild cognitive impairment patients based on core diagnostic
markers for Alzheimer disease. Neurology 2013; 80: 1048-56.
9. Petersen RC, Aisen P, Boeve BF, Geda YE, Ivnik RJ, Knopman DS, et al. Criteria for mild
cognitive impairment due to alzheimer's disease in the community. Ann Neurol 2013; 47:
199-208.
10. Visser PJ, Verhey FR, Boada M, Bullock R, De Deyn PP, Frisoni GB, et al. Development of
screening guidelines and clinical criteria for predementia Alzheimer's disease. The
DESCRIPA Study. Neuroepidemiology 2008; 30: 254-65.
11. Lovestone S, Francis P, Kloszewska I, Meccoci P, Simmons A, Soininen H, et al.
AddNeuroMed - the European collaboration for the discovery of novel biomarkers for
Alzheimer's disease. Ann NY Acad Sci 2009; 1180: 36-46.
12. Kornhuber J, Schmidtke K, Froelich L, Perneczky R, Wolf S, Hampel H, et al. Early and
differential diagnosis of dementia and mild cognitive impairment. Design and cohort
baseline characteristics of the German Dementia Competence Network. Dement Geriatr
Cogn Disord 2009; 27: 404-17.
13. Morbelli S, Drzezga A, Perneczky R, Frisoni GB, Caroli A, van Berckel BN, et al. Resting
metabolic connectivity in prodromal Alzheimer's disease. A European Alzheimer Disease
Consortium (EADC) project. Neurobiol Aging 2012; 33: 2533-50.
14. Mueller SG, Weiner MW, Thal LJ, Petersen RC, Jack CR, Jagust W, et al. Ways toward an
early diagnosis in Alzheimer's disease: the Alzheimer's Disease Neuroimaging Initiative
(ADNI). Alzheimers Dement 2005; 1: 55-66.
15. van der Flier WM, Pijnenburg YA, Prins N, Lemstra AW, Bouwman FH, Teunissen CE, et
al. Optimizing Patient Care and Research: The Amsterdam Dementia Cohort. J Alzheimers
Dis 2014; 41: 313-27.
Page 19 of 51
ScholarOne, 375 Greenbrier Drive, Charlottesville, VA, 22901 Support (434) 964 4100
Brain
For Peer Review
19
16. Van der Mussele S, Mariën P, Saerens J, Somers N, Goeman J, De Deyn PP, et al.
Behavioral syndromes in mild cognitive impairment and Alzheimer's disease. J Alzheimers
Dis 2014; 38: 319-29.
17. Frisoni GB1, Prestia A, Zanetti O, Galluzzi S, Romano M, Cotelli M, et al. Markers of
Alzheimer's disease in a population attending a memory clinic. Alzheimers Dement 2009; 5:
307-17.
18. Baldeiras I, Santana I, Proença MT, Garrucho MH, Pascoal R, Rodrigues A, et al. Peripheral
oxidative damage in Mild Cognitive Impairment and mild Alzheimer’s disease. J
Alzheimers Dis 2008; 15: 117-28.
19. Eckerström C, Andreasson U, Olsson E, Rolstad S, Blennow K, Zetterberg H, et al.
Combination of hippocampal volume and cerebrospinal fluid biomarkers improves
predictive value in mild cognitive impairment. Dement Geriatr Cogn Disord 2010; 29: 294-
300.
20. Seppälä TT, Koivisto AM, Hartikainen P, Helisalmi S, Soininen H, Herukka SK.
Longitudinal changes of CSF biomarkers in Alzheimer's disease. J Alzheimers Dis 2011; 25:
583-94.
21. Bastin C, Kerrouche N, Lekeu F, Adam S, Guillaume B, Lemaire C, et al. Controlled
memory processes in questionable Alzheimer's disease: a view from neuroimaging research.
J Alzheimers Dis 2010; 20: 547-60.
22. Maroco J, Silva D, Rodrigues A, Guerreiro M, Santana I, de Mendonça A. Data mining
methods in the prediction of Dementia: A real-data comparison of the accuracy, sensitivity
and specificity of Linear Discriminant Analysis, Logistic Regression, Neural Networks,
Support Vector Machines, Classification Trees and Random Forests. BMC Res Notes 2011;
4: 299.
Page 20 of 51
ScholarOne, 375 Greenbrier Drive, Charlottesville, VA, 22901 Support (434) 964 4100
Brain

For Peer Review
20
23. Petersen RC. Mild cognitive impairment as a diagnostic entity. J Intern Med 2004; 256: 183-
94.
24. American Psychiatric Association. Diagnostic and Statistical Manual of Mental Disorders:
DSM-IV. Washington, DC: American Psychiatric Association; 1994.
25. McKhann G, Drachman D, Folstein M, Katzman R, Price D, Stadlan EM. Clinical diagnosis
of Alzheimer's disease: report of the NINCDS-ADRDA Work Group under the auspices of
Department of Health and Human Services Task Force on Alzheimer's Disease. Neurology
1984; 34: 939-44.
26. Jack CR, Jr., Knopman DS, Weigand SD, Wiste HJ, Vemuri P, Lowe V, et al. An
operational approach to National Institute on Aging-Alzheimer's Association criteria for
preclinical Alzheimer disease. Ann Neurol 2012; 71: 765-75.
27. Vos SJ, Chengjie X, Visser PJ, Jasielec MS, Hassenstab J, Grant EA, et al. Preclinical
Alzheimer’s disease and its outcome: a longitudinal cohort study. Lancet Neurol 2013; 12:
957-65.
28. Vos SJ, van Rossum IA, Verhey F, Knol DL, Soininen H, Wahlund LO, et al. Prediction of
Alzheimer disease in subjects with amnestic and nonamnestic mild cognitive impairment.
Neurology 2013; 80: 1124-32.
29. van Rossum IA, Vos SJ, Burns MP, Knol DL, Scheltens P, Soininen H, et al. Injury markers
predict cognitive decline in subjects with mild cognitive impairment and amyloid pathology.
Neurology 2012; 79: 1809-16.
30. Scott JM, Bartlett JW, Fox NC, Barnes J. Increased brain atrophy rates in cognitively
normal older adults with low cerebrospinal fluid Abeta1-42. Ann Neurol 2010; 68: 825-34.
Figure legends
Page 21 of 51
ScholarOne, 375 Greenbrier Drive, Charlottesville, VA, 22901 Support (434) 964 4100
Brain
For Peer Review
21
Figure 1 Alzheimer’s disease-type dementia survival probability by the IWG-1, IWG-2 and
NIA-AA criteria. The graphs represent the Alzheimer’s disease-type dementia survival
probability according to the IWG-1 (left), IWG-2 (middle), and NIA-AA (right) criteria, adjusted
for age, gender, education and centre. IWG-1: The group without prodromal Alzheimer’s disease
represents subjects without memory impairment and/or abnormal biomarker(s). The prodromal
Alzheimer’s disease group represents subjects with memory impairment and at least one abnormal
biomarker. IWG-2: The group without prodromal Alzheimer’s disease represents subjects with
normal CSF amyloid-β1-42 and/or tau. The prodromal Alzheimer’s disease group represents
subjects with abnormal CSF amyloid-β1-42 and tau. NIA-AA: The low Alzheimer’s disease
likelihood group represents subjects with normal amyloid and neuronal injury markers, the high
Alzheimer’s disease likelihood group represents subjects with both abnormal amyloid and
neuronal injury markers, the IAP group is a conflicting biomarker group with an abnormal
amyloid marker and normal neuronal injury marker, the SNAP group is a conflicting biomarker
group with an abnormal neuronal injury marker and normal amyloid marker, the intermediate
Alzheimer’s disease likelihood group represents subjects with an abnormal neuronal injury marker
without information on amyloid pathology, the inconclusive group represents subjects with a
normal neuronal injury marker without information on amyloid pathology. AD = Alzheimer’s
disease.
Figure 2 CSF amyloid-β1-42 levels above the cut-off in the SNAP group by outcome. Results
are CSF amyloid-β1-42 levels above the cut-off of subjects with SNAP who had Alzheimer’s
disease-type dementia, no dementia or non-Alzheimer’s disease dementia at follow-up. As
amyloid-β1-42 cut-offs were different for different studies, we compared the amyloid-β1-42 levels
above the cut-off (deviation from the cut-off) and not overall amyloid-β1-42 levels. The bold line
represents the mean CSF amyloid-β1-42 levels above the cut-off.
AD = Alzheimer’s disease, Aß = amyloid-β.
Page 22 of 51
ScholarOne, 375 Greenbrier Drive, Charlottesville, VA, 22901 Support (434) 964 4100
Brain

For Peer Review
Figure 1. Alzheimer’s disease-type dementia survival probability by the IWG-1, IWG-2, and NIA-AA criteria
The graphs represent the Alzheimer’s disease-type dementia survival probability according to the IWG-1 (left), IWG-2 (middle), and NIA-AA (right) criteria, adjusted for age, gender, education, and center.
IWG-1: The group without prodromal Alzheimer’s disease represents subjects without memory impairment and/or abnormal biomarker(s). The prodromal Alzheimer’s disease group represents subjects with memory impairment and at least one abnormal biomarker. IWG-2: The group without prodromal Alzheimer’s disease
represents subjects with normal CSF Aβ1-42 and/or tau. The prodromal Alzheimer’s disease group
represents subjects with abnormal CSF Aβ1-42 and tau. NIA-AA: The low-Alzheimer’s disease-likelihood group represents subjects with normal amyloid and neuronal injury markers, the high-Alzheimer’s disease-
likelihood group represents subjects with both abnormal amyloid and neuronal injury markers, the IAP group is a conflicting biomarker group with an abnormal amyloid marker and normal neuronal injury marker, the SNAP group is a conflicting biomarker group with an abnormal neuronal injury marker and normal amyloid
marker, the intermediate-Alzheimer’s disease-likelihood group represents subjects with an abnormal neuronal injury marker without information on amyloid pathology, the inconclusive group represents
subjects with a normal neuronal injury marker without information on amyloid pathology. AD=Alzheimer’s disease, IWG=International Working Group, NIA-AA=National Institute of Aging and Alzheimer’s Association,
IAP=isolated Alzheimer pathology, SNAP=suspected non-Alzheimer pathophysiology.
Page 23 of 51
ScholarOne, 375 Greenbrier Drive, Charlottesville, VA, 22901 Support (434) 964 4100
Brain

For Peer Review
Figure 2. CSF Aß1-42 levels above the cut-off in the SNAP group by outcome.
Results are CSF Aß1-42 levels above the cut-off of subjects with SNAP who had Alzheimer’s disease-type dementia, no dementia or non-AD dementia at follow-up. As Aß1-42 cut-offs were different for different studies, we compared the Aß1-42 levels above the cut-off (deviation from the cut-off) and not overall Aß1-42 levels. The bold line represents the mean CSF Aß1-42 levels above the cut-off. AD=Alzheimer’s disease,
Aß=amyloid beta, SNAP=Suspected Non-Alzheimer Pathophysiology.
138x93mm (300 x 300 DPI)
Page 24 of 51
ScholarOne, 375 Greenbrier Drive, Charlottesville, VA, 22901 Support (434) 964 4100
Brain

For Peer Review
Supplemental data
Prevalence and prognosis of Alzheimer’s disease at the mild cognitive impairment stage
Stephanie J. B. Vos PhD, Frans Verhey MD, Lutz Frölich MD, Johannes Kornhuber MD, Jens
Wiltfang MD, Wolfgang Maier MD, Oliver Peters MD, Eckart Rüther MD, Flavio Nobili MD,
Silvia Morbelli MD, Giovanni B. Frisoni MD, Alexander Drzezga MD, Mira Didic PhD, Bart N.
M. van Berckel MD, Andrew Simmons PhD, Hilkka Soininen MD, Iwona Kloszewska, Patrizia
Mecocci MD, Magda Tsolaki MD, Bruno Vellas, Simon Lovestone PhD, Cristina Muscio MS,
Sanna-Kaisa Herukka MD, Eric Salmon MD, Christine Bastin PhD, Anders Wallin MD, Arto
Nordlund PhD, Alexandre de Mendonça MD, Dina Silva PhD, Isabel Santana MD, Raquel Lemos
PhD, Sebastiaan Engelborghs MD, Stefan Van der Mussele PhD, the Alzheimer’s Disease
Neuroimaging Initiative, Yvonne Freund-Levi MD, Åsa K. Wallin MD, Harald Hampel MD,
Wiesje van der Flier PhD, Philip Scheltens MD, and Pieter Jelle Visser MD,
Supplemental Table 1. Neuropsychological tests by center and by cognitive domain
Supplemental Table 2. Biomarker cut-offs per center
Supplemental Table 3. Number of subjects by center and by biomarker
Supplemental Table 4. Sample demographics by biomarker groups
Supplemental Table 5. Alzheimer’s disease-type dementia survival probability based on the NIA-
AA classification in two groups
Supplemental Table 6. Annual Mini-Mental State Examination change for each biomarker group
by the IWG-1, IWG-2, and NIA-AA criteria
Supplemental Table 7. Alzheimer’s disease prevalence at the mild cognitive impairment stage and
dementia survival probability with abnormal CSF Aß1-42 and tau defined according to the same
ELISA cut-offs
Supplemental Table 8. Prevalence of Alzheimer’s disease at the mild cognitive impairment stage
for each large cohort separately
Supplemental Table 9. 3-year progression rate to Alzheimer’s disease-type dementia at last
follow-up for each large cohort separately
Page 25 of 51
ScholarOne, 375 Greenbrier Drive, Charlottesville, VA, 22901 Support (434) 964 4100
Brain

For Peer Review
Supplemental Figure 1. Annual Mini-Mental State Examination change for each biomarker group
by the IWG-1, IWG-2, and NIA-AA criteria
Supplemental Figure 2. Alzheimer’s disease-type dementia survival probability by subdivided
IWG-1 and IWG-2 criteria
Supplemental Text 1. Methods ADNI study
Page 26 of 51
ScholarOne, 375 Greenbrier Drive, Charlottesville, VA, 22901 Support (434) 964 4100
Brain
For Peer Review
Supplemental Table 1. Neuropsychological tests by center and by cognitive domain
Center / study Neuropsychological tests
Memory Language Executive function Visuoconstruction
AddNeuroMed
(multicenter)
CERAD word list CERAD verbal fluency animals 1
minute
- CERAD visuoconstruction
ADNI (multicenter) RAVLT Verbal fluency animals 1
minute
TMT part A and B -
Amsterdam RAVLT Verbal fluency animals 1
minute
TMT part A and B Rey figure copy test
Antwerp RBANS word list, WMS verbal
paired associations, logical memory,
RBANS story recall, HDS
RBANS verbal fluency animals
1 minute
TMT part A and B RBANS figure copy, cube
drawing, luria meander
Brescia RAVLT, story Brescia Verbal fluency animals 1
minute, phonemic fluency 1
minute
TMT part A and B Rey copy figure
Coimbra ADAS-Cog word list, free & cued
recall
Fluency animals 1minute TMT part A and B ADAS-Cog
DCN (multicenter) CERAD word list, WMS logical
memory
CERAD verbal fluency animals
1 minute
TMT part A and B CERAD visuoconstruction
DESCRIPA
(multicenter)
RAVLT and CERAD word list were
primary tests
Verbal fluency animals 1
minute
TMT part A and B Rey figure copy test and
CERAD figures were
primary tests
EADC-PET
(multicenter)
RAVLT and CERAD word list were
primary tests
Verbal fluency animals 1
minute
TMT part A and B Rey figure copy test and
CERAD figures were
primary tests
Gothenburg RAVLT FAS word fluency 1 minute
(x3)
TMT part A and B Rey figure copy test
Kuopio CERAD word list - - CERAD visuoconstruction
Liège RI-48 word list Verbal fluency animals 2
minutes
Stroop interference -
Lisbon CVLT Verbal fluency supermarket
items 1 minute
TMT part A and B Cube copy
If multiple tests were performed for a cognitive domain, tests were ranked by preference; if scores of the first test were not available, we used scores of the
second tests etc. CERAD=The Consortium to Establish a Registry for Alzheimer’s Disease, RAVLT=Rey auditory Verbal Learning Test, TMT=Trail Making
Test, RBANS=Repeatable Battery for the Assessment of Neuropsychological Status, WMS=Wechsler Memory Scale, HDS= Hierarchic Dementia Scale,
ADAS-Cog=Alzheimer's Disease Assessment Scale-cognitive subscale, CVLT= Californian Verbal Learning Test. DESCRIPA tests per center are described
elsewhere.
Page 27 of 51
ScholarOne, 375 Greenbrier Drive, Charlottesville, VA, 22901 Support (434) 964 4100
Brain
For Peer Review
Supplemental Table 2. Biomarker cut-offs per center
Center / study CSF Aß1-42
(pg/ml)**
CSF total tau
(pg/ml)**
CSF
phosphorylated
tau (pg/ml)**
FDG-PET Hippocampal volume Medial
temporal lobe
atrophyg
AddNeuroMed
(multicenter)*
- - - - Z-score <-0·0003 (calculated in
healthy controls)
> 2
ADNI (multicenter)*
<192a
>93a
>23a
- < 5·389 cm
3, LEAP method
b -
Amsterdam <551c >375
c >52
c - < 5·389
cm
3, LEAP method
b > 2
Antwerp <638·5 >296·5 >56·5 - - -
Brescia <500d
>450/>500d
- - < 5th
percentile of volume
distribution of controlse
> 2
Coimbra <542 >250 >35 - - > 2
DCN (multicenter)*
<500 >600 >61 - <4500 mm3
DESCRIPA
(multicenter)*
<551c
>375c
>52c
- < 5·389 cm3, LEAP method
b > 2
EADC-PET
(multicenter)*
<500d >450/>500
d - AD profile < 5
th percentile of volume
distribution of controlse
> 2
Gothenburg <450 >400 >80 - - -
Kuopio <452 >399 >70 - Right: men<14·9, women<15·3f
Left: men<14·3, woman<14·1f
-
Liège - - - AD profile - -
Lisbon <445 >300 >61 - Z-score <-1·5 SD -
*For the multicenter studies, biomarker analyses were performed centrally, as described elsewhere.
**CSF analyses were performed using
commercially available sandwich ELISAs for all centers except for the ADNI study, which used the multiplex xMAP Luminex platform.
PET=Positron Emission Tomography, CSF=cerebrospinal fluid, Aß=amyloid-beta, FDG= fludeoxyglucose. aShaw LM, Vanderstichele H, Knapik-
Czajka M, et al. Cerebrospinal fluid biomarker signature in Alzheimer’s disease neuroimaging initiative subjects. Ann Neurol 2009;65:403–413; bVos
SJ, van Rossum IA, Verhey F, et al. Prediction of Alzheimer disease in subjects with amnestic and nonamnestic MCI. Neurology 2013;80:1124-1132; cMulder C, Verwey NA, van der Flier WM, et al. Amyloid-ß(1-42), total tau, and phosphorylated tau as cerebrospinal fluid biomarkers for the
diagnosis of Alzheimer disease. Clin Chem 2010;56:248 –253; dSjogren M, Vanderstichele H, Ågren H, et al. Tau and Abeta42 in cerebrospinal fluid
from healthy adults 21–93 years of age: establishment of reference values. Clin Chem 2001;47:1776–1781; eGaluzzi S, Geroldi C, Ghidoni R, et al.
The new Alzheimer’s criteria in a naturalistic series of patients with mild cognitive impairment. J neurol 2010; 257, 2004-14; fHerukka SK, Pennanen
C, Soininen H, Pirttila T. CSF Abeta42, tau and phosphorylated tau correlate with medial temporal lobe atrophy. J Alzheimers Dis 2008;14:51-7; gScheltens P, Leys D, Barkhof F, et al. Atrophy of medial temporal lobes on MRI in “probable” Alzheimer’s disease and normal ageing: diagnostic
value and neuropsychological correlates. J Neurol Neurosurg Psychiatry 1992; 55, 967e972.
Page 28 of 51
ScholarOne, 375 Greenbrier Drive, Charlottesville, VA, 22901 Support (434) 964 4100
Brain

For Peer Review
Supplemental Table 3. Number of subjects by center and by biomarker
Center / study Total
N
Amyloid
marker
Injury marker
CSF
Aß1-42
CSF
tau
FDG-
PET
Hippocampal
volume
Medial
temporal
lobe
atrophy
AddNeuroMed 99 - - - 98 85
ADNI 300 155 155 - 300 -
Amsterdam 124 88 88 - 96 110
Antwerp 32 32 32 - - -
Brescia 80 56 56 - 78 58
Coimbra 36 16 16 - - 35
DCN 373 227 227 - 283 -
DESCRIPA 267 104 104 - 217 235
EADC-PET 125 31 31 125 9 9
Gothenburg 36 36 36 - - -
Kuopio 50 19 19 - 48 -
Liège 49 - - 49 - -
Lisbon 36 2 2 - 36 -
CSF=cerebrospinal fluid, Aß=amyloid-beta, FDG= fludeoxyglucose, PET=Positron
Emission Tomography.
Page 29 of 51
ScholarOne, 375 Greenbrier Drive, Charlottesville, VA, 22901 Support (434) 964 4100
Brain

For Peer Review
Supplemental Table 4. Sample demographics by biomarker groups
Total
sample
N=1607
1 marker
FDG-PET
N=140
1 marker
MTL
N=698
1 marker
FDG-PET
or MTL
N=841
2 markers
CSF Aß
and tau
N=200
2/3 markers
CSF Aß and
tau with or
without MTL
or FDG-PET
N=766
3/4 biomarkers
CSF Aß and tau
and MTL with
or without
FDG-PET
N=544
Age, y 70·1
(8·4)
71·5 (8·0) 71·0
(8·0)
71·1 (8·0) 66·8
(8·8)
68·9 (8·7) 69·5 (8·5)
Female, n 808
(50%)
64 (46%) 389
(56%)
455 (54%) 93 (47%) 353 (46%) 245 (45%)
Education, y 10·8
(4·3)
11·0 (4·2) 10·4
(4·6)
10·5 (4·5) 10·6
(2·9)
11·1 (4·1) 11·4 (4·3)
Amnestic mild cognitive impairment, n 1207
(75%)
134 (96%) 501
(72%)
638 (76%) 148
(74%)
569 (74%) 407 (75%)
Follow-up, y 2·4 (1·3) 2·7 (1·8) 2·2 (1·2) 2·3 (1·3) 2·4 (1·4) 2·4 (1·2) 2·4 (1·2)
APOE-ε4 560
(45%)
14 (39%) 218
(44%)
233 (44%) 79 (44%) 327 (47%) 235 (47%)
MMSE baseline 26·9
(2·3)
26·7 (2·1) 27·2
(2·3)
27·1 (2·2) 27·0
(2·6)
26·7 (2·4) 26·7 (2·3)
MMSE last follow-up 24·6
(4·5)
24·2 (3·3) 25·3
(4·1)
25·1 (4·0) 25·3
(4·5)
24·2 (4·8) 23·9 (4·9)
Progression to Alzheimer’s disease-
type dementia at last follow-up
539
(34%)
73 (52%) 193
(28%)
269 (32%) 59 (30%) 270 (35%) 200 (37%)
Progression to other dementia at last
follow-up
85 (5%) 7 (5%) 30 (4%) 37 (4%) 8 (4%) 48 (6%) 36 (7%)
Results are mean (SD) or number (%) for subgroups with only a neuronal injury marker and subgroups with amyloid and neuronal injury markers.
PET=Positron Emission Tomography, CSF=cerebrospinal fluid, Aß=amyloid-beta, FDG=fludeoxyglucose, MTL=medial temporal lobe,
APOE=Apolipoprotein, MMSE=Mini-Mental State Examination.
Page 30 of 51
ScholarOne, 375 Greenbrier Drive, Charlottesville, VA, 22901 Support (434) 964 4100
Brain

For Peer Review
Supplemental Table 5. Alzheimer’s disease-type dementia survival probability based on
dichotomized NIA-AA classification
*Estimated 3-year progression (cumulative incidence) rate to
Alzheimer’s disease-type dementia,
**Hazard ratios
(95% CI) for progression to Alzheimer’s disease-type dementia calculated using Cox regression analyses and
corrected for baseline age, gender, education and center. IWG=International Working Group, NIA-
AA=National Institute of Aging and Alzheimer’s Association.
NIA-AA criteria Prevalence of Alzheimer’s
disease at the
mild cognitive
impairment
stage
3-year progression
rate to
Alzheimer’s
disease-type
dementia*
Hazard Ratio**
(95% CI) P-value
Amyloid & neuronal injury markers
(A)
- Combined low-Alzheimer’s disease-
likelihood and conflicting groups
413 (54%) 19% Reference
- High-Alzheimer’s disease-likelihood
group
353 (46%) 60% 4.2 (3.1-5.7) <0.0001
(B)
- Low-Alzheimer’s disease-likelihood group 144 (19%) 5% Reference
- Combined conflicting and high-
Alzheimer’s disease-likelihood groups
622 (81%) 46% 10.1 (4.1-24.6) <0.0001
Only neuronal injury markers
- Inconclusive group 382 (45%) 20% Reference
- Intermediate-Alzheimer’s disease
likelihood group
459 (55%) 48% 2.9 (2.1-3.9) <0.0001
Page 31 of 51
ScholarOne, 375 Greenbrier Drive, Charlottesville, VA, 22901 Support (434) 964 4100
Brain

For Peer Review
Supplemental Table 6. Annual Mini-Mental State Examination change for each biomarker
group by the IWG-1, IWG-2, and NIA-AA criteria
Results are annual decline on the MMSE according to the criteria. IWG=International Working Group, NIA-
AA=National Institute of Aging and Alzheimer’s Association, MMSE=Mini-Mental State Examination.
Slope MMSE P-value slope P-value compared
to
reference group
IWG-1
No prodromal Alzheimer’s disease -0·53 (0·08) P<0·0001 Reference
Prodromal Alzheimer’s disease -1·32 (0·08) P<0·0001 P<0·0001
IWG-2
No prodromal Alzheimer’s disease -0·53 (0·12) P<0·0001 Reference
Prodromal Alzheimer’s disease -1·63 (0·12) P<0·0001 P<0·0001
NIA-AA
Low-Alzheimer’s disease-likelihood group -0·34 (0·22) P=0·12 Reference
High-Alzheimer’s disease-likelihood group -1·53 (0·11) P<0·0001 P<0·0001
Conflicting Isolated Amyloid Pathology group -0·40 (0·30) P=0·18 P=0·88
Conflicting Suspected Non-Alzheimer
Pathophysiology group
-0·50 (0·16) P=0·0016 P=0·55
Intermediate-Alzheimer’s disease-likelihood
group
-1·19 (0·12)
P<0·0001 P=0·014
Uninformative/inconclusive group -0·50 (0·11)
P<0·0001 P=0·52
Page 32 of 51
ScholarOne, 375 Greenbrier Drive, Charlottesville, VA, 22901 Support (434) 964 4100
Brain
For Peer Review
Supplemental Table 7. Alzheimer’s disease prevalence at the mild cognitive impairment stage
and dementia survival probability with abnormal CSF Aß1-42 and tau defined according to the
same ELISA cut-offs
*Estimated 3-year progression (cumulative incidence) rate to
Alzheimer’s disease-type dementia,
**Hazard ratios
(95% CI) for progression to Alzheimer’s disease-type dementia calculated using Cox regression analyses and
corrected for baseline age, gender, education and center. CSF ELISA cutoffs were the same for each center
(Aß1-42<551, total tau>375, phosphorylated tau>52, from Mulder C, Verwey NA, van der Flier WM, et al.
Amyloid-ß(1-42), total tau, and phosphorylated tau as cerebrospinal fluid biomarkers for the diagnosis of
Alzheimer disease. Clin Chem 2010;56:248 –253). IWG=International Working Group, NIA-AA=National
Institute of Aging and Alzheimer’s Association.
Prevalence of
Alzheimer’s
disease at the
mild
cognitive
impairment
stage
3-year progression
rate to
Alzheimer’s
disease-type
dementia*
Hazard Ratio**
(95% CI) P-value
IWG-1
No prodromal Alzheimer’s disease 747 (47%) 22% Reference
Prodromal Alzheimer’s disease 860 (54%) 50% 2.9 (2.4-3.6) <0.0001
IWG-2
No prodromal Alzheimer’s disease 458 (60%) 22% Reference
Prodromal Alzheimer’s disease 308 (40%) 61% 4.0 (3.0-5.2) <0.0001
NIA-AA
Low-Alzheimer’s disease-likelihood
group
132 (17%) 6% Reference
High-Alzheimer’s disease-likelihood
group
347 (45%) 58% 12.6 (5.2-31.0) <0.0001
Conflicting Isolated Amyloid Pathology
group
46 (6%) 21% 4.6 (1.5-13.9) 0.0064
Conflicting Suspected Non-Alzheimer
pathophysiology group
241 (32%) 25% 4.5 (1.8-11.2) 0.0015
Intermediate-Alzheimer’s disease-
likelihood group
459 (55%) 49% 9.4 (3.8-23.2) <0.0001
Uninformative/inconclusive group 382 (45%) 21% 3.2 (1.3-8.0) 0.0014
Page 33 of 51
ScholarOne, 375 Greenbrier Drive, Charlottesville, VA, 22901 Support (434) 964 4100
Brain
For Peer Review
Supplemental Table 8. Prevalence of Alzheimer’s disease at the mild cognitive impairment stage for each large cohort separately
Results are prevalence of Alzheimer’s disease according to the criteria for the six largest cohorts. For the EADC-PET cohort, results were not calculated for
the subgroup with two markers available, as the sample size was too small. IWG=International Working Group, NIA-AA=National Institute of Aging and Alzheimer’s Association, NA=not applicable.
AddNeuroMed N=99
ADNI N=300
Amsterdam N=124
DESCRIPA N=267
DCN N=373
EADC-PET N=125
IWG-1
No prodromal Alzheimer’s disease 53 (54%) 109 (36%) 36 (29%) 150 (56%) 195 (52%) 42 (34%)
Prodromal Alzheimer’s disease 46 (47%) 191 (64%) 88 (71%) 117 (44%) 178 (48%) 83 (66%)
IWG-2
No prodromal Alzheimer’s disease NA 60 (39%) 45 (51%) 56 (54%) 164 (72%) NA
Prodromal Alzheimer’s disease NA 95 (61%) 43 (49%) 48 (46%) 63 (28%) NA
NIA-AA
Low-Alzheimer’s disease-likelihood
group
NA 10 (7%) 12 (14%) 12 (12%) 67 (30%) NA
High-Alzheimer’s disease-likelihood
group
NA 105 (68%) 43 (49%) 54 (52%) 72 (32%) NA
Conflicting Isolated Amyloid
Pathology group
NA 5 (3%) 3 (3%) 10 (10%) 11 (5%) NA
Conflicting Suspected Non-Alzheimer
pathophysiology group
NA 35 (23%) 30 (34%) 28 (27%) 77 (34%) NA
Intermediate-Alzheimer’s disease-
likelihood group
46 (47%) 80 (55%) 26 (72%) 88 (54%) 65 (45%) 70 (75%)
Uninformative/inconclusive group 53 (54%) 65 (45%) 10 (28%) 75 (46%) 81 (56%) 24 (26%)
Page 34 of 51
ScholarOne, 375 Greenbrier Drive, Charlottesville, VA, 22901 Support (434) 964 4100
Brain

For Peer Review
Supplemental Table 9. 3-year progression rate to Alzheimer’s disease-type dementia for each large cohort separately
Results are progression to Alzheimer’s disease-type dementia after 3 years according to the criteria for the six largest cohorts. For the EADC-PET cohort,
results were not calculated for the subgroup with two markers available, as the sample size was too small. IWG=International Working Group, NIA-
AA=National Institute of Aging and Alzheimer’s Association, NA=not applicable.
AddNeuroMed
N=99
ADNI
N=300
Amsterdam
N=124
DESCRIPA
N=267
DCN
N=373
EADC-PET
N=125
IWG-1
No prodromal Alzheimer’s disease 7 (13%) 14 (13%) 9 (25%) 19 (13%) 11 (6%) 11 (26%)
Prodromal Alzheimer’s disease 11 (24%) 73 (38%) 35 (40%) 51 (44%) 65 (37%) 40 (48%)
IWG-2
No prodromal Alzheimer’s disease NA 6 (10%) 8 (18%) 9 (16%) 16 (10%) NA
Prodromal Alzheimer’s disease NA 40 (42%) 26 (61%) 26 (54%) 31 (49%) NA
NIA-AA
Low-Alzheimer’s disease-likelihood
group
NA 0 (0%) 1 (8%) 0 (0%) 0 (0%) NA
High-Alzheimer’s disease-likelihood
group
NA 43 (41%) 26 (61%) 28 (52%) 33 (46%) NA
Conflicting Isolated Amyloid
Pathology group
NA 0 (0%) 0 (0%) 2 (20%) 2 (18%) NA
Conflicting Suspected Non-Alzheimer
pathophysiology group
NA 3 (9%) 7 (23%) 5 (18%) 12 (16%) NA
Intermediate-Alzheimer’s disease-
likelihood group
11 (24%) 32 (40%) 9 (35%) 30 (34%) 20 (31%) 31 (44%)
Uninformative/inconclusive group 7 (13%) 9 (14%) 1 (10%) 5 (7%) 9 (11%) 5 (21%)
Page 35 of 51
ScholarOne, 375 Greenbrier Drive, Charlottesville, VA, 22901 Support (434) 964 4100
Brain

For Peer Review
Supplemental Figure 1. Annual Mini-Mental State Examination change for each biomarker group by the IWG-1, IWG-2, and NIA-AA
criteria
The graph shows annual decline on the MMSE according to the criteria. IWG-1: The group without prodromal Alzheimer’s disease represents subjects
without memory impairment and/or abnormal biomarker(s). The prodromal Alzheimer’s disease group represents subjects with memory impairment and at
least one abnormal biomarker. IWG-2: The group without prodromal Alzheimer’s disease represents subjects with normal CSF Aß1-42 and/or t-tau markers.
The prodromal Alzheimer’s disease group represents subjects with abnormal CSF Aß1-42 and/or t-tau markers. NIA-AA: The low-Alzheimer’s disease-
likelihood group represents subjects with normal amyloid and neuronal injury markers, the high-Alzheimer’s disease-likelihood group represents subjects
with both abnormal amyloid and neuronal injury markers, the Isolated Amyloid Pathology group is a conflicting biomarker group with an abnormal amyloid
marker and normal neuronal injury marker, the Suspected Non-Alzheimer Pathophysiology group is a conflicting biomarker group with an abnormal neuronal
injury marker and normal amyloid marker, the intermediate-Alzheimer’s disease-likelihood group represents subjects with an abnormal neuronal injury
marker without information on amyloid pathology, the inconclusive group represents subjects with a normal neuronal injury marker without information on
amyloid pathology. AD=Alzheimer’s disease, IWG=International Working Group, NIA-AA=National Institute of Aging and Alzheimer’s Association,
IAP=isolated amyloid pathology, SNAP=suspected non-Alzheimer pathophysiology.
Page 36 of 51
ScholarOne, 375 Greenbrier Drive, Charlottesville, VA, 22901 Support (434) 964 4100
Brain

For Peer Review
Supplemental Figure 2. Alzheimer’s disease-type dementia
survival probability by subdivided IWG-1 and IWG-2 criteria
The graph shows Alzheimer’s disease-type dementia survival probability for
typical and atypical prodromal Alzheimer’s disease according to the IWG
criteria.
IWG-1: the prodromal Alzheimer’s disease group represents subjects with
memory impairment and at least one abnormal biomarker.
IWG-2: the atypical prodromal Alzheimer’s disease group represents
subjects with naMCI and abnormal CSF Aß1-42 and tau markers, the
typical AD prodromal Alzheimer’s disease group represents subjects with
memory impairment and abnormal CSF Aß1-42 and tau markers.
AD=Alzheimer’s disease, naMCI-non-amnestic MCI.
Page 37 of 51
ScholarOne, 375 Greenbrier Drive, Charlottesville, VA, 22901 Support (434) 964 4100
Brain
For Peer Review
Supplemental Text 1. Methods ADNI Study.
Data used in the preparation of this article were partially obtained from the
Alzheimer’s Disease Neuroimaging Initiative (ADNI) database (adni.loni.usc.edu).
The ADNI was launched in 2003 by the National Institute on Aging (NIA), the
National Institute of Biomedical Imaging and Bioengineering (NIBIB), the Food and
Drug Administration (FDA), private pharmaceutical companies and non-profit
organizations, as a $60 million, 5-year public-private partnership. The primary goal of
ADNI has been to test whether serial magnetic resonance imaging (MRI), positron
emission tomography (PET), other biological markers, and clinical and
neuropsychological assessment can be combined to measure the progression of mild
cognitive impairment (MCI) and early Alzheimer’s disease(AD). Determination of
sensitive and specific markers of very early AD progression is intended to aid
researchers and clinicians to develop new treatments and monitor their effectiveness,
as well as lessen the time and cost of clinical trials. The Principal Investigator of this
initiative is Michael W. Weiner, MD, VA Medical Center and University of California
–San Francisco. ADNI is the result of efforts of many co-investigators from a broad
range of academic institutions and private corporations, and subjects have been
recruited from over 50 sites across the U.S. and Canada. The initial goal of ADNI was
to recruit 800 subjects but ADNI has been followed by ADNI-GO and ADNI-2. To
date these three protocols have recruited over 1500 adults, ages 55 to 90,to participate
in the research, consisting of cognitively normal older individuals, people with early or
late MCI, and people with early AD. The follow up duration of each group is specified
in the protocols for ADNI-1, ADNI-2 and ADNI-GO. Subjects originally recruited for
ADNI-1 and ADNI-GO had the option to be followed in ADNI-2. For up-to-date
information, see www.adni-info.org.
Page 38 of 51
ScholarOne, 375 Greenbrier Drive, Charlottesville, VA, 22901 Support (434) 964 4100
Brain

For Peer Review
See Schott for a scientific commentary on this article (doi:10.1093/brain/).
Vos et al. compare the prevalence and prognosis of Alzheimer’s disease at the
mild cognitive impairment stage based on the IWG-1, IWG-2 and NIA-AA criteria.
All three aid identification of early Alzheimer’s disease, but combining amyloid
and neuronal injury markers according to the NIA-AA criteria offers the most
accurate prognosis.
Page 39 of 51
ScholarOne, 375 Greenbrier Drive, Charlottesville, VA, 22901 Support (434) 964 4100
Brain
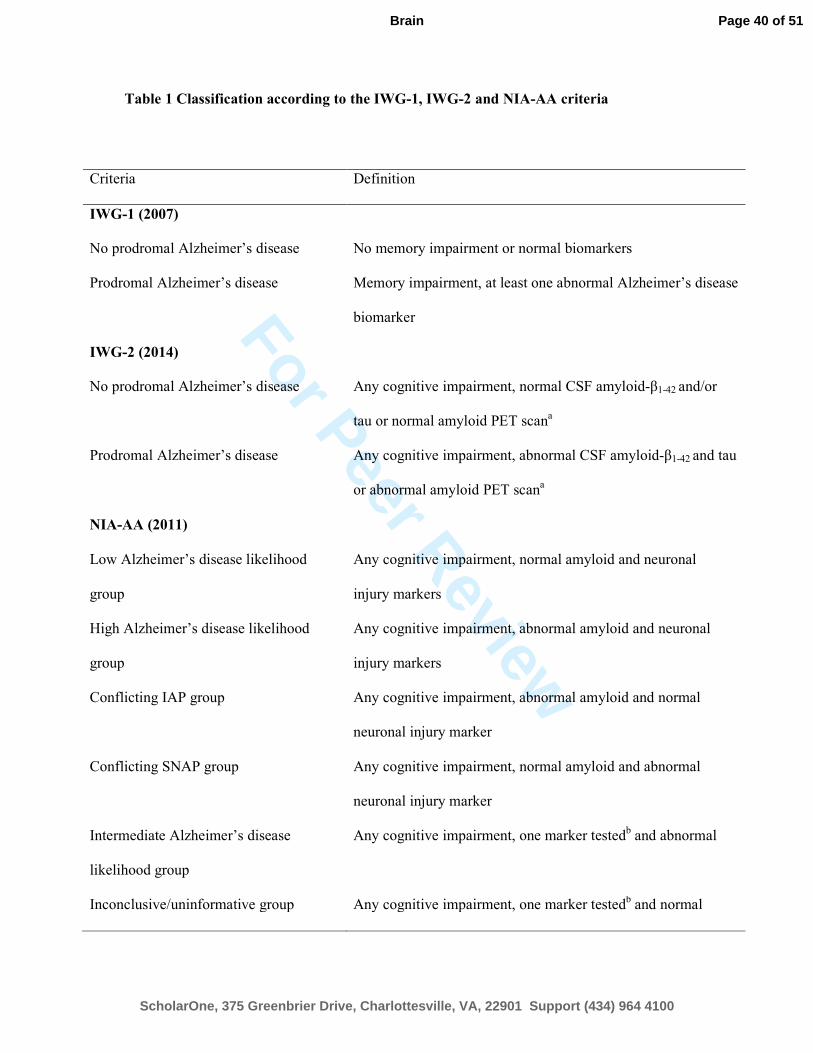
For Peer Review
Table 1 Classification according to the IWG-1, IWG-2 and NIA-AA criteria
Criteria Definition
IWG-1 (2007)
No prodromal Alzheimer’s disease No memory impairment or normal biomarkers
Prodromal Alzheimer’s disease Memory impairment, at least one abnormal Alzheimer’s disease
biomarker
IWG-2 (2014)
No prodromal Alzheimer’s disease Any cognitive impairment, normal CSF amyloid-β1-42 and/or
tau or normal amyloid PET scana
Prodromal Alzheimer’s disease Any cognitive impairment, abnormal CSF amyloid-β1-42 and tau
or abnormal amyloid PET scana
NIA-AA (2011)
Low Alzheimer’s disease likelihood
group
Any cognitive impairment, normal amyloid and neuronal
injury markers
High Alzheimer’s disease likelihood
group
Any cognitive impairment, abnormal amyloid and neuronal
injury markers
Conflicting IAP group Any cognitive impairment, abnormal amyloid and normal
neuronal injury marker
Conflicting SNAP group Any cognitive impairment, normal amyloid and abnormal
neuronal injury marker
Intermediate Alzheimer’s disease
likelihood group
Any cognitive impairment, one marker testedb and abnormal
Inconclusive/uninformative group Any cognitive impairment, one marker testedb and normal
Page 40 of 51
ScholarOne, 375 Greenbrier Drive, Charlottesville, VA, 22901 Support (434) 964 4100
Brain

For Peer Review
Amyloid marker = CSF amyloid-β1-42; neuronal injury marker = CSF tau/medial temporal lobe
atrophy score/hippocampal volume/FDG-PET, cognitive impairment is defined as Z-score < −1.5.
aIn our study, CSF data are used for subject classification;
bIn our study, only neuronal injury markers were tested.
Page 41 of 51
ScholarOne, 375 Greenbrier Drive, Charlottesville, VA, 22901 Support (434) 964 4100
Brain

For Peer Review
Table 2 Demographics and clinical outcome according to the IWG-1, IWG-2 and NIA-AA criteria
IWG-1 criteria IWG-2 criteria NIA-AA criteria
No
prodromal
Alzheimer
’s disease
Prodrom
al
Alzheim
er’s
disease
No
prodromal
Alzheimer
’s disease
Prodrom
al
Alzheim
er’s
disease
Low
Alzheimer’
s disease
likelihood
High
Alzheimer
’s disease
likelihood
Conflicting
A:
IAP
Conflicting B:
SNAP
Intermedia
te
Alzheimer’
s disease
likelihood
Uninformati
ve/inconclu
sive
Normal
markers or
no
amnestic
mild
cognitive
impairmen
t
n = 757
Amnesti
c mild
cognitive
impairm
ent and
at least
1 marker
+
n = 850
CSF
markers −
n = 458
CSF
markers
+
n = 308
Amyloid −
Injury −
n = 144
Amyloid +
Injury +
n = 353
Amyloid +
Injury −
n = 49
Amyloid -
Injury +
n = 220
Amyloid ?
Injury +
n = 459
Amyloid ?
Injury −
n = 382
Age, years 68.6 (8.7)P 71.3
(7.9)
67.2 (8.9)
P 71.4
(7.6)
62.9
(9.0)H,A,B,I,
U
71.4
(7.6)L,A,B,I,
U
66.1
(7.7)L,H,B,I,U
69.4 (8.3)L,H,A,I
72.8
(7.3)L,H,A,B,
U
69.0
(8.4)L,H,A,I
Female, n 406
(54%)P
402
(47%)
206 (45%) 147
(48%)
63 (44%)U
165
(47%)U
21 (43%)U 104 (47%)
U 223
(49%)U
232
(61%)L,H,A,B,
I
Education, years 10.3 (4.4)P 11.2
(4.2)
10.6 (3.9)P 11.9
(4.1)
10.5 (3.2)H
11.7
(4.3)L,B,I,U
11.0 (4.0) 10.5 (4.0)H
10.7 (4.4)H
10.3 (4.8)H
Amnestic mild
cognitive impairment,
n
357
(47%)P
850
(100%)
310
(68%)P
259
(84%)
98
(68%)H,I
293
(83%)L,A,B,
U
30 (61%)H,I
148 (67%)H,I
379
(83%)L,A,B,
U
259
(68%)H,I
Follow-up, years 2.4 (1.3) 2.3 (1.3) 2.4 (1.3) 2.3 (1.2) 2.4 (1.1)
2.3 (1.2)
2.7 (1.5)I
2.5 (1.3)I
2.2
(1.3)A,B,U
2.4 (1.4)I
APOE-ε4 218
(37%)P
342
(53%)
137
(33%)P
190
(66%)
36
(28%)H,A,I
207
(63%)L,A,B,
22 (46%)L,H
62 (32%)H,I
144
(51%)L,H,B,
89 (35%)H,I
Page 42 of 51
ScholarOne, 375 Greenbrier Drive, Charlottesville, VA, 22901 Support (434) 964 4100
Brain

For Peer Review
I,U U
MMSE
at baseline
27.5 (2.2)P 26.4
(2.3)
27.1 (2.3)P 26.2
(2.5)
27.7
(2.3)H,B,I
26.2
(2.4)L,A,B,I,
U
27.6
(1.9)H,B,I
26.7
(2.3)L,H,A,U
26.7
(2.2)L,H,A,U
27.6
(2.2)H,B,I
MMSE
at last follow-up
26.2 (3.9)P 23.3
(4.5)
25.8 (3.9)P 22.4
(5.0)
27.0
(3.2)H,B,I
22.5
(4.9)L,A,B,I,
U
26.3 (4.0)H,I
25.7 (4.0)L,H,I
24.2
(3.8)L,H,A,B,
U
26.2 (4.0)H,I
Progression to
Alzheimer’s disease-
type dementia at last
follow-up
134
(18%)P
405
(48%)
84 (18%)P
186
(60%)
5
(4%)H,A,B,I,
U
207
(59%)L,A,B,
I,U
11
(22%)L,H,I
47 (21%)L,H,I
201
(44%)L,H,A,
B,U
68
(18%)L,H,I
Time to Alzheimer’s
disease-type
dementia, years
2.4 (1.3) 2.3 (1.3) 2.5 (1.7) 2.3 (1.2) 2.9 (1.1) 2.3 (1.2)
3.1 (1.8) 2.6 (1.8) 2.3 (1.3)U
2.7 (1.5)I
Progression to non-
Alzheimer’s disease
dementia at last
follow-up
45 (6%) 40 (5%) 43 (9%)P 5 (2%) 15
(10%)H,U
10 (3%)L,B
2 (4%) 21 (10%)H,U
26 (6%) 11 (3%)L,B
Diagnosis of non-
Alzheimer’s disease
dementia
Frontotemporal
dementia
15 9 13 7 6 8 3
Lewy body dementia 12 4 7 5 2 8 1
Vascular dementia 7 1 4 1 2 1 1 2 2 1
Parkinson’s disease
dementia
2 2 1
Progressive
supranuclear palsy
1 1
Alcohol-related
dementia
1 1 1
Not available 10 23 16 4 1 8 1
10
8 5
Page 43 of 51
ScholarOne, 375 Greenbrier Drive, Charlottesville, VA, 22901 Support (434) 964 4100
Brain
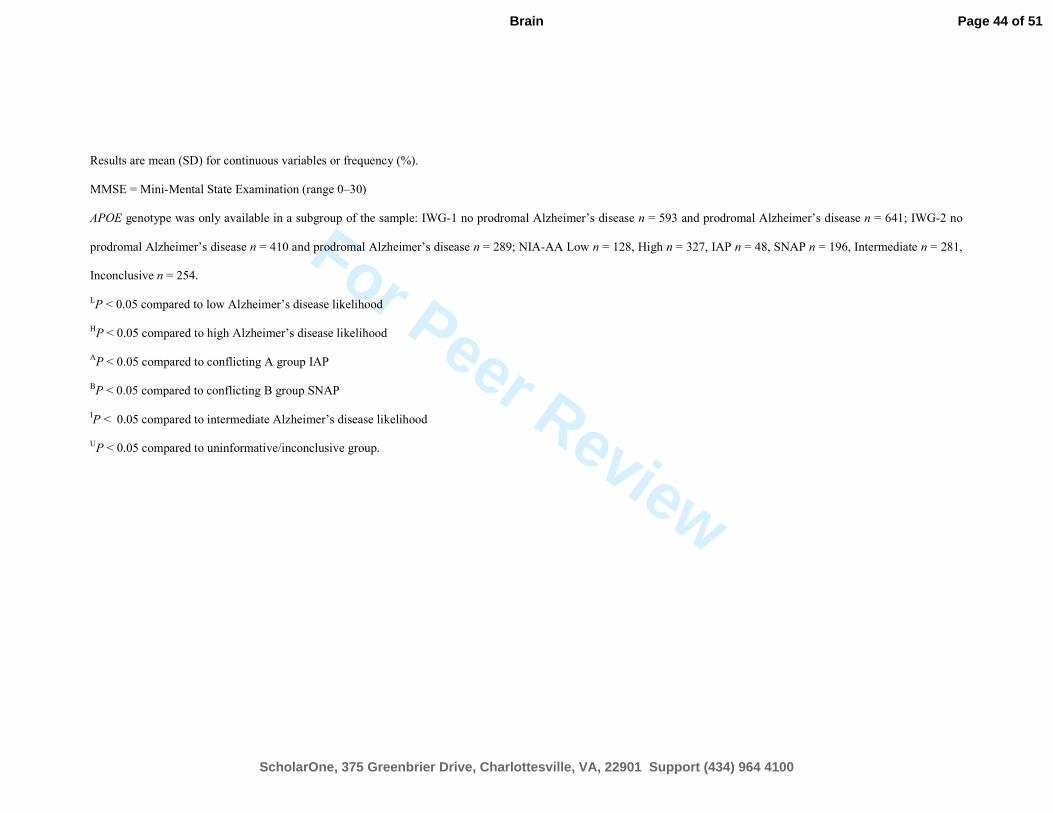
For Peer Review
Results are mean (SD) for continuous variables or frequency (%).
MMSE = Mini-Mental State Examination (range 0–30)
APOE genotype was only available in a subgroup of the sample: IWG-1 no prodromal Alzheimer’s disease n = 593 and prodromal Alzheimer’s disease n = 641; IWG-2 no
prodromal Alzheimer’s disease n = 410 and prodromal Alzheimer’s disease n = 289; NIA-AA Low n = 128, High n = 327, IAP n = 48, SNAP n = 196, Intermediate n = 281,
Inconclusive n = 254.
LP < 0.05 compared to low Alzheimer’s disease likelihood
HP < 0.05 compared to high Alzheimer’s disease likelihood
AP < 0.05 compared to conflicting A group IAP
BP < 0.05 compared to conflicting B group SNAP
IP < 0.05 compared to intermediate Alzheimer’s disease likelihood
UP < 0.05 compared to uninformative/inconclusive group.
Page 44 of 51
ScholarOne, 375 Greenbrier Drive, Charlottesville, VA, 22901 Support (434) 964 4100
Brain
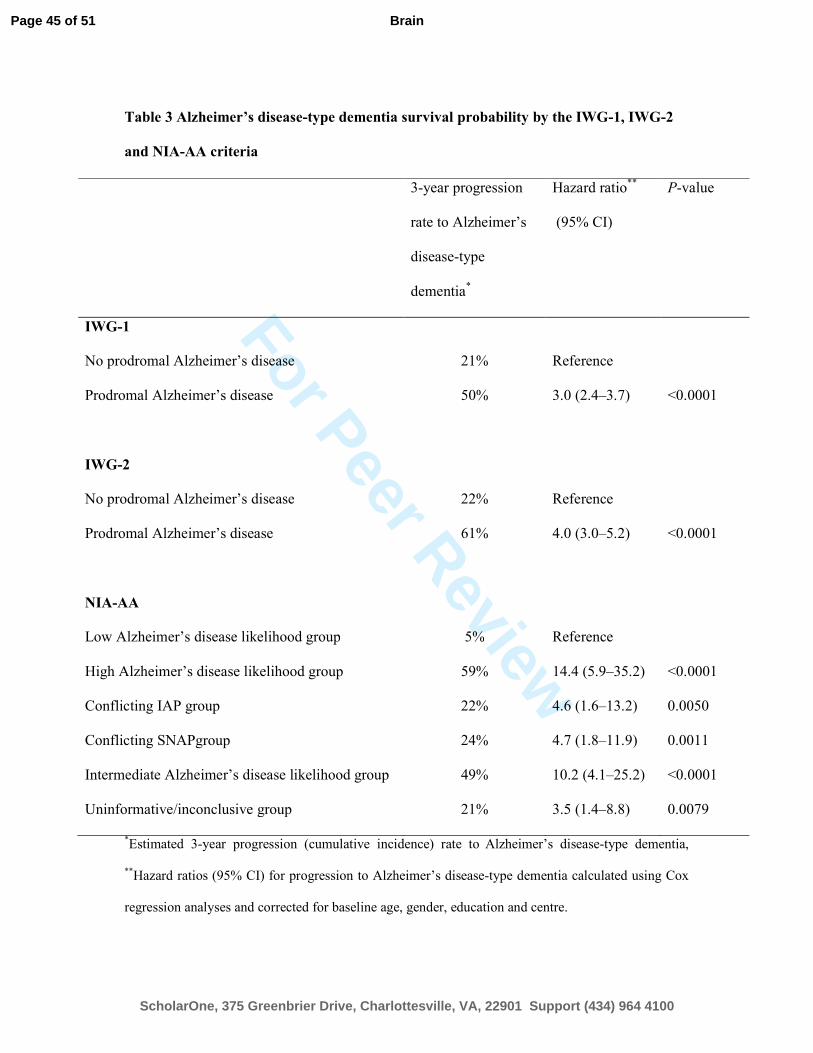
For Peer Review
Table 3 Alzheimer’s disease-type dementia survival probability by the IWG-1, IWG-2
and NIA-AA criteria
*Estimated 3-year progression (cumulative incidence) rate to
Alzheimer’s disease-type dementia,
**Hazard ratios (95% CI) for progression to Alzheimer’s disease-type dementia calculated using Cox
regression analyses and corrected for baseline age, gender, education and centre.
3-year progression
rate to Alzheimer’s
disease-type
dementia*
Hazard ratio**
(95% CI)
P-value
IWG-1
No prodromal Alzheimer’s disease 21% Reference
Prodromal Alzheimer’s disease 50% 3.0 (2.4–3.7) <0.0001
IWG-2
No prodromal Alzheimer’s disease 22% Reference
Prodromal Alzheimer’s disease 61% 4.0 (3.0–5.2) <0.0001
NIA-AA
Low Alzheimer’s disease likelihood group 5% Reference
High Alzheimer’s disease likelihood group 59% 14.4 (5.9–35.2) <0.0001
Conflicting IAP group 22% 4.6 (1.6–13.2) 0.0050
Conflicting SNAPgroup 24% 4.7 (1.8–11.9) 0.0011
Intermediate Alzheimer’s disease likelihood group 49% 10.2 (4.1–25.2) <0.0001
Uninformative/inconclusive group 21% 3.5 (1.4–8.8) 0.0079
Page 45 of 51
ScholarOne, 375 Greenbrier Drive, Charlottesville, VA, 22901 Support (434) 964 4100
Brain

For Peer Review
Table 4 Overlap in subject classification according to the IWG-1, IWG-2 and NIA-AA criteria by outcome after 3 years
Results are total number of subjects (% of subjects with Alzheimer’s disease-type dementia after 3 years of follow-up).
NIA-AA
Amyloid and neuronal injury markers (n = 766) Only a neuronal injury marker (n =
841)
Low
Alzheimer’
s disease
likelihood
(n = 144)
High
Alzheimer’s
disease
likelihood (n
= 353)
Conflicting:
IAP
(n = 49)
Conflicting:
SNAP (n = 220)
Intermediate
Alzheimer’s
disease likelihood
(n = 459)
Uninformative/
Inconclusive
(n = 382)
IWG-1 No prodromal Alzheimer’s disease 144 (2%) 60 (45%) 19 (11%) 72 (11%) 80 (19%) 382 (12%)
Prodromal Alzheimer’s disease - 293 (49%) 30 (23%) 148 (20%) 379 (39%) -
IWG-2 No prodromal Alzheimer’s disease 144 (2%) 45 (42%) 49 (18%) 220 (17%) NA NA
Prodromal Alzheimer’s disease - 308 (49%) - - NA NA
Page 46 of 51
ScholarOne, 375 Greenbrier Drive, Charlottesville, VA, 22901 Support (434) 964 4100
Brain

For Peer Review
NA = not applicable
Page 47 of 51
ScholarOne, 375 Greenbrier Drive, Charlottesville, VA, 22901 Support (434) 964 4100
Brain
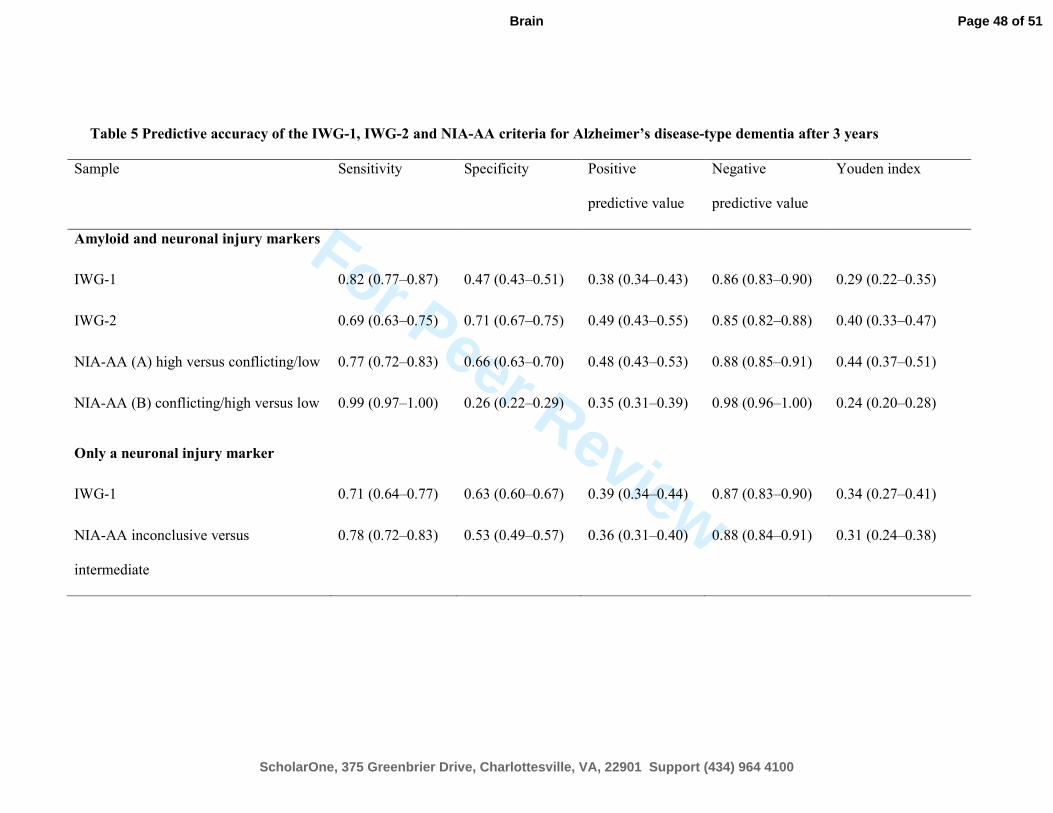
For Peer Review
Table 5 Predictive accuracy of the IWG-1, IWG-2 and NIA-AA criteria for Alzheimer’s disease-type dementia after 3 years
Sample Sensitivity Specificity Positive
predictive value
Negative
predictive value
Youden index
Amyloid and neuronal injury markers
IWG-1 0.82 (0.77–0.87) 0.47 (0.43–0.51) 0.38 (0.34–0.43) 0.86 (0.83–0.90) 0.29 (0.22–0.35)
IWG-2 0.69 (0.63–0.75) 0.71 (0.67–0.75) 0.49 (0.43–0.55) 0.85 (0.82–0.88) 0.40 (0.33–0.47)
NIA-AA (A) high versus conflicting/low 0.77 (0.72–0.83) 0.66 (0.63–0.70) 0.48 (0.43–0.53) 0.88 (0.85–0.91) 0.44 (0.37–0.51)
NIA-AA (B) conflicting/high versus low 0.99 (0.97–1.00) 0.26 (0.22–0.29) 0.35 (0.31–0.39) 0.98 (0.96–1.00) 0.24 (0.20–0.28)
Only a neuronal injury marker
IWG-1 0.71 (0.64–0.77) 0.63 (0.60–0.67) 0.39 (0.34–0.44) 0.87 (0.83–0.90) 0.34 (0.27–0.41)
NIA-AA inconclusive versus
intermediate
0.78 (0.72–0.83) 0.53 (0.49–0.57) 0.36 (0.31–0.40) 0.88 (0.84–0.91) 0.31 (0.24–0.38)
Page 48 of 51
ScholarOne, 375 Greenbrier Drive, Charlottesville, VA, 22901 Support (434) 964 4100
Brain

For Peer Review
Results are predictive accuracy for Alzheimer’s disease-type dementia after 3-year follow-up according to the criteria for the subgroup with amyloid and
neuronal injury markers (n = 766) and for the subgroup with only a neuronal injury marker (n = 841). For the IWG-1 and IWG-2 criteria, groups are defined
as no prodromal Alzheimer’s disease versus prodromal Alzheimer’s disease.
Youden index = sensitivity + specificity−1.
Page 49 of 51
ScholarOne, 375 Greenbrier Drive, Charlottesville, VA, 22901 Support (434) 964 4100
Brain
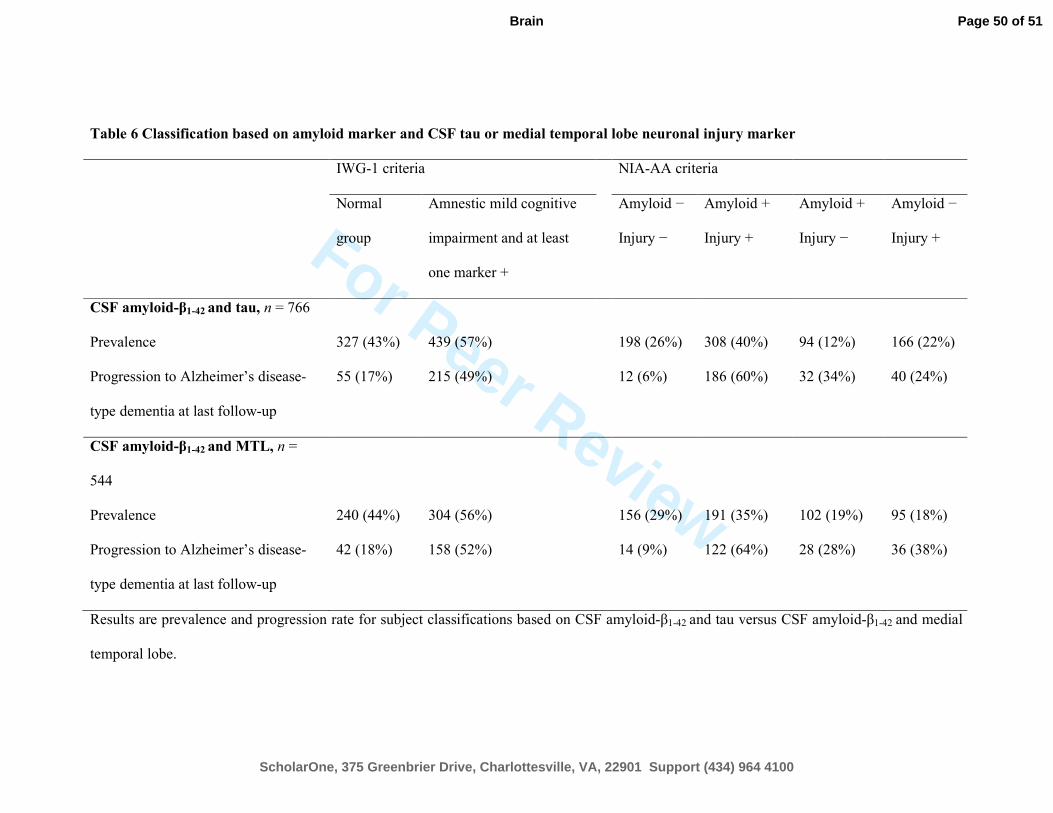
For Peer Review
Table 6 Classification based on amyloid marker and CSF tau or medial temporal lobe neuronal injury marker
IWG-1 criteria NIA-AA criteria
Normal
group
Amnestic mild cognitive
impairment and at least
one marker +
Amyloid −
Injury −
Amyloid +
Injury +
Amyloid +
Injury −
Amyloid −
Injury +
CSF amyloid-β1-42 and tau, n = 766
Prevalence 327 (43%) 439 (57%) 198 (26%) 308 (40%) 94 (12%) 166 (22%)
Progression to Alzheimer’s disease-
type dementia at last follow-up
55 (17%) 215 (49%) 12 (6%) 186 (60%) 32 (34%) 40 (24%)
CSF amyloid-β1-42 and MTL, n =
544
Prevalence 240 (44%) 304 (56%) 156 (29%) 191 (35%) 102 (19%) 95 (18%)
Progression to Alzheimer’s disease-
type dementia at last follow-up
42 (18%) 158 (52%) 14 (9%) 122 (64%) 28 (28%) 36 (38%)
Results are prevalence and progression rate for subject classifications based on CSF amyloid-β1-42 and tau versus CSF amyloid-β1-42 and medial
temporal lobe.
Page 50 of 51
ScholarOne, 375 Greenbrier Drive, Charlottesville, VA, 22901 Support (434) 964 4100
Brain

For Peer Review
MTL = medial temporal lobe
Page 51 of 51
ScholarOne, 375 Greenbrier Drive, Charlottesville, VA, 22901 Support (434) 964 4100
Brain

For Peer Review
Table 7 Classification based on amyloid marker and two neuronal injury markers
Amyloid marker Amyloid + (n = 286) Amyloid − (n = 258)
Neuronal injury markers Tau −
MTL −
Tau +
MTL −
Tau -
MTL +
Tau+
MTL +
Tau −
MTL −
Tau +
MTL −
Tau −
MTL +
Tau+
MTL +
Prevalence within amyloid subgroup 37 (13%) 58 (20%) 25 (9%) 168 (58%) 91 (35%) 65 (25%) 39 (15%) 63 (24%)
Prevalence in total group 37 (7%) 58 (11%) 25 (5%) 166 (31%) 91 (17%) 65 (12%) 39 (7%) 63 (12%)
Progression to Alzheimer’s disease-
type dementia at last follow-up
12 (32%) 24 (41%) 9 (36%) 113 (68%) 4 (4%) 10 (15%) 5 (13%) 23 (37%)
Results are prevalence and progression rate for subject classifications based on CSF amyloid-β1-42, tau and medial temporal lobe.
MTL=medial temporal lobe.
Page 52 of 51
ScholarOne, 375 Greenbrier Drive, Charlottesville, VA, 22901 Support (434) 964 4100
Brain


![A distinct [18F]MPPF PET profile in amnestic mild cognitive impairment compared to mild Alzheimer's disease](https://static.fdokumen.com/doc/165x107/63361f3bb5f91cb18a0bb07c/a-distinct-18fmppf-pet-profile-in-amnestic-mild-cognitive-impairment-compared.jpg)