Serum p97 levels as an aid to identifying Alzheimer’s disease
10
507 Serum p97 levels as an aid to identifying Alzheimer’s disease H. Feldman a , R. Gabathuler b,c , M. Kennard b,c , J. Nurminen b,c , D. Levy d , S. Foti a , D. Foti a , B.L Beattie a and W.A. Jefferies b,∗ a Division of Neurology, University of British Columbia, Clinic for Alzheimer’s Disease and Related Disorders, Vancouver, Canada b Biotechnology Laboratory, Biomedical Research Center and the Departments of Medical Genetics, Zoology, and Microbiology and Immunology, Vancouver, Canada c Synapse Technologies Inc., Suite 300 – 6660 NW Marine Drive, Vancouver, Canada V6T 1Z4 d Statistics and Epidemiology Research Corporation (SERC), 1107 NE 45th St Suite 520, 90105 Seattle, WA, USA Communicated by David Small Background: The application of formal clinical diagnostic criteria for the identification of Alzheimer’s Disease (AD) has improved diagnostic sensitivity. However, there remains a need for non-invasive biological markers and laboratory tests, which can facilitate case identification, and the assessment of treatment response. The p97 protein is a secreted protein specifically expressed by amyloid plaque associated reactive microglia that may have AD diagnostic ability. Methods: A quantitative radioimmunoassay was devel- oped to measure serum p97. This study, under a double blind protocol, evaluated the utility of serum p97 as diagnostic test for AD. All subjects were referred to the UBC Clinic for Alzheimer’s Disease and Related Disorders (CADRD) for clinical assessment of dementia. A serum p97 sample was obtained at the time of assessment but diagnosis of disease was determined independently of p97 examination. Results: “Possible” and “probable” AD cases (n = 41) and cognitively normal controls (n = 64) showed a highly significant difference in mean p97 concentration (41 vs. 20 ng/ml, p< 0.001). There was some overlap in p97 dis- tributions between AD cases and control subjects. The area under the curve (AUC) for the receiver operator curve (ROC) was 0.812. Conclusions: These results further support the specificity of high serum p97 levels in AD and its potential utility as a biological marker in AD. The reproducible elevation of serum p97 in AD underlines the need to further determine its role as a biological marker and diagnostic adjunct for AD. 1. Introduction Alzheimer’s Disease (AD) is a progressive neurode- generative disease that affects cognition, behavior and function. The ’gold standard’ for definite AD currently resides with post-mortem neuropathological examina- tion despite the significant differences that exist be- tween the sets of neuropathological criteria that have been used in longitudinal research studies [4,34,35]. Clinically, the diagnosis of AD is established through neurological, neurobehavioral, and neuroimaging as- sessments. The phenotype of AD is recognized as most typically having a core amnesic disorder coupled to other areas of higher cortical dysfunction and with a clinical course that begins gradually and is progres- sive. To date, laboratory testing has been largely di- rected at ruling out modifiable non-degenerative causes of dementia [2]. The application of clinical diagnos- tic criteria, such as those of the National Institute of Neurological and Communicative Disorders and Stroke and the Alzheimer’s Disease and Related Disorders Association (NINCDS-ADRDA), has allowed an im- proved clinicopathological diagnostic accuracy of 80% or greater. However, a recent large clinical and neu- ropathological study of Mayeux et al. reported that, although the sensitivity for AD diagnosis was very high (> 90%) with the NINCDS-ADRDA criteria, speci- ficity is still lacking (55%). Progress in finding ante- mortem laboratory confirmatory or diagnostic tests for AD has been slow, though numerous biological mark- ers and diagnostic tests have been proposed. These in- clude measuring the CSF levels of tau, Aβ 1-40 and 1- ∗ Corresponding author: Dr. Wilfred A. Jefferies D. Phil. Pro- fessor, The Biotechnology Laboratory and the Biomedical Research Centre, University of British Columbia, 2222 Health Sciences Mall, Vancouver, B.C.Canada, V6T 1Z3. Tel.: 604 822 6961; Fax: 604 822 6780; E-mail: [email protected]. Journal of Alzheimer’s Disease 3 (2001) 507–516 ISSN 1387-2877 / $8.00 2001, IOS Press. All rights reserved
-
Upload
independent -
Category
Documents
-
view
0 -
download
0
Transcript of Serum p97 levels as an aid to identifying Alzheimer’s disease

507
Serum p97 levels as an aid to identifyingAlzheimer’s disease
H. Feldmana, R. Gabathulerb,c, M. Kennardb,c,J. Nurminenb,c, D. Levyd, S. Fotia, D. Fotia,B.L Beattiea and W.A. Jefferiesb,∗aDivision of Neurology, University of BritishColumbia, Clinic for Alzheimer’s Disease and RelatedDisorders, Vancouver, CanadabBiotechnology Laboratory, Biomedical ResearchCenter and the Departments of Medical Genetics,Zoology, and Microbiology and Immunology,Vancouver, CanadacSynapse Technologies Inc., Suite 300 – 6660 NWMarine Drive, Vancouver, Canada V6T 1Z4dStatistics and Epidemiology Research Corporation(SERC), 1107 NE 45th St Suite 520, 90105 Seattle,WA, USA
Communicated by David Small
Background: The application of formal clinical diagnosticcriteria for the identification of Alzheimer’s Disease (AD) hasimproved diagnostic sensitivity. However, there remains aneed for non-invasive biological markers and laboratory tests,which can facilitate case identification, and the assessmentof treatment response. The p97 protein is a secreted proteinspecifically expressed by amyloid plaque associated reactivemicroglia that may have AD diagnostic ability.
Methods: A quantitative radioimmunoassay was devel-oped to measure serum p97. This study, under a double blindprotocol, evaluated the utility of serum p97 as diagnostic testfor AD. All subjects were referred to the UBC Clinic forAlzheimer’s Disease and Related Disorders (CADRD) forclinical assessment of dementia. A serum p97 sample wasobtained at the time of assessment but diagnosis of diseasewas determined independently of p97 examination.
Results: “Possible” and “probable” AD cases (n = 41)and cognitively normal controls (n = 64) showed a highlysignificant difference in mean p97 concentration (41 vs.20 ng/ml, p < 0.001). There was some overlap in p97 dis-tributions between AD cases and control subjects. The areaunder the curve (AUC) for the receiver operator curve (ROC)was 0.812.
Conclusions: These results further support the specificityof high serum p97 levels in AD and its potential utility as abiological marker in AD. The reproducible elevation of serum
p97 in AD underlines the need to further determine its roleas a biological marker and diagnostic adjunct for AD.
1. Introduction
Alzheimer’s Disease (AD) is a progressive neurode-generative disease that affects cognition, behavior andfunction. The ’gold standard’ for definite AD currentlyresides with post-mortem neuropathological examina-tion despite the significant differences that exist be-tween the sets of neuropathological criteria that havebeen used in longitudinal research studies [4,34,35].Clinically, the diagnosis of AD is established throughneurological, neurobehavioral, and neuroimaging as-sessments. The phenotype of AD is recognized as mosttypically having a core amnesic disorder coupled toother areas of higher cortical dysfunction and with aclinical course that begins gradually and is progres-sive. To date, laboratory testing has been largely di-rected at ruling out modifiable non-degenerative causesof dementia [2]. The application of clinical diagnos-tic criteria, such as those of the National Institute ofNeurological and Communicative Disorders and Strokeand the Alzheimer’s Disease and Related DisordersAssociation (NINCDS-ADRDA), has allowed an im-proved clinicopathological diagnostic accuracy of 80%or greater. However, a recent large clinical and neu-ropathological study of Mayeux et al. reported that,although the sensitivity for AD diagnosis was very high(> 90%) with the NINCDS-ADRDA criteria, speci-ficity is still lacking (55%). Progress in finding ante-mortem laboratory confirmatory or diagnostic tests forAD has been slow, though numerous biological mark-ers and diagnostic tests have been proposed. These in-clude measuring the CSF levels of tau, Aβ 1-40 and 1-
∗Corresponding author: Dr. Wilfred A. Jefferies D. Phil. Pro-fessor, The Biotechnology Laboratory and the Biomedical ResearchCentre, University of British Columbia, 2222 Health Sciences Mall,Vancouver, B.C. Canada, V6T 1Z3. Tel.: 604 822 6961; Fax: 604822 6780; E-mail: [email protected].
Journal of Alzheimer’s Disease 3 (2001) 507–516ISSN 1387-2877 / $8.00 2001, IOS Press. All rights reserved

508 H. Feldman et al. / Serum p97 levels as an aid to identifying Alzheimer’s disease
42, α 1-antichymotrypsin and neural thread protein [3,10,26,41]. A consensus report of the Working Groupon Molecular and Biochemical Markers of Alzheimer’sDisease [8] proposed steps that should be taken in thedevelopment of an AD biomarker. They noted that anon- or minimally invasive laboratory test for the de-tection of AD, such as a blood test, would have a greatadvantage over CSF measured biomarkers. The Work-ing Group suggested that an ideal biomarker for ADshould have a sensitivity of > 80% for detecting ADand a specificity of > 80% [8].
Potentially hindering the development of a diagnos-tic test for AD is the increasing recognition of the coex-istence of multiple brain disorders that can comorbidlyproduce dementia. For example, vascular lesions coex-ist with senile neuritic plaques and neurofibrillary tan-gles in 10–20% of AD [6] while Lewy bodies coexistwith plaque pathology in 15–25% [11]. The effects ofthese pathological comorbidities on diagnostic markersfor AD are not clarified [19,25,32,37].
The ‘gold standard’ of AD diagnosis, i.e. postmortem examination of the brain for tangles andplaques, has been recently described as ‘probabilistic’with recognition that clinical correlation to pathology isrequired [20]. In addition, it is becoming increasinglyevident that AD may not be a single disease but rather anumber of disorders whose symptoms converge to theestablished clinical and pathological definition of AD.
The p97 antigen, also known as melanotransferrin,is a sialoglycoprotein that belongs to the group of iron-binding proteins that include transferrin (Tf), lacto-ferrin, and ovotransferrin. p97 binds iron and is in-volved in cellular iron uptake, providing a transferrin-independent cellular iron-uptake pathway [16,23]. p97exists in two forms, one of which is attached to thecell surface by a glycosyl-phosphatidylinositol anchorand the other is actively secreted. In the CNS, p97 andthe transferrin receptors (TR) are highly localized tothe capillary endothelium of human brain, whereas Tfitself is found mainly localized to glial cells [40]. Inaddition, p97 is specifically expressed on reactive mi-croglial cells associated with amyloid plaques in post-mortem AD brain tissue. All other microglia not as-sociated with senile AD plaques and those found inbrain tissue from other neurodegenerative diseases, in-cluding Parkinson’s disease, progressive supranuclearpalsy, Huntington disease and amyotrophic lateral scle-rosis, do not express detectable levels of p97 [21].
A quantitative serum and cerebrospinal fluid (CSF)p97 assay has been developed based on the radioim-munoassay (RIA) technique, which employs capture
antibodies bound to sub-micron polystyrene beads andradio-labelled secondary antibodies. In a prior study,which used a less sensitive (Pandex) immunofluores-cence assay, the levels of p97 in a small sample of ADsubjects were shown to be significantly elevated in CSFand serum compared to neurologically normal controlswithout overlapping values [24]. Additionally, extrap-olation from this published data suggested that the p97concentration might begin to increase an estimated twoyears prior to first observed symptoms of AD [24]. Thecurrent study was undertaken to reproduce the resultsfrom the initial Pandex pilot study and was based on aRIA technique that was developed. It was also carriedout to further investigate the diagnostic utility of serump97 in a larger sample of newly referred subjects us-ing a strict double blinded technique where the clinicalassessment and the laboratory assessment of p97 wereperformed independently and concurrently.
2. Methods
The current study was a cross-sectional evaluationof consecutive newly referred subjects to the UBCClinic for Alzheimer’s Disease and Related Disorders(CADRD) for the assessment of dementia during an 8month recruitment period. Serum samples were ob-tained from these patients at the time of their cogni-tive and neurological assessment for dementia. Theprimary study objectives were to evaluate the utilityof serum p97 as a diagnostic for AD by determiningits sensitivity and specificity as well as a dichotomouscut-point where both sensitivity and specificity weresimultaneously maximized [9,13,15,18,43].
2.1. Selection of Cases
There were 119 subjects in this study, 48 subjectswith “probable” or “possible” AD according to theNINCDS-ADRDA criteria and 71 controls. All ADsubjects had a complete neurological/medical exami-nation, neuroimaging with CT or MRI, and selectedlaboratory studies. Formal neuropsychological assess-ment was conducted in selected AD cases, particularlywhen cognitive deficits were mild or when additionalcognitive assessment was required for diagnostic clari-fication. Control subjects were derived from caregiversor other informants who had accompanied referred ADsubjects to the CADRD and who consented to screen-ing cognitive testing and blood drawing for p97 assay.All control subjects had a Modified Mini Mental State

H. Feldman et al. / Serum p97 levels as an aid to identifying Alzheimer’s disease 509
Exam (3MS) score of > 88. In the Canadian Studyof Health and Aging (CSHA) a 3MS value of < 88was sensitive at identifying all dementia cases [31,43].Each consenting subject provided a sample of bloodfor the p97 assay on their initial visit to the CADRD.On the basis of the clinical assessment, without accessto the p97 results, a provisional diagnosis was enteredinto the database for each subject by one of the clin-ical investigators (HF, DF, BLB) while the laboratorywas similarly blinded to clinical information until theresults were analyzed [7,12,33,39].
2.2. Serum p97 detection methods
The p97 assays were run on aliquoted sera that hadbeen prepared according to the following protocol. Fol-lowing the blood draw, the sample was allowed to clotat room temperature for at least 60 min. The serumwas then recovered by centrifugation at 4◦C and imme-diately frozen at −80◦C and stored for up to 1 week.Samples were then thawed only once at 4◦C overnightprior to carrying out the p97 assay. The p97 radioim-munoassay (RIA) used in this study utilized purified,secreted recombinant p97 as the standard. This p97was recovered from the media used to culture Chinesehamster ovary (CHO) cells, which had been transfectedwith the human p97 gene, and purified using an affinitycolumn containing immobilized anti-p97 monoclonalantibodies (mAb) [14,22]. The assay was based on cre-ating a sandwich between the mAb Hyb C immobilizedonto carboxypolystyrene beads (3 µm), the sample p97and secondary mAb, L235 labeled with 125I. The serumsample was diluted 1:4 in dilution buffer (PBS, 1% BSAand 0.1% sodium azide) [22]. 100 µL diluted serumsamples and recombinant human secreted p97 spikedheat inactivated (HI) serum samples, which acted asstandards, were added to a 5 mL tube; 20 µL of HybC coated beads were added and incubated for 1 hour atroom temperature. 100 µL of 125I labeled mAb L235at 10 µg/ml was next added in dilution buffer and incu-bated for 1 hour at room temperature. After centrifuga-tion, the solution was removed from the pellet, whichwas then washed once with 1 mL washing buffer (PBS,1% BSA and 0.1% sodium azide). The tube plus pelletwas then placed in a Gamma counter. p97 standardswere tested in duplicate; serum samples were tested inquadruplicate. The determination of p97 concentrationwas made through a calculation of the average of allCPM (counts per minute) for each sample. A calibra-tion curve was prepared based on the HI serum samplespiked with 30, 15, 5, and 0 ng/mL recombinant hu-
man secreted p97. The slope, intercept, and R2 weredetermined by linear regression. HI denatures p97 andrenders it undetectable by the p97 RIA. The p97 con-centration of the undoped sample was then determinedfrom this calibration curve according to the followingformula:
p97 concentration
= dilution × (Sample mean CPM
−HI sample mean CPM)/
Slope of calibration curve
All serum samples were assayed by a single labo-ratory. Blood samples were considered as not beingevaluable if they were coagulated, or if they had in-tercepts greater than 10,000 CPM (high background).Evaluable samples were generally in the range 2,000–3,000 CPM (low background). If one of the quadru-plicate CPM readings differed from the average by 3standard deviations then the reading was ignored andthe sample mean CPM determined from the remainingthree readings. Sample data would be ignored and thesample re-tested for serum p97 concentration, if: 1)two of the quadruplicate CPM readings differed fromthe average by 3 standard deviations; 2) the measuredp97 concentration was greater than the range of thestandards (i.e., > 120 ng/ml); 3) the HI sample CPMwas greater than the “0” doped sample CPM or 4) theR2 value of the calibration curve was < 0.9. If afterre-testing the sample data was still unacceptable, thesubject was deleted from the trial.
2.3. Statistical methods
Descriptive statistics of means and standard devia-tions which, were calculated for continuous variablessuch as the serum p97 concentrations and percentagespresented for categorical study variables. Continuousvariables were compared between cases and controlsusing the t-test and Mann Whitney test. Spearman andPearson correlations, along with their statistical signif-icance, were calculated between p97 and other con-tinuous variables. Sensitivity, specificity, and positivepredictive value were calculated for the various cut-points of p97 that were used to classify cases as AD.The Kolmogorov-Smirnov test was used to comparedistributions of p97 to the normal distribution.

510 H. Feldman et al. / Serum p97 levels as an aid to identifying Alzheimer’s disease
"L ow B ackg rou n d " p 9 7n =4 1
"H ig h B ackg rou n d "E xc lu s ion
n =7
A D C asesn =4 8
C on tro ls"L ow B ackg rou n d "
n =6 4
C on tro ls"H ig h B ackg rou n d "
n =7
C on tro ls3 M S ≥8 8
n =7 1
A ll S tu d y P artic ip an tsn =1 1 9
Fig. 1. Case classification of samples.
Table 1Descriptive characteristics of AD cases and controls with serum p97 results
Variable AD cases Controls p-valueN Mean N Mean (Significance measurement)
t-test Mann-Whitney
Age 41 72.5 ± 7.0 64 61.0 ± 15.7 0.000 0.000p97 concentration 41 41.0 ± 20.0 64 19.5 ± 8.3 0.000 0.000Replication SD of p97 (ng/ml) 41 2.34 ± 1.28 64 1.79 ± 1.08 0.02 0.0083MS 35 58.1 ± 19.8 64 97.1 ± 3.0 0.000 0.000MMSE 39 17.5 ± 6.0 64 29.4 ± 0.9 0.000 0.000DAD (%) 34 65 ± 26 NAFRS (sum of boxes) 37 26.3 ± 5.9 NA
3. Results
Figure 1 illustrates the case classification process ac-cording to the study protocol. There were 48 AD sub-jects and 71 control subjects who participated in thestudy. Seven AD and 7 control subjects were excludedfrom the analysis for reason of having high backgroundactivity. The analysis of evaluable AD cases (n = 41)compared to cognitively normal controls (n = 64) ispresented in Table 1. The mean age of the AD cases(mean 72.5±7.0 yr., range 50–84 yr.) was significantlyolder than the control group (mean 61.0 ± 15.7 yr.,range 30–90 yr.) which included some family mem-bers of AD cases (p < 0.001 t-test). There were morewomen than men in the AD group (66%) compared tocontrols (55%) though the difference was not statisti-cally significant (p = 0.3). The mean values in ADcases of 3MS (58.1±19.8), MMSE (17.5±6.0), DAD(65± 26), and FRS (26.3± 5.9) fall within the mild tomoderate disease severity range.
Mean values of serum p97 were increased twofoldin AD subjects and were highly significantly differentfrom controls (p = 0.0001 t-test; p = 0.0001 MannWhitney). The mean for highly possible/probable ADcases (41.0 ± 20.0 ng/ml) was over double that of themean for the control group (19.5 ± 8.3 ng/ml). Forthose individuals > age 60 yr., the mean for the AD
group was again over double that of the controls (AD40.9± 19.1 ng/ml and controls 19.2± 8.5 ng/ml; t-testp < 0.001, Mann Whitney p < 0.001) indicating thatage did not appear to have an effect of the observeddifferences. For the full sample it was noted that thestandard deviations in serum p97 levels were substan-tially larger in AD cases (20.0) than in controls (8.3)p < 0.001, F-test. The p97 replication standard devia-tion additionally was larger in AD cases than controls,indicating greater variability across repeat assays.
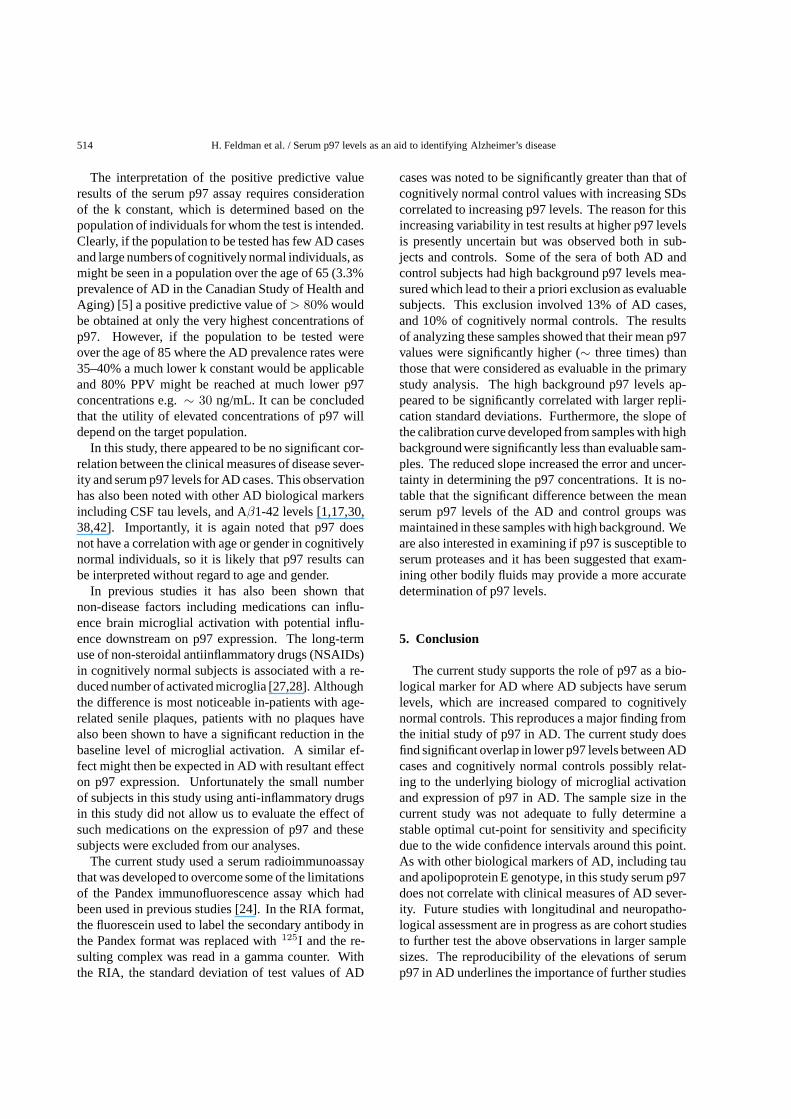
The scatter plot shown in Fig. 2 illustrates the dif-ference between the mean serum p97 value of the ADgroup compared to controls. The controls were splitinto two groups, old controls > 60 yr. and young con-trols < 60 yr., in order to illustrate the lack of variationin p97 serum levels with age in control groups. Withinthe AD case population the relative lack of p97 concen-trations around 30 ng/ml for AD cases suggested thepossibility of a bimodal distribution. This was exam-ined further with the Kolmogorov-Smirnov test of thenull hypothesis of normality which yielded p = 0.4,a result consistent with normality and a single popula-tion, rather than two. However, in another study thisbimodal distribution was noted and was statisticallysignificant [36].
The upward shift of the AD p97 distribution and thelimited overlap between cases and controls, as seen inFig. 2, served as a basis for using serum p97 cut points

H. Feldman et al. / Serum p97 levels as an aid to identifying Alzheimer’s disease 511
0
10
20
30
40
50
60
70
80
90
< 60 yr.> 60 yr.
19.2+8.5
Normal Controls AD
20.2+9.6
41.0+20.0
Se
rum
p9
7 C
on
cen
tra
tion
(ng
/mL
)
Fig. 2. Mean p97 concentration for AD cases and controls.
to classify subjects suffering from AD. To determinethe ability of using serum p97 concentration as a di-agnostic of AD, the data was assessed by the statisticsof sensitivity, specificity and positive predictive valuecalculated for specified p97 concentrations. Table 2presents the statistics for a range of cut points for serump97 values.
A cut-point of 23 ng/ml approximately equalizedsensitivity and specificity (71 and 72%, respectively),although the confidence intervals (CI) were fairly wide(for a sensitivity of 71% the 95% CI was 54–84% andfor a specificity of 72% the 95% CI was 59–82%). Nocontrols had values of > 46 ng/ml where specificitywas 100%. For k = 1, 2 and 10, the concentrationsthat yielded PPV of 80% or larger were 26, 29, and46 ng/ml respectively. The sensitivities, specificities,and positive predictive values for subjects aged 60 yr.and over were very similar to those found for the fullsample (at a cut point of 24 ng/mL the sensitivity andspecificity were both 70% with a PPV of 70%). Figure 3presents an empiric receiver operator curve (ROC) forthe AD and control samples with an area under thecurve (AUC) of 0.812 for all subjects and improves to0.831 for subjects over the age of 60 yr.
Age had no correlation with p97 for either cases orcontrols. A fitted regression model for p97 versus ageincluding both linear and quadratic age terms was notsignificant (p = 0.1). There were no significant asso-ciations in AD cases between p97 and duration disease
as estimated by the caregiver, or gender. There wereno significant correlations between p97 and measuresof global disease severity (FRS), functional disability(DAD total score) or cognitive measures (3-MS totalscores) (Table 3). There was a weak correlation of p97with the SD of the p97 values in cases while in controlsthere was a significant negative correlation.
There were a total of 7 AD cases and 7 controlsthat were excluded from the analysis due to high back-ground levels of p97 (see Fig. 1). The 7 AD caseswith high background activity had mean p97 assayvalues of 118.4 ± 85.7 ng/ml compared to mean of41 ± 20.0 ng/ml in low background cases (p < 0.001Mann-Whitney test). Similarly the 7 high back-ground control cases had mean p97 assay values of56.2 ± 23.1 ng/ml, threefold higher than low back-ground cases 19.5 ± 8.3 ng/ml (p = 0.0001 Mann-Whitney; 56 vs. 20, p < 0.001). Spearman correla-tions between the dichotomous background indicator(high vs. low) for all of the continuous and dichoto-mous variables were determined. These variables in-cluded demographic and clinical factors as well as p97results. All cases (n = 48) and controls (n = 71)were included, regardless of background level or diag-nosis. The only significant correlations between back-ground level and other factors occurred for p97 concen-tration (rho = 0.46, p < 0.001) and the p97 replicationstandard deviation (rho = 0.33, p < 0.001). Thesecorrelations are a consequence of the case-control dif-

512 H. Feldman et al. / Serum p97 levels as an aid to identifying Alzheimer’s disease
Table 2Empirical sensitivity and specificity for specified p97 concentrations
Cutpoint Sensitivity 95% CI∗ Specificity 95% CI∗ PPV PPV PPV(p97 Conc.) k = 1 k = 2 k = 10
10 0.98 40/41 (0.87, 0.99) 0.11 7/64 (0.05, 0.21) 0.52 0.35 0.1020 0.85 35/41 (0.71, 0.94) 0.58 37/64 (0.45, 0.70) 0.67 0.50 0.1723 0.71 29/41 (0.54, 0.84) 0.72 46/64 (0.59, 0.82) 0.72 0.56 0.2027 0.66 27/41 (0.49, 0.80) 0.88 56/64 (0.77, 0.94) 0.84 0.72 0.3530 0.61 25/41 (0.45, 0.76) 0.94 60/64 (0.85, 0.98) 0.91 0.83 0.4940 0.51 21/41 (0.35, 0.67) 0.98 63/64 (0.92, 0.99) 0.97 0.94 0.7746 0.44 18/41 (0.28, 0.60) 1.00 64/64 (0.94, 0.99) 1.00 1.00 1.00
∗CI = confidence interval. Sensitivity refers to the percentage of AD cases that are correctly classified ascases, and specificity to the percentage of controls that are correctly classified as controls, calculated forspecified cut points on the p97 scale. Positive predictive value (PPV) refers to the percentage of true AD casesamong the subjects who (correctly or incorrectly) are classified by the cut point rule as having AD. Specifically,PPV = {sens./[sens. + k(1-spec.)]}, where sensitivity and specificity are expressed as proportions betweenone and zero and k refers to the ratio of controls to AD subjects among those screened.
0.0 0.2 0.4 0.6 0.8 1.0
0.0
0.2
0.4
0.6
0.8
1.0
Area Under the Curve: 0.812
Se
nsi
tivity
1 -Specificity
Fig. 3. Empiric receiver operator curve (ROC) for AD and control samples.
ferences in p97 concentrations. All other correlationsbetween background and other factors were less than±0.1. Thus, the occurrence of high background seemsto be associated primarily with higher p97 assay val-ues although the cause of the high background remainsuncertain.
4. Discussion
To date the development of non-invasive biologicalmarkers for AD has had limited success. There havebeen a number of confirmed familial autosomal dom-inant mutations on chromosomes 21, 12 and 1. How-
ever, they account for only a small percentage of thetotal number of AD cases. Genetic risk markers includ-ing Apolipoprotein E genotyping may account for anestimated 50% of late onset sporadic disease. There isstill a need to develop biological markers with diagnos-tic utility both for research studies as well as for clini-cal practice. Recent reports of the utility of measuredAPP fragments in blood and heme oxygenase levelshold promise but still require replication. The mostwidely investigated biological markers for AD includ-ing measured levels of Aβ1-42; Aβ1-40, and tau allinvolve cerebrospinal fluid analysis, which limits theirapplicability and acceptance.
In this study, conducted under a strict double-

H. Feldman et al. / Serum p97 levels as an aid to identifying Alzheimer’s disease 513
Table 3Association of p97 concentration with study characteristics for AD cases and controls
Variable Cases p-value Controls p-valueN Pears. or Spear. N Pears. or Spear.
mean ± SD mean ± SD
SD of [p97] 41 0.360 p 0.252 s 0.02 p 0.11 s 64 −0.392 p −0.409 s 0.001 p 0.001 sSD of Age 41 0.002 p 0.084 s 0.99 p 0.60 s 64 −0.165 p −0.120 s 0.19 p 0.34 sAge: 30–59 4 41.4 ± 30.7 0.96 t 0.97 mw 27 19.8 ± 8.1 0.78 t 0.94 mw60–90 37 40.9 ± 19.1 37 19.2 ± 8.5Duration of AD (months) 41 −0.241 p −0.219 s 0.13 p 0.17 s 0Gender: Male 14 40.7 ± 22.1 0.95 t 0.97 mw 29 19.0 ± 6.4 0.71 t 0.90 mwFemale 27 41.1 ± 19.3 35 19.8 ± 9.63MS 35 −0.042 p −0.095 s 0.81 p 0.59 s 64 −0.032 p −0.039 s 0.80 p 0.76 sDAD 34 0.134 p 0.132 s 0.45 p 0.46 s 0FRS 37 −0.002 p 0.084 s 0.99 p 0.62 s 0
Abbreviations: Pears. or p = Pearson correlation coefficient, Spear. or s = Spearman correlation coefficient, t = t-test, mw = Mann-Whitneytest, NA = not applicable.
blinded procedure, there is a highly significant differ-ence demonstrated between the mean concentrations ofserum p97 in AD cases and cognitively normal con-trols. These findings confirm similar results from a pre-vious study which utilized blood to measure p97 levelsin AD and controls [24,36]. In the current study thereis an overlap seen in this study in p97 levels betweenthe AD cases and the cognitively normal controls, thathas not been previously noted [24]. The presence oflow or normal p97 levels in some clinically diagnosedAD cases raises the possibility that not all AD casesexpress high p97 levels. We postulate that this mayresult from the heterogeneity of Alzheimer pathologyor from other factors such as medications or geneticpolymorphisms that may interact with the underlyingdisease process. In previous studies, it has been re-ported that microglia associated with the senile neu-ritic plaques (SNP) overexpress p97 on their cell sur-face [21,40]. There are however AD cases where SNPpathology is less prominent than neurofibrillary tanglepathology [29]. It is possible that in such instanceswhere subjects have lower SNP scores they will alsohave lower p97 levels due to low plaque activation ofthe microglial cells. Recently there have also been de-scribed gene polymorphisms of Interleukin 1, a pro-cytokine that seems to influence both the risk and ex-pression of AD through inflammatory control mecha-nisms. This too might have some effect on the levelsof expressed p97 relating to microglial activation. Ad-ditionally other co-morbid pathologies in the brains ofAD subjects such as vascular lesions might influencep97 expression. Neuropathological evaluation of ourstudy participants will be important in trying to drawcorrelations of p97 levels with plaque scores and withmeasures of microglial activation.
The gradual decline of sensitivity seen with increas-ing p97 concentrations in this study reflects on the widedistribution of values in the AD case group. On theother hand, the rapid rise of specificity is due to themuch narrower distribution of the control p97 valueswhere the specificity at values of > 30 ng/mL is up-wards of 90%, reaching 98% at 40 ng/mL. Approxi-mately equalized sensitivity and specificity (71-72%)was reached with a cut-point of 23 ng/mL. This cutpoint from the current study must be treated with somecaution as the 95% confidence intervals for both thesensitivity (54–84%) and specificity (59–82%) at thisvalue were quite wide, and the sample size relativelysmall. If, however, such a cut-point were confirmed inlarger study samples it is possible that such a paradigmmight allow subjects with a p97 score above a speci-fied level to be most reliably classified as AD. For thebalance of AD subjects with below cut point p97 val-ues, it would not be implied that they did not have ADrather that it was simply less likely. While such a sin-gle cut-point might be of interest in clinical practice,other cut-points would have different utility in othersettings. If there were a need for a screening test thathad a high degree of sensitivity that would miss veryfew AD cases at the expense of specificity, then a rela-tivity low cut-point could be used. On the other hand,if avoiding false positive diagnoses were desired forpurposes of a proof of principal clinical trial for ADwith leading edge technology, then a high p97 cut-pointcould be used to yield a high specificity at the expenseof reduced sensitivity. The ROC curve representationof sensitivity and specificity reveals an area under thecurve (AUC) of 0.81 (0.831 for > 60 yr.), which sug-gests that overall the p97 serum assay does have someutility in identifying AD.
514 H. Feldman et al. / Serum p97 levels as an aid to identifying Alzheimer’s disease
The interpretation of the positive predictive valueresults of the serum p97 assay requires considerationof the k constant, which is determined based on thepopulation of individuals for whom the test is intended.Clearly, if the population to be tested has few AD casesand large numbers of cognitively normal individuals, asmight be seen in a population over the age of 65 (3.3%prevalence of AD in the Canadian Study of Health andAging) [5] a positive predictive value of > 80% wouldbe obtained at only the very highest concentrations ofp97. However, if the population to be tested wereover the age of 85 where the AD prevalence rates were35–40% a much lower k constant would be applicableand 80% PPV might be reached at much lower p97concentrations e.g. ∼ 30 ng/mL. It can be concludedthat the utility of elevated concentrations of p97 willdepend on the target population.
In this study, there appeared to be no significant cor-relation between the clinical measures of disease sever-ity and serum p97 levels for AD cases. This observationhas also been noted with other AD biological markersincluding CSF tau levels, and Aβ1-42 levels [1,17,30,38,42]. Importantly, it is again noted that p97 doesnot have a correlation with age or gender in cognitivelynormal individuals, so it is likely that p97 results canbe interpreted without regard to age and gender.
In previous studies it has also been shown thatnon-disease factors including medications can influ-ence brain microglial activation with potential influ-ence downstream on p97 expression. The long-termuse of non-steroidal antiinflammatory drugs (NSAIDs)in cognitively normal subjects is associated with a re-duced number of activated microglia [27,28]. Althoughthe difference is most noticeable in-patients with age-related senile plaques, patients with no plaques havealso been shown to have a significant reduction in thebaseline level of microglial activation. A similar ef-fect might then be expected in AD with resultant effecton p97 expression. Unfortunately the small numberof subjects in this study using anti-inflammatory drugsin this study did not allow us to evaluate the effect ofsuch medications on the expression of p97 and thesesubjects were excluded from our analyses.
The current study used a serum radioimmunoassaythat was developed to overcome some of the limitationsof the Pandex immunofluorescence assay which hadbeen used in previous studies [24]. In the RIA format,the fluorescein used to label the secondary antibody inthe Pandex format was replaced with 125I and the re-sulting complex was read in a gamma counter. Withthe RIA, the standard deviation of test values of AD
cases was noted to be significantly greater than that ofcognitively normal control values with increasing SDscorrelated to increasing p97 levels. The reason for thisincreasing variability in test results at higher p97 levelsis presently uncertain but was observed both in sub-jects and controls. Some of the sera of both AD andcontrol subjects had high background p97 levels mea-sured which lead to their a priori exclusion as evaluablesubjects. This exclusion involved 13% of AD cases,and 10% of cognitively normal controls. The resultsof analyzing these samples showed that their mean p97values were significantly higher (∼ three times) thanthose that were considered as evaluable in the primarystudy analysis. The high background p97 levels ap-peared to be significantly correlated with larger repli-cation standard deviations. Furthermore, the slope ofthe calibration curve developed from samples with highbackground were significantly less than evaluable sam-ples. The reduced slope increased the error and uncer-tainty in determining the p97 concentrations. It is no-table that the significant difference between the meanserum p97 levels of the AD and control groups wasmaintained in these samples with high background. Weare also interested in examining if p97 is susceptible toserum proteases and it has been suggested that exam-ining other bodily fluids may provide a more accuratedetermination of p97 levels.
5. Conclusion
The current study supports the role of p97 as a bio-logical marker for AD where AD subjects have serumlevels, which are increased compared to cognitivelynormal controls. This reproduces a major finding fromthe initial study of p97 in AD. The current study doesfind significant overlap in lower p97 levels between ADcases and cognitively normal controls possibly relat-ing to the underlying biology of microglial activationand expression of p97 in AD. The sample size in thecurrent study was not adequate to fully determine astable optimal cut-point for sensitivity and specificitydue to the wide confidence intervals around this point.As with other biological markers of AD, including tauand apolipoprotein E genotype, in this study serum p97does not correlate with clinical measures of AD sever-ity. Future studies with longitudinal and neuropatho-logical assessment are in progress as are cohort studiesto further test the above observations in larger samplesizes. The reproducibility of the elevations of serump97 in AD underlines the importance of further studies

H. Feldman et al. / Serum p97 levels as an aid to identifying Alzheimer’s disease 515
to determine its role as a biological marker or diagnos-tic adjunct in AD. Future work will address whetherit is also useful for the differential diagnosis of ADagainst other dementias/neurodegenerative diseases oragonal state.
Acknowledgements
The authors wish to thank Ms. Sandra Tam for herhelpful assistance in the preparation of this manuscript.Financial support for this study was provided bySynapse Technologies, and grants to W.A.J. from theCIHR, the Vancouver Foundation and NSERC.
References
[1] N. Andreasen, E. Vanmechelen, A. Van de Voorde, P. Davids-son, C. Hesse, S. Tarvonen, I. Raiha, L. Sourander, B. Win-blad and K. Blennow, Cerebrospinal fluid tau protein as a bio-chemical marker for Alzheimer’s disease: a community basedfollow up study, J Neurol Neurosurg Psychiatry 64(3) (1998),298–305.
[2] Assessing dementia: the Canadian consensus. OrganizingCommittee, Canadian Consensus Conference on the Assess-ment of Dementia [editorial], Cmaj 144(7) (1991), 851–853.
[3] D.R. Borchelt, G. Thinakaran, C.B. Eckman, M.K. Lee, F.Davenport, T. Ratovitsky, C.M. Prada, G. Kim, S. Seekins,D. Yager, H.H. Slunt, R. Wang, M. Seeger, A.I. Levey,S.E. Gandy, N.G. Copeland, N.A. Jenkins, D.L. Price, S.G.Younkin and S.S. Sisodia, Familial Alzheimer’s disease-linkedpresenilin 1 variants elevate Abeta1-42/1-40 ratio in vitro andin vivo, Neuron 17(5) (1996), 1005–1013.
[4] H. Braak and E. Braak, Neuropathological stageing ofAlzheimer-related changes, Acta Neuropathol 82(4) (1991),239–259.
[5] Canadian study of health and aging: study methods and preva-lence of dementia, Cmaj 150(6) (1994), 899–913.
[6] H.C. Chui, J.I. Victoroff, D. Margolin, W. Jagust, R. Shankleand R. Katzman, Criteria for the diagnosis of ischemic vascu-lar dementia proposed by the State of California Alzheimer’sDisease Diagnostic and Treatment Centers, Neurology 42(3 Pt1) (1992), 473–480.
[7] Clinical and neuropathological criteria for frontotemporal de-mentia. The Lund and Manchester Groups, J Neurol Neuro-surg Psychiatry 57(4) (1994), 416–418.
[8] Consensus report of the Working Group on: “Molecular andBiochemical Markers of Alzheimer’s Disease”, The Ronaldand Nancy Reagan Research Institute of the Alzheimer’s As-sociation and the National Institute on Aging Working Group[published erratum appears in Neurobiol Aging 1998 May–Jun;19(3):285], Neurobiol Aging 19(2) (1998), 109–116.
[9] D. Crockett, H. Tuokko, R. Koch and R. Parks, The assessmentof everyday functioning using the present functioning ques-tionnaire and the functional rating scale in elderly samples,Clin Gerontol 8 (1989), 3–25.
[10] S.M. de la Monte, L. Volicer, S.L. Hauser and J.R. Wands,Increased levels of neuronal thread protein in cerebrospinalfluid of patients with Alzheimer’s disease, Ann Neurol 32(6)(1992), 733–742.
[11] D.W. Dickson, D. Ruan, H. Crystal, M.H. Mark, P. Davies, Y.Kress and S.H. Yen, Hippocampal degeneration differentiatesdiffuse Lewy body disease (DLBD) from Alzheimer’s disease:light and electron microscopic immunocytochemistry of CA2-3 neurites specific to DLBD, Neurology 41(9) (1991), 1402–1409.
[12] E.M. Ebly, D.B. Hogan and I.M. Parhad, Cognitive impair-ment in the nondemented elderly. Results from the CanadianStudy of Health and Aging, Arch Neurol 52(6) (1995), 612–619.
[13] H. Feldman, M. Schulzer, S. Wang, H. Tuokko and B. Beattie,The Functional Rating Scale (FRS) in Alzheimer’s disease: alongitudinal study (abstract), Neurobiol Aging 15(1) (1994).
[14] H. Feldman, M.L. Kennard, T. Yamada, S. Adams and W.A.Jefferies, Serum levels of the iron binding protein p97: a novelbiological marker of Alzheimer’s disease, in: Alzheimer’s Dis-ease: Biology, Diagnosis and Therapeutics, K. Iqbal, B. Win-blad, S. Nishimura, M. Takeda and H. Wisniewski, eds, JohnWiley & Sons, 1997, Pages.
[15] M.F. Folstein, S.E. Folstein and P.R. McHugh, Mini-mentalstate, A practical method for grading the cognitive state ofpatients for the clinician, J Psychiatr Res 12(3) (1975), 189–198.
[16] M.R. Food, S. Rothenberger, R. Gabathuler, I.D. Haidl, G.Reid and W.A. Jefferies, Transport and expression in humanmelanomas of a transferrin-like glycosylphosphatidylinositol-anchored protein, J Biol Chem 269(4) (1994), 3034–3040.
[17] D. Galasko, C. Clark, L. Chang, B. Miller, R.C. Green, R.Motter and P. Seubert, Assessment of CSF levels of tau pro-tein in mildly demented patients with Alzheimer’s disease,Neurology 48(3) (1997), 632–635.
[18] I. Gelinas, L. Gauthier, M. McIntyre and S. Gauthier, Devel-opment of a functional measure for persons with Alzheimer’sdisease: the disability assessment for dementia, Am J OccupTher 53(5) (1999), 471–481.
[19] L. Hansen, D. Salmon, D. Galasko, E. Masliah, R. Katzman,R. DeTeresa, L. Thal, M. M. Pay, R. Hofstetter and M. Klauberet al., The Lewy body variant of Alzheimer’s disease: a clinicaland pathologic entity, Neurology 40(1) (1990), 1–8.
[20] B.T. Hyman and J.Q. Trojanowski, Consensus recommenda-tions for the postmortem diagnosis of Alzheimer disease fromthe National Institute on Aging and the Reagan Institute Work-ing Group on diagnostic criteria for the neuropathological as-sessment of Alzheimer disease [editorial], J Neuropathol ExpNeurol 56(10) (1997), 1095–1097.
[21] W.A. Jefferies, M.R. Food, R. Gabathuler, S. Rothenberger,T. Yamada, O. Yasuhara and P.L. McGeer, Reactive microgliaspecifically associated with amyloid plaques in Alzheimer’sdisease brain tissue express melanotransferrin, Brain Res712(1) (1996), 122–126.
[22] M.L. Kennard, M.R. Food, W.A. Jefferies and J.M. Piret, Con-trolled process to recover heterologous glycosylphosphatidyli-nositol membrane anchored proteins from CHO cells, BiotechBioeng 42 (1993), 480–486.
[23] M.L. Kennard, D.R. Richardson, R. Gabathuler, P. Ponka andW.A. Jefferies, A novel iron uptake mechanism mediated byGPI-anchored human p97, Embo J 14(17) (1995), 4178–4186.
[24] M.L. Kennard, H. Feldman, T. Yamada and W.A. Jefferies,Serum levels of the iron binding protein p97 are elevated inAlzheimer’s disease, Nat Med 2(11) (1996), 1230–1235.
[25] K. Kosaka, M. Yoshimura, K. Ikeda and H. Budka, Diffusetype of Lewy body disease: progressive dementia with abun-dant cortical Lewy bodies and senile changes of varying degree– a new disease? Clin Neuropathol 3(5) (1984), 185–192.

516 H. Feldman et al. / Serum p97 levels as an aid to identifying Alzheimer’s disease
[26] F. Licastro, L.J. Davis, M.C. Morini, D. Cucinotta and G.Savorani, Cerebrospinal fluid of patients with senile dementiaof Alzheimer’s type shows an increased inhibition of alpha-chymotrypsin, Alzheimer Dis Assoc Disord 8(4) (1994), 241–249.
[27] I.R. Mackenzie and D.G. Munoz, Nonsteroidal anti-inflammatory drug use and Alzheimer- type pathology in ag-ing, Neurology 50(4) (1998), 986–990.
[28] I.R. Mackenzie, Anti-inflammatory drugs and Alzheimer-typepathology in aging, Neurology 54(3) (2000), 732–734.
[29] W.R. Markesbery, Neuropathological criteria for the diagnosisof Alzheimer’s disease, Neurobiol Aging 18(4) (1998), S13–S19.
[30] E. Matsubara, S. Hirai, M. Amari, M. Shoji, H. Yamaguchi,K. Okamoto, K. Ishiguro, Y. Harigaya and K. Wakabayashi,Alpha 1-antichymotrypsin as a possible biochemical markerfor Alzheimer- type dementia, Ann Neurol 28(4) (1990), 561–567.
[31] I. McDowell, B. Kristjansson, G.B. Hill and R. Hebert, Com-munity screening for dementia: the Mini Mental State Exam(MMSE) and Modified Mini-Mental State Exam (3MS) com-pared, J Clin Epidemiol 50(4) (1997), 377–383.
[32] I.G. McKeith, A.F. Fairbairn, R.H. Perry and P. Thompson,The clinical diagnosis and misdiagnosis of senile dementiaof Lewy body type (SDLT), Br J Psychiatry 165(3) (1994),324–332.
[33] I.G. McKeith and G.A. Ayre, Consensus criteria for the clini-cal diagnosis of dementia with Lewy bodies, in: Alzheimer’sDisease: Biology, Diagnosis and Therapeutics, K. Iqbal, B.Winblad, T. Nishimura, M. Takeda and H.M. Wisniewski, eds,John Wiley & Sons Ltd, Chichester, 1997, pp. 167–177.
[34] G. McKhann, D. Drachman, M. Folstein, R. Katzman, D.Price and E.M. Stadlan, Clinical diagnosis of Alzheimer’sdisease: report of the NINCDS-ADRDA Work Group underthe auspices of Department of Health and Human ServicesTask Force on Alzheimer’s Disease, Neurology 34(7) (1984),939–944.
[35] S.S. Mirra, A. Heyman, D. McKeel, S.M. Sumi, B.J. Crain,
L.M. Brownlee, F.S. Vogel, J.P. Hughes, G. van Belle and L.Berg, The Consortium to Establish a Registry for Alzheimer’sDisease (CERAD). Part II. Standardization of the neuropatho-logic assessment of Alzheimer’s disease, Neurology 41(4)(1991), 479–486.
[36] I. Moroo, T. Yamada, M.L. Kennard, R. Gabathuler, J. Nurmi-nen and W.A. Jefferies, Use of p97 (melanotransferrin) in thediagnosis of Alzheimer’s disease, Alzheimer’s Report 2(1999),353–358.
[37] R.H. Perry, D. Irving, G. Blessed, A. Fairbairn and E.K. Perry,Senile dementia of Lewy body type. A clinically and neu-ropathologically distinct form of Lewy body dementia in theelderly, J Neurol Sci 95(2) (1990), 119–139.
[38] T. Pirttila, K.S. Kim, P.D. Mehta, H. Frey and H.M. Wis-niewski, Soluble amyloid beta- protein in the cerebrospinalfluid from patients with Alzheimer’s disease, vascular demen-tia and controls, J Neurol Sci 127(1) (1994), 90–95.
[39] K. Rockwood, I. Parhad, V. Hachinski, T. Erkinjuntti, B. Rew-castle, A. Kertesz, M.R. Eastwood and S. Phillips, Diagno-sis of vascular dementia: Consortium of Canadian Centresfor Clinical Cognitive Research concensus statement, Can JNeurol Sci 21(4) (1994), 358–364.
[40] S. Rothenberger, M.R. Food, R. Gabathuler, M.L. Kennard,T. Yamada, O. Yasuhara, P.L. McGeer and W.A. Jefferies,Coincident expression and distribution of melanotransferrinand transferrin receptor in human brain capillary endothelium,Brain Res 712(1) (1996), 117–121.
[41] P. Seubert, R. Motter and D. Schenk et al., Elevation of CSFtau in early stage Alzheimer’s disease, Neurology 46 (1997),A161 (abstract).
[42] P.C. Southwick, S.K. Yamagata, C.L. Jr. Echols, G.J. Higson,S.A. Neynaber, R.E. Parson and W.A. Munroe, Assessmentof amyloid beta protein in cerebrospinal fluid as an aid in thediagnosis of Alzheimer’s disease, J Neurochem 66(1) (1996),259–265.
[43] E.L. Teng and H.C. Chui, The Modified Mini-Mental State(3MS) examination, J Clin Psychiatry 48(8) (1987), 314–318.