Modelling demography and extinction risk in the endangered Balearic shearwater
Upload
independentCategory
view
1download
0
Journal of Tropical Ecology (2008) 24:493–503. Copyright © 2008 Cambridge University Pressdoi:10.1017/S0266467408005312 Printed in the United Kingdom
Demography and life history of two rattan species, Eremospathamacrocarpa and Laccosperma secundiflorum, in Cote d’Ivoire
Kouadio I. Kouassi∗†1, Sebastien Barot†, Jacques Gignoux‡ and Irie A. Zoro Bi∗
∗ Universite d’Abobo-Adjame, UFR des Sciences de la Nature, 02 BP 801 Abidjan 02, Cote d’Ivoire† Laboratoire d’Ecologie des Sols Tropicaux (LEST), UMR 137, IRD, 32 Avenue Henri Varagnat, 93143, Bondy, France‡ Laboratoire de Biochimie et Ecologie des Milieux Continentaux (Biodiversite et fonctionnement des Ecosystemes), ENS, 46 rue d’Ulm 75230 Paris Cedex 05(Accepted 26 July 2008)
Abstract: Two rattans species were studied in Cote d’Ivoire using a stage-classified matrix model to compare theirdemography and life histories. Respectively 854 and 1009 genets of Eremospatha macrocarpa (pleonanthic) andLaccosperma secundiflorum (hapaxanthic) were censused every 6 mo over 18 mo. The population growth rates ofE. macrocarpa (λ= 0.979) and L. secundiflorum (λ= 0.959) were not significantly different from 1. This indicates thatthe populations were close to equilibrium. However, the difference between the stable stage distributions and theobserved distributions indicated temporal variation in vital rates. Elasticity analysis showed that growth and fecundityhad lower contributions to λ than the survival rates for the two species. A Life Table Response Experiment revealedthat the survival of the first juvenile stage (all stems < 6 m in length), fecundity, growth of the second juvenile stage(at least one stem > 6 m in length) and adult (reproductive) survival highly contribute to the differences between thedemography of the two species. Reproduction is postponed longer for L. secundiflorum than for E. macrocarpa and themean remaining life span for adult genets is shorter for L. secundiflorum than for E. macrocarpa. Finally, our resultssuggest the existence of two trade-offs within reproduction which suggest that, although the two species have differentdemographic features, the λ of their populations are not significantly different from 1.
Key Words: age estimation, elasticity, life-table response experiments, non-timber forest products, palm, populationgrowth rate, stage-classified matrix model, tropical forest
INTRODUCTION
Life-history evolution is an important field of modernecology (Begon et al. 2006, Stearns 1977). A usefulapproach is to compare the life histories of relatedorganisms to determine how evolution has shaped therelationship between different life-history traits. Becausethe population growth rate is a function of all life-history parameters, changes in these parameters willcause changes in the growth rate (Caswell 2001, Stearns& Hoekstra 2000). In this context, palm trees are suitablemodels to study perennial plant demography and lifehistory (Barot & Gignoux 1999). In particular, therelatively simple morphology of palm trees makes it iseasy to define stages based on morphological traits andsize.
Matrix population models have been widely used toanalyse the demography of palms (Barot et al. 2000,
1 Corresponding author. Email: [email protected]
Bernal 1998, Bullock 1980, De Steven 1986, 1989;Escalante et al. 2004, Pinero et al. 1984, Rodriguez-Buritica et al. 2005, Souza & Martins 2006) and toimprove the exploitation of palm populations (Anderson& Putz 2002, Balick 1987, Endress et al. 2004, Olmsted& Alvarez-Buylla 1995, Ratsirarson et al. 1996). Matrixmodels constitute useful tools to analyse the persistence ofpopulations, to describe life histories, and to compare thedemography of different populations or species (Caswell2001). For plants, these models are usually stage-classified and require the estimations of the transitionprobabilities between stages as well as fecundities (Caswell2001, De Matos & Matos 1998, Ramula & Lehtila 2005,Silvertown et al. 1993). The models also allow thecalculation of age-based parameters (Barot et al. 2002,Cochran & Ellner 1992) such as the mean ages in differentstages.
We present here the first matrix model for the genetsof two African rattan species: Eremospatha macrocarpa(Mann & Wendl.) Wendl. and Laccosperma secundiflorum(P. Beauv.) Kuntze. Despite the existence of over 600
494 KOUADIO I. KOUASSI ET AL.
species of rattan and the fact that rattans constituteone of the main non-timber forest products worldwide,very little is known about their demography and lifehistory. More generally, these species are multiple-stemmed palms, i.e. each individual (genet) producesseveral stems (ramets) linked by a common rhizome,and the demographic effect of such a type of clonalityhas seldom been studied. The two species have differentflowering types. Eremospatha macrocarpa is pleonanthic:inflorescences are developed on axillary buds so that stemsgo on growing after flowering. Laccosperma secundiflorumis hapaxanthic: inflorescences are apical so that rametsdie after flowering. We hypothesize here that thesetwo flowering types lead to differences in the rametdynamics and subsequently in the genet dynamics ofthe two species. For example, hapaxanthy should leadto higher ramet mortality in L. secundiflorum than inE. macrocarpa. This could subsequently lead to highergenet mortality in L. secundiflorum than in E. macrocarpa.In fact, the complete life histories (as defined by theage at first reproduction, fecundity and other life-history parameters) of the two rattan species arelikely to have evolved in relation with their floweringtypes. The two species should thus have different lifehistories.
In turn, life-history differences should lead to differencesbetween the demography of the two species. Althoughthey live in the same environment and are taxonomicallyclose to each other, their populations should achievetheir growth rates through different combinations ofdemographic parameters. This should be reflected in thepattern of sensitivities of the population growth rate tothe demographic parameters and a Life Table ResponseExperiment comparing the matrix models of the twospecies. The demographic models we present here havethus three objectives: first to determine the demographicstatus of the studied palm populations (increasing ordecreasing), second to test the hypothesis that the twopalm species have evolved different life histories in relationwith their flowering types, third to test the hypothesisthat the two palm species have different demographiccharacteristics. It must be added that the flowering typeis a life-history parameter among many others, and thatall the life-history parameters of the two species and theirpopulation dynamics have interacted bidirectionally allthrough their evolutionary histories. Our rationale is thusvalid in retrospect, i.e. at a broad macro-evolutionaryscale. Correlations between the flowering type, other life-history parameters and demographic features are thus tobe expected but it is difficult to determine the successionof evolutionary pressures that have really been involved.For example, the flowering type of the two rattan speciesmight have evolved before the evolution of differentramet and genet survival rates, but the reverse is alsopossible.
MATERIALS AND METHODS
Study site and data
Study site. The study was conduced in the N’zodji forest(1086 ha) in south-eastern Cote d’Ivoire. This forestis located between 5◦33′N and 5◦43′N and between3◦49′W and 3◦56′W. N’zodji forest is dense, wet andevergreen. The climate is wet and subequatorial, witha mean annual precipitation of 1350 mm, and a meanannual temperature of about 25 ◦C. Soils are ferralliticand derived from schist rocks.
Study species. Eremospatha macrocarpa and Laccospermasecundiflorum are multiple-stemmed palms: each indi-vidual (genet) produces many stems (ramets) that remainattached to each other by a rhizome. Eremospathamacrocarpa stems can reach up to 50–75 m long whereasL. secundiflorum stems can reach up to 25–50 m long(Sunderland 2007). In E. macrocarpa, the climbingstems have a small diameter (1–1.8 cm). Floweringis pleonanthic (Sunderland 2002): inflorescences aredeveloped on axillary buds. Consequently, ramets cancontinue their growth after flowering and can thusflower many times. Laccosperma secundiflorum is alsoa multiple-stemmed climbing palm. Its climbing stemshave a larger (3–5 cm) diameter than E. macrocarpa.Flowering is hapaxanthic: inflorescences are apical so thatramets die after flowering (Sunderland 2002, Tomlinson& Jeffrey 1990). A stem dies after flowering, but thegenet it belongs to continues living and producing newstems (Sunderland 2002). Eremospatha macrocarpa fruitsare larger (2.5 × 2 cm and 15–20 rings of scales) thanL. secundiflorum fruits (1.5 × 1 cm in height and 12 spiralrings of scales) (Sunderland 2007).
The two rattan species are important non-timberforest products that are used in local handicraft. Theexploitation of their natural populations is not controlled,which can potentially threaten these populations. Here,the harvest rate, defined as the number of ramets collectedper harvestable ramets (juvenile 2 and adult stages)during a given period, varied according the plot and thespecies (unpubl. data). These estimates varied from 18%to 23% and from 8.3% to 42.7% over a 6-mo period,respectively for E. macrocarpa and L. secundiflorum. Theharvest rate was on the average higher in L. secundiflorum.
Data collection. Three 200 × 200-m (4 ha) plots wereestablished in the northern part of N’zodji forest. In eachplot we counted and labelled all genets and ramets.For demographic analyses, genets of the two specieswere classified in four stages, according to their size andmorphology using traditionally used criteria for palm
Demography of rattan species 495
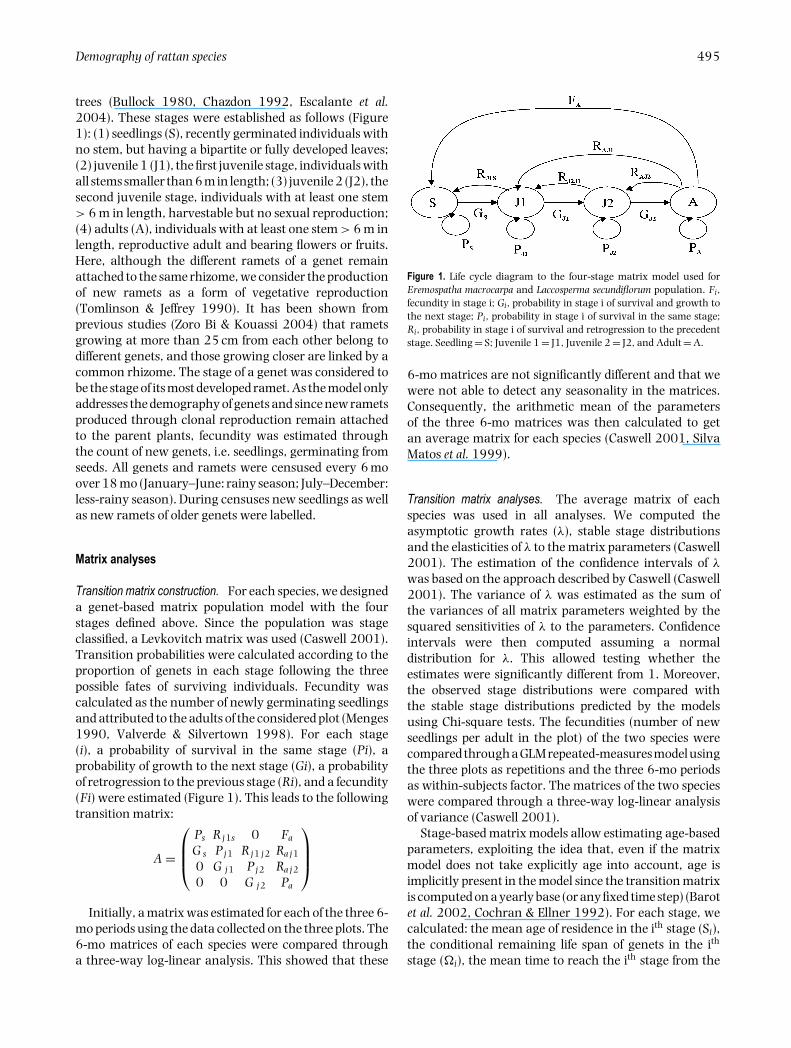
trees (Bullock 1980, Chazdon 1992, Escalante et al.2004). These stages were established as follows (Figure1): (1) seedlings (S), recently germinated individuals withno stem, but having a bipartite or fully developed leaves;(2) juvenile 1 (J1), the first juvenile stage, individuals withall stems smaller than 6 m in length; (3) juvenile 2 (J2), thesecond juvenile stage, individuals with at least one stem> 6 m in length, harvestable but no sexual reproduction;(4) adults (A), individuals with at least one stem > 6 m inlength, reproductive adult and bearing flowers or fruits.Here, although the different ramets of a genet remainattached to the same rhizome, we consider the productionof new ramets as a form of vegetative reproduction(Tomlinson & Jeffrey 1990). It has been shown fromprevious studies (Zoro Bi & Kouassi 2004) that rametsgrowing at more than 25 cm from each other belong todifferent genets, and those growing closer are linked by acommon rhizome. The stage of a genet was considered tobe the stage of its most developed ramet. As the model onlyaddresses the demography of genets and since new rametsproduced through clonal reproduction remain attachedto the parent plants, fecundity was estimated throughthe count of new genets, i.e. seedlings, germinating fromseeds. All genets and ramets were censused every 6 moover 18 mo (January–June: rainy season; July–December:less-rainy season). During censuses new seedlings as wellas new ramets of older genets were labelled.
Matrix analyses
Transition matrix construction. For each species, we designeda genet-based matrix population model with the fourstages defined above. Since the population was stageclassified, a Levkovitch matrix was used (Caswell 2001).Transition probabilities were calculated according to theproportion of genets in each stage following the threepossible fates of surviving individuals. Fecundity wascalculated as the number of newly germinating seedlingsand attributed to the adults of the considered plot (Menges1990, Valverde & Silvertown 1998). For each stage(i), a probability of survival in the same stage (Pi), aprobability of growth to the next stage (Gi), a probabilityof retrogression to the previous stage (Ri), and a fecundity(Fi) were estimated (Figure 1). This leads to the followingtransition matrix:
A =
⎛⎜⎜⎝
Ps Rj 1s 0 Fa
G s Pj 1 Rj 1 j 2 Ra j 1
0 G j 1 Pj 2 Ra j 2
0 0 G j 2 Pa
⎞⎟⎟⎠
Initially, a matrix was estimated for each of the three 6-mo periods using the data collected on the three plots. The6-mo matrices of each species were compared througha three-way log-linear analysis. This showed that these
Figure 1. Life cycle diagram to the four-stage matrix model used forEremospatha macrocarpa and Laccosperma secundiflorum population. Fi,fecundity in stage i; Gi, probability in stage i of survival and growth tothe next stage; Pi, probability in stage i of survival in the same stage;Ri, probability in stage i of survival and retrogression to the precedentstage. Seedling = S; Juvenile 1 = J1, Juvenile 2 = J2, and Adult = A.
6-mo matrices are not significantly different and that wewere not able to detect any seasonality in the matrices.Consequently, the arithmetic mean of the parametersof the three 6-mo matrices was then calculated to getan average matrix for each species (Caswell 2001, SilvaMatos et al. 1999).
Transition matrix analyses. The average matrix of eachspecies was used in all analyses. We computed theasymptotic growth rates (λ), stable stage distributionsand the elasticities of λ to the matrix parameters (Caswell2001). The estimation of the confidence intervals of λ
was based on the approach described by Caswell (Caswell2001). The variance of λ was estimated as the sum ofthe variances of all matrix parameters weighted by thesquared sensitivities of λ to the parameters. Confidenceintervals were then computed assuming a normaldistribution for λ. This allowed testing whether theestimates were significantly different from 1. Moreover,the observed stage distributions were compared withthe stable stage distributions predicted by the modelsusing Chi-square tests. The fecundities (number of newseedlings per adult in the plot) of the two species werecompared through a GLM repeated-measures model usingthe three plots as repetitions and the three 6-mo periodsas within-subjects factor. The matrices of the two specieswere compared through a three-way log-linear analysisof variance (Caswell 2001).
Stage-based matrix models allow estimating age-basedparameters, exploiting the idea that, even if the matrixmodel does not take explicitly age into account, age isimplicitly present in the model since the transition matrixis computed on a yearly base (or any fixed time step) (Barotet al. 2002, Cochran & Ellner 1992). For each stage, wecalculated: the mean age of residence in the ith stage (Si),the conditional remaining life span of genets in the ith
stage (�i), the mean time to reach the ith stage from the
496 KOUADIO I. KOUASSI ET AL.
shoot (first stage) (τ s,i) (Barot et al. 2002, Cochran & Ellner1992).
Sensitivity analysis. We used elasticity and Life TableResponse Experiments (LTRE) to compare the lifecycles of the two studied species and to explore therelative importance of the different matrix entries in thepopulation growth rate. The first method consisted ofcalculating the elasticities of λ (asymptotic growth rate).Elasticity analyses evaluate the relative contribution ofmatrix entries to λ by providing information on howmuch λ would change if matrix entries were modified.Elasticities are a measure of proportional sensitivity ofλ to proportional change in aij (De Kroon et al. 2000).Elasticities have been considered a useful tool to identifyvulnerable life cycle stages on which to focus conservationand management strategies. We also used Silvertown’sapproach (Silvertown et al. 1992, 1993). This methodconsists in characterizing the life cycle by summing theelasticities of λ (asymptotic growth rate) to fecundities (F),growth rates (G) and survival rates (L) (Silvertown et al.1992).
Secondly, to determine the differences between thetransition matrices of the two species that are responsiblefor the different demographic behaviours of the twospecies and the difference in their asymptotic growthrates, a LTRE was conducted (Caswell 1996a). Todo so, the arithmetic mean of the two matrices wascalculated and the sensitivity of its asymptotic growthrate to each parameter was computed. These sensitivitieswere then multiplied by the difference between thecorresponding parameters of the two species. This resultsin a contribution matrix taking into account both theeffect of each demographic parameter on the populationgrowth rate and the amplitude of the difference betweenthe parameters of the two species. If a demographicparameter is very influential for the population growthrate but has similar values in the two species or if aparameter has highly different values in the two speciesbut is not influential for the population growth rate it willhave a low contribution in the LTRE matrix (and viceversa).
Matrix analyses were performed using the ULMsoftware (Legendre & Clobert 1995) and some speciallydesigned SAS routines using SAS/IML particularly for theage estimations. Statistics were also implemented in theSAS statistical package.
RESULTS
Average four-stage matrix model
In total 854 genets and 1853 ramets of E. macrocarpa werelabelled in the three plots (Table 1). One thousand and
Table 1. Number of individuals of Eremospatha macrocarpa andLaccosperma secundiflorum, censused by stage in three plots (12 ha) inN’zodji forest of Cote d’Ivoire.
Eremospathamacrocarpa
Laccospermasecundiflorum
Genets Ramets Genets Ramets
Seedling 603 818 788 987Juvenile 1 183 368 204 266Juvenile 2 23 415 14 19Adult 45 252 3 3Total 854 1853 1009 1275
Table 2. Average 6-mo transition matrix for Eremospatha macrocarpaand Laccosperma secundiflorum computed for three plots and two 6-momatrices.
Seedling Juvenile 1 Juvenile 2 Adult
Eremospatha macrocarpaSeedling 0.866 0.062 0.000 0.096Juvenile 1 0.057 0.804 0.000 0.011Juvenile 2 0.000 0.017 0.587 0.090Adult 0.000 0.000 0.397 0.881
Laccosperma secundiflorumSeedling 0.863 0.031 0.000 2.139Juvenile 1 0.064 0.919 0.190 0.000Juvenile 2 0.000 0.011 0.619 0.000Adult 0.000 0.000 0.071 0.750
nine (1009) genets and 1275 ramets of L. secundiflorumwere recorded in the plots (Table 1). In general, thestructure of the population was dominated by the seedlingstages in the two species.
The average transition matrices of both species(Table 2) were characterized by very high survival rates,and low retrogression rates between stages. For E.macrocarpa, the growth rates were higher in the adultstage than in the other stages while for L. secundiflorumthe higher growth rate was observed in the seedling andadult stages.
For E. macrocarpa, the mortality rate in 6 mo(mortality = 1 − gi − pi − ri) was higher in the seedlingand juvenile 1 stages (respective mortalities for seedling,juvenile 1, juvenile 2, adult: 0.077, 0.113, 0.016, 0.020).For L. secundiflorum, mortality was higher in the seedling,juvenile 2 and adult stages (respective mortalities forseedling, juvenile 1, juvenile 2, adult: 0.074, 0.039,0.119, 0.250). For E. macrocarpa, the lowest mortalityrates were observed for the juvenile 2 and adult stages,while for L. secundiflorum these two stages had highermortality rates. The growth rate in 6 mo of the juvenile 2stage was very low for L. secundiflorum (0.071) and muchhigher for E. macrocarpa (0.397). Moreover there was ahigh retrogression rate in 6 mo for E. macrocarpa from theadult to the juvenile 2 stage, while for L. secundiflorumthe highest retrogression rate was from the juvenile 2 tothe juvenile 1 stage.
Demography of rattan species 497
The asymptotic growth rate was slightly lower than1.0 for the two species (λ = 0.979 for E. macrocarpa andλ = 0.959 for L. secundiflorum). The standard deviation ofλ, due to the uncertainty in matrix parameters, was 0.048for E. macrocarpa and 0.046 for L. secundiflorum. Assuminga normal distribution for λ, led to the following 95%confidence intervals: 0.885–1.073 for E. macrocarpa and0.870–1.048 for L. secundiflorum. Thus the asymptoticgrowth rates of the two species were not significantlydifferent from 1.0.
There was a significant difference between the averagematrices of the two species (log-linear analysis of variance,model df = 1, P < 0.001). This difference comes fromall stages (log-linear analysis of variance comparingthe fate of genets between the two species, separatelyfor each stage, model df = 1, respective Ps: < 0.001,< 0.001, 0.027 and < 0.001 for the seedling, juvenile 1,juvenile 2 and adult stages). The average fecundity for E.macrocarpa and L. secundiflorum was 0.10 new individualsper adult genet per 6-mo period for E. macrocarpa and 2.14for L. secundiflorum. The difference between these totalfecundities was significant (repeated-measures ANOVA,F = 12.90, df = 5; P = 0.023 for the between-subjectseffect).
Stable stage distribution analysis
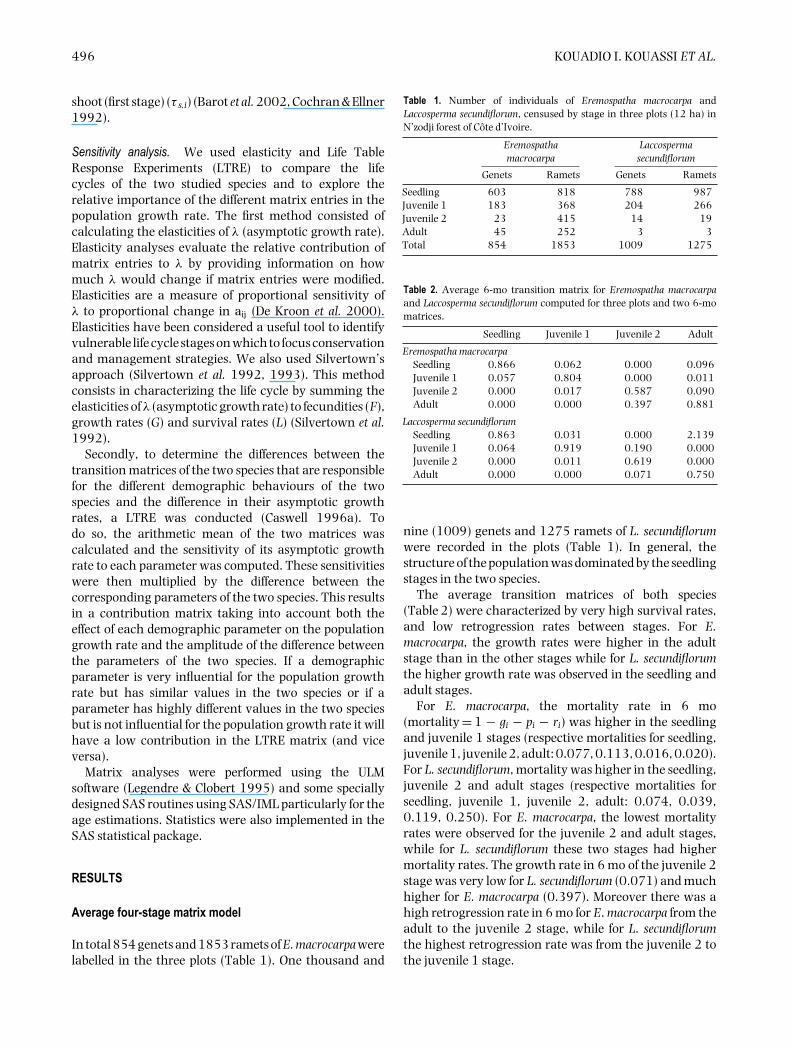
The proportions of individuals in each stage were,respectively for E. macrocarpa and L. secundiflorum:seedling (0.504, 0.351), juvenile 1 (0.232, 0.622),juvenile 2 (0.060, 0.020) and adult (0.204, 0.007).For the two species, the observed stage distributionwas different from the predicted stable stage distribution(Figure 2; Chi-square test for the equality betweenobserved and predicted distributions, χ2 = 9.49, df = 4,P < 0.05). If the observed transition rates were constantin time, the proportion of adults in the whole populationwould decrease, while the proportion of seedlings andjuveniles would increase for the two species.
Elasticity analysis
Generally, in the two species, elasticities of λ for thesurvival rates were higher than for the growth andretrogression rates (Table 3). In E. macrocarpa, the highestelasticity was observed in the adult survival while in L.secundiflorum, it was observed in juvenile 1 survival. Thissuggests that the critical stage was the adult stage in E.macrocarpa and the juvenile 1 stage in L. secundiflorum.The elasticity of λ for fecundities was very low in the twospecies.
The decomposition of elasticities in F, G and L ledto 0.004, 0.084 and 0.911 for E. macrocarpa, and
0
100
200
300
400
500
600
700
Seedling Juvenile 1 Juvenile 2 Adult
Stages
Num
ber
of g
enet
s
OSD
PSSD
0
100
200
300
400
500
600
700
Seedling Juvenile 1 Juvenile 2 Adult
Stages
Num
ber
of g
enet
s
OSD
PSSD
a
b
Figure 2. Comparison of observed stage distribution (OSD) and predictedstable stage distribution (PSSD) for Eremospatha macrocarpa (a) andLaccosperma secundiflorum (b).
Table 3. Elasticity matrices for the four-stage average Eremospathamacrocarpa and Laccosperma secundiflorum matrix models (Table 2).
Seedling Juvenile 1 Juvenile 2 Adult
Eremospatha macrocarpaSeedling 0.043 0.001 0.000 0.004Juvenile 1 0.006 0.031 0.000 0.001Juvenile 2 0.000 0.005 0.110 0.068Adult 0.000 0.000 0.073 0.657
Laccosperma secundiflorumSeedling 0.223 0.014 0.000 0.011Juvenile 1 0.025 0.631 0.004 0.000Juvenile 2 0.000 0.015 0.027 0.000Adult 0.000 0.000 0.010 0.038
0.011, 0.051 and 0.939 for L. secundiflorum. Thisdecomposition was not significantly different between thetwo species (Kruskall–Wallis test, taking the three periodsas repetitions, model df = 1, respectively χ2 = 1.19,P = 0.26; χ2 = 0.05, P = 0.83; and χ2 = 0.05, P = 0.83).
Life-table response experiments (LTRE)
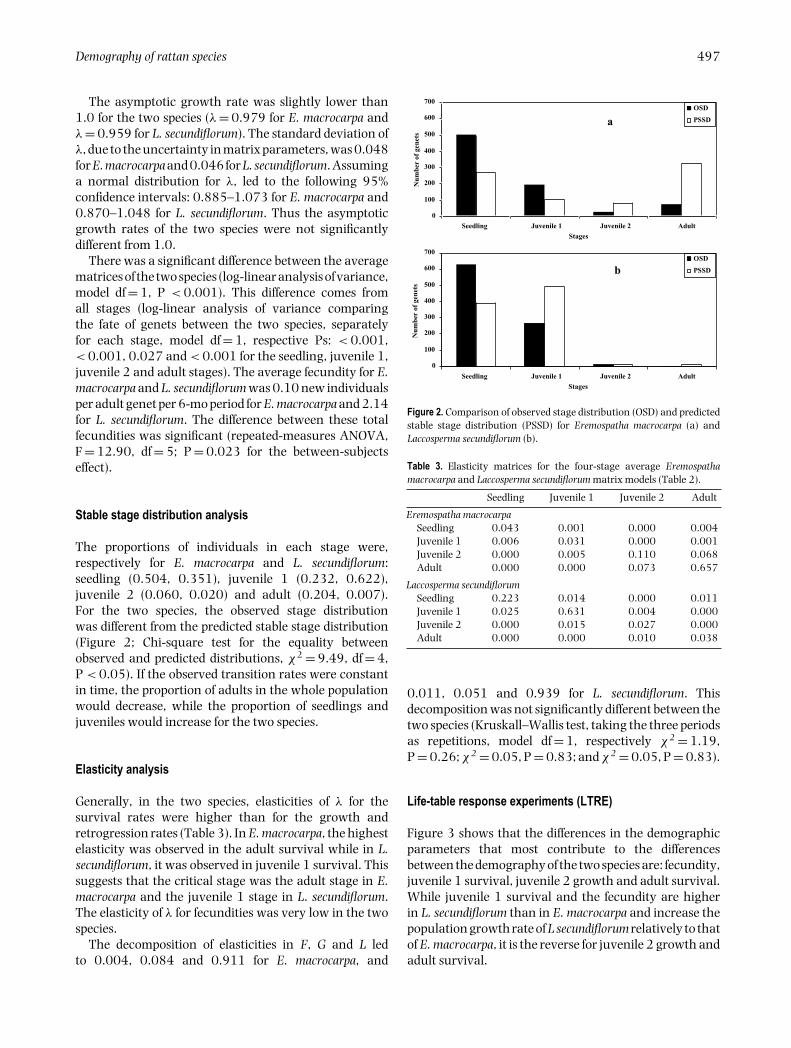
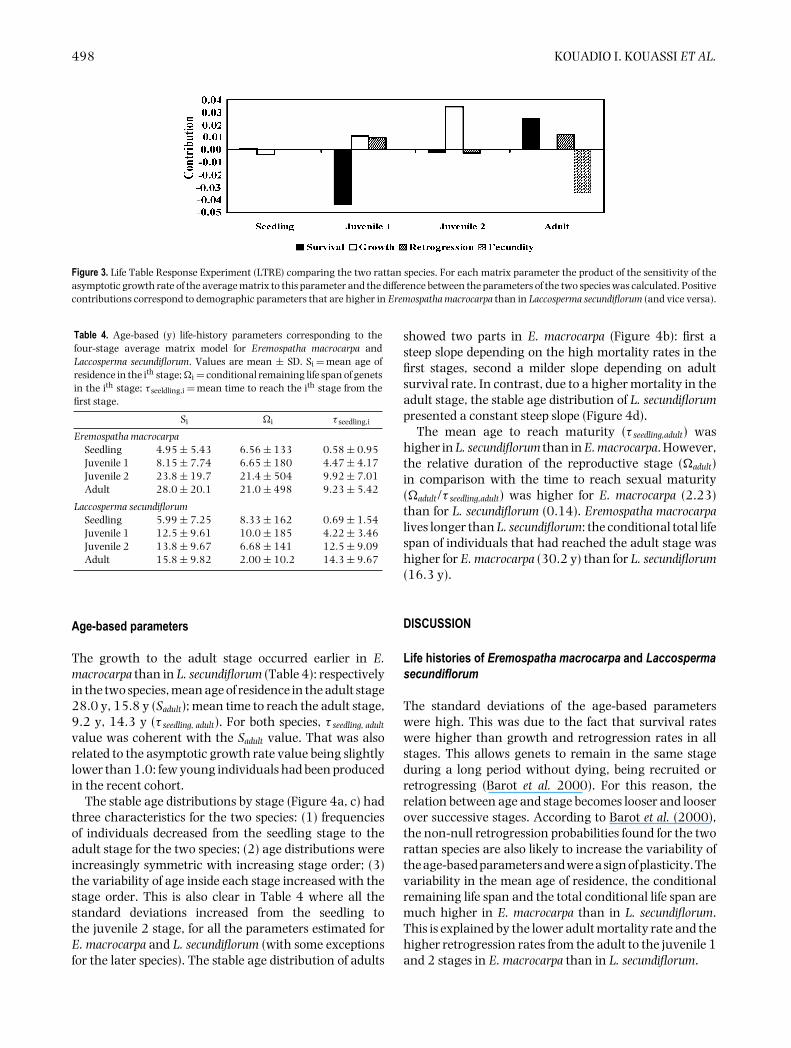
Figure 3 shows that the differences in the demographicparameters that most contribute to the differencesbetween the demography of the two species are: fecundity,juvenile 1 survival, juvenile 2 growth and adult survival.While juvenile 1 survival and the fecundity are higherin L. secundiflorum than in E. macrocarpa and increase thepopulation growth rate of L secundiflorum relatively to thatof E. macrocarpa, it is the reverse for juvenile 2 growth andadult survival.
498 KOUADIO I. KOUASSI ET AL.
Figure 3. Life Table Response Experiment (LTRE) comparing the two rattan species. For each matrix parameter the product of the sensitivity of theasymptotic growth rate of the average matrix to this parameter and the difference between the parameters of the two species was calculated. Positivecontributions correspond to demographic parameters that are higher in Eremospatha macrocarpa than in Laccosperma secundiflorum (and vice versa).
Table 4. Age-based (y) life-history parameters corresponding to thefour-stage average matrix model for Eremospatha macrocarpa andLaccosperma secundiflorum. Values are mean ± SD. Si = mean age ofresidence in the ith stage; �i = conditional remaining life span of genetsin the ith stage; τ seeldling,i = mean time to reach the ith stage from thefirst stage.
Si �i τ seedling,i
Eremospatha macrocarpaSeedling 4.95 ± 5.43 6.56 ± 133 0.58 ± 0.95Juvenile 1 8.15 ± 7.74 6.65 ± 180 4.47 ± 4.17Juvenile 2 23.8 ± 19.7 21.4 ± 504 9.92 ± 7.01Adult 28.0 ± 20.1 21.0 ± 498 9.23 ± 5.42
Laccosperma secundiflorumSeedling 5.99 ± 7.25 8.33 ± 162 0.69 ± 1.54Juvenile 1 12.5 ± 9.61 10.0 ± 185 4.22 ± 3.46Juvenile 2 13.8 ± 9.67 6.68 ± 141 12.5 ± 9.09Adult 15.8 ± 9.82 2.00 ± 10.2 14.3 ± 9.67
Age-based parameters
The growth to the adult stage occurred earlier in E.macrocarpa than in L. secundiflorum (Table 4): respectivelyin the two species, mean age of residence in the adult stage28.0 y, 15.8 y (Sadult); mean time to reach the adult stage,9.2 y, 14.3 y (τ seedling, adult). For both species, τ seedling, adult
value was coherent with the Sadult value. That was alsorelated to the asymptotic growth rate value being slightlylower than 1.0: few young individuals had been producedin the recent cohort.
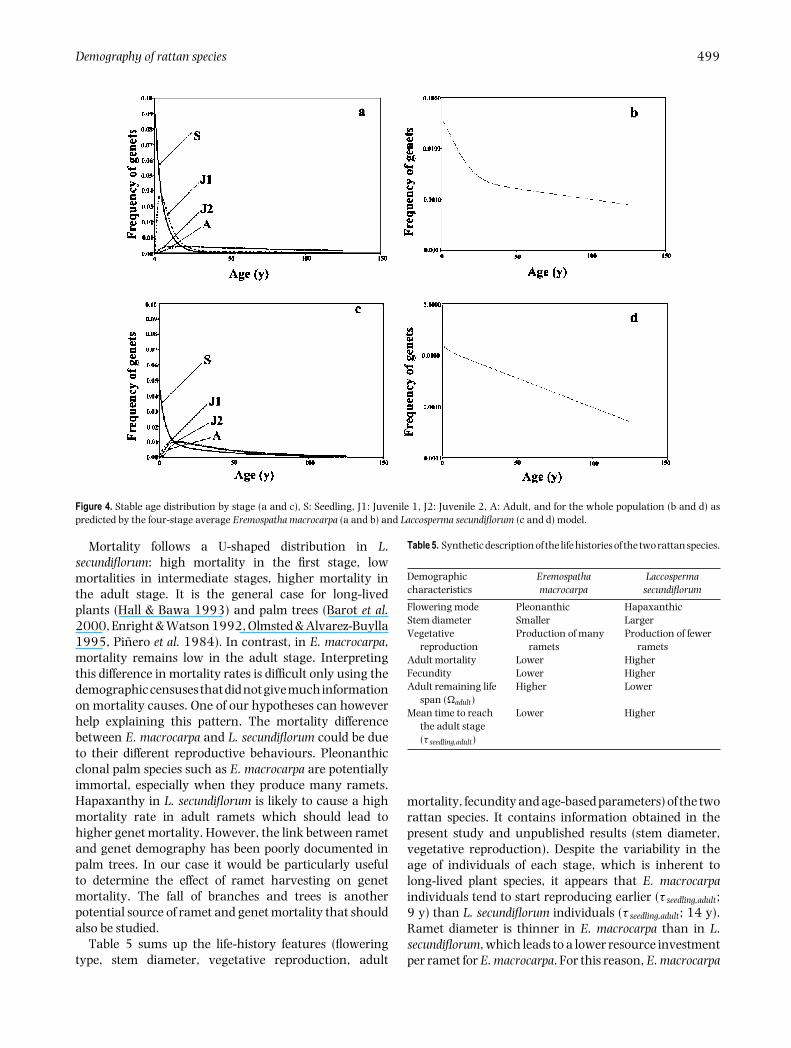
The stable age distributions by stage (Figure 4a, c) hadthree characteristics for the two species: (1) frequenciesof individuals decreased from the seedling stage to theadult stage for the two species; (2) age distributions wereincreasingly symmetric with increasing stage order; (3)the variability of age inside each stage increased with thestage order. This is also clear in Table 4 where all thestandard deviations increased from the seedling tothe juvenile 2 stage, for all the parameters estimated forE. macrocarpa and L. secundiflorum (with some exceptionsfor the later species). The stable age distribution of adults
showed two parts in E. macrocarpa (Figure 4b): first asteep slope depending on the high mortality rates in thefirst stages, second a milder slope depending on adultsurvival rate. In contrast, due to a higher mortality in theadult stage, the stable age distribution of L. secundiflorumpresented a constant steep slope (Figure 4d).
The mean age to reach maturity (τ seedling,adult) washigher in L. secundiflorum than in E. macrocarpa. However,the relative duration of the reproductive stage (�adult)in comparison with the time to reach sexual maturity(�adult/τ seedling,adult) was higher for E. macrocarpa (2.23)than for L. secundiflorum (0.14). Eremospatha macrocarpalives longer than L. secundiflorum: the conditional total lifespan of individuals that had reached the adult stage washigher for E. macrocarpa (30.2 y) than for L. secundiflorum(16.3 y).
DISCUSSION
Life histories of Eremospatha macrocarpa and Laccospermasecundiflorum
The standard deviations of the age-based parameterswere high. This was due to the fact that survival rateswere higher than growth and retrogression rates in allstages. This allows genets to remain in the same stageduring a long period without dying, being recruited orretrogressing (Barot et al. 2000). For this reason, therelation between age and stage becomes looser and looserover successive stages. According to Barot et al. (2000),the non-null retrogression probabilities found for the tworattan species are also likely to increase the variability ofthe age-based parameters and were a sign of plasticity. Thevariability in the mean age of residence, the conditionalremaining life span and the total conditional life span aremuch higher in E. macrocarpa than in L. secundiflorum.This is explained by the lower adult mortality rate and thehigher retrogression rates from the adult to the juvenile 1and 2 stages in E. macrocarpa than in L. secundiflorum.
Demography of rattan species 499
Figure 4. Stable age distribution by stage (a and c), S: Seedling, J1: Juvenile 1, J2: Juvenile 2, A: Adult, and for the whole population (b and d) aspredicted by the four-stage average Eremospatha macrocarpa (a and b) and Laccosperma secundiflorum (c and d) model.
Mortality follows a U-shaped distribution in L.secundiflorum: high mortality in the first stage, lowmortalities in intermediate stages, higher mortality inthe adult stage. It is the general case for long-livedplants (Hall & Bawa 1993) and palm trees (Barot et al.2000, Enright & Watson 1992, Olmsted & Alvarez-Buylla1995, Pinero et al. 1984). In contrast, in E. macrocarpa,mortality remains low in the adult stage. Interpretingthis difference in mortality rates is difficult only using thedemographic censuses that did not give much informationon mortality causes. One of our hypotheses can howeverhelp explaining this pattern. The mortality differencebetween E. macrocarpa and L. secundiflorum could be dueto their different reproductive behaviours. Pleonanthicclonal palm species such as E. macrocarpa are potentiallyimmortal, especially when they produce many ramets.Hapaxanthy in L. secundiflorum is likely to cause a highmortality rate in adult ramets which should lead tohigher genet mortality. However, the link between rametand genet demography has been poorly documented inpalm trees. In our case it would be particularly usefulto determine the effect of ramet harvesting on genetmortality. The fall of branches and trees is anotherpotential source of ramet and genet mortality that shouldalso be studied.
Table 5 sums up the life-history features (floweringtype, stem diameter, vegetative reproduction, adult
Table 5. Synthetic description of the life histories of the two rattan species.
Demographiccharacteristics
Eremospathamacrocarpa
Laccospermasecundiflorum
Flowering mode Pleonanthic HapaxanthicStem diameter Smaller LargerVegetative
reproductionProduction of many
rametsProduction of fewer
rametsAdult mortality Lower HigherFecundity Lower HigherAdult remaining life
span (�adult)Higher Lower
Mean time to reachthe adult stage(τ seedling,adult)
Lower Higher
mortality, fecundity and age-based parameters) of the tworattan species. It contains information obtained in thepresent study and unpublished results (stem diameter,vegetative reproduction). Despite the variability in theage of individuals of each stage, which is inherent tolong-lived plant species, it appears that E. macrocarpaindividuals tend to start reproducing earlier (τ seedling,adult;9 y) than L. secundiflorum individuals (τ seedling,adult; 14 y).Ramet diameter is thinner in E. macrocarpa than in L.secundiflorum, which leads to a lower resource investmentper ramet for E. macrocarpa. For this reason, E. macrocarpa
500 KOUADIO I. KOUASSI ET AL.
ramets probably grow quicker than L. secundiflorumramets. These results show that E. macrocarpa has a muchstronger potential for growth and vegetative reproductionthan L. secundiflorum. Consequently, our results alsosuggest the existence of a trade-off between the rametdiameter and the number of produced ramets.
There is a low fecundity by genet (as estimated bythe production of new offspring by sexual reproduction)for both E. macrocarpa and L. secundiflorum. However,this fecundity seems to be lower for E. macrocarpathan for L. secundiflorum. Our data thus suggest thatE. macrocarpa produces fewer seeds per genet (andramet) than L. secundiflorum. Consequently, since E.macrocarpa individuals produce more ramets than L.secundiflorum individuals, this suggests the existence ofa trade-off between sexual and vegetative reproduction.However, data on the production of seeds per adult andgermination rates would be needed to better characterizethe demographic strategies of the two species andto understand how E. macrocarpa can produce feweroffspring (ramets) per individual (tuft of ramets) than L.secundiflorum.
As hypothesized, our results (Table 5) clearly show thatthe two rattan species have different life histories. Thehigher adult mortality and the lower adult remaininglife span in L. secundiflorum are probably linked tohapaxanthy. It is more difficult to interpret the wholepattern of differences between the life histories of thetwo species and to link this pattern to the two floweringtypes. This is due to the fact that individuals mustdistribute their resource among at least three functions(maintenance, reproduction and growth) and that thereare many potential combinations. However, trade-offsbetween and within these functions are likely to limit thenumber of possible combinations of resource allocation.Here, our results suggest the existence of two trade-offs within reproduction: between vegetative and sexualreproductions and between the diameter of offspring (byvegetative reproduction) and the number of offspring.More generally, pleonanthy and hapaxanthy should haveevolved in relation with the other life-history features.This might have led to distinct demographic syndromes.Whether pleonanthic and hapaxanthic palms tend tohave the same demographic syndromes as E. macrocarpaand L. secundiflorum (lower potential for vegetativereproduction and higher production of offspring throughsexual reproduction in hapaxanthic species than inpleonanthic species) remains an open issue.
Demography of Eremospatha macrocarpa and Laccospermasecundiflorum
The matrix model approach used here has been appliedearlier to describe the dynamics of many palm species
(Barot et al. 2000, Bernal 1998, Bullock 1980, De Steven1986, 1989; Escalante et al. 2004, Pinero et al. 1984,Rodriguez-Buritica et al. 2005, Souza & Martins 2006).In general, the value of λ obtained for the studied specieswas close to 1.0, likely because the environment of thesestudies was not much disturbed by human activities ornatural ecosystem dynamics. In the case of the studiedpopulations of E. macrocarpa and L. secundiflorum, inspite of the exploitation of the ramets of the two species,the estimated λ values were not significantly differentfrom 1.0. This suggests that exploitation by local humanpopulation does not threaten these rattan populations.This also shows that the populations of the two speciesachieve comparable growth rate despite clear differencesin their life histories. However, the uncertainty on λ washigher and the estimated λ was lower for L. secundiflorumthan for E. macrocarpa. This was due to a lower numberof adult palms (Table 1) and to a higher mortality rate injuvenile 2 and adults (respectively 0.119 and 0.250) forL. secundiflorum than for E. macrocarpa.
The difference between the predicted stable stagedistributions and the observed stage distributions suggeststhat the demographic parameters included in the matriceshave changed in the recent past because of some changesin environmental conditions, driven or not by humanactivities such as harvesting. Our evaluation of thedemographic parameters was carried out over an 18-mo period. Because transition probabilities (survival,growth and retrogression) and fecundity are likely tovary in time much more quickly than stage distributions,estimating these parameters over a longer period couldlead to more accurate stable stage distributions and to abetter correspondence between the observed distributionsand the predicted stable distributions (Enright & Ogden1979). Our matrix models explain the different populationstructures observed and predicted respectively for E.macrocarpa and L. secundiflorum (Figure 2): for E.macrocarpa there are more adults than juveniles 2. Thiscan be explained by the higher adult survival observedfor E. macrocarpa than for L. secundiflorum, which couldallow the accumulation of individuals in the adult stage inE. macrocarpa.
Elasticity results follow the general pattern found inLefkovitch matrices: the asymptotic growth rate wasmore sensitive to survival rates than to growth rates andelasticities to fecundities were very small (Caswell 2001,De Matos & Matos 1998). The very large contributionsof survival rates to the elasticity matrices found forE. macrocarpa and L. secundiflorum is typical of long-livedspecies (Silvertown et al. 1993, 1996). Since elasticitiesmeasure the relative influence of the demographicparameters on the population growth, conservationmeasures should concentrate on the demographicparameters with high elasticities (Caswell 1996b, Menges1990). We obtained the highest elasticities for adult
Demography of rattan species 501
survival in E. macrocarpa and for juvenile 1 survivalin L. secundiflorum. This suggests that conservationpractices, or practices aimed at a sustainable and moreproductive exploitation of these natural populations (thusapproaching a kind of in situ cultivation) should focuson these demographic parameters. The high elasticityfor adult survival in E. macrocarpa suggests that thisspecies is more sensitive than L. secundiflorum to theexploitation of adult ramets, at least if this exploitationincreases genet (individual) mortality. The high elasticityobtained for juvenile 1 survival in L. secundiflorumsuggests that protecting juvenile 1 would be an efficientway to protect the L. secundiflorum population or toallow an intensification of the exploitation of adultramets. The difference in the critical stage of the tworattan species could probably be explained by the loweradult retrogression rate for L. secundiflorum than forE. macrocarpa and a lower adult mortality rate forE. macrocarpa compared to L. secundiflorum.
The LTRE analysis gives complementary information.It confirms the importance of juvenile 1 survival forL. secundiflorum but shows that demographic parameters,such as fecundity, that are not very influential for theasymptotic growth rate may determine the differencebetween the demography of the two rattan species. TheLTRE analysis also suggests that the two species achieverelatively similar asymptotic growth rate (neither issignificantly different from 1) with different combinationsof demographic parameters: L. secundiflorum through ahigher juvenile 1 survival and fecundity, E. macrocarpathrough a higher juvenile 2 growth and adult survival.This also shows that, while the asymptotic growth ratesare mostly sensitive to survival rates, the fecundity andgrowth rates must be taken into account to explain thedifferences between the demography of the two species.Taken together, the differences between the elasticitypatterns of the two species and the LTRE results are due todifferences in their demographic parameters and confirmthe hypothesis that the two rattan species have distinctdemographic features. This in turn reflects the fact theyhave different life histories. The description of these lifehistories suggests the existence of two trade-offs withinreproduction. These trade-offs and probably other onesbetween survival and reproduction would explain that,although the two species have different life histories, thegrowth rates of their populations are not significantlydifferent from 1.
Comparison with other clonal palm species and lianas
Elasticity patterns found in this study are similar tothose obtained for other clonal palm species (Bullock1980, Escalante et al. 2004, Rodriguez-Buritica et al.2005, Souza & Martins 2006), a clonal liana (Nabe-
Nielsen 2004) and, more generally, to other long-livedperennial plant species (Silvertown et al. 1993). Thehigh elasticity for stasis of large plants and the lowelasticities for sexual reproduction and growth are typicalfor woody polycarpic plants (Caswell 2001, Silvertownet al. 1993). The high total elasticity of stasis for E.macrocarpa and L. secundiflorum is comparable with that oflong-lived tropical trees (Alvarez-Buylla et al. 1996). Theelasticity pattern and high longevities suggest that bothclonal climbing palms and clonal lianas (Bullock 1980,Escalante et al. 2004, Nabe-Nielsen 2004, Rodriguez-Buritica et al. 2005, Souza & Martins 2006) achieve,through clonality and the production of many shorter-lived ramets, the same type of life-cycle as long-livedperennials such as the trees among which they areliving.
Conclusion
The present study has allowed the description of thedemography of two rattan species. Our results suggestthat the two studied populations are not threatened bythe exploitation of ramets by local human populationsbut that E. macrocarpa should be more sensitive to thisexploitation. However, to better understand the effectof the exploitation of adult ramets on the demographyof the two rattan species more data are needed. First,the production of seeds and their germination rateshould be assessed for the two species. This wouldallow incorporating the seed stage into the model andassess the influence of seed production, seed survivaland germination on the two species growth rates.This is important, as manipulating seeds would bean easy way to enhance the demography of thetwo palms and increase the sustainability of rametexploitation. Second, determining the effect of rametnatural mortality and exploitation on genet mortalityand further ramet production is essential to designoptimal harvesting strategies (percentage and frequencyof ramet harvesting). More generally, such data linkingthe demography of ramets and genets in long-lived clonalplants is so far very sparse and should allow us to betterunderstand the role of clonality in the demography ofperennial plants.
ACKNOWLEDGEMENTS
The work would not have been possible without theassistance and encouragement of many individualsworking at the LEST in Bondy (Kam-Rigne Laossi, DianaNoguera, Simon Boudsocq). The training course of K. I.Kouassi in France was supported by DSF-IRD.
502 KOUADIO I. KOUASSI ET AL.
LITERATURE CITED
ALVAREZ-BUYLLA, E. R., GARCIA-BARRIOS, R., LARA-MORENCO, C.
& MARTINEZ-RAMOS, M. 1996. Demographic and genetic models
in conservation biology: applications and perspectives for tropical
rain forest tree species. Annual Reviews of Ecology and Systematics
27:387–421.
ANDERSON, P. J. & PUTZ, F. E. 2002. Harvesting and conservation:
are both possible for the palm, Iriartea deltoidea? Forest Ecology and
Management 170:271–283.
BALICK, M. J. 1987. The economic utilization of the Babassu palm: a
conservation strategy for sustaining tropical resources. Journal of the
Washington Academy of Science 77:215–223.
BAROT, S. & GIGNOUX, J. 1999. Population structure and life cycle of
Borassus aethiopum Mart.: evidence of early senescence in a palm tree.
Biotropica 31:439–448.
BAROT, S., GIGNOUX, J., LEGENDRE, S. & VUATTOUX, R. 2000.
Demography of a savanna palm tree in Ivory Coast (Lamto):
population persistence, and life history. Journal of Tropical Ecology
16:637–655.
BAROT, S., GIGNOUX, J. & LEGENDRE, S. 2002. Stage-structured matrix
models and age estimates. Oikos 96:56–61.
BEGON, M., TOWNSEND, C. R. & HARPER, J. L. 2006. Ecology. Blackwell
Scientific Publications, Oxford. 738 pp.
BERNAL, R. 1998. Demography of the vegetable ivory palm Phytelephas
seemannii in Colombia, and the impact of seed harvesting. Journal of
Applied Ecology 35:64–74.
BULLOCK, S. H. 1980. Demography of an undergrowth palm in littoral
Cameroon. Biotropica 12:247–255.
CASWELL, H. 1996a. Analysis of Life Table Response Experiments II.
Alternative parameterizations for size- and stage-structured models.
Ecological Modelling 88:73–82.
CASWELL, H. 1996b. Second derivatives of population growth rate:
calculation and applications. Ecology 77:870–879.
CASWELL, H. 2001. Matrix population models: construction, analysis, and
interpretation. Sinauer Associates, Inc., Sunderland. 722 pp.
CHAZDON, R. L. 1992. Patterns of growth and reproduction of Geonoma
congesta, a clustered understory palm. Biotropica 24:43–51.
COCHRAN, M. E. & ELLNER, S. 1992. Simple methods for calculating
age-based life history parameters for stage-structured populations.
Ecological Monographs 62:345–364.
DE KROON, H., VAN GROENENDAEL, J. & EHRLEN, J. 2000. Elasticities:
a review of methods and model limitations. Ecology 81:607–618.
DE MATOS, M. B. & MATOS, D. M. S. 1998. Mathematical contraints on
transition matrix elasticity analysis. Journal of Ecology 86:706–708.
DE STEVEN, D. 1986. Comparative demography of a clonal palm
(Oenocarpus mapora subsp. mapora) in Panama. Principes 30:100–
104.
DE STEVEN, D. 1989. Genet and ramet demography of Oenocarpus
mapora ssp. mapora, a clonal palm of Panamian tropical moist forest.
Journal of Ecology 77:579–596.
ENDRESS, B. A., GORCHOV, D. L., PETERSON, M. B. & SERRANO,
E. P. 2004. Harvest of the palm Chamaedorea radicalis, its effects
on leaf production, and implications for sustainable management.
Conservation Biology 18:822–830.
ENRIGHT, N. & OGDEN, J. 1979. Applications of transition matrix
models in forest dynamics: Araucaria in Papua New Guinea and
Nothofagus in New Zealand. Australian Journal of Ecology 4:3–23.
ENRIGHT, N. J. & WATSON, A. D. 1992. Population dynamics of the
nikau palm, Rhopalostylis sapida (Wendl. et Drude), in a temperate
forest remnant near Auckland, New Zealand. New Zealand Journal of
Botany 30:29–43.
ESCALANTE, S., MONTANA, C. & ORELLANA, R. 2004. Demography
and potential extractive use of the liana palm, Desmoncus orthacanthos
Martius (Arecaceae), in southern Quintana Roo, Mexico. Forest
Ecology and Management 187:3–18.
HALL, P. & BAWA, K. 1993. Methods to assess the impact of extraction
of non-timber tropical forest products on plant populations. Economic
Botany 47:234–247.
LEGENDRE, S. & CLOBERT, J. 1995. ULM, a software for conservation
and evolutionary biologists. Journal of Applied Statistics 22:817–
834.
MENGES, E. S. 1990. Population viability analysis for an endangered
plant. Conservation Biology 4:52–62.
NABE-NIELSEN, J. 2004. Demography of Machaerium cuspidatum, a
shade-tolerant neotropical liana. Journal of Tropical Ecology 20:505–
516.
OLMSTED, I. & ALVAREZ-BUYLLA, E. R. 1995. Sustainable harvesting
of tropical trees: demography and matrix models of two palm species
in Mexico. Ecological Applications 5:484–500.
PINERO, D., MARTINEZ-RAMOS, M. & SARUKHAN, J. 1984. A
population model of Astrocaryum mexicanum and a sensitivity
analysis of its finite rate of increase. Journal of Ecology 72:977–
991.
RAMULA, S. & LEHTILA, K. 2005. Matrix dimensionality in
demographic analyses of plants: when to use smaller matrices? Oikos
111:563–573.
RATSIRARSON, J., SILANDER, J. A. & RICHARD, A. F. 1996.
Conservation and management of a threateaned Madagascar palm
species, Neodypsis decaryi, Jumelle. Conservation Biology 10:40–52.
RODRIGUEZ-BURITICA, S., ORJUELA, M. A. & GALEANO, G. 2005.
Demography and life history of Geonoma orbignyana: an understory
palm used as foliage in Colombia. Forest Ecology and Management
211:329–340.
SILVA MATOS, D. M. S., FRECKLETON, R. P. & WATKINSON, A. R.
1999. The role of density dependence in the population dynamics of
a tropical palm. Ecology 80:2635–2650.
SILVERTOWN, J., FRANCO, M. & MCCONWAY, K. 1992. A
demographic interpretation of Grime’s triangle. Functional Ecology
6:130–136.
SILVERTOWN, J., FRANCO, M., PISANTY, I. & MENDOZA, A. 1993.
Comparative plant demography – relative importance of life-cycle
components to the finite rate of increase in woody and herbaceous
perennials. Journal of Ecology 81:465–476.
SILVERTOWN, J., FRANCO, M. & MENGES, E. S. 1996. Interpretation of
elasticity matrices as an aid to the management of plant populations
for conservation. Conservation Biology 10:591–597.
SOUZA, A. F. & MARTINS, F. R. 2006. Demography of the clonal palm
Geonoma brevispatha in a neotropical swamp forest. Austral Ecology
31:869–881.

Demography of rattan species 503
STEARNS, S. 1977. The evolution of life history traits: a critique of
the theory and a review of the data. Annual Review of Ecology and
Systematics 8:145–171.
STEARNS, S. C. & HOEKSTRA, R. F. 2000. Evolution: an introduction.
Oxford University Press. 381 pp.
SUNDERLAND, T. C. H. 2002. Hapaxanthy and pleonanthy in African
rattans (Palmae: Calamoideae). Journal of Bamboo and Rattan 1:131–
139.
SUNDERLAND, T. C. H. 2007. Field guide to the rattan palms of Africa.
Kew Publishing, Royal Botanic Gardens, Kew. 66 pp.
TOMLINSON, P. B. & JEFFREY, E. C. 1990. The structural biology of palms.
Clarendon Press, Oxford. 477 pp.
VALVERDE, T. & SILVERTOWN, J. 1998. Variation in the demography
of woodland understorey herb (Primula vulgaris) along the forest
regeneration cycle: projection matrix analysis. Journal of Ecology
86:545–562.
ZORO BI, I. A. & KOUASSI, K. I. 2004. Rattan abund-
ance and collection in N’zodji forest (South Eastern Cote
d’Ivoire). Revue Ivoirienne des Sciences et Technologie 5:185–
197.
Copyright © 2022 FDOKUMEN