THE INFLUENCE OF RELATIONAL DEMOGRAPHY ON PANEL INTERVIEW RATINGS: A FIELD EXPERIMENT
21
PERSONNEL PSYCHOLOGY 2007, 60, 627–646 THE INFLUENCE OF RELATIONAL DEMOGRAPHY ON PANEL INTERVIEW RATINGS: A FIELD EXPERIMENT M. RONALD BUCKLEY University of Oklahoma KATHERINE A. JACKSON Auburn University at Montgomery MARK C. BOLINO University of Oklahoma JOHN G. VERES III Auburn University at Montgomery HUBERT S. FEILD Auburn University The influence of relational demography (assessor race, candidate race, and the racial composition of rating panels) was examined in a structured interview setting. Twenty assessors (10 White and 10 Black) compris- ing five, 4-person panels of all possible racial compositions, evaluated videotaped responses of police officers participating in a promotion pro- cess. Each panel rated the same 73 (36 White and 37 Black) candidates’ responses to a complex, structured interview question. An examination of mean overall ratings revealed a same race bias and a significant dif- ference between panels based upon the relational demography of the interview panel; nevertheless, the size of these effects was small. Net reconciliation (i.e., between initial and final scores) differed significantly between minority and majority panel conditions for only Black assessors and, again, the effects here were very small. The practical implications of these findings are discussed. Employment interviews are one of the most frequently used methods of selection in both private and public sector organizations. Although the va- lidity of some interviewing practices has been questioned, panel or board interviews are often recommended for selecting personnel (e.g., Arvey & Campion, 1982; Campion, Pursell, & Brown, 1988; Dixon, Wang, Calvin, Dineen, & Tomlinson, 2002; Roth & Campion, 1992; Wiesner & Cronshaw, 1988). Although prior research has addressed the effects of demographic variables in employment interviews (see Cesare, 1996 and Correspondence and requests for reprints should be addressed to M. Ronald Buckley, University of Oklahoma, Division of Management, Norman, OK 73019-0450; mbuckley@ ou.edu. COPYRIGHT C 2007 BLACKWELL PUBLISHING, INC. 627
-
Upload
independent -
Category
Documents
-
view
2 -
download
0
Transcript of THE INFLUENCE OF RELATIONAL DEMOGRAPHY ON PANEL INTERVIEW RATINGS: A FIELD EXPERIMENT
PERSONNEL PSYCHOLOGY
2007, 60, 627–646
THE INFLUENCE OF RELATIONAL DEMOGRAPHYON PANEL INTERVIEW RATINGS:A FIELD EXPERIMENT
M. RONALD BUCKLEYUniversity of Oklahoma
KATHERINE A. JACKSONAuburn University at Montgomery
MARK C. BOLINOUniversity of Oklahoma
JOHN G. VERES IIIAuburn University at Montgomery
HUBERT S. FEILDAuburn University
The influence of relational demography (assessor race, candidate race,and the racial composition of rating panels) was examined in a structuredinterview setting. Twenty assessors (10 White and 10 Black) compris-ing five, 4-person panels of all possible racial compositions, evaluatedvideotaped responses of police officers participating in a promotion pro-cess. Each panel rated the same 73 (36 White and 37 Black) candidates’responses to a complex, structured interview question. An examinationof mean overall ratings revealed a same race bias and a significant dif-ference between panels based upon the relational demography of theinterview panel; nevertheless, the size of these effects was small. Netreconciliation (i.e., between initial and final scores) differed significantlybetween minority and majority panel conditions for only Black assessorsand, again, the effects here were very small. The practical implicationsof these findings are discussed.
Employment interviews are one of the most frequently used methods ofselection in both private and public sector organizations. Although the va-lidity of some interviewing practices has been questioned, panel or boardinterviews are often recommended for selecting personnel (e.g., Arvey& Campion, 1982; Campion, Pursell, & Brown, 1988; Dixon, Wang,Calvin, Dineen, & Tomlinson, 2002; Roth & Campion, 1992; Wiesner& Cronshaw, 1988). Although prior research has addressed the effects ofdemographic variables in employment interviews (see Cesare, 1996 and
Correspondence and requests for reprints should be addressed to M. Ronald Buckley,University of Oklahoma, Division of Management, Norman, OK 73019-0450; [email protected].
COPYRIGHT C© 2007 BLACKWELL PUBLISHING, INC.
627
628 PERSONNEL PSYCHOLOGY
Harris, 1989 for reviews), these investigations have typically examined oneor more demographic variables (e.g., race, gender, age) of the interviewerand/or interviewee to see how they may influence the outcome of the in-terview, and unstructured and single interviewer conditions have been theprimary conditions for these studies. Nevertheless, demographic variablesmay play an important, yet different, role in the outcome of other types ofinterviews such as structured and panel interviews. For instance, with mul-tiple interviewers involved, it is more likely for someone serving on the in-terview panel to be prejudiced; in a group setting, self-presentation motivesand conformity pressures are more likely, too (Asch, 1956; Jones, 1964).
Only a few studies, though, have systematically investigated theseareas. In a field study of an interview for a custodial position, Lin, Dobbins,and Farh (1992) demonstrated that less same-race bias was evidenced wheninterview panels were composed of more than one race. They suggestedthat as a matter of “check and balance of the evaluation process” panelsshould include at least one “different-race interviewer” (Lin et al., 1992,p. 369). But, the Lin et al. study used only two-person panels. Specifically,the racial composition of the panel was either (a) same as the interviewee,(b) different from the interviewee, or (c) balanced (one interviewer ofthe same race, one interviewer of another race). Therefore, the Lin et al.findings may not generalize to those situations that use an interview boardof three or more interviewers.
Prewett-Livingston, Feild, Veres, and Lewis (1996) extended the Linet al. (1992) study through the use of four-person panels (of various racialcompositions) in selection interviews for law enforcement positions. Thefield setting and ethical obligation to make the selection process as fair aspossible, however, prevented the use of all-White or all-Black interviewpanels. In addition, in the Prewett-Livingston et al. study, each panel in-terviewed different candidates, which introduces another potential sourceof variability. For this reason, then, Dixon et al. (2002, p. 419) argued thatracial dynamics in the context of panel interviews is an area that “deservesmore research attention.”
Recently, McFarland, Ryan, Sacco, and Kriska (2004) examined theeffects of applicant race, rater race, and panel composition in the context ofthree-person interviewer panels. Their findings suggested that panels thatwere predominantly White provided significantly more favorable ratingsto applicants of all races compared to panels composed largely of Blackraters. Further, they found that Black raters gave higher ratings to Blackapplicants (than they did to White applicants) only when they were on apredominantly Black panel. Moreover, although their study had a numberof strengths, they were unable to create panels that were balanced withregard to race because all of their panels were composed of three raters,and the panels did not evaluate the same candidates.
M. RONALD BUCKLEY ET AL. 629
This study also examines the effect of racial composition of interviewpanels on the ratings of candidates. This research builds upon previouswork in this area by (a) allowing for complete manipulation of racialcomposition of four-person interview panels using a structured interviewformat and (b) obtaining ratings from each of the five panel compositionconditions on the same stimuli (i.e., videotaped interviewee responses).Therefore, although prior work has shown that racial composition of in-terview panels does affect the ratings an interviewee receives, this studyallows for a broader examination of the impact of fellow assessors’ raceand candidate’s race on individual assessor evaluations in the context ofpanel interviews under more controlled conditions.
One strength of this research over laboratory studies was that the video-taped interviews were actual promotion interviews, where the intervieweeswere seeking a promotion and where the raters were employees rather thanstudents. Because the ratings of interview panels in this study were notactually used to make promotion decisions, constructing interview pan-els that were racially unbalanced was possible, thereby allowing a morethorough examination of the dynamics of interview panel ratings. Further-more, obtaining evaluations from each of the five rating panels (varyingcompositions) on the same exact stimuli rules out the possibility that anydifferences seen in evaluations are due to differences in the performanceof candidates. All differences in evaluations can, therefore, be attributedto panel differences.
Theory
Researchers have suggested that similarity-attraction theory (Byrne,1961) may explain why interviewers might give more favorable evalua-tions to interviewees who are the same race as themselves. In practice,though, the empirical results have often been inconsistent. For exam-ple, Lin et al. (1992) demonstrated support for a similar-to-me effect,whereas the findings of Prewett-Livingston et al. (1996) and McFarlandet al. (2004) showed support for the phenomenon only in some conditions.Social identity theory (Turner, 1984) also suggests that individuals tendto favor members of “their own” group. In the context of performanceappraisals, studies have found very small race effects (Kraiger & Ford,1985; Mount, Sytsma, Hazucha, & Holt, 1997) that are consistent withsimilarity-attraction and social identity theories. It is hypothesized, then,that interviewers will rate same-race interviewees more favorably than in-terviewees of a different race. Likewise, it is expected that White panelswill tend to favor White candidates and that Black panels will tend to favorBlack candidates.

630 PERSONNEL PSYCHOLOGY
Hypothesis 1: Mean candidate interview scores will differ as a jointfunction of the race of the candidate and the race of theinterviewer, with assessors giving more favorable ratingsto candidates of the same race (as the assessor) than tocandidates of a race different from the assessor.
Hypothesis 2: Mean candidate interview scores will differ as a func-tion of the racial composition of the interview panel,with same-race panels giving more favorable ratings tocandidates of the same race (as the panel members) thanto candidates of a race different from the panel members.
An interview panelist might be influenced not only by the characteris-tics of the candidate and the candidate’s behavior but also by the presenceof other interviewers (Dipboye, Gaugler, Hayes, & Parker, 2001; Pulakos,Schmitt, Whitney, & Smith, 1996). The influence of the other interviewerscould be direct (e.g., persuasion to reconcile ratings) or indirect (e.g., self-imposed pressure to appear fair). Based on the notion that people oftenadjust their behavior to influence other individuals’ perceptions of them(Jones, 1964), an interviewer could, in fact, bias or change ratings to influ-ence the way he or she (i.e., the interviewer) is perceived by others (e.g.,another interviewer, the interviewee). Likewise, there are internal and ex-ternal motives for individuals to avoid prejudice (Plant & Devine, 1998).Furthermore, the pressure to avoid the appearance of racial bias should begreater for an assessor who is a racial minority on an interview panel thanfor an assessor on a racially balanced, racial-majority, or same-race panel.That is, it is anticipated that when rating a Black candidate, for example, aWhite interviewer will be less likely to favorably bias ratings to avoid theappearance of bias when participating on an all-White panel than whenparticipating on a four-person panel with three Black interviewers.
In this study, an initial rating was made by each assessor, followed by agroup discussion, and then another independent rating. Therefore, ratingswere made public following the first independent ratings and then againfollowing the discussion and assignment of final ratings. Given that thereare two different points at which the “behavior” (i.e., rating in this case)will be known, a self-presentation bias could occur at two points. Assessorswho are a racial minority on their panel may, in anticipation of makingtheir ratings public, assign opposite race candidates higher initial ratings inan effort to appear racially unbiased to their fellow panel members (Plant& Devine, 1998). An effort to appear unbiased, nevertheless, could alsobe demonstrated after assigning initial ratings, during assessor discussion,prior to assigning final ratings. Indeed, conformity pressures could comeinto play more during the post-rating discussion and assignment of finalratings, which are made public.
M. RONALD BUCKLEY ET AL. 631
A situation in which an interviewer is on an assessor panel with threeinterviewers of a race different from his or her race would logically resultin greater social pressure to conform to the group’s ratings during the finalrating period than would a situation in which the interviewer is on anassessor panel with three interviewers of the same race as that interviewer(Plant & Devine, 1998). Moreover, regardless of the point at which self-presentation occurs, this should tend to occur when panel-race minoritiesare rating different-race candidates. In other words, it is expected that themean ratings given to a Black candidate by a White assessor serving on apanel with three Black assessors will be greater than the mean rating givento a Black candidate by a White assessor serving on a panel with at leastone other White assessor.
Hypothesis 3: The mean difference between initial and final ratingswill be greater for assessors who are a racial minorityon an interview panel than for assessors who are a racialmajority on their panel.
Hypothesis 4: When rating candidates of a different race, mean ratingsof candidates will be greater for assessors who are serv-ing as a racial minority on a panel than for assessors whoare serving on a panel with at least one assessor of thesame race as that assessor.
Method
Participants
The assessors consisted of 19 male law enforcement officers from 10law enforcement agencies and one male human resources specialist withexperience in the testing and assessment of law enforcement officials. Tenof the assessors were Black, and 10 were White.
Assessor panel composition. On each of the 3 days of the study, eachof the 20 assessors was assigned by race, using a random number generator,to one of five interview panels; therefore, each assessor participated onthree panels, one for each of the 3 days. The five panels included (a) a panelof four White assessors (all White or WWWW), (b) a panel of three Whiteassessors and one Black assessor (majority White or BWWW), (c) a panelof two White assessors and two Black assessors (balanced or BBWW),(d) a panel of three Black assessors and one White assessor (majorityBlack or BBBW), and (e) a panel of four Black assessors (all Black orBBBB).
632 PERSONNEL PSYCHOLOGY
Candidate pool. The candidate pool for this study consisted of 73 of-ficers of a southeastern law enforcement agency. All candidates were men.Thirty-seven Black candidates and 36 White candidates were evaluated inthis study. An evaluation was made of videotaped responses to a structuredinterview question designed to assess five performance dimensions: oralcommunication (e.g., ability to listen to all points of view, ability to expressoneself effectively to other individuals), problem analysis (e.g., ability toidentify problems, secure relevant information, and establish priorities),technical and departmental knowledge (e.g., understanding of procedures,rules, and regulations in planning work, giving advice, and responding tosituations), supervisory ability (e.g., ability to provide subordinates withdirections and guidance, ability to recognize problem behavior), and man-agement ability (e.g., ability to plan, organize, coordinate, and allocateresources).
Measure
In this study, assessors rated videotaped responses of candidate inter-views. In the actual promotion process from which these taped interviewswere acquired, the candidates responded to four interview questions. But,because of the limited time available for the panels configured specifi-cally for this study to score the ratings and to maximize the number ofcandidates assessed by the panels, we had to reduce the amount of ma-terial evaluated. Therefore, we distributed to the assessment panels thecandidates’ videotaped responses to only one of the situational interviewquestions. The interview question was developed based on a content va-lidity model and was designed to measure many knowledges, skills, andabilities (KSAs), grouped into performance dimensions, derived from ajob analysis. The question chosen had shown in the actual promotion pro-cess fewer racial differences between the candidates than had the otherthree questions (i.e., there were no significant differences between Blackcandidates’ performances and that of Whites on the chosen question).
The level of structure of the situational interview used in this study wasStructure IV based on the classification system proposed by Huffcutt andArthur (1994). This level of structure is characterized by standardizationof questions (Level 4) and response-scoring (Level 3). This Structure IVclass is defined as an interview that asks “the exact same questions with nochoice or follow-up” and evaluates “each individual response according topre-established answers” (Huffcutt & Arthur, 1994, p. 187). The questionused in this research is presented below:
You are a recently promoted sergeant. Today is Tuesday 1530 hours.The dispatcher informs you of an armed robbery in progress at a local
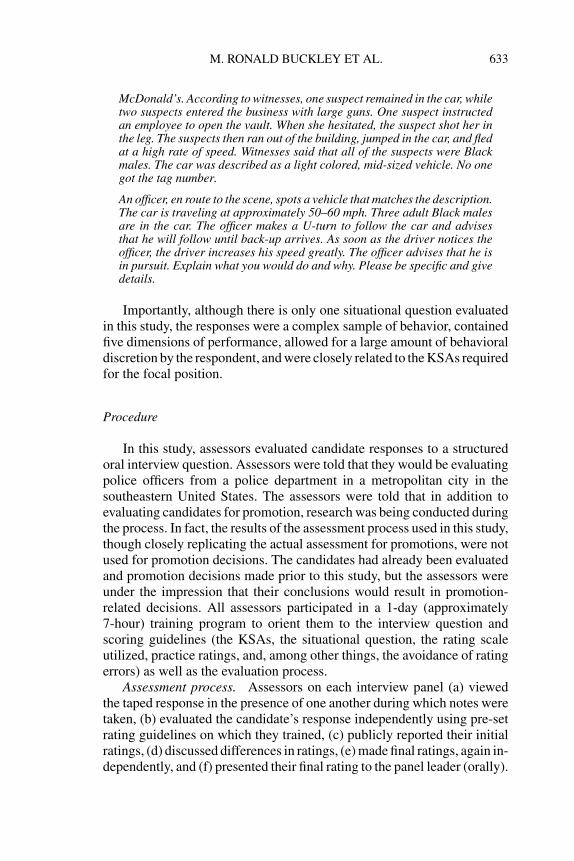
M. RONALD BUCKLEY ET AL. 633
McDonald’s. According to witnesses, one suspect remained in the car, whiletwo suspects entered the business with large guns. One suspect instructedan employee to open the vault. When she hesitated, the suspect shot her inthe leg. The suspects then ran out of the building, jumped in the car, and fledat a high rate of speed. Witnesses said that all of the suspects were Blackmales. The car was described as a light colored, mid-sized vehicle. No onegot the tag number.
An officer, en route to the scene, spots a vehicle that matches the description.The car is traveling at approximately 50–60 mph. Three adult Black malesare in the car. The officer makes a U-turn to follow the car and advisesthat he will follow until back-up arrives. As soon as the driver notices theofficer, the driver increases his speed greatly. The officer advises that he isin pursuit. Explain what you would do and why. Please be specific and givedetails.
Importantly, although there is only one situational question evaluatedin this study, the responses were a complex sample of behavior, containedfive dimensions of performance, allowed for a large amount of behavioraldiscretion by the respondent, and were closely related to the KSAs requiredfor the focal position.
Procedure
In this study, assessors evaluated candidate responses to a structuredoral interview question. Assessors were told that they would be evaluatingpolice officers from a police department in a metropolitan city in thesoutheastern United States. The assessors were told that in addition toevaluating candidates for promotion, research was being conducted duringthe process. In fact, the results of the assessment process used in this study,though closely replicating the actual assessment for promotions, were notused for promotion decisions. The candidates had already been evaluatedand promotion decisions made prior to this study, but the assessors wereunder the impression that their conclusions would result in promotion-related decisions. All assessors participated in a 1-day (approximately7-hour) training program to orient them to the interview question andscoring guidelines (the KSAs, the situational question, the rating scaleutilized, practice ratings, and, among other things, the avoidance of ratingerrors) as well as the evaluation process.
Assessment process. Assessors on each interview panel (a) viewedthe taped response in the presence of one another during which notes weretaken, (b) evaluated the candidate’s response independently using pre-setrating guidelines on which they trained, (c) publicly reported their initialratings, (d) discussed differences in ratings, (e) made final ratings, again in-dependently, and (f) presented their final rating to the panel leader (orally).

634 PERSONNEL PSYCHOLOGY
Consensus among assessors was not required. This process of assigningindependent ratings, discussing ratings, and assigning final ratings waspracticed during the assessor training period. Therefore, the assessors wereaware that their three fellow panel members would know their final ratings.
The responses given to the complex interview questions lasted between5 and 8 minutes—and most candidates were stopped at the 8-minute timelimit for responses. Each candidate was assigned, by each assessor, arating on each of the five aforementioned dimensions (i.e., oral commu-nication, problem analysis, technical and departmental knowledge, super-visory ability, and management ability) measured by the response to thesituational question. Assessors used a 7-point scale and preestablished re-sponse guidelines to assign ratings. They were asked to judge responsesto the scenario on a scale ranging from 1 = clearly unacceptable to 7 =clearly superior. Each panel was, unknowingly, evaluating the same can-didates that the other four panels were rating on that day. Panels evaluateda different set of job candidates on each of the 3 evaluation days. Assessorsparticipated on their assigned panel for the entire day.
Each candidate was rated by each of the five panel types. Therefore,at the completion of the interview process, each of the 73 candidates hadbeen assigned an initial and final rating on each performance dimensionfrom 20 assessors (10 White and 10 Black) that resulted in five overall(i.e., panel average) dimension scores, one for each of the five panel typesand five overall question scores, one for each panel. The overall questionscores for each panel were obtained by summing the weighted average (ofthe four panel members) of each dimension score for a given panel. Eachperformance dimension was assigned a weight for the interview based onthe relative weight of the KSAs from the job analysis. The dimensionsreceived the following weights in the interview: oral communications 7%,problem analysis 17%, technical and departmental knowledge 31%, su-pervisory ability 14%, and management ability 31%.
Assessor panel scoring reliability. We estimated assessor rating re-liability in several ways. First, we computed a mean correlation amongpanelists’ initial overall ratings for all candidates assessed by the panelistson each of the 15 panels. The initial rating score was used to obtain anestimate of rating agreement among assessors prior to any panel discus-sion and reconciliation of their ratings. In all, 15 mean correlations werecomputed, one for each of the 15 panels. The mean correlations rangedfrom .51 to .91 with an overall mean of .79. Intraclass correlations (ICC,type 2: Shrout & Fleiss, 1979) were also computed for each of the 15panels. The intraclass correlations ranged from .76 to .97 with a mean in-traclass correlation of .91. A 3 (rating day) × 5 (type of panel composition)analysis of variance (ANOVA) on the correlation coefficients showed a sig-nificant difference in rater agreement among the 3 interview rating days

M. RONALD BUCKLEY ET AL. 635
(F(2, 8) = 9.85, p < .007, η2 = .579). As might be expected, lower agree-ment among the panels was found on the first day of ratings when comparedwith days 2 and 3. We attributed this to practice effects. No differencesin rater agreement were found between the last 2 rating days. In addition,no differences were identified in the degree of rater agreement for the fivetypes of assessor panel composition (with regard to initial ratings).
Post assessment questionnaire. When each panel completed rating thefinal candidate, panel members were presented with a brief questionnaire.The purpose of the questionnaire was to determine whether assessors wereaware of the topic of this study. The questionnaire included one item askingthe participant what he believed the “topic of the study may be.” Onlyone assessor, the human resources specialist, listed race as an issue. Heindicated that he thought the topic of the study might be “whether racialbiases exist in how people are rated.” Results were completed with andwithout this individual included and were not significantly different.
Results
The first hypothesis suggested that mean candidate interview scoreswill differ as a joint function of the race of the candidate and the race of theinterviewer, with assessors giving more favorable evaluations to candidatesof the same race (as the assessor) than to candidates of a race different fromthe assessor. This hypothesis was examined using a t-test, conducted as awithin-subject examination of the difference in ratings assigned to Whitecandidates and Black candidates by Black assessors and White assessors.This t-test of equal variances was conducted comparing the average ofmean Black overall final assessor ratings less mean White overall finalassessor ratings for each Black candidate and the average of mean Blackoverall final assessor ratings less mean White overall final assessor ratingsfor each White candidate.
This t-test offered two important perspectives on racial differences.First, it is an analysis that holds candidate characteristics constant. There-fore, a true candidate difference in ability was not a factor in any differencesin scores. Second, this also allowed for an analysis of assessor effects out-side of the panel condition. The results here indicated that White assessorsrated White candidates, on average, .09 points higher than Black assessorsrated the same White candidates. Black assessors rated Black candidates,on average, .12 points higher than White assessors rated the same Blackcandidates. A t-test of equal variances for the average of mean Blackoverall final assessor ratings less mean White overall final assessor ratingsfor each Black candidate (.12), and the average of mean Black overallfinal assessor ratings less mean White overall final assessor ratings foreach candidate (−.09) was significant (p < .0025). In this way, the results
636 PERSONNEL PSYCHOLOGY
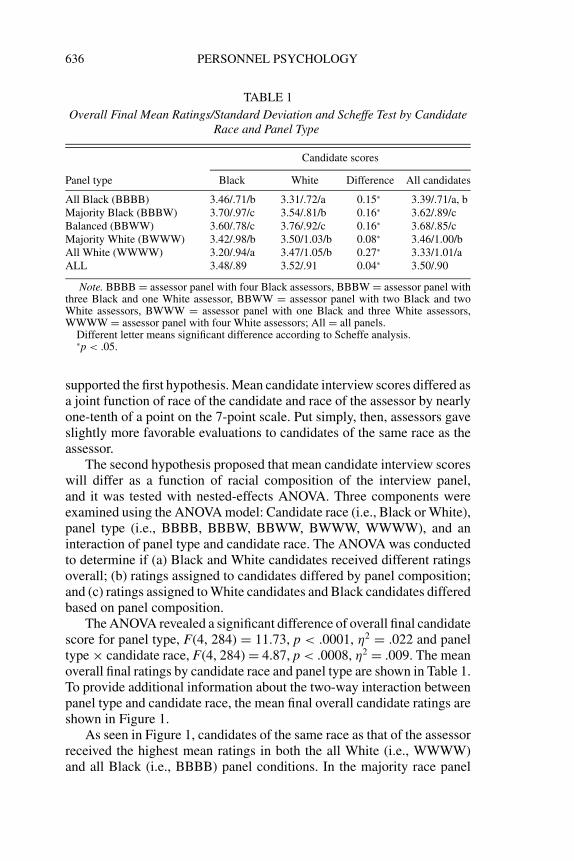
TABLE 1
Overall Final Mean Ratings/Standard Deviation and Scheffe Test by CandidateRace and Panel Type
Candidate scores
Panel type Black White Difference All candidates
All Black (BBBB) 3.46/.71/b 3.31/.72/a 0.15∗ 3.39/.71/a, bMajority Black (BBBW) 3.70/.97/c 3.54/.81/b 0.16∗ 3.62/.89/cBalanced (BBWW) 3.60/.78/c 3.76/.92/c 0.16∗ 3.68/.85/cMajority White (BWWW) 3.42/.98/b 3.50/1.03/b 0.08∗ 3.46/1.00/bAll White (WWWW) 3.20/.94/a 3.47/1.05/b 0.27∗ 3.33/1.01/aALL 3.48/.89 3.52/.91 0.04∗ 3.50/.90
Note. BBBB = assessor panel with four Black assessors, BBBW = assessor panel withthree Black and one White assessor, BBWW = assessor panel with two Black and twoWhite assessors, BWWW = assessor panel with one Black and three White assessors,WWWW = assessor panel with four White assessors; All = all panels.
Different letter means significant difference according to Scheffe analysis.∗p < .05.
supported the first hypothesis. Mean candidate interview scores differed asa joint function of race of the candidate and race of the assessor by nearlyone-tenth of a point on the 7-point scale. Put simply, then, assessors gaveslightly more favorable evaluations to candidates of the same race as theassessor.
The second hypothesis proposed that mean candidate interview scoreswill differ as a function of racial composition of the interview panel,and it was tested with nested-effects ANOVA. Three components wereexamined using the ANOVA model: Candidate race (i.e., Black or White),panel type (i.e., BBBB, BBBW, BBWW, BWWW, WWWW), and aninteraction of panel type and candidate race. The ANOVA was conductedto determine if (a) Black and White candidates received different ratingsoverall; (b) ratings assigned to candidates differed by panel composition;and (c) ratings assigned to White candidates and Black candidates differedbased on panel composition.
The ANOVA revealed a significant difference of overall final candidatescore for panel type, F(4, 284) = 11.73, p < .0001, η2 = .022 and paneltype × candidate race, F(4, 284) = 4.87, p < .0008, η2 = .009. The meanoverall final ratings by candidate race and panel type are shown in Table 1.To provide additional information about the two-way interaction betweenpanel type and candidate race, the mean final overall candidate ratings areshown in Figure 1.
As seen in Figure 1, candidates of the same race as that of the assessorreceived the highest mean ratings in both the all White (i.e., WWWW)and all Black (i.e., BBBB) panel conditions. In the majority race panel
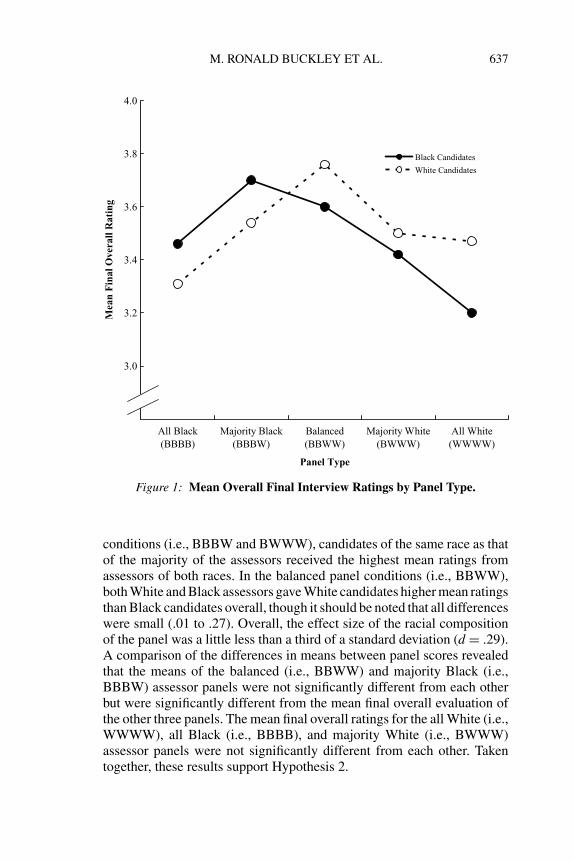
M. RONALD BUCKLEY ET AL. 637
3.0
3.2
3.4
3.6
3.8
4.0
All Black
(BBBB)
Majority Black
(BBBW)
Balanced
(BBWW)
Majority White
(BWWW)
All White
(WWWW)
Panel Type
Mea
nF
inal
Ove
r all
Rat
ing
Black Candidates
White Candidates
Figure 1: Mean Overall Final Interview Ratings by Panel Type.
conditions (i.e., BBBW and BWWW), candidates of the same race as thatof the majority of the assessors received the highest mean ratings fromassessors of both races. In the balanced panel conditions (i.e., BBWW),both White and Black assessors gave White candidates higher mean ratingsthan Black candidates overall, though it should be noted that all differenceswere small (.01 to .27). Overall, the effect size of the racial compositionof the panel was a little less than a third of a standard deviation (d = .29).A comparison of the differences in means between panel scores revealedthat the means of the balanced (i.e., BBWW) and majority Black (i.e.,BBBW) assessor panels were not significantly different from each otherbut were significantly different from the mean final overall evaluation ofthe other three panels. The mean final overall ratings for the all White (i.e.,WWWW), all Black (i.e., BBBB), and majority White (i.e., BWWW)assessor panels were not significantly different from each other. Takentogether, these results support Hypothesis 2.
638 PERSONNEL PSYCHOLOGY
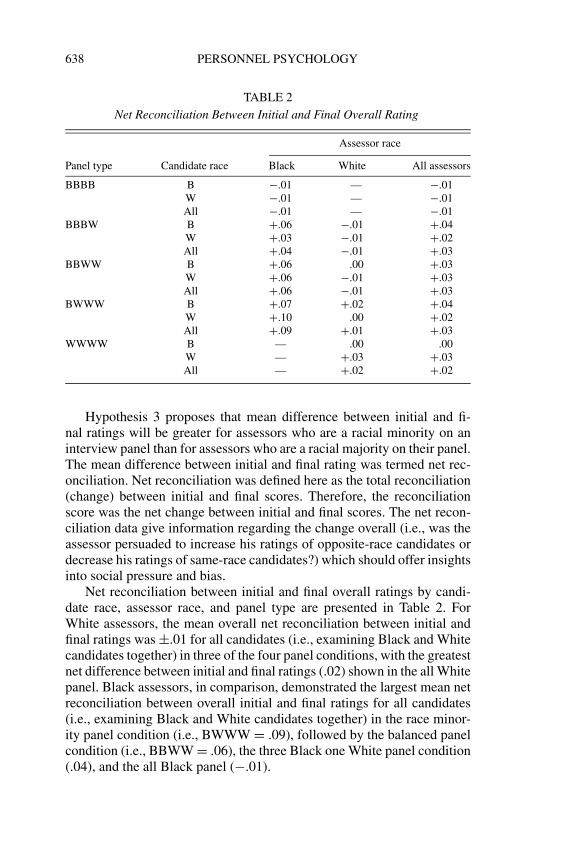
TABLE 2
Net Reconciliation Between Initial and Final Overall Rating
Assessor race
Panel type Candidate race Black White All assessors
BBBB B −.01 — −.01W −.01 — −.01All −.01 — −.01
BBBW B +.06 −.01 +.04W +.03 −.01 +.02All +.04 −.01 +.03
BBWW B +.06 .00 +.03W +.06 −.01 +.03All +.06 −.01 +.03
BWWW B +.07 +.02 +.04W +.10 .00 +.02All +.09 +.01 +.03
WWWW B — .00 .00W — +.03 +.03All — +.02 +.02
Hypothesis 3 proposes that mean difference between initial and fi-nal ratings will be greater for assessors who are a racial minority on aninterview panel than for assessors who are a racial majority on their panel.The mean difference between initial and final rating was termed net rec-onciliation. Net reconciliation was defined here as the total reconciliation(change) between initial and final scores. Therefore, the reconciliationscore was the net change between initial and final scores. The net recon-ciliation data give information regarding the change overall (i.e., was theassessor persuaded to increase his ratings of opposite-race candidates ordecrease his ratings of same-race candidates?) which should offer insightsinto social pressure and bias.
Net reconciliation between initial and final overall ratings by candi-date race, assessor race, and panel type are presented in Table 2. ForWhite assessors, the mean overall net reconciliation between initial andfinal ratings was ±.01 for all candidates (i.e., examining Black and Whitecandidates together) in three of the four panel conditions, with the greatestnet difference between initial and final ratings (.02) shown in the all Whitepanel. Black assessors, in comparison, demonstrated the largest mean netreconciliation between overall initial and final ratings for all candidates(i.e., examining Black and White candidates together) in the race minor-ity panel condition (i.e., BWWW = .09), followed by the balanced panelcondition (i.e., BBWW = .06), the three Black one White panel condition(.04), and the all Black panel (−.01).
M. RONALD BUCKLEY ET AL. 639
To test Hypothesis 3, another nested-effects ANOVA was used. Paneltype, assessor race, an interaction of panel type and assessor race, candidaterace, and an interaction of assessor race and candidate race were the fivecomponents of this analysis. The results showed a significant difference innet reconciliation of overall candidate score for panel type, F(4, 1439) =6.77, p < .0001, η2 = .018, and assessor race, F(1, 1439) = 22.70, p <
.0001, η2 = .015. These results lend support to Hypothesis 3; however,these findings, as seen from the reconciliation scores (cf. Table 2), aresupported only for Black assessors rating White candidates (i.e., Blackassessors demonstrated the greatest degree of reconciliation rating Whitecandidates when serving on a BWWW panel). White assessors demon-strated the largest reconciliation (i.e., change between initial and finalscores) when rating Black candidates in the majority White (i.e., BWWW)panel and rating White candidates in the all similar (i.e., WWWW) panel.Therefore, the third hypothesis is not supported for White assessors ratingBlack candidates.
The fourth hypothesis proposed that mean ratings of candidates of adifferent race than the assessor would be greater for assessors who are theonly person of their race on a panel (i.e., a White assessor on a BBBWpanel or a Black assessor on a BWWW panel) than for those assessorswho are serving on a panel that includes the assessor and one or moreassessors of the same race as that assessor. To test this hypothesis, fournested-effects ANOVAs were used to examine the impact of the racialcomposition of the panel on initial and final overall mean ratings. Thesource of variance for the first two ANOVAs (i.e., one examining initialoverall mean ratings and one examining final overall mean ratings) was thenumber of similar race assessors on the panel. The source of variance forthe second set of ANOVAs (i.e., one examining initial overall mean ratingsand one examining final overall mean ratings) was the panel composition.Panel composition in this analysis refers to the classification of the assessorby the composition of his panel. Minority panel composition, for example,included all White assessors in the BBBW panel conditions and all Blackassessors in the BWWW panel conditions. This differs from panel type,as used in the previously discussed analyses.
Each ANOVA examined the effect of these differences for overallratings looking only at opposite race candidates. The ANOVA examiningcomposition of panel (i.e., number of similar assessors) as the source ofvariance showed a significant difference of initial overall score F(1, 723) =18.07, p < .0001, η2 = .024, and final overall score F(1, 723) = 23.63, p <
.0001, η2 = .032. The results of the ANOVA examining panel type asthe source of variance of initial overall scores also showed a significantdifference F(3, 721) = 6.77, p < .0002, η2 = .027, as did the examinationof final overall scores F(3, 721) = 8.74, p < .0001, η2 = .035.
640 PERSONNEL PSYCHOLOGY
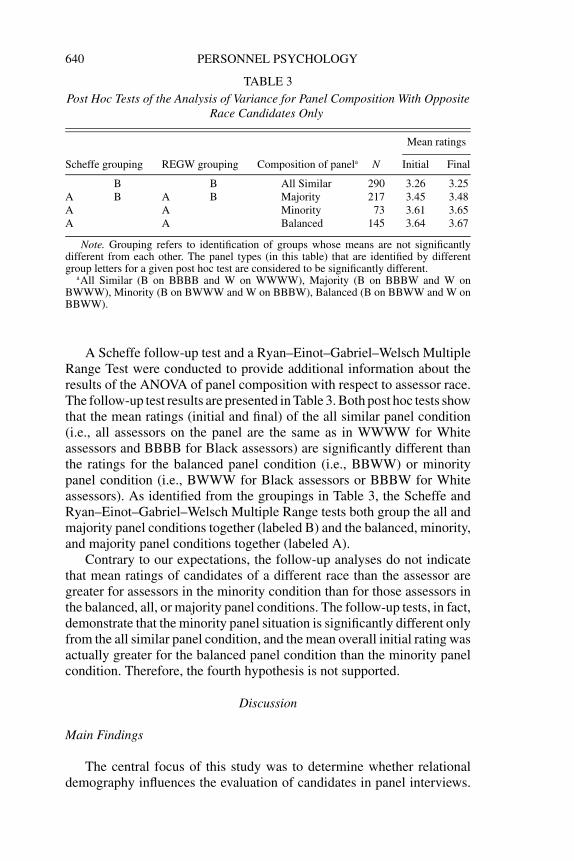
TABLE 3
Post Hoc Tests of the Analysis of Variance for Panel Composition With OppositeRace Candidates Only
Mean ratings
Scheffe grouping REGW grouping Composition of panela N Initial Final
B B All Similar 290 3.26 3.25A B A B Majority 217 3.45 3.48A A Minority 73 3.61 3.65A A Balanced 145 3.64 3.67
Note. Grouping refers to identification of groups whose means are not significantlydifferent from each other. The panel types (in this table) that are identified by differentgroup letters for a given post hoc test are considered to be significantly different.
aAll Similar (B on BBBB and W on WWWW), Majority (B on BBBW and W onBWWW), Minority (B on BWWW and W on BBBW), Balanced (B on BBWW and W onBBWW).
A Scheffe follow-up test and a Ryan–Einot–Gabriel–Welsch MultipleRange Test were conducted to provide additional information about theresults of the ANOVA of panel composition with respect to assessor race.The follow-up test results are presented in Table 3. Both post hoc tests showthat the mean ratings (initial and final) of the all similar panel condition(i.e., all assessors on the panel are the same as in WWWW for Whiteassessors and BBBB for Black assessors) are significantly different thanthe ratings for the balanced panel condition (i.e., BBWW) or minoritypanel condition (i.e., BWWW for Black assessors or BBBW for Whiteassessors). As identified from the groupings in Table 3, the Scheffe andRyan–Einot–Gabriel–Welsch Multiple Range tests both group the all andmajority panel conditions together (labeled B) and the balanced, minority,and majority panel conditions together (labeled A).
Contrary to our expectations, the follow-up analyses do not indicatethat mean ratings of candidates of a different race than the assessor aregreater for assessors in the minority condition than for those assessors inthe balanced, all, or majority panel conditions. The follow-up tests, in fact,demonstrate that the minority panel situation is significantly different onlyfrom the all similar panel condition, and the mean overall initial rating wasactually greater for the balanced panel condition than the minority panelcondition. Therefore, the fourth hypothesis is not supported.
Discussion
Main Findings
The central focus of this study was to determine whether relationaldemography influences the evaluation of candidates in panel interviews.
M. RONALD BUCKLEY ET AL. 641
Consistent with social identity and similarity-attraction theories, thefindings suggest that, for panel interviewers, it is not only who they are andwhom they are rating that may influence their rating decision, but also thecomposition of the interview panel with whom they are rating. Specifically,a same-race bias was demonstrated by the significant difference betweenthe difference in mean Black assessor and mean White assessor rating ofWhite candidates and the difference in mean Black assessor and meanWhite assessor rating of Black candidates. However, on a 7-point scale,the differences were only .09 (for White assessors rating White candidatesvs. Black assessors rating White candidates) and .12 (for Black assessorsrating Black candidates vs. White assessors rating Black candidates). Like-wise, it was found that Black panels tended to rate Black candidates higherthan they rated White candidates, and White panels tended to rate Whitecandidates higher than they rated Black candidates. Nevertheless, the in-teraction of panel composition and candidate race accounted for less than1% of explained variance in overall ratings. Although statistically signifi-cant, these effects were quite small. Accordingly, as always, one must becareful about over interpreting these findings.
The idea that the difference between initial and final ratings (i.e., rec-onciliation) would be greater for assessors who were serving on a panelwith three assessors of a different race than for assessors who are in theracial majority on their panel was supported only in part. The final scoresby panel type and candidate race indicated that the reconciliation seen inthe minority panel condition was greater than the majority or all similarpanel conditions. Examining these results within each race showed that theextent of assessor reconciliation between overall initial and final ratingsfor Black assessors was consistent with this idea, but it was not for Whiteassessors. That is, Black assessors generally changed their scores the leastfrom initial to final ratings in the all-Black panel condition and the mostin the racial minority (i.e., BWWW) panel. In fact, the addition of eachadditional White assessor to the panel created greater discrepancy betweeninitial and final ratings for Black assessors. These findings suggest that, atleast for Blacks, the social pressure to reconcile initial scores with othergroup members increases as the number of Black assessors on the paneldecreases and the number of White assessors increases (or, alternatively,Black raters may have learned that their initial ratings were less accurate).
We also found a significant difference in mean ratings for the com-position of the panel (i.e., number of similar race assessors) and paneltype. However, in contrast to what we expected, follow-up tests did notshow that the minority panel situation was significantly different than allother panel types. Therefore, when rating candidates of a different race,mean ratings of candidates were not greater for assessors serving as racialminorities on a panel than for those serving on panels where at least oneassessor was of the same race as that assessor. Indeed, assessors serving on

642 PERSONNEL PSYCHOLOGY
a balanced panel gave higher (yet not significantly higher than the minoritycondition) ratings to opposite race candidates than assessors in any otherpanel condition.
Finally, it should be noted that increasing the diversity of rating panelsdoes not necessarily ensure that racial differences will not persist. Indeed,the final ratings by panel type and candidate race showed that, in each case,candidates of the same race as the majority of the assessor panel mem-bers received higher ratings than candidates of the other race. Therefore,creating diverse panels may not, alone, solve the problems of bias in theinterview. However, the inclusion of a minority assessor may prove ben-eficial in minimizing racial differences. Balanced panels displayed smallracial differences in this study. Nevertheless, the smallest racial differenceswere actually found in the majority White assessor panels.
Taken together, then, our findings are similar to those reported in priorexaminations of race in the other areas of human resources management. Inparticular, like research on race in performance appraisal and interviewing,our findings revealed only very small effect sizes (Kraiger & Ford, 1985;Lin et al., 1992; McFarland et al., 2004). In fact, although effect sizesaverage about .30 SD in performance appraisal (Kraiger & Ford, 1985;Mount et al., 1997), the effects in our study are closer to .10 SD. As inprevious studies, the findings here also suggest that effects are strongeramong Black raters.
Practical Implications
We followed the lead of McFarland et al. (2004) to illustrate the prac-tical impact of panel composition on selection decisions. The effects werenot trivial. When comparing the differences between the all-Black paneland the balanced panel, the effect of panel composition was almost a halfof a standard deviation. As a practical example, we examined how theselection decisions would change at varying selection ratios if one wereto lower the scores received by applicants who were rated by the balancedpanel (those who were rated by the balanced panel scored, on average,.29 points higher than those who were rated by the all-Black panel). Weexamined who would be hired before ratings were adjusted in this wayand who would be hired after ratings were adjusted in this way. Typically,in police settings a selection ratio of 10% is used (cf. McFarland et al.,2004). Our analysis indicates that over 22% of the applicants who wereselected before the score adjustment would not have been hired after thescore adjustment was made based on the observed differences in scoresdue to panel composition. Moreover, as McFarland et al. (2004) point out,this difference is dependent on the selection ratio—as the selection ratio
M. RONALD BUCKLEY ET AL. 643
decreases the differences will get larger, and as the selection ratio increasesthe differences will be smaller.
The results of this study, then, may have some practical implications forthe development and administration of employment interviews. AlthoughSacco, Scheu, Ryan, and Schmitt (2003) concluded that organizationsshould not be concerned about bias due to demographic differences in thecontext of highly structured, one-on-one interviews, our findings indicatethat the relational demography of an interview panel does have a small im-pact on candidate evaluation. Nevertheless, although the effects are small,same-race bias and rating differences based on the racial composition ofthe rating panel could lead to rating differences that influence the final can-didate score enough to impact hiring decisions. Even if rating bias doesnot result in real differences in hiring decisions for a given candidate(s),the pattern of bias detected overall in such a situation may hinder the legaldefensibility of a selection system. The pattern of bias could be proposedas one of many “underlying factual issues” (Williamson, Campion, Malos,Roehling, & Campion, 1997, p. 909) judges use to make decisions in casesinvolving employment discrimination. In other words, even though the re-sults might not lead to differences that impact a specific hiring decision,an established pattern of bias could communicate undesirable informationto a judge or jury.
More generally, racial diversity on panels has been recommended inprior work, and our results support that recommendation. However, ourfindings suggest that the presence of one minority race member on a panelmay be helpful in minimizing racial differences. From a practical view-point, it may not be necessary to create a balanced panel of four assessorsif a three-person panel of assessors of two majority race assessors anda minority race assessor can be recruited. As minority assessors are, bydefinition, more difficult to identify, practitioners may find comfort in theefficacy of including a single minority assessor when such assessors are alimited resource.
Limitations and Directions for Future Research
In this study, there were instances in which individuals were assignedto panels with assessors from the same agency. Unfortunately, we did notrecord this information, and hence, we are unable to control for any po-tential effects of agency (e.g., a rater might feel more or less pressure toconform when assigned with panelists from his own agency). Likewise, theuse of videotapes instead of evaluations of actual candidate interviews is alimitation of this study. Although the use of videotapes enabled an exami-nation of all candidates by each type of panel, a condition that would havenot been possible in a field setting, most interviews are not videotaped for

644 PERSONNEL PSYCHOLOGY
later evaluation, and evaluating a candidate face-to-face may be differentthan evaluating a videotaped response. In particular, the use of videotapesresults in passive observation on the part of raters (rather than active in-formation seeking), eliminates the opportunity for verbal and nonverbalexchange, and prevents raters from asking the follow-up questions thatthey might ask in a real interview (Eder & Buckley, 1988).
The use of a human resources specialist as one of the assessors is anadditional weakness. This occurred because of the cancellation of asses-sors scheduled to participate. Although this did not seem to have an effecton the results, ideally, we would have conducted this study only using lawenforcement officials. A sample size of only 20 assessors also limits thegeneralizability of our findings. Furthermore, each assessor participatedon multiple panels over the course of 3 days. Although there were no pan-els that were the same, because each participant did provide more thanone evaluation, the ratings in this study are not completely independent,even though they are treated as such in the analyses. Indeed, it is possiblethat an assessor’s earlier experience on one panel could have affected hisor her behavior on subsequent panels. Ideally, then, we would have usedmore assessors to ensure that all of the ratings were truly independent.
The panels were composed of law enforcement officers (e.g., as op-posed to students), and we could only impose upon them to evaluate re-sponses to one of the interview questions. Limiting the stimulus to oneinterview question in this study was also a trade-off for the opportunityto evaluate more candidates. Stereotypes that may lead to biased ratingsare reduced with job-related information as a rater continues to evaluatea candidate (London & Hakel, 1974). Therefore, the limited assessmentprocess may have maximized the likelihood of finding racial differences.Moreover, because applicants were asked to respond to a situation wherethe suspects were Black males, it may have caused race to become moresalient to the interviewers. It is possible, then, that additional questionsor other assessment processes might have reduced the racial differences.However, all of the candidate responses were fairly complex and wereat least 5 minutes in length (and most lasted 8 minutes). Given that in-terviewers tend to make decisions within 4 minutes (Judge, Higgins, &Cable, 2000), we believe that this one question was adequate to capture thepotential influence of racial dissimilarity in our interviews. Nevertheless,these findings should still be viewed with some caution.
The presence of a significant difference in mean overall final ratingsby interview day should be noted, too. The assessors in our study all re-ceived about 7 hours of training. It is possible, though, that respondentswith greater training and experience may respond differently to the ef-fects of demographic differences. Therefore, the results here may not fullygeneralize to situations where interviewers are especially well-trained or
M. RONALD BUCKLEY ET AL. 645
experienced. To control for gender, all of the participants in this study weremale, which further limits the generalizability of our results. Moreover, ourfocus on race ignores other variables such as origin (i.e., the southeasternlocation of our study), age, education, and socioeconomic status. Futureresearch, then, should explore the potential relevance of these factors hereas well.
Like other studies of relational demography, this study offers littleinsight into the psychological variables that might explain our findings.Furthermore, although we found differences in ratings, the psychologicalmechanisms through which differences in ratings may have occurred areunclear. In future studies, researchers should include measures of howmuch raters feel similar to the other panelists on their panels, how muchpressure they feel to conform, and so on. Along the same lines, it mightalso be interesting to content code the notes taken by interviewers to seeif the notes change depending on the race of the applicant and the racialcomposition of the panel. For example, White assessors on a majorityBlack panel (i.e., BBBW) might take few notes when evaluating Blackcandidates because they know that they will defer to the other panel mem-bers in providing a final rating. Finally, the findings here indicate thatrelational demography is, indeed, related to interview bias; however, itis unclear if the ratings are more or less accurate as a result. We wouldecho Stauffer and Buckley’s (2005) call for more research on racial issuesas they influence human resource management outcomes. Despite theselimitations, this study has advanced our understanding of the influence ofrelational demography on panel interviews and has also been instrumentalin identifying a number of fecund areas for future research.
REFERENCES
Arvey RD, Campion JE. (1982). The employment interview: A summary and review ofrecent research. PERSONNEL PSYCHOLOGY, 35, 281–322.
Asch SE. (1956). Studies of independence and conformity: A minority of one against aunanimous majority. Psychological Monographs, 70(9), 1–70.
Byrne D. (1961). Interpersonal attraction and attitude similarity. Journal of Abnormal andSocial Psychology, 62, 713–715.
Campion MA, Pursell ED, Brown BK. (1988). Structured interviewing, raising the psycho-metric properties of the employment interview. PERSONNEL PSYCHOLOGY, 41, 25–42.
Cesare SJ. (1996). Subjective judgment and the selection interview: A methodologicalreview. Public Personnel Management, 25, 291–306.
Dipboye RL, Gaugler BB, Hayes TL, Parker D. (2001). The validity of unstructured panelinterviews: More than meets the eye? Journal of Business and Psychology, 16, 35–49.
Dixon M, Wang S, Calvin J, Dineen B, Tomlinson E. (2002). The panel interview: A reviewof empirical research and guidelines for practice. Public Personnel Management,31, 397–428.
646 PERSONNEL PSYCHOLOGY
Eder RW, Buckley MR. (1988). The employment interview: An interactionist perspective.In Ferris GR, Rowland KM (Eds.). Research in personnel and human resourcesmanagement (Vol. 6, pp. 75–107). Greenwich, CT: JAI.
Harris MM. (1989). Reconsidering the employment interview: A review of recent literatureand suggestions for future research. PERSONNEL PSYCHOLOGY, 42, 691–726.
Huffcutt AI, Arthur W. (1994). Hunter and Hunter (1984) revisited: Interview validity forentry-level jobs. Journal of Applied Psychology, 79, 184–190.
Jones EE. (1964). Ingratiation: A social psychological analysis. New York: Meredith.Judge TA, Higgins CA, Cable DM. (2000). The employment interview: A review of recent
research and recommendations for future research. Human Resource ManagementReview, 10, 383–406.
Kraiger K, Ford JK. (1985). A meta-analysis of ratee race effects in performance ratings.Journal of Applied Psychology, 70, 56–65.
Lin TR, Dobbins GH, Farh JL. (1992). A field study of race and age similarity effectson interview ratings in conventional and situational interviews. Journal of AppliedPsychology, 77, 363–371.
London M, Hakel MD. (1974). Effects of applicant stereotypes, order, and information oninterview impressions. Journal of Applied Psychology, 59, 157–162.
McFarland LA, Ryan AM, Sacco JM, Kriska SD. (2004). Examination of structured in-terview ratings across time: The effects of applicant race, rater race, and panelcomposition. Journal of Management, 30, 435–452.
Mount MK, Sytsma MR, Hazucha JF, Holt KE. (1997). Rater-ratee effects in developmentalperformance ratings of managers. PERSONNEL PSYCHOLOGY, 50, 51–69.
Plant EA, Devine PG. (1998). Internal and external motivation to respond without prejudice.Journal of Personality and Social Psychology, 75, 811–832.
Prewett-Livingston AJ, Feild HS, Veres JG, Lewis PM. (1996). Effects of race on interviewratings in a situational panel interview. Journal of Applied Psychology, 81, 178–186.
Pulakos E, Schmitt N, Whitney D, Smith M. (1996). Individual differences in interviewerratings: The impact of standardization, consensus discussion, and sampling error onthe validity of a structured interview. PERSONNEL PSYCHOLOGY, 49, 85–102.
Roth PL, Campion JE. (1992). An analysis of the predictive power of the panel interviewand pre-employment tests. Journal of Occupational and Organizational Psychology,65, 51–60.
Sacco JM, Scheu CR, Ryan AM, Schmitt N. (2003). An investigation of race and sexsimilarity effects in interviews: A multilevel approach to relational demography.Journal of Applied Psychology, 88, 852–865.
Shrout PE, Fleiss JL. (1979). Intraclass correlations: Uses in assessing rater reliability.Psychological Bulletin, 86, 420–428.
Stauffer JM, Buckley MR. (2005). A note on the existence and nature of racial bias insupervisory ratings. Journal of Applied Psychology, 90, 586–590.
Turner JC. (1984). Social identification and psychological group formation. In Tajfel H(Ed.), The social dimension: European developments in social psychology (Vol. 2,pp. 518–538). Cambridge: Cambridge University Press.
Wiesner WH, Cronshaw SF. (1988). A meta-analytic investigation of the impact of interviewformat and degree of structure on the validity of the employment interview. Journalof Occupational Psychology, 61, 275–290.
Williamson LG, Campion JE, Malos SB, Roehling MV, Campion MA. (1997). Employmentinterview on trial: Linking interview structure with litigation outcomes. Journal ofApplied Psychology, 82, 900–912.