Relational demography and officer occupational attitudes: The influence of workgroup context
12
Relational demography and officer occupational attitudes: The influence of workgroup context Jason R. Ingram a, ⁎, William Terrill b a Illinois State University, Department of Criminal Justice Sciences, Campus Box 5250, Normal, Illinois 61790–5250 b Michigan State University, School of Criminal Justice, 560 Baker Hall, East Lansing, Michigan abstract article info Available online xxxx Purpose: Researchers have long held an interest in understanding what role officer demographics play in explaining occupational attitudes. Despite this interest, evidence has consistently shown such relationships to be inconsistent. Using a relational demography framework that is based on the notion that demographic effects are contextual rather than universal across all officers, the current study examines the extent to which officer demographics influences their occupational attitudes when viewed in relation to other officers in their assigned workgroup. Methods: Surveys of 1,022 patrol officers assigned to 187 workgroups were used to examine demographic effects across a number of occupational attitudes. A series of multilevel modeling techniques were used to test the viability of the relational demography framework. Results: Certain demographic effects changed or were attenuated after accounting for workgroup membership. De- mographic effects were also found to differ across workgroup contexts. Finally, results for job satisfaction indicated that gender and experience effects were dependent upon the demographic and cultural context of the workgroup. Conclusions: Demographic-attitudinal relationships are influenced by the broader workgroup environment. The results also highlight the importance of taking into consideration non-independence issues associated with at- titudes and demographics from both theoretical and analytical perspectives. © 2014 Elsevier Ltd. All rights reserved. Introduction The study of officers’ occupational attitudes has been a cornerstone of policing research for almost fifty years. Such attitudes commonly in- clude officer views toward prominent features of their organizational environments (e.g., the administration, supervision, and job satisfac- tion) and their occupational environments (e.g., citizens, role orienta- tions, and policing tactics). Collectively, these attitudes have become “central constructs” in empirical research on the police (Worden, 1995: 49). One line of research has focused on identifying factors that explain attitudinal differences among officers and has emphasized the importance of demographic characteristics (e.g., gender, race, age, education, experience). Results from this line of research, however, have indicated that these characteristics are rather inconsistent and weak predictors of officer attitudes (Carlan, 2007; Lord & Friday, 2008; Paoline, Myers, & Worden, 2000; Worden, 1993; Zhao, Thurman, & He, 1999). As such, the utility for examining the effect of demographic characteristics on officer attitudes has come into question. There are, however, three issues that could account for the lim- ited and inconsistent support for demographic influences on officers’ occupational attitudes. First, prior research has largely examined demographic-attitudinal relationships as universal, or absolute, in na- ture. In doing so, it implies that these relationships exist in a social vacuum, uninfluenced by the broader environment in which officers’ work or by other officers (Drummond, 1976; Frank & Brandl, 1991). Second, occupational attitudes are often treated as prescriptions of po- lice culture, which is commonly defined as a set of shared attitudes (Herbert, 1998; Manning, 1995; Paoline, 2003). The notion that officers share attitudes suggests that their responses reflect collective views toward officers’ work environments instead of individual ones, poten- tially limiting the likelihood that individual-level characteristics will predict attitudinal variation (Kozlowski & Klein, 2000). Finally from an analytical perspective, non-independence issues may be encountered as a result of the previous two issues, leading to biased estimates of demographic effects. The purpose of the current study is to investigate the potential effects these issues have on the relationship between demographic characteristics and officers' occupational attitudes. To do so, we apply a relational demography approach within officer workgroups as a theo- retical framework. Relational demography proposes that an individual’s demographic similarity (or dissimilarity) to others in an organizational entity affects attitudes. A key component of this framework is that individuals’ demographics lead to different attitudinal responses across Journal of Criminal Justice 42 (2014) 309–320 ⁎ Corresponding author. Tel.: +1 309 438 7103. E-mail address: [email protected] (J.R. Ingram). http://dx.doi.org/10.1016/j.jcrimjus.2014.04.001 0047-2352/© 2014 Elsevier Ltd. All rights reserved. Contents lists available at ScienceDirect Journal of Criminal Justice
Transcript of Relational demography and officer occupational attitudes: The influence of workgroup context

Journal of Criminal Justice 42 (2014) 309–320
Contents lists available at ScienceDirect
Journal of Criminal Justice
Relational demography and officer occupational attitudes: The influenceof workgroup context
Jason R. Ingram a,⁎, William Terrill b
a Illinois State University, Department of Criminal Justice Sciences, Campus Box 5250, Normal, Illinois 61790–5250b Michigan State University, School of Criminal Justice, 560 Baker Hall, East Lansing, Michigan
⁎ Corresponding author. Tel.: +1 309 438 7103.E-mail address: [email protected] (J.R. Ingram).
http://dx.doi.org/10.1016/j.jcrimjus.2014.04.0010047-2352/© 2014 Elsevier Ltd. All rights reserved.
a b s t r a c t
a r t i c l e i n f oAvailable online xxxx
Purpose: Researchers have long held an interest in understanding what role officer demographics play inexplaining occupational attitudes. Despite this interest, evidence has consistently shown such relationshipsto be inconsistent. Using a relational demography framework that is based on the notion that demographic effects are contextual rather than universal across all officers, the current study examines the extent to whichofficer demographics influences their occupational attitudes when viewed in relation to other officers in theirassigned workgroup.Methods: Surveys of 1,022 patrol officers assigned to 187workgroups were used to examine demographic effectsacross a number of occupational attitudes. A series of multilevel modeling techniques were used to test theviability of the relational demography framework.Results: Certain demographic effects changedorwere attenuated after accounting forworkgroupmembership. De-mographic effectswere also found to differ acrossworkgroup contexts. Finally, results for job satisfaction indicatedthat gender and experience effects were dependent upon the demographic and cultural context of theworkgroup.Conclusions: Demographic-attitudinal relationships are influenced by the broader workgroup environment.The results also highlight the importance of taking into consideration non-independence issues associatedwith at-titudes and demographics from both theoretical and analytical perspectives.© 2014 Elsevier Ltd. All rights reserved.
Introduction
The study of officers’ occupational attitudes has been a cornerstoneof policing research for almost fifty years. Such attitudes commonly in-clude officer views toward prominent features of their organizationalenvironments (e.g., the administration, supervision, and job satisfac-tion) and their occupational environments (e.g., citizens, role orienta-tions, and policing tactics). Collectively, these attitudes have become“central constructs” in empirical research on the police (Worden,1995: 49). One line of research has focused on identifying factors thatexplain attitudinal differences among officers and has emphasizedthe importance of demographic characteristics (e.g., gender, race, age,education, experience). Results from this line of research, however,have indicated that these characteristics are rather inconsistent andweak predictors of officer attitudes (Carlan, 2007; Lord & Friday, 2008;Paoline, Myers, & Worden, 2000; Worden, 1993; Zhao, Thurman, &He, 1999). As such, the utility for examining the effect of demographiccharacteristics on officer attitudes has come into question.
There are, however, three issues that could account for the lim-ited and inconsistent support for demographic influences on officers’
occupational attitudes. First, prior research has largely examineddemographic-attitudinal relationships as universal, or absolute, in na-ture. In doing so, it implies that these relationships exist in a socialvacuum, uninfluenced by the broader environment in which officers’work or by other officers (Drummond, 1976; Frank & Brandl, 1991).Second, occupational attitudes are often treated as prescriptions of po-lice culture, which is commonly defined as a set of shared attitudes(Herbert, 1998; Manning, 1995; Paoline, 2003). The notion that officersshare attitudes suggests that their responses reflect collective viewstoward officers’ work environments instead of individual ones, poten-tially limiting the likelihood that individual-level characteristics willpredict attitudinal variation (Kozlowski & Klein, 2000). Finally from ananalytical perspective, non-independence issues may be encounteredas a result of the previous two issues, leading to biased estimates ofdemographic effects.
The purpose of the current study is to investigate the potentialeffects these issues have on the relationship between demographiccharacteristics and officers' occupational attitudes. To do so, we applya relational demography approach within officer workgroups as a theo-retical framework. Relational demography proposes that an individual’sdemographic similarity (or dissimilarity) to others in an organizationalentity affects attitudes. A key component of this framework is thatindividuals’ demographics lead to different attitudinal responses across
310 J.R. Ingram, W. Terrill / Journal of Criminal Justice 42 (2014) 309–320
various organizational contexts, dependent upon the demographiccomposition of the organizational entity (Riordan & Shore, 1997).The entity central to our framework is officer workgroups, defined aspatrol officers assigned to the same squad or work schedule (i.e., dayson duty), on the same shift, and in the same precinct. Officer attitudeshave been found to vary across workgroups, and officers withinworkgroups have been found to share occupational attitudes (Ingram,Paoline, & Terrill, 2013).
We begin with a review of the literature on officer occupational atti-tudes. Here, prior research that has examined demographic influenceson officer attitudes is presented. This section is followed by a discussionof relational demography within the workgroup context and how itapplies to the study of officer demographics and attitudes. Next, weprovide an overview of the survey methodology, attitudinal measures,and group-level properties across 187 workgroups. We then presentfindings from three sets of analyses that test the extent to which demo-graphic effects vary across workgroup contexts. Finally, we discuss theimplications of this research for future studies on police officer attitudes.
Occupational attitudes of police
The study of officers’ occupational attitudes arose out of a set of earlyobservational studies of the police (i.e., Bittner, 1970; Manning, 1997[1977]; Rubinstein, 1973; Skolnick, 1967; Van Maanen, 1974; Westley,1970). Collectively, these studies provided insight into the uniquefeatures of officers’ work environments and the ways in which officersresponded to them. Such responses have come to be conceptualizedas a set of attitudes that comprise officers’ occupational outlooks(Worden, 1995). The most prevalent attitudes included views towardcitizens (Manning, 1997; Skolnick, 1967; Rubinstein, 1973; Westley,1970), role orientations (Bittner, 1970; Manning, 1997), policing tactics(Bittner, 1970; Van Maanen, 1974), supervision (Van Maanen, 1974;Reuss-Ianni, 1983), and job satisfaction (Worden, 1995).
The study of occupational attitudes was further refined by officertypology studies (Broderick, 1977; Brown, 1988; Muir, 1977; White,1972). While early observational studies essentially assumed officers’held similar attitudinal outlooks as a result of working in the sameoccupation, typology studies found that officers responded differentlyto their work environments, leading to attitudinal differences (Brown,1988). Based on the nature of these responses, officers were thengrouped together into common types (Worden, 1995). Typology studiesprovided evidence of variation in officer attitudes and noted that thisvariation was theoretically meaningful. For example, Worden (1995:49) noted that the identification of different officer types indicates that"officers are not psychologically homogenous." This notion has been im-portant to the conceptual development of officers' occupational attitudesas it has directed research to investigate potential sources of attitudinalvariation. This has subsequently led to a body of research seeking toexplain attitudinal differences across officers (e.g., Paoline et al., 2000).
Demographic influences on officer attitudes
Research that has aimed to explain attitudinal differences among of-ficers has focused attention on the effect of individual demographiccharacteristics (e.g., gender, race, age, education, experience) onofficers’ attitudes (Manning, 2005; Paoline et al., 2000). Two perspec-tives have often been offered for why demographic characteristicsshould account for attitudinal differences. The trait-based approachproposes that differences in officers’ backgrounds lead to differencesin how they view police work (Sun, 2003). For example, female officersare said to have “fundamentally different priorities and perspectives onhuman relationships” and these differences lead to variation in howmale and female officers view their jobs (Worden, 1993: 204). A secondapproach takes a diversity perspective. Based on the notion that the oc-cupation of policing has become increasingly diverse with the inclusionof more women, minority, and college educated officers, this approach
contends that a greater diversity of social backgrounds leads to attitudi-nal differences (Paoline et al., 2000).
A number of studies have examined the influence of officer demo-graphics on occupational attitudes. Table 1 provides a summary ofseventeen studies conducted in this area. The seventeen studies wereselected and highlighted for three reasons: 1) each focused on attitudesassociated with those derived from early observational or typologystudies, 2) they examined the effect of at least one demographic charac-teristic on officer attitudes, and 3) they employed multivariate analysesas away to control for potentially confounding effects. As such, it shouldbe noted that the studies reviewedmay not represent an exhaustive list.Furthermore, while each of the studies examined demographic effectson officer attitudes, demographics may not have been the primary, orexclusive, focus of the research (e.g., Johnson, 2012; Lord & Friday,2008; Zhao et al., 1999). Overall, two important patterns emerge fromthis body of research.
First, the results reported by these studies indicate that officer demo-graphics are rather weak predictors of occupational attitudes. Eventhough this set of studies has found officer characteristics to signifi-cantly predict attitudinal differences among officers, the amount ofvariation that is explained by these characteristics is relatively small.For example, the studies on job satisfaction note that demographicsexplain between four to eight percent of the variation in satisfactionlevels (Carlan, 2007; Dantzker & Kubin, 1998; Hunt & McCadden, 1985;Johnson, 2012; Zhao et al., 1999). Similar results have been reportedfor other attitudes as well (e.g., DeJong, 2004; Worden, 1990, 1993).
Second, the results point out inconsistencies regarding the natureof the relationship between demographics and several attitudes. Takefor example, research that has examined gender differences on officerattitudes. Some studies have reported female officers to hold broaderrole orientations (Sun, 2003) or hold more positive attitudes towardscommunity policing (Schafer, 2002), while others have noted femaleofficers to hold more negative attitudes towards order maintenance(Paoline et al., 2000). Other studies reported different findings forfemale officer views toward law enforcement (Worden, 1990, 1993)or views toward use of force (Brooks, Piquero, & Cronin, 1993). Finally,discrepant effects have been found for gender differences and views to-ward citizens (DeJong, 2004; Sun, 2002;Worden, 1993).1 Such inconsis-tencies make it difficult to draw conclusions regarding the extent towhich demographics influence officer attitudes.
Three reasons exist that could account for the limited and inconsis-tent support for demographic influences on officer attitudes. First,extant research has largely treated demographic effects as universal,or absolute, in nature. In doing so, demographic effects on officer atti-tudes are assumed to be the same, or similar, across all officers. Bytreating demographic-attitudinal relationships as universal, it impliesthat they are uninfluenced by the broader environment or other officers(Frank & Brandl, 1991; Drummond, 1976). Researchers, however, havestressed the importance of examining how officers' environmentsimpact their attitudes (Brooks et al., 1993; DeJong, 2004; Hassell, 2006;Paoline et al., 2000; Poteyeva & Sun, 2009; Sun, 2002, 2003). Since offi-cers' attitudes are also likely to be shaped by their work environmentsand interactions with other officers, in addition to individual-level char-acteristics, demographic influences might be context dependent ratherthan universal, or absolute. Research in this area, however, is currentlyunderdeveloped as recent reviews of demographic effects on officer atti-tudes have noted that the impact of environmental characteristics hasbeen "rarely assessed" (Poteyeva & Sun, 2009: 520).
Second, the occupational attitudes of police are often treated as pre-scriptions of police culture, which is commonly defined as a set of sharedattitudes, values, and norms that officers use to copewith the challengesfaced in their work environments (Herbert, 1998; Manning, 1995;Paoline, 2003). Research in the organizational sciences has found thatwhen employees are exposed to common work environments and de-velop shared views of them, it reduces the likelihood that individualcharacteristics will predict outcomes of interest (Kozlowski & Klein,

Table 1Studies Examining the Effect of Individual Officer Characteristics on Officers’ Attitudes
Study Study Sample Size Officer Characteristics Key Attitudes Relevant Findings
Hunt and McCadden(1985)
6 departments(N = 1,202 officers)
Race, Gender, Age, Education,Experience
Job Satisfaction Officers’ race, age, and experience were all found to be significantpredictors. However, officer characteristics collectively explainedonly 4% of the variation in satisfaction levels.
Worden (1990) 24 departments(N = 1,360 officers)
Race, Gender, Education⁎,Experience
Role OrientationLegal RestrictionsSelectivityAutonomyViews of SupervisorsMorale
College educated officers significantly more likely to hold narrowviews toward police role, positive views towards legal restrictions,and greater preferences for autonomy and selective enforcement.Education, however, explained “little of the variance in anyattitude” (pg. 584).
Brooks et al. (1993) 2 departments(N = 761 officers)
Race, Gender, Age, Education,Experience
Role OrientationViews of CitizensSelectivityViews toward force
“While some relationships between police officer attitudes anddemographic characteristics were apparent, the correlationswere weak and the explained variance was low” (pg. 130).
Worden (1993) 24 departments(N = 740 officers)
Race, Gender⁎, Age, Experience Role OrientationSelectivityLegal RestrictionsViews of CitizensViews of PeersViews of Supervisors
Male officers less likely to favor selective enforcement. Womenofficers held more positive attitudes toward citizens. However,the “most striking finding…is the failure of gender to explainmuch or any variation in the array of attitudes examined”(pg. 229).
Dantzker and Kubin(1998)
14 departments(N = 2,734 officers)
Race, Gender⁎, Age,Education, Experience
Job Satisfaction Officers’ gender, age, and experience were significantly related totheir levels of satisfaction. However, the variables “represent 6%or less of the variance” in explaining job satisfaction (pg. 29).
Zhao et al. (1999) 1 department(N = 199 officers)
Race, Gender, Education,Experience
Job Satisfaction Officers’ years of experience negatively related to job satisfaction.However, the demographic variables explain only 6% of thevariation in satisfaction levels.
Paoline et al. (2000) 2 departments(N = 644 officers)
Race, Gender, Education,Experience
Role OrientationAggressivenessSelectivityViews of Citizens
“Overall, then, we detect only modest differences associatedwith officers’ race, and even smaller differences, if any associatedwith their sex and education” (pg. 600).
Schafer (2002) 1 department(N = 128 officers)
Gender, Race, Education Views of COP Female officers more likely to hold positive attitudes towardglobal assessments of COP.
Sun (2002) 1 department(N = 398 officers)
Race, Gender, Education,Experience
Views of PeersViews of SupervisorsViews of ManagementViews of Citizens
None of the four characteristics explain much of the variationin officers’ occupational attitudes (pg. 80).
Sun (2003) 1 department(N = 398 officers)
Race⁎, Gender, Education,Experience
Role OrientationSelectivityLegal RestrictionsProblem Solving
Black officers significantly more likely to hold broader roleorientations, less selective in enforcing law, and more likelyto hold positive attitudes toward legal restrictions thenWhite officers.
DeJong (2004) 2 departments(N = 6,135 encounters)
Race, Gender⁎, Education,Experience
Views of Citizens Nonwhite, male officers and female officers with collegedegree significantly more likely to be distrustful of citizens.
Carlan (2007) 16 departments(N = 1,114 officers)
Race, Gender, Age, Education,Experience
Job Satisfaction Officer “demographics are of little value to understandingjob satisfaction” (pg. 74).
Moon and Zager(2007)
Korean National Police(N = 434 officers)
Education & Experience Views of Citizens More experienced officers significantly more likely tohold positive views towards citizens.
Lord and Friday (2008) 1 department(N = 77 officers)
Education & Experience Views of COP Officer characteristics failed to explain changes in officers’acceptance of or receptiveness to community policing.
Miller, Mire, and Bitna(2009)
1 department(N = 87 officers)
Gender, Race, Education,Experience
Job Satisfaction More experienced officers were significantly less satisfiedwith their jobs.
Hassell, Archbold, andStichman (2011)
1 department(N = 87 officers)
Gender⁎ & Experience Job Satisfaction Neither gender nor experience affected job satisfaction.
Johnson (2012) 11 departments(N = 292 officers)
Gender, Race, Education,Experience
Job Satisfaction African American officers were more satisfied while moreexperienced officers reported lower levels of satisfaction.“As with the previous literature on job satisfaction, employeeascribed characteristics had very little explanatorypower” (pg. 171).
⁎ Where denoted, indicates study’s primary variable of interest.
311J.R. Ingram, W. Terrill / Journal of Criminal Justice 42 (2014) 309–320
2000). In essence, research on police culture also suggests that individualofficer demographic influences on attitudes are context dependent. Incontexts where attitudes are strongly shared, individual demographicdifferences should not be expected to have much influence.
Finally, there are potential methodological limitations. Prior re-search on officer demographics and attitudes has employed analysistechniques that assume independence of officers’ attitudes as well asdemographic characteristics. For example,many of the studies reviewedin Table 1 relied on regression-based analytic techniques as ways forcontrolling for other potentially confounding factors related to officerattitudes. Such techniques assume that observations are independentof each other (Raudenbush & Bryk, 2002). However, if officer attitudesare also influenced by their broader work environment and shared byofficers, which research on police culture suggests (Ingram et al.,
2013), then this assumption is likely violated. Furthermore, the assign-ment of personnel in departments is oftenmade using individual officercharacteristics, such as experience (e.g., seniority levels). This also ques-tions the independence of the distribution of demographic characteris-tics across police organizations and suggests that non-independenceissues may be present for both attitudinal measures and demographiccharacteristics. Prior research has noted that non-independence canlead researchers to make Type I or Type II errors, if not accounted for(Bliese & Hanges, 2004).
Theoretical framework
The current study uses a theoretical perspective rooted within orga-nizational demography in order to incorporate these conceptual and

312 J.R. Ingram, W. Terrill / Journal of Criminal Justice 42 (2014) 309–320
methodological issues into the study of demographic-attitudinal rela-tionships. Organizational demography is the study of a population in or-ganizational settings and proposes that the composition of a population,usually in terms of basic demographic characteristics, serves to shapesocial structures and outcomes (Carroll, 2008; Pfeffer, 1983). Popular-ized by Pfeffer’s (1983) work, this approach noted that aggregate, com-positional effects represent more than just the sums of individual-leveldemographic effects. Within organizational demography, there arethree major areas of study: 1) organizations or industries, 2) the work-force, or 3) internal organizational demography (Carroll, 2008: 1043).We base our framework on the internal organizational demographyapproach, which examines the demographic distributions of peoplewithin organizations. Specifically, we focus on relational demographywithin workgroup contexts (Riordan & Shore, 1997).
Relational demography & workgroup contexts
Relational demography is a field of research that focuses on how in-dividuals’ similarity or dissimilarity to their organizational units affectsattitudes and behaviors (Knippenberg & Schippers, 2007; Riordan &Wayne, 2008). Specifically, it examines how individual demographiccharacteristics and the organizational context interact and proposesthat “individuals compare their own demographic characteristics withthose of others in their social units to determine if they are similar ordissimilar in their demographic characteristics to the composition oftheir unit” (Riordan & Shore, 1997: 342). This proposition is basedon ideas from self categorization and similarity-attraction theorieswhich assert that individuals identifymorewith people who are demo-graphically similar to them. Demographically similar individuals mayhave similar background experiences, share common outlooks, and bemore likely to interact with each other. In this regard, the demographiccomposition of organizational entities reflects an important contextualcomponent of thework environment: individuals’ demographic charac-teristics may produce different attitudinal outcomes across organiza-tional contexts, depending on the demographic composition of theother members. As such, demographic effects are viewed as relative tothe unit an individualworks in rather than universal, or absolute, acrossall individuals (O'Reilly, Caldwell, & Barnett, 1989; Riordan & Shore,1997; Riordan & Wayne, 2008).
In applying the relational demography approach, selecting an appro-priate organizational unit is important as it represents the context that isassumed to interactwith individuals' demographic characteristics. In therelational demography literature, support has been found for employeeworkgroups (Kirchmeyer, 1995; Maume & Sebastian, 2007; O'Reillyet al., 1989; Riordan & Shore, 1997). Kozlowski and Bell (2003) defineworkgroups as:
two or more individuals who (a) exist to perform organizationallyrelevant tasks, (b) share one or more common goals, (c) interactsocially, (d) exhibit task interdependencies…, (e) maintain andmanage boundaries, and (f) are embedded in an organizationalcontext that sets boundaries, constrains the [group], and influencesexchanges with other units in the broader entity. (p. 334)
As such, workgroups provide an immediate environment in whichwork is carried out. Individuals within workgroups are exposed tocommon features of the organizational environment. Additionally,workgroup boundaries structure individuals’ interaction patterns.
Studies on relational demography within the workgroup settinghave found that demographic dissimilarity between individuals andtheir workgroup can lead to lower commitment (Riordan & Shore,1997), job satisfaction (Maume & Sebastian, 2007), or perceptions ofjob challenge (Kirchmeyer, 1995). Although workgroup demographyhas not been applied to police research to our knowledge, there hasbeen a line of research that is based on relational principles betweenofficers and their department. For example, Krimmel and Gormley
(2003) in a test of the tokenism hypothesis, found job satisfaction tobe lower for females working in departments with less than 15 percentfemale officers. As such, the results of extant research on relationaldemography warrants further exploration to determine its' applica-bility to the study of officer attitudes at lower levels of the policeorganization.
Current study
The current study proposes that it is beneficial to apply the rela-tional demography framework to the study of demographic effectson occupational attitudes within officers' workgroup settings. Here,workgroups are defined as patrol officers who work the same squador schedule (i.e., days on duty) on the same shift in the same precinct.Patrol workgroups represent immediate and proximal contexts oftheir occupational (i.e., interactions on the street with citizens) andorganizational (i.e., interactions in the department with supervisors)environments. Furthermore, officers within workgroups are more like-ly to interact with one another on a routine basis. Recent researchin the area of police culture has also provided support for examiningthe workgroup-level (Ingram et al., 2013). Specifically, officers withinworkgroups were found to significantly share a range of attitudes thatcomprise common depictions of police culture (e.g., views toward citi-zens, the police role, policing tactics, job satisfaction, and supervision).Furthermore, these orientations significantly varied across workgroups,supporting the notion that workgroup contexts are associated withofficer attitudes.
As such, we contend that officers’ demographic similarity or dissim-ilarity to the other officers in their workgroup should influencetheir attitudinal dispositions. In other words, officers’ demographiccharacteristics are argued to lead to different attitudinal outcomes indifferent workgroup contexts, constituting relative effects rather thanabsolute effects. Based on the relational demography and officer occu-pational attitudinal literature, two important features of the workgroupcontext that should account for such differences areworkgroup demog-raphy and workgroup culture (i.e., the extent to which officers withinworkgroups share attitudes).
In order to examine the viability of this framework, the current studyinvestigates three research questions. First, does an officer’s relative de-mographic position within the workgroup have an impact on his/heroccupational attitudes? Second, do officer demographic characteristicsproduce different attitudinal outcomes across workgroups? Finally,to what extent does workgroup demography and culture moderatedemographic-attitudinal relationships?
Data & methods
The current inquiry uses data collected from the Assessing Police Useof Force Policy and Outcomes project, a National Institute of Justicefunded project designed to examine use of force policies and practicesacross the United States. A component of this project was a 116 itemsurvey administered to patrol officers asking them their views towardforce policy, work environments, and background characteristics. Forthe current study, we focus on the survey questions measuring officers’attitudes toward their work environments collected from five of theparticipating agencies: Albuquerque, New Mexico (APD); Portland,Oregon (PPB); Colorado Springs, Colorado (CSPD); Fort Wayne, Indiana(FWPD); and Knoxville, Tennessee (KPD).
Although the selection criterion for the study departments wasbased on the type of force policy each agency had implemented, the se-lection process also sought departments of similar sizes and character-istics that would be consistent with other medium to large municipaldepartments. The results from Table 2 indicate that many of the cityand department characteristics across the study departments are fairlysimilar.

Table 2Study Sites
Characteristics Albuquerque(APD)
Portland(PPB)
Colorado Springs(CSPD)
Fort Wayne(FWPD)
Knoxville(KPD)
City characteristicsPopulation 513,124 538,133 374,112 248,423 182,337% Non-White 28.4 22.1 19.3 24.5 20.3% Female headed households 8.0 6.3 7.1 9.8 8.0% Below poverty 10.0 8.5 6.1 9.6 14.4% Unemployed 3.8 4.5 3.1 4.3 3.9Part I crimes/1,000 population 66.98 65.57 49.55 43.65 81.38
Department characteristicsTotal # of sworn officers 986 989 669 457 382# officers/1,000 population 1.92 1.84 1.78 1.84 2.09
Table 3Attitudinal Measures, Demographics, and Workgroup Properties
Variables Mean S.D. Minimum Maximum ICC
Officer LevelAttitudesTop Management 8.58 2.13 3.00 12.00 .17Direct Supervisors 3.67 1.47 2.00 8.00 .15Job Satisfaction 9.12 1.80 3.00 12.00 .13Citizen Distrust/Suspicion 4.95 1.53 2.00 8.00 .06Order Maintenance 13.83 3.24 6.00 24.00 .10Aggressive Patrol 3.11 .75 1.00 4.00 .11
CharacteristicsFemale .11 .21 .00 1.00 .02Non-White .21 .41 .00 1.00 .09Education Level 4.77 1.63 1.00 8.00 .17Experience 7.79 6.43 .17 34.58 .35CSPD .18 .39 .00 1.00 ---PPB .23 .42 .00 1.00 ---APD (reference) .30 .45 .00 1.00 ---FWPD .18 .38 .00 1.00 ---KPD .12 .32 .00 1.00 ---
Workgroup LevelAttitudinal DispersionTop Management Dispersion .55 .17 0.00 1.11 ---Direct Supervisor Dispersion .54 .21 0.00 1.11 ---Satisfaction Dispersion .51 .14 0.00 0.83 ---Citizen Distrust/Suspicion Dispersion .56 .21 0.00 1.25 ---Order Maintenance Dispersion .54 .13 0.17 0.92 ---Aggressive Patrol Dispersion .49 .22 0.00 1.00 ---
DemographyProportion Female .12 .13 .00 .67 ---Proportion Non-White .22 .21 .00 .88 ---Average Education 4.83 0.91 2.50 6.67 ---Average Experience 8.08 4.46 1.67 23.65 ---
313J.R. Ingram, W. Terrill / Journal of Criminal Justice 42 (2014) 309–320
Survey administration
In order to develop a structured plan for survey administration,project staff members coordinated with each department prior toimplementing the survey and then surveyed on-site for a week to tendays with the goal of visiting every patrol shift, across each geographiclocation, at least twice.With the exception of one site, the surveywas ad-ministered during roll call sessions, by trained project staff, before thestart of the officers’ shifts.2 Our aim was to survey the population of pa-trol officers. Of the 1,460 patrol officers eligible to be surveyed across thefive departments, 1,053were present at roll calls.3 Of those officers in at-tendance, 1,022 completed the survey. Thus, on average approximately70 percent of all patrol officers were surveyed with a response rate ofapproximately 97 percent, an indication that the officers surveyed arerepresentative of the patrol population for the study departments.
Patrol workgroups
Workgroups are composed of officers assigned to the same squador work schedule (i.e., days on duty), on the same shift in the sameprecinct.4 Officers were coded into their respective workgroups basedon work rosters provided by each department as a part of the project.In all, there were 187 total workgroups broken down as follows: APD(N = 48), PPB (N = 50), CSPD (N = 39), FWPD (N = 36), and KPD(N = 14).5 Workgroups had an average of 7.56 officers assigned tothem (ranging from 6 to 10 officers) and approximately 72 percent ofofficers were surveyed on average within each workgroup.
Attitudinal measures & workgroup properties
The current study examines demographic influences on six occupa-tional attitudes from the patrol officer survey. The six attitudes repre-sent a range of officer views toward their work environment that hasbeen central to the study of officers' occupational attitudes. Further-more, the survey items used were derived from prior research in thisarea (e.g., DeJong, 2004; Paoline et al., 2000; Sun, 2002, 2003). Eachquestionwas based on a four-point Likert scalemeasuring officer agree-ment with the question (1= Strongly agree to 4 = Strongly disagree).Overall, sixteen items were used to create five multi-item attitudi-nal measures treated as additive indices: top management (3 items;α = 0.78), direct supervisors (2 items; α = 0.78), job satisfaction(3 items; α = 0.63), citizen distrust/suspicion (2 items; α = 0.81), andorder maintenance (6 items; α = 0.75). Additionally, a single surveyitem was used to measure aggressive patrol. For each of the six attitudi-nal measures, itemswere coded so that higher values representedmorenegative attitudes toward top management and direct supervisors;greater job satisfaction; greater distrust/suspicion of citizens; lessacceptance of order maintenance roles; and more positive attitudes to-ward aggressive patrol tactics. Table 3 reports descriptive statistics forthe attitudinal measures. Individual survey items used to comprisethese measures are included in Appendix A.
In addition to descriptive statistics, we also present the intraclasscorrelation coefficient (ICC) values for each attitude. Here, the ICCvalues provide an indication of the amount of attitudinal variationthat can be accounted for by workgroup membership (e.g., clusteringeffects). Recall that non-independence of officer attitudes may bepresent as a result of working together within workgroups. If present,non-independence issues could affect subsequent results if unaccountedfor. The ICC values reported in the last column of Table 3 reveal clus-tering for each of the six attitudinal measures in varying degrees. Inessence, the results indicate that between 6 (citizen distrust/suspicion)and 17 (top management) percent of the variation in officers' occupa-tional attitudes is associated with workgroup membership and suggestthat officers' attitudes are not independent of each other.
Attitudinal dispersion
The occupational attitudes under study are also often treated as pre-scriptions of police culture. Officers are said to develop shared attitudesas a result of being exposed to similar environments and interacting
314 J.R. Ingram, W. Terrill / Journal of Criminal Justice 42 (2014) 309–320
with each other. This may reduce the likelihood that individual officerdemographics will predict attitudinal differences. As such, it is impor-tant to also assess and present the extent to which officers withinworkgroups share occupational attitudes.
In order to do this, we employed within group agreement indicesas measures for the amount of attitudinal dispersion present withinworkgroups. Within group agreement indices have been used to exam-ine attitudinal agreement in the organizational sciences for quitesome time (James, Demaree, & Wolf, 1984; Kozlowski & Hattrup,1992). They have also been used in police culture research to assessthe extent to which officers share attitudes (Ingram et al., 2013).Statistically, they measure the amount of dispersion present in attitudi-nal items for people within the same organizational group (Bliese,2000).
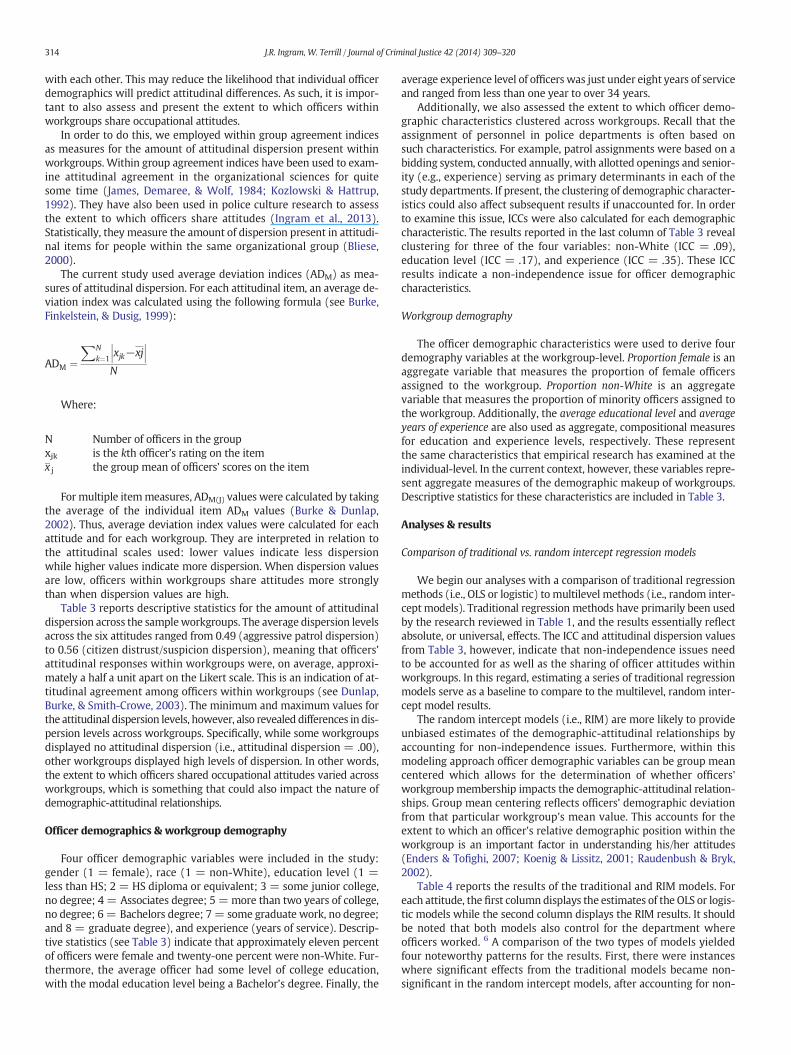
The current study used average deviation indices (ADM) as mea-sures of attitudinal dispersion. For each attitudinal item, an average de-viation index was calculated using the following formula (see Burke,Finkelstein, & Dusig, 1999):
ADM ¼XN
k¼1xjk−xj���
���N
Where:
N Number of officers in the groupxjk is the kth officer’s rating on the itemx j the group mean of officers’ scores on the item
For multiple itemmeasures, ADM(J) values were calculated by takingthe average of the individual item ADM values (Burke & Dunlap,2002). Thus, average deviation index values were calculated for eachattitude and for each workgroup. They are interpreted in relation tothe attitudinal scales used: lower values indicate less dispersionwhile higher values indicate more dispersion. When dispersion valuesare low, officers within workgroups share attitudes more stronglythan when dispersion values are high.
Table 3 reports descriptive statistics for the amount of attitudinaldispersion across the sampleworkgroups. The average dispersion levelsacross the six attitudes ranged from 0.49 (aggressive patrol dispersion)to 0.56 (citizen distrust/suspicion dispersion), meaning that officers’attitudinal responses within workgroups were, on average, approxi-mately a half a unit apart on the Likert scale. This is an indication of at-titudinal agreement among officers within workgroups (see Dunlap,Burke, & Smith-Crowe, 2003). The minimum and maximum values forthe attitudinal dispersion levels, however, also revealed differences in dis-persion levels across workgroups. Specifically, while some workgroupsdisplayed no attitudinal dispersion (i.e., attitudinal dispersion = .00),other workgroups displayed high levels of dispersion. In other words,the extent to which officers shared occupational attitudes varied acrossworkgroups, which is something that could also impact the nature ofdemographic-attitudinal relationships.
Officer demographics & workgroup demography
Four officer demographic variables were included in the study:gender (1 = female), race (1 = non-White), education level (1 =less than HS; 2 = HS diploma or equivalent; 3 = some junior college,no degree; 4 = Associates degree; 5 =more than two years of college,no degree; 6 = Bachelors degree; 7 = some graduate work, no degree;and 8 = graduate degree), and experience (years of service). Descrip-tive statistics (see Table 3) indicate that approximately eleven percentof officers were female and twenty-one percent were non-White. Fur-thermore, the average officer had some level of college education,with the modal education level being a Bachelor’s degree. Finally, the
average experience level of officers was just under eight years of serviceand ranged from less than one year to over 34 years.
Additionally, we also assessed the extent to which officer demo-graphic characteristics clustered across workgroups. Recall that theassignment of personnel in police departments is often based onsuch characteristics. For example, patrol assignments were based on abidding system, conducted annually, with allotted openings and senior-ity (e.g., experience) serving as primary determinants in each of thestudy departments. If present, the clustering of demographic character-istics could also affect subsequent results if unaccounted for. In orderto examine this issue, ICCs were also calculated for each demographiccharacteristic. The results reported in the last column of Table 3 revealclustering for three of the four variables: non-White (ICC = .09),education level (ICC = .17), and experience (ICC = .35). These ICCresults indicate a non-independence issue for officer demographiccharacteristics.
Workgroup demography
The officer demographic characteristics were used to derive fourdemography variables at the workgroup-level. Proportion female is anaggregate variable that measures the proportion of female officersassigned to the workgroup. Proportion non-White is an aggregatevariable that measures the proportion of minority officers assigned tothe workgroup. Additionally, the average educational level and averageyears of experience are also used as aggregate, compositional measuresfor education and experience levels, respectively. These representthe same characteristics that empirical research has examined at theindividual-level. In the current context, however, these variables repre-sent aggregate measures of the demographic makeup of workgroups.Descriptive statistics for these characteristics are included in Table 3.
Analyses & results
Comparison of traditional vs. random intercept regression models
We begin our analyses with a comparison of traditional regressionmethods (i.e., OLS or logistic) to multilevel methods (i.e., random inter-cept models). Traditional regression methods have primarily been usedby the research reviewed in Table 1, and the results essentially reflectabsolute, or universal, effects. The ICC and attitudinal dispersion valuesfrom Table 3, however, indicate that non-independence issues needto be accounted for as well as the sharing of officer attitudes withinworkgroups. In this regard, estimating a series of traditional regressionmodels serve as a baseline to compare to the multilevel, random inter-cept model results.
The random intercept models (i.e., RIM) are more likely to provideunbiased estimates of the demographic-attitudinal relationships byaccounting for non-independence issues. Furthermore, within thismodeling approach officer demographic variables can be group meancentered which allows for the determination of whether officers'workgroupmembership impacts the demographic-attitudinal relation-ships. Group mean centering reflects officers' demographic deviationfrom that particular workgroup's mean value. This accounts for theextent to which an officer's relative demographic position within theworkgroup is an important factor in understanding his/her attitudes(Enders & Tofighi, 2007; Koenig & Lissitz, 2001; Raudenbush & Bryk,2002).
Table 4 reports the results of the traditional and RIM models. Foreach attitude, the first column displays the estimates of the OLS or logis-tic models while the second column displays the RIM results. It shouldbe noted that both models also control for the department whereofficers worked. 6 A comparison of the two types of models yieldedfour noteworthy patterns for the results. First, there were instanceswhere significant effects from the traditional models became non-significant in the random intercept models, after accounting for non-

Table 4OLS, Logit, and RIM Effects of Officer Demographics on Occupational Attitudes
Variable Top Management Direct Supervisor Job Satisfaction CitizenDistrust/Suspicion
Order Maintenance Aggressive Patrol
OLS RIM OLS RIM OLS RIM OLS RIM OLS RIM Logit RIM
Intercept 7.64(.24)⁎⁎⁎
8.56(.08)⁎⁎⁎
2.77(.17)⁎⁎⁎
3.68(.06)⁎⁎⁎
10.47(.21)⁎⁎⁎
9.13(.07)⁎⁎⁎
5.51(.18)⁎⁎⁎
4.94(.05)⁎⁎⁎
12.58(.39)⁎⁎⁎
13.79(.12)⁎⁎⁎
--- ---
Threshold 1 --- --- --- --- --- --- --- --- --- --- −4.79(.31)⁎⁎⁎
−3.81(.20)⁎⁎⁎
Threshold 2 --- --- --- --- --- --- --- --- --- --- −2.64(.25)⁎⁎⁎
−1.66(.09)⁎⁎⁎
Threshold 3 --- --- --- --- --- --- --- --- --- --- -.15(.23)
.86(.09)⁎⁎⁎
Female .08(.21)
-.02(.24)
-.12(.15)
-.23(.17)
-.28(.18)
-.09(.22)
.04(.15)
.04(.17)
.57(.33) †
.35(.33)
-.45(.20)⁎
-.26(.21)
Non-White -.30(.17) †
-.30(.17) †
.08(.12)
.09(.10)
.05(.14)
-.09(.15)
-.07(.12)
-.13(.15)
.15(.26)
.22(.28)
-.52(.16)⁎⁎
-.58(.18)⁎⁎
Education .09(.04)⁎
.04(.05)
.09(.03)⁎⁎
.04(.03)
-.15(.04)⁎⁎⁎
-.13(.04)⁎⁎
-.05(.03)
-.06(.04)
.11(.07)
.04(.07)
-.04(.04)
-.04(.05)
Experience .05(.01)⁎⁎⁎
.04(.02)⁎
.05(.01)⁎⁎⁎
.03(.01)⁎⁎
-.05(.01)⁎⁎⁎
-.03(.01)⁎
-.03(.01)⁎⁎⁎
-.03(.01)⁎
-.03(.02) †
-.05(.02)⁎
-.05(.01)⁎⁎⁎
-.03(.02)
CSPD .02(.21)
.36(.22)
.39(.14)⁎⁎⁎
.61(.15)⁎⁎⁎
-.20(.18)
-.55(.21)⁎⁎
-.14(.15)
-.32(.15)⁎
1.68(.32)⁎⁎⁎
1.54(.34)⁎⁎⁎
-.36(.19) †
-.51(.22)⁎
PPB .36(.20) †
.76(.21)⁎⁎⁎
.19(.14)
.45(.17)⁎⁎
-.58(.18)⁎⁎
-.99(.19)⁎⁎⁎
-.45(.15)⁎⁎
-.61(.13)⁎⁎⁎
.99(.32)⁎⁎
1.03(.32)⁎⁎
-.12(.19)
-.25(.20)
FWPD 1.17(.20)⁎⁎⁎
1.52(.21)⁎⁎⁎
.26(.14) †
.48(.17)⁎⁎
-.23(.18)
-.52(.20)⁎
-.13(.15)
-.26(.14) †
.76(.32)⁎
.59(.35) †
−1.11(.20)⁎⁎⁎
−1.23(.21)⁎⁎⁎
KPD −1.14(.23)⁎⁎⁎
−1.00(.32)⁎⁎
-.21(.16)
-.26(.23)
-.19(.20)
-.16(.23)
.53(.17)⁎⁎
.53(.14)⁎⁎⁎
1.22(.36)⁎⁎
1.07(.36)⁎⁎
.28(.22)
.46(.27) †
R2 .14 .14 .08 .06 .08 .06 .06 .06 .04 .04 .11 .09N 973 973 986 986 975 975 982 982 983 983 990 990
⁎⁎⁎p b .001, ⁎⁎p b .01, ⁎p b .05, †p b .10; Note: Standard errors are in parentheses.
315J.R. Ingram, W. Terrill / Journal of Criminal Justice 42 (2014) 309–320
independence due to workgroup membership. For example, the effectof gender on aggressive patrol, the effect of education on officers'views toward top management and direct supervisors, and the effectof experience on aggressive patrol all becamenon-significant in the ran-dom intercept models.
Second, certain relationships were attenuated. The most prevalentdifferences were found for the effect of officer experience. For example,even though the traditional models found more experienced officers tohold significantly less favorable views toward top management, directsupervisors, and job satisfaction aswell asmore favorable views towardcitizens, the RIM estimates for these same relationships were all re-duced. The effect of officer education on job satisfaction was also atten-uated. Third, somefindingswere strengthened after accounting for non-independence andworkgroupmembership, such as the result for officerexperience and ordermaintenance. Finally, certain results remained thesame, such as the effects of officer race on occupational attitudes. Forboth types of models, non-white officers were significantly less likelyto favor aggressive patrol tactics.
Random slope model results
The previous analyses compared the absolute effects (e.g., OLSmodels) of officer demographics on occupational attitudes to their rela-tive effects (e.g., RIM)withinworkgroup settings.While the random in-tercept model results accounted for non-independence issues andprovided insight as to whether officers' relative demographic positionwithin a workgroup was associated with their attitudes, these modelstreated the relationships as fixed. In other words, the nature of theobserved relationships between officer demographics and their atti-tudes was still assumed to be the same across all workgroups. Fromthe relational demography perspective, however, it is plausiblethat the nature of the demographic-attitudinal relationships alsodiffers across workgroup contexts. Take for example the relationshipbetween officer years of experience and job satisfaction. While therandom intercept models from Table 4 indicated that, on average,
more experienced officers within workgroups were less satisfied withtheir job, it may be the case that in some of the sample workgroupsthis relationship: 1) is stronger than in other workgroups, 2) is weakerthan in other workgroups, or 3) is null, or nonexistent.
In order to examine this possibility, a series of random intercept, ran-dom slope models were estimated for each occupational attitude.7
These types of multilevel models examine whether the level 1, orindividual-level effects (i.e., slopes), vary significantly across groups(Aguinis, Gottfredson, & Culpepper, 2013). In the current context, theycan be used to test whether the demographic-attitudinal relationshipsvary across workgroups. Two methods were used for determiningwhether slopes for the demographic effects differed significantly acrossworkgroups. First, the slope variance estimates and standard errorsfrom the models were examined for each demographic effect and atti-tude. Statistically significant slope variance estimates provides empiri-cal support that the nature of that specific demographic-attitudinalrelationship varies across groups. A limitation of this method is thatthe standard error of the slope variance estimates can be biased,which can lead researchers to make Type II errors. As such, a secondmethod has been proposed to assess the importance of random slopes,a −2 log-likelihood difference test (see Aguinis et al., 2013). This testcompares the −2 log-likelihood value from the random slope modelto the value from the fixed effect model (e.g., the RIM in Table 4). Ifthe difference test indicates that the random slope model fits the databetter than the fixed effect model, then there is support for treatingthe slope as a random effect.
Table 5 presents the slope variance estimates and standard errorsfrom each of the random slope models as well as the results from the−2 log-likelihood difference tests. The findings indicated that five ofthe slopes varied significantly across workgroups. The effects of officerexperience on attitudes are perhaps most noteworthy as they werefound to vary across four of the attitudes: views toward top manage-ment, direct supervisors, job satisfaction, and aggressive patrol. Here,the effect of officers' years of experience on these attitudes varied,depending on the workgroup they were assigned to. Gender effects on

Table 5Random Slope Results
Variable Top Management DirectSupervisor
Job Satisfaction CitizenDistrust/Suspicion
Order Maintenance Aggressive Patrol
Var. Comp. −2 LLDiff.
Var. Comp. −2 LL Diff. Var. Comp. −2 LL Diff. Var. Comp. −2 LL Diff. Var. Comp. −2 LL Diff. Var. Comp. −2 LL Diff.
Female .32(.58) .39 .29(.29) 1.59 .74(.55) 4.36⁎ .16(.37) -.54 .46(2.30) -.55 .03(.02)a -.41Non-White .24(.72) -.27 .03(.43) -.46 .20(.38) -.40 .38(.35) 1.45 .05(.92) .01 .32(.57) .49Education .05(.04) 2.76† .01(.02) .55 .01(.03) .58 .01(.02) -.44 .02(.15) -.36 .01(.03) .03Experience .01(.00) 6.45⁎ .03(.01)†a 12.07⁎⁎⁎ .01(.00)⁎⁎ 256.47⁎⁎⁎ .00(.00) .71 .00(.01) -.40 .05(.03)a 7.46⁎⁎
⁎⁎⁎p b .001, ⁎⁎p b .01, ⁎p b .05, †p b .10; a = coefficients multiplied by 10.
Table 6Results of Cross-Level Interaction Models on Officer Job Satisfaction
Variables Model 1: Gender Model 2: Experience
Between-Level InterceptsIntercept 11.01(.54)⁎⁎⁎ 10.99(.54)⁎⁎⁎
Female 1.15(1.08) -----Experience ----- .08(.06)
Workgroup Level CharacteristicsSatisfaction Dispersion −1.83(.47)⁎⁎⁎ −1.85(.47)⁎⁎⁎
Proportion Female -.62(0.50) -.63(0.50)Proportion Non-white .44(.40) .44(.40)Avg. Educational Level -.10(.10) -.10(.10)Avg. Years of Experience -.06(.02)⁎⁎⁎ -.06(.02)⁎⁎⁎
Cross–level InteractionFemale X Satisfaction Dispersion -.38(1.88) -----Female X Proportion Female −4.81(2.06)⁎ -----Experience X Satisfaction Dispersion ----- -.24(.11)⁎
Experience X Avg. Years of Experience ----- -.00(.00)
⁎⁎⁎p b .001, ⁎⁎p b .01, ⁎p b .05.
316 J.R. Ingram, W. Terrill / Journal of Criminal Justice 42 (2014) 309–320
officer job satisfaction also varied across groups. Thus, the effect of beingfemale on job satisfaction also differed depending on the group inwhichthe officer worked.
Overall, there was some empirical support that the relationships be-tween officer demographic characteristics and attitudes differed acrossworkgroup contexts. Though, this support was found primarily for atti-tudes pertaining to officers' organizational environments. With the ex-ception of the slope for officer experience on aggressive patrol tactics,random-slope effects were exclusive to officer views toward top man-agement, direct supervisors, and job satisfaction. This suggests thatthe observed relationships between officer demographics and attitudestoward citizens, role orientations, and patrol tactics (i.e., the RIM resultsin Table 4) operate similarly across all workgroup contexts. On the otherhand, findings from the random slope models provided evidence thatcertain individual-level relationships between officer demographiccharacteristics and occupational attitudes differed across workgroupsettings, suggesting that characteristics of officers' workgroup environ-ments may serve to explain these differences.
Cross-level interaction results: Illustrative example for officer jobsatisfaction
In order to further investigate the viability of the relational demogra-phy approach, we conducted additional analyses to provide an illustra-tive example for how the framework might be applied to research inthis area. Specifically,we examinedhow the approachmight add insightinto the study of demographic effects on officer job satisfaction. Job sat-isfactionwas chosen as the example for two reasons. From an empiricalstandpoint, the random slope results showed evidence of two randomdemographic effects (i.e., gender and experience) as opposed to justone (or none) across the other attitudes used in the study. From a con-ceptual standpoint, the influence of officer demographics on job satis-faction has been a popular topic of inquiry, but one with limitedempirical support (see Table 1). Since prior research has primarily con-sidered these relationships as absolute in nature, taking a relational ap-proach has the potential to offer an alternative perspective to researchin this area.
Within the workgroup context, factors associated with workgroupdemography and culture (i.e., the extent towhich officerswithin groupsshare attitudes) constitute elements that could explain the variabilityin gender and experience effects on officer satisfaction. For example,female officers may be more (or less) satisfied with their jobs inworkgroups with higher numbers of female officers. On the otherhand, in workgroups with strong cultures, where officers stronglyshare views on satisfaction, individual effects are likely to be constrained.In these contexts, the effect of being female on satisfactionmay not be asstrong.
Cross-level interaction models were used to test these possibilities.Here, the workgroup-level measures were introduced as level 2 vari-ables and modeled as both independent effects on officer job satisfac-tion as well as interaction effects with the random slopes. Threeworkgroup-level measures from Table 3 were used in the currentanalyses: proportion of female officers in the workgroup (proportion
female), the average years of experience of officers in the workgroup(average years of experience), and the extent to which officers’ sharedviews of job satisfaction (satisfaction dispersion).
Table 6 presents the relevant estimates for the estimated cross-levelinteraction models. Due to the complex nature of these analyses, sepa-rate models were estimated: one estimating interaction effects forofficer gender (Model 1) and one estimating interaction effects forofficer experience (Model 2). Results fromModel 1 showed a significantcross-level interaction between the proportion of female officers inthe workgroup and the effect of being female on officer satisfaction(b = −4.81, s.e. = 2.06, p b .05). Furthermore, the proportion offemale officers and satisfaction dispersion variables were found tocollectively explain approximately 38 percent of the total varianceof the random slope effect (i.e., the gender-satisfaction randomeffect).8 Results from Model 2 revealed a significant cross-level inter-action between satisfaction dispersion levels and the effect of officer ex-perience on satisfaction (b = − .24, s.e. = .11, p b .05). Collectively,average experience levels of the workgroup and satisfaction dispersionlevels explained approximately 20 percent of the total variance of therandom slope effect (i.e., the experience-satisfaction random effect).
In order to better illustrate the nature of these findings, the signifi-cant interaction effects were plotted and are presented in Fig. 1. Forthe cross-level effect of proportion female on the relationship betweenfemale and satisfaction, the plots indicate that the relationship betweenbeing female and job satisfaction becomes stronger as the proportion offemale in workgroups increases. However, this relationship is negative:as the proportion of female officers increases, being female leads togreater job dissatisfaction. With respect to the plot for officer experi-ence, the negative effect of officer experience on job satisfaction ismore pronounced in workgroups that have high levels of attitudinaldispersion. In workgroup contexts where officers do not share thesame views of satisfaction, officer experience plays a more prominentrole in explaining officer dissatisfaction than in contexts where officersstrongly share satisfaction levels.

10
10.5
11
11.5
12
12.5
highmedlow
Job
Sat
isfa
ctio
n
Proportion of Female Officers in Workgroup
Officer Gender & Proportion of Female Officers
Gender
Female
Male
7
7.5
8
8.5
9
9.5
10
highmedlow
Job
Sat
isfa
ctio
n
Experience Levels
Officer Experience & Satisfaction Dispersion Levels
Satisfaction Dispersionhigh
med
low
Fig. 1. Cross-Level Interaction Plots for Officer Job Satisfaction.
317J.R. Ingram, W. Terrill / Journal of Criminal Justice 42 (2014) 309–320
Discussion
Researchers have long held an interest in understanding what rolevarying officer characteristics (e.g., gender, race, education, experience)play in terms of attitudinal variation. Much of this interest can be tracedto police cultural components in terms of how different types of policeofficers view their organizational and occupational environments.Despite the volume of research produced over the years the evidenceshows that officer demographics have, at best, an inconsistent effecton their attitudes. However, prior research has generally assumed therelationship between officer demographics and attitudes to be thesame, or similar, across all officers. Moreover, much of the researchto date has relied on analytical models that assume observations areindependent from one another. Hence, the inconsistent findings fromprevious work may be more a result of the manner in which thedemographic-attitudinal relationship has been studied rather than theabsence of a true effect.
The present study incorporated a theoretical and analytic approachdesigned to address these potential issues. More specifically, wedrew on relational demography from a theoretical perspective to con-sider the broader context in which police officers work (i.e., theworkgroup). In particular, we considered demographic effects to berelative to the unit an individual works in rather than universal acrossall individuals. A series of statistical techniques designed to fully
consider the relationship between numerous officer demographiccharacteristics (i.e., gender, race, education, and experience) andoccupational attitudes (i.e., views toward top management, directsupervisors, job satisfaction, citizen distrust, order maintenance, andaggressive patrol) were employed. We found that the extent of varia-tion in officers' occupational attitudes was associated with workgroupmembership, showing that officers' attitudes are not independentof each other, and that the extent to which officers share occupationalattitudes varied across workgroups. Further analyses demonstratedthe importance of considering the role of workgroup membership onofficer attitudes.
Themost notablefindingswere for the effect of officer experience onoccupational attitudes. Specifically, experience was significantly associ-ated with officers' views towardmanagement, supervisors, job satisfac-tion, and citizens, even after accounting for workgroup membership.Upon further analysis, however, we found that the effect of experienceon officer attitudes was not the same across all workgroup contexts.For example, the relationship between officer experience and job satis-faction was dependent upon the cultural context of the workgroup. Inworkgroups where officers tended to share similar views toward jobsatisfaction, officer experience had little effect. Thus, the results indicatethat the relationship between experience and attitudes is perhapsbetter viewed as relative to the officers' assigned workgroup, ratherthan universal across all officers.

318 J.R. Ingram, W. Terrill / Journal of Criminal Justice 42 (2014) 309–320
The results for officer gender also provided some interestingfindings. While the traditional model indicated female officers heldsignificantly less favorable views toward aggressive patrol tactics, thisfinding became non-significant after accounting for officers' relativeposition within their workgroup on this demographic characteristic.Furthermore, gender effects on job satisfaction varied acrossworkgroupsettings. In some workgroups, female officers were more satisfied withtheir jobs than in other groups, and this relationship was dependentupon the proportion of female officers assigned to the group. In this re-gard, the results provide support for the notion that the effect of genderon satisfaction is also relative to the unit where officers work.
With respect to education, the results suggest that this demographiccharacteristic is not associated with officers' views toward citizens,order maintenance, or aggressive patrol. Furthermore, education hadlittle effect on views toward management and direct supervisorsonce accounting for workgroup membership. One consistent finding,however, was that more highly educated officers were significantlyless satisfied with their jobs. Collectively, the results did not provideany evidence that the relationship differed across workgroup contexts.Thus, the current results do not support the notion that education-attitudinal relationships are influenced by workgroup context.
Finally, the effect of race on occupational attitudes was also uninflu-enced byworkgroup context. Accounting forworkgroupmembership inthe random intercept models did not substantively change the results.Race effects were also not found to differ across workgroups. Future re-search, however, could expand on this inquiry by incorporating alterna-tive perspectives related to the organizational demography framework.Of the four demographic characteristics under study, race effects mightalso be captured using a diversity framework, as opposed to the trait-based framework under which the current study primarily operates.Workgroup diversity is a theoretically and methodologically distinctconcept from demography (see Knippenberg & Schippers, 2007), andso taking such a perspective could offer additional insight into the effectof race on officer attitudes.
The findings as a whole point to a number of important issues. First,the demographic-attitudinal relationship does not necessarily exist in asocial vacuum, but is influenced by an officers’ broaderworkgroup envi-ronment. In some cases the workgroup influence can be rather strong,but in others the effect may be marginal. The key is that the study ofindividual demographics does not always adhere to a one sizefits all ap-proach. Second, and in a related manner, the findings lend even moresupport to a growing body of literature showing that police culturalfeatures are contextual in nature. For example, the results found somesupport for the notion that individual officer characteristics are less in-fluential in contexts with strong cultures. Third, research has tendedto overlook the issue of independence of observations. In the case ofthe demographic-attitudinal relationship, the inconsistent results fromprior research could be due, in part, to non-independence issues associ-ated with both officer attitudes and demographics. As we showed here,addressing this issue through both careful theoretical and statisticalapplications can alter and enhance the findings.
We urge future researchers to carefully consider both the theoreticaland analytical issues raised here. Theoretically, we borrowed fromthe organizational sciences to draw on relational demography to morethoroughly consider the potential role of officer characteristics. Addi-tionally, we used varying techniques (attitudinal dispersion techniques,intraclass correlation coefficients, and random intercept and slopemodels) to test for potential effects. By combing these approaches wewere able tomore fully examine the relationship between officer demo-graphics and occupational outlooks.
Limitations & future research
Before discussing the implications of the findings, certain limitationsof the study should be considered. One limitation concerns the general-izability of the results to other departments, to assignments other than
patrol, and to other fields within the criminal justice system. While thestudy departments were selected to be representative of medium tolarge sized agencies, the findings may not extend to departments thatare more highly centralized and have fewer officers. In this regard, theworkgroup context may not serve as a prominent organizational levelin such agencies. Similarly, the study focused solely on patrol officers.Differences in occupational attitudes, demographic influences, andwork environments likely exist for other types of officer assignments,such as administration, investigation, or specialized units. Furthermore,such differences may also exist for other components of the criminaljustice system, such as corrections. Future research would benefit byexploring the viability of the relational demography approach to thestudy of occupational attitudes across departments of varying sizes, insamples that include additional assignments, and across other criminaljustice fields.
Second, the scope of the current inquiry focused exclusively on therelationship between officer demographics and occupational attitudes.In doing so, it allowed for the examination of four demographic charac-teristics across a broad range of attitudes common to research inthis area. However, this came at the expense of including other influ-ences, specific to each attitude, which could impact the results. Forexample, research has found task characteristics (e.g., autonomy, varie-ty, and conflict) and the organizational environment (e.g., support andcohesion) to be associated with officers' job satisfaction, in addition todemographics (see Johnson, 2012; Zhao et al., 1999). Future researchshould expand on the current inquiry by incorporating such factors tosee how they might impact the results reported here.
Furthermore, while specific moderating relationships were exam-ined for officer job satisfaction, it was beyond the scope of the currentinquiry to fully investigate such relationships across all attitudes. Inthis regard, future research is warranted to examine how workgroupdemography and culture might impact the observed differences in theother demographic-attitudinal relationships reported here. Finally,while associations between demographic characteristics, workgroupdemography, and attitudes were uncovered, the current study couldnot readily account for why such associations exist. Future researchcould, for example, focus on why female officers might be less satisfiedin workgroups with a higher proportion of female officers. In this re-gard, the use of alternativemethodologies (e.g., qualitative approaches)could serve to identify potential reasons that would add insight to thecurrent findings.
Conclusion
From a practical perspective, the results demonstrate the need foradministrators to consider a range of potential responses should a par-ticular attitudinal disposition become a concern of departments. Forexample, if job satisfaction is a concern, the current findings point totwo types of managerial responses that could serve to increase satisfac-tion levels. First, the demographic composition of patrol assignments(e.g., gender composition) had a modest influence on satisfaction.Thus, the findings suggest that who one works with matters. Since assign-ment responsibility is directly within the purview of managerial control(short of police union specifications), the demographic distribution ofofficers can essentially be manipulated. While this type of responsemay only produce modest gains, demography is one feature of thework environment that can be more readily managed or altered as op-posed to other environmental features (e.g., crime rates, communitycharacteristics, or job tasks).
Second, the results also show that the strength of a group's culturecan serve tominimize the negative effects that individual characteristicshave on satisfaction. Prior research has foundmore experienced officersto be significantly less satisfiedwith their jobs. However, the current re-sults suggest that when officers work in groups with strong cultures,this specific relationship is mitigated. Admittedly, more research isneeded to determine why this is the case, but the results do highlight

319J.R. Ingram, W. Terrill / Journal of Criminal Justice 42 (2014) 309–320
the potential benefit that the cultural context of a unit can have on jobsatisfaction. Thus, focusing onways to promote a strong sense of cultureamongst work units could address the negative impact that yearsof experience has been found to have on officers' job satisfaction. Inessence, just as the results imply that the study of individual demo-graphics does not always adhere to a one size fits all approach, the con-sideration of potential managerial responses to this issue should bewide-ranging as well.
Appendix A. Attitudinal survey items
Top Management (3 items; α = .70)When an officer does a particularly good job, TM will publicly recognize his/herperformance?
When an officer gets written up for minor violations of the rules, he/she will betreated fairly by TM?
When an officer contributes to a team effort rather than look good individually, TMwill recognize it?
Direct Supervisors (2 items; α = .78)My supervisor’s approach tends to discourage me from giving extra effort. (recoded)My supervisor looks out for the personal welfare of his/her subordinates.Job Satisfaction (3 items; α = .63)I would not consider taking another job. (recoded)I like my job better than the average police officer does. (recoded)I find real enjoyment in my job. (recoded)Citizen Distrust/Suspicion (2 items; α = .81)Police officers have reason to be distrustful of most citizens. (recoded)Police officers have reason to be suspicious of most citizens. (recoded)Order Maintenance (6 items; α = .75)Law enforcement officers should be required to do something about…Public nuisances (e.g., loud parties, barking dogs, etc.).Neighbor disputes.Family disputes.Parents who don’t control their kids.Litter and trash.Nuisance businesses.
Aggressive Patrol (1 item)A good police officer is one who patrols aggressively by stopping cars, checking outpeople, running license checks, and so forth. (recoded)
Items based on 4 point Likert scale ranging from 1 (Strongly Agree) to 4 (StronglyDisagree).
Notes
1. For a more comprehensive discussion of gender effects on officer attitudes, see(Poteyeva & Sun, 2009).
2. The Fort Wayne Police Department did not use a roll call system, thus we coordi-nated with the department’s annual in-service training and administered the surveyduring these training sessions.
3. Even though we had an a priori plan to survey officers around their scheduleddays off (i.e., via the official work roster), we could not control for officers that weresupposed to be at the roll call but were absent due to a variety of reasons (e.g., illness,vacation, training, court, military duty, suspension, etc.).
4. In APD, FWPD, and KPD officers were assigned to squads or teams on each shift.For example, in APD the morning shift in Precinct A had three teams assigned to it. Offi-cers on each team worked the same days on duty. For these three departments, eachsquad or team reflects a workgroup. In PPB and CSPD, officers work assignments on eachshift were staggered based on their days on duty. For these two sites, workgroupsconsisted of officers who had the same days on duty and days off duty. In other words,in these two sites workgroups consisted of officers who held the same work scheduleon the same shift in the same precinct.
5. KPD contributed fewer workgroups (14 squads) to the sample due to the fact thatit was the smallest department that participated in the study. For example, KPD wasdivided into two precincts each with seven patrol squads (i.e., 2 day shift, 2 afternoonshift, 2 power shift, and 1 night shift). The other participating departments were larger,divided into four to five precincts, contributing more workgroups to the sample.
6. Four dummy variables were included as department controls with APD serving asthe reference department. For the RIM, the department control variables were grandmean centered.
7. Due to the complexity of the analyses, separate models were conducted for eachdemographic effect (Aguinis et al., 2013).
8. This was calculated using the approach offered by Aguinis et al., 2013 (see pg. 1518).
References
Aguinis, H., Gottfredson, R. K., & Culpepper, S. A. (2013). Best-practice recommendationsfor estimating cross-level interaction effects using multilevel modeling. Journal ofManagement, 39(6), 1490–1528.
Bittner, E. (1970). The functions of police in modern society: A review of background factors,current practices, and possible role models. Chevy Chase, MD: National Institute ofMental Health Center for Studies of Crime and Delinquency.
Bliese, P. D. (2000). Within-group agreement, non-independence, and reliability: Implica-tions for data aggregation and analysis. In K. J. Klein, & S. W. J. Kozlowski (Eds.),Multilevel Theory, Research, and Methods in Organizations: Foundations, Extensions,and New Directions (pp. 349–381). San Francisco: Jossey-Bass.
Bliese, P. D., & Hanges, P. (2004). Being both to liberal and too conservative: The perils oftreating grouped data as though they were independent. Organizational ResearchMethods, 7(4), 400–417.
Broderick, J. (1977). Police in a time of change. Morristown, NJ: General Learning Press.Brooks, L., Piquero, A., & Cronin, J. (1993). Police officer attitudes concerning their com-
munities and their roles: A comparison of two suburban police departments.American Journal of Police, 12(3), 115–140.
Brown, M. (1988). Working the street: Police discretion and the dilemmas of reform.New York: Russell Sage Foundation.
Burke, M. J., & Dunlap, W. P. (2002). Estimating interrater agreement with the averagedeviation index: A user’s guide. Organizational Research Methods, 5, 159–172.
Burke, M. J., Finkelstein, L. M., & Dusig, M. S. (1999). On average deviation indices forestimating interrater agreement. Organizational Research Methods, 2, 49–68.
Carlan, P. (2007). The search for job satisfaction: A survey of Alabama policing. AmericanJournal of Criminal Justice, 32, 74–86.
Carroll, G. R. (2008). Organizational demography. In S. R. Clegg, & J. R. Bailey (Eds.),International Encyclopedia of Organization Studies, Vol. 3. (pp. 1042–1044). ThousandOaks, CA: Sage Publications.
Dantzker, M., & Kubin, B. (1998). Job satisfaction: The gender perspective among policeofficers. American Journal of Criminal Justice, 23(1), 19–31.
DeJong, C. (2004). Gender differences in officer attitudes and behavior: Providing comfortto citizens. Women and Criminal Justice, 15(3/4), 1–32.
Drummond, D. S. (1976). Police culture. Beverly Hills: Sage Publications.Dunlap, W. P., Burke, M. J., & Smith-Crowe, K. (2003). Accurate tests of statistical signifi-
cance for rwg and average deviation interrater agreement indexes. Journal of AppliedPsychology, 88, 356–362.
Enders, C. K., & Tofighi, D. (2007). Centering predictor variables in cross-sectional multi-level models: A new look at an old issue. Psychological Methods, 12, 121–138.
Frank, J., & Brandl, S. (1991). The police attitude-behavior relationship: Methodologicaland conceptual considerations. American Journal of Police, 10(4), 83–103.
Hassell, K. D. (2006). Police organizational cultures and patrol practices. New York: LFBScholarly Publishing.
Hassell, K. D., Archbold, C. A., & Stichman, A. J. (2011). Comparing the workplace experi-ences of male and female officers: Examining workplace problems, stress, job satis-faction and consideration of career change. International Journal of Police Science &Management, 13(1), 37–53.
Herbert, S. (1998). Police subculture reconsidered. Criminology, 36(2), 343–369.Hunt, R., & McCadden, K. (1985). A survey of work attitudes of police officers: Commit-
ment and satisfaction. Police Studies, 8, 17–25.Ingram, J. R., Paoline, E. A., III, & Terrill, W. (2013). A multilevel framework for under-
standing police culture: The role of the workgroup. Criminology, 51(2), 365–397.James, L. R., Demaree, R. G., & Wolf, G. (1984). Estimating within-group interrater reli-
ability with and without response bias. Journal of Applied Psychology, 69, 85–98.Johnson, R. R. (2012). Police officer job satisfaction: A multidimensional analysis. Police
Quarterly, 15(2), 157–176.Kirchmeyer, C. (1995). Demographic similarity to the work group: A longitudinal study of
managers at the early career stage. Journal of Organizational Behavior, 16, 67–83.Knippenberg, D. V., & Schippers, M. C. (2007). Workgroup diversity. Annual Review of
Psychology, 58, 515–541.Koenig, J. A., & Lissitz, R. W. (2001). The effects of centering method on parameter esti-
mates and variance explained in multilevel models. Paper presented at the AnnualMeeting of the American Educational Research Association, Seattle, Washington.
Kozlowski, S. W. J., & Bell, B. S. (2003). Work groups and teams in organizations. In W. C.Borman, D. R. Ilgen, & R. J. Kilmoski (Eds.), Handbook of Psychology: Industrial andOrganizational Psychology, Vol. 12. (pp. 333–375). London: Wiley.
Kozlowski, S. W. J., & Hattrup, K. (1992). A disagreement about within group agreement:Disentangling issues of consistency versus consensus. Journal of Applied Psychology,77, 161–167.
Kozlowski, S., & Klein, K. J. (2000). A multilevel approach to theory and research in orga-nizations: Contextual, temporal, and emergent processes. In K. Klein, & S. Kozlowski(Eds.),Multilevel theory, research, and methods in organization: Foundations, extensions,and new directions (pp. 3–90). San Francisco: Jossey-Bass.
Krimmel, J. T., & Gormley, P. E. (2003). Tokenism and job satisfaction for police women.American Journal of Criminal Justice, 28(1), 73–88.
Lord, V., & Friday, P. (2008).What really influences officer attitudes toward COP?: The im-portance of context. Police Quarterly, 11(2), 220–238.
Manning, P. K. (1995). Occupational culture. In W. Bailey (Ed.), The encyclopedia of policescience (pp. 472–475). New York: Garland Publishing.
Manning, P. K. (1997). Police work: The social organization of policing (2nd ed.). ProspectHeights, IL: Waveland Press.
Manning, P. K. (2005). The study of policing. Police Quarterly, 8(1), 23–44.Maume, D. J., & Sebastian, R. (2007). Racial composition of workgroups and job satisfac-
tion amongWhites. The Annals of the American Academy of Political and Social Science,609, 85–103.

320 J.R. Ingram, W. Terrill / Journal of Criminal Justice 42 (2014) 309–320
Miller, H. A., Mire, S., & Bitna, K. (2009). Predictors of job satisfaction among policeofficers: Does personality matter? Journal of Criminal Justice, 37, 419–426.
Moon, B., & Zager, L. (2007). Police officers’ attitudes toward citizen support: Focuson individual, organizational, and neighborhood characteristic factors. Policing:An International Journal of Police Strategies and Management, 30(3), 484–497.
Muir, W. K. (1977). Police: Streetcorner politicians. Chicago: University of Chicago Press.O'Reilly, C. A., Caldwell, D. F., & Barnett, W. P. (1989). Workgroup demography, social
integration, and turnover. Administrative Science Quarterly, 34, 21–37.Paoline, E. A., III (2003). Taking stock: Toward a richer understanding of police culture.
Journal of Criminal Justice, 31, 199–214.Paoline, E., Myers, S., & Worden, R. (2000). Police culture, individualism, and community
policing: Evidence from two police departments. Justice Quarterly, 17(3), 575–605.Pfeffer, J. (1983). Organizational demography. In L. L. Cummings, & B. M. Staw (Eds.),
Research in organizational behavior, Vol. 5. (pp. 299–357). Greenwich, CT: JAI Press.Poteyeva, M., & Sun, I. (2009). Gender differences in police officer attitudes: Assessing
current empirical evidence. Journal of Criminal Justice, 31, 512–522.Raudenbush, S., & Bryk, A. (2002).Hierarchical linear models: Applications and data analysis
methods (2nd ed.). Thousand Oaks: Sage.Reuss-Ianni, E. (1983). Two cultures of policing: Street cops and management cops.
New Brunswick, NJ: Transaction Publishers.Riordan, C. M., & Shore, L. M. (1997). Demographic diversity and employee attitudes: An
empirical examination of relational demography within work units. Journal of AppliedPsychology, 82(3), 342–358.
Riordan, C. M., & Wayne, J. H. (2008). A review and examination of demographic similar-ity measures used to assess relational demography within groups. OrganizationalResearch Methods, 11(3), 562–592.
Rubinstein, J. (1973). City police. New York: Farrar, Straus, and Giroux.Schafer, J. (2002). “I’mnot against it in theory…”: Global and specific community policing
attitudes. Policing: An International Journal of Police Strategies and Management, 25(4),669–686.
Skolnick, J. (1967). Justice without trial: Law enforcement in democratic society. New York:John Wiley & Sons.
Sun, I. (2002). Police officers attitudes toward peers, supervisors, and citizens: A compar-ison between field training officers and regular officers. American Journal of CriminalJustice, 27(1), 69–83.
Sun, I. (2003). Police officers’ attitudes toward their role and work: A comparison of blackand white officers. American Journal of Criminal Justice, 28(1), 90–108.
Van Maanen, J. (1974). Working the street: A developmental view of police behavior.In H. Jacob (Ed.), The potential for reform of criminal justice (pp. 83–130). Beverly Hills:Sage.
Westley, W. (1970). Violence and the police. Cambridge, MA: MIT Press.White, S. (1972). A perspective on police professionalization. Law and Society Review, 7,
61–85.Worden, R. (1990). A badge and a baccalaureate: Policies, hypotheses, and further
evidence. Justice Quarterly, 7(3), 565–592.Worden, A. P. (1993). The attitudes of women and men in policing: Testing conventional
and contemporary wisdom. Criminology, 31(2), 203–241.Worden, R. (1995). Police officers’ belief systems: A framework for analysis. American
Journal of Police, 14(1), 49–81.Zhao, J., Thurman, Q., & He, N. (1999). Sources of job satisfaction among police officers:
A test of demographic and work environment models. Justice Quarterly, 16(1),153–173.