A comparative demography of plants based upon elasticities of vital rates
9
Open Research Online The Open University’s repository of research publications and other research outputs A Comparative demography of plants based upon elas- ticities of vital rates Journal Article How to cite: Franco, Miguel and Silvertown, Jonathan (2004). A Comparative demography of plants based upon elasticities of vital rates. Ecology, 85(2), pp. 531–538. For guidance on citations see FAQs . c [not recorded] Version: [not recorded] Link(s) to article on publisher’s website: http://www.esajournals.org/esaonline/?request=get-abstract&issn=0012-9658&volume=085&issue=02&page=0531 Copyright and Moral Rights for the articles on this site are retained by the individual authors and/or other copy- right owners. For more information on Open Research Online’s data policy on reuse of materials please consult the policies page. oro.open.ac.uk
Transcript of A comparative demography of plants based upon elasticities of vital rates

Open Research OnlineThe Open University’s repository of research publicationsand other research outputs
A Comparative demography of plants based upon elas-ticities of vital rates
Journal ArticleHow to cite:
Franco, Miguel and Silvertown, Jonathan (2004). A Comparative demography of plants based uponelasticities of vital rates. Ecology, 85(2), pp. 531–538.
For guidance on citations see FAQs.
c© [not recorded]
Version: [not recorded]
Link(s) to article on publisher’s website:http://www.esajournals.org/esaonline/?request=get-abstract&issn=0012-9658&volume=085&issue=02&page=0531
Copyright and Moral Rights for the articles on this site are retained by the individual authors and/or other copy-right owners. For more information on Open Research Online’s data policy on reuse of materials please consultthe policies page.
oro.open.ac.uk

531
Ecology, 85(2), 2004, pp. 531–538q 2004 by the Ecological Society of America
A COMPARATIVE DEMOGRAPHY OF PLANTS BASED UPONELASTICITIES OF VITAL RATES
MIGUEL FRANCO1,3 AND JONATHAN SILVERTOWN2
1Marine Biology and Ecology Research Group, School of Biological Sciences, University of Plymouth, Drake Circus,Plymouth PL4 8AA, UK
2Department of Biological Sciences, Open University, Walton Hall, Milton Keynes MK7 6AA, UK
Abstract. Elasticities of matrix elements from population projection matrices are com-monly used to analyze the relative contributions of different life history transitions (birth,survival, growth) to the finite rate of increase (l). Hitherto, comparative demography basedon matrix models has relied upon decomposing elasticity matrices into blocks, each con-taining matrix elements deemed to represent recruitment, stasis, or progression to largersize classes. Elasticities across an entire matrix always sum to unity, and different popu-lations and species can be compared on the basis of the relative proportions of these threevariables. This method has been widely used, but it contains a weakness in that the valueof matrix elements is a function of more than one vital rate. For example, transitionsrepresenting progression to larger size classes involve a survival rate as well as a growthrate. Ideally, then, demographic comparisons between populations should be made usingelasticities of vital rates themselves, rather than elasticities of matrix elements that arecompounds of those rates. Here, we employ the complete set of general equations for theelasticity of vital rates in an entirely new analysis of matrices for 102 species of perennialplants. The results show a surprising similarity to an earlier analysis based upon matrixelement elasticity and provide important confirmation of general patterns of correlationbetween plant life history and demography. In addition, we show that individual vital rateelasticities cannot, on their own, predict variation in life history. Therefore, all three de-mographic processes (survival, growth, and reproduction) are necessary to account for lifehistory variation. The new analysis provides a firmer foundation for comparative demog-raphy.
Key words: age at first reproduction; damping ratio; demographic triangle; elasticity analysis;finite rate of increase; generation time; longevity; net reproductive rate; perennial plants; period ofoscillation; population projection matrix.
INTRODUCTION
Comparative biology seeks to uncover the funda-mental variables that lie hidden within the rich varietyof form and life history found among living speciesand to discern their influence in shaping this variation.In the field of demography, the fundamental variablesare the age- or stage-specific vital rates of survival,growth, and fecundity and the theory applying to struc-tured populations is very well developed. Though thefundamental variables are clearly identified, the distri-bution of living populations in the space defined bythese parameters is less well understood. This is a sol-uble problem because there now exists a substantialdata set of matrix models for plant populations basedupon stage- or size-specific vital rates measured in thefield. This type of model is a singularly appropriatetool for the analysis of the complex life cycles typicalof perennial plants and provides a sound basis for com-parative analysis (Caswell 2001).
Manuscript received 21 October 2002; revised 25 March 2003;accepted 27 March 2003; final version received 13 June 2003.Corresponding Editor: W. S. C. Gurney.
3 E-mail: [email protected]
Hitherto, comparative demography based on matrixmodels has relied upon decomposing an elasticity ma-trix (de Kroon et al. 1986) for each population intothree components, one each for the matrix elementsrepresenting recruitment, stasis (survival with nochange in size class), and progression to larger sizeclasses. The elasticity value for a particular matrix el-ement measures the effect on the finite rate of increase(l) of small perturbations to the corresponding tran-sition in the life cycle. Since elasticities across an entirematrix always sum to unity, different populations canbe compared on the basis of the relative proportions ofthese three components. Using this method, Silvertownet al. (1993) found that semelparous perennial herbs,iteroparous herbs, and woody plants each tended tooccupy a different region of the parameter space de-fined by the three components. Among iteroparousherbs, there was also a difference between species offorest and open habitats. Subsequent studies of speciesnot included in the dataset analyzed by Silvertown etal. (1993) have tended to confirm the original patterns(e.g., Bullock et al. 1994, Floyd and Ranker 1998).
Silvertown and Franco (1993) used the same tech-nique for intraspecific comparisons between herb pop-
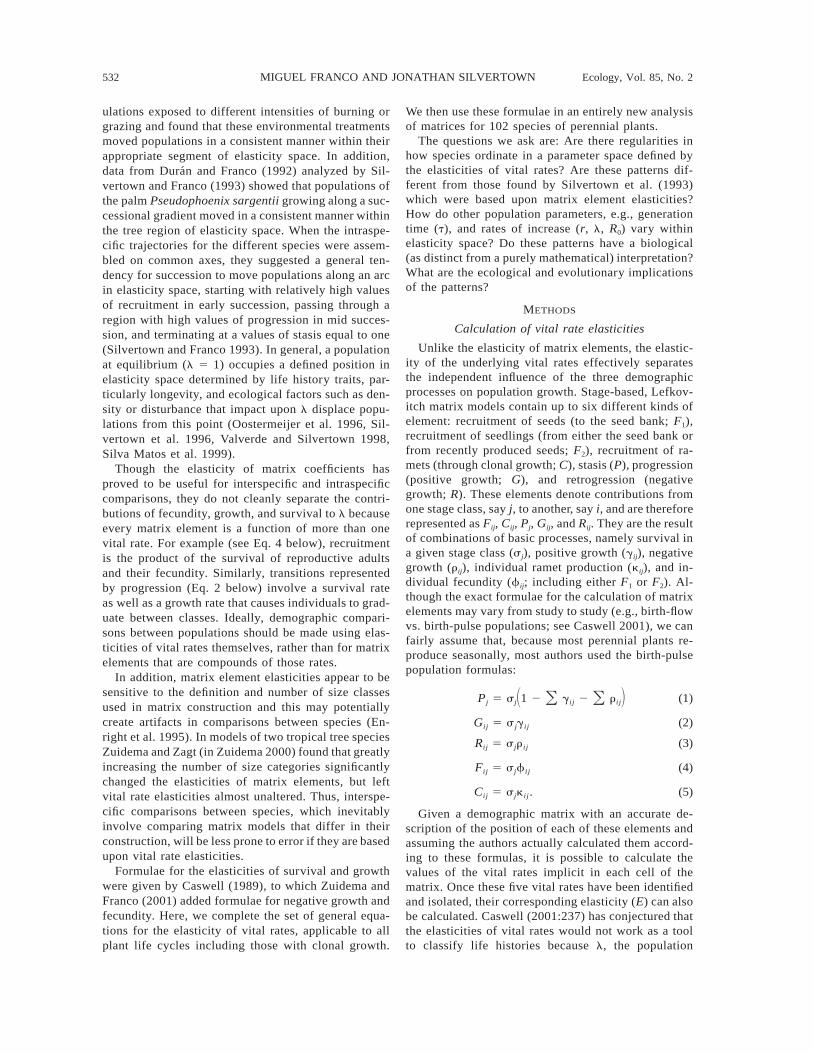
532 MIGUEL FRANCO AND JONATHAN SILVERTOWN Ecology, Vol. 85, No. 2
ulations exposed to different intensities of burning orgrazing and found that these environmental treatmentsmoved populations in a consistent manner within theirappropriate segment of elasticity space. In addition,data from Duran and Franco (1992) analyzed by Sil-vertown and Franco (1993) showed that populations ofthe palm Pseudophoenix sargentii growing along a suc-cessional gradient moved in a consistent manner withinthe tree region of elasticity space. When the intraspe-cific trajectories for the different species were assem-bled on common axes, they suggested a general ten-dency for succession to move populations along an arcin elasticity space, starting with relatively high valuesof recruitment in early succession, passing through aregion with high values of progression in mid succes-sion, and terminating at a values of stasis equal to one(Silvertown and Franco 1993). In general, a populationat equilibrium (l 5 1) occupies a defined position inelasticity space determined by life history traits, par-ticularly longevity, and ecological factors such as den-sity or disturbance that impact upon l displace popu-lations from this point (Oostermeijer et al. 1996, Sil-vertown et al. 1996, Valverde and Silvertown 1998,Silva Matos et al. 1999).
Though the elasticity of matrix coefficients hasproved to be useful for interspecific and intraspecificcomparisons, they do not cleanly separate the contri-butions of fecundity, growth, and survival to l becauseevery matrix element is a function of more than onevital rate. For example (see Eq. 4 below), recruitmentis the product of the survival of reproductive adultsand their fecundity. Similarly, transitions representedby progression (Eq. 2 below) involve a survival rateas well as a growth rate that causes individuals to grad-uate between classes. Ideally, demographic compari-sons between populations should be made using elas-ticities of vital rates themselves, rather than for matrixelements that are compounds of those rates.
In addition, matrix element elasticities appear to besensitive to the definition and number of size classesused in matrix construction and this may potentiallycreate artifacts in comparisons between species (En-right et al. 1995). In models of two tropical tree speciesZuidema and Zagt (in Zuidema 2000) found that greatlyincreasing the number of size categories significantlychanged the elasticities of matrix elements, but leftvital rate elasticities almost unaltered. Thus, interspe-cific comparisons between species, which inevitablyinvolve comparing matrix models that differ in theirconstruction, will be less prone to error if they are basedupon vital rate elasticities.
Formulae for the elasticities of survival and growthwere given by Caswell (1989), to which Zuidema andFranco (2001) added formulae for negative growth andfecundity. Here, we complete the set of general equa-tions for the elasticity of vital rates, applicable to allplant life cycles including those with clonal growth.
We then use these formulae in an entirely new analysisof matrices for 102 species of perennial plants.
The questions we ask are: Are there regularities inhow species ordinate in a parameter space defined bythe elasticities of vital rates? Are these patterns dif-ferent from those found by Silvertown et al. (1993)which were based upon matrix element elasticities?How do other population parameters, e.g., generationtime (t), and rates of increase (r, l, R0) vary withinelasticity space? Do these patterns have a biological(as distinct from a purely mathematical) interpretation?What are the ecological and evolutionary implicationsof the patterns?
METHODS
Calculation of vital rate elasticities
Unlike the elasticity of matrix elements, the elastic-ity of the underlying vital rates effectively separatesthe independent influence of the three demographicprocesses on population growth. Stage-based, Lefkov-itch matrix models contain up to six different kinds ofelement: recruitment of seeds (to the seed bank; F1),recruitment of seedlings (from either the seed bank orfrom recently produced seeds; F2), recruitment of ra-mets (through clonal growth; C), stasis (P), progression(positive growth; G), and retrogression (negativegrowth; R). These elements denote contributions fromone stage class, say j, to another, say i, and are thereforerepresented as Fij, Cij, Pj, Gij, and Rij. They are the resultof combinations of basic processes, namely survival ina given stage class (sj), positive growth (gij), negativegrowth (rij), individual ramet production (kij), and in-dividual fecundity (fij; including either F1 or F2). Al-though the exact formulae for the calculation of matrixelements may vary from study to study (e.g., birth-flowvs. birth-pulse populations; see Caswell 2001), we canfairly assume that, because most perennial plants re-produce seasonally, most authors used the birth-pulsepopulation formulas:
P 5 s 1 2 g 2 r (1)1 O O 2j j i j i j
G 5 s g (2)i j j i j
R 5 s r (3)i j j i j
F 5 s f (4)i j j i j
C 5 s k . (5)i j j i j
Given a demographic matrix with an accurate de-scription of the position of each of these elements andassuming the authors actually calculated them accord-ing to these formulas, it is possible to calculate thevalues of the vital rates implicit in each cell of thematrix. Once these five vital rates have been identifiedand isolated, their corresponding elasticity (E) can alsobe calculated. Caswell (2001:237) has conjectured thatthe elasticities of vital rates would not work as a toolto classify life histories because l, the population

February 2004 533COMPARATIVE DEMOGRAPHY OF PLANTS
growth rate, is a homogeneous function of degree 2 ofall vital rates and, therefore, their elasticities must addup to a value of 2. Indeed, as we found (see Results)and as Caswell mentions in the same page, l is a ho-mogenous function of degree 1 of survival and theirelasticity adds up to 1. Intuitively, this makes sensebecause survival is present in all positive matrix ele-ments. This, however, is not the case with any of theother vital rates, which appear in some, but not all,cells with positive values. For example, both fecundityand clonal growth are open-ended processes that canvary from zero to (at least in theory) infinity. There isalso no restriction as to where in the life cycle fecundityand clonal growth can occur, i.e., they may occur ev-erywhere or nowhere at all. Similarly, regardless oftheir contribution to stasis, there is no restriction as tothe values that positive and negative growth can have.They depend on the (usually arbitrarily defined) stageduration (Caswell 2001, section 6.4). All this seems toaccount for the empirical fact, found in the analysespresented here, that, with the exception of survival, thecombined elasticities of all other vital rates do not ex-ceed unity. They do, however, seem to be bounded bythis value, restricting the total sum of elasticities tovary between 1, when survival dominates, and 2, asother processes gain importance.
Although we have five different vital rates (sj, gij,rij, fij, and kij), positive, negative, and clonal growthcan all be ascribed to one process, i.e., growth. There-fore Esurvival(Es 5 Ses), Egrowth(Eg 1 Er 1 Ek 5 Szegz1Szerz 1 Sek; see the last paragraph in this subsectionfor the reason we add the absolute values of positiveand negative growth), and Efecundity(Ef 5 Sef) withineach species. Because l is a homogeneous function ofdegree 1 of s, the total sum of the elasticity values forsurvival is equal to 1 (Es 5 1). This, however, doesnot mean we can only compare the elasticity values ofthe remaining vital rates. Just as we can standardize aseries of values such that one of them is always equalto a constant, we can also calculate their proportionalvalues. This we did (Esurvival/E, Egrowth/E and Efecundity/E,where E 5 Es 1 Eg 1 Er 1 Ek 1 Ef) and subsequentlyplotted the proportional elasticity values in triangular‘‘elasticity space.’’ For simplicity, we labeled theseaxes S (5Esurvival/E), G (5 Egrowth/E), and F (5Efecundity/E).
The sensitivity sij of l to changes in a matrix elementaij is defined and calculated as follows (Caswell 1978):
n w]l i js 5 5 (6)i j ]a v · wi j
where aij corresponds to each of the elements definedin Eqs. 1–5, vi and wj are the corresponding elementsof the left (v) and right (w) eigenvectors associatedwith l, and v·w is their scalar product. The elasticitiesof l to changes in the vital rates implicit in the matrixelements will be as follows (Caswell 1989 and 2001,Zuidema and Franco 2001).
survival:
s ]lje 5sj l ]s j
s ]l ]P ]l ]G ]l ]Rj j ij ij5 1 1O O[l ]P ]s ]G ]s ]R ]si ij j i j j i j j
]l ]Fij1 O ]]F ]si i j j
s j5 s 1 2 g 2 r 1 s gO O Oi jj j i j i j i j1 2[l i i i
1 s r 1 s f (7)O Oi j i j i j i j]i i
positive growth (i . j):
g ]l g ]l ]P ]l ]Gij ij j ije 5 5 1gij 1 2l ]g l ]P ]g ]G ]gi j j i j i j i j
gi j5 [s (2s ) 1 s s ] (8)j j j i j jl
negative growth (i , j):
r ]l r ]l ]P ]l ]Rij ij j ije 5 5 1rij 1 2l ]r l ]P ]r ]R ]ri j j i j i j i j
ri j5 [s (2s ) 1 s s ] (9)j j j i j jl
fecundity:
f ]l f ]l ]F fi j i j i j i je 5 5 5 (s s ) (10)f i j jij 1 2l ]f l ]F ]f li j i j i j
clonal growth:
k ]l k ]l ]C ki j i j i j i je 5 5 5 (s s ). (11)k i j jij 1 2l ]k l ]C ]k li j i j i j
Notice that because sj appears with both a positiveand a negative sign in the equations for the elasticityof positive and negative growth, these elasticities canacquire either a positive or a negative value. This ob-viously depends on the relative value of the sensitivityelements associated with them. These, in turn, dependon the relative reproductive values of the categoriesinvolved. Thus, moving to a category with a lowerreproductive value implies a negative effect on popu-lation growth rate, while moving to a category with ahigher reproductive value results in a positive value ofelasticity (Caswell 2001:220). Because we were inter-ested in the magnitude of the changes and not in theirsign, we added the absolute values of the elasticitiesof these vital rates.
The data set
Demographic data in the form of matrix models werecollected from the literature. More than 120 specieswere identified. However, particularly for species with
534 MIGUEL FRANCO AND JONATHAN SILVERTOWN Ecology, Vol. 85, No. 2
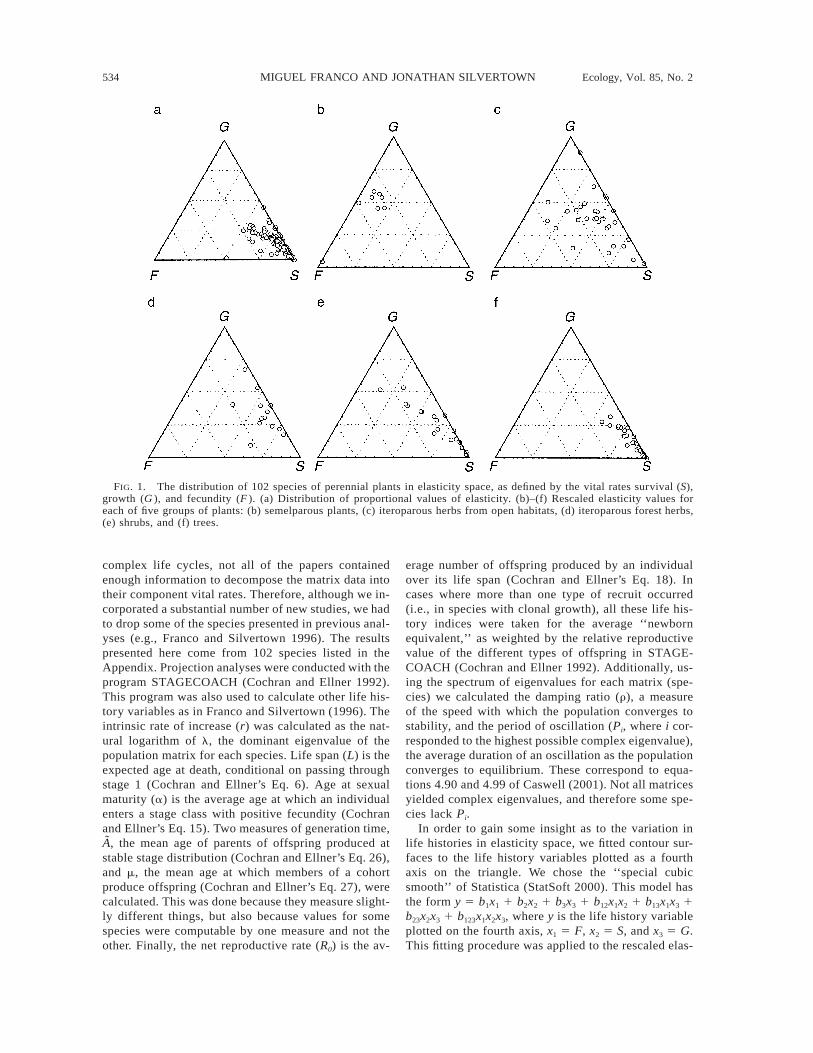
FIG. 1. The distribution of 102 species of perennial plants in elasticity space, as defined by the vital rates survival (S),growth (G ), and fecundity (F ). (a) Distribution of proportional values of elasticity. (b)–(f) Rescaled elasticity values foreach of five groups of plants: (b) semelparous plants, (c) iteroparous herbs from open habitats, (d) iteroparous forest herbs,(e) shrubs, and (f) trees.
complex life cycles, not all of the papers containedenough information to decompose the matrix data intotheir component vital rates. Therefore, although we in-corporated a substantial number of new studies, we hadto drop some of the species presented in previous anal-yses (e.g., Franco and Silvertown 1996). The resultspresented here come from 102 species listed in theAppendix. Projection analyses were conducted with theprogram STAGECOACH (Cochran and Ellner 1992).This program was also used to calculate other life his-tory variables as in Franco and Silvertown (1996). Theintrinsic rate of increase (r) was calculated as the nat-ural logarithm of l, the dominant eigenvalue of thepopulation matrix for each species. Life span (L) is theexpected age at death, conditional on passing throughstage 1 (Cochran and Ellner’s Eq. 6). Age at sexualmaturity (a) is the average age at which an individualenters a stage class with positive fecundity (Cochranand Ellner’s Eq. 15). Two measures of generation time,A, the mean age of parents of offspring produced atstable stage distribution (Cochran and Ellner’s Eq. 26),and m, the mean age at which members of a cohortproduce offspring (Cochran and Ellner’s Eq. 27), werecalculated. This was done because they measure slight-ly different things, but also because values for somespecies were computable by one measure and not theother. Finally, the net reproductive rate (R0) is the av-
erage number of offspring produced by an individualover its life span (Cochran and Ellner’s Eq. 18). Incases where more than one type of recruit occurred(i.e., in species with clonal growth), all these life his-tory indices were taken for the average ‘‘newbornequivalent,’’ as weighted by the relative reproductivevalue of the different types of offspring in STAGE-COACH (Cochran and Ellner 1992). Additionally, us-ing the spectrum of eigenvalues for each matrix (spe-cies) we calculated the damping ratio (r), a measureof the speed with which the population converges tostability, and the period of oscillation (Pi, where i cor-responded to the highest possible complex eigenvalue),the average duration of an oscillation as the populationconverges to equilibrium. These correspond to equa-tions 4.90 and 4.99 of Caswell (2001). Not all matricesyielded complex eigenvalues, and therefore some spe-cies lack Pi.
In order to gain some insight as to the variation inlife histories in elasticity space, we fitted contour sur-faces to the life history variables plotted as a fourthaxis on the triangle. We chose the ‘‘special cubicsmooth’’ of Statistica (StatSoft 2000). This model hasthe form y 5 b1x1 1 b2x2 1 b3x3 1 b12x1x2 1 b13x1x3 1b23x2x3 1 b123x1x2x3, where y is the life history variableplotted on the fourth axis, x1 5 F, x2 5 S, and x3 5 G.This fitting procedure was applied to the rescaled elas-
February 2004 535COMPARATIVE DEMOGRAPHY OF PLANTS
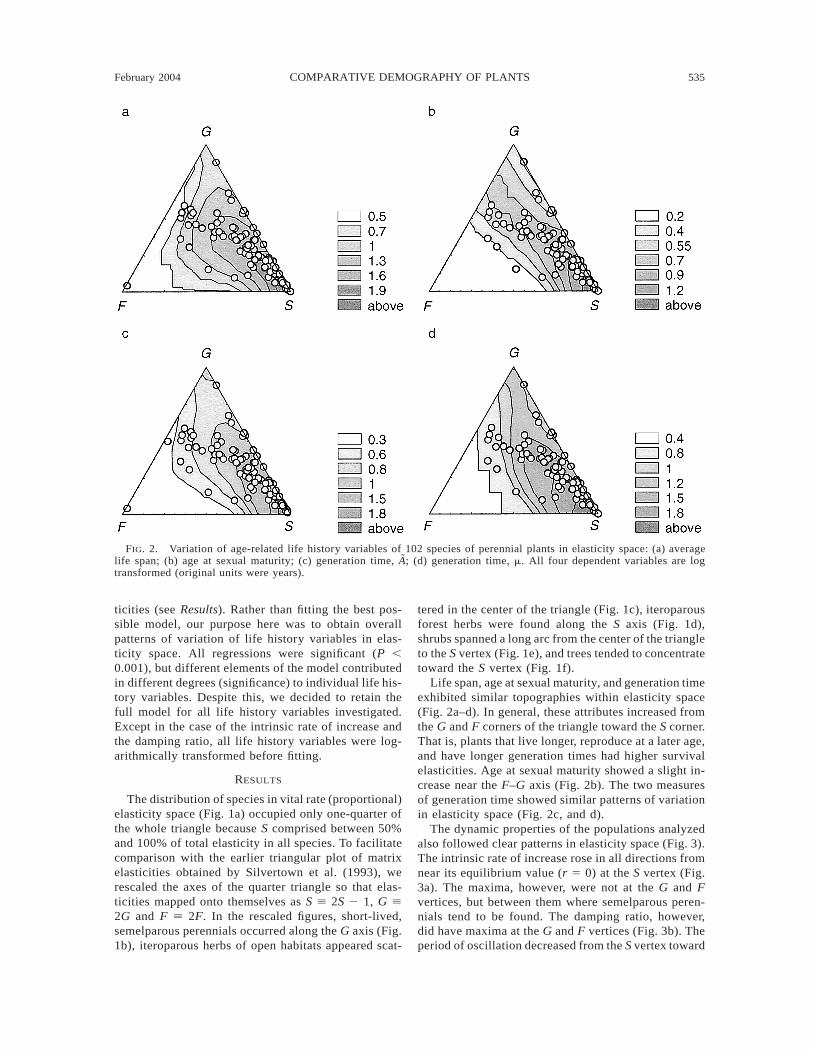
FIG. 2. Variation of age-related life history variables of 102 species of perennial plants in elasticity space: (a) averagelife span; (b) age at sexual maturity; (c) generation time, A; (d) generation time, m. All four dependent variables are logtransformed (original units were years).
ticities (see Results). Rather than fitting the best pos-sible model, our purpose here was to obtain overallpatterns of variation of life history variables in elas-ticity space. All regressions were significant (P ,0.001), but different elements of the model contributedin different degrees (significance) to individual life his-tory variables. Despite this, we decided to retain thefull model for all life history variables investigated.Except in the case of the intrinsic rate of increase andthe damping ratio, all life history variables were log-arithmically transformed before fitting.
RESULTS
The distribution of species in vital rate (proportional)elasticity space (Fig. 1a) occupied only one-quarter ofthe whole triangle because S comprised between 50%and 100% of total elasticity in all species. To facilitatecomparison with the earlier triangular plot of matrixelasticities obtained by Silvertown et al. (1993), werescaled the axes of the quarter triangle so that elas-ticities mapped onto themselves as S [ 2S 2 1, G [2G and F [ 2F. In the rescaled figures, short-lived,semelparous perennials occurred along the G axis (Fig.1b), iteroparous herbs of open habitats appeared scat-
tered in the center of the triangle (Fig. 1c), iteroparousforest herbs were found along the S axis (Fig. 1d),shrubs spanned a long arc from the center of the triangleto the S vertex (Fig. 1e), and trees tended to concentratetoward the S vertex (Fig. 1f).
Life span, age at sexual maturity, and generation timeexhibited similar topographies within elasticity space(Fig. 2a–d). In general, these attributes increased fromthe G and F corners of the triangle toward the S corner.That is, plants that live longer, reproduce at a later age,and have longer generation times had higher survivalelasticities. Age at sexual maturity showed a slight in-crease near the F–G axis (Fig. 2b). The two measuresof generation time showed similar patterns of variationin elasticity space (Fig. 2c, and d).
The dynamic properties of the populations analyzedalso followed clear patterns in elasticity space (Fig. 3).The intrinsic rate of increase rose in all directions fromnear its equilibrium value (r 5 0) at the S vertex (Fig.3a). The maxima, however, were not at the G and Fvertices, but between them where semelparous peren-nials tend to be found. The damping ratio, however,did have maxima at the G and F vertices (Fig. 3b). Theperiod of oscillation decreased from the S vertex toward

536 MIGUEL FRANCO AND JONATHAN SILVERTOWN Ecology, Vol. 85, No. 2
FIG. 3. Variation in the value of demographic parameters of 102 species in elasticity space: (a) intrinsic rate of increase(yr21); (b) damping ratio (dimensionless); (c) period of oscillation (yr); (d) net reproductive rate (newborns per life span).Dependent variables in (c) and (d) were log transformed.
TABLE 1. Spearman rank correlation coefficients between pairs of life history attributes.
Attribute r log Pi log L log a log R0 log A log m
rrlog Pi
log Llog alog R0
log A
0.322 (101) 20.330 (85)20.699 (85)
20.226 (100)20.686 (100)
0.781 (84)
20.257 (95)20.680 (95)
0.662 (80)0.756 (95)
0.762 (96)20.044 (96)
0.054 (81)0.254 (96)0.162 (95)
20.604 (99)20.684 (98)
0.759 (84)0.852 (98)0.751 (93)
20.152 (94)
20.178 (96)20.667 (96)
0.706 (81)0.956 (96)0.733 (95)0.328 (96)0.799 (94)
Notes: Because not all attributes could be calculated for all species, sample size (in parentheses; missing data pairwisedeleted) # 102. Figures in bold are significant at the 1% level; coefficients in italics are statistically significant at the 5%level.
the area occupied by semelparous herbs (Fig. 3c). Itwas not, however, as small near the G vertex andseemed to increase toward the F vertex. Unfortunately,the matrix for Linum catharticum, the only species nearthe F vertex of the triangle, failed to produce an es-timate of the period of oscillation. It was thereforedifficult to judge how reliable the trend toward thisvertex is. Finally, the net reproductive rate decreasedfrom a peak near the center of the triangle, where herbsand shrubs of open or disturbed habitats were located,toward all three vertices of the triangle (Fig. 3d). Once
again, however, it was impossible to assess whether thetrend toward the F corner was an unrealistic extrapo-lation. Finally, the life history attributes studied tendedto be correlated with each other, but there were someexceptions (Table 1).
DISCUSSION
Elasticities of vital rates vs. matrixelement elasticities
The distributions of species grouped by life historyand habitat plotted in (rescaled) vital-rate elasticity

February 2004 537COMPARATIVE DEMOGRAPHY OF PLANTS
FIG. 4. The relationship between each of the elasticitiesof (a) survival, (b) growth, and (c) fecundity and life spanfor 102 species of perennial plants.
space (Fig. 1b–f) are all remarkably similar to the orig-inal distributions of the groups plotted using matrixelement elasticities by Silvertown et al. (1993). Thematch between the two analyses is all the more re-markable because only 52 species out of the total of120 analyzed so far were present in both the originaldataset and the current one, and four of these have newdata (see the Appendix). The similarity of the two setsof distributions demonstrates that, although matrixelasticities are technically compounds of vital rates, thematrix regions that were originally designated as rep-resenting growth, stasis, and fecundity were appropri-ately named for practical purposes. It is evident fromthis that the elasticities of distinct matrix regions, asdefined by Silvertown et al. (1993), are largely deter-mined by contributions from specific vital rates.
Notwithstanding the agreement between element andvital rate elasticities, the latter are to be preferred be-cause they strictly correspond to the fundamental de-mographic processes that matrix element elasticitiesonly approximate. Another reason for the preference isthat matrix element elasticities are influenced by thenumber and breadth of size classes used in a populationmodel (Enright et al. 1995), while vital rate elasticitiesare more robust to such details of matrix construction.As mentioned in Introduction, Zuidema and Zagt (inZuidema 2000) found that, in contrast to the elasticityof matrix elements, the elasticity of vital rates wasrather insensitive to changes in the number of cate-gories (matrix size) employed.
It is important to bear in mind that whichever typeof elasticity analysis is used, estimates of demographicparameters will always be highly dependent upon theecological conditions, for example the successional sta-tus, under which the estimates were obtained (Silver-town et al. 1996, Silva Matos et al. 1999). This problemsuggests that standardization may be useful before spe-cies are compared. One possible method of standard-ization would be to confine comparisons only to thosespecies represented by populations at equilibrium (i.e.,l ø 1 or r ø 0). However, this would ignore the factthat equilibrium is not a typical state for the populationsof some species, particularly short-lived ones, and sucha comparison would therefore be biased against certainlife history types. In the present data set, only 44 ofthe 102 species fall within the bounds 0.95 , l , 1.05and these are mainly woody (nine shrubs and 20 trees).Standardization by this method would severely bias thedata set and defeat the object of comparing species byexcluding all eight semelparous perennial species, most(22 out of 31 species) iteroparous herbs of open hab-itats, and half the forest herbs and shrubs (seven outof 13 and nine out of 18 species, respectively).
Correlates of vital rate elasticities
As is to be expected, elasticities of vital rates cor-relate with life history and population parameters. Lon-gevity, age at first reproduction, and generation timeall increase along an arc that runs from the F vertexto the S vertex, passing through the center of the tri-angle (Fig. 2a–d). These patterns reflect the changes inplant life history that occur with succession from pi-oneer to climax communities (Silvertown and Franco1993). Population model properties also correlate withvital rate elasticities, but in a more varied manner. Theintrinsic rate of natural increase (r) is highest at thepoint F ø G ø 0.5, S 5 0 and decreases toward S 51 (Fig. 3a). By contrast, the net reproductive rate (R0)is highest near the center of the triangle (Fig. 3d). Thedamping ratio (r), which measures how quickly a pop-ulation’s size structure converges on equilibrium, ishigh for short-lived species at the G and F vertices anddecreases toward the center of the triangle and the Svertex. (Fig. 3b). The period of oscillation is lowest

538 MIGUEL FRANCO AND JONATHAN SILVERTOWN Ecology, Vol. 85, No. 2
near the center of the triangle and toward the G vertexand increases toward the F and S vertices (Fig. 3c).
The patterns shown in Fig. 3 are more complex thanone would expect if the variety of life histories amongthe 102 species could be reduced to one-dimensionalclassifications of the r–K (MacArthur and Wilson 1967)or fast–slow (e.g., Promislow and Harvey 1990) type.If a single axis completely captured life history varia-tion, the contours in elasticity space would be identicalfor different variables (if parameters were perfectly andpositively correlated), or exact inverses of each other,with ‘‘valleys’’ in one attribute corresponding to ‘‘hills’’in another (if parameters were negatively correlated).This not being the case accounts for the weak or insig-nificant correlation among some life history attributes(Table 1). Similarly, the relationship between the elas-ticity of a particular vital rate and individual life historyparameters is not a function in the mathematical sense(Fig. 4). Although a few points in a graph of this typemay give the impression that some attributes are cor-related with elasticity, the number of species analyzedhere shows that these relationships are represented by‘‘triangular clouds,’’ not by functions varying in a par-ticular direction. The boundary confining these points,however, does follow a particular increasing (S) or de-creasing (G and F ) function. These patterns of variationoccur in other life history parameters studied here andlead to the conclusion that all three vital rates are neededto account for variation in life history.
The failure of models such as r and K to account forthe variety of life histories has prompted Stearns (1992)to conclude that ‘‘we may have to reconcile ourselvesto dealing with sets of patterns rather than single pat-terns.’’ Our results offer a less gloomy prospect, andsuggest that the demographic triangle based upon vitalrate elasticities does provide a general pattern that linkslife history, demography, and community-level pro-cesses such as succession.
ACKNOWLEDGMENTS
M. Franco thanks the Ferguson Fund of The Open Uni-versity for financial support. Pieter Zuidema pointed out somematrix data in the literature, provided constructive discussion,and commented on the manuscript. Graham Floater and Xa-vier Pico also provided useful criticism of the manuscript.
LITERATURE CITED
Bullock, J. M., B. Clear Hill, and J. Silvertown. 1994. De-mography of Cirsium vulgare in a grazing experiment.Journal of Ecology 82:101–111.
Caswell, H. 1978. A general formula for the sensitivity ofpopulation growth rate to changes in life history parame-ters. Theoretical Population Biology 14:215–230.
Caswell, H. 1989. Matrix population models: construction,analysis, and interpretation. First edition. Sinauer, Sunder-land, Massachusetts, USA.
Caswell, H. 2001. Matrix population models: construction,analysis, and interpretation. Second edition. Sinauer, Sun-derland, Massachusetts, USA.
Cochran, M. E., and S. Ellner. 1992. Simple methods forcalculating age-based life history parameters for stage-structured populations. Ecological Monographs 62:345–364.
de Kroon, H., A. Plaiser, and J. M. van Groenendael. 1986.Elasticity: the relative contribution of demographic param-eters to population growth rate. Ecology 67:1427–1431.
Duran, R., and M. Franco. 1992. Estudio demografico dePseudophoenix sargentii. Bulletin de l’Institute Francaised’etudes Andines 21:609–621.
Enright, N. J., M. Franco, and J. Silvertown. 1995. Com-paring plant life histories using elasticity analysis: the im-portance of lifespan and the number of life cycle stages.Oecologia 104:79–84.
Floyd, S. K., and T. A. Ranker. 1998. Analysis of a transitionmatrix model for Gaura neomexicana ssp. coloradensis(Onagraceae) reveals spatial and temporal demographicvariability. International Journal of Plant Sciences 159:853–863.
Franco, M., and J. Silvertown. 1996. Life history variationin plants: an exploration of the fast–slow continuum hy-pothesis. Philosophical Transactions of the Royal Societyof London B 351:1341–1348.
MacArthur, R. H., and E. O. Wilson. 1967. The theory ofisland biogeography. Monographs in Population Biology1. Princeton University Press, Princeton, New Jersey, USA.
Oostermeijer, J. G. B., M. L. Brugman, E. R. de Boer, andH. C. M. den Nijs. 1996. Temporal and spatial variationin the demography of Gentiana pneumonanthe, a rare pe-rennial herb. Journal of Ecology 84:153–166.
Promislow, D. E. L., and P. H. Harvey. 1990. Living fast anddying young: a comparative analysis of life history vari-ation among mammals. Journal of Zoology 220:417–437.
Silva Matos, D. M., R. P. Freckleton, and A. R. Watkinson.1999. The role of density dependence in the populationdynamics of a tropical palm. Ecology 80:2635–2650.
Silvertown, J., and M. Franco. 1993. Plant demography andhabitat: a comparative approach. Plant Species Biology 8:67–73.
Silvertown, J., M. Franco, and E. Menges. 1996. Interpre-tation of elasticity matrices as an aid to the managementof plant populations for conservation. Conservation Biol-ogy 10:591–597.
Silvertown, J., M. Franco, I. Pisanty, and A. Mendoza. 1993.Comparative plant demography—relative importance of life-cycle components to the finite rate of increase in woody andherbaceous perennials. Journal of Ecology 81:465–476.
StatSoft. 2000. STATISTICA for Windows. StatSoft, Inc.,Tulsa, Oklahoma, USA.
Stearns, S. C. 1992. The evolution of life histories. OxfordUniversity Press, Oxford, UK.
Valverde, T., and J. Silvertown. 1998. Variation in the de-mography of a woodland understorey herb (Primula vul-garis) along the forest regeneration cycle: projection matrixanalysis. Journal of Ecology 86:545–562.
Zuidema, P. A. 2000. Demography of exploited tree speciesin the Bolivian Amazon. Dissertation. Utrecht University,Utrecht, The Netherlands.
Zuidema, P. A., and M. Franco. 2001. Integrating vital ratevariability into perturbation analysis: an evaluation for ma-trix population models of six plant species. Journal of Ecol-ogy 89:995–1005.
APPENDIX
The data set of species employed in the analysis of the elasticity of population growth rate to changes in vital rates isavailable in ESA’s Electronic Data Archive: Ecological Archives E085-012-A1.