India: Effect of Income and Exchange rate Elasticities on Foreign Trade
10
India: Effect of Income and Exchange rate Elasticities on Foreign Trade Anshul Kumar Singh Indian Institute of Technology, Kanpur Email id: [email protected] The Indian currency (rupee) has depreciated 39% in the last two years, and plunged 13% since May’13 and the falling rupee has substantially appreciated the revenues for the exporters, who receive more rupees for their dollar receipts. In this paper I analyze exchange rate and income elasticity of Indian imports and exports. I find a significant gap between domestic and foreign income elasticities (for exports and imports respectively) which points to a threat of growing trade deficits. In addition I also find that the exchange rate elasticity is positive for both India’s exports and imports. This indicates that depreciation of the Indian Currency will increase both imports and exports for India. Keywords: Cointegration; Exchange rate and Income elasticity; India
Transcript of India: Effect of Income and Exchange rate Elasticities on Foreign Trade

India: Effect of Income and Exchange rate Elasticities on Foreign Trade
Anshul Kumar Singh
Indian Institute of Technology, Kanpur
Email id: [email protected]
The Indian currency (rupee) has depreciated 39% in the last two years, and plunged 13% since
May’13 and the falling rupee has substantially appreciated the revenues for the exporters, who
receive more rupees for their dollar receipts. In this paper I analyze exchange rate and income
elasticity of Indian imports and exports. I find a significant gap between domestic and foreign
income elasticities (for exports and imports respectively) which points to a threat of growing trade
deficits. In addition I also find that the exchange rate elasticity is positive for both India’s exports
and imports. This indicates that depreciation of the Indian Currency will increase both imports and
exports for India.
Keywords: Cointegration; Exchange rate and Income elasticity; India

1. Introduction
For years after the 1991 crises, the Indian government contained the current account deficit to
less than 2% of GDP. But in recent years, the deficit has ballooned to 1991-like levels, which is
because partly to higher imports and more recently lower exports but nowdays exports have
increased significantly because of large depreciation in Indian currency.
Exchange rate is one of the important prices in an open economy since it affects so many
business, investment and policy decisions. Thus, it is not surprising to learn that the study of
exchange rate has been one of the most important areas of economic research over the past few
decades. This body of research has experienced tremendous growth, especially in the post-
Bretton Woods era in which foreign exchange rate has been highly volatile after the inception of
the floating exchange rate regime in 1973.
As we all know that India is once again facing a much worsened current account position leading
to concerns of a crisis. India has always had current account deficit barring initial years in 2000s.
The trade deficit is the major driving force of the current account deficit. Trade balances are
affected by changes in the exchange rate. An appreciating exchange rate by making imports
cheaper and exports more expensive can exacerbate the trade deficit. Trade balances are also
impacted by national income changes. A rise in income of a country’s trading partners will cause
exports to increase and improve the trade position. An increase in domestic income leads to
higher imports which worsens the trade position of a country. In this paper we analyze the
responsiveness of Indian trade to the exchange rate and income.
Income and exchange rate elasticties for exports and imports have been estimated for several
countries such as China by Thorbecke (2006), Japan by Bahmani-Oskooee and Goswani (2004),
the U.S. by Houthakker and Magee (1969), Mann and Plück(2005) and Chinn (2005), G-7
countries by Hooper, Johnson and Marquez (1998) and for several developed and developing
countries by Marquez (1990). We contribute to this literature by examining these elasticities for
India which to the best of my knowledge have not been analyzed in the literature. Through this
we provide a more comprehensive understanding of the India’s trade position.
It is therefore important to understand the factors that impact the current account deficit or trade
balance.

2. Background Study:
The Indian currency (rupee) has depreciated 39 per cent in the last two years, and plunged 13 per
cent since May’13. Growth, which had been between 8 to 9 per cent for around eight years, has
fallen sharply, and is expected to be between 5 to 5.5 per cent during the current April-to-March
(2013-14) financial year. From the past few years, as per report, the share of India’s FII (Foreign
institutional investors) in the developing markets has decreased considerably from 19.2 % in
2010 to 3.8% in the year 2011. As FII’s are taking their investments out of the Indian markets, it
has led to an increased demand for dollars, further leading to a spiraling rupee. However the
falling rupee has substantially appreciated the revenues for the exporters, who receive more
rupees for their dollar receipts. In terms of trade, India’s exports to China in 2012 reached US$
18.8 billion, whereas imports touched a total of US$ 47.75 billion which is more than the double
compared to exports and US which imports US$ 40 billion from India while exported only US$
22 billion.
As we all know that the nominal exchange rate is the rate at which currency can be exchanged. If
the nominal exchange rate between the dollar and the Rupee is 50, then one dollar will purchase
50 Rupee. Exchange rates are always represented in terms of the amount of foreign currency that
can be purchased for one unit of domestic currency. Thus, we determine the nominal exchange
rate by identifying the amount of foreign currency that can be purchased for one unit of domestic
currency. The real exchange rate is a bit more complicated than the nominal exchange rate, the
movement of real and nominal exchange rate can be seen in figure1 since 1970, while the
nominal exchange rate tells how much foreign currency can be exchanged for a unit of domestic
currency, the real exchange rate tells how much the goods and services in the domestic country
can be exchanged for the goods and services in a foreign country. When the real exchange rate is
high, the relative price of goods at home is higher than the relative price of goods abroad. In this
case, import is likely because foreign goods are cheaper, in real terms, than domestic goods.
Thus, when the real exchange rate is high, net exports decrease as imports rise. Alternatively,
when the real exchange rate is low, net exports increase as exports rise. Hence, Changes in
imports and exports are affected by exchange rates and incomes (domestic and foreign
respectively). In sections 3 and 4 we analyze the impact of exchange rate and income elasticity
on imports and exports.

3. Data and Modeling:
I have used yearly data from 1970 to 2012. I use the GDP of the US as a proxy for foreign
income in the export demand function which restricts our sample another year. I estimate export
and import demand functions according to equations (1) and (2) for total exports, total imports.
All data are in logs hence all estimated parameters are elasticities. US GDP and CPI data are
from World Bank and all data are from and Reserve Bank of India. The trade data is in millions
of current US dollars which are multiplied by the real exchange rate to calculate real exports and
imports Indian Currency. The real exchange rate is computed by multiplying the nominal
exchange rate with prices for India and the foreign country. I use the indicator buying rate for the
nominal exchange rate and consumer price index (CPI) for price levels of both countries as
. E is the nominal exchange rate for INR to one unit of foreign currency (USD), is
the foreign country’s CPI and is the CPI for India both indices with 2005 as the base year.
I use real GDP of India as a proxy for real income in the import demand function and real GDP
of the US as a proxy of real foreign income in the export demand function. It would be more
appropriate to use a trade weighted GDP for foreign income and a trade weighted exchange rate
in the export demand functions but we opt to refrain from computing a GDP and exchange rate
which are not readily observable. I compute elasticities with respect to the US dollar. The US has
been a major destination for Indian exports for the entire sample period, in 2012 US imported
US$ 40 billion (second most importer) from India while exported only US$ 22 billion, thus is the
right choice for foreign income.
I follow the literature in setting up the import and export functions as,
(1)
(2)

where M denotes real imports, X denotes real exports, r is the real exchange rate, GDP
and GDP* are domestic and foreign real income respectively.
If the variables are integrated of order one we can test for cointegration and compute exchange
rate and income elasticities using the error correction framework. Estimation steps are as
follows. First the order of integration of variables used are determined by unit root tests. Then
lag length is chosen by considering several information criteria in an unrestricted VAR where
maximum lag length is set at five given the size of the sample. In addition to Likelihood Ratio
Tests and Final Prediction Error, Akaike, Schwartz, and Hannan Quinn information criteria are
considered. Lag length is chosen based on the outcome of majority of the tests. Diagnostic tests
are performed to ensure the model cointegration tests are performed on a correctly specified
model. The Johansen (1991) VAR-based cointegration tests are implemented to test for the
existence of a cointegrating relationship and to identify the cointegrating equation. Finally,
vector error correction models based on the identified cointegrating equation are estimated.
4. Results:
Unit root tests on variables indicate that all variables are integrated of order 1. Unit root test
results are presented in Appendix A. We report the ADF, Phillips-Perron and KPSS unit root test
statistics on each variable. Johansen cointegration estimation results of exchange rate and income
elasticities of imports and exports show that a significant gap between income elasticities exists
which points to a threat of growing trade deficits. In addition, exchange rate elasticities of both
exports and imports are positive; indicating that a depreciation of the Indian currency will have a
positive effect on both imports and exports.
From table A we see that if India and US real income rose by 1% each, imports of goods and
services would increase by 2.31% and exports of goods and services would decrease by 5.79%.

Table A : Results from the regression
Real Exchange Rate
Elasticity Income Elasticity
Total Imports 1.709972
(0.55327)*
2.316005
(0.32829)*
Total Exports 0.917592
(0.40394)*
-5.793672
(0.73815)*
*standard error in parentheses
The results show that if domestic and foreign real income were to grow at the same pace, the
trade deficit in India would widen considerably. Disaggregating trade elasticities does not
completely eliminate the income elasticity gap for India. Overall, the income elasticity gap for all
goods shows threat for the Indian trade balance.
Turning now to exchange rate elasticity results I find that a 1% depreciation of the INR would
lead to a 1.71 % decline in imports. The exchange rate elasticity for exports are positive but lack
statistical significance. To make sense of these findings, the structure of Indian exports and
imports needs to be scrutinized and this task will be undertaken in the next section.
5. Conclusions:
I estimated exchange rate and income elasticities for India’ imports and exports and investigate
the effect of an appreciating INR on Indian foreign trade. I found that a significant gap between
income elasticities of imports and exports exists. The income elasticity for imports is
significantly greater that exports which warns against increasing trade deficits over time. I also
found exchange rate elasticities of both exports and imports to be positive indicating that a
depreciation of the INR will have a positive effect on both imports and exports. We can also do
some further study including primary goods imports/exports, oil/non-oil goods imports/exports
to find the better idea about the elasticities and know it better that which one leading India to the
trade deficit.

References:
Bahmani-Oskooee M, Goswami GG (2004) Exchange rate sensitivity of Japan's bilateral trade
flows. Japan and the World Economy 16(1): 1-15.
Bahmani-Oskooee, M. & F. Niroomand (1998). ‘Long-run price elasticities and the Marshall–
Lerner condition revisited.’ Economics Letters 61:101–109
Chinn M (2005) Doomed to deficits? Aggregate U.S. trade flows re-visited. Review of World
Economics 141:460-485.
Cushman, D.O. (1987). ‘US bilateral trade balances and the dollar.’ Economics Letters 24:363–
367.
Cushman, D.O. (1990). ‘US bilateral trade equations: forecasts and structural stability.’ Applied
Economics 22:1093–1102.
Haynes, S.E., M. M. Hutchison & R. F. Mikesell (1996). ‘US–Japanese bilateral trade and the
yen–dollar exchange rate: an empirical analysis.’ Southern Economic Journal 52:923–932.
Hooper, P., K. Johnson & J. Marquez (1998). ‘Trade Elasticities for G-7 Countries.’
International Finance Discussion Papers No. 609 (Washington, DC, Federal Reserve Board,
April).
Houthakker, H.. & S. Magee (1969). ‘Income and Price Elasticities in World Trade.’ Review of
Economics and Statistics 51:111-25.
Johansen, S. (1991). ‘Estimation and Hypothesis Testing of Cointegration Vectors in Gaussian
Vector Autoregressive Models.’ Econometrica, 59:1551-1580.
Senhadji, Semlali, 1997, “Time-Series of Structural Import Demand Equations—A Cross
Country Analysis,” IMF Working Paper 97/132 (Washington: International Monetary Fund).
Stern, Robert, 1973, The Balance of Payments: Theory and Economic Policy, (New York:
Aldine Publishing Company).
Stern, Robert, Francis, Jonathan, and Bruce Schumacher, 1976, Price Elasticities in
International Trade—An Annotated Bibliography, (London: MacMillan).

Figure 1 Nominal vs Real Exchange Rate
Figure 2 Log Real Exports vs Imports
-10
0
10
20
30
40
50
60
1960 1980 2000 2020
Nominal Exchange
Rate
Real Exchange Rate
0
1
2
3
4
5
6
7
8
19
70
19
73
19
76
19
79
19
82
19
85
19
88
19
91
19
94
19
97
20
00
20
03
20
06
20
09
20
12
log Real Exports
USD
Log Real Imports
USD
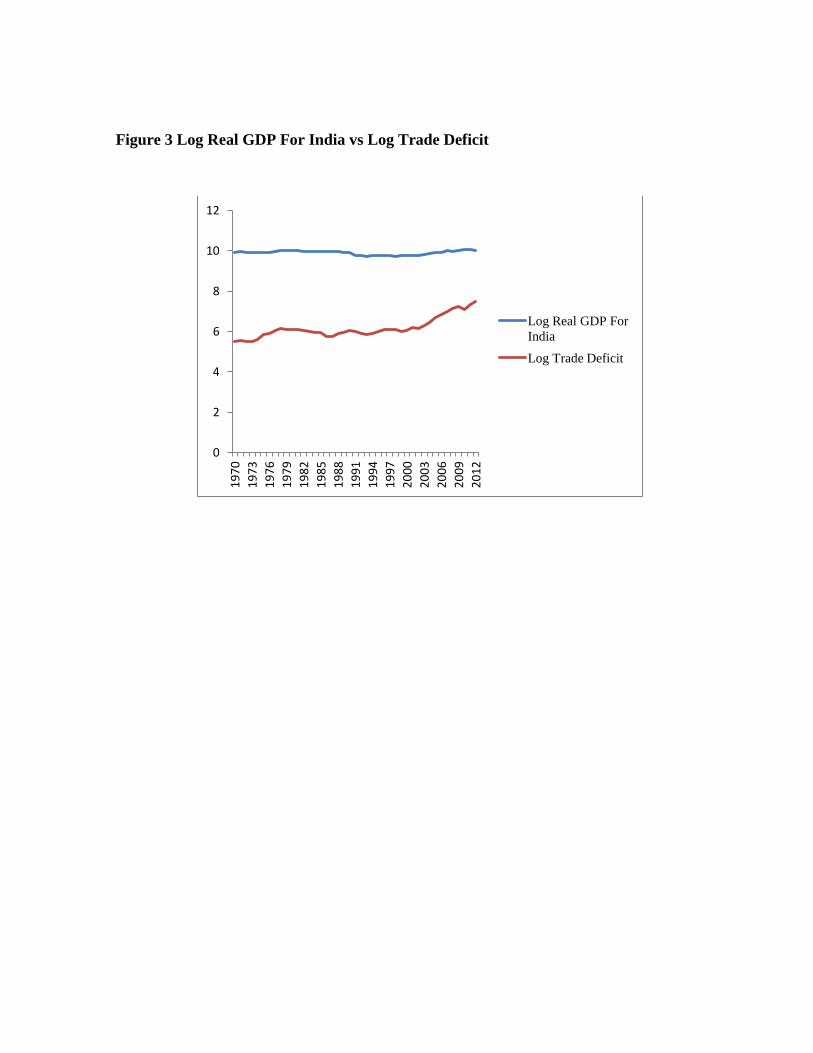
Figure 3 Log Real GDP For India vs Log Trade Deficit
0
2
4
6
8
10
12
19
70
19
73
19
76
19
79
19
82
19
85
19
88
19
91
19
94
19
97
20
00
20
03
20
06
20
09
20
12
Log Real GDP For
India
Log Trade Deficit

Appendix:
Table A Unit Root Tests:
Test/Variables GDP GDP* R Exports Imports
ADF1
Intercept
-0.836736
{0}
-1.751247
{0}
-3.386704
{0}
-1.159170
{0}
-1.115651
{0}
Trend and
Intercept
-0.589798
{0}
-1.982498
{0}
-4.138624
{0}
-4.396151
{0}
-4.298547
{0}
None
0.381757
{0}
8.418230
{0}
-0.827652
{0}
0.960960
{0}
2.187049
{0}
F.D.
-5.605298
{1}
-2.509570
{1}
-8.203561
{1}
-8.097562
{1}
-7.686192
{1}
Phillips-
Perron2
Intercept
-1.270930
-1.832721
0.0181
-0.720206
-0.671058
Trend and
Intercept
{4}
-1.019476
{4}
{5}
-1.364791
{2}
{1}
-4.153404
{1}
{13}
-4.396151
{0}
{17}
-4.298547
{0}
None
0.291088
7.453389
-0.472734
4.315050
4.941347
F.D.
{4}
-5.757016
{3}
-2.281116
{13}
-12.53981
{41}
-8.470217
{41}
-8.095814
{3} {3} {13} {5} {6}
KPSS3
Intercept
Trend and
Intercept
F.D.
0.184123
{5}
0.139990
{5}
0.201776
{4}
0.820643
{5}
0.128742
{4}
0.251070
{3}
0.507024
{4}
0.074345
{3}
0.455307
{38}
0.791643
{5}
0.097102
{3}
0.500000
{41}
0.792956
{5}
0.097011
{3}
0.500000
{41}
1 Lag length is presented in square brackets. Lag length is selected based on Schwartz information criteria when maximum lag
length is 9
2 Bandwidth is in square brackets and was chosen by Newey-West algorithm using Bartlett kernel.
3 Bandwidth is in square brackets .