Demographic statistics: - European Union
96
A review of definitions and methods of collection in 44 European countries 2015 edition Demographic statistics: Manuals and guidelines ISSN 2315-0815
-
Upload
khangminh22 -
Category
Documents
-
view
0 -
download
0
Transcript of Demographic statistics: - European Union

A review of definitions and methods of collection in 44 European countries
2015 edition
Demographic statistics:
Dem
ographic statistics: a review of definitions and m
ethods of collection in 44 European countries
Manuals and guidelines
2015 editio
n
ISSN 2315-0815


A review of definitions and methods of collection in 44 European countries
2013 edition
Demographic statistics:
Manuals and guidelines
2015 edition

Europe Direct is a service to help you find answers to your questions about the European Union.
Freephone number (*):
00 800 6 7 8 9 10 11The information given is free, as are most calls (though some operators,
phone boxes or hotels may charge you).
More information on the European Union is available on the Internet (http://europa.eu).
Luxembourg: Publications Office of the European Union, 2015
Print ISBN 978-92-79-45405-9 ISSN 2363-197X doi:10.2785/66552 KS-GQ-15-002-EN-C
PDF ISBN 978-92-79-45404-2 ISSN 2315-0815 doi:10.2785/717072 KS-GQ-15-002-EN-N
Theme: Population and social conditionsCollection: Manuals and guidelines
© European Union, 2015Reproduction is authorised provided the source is acknowledged.
Printed in Luxembourg

Foreword
3 Demographic statistics
ForewordEurostat serves as a point of reference for demographic data on European countries. Data on population, vital events and migration are collected regularly from the National Statistical Institutes, in accordance with existing EU regulations on demographic and migration statistics.
Still, while some basic definitions and the programme of the statistical tables to be transmitted to Eurostat have been fixed in the Regulations, the production of these data in the EU and in the neighbouring countries is characterised by disparate definitions and methodologies.
These practices were first documented in the Eurostat Working Paper ‘Demographic statistics: definitions and methods of collection in 31 European Countries’ published in 2003 and they are now updated in this publication. This review is there‑fore an important source of information for users interested in gaining a deeper understanding of the peculiarities of the national production of official demographic statistics, and of their international comparability.
Eurostat continues to cooperate with its partners in the European Statistical System to harmonise the production of sta‑tistics, particularly in this area, where current trends have important implications for European societies. Ageing, persist‑ing low fertility, improved life expectancy and migration are just some examples of topics that require data of the highest quality.
It is our hope that this publication will contribute to the advances in this field.
Adam Wronski Head of Unit Population Unit
Eurostat
Acknowledgements
Authors: Alessandro Albano, Veronica Corsini, Andrea Gereöffy
Language editing: Mark Osborne, DG Translation Editing Unit
This review could not have been produced without the kind collaboration of officials from the National Statistical Insti‑tutes. Eurostat wishes to thank them all. (*)
(*) The full list of contact details and web addresses of National Statistical Institutes is available at http://ec.europa.eu/eurostat/web/links/national_statistical_offices

Contents
4 Demographic statistics
ContentsForeword 3
Introduction 8
1. Population 9
1.1. Estimating the size of the population 10
1.2. Registration of arrivals and departures 15
1.3. Population structure indicators 15
1.4. Average population 18
2. Births 19
2.1. Definition of ‘live birth’ 20
2.2. Declaring a birth 202.2.1. Persons who can make the declaration 202.2.2. Time limit for birth declaration 20
2.3. The contents of a birth declaration 21
2.4. Live births abroad, live births to ‘non-residents’ and mother’s age 24
2.5. Fertility indicators 272.5.1. Total fertility rate 272.5.2. Availability of total fertility rate 272.5.3 Mean age of women at childbirth 29
2.6. Induced abortions 312.6.1. Circumstances under which abortion is allowed 322.6.2. The contents of an abortion registration 322.6.3. Abortion indicators 36
3. Deaths 39
3.1. Definition of death 40
3.2. Declaring a death 40
3.3. The contents of a death declaration 40
3.4. Persons dying abroad and deaths of ‘non-residents’ 42
3.5. Mortality indicators 423.5.1. Death rates 423.5.2. Infant mortality rates 463.5.3. Life expectancy at birth 493.5.4. Availability of mortality indicators 49

Contents
5 Demographic statistics
4. Marriages and legal unions 53
4.1. Registration of marriages 54
4.2. Minimum marriageable age 56
4.3. Definition of age 57
4.4. The contents of a marriage declaration 57
4.5. Marriages conducted abroad and marriages between ‘non-residents’ 60
4.6. Legal unions 624.6.1. The contents of a legal union declaration 644.6.2. Legal unions abroad and between ‘non-residents’ 644.6.3. Definition of age 67
4.7. Marriage indicators 674.7.1. Mean age at marriage and at first marriage 674.7.2. Total first marriage rate 70
5. Divorces 71
5.1. Divorce regulations 72
5.2. Conditions for divorce 72
5.3. The contents of a divorce declaration 76
5.4. Divorces of residents abroad and divorces of ‘non-residents’ 79
5.5. Divorce indicators 80
Annex I — List of country codes 82
Annex II — Age-specific demographic rates 83 Methods for calculating the main demographic rates 84
Annex III — Mean age, event-based and rate based 86
Annex IV — Glossary 87
Annex V — Country-specific registration forms 90

List of tables
6 Demographic statistics
List of tablesTable 1.1: Population characteristics 11
Table 1.2: Definition of population 13
Table 1.3: Registration on arrival and de-registration on departure 16
Table 1.4: Population structure indicators 17
Table 1.5: Procedures for calculating average population 18
Table 2.1: Contents of a birth declaration 22
Table 2.2: Live births abroad and live births to ‘non-residents’ 25
Table 2.3: Mother’s age 26
Table 2.4: Calculation of total fertility rate 28
Table 2.5: Breakdowns of total fertility rate 29
Table 2.6: Mean age of women at childbirth 30
Table 2.7: Induced abortions 31
Table 2.8: Abortion regulations 33
Table 2.9: Contents of an abortion registration 35
Table 2.10: Abortion indicators 37
Table 3.1: Contents of a death declaration 41
Table 3.2: Deaths abroad and deaths of ‘non-residents’ 43
Table 3.3: Calculation of death rates 44
Table 3.4: Infant mortality rates 47
Table 3.5: Calculation of life expectancy at birth 50
Table 3.6: Availability of mortality indicators 51
Table 4.1: Civil and religious marriage 54
Table 4.2: Registration of marriages 55
Table 4.3: Minimum marriageable age 56
Table 4.4: Definition of age 57
Table 4.5: Contents of a marriage declaration 58
Table 4.6: Marriages conducted abroad and marriages contracted between ‘non-residents’ 61
Table 4.7: Legal unions 62
Table 4.8: Contents of a legal union declaration 65
Table 4.9: Legal unions abroad and legal unions of ‘non-residents’ 66
Table 4.10: Definition of age 67
Table 4.11: Mean age at marriage 68
Table 4.12: Calculation of total first marriage rate 69

List of tables
7 Demographic statistics
Table 5.1: Regulations on divorce and dissolution of legal union 73
Table 5.2: Conditions for a divorce 74
Table 5.3: Contents of a divorce declaration 77
Table 5.4: Divorces of residents abroad and divorces of ‘non-residents’ 79
Table 5.5: Divorce indicators 80
Table A: Methods for calculating the main age-specific demographic rates 85

Introduction
8 Demographic statistics
IntroductionThis working paper seeks to provide an overview of national practices as regards the collection, compilation and pro‑duction of demographic statistics, definitions of main vital events and methods used to compute the main demograph‑ic indicators. It has been compiled from information from a Eurostat survey launched in spring 2013, when a ques‑tionnaire was addressed to 49 national statistical offices, of which 44 completed and returned the forms.
The review updates the 2003 working paper on ‘Demograph-ic statistics: definitions and methods of collection in 31 Euro-pean countries’ (1), which was based on the results of a 2002 survey.
It covers the main thematic areas of relevance to demo‑graphic statistics:
• Section 1 focuses on population count, with an in‑depth analysis of how ‘population’ is defined;
• Section 2 provides information on statistics on births, fertility indicators and abortions;
• Section 3 describes death statistics and mortality indicators;
• Section 4 gives an overview of statistics on marriages and other types of living arrangement, as well as mar‑riage indicators; and
• Section 5 contains information on statistics on divorce and the dissolution of legal unions.
(1) ec.europa.eu/eurostat/ramon/statmanuals/files/KS-CC-03-005-EN.pdf (Available on 2015)
Each chapter includes a selection of tables accompanied by explanatory text based on the answers received for the topic in question. Certain type of information was not received from all the countries, either because it was not available or not relevant for the respective country. Some methodologi‑cal explanations on the main demographic indicators are given at the end of the review (Annex II and III). A glos‑sary of the most frequently used demographic terms in this publication is also provided (Annex IV), as well as examples of the administrative declarations discussed, provided by some of the countries surveyed (Annex V).

Population 1

10 Demographic statistics
Population1
1.1. Estimating the size of the population
The aim of this section is to analyse approaches used in the countries surveyed to quantify population. We start with an overview of the sources used for population estimates and then examine national reference dates. Particular attention will be paid to definitions of population and the time criteria used in these definitions.
As shown in Table 1.1, most of the countries that answered the questionnaire (31 out of 44) estimate population on the basis of census. This method was used either in isolation (by 18 countries) or in combination with a register (DE, ES, FR, LV, LT and HU) (2), a survey (IE, HR, ME, RS and XK) or both (MT and RO). Population registers are the second most commonly used source for estimating population: they are used by 20 countries (BE, DE, DK, ES, FR, IT, LV, LT, HU, MT, NL, AT, RO, SI, FI, SE, LI, NO, CH and TR), of which six combine them with census information, one (IT) with information from surveys and two with both census and survey.
Table 1.1 also shows that the most common reference date for counting population is 1 January, followed by 31 De‑cember. The difference between these two dates is actually nil (3) at national level: the population is usually the same on 1 January of calendar year t as on 31 December of calendar year t-1. IE and UK use mid‑April and 30 June respectively as reference dates. Also BA uses the mid‑year reference date. CZ, ME and RS use all three reference dates (1 January, 31 December and mid‑year).
Many countries produce additional population figures at other times in the calendar year, e.g. CZ produces quarterly data, SI produces population figures for 1 April and 1 Octo‑ber, and AM for 1 April, 1 July and 1 October. In general, these figures are less detailed than those relating to 1 Janu‑ary or 31 December.
In order to measure the population, one has to define it. Four main definitions are used, (4) each based on different prin‑ciples determining whether or not a given individual is in‑cluded. In general, the principles used reflect national data needs; they are as follows:
1. de jure population — this is based on a person’s le‑gal right to settle in the country; it therefore covers all
(2) See Annex I for a list of country codes.
(3) Except where legislation relevant to the population count enters into force on 1 January. This is the case with changes to geographical area; e.g. on 1 January 2014, Mayotte became part of the economic territory of France and there was a significant difference between the French population on 31 December 2013 and that on 1 January 2014.
(4) Lanzieri, G. (2013): Population definitions at the 2010 censuses round in the countries of the UNECE region. Paper for the 15th meeting of UNECE Group of Experts on Population and Housing Censuses, Geneva, 30.9–3.10.2013.
persons who, on a given date, either have citizenship or have been granted a residence permit or visa;
2. de facto population — all people present in the coun‑try at the time of the counting regardless of whether they have residence;
3. registered population — all persons listed in one or more registers kept by the national authorities on the reference date; and
4. ‘usually resident’ population — persons who (5):
• lived in the country for a continuous period of at least 12 months before the reference time (6); or
• arrived in the country during the 12 months before the reference time with the intention of staying there for at least one year.
The definition recommended by the Conference of European Statisticians (CES) (7) and incorporated in the EU’s popula‑tion and housing census Regulation (8) is based on place of usual residence. As shown by Table 1.1., ‘usually resident population’ is the most widespread definition: 34 of the 44 countries surveyed reported using it, of which 23 use it in isolation, four (FR, RO (9), FI and CH) use it in combina‑tion with the concept of legal population, four (DE, ES, IT, XK) refer to it together with registered population and three (BE, PL (10) and NO) use three concepts. The second most commonly used definition is ‘registered population’: this was used in isolation by seven countries (CZ, DK, NL AT, SE, MD and RU), in combination with ‘legal population’ by two (SK and TR) and together with ‘de facto population’ by one (MD). The only country that uses ‘legal population’ only is RS.
As regards the definition of ‘usual residence’, most countries (33 out of 44) apply a time criterion of 12 months or ‘at least 12 months’ (see Table 1.1). Nine countries report having no time criteria. Of the 33 countries referring to the ‘usually res‑ident’ population and applying a 12‑month or an ‘at least 12 months’ criterion, 11 (IE, HR, CY, HU, PT, UK, MT, LI, ME, RS and AL) mention ‘intention to stay’ in the country for (at least) this amount of time as a key criterion (see Table 1.2).
(5) As defined in Regulation (EU) No 1260/2013 of the European Parliament and of the Council on European demographic statistics, URL (26.02.2015): http://eur-lex.europa.eu/legal-content/EN/TXT/HTML/?uri=CELEX:32013R1260&from=EN
(6) Regardless of temporary or short-term absences for recreation, personal or business visits, etc.
(7) Lanzieri, G. (2013): Some proposals for the Revision of the CES Recommendations on the population to be enumerated. Paper for the 15th meeting of UNECE Group of Experts on Population and Housing Censuses, Geneva, 30.9–3.10.2013.
(8) European Parliament and Council Regulation (EC) No 763/2008 on population and housing censuses, URL:http://eur-lex.europa.eu/legal-content/EN/TXT/?qid=1412688957286&uri=CELEX:32008R0763
(9) RO calculates usually resident population at national level and a combination of legal and usually resident population for other levels.
(10) PL has used three concepts, but the one considered the most important is ‘legal’ or ‘de jure’ (actually living) population, i.e. those having a registered place of residence to stay permanently in PL. The criterion for duration of stay is three months.

11 Demographic statistics
Population 1Ta
ble
1.1:
Pop
ulat
ion
char
acte
ristic
s
Dat
e of
m
ost r
ecen
t po
pula
tion
ce
nsus
Sour
ce fo
r est
imat
ing
popu
lati
onRe
fere
nce
date
of p
opul
atio
n es
tim
ates
Popu
lati
on c
once
ptTi
me
crit
eria
?Po
pula
tion
re
gist
er(s
)Ce
nsus
‑ ba
sed
Oth
er1
Janu
ary
31 D
ecem
ber
Mid
‑yea
rO
ther
Regi
ster
ed
popu
lati
onLe
gal
popu
lati
on
Usu
ally
re
side
nt
popu
lati
onO
ther
BE01
-01-
2011
xx
xx
xN
o
BG01
-02-
2011
xx
x12
mon
ths
CZ
26-0
3-20
11x
xx
xQ
uart
erly
xN
o
DK
01-0
4-20
13x
xx
3 m
onth
s
DE
09-0
5-20
11x
xLo
cal r
egis
ter
and
othe
rsx
Aver
age
xx
No
EE31
-12-
2011
xx
xA
t lea
st 1
2 m
onth
s
IE10
-04-
2011
xSu
rvey
Mid
-apr
ilx
12 m
onth
s
EL09
-05-
2011
xx
x12
mon
ths
ES01
-11-
2011
xx
xx
xx
12 m
onth
s
FR01
-01-
2010
xx
xx
xA
t lea
st 1
2 m
onth
s
HR
31-0
3-20
11x
Surv
eyx
xx
At l
east
12
mon
ths
IT09
-10-
2011
xSu
rvey
xx
xx
No
CY
01-1
0-20
11x
xx
12 m
onth
s
LV01
-03-
2011
xx
Mat
hem
atic
al
met
hods
; se
vera
l reg
iste
rsx
x12
mon
ths
LT01
-03-
2011
xx
Fore
igne
rs’
Regi
ster
xx
12 m
onth
s
LU01
-02-
2011
xx
x12
mon
ths
HU
01-1
0-20
11x
xx
x12
mon
ths
MT
20-1
1-20
11x
xSu
rvey
xx
At l
east
12
mon
ths
NL
01-0
1-20
11x
xx
No
AT31
-10-
2011
xx
x90
day
s (m
ain
resi
denc
e)
PL31
-03-
2011
xx
xx
x12
mon
ths
PT21
-03-
2011
xx
x12
mon
ths
RO20
-10-
2011
xx
Surv
ey; E
cono
-m
etric
mod
els
xx
xx
At l
east
12
mon
ths
SI01
-01-
2011
xx
x1
Apr
il,
1 O
ctob
erx
At l
east
12
mon
ths
SK21
-05-
2011
xx
xx
No
FI31
-12-
2010
xx
xx
12 m
onth
s
SE31
-12-
2013
xx
x12
mon
ths
UK
27-0
3-20
11x
xx
12 m
onth
s

12 Demographic statistics
Population1D
ate
of
mos
t rec
ent
popu
lati
on
cens
us
Sour
ce fo
r est
imat
ing
popu
lati
onRe
fere
nce
date
of p
opul
atio
n es
tim
ates
Popu
lati
on c
once
ptTi
me
crit
eria
?Po
pula
tion
re
gist
er(s
)Ce
nsus
‑ ba
sed
Oth
er1
Janu
ary
31 D
ecem
ber
Mid
‑yea
rO
ther
Regi
ster
ed
popu
lati
onLe
gal
popu
lati
on
Usu
ally
re
side
nt
popu
lati
onO
ther
LI31
-12-
2011
xx
xA
t lea
st 1
2 m
onth
s
NO
19-1
1-20
11x
xx
xx
xN
o
CH
31-1
2-20
12x
xx
x12
mon
ths
ME
31-0
3-20
11x
Surv
eyx
xx
xA
t lea
st 1
2 m
onth
s
AL
01-1
0-20
11x
xx
At l
east
12
mon
ths
RS30
-09-
2011
xSu
rvey
; Ev
iden
cies
on
resi
denc
ex
xx
xA
t lea
st 1
2 m
onth
s
TR02
-10-
2011
xx
xx
No
BY14
-10-
2009
xx
x12
mon
ths
BA31
-03-
1991
Surv
ey;
estim
atio
n x
xA
t lea
st 1
2 m
onth
s
XK31
-03-
2011
xSu
rvey
xx
xA
t lea
st 1
2 m
onth
s
MD
05-1
0-20
04x
xx
De
fact
o p
opul
atio
nN
o
RU09
-10-
2010
xx
x12
mon
ths
UA
05-1
2-20
01x
xx
12 m
onth
s
AM
12-1
0-20
11x
xx
1 A
pril,
1
July
, 1
Oct
ober
xD
e fa
cto
pop
ulat
ion
At l
east
12
mon
ths
AZ
13-0
4-20
09x
xx
At l
east
12
mon
ths
GE
17-0
1-20
02x
xx
At l
east
12
mon
ths

13 Demographic statistics
Population 1Table 1.2: Definition of population
Details of the definitionBE Legal population is registered population
BG The main category used in the current demographic statistics is ‘permanent resident population’, i.e. people usually living in the country who have not left it officially as of 31 December of the reference year.
CZData refer to the resident population, irrespective of citizenship. Since 2001 (in relation to the 2001 Population and Housing Census), data also include foreigners with visas for over 90 days and foreigners who have been granted asylum. Since 1 May 2004, data also apply to EU nationals with temporary residence and third-country nationals with long-term residence.
DK All people registered to live in the country at a given date. Late registrations (within 30 days) are included.
DE All people who should be registered are included in the census population. Registered arrivals and departures and life events are taken into account in the updates of population figures.
EE Population statistics are based on population censuses and registered changes of the population — births, deaths and changes of residence (migration).
IE Usual residents defined in line with UN recommendations, i.e. those who have stayed, or have recently arrived and intend to stay, for at least a year. Emigrants are those who have left and intend to stay away for at least a year.
EL ‘Residents’ are persons resident in the place where they normally spend the daily period of rest, regardless of temporary absences, for a period of at least 12 months.
ES
Those who have established, or intend to establish, their regular residence in the country for at least 12 months, where the regular residence is the place where a person normally spends her/his daily rest periods, regardless of temporary absences. Population figures start from the 2011 census and are computed through the addition of demographic components (statistics on life events and migration). Migration statistics are based on the statistical treatment of variations in the population register (Padrón — municipal register).
FR Individuals having their habitual residence in France (see Decree No 2003-485 of 5 June 2003).
HR
The place of usual residence is used to determine total population, i.e. the place where a person spends most of his/her daily time, irrespective of short-term absence (e.g. vacations, trips, medical treatment, visits, etc.). The total population includes those who have lived in their place of usual residence for a continuous period of at least 12 months and those who have not done so but have the intention of staying there for at least a year.
IT People having usual residence in a given municipality.
CY Usually resident population is the population residing or intending to reside in Cyprus for at least 12 months.
LV
All inhabitants whose permanent place of residence (for 12 months or more) is the respective administrative territory. The permanent place of residence is the place in which the person usually spends the daily rest period, not counting short-term absence for entertainment, vacations, visit to friends or relatives, business, medical treatment or pilgrimage. The usually resident population is estimated using administrative data and mathematical methods.
LT
Resident population refers to the total of individuals permanently residing (having a permanent place of residence) within a certain territory and changes due to births, deaths and migration. Permanent place of residence refers to the legal or declared place of residence where an individual usually spends his/her daily period of rest, excluding temporary absences for holidays, to visit friends, relatives, on business, or for health or religious purposes.
LU Population at usual residence, i.e. the place where persons normally spend the daily period of rest
HU
Resident population: the total number of persons having a residence in the respective area and no place of stay elsewhere and those with a place of stay in the same area. Place of residence: the address of the dwelling in which the citizen lives. For the purposes of registering the home address, the following can be considered as a dwelling: a building or a part of building, consisting of one or more living premises, used by the citizen as home, or a room in which somebody lives in need or lodges if he/she has no other dwelling (Act LXVI of 1992 on the registration of citizens’ personal data and home address, §.5. /2/). This corresponds to the earlier permanent place of residence. Place of stay: the address of the dwelling where a person stays longer than three months without the intention definitively to leave their place of residence (Act LXVI of 1992, §.5. /3/). This corresponds to the former temporary place of residence.
MTThe country (place) where the person normally spends his/her daily period of rest, regardless of temporary absences for purposes of recreation, holidays, visits to friends and relatives, business, medical treatment or religious pilgrimage. The country of residence can also be the country where the person intends to reside in the coming year.
NL The population in the register is that on 1 January of year x, as known on 15 February of that year.
AT All people with main residence registration in AT for more than 90 days belong to the population. Registrations of less than 90 days are not counted. Continuous registration can involve gaps of <90 days. Gaps of >90 days are treated as emigration followed by return.
PL De jure population (actually living population), i.e. having registered place of residence for permanent stay in Poland.
PTPersons who, regardless of being present or absent in a given housing unit at the date of observation, have lived in their usual place of residence for a continuous period of 12 months prior to that date, or have arrived at their usual place of residence in the 12 months prior to that date in order to live there for at least a year.
RO The legal population is all persons having legal residence (domicile) in a locality inside Romania. The usually resident population is all persons with usual residence (within the meaning of Regulation No 862/2007) in Romania.

14 Demographic statistics
Population1Details of the definition
SI
Persons with registered permanent and/or temporary residence in Slovenia who live or intend to live in Slovenia for one year or more and are not temporarily absent from Slovenia for a year or more, i.e. all persons usually resident in Slovenia, regardless of their citizenship. This includes: (1) Persons who have registered permanent residence in Slovenia, excluding those who have been abroad for one year or more and have given notice of their departure in the administrative unit of their permanent residence. These persons are counted as belonging to the population at the address of their registered permanent residence; (2) Persons who have registered temporary residence in Slovenia for a total of at least one year. These persons are counted as belonging to the population at the address of their last registered temporary residence; and (3) Persons who have registered both permanent and temporary residence in Slovenia, excluding those who have been abroad for one year or more and have given notice of their departure in the administrative unit of their permanent residence. These persons are usually counted as belonging to the population at the address of their registered temporary address.
SK Population statistics are based on the number of permanent residents.
FI Population includes Finnish citizens and foreigners living permanently in Finland according to the population information system, even if they are temporarily residing abroad.
SE New-born children to registered parents and people residing in Sweden for at least one year are registered.
UK Usual residence: An individual is a usual resident of the UK if they have lived, or intend to live, within the UK for at least one year. This includes people who have been usual residents of the UK but who are temporarily out of the country (for less than a year).
LI Usually resident population: Nationals; persons who intend to stay 12 months or longer in Liechtenstein according to their residence permit; persons (e.g. with short-term permits) who have already stayed 12 months or longer in Liechtenstein.
NO
Legal population. However, for all practical purposes legal population is the same as registered population. There may be a difference for some people if the formal registration in the population register is not recorded immediately in the CPR database, but such delays are usually not longer than a week. This delay means that the concept used is registered population. In any case, ‘usually resident population’ is the principle that takes precedence for Norwegian population registration. Unfortunately, there are several exceptions to that principle. As regards emigra-tion, what counts is the connection to Norway, not the actual stay. Conclusion: The population concept is not straightforward.
CHThe (legal) usually resident population comprises all Swiss citizens whose main domicile is in Switzerland and all non-nationals who: (1) have the legal right (permission) to stay in Switzerland for at least 12 months; or (2) whose overall uninterrupted legal stay in Switzerland is at least 12 months long.
MEPersons with their usual place of residence in Montenegro, i.e. the place where a person usually resides, regardless of temporary absence for the purposes of recreation, holiday, visits to friends or relatives, business, medical treatment or religious pilgrimage; or where a person resides or intends to reside continuously for at least one year.
AL
Usual residents: all persons who are usually resident in Albania, regardless of their citizenship and whether or not they were present at their usual place of residence at the date of the census or temporarily absent. Persons who: — had resided in the place of usual residence for a continuous period of at least 12 months prior to the date of the census; or — arrived at their place of usual residence in the 12 months prior to that date, with the intention of staying there for at least one year; or — are usually resident at the place of enumeration, but had been absent for less than 12 months as of that date.
RS
Place of usual residence is the geographical location where the person usually resides. Only those persons who have lived in their place of usual residence for a continuous period of at least 12 months before the date of the census or who have arrived in their usual place of residence in the 12 months before that date with the intention of staying there for at least one year are considered as usual residents of the relevant geograph-ical or administrative subdivision.
TR The de jure concept is used. The residence address is the place where the person intends to live continually.
BY The resident population comprises persons permanently residing in the Republic of Belarus and foreign nationals and stateless persons tempo-rarily residing there for more than a year.
BA Usually resident population
XKUnder Law No 03/L–237 on population and housing census, the resident population consists of persons who have lived in their usual residence for a continuous period of more than 12 months before the reference date of the census or who have arrived in that place during the 12 months before that date with the intention of staying there for over a year.
MD The number of people present on the territory concerned at the time of the census, including those with temporary residence.
RU Usually resident population
UA The resident population consists of those constantly living within a designated area as of the moment of the census, taking into account those temporarily absent from their permanent place of residence for no more than 12 months.
AM The usually resident population of a given territory includes permanent residents present at the time of the census and those usually resident in the place in question, but temporarily absent (for less than one year) at the time of the census.
AZThe resident population is made up of persons habitually living in the given territory on the day of the census, including residents temporarily absent. In the period between censuses, the resident population is estimated on the basis of census data and registered information as to current demographic events.
GE The usually resident population represents the number of inhabitants of a given area on 1 January of the year

15 Demographic statistics
Population 1
1.2. Registration of arrivals and departures
As shown in Table 1.3, in the vast majority of countries sur‑veyed, people coming to stay have to register on arrival; the exceptions are IE, FR, PT, UK, AM and GE. In the EU, the time limit for registration (where there is one) ranges be‑tween two days (HR and RO) and 90 days (BE, CZ, EL, LV and HU); outside the EU, the range is between three (ME) and 90 days (MD). In DE, the time limit depends on provi‑sions in the individual Länder. In six countries (CZ, CY, HR, MT, PL and SE), requirements for the time of registration differ for nationals, EU citizens and non‑EU citizens.
De‑registration is mandatory in 25 of the countries surveyed. In general, apart from the legal obligation, there is very sel‑dom an incentive to de‑register before departure. Only the system in BG provides an incentive, in that citizens declar‑ing that they are leaving the country for more than 183 days are released from paying health insurance contributions. AT, HR, LT and LU have a time limit for de‑registering: three days before departure for the first two, seven days for LT and one day for LU. In five countries (NL, PL, SI, SK and NO), the time limit depends on how long the individual intends to stay abroad.
1.3. Population structure indicators
Statistics on population structure are increasingly used to support policy‑making and monitor demographic behaviour from political, economic, social and cultural perspectives. Indicators such as the old and young age dependency ratio and the median age are computed by most of the 44 countries in the study (see Table 1.4 and Annex IV for definitions).
Further indicators are available in 24 countries: the mean age of the total population is published in 18 (BG, CZ, DE, IE, ES, HR, IT, LV, LT, HU, AT, RO, SI, FI, SE, CH, RU and UA), 19 (EE, IE, EL, ES, DE, HU, IT, LV, MT, LU, LT, PT, RO, SI, CH, RS, RU, TR and AL) produce the total depend‑ency ratio, and DE and IT also publishes other kinds of de‑pendency ratios that can be obtained from population figures by age, for example the ageing index (the ratio of population aged 65+ to population aged 0‑14). Ten countries (AT, DE, HU, PL, RO, SI, UK, CH, TR and AL) calculate the gen‑der ratio; this is usually expressed as the number of males per 100 females, but HU and SI calculate it as the number of females per 100 males, while LT calculates women per 1000 men. Some countries, for example FR, do not publish these indicators regularly; however they are used in various studies (11).
(11) For annual publications in FR, proportions of main age groups are preferred.

16 Demographic statistics
Population1Table 1.3: Registration on arrival and de-registration on departure
Obligation to registration when arriving in the country Obligation to de‑registration when leaving the country Yes No Time limit Yes No Time limit
BE x 90 days x
BG (*) x At arrival x Not specified
CZ x 90 days x
DK x 5 days x Not specified
DE xDepending on the relevant population registration provisions of each federal state. From 01.05.2015 onwards general time limit of 3 months.
x Not specified
EE x 1 month x Not specified
IE x x
EL x 90 days x
ES x No limits x No limits
FR x x
HR x 2 days x 3 days
IT x No limits x Not specified
CY x Depending on the citizenship x
LV x 90 days x Not specified
LT x 7 days x 7 days before departure
LU x 8 days x 1 day after the departure at the latest
HU x 90 days x
MT x Depending on the citizenship x
NL x 5 days x Depending on the intention to stay abroad
AT x 3 days x 3 days before departure
PL x Depending on the citizenship x Depending on the intention to stay abroad
PT x x
RO x 2 days x
SI x 8 days x Depending on the intention to stay abroad
SK x 5 days x Depending on the intention to stay abroad
FI x 7 days x Not specified
SE x Depending on the citizenship x Not specified
UK x x
LI x Not specified x
NO x 8 days x Depending on the intention to stay abroad
CH x 14 days x Not specified
ME x 3 days x Not specified
AL x 10 days x
RS x 30 days x Not specified
TR x 20 days x
BY x 5 days x Not specified
BA x Not applicable x Not specified
XK x 7 days x
MD x 90 days x
RU x 7 days x
UA x 10 days x Not specified
AM x x
AZ x 22 days x
GE x x
(*) In BG, no obligation exists for de-registration when leaving the country, only incentive.

17 Demographic statistics
Population 1Table 1.4: Population structure indicators
Old age dependency
ratio
Young age dependency
ratio Median age
Other indicators
Yes No Yes No Yes NoBE x x x
BG x x Mean age; coefficient of demographic replacement; demographic ageing
CZ x x x Mean age; ageing index; proportion of persons by broad age groups
DK x x x
DE x x x Mean age; total dependency ratio; gender ratio
EE x x x Demographic labour pressure index; total dependency ratio
IE x x x Mean age; total dependency ratio
EL x x x Total dependency ratio; ageing ratio
ES x x xMean age; total dependency ratio; natural increase per 1 000 inhabitants; births per 1 000 deaths; proportion of males in the population; proportion of persons over 64; ageing index; migration balance.
FR x x x
HR x x x Mean age; age-specific mortality rate; ageing index; age coefficient
IT x x x Mean age; ageing index and, more generally, every kind of dependency ratio that can be obtained from population figures by age
CY x x x
LV x x x Mean age; total dependency ratio; demographic burden; urban/rural population; popu-lation density; population by LAU 2
LT x x x Mean age of the population; total dependency ratio; ageing index; natural population change per 1 000; women per 1 000 men.
LU x x x Total dependency ratio
HU x x x Mean age; total dependency ratio, gender ratio, average annual increase/decrease; ageing index
MT x x x Total dependency ratio
NL x x x Demographic burden
AT x x x Mean age of total population; mean age of population aged 15-64; gender ratio
PL x x x Gender ratio
PT x x x Total dependency ratio; ageing index; working age population renewal index; longevity index; potentiality index
RO x x x Mean age; total dependency ratio; gender ratio
SI x x x Mean age; Total age dependency ratio; gender ratio; ageing index; femininity index
SK x x x Ageing index; demographic burden
FI x x x Mean age; demographic age dependency ratio
SE x x x Mean age
UK x x x Gender ratio, old age support ratio
LI x x x
NO
CH x x x Mean age; total dependency ratio; gender ratio
ME x x x
AL x x x Total dependency ratio, gender ratio
RS x x x Ageing index; dependent population
TR x x x Total dependency ratio; gender ratio; population density; population growth rate; net migration rate.
BY x x x
BA x x x
XK
MD
RU x x x Mean age; total dependency ratio
UA x x x Mean age; modal age
AM x x x
AZ
GE

18 Demographic statistics
Population1
1.4. Average populationAnnual rates and other indicators are calculated on the basis of average population. Table 1.5 shows a breakdown of coun‑tries into three groups, according to how average population is calculated:
• 26 countries calculate average population as the simple average of the numbers as of 1 January in two consecu‑tive years (12);
• 16 countries take the population at mid‑year: BE, CZ, DK, ES, LU, RO, SI, ME, AL and GE use the figure as of 1 July, while EL, HR, MT, PL, UK and LI refer to 30 June;
• Two countries (AT and DE) calculate a weighted av‑erage. DE calculates average monthly population as the simple average of population at the beginning and end of each month and then calculates the annual aver‑age as the average of the monthly averages. AT uses a quarterly method whereby the figures at the begin‑ning and end of the year count once, while those at the end of each quarter (Q1, Q2 and Q3) count twice, and the sum is then divided by eight.
(12) SK and CH base their calculations on population as of 1 January and 31 December of the reference year. FI and TR compute the average between the populations on 31 December of two consecutive years.
Table 1.5: Procedures for calculating average population
Average population is calculated as …Simple average Weighted average Mid‑year
BE x
BG x
CZ x
DK x
DE x
EE x
IE x
EL x
ES x
FR x
HR x
IT x
CY x
LV x
LT x
LU x
HU x
MT x
NL x
AT x
PL x
PT x
RO x
SI x
SK x
FI x
SE x
UK x
LI x
NO x
CH x
ME x
AL x
RS x
TR x
BY x
BA x
XK x
MD x
RU x
UA x
AM x
AZ x
GE x

2Births

20 Demographic statistics
Births2
2.1. Definition of ‘live birth’Most countries use the standard international definition of ‘live birth’. As defined by the World Health Organisation (WHO), a live birth is the complete expulsion or extraction from the mother, irrespective of the duration of the preg‑nancy, of a baby which then breathes or shows any other sign of life, such as beating of the heart, pulsation of the um‑bilical cord or definite movement of the voluntary muscles, whether or not the umbilical cord has been cut or the pla‑centa is attached. Each product of such a birth is considered ‘live born’.
Some countries (LT, SK and RU) have added additional criteria regarding the baby’s weight and/or the length of gestation (13).
2.2. Declaring a birthAll 44 countries surveyed register births of children born to parents who are resident in their territory (for the statistical treatment of children born abroad and births to ‘non‑resi‑dents’, see Table 2.2).
2.2.1. Persons who can make the declaration
There are, however, differences in registration procedures and how the requisite information is collected. Three groups of countries can be identified according to who is responsi‑ble for making the declaration; this could be:
— the parents (EE, EL, ES, LT, LU, UK and ME);
— the hospital (BE, BG, DK, SK, FI, LI, NO, ME, RS, MD and GE); or
— another body — generally, the civil registration au‑thorities attached to the justice or home/international affairs ministry (IE, FR, IT, NL, RO, BY, XK, UA, AM and AZ).
(13) RU: Live birth is the moment of foetus separation from the mother’s body through the childbirth when the pregnancy term is 22 weeks or more and child body weight is 500 grams or more (less for multiple births.) If the mass of the body is unknown — when length of child body is 25 cm or more and new-born gives signs of birth. If a pregnancy term is less than 22 weeks, weight is less than 500 grams, child body length is less than 25cm live-born is a child who has lived not less than 7 days. LT: Live birth is the delivery of a live-born child, i. e. a child showing evidence of life irrespective of the duration of pregnancy. SK: Child showing at least one sign of life, with birth weight 500 grams or more, or with a birth weight of 499 grams or less, if survives 24 hours after birth.
In some countries, births can be declared by all three of the above (e.g. DE, AT (14) and PT) or by two, in various combi‑nations as follows:
— parents and hospital (HR, LV, MT, SE, CH, TR and AL);
— hospital and civil authorities (HU, RS and RU); and
— parents and civil authorities (PL).
In CZ, births must be reported to registry offices by the hos‑pital in question or, if the baby is delivered elsewhere, by a parent or another person with knowledge of the birth. In LV, the legislation requires local authorities to declare the birth of a child where parents have not done so; if the birth takes place in a prison or shelter, the head of the institution has to declare it. In HR, SI, SE, CH and RU, the place of birth determines who is entitled to make the declaration: the gen‑eral rule is that births in a hospital or healthcare institution must be declared by that institution, while births occurring elsewhere must be declared to the civil authorities by the family.
In PL, the physician fills in some of the information on the birth declaration (medical characteristics and some identi‑fication details). Civil registration officers add socio‑demo‑graphic characteristics taken from registers and the parents’ declaration.
In NL, the parents register the child with the municipal au‑thority where the child is born, which draws up the birth declaration. The information in the declaration is then en‑tered in the population registry system, from where addi‑tional information can be obtained (e.g. parents’ personal identifiers, age, etc.)
2.2.2. Time limit for birth declarationThe time limit for declaring a birth varies widely, from one day in FI, HU, PT and SK to 90 days in CY, IE and LT. Out‑side the EU, the range varies from the same day (GE) to a year (AM).
Seven countries (BE, HR, MT, RO, SI, RS and BA) require declarations within 15 days.
Time limits can be based on calendar days and working days. Limits of one or two days usually refer to working days.
(14) According to civil registry law [PStG 2013 §9(2)] in AT, the following (in the following order) are responsible for declaring the birth: 1. the general manager of the hospital where the child is born; 2. physicians or midwives present at the birth; 3. the father or mother, if they are able to do so within the deadline; 4. any government office performing inquiries on the birth; 5. any other persons with knowledge of the birth.

21 Demographic statistics
Births 2
2.3. The contents of a birth declaration
The contents of a birth declaration vary widely among the 44 countries surveyed (see Table 2.1). The child’s gender and date of birth are registered on the birth certificate in all the countries, as is the place of birth. All countries collect other information, which in many cases includes the child’s name and personal identifier, the mother’s and father’s age and the marital status of both parents. A smaller number ask for additional characteristics about the new‑born child on the declaration, often regarding legitimacy, citizenship, whether live or stillborn, multiple or single birth, and birth order. In 14 countries (BE, BG, EL, LV, LU, AT, PL, PT, RO, SK, NO, AL, BA and AZ), all five of the above characteristics are registered on the birth certificate.
Data on the person who makes the declaration of birth are also registered. In 32 countries, this person’s name is on the declaration, while his/her address is registered in 23.
Information on type of birth (spontaneous delivery, caesar‑ean section, forceps delivery, etc.) and place of delivery is collected by seven countries (BE, EE, PL, AL, BY, BA and MD) and 26 (BE, BG, EE, IE, EL, ES, FR, HR, LU, MT, NL, PL, PT, RO, SI, SK, FI, UK, CH, RS, AL, BY, BA, XK, MD and GE) respectively. However, 18 countries (CZ, DK, DE, IT, CY, LV, LT, HU, AT, PT, SE, LI, NO, ME, TR, UA, AM, AZ and RU) (15) do not register any details about the place of delivery. The birth declaration in 19 countries includes duration of pregnancy (BE, BG, CZ, EE, IE, EL, HU, MT, AT, PL, RO SI, SK, CH, AL, BY, XK, MD and GE) (16).
As mentioned above, birth declarations usually include data on parents as well: often their age, marital status, nationality and country of birth. All these details (for both parents) can be found on the declarations in 16 countries (BE, BG, DE, EE, EL, FR, LV, LU, MT, AT, PT, SK, LI, AL, BY, RU, AM, AZ and GE) (17). RO collects all these details only for mothers. Information on the highest level of educational attainment is collected in 19 countries (BE, BG, CZ (18), EE, EL, HR, HU, AT, PL, RO, SK, ME, AL, BY, BA, XK, RU, AM and AZ), in RO and RU only for the mothers.
(15) CZ and DK can retrieve these from related information sources. In CZ, the report for the NSI does not contain this information, but medical reports on mother/new-born do.
(16) In some cases, like for example PT this can be deduced from related information sources.
(17) Same as above.
(18) Collected on a voluntary basis.
Table 2.1 shows a selection of children’s and parents’ charac‑teristics as registered in birth declarations in the countries surveyed. As can be seen, the amount of information col‑lected varies widely among countries. BG and EE register 27 of the 30 selected items in the table, while FI, HR and CY record fewer than 10. Outside the EU, BY is the country that registers the highest number of items (28) and MD and UA collect the least information (16 items).
However, in some countries, such as NL, DK, PT or CZ the information in the birth declaration is integrated in the register, from where a number of other information (among those listed in table 2.1) can or could be deduced or calculated. For example the mother’s and father’s age can be deduced from their date of birth etc., thus this informa‑tion could be considered as available. In PT the collection of live births data for statistical purposes includes informa‑tion from the birth declaration plus a set of other variables collected simultaneously in an electric questionnaire. In DK, medical information on births is taken from the cen‑tral population register and supplemented with data from the birth register, retrieved by the NSI, while information on the mother’s and father’s background is compiled from administrative registers. Thus it can be said that the declara‑tion of birth is a general indication of the information avail‑able for statistical offices, but in many cases it is not their only source of information.

22 Demographic statistics
Births2Table 2.1: Contents of a birth declaration
Dec
lari
ng p
erso
n ‑
Nam
e
Dec
lari
ng p
erso
n ‑
Add
ress
Del
iver
y ‑ T
ype
Del
iver
y ‑ P
lace
Preg
nanc
y du
rati
on
Child
‑ N
ame
Child
‑ Pe
rson
al
iden
tifie
r
Child
‑ Se
x
Child
‑ Bi
rth
date
Child
‑ Bi
rth
plac
e (c
ount
ry,
mun
icip
alit
y, e
tc.)
Child
‑ Li
ve o
r st
ilbir
th
Child
‑ Le
giti
mac
y
Child
‑
Citi
zens
hip
Child
‑ Bi
rth
orde
r
Child
‑ M
ulti
ple
or s
ingl
eton
BE x x x x x x x x x x x
BG x x x x x x x x x x x x x x
CZ x x x x x x x x x x x
DK x x x x x
DE x x x x x x
EE x x x x x x x x x x x x x x
IE x x x x x x x x x x x
EL x x x x x x x x x x x x
ES x x x x x x
FR x x x x x x x x x x
HR x x x x x x x x x x x x
IT x x x x x x x
CY x x x x x
LV x x x x x x x x x x
LT x x x x x x x x x x
LU x x x x x x x x x x x x x
HU x x x x x x x x
MT x x x x x x x x x x x x
NL x x x x x x x
AT x x x x x x x x x
PL x x x x x x x x x x x x
PT x x x x x x x x x x x x
RO x x x x x x x x x x x x
SI x x x x x x x x x x x x x
SK x x x x x x x x x x x x x x
FI x x x x x x x
SE x x x x x x x
UK x x x x x x x x x x
LI x x x x x x x x x x
NO x x x x x x x x x x
CH x x x x x x x x x x x x
ME x x x x x x x
AL x x x x x x x x x x x x x
RS x x x x x x x x
TR x x x x x x x x x
BY x x x x x x x x x x x x x x
BA x x x x x x x x x x x x x x
XK x x x x x x x x x x x x x
MD x x x x x x x x x x x x x
RU x x x x x x x x x x
UA x x x x x x x x x
AM x x x x x x x x x x
AZ x x x x x x x x x x x x
GE x x x x x x x x x x x x

23 Demographic statistics
Births 2M
othe
r ‑ A
ge
Mot
her ‑
Mar
ital
st
atus
Mot
her ‑
Per
sona
l id
enti
fier
Mot
her ‑
Ci
tize
nshi
p
Mot
her ‑
Cou
ntry
of
bir
th
Mot
her ‑
H
ighe
st le
vel
of e
duca
tion
al
atta
inm
ent
Mot
her ‑
12
mon
ths
resi
dent
in th
e co
untr
y (o
r mor
e)
Fath
er ‑
Age
Fath
er‑ M
arit
al
stat
us
Fath
er ‑
Pers
onal
id
enti
fier
Fath
er ‑
Citi
zens
hip
Fath
er ‑
Coun
try
of b
irth
Fath
er ‑
Hig
hest
leve
l of
edu
cati
onal
at
tain
men
t
Fath
er ‑
12 m
onth
s re
side
nt in
the
coun
try
(or m
ore)
Oth
er
x x x x x x x x x x BE
x x x x x x x x x x x x x BG
x x x x x x x x x x CZ
x x DK
x x x x x x x x x DE
x x x x x x x x x x x x x EE
x x x x x x IE
x x x x x x x x x x x x EL
x x x x x x x x x ES
x x x x x x x x x FR
x x x x x x HR
x x x x x x x x IT
x CY
x x x x x x x x x x x LV
x x x x x LT
x x x x x x x x x x LU
x x x x x x x x x x HU
x x x x x x x x x x x MT
x x x x NL
x x x x x x x x x AT
x x x x x x x PL
x x x x x x x x x PT
x x x x x x x x RO
x x x SI
x x x x x x x x x x x x SK
x FI
x x SE
x x x x x x x UK
x x x x x x x x LI
x x NO
x x x x x x x x x CH
x x x x x x x x x x ME
x x x x x x x x x x x x x x AL
x x x x x x x x x RS
x x x x x x x x TR
x x x x x x x x x x x x x x BY
x x x x x x x x x x x x x BA
x x x x x x x x x x x x x XK
x x x MD
x x x x x x x x x x RU
x x x x x x x UA
x x x x x x x x x x AM
x x x x x x x x x x x x AZ
x x x x x x x x x x GE
Table 2.1: Contents of a birth declaration (continued)

24 Demographic statistics
Births2
2.4. Live births abroad, live births to ‘non-residents’ and mother’s age
As can be seen from Table 2.2, 37 of the 44 countries sur‑veyed register live births abroad, but only 21 include them in their national statistics. (19) Of the 31 countries that register live births to ‘non‑residents’, 12 (IE, EL, ES, FR, HU, PT, RO, UK, BY (20), XK, MD and RU) include them in their national statistics. Based on these differences, four groups of coun‑tries can be identified:
• those that include children born abroad and exclude children to ‘non‑residents’ born on their territory (BE, CZ, DK, DE, CY, LT, LU, NL (21), SI, SE and CH, BY);
(19) Also LV partly includes live births abroad in its national statistics. Data on the usual residence of the mother before and after the birth are used, as is information from the health register (the child has to be seen by a doctor once a month in the first six months and then twice between the seven and 11 months). If the mother is usually resident in the country (even if she was abroad for a short period), but the birth occurs abroad, this is included in national statistics. Live births to ‘non-resident’ women in the country are partly registered but not included in national statistics.
(20) Vital events, marriage and divorce of BY residents temporarily living or staying abroad are included in the national statistics if the events were registered at the consular institutions or diplomatic missions of BY. Duplicate copies of records of births, deaths, marriages and divorces occurring to BY residents temporarily living or staying abroad are then annually (before 31 December following the reporting year) sent to the Ministry of Foreign Affairs of BY.
(21) NL registers children born abroad where at least one parent is resident in the Netherlands.
• those that exclude the former and include the latter (HU, ES, PT and RU);
• those that exclude both (BG, EE, HR, LV, MT, NL, PL, SK (22), ME, RS, AL and BA); and
• those that include both (RO, XK and MD).
All the countries are able to produce birth data by mother’s age at the time of giving birth. Some (BE, CZ, DK, DE, EE, FR, CY, LV, LU, MT, NL, SI, SK, SE, LI, NO, CH, BA and GE) also produce data by mother’s age reached at the end of the year (see Table 2.3).
(22) SK included live births abroad in national statistics until 2011, but has not done so since.

25 Demographic statistics
Births 2Table 2.2: Live births abroad and live births to ‘non-residents’
Live births abroad registered Live births abroad included in national statistics
Live births to ‘non‑residents’ registered
Live births to ‘non‑residents’ included in national statistics
Yes No Yes No Yes No Yes NoBE x x x x
BG x x x x
CZ x x x x
DK x x x x
DE x x x x
EE x x x x
IE x x x
EL x x x
ES x x x x
FR x x x
HR x x x x
IT x x x
CY x x x x
LV x x x x
LT x x x x
LU x x x x
HU x x x x
MT x x x x
NL x x x x x
AT x x x
PL x x x x
PT x x x x
RO x x x x
SI x x x x
SK x x x x
FI x x x
SE x x x x
UK x x x
LI x x x
NO x x x
CH x x x x
ME x x x x
AL x x x x
RS x x x x
TR x x x
BY x x x x
BA x x x x
XK x x x x
MD x x x x
RU x x x x
UA x x x
AM x x x
AZ x x x
GE x x x

26 Demographic statistics
Births2Table 2.3: Mother’s age
Mother’s age definitionAge reached at the end of the year Age completed at the time of the event
BE x x
BG x
CZ x x
DK x x
DE x x
EE x x
IE x
EL x
ES x
FR x x
HR x
IT x
CY x x
LV x x
LT x
LU x x
HU x
MT x x
NL x x
AT x
PL x
PT x
RO x
SI x x
SK x x
FI x
SE x x
UK x
LI x x
NO x x
CH x x
ME x
AL x
RS x
TR x
BY x
BA x x
XK x
MD x
RU x
UA x
AM x
AZ x
GE x x

27 Demographic statistics
Births 2
2.5. Fertility indicators
2.5.1. Total fertility rateAll 44 countries surveyed produce total fertility rates (TFR) (see Table 2.4). More than half use fertility rates by single years of age only. The others fall into two groups: 16 that compile TFRs by five‑year age groups and seven (DK, EL, RO, SK, UK, RS and AM) that use both single ages and five‑year age groups.
In almost all countries, 15 is the lowest age and 49 is the highest age of the mother distinguished for the purpose of calculating the TFR. The other countries have different age spectrum:
• EE and EL, where 13 and 14 are the lowest ages, and 50 is the highest;
• FR, where 50 is the highest age;
• UK, where the highest age is 44;
• RU, where 54 is the highest age;
• IT, where 13 is the lowest age and 55 is the highest;
• LU, MT and FI, which have no age limit; and
• HR, which is the only country using five‑year age groups where 10–14 is the lowest age and ages above 50 are the highest;
Mothers outside the range are usually assigned to the lowest or highest ages. However, in 16 countries (BE, DK, DE, EE, FR, HU, RO, SI, SK, LI, NO, ME, TR, BA, MD and GE), such cases are not taken into account.
2.5.2. Availability of total fertility rateTable 2.5 shows that in 28 countries TFRs are calculated at regional level, mostly at the most detailed regional level (NUTS 3) (23). CZ, NL and PL also compute TFRs at a more local level: LAU 1 (CZ) and LAU 2 (NL and PL). A number of countries provide breakdowns on the basis of citizenship (BE, DE, ES, IT, LU, MT, AT and CH), country of birth (NL, FI, UK and CH), urban/rural (CZ and RO), birth order (CZ and ES) and parents’ marital status (NL and CH).
(23) In SI, TFRs at NUTS 3 level are available for five-year periods only.

28 Demographic statistics
Births2Table 2.4: Calculation of total fertility rate
Mother’s age Mother’s age Mothers of other ages Live births abroad Live births to ‘non‑residents’
Single ages
5‑years age
groupsLowest Highest
When they are younger they
are assigned to
When they are older they are
assigned toIncluded Excluded Included Excluded
BE x 15 49 not included not included x xBG x 15 49 15 49 x xCZ x 15 49 15 49 x xDK x x 15 49 not included not included x xDE x 15 49 not included not included x xEE x 13 50 not included not included x xIE x 15 49 15 45-49 x xEL x x 14 50 14 50 x xES x 15 49 15 49 x xFR x 15 50 not included not included x xHR x 10-14 50+ 10-14 50+ x xIT x 13 55 13 55 x xCY x 15 49 15 49 x xLV x 15 49 15 49 x xLT x 15 49 15 49 x x
LU x no age limits
no age limits x x
HU x 15 49 not included not included x x
MT x no age limits
no age limits x not
applicableNL x 15 49 15 49 x xAT x 15 49 15 49 x xPL x 15 49 15 49 x xPT x 15 49 15 49 x xRO x x 15 49 not included not included x xSI x 15 49 not included not included x xSK x x 15 49 not included not included x x x
FI x no age limits
no age limits x x
SE x 15 49 15 49 x xUK x x 15 44 15 44 x xLI x 15 49 not included not included x xNO x 15 49 not included not included x xCH x 15 49 15 49 x xME x 15 49 not included not included x xAL x 15 49+ 15 x xRS x x 15 49 15 49 x x
TR x 15 49 not included not included x not applicable
BY x 15 49 15 55 x xBA x 15 49 not included not included x x
XK x >15 <49 49 x not applicable
MD x 15 49 not included not included x x
RU x 15 54 15 54 not applicable
not applicable
UA x 15 49 15-19 45-49 x not applicable
AM x x 15 49 15 49 not applicable
not applicable
AZ x 15 49 15-49 45-49 x x
GE x 15 49 not included not included not applicable x

29 Demographic statistics
Births 2Table 2.5: Breakdowns of total fertility rate
Regional level TFR Other breakdowns for TFRBE NUTS 2 Citizenship (Nationals and non-nationals)
BG NUTS 3
CZ NUTS 3, LAU 1 Urban/rural, birth order
DK Municipalities Immigrant background and education
DE NUTS 1 Citizenship (Nationals and non-nationals)
EE
IE NUTS 3
EL
ES Autonoums Communities (NUTS 2) and Provinces Citizenship (Nationals and non-nationals) and birth order
FR NUTS 3
HR
IT NUTS 3 Citizenship (Nationals and non-nationals)
CY
LV NUTS 3
LT NUTS 3 and LAU 1 levels
LU Citizenship (Nationals and non-nationals)
HU NUTS 1-3
MT Total population and Nationals
NL NUTS 3, LAU 2 Country of birth, marital status
AT NUTS 1, NUTS 2, NUTS 3, Political Districts, Functional Classifications Groups of citizenship; groups of country of foreign origin
PL NUTS 2 and NUTS 3; LAU 2
PT NUTS 3
RO NUTS 3 Urban/rural
SI NUTS 3 (5 years rates only), NUTS 2
SK NUTS 3; LAU 1
FI NUTS 3; municipality level but only 5-year rates Country of birth
SE Municipality
UK NUTS 3 Country of birth
LI
NO County level This is not done on regular basis, but as part of research projects
CH NUTS 3 Marital status, citizenship, country of birth
ME
AL
RS NUTS 3 and other higher levels
TR NUTS 3
BY Macrolevel, mesolevel
BA
XK
MD
RU At all levels
UA Not applicable
AM
AZ
GE
2.5.3 Mean age of women at childbirthWhen calculating the mean age of women giving birth, one has to decide whether to define age:
— in completed years at the time of giving birth (i.e. age completed at the most recent birthday); this is used by the majority of the countries surveyed; or
— as age reached during the calendar year (i.e. age based on the year of birth of the mother); this is used by FR, LV, CH and GE.
Four countries (BE, DE, NL and BA) apply both definitions. Of the 36 countries using the first definition only, 27 add 0.5 years to each age in the formula to calculate the mean age of the mother on giving birth (on calculating the mean age please see Annex III).

30 Demographic statistics
Births2The mean age can be calculated from observations during the calendar year (event‑based) or from age‑specific fertility rates (rate‑based). Age‑specific fertility rates are computed as the ratio between the number of births at a certain age of the mother and the average female population of that age.
Annex II and III describe in detail the two methodologies. Most countries apply the former method, but eight (BE, CZ, ES, FR, IT, LT, SE and CH) use the latter. Five (EE, LU, AT, UK and RU) produce both rate‑based and event‑based figures (see Table 2.6).
Table 2.6: Mean age of women at childbirth
Age of mother at birth of child Calculation of mean age of mother
Age completed Age reached at the end of the calendar year Rate‑based Event‑based
BE x x x
BG x x
CZ x x
DK x x
DE x x x
EE x x x
IE x x
EL x x
ES x x
FR x x
HR x x
IT x x
CY x x
LV x x
LT x x
LU x x x
HU x x
MT x x
NL x x x
AT x x x
PL x x
PT x x
RO x x
SI x x
SK x x
FI x x
SE x x
UK x x x
LI x x
NO x x
CH x x
ME x x
AL x x
RS x x
TR x x
BY x x
BA x x x
XK x x
MD x x
RU x x x
UA x x
AM x x
AZ x x
GE x x

31 Demographic statistics
Births 2
2.6. Induced abortionsData on induced abortions are collected by the majority of the 44 countries; 10 countries (AT, HR, CY, LU, MT, LI, NO, AL, BA and XK) do not collect this information.
Abortion is legal in almost all of the countries surveyed. In most countries, abortion laws were passed in the 1970s and 1980s. FI has the oldest abortion law in Europe dating from 1950; IE has the most recent, with a law in force since 1 Jan‑uary 2014 (see Table 2.7).
Table 2.7: Induced abortions
Data on abortion collected Abortion legalisedYes No Yes No Since what date
BE x x 03-04-1990
BG x x 01-01-1970
CZ x x 30-12-1957
DK x x 01-01-1973
DE x x 01-01-1996
EE x x 01-01-1991
IE x x 01-01-2014
EL (*) x x 27-01-1984
ES x x 03-03-2010
FR x x 17-01-1975
HR x x 21-04-1978
IT x x 31-05-1978
CY x x 1986
LV x x 01-02-1955
LT x x 28-01-1994
LU x x 15-11-1978
HU x x 01-01-1954
MT x x
NL x x 05-01-1981
AT x x 23-01-1974
PL x x 21-01-1993
PT x x 15-07-2007
RO x x 01-01-1990
SI x x 01-07-1977
SK x x 01-01-1957
FI x x 01-07-1950
SE x x 01-01-1975
UK (**) x x 27-04-1968
LI x x
NO x x 1978
CH x x 01-01-1942 and 01-10-2002
ME x x 07-08-2009
AL x x 07-12-1995
RS x x 07-10-1977
TR x x 24-05-1983 (Family Planning Law)
BY x x 18-06-1993
BA x x
XK x
MD x x 01-03-1995
RU x x 05-06-1987
UA x x 01-01-1955
AM x x 23-11-1955
AZ x x 26-06-1997
GE x x 10-12-1997
(*) Data are collected from the survey on the in-patient hospital care (ICD10).
(**) Date relates to England, Wales and Scotland only.

32 Demographic statistics
Births2
2.6.1. Circumstances under which abortion is allowed
In many countries, the woman is free to decide to terminate pregnancy in the first few weeks. After this, abortion is sub‑ject to additional conditions, usually to do with health.
In general, abortions can be carried out if the woman has been pregnant for less than 10‑12 weeks (see Table 2.8). Ex‑ceptions are possible, in particular where the mother’s and/or foetus’ health is in serious danger. In EE, for example, attention is focused on the health status of the mother: if this hinders the child’s development, the pregnancy can be terminated. Abortion is legal in IE only where there is a real and substantial risk to the life, as distinct from the health, of the pregnant woman that may be averted only by termination of the pregnancy. In PL, pregnancy can be terminated for the above reasons, but also if it is the result of a criminal act.
2.6.2. The contents of an abortion registration
As with birth certificates, the information collected through abortion registrations vary widely between countries (see Table 2.9). HR, NL, AT, CY, LU, MT, LI, NO, AL, BA, XK and MD do not collect data on induced abortions. In all other countries where abortion is allowed, a medical form has to be filled in by the hospital or the doctor in question. BG requires a declaration from the woman and the results of specialised medical examinations demonstrating the ab‑sence of contra‑indications for abortion. In AZ, the woman can declare the abortion herself if it takes place in the first 12 weeks of pregnancy.
In IE, the 2013 Protection of Life During Pregnancy Act provides for a notification system covering all terminations
of pregnancy carried out under the Act. Specifically, it re‑quires that the Minister for Health be notified of each ter‑mination no later than 28 days after it has taken place (the woman’s name is not disclosed). The notification, by means of a prescribed form, must include:
• the Medical Council registration number of the medi‑cal practitioner who carried out the procedure;
• the section of the Act, i.e. section 7, 8 or 9, under which it was carried out;
• the Medical Council registration numbers of the certi‑fying doctors;
• the name of the institution where it was carried out or the location if it was carried out elsewhere in an emergency; and
• the date on which the procedure took place.
Of the 44 countries surveyed, CZ, DE, IT, HU, SI, SK, FI (24), TR, RU and RS are those where registrations contain most information. This can include the woman’s socio‑de‑mographic data (age, marital status, educational attainment and employment status), reproductive history (previous live births, previous abortions), reasons for abortion, and length of pregnancy. 17 countries (CZ, DE, ES, FR, FI, IT, HU, PT, RO, SI, SK, UK, CH, TR, RS, BY and RU) specify the type of abortion (whether by surgery — encompassing eight different procedures, or the administration of pharma‑ceuticals — encompassing three different procedures). The woman’s nationality is registered in CZ, EL, ES, IT, PT, TR and RU. Eight countries (CZ, DE, ES, HU, IE, PT, UK and BY) also indicate the reason for the intervention. Medical details (25) are documented in abortion declarations in ten countries (CZ, DE, ES, IT, HU, FI, UK, TR, RU and RS).
(24) FI has a separate abortion register which contains additional information.
(25) Medical details can include urgency, analgesic therapy, occurrence of complications, health reason for abortion, etc.

33 Demographic statistics
Births 2Table 2.8: Abortion regulations
Upper limit (number of weeks
pregnant)
Exceptions possible Other limitations
BE 12 weeks yes Pregnancies can be interrupted after 12 weeks only because of a risk to the mother’s or foetus’ health
BG 12 weeks yes Two types of abortions: at the woman’s request or on the basis of medical indications. Pregnancy older than 12 weeks can be interrupted only in case of risk for mother’s or foetus’ health.
CZ 24 weeks yes Health reasons
DK 12 weeks not specified Not specified
DE 12 weeks yes Not specified
EE 12 weeks yes
Later abortions are allowed up to the 22nd week if: 1) the age of the woman is <15 or >45; 2) the woman or the foetus suffers from physical/mental problems/defects; or 3) the woman’s illness is hindering the child’s development.
IE not specified not specified Abortion is legal in Ireland in cases where there is a real and substantial risk to the life, as distinct from the health, of the pregnant woman which may be averted only by termination of pregnancy.
EL 12 weeks not specified Not specified
ES 14 weeks yes Abortion can be induced up to the 22nd week in cases of risk to mother’s health or serious physical defects of the foetus
FR 12 weeks yes No limitation on preganancy duration depending on justifying factors affecting the foetus’ and/or the mother’s health.
HR 10 weeks not specified Restricted variously with the age of the pregnancy, the age of the woman, and the opinion and consent of medical professionals involved.
IT 12 weeks (90 days) yes Pregnancy can be interrupted after 90 days of gestational age where the woman’s life or health is in danger
CY not specified not specifiedAbortion is only performed in Cyprus if there is a risk of physical or mental harm to the mother, if there is a risk of fetal deformity, or if the patient was raped or had another sexual crime committed against them ‘affecting the social or family status.’
LV 12 weeks yes In cases of serious risk to the mother’s health, induced abortion is allowed up to 24 completed weeks.
LT 12 weeks Up to 22 weeks, abortion can be induced for specific therapeutic reasons.
LU not specified not specified Not specified
HU 12 weeks yes For health reasons, abortion can be carried out at any time; for any other reasons until the 12th week
MT not specified not specified Not specified
NL 24 weeks yes Two pillars In the law: protection of the unborn child; protection of women who are pregnant against their will Five-day ‘reflection period’ between file for abortion and actual abortion
AT 12 weeks not specified Not specified
PL 12 weeks yes
Pregnancy can be terminated only if: 1. The pregnancy constitutes a threat to the life or health of the mother; 2. There is a serious damage of the foetus up till 12th week of pregnancy; 3. The pregnancy is the result of a criminal act
PT 10 weeks yes 12, 16, 24 weeks, at any time, depending on the seriousness of the problem affecting mother and/or foetus
RO 12 weeks yes Pregnancies can be interrupted after more than 12 weeks if mother’s or child’s health is at risk.
SI 10 weeks yes After the 10th week, induced abortion is allowed on the basis of medical conditions (prenatal anomalies of the foetus or when woman’s health or life is endangered) or social conditions.
SK 12 weeks not specified Not specified
FI 12 weeks yes Abortion is allowed up to the 24th week for medical reasons
SE 19 weeks yes After 19 weeks, pregnancy can be interrupted only for medical reasons
UK (*) 24 weeks yes Risk to life or health; child will be born with severe health risks
LIAbortion is illegal except in cases of serious danger to the woman’s life or health that can only be prevented with an abortion, or when the woman was under the age of 14 at conception and unmarried to the man who impregnated her.
NO 12 weeks yes By application up to 18th week and only in exceptional cases thereafter.
CH 12 weeks yes After the 12th week, abortion can be induced if necessary to prevent the pregnant woman from sustaining serious physical injury or serious psychological distress.
ME 10 weeks yes After the 10th week, pregnancy can be interrupted only for medical reasons.
AL not specified not specified Not specified
RS 10 weeks yes After the 10th week, pregnancy can be interrupted only for medical reasons.
TR 10 weeks yes There are some exceptions relating to the health of the mother (see Regulation dated 18.12.1983).

34 Demographic statistics
Births2Upper limit
(number of weeks
pregnant)
Exceptions possible Other limitations
BY 12 weeks yes
In case of minors abortion can be carried out with the written consent of her legal representative. In case of certain medical conditions and the woman’s consent abortion can be carried out regardless of gestation term. In case of social conditions (court decision on deprivation of parental rights; preganancy as a result of criminal act) and woman’s consent abortion is allowed up to the 22nd week of gestation.
BA 10 weeks yes When the woman’s life or health is threatened, when the fetus is severely impaired, when the pregnancy results from a crime, and for psychosocial reasons
XK not specified not specified Not specified
MD not specified not specified Not specified
RU 27 weeks not specified Not specified
UA 12 weeks yes Abortion is allowed up to the 22nd week for medical reasons.
AM 22 weeks not specified Not specified
AZ 22 weeks yes Abortion is allowed up to the 22nd week for social reasons.
GE 12 weeks not specified Not specified
(*) Relates to England, Wales and Scotland only. In Northern Ireland abortion is only lawful in exceptional circumstances, where:— it is necessary to preserve the life of the woman, or — there is a risk of real and serious adverse effect on her physical and mental health, which is either long term or permanent.

35 Demographic statistics
Births 2Table 2.9: Contents of an abortion registration
Med
ical
form
Upp
er li
mit
Dra
wn
up b
y do
ctor
Information on form
Add
itio
nal
info
rmat
ion
Age
Educ
atio
n/pr
ofes
sion
Mar
ital
sta
tus
Coun
try/
prov
ince
of
resi
denc
e
Nat
iona
lity
Prev
ious
live
bi
rths
Prev
ious
abo
rtio
ns
Type
of a
bort
ion
Reas
ons
for
abor
tion
Leng
th o
f pr
egna
ncy
Med
ical
dat
a
Agg
rega
ted
data
BE x x x x x
BG (*) x x x
CZ x x x x x x x x x x x x
DK x x x
DE x x x x x x x x x xNumber of minors in the households
EE x x x x x
IE x x x
Date of procedure and name of the institution where the abortion took place.
EL x x x x x x
ES x x x x x x x x x x x x x
FR x x x x x
HR
IT x x x x x x x x x x x x
Weeks of amenorrhea, presence of foetal mal-formations. Complete medical infor-mation on the operation
CY
LV x x x
LT x x x
LU
HU x x x x x x x x x x x
Price of abortion, number of days in healthcare
MT
NL
AT
PL x x x
PT x x x x x x x x x x x x
RO x x x x
SI x x x x x x x x x x
SK x x x x x x x x xInformation about the hospital
FI x x x x x x x x x
SE x x

36 Demographic statistics
Births2M
edic
al fo
rmU
pper
lim
it
Dra
wn
up b
y do
ctor
Information on form
Add
itio
nal
info
rmat
ion
Age
Educ
atio
n/pr
ofes
sion
Mar
ital
sta
tus
Coun
try/
prov
ince
of
resi
denc
e
Nat
iona
lity
Prev
ious
live
bi
rths
Prev
ious
abo
rtio
ns
Type
of a
bort
ion
Reas
ons
for
abor
tion
Leng
th o
f pr
egna
ncy
Med
ical
dat
a
Agg
rega
ted
data
UK x x x x x x x x x x x
ethnicity, funding of abortion (England and Wales only)
LI
NO
CH x x x x x x
ME x x x x
AL
RS x x x x x x x x x xInformation about the hospital
TR (**) x x x x x x x x x x x x
BY x x x x x x x
BA
XK
MD
RU (***) x x x x x x x x x x x x
UA x x x xDeaths following abortions.
AM x x x
AZ x x
GE x
(*) Information is provided to the NSI by National Centre for Public Health and Analyses at the Ministry of Health and aggregated data are received for statistical purposes.(**) In the event of termination of pregnancy, health-care institutions transmit information related to the pregnancy (pregnant, doctor and treatment information) to the web services
and electronically to the Ministry of Heath.(***) Healthcare institutions transmit information relating to the pregnancy, the doctor and the treatment to services’ web servers and electronically to the Ministry of Health.
2.6.3. Abortion indicatorsAbortion indicators are calculated widely across the coun‑tries surveyed (see Table 2.10). 23 countries calculate either abortion rate or abortion ratio, of which eleven (CZ, DE, ES, SI, SK, FI, CH, TR, BY, RU and UA) produce both abortion rate and abortion ratio (26). Total abortion rates are produced by CZ, HU and FI; LV, CZ, HU and RU compute abortion indicators by some characteristics of the mother (age, mari‑tal status), the UK computes the percentage of conceptions leading to abortions, and UA computes the frequency of deaths following abortions (per 10000 abortions), as further examples of indicators calculated based on abortion data.
(26) Please refer to the Glossary in Annex IV for the definitions.

37 Demographic statistics
Births 2Table 2.10: Abortion indicators
Abortion rate Abortion ratio Other indicators
Yes No Yes NoBE
BG x x
CZ x x Total abortion rate; mean age at abortion
DK x x
DE x x
EE x x
IE
EL
ES x x Group age specific abortion rates and percentage distributions
FR
HR
IT x x
CY
LV x xAbortions per 100 live and stillbirths; induced abortions per 100 live and stillbirths; induced abortions by age of female; induced abortions by age of female per 100 live and stillbirths
LT
LU
HU x x Total pregnancies/foetal loss/ foetal death rate; age-specific abortion rate; abortions per 100 live births; abortions by marital status.
MT
NL
AT
PL
PT An agreement is pending between the NSI and the Directorate of Health for the dissemination of statistics on legally induced abortions.
RO x x
SI x x
SK x x Age-specific abortion rates
FI x x Total abortion rate
SE
UK x x Percentage of conceptions leading to abortions
LI
NO
CH x x
ME
AL x x
RS x x
TR x x ‘Age-specific abortion rate’ and ‘proportion by type of abortion’ are available (via the Turkish population and health surveys)
BY x x
BA
XK
MD
RU x x By mother’s age.
UA x x
Frequency of usage of dangerous and safe methods to terminate pregnancy prior to 12 weeks of pregnancy per 1 000 women of fertile age (15-49 years old) and per 1 000 corresponding female population at selected age groups; frequency of deaths following abortions per 10 000 abortions.
AM x x
AZ x x
GE


3Deaths

40 Demographic statistics
Deaths3
3.1. Definition of deathAccording to the United Nations (UN) definition, death is ‘the permanent disappearance of all evidence of life at any time after live birth has taken place (postnatal cessation of vital functions without capability of resuscitation). This def‑inition therefore excludes foetal deaths’.
The majority of the countries surveyed follow the UN defi‑nition. Variations nevertheless exist:
• DK uses loss of brain function to define death;
• LT defines death as the irreversible cessation of life of the human body as a whole; and
• RU uses both the above criteria (brain death and ir‑reversible death of human body).
3.2. Declaring a deathDeaths are registered in all 44 countries surveyed, i.e. all people who die in the countries’ territories are, in principle, registered as deceased.
In almost all countries, doctors or relatives can fill in the declaration of death, which must be made at a local or dis‑trict civil registration office. In several countries the infor‑mation in this document is complemented by other sources, such as a separate declaration made by a doctor or a statisti‑cal questionnaire collected simultaneously with the regis‑tration of death (27).
Time limits for declaring a death are generally much shorter than those for declaring a birth. In the majority of the coun‑tries surveyed, deaths must be declared within zero to seven days. However:
• in AL, AZ and TR, deaths must be declared within 10 days;
• in IE and CY, the declaration can be made as much as a year later; and
• there is no time limit in NL.
(27) In Portugal, for example, data on deaths are collected from three different sources:
(1) The death certificate, filled by a doctor (2) The death registration, made at a Civil Registration Office by a relative or other
person on his/her behalf (3) A statistical questionnaire collected simultaneously with the registration of death by
the Civil Registration Office.
The data from these three sources are compiled by Statistics Portugal into a unique database. (Table 3.1 includes information coming from these three sources for Portugal).
3.3. The contents of a death declaration
As can be seen from Table 3.1, the information contained in death declarations vary between the 44 countries. The date of death is included in declarations in all countries and the name and date of birth of the deceased in all except BE, NL (name excluded), FI, SE and NO (name and date of birth excluded).
16 countries do not register the age of the deceased, although in all these countries except FI, SE and NO this information could be derived from processing.
32 countries (FI, SE and NO included) register the personal identification number (PIN), whereby in a number of coun‑tries the declaration can be linked to other registered data.
The deceased’s religion is registered in CY, DE (till 2013) and RS, while the highest level of educational attainment is registered in BE, BG, CZ (28), EE, EL, HR, IT, HU, PL, PT, RO, SK, ME, TR, BY, BA, XK, MD, RU, AM and AZ. EE also records place of burial.
Citizenship and country of birth are registered by 32 and 30 countries, respectively, while marital status and cause of death are recorded by 37.
EE, EL, IT, CY, HU, RO, SK and BA register the most items on the death declaration, while FI and SE register only a very limited amount of information. However, several countries can link different sources in order to obtain more informa‑tion. In NL for example the declaration of death is made up by the general practitioner (doctor) and sent to Statis‑tics Netherlands through the municipal authority where the person has died. The information in the document is com‑bined with the population registry information available at Statistics Netherlands. Secondary variables like: country of birth, date of birth, address, sex etc. are obtained from the register, not from the death declaration itself.
(28) On a voluntary basis.

41 Demographic statistics
Deaths 3Table 3.1: Contents of a death declaration
Nam
e
Pers
onal
iden
tifie
r
Dat
e of
dea
th
Dat
e of
bir
th
Age
Plac
e of
dea
th
(cou
ntry
, m
unic
ipal
ity,
etc
.)
Plac
e of
dea
th (a
t ho
me,
hos
pita
l, et
c.)
Add
ress
Gen
der
Mar
ital
sta
tus
Citi
zens
hip
Coun
try
of b
irth
Hig
hest
leve
l of
edu
cati
onal
at
tain
men
t
12 m
onth
s (o
r mor
e)
resi
dent
in th
e co
untr
y
Caus
e of
dea
th
Oth
er
BE x x x x x x x x x x x
BG x x x x x x x x x x x x
CZ x x x x x x x x x x x x x x
DK x x x x x x x x x x
DE x x x x x x x x x x x x x
EE x x x x x x x x x x x x x x
IE x x x x x x x x x x
EL x x x x x x x x x x x x x x x x
ES x x x x x x x x x x x
FR x x x x x x x x x x x
HR x x x x x x x x x x x x x
IT x x x x x x x x x x x x x x
CY x x x x x x x x x x x x x
LV x x x x x x x x x x x x
LT x x x x x x x x x x
LU x x x x x x x x x x x x
HU x x x x x x x x x x x x x x
MT x x x x x x x x x x x x x x
NL x x x x x x x x
AT x x x x x x x x x x x
PL x x x x x x x x x x x x
PT x x x x x x x x x x x x
RO x x x x x x x x x x x x x x x x
SI x x x x x x x x x x x
SK x x x x x x x x x x x x x x
FI x x
SE x x x
UK x x x x x x x x x x x
LI x x x x x x x x x
NO x x x x x
CH x x x x x x x x x x x x x
ME x x x x x x x x x x x x
AL x x x x x x x x x x x x x
RS x x x x x x x x x x x x x
TR x x x x x x x x x x x
BY x x x x x x x x x x x x x x
BA x x x x x x x x x x x x x x x
XK x x x x x x x x x x x x x x
MD x x x x x x x x x x x x
RU x x x x x x x x x x x x x x
UA x x x x x x x x x x
AM x x x x x x x x x x x x
AZ x x x x x x x x x x x x x
GE x x x x x x x x x x x x x

42 Demographic statistics
Deaths3
3.4. Persons dying abroad and deaths of ‘non‑residents’
Table 3.2 shows that deaths occurring abroad are registered in 37 countries, but included in national death statistics by only 23. In line with this, most countries exclude deceased ‘non‑residents’ from the national statistics. IE, ES, FR, HU, PT, RO, UK and RU include deceased ‘non‑residents’ in their national statistics.
The biggest group of countries (18: BE, CZ, DK, DE, IT, CY, LT, LU, MT, NL, AT, SK, FI, SE, LI, CH, BY and XK) include the deaths of residents who have died abroad and exclude the deaths of ‘non‑residents’. For 14 countries (BG, EE, HR, LV, PL, SI, NO, ME, RS, TR, AL and BA) both groups are left out from statistics and in two countries (RO and RU) both groups are included.
3.5. Mortality indicators
3.5.1. Death ratesThe starting point for calculating life expectancy is the computation of the age‑specific death rates for the popula‑tion. Age‑specific death rates are computed as the ratio be‑tween the number of deaths at a certain age and the aver‑age population of that age. 28 countries produce death rates for one‑year age groups (single ages), 14 countries only for five‑year age groups, while EE, HU, MT, PT, SI, UK, RS and RU produce both. LI and BA do not compute age‑specific death rates. Death rates by gender are calculated in all the countries surveyed (see Table 3.3).
In EE and MD death rates are calculated for all ages up to the highest that occurred that year. This means that the age of the oldest deceased person determines the highest age for which death rates are calculated. As for the other countries, the highest age for which death rates are calculated is fixed and varies in the EU between 84 (PL) and 110 (EL and UK). In IT, death rates among those aged between 95 and 120 are derived from a statistical model. Outside the EU, the high‑est age used for death rates ranges between 70 (AM) and 100 (CH, BY, AZ and RU).
Age is a fundamental factor in mortality statistics. The risk of death for both genders is normally high immediately after birth, diminishes during childhood (reaching a minimum around the ages 10 to 12) and then rises again, until for the elderly it surpasses that in the first year of life.
In general, the death rate expresses how many of a fixed number of people at risk (normally 1 000) died in a given pe‑riod of time. At first sight, this concept seems to be straight‑forward, but the base population (the denominator of the rate) is calculated very differently depending on the country (see Table 3.3).
Most of the countries surveyed use average population or, for age‑specific death rates, the population of those of the age in question. 16 countries (BE, CZ, DK, DE, EE, FR, CY, LV, LU, MT, NL, SK, SE, NO, CH and GE) are able to give death rates by age that would have been reached by the end of the year in question and age at the time of death. The re‑maining 26 countries use only the latter.

43 Demographic statistics
Deaths 3Table 3.2: Deaths abroad and deaths of ‘non‑residents’
Deaths abroad registered Deaths abroad included in national statistics
Deaths to ‘non‑residents’ registered
Deaths to ‘non‑residents’ included in national statistics
Yes No Yes No Yes No Yes NoBE x x x
BG x x x
CZ x x x x
DK x x x x
DE x x x x
EE x x x x
IE x x x
EL x x
ES x x x x
FR x x x
HR x x x x
IT x x x
CY x x x x
LV x x
LT x x x x
LU x x x x
HU x x x x
MT x x x x
NL x x x x
AT x x x x
PL x x x x
PT x x x x
RO x x x x
SI x x x x
SK x x x
FI x x x
SE x x x x
UK x x x
LI x x x x
NO x x x
CH x x x x
ME x x x x
AL x x x
RS x x x x
TR x x x
BY x x x x
BA x x x x
XK x x x x
MD x x x
RU x x x x
UA x x
AM x x x
AZ x x x
GE x x x

44 Demographic statistics
Deaths3Ta
ble
3.3:
Cal
cula
tion
of d
eath
rate
s
Age
‑spe
cific
rate
sH
ighe
st
age
Dea
ths
abro
adD
eath
s of
‘n
on‑r
esid
ents
’D
enom
inat
or o
f age
‑spe
cific
dea
th ra
tes
Defi
niti
on o
f age
Sing
le
ages
5-ye
ar a
ge
grou
psIn
clud
edEx
clud
edIn
clud
edEx
clud
edde
nom
inat
or o
f the
age
spe
cific
dea
th ra
tes
Age
reac
hed
at
end
of y
ear
Age
com
plet
ed
at ti
me
of e
vent
BEx
105
xx
Two
calc
ulat
ions
: ave
rage
pop
ulat
ion
and
regi
ster
ed p
opu‑
latio
n on
1 Ja
nuar
y x
x
BGx
>100
xx
Aver
age
pop
ulat
ion
of a
ge in
que
stio
n x
CZ
x10
5x
xN
umb
er o
f peo
ple
(P) b
y ag
e (x
) and
gen
der a
s of
1 J
uly
of
a gi
ven
year
/ y
ears
x
x
DK
x11
0x
xC
alcu
latio
ns a
re b
ased
on
two
cale
ndar
yea
rs a
nd c
over
ev
ery
per
son
in th
e p
opul
atio
n at
som
e p
oint
bet
wee
n hi
s/he
r birt
hday
in y
ear 1
and
yea
r 2.
xx
DE
x90
xx
Aver
age
pop
ulat
ion
of th
e sa
me
age
xx
EEx
xFo
r eac
h ag
ex
Aver
age
pop
ulat
ion
xx
IEx
105
xx
Popu
latio
n at
that
sp
ecifi
c ag
e ac
cord
ing
to th
e ce
nsus
re
sults
x
ELx
110
xx
Aver
age
pop
ulat
ion
x
ESx
100
xx
Aver
age
of s
urvi
vors
on
1 Ja
nuar
y of
the
year
and
on
1 Ja
nuar
y of
the
follo
win
g ye
ar, p
lus
dire
ct c
ompu
tatio
n of
ag
es a
t whi
ch p
eopl
e di
ed d
urin
g th
e ye
ar.
x
FRx
105+
xx
For e
ach
age
and
gend
er: p
opul
atio
n on
1 Ja
nuar
y +
(net
m
igra
tion
+ a
ny a
djus
tmen
t dur
ing
the
year
) / 2
xx
HR
x85
xx
Not
cal
cula
ted
x
ITx
94x
xPo
pula
tion
of a
ge x
on
1 Ja
nuar
y in
yea
r t+1
plu
s de
aths
of
thos
e of
com
plet
ed a
ge x
in y
ear t
from
per
sons
bor
n in
ye
ar t‑
x (lo
w L
exis
tria
ngle
)x
CY
x85
+x
xAv
erag
e p
opul
atio
nx
x
LVx
95+
xx
Aver
age
pop
ulat
ion
(UN
Mor
tpak
pro
gram
me)
xx
LTx
100+
xx
Aver
age
annu
al p
opul
atio
n of
age
at r
isk
x
LUx
95+
xx
Popu
latio
n of
the
age
grou
p in
que
stio
nx
x
HU
xx
90x
xPo
pula
tion
of th
e ag
e gr
oup
in q
uest
ion
x
MT
xx
85+
xx
Popu
latio
n of
the
age
grou
p in
que
stio
n x
x
NL
x10
0.5
xx
Aver
age
pop
ulat
ion:
age
at t
he e
nd o
f the
yea
r. Pe
riod‑
coho
rt b
ased
.x
x
ATx
99+
xx
Aver
age
pop
ulat
ion
x
PLx
84x
xPo
pula
tion
aged
: 0; 1
<= x
<=
84 fo
r five
‑yea
r sp
ecifi
c ag
e gr
oups
; 85
and
over
— e
xtra
pol
atio
n m
etho
d.x
PTx
x85
+x
xAv
erag
e p
opul
atio
nx
ROx
85+
xx
Popu
latio
n of
the
spec
ific
age
or g
ende
r with
usu
al
resi
denc
e fo
r at l
east
12
mon
ths
in R
oman
ia, s
tart
ing
in
2014
.x
SIx
x10
0+x
xPo
pula
tion
of th
e ag
e gr
oup
in q
uest
ion
x
SKx
For e
ach
age
xx
Aver
age
pop
ulat
ion
for s
pec
ific
age
(sp
ecifi
c ag
e‑gr
oup)
xx

45 Demographic statistics
Deaths 3A
ge‑s
peci
fic ra
tes
Hig
hest
ag
e
Dea
ths
abro
adD
eath
s of
‘n
on‑r
esid
ents
’D
enom
inat
or o
f age
‑spe
cific
dea
th ra
tes
Defi
niti
on o
f age
Sing
le
ages
5-ye
ar a
ge
grou
psIn
clud
edEx
clud
edIn
clud
edEx
clud
edde
nom
inat
or o
f the
age
spe
cific
dea
th ra
tes
Age
reac
hed
at
end
of y
ear
Age
com
plet
ed
at ti
me
of e
vent
FIx
99x
xAv
erag
e p
opul
atio
nx
SEx
90+
xx
Mea
n p
opul
atio
n by
age
on
31 D
ecem
ber
. For
age
=0,
the
num
ber
of b
irths
dur
ing
the
per
iod
is u
sed.
x
x
UK
xx
110
xx
Mid
‑yea
r pop
ulat
ion
x
LIn.
a.x
xN
ot c
alcu
late
d
NO
x90
+x
xAv
erag
e p
opul
atio
nx
x
CH
x10
0x
xPt
,x=
ave
rage
pop
ulat
ion
at a
ge x
in y
ear t
(Val
lin —
Mes
lé,
2001
)x
x
ME
x85
+x
xEs
timat
e ba
sed
on c
ensu
s da
ta a
nd li
fe s
tatis
tics
x
AL
x85
+x
xM
id‑y
ear p
opul
atio
nx
RSx
x85
+x
xN
ot c
alcu
late
dx
TRx
85+
xn.
a.M
id‑y
ear p
opul
atio
nx
BYx
>100
xx
Not
cal
cula
ted
x
BAn.
a.n.
a.x
Not
cal
cula
ted
XKx
>80
xx
Not
cal
cula
ted
x
MD
xFo
r eac
h ag
ex
xN
ot c
alcu
late
dx
RUx
x10
0+n.
a.n.
a.N
ot c
alcu
late
dx
UA
x>
85x
xN
ot c
alcu
late
dx
AM
x70
+n.
a.n.
a.Av
erag
e nu
mb
er o
f usu
al re
side
nt p
opul
atio
n at
cer
tain
ag
es.
x
AZ
x10
0x
xN
ot c
alcu
late
dx
GE
x85
+x
n.a.
Mid
‑yea
r pop
ulat
ion
xx

46 Demographic statistics
Deaths3
3.5.2. Infant mortality ratesOf the countries surveyed, twelve (BE, EL, IT, LV, HU, NL, RO, UK, BY, BA, UA, AM) have a separate registration for infant deaths which contains more information on the child, on the mother and on the birth than the standard death declaration (see Table 3.4).
All countries except LI calculate infant mortality rates. The conventional infant mortality rate is defined as the number of infants dying before one year of age per 1000 live births. However, the infants could have been born in the calendar year in which they die or in the previous year and still have less than 1 year of age completed at the time of death. There‑fore, countries can calculate differently the live births vari‑able to be used as the denominator of the rate. Among the countries surveyed,
• DE computes infant mortality rate in terms of prob‑ability of dying during month of life i+1 at age 0 (29);
• LT, RU and AZ calculates the infant mortality rate as the sum, multiplied by 1 000, of:
— the number of infants dead within the first year of life and born in year t divided by the number of live births in year t; and
— the number of infants dead within the first year of life and born in year t-1 divided by the number of live births in year t-1.
• BY uses the average annual number of births between year t-1 and t as the denominator.
Besides these rates, more specific indicators can be calcu‑lated based on the age of the infant in days or months, as follows:
• early neonatal mortality rate measures the infant mortality in the first week of life (age 0–6 days) rela‑tive to the number of live births in calendar year t; it is calculated in 30 countries (please see Table 3.4).
• neonatal mortality rate measures the infant mortal‑ity in the first month of life (0–27 days) relative to the number of live births in calendar year t; it is calculated in 36 countries.
• late foetal mortality rate measures the mortality in the perinatal period (late foetal deaths or stillbirths) rela‑tive to the number of total births (live births plus late foetal deaths) in calendar year t; it is calculated in 22 countries.
• perinatal mortality rate measures the infant mortal‑ity in the perinatal period and in the first week of life
(29) The numerator of this probability is the number of deaths in month of life i+1 at age 0; the denominator corresponds to the number of children living at the beginning of month of life i+1 at age 0. In this equation, i is any month within the first year of life (i = 0, 1, …, 11).
relative to the number of total births (live births plus late foetal deaths) in calendar year t; it is calculated in 34 of the countries surveyed.
Some countries also calculate:
• post neonatal infant mortality rate (at 28–364 days), the number of deaths at 28–364 days in calendar year t, calculated as the ratio of the number of deaths of children between 28 and 364 days of age to the num‑ber of live births during that year, for 1 000 live births. It is calculated by BG, CZ, DE, ES, FR, PT and SI.
• late neonatal mortality rate: is the infant mortality rate at 7–27 days, calculated as the ratio of the number of deaths at 7–27 days in calendar year t to the number of live births in calendar year t, for 1 000 live births. It is calculated by BG, CZ, DE, ES and SI.
• net infant death rate: it compares the dead infants grouped by age to the weighted sum of the live births occurred in the given quarter of two years. It is calcu‑lated by HU.

47
Deaths 3
Other indicators
Tabl
e 3.
4: In
fant
mor
talit
y ra
tes
Sepa
rate
regi
stra
tion
fo
r inf
ant d
eath
sIn
fant
mor
talit
y ra
tes
calc
ulat
ed
Oth
er in
dica
tors
Yes
No
Infa
nt
mor
talit
y ra
te
Neo
nata
l m
orta
lity
rate
Earl
y ne
onat
al
mor
talit
y ra
te
Peri
nata
l m
orta
lity
rate
Late
foet
al
deat
h ra
te
BEx
xx
xx
x
BGx
xx
x
The
late
neo
nata
l mor
talit
y is
the
ratio
bet
wee
n th
e nu
mb
er o
f dea
d ch
ildre
n fr
om th
e 7th
till
the
27th
day
of t
heir
birt
h an
d th
e nu
mb
er o
f liv
e b
orn
child
ren.
Th
e p
ostn
eona
tal m
orta
lity
is th
e ra
tio b
etw
een
the
num
ber
of i
nfan
ts w
ho
have
die
d at
the
age
of 2
8 da
ys u
p to
1 y
ear a
nd th
e nu
mb
er o
f liv
e b
orn
child
ren,
dec
reas
ed b
y th
e nu
mb
er o
f inf
ant d
eath
s til
l 27th
day
.
CZ
xx
xx
xx
Post
‑neo
nata
l, la
te n
eona
tal
DK
xx
x
DE
xx
xx
xx
Num
ber
of d
eath
s of
chi
ldre
n ag
ed 8
to 2
8 da
ys p
er 1
000
live
birt
hs. N
umb
er o
f de
aths
of c
hild
ren
aged
29
days
to 1
2 m
onth
s p
er 1
000
live
birt
hs.
EEx
xx
x
IEx
xx
xx
ELx
xx
xx
x
ESx
xx
xx
xPo
st‑n
eona
tal,
late
neo
nata
l
FRx
xx
xPo
st n
eona
tal m
orta
lity
rate
: rat
io o
f the
num
ber
of d
eath
s of
chi
ldre
n b
etw
een
28 d
ays
and
one
year
of a
ge d
urin
g th
e ye
ar N
to th
e nu
mb
er o
f liv
e bi
rths
du
ring
that
yea
r, fo
r 1 0
00 li
ve b
irths
.
HR
xx
ITx
xx
x
CY
xx
x
LVx
xx
xx
x
LTx
xx
xx
x
LUx
xx
xx
HU
xx
xx
xx
Net
infa
nt d
eath
rate
: it c
ompa
res
the
dead
infa
nts
grou
ped
by
age
to th
e w
eigh
ted
sum
of t
he li
ve b
irths
occ
urre
d in
the
give
n qu
arte
r of t
wo
year
s.
MT
xx
NL
xx
xx
xx
ATx
xx
xx
PLx
xx
xx
x
PTx
xx
xx
x
Post
‑neo
nata
l mor
talit
y ra
te: T
he ra
tio o
f the
num
ber
of d
eath
s of
infa
nts
aged
b
etw
een
28 d
ays
and
unde
r one
yea
r dur
ing
a ca
lend
ar y
ear,
to th
e nu
mb
er
of li
ve b
irths
in th
at s
ame
year
(usu
ally
exp
ress
ed a
s th
e nu
mb
er o
f dea
ths
of in
fant
s ag
ed u
nder
28
days
per
1 0
00 li
ve b
irths
). ‑ D
of 2
8 to
365
day
s(0,
t)/
LB(0
,t)]*
1 00
0; w
here
: D o
f 28
to 3
56 d
ays(
0,t)
= In
fant
dea
ths
aged
bet
wee
n 28
to
356
day
s, b
etw
wen
the
mom
ents
0 a
nd t;
and
LB(
0,t)
= L
ive
birt
hs b
etw
een
mom
ents
0 a
nd t.
ROx
xx
xx
x
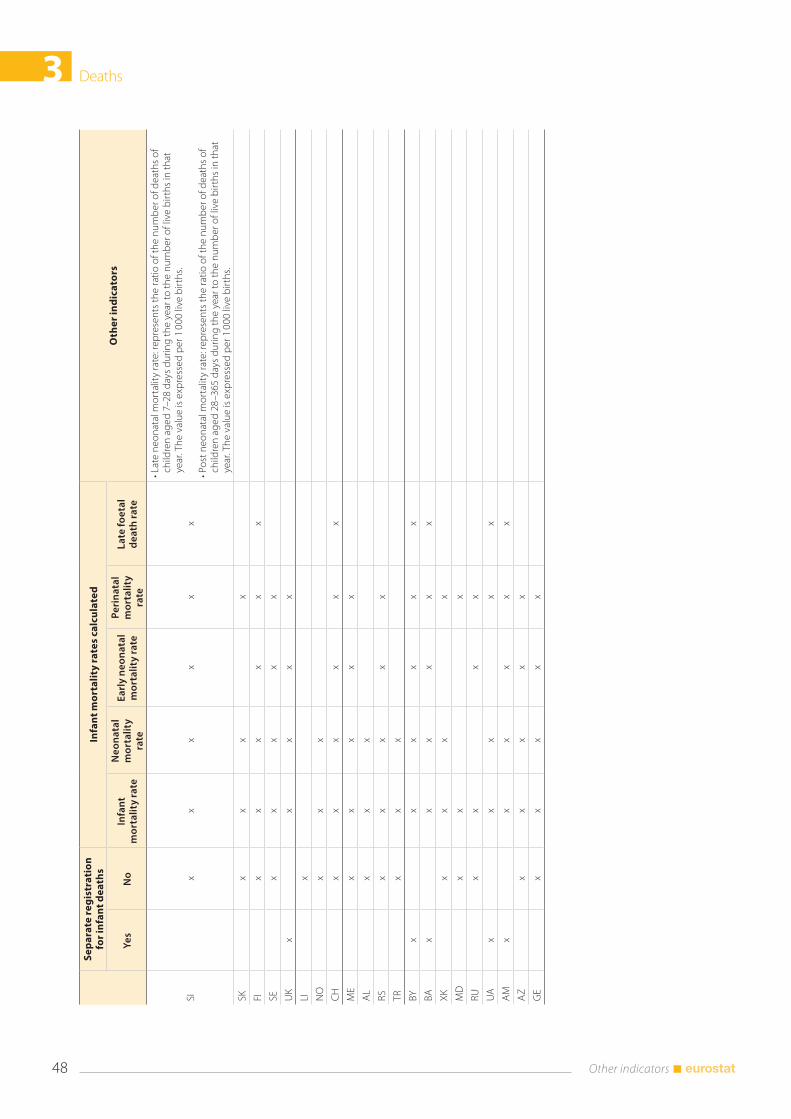
48
Deaths3
Other indicators
Sepa
rate
regi
stra
tion
fo
r inf
ant d
eath
sIn
fant
mor
talit
y ra
tes
calc
ulat
ed
Oth
er in
dica
tors
Yes
No
Infa
nt
mor
talit
y ra
te
Neo
nata
l m
orta
lity
rate
Earl
y ne
onat
al
mor
talit
y ra
te
Peri
nata
l m
orta
lity
rate
Late
foet
al
deat
h ra
te
SIx
xx
xx
x
• Lat
e ne
onat
al m
orta
lity
rate
: rep
rese
nts
the
ratio
of t
he n
umb
er o
f dea
ths
of
child
ren
aged
7–2
8 da
ys d
urin
g th
e ye
ar to
the
num
ber
of l
ive
birt
hs in
that
ye
ar. T
he v
alue
is e
xpre
ssed
per
1 0
00 li
ve b
irths
.
• Pos
t neo
nata
l mor
talit
y ra
te: r
epre
sent
s th
e ra
tio o
f the
num
ber
of d
eath
s of
ch
ildre
n ag
ed 2
8–36
5 da
ys d
urin
g th
e ye
ar to
the
num
ber
of l
ive
birt
hs in
that
ye
ar. T
he v
alue
is e
xpre
ssed
per
1 0
00 li
ve b
irths
.
SKx
xx
x
FIx
xx
xx
x
SEx
xx
xx
UK
xx
xx
x
LIx
NO
xx
x
CH
xx
xx
xx
ME
xx
xx
x
AL
xx
x
RSx
xx
xx
TRx
xx
BYx
xx
xx
x
BAx
xx
xx
x
XKx
xx
x
MD
xx
x
RUx
xx
x
UA
xx
xx
x
AM
xx
xx
xx
AZ
xx
xx
x
GE
xx
xx
x

49 Demographic statistics
Deaths 3
3.5.3. Life expectancy at birthAll countries except LI produce separate life tables for males and females. SE is the only country that has no fixed high‑est age in the life table. Otherwise, in the EU, the highest age varies between 85 (HR, MT and CY) and 125 (UK, pro‑duced on request).
30 countries base their life tables on unsmoothed rates, while the remaining 13 apply different smoothing methods to the age‑specific death rates. With the Gompertz meth‑od (30) applied in BG and CZ (see Table 3.5),the mortality rate tends to increase exponentially with age. Other coun‑tries use different methods: EL and IT apply the moving av‑erage procedure; EE uses the Heligman‑Pollard method (31) for modelling mortality probability at various ages. In or‑der to smooth mortality rates at advanced ages, IE refers to King’s formula for osculatory interpolation (32), while PT uses the Denuit and Goderniaux (33) model.
Ways of calculating life expectancy differ according inter alia to the time reference used, to produce:
• ‘period’ life expectancy based on experience over a short period of time (usually one year); this is the method used by most of the countries surveyed;
• ‘average’ life expectancy, which is calculated over a pe‑riod of one to three years; eight countries (BG, LU, RO, UK, ME, TR, BA and XK) use this method;
• ‘pooled’ life expectancy, which refers to a longer period (usually the period between two census rounds); this is the method used by DK and CY. DE usually calculates pooled life table over a period of 3 years.
(30) Gompertz B. (1825): ‘On the nature of the function expressive of the law of human mortality and on the new mode of determining the value of life contingencies’. Philosophical Transactions of the Royal Society A, 115:513–8.
(31) Heligman N, Pollard J.H. (1980): ‘The Age Pattern of Mortality’. Journal of the Institute of Actuaries 107, part 1: 49–82.
(32) King, G. (1914): ‘On a short method of constructing an Abridged Life Table’. Journal of the Institute of Actuaries 48: 294–303.
(33) Denuit M., Goderniaux A.C. (2005): ‘Closing and projecting life tables using log‑linear models’. Bulletin de l’Association Suisse des Actuaires.
However, the following exceptions can be observed:
• both ‘period’ and ‘pooled’ life expectancy are calcu‑lated by four countries (EE, NL, SK and SE);
• FR uses both the ‘period’ and the ‘average’ method.
3.5.4. Availability of mortality indicatorsAs can be seen from Table 3.6, 18 countries (CZ, DK, FR, IT, LT, HU, NL, AT, PL, PT, RO, SI, SK, FI, UK, CH, RS and AM) are able to produce death rates, life expectancy and life expectancy at birth at NUTS 3 level. CZ and SK also go down to LAU 1 level (the lowest level in CZ is that of the ‘administrative district’, which corresponds to a group of municipalities) and four countries (DK, SE, RU and BA) produce these indicators at municipality level.
Life expectancy is also broken down by citizenship/nation‑ality in three countries (BE, EE and AT). A distinction be‑tween urban and rural is made by the statistical offices in CZ, EE, LT, HU, RO, SK, BY and RU.
BG produces death rates and life expectancy according to cause of death, and education. Death rates by causes of death are also produced by RU. The UK and CH take account, re‑spectively, of socio‑economic conditions and marital status.

50 Demographic statistics
Deaths3Table 3.5: Calculation of life expectancy at birth
Available by gender
Highest age
Life table based on unsmoothed death rates
Life table based on smoothed death rates Type of life expectancy Method used
BE x 105 or 104 x Period
BG x 100 x Gompertz method Average
CZ x 105 x Gompertz method Period
DK x 99 x Pooled
DE x 100 x Pooled
EE x 100 x Heligman‑Pollard model Period and pooled
IE x 105 x King’s 1911 formula for osculatory interpolation Period
EL x 110 x Moving average procedure Period
ES x 100 x Period
FR x 100 x Period and average
HR x 85 x Period
IT x 124 x Moving average procedure Period
CY x 85 x Pooled
LV x 95 x Period
LT x 100 x Exponential smoothing is applied from 15‑year age‑group, but not for the last age‑group. Period
LU x 95 x qX = median(qX‑1,qX,QX+1) Average
HU x 100 x Period
MT x 85 x Period
NL x 99 x Period and pooled
AT x 99 x Period
PL x 120 x Moving parabolic fit with different number of terms is used for smoothing probabilities of death. Period
PT x 115 xDenuit and Goderniaux (2005) method as a closing procedure to smooth the mortality rates at advanced ages.
Period
RO x 100 x Average
SI x 100 x Period
SK x 100 x Period and pooled
FI x 100 x Period
SE x No age limit xSmoothed age‑specific death rates are used from age 95. The rates are based on observed date rates at age 90 to 100.
Period and pooled
UK x 125 x Average
LI x Not calculated
NO x 99 x Not specified Period
CH x 100 x Spline Period
ME x 80 x Average
AL x 85 x Period
RS x 100 x Period
TR x 100 x Average
BY x 100 x Period
BA x n/a x Average
XK x 80 x Average
MD x 100 x Period
RU x 100 x Period
UA x 100 x Period
AM x 100 x Period
AZ x 100 x Period
GE x 85 x Period

51 Demographic statistics
Deaths 3Table 3.6: Availability of mortality indicators
Regional level Other breakdownsBE NUTS 1 Citizenship (nationals and non‑nationals)
BG Cause of death, education
CZ NUTS 2, NUTS 3, LAU 1, administrative districts Urban/rural
DK NUTS 3 and municipalities
DE NUTS 1
EE County Nationality, urban/rural
IE
EL
ES NUTS 2 and provinces
FR NUTS 3
HR
IT NUTS 3
CY
LV
LT NUTS 3 Also death rates at LAU 1; life expectancy by urban/rural
LU
HU NUTS 3 Urban/rural and disaggregation by size of settlement
MT
NL NUTS 3
AT NUTS 1–3, political districts, functional classifications Citizenship; country of foreign origin
PL NUTS 1, NUTS 2, NUTS 3
PT NUTS 3
RO NUTS 3 Urban/rural
SI NUTS 3 Death rates for NUTS 3; life tables for NUTS 1; on demand for NUTS 2
SK NUTS 1–3, LAU 1 Urban/rural
FI NUTS 3
SE Municipality and county level
UK NUTS 3 National socio‑economic classification
LI
NO County level Not done on regular basis, but as part of research projects
CH NUTS 3 Marital status
ME
AL
RS NUTS 3
TR
BY Macro level, meso level Urban/rural
BA Entity level
XK
MD
RU Regions, national, municipality Urban/rural, cause of death
UA
AM NUTS 3
AZ
GE


4Marriages and legal unions

54 Demographic statistics
Marriages and legal unions4
4.1. Registration of marriagesCivil marriage is possible in all 44 countries surveyed (see Table 4.1). However, the relationship between religious and civil marriage is not always the same: some countries recog‑nise religious marriage as equivalent to civil marriage, while others do not. Religious marriage affects civil status in 11 countries (CZ, DK, EE, HR, IT, LV, LT, MT, PL, FI and LI).
At the moment of surveying the countries (spring 2013) it was in eight (BE, ES, FR, DK, NL, NO, PT, SE) (34) that same‑sex couples could marry officially. Such marriages are registered by the local registrar. Several other countries re‑serve the possibility of a legal union for same sex couples (see section 4.6).
All countries except DK have marriage certificates/declara‑tions. In general, as can be seen from Table 4.2, the admin‑istration responsible for collecting the requisite information is the civil registry office. There are also some country‑spe‑cific features, as follows:
• in a number of countries (BE, BG, FR, IT, LU, NL, CH, ME, RS and XK), the local registry office for the territorial unit in which the marriage took place has to collect the information in the marriage certificate/declaration;
• in BG, marriage certificates are issued by the local population registry office for the territorial unit in which the marriage took place; while information on marriages is provided for statistical purposes by the regional offices of the population register;
• in three countries (PT, BY and AZ), marriages must be registered with the justice ministry;
• in five countries (EE, EL, RO, SI and TR), marriage certificates are kept by the ministry of interior;
• in SE and NO, people who get married must inform the local tax agency and, in GE, the public service de‑velopment agency.
(34) Since March 2014 marriages are also available for same‑sex couples in England and Wales.
Table 4.1: Civil and religious marriage
Civil marriage is possible Religious marriage influences civil status
Yes No Yes NoBE x x
BG x x
CZ x x
DK x x
DE x x
EE x x
IE x x
EL x x
ES x x
FR x x
HR x x
IT x x
CY x x
LV x x
LT x x
LU x x
HU x x
MT x x
NL x x
AT x x
PL x x
PT x x
RO x x
SI x x
SK x x
FI x x
SE x x
UK x x
LI x x
NO x x
CH x x
ME x x
AL x x
RS x x
TR x x
BY x x
BA x x
XK x x
MD x x
RU x x
UA x x
AM x x
AZ x x
GE x x

55 Demographic statistics
Marriages and legal unions 4Table 4.2: Registration of marriages
Marriage certificate AdministrationTime limit
Yes No Justice ministry
Interior ministry
Registry office
Municipali-ties Other
BE x x As soon as possible
BG x x x The day of the marriage
CZ x x Depending on the kind of marriage
DK x
DE x x The day of the marriage
EE x x Depending on the kind of marriage
IE x x 56 days
EL x x 40 days
ES x x 1 day
FR x x As soon as possible
HR x x Depending on the kind of marriage
IT x x Depending on the kind of marriage
CY x x Depending on the kind of marriage
LV x x Depending on the kind of marriage
LT x x Depending on the kind of marriage
LU x x Not specified
HU x x The day of the marriage
MT x x 1 month
NL x x No time limit
AT x x The day of the marriage
PL x x Depending on the kind of marriage
PT x x 6 months
RO x x The day of the marriage
SI x x The day of the marriage
SK x x 5th day of the following month
FI x x As soon as possible
SE x x As soon as possible
UK x x No time limit
LI x x No time limit
NO x x No time limit
CH x x As soon as possible
ME x x No time limit
AL x x 11 days
RS x x Not specified
TR x x 10 days
BY x x 3 days to 3 months after the application
BA x Not specified
XK x x Not specified
MD x x No time limit
RU x x The day of the marriage
UA x x 30 days
AM x x 3 months
AZ x x 1 month
GE x x Not specified

56 Demographic statistics
Marriages and legal unions4Time limits in the EU for registering/declaring a marriage generally exist and range between one day (ES) and 56 days (IE). Elsewhere, the lowest limit is 10 days (TR) and the highest three months (AM). Some differences:
• in BG, DE, HU, AT, RO, SI and RU, notification of a new marriage should be sent the same day;
• in BE, FR, FI, SE and CH, there is no legal time limit, but the person officiating at the wedding is expected to do it without delay;
• in some EU countries (CZ, EE, HR, IT, CY, LV, LT and PL), there is a distinction between civil marriage, which must be declared immediately, and religious marriage, where the deadline ranges from three to five days to two weeks; and
• there is no time limit in NL, UK, LI, NO, ME and MD, and time limit is not specified in LU, RS, BA, XK and GE.
4.2. Minimum marriageable age
The minimum legal age at which men and women can mar‑ry without parental consent is 18 in all the countries except AT, where it is 16 (see Table 4.3).
In most countries, younger people can get married if a court or parents/guardians grant permission, or if certain speci‑fied conditions are met. In 20 countries, 16‑year‑olds can get married with parental consent. In EE, LT, SI, AL, BY and XK the minimum age is 15 and in ES it is 14. In EL, men may be allowed to marry when they are 14, while for women the minimum age to receive court permission to marry is 12. In four countries (EL, LU, AT and PL) the legally required age to marry is not the same for men and women, with a differ‑ence of two years.
Table 4.3: Minimum marriageable age
Minimum legal age for marriage with parental
consent
Minimum legal age for marriage without parental
consentMales Females Males Females
BE 18 18 18 18
BG 16 16 18 18
CZ 16 16 18 18
DK 18 18 18 18
DE 16 16 18 18
EE 15 15 18 18
IE 18 18 18 18
EL 14 12 18 18
ES 14 14 18 18
FR 18 18 18 18
HR 16 16 18 18
IT 16 16 18 18
CY 16 16 18 18
LV 16 16 18 18
LT 15 15 18 18
LU 18 16 18 18
HU 16 16 18 18
MT 16 16 18 18
NL 18 18 18 18
AT 16 14 16 16
PL 18 16 18 18
PT 16 16 18 18
RO 16 16 18 18
SI 15 15 18 18
SK 16 16 18 18
FI 18 18 18 18
SE 18 18 18 18
UK 16 16 18 18
LI 18 18 18 18
NO 16 16 18 18
CH 18 18 18 18
ME 16 16 18 18
AL 15 15 18 18
RS 16 16 18 18
TR 17 17 18 18
BY 15 15 18 18
BA 16 16 18 18
XK 15 15 18 18
MD 18 18 18 18
RU 16 16 18 18
UA 16 16 18 18
AM 17 17 18 18
AZ 18 18 18 18
GE 16 16 18 18

57 Demographic statistics
Marriages and legal unions 4
4.3. Definition of ageAll countries use age in completed years (at the last birth‑day). 15 countries (BE, CZ, DE, EE, FR, LV, LU, MT, NL, SK, SE, NO, CH, BA and GE) also apply age at the end of the year (see Table 4.6).
Table 4.4: Definition of age
Age definitionAge reached
at end of yearAge completed at time of event
BE x xBG xCZ x xDK xDE x xEE x xIE xEL xES xFR x xHR xIT xCY xLV xLT xLU x xHU xMT x xNL x xAT xPL xPT xRO xSI (*) xSK x xFI xSE x xUK xLI xNO x xCH x xME xAL xRS xTR xBY xBA x xXK xMD xRU xUA xAM xAZ xGE x x
(*) Age definition in SI is age completed at the time of the event but they can produce data on year of birth (aged reached at the end of the year).
4.4. The contents of a marriage declaration
Marriage declarations exist in all countries except DK. In most countries, the date and place of marriage, the names of the spouses, their surnames before marriage, their dates of birth, nationality and previous marital status are recorded on the marriage certificate (see Table 4.4).
Other information included in the certificate varies widely among countries. For example, information on the spouses’ highest level of educational attainment is included in 17 countries (CZ (35), EE, EL, HR, IT, HU, PL, PT, RO, SK, ME, TR, BY, BA, XK, AM and AZ). Nine (DE, EL, HR, CY, LV, AT, CH, BA and XK) collect information on their religion. 12 countries (DE, EE, LU, HU, AT, PT, NO, CH, BY, XK, RU and AZ) register how many children each of them has (either together or from previous relationships) (36).
In HU for example, surnames before and after marriage are included in the marriage declaration, but not recorded in the statistical database. Home address is available at set‑tlement level and information on both spouses’ country of birth will be available from 2014.
Information on both spouses’ economic activity status is collected in HR, EL, HU, IT, PT and RO..
In the EU, the countries that collect the most information on the marriage declaration are EE, EL, LV and PT (13 items of the 15 selected); outside the EU, XK collects 14 items out of 15.
However, countries can link different sources in order to ob‑tain more information. In NL the data on the marriage dec‑laration document is integrated in the population registry system. This in turn allows for access to secondary variables like date of birth of the spouses, their address, citizenship etc. In PT, the collection of data on marriages for statistical purposes includes information from the civil registry (mar‑riage registration) as well as a set of other variables collected simultaneously in an electronic questionnaire.
(35) On a voluntary basis.
(36) CH and DE registers the number of children the couple has together (not overall number of children of each spouse). Certificates in EE, HU and PT also show separately how many children the spouses had before marrying together, how many children come from previous relationships.

58 Demographic statistics
Marriages and legal unions4Ta
ble
4.5:
Con
tent
s of a
mar
riage
dec
lara
tion
Marriage date
Place of marriage (country, munici‑pality, etc.)
Both partners’ personal identifier
Both partners’ surnames before marriage
Both partners’ date of birth
Both partners’ surnames after marriage
Both partners’ highest level of educational attain‑ment
Both partners’ home address
Both partners’ religion
Both partners’ age
Both partners’ country of birth
Both partners’ nationality/citizen‑ship
Both partners ‑ 12 months (or more) resident in the country
Both partners’ previous marital status
Number of children of both partners
Other
BEx
xx
xx
xx
BG CZ
xx
xx
xx
xx
xx
xx
DK
DE
xx
xx
xx
xx
xx
x
EEx
xx
xx
xx
xx
xx
xx
IEx
xx
xx
xx
ELx
xx
xx
xx
xx
xx
xx
ESx
xx
xx
xx
xx
x
FRx
xx
xx
xx
xx
x
HR
xx
xx
xx
xx
xx
xx
ITx
xx
xx
xx
xx
CY
xx
xx
xx
x
LVx
xx
xx
xx
xx
xx
xx
LTx
xx
xx
xx
xx
x
LUx
xx
xx
xx
xx
xx
x
HU
xx
xx
xx
xx
xx
xx
MT
xx
xx
xx
xx
x
NL
xx
xx
xx
xx
xx
x
ATx
xx
xx
xx
xx
PLx
xx
xx
xx
xx
xx
PTx
xx
xx
xx
xx
xx
xx
ROx
xx
xx
xx
xx
x
SIx
xx
xx
xx
xx
x
SKx
xx
xx
xx
xx
FIx
xx
xx
xx
x
SEx
xx
x
UK
xx
xx
xx
x
LIx
xx
xx
xx
xx
xx
x
NO
xx
xx
xx
xx
x
CH
xx
xx
xx
xx
xx
xx
x

59 Demographic statistics
Marriages and legal unions 4
Marriage date
Place of marriage (country, munici‑pality, etc.)
Both partners’ personal identifier
Both partners’ surnames before marriage
Both partners’ date of birth
Both partners’ surnames after marriage
Both partners’ highest level of educational attain‑ment
Both partners’ home address
Both partners’ religion
Both partners’ age
Both partners’ country of birth
Both partners’ nationality/citizen‑ship
Both partners ‑ 12 months (or more) resident in the country
Both partners’ previous marital status
Number of children of both partners
Other
ME
xx
xx
xx
xx
xx
x
AL
xx
xx
xx
xx
RSx
xx
xx
xx
xx
x
TRx
xx
xx
xx
xx
x
BYx
xx
xx
xx
xx
xx
xx
BAx
xx
xx
xx
xx
xx
xx
x
XKx
xx
xx
xx
xx
xx
xx
x
MD
xx
xx
xx
xx
RUx
xx
xx
xx
xx
xx
UA
xx
xx
xx
xx
AM
xx
xx
xx
xx
xx
x
AZ
xx
xx
xx
xx
xx
xx
GE
xx
xx
xx
xx
xx
x

60 Demographic statistics
Marriages and legal unions4
4.5. Marriages conducted abroad and marriages between ‘non‑residents’
Unlike births and deaths, which involve individuals, mar‑riages are contracted between two persons, who do not nec‑essarily belong to the same population. Also, they may be contracted outside the country of residence of one or both of the spouses. It is therefore useful to distinguish between the following situations:
Country of residence Country of marriage Spouse 1 Spouse 2
Case 1 X X X
Case 2 X Y X
Case 3 X X Z
Case 4 X Y Z
Case 1 represents the most common situation: two people who reside in the same country and get married in that country. In this case, the marriage certificate is drawn up in that country, the marriage is entered in the marriage statis‑tics of that country and no other country is involved, either administratively or in terms of population statistics.
Looking at the other cases from the point of view of spouse 1 or his/her country of residence respectively:
• in Case 2, the spouses reside in different countries but the marriage is contracted in the country of spouse 1;
• in Case 3, the spouses have residence in the same country, but get married elsewhere; this is common among immigrants; and
• in Case 4, the spouses come from different countries and decide to get married in a third country.
Case 2 marriages are generally treated and counted no dif‑ferently from other marriages. Marriages contracted abroad (i.e. Cases 3 and 4) are registered in 30 of the 44 countries surveyed (see Table 4.5). Of these, 11 (BE, HR, CY, FI, LI,
MD, NL, RS, SK, SI and TR) register all marriages of their residents that take place abroad, others apply various cri‑teria to determine whether or not a marriage is registered:
• ES, RO and NO register only those marriages where at least one spouse has citizenship of their country;
• LT registers only those marriages where at least one spouse is usually resident in LT;
• SE registers only those marriages where both spouses have SE citizenship;
• DE, EE, XK and GE register their citizens’ marriages only if the spouses officially request it.
Of the countries that register marriages taking place abroad, 20 include them in their national statistics, while BE, BG, EE, CY, PL, SI, ME, RS, TR and RU do not. In the remain‑ing countries, there is no legal requirement to register such marriages.
Marriages of ‘non‑residents’ are registered in 26 countries, but 14 (BG, CZ, EE, HR, LV, LT, NL, AT, PL, SI, SE, CH, RS and BA) do not include these in national statistics.
Most countries’ national statistics include marriages of residents contracted abroad and exclude marriages by ‘non‑residents’. However:
• CZ includes only cases where at least one spouse has a registered residence in the country, regardless where the marriage is contracted;
• BG, EE, AT, PL, SI and RS exclude both categories;
• IE, EL, FR, IT, CY, HU, PT, UK and ME normally base their marriage statistics on marriages contracted in the country, irrespective of the spouses’ countries of residence; they exclude their residents’ marriages abroad; and
• DE, MT , ES, RO and XK include both categories; their marriage statistics include all marriages contracted in their countries (irrespective of the spouses’ countries of residence) and all their residents’ marriages abroad.

61 Demographic statistics
Marriages and legal unions 4Table 4.6: Marriages conducted abroad and marriages contracted between ‘non‑residents’
Marriages abroad registered Marriages abroad included in national statistics
Marriages of ‘non‑residents’ registered
Marriages of ‘non‑residents’ included in national statistics
Yes No Yes No Yes No Yes NoBE x x x
BG x x x x
CZ x x x x
DK x x x
DE x x x x
EE x x x x
IE x x x
EL x x x
ES x x x x
FR x x x
HR x x x x
IT x x x
CY x x x x
LV x x x
LT x x x x
LU x x
HU x x x
MT x x x x
NL x x x x
AT x x x
PL x x x x
PT x x x
RO x x x x
SI x x x x
SK x x x
FI x x x
SE x x x x
UK x x x
LI x x x
NO x x x
CH x x x x
ME x x x x
AL x x
RS x x x x
TR x x x
BY x x x
BA x x x x
XK x x x x
MD x x x
RU x x x
UA x x
AM x x
AZ x x x
GE x x x

62 Demographic statistics
Marriages and legal unions4
4.6. Legal unionsSince the 1960s, living arrangements other than marriage have become more common in Europe. Some countries have fully or partially legalised living arrangements other than marriage, and allow couples with such arrangements to be registered in a more or less similar way to married cou‑ples. These arrangements became common practice in the north of Europe much earlier than in the south.
Among the 44 countries surveyed, legal/civil unions are allowed in 19 (BE, CZ, DK, DE, ES, FR, IE, EL, LU, HU, MT, NL, AT, SI, FI, SE, UK, NO and CH). In CZ, DE, HU,
AT, FI, SI, UK and CH, registered/civil partnership status is reserved for same‑sex couples and in EL for heterosexual couples (see Table 4.7). In the rest of the countries where le‑gal/civil unions exist they are possible both for heterosexual and same‑sex couples.
Legal/civil unions are usually registered by municipalities. In DE and MT, this is done by the registrar’s office, in SI by the ministry of interior and in NO by the tax administration.
In CZ, only registered same‑sex partnerships are codified, but the data are not collected for statistical purposes. BE produces statistics on legal cohabitation but not on legal unions.
Table 4.7: Legal unions
Legal union
allowedDescription Registration by:
Same‑sex legal
union allowed
BE Yes Legal cohabitation made possible by Law of 23 November 1998 Municipalities Yes
BG No
CZ Yes Intended exclusively for same‑sex couples Yes
DK Yes Registered partnership since 1989, same‑sex marriages since 2012 Yes
DE Yes For same‑sex partnerships only, i.e. registered partnership of two persons of same sex (since 2001) Registrar’s office Yes
EE No
IE Yes Civil partnerships legal since 2011 General Registrar’s Office, Convent Road, Roscommon Yes
EL YesLegal union is an agreement between two adult heterosexual persons and has been possible since 2009. It is formalised in a notarial act and enters into force on the deposit of the notarial act in the registry of residence.
No
ES YesLegal union involves two persons living together as a couple, in a free, public and respect‑able way, stably and affectionately linked, for a continuous period of at least 12 months, on condition that they voluntarily decide to register in the Legal Unions Register.
Legal Unions Register Yes
FR YesOther legal arrangements than marriage exist in France: the French civil partnership ‑ pacte civil de solidarite, PACS ‑ was created in 1999. But this is not considered a legal union (equivalent to marriage), because the PACS can be broken by just one partner.
HR No
IT No
CY No
LV No
LT No
LU Yes
Partners wishing to make a statement of partnership, personally and jointly declare in writing their partnership and the existence of an agreement on the effects of their part‑nership on their inheritance, if they have concluded such an agreement. The declaration is submitted to the registrar of civil status of the municipality of their place of domicile or residence (Law of 9 June 2004).
Municipality Yes
HU YesRegistered partnerships have been accepted in Hungary since 1 July 2009. They can be established by adult same‑sex couples in the presence of a registrar. With a few excep‑tions, the same regulations apply to registered partnership as marriages.
Data collection coordinated by the Hungarian Statistical
Office. In settlements, the local governments are responsible.
Data supplied by registrars.
Yes
MT Yes Partnerships between persons of the same or opposite sex can be registered as civil unions. Registrar’s office Yes
NL Yes
Registered partnerships have been registered at the municipality since 1998. Cohabita‑tion can be registered with a notary. Data on cohabitation are not available at the micro level. Data on legal unions (registered partnerships) are available in the same way as information on marriages.
Municipality Yes
AT Yes A legal union can be entered into only by persons of the same sex. It is a permanent civil union with reciprocal rights and obligations (§2 EPG, since 1.1.2010). Yes
PL No

63 Demographic statistics
Marriages and legal unions 4
Legal union
allowedDescription Registration by:
Same‑sex legal
union allowed
PT No
RO No
SI YesA registered same‑sex civil partnership (possible since July 2006) is a relationship between two women or two men who have registered as civil partners before the competent authority.
Ministry of the Interior Yes
SK No
FI Yes
Partnerships of two persons of the same sex and over 18 years of age may be registered by an authority entitled to perform civil marriage ceremonies. The partners jointly sign the partnership document in the presence of the authority referred to in section 4(1) of the Act on Registered Partnerships 950/2001, which verifies it with a countersignature. For statistical purposes, at least one of the partners must belong to the resident population.
Population register centre and local registry offices Yes
SE YesLegal union is the cohabitation of two people. Sweden used to have registered partner‑ships between persons of the same sex. Since 1 May 2009, same‑sex marriage has been allowed and registered partnerships are no longer possible.
Yes
UK Yes Relationships between two people of the same sex have been legally recognised since December 2005 under the Civil Partnerships Act 2004.
General Register Offices for England and Wales, Scotland
and Northern IrelandYes
LI No
NO Yes Some partnerships concluded prior to the latest amendment of the Marriage Act still exist. However, new partnerships are not contracted. Norwegian Tax Administration Yes
CH Yes Partnerships between two people of the same sex have been registered since 2007.
Local civil registry office responsible for the territorial unit in which the partnership
was registered
Yes
ME No
AL No
RS No
TR No
BY No
BA No
XK No
MD No
RU No
UA No
AM No
AZ No
GE No

64 Demographic statistics
Marriages and legal unions4
4.6.1. The contents of a legal union declaration
Like marriage certificates, legal union declarations feature a set of basic information: the date and place of the legal union, and the partners’ dates of birth.
In eight countries (BE, DE, IE, HU, SI, FI, UK and CH), such certificates also include information about both part‑ners’ previous marital status.
DE registers the religion of partners in a legal union, while in HU the declaration contains their highest level of edu‑cational attainment and occupational status (see Table 4.8). MT equally registers the spouses’ parents’ name and sur‑name, maiden name of the mothers, as well as information about the witnesses: name and surname, date and place of birth, place of residence.
Similarly to marriage declarations, the information in the document in NL is integrated in the population registry sys‑tem. Secondary variables like: date of birth of spouses, ad‑dress, citizenship etc. can be drawn from this register.
4.6.2. Legal unions abroad and between ‘non‑residents’
Legal unions abroad are registered in most of the countries where such living arrangements are allowed (listed in Table 4.7), except IE, EL, ES, LU, HU, AT and the UK (see Table 4.9). Normally, if they are registered, they are also included in national statistics, except in NO and SI. ES does not in‑clude legal unions in national statistics. MT includes civil unions abroad it its statistics if one of the parties is a citizen of MT.
DE, IE, EL, HU, NL, SI, UK, NO and CH register legal un‑ions contracted between ‘non‑residents’ but NL, SI, NO and CH do not include them in national statistics.MT only reg‑isters legal unions contracted between ‘non‑residents’ if one of them is MT citizen.

65 Demographic statistics
Marriages and legal unions 4Table 4.8: Contents of a legal union declaration
Dat
e of
lega
l/civ
il un
ion
Plac
e of
lega
l uni
on
(cou
ntry
, mun
ici‑
palit
y, e
tc.)
Both
par
tner
s’
pers
onal
iden
tifie
r
Both
par
tner
s’
surn
ames
bef
ore
lega
l uni
on
Both
par
tner
s’ d
ate
of b
irth
Both
par
tner
s’
surn
ames
aft
er le
gal
unio
nBo
th p
artn
ers’
hi
ghes
t lev
el o
f edu
‑ca
tion
al a
ttai
nmen
t
Both
par
tner
s’ h
ome
addr
ess
Both
par
tner
s’
relig
ion
Both
par
tner
s’ a
ge
Both
par
tner
s’
coun
try
of b
irth
Both
par
tner
s’
nati
onal
ity/
citi
zen‑
ship
Both
par
tner
s 12
m
onth
s (o
r mor
e)
resi
dent
in th
e co
untr
y
Both
par
tner
s’
prev
ious
mar
ital
st
atus
Num
ber o
f chi
ldre
n of
bot
h pa
rtne
rs
Oth
er
BE x x x x x x x
BG
CZ
DK
DE x x x x x x x x x x
EE
IE x x x x x x x x
EL
ES
FR
HR
IT
CY
LV
LT
LU
HU x x x x x x x x x x
MT x x x x x x x
NL x x x x
AT
PL
PT
RO
SI x x x x x x x
SK
FI x x x x x x
SE
UK x x x x x
LI
NO x x x x x
CH x x x x x x x x
ME
AL
BY
RS
TR
BA
XK
MD
RU
UA
AM
AZ
GE

66 Demographic statistics
Marriages and legal unions4Table 4.9: Legal unions abroad and legal unions of ‘non‑residents’
Legal unions abroad registered
Legal unions abroad included in national statistics
Legal unions to ‘non‑residents’ registered
Legal unions to ‘non‑residents’ included
in national statisticsYes No Yes No Yes No Yes No
BE x x x
BG
CZ
DK x x x
DE x x x x
EE
IE x x x
EL x x x
ES x
FR
HR
IT
CY
LV
LT
LU x x
HU x x x
MT x x x x
NL x x x x
AT x x
PL
PT
RO
SI x x x x
SK
FI x x x
SE x x x x
UK x x x
LI
NO x x x x
CH x x x x
ME
AL
RS
TR
BY
BA
XK
MD
RU
UA
AM
AZ
GE

67 Demographic statistics
Marriages and legal unions 4
4.6.3. Definition of ageAll countries where legal unions are allowed and included in national statistics use age in completed years (at last birthday). Seven (BE, DE, LU, NL, SE, NO and CH) also ap‑ply age reached at the end of the year (see Table 4.10).
Table 4.10: Definition of age
Age definitionReached at end of year Completed at time of event
BE x x
BG x
CZ
DK x
DE x x
EE
IE x
EL x
ES
FR
HR
IT
CY
LV
LT
LU x x
HU x
MT x
NL x x
AT x
PL
PT
RO
SI (*) x
SK
FI x
SE x x
UK x
LI
NO x x
CH x x
ME
AL
RS
TR
BY
BA
XK
MD
RU
UA
AM
AZ
GE
(*) Age definition in SI is age completed at the time of the event but they can produce data on year of birth (age reached at the end of the year).
4.7. Marriage indicators
4.7.1. Mean age at marriage and at first marriage
As can be seen from Table 4.11, figures either on mean age at first marriage or mean age at marriage are produced by almost all the countries except MT, LI and RU.
Six countries (EE, EL, HR, CY, PL and NO) only produce statistics on mean age at first marriage, while RO and AL produces only statistics on mean age at marriage.
BE, IE, ES, NL, PT, SE and NO include same‑sex marriages in the calculation of mean age at first marriage.
Mean age at marriage can be calculated in two different ways: on the basis of events or of rates. Both methods are described in Annex III.
Most of the countries that produce mean ages for both first and all marriages are consistent in their calculation method:
• 25 apply the event‑based method for both calculations;
• ES, IT, LT and CH use the rate‑based method for both calculations;
• CZ uses the rate‑based method at national level, but the event‑based method at regional level.
• FR and AT calculate mean age at first marriage ac‑cording to both methods, but restrict themselves to an event‑based mean age for all marriages;
• EE calculates mean age at first marriage according to both methods, and doesn’t calculate mean age at marriages;
• IT calculates mean age at first marriage according to both methods, but only uses the rate‑based method for all marriages;
• LU, NL and BY produce mean age at first marriage on the basis of events but compute mean age at all mar‑riages according to rates;
• FI produces mean age at first marriage on the basis of events but mean age at all marriages on the basis of both rates and events.
With regard to the definition of age, the majority of the countries surveyed refer to age completed at the time of marriage. Six (FR, LV, NL, LI, CH and GE) apply age reached at the end of the year, CZ uses both age definitions and SI computes the age reached during data processing.

68 Demographic statistics
Marriages and legal unions4Table 4.11: Mean age at marriage
Computation of mean
age at first marriage
Same‑sex marriages
included in calculation
First‑time legal union included in calculation
Calculation method ‑ mean
age at first marriage
Computation of mean age at
marriage
Calculation method ‑ mean age at marriage
Age definition
Yes No Yes No Yes No Rate- based
Event- based Yes No Rate-
basedEvent- based
Reached at end of year
Completed at time of
eventBE x x x x x x x
BG x n.a. n.a. n.a. n.a. x x x x
CZ x n.a. n.a. x x x x x x x
DK x x x x x x x
DE x n.a. n.a. x x x x x
EE x n.a. n.a. n.a. n.a. x x x x
IE x x x x x x x
EL x n.a. n.a. x x x x
ES x x x x x x x
FR x x x x x x x
HR x n.a. n.a. n.a. n.a. x x x
IT x n.a. n.a. n.a. n.a. x x x x x
CY x n.a. n.a. n.a. n.a. x x x
LV x n.a. n.a. n.a. n.a. x x x x
LT x n.a. n.a. n.a. n.a. x x x x
LU x n.a. n.a. x x x x x
HU x x x x x x x
MT x n.a. n.a. x x
NL x x x x x x x
AT x n.a. n.a. x x x x x x
PL x n.a. n.a. n.a. n.a. x x x
PT x x n.a. n.a. x x x x
RO x n.a. n.a. n.a. n.a. x x x x
SI (*) x x x x x x x
SK x n.a. n.a. n.a. n.a. x x x x
FI x n.a. n.a. x x x x x
SE x x x x x x x
UK x x x x x x x
LI x n.a. n.a. n.a. n.a. x x
NO x x x x x x
CH x n.a. n.a. x x x x x
ME x n.a. n.a. n.a. n.a. x x x x
AL x n.a. n.a. n.a. n.a. x x x x
RS x n.a. n.a. n.a. n.a. x x x x
TR x n.a. n.a. n.a. n.a. x x x x
BY x n.a. n.a. n.a. n.a. x x x x
BA x n.a. n.a. n.a. n.a. x x x
XK x n.a. n.a. n.a. n.a. x x x x
MD x n.a. n.a. n.a. n.a. x x x
RU x n.a. n.a. n.a. n.a. x x
UA x n.a. n.a. n.a. n.a. x x x
AM x n.a. n.a. n.a. n.a. x x x x
AZ x n.a. n.a. n.a. n.a. x x x x
GE x n.a. n.a. n.a. n.a. x x x x
(*) Age definition in SI is age completed at the time of the event but they can produce data on year of birth (aged reached at the end of the year).

69 Demographic statistics
Marriages and legal unions 4Table 4.12: Calculation of total first marriage rate
Availability of TFMR Age
Yes No Single ages 5-year age groups
Lowest age Highest age
Males Females Males FemalesBE x
BG x
CZ x x 15 15 49 49
DK x
DE x
EE x X 15 15 49 49
IE x
EL x x 14 12
ES x x 14 14 60 60
FR x x 15 15 50 50
HR x
IT x x 16 16 49 49
CY x
LV x x 16 16
LT x x 15 15 49 49
LU x
HU x x 15 15 59 49
MT x
NL x
AT x x 15 15 49 49
PL x x 16 16 49 49
PT x
RO x
SI x x 15 49
SK x
FI x x 15 49
SE x
UK x x X 16 16
LI x
NO x
CH x x 15 15 49 49
ME x
AL x
RS x
TR x
BY x
BA x
XK x
MD x
RU x
UA x
AM x
AZ x
GE x

4.7.2. Total first marriage rate16 countries produce total first marriage rate (TFMR), most of which produce separate TFMRs for males and females (see Table 4.12 above).
TFMR is produced by adding up age‑specific first marriage rates (see Annex II). Single years of age are used by all the 15 countries answering to this question, except EE, which computes TFMR from five‑year age group marriage rates. UK produces age‑specific marriage rates both for single ages and five‑year age groups (37).
In CZ, EE, LT, AT, SI, FI and CH, the age coverage of the TFMR is from 15 to 49. Differences in other countries:
• in FR, the highest age is 50;
• in EL, the lowest age is 12 for females and 14 for males;
• in ES, the lowest age is 14 and the highest 60;
• in LV, the lowest age is 16 and the highest age depends on available data;
• in IT, PL and UK, the lowest age (for men and women) is 16;
• in HU, the highest age for males is 59;
• in FI and SI, only women’s ages are used (TFMR is regularly calculated only for females).
In most countries, the age‑specific marriage rates used to compute the TFMR are produced according to the ‘square method’ (see Annex II).
(37) England and Wales calculate marriage rates based on the number of people marrying per 1000 unmarried population aged 16 and over. Scotland did this until 2009.

5Divorces

72 Demographic statistics
Divorces5
5.1. Divorce regulationsDivorce is possible in all the countries surveyed. As can be seen from Table 5.1, the oldest regulations are in FI, where divorce has been allowed since 1571. In LU, people have been able to divorce since the beginning of the 19th century. Other European countries in which divorce was made pos‑sible in that century are NL (1804), BE (1840), SE (statistics available since 1831), UK (1855 (38)), CH (1875), HU (1876), FR (1884). In 11 countries (BG, CZ (39), DE, EL, HR, LV, LT, AT, PL, PT, TR and XK), married couples obtained the right to divorce in the first half of the 20th century. In IE (1996–97), ES (1981) and AZ (1990), divorce has become possible only relatively recently. Divorce legislation was introduced in MT in 2009.
Table 5.1 also shows where and when legislation was imple‑mented to provide for the dissolution of legal union. Dis‑tinct statistics on the dissolution of legal unions, as opposed to divorces, are collected by all countries that allow legal unions except IE.
5.2. Conditions for divorceTable 5.2 shows that in most countries divorces are decided upon by the court and almost everywhere a divorce has to be requested by one or both partners. Additional remarks can be made for a number of countries, as follows:
• in nine countries (BE, CZ, DE, EL, LV, LU, NL, XK and RU), ‘structural disruption of the marriage and no prospect of reconciliation’ is one of the conditions for obtaining the divorce;
• in FR, LT, MT, UK and XK, adultery is one of the pos‑sible reasons for granting a divorce;
(38) Divorce has been allowed since 1855 in Scotland, 1858 in England and 1971 in Northern Ireland.
(39) In CZ, two different forms of marriage dissolution existed in 1918–49.
• in CZ, LT and RU, the marriage has to have lasted for a certain amount of time;
• in six countries (CZ, DE, LV, FI, XK and RU), the cou‑ple has to have lived apart for a certain amount of time (usually one year); in CH, two years of separation are required to obtain the divorce (unless serious reasons rule out continuation of the marriage); in CY and IT three years of legal separation is the main condition for obtaining a divorce;
• five countries (CZ, NL, SI, XK and RU) require proper provision for dependents (children, elderly people) be‑fore a divorce is granted;
• in LV, a divorce can be obtained for reasons linked to a threat to a partner’s life or health, but also when one of the spouses is cohabiting with another person with whom they have had, or are expecting, a child;
• in PT, the divorce might be requested by one spouse against the other (divorce without the consent of a spouse, requested in the court) or of both (divorce by mutual consent, requested in the civil register). Grounds for divorce without the consent of a spouse are: a de facto separation for a year, the change of the mental faculties of the other spouse when this has last‑ed for more than a year and its severity compromises the possibility of life in common; the absence without any news of the absent for at least a year, and any other fact which shows the rupture of marriage, regardless of a fault of the spouses;
• in SK, the conditions for granting a divorce include factors relating to the personal behaviour of the spouses.

73 Demographic statistics
Divorces 5Table 5.1: Regulations on divorce and dissolution of legal union
Is divorce/dissolution of legal
union allowed?If so, since when?
BE Yes Divorce has been allowed for a long time, dissolution of legal cohabitations since 1998.
BG Yes Since 1910
CZ Yes Before 1950, two forms of legal dissolution of marriage existed. Since 1950, only one form has existed, i.e. divorce. The conclusion and dissolution of registered partnerships (for persons of same sex only) has been codified since 1 July 2006.
DK Yes For divorces, for over 100 years; for same‑sex unions, since they were introduced.
DE Yes Divorces since 1950. Dissolution of (same‑sex) legal union since 2001. Statistics on dissolutions planned from 2015, for reporting year 2014.
EE Yes Divorce and has always been allowed. Legal union/dissolution of legal union: n/a
IE Yes Section 5(1) of the 1996 Act sets out when and under what conditions the courts can grant a divorce in Ireland. Divorce Law came into effect in 1997.
EL Yes For divorce, since 1946; for dissolution of legal union since 2009.
ES Yes Divorce has been allowed since 20 July 1981.
FR Yes Divorce: 27 July 1884.
HR Yes Since 1950
IT Yes Since 1971
CY Yes Divorce and dissolution of legal union have been allowed since 1960.
LV Yes Divorce has been allowed since the Republic of Latvia was founded, in 1918 (the necessary legislation was promulgated in 1919).
LT Yes Since 1950
LU Yes Dissolution of legal union: since 2004; divorce: since the beginning of 1800 .
HU Yes Data are available for divorces since 1876 and for dissolution of registered partnerships since 2009.
MT Yes Divorce legislation was introduced in Malta in 2011.
NL Yes Since the 19th century
AT Yes Divorces since 1938; dissolutions of same‑sex registered partnerships since 2010.
PL Yes Divorce has been possible since 1 January 1946.
PT Yes Divorce is allowed since 1910 but between 1940 and 1974 only for civil marriages. Figures since 2011 include dissolved same‑sex marriages.
RO Yes For legal union: n/a
SI Yes Divorce has always been allowed in Slovenia.
SK Yes Divorce since 1918; dissolution of legal union: n/a
FI Yes Divorce since 1571; dissolution of legal union since 1 March 2002.
SE Yes For many years
UK Yes Divorces since 1855 in Scotland, 1858 in England and Wales, 1971 in Northern Ireland. Civil partnership dissolutions have been possible since 2006 in all countries.
LI Yes For opposite‑sex couples: since 1 June 1974; for same‑sex couples: since 1 September 2011.
NO Yes Since well over 100 years ago
CH Yes Divorce: since 1875 nationwide; dissolution of legal union: since 2007.
ME Yes
AL Yes
RS Yes Divorce is regulated by the Family Law.
TR Yes Divorce (as the final legal dissolution of a legal marriage, i.e. separation of husband and wife by judicial decree) has conferred on the parties the right to civil remarriage since 1926.
BY Yes
BA Yes
XK Yes Divorce: since the end of World War II
MD Yes Only for opposite‑sex couples
RU Yes
UA Yes
AM Yes
AZ Yes Since 1990
GE Yes Only for opposite‑sex marriages

74 Demographic statistics
Divorces5Ta
ble
5.2:
Con
ditio
ns fo
r a d
ivor
ce
Cour
t de
cisi
on
By
requ
est
of o
ne
or b
oth
part
ners
Stru
ctur
al
disr
upti
onA
dult
ery
Low
er
limit
of
mar
riag
e du
rati
on
Min
imum
pe
riod
of
livi
ng
apar
t
Inte
rest
s of
oth
er
part
ner
mus
t be
met
No
pros
pect
of
reco
n‑ci
liati
on
Prop
er
prov
isio
n fo
r dep
end‑
ents
Oth
er c
ondi
tion
s fo
r div
orce
or d
isso
luti
on o
f leg
al u
nion
BEx
xx
BGx
CZ
xx
xx
xx
xx
DK
x
DE
xx
xx
1. A
mar
riage
can
in p
rinci
ple
be
diss
olve
d on
ly th
roug
h di
vorc
e, e
ven
if th
e sp
ouse
s ha
ve b
een
mar
ried
very
brie
fly. A
nnul
men
t is
pos
sibl
e on
ly in
ve
ry e
xcep
tiona
l cas
es, e
.g. i
f a s
pou
se h
as c
heat
ed o
n cr
imin
al c
onvi
ctio
ns,
pre‑
mar
ital c
hild
ren
or a
ser
ious
illn
ess,
or re
gard
ing
mar
riage
of c
onve
ni‑
ence
. 2.
A c
oupl
e m
ay in
prin
cipl
e b
e di
vorc
ed o
nly
afte
r a y
ear’s
sep
arat
ion.
If
bot
h sp
ouse
s ar
e in
agr
eem
ent,
they
can
agr
ee o
n a
sepa
ratio
n tim
e, w
hich
w
ill n
ot b
e ex
amin
ed b
y th
e co
urt.
3.
The
mar
riage
end
s in
div
orce
whe
n it
is ‘b
roke
n’. I
f the
sp
ouse
s ag
ree
on d
ivor
ce a
nd it
s co
nseq
uenc
es, t
he c
ourt
doe
s no
t che
ck. I
f the
y do
not
ag
ree
on e
very
thin
g, th
e co
urt m
ust e
xpla
in w
hy th
e m
arria
ge h
as b
roke
n do
wn.
EEx
x
IE ELx
xx
x
ESx
FRx
xx
HR
x
Div
orce
can
be
initi
ated
by
cons
ensu
al re
ques
t of b
oth
part
ners
or b
y la
wsu
it of
one
par
tner
. A h
usba
nd c
anno
t arr
aign
the
law
suit
if th
e w
ife
is p
regn
ant o
r unt
il th
e ch
ild is
one
yea
r of a
ge. T
he c
ourt
dec
ides
ab
out
divo
rce.
If th
e pa
rtne
rs h
ave
one
or m
ore
child
ren,
they
hav
e to
att
end
a fa
mily
med
iatio
n in
the
proc
ess
of d
ivor
ce. T
he c
ourt
will
gra
nt a
div
orce
if
it de
term
ines
that
mar
ital r
elat
ions
hav
e b
een
serio
usly
and
per
man
ently
di
srup
ted
or if
a y
ear h
as p
asse
d si
nce
the
mar
ital u
nion
cea
sed
to e
xist
or i
f b
oth
spou
ses
cons
ensu
ally
app
ly fo
r a d
ivor
ce.
ITx
xA
fter
thre
e ye
ars
of le
gal s
epar
atio
n
CY
xX
LVx
xD
ivor
ce c
an a
lso
be
just
ified
by
a th
reat
to a
par
tner
’s lif
e or
hea
lth. A
s fr
om 1
Feb
ruar
y 20
11, m
arria
ges
may
be
diss
olve
d by
a s
wor
n no
tary
if th
e pa
rtne
rs h
ave
reac
hed
an a
gree
men
t.
LTx
xx
x
LUx
xx
x
HU
xx
Sam
e‑se
x le
gal u
nion
s ca
n al
so b
e di
ssol
ved
by re
gist
rars
.
MT
xx
x
NL
xx
xx
ATx
x

75 Demographic statistics
Divorces 5Co
urt
deci
sion
By
requ
est
of o
ne
or b
oth
part
ners
Stru
ctur
al
disr
upti
onA
dult
ery
Low
er
limit
of
mar
riag
e du
rati
on
Min
imum
pe
riod
of
livi
ng
apar
t
Inte
rest
s of
oth
er
part
ner
mus
t be
met
No
pros
pect
of
reco
n‑ci
liati
on
Prop
er
prov
isio
n fo
r dep
end‑
ents
Oth
er c
ondi
tion
s fo
r div
orce
or d
isso
luti
on o
f leg
al u
nion
PLx
PTx
Gro
unds
for d
ivor
ce w
ithou
t the
con
sent
of t
he s
pou
se a
re: a
de
fact
o se
para
tion
for a
con
secu
tive
year
, the
cha
nge
of th
e m
enta
l fac
ultie
s of
the
othe
r sp
ouse
whe
n th
is h
as la
sted
for o
ver a
yea
r, an
d its
sev
erity
com
pro‑
mis
es th
e p
ossi
bilit
y of
life
in c
omm
on; t
he a
bsen
ce w
ithou
t any
new
s of
th
e ab
sent
, for
not
less
than
one
yea
r; an
y ot
her f
act w
hich
, reg
ardl
ess
of
faul
t of t
he s
pou
ses,
show
ing
the
final
rupt
ure
of th
e m
arria
ge.
ROx
SIx
xx
The
cour
t may
dis
solv
e th
e m
arria
ge if
bot
h sp
ouse
s ag
ree;
if th
e m
arria
ge
bec
omes
uns
usta
inab
le fo
r any
reas
on, e
ither
sp
ouse
can
brin
g a
law
suit
requ
estin
g a
divo
rce.
The
reas
on is
in p
rinci
ple
not i
mp
orta
nt; n
eith
er is
it
imp
orta
nt w
hich
of t
he s
pou
ses
has
crea
ted
a si
tuat
ion
in w
hich
the
mar
riage
has
bec
ome
into
lera
ble.
SKx
FIx
xx
1. If
it is
foun
d th
at th
e hu
sban
d an
d w
ife o
r the
par
tner
s in
a re
gist
ered
pa
rtne
rshi
p ar
e cl
ose
rela
tives
, the
re is
no
time
limit
for g
ettin
g a
divo
rce.
Th
e co
urt c
an is
sue
a di
vorc
e de
cisi
on im
med
iate
ly.
2. If
the
per
sons
hav
e m
arrie
d or
regi
ster
ed th
eir p
artn
ersh
ip w
hen
still
in
a pr
evio
us m
arria
ge o
r reg
iste
red
part
ners
hip.
SEx
UK
xx
xU
nrea
sona
ble
beh
avio
ur, d
eser
tion,
livi
ng a
part
for m
ore
than
two
year
s (w
here
the
part
ies
agre
e to
div
orce
) or f
or m
ore
than
five
yea
rs (w
here
one
pa
rty
does
not
agr
ee).
LIx
NO
x
CH
xx
X
ME
xx
AL
x
RSx
TRx
BYx
x
BAx
XKx
xx
xx
xx
MD
xx
RUx
xx
xx
xx
UA
x
AM
xx
AZ
xx
GE
xx

76 Demographic statistics
Divorces5
5.3. The contents of a divorce declaration
In general, the declaration of divorce is a legal document to be filled in by the relevant court after it has pronounced its judgment. Table 5.3 shows that such documents are issued in 36 of the 44 countries surveyed. In MT for example no certificate is issued, instead there is an annotation on the side of the marriage/civil union certificate.
The contents of these certificates vary widely across coun‑tries. EE and HU include the most information on such a certificate, followed by TR, GE and ME. Date of registra‑tion of divorce, date of marriage, date of birth and citizenship of both ex‑spouses are the most commonly registered data. The number of common children is also included in 17 and the highest level of educational attainment in 15 countries. In EE, IT, RS and AM, certificates indicate the ex‑spouses’ socio‑economic status. In BG, CZ, DE, IT, CY, LU, HU, PL, PT, RO, SK, CH and TR, the certificates also include infor‑mation on the reasons for the divorce/dissolution.
Like in the case of the other declarations, the declaration of divorce is a general indication of the information available for statistical offices, but not necessarily the only source of information. In PT there are two instruments/declarations that support data collection: one for divorces granted in Court and another for divorces granted by the Civil Reg‑istry. For NL the gathering of the information follows this process: the information in the divorce declaration is sent to the municipality where the former spouses live and is integrated there in the population registry system. Second‑ary variables like date of birth of spouse, address, citizen‑ship etc. are drawn from the register not from the marriage dissolution certificate. A number of variables like marriage order for example, are deducted from registry information within Statistics Netherlands. Similarly, in BG information on date of birth of both partners, their place of birth, home address, age country of birth, citizenship can be derived from the register. In UK age at divorce is derived while pro‑cessing from age at marriage.

77 Demographic statistics
Divorces 5Ta
ble
5.3:
Con
tent
s of a
div
orce
dec
lara
tion
Existence of divorce certificate
Date of registration of divorce
Causes of divorce
Date of marriage
Place of marriage (country, municipality, etc.)
Both ex‑partners’ personal identifier
Surnames before and after divorce
Both ex‑partners’ date of birth
Marriage order
Place of birth
Both ex‑partners’ highest level of educational attainment
Both ex‑partners’ home address
Both ex‑partners’ religion
Both ex‑partners’ age
Both ex‑partners’ country of birth
Both ex‑partners’ nationality/citizenship
Both ex‑partners ‑ 12 months (or more) resident in the country
Both ex‑partners’ previous marital status
Number of common children
Other
BEx
xx
xx
xx
BGx
xx
xx
xx
xx
CZ
xx
xx
xx
xx
xx
x
DK
x
DE
xx
xx
xx
x
EEx
xx
xx
xx
xx
xx
xx
IE ELx
xx
x
ES FR HR
ITx
xx
xx
xx
x
CY
xx
xx
xx
xx
xx
LV LTx
xx
xx
xx
xx
xx
LUx
xx
xx
x
HU
xx
xx
xx
xx
xx
xx
xx
x
MT
NL
xx
xx
AT PLx
xx
xx
xx
x
PTx
xx
xx
xx
xx
xx
xx
x
ROx
xx
xx
xx
xx
xx
x
SIx
xx
xx
xx
xx
SKx
xx
xx
x
FIx
xx
xx
SEx
xx
UK
xx
xx
xx

78 Demographic statistics
Divorces5
Existence of divorce certificate
Date of registration of divorce
Causes of divorce
Date of marriage
Place of marriage (country, municipality, etc.)
Both ex‑partners’ personal identifier
Surnames before and after divorce
Both ex‑partners’ date of birth
Marriage order
Place of birth
Both ex‑partners’ highest level of educational attainment
Both ex‑partners’ home address
Both ex‑partners’ religion
Both ex‑partners’ age
Both ex‑partners’ country of birth
Both ex‑partners’ nationality/citizenship
Both ex‑partners ‑ 12 months (or more) resident in the country
Both ex‑partners’ previous marital status
Number of common children
Other
LIx
xx
x
NO
xx
xx
CH
xx
xx
xx
xx
x
ME
xx
xx
xx
xx
x
AL
RSx
xx
xx
xx
x
TRx
xx
xx
xx
xx
xx
x
BYx
xx
xx
xx
xx
xx
xx
xx
BAx
XKx
xx
xx
xx
xx
xx
xx
xx
MD
xx
RUx
xx
xx
UA
xx
xx
xx
xx
AM
xx
xx
xx
xx
xx
x
AZ
xx
xx
xx
x
GE
xx
xx
xx
xx
xx
x

79 Demographic statistics
Divorces 5
5.4. Divorces of residents abroad and divorces of ‘non‑residents’
As shown in Table 5.4 of the 29 countries that register di‑vorces abroad, 18 (CZ, DK, FR, IT, LT, MT, NL, PL, RO, FI, SE, LI, CH, BY, XK, MD, RU, GE) include these data in their national statistics. Divorces involving ‘non‑residents’ are
registered in 26 countries, but of these they are included in national statistics in 12 (EL, ES, FR, IT, HU, MT, PT, RO, UK, NO, XK and AZ). Five countries (FR, IT, MT, RO and XK) include both in their national statistics.
Duration completed at the time of divorce is used for the definition of duration of marriage at time of divorce in all the countries surveyed except DK, FR, LV and AM, which exclusively use duration reached at the end of the calendar year in their statistics. 11 countries (CZ, EE, IE, LU, NL, SK, SE, NO, CH, BA and GE) use both definitions.
Table 5.4: Divorces of residents abroad and divorces of ‘non‑residents’
Divorces abroad registered
Divorces abroad included in national
statistics
Divorces of ‘non‑resi‑dents‘ registered
Divorces of ‘non‑res‑idents’ included in national statistics
Definition of duration of marriage at time of
divorce
Yes No Yes No Yes No Yes NoReached at end of
year
Completed at time of
eventBE x x x x
BG x x x x
CZ x x x x x
DK x x x x
DE x x x
EE x x x x x x
IE x x x x
EL x x x x
ES x x x x
FR x x x x x
HR x x x
IT x x x x x
CY (*) x x x x
LV x x x
LT x x x x
LU x x x x
HU x x x x
MT x x x x x
NL x x x x x x
AT x x x x
PL x x x x x
PT x x x x
RO x x x x x
SI x x x x x
SK x x x x x x
FI x x x x
SE x x x x x x
UK x x x x
LI x x x x x
NO x x x x x x
CH x x x x x x
ME x x x x x
AL x x x x x
RS x x x x x
TR x x x x x

80 Demographic statistics
Divorces5
Divorces abroad registered
Divorces abroad included in national
statistics
Divorces of ‘non‑resi‑dents‘ registered
Divorces of ‘non‑res‑idents’ included in national statistics
Definition of duration of marriage at time of
divorce
Yes No Yes No Yes No Yes NoReached at end of
year
Completed at time of
eventBY x x x x
BA x x x x x x
XK x x x x x
MD x x x x
RU x x x x
UA x x x
AM x x x
AZ x x x x
GE x x x x x
(*) CY only includes divorces involving ‘non‑residents’ if one of the spouses is a resident.
5.5. Divorce indicatorsTable 5.5 shows that 31 countries calculate total divorce rate and 26 produce mean duration of marriage at divorce.
The mean or median age of the divorcing persons is calcu‑lated in 8 countries (CZ, DK, DE, HU, AT, PL, PT and CH). The crude divorce rate is also produced in 8 (CZ, DK, DE, CY, LT, LU, HU, SI and SK).
Table 5.5: Divorce indicators
Mean duration of marriage at divorce
Total divorce rate Other
BE x
BG x x
CZ x x Divorces per 1 000 inhabitants; divorces per 100 marriages; mean age at divorce
DK x x Divorces per 1 000 inhabitants; divorces per 100 marriages; mean age at divorce
DE x x Divorces per 1 000 inhabitants; divorces per 1 000 existing marriages; average age of divorced persons
EE x
IE
EL
ES x x
FR x Number of divorces by 1 000 couples married; divorce rates by duration of marriage; proportion of unions broken according to duration and year of marriage
HR x
IT
CY x Crude divorce rate
LV x x Divorces per 1 000 marriages; age‑specific divorce rates (per 1 000 population of corresponding age and gender)
LT x x Divorces per 100 marriages; crude divorce rate; age‑specific divorce rates (per 1 000 population of corresponding age and gender)
LU x x Crude divorce rate
HU x xCrude divorce rate; net divorce rate; average duration of marriage at divorce; standardised crude divorce rate; standardised net divorce rate; mean age at divorce; divorces per 1 000 marriages; number of divorces per 1 000 married couples
MT
NL x x
AT x x Duration‑specific divorce rates; median duration of divorce; mean age of man and woman at divorce and at marriage
PL x x Median age of divorced persons; number of divorces per 1 000 marriages in given year
PT x x Mean age at divorce by gender
RO x x Divorces by length of marriage
SI x x Divorces per 1 000 population; divorces per 1 000 marriages; age‑specific divorce rates

81 Demographic statistics
Divorces 5Mean duration of
marriage at divorceTotal divorce
rate Other
SK x x Crude divorce rate; number of divorces per new marriage
FI Median duration of marriage at divorce; median duration of marriage at death of husband and wife; probability of divorce for first marriage
SE x
UK England and Wales: divorce rates based on the number of people divorcing per 1000 marriad population aged 16 and over. Scotland: mean and median duration of marriage.
LI x x
NO x
CH x x Mean age at divorce (male/female)
ME x
AL x Divorces/100 marriages
RS x x
TR x
BY x x
BA x
XK x
MD x
RU
UA x
AM x
AZ x
GE x

82 Demographic statistics
Annexes
Annex I — List of country codesBE BelgiumBG BulgariaCZ Czech RepublicDK DenmarkDE GermanyEE EstoniaIE IrelandEL GreeceES SpainFR France (including overseas departments — DOM)HR CroatiaIT ItalyCY CyprusLV LatviaLT LithuaniaLU LuxembourgHU HungaryMT MaltaNL NetherlandsAT AustriaPL PolandPT PortugalRO RomaniaSI SloveniaSK SlovakiaFI FinlandSE SwedenUK United Kingdom
LI LiechtensteinNO NorwayCH Switzerland
ME MontenegroAL AlbaniaRS SerbiaTR Turkey
BY BelarusBA Bosnia and HerzegovinaXK Kosovo (under UNSCR 1244)MD MoldovaRU Russian FederationUA UkraineAM ArmeniaAZ AzerbaijanGE Georgia

83 Demographic statistics
Annexes
Annex II — Age‑specific demographic ratesThe countries were asked in the questionnaire to indicate how the following demographic age‑specific demographic rates are calculated:
• fertility rates;
• death rates; and
• first marriage rates.
These rates are generally expressed as the ratio of a number of persons experiencing a demographic event (here the birth of a child, death or first marriage) to the number of persons who might experience that event (the ‘risk population’).
There are three main ways to define the denominator and numerator of age‑specific ratio‑type rates, depending on whether we use birth cohorts (persons born in the same year) or age cohorts (people having the same age) and if we are looking at a calendar year or another period. These alternatives can be clarified by means of a Lexis diagram, a two‑dimensional plane where the horizontal axis repre‑sents time (t) and the vertical axis represents age (a). Both are presented as continuous variables. In the Lexis diagram, a lifeline is drawn for each person, i.e. a straight line which starts at a point on the horizontal axis (the date of birth). The angle between a lifeline and each axis is 45°. A lifeline ends when the person dies (or emigrates). Each moment in the life of a person is a point on his or her lifeline which is determined by his or her age at that moment and the calen‑dar date. All moments at which a person experiences a de‑mographic event can be marked by a point on his or her lifeline, marking the date and the age of the person at the time of the event.
Annual data can be classified in three different ways, each one corresponding to a shape on the Lexis diagram:
• the square (figure A): this groups events occurring during year t to individuals of a certain age a born in different years (belonging to two different birth co‑horts). Events are classified by age in completed years and by calendar year;
• the vertical parallelogram (figure B): this groups events occurring during year t to members of the same birth cohort (same year of birth) but at different ages (a and a+1). Events are classified by age reached dur‑ing the year and by calendar year; and
• the horizontal parallelogram (figure C) groups events occurring in two consecutive years (t and t+1) within a single birth cohort (ages a and a+1). Events are classified by age in completed years and by birth cohort (year of birth).
In general, the methods used to calculate age‑specific rates correspond to these shapes on the Lexis diagram: the numer‑ator of the age‑specific rates usually includes all individuals who experience an event (birth of a child, marriage, death) at a given age at a given time. As shown, age and time can be chosen in different ways and in different combinations. Giv‑en the age definition, the denominator (the ‘risk population’) should be chosen appropriately. The simplest way of choosing the ‘risk population’ is by calculating the average population, corresponding to the numerator.
AGE
a+3
a+2
a+1
a
a-1
t-1 t t+1 t+2 t+3 TIME
F
CD E
A B
AGE
a+3
a+2
a+1
a
a-1
t-1 t t+1 t+2 t+3 TIME
F
CD E
A B
Figure A Figure B

84 Demographic statistics
Annexes
AGE
a+3
a+2
a+1
a
a-1
t-1 t t+1 t+2 t+3 TIME
A
F
B
D EC
All three approaches have pros and cons.
• Both the numerator and the denominator of rates based on the square method include individuals from two different birth cohorts, i.e. two calendar years of birth: this is the drawback of the method, that the old‑est person in the risk population (the denominator) is two years older than the youngest. These rates relate to events that occur during a single calendar year.
• The vertical parallelogram method relates also to events that occur in one calendar year, but a drawback is the wide age range: the oldest individual in the nu‑merator is two years older than the youngest.
• The horizontal parallelogram method does not have this drawback, but the time‑lag between the earliest and the latest event is two years. Consequently, the rate refers to two calendar years instead of one.
Methods for calculating the main demographic ratesMost countries use the square method (Sq) to calculate the three indicators mentioned above (see Table A).
The vertical parallelogram method (Pvs) is used by four countries (FR, MT, NL and NO) to calculate the fertility rates. Three countries (FR, MT and NL) apply this method to calculate death rates and CZ, FR and NO use this method to compute first marriage rates.
The horizontal parallelogram method (Phs) is used by DK only for the calculation of age‑specific death rates.
Following the calculation of age‑specific rates, the total fer‑tility rate is then calculated as the sum of the age‑specific fertility rates in a given year and, similarly, the total first marriage rate by sex is the sum of the age‑specific first mar‑riage rates by sex. Age‑specific death rates are the starting point for the calculation of life expectancy (*).
Figure C
(*) For the calculation of life expectancy please refer to: http://ec.europa.eu/eurostat/cache/metadata/Annexes/demo_mor_esms_an1.pdf

85 Demographic statistics
Annexes
Table A: Methods for calculating the main age‑specific demographic rates
Fertility rate Death rates First marriage rate
Sq Pvs Phs Sq Pvs Phs Sq Pvs Phs
BE x x
BG x x
CZ x x x
DK x x
DE x x x
EE x x x
IE x x
EL x x x
ES x x x
FR x x x
HR x x
IT x x x
CY x x
LV x x x
LT x x x
LU x x
HU x x x
MT x x
NL x x
AT x x x
PL x x x
PT x x
RO x
SI x x x
SK x x x
FI x x x
SE x x x
UK x x x
LI
NO x x x
CH x x x
ME
AL
RS
TR
BY x x
BA
XK
MD x x
RU x x
UA x x
AM x x
AZ x x
GE

86 Demographic statistics
Annexes
Annex III — Mean age, event‑based and rate basedThe mean age of a mother at the birth of a child, at the birth of the first child or mean age at (first) marriage can be cal‑culated in two different ways, i.e. on the basis of the number of events or of rates.
To calculate mean age based on the number of events, all ages at birth or at marriage in a population in a calendar year are added and then divided by the number of individu‑als concerned. Here, we show how mean ages are calculated for marriages (or first marriages), but the same holds, by analogy, for births. Mean age at the birth of a child usually refers to mothers and mean age at marriage to males and females separately.
The formula for calculating the event‑based mean age at
first marriage = ΣxN(x)ΣN(x)
where:
x = age
N(x) = number of males/females who (first) marry at age x.
If age is measured as the number of completed years (age at last birthday), x can be raised by 0.5.
Event‑based indicators have the disadvantage that they are influenced by changes in cohort size (it is not the same size of population in every age). The weight of the age that cor‑responds to a big cohort is relatively large, while for a small cohort it is relatively small. This may hamper comparisons between regions, countries and periods.
In order to neutralise the influence of cohort size, mean ages can be calculated on the basis of age‑specific rates (please see Annex II on the calculation of age‑specific rates).
The formula for calculating the rate‑based mean age at first
marriage = ΣxM(x)ΣM(x)
where:
x = age
M(x) = age‑specific (first) marriage rate at age x.
Again, if age is measured as the number of completed years (age at last birthday), x can be raised by 0.5.

87 Demographic statistics
Annexes
Annex IV — GlossaryA
ABORTION (INDUCED ABORTION)
Induced expulsion of the foetus during the first part of a pregnancy, permitted by law for health or other reasons.
ABORTION RATE
The number of abortions per 1 000 women in reproductive ages in a given year.
ABORTION RATIO
The number of abortions per 100 or per 1 000 live births in a given year.
AGE DEPENDENCY RATIO
The ratio of the number of persons of an age when they are generally economically inactive to the number of persons of working age (conventionally defined as 15–64 or 20–59, depending on the context). The total dependency ratio is ob‑tained by adding the young‑ and old‑age dependency ratios (see below).
AGE AT LAST BIRTHDAY (AGE COMPLETED)
The interval of time between birth and the present time, expressed in completed units (years for adults and children and months, weeks, days, hours or minutes of life, as ap‑propriate, for infants or very young children). It is the age expressed as the number of birthdays passed at the date of an event.
AGE REACHED DURING THE YEAR
The number of complete years lived at the end of calen‑dar year in question, e.g. all persons born in 1944 will be treated as 70 years old throughout 2014, irrespective of their actual birthday. The age reached during the year is equal to the year to which data refers to minus the year of birth (2014 – 1944 = 70).
AVERAGE (OR MID‑YEAR OR MEAN) POPULATION
The average population in a calendar year is generally cal‑culated as the arithmetic mean of population on 1 Janu‑ary of two consecutive years (also referred to as the mean population). However, some countries use population based on registers, estimate it on a date close to 1 July (mid‑year population) or calculate a weighted average.
B
BIRTH ORDER (LIVE BIRTHS)
Ranking of a new‑born baby in relation to all previous live births to the same mother, i.e. the number of previous live births plus the birth in question.
C
CIVIL REGISTRAR
See Registrar.
COHORT
A group of people sharing a common demographic experi‑ence who are observed through time. The cohort of persons born in the same year is known as a generation, while the cohort of persons married in the same year is called a mar‑riage cohort or marriage generation.
CRUDE BIRTH RATE
The ratio of the number of live births during the year to the average population in that year. The value is expressed per 1 000 population.
CRUDE DEATH RATE
The ratio of the number of deaths during the year to the average population in that year. The value is expressed per 1 000 population.
CRUDE DIVORCE RATE
The ratio of the number of divorces during the year to the average population in that year. The value is expressed per 1 000 population.
CRUDE MARRIAGE RATE
The ratio of the number of marriages during the year to the average population in that year. The value is expressed per 1 000 population.
D
DIVORCE RATES BY DURATION OF MARRIAGE
For each calendar year n, if the number of divorces ranked according to the number of years of marriage (x) is avail‑able, divorce rates by duration of marriage can be calculated by relating the number of divorces at the end of x years of marriage to the number of marriages in year n‑x.
DEATH RATES BY AGE (AGE‑SPECIFIC DEATH RATES)
The ratio of the number of deaths of persons of age x to the average population of age x. Depending on the country, the age is either the age reached during the year or the age at last birthday.
E
EARLY NEONATAL MORTALITY RATE
The ratio of the number of deaths of children aged less than one week during the year to the number of live births in that year. The value is expressed per 1 000 live births.

88 Demographic statistics
Annexes
F
FERTILITY RATES BY AGE OF THE MOTHER (AGE‑SPECIFIC FERTILITY RATES)
The ratio of the number of live births to mothers of age x to the average female population of age x. Depending on the country, the age is either the age reached during the year or the age at last birthday.
FIRST MARRIAGE RATES BY AGE (AGE‑SPECIFIC FIRST MARRIAGE RATES)
The ratio of the number of first marriages of women (or men) of age x to the average female (or male) population of age x. Depending on the country, the age is either the age reached during the year or the age at last birthday.
G
GENERATION
A group of persons born in the same period, generally a cal‑endar year.
I
INFANT MORTALITY RATE
The ratio of the number of deaths of children under one year of age during the year to the number of live births in that year. The value is expressed per 1 000 live births.
LATE FOETAL MORTALITY RATE
The ratio of the number of stillbirths during the year to the number of total births in that year (live births plus still‑births). The value is expressed per 1 000 total births.
LIFE EXPECTANCY AT BIRTH
The mean number of years that a new‑born child can expect to live if subjected throughout its life to the current mortal‑ity conditions (age‑specific probabilities of dying).
LIFE EXPECTANCY AT SELECTED AGES
The mean number of years still to be lived by a person who has reached a certain age, if subjected throughout the rest of his/her life to the current mortality conditions (age‑specific probabilities of dying).
LIVE BIRTHS
Births of children that showed any sign of life, i.e. births excluding stillbirths (total births include live births and stillbirths).
M
MEAN AGE AT FIRST MARRIAGE
The mean age of women (or men) when they first get married.
For a given calendar year, the mean age of women (or men) at first marriage can be calculated using first marriage rates by age.
MEAN AGE OF WOMEN AT CHILDBIRTH
The mean age of women when their children are born.
For a given calendar year, the mean age of women at child‑birth can be calculated using fertility rates by age (in gen‑eral, the reproductive period is conventionally defined be‑tween 14 and 50 years of age).
MEAN AGE OF WOMEN AT FIRST BIRTH
The mean age of women delivering their first child (live birth).
For a given calendar year, the mean age of women at first child can be calculated using fertility rates for first births by age (in general, the reproductive period is conventionally defined between 14 and 50 years of age).
N
NATURAL CHANGE
The difference between the number of live births and the number of deaths during the year. The natural change is negative when the number of deaths exceeds the number of births.
NEONATAL MORTALITY RATE
The ratio of the number of deaths of children aged less than 28 days during the year to the number of live births in that year. The value is expressed per 1 000 live births.
O
OLD‑AGE DEPENDENCY RATIO
The ratio of the number of elderly persons of an age when they are generally economically inactive (conventionally defined as 60+ or 65+, depending on the context) to the number of persons of working age (conventionally defined as 15–64 or 20–59, depending on the context).
P
PERINATAL MORTALITY RATE
The ratio of the number of deaths of children aged less than one week plus the stillbirths during the year to the number of total births in that year (live births plus stillbirths). The value is expressed per 1 000 total births.
POPULATION CHANGE
The difference between the size of the population at the end and at the beginning of a period. This is equal to the alge‑braic sum of natural change and net migration (including corrections). There is negative change when both of these components are negative or when one is negative and has a higher absolute value than the other.
POPULATION ON 1 JANUARY
The inhabitants of a given area on 1 January of the year in question (or, in some cases, on 31 December of the previous

89 Demographic statistics
Annexes
year). The population is based on data from the most recent census adjusted by the components of population change produced since, or on population registers.
POPULATION REGISTER
An individualised data system, that is, a mechanism of con‑tinuous recording and/or of coordinated linkage, of select‑ed information pertaining to each member of the resident population of a country in such a way as to offer the pos‑sibility of deriving up‑to‑date information concerning the size and characteristics of that population at selected time intervals. (40)
R
REGISTRAR
The official or administration authorised by law with the responsibility for carrying out the civil registration of vital events in a well‑defined area (an entire country, or a coun‑try, district, municipality, parish etc.) and for recording and reporting information on those events for legal and statisti‑cal purposes. (41) In some countries, the registrar also reg‑isters other official documents, such as those for registered partnerships.
S
SEX RATIO
Generally, the number of males per 100 females in a pop‑ulation (in some countries the number of females per 100 males).
STILLBIRTHS
The expulsion or extraction from the mother of a dead foe‑tus after the time at which it would normally be presumed capable of independent extra‑uterine existence (commonly taken to be after 24 or 28 weeks of gestation). This does not include infants who are born alive but die shortly after birth.
T
TOTAL BIRTHS
The sum of live births and stillbirths.
TOTAL DIVORCE RATE
The mean number of divorces per marriage in a given year. This is not weighted according to the structure of marriage duration, i.e. the size of the various marriage cohorts is as‑sumed to be the same. The total divorce rate is computed by adding the divorce rates by duration of marriage for the year in question. It does not distinguish between marriage cohorts and is not the divorce rate of any specific mar‑riage cohort; rather, it is the divorce rate of a hypothetical
(40) As defined in UNSD Statistical Paper ‘Principles and recommendations for a Vital Statistics System’, p. 206.
(41) As defined in UNSD Statistical Paper ‘Principles and recommendations for a Vital Statistics System’, p. 202.
generation subjected at each age to the current marriage conditions.
TOTAL FERTILITY RATE
The mean number of children that would be born alive to a woman during her lifetime if she were to pass through her childbearing years conforming to the fertility rates by age of a given year, and surviving. It is therefore the completed fertility of a hypothetical generation, computed by adding the fertility rates by age for women in a given year (the num‑ber of women at each age is assumed to be the same). Please see the calculation of age‑specific fertility rates in Annex II. The total fertility rate is then calculated as the sum of the age‑specific fertility rates in a given year.
TOTAL FIRST MARRIAGE RATE
The mean number of first marriages per woman (or man) in a given year. This is calculated by adding the first marriage rates by age of women (or men) for the year in question (the numbers of women and men at each age are assumed to be the same). It does not distinguish between generations and is not the first marriage rate of any specific generation; rath‑er, it is the first marriage rate of a hypothetical generation subjected at each age to the current marriage conditions.
Y
YOUNG‑AGE DEPENDENCY RATIO
The ratio of the number of young persons of an age when they are generally economically inactive (conventionally defined as <15 or <20, depending on the context) to the number of persons of working age (conventionally defined as 15–64 or 20–59, depending on the context).

90 Demographic statistics
Annexes
Annex V — Country‑specific registration formsFor examples of country‑specific registration forms:
http://ec.europa.eu/eurostat/documents/10186/6799655/KS‑GQ‑15‑002‑ANNEX+5.zip


HOW TO OBTAIN EU PUBLICATIONS
Free publications:
• one copy: via EU Bookshop (http://bookshop.europa.eu);
• more than one copy or posters/maps: from the European Union’s representations (http://ec.europa.eu/represent_en.htm); from the delegations in non-EU countries (http://eeas.europa.eu/delegations/index_en.htm); by contacting the Europe Direct service (http://europa.eu/europedirect/index_en.htm) or calling 00 800 6 7 8 9 10 11 (freephone number from anywhere in the EU) (*).
(*) The information given is free, as are most calls (though some operators, phone boxes or hotels may charge you).
Priced publications:
• via EU Bookshop (http://bookshop.europa.eu).

Dem
ographic statistics: a review of definitions and m
ethods of collection in 44 European countries2015 ed
ition
KS-GQ
-15-002-EN-N
doi:10.2785/717072