Deliverable 1.1 Regional state of play analyses - SUWANU ...
279
Page 1 of 274 Deliverable 1.1 Regional state of play analyses Funding scheme: Horizon 2020 – Coordination and Support Action (CSA) Project Coordinator: BIOAZUL Start date of the project: 01.01.19 Duration of the project: 30 months Contractual delivery date: 30.06.2019 Actual delivery date: 09.07.2019 Contributing WP: WP1: Inventory of existing knowledge, good practices and regional analysis Dissemination level: Public Responsible partner: UCO Version: FINAL VERSION
-
Upload
khangminh22 -
Category
Documents
-
view
2 -
download
0
Transcript of Deliverable 1.1 Regional state of play analyses - SUWANU ...
Page 1 of 274
Deliverable 1.1
Regional state of play analyses
Funding scheme: Horizon 2020 – Coordination and Support Action (CSA)
Project Coordinator: BIOAZUL
Start date of the project: 01.01.19 Duration of the project: 30 months
Contractual delivery date: 30.06.2019
Actual delivery date: 09.07.2019
Contributing WP: WP1: Inventory of existing knowledge, good practices and regional analysis
Dissemination level: Public
Responsible partner: UCO
Version: FINAL VERSION

Deliverable 1.1: Regional state of play analyses
Page 2 of 274
Table of Contents
Executive Summary .......................................................................................................... 4
Introduction ...................................................................................................................... 5
• Background definition of the deliverable goals .................................................................. 5
• Calendar for Deliverable 2.1 development ......................................................................... 6
• Common terminology ......................................................................................................... 6
Regional State of Play ....................................................................................................... 7
1. ANTWERP AND LIMBURG, BELGIUM ........................................................................... 7
1.1 Belgium Executive summary ............................................................................................... 7
1.2 Socio-economic characterization of the region .................................................................. 7
1.3 Regulatory and institutional framework ........................................................................... 16
1.4 Identification of key actors ............................................................................................... 17
1.5 Existing situation of wastewater treatment and agriculture ............................................ 21
1.6 Existing related initiatives ................................................................................................. 29
1.7 Discussion and conclusion remarks .................................................................................. 29
1.8 References ........................................................................................................................ 30
2 PLOVDIV, BULGARIA .................................................................................................. 33
2.1 Bulgaria Executive summary ............................................................................................. 33
2.2 Socio-economic characterization of the region ................................................................ 33
2.3 Regulatory and institutional framework ........................................................................... 44
2.4 Identification of key actors ............................................................................................... 51
2.5 Existing situation of wastewater treatment and agriculture ............................................ 55
2.6 Existing related initiatives ................................................................................................. 67
2.7 Discussion and conclusion remarks .................................................................................. 69
2.8 References ........................................................................................................................ 70
3 OCCITANIE, FRANCE ................................................................................................... 72
3.1 France Executive Summary ............................................................................................... 72
3.2 Socio-economic characterization of the region ................................................................ 72
3.3 Regulatory and institutional framework ........................................................................... 81
3.4 Identification of key actors ............................................................................................... 83
3.5 Existing situation of wastewater treatment and agriculture ............................................ 86
3.6 Existing related initiatives ................................................................................................. 91
3.7 Discussion and conclusion remarks .................................................................................. 92
3.8 References ........................................................................................................................ 93
4 BRAUNSCHWEIG, GERMANY ..................................................................................... 94
4.1 Germany Executive Summary ........................................................................................... 94
4.2 Socio-economic characterization of the region ................................................................ 94
4.3 Regulatory and institutional framework ......................................................................... 106
4.4 Identification of key actors ............................................................................................. 109
4.5 Existing situation of wastewater treatment and agriculture .......................................... 110
Deliverable 1.1: Regional state of play analyses
Page 3 of 274
4.6 Existing related initiatives ............................................................................................... 112
4.7 Discussion and conclusion remarks ................................................................................ 116
4.8 References ...................................................................................................................... 116
5 THESSALONIKI PROVINCE, GREECE .......................................................................... 117
5.1 Greece Executive Summary ............................................................................................ 117
5.2 Socio-economic characterization of the region .............................................................. 117
5.3 Regulatory and institutional framework ......................................................................... 138
5.4 Identification of key actors ............................................................................................. 159
5.5 Existing situation of wastewater treatment and agriculture .......................................... 167
5.6 Existing related initiatives ............................................................................................... 180
5.7 Discussions and conclusions remarks ............................................................................. 189
5.8 References ...................................................................................................................... 191
6 PO RIVER, ITALY ....................................................................................................... 193
6.1 Italy executive summary ................................................................................................. 193
6.2 Socio-economic characterization of the region .............................................................. 193
6.3 Regulatory and institutional framework ......................................................................... 199
6.4 Identification of key actors ............................................................................................. 201
6.5 Existing situation of wastewater treatment and agriculture .......................................... 207
6.6 Existing related initiatives ............................................................................................... 213
6.7 Discussion and conclusion remarks ................................................................................ 216
7 ALENTEJO, PORTUGAL ............................................................................................. 217
7.1 Portugal Executive summary .......................................................................................... 217
7.2 Socio-economic characterization of the region .............................................................. 217
7.3 Regulatory and institutional framework ......................................................................... 227
7.4 Identification of key actors ............................................................................................. 228
7.5 Existing situation of wastewater treatment and agriculture .......................................... 232
7.6 Existing related initiatives ............................................................................................... 243
7.7 Discussion and conclusion remarks ................................................................................ 243
7.8 References ...................................................................................................................... 244
8 ANDALUSIA, SPAIN ................................................................................................... 245
8.1 Spain Executive summary ............................................................................................... 245
8.2 Socio-economic characterization of the region .............................................................. 246
8.3 Regulatory and institutional framework ......................................................................... 254
8.4 Identification of key actors ............................................................................................. 260
8.5 Existing situation of wastewater treatment and agriculture .......................................... 261
8.6 Existing related initiatives ............................................................................................... 268
8.7 Discussion and conclusion remarks ................................................................................ 269
General conclusions ...................................................................................................... 270
References .................................................................................................................... 272
ANNEX I: EU Legislative procedure and terminology adopted in the European Regulation on water reuse for agricultural irrigation ..................................................................... 274

Deliverable 1.1: Regional state of play analyses
Page 4 of 274
Executive Summary
The state-of-the-art aims the understanding of reclaimed water implementation degree and replicability potential for water reuse solutions in agriculture. Issues analysed in this report are the existing situation of wastewater treatment and agriculture, identification of key actors, institutions and existing related initiatives, regional context including legislation and socio-economic aspects. Thus, the work done in this report serves as the basis for the subsequence work of the project, with an insight of the reclaimed water situation in the target regions reinforcing the following tasks with an adequate background.
The structure of each regional analyses within this report is organised in the following points:
• Socio-economic characterization of the region, information about the location, climate geography, population, economic data, urban structure, agricultural insight or hydrological data is provided.
• Analysis of regulatory and institutional framework, an analysis of the legal framework about the application of water in agriculture is conducted.
• Identification of the key actors. This aspect is essential as a first step for the creation of regional working groups and contacts for the participatory workshops.
• Characterisation of the wastewater treatment situation and its agricultural uses, information about the wastewater treatment plants, about the water treated in the industry, urban or any other part of the region is provided. Besides information about the agricultural sector is provided, more specifically, information about the type of crops, water demand and the agribusiness description.
• Information about existing initiatives in implementing reclaimed water for agricultural purposes.
Information provided helps to contextualise the different regions situation. Data about water demands for agricultural irrigation, the number of WWTP or their potential amount of water to treat helps this project to visualize the potential use of reclaimed water in the different regions. Besides, key actors’ identification process will allow to conduct the following steps of the projects. For example, part of these key actors participated in the evaluation of the SWOT analysis aspects and participated or will participate in the several workshops to be organised.
The lack of a homogeneous regulation, where some regions (Belgium, Bulgaria, Italy or Portugal) do not regulated directly the use of reclaimed water needs to be face at a European level. The for coming EU regulation for irrigation with reclaimed water is a proper opportunity to foster this alternative resource.
Besides, this report highlights the similarities and differences among the target regions. There is a consensus about the potential use of reclaimed water for irrigation and the availability of a constant water resource thanks to the WWTP implemented among. However, there is also a lack of treatment in some regions, where the total wastewater treatment is not achieved. The size of the regions in terms of area and population affects the implementation of reclaimed water for irrigation and the potential policies should consider this issue.
This report helps to visualize the potential use of reclaimed water for irrigation in all the target regions. There is no doubt that water scarcity is a problem that affect to the whole group of regions and the availability of WWTP and the capacity to reuse water in each region suppose an important starting point.
Deliverable 1.1: Regional state of play analyses
Page 5 of 274
Introduction
• Background definition of the deliverable goals
The document ‘Deliverable 1.1: State of Play for target regions’ is part of WP1: Inventory of existing knowledge, good practices and regional analysis. The definition of this task 1.1 according SUWANU Program is:
An in-depth state of play analysis at regional level will be performed to better understand the current implementation degree and replicability potential for water reuse solutions in agriculture. The state of play analysis will be compiled in 8 regional reports, one report for each target region (..)
The regional reports will reflect a multi-actor approach including the expertise and experiences of the different actors involved in the process to implement the water reuse in the target regions, including at least:
• policy makers, • farmers, • wastewater plant operators, • water suppliers, • agricultural advisors • consumers
Task members have drafted a first list of key elements that will have to be addressed in the regional report. These elements will include:
1. Common terminology for the project 2. socio-economic characterization 3. legal and regulatory framework 4. identification of key actors 5. existing situation of wastewater treatment and agriculture, 6. institutions and existing related initiatives
The information address current regional infrastructure, institutions, supply demand and socioeconomic characteristics including already know future expansion plans (new research and research centres).
Guidelines included in this document are designed to ease comparability and give a common stature to the regional analysis. Partners follow and fill all data requirements subjects to a proportional effort and rationality, i.e. making a research into available information and adapting to proposed information structure.
Deliverable 1.1: Regional state of play analyses
Page 6 of 274
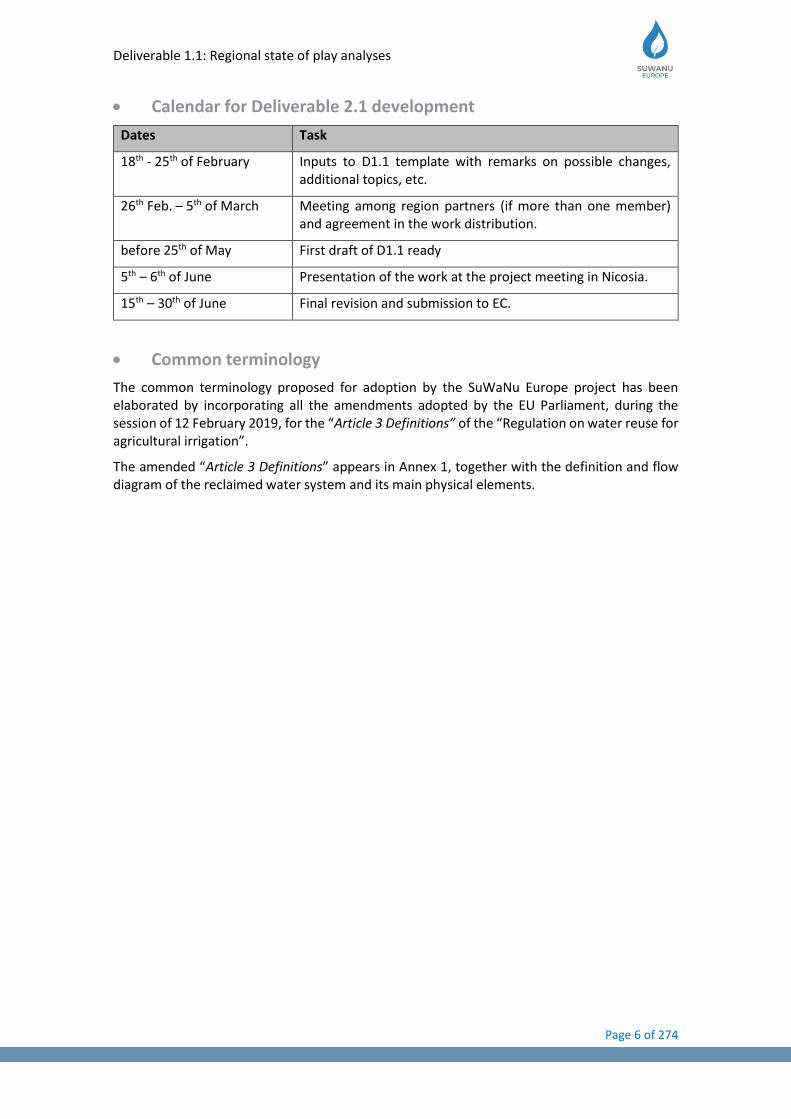
• Calendar for Deliverable 2.1 development
Dates Task
18th - 25th of February Inputs to D1.1 template with remarks on possible changes, additional topics, etc.
26th Feb. – 5th of March Meeting among region partners (if more than one member) and agreement in the work distribution.
before 25th of May First draft of D1.1 ready
5th – 6th of June Presentation of the work at the project meeting in Nicosia.
15th – 30th of June Final revision and submission to EC.
• Common terminology
The common terminology proposed for adoption by the SuWaNu Europe project has been elaborated by incorporating all the amendments adopted by the EU Parliament, during the session of 12 February 2019, for the “Article 3 Definitions” of the “Regulation on water reuse for agricultural irrigation”.
The amended “Article 3 Definitions” appears in Annex 1, together with the definition and flow diagram of the reclaimed water system and its main physical elements.
Deliverable 1.1: Regional state of play analyses
Page 7 of 274
Regional State of Play
1. ANTWERP AND LIMBURG, BELGIUM
1.1 Belgium Executive summary
Antwerp and Limburg are two provinces located in the northeast of Flanders (Belgium). The region includes some compact cities (Antwerp, Mechelen, and Hasselt). Highly dispersed suburban zones characterise the landscape, although some regions with dominant agriculture and forestry still prevail. Both provinces are characterised by a high (Limburg 364.5 inhabitants/km2) to very high (Antwerp 658 inhabitants/km2) population density. This reason, together with the relatively moderate supply of surface water, explains the area’s low water availability (1.100 - 1.700 m³ water per capita). Intensive pig and poultry farming, and dairy production are important agricultural sectors in both provinces. Furthermore, vegetable production in greenhouses prevails in the region between the cities Mechelen and Antwerp, while fruit production characterises the Southern part of the province. Pressure on the groundwater resources and deviating precipitation patterns are predicted to further increase in the future due to climate change. Today, reclaimed water is only exceptionally used in agriculture. Nevertheless, reclaimed water is considered an important alternative for the future – especially in cultures of potato and vegetables.
1.2 Socio-economic characterization of the region
Location
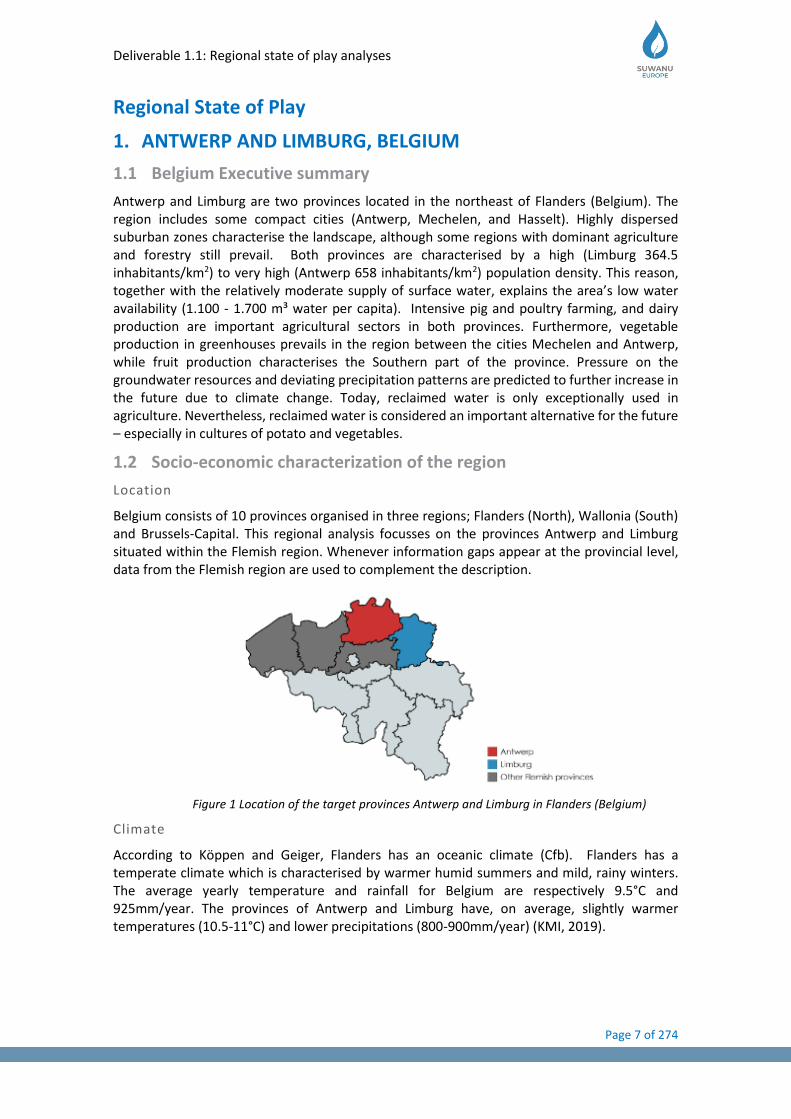
Belgium consists of 10 provinces organised in three regions; Flanders (North), Wallonia (South) and Brussels-Capital. This regional analysis focusses on the provinces Antwerp and Limburg situated within the Flemish region. Whenever information gaps appear at the provincial level, data from the Flemish region are used to complement the description.
Figure 1 Location of the target provinces Antwerp and Limburg in Flanders (Belgium)
Climate
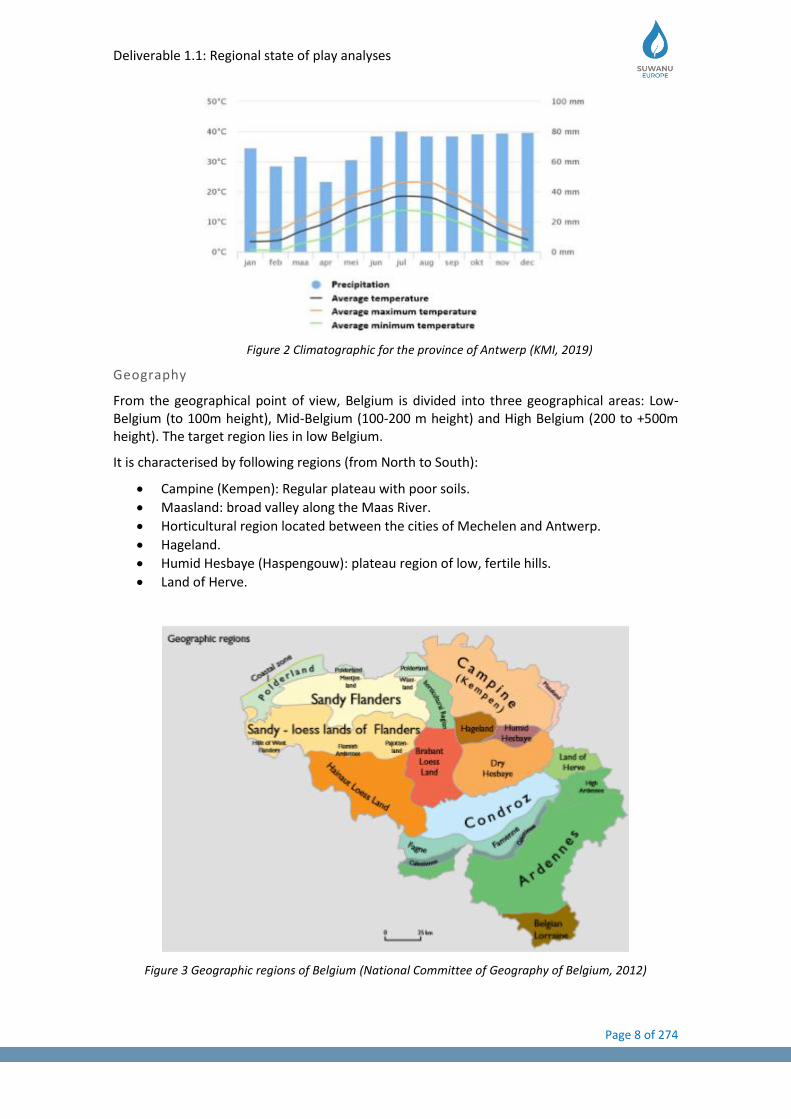
According to Köppen and Geiger, Flanders has an oceanic climate (Cfb). Flanders has a temperate climate which is characterised by warmer humid summers and mild, rainy winters. The average yearly temperature and rainfall for Belgium are respectively 9.5°C and 925mm/year. The provinces of Antwerp and Limburg have, on average, slightly warmer temperatures (10.5-11°C) and lower precipitations (800-900mm/year) (KMI, 2019).
Deliverable 1.1: Regional state of play analyses
Page 8 of 274
Figure 2 Climatographic for the province of Antwerp (KMI, 2019)
Geography
From the geographical point of view, Belgium is divided into three geographical areas: Low-Belgium (to 100m height), Mid-Belgium (100-200 m height) and High Belgium (200 to +500m height). The target region lies in low Belgium.
It is characterised by following regions (from North to South):
• Campine (Kempen): Regular plateau with poor soils.
• Maasland: broad valley along the Maas River.
• Horticultural region located between the cities of Mechelen and Antwerp.
• Hageland.
• Humid Hesbaye (Haspengouw): plateau region of low, fertile hills.
• Land of Herve.
Figure 3 Geographic regions of Belgium (National Committee of Geography of Belgium, 2012)
Deliverable 1.1: Regional state of play analyses
Page 9 of 274
Population
Flanders counts 6.5 million inhabitants. It is a densely populated region with on average 485 inhabitants per km². Compared to the Flemish average, Limburg has a lower population density, while Antwerp a higher.
Table 1 Population and density in the province of Antwerp and Limburg (2018)
Population (amount) Population density (inhabitants per km2)
Antwerp 1.849.967 645
Limburg 872.923 360
Source: (Eurstat, 2018; Statbel, 2018)
Economic data
The Flemish GDP per capita in Purchasing Power Standards was 118% compared to the EU-28 average. In absolute figures, it represents EUR 310 billion for Flanders for the year 2018 or EUR 36.700 GDP per capita (Statistiek Vlaanderen, 2018). Within Flanders, differences at the regional level appear. The high economic importance of the province of Antwerp is reflected by the GDP capita, which is 39% above the EU average. On the other hand, Limburg figures 3% below the EU average (Eurstat, 2018).
Table 2 Gross domestic product in the province of Antwerp and Limburg
Province GDP (million €) (2017) GDP per capita compared to EU-28 average (PPS) (100% = EU-28 average) (2016)
Antwerp 85.753 139%
Limburg 27.811 97%
Source: (Eurstat, 2018)
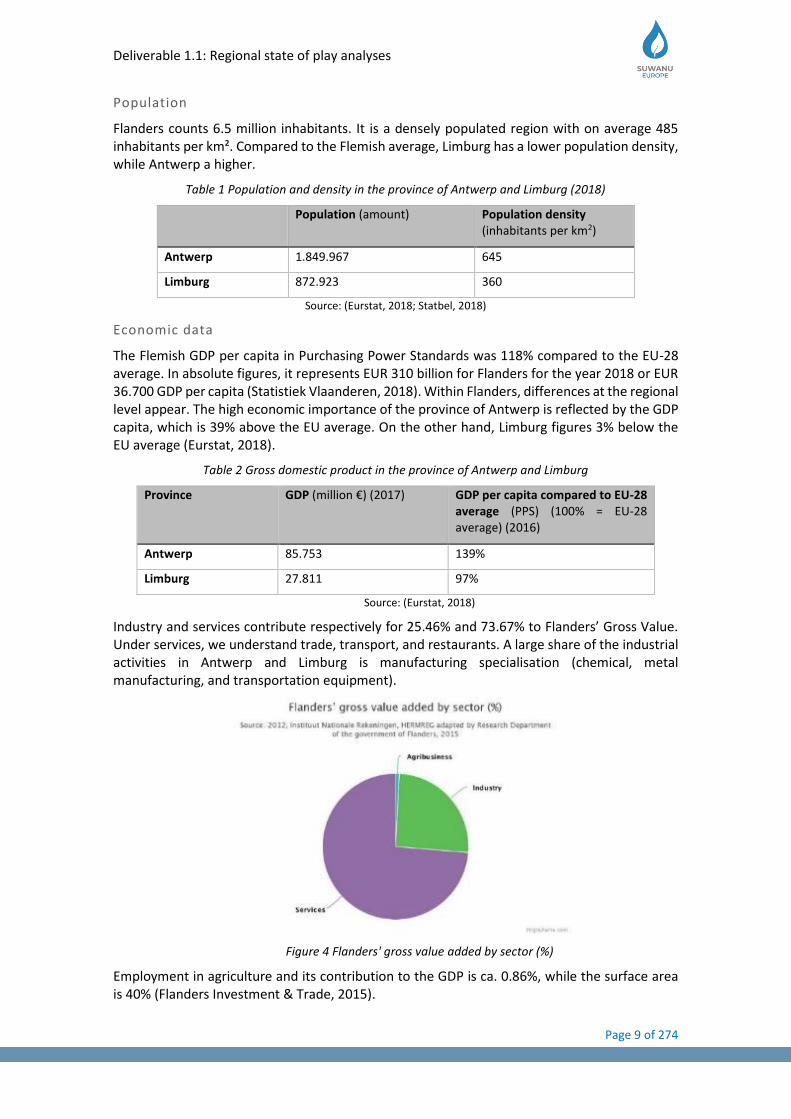
Industry and services contribute respectively for 25.46% and 73.67% to Flanders’ Gross Value. Under services, we understand trade, transport, and restaurants. A large share of the industrial activities in Antwerp and Limburg is manufacturing specialisation (chemical, metal manufacturing, and transportation equipment).
Figure 4 Flanders' gross value added by sector (%)
Employment in agriculture and its contribution to the GDP is ca. 0.86%, while the surface area is 40% (Flanders Investment & Trade, 2015).

Deliverable 1.1: Regional state of play analyses
Page 10 of 274
Urban structure
Flanders is a highly urbanised region. Most Flemish people live in regional and small cities (54.4%), followed by large cities and their agglomeration (27.4%) and a lower proportion in rural areas (18%). These figures reflect how the population is widely spread across suburban zones and not concentrated in compact cities. The landscape appearance is strongly characterised by the highly dispersed urbanisation, although some regions with dominant agriculture and forestry still prevail (National Committee of Geography of Belgium, 2012; Tempels et al., 2012; Vanderhaegen et al., 2016).
Figure 5 Residential areas (black) and open space (white) in Flanders (Tempels et al., 2012)
Agriculture
More than one-third of the area in both provinces is cultivated (in total 182.175 hectares).
In the province of Antwerp, 79% of the agricultural area is used for fodder crops (almost exclusively maize and grass). The abundance of these cultures indicates the importance of intensive pig and poultry farming and dairy production in the province. Nearly 50% of the agri-food firms based in the province of Antwerp are specialised in livestock production. Arable farming such as grain maize, potatoes, and cereals count to 15% of the agricultural area. Although the vegetable production in greenhouses barely covers 1% of the total cultivated area, it characterises the region between the cities Mechelen and Antwerp as well as the northern part of the province (Hoogstraten and Rijkevorsel). The province of Antwerp concentrates 42% of the Flemish greenhouse horticulture area (Statbel, 2018).
Dairy production and cattle farming equally express a major role in agricultural production in the province of Limburg. Fodder crops cover 51% of the province’s agriculture area. Orchards characterise the Southern part of Limburg. The province of Limburg represents 60% of the Flemish fruit production. The last decade, the area for vegetable production in open air has grown considerably. The asparagus production is a specialisation in the province (54% of the Flemish asparagus area). Unlike Antwerp, Limburg barely has greenhouses (only 185ha), but future initiatives are focussing on the rollout of the greenhouse area. Figure 6 shows the geographical distribution of agricultural specialisations across the target region (Reynders et al., 2014).
Based on the share of irrigation areas per crop types determined in a study of D’hooge et al. (2007), the province of Antwerp has an estimated irrigated cultivated area of 8%. For the province of Limburg, the irrigated area is estimated at 7% of the total cultivated area.
Deliverable 1.1: Regional state of play analyses
Page 11 of 274
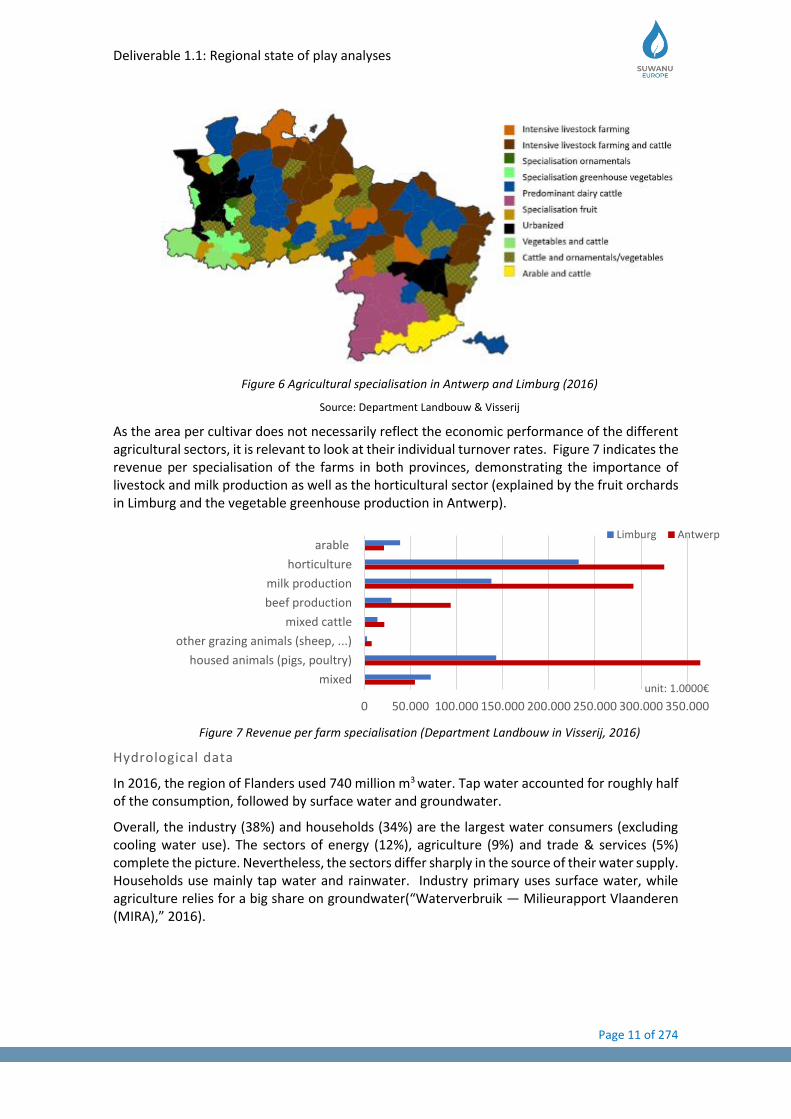
Figure 6 Agricultural specialisation in Antwerp and Limburg (2016)
Source: Department Landbouw & Visserij
As the area per cultivar does not necessarily reflect the economic performance of the different agricultural sectors, it is relevant to look at their individual turnover rates. Figure 7 indicates the revenue per specialisation of the farms in both provinces, demonstrating the importance of livestock and milk production as well as the horticultural sector (explained by the fruit orchards in Limburg and the vegetable greenhouse production in Antwerp).
Figure 7 Revenue per farm specialisation (Department Landbouw in Visserij, 2016)
Hydrological data
In 2016, the region of Flanders used 740 million m3 water. Tap water accounted for roughly half of the consumption, followed by surface water and groundwater.
Overall, the industry (38%) and households (34%) are the largest water consumers (excluding cooling water use). The sectors of energy (12%), agriculture (9%) and trade & services (5%) complete the picture. Nevertheless, the sectors differ sharply in the source of their water supply. Households use mainly tap water and rainwater. Industry primary uses surface water, while agriculture relies for a big share on groundwater(“Waterverbruik — Milieurapport Vlaanderen (MIRA),” 2016).
0 50.000 100.000 150.000 200.000 250.000 300.000 350.000
mixed
housed animals (pigs, poultry)
other grazing animals (sheep, ...)
mixed cattle
beef production
milk production
horticulture
arable
unit: 1.0000€
Limburg Antwerp
Deliverable 1.1: Regional state of play analyses
Page 12 of 274
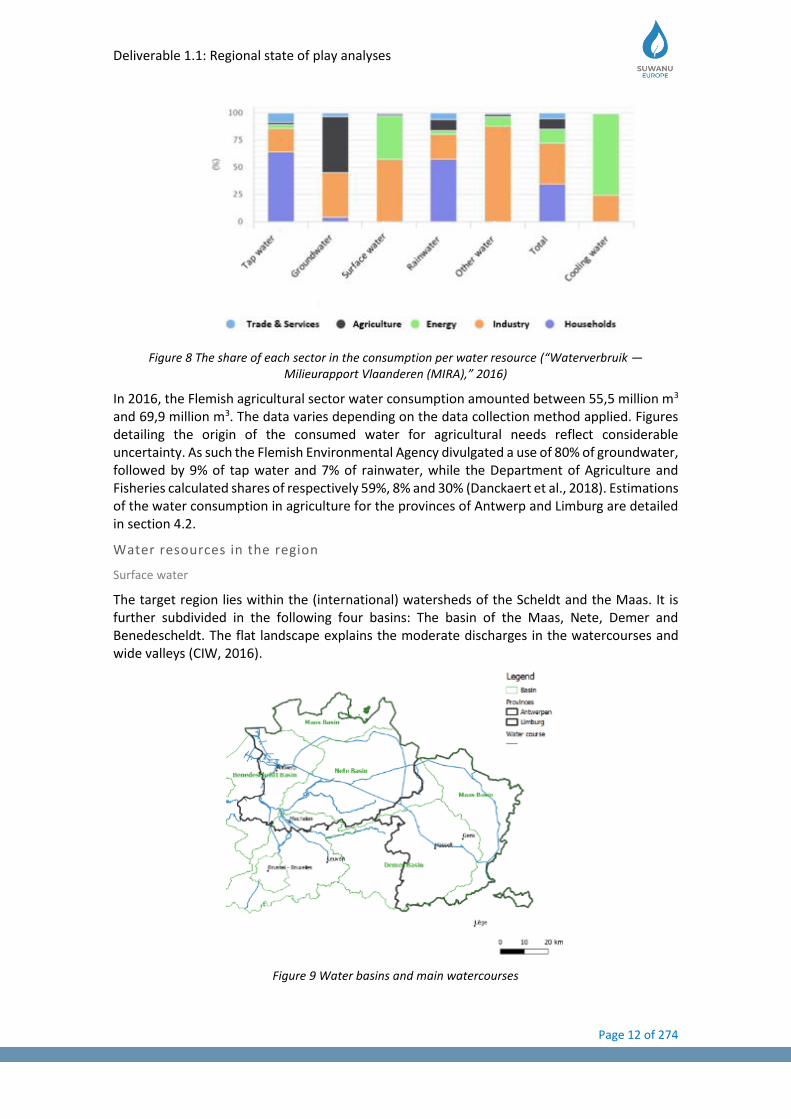
Figure 8 The share of each sector in the consumption per water resource (“Waterverbruik — Milieurapport Vlaanderen (MIRA),” 2016)
In 2016, the Flemish agricultural sector water consumption amounted between 55,5 million m3 and 69,9 million m3. The data varies depending on the data collection method applied. Figures detailing the origin of the consumed water for agricultural needs reflect considerable uncertainty. As such the Flemish Environmental Agency divulgated a use of 80% of groundwater, followed by 9% of tap water and 7% of rainwater, while the Department of Agriculture and Fisheries calculated shares of respectively 59%, 8% and 30% (Danckaert et al., 2018). Estimations of the water consumption in agriculture for the provinces of Antwerp and Limburg are detailed in section 4.2.
Water resources in the region
Surface water
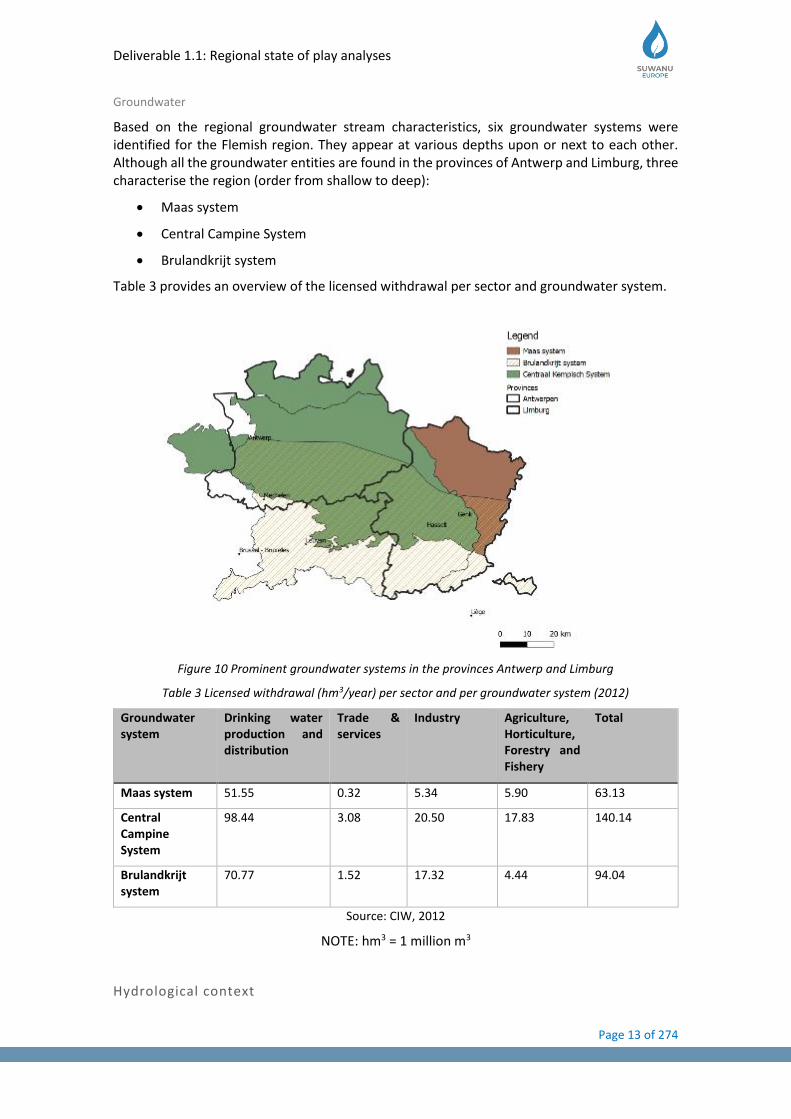
The target region lies within the (international) watersheds of the Scheldt and the Maas. It is further subdivided in the following four basins: The basin of the Maas, Nete, Demer and Benedescheldt. The flat landscape explains the moderate discharges in the watercourses and wide valleys (CIW, 2016).
Figure 9 Water basins and main watercourses
Deliverable 1.1: Regional state of play analyses
Page 13 of 274
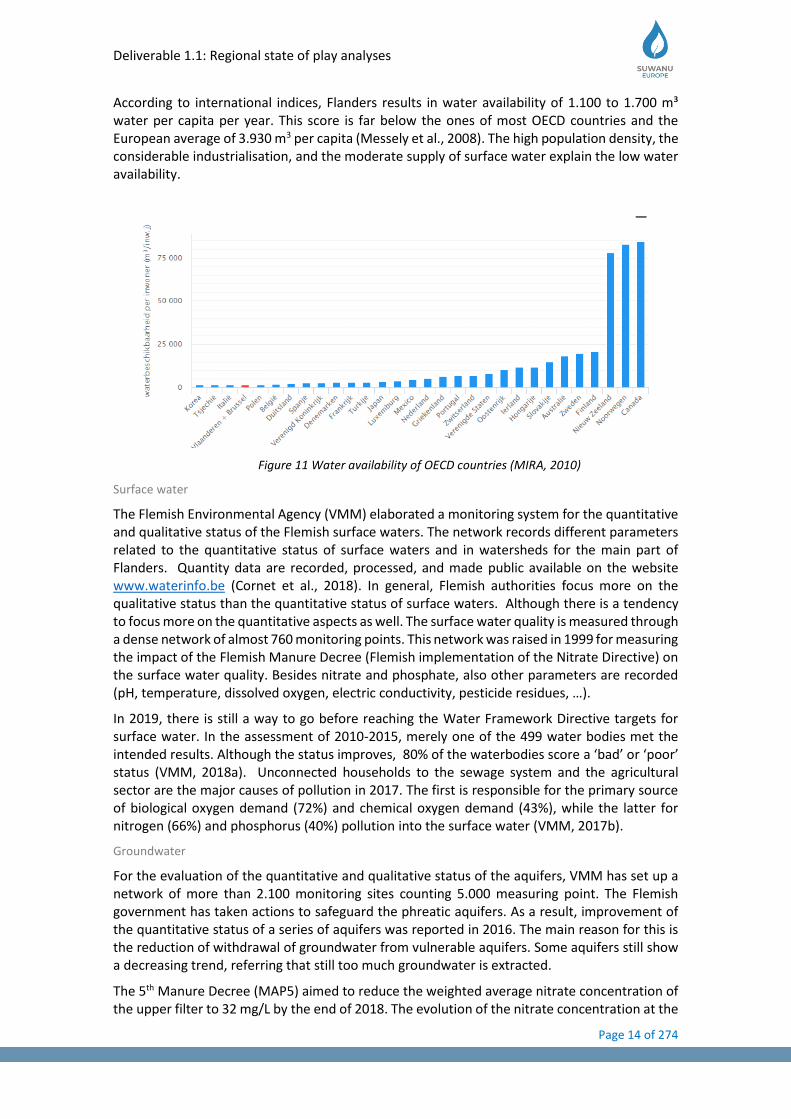
Groundwater
Based on the regional groundwater stream characteristics, six groundwater systems were identified for the Flemish region. They appear at various depths upon or next to each other. Although all the groundwater entities are found in the provinces of Antwerp and Limburg, three characterise the region (order from shallow to deep):
• Maas system
• Central Campine System
• Brulandkrijt system
Table 3 provides an overview of the licensed withdrawal per sector and groundwater system.
Figure 10 Prominent groundwater systems in the provinces Antwerp and Limburg
Table 3 Licensed withdrawal (hm3/year) per sector and per groundwater system (2012)
Groundwater system
Drinking water production and distribution
Trade & services
Industry Agriculture, Horticulture, Forestry and Fishery
Total
Maas system 51.55 0.32 5.34 5.90 63.13
Central Campine System
98.44 3.08 20.50 17.83 140.14
Brulandkrijt system
70.77 1.52 17.32 4.44 94.04
Source: CIW, 2012
NOTE: hm3 = 1 million m3
Hydrological context
Deliverable 1.1: Regional state of play analyses
Page 14 of 274
According to international indices, Flanders results in water availability of 1.100 to 1.700 m³ water per capita per year. This score is far below the ones of most OECD countries and the European average of 3.930 m3 per capita (Messely et al., 2008). The high population density, the considerable industrialisation, and the moderate supply of surface water explain the low water availability.
Figure 11 Water availability of OECD countries (MIRA, 2010)
Surface water
The Flemish Environmental Agency (VMM) elaborated a monitoring system for the quantitative and qualitative status of the Flemish surface waters. The network records different parameters related to the quantitative status of surface waters and in watersheds for the main part of Flanders. Quantity data are recorded, processed, and made public available on the website www.waterinfo.be (Cornet et al., 2018). In general, Flemish authorities focus more on the qualitative status than the quantitative status of surface waters. Although there is a tendency to focus more on the quantitative aspects as well. The surface water quality is measured through a dense network of almost 760 monitoring points. This network was raised in 1999 for measuring the impact of the Flemish Manure Decree (Flemish implementation of the Nitrate Directive) on the surface water quality. Besides nitrate and phosphate, also other parameters are recorded (pH, temperature, dissolved oxygen, electric conductivity, pesticide residues, …).
In 2019, there is still a way to go before reaching the Water Framework Directive targets for surface water. In the assessment of 2010-2015, merely one of the 499 water bodies met the intended results. Although the status improves, 80% of the waterbodies score a ‘bad’ or ‘poor’ status (VMM, 2018a). Unconnected households to the sewage system and the agricultural sector are the major causes of pollution in 2017. The first is responsible for the primary source of biological oxygen demand (72%) and chemical oxygen demand (43%), while the latter for nitrogen (66%) and phosphorus (40%) pollution into the surface water (VMM, 2017b).
Groundwater
For the evaluation of the quantitative and qualitative status of the aquifers, VMM has set up a network of more than 2.100 monitoring sites counting 5.000 measuring point. The Flemish government has taken actions to safeguard the phreatic aquifers. As a result, improvement of the quantitative status of a series of aquifers was reported in 2016. The main reason for this is the reduction of withdrawal of groundwater from vulnerable aquifers. Some aquifers still show a decreasing trend, referring that still too much groundwater is extracted.
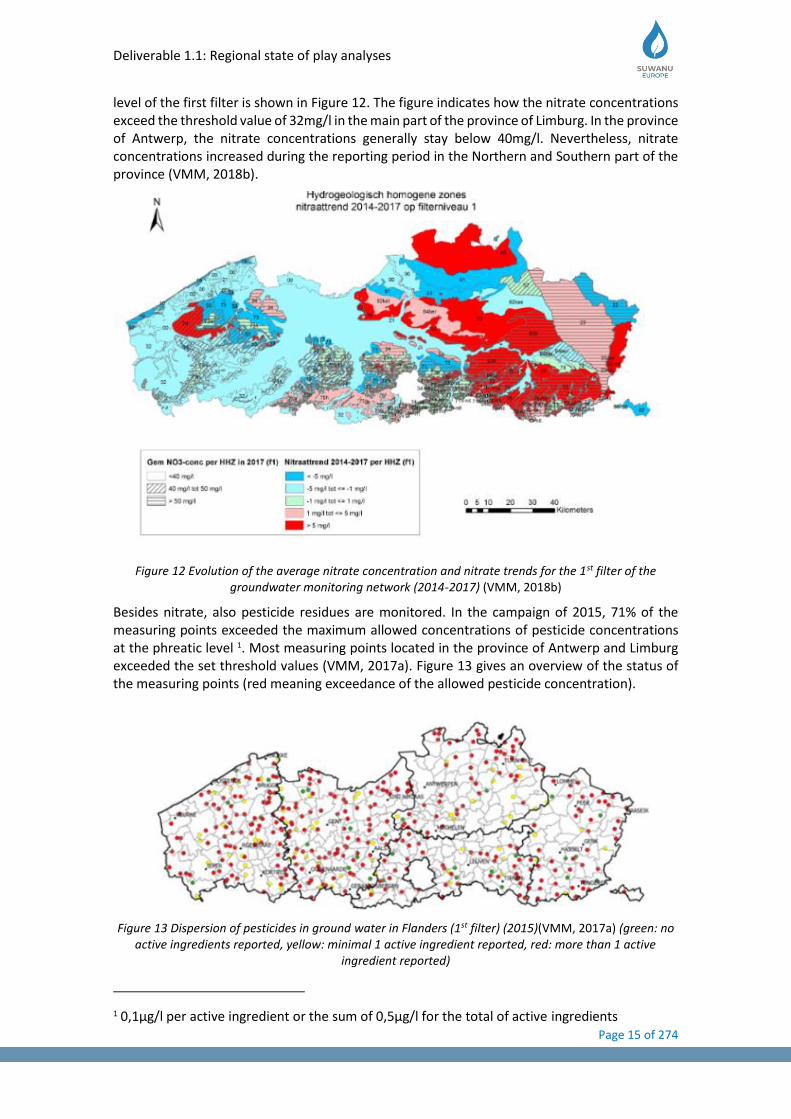
The 5th Manure Decree (MAP5) aimed to reduce the weighted average nitrate concentration of the upper filter to 32 mg/L by the end of 2018. The evolution of the nitrate concentration at the
Deliverable 1.1: Regional state of play analyses
Page 15 of 274
level of the first filter is shown in Figure 12. The figure indicates how the nitrate concentrations exceed the threshold value of 32mg/l in the main part of the province of Limburg. In the province of Antwerp, the nitrate concentrations generally stay below 40mg/l. Nevertheless, nitrate concentrations increased during the reporting period in the Northern and Southern part of the province (VMM, 2018b).
Figure 12 Evolution of the average nitrate concentration and nitrate trends for the 1st filter of the groundwater monitoring network (2014-2017) (VMM, 2018b)
Besides nitrate, also pesticide residues are monitored. In the campaign of 2015, 71% of the measuring points exceeded the maximum allowed concentrations of pesticide concentrations at the phreatic level 1. Most measuring points located in the province of Antwerp and Limburg exceeded the set threshold values (VMM, 2017a). Figure 13 gives an overview of the status of the measuring points (red meaning exceedance of the allowed pesticide concentration).
Figure 13 Dispersion of pesticides in ground water in Flanders (1st filter) (2015)(VMM, 2017a) (green: no active ingredients reported, yellow: minimal 1 active ingredient reported, red: more than 1 active
ingredient reported)
1 0,1µg/l per active ingredient or the sum of 0,5µg/l for the total of active ingredients
Deliverable 1.1: Regional state of play analyses
Page 16 of 274
1.3 Regulatory and institutional framework
1.3.1 Legal framework
Applicable regulation and summary of main provisions applicable to water reuse in agriculture
Currently, no specific regulations on water reuse in agriculture exist at European nor the Flemish level. The publication of the Joint Research Centre on “Minimum quality requirements for water reuse in agricultural irrigation and aquifer recharge” (Gawlik, 2017) sets out the basis for the European regulation. At the Flemish level, the reuse of treated wastewater for irrigation touches upon regulations controlled by various public authorities such as the VMM (Flemish Environmental Agency), OVAM ((Public Waste Agency of Flanders), BFSA (Belgian Food Safety Agency) and VLM (Flemish Land Agency). The VMM has the responsibility to develop the implementation of the European legislation in the coming years at the Flemish level. This takes place in discussion with various stakeholders such as wastewater supplier Aquafin, the Belgian Food Security Agency FAVV, farmer association Boerenbond, farmer cooperative Belorta, the Department of Agriculture and Fisheries and research institution Proefstation voor de Groenteteelt. In 2019, they developed a legal framework for the use of treated wastewater for irrigation practices (VMM, 2019b) until the European regulation enters into force.
The commitment of the European Union to promote water reuse is reflected in European policy documents such as the “Roadmap to a resource efficient Europe (2011)”, “A blueprint to safeguard water resources (2012) and "Closing the loop – An EU action plan for the circular economy". In the absence of a specific regulation, the European legislation currently encourages the use of reclaimed water through the Urban Wastewater Treatment Directive and the Water Framework Directive. However, they do not specify standards for water reuse (Bourguignon, 2018). The European regulation largely defines the environmental policy in Flanders. Flanders’ “decreet integraal waterbeleid” contains the conversion of the Water Framework Directive to the region (CIW, 2016). Furthermore, the effluent of households and industrial wastewater must comply with VLAREM norms before discharge into surface water.
Permissions/licencing and other administrative requirements
In case reclaimed water is offered for further use, the provider of the reclaimed water should request a “resources statement”. This statement offers providers and consumers legal certainty in the frame of the waste and wastewater legislation. The request must be sent to OVAM. OVAM, assisted by relevant authorities, will carry out a risk assessment. The procedure focusses on three aspects:
▪ Water quality of the reclaimed water:
• Representative and recent analyses of all parameters
• Representative analyses of the microbiological quality o Number of colonies (22°C) o E. coli (CFU/100ml).
▪ Period of use of the reclaimed water: will the reclaimed water be used for a short or prolonged period? In the case of a short period, the risk assessment will focus on food safety issues. In the case of prolonged use, also environmental factors will be evaluated during the risk assessment.
▪ Application method and location
Depending on the use of the reclaimed water, OVAM may request specific additional conditions for the implementation of the reclaimed water. These conditions may refer to quality criteria, monitoring of the quality criteria, and the use of the water (VMM, 2019b).
Deliverable 1.1: Regional state of play analyses
Page 17 of 274
1.3.2 Standards
The Belgian Food Safety Agency (BFSA) is the federal executive agency which is responsible for the assessment and the management of risks that may be harmful to the health of consumers and/or to the health of animals and plants. The G-0404 sector guide approved by the BFSA contains the legal requirements and recommendation for the primary production. As already mentioned, no regulations exist concerning the quality of irrigation water or process water intended for the primary production. Although no norms have been defined, the guide classifies “water types” according to their source of origin. Herein following is stipulated (OVPG; AGROFRONT, 2015; Wetenschappelijk comité van het Federaal Agentschap voor de Veiligheid van de Voedselketen, 2017):
“For irrigation, only surface water, water from an (un)lined water reservoir, groundwater, tap water or rainwater can be used. Irrigation is also permitted with water from:
- The washing of vegetables and fruits (except washing water of root vegetables or tubers);
- Processes making products free of contamination (water from blanching/sterilization); - Processes that take place after all processes that make the products free from
contamination (water from cooling after blanching/sterilization, water from rapid freezing);
- The cleaning of the blanching / sterilizing lines and the cleaning and thawing of the cooling lines "
The scientific committee of the BFSA elaborates in an advisory report (FAVV, 2009) that treated effluent from treatment plants might be used for irrigation purposes if it meets the recommendations for surface water. The later must comply to microbiological norms of maximum 100 CFU E. coli per ml for the cultures of grain, industrial and animal feed and maximum 10 CFU E. coli per ml for the irrigation of products eaten raw (as fruits and vegetables). Other chemical parameters to which to comply are not mentioned.
The "Globalgap certification" includes standards for irrigation water used to water vegetables destined for the fresh market. The number of faecal coliforms must be lower than 10 CFU per ml. Moreover, the water must not contain any harmful nematodes. For irrigation of industrial vegetables, it only specifies the water must not contain harmful nematodes (Departement Landbouw & Visserij, n.d.).
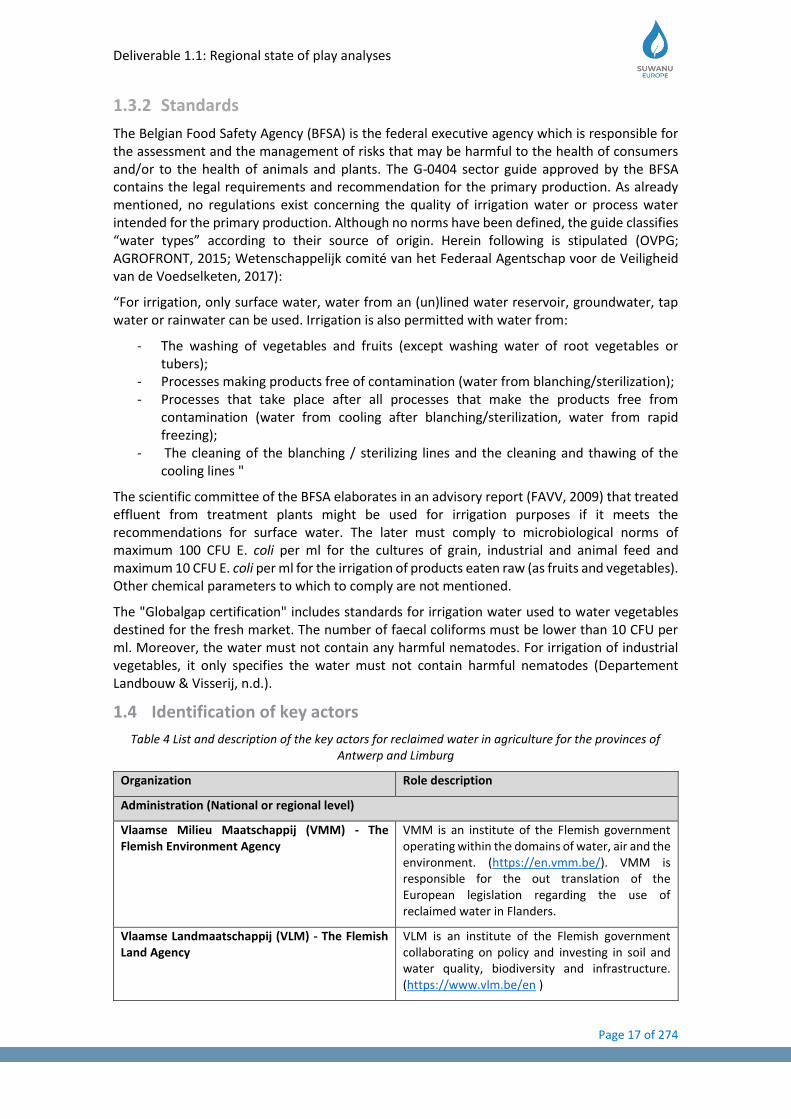
1.4 Identification of key actors
Table 4 List and description of the key actors for reclaimed water in agriculture for the provinces of Antwerp and Limburg
Organization Role description
Administration (National or regional level)
Vlaamse Milieu Maatschappij (VMM) - The Flemish Environment Agency
VMM is an institute of the Flemish government operating within the domains of water, air and the environment. (https://en.vmm.be/). VMM is responsible for the out translation of the European legislation regarding the use of reclaimed water in Flanders.
Vlaamse Landmaatschappij (VLM) - The Flemish Land Agency
VLM is an institute of the Flemish government collaborating on policy and investing in soil and water quality, biodiversity and infrastructure. (https://www.vlm.be/en )
Deliverable 1.1: Regional state of play analyses
Page 18 of 274
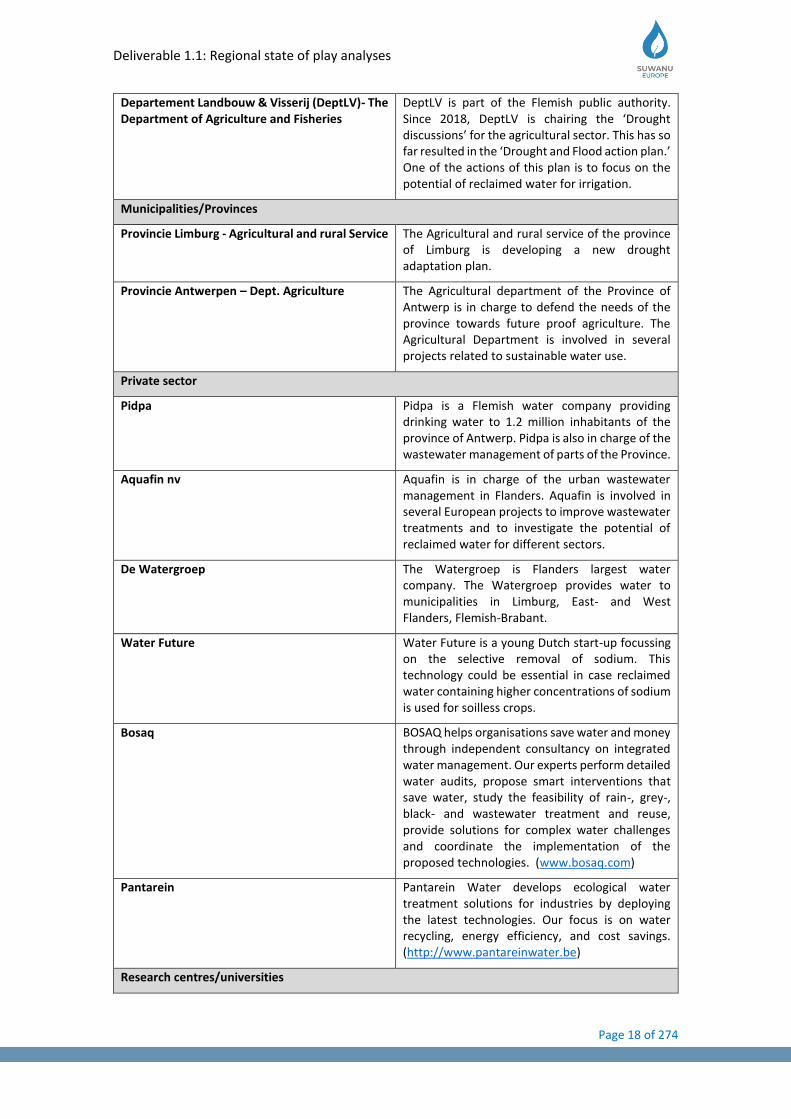
Departement Landbouw & Visserij (DeptLV)- The Department of Agriculture and Fisheries
DeptLV is part of the Flemish public authority. Since 2018, DeptLV is chairing the ‘Drought discussions’ for the agricultural sector. This has so far resulted in the ‘Drought and Flood action plan.’ One of the actions of this plan is to focus on the potential of reclaimed water for irrigation.
Municipalities/Provinces
Provincie Limburg - Agricultural and rural Service The Agricultural and rural service of the province of Limburg is developing a new drought adaptation plan.
Provincie Antwerpen – Dept. Agriculture The Agricultural department of the Province of Antwerp is in charge to defend the needs of the province towards future proof agriculture. The Agricultural Department is involved in several projects related to sustainable water use.
Private sector
Pidpa Pidpa is a Flemish water company providing drinking water to 1.2 million inhabitants of the province of Antwerp. Pidpa is also in charge of the wastewater management of parts of the Province.
Aquafin nv Aquafin is in charge of the urban wastewater management in Flanders. Aquafin is involved in several European projects to improve wastewater treatments and to investigate the potential of reclaimed water for different sectors.
De Watergroep The Watergroep is Flanders largest water company. The Watergroep provides water to municipalities in Limburg, East- and West Flanders, Flemish-Brabant.
Water Future Water Future is a young Dutch start-up focussing on the selective removal of sodium. This technology could be essential in case reclaimed water containing higher concentrations of sodium is used for soilless crops.
Bosaq BOSAQ helps organisations save water and money through independent consultancy on integrated water management. Our experts perform detailed water audits, propose smart interventions that save water, study the feasibility of rain-, grey-, black- and wastewater treatment and reuse, provide solutions for complex water challenges and coordinate the implementation of the proposed technologies. (www.bosaq.com)
Pantarein Pantarein Water develops ecological water treatment solutions for industries by deploying the latest technologies. Our focus is on water recycling, energy efficiency, and cost savings. (http://www.pantareinwater.be)
Research centres/universities
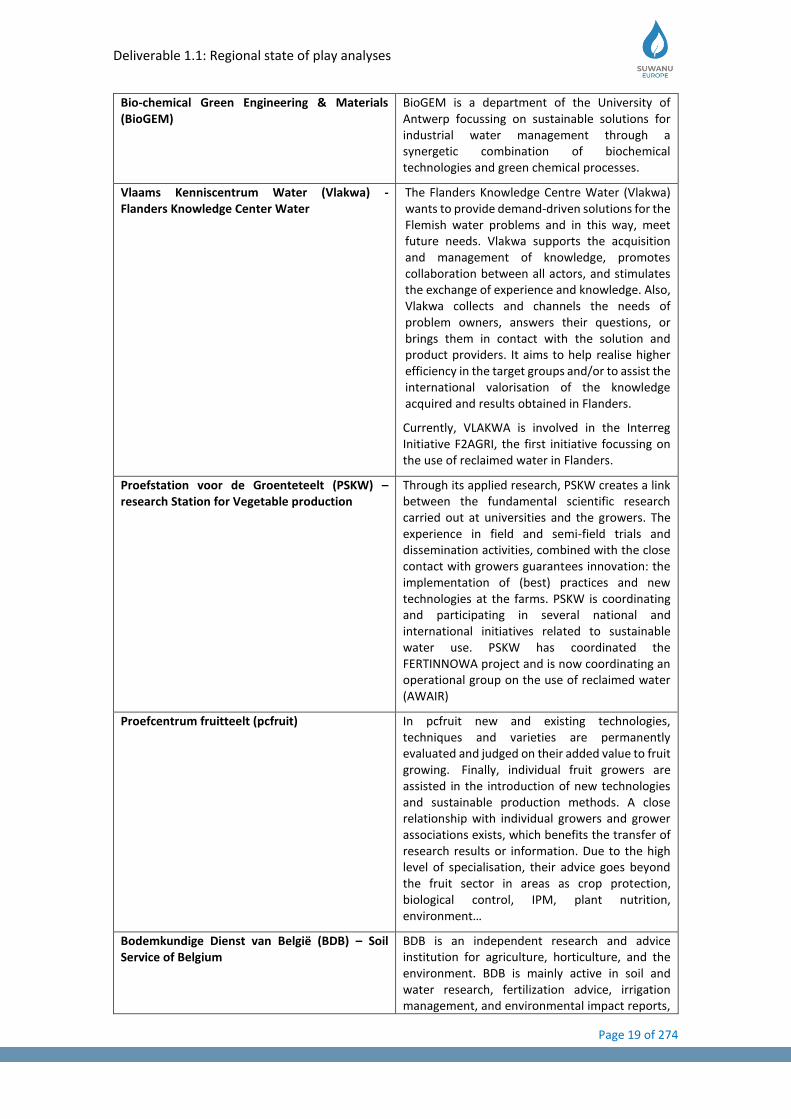
Deliverable 1.1: Regional state of play analyses
Page 19 of 274
Bio-chemical Green Engineering & Materials (BioGEM)
BioGEM is a department of the University of Antwerp focussing on sustainable solutions for industrial water management through a synergetic combination of biochemical technologies and green chemical processes.
Vlaams Kenniscentrum Water (Vlakwa) - Flanders Knowledge Center Water
The Flanders Knowledge Centre Water (Vlakwa) wants to provide demand-driven solutions for the Flemish water problems and in this way, meet future needs. Vlakwa supports the acquisition and management of knowledge, promotes collaboration between all actors, and stimulates the exchange of experience and knowledge. Also, Vlakwa collects and channels the needs of problem owners, answers their questions, or brings them in contact with the solution and product providers. It aims to help realise higher efficiency in the target groups and/or to assist the international valorisation of the knowledge acquired and results obtained in Flanders.
Currently, VLAKWA is involved in the Interreg Initiative F2AGRI, the first initiative focussing on the use of reclaimed water in Flanders.
Proefstation voor de Groenteteelt (PSKW) – research Station for Vegetable production
Through its applied research, PSKW creates a link between the fundamental scientific research carried out at universities and the growers. The experience in field and semi-field trials and dissemination activities, combined with the close contact with growers guarantees innovation: the implementation of (best) practices and new technologies at the farms. PSKW is coordinating and participating in several national and international initiatives related to sustainable water use. PSKW has coordinated the FERTINNOWA project and is now coordinating an operational group on the use of reclaimed water (AWAIR)
Proefcentrum fruitteelt (pcfruit) In pcfruit new and existing technologies, techniques and varieties are permanently evaluated and judged on their added value to fruit growing. Finally, individual fruit growers are assisted in the introduction of new technologies and sustainable production methods. A close relationship with individual growers and grower associations exists, which benefits the transfer of research results or information. Due to the high level of specialisation, their advice goes beyond the fruit sector in areas as crop protection, biological control, IPM, plant nutrition, environment…
Bodemkundige Dienst van België (BDB) – Soil Service of Belgium
BDB is an independent research and advice institution for agriculture, horticulture, and the environment. BDB is mainly active in soil and water research, fertilization advice, irrigation management, and environmental impact reports,
Deliverable 1.1: Regional state of play analyses
Page 20 of 274
and also offers numerous services for government, companies and individuals. BDB has developed a wide expertise in the field of irrigation.
Associations
BelOrta BelOrta is the largest cooperative auction for fresh fruits and vegetables in Europe. The majority of Belorta’s 1.180 growers is located in the provinces of Antwerp (469) and Limburg (358). The auction supports its growers evolving towards more sustainable water use. Assuring availability of qualitative irrigation water has become one of the focus points for BelOrta.
Boerenbond Boerenbond is a Flemish growers’ organisation focussing on i) defending the interests of the Flemish farmers, .ii) education and information, iii)….
Copa-Cogeca COPA-COGECA is the union of the two big agricultural umbrella organisations COPA and COGECA and the most influential interest group for European farmers. Founded in 1962 and headquartered in Brussels, its activity focus is on the Common Agricultural Policy and other policy areas relevant to farmers and agri-cooperatives, such as food safety, animal health, and welfare, plant health, environment, research and innovation, trade, etc. Copa-Cogeca defends the interests of the European farmers and cooperatives with regards to reclaimed water.
Deliverable 1.1: Regional state of play analyses
Page 21 of 274
1.5 Existing situation of wastewater treatment and agriculture
1.5.1 Characterization of wastewater treatment sector
Identification of wastewater treatment plants
Aquafin was founded by the Flemish Government in 1990, for the purpose of expanding, operating and pre-financing the municipal wastewater treatment infrastructure in Flanders (6,6 million inhabitants). The Flemish Environmental Holding is the sole shareholder. Aquafin collects household wastewater from the municipal sewers in collector sewers and transports it to wastewater treatment plants, where it is treated in accordance with European and Flemish standards. Currently, Aquafin is responsible for the operation of 319 wastewater treatment plants. Over a period of more than 25 years, the company evolved from a new player in the sector into a many-faceted partner for all the actors involved in the implementation of an integrated water policy in Flanders.
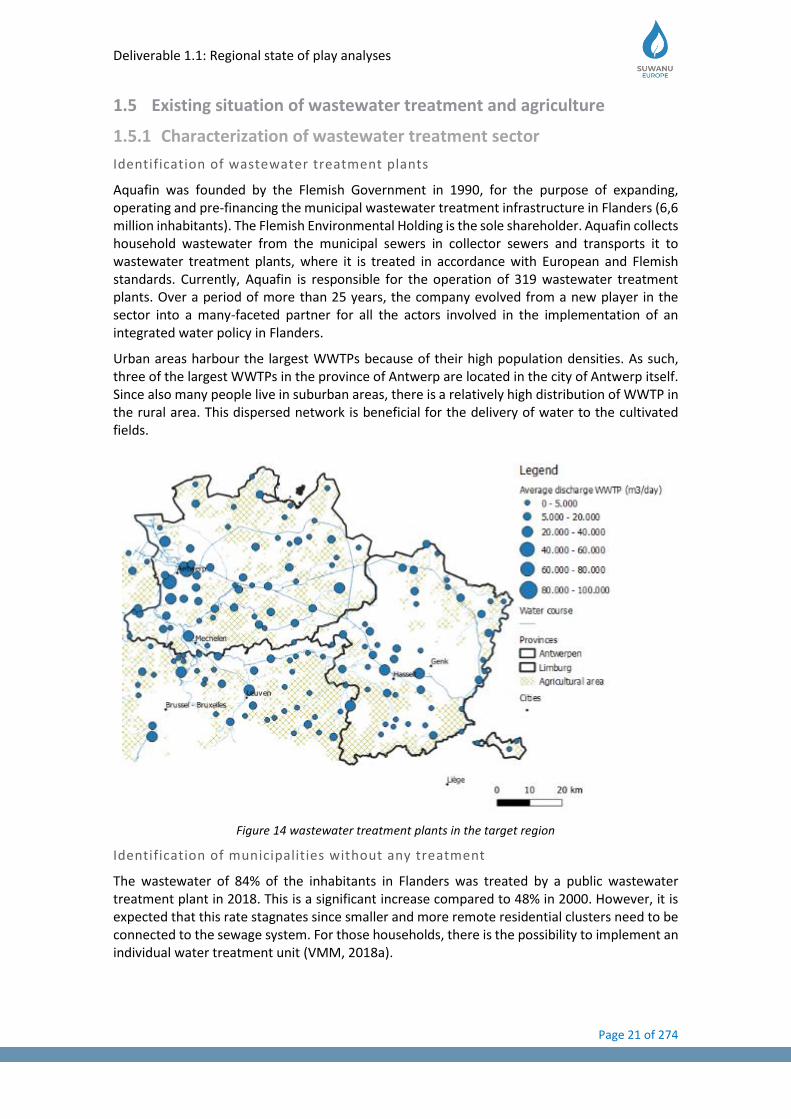
Urban areas harbour the largest WWTPs because of their high population densities. As such, three of the largest WWTPs in the province of Antwerp are located in the city of Antwerp itself. Since also many people live in suburban areas, there is a relatively high distribution of WWTP in the rural area. This dispersed network is beneficial for the delivery of water to the cultivated fields.
Figure 14 wastewater treatment plants in the target region
Identification of municipalities without any treatment
The wastewater of 84% of the inhabitants in Flanders was treated by a public wastewater treatment plant in 2018. This is a significant increase compared to 48% in 2000. However, it is expected that this rate stagnates since smaller and more remote residential clusters need to be connected to the sewage system. For those households, there is the possibility to implement an individual water treatment unit (VMM, 2018a).

Deliverable 1.1: Regional state of play analyses
Page 22 of 274
Figure 15 Degree of purification of household wastewater in Flemish municipalities
Quantification of wastewater produced, e.g., m3/year (treated and non -treated)
Wastewater from WWTPs
In 2017, Flanders counted 311 WWTPs with respectively 59 and 49 WWTPs in the province of Antwerp and Limburg. The total discharge from WWTPs for the region of Flanders represented 727 hm3 in 2018 (VMM, 2018). This figure suggests an even higher potential of reclaimed water supply than mentioned in the JRC report (Pistocchi et al., 2017). Since many sewage systems also drain rainwater, there is a yearly fluctuation explained by the precipitation. Nevertheless, an increasing trend in the annual discharged effluent can be identified thanks to an increase in the number of WWTPs and more households connecting to the sewage infrastructure.
The total discharge of the effluent for the province of Antwerp reached 208 hm3 in 2018. For the same year, the province of Limburg treated 107 hm3.
Figure 16 Evolution of annual discharge and amount of WWTPs in Flanders
Deliverable 1.1: Regional state of play analyses
Page 23 of 274
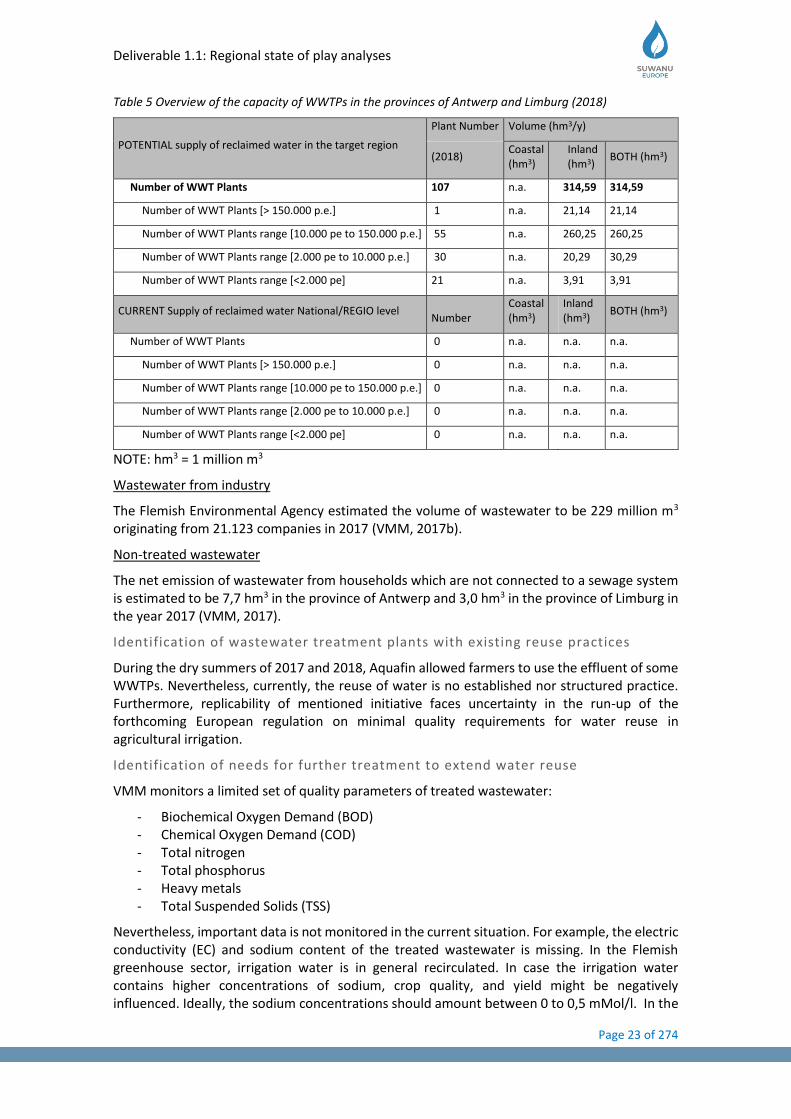
Table 5 Overview of the capacity of WWTPs in the provinces of Antwerp and Limburg (2018)
POTENTIAL supply of reclaimed water in the target region
Plant Number Volume (hm3/y)
(2018) Coastal (hm3)
Inland (hm3)
BOTH (hm3)
Number of WWT Plants 107 n.a. 314,59 314,59
Number of WWT Plants [> 150.000 p.e.] 1 n.a. 21,14 21,14
Number of WWT Plants range [10.000 pe to 150.000 p.e.] 55 n.a. 260,25 260,25
Number of WWT Plants range [2.000 pe to 10.000 p.e.] 30 n.a. 20,29 30,29
Number of WWT Plants range [<2.000 pe] 21 n.a. 3,91 3,91
CURRENT Supply of reclaimed water National/REGIO level Number
Coastal (hm3)
Inland (hm3)
BOTH (hm3)
Number of WWT Plants 0 n.a. n.a. n.a.
Number of WWT Plants [> 150.000 p.e.] 0 n.a. n.a. n.a.
Number of WWT Plants range [10.000 pe to 150.000 p.e.] 0 n.a. n.a. n.a.
Number of WWT Plants range [2.000 pe to 10.000 p.e.] 0 n.a. n.a. n.a.
Number of WWT Plants range [<2.000 pe] 0 n.a. n.a. n.a.
NOTE: hm3 = 1 million m3
Wastewater from industry
The Flemish Environmental Agency estimated the volume of wastewater to be 229 million m3 originating from 21.123 companies in 2017 (VMM, 2017b).
Non-treated wastewater
The net emission of wastewater from households which are not connected to a sewage system is estimated to be 7,7 hm3 in the province of Antwerp and 3,0 hm3 in the province of Limburg in the year 2017 (VMM, 2017).
Identification of wastewater treatment plants with existing reuse practices
During the dry summers of 2017 and 2018, Aquafin allowed farmers to use the effluent of some WWTPs. Nevertheless, currently, the reuse of water is no established nor structured practice. Furthermore, replicability of mentioned initiative faces uncertainty in the run-up of the forthcoming European regulation on minimal quality requirements for water reuse in agricultural irrigation.
Identification of needs for further treatment to extend water reuse
VMM monitors a limited set of quality parameters of treated wastewater:
- Biochemical Oxygen Demand (BOD) - Chemical Oxygen Demand (COD) - Total nitrogen - Total phosphorus - Heavy metals - Total Suspended Solids (TSS)
Nevertheless, important data is not monitored in the current situation. For example, the electric conductivity (EC) and sodium content of the treated wastewater is missing. In the Flemish greenhouse sector, irrigation water is in general recirculated. In case the irrigation water contains higher concentrations of sodium, crop quality, and yield might be negatively influenced. Ideally, the sodium concentrations should amount between 0 to 0,5 mMol/l. In the

Deliverable 1.1: Regional state of play analyses
Page 24 of 274
Netherlands, sodium concentrations of 3 to 10 times the set value were reported for reclaimed water sources (Stowa, 2001). In Flanders, concentrations of 6,4mMol/l were measured.
Furthermore, information on the microbiological load of the treated wastewater is not publicly available. Data on pesticide residues and other contaminants are equally missing.
More insights into the chemical and microbiological water quality are required in order to define the needed treatment steps to extend water reuse.
1.5.2 Characterization of the agricultural sector:
General description of the agricultural sector in the region.
Quantification of the water demand
Scientific JRC reports (Pistocchi et al., 2017; Wriedt et al., 2008) estimate the irrigation water requirements at EU level. They are useful to compare the crop water demands across the EU as shown in Figure 17, although the quantifications at country and regional level are rough.
Figure 17 Average irrigation water requirements in the EU (Pistocchi et al., 2017)
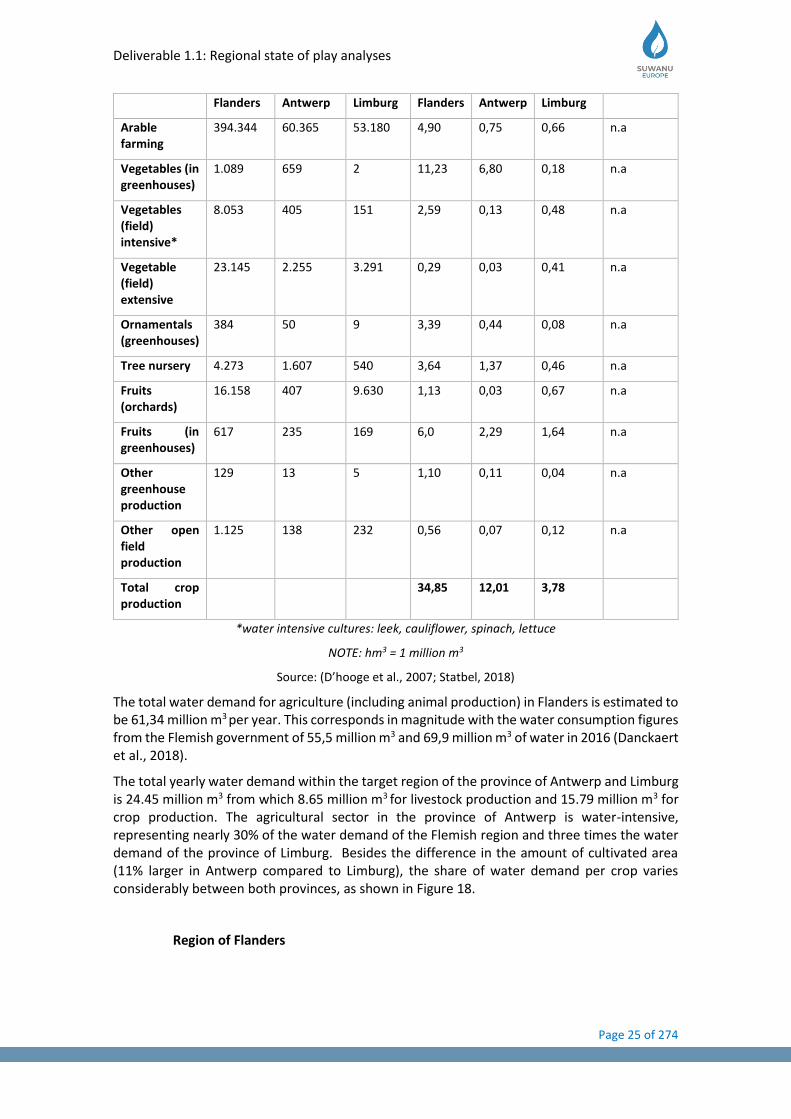
More detailed quantification of the water demand for the agriculture and horticulture sector in Flanders as well as in the target region (of Limburg and Antwerp) are shown in Table 3. The water demands have been calculated based on the crop areas of 2018 (Statbel, 2018) and multiplied by a water consumption factor per crop. The factors have been derived from a study by D’hooge et al. (2007), which defined water consumption values based on the literature and validated by experts.
Table 3 Water demand for the agricultural sector
Crop Number of hectares Water demand (hm3/year) (irrigation demand)
Reclaimed water (hm3/year)
Deliverable 1.1: Regional state of play analyses
Page 25 of 274
Flanders Antwerp Limburg Flanders Antwerp Limburg
Arable farming
394.344 60.365 53.180 4,90 0,75 0,66 n.a
Vegetables (in greenhouses)
1.089 659 2 11,23 6,80 0,18 n.a
Vegetables (field) intensive*
8.053 405 151 2,59 0,13 0,48 n.a
Vegetable (field) extensive
23.145 2.255 3.291 0,29 0,03 0,41 n.a
Ornamentals (greenhouses)
384 50 9 3,39 0,44 0,08 n.a
Tree nursery 4.273 1.607 540 3,64 1,37 0,46 n.a
Fruits (orchards)
16.158 407 9.630 1,13 0,03 0,67 n.a
Fruits (in greenhouses)
617 235 169 6,0 2,29 1,64 n.a
Other greenhouse production
129 13 5 1,10 0,11 0,04 n.a
Other open field production
1.125 138 232 0,56 0,07 0,12 n.a
Total crop production
34,85 12,01 3,78
*water intensive cultures: leek, cauliflower, spinach, lettuce
NOTE: hm3 = 1 million m3
Source: (D’hooge et al., 2007; Statbel, 2018)
The total water demand for agriculture (including animal production) in Flanders is estimated to be 61,34 million m3 per year. This corresponds in magnitude with the water consumption figures from the Flemish government of 55,5 million m3 and 69,9 million m3 of water in 2016 (Danckaert et al., 2018).
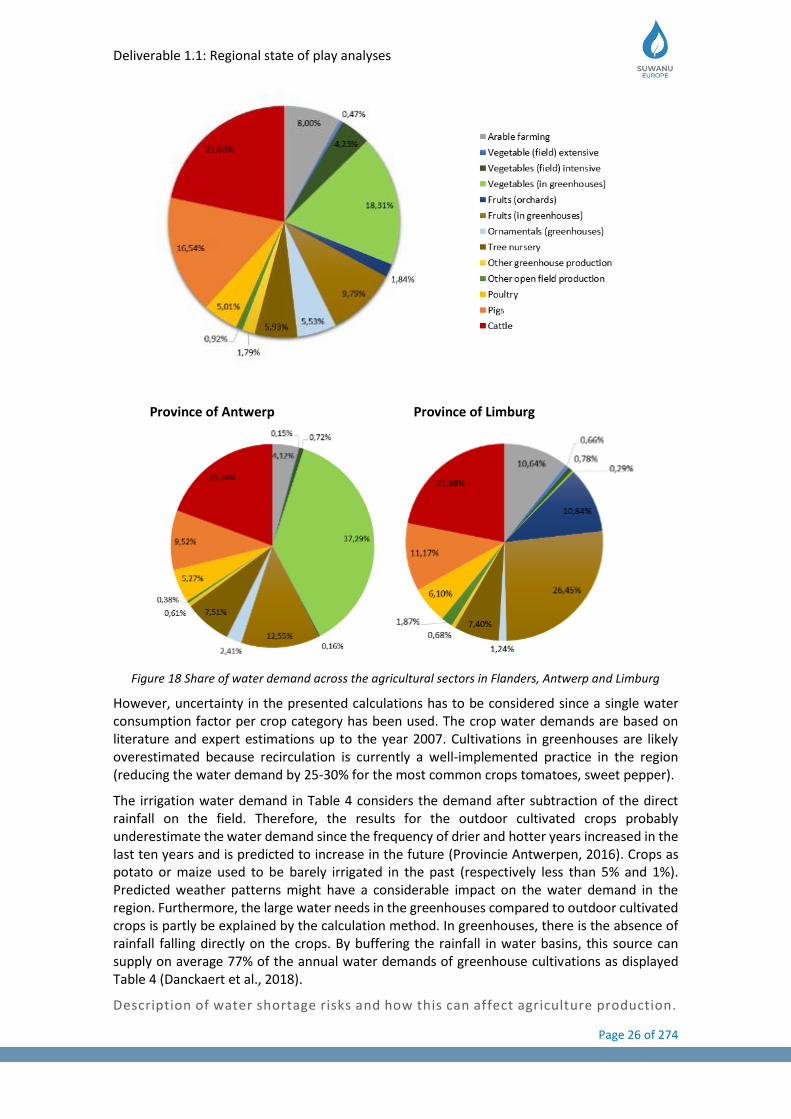
The total yearly water demand within the target region of the province of Antwerp and Limburg is 24.45 million m3 from which 8.65 million m3 for livestock production and 15.79 million m3 for crop production. The agricultural sector in the province of Antwerp is water-intensive, representing nearly 30% of the water demand of the Flemish region and three times the water demand of the province of Limburg. Besides the difference in the amount of cultivated area (11% larger in Antwerp compared to Limburg), the share of water demand per crop varies considerably between both provinces, as shown in Figure 18.
Region of Flanders
Deliverable 1.1: Regional state of play analyses
Page 26 of 274
Province of Antwerp Province of Limburg
Figure 18 Share of water demand across the agricultural sectors in Flanders, Antwerp and Limburg
However, uncertainty in the presented calculations has to be considered since a single water consumption factor per crop category has been used. The crop water demands are based on literature and expert estimations up to the year 2007. Cultivations in greenhouses are likely overestimated because recirculation is currently a well-implemented practice in the region (reducing the water demand by 25-30% for the most common crops tomatoes, sweet pepper).
The irrigation water demand in Table 4 considers the demand after subtraction of the direct rainfall on the field. Therefore, the results for the outdoor cultivated crops probably underestimate the water demand since the frequency of drier and hotter years increased in the last ten years and is predicted to increase in the future (Provincie Antwerpen, 2016). Crops as potato or maize used to be barely irrigated in the past (respectively less than 5% and 1%). Predicted weather patterns might have a considerable impact on the water demand in the region. Furthermore, the large water needs in the greenhouses compared to outdoor cultivated crops is partly be explained by the calculation method. In greenhouses, there is the absence of rainfall falling directly on the crops. By buffering the rainfall in water basins, this source can supply on average 77% of the annual water demands of greenhouse cultivations as displayed Table 4 (Danckaert et al., 2018).
Description of water shortage risks and how this can affect agriculture production.
Deliverable 1.1: Regional state of play analyses
Page 27 of 274
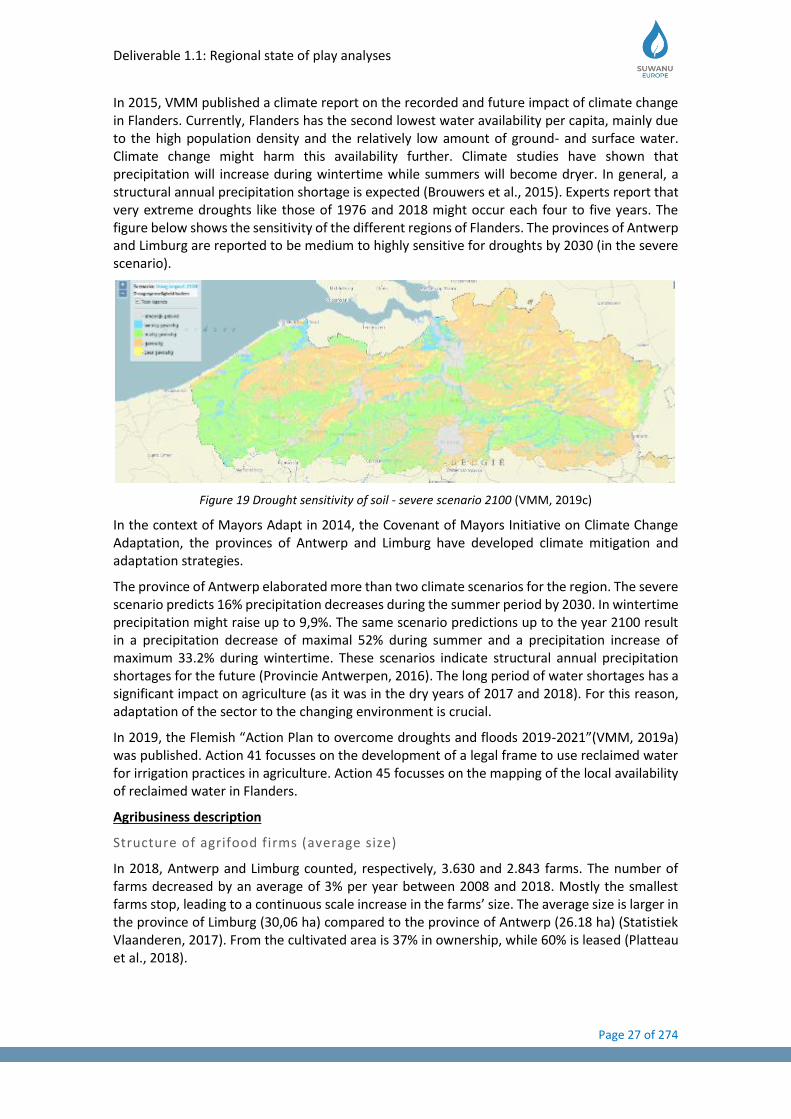
In 2015, VMM published a climate report on the recorded and future impact of climate change in Flanders. Currently, Flanders has the second lowest water availability per capita, mainly due to the high population density and the relatively low amount of ground- and surface water. Climate change might harm this availability further. Climate studies have shown that precipitation will increase during wintertime while summers will become dryer. In general, a structural annual precipitation shortage is expected (Brouwers et al., 2015). Experts report that very extreme droughts like those of 1976 and 2018 might occur each four to five years. The figure below shows the sensitivity of the different regions of Flanders. The provinces of Antwerp and Limburg are reported to be medium to highly sensitive for droughts by 2030 (in the severe scenario).
Figure 19 Drought sensitivity of soil - severe scenario 2100 (VMM, 2019c)
In the context of Mayors Adapt in 2014, the Covenant of Mayors Initiative on Climate Change Adaptation, the provinces of Antwerp and Limburg have developed climate mitigation and adaptation strategies.
The province of Antwerp elaborated more than two climate scenarios for the region. The severe scenario predicts 16% precipitation decreases during the summer period by 2030. In wintertime precipitation might raise up to 9,9%. The same scenario predictions up to the year 2100 result in a precipitation decrease of maximal 52% during summer and a precipitation increase of maximum 33.2% during wintertime. These scenarios indicate structural annual precipitation shortages for the future (Provincie Antwerpen, 2016). The long period of water shortages has a significant impact on agriculture (as it was in the dry years of 2017 and 2018). For this reason, adaptation of the sector to the changing environment is crucial.
In 2019, the Flemish “Action Plan to overcome droughts and floods 2019-2021”(VMM, 2019a) was published. Action 41 focusses on the development of a legal frame to use reclaimed water for irrigation practices in agriculture. Action 45 focusses on the mapping of the local availability of reclaimed water in Flanders.
Agribusiness description
Structure of agrifood firms (average size)
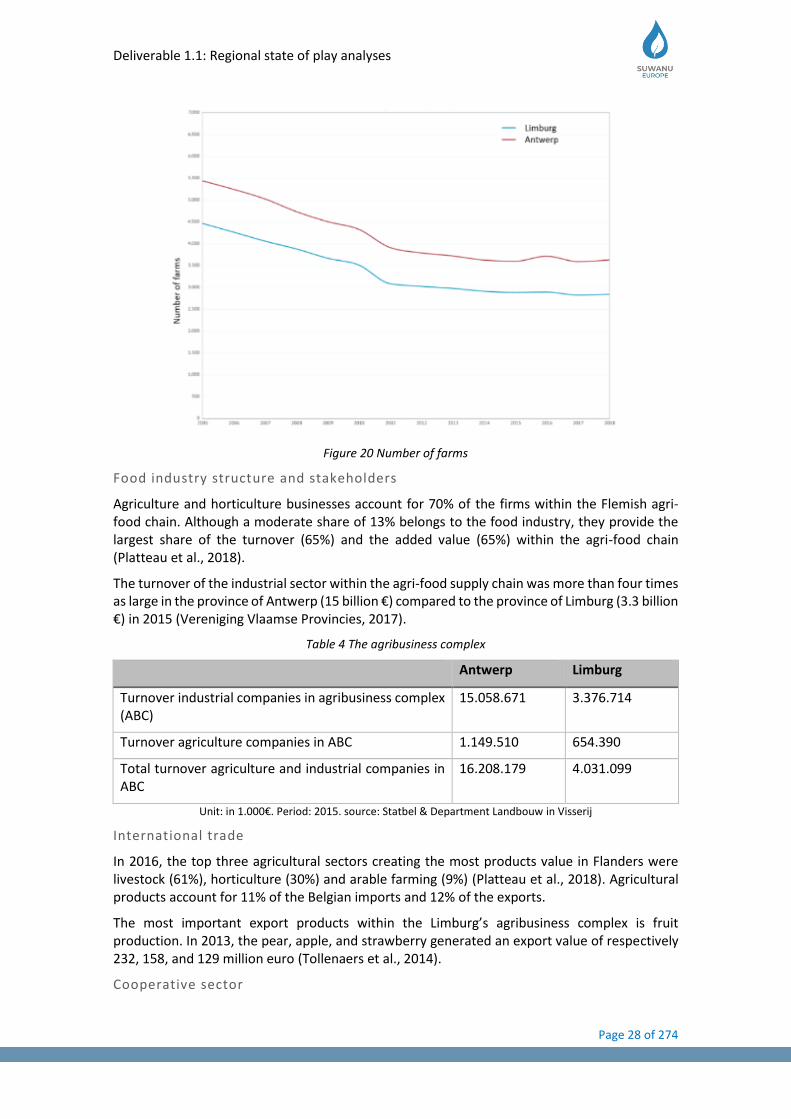
In 2018, Antwerp and Limburg counted, respectively, 3.630 and 2.843 farms. The number of farms decreased by an average of 3% per year between 2008 and 2018. Mostly the smallest farms stop, leading to a continuous scale increase in the farms’ size. The average size is larger in the province of Limburg (30,06 ha) compared to the province of Antwerp (26.18 ha) (Statistiek Vlaanderen, 2017). From the cultivated area is 37% in ownership, while 60% is leased (Platteau et al., 2018).
Deliverable 1.1: Regional state of play analyses
Page 28 of 274
Figure 20 Number of farms
Food industry structure and stakeholders
Agriculture and horticulture businesses account for 70% of the firms within the Flemish agri-food chain. Although a moderate share of 13% belongs to the food industry, they provide the largest share of the turnover (65%) and the added value (65%) within the agri-food chain (Platteau et al., 2018).
The turnover of the industrial sector within the agri-food supply chain was more than four times as large in the province of Antwerp (15 billion €) compared to the province of Limburg (3.3 billion €) in 2015 (Vereniging Vlaamse Provincies, 2017).
Table 4 The agribusiness complex
Antwerp Limburg
Turnover industrial companies in agribusiness complex (ABC)
15.058.671 3.376.714
Turnover agriculture companies in ABC 1.149.510 654.390
Total turnover agriculture and industrial companies in ABC
16.208.179 4.031.099
Unit: in 1.000€. Period: 2015. source: Statbel & Department Landbouw in Visserij
International trade
In 2016, the top three agricultural sectors creating the most products value in Flanders were livestock (61%), horticulture (30%) and arable farming (9%) (Platteau et al., 2018). Agricultural products account for 11% of the Belgian imports and 12% of the exports.
The most important export products within the Limburg’s agribusiness complex is fruit production. In 2013, the pear, apple, and strawberry generated an export value of respectively 232, 158, and 129 million euro (Tollenaers et al., 2014).
Cooperative sector
Deliverable 1.1: Regional state of play analyses
Page 29 of 274
Most of the Flemish growers are associated with cooperative auctions. In the province of Antwerp, most fruit and vegetable growers are associated with BelOrta or Cooperation Hoogstraten. BelOrta leads for among others the tomatoes, cucumbers, pears and asparagus. The cooperation of Hoogstraten represent the largest share in the strawberry market. In the province of Limburg, most fruit and vegetable growers are members of BelOrta.
Water user associations, role in water distribution and structure
No established water user association exist in Flanders.
R+D support institutions
Flanders has an excellent network of high-quality research institutions and education in all areas of agriculture. The region functions as an R&D hub in the area of plant biotechnology and has solid expertise in domains such as green biotech, the biobased economy, the food industry, and life sciences (Flanders investment & trade, 2019). The research institutions maintain good ties with the industry and throughout the food supply chain. Implementation of innovations in companies is well functioning. There is still room to improve the implementation of the research results towards applications widely adopted by the farmers (Platteau et al., 2018).
1.6 Existing related initiatives
Network/project Purpose Leader/coordinator and relevant organisations involved
AWAIR AWAIR is a Flemish operational group supporting the first initiatives for the implementation of reclaimed water in 3 horticultural clusters in the Province of Antwerp.
PSKW
F2Agri F2AGRI means ‘effluent to agriculture’ and aims to realise technical measures to enable the reuse of industrial effluent (treated wastewater) for agricultural purposes. This project will contribute to sustainable water use with concrete actions to prevent further drying out. As such, climate change is anticipated, and the agri- and horticultural sector will be resilient against future water challenges.
Vlakwa
Kruitfabriek Aquafin
1.7 Discussion and conclusion remarks
The report quantified the crop water demands for the provinces of Antwerp and Limburg at 15.8 million m3 per year based on the agricultural area of 2018. Currently, groundwater supplies between 60 and 80% of the agricultural water demand. The second most important water source for agriculture is rainwater (between 7 and 30%).
In the case climate scenarios, cultivation trends and the population growth evolve as predicted, the future crop water requirements will likely increase while the water supplies to agriculture from the classic water resources will be further restricted. These trends would imply a negative impact on the water balance in the region, leading to an increased occurrence of water shortages in the agricultural sector.
For these reasons, reclaimed water is considered to be a relevant alternative water resource for irrigation. The use of reclaimed water is considered as one of the climate adaptation strategies. The annual supplied water originating from wastewater treatment plants in the provinces of

Deliverable 1.1: Regional state of play analyses
Page 30 of 274
Antwerp and Limburg represented 314 million m3 for the year 2018. This amount constitutes an abundant potential supply of water compared to the crop water requirements.
Although the quantitative water balance considering reclaimed water is mostly positive at the regional scale, the local match between supply and demand is not straightforward. In some places, the geographical distribution of the WWTPs does not correspond with the location of the cultivated areas. The largest WWTPs are situated in urban regions, which are inherently far from the irrigated fields. Furthermore, no distribution network to the agricultural fields is available for irrigation water.
The treatment technologies to further purify the treated wastewater are available. Nevertheless, uncertainty prevails about the extent to which wastewater needs to be treated to meet adequate (legal) quality parameters. Based on the current situation, it was not possible estimating the treatment needs. From a legal aspect, EU wide standards on the minimum requirements for water reuse are currently under discussion. When the regulation would come into force and how it would be interpreted at the Flemish level are not yet defined. The proposed standards focus on microbiological parameters (such as E.coli and Legionella), Total Suspended Solids and Biological Oxygen Demand. Besides these legal requirements, specific cultivations require consideration of among others sodium, EC, pesticide residues, and micropollutants concentrations. Since public monitoring of those parameters does not take place for the treated wastewater (but mainly BOD, COD, Total N, and Total P), it is difficult to estimate how large the gap is between the current treated water and the intended water quality for irrigation.
1.8 References
Bourguignon, D. (2018). Briefing EU Legislation in Progress Setting minimum requirements overview. Retrieved from http://www.europarl.europa.eu/RegData/etudes/BRIE/2018/625171/EPRS_BRI(2018)625171_EN.pdf
Brouwers, J., Peeters, B., Van Steertegem, M., van Lipzig, N., Wouters, H., Beullens, J., … Cauwenberghs, K. (2015). MIRA Klimaatrapport 2015, over waargenomen en toekomstige klimaatveranderingen. Aalst, Belgium.
CIW. (2016). Stroomgebiedbeheerpland voor de Schelde 2016-2021. Retrieved from www.integraalwaterbeleid.be
Cornet, E., Vandenbruwaene, W., Vereecken, H., Deschamps, M., & Mostaert, F. (2018). Hydrologisch jaarboek 2017. Retrieved from https://www.waterbouwkundiglaboratorium.be/sites/default/files/atoms/files/WL2018R12_077_10.pdf
D’hooge, J., Ludwig, W., & Lauwers, H. (2007). Inschatting van het watergebruik in de landbouw op basis van nieuwe en geactualiseerde kengetallen per landbouwactiviteit.
Danckaert, S., & Lenders, S. (2018). Waterverbruik en -beschikbaarheid in landbouw en agrovoeding. Retrieved from https://lv.vlaanderen.be/sites/default/files/attachments/waterverbruik_beschikbaarheid_website.pdf
Departement Landbouw & Visserij. (n.d.). Kwaliteitseisen voor irrigatiewater. Retrieved May 21, 2019, from https://lv.vlaanderen.be/nl/voorlichting-info/publicaties/praktijkgidsen/water/duurzaam-watergebruik-de-openluchtgroenteteelt-3
Eurstat. (2018). Eurostat regional yearbook 2018. Retrieved June 17, 2019, from http://ec.europa.eu/eurostat/statistical-
Deliverable 1.1: Regional state of play analyses
Page 31 of 274
atlas/gis/viewer/?year=&chapter=06&mids=BKGCNT,C06M01&o=1,1&ch=ECF,C06¢er=50.94203,6.08175,7&
FAVV. (2009). Kwaliteit van irrigatiewater in de primaire plantaardige productie en voedselveiligheid (eigen initiatief dossier Sci Com 2008/02). Retrieved from http://www.favv-afsca.fgov.be/autocontrole-
Flanders Investment & Trade. (2015). Flanders by numbers | Invest in Flanders. Retrieved June 3, 2019, from https://www.flandersinvestmentandtrade.com/invest/en/investing-in-flanders/market-and-economy/favorable-demographics-and-macroeconomic-trends-in-flanders
Gawlik, B. M. (2017). Minimum quality requirements for water reuse in agricultural irrigation and aquifer recharge Towards a water reuse regulatory instrument at EU level. https://doi.org/10.2760/887727
KMI. (2019). Het Belgisch klimaat in grote lijnen. Retrieved May 31, 2019, from https://www.meteo.be/nl/klimaat/klimaatatlas/het-belgisch-klimaat/het-belgisch-klimaat-in-grote-lijnen
Messely, L., Lenders, S., & Carels, K. (2008). Water in de Vlaamse land- en tuinbouw: Gebruik, kostprijs en besparingstechnieken. Retrieved from https://lv.vlaanderen.be/sites/default/files/attachments/yperdi_Watergebruik in de Vlaamse land- en tuinbouw%281%29.pdf
National Committee of Geography of Belgium. (2012). A CONCISE GEOGRAPHY OF BELGIUM National Committee of Geography of Belgium IGU, 2012. Retrieved from http://www.atlas-belgique.be/cms2/uploads/oldatlas/atlas3/ACGoB.pdf
OVPG; AGROFRONT. (2015). Vegaplan Standaard Primaire Plantaardige Productie. Retrieved from www.vegaplan.be.
Pistocchi, A., Aloe, A., Dorati, C., Sanz, L. A., Bouraoui, F., Gawlik, B., … Vigiak, O. (2017). The potential of water reuse for agricultural irrigation in the EU A Hydro-Economic Analysis. https://doi.org/10.2760/263713
Platteau, J., Lambrechts, G., Roels, K., & Van Bogaert, T. (2018). Uitdagingen voor de Vlaamse land- en tuinbouw. Landbouwrapport 2018. Retrieved from https://lv.vlaanderen.be/sites/default/files/attachments/gr_201807_lara2018_webtom.pdf
Provincie Antwerpen. (2016). Provinciaal Klimaatadaptatieplan. Retrieved from https://www.provincieantwerpen.be/content/dam/provant/dlm/dmn/klimaat/ProvinciaalAdaptatiePlan.pdf
Statbel. (2018). Belgian statistical office. Retrieved June 17, 2019, from https://statbel.fgov.be/en
Statistiek Vlaanderen. (2018). Bruto binnenlands product per inwoner. Retrieved June 3, 2019, from https://www.statistiekvlaanderen.be/bruto-binnenlands-product-per-inwoner-0
Stowa. (2001). Compendium RWZI-effluent als bron voor ander water. Retrieved from https://www.stowa.nl/sites/default/files/assets/PUBLICATIES/Publicaties 2000-2010/Publicaties 2000-2004/STOWA 2001-14.pdf
Tempels, B., Bomans, K., & Verbeeck, T. (2012). Versnipperd Vlaanderen. Retrieved from https://biblio.ugent.be/publication/2103594/file/2950226.pdf
Tollenaers, W., & Van der Flaas, J. (2014). De Limburgse land-en tuinbouw in kaart. Retrieved from http://www.limburg.be/webfiles/limburg/product/landbouw_landbouwkaart2014.pdf
Deliverable 1.1: Regional state of play analyses
Page 32 of 274
Vanderhaegen, S., & Canters, F. (2016). Use of Earth observation for monitoring soil sealing trends in Flanders and Brussels between 1976 and 2013. Belgeo, (2). https://doi.org/10.4000/belgeo.18025
Vereniging Vlaamse Provincies. (2017). Agrobusinesscomplex. Retrieved from https://www.provincieantwerpen.be/content/dam/provant/dese/dienst-landbouw--en-plattelandsbeleid/landbouw_glastuinbouw/Agrobusinesscomplex-VVP.pdf
VMM. (2016). Waterverbruik — Milieurapport Vlaanderen (MIRA). Retrieved April 10, 2019, from https://www.milieurapport.be/milieuthemas/waterkwantiteit/waterverbruik-beschikbaarheid/waterverbruik
VMM. (2017a). Pesticiden in grondwater — Milieurapport Vlaanderen (MIRA). Retrieved May 31, 2019, from https://www.milieurapport.be/milieuthemas/waterkwaliteit/pesticiden/pesticiden-in-grondwater
VMM. (2017b). Waterverontreiniging in Vlaanderen in 2017. Aalst.
VMM. (2018a). Environmental Outlook 2018. Solution for a sustainable future. https://doi.org/10.1016/S0026-0576(96)94124-0
VMM. (2018b). Nitraat in grondwater in landbouwgebied — Milieurapport Vlaanderen (MIRA). Retrieved May 31, 2019, from https://www.milieurapport.be/milieuthemas/waterkwaliteit/zuurstof-nutrienten/nitraat-in-grondwater-in-landbouwgebied
VMM. (2019a). Actieplan Droogte en Wateroverlast 2019-2021.
VMM. (2019b). Gezuiverd afvalwater aanbieden? Retrieved May 31, 2019, from https://www.vmm.be/water/afvalwater/gezuiverd-afvalwater-aanbieden
VMM. (2019c). Kaarten en Cijfers - Klimaatportaal Vlaanderen. Retrieved June 10, 2019, from https://klimaat.vmm.be/nl/kaartapplicatie-thema-5
Wetenschappelijk comité van het Federaal Agentschap voor de Veiligheid van de Voedselketen. (2017). Prioritering van microbiologische risico’s en richtlijnen voor het borgen van de microbiologische voedselveiligheid van rauwe en minimaal bewerkte plantaardige levensmiddelen in België. Retrieved from http://www.afsca.be/wetenschappelijkcomite/adviezen/2017/_documents/Advies11-2017_SciCom2013-12_Groentenfruitmicrobiologie.pdf
Wriedt, G., Van Der Velde, M., Aloe, A., & Bouraoui, F. (2008). Water Requirements for Irrigation in the European Union A model based assessment of irrigation water requirements and regional water demands in Europe. https://doi.org/10.2788/88345
Deliverable 1.1: Regional state of play analyses
Page 33 of 274
2 PLOVDIV, BULGARIA
2.1 Bulgaria Executive summary
The Plovdiv district is located in the central part of South Bulgaria covering 5,977.5 km2, which is about 5.4 % of the whole country. It focuses on the main activities in the areas of economy, health, education and science, culture, transport and communications in the region. The climate is transitionally continental, while the average annual temperature is around 12 oC, which varies from 1.70 oC in January to 22.5 oC in July. There is 550-570 mm of precipitation annually with significant evapotranspiration. The deficit in the balance of atmospheric humidity for the vegetation period is about 400 mm. At the end of 2016, the population of the district was 671,573 or 9.4 % of the total population of the country. For the same year the Gross domestic product of Plovdiv district was BGN 7,546 mln, while per capita it is calculated to BGN 11,222.
The agricultural sector contributes to 6 % of the country's GVA and 18.5 % of the total employment. The highest share of irrigated land is with the farms that manage less than 2 hectares that specialize on vegetable growing and are predominantly situated in the East-Aegean region (where 40 % of Bulgaria’s farms manage 27 % of the utilizable agricultural land).
Compared to other European countries, Bulgaria has relatively significant freshwater resources and is not a water-stressed country. Yet, there are areas that experience water scarcity especially in dry summers. Thirty six percent of the surface water resources are generated in the East Aegean Basin District, where Plovdiv region is situated. The main drainage artery is the Maritsa River and its tributaries, that is the largest river on the Balkan Peninsula.
The main state-driven mechanism through which water reaches the end-users (farmers) is through the company “Irrigation systems Ltd.”, its drainage and water catchments. Generally, in the East Aegean region exists twenty-three dams that representing a total storage volume of 3,105.5 hm3. The main purpose of reservoirs is to store water for irrigation, electricity generation, drinking and industrial water supply including cooling, transport, fish farming, and recreation. The dams have an important function in river flow regulation.
The use of reclaimed water in Bulgaria is not regulated. The main legislative ordinance that regulates the irrigation sector is ordinance No. 18 for the quality of water used for irrigation. At present, 13 urban WWTPs are operating in the territory of Plovdiv district. Much of them are built with European funding. By 2023, another 16 WWTP should be built to meet the requirements of the UWWTD for wastewater treatment of the settlements. Total reclaimed water produced by wastewater treatment facilities is 49.06 hm3 of which about 2.4 hm3 is the recorded use of reclaimed water for irrigation in agriculture. This volume is mainly represented by the “Blue river” dam where discharging the WWTP of the town of Hisarya. In addition, private initiatives for use of reclaimed water for irrigation do in fact exist and are applied to their own lands and plants (poplars, roses, lavender, etc.).
2.2 Socio-economic characterization of the region
Bulgaria is divided into 6 planning regions (NUTS 2), 28 administrative regions (NUTS 3) and 264 municipalities (LAU 1). The agricultural sector is the main sectors in the country, where around 73 % of the total arable land is privately owned, 22 % is owned by municipalities and 5 % is state property (RDP, 2007). Plovdiv administrative region is chosen from South-Central planning region as a study region. The study region has a well-developed and constantly improving infrastructure: highways, railway stations and international airport.
Plovdiv region is characterized with very well-established irrigation system, but old and plundered infrastructure. The natural conditions (soil quality, weather, access to water resources, etc.) are very good for the cultivation of a wide variety of crops, orchards, vineyards and vegetables. Large percentage of farmland in the study region has ecologically clean and
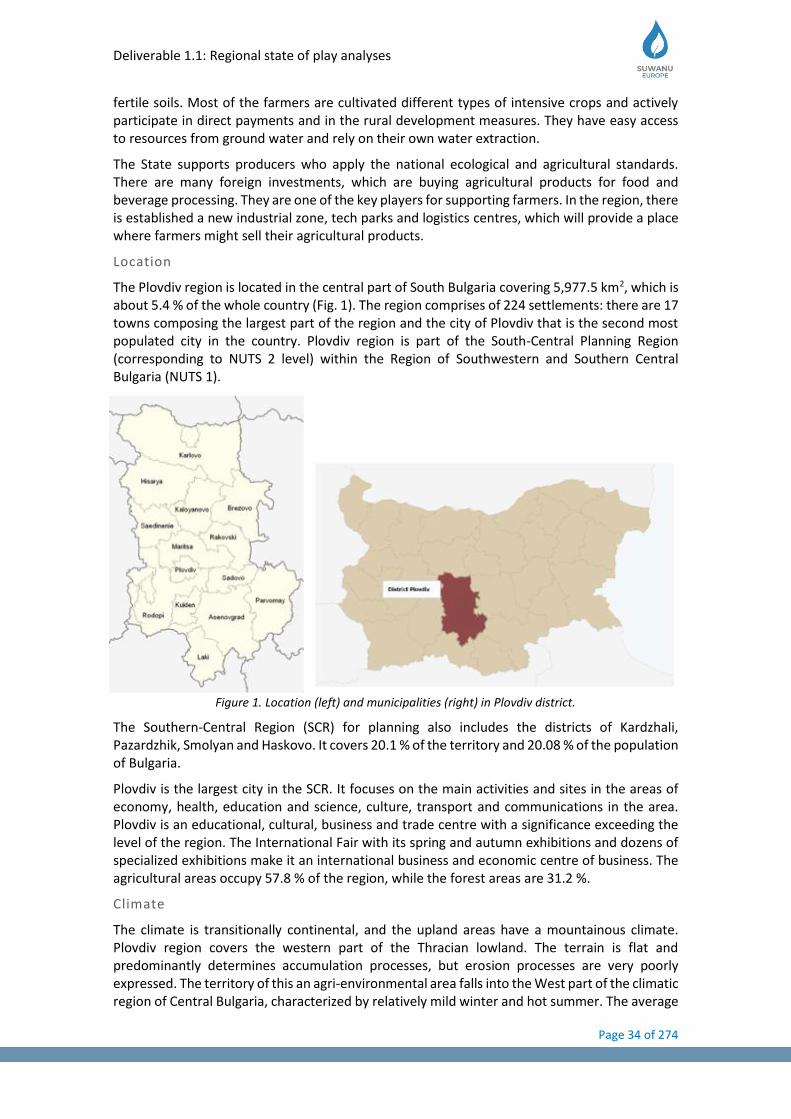
Deliverable 1.1: Regional state of play analyses
Page 34 of 274
fertile soils. Most of the farmers are cultivated different types of intensive crops and actively participate in direct payments and in the rural development measures. They have easy access to resources from ground water and rely on their own water extraction.
The State supports producers who apply the national ecological and agricultural standards. There are many foreign investments, which are buying agricultural products for food and beverage processing. They are one of the key players for supporting farmers. In the region, there is established a new industrial zone, tech parks and logistics centres, which will provide a place where farmers might sell their agricultural products.
Location
The Plovdiv region is located in the central part of South Bulgaria covering 5,977.5 km2, which is about 5.4 % of the whole country (Fig. 1). The region comprises of 224 settlements: there are 17 towns composing the largest part of the region and the city of Plovdiv that is the second most populated city in the country. Plovdiv region is part of the South-Central Planning Region (corresponding to NUTS 2 level) within the Region of Southwestern and Southern Central Bulgaria (NUTS 1).
Figure 1. Location (left) and municipalities (right) in Plovdiv district.
The Southern-Central Region (SCR) for planning also includes the districts of Kardzhali, Pazardzhik, Smolyan and Haskovo. It covers 20.1 % of the territory and 20.08 % of the population of Bulgaria.
Plovdiv is the largest city in the SCR. It focuses on the main activities and sites in the areas of economy, health, education and science, culture, transport and communications in the area. Plovdiv is an educational, cultural, business and trade centre with a significance exceeding the level of the region. The International Fair with its spring and autumn exhibitions and dozens of specialized exhibitions make it an international business and economic centre of business. The agricultural areas occupy 57.8 % of the region, while the forest areas are 31.2 %.
Climate
The climate is transitionally continental, and the upland areas have a mountainous climate. Plovdiv region covers the western part of the Thracian lowland. The terrain is flat and predominantly determines accumulation processes, but erosion processes are very poorly expressed. The territory of this an agri-environmental area falls into the West part of the climatic region of Central Bulgaria, characterized by relatively mild winter and hot summer. The average
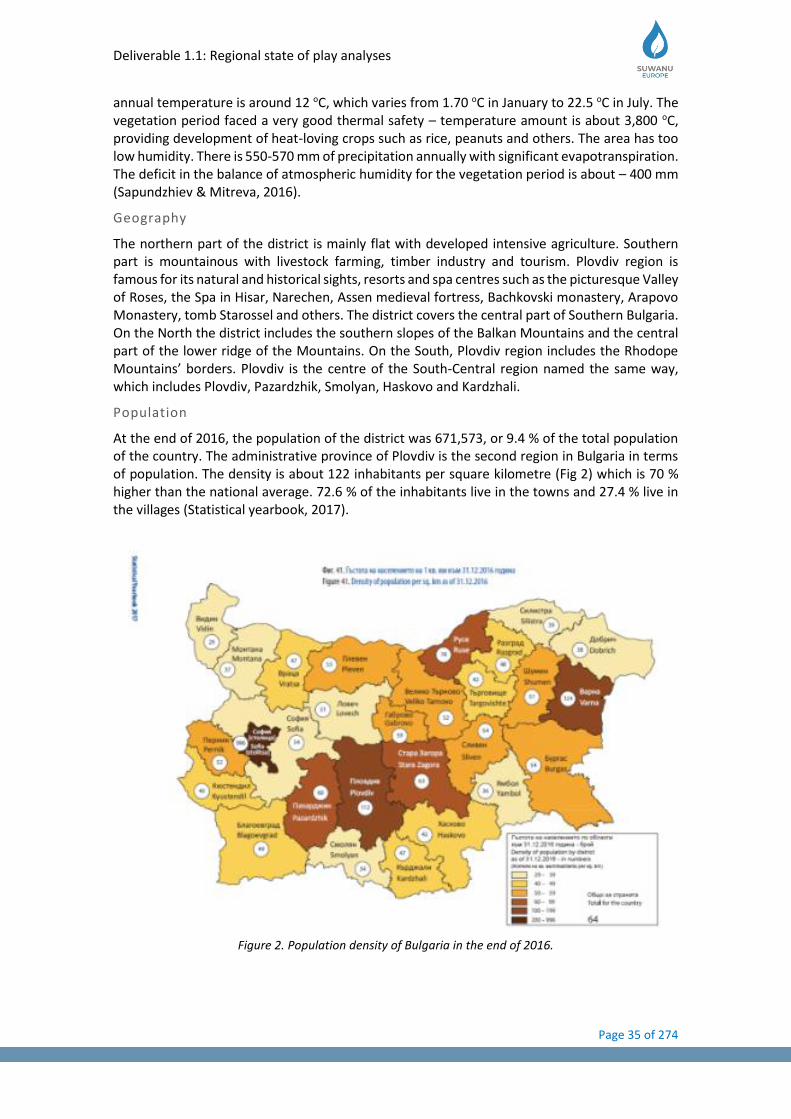
Deliverable 1.1: Regional state of play analyses
Page 35 of 274
annual temperature is around 12 oC, which varies from 1.70 oC in January to 22.5 oC in July. The vegetation period faced a very good thermal safety – temperature amount is about 3,800 oC, providing development of heat-loving crops such as rice, peanuts and others. The area has too low humidity. There is 550-570 mm of precipitation annually with significant evapotranspiration. The deficit in the balance of atmospheric humidity for the vegetation period is about – 400 mm (Sapundzhiev & Mitreva, 2016).
Geography
The northern part of the district is mainly flat with developed intensive agriculture. Southern part is mountainous with livestock farming, timber industry and tourism. Plovdiv region is famous for its natural and historical sights, resorts and spa centres such as the picturesque Valley of Roses, the Spa in Hisar, Narechen, Assen medieval fortress, Bachkovski monastery, Arapovo Monastery, tomb Starossel and others. The district covers the central part of Southern Bulgaria. On the North the district includes the southern slopes of the Balkan Mountains and the central part of the lower ridge of the Mountains. On the South, Plovdiv region includes the Rhodope Mountains’ borders. Plovdiv is the centre of the South-Central region named the same way, which includes Plovdiv, Pazardzhik, Smolyan, Haskovo and Kardzhali.
Population
At the end of 2016, the population of the district was 671,573, or 9.4 % of the total population of the country. The administrative province of Plovdiv is the second region in Bulgaria in terms of population. The density is about 122 inhabitants per square kilometre (Fig 2) which is 70 % higher than the national average. 72.6 % of the inhabitants live in the towns and 27.4 % live in the villages (Statistical yearbook, 2017).
Figure 2. Population density of Bulgaria in the end of 2016.

Deliverable 1.1: Regional state of play analyses
Page 36 of 274
Economic data
The Gross domestic product of Plovdiv district in 2016 was 7,546 mln. BGN (Table 1), while per capita it is calculated to 11,222 BGN (Statistical yearbook, 2017).
Table 1. Gross value added at current prices – 2016 by economic sectors (Million BGN)
Sector Agriculture and forestry
Industry Services Gross value added
GVA 259 2,112 3,540 6,511
Urban structure
The biggest city of the region is Plovdiv. It is characterized by high- and middle-high buildings. Some neighbourhoods are of a rural type – family houses with a yard. There are many parks, as well as the pearls of the town – the hills that attract a lot of people with their vegetation, atmosphere and protected flora and fauna. Other towns with important population density in the region are Assenovgrad and Karlovo. The structure is similar to the Plovdiv’, but the buildings are of medium and size. On the other hand, the rural settlements are characterized by existence of family houses.
Agriculture
The agricultural sector contributes to 6 % of the country's GVA and 18.5 % of the total employment. Certain traditional agricultural sectors (such as fruit growing and vegetables, and livestock) are underperforming and experiencing structural difficulties (Fig. 3). In addition to the need for technological modernization, there is a necessity to promote short supply chains, restructuring of small farms, and generation renewal in agriculture in order to ensure stronger productivity growth and the creation of new jobs.
In terms of the expected changes in rainfall patterns, a reduction in precipitation is likely, leading to a significant reduction of the total water reserves in the country. In this regard, projections suggest a decrease in precipitation by approximately 10 percent by 2020, 15 percent by 2050, and up to 30–40 percent by 2080 (Fig. 4).
Figure 3. Structure of Bulgarian agriculture in last years.
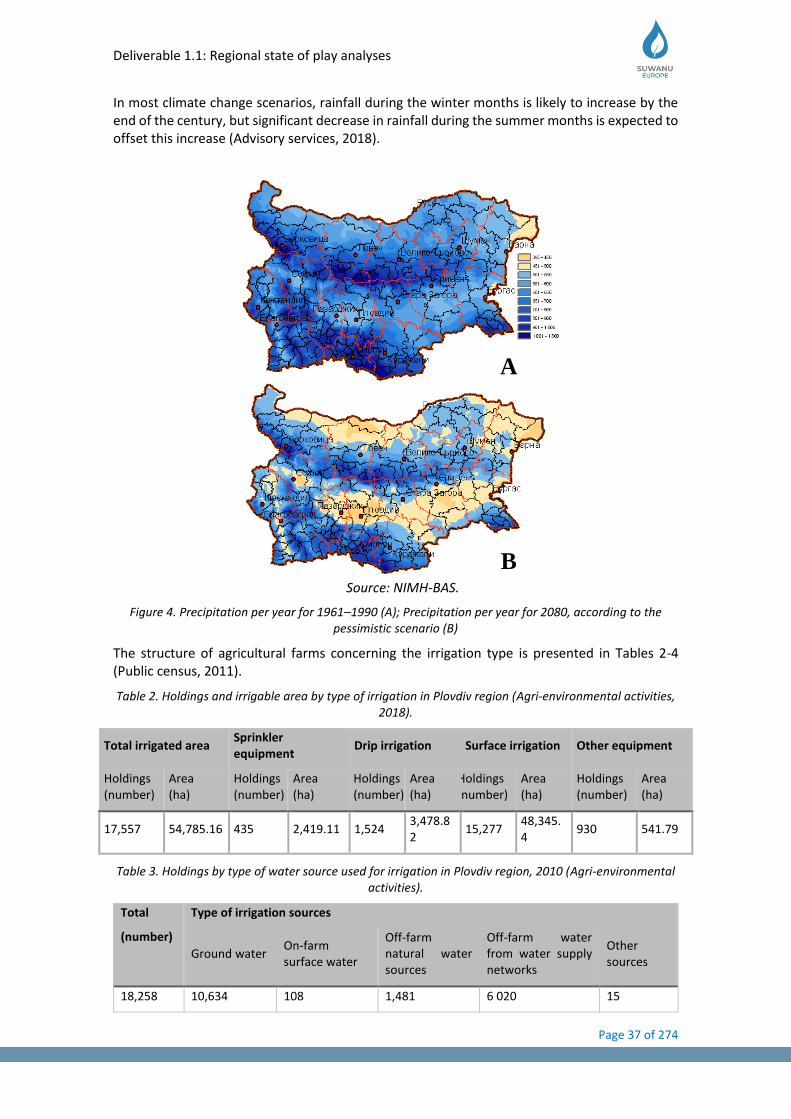
Deliverable 1.1: Regional state of play analyses
Page 37 of 274
In most climate change scenarios, rainfall during the winter months is likely to increase by the end of the century, but significant decrease in rainfall during the summer months is expected to offset this increase (Advisory services, 2018).
Figure 4. Precipitation per year for 1961–1990 (A); Precipitation per year for 2080, according to the pessimistic scenario (B)
The structure of agricultural farms concerning the irrigation type is presented in Tables 2-4 (Public census, 2011).
Table 2. Holdings and irrigable area by type of irrigation in Plovdiv region (Agri-environmental activities, 2018).
Total irrigated area Sprinkler equipment
Drip irrigation Surface irrigation Other equipment
Holdings (number)
Area (ha)
Holdings (number)
Area (ha)
Holdings (number)
Area (ha)
Holdings (number)
Area (ha)
Holdings (number)
Area (ha)
17,557 54,785.16 435 2,419.11 1,524 3,478.82
15,277 48,345.4
930 541.79
Table 3. Holdings by type of water source used for irrigation in Plovdiv region, 2010 (Agri-environmental activities).
Total
(number)
Type of irrigation sources
Ground water On-farm surface water
Off-farm natural water sources
Off-farm water from water supply networks
Other sources
18,258 10,634 108 1,481 6 020 15
B
A
Source: NIMH-BAS.
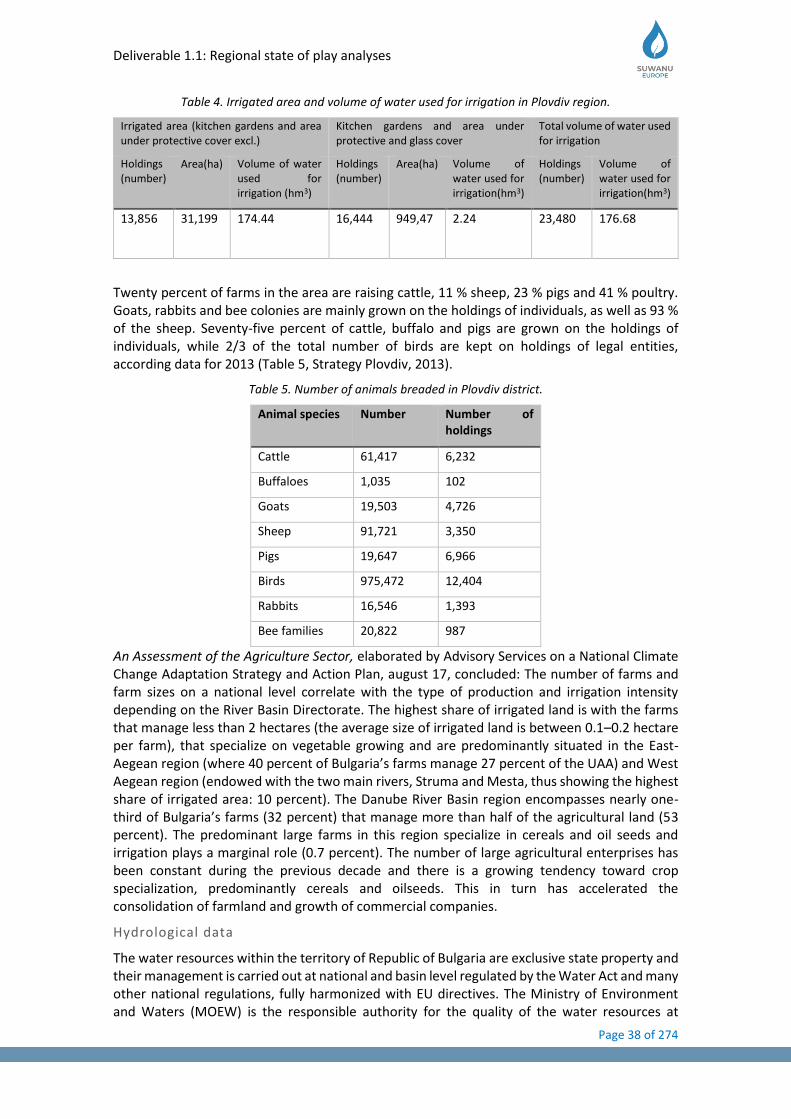
Deliverable 1.1: Regional state of play analyses
Page 38 of 274
Table 4. Irrigated area and volume of water used for irrigation in Plovdiv region.
Irrigated area (kitchen gardens and area under protective cover excl.)
Kitchen gardens and area under protective and glass cover
Total volume of water used for irrigation
Holdings (number)
Area(ha) Volume of water used for irrigation (hm3)
Holdings (number)
Area(ha) Volume of water used for irrigation(hm3)
Holdings (number)
Volume of water used for irrigation(hm3)
13,856 31,199 174.44 16,444 949,47 2.24 23,480 176.68
Twenty percent of farms in the area are raising cattle, 11 % sheep, 23 % pigs and 41 % poultry. Goats, rabbits and bee colonies are mainly grown on the holdings of individuals, as well as 93 % of the sheep. Seventy-five percent of cattle, buffalo and pigs are grown on the holdings of individuals, while 2/3 of the total number of birds are kept on holdings of legal entities, according data for 2013 (Table 5, Strategy Plovdiv, 2013).
Table 5. Number of animals breaded in Plovdiv district.
Animal species Number Number of holdings
Cattle 61,417 6,232
Buffaloes 1,035 102
Goats 19,503 4,726
Sheep 91,721 3,350
Pigs 19,647 6,966
Birds 975,472 12,404
Rabbits 16,546 1,393
Bee families 20,822 987
An Assessment of the Agriculture Sector, elaborated by Advisory Services on a National Climate Change Adaptation Strategy and Action Plan, august 17, concluded: The number of farms and farm sizes on a national level correlate with the type of production and irrigation intensity depending on the River Basin Directorate. The highest share of irrigated land is with the farms that manage less than 2 hectares (the average size of irrigated land is between 0.1–0.2 hectare per farm), that specialize on vegetable growing and are predominantly situated in the East-Aegean region (where 40 percent of Bulgaria’s farms manage 27 percent of the UAA) and West Aegean region (endowed with the two main rivers, Struma and Mesta, thus showing the highest share of irrigated area: 10 percent). The Danube River Basin region encompasses nearly one-third of Bulgaria’s farms (32 percent) that manage more than half of the agricultural land (53 percent). The predominant large farms in this region specialize in cereals and oil seeds and irrigation plays a marginal role (0.7 percent). The number of large agricultural enterprises has been constant during the previous decade and there is a growing tendency toward crop specialization, predominantly cereals and oilseeds. This in turn has accelerated the consolidation of farmland and growth of commercial companies.
Hydrological data
The water resources within the territory of Republic of Bulgaria are exclusive state property and their management is carried out at national and basin level regulated by the Water Act and many other national regulations, fully harmonized with EU directives. The Ministry of Environment and Waters (MOEW) is the responsible authority for the quality of the water resources at
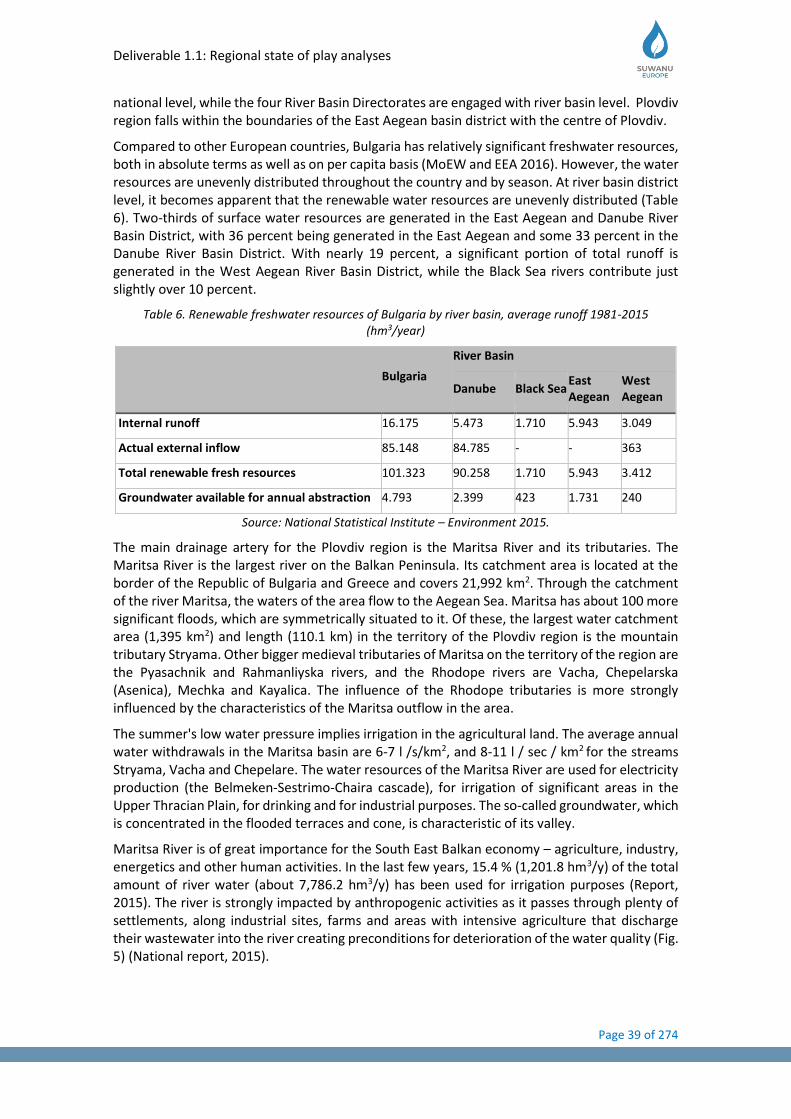
Deliverable 1.1: Regional state of play analyses
Page 39 of 274
national level, while the four River Basin Directorates are engaged with river basin level. Plovdiv region falls within the boundaries of the East Aegean basin district with the centre of Plovdiv.
Compared to other European countries, Bulgaria has relatively significant freshwater resources, both in absolute terms as well as on per capita basis (MoEW and EEA 2016). However, the water resources are unevenly distributed throughout the country and by season. At river basin district level, it becomes apparent that the renewable water resources are unevenly distributed (Table 6). Two-thirds of surface water resources are generated in the East Aegean and Danube River Basin District, with 36 percent being generated in the East Aegean and some 33 percent in the Danube River Basin District. With nearly 19 percent, a significant portion of total runoff is generated in the West Aegean River Basin District, while the Black Sea rivers contribute just slightly over 10 percent.
Table 6. Renewable freshwater resources of Bulgaria by river basin, average runoff 1981-2015 (hm3/year)
Bulgaria
River Basin
Danube Black Sea East Aegean
West Aegean
Internal runoff 16.175 5.473 1.710 5.943 3.049
Actual external inflow 85.148 84.785 - - 363
Total renewable fresh resources 101.323 90.258 1.710 5.943 3.412
Groundwater available for annual abstraction 4.793 2.399 423 1.731 240
Source: National Statistical Institute – Environment 2015.
The main drainage artery for the Plovdiv region is the Maritsa River and its tributaries. The Maritsa River is the largest river on the Balkan Peninsula. Its catchment area is located at the border of the Republic of Bulgaria and Greece and covers 21,992 km2. Through the catchment of the river Maritsa, the waters of the area flow to the Aegean Sea. Maritsa has about 100 more significant floods, which are symmetrically situated to it. Of these, the largest water catchment area (1,395 km2) and length (110.1 km) in the territory of the Plovdiv region is the mountain tributary Stryama. Other bigger medieval tributaries of Maritsa on the territory of the region are the Pyasachnik and Rahmanliyska rivers, and the Rhodope rivers are Vacha, Chepelarska (Asenica), Mechka and Kayalica. The influence of the Rhodope tributaries is more strongly influenced by the characteristics of the Maritsa outflow in the area.
The summer's low water pressure implies irrigation in the agricultural land. The average annual water withdrawals in the Maritsa basin are 6-7 l /s/km2, and 8-11 l / sec / km2 for the streams Stryama, Vacha and Chepelare. The water resources of the Maritsa River are used for electricity production (the Belmeken-Sestrimo-Chaira cascade), for irrigation of significant areas in the Upper Thracian Plain, for drinking and for industrial purposes. The so-called groundwater, which is concentrated in the flooded terraces and cone, is characteristic of its valley.
Maritsa River is of great importance for the South East Balkan economy – agriculture, industry, energetics and other human activities. In the last few years, 15.4 % (1,201.8 hm3/y) of the total amount of river water (about 7,786.2 hm3/y) has been used for irrigation purposes (Report, 2015). The river is strongly impacted by anthropogenic activities as it passes through plenty of settlements, along industrial sites, farms and areas with intensive agriculture that discharge their wastewater into the river creating preconditions for deterioration of the water quality (Fig. 5) (National report, 2015).
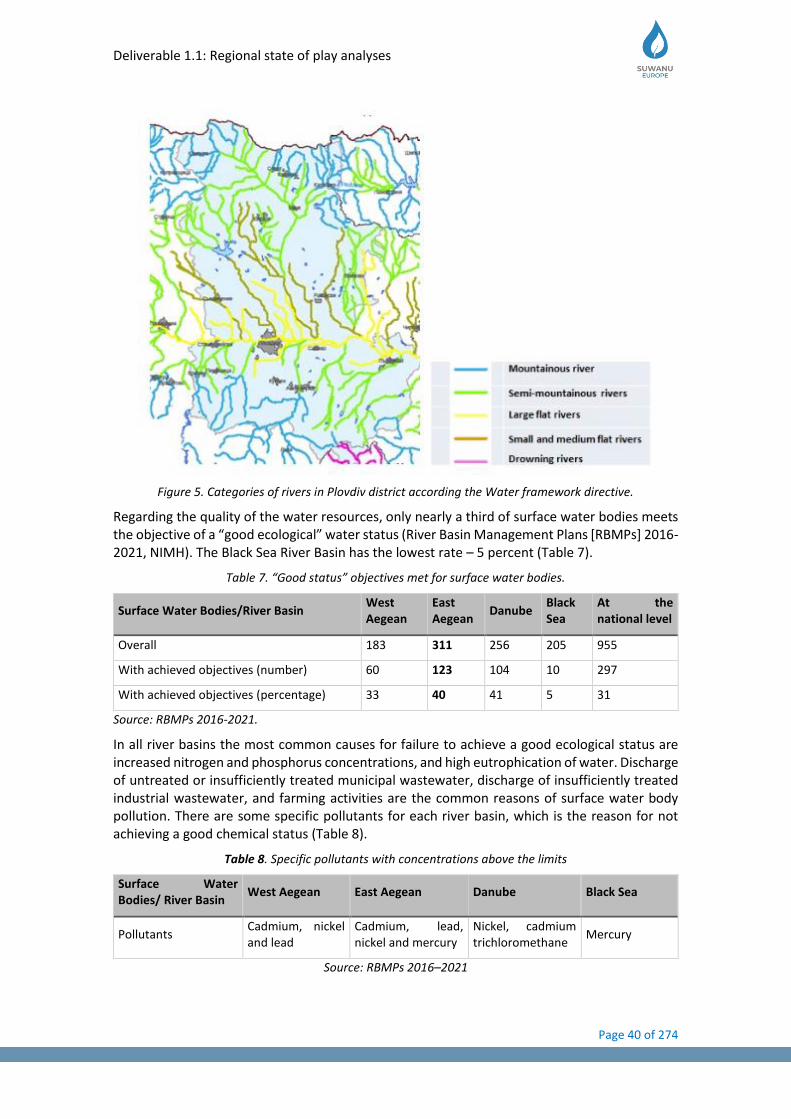
Deliverable 1.1: Regional state of play analyses
Page 40 of 274
Figure 5. Categories of rivers in Plovdiv district according the Water framework directive.
Regarding the quality of the water resources, only nearly a third of surface water bodies meets the objective of a “good ecological” water status (River Basin Management Plans [RBMPs] 2016-2021, NIMH). The Black Sea River Basin has the lowest rate – 5 percent (Table 7).
Table 7. “Good status” objectives met for surface water bodies.
Surface Water Bodies/River Basin West Aegean
East Aegean
Danube Black Sea
At the national level
Overall 183 311 256 205 955
With achieved objectives (number) 60 123 104 10 297
With achieved objectives (percentage) 33 40 41 5 31
Source: RBMPs 2016-2021.
In all river basins the most common causes for failure to achieve a good ecological status are increased nitrogen and phosphorus concentrations, and high eutrophication of water. Discharge of untreated or insufficiently treated municipal wastewater, discharge of insufficiently treated industrial wastewater, and farming activities are the common reasons of surface water body pollution. There are some specific pollutants for each river basin, which is the reason for not achieving a good chemical status (Table 8).
Table 8. Specific pollutants with concentrations above the limits
Surface Water Bodies/ River Basin
West Aegean East Aegean Danube Black Sea
Pollutants Cadmium, nickel and lead
Cadmium, lead, nickel and mercury
Nickel, cadmium trichloromethane
Mercury
Source: RBMPs 2016–2021

Deliverable 1.1: Regional state of play analyses
Page 41 of 274
Figure 6. Categories of lakes (dams) in Plovdiv district according to the Water framework directive.
Groundwater bodies have a better quality regarding good status objectives. At the national level 63 percent (106 over 169) meet the objective of ‘good status’ (described in Article 4 of the WFD and in Section 5 of the RBMPs). In the East Aegean River Basin, 18 groundwater bodies were classified as having poor chemical status due to higher concentrations of the following indicators: nitrates, ammonium ions, chlorides, sulphates, manganese, iron, calcium, sodium, magnesium, water hardness (general), permanganate oxidation, and phosphates (Table 9).
Table 9. “Good status” objectives met for groundwater bodies.
Groundwater Bodies/River Basin West Aegean
East Aegean
Danube Black Sea At the national level
Overall 38 41 50 40 169
With achieved objectives (number) 32 23 28 23 106
With achieved objectives (percentage) 84 56 56 58 63
What are the other water resources on the territory?
The main state-driven mechanism through which water reaches the end-users (farmers) is through the company” Irrigation systems” Ltd. Many of the small farmers satisfy their needs of water supply on their own. The quantity of the consumed water from other water suppliers and the reclaimed water is exceptionally small and insignificant for the water use in the East Aegean River Basin Directorate (EAR BD). The hydromeliorative map of Plovdiv district is shown in Figure 7.
According to an analysis of projected water demand, Bulgaria is not a water-stressed country. Over 60 rivers flow through Bulgaria. The country is divided into 4 catchments regions: The Danube, Black Sea, Eastern Aegean, and Western Aegean. Annual river runoff is expected to decrease up to 14 % in the next 50 years and to be 20 % less at the end of the century due to current climate trends. An analysis of the projected domestic water consumption and internal

Deliverable 1.1: Regional state of play analyses
Page 42 of 274
water resource base suggests that Bulgaria is not a water-stressed country. Since 1990, abstractions for both agricultural and industrial purposes have fallen drastically, contributing to its overall low water stress. Yet, there are areas of Bulgaria that experience water scarcity and seasonal water scarcity in dry summers (Danube water program, 2015).
Bulgaria has a significant stock of hydraulic storage capacity, including 216 large dams (Fig. 6). The total storage capacity of 53 multi-purpose and significant dams amounts to 6,697.8 hm3. Twenty-three dams are in the East Aegean region, representing a total storage volume of 3,105.5 million m3. The main purpose of reservoirs is to store water for irrigation, electricity generation, drinking and industrial water supply including cooling, transport, fish farming, and recreation. The dams have an important function in river flow regulation. There are also many smaller dams, not listed in Annex No. 1 to Article 13, of the Water Act (Table 10). The dams are state or municipal property.
Table 10. Smaller dams, not listed in Annex No. 1 to Article 13, of the Water Act.
RBD Number Storage Volume (million m3)
Danube RBD 724 444
Black Sea RBD 513 424
East Aegean RBD 1,068 523
West Aegean RBD 431 46
Source: The National Strategy for Management and Development of the Water Sector in Bulgaria 2012.
The subsector in numbers is presented below (Water Sector Strategy, Hydro-melioration Sector Strategy (Strategy Plovdiv, 2013), Irrigation Systems Company):
• Dams: The following state dams are part of the Irrigation systems:
- 22 multi-purpose dams under Article 13, p. 1 of the Water Act - 146 irrigation dams - Total storage capacity of 3.1 hm3 of water
• 168 irrigation pumping stations
• 6,435 km of open canals and 9,269 km pipe networks for irrigation
• The total length of drainage canals is 2,334 km; the total length of field drains amounts to 11,192 km
• Dykes with a total length of 487 km, 253 km of which are along the Danube river
• River corrections of 3,157 km
What is the hydrological context? (Water quality and Quantity)
A paper in the Fresenius Environmental Bulletin aimed to monitor the water quality of upper-middle course of Maritsa River using physicochemical and microbiological parameters and assess its suitability and applicability for irrigation (Kostadinova et al., 2012), in accordance with Bulgarian standard. In June and August 2014, Maritsa River water quality in upper (MP-1) and middle (MP-2) course of the river, assessed by 31 parameters, meets the requirements of Bulgarian standard with respect to 24 physicochemical parameters: T, oC, pH, EC, TH, Ca, Mg, DO, N-NH4 (except for June), N-NO3, SO4 2-, PPO4 (except for August), Cl-, COD, BOD5, SS (except for June), Mn, Fe, Cu, Zn, Pb, Ni, Cd, Cr and As. Deviations from the norms were established for all sanitary-indicator microorganisms (total coli titer, E. coli titer, Salmonella spp. and Enterobacteriaceae). The metal concentrations decrease in the order of
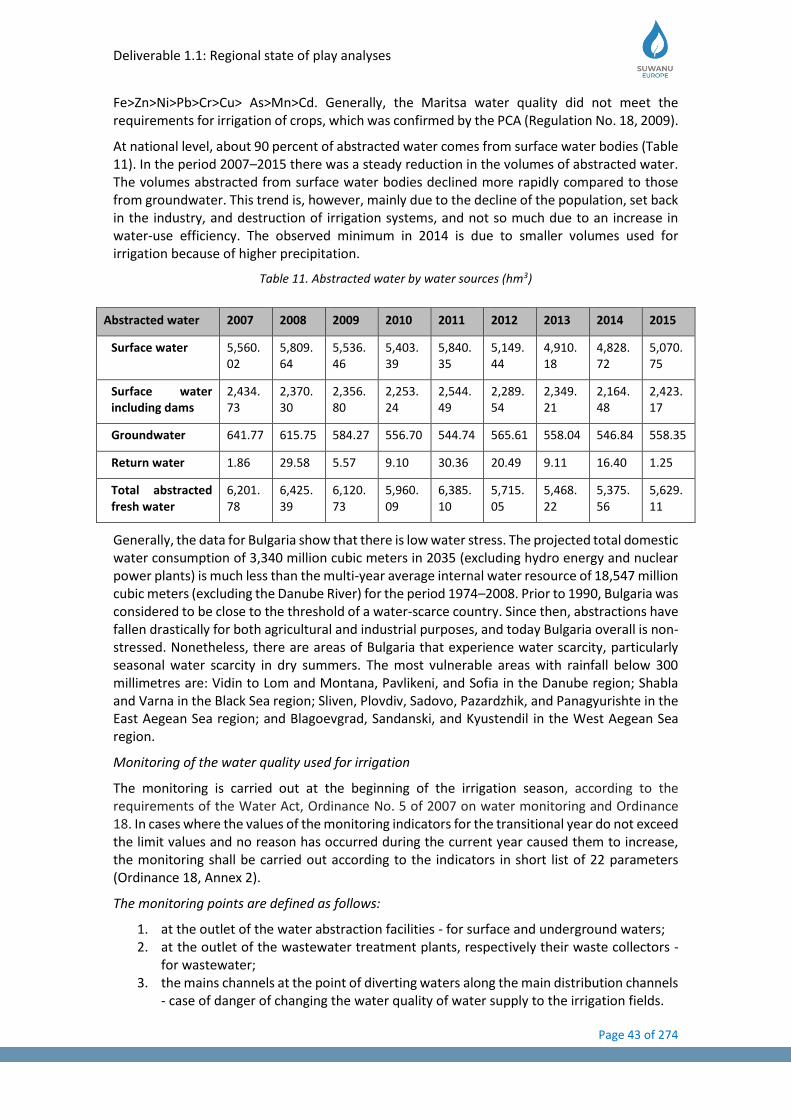
Deliverable 1.1: Regional state of play analyses
Page 43 of 274
Fe>Zn>Ni>Pb>Cr>Cu> As>Mn>Cd. Generally, the Maritsa water quality did not meet the requirements for irrigation of crops, which was confirmed by the PCA (Regulation No. 18, 2009).
At national level, about 90 percent of abstracted water comes from surface water bodies (Table 11). In the period 2007–2015 there was a steady reduction in the volumes of abstracted water. The volumes abstracted from surface water bodies declined more rapidly compared to those from groundwater. This trend is, however, mainly due to the decline of the population, set back in the industry, and destruction of irrigation systems, and not so much due to an increase in water-use efficiency. The observed minimum in 2014 is due to smaller volumes used for irrigation because of higher precipitation.
Table 11. Abstracted water by water sources (hm3)
Generally, the data for Bulgaria show that there is low water stress. The projected total domestic water consumption of 3,340 million cubic meters in 2035 (excluding hydro energy and nuclear power plants) is much less than the multi-year average internal water resource of 18,547 million cubic meters (excluding the Danube River) for the period 1974–2008. Prior to 1990, Bulgaria was considered to be close to the threshold of a water-scarce country. Since then, abstractions have fallen drastically for both agricultural and industrial purposes, and today Bulgaria overall is non-stressed. Nonetheless, there are areas of Bulgaria that experience water scarcity, particularly seasonal water scarcity in dry summers. The most vulnerable areas with rainfall below 300 millimetres are: Vidin to Lom and Montana, Pavlikeni, and Sofia in the Danube region; Shabla and Varna in the Black Sea region; Sliven, Plovdiv, Sadovo, Pazardzhik, and Panagyurishte in the East Aegean Sea region; and Blagoevgrad, Sandanski, and Kyustendil in the West Aegean Sea region.
Monitoring of the water quality used for irrigation
The monitoring is carried out at the beginning of the irrigation season, according to the requirements of the Water Act, Ordinance No. 5 of 2007 on water monitoring and Ordinance 18. In cases where the values of the monitoring indicators for the transitional year do not exceed the limit values and no reason has occurred during the current year caused them to increase, the monitoring shall be carried out according to the indicators in short list of 22 parameters (Ordinance 18, Annex 2).
The monitoring points are defined as follows:
1. at the outlet of the water abstraction facilities - for surface and underground waters; 2. at the outlet of the wastewater treatment plants, respectively their waste collectors -
for wastewater; 3. the mains channels at the point of diverting waters along the main distribution channels
- case of danger of changing the water quality of water supply to the irrigation fields.
Abstracted water 2007 2008 2009 2010 2011 2012 2013 2014 2015
Surface water 5,560.02
5,809.64
5,536.46
5,403.39
5,840.35
5,149.44
4,910.18
4,828.72
5,070.75
Surface water including dams
2,434.73
2,370.30
2,356.80
2,253.24
2,544.49
2,289.54
2,349.21
2,164.48
2,423.17
Groundwater 641.77 615.75 584.27 556.70 544.74 565.61 558.04 546.84 558.35
Return water 1.86 29.58 5.57 9.10 30.36 20.49 9.11 16.40 1.25
Total abstracted fresh water
6,201.78
6,425.39
6,120.73
5,960.09
6,385.10
5,715.05
5,468.22
5,375.56
5,629.11
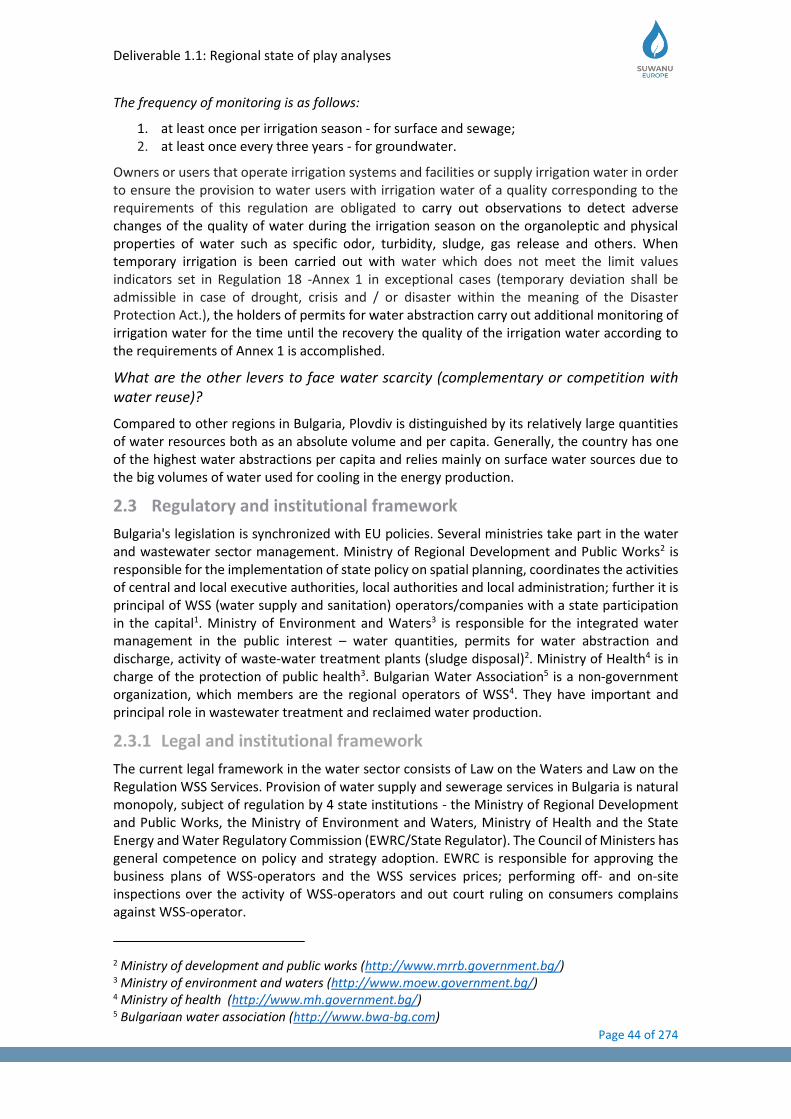
Deliverable 1.1: Regional state of play analyses
Page 44 of 274
The frequency of monitoring is as follows:
1. at least once per irrigation season - for surface and sewage; 2. at least once every three years - for groundwater.
Owners or users that operate irrigation systems and facilities or supply irrigation water in order to ensure the provision to water users with irrigation water of a quality corresponding to the requirements of this regulation are obligated to carry out observations to detect adverse changes of the quality of water during the irrigation season on the organoleptic and physical properties of water such as specific odor, turbidity, sludge, gas release and others. When temporary irrigation is been carried out with water which does not meet the limit values indicators set in Regulation 18 -Annex 1 in exceptional cases (temporary deviation shall be admissible in case of drought, crisis and / or disaster within the meaning of the Disaster Protection Act.), the holders of permits for water abstraction carry out additional monitoring of irrigation water for the time until the recovery the quality of the irrigation water according to the requirements of Annex 1 is accomplished.
What are the other levers to face water scarcity (complementary or competition with water reuse)?
Compared to other regions in Bulgaria, Plovdiv is distinguished by its relatively large quantities of water resources both as an absolute volume and per capita. Generally, the country has one of the highest water abstractions per capita and relies mainly on surface water sources due to the big volumes of water used for cooling in the energy production.
2.3 Regulatory and institutional framework
Bulgaria's legislation is synchronized with EU policies. Several ministries take part in the water and wastewater sector management. Ministry of Regional Development and Public Works2 is responsible for the implementation of state policy on spatial planning, coordinates the activities of central and local executive authorities, local authorities and local administration; further it is principal of WSS (water supply and sanitation) operators/companies with a state participation in the capital1. Ministry of Environment and Waters3 is responsible for the integrated water management in the public interest – water quantities, permits for water abstraction and discharge, activity of waste-water treatment plants (sludge disposal)2. Ministry of Health4 is in charge of the protection of public health3. Bulgarian Water Association5 is a non-government organization, which members are the regional operators of WSS4. They have important and principal role in wastewater treatment and reclaimed water production.
2.3.1 Legal and institutional framework
The current legal framework in the water sector consists of Law on the Waters and Law on the Regulation WSS Services. Provision of water supply and sewerage services in Bulgaria is natural monopoly, subject of regulation by 4 state institutions - the Ministry of Regional Development and Public Works, the Ministry of Environment and Waters, Ministry of Health and the State Energy and Water Regulatory Commission (EWRC/State Regulator). The Council of Ministers has general competence on policy and strategy adoption. EWRC is responsible for approving the business plans of WSS-operators and the WSS services prices; performing off- and on-site inspections over the activity of WSS-operators and out court ruling on consumers complains against WSS-operator.
2 Ministry of development and public works (http://www.mrrb.government.bg/) 3 Ministry of environment and waters (http://www.moew.government.bg/) 4 Ministry of health (http://www.mh.government.bg/) 5 Bulgariaan water association (http://www.bwa-bg.com)
Deliverable 1.1: Regional state of play analyses
Page 45 of 274
Currently there are 64 WSS operators, which cover 100 % of the market. All of them are subject of regulation and tariff approval by the Regulator – Energy and Water Regulatory Commission (EWRC) is a national regulatory agency and according to its statutes, exercises regulatory functions over 4 sectors: electricity, central heating, natural gas and WSS services.
Bulgaria joined the EU in the beginning of 2007. The national legislation corresponds to the Acquis Communautaire. The country started reform in the WSS sector with amendments of the Law on Waters in 2009 and the main characteristics of this reform include:
- Change in ownership of water infrastructure (public state and public municipal property); - Change in the management of water systems and facilities: WSS Associations are created
where the ownership of water assets belongs to more than one municipality; associations manage assets on behalf of owners and choose water operator;
- Water companies are converted from owners of assets to operators using the assets under contract conditions;
- WSS Associations should establish long-term contract with an operator for the provision of WSS services at the specified territory; they approved a regional master plan for WSS and ensure its implementation by the business plan of the WSS operator;
Regulator regulates WSS-operators based on their contracts with WSS associations and ensures implementation and sustainability of the water supply services.
2.3.2 Legal framework
Bulgaria doesn’t have a single legislative act to settle the sector of hydro-meliorations. From a lawful point of view, the sector of hydro-meliorations is an inseparable part of the whole water sector which is additionally settled in some of the legislative and sub legislative normative acts. The basic legal regulation includes the Water Act from 2003 and the Irrigation Associations Act from 2001 together with their most resent amendments.
The main legislative and sub-legislative normative regulation active at the moment in the hydro-meliorations area in Bulgaria incorporates the following documents:
- WATER ACT (prom. SG. 67/27.07.1999). It settles the principles of ownership of the infrastructure for irrigation and regime of receiving permission for water abstraction. Water metering for permitted abstractions is obliged in Bulgaria. The duration of permits or authorisations in Bulgaria is for no more than 5 years from surface water source. In 2000 a charge on water abstraction was adopted with the regulatory document “Tariff of fees for the right to use water and / or authorized use of water bodies” and it was amended in 2012 with the title “Tariff of fees for water abstraction, water use and those that are subject to contamination”. The charges were imposed with the main aim of preserving water resources to achieve sustainable water usage in the long-term.
- ORDINANCE No 1 of April 11, 2011 23.04.2007 on Water Monitoring (promulgated SG. 34/ 29.04.2011; enforced 29.04.2011, amended and supplemented No 22 of 05.03.2013, enforced 05.03.2013, amended No. 44 of 17.05.2013, enforced 17.05.2013);
- ORDINANCE No 2 from 08.06.2011 on issuing permits for discharging wastewater into water points and setting individual emission limits for local sources of pollution (promulgated SG. 47 of 21.06.2011, enforced 21.06.2011, amended, No. 14 of 17.02.2012, enforced 17.02.2012, supplemented No.44 of 17.05. 2013, enforced 17.05. 2013). This regulation provides the interpretation of the term “waste waters”. These are waters, including rainwater, polluted by manufacturing processes, economic, agricultural and household activities, as well as the waters from the sewerage systems of settlements, residential and recreational formations. Regarding the quality of the waters which are discharged in compliance with the provisions of Ordinance No 2, the related responsibilities and obligations are of the holder of the Discharge permit. The
Deliverable 1.1: Regional state of play analyses
Page 46 of 274
control on the fulfilment of the requirements and the conditions contained in the Discharge permit is exercised by the Basin Directorate and the Regional Inspectorate of Environment and Waters.
- ORDINANCE No 3 from 16.10.2000 on the terms and conditions for research, design, approval and operation of sanitary protective zones around water sources and facilities for drinking water, and sources of mineral waters used for therapeutic, prophylactic, drinking and sewerage (promulgated SG. 88/2000)
- REGULATION No 6 from 9.11.2000 for emission norms for admissible content of noxious and hazardous substances in the wastewater. The Regulation settles the emission limit values of the permissible content of certain harmful and noxious substances in wastewaters, discharged in water basins. Outside the scope of the regulation remain the discharges of waste waters in underground waters.
- REGULATION No 7 from 14.11.2000 on conditions and procedure for discharge of industrial wastewater in the sewerage systems of residential locations: The regulation specifies the treatment of waste waters used in industry and production processes, discharged in the sewerage systems of residential locations and residential water treatment plants. The objective of the regulation is to prevent water from getting polluted with toxic, harmful and dangerous for the environment substances. Outside the scope of the regulation are the activities related to the discharge of industrial waste waters in water basins. The regulation specifies the conditions and procedures for the discharge of waste waters and identifies the admissible content of toxic, harmful and dangerous for the environment substances in the waste waters prior to their discharge. The limit quality values of waters intended for irrigation of agricultural crops are more restrictive than the maximum admissible concentration rates of substances in industrial waste waters released in sewerage systems of residential locations or in residential water treatment plants.
- ORDINANCE No H-4 of September 14, 2012 on the characterization of surface water (promulgated SG, No. 22 of March 5, 2013, enforced March 5, 2013)
- ORDINANCE No 13 from 29.01.2004 on the procedures for carrying out the technical operation of dams and associated facilities (promulgated SG. 17/2.03.2004)
- ORDINANCE No 18 from 27.05.2009 on the quality of water for irrigation of agricultural crops. The reuse of wastewaters for irrigation of agricultural crops is legislatively acceptable after wastewater treatment, which will ensure achieving the irrigation water quality standards specified in Regulation 18.
The supply of irrigation water pursuant to the provisions of Ordinance No 18 is performed on the basis of a contract concluded between the owner of the hydrotechnical facility and the irrigation water user. The contract must include the requirements to the quality of the water upon its delivery and the obligations of the user not to deteriorate its quality during the process of water supply. The Ordinance determines the necessary quality and monitoring requirements for the water (surface, underground and waste waters) intended for agricultural crops irrigation on the territory of the Republic of Bulgaria. The document sets the criteria and indicators for irrigation water quality assessment, also aimed to prevent the damage caused by hydro-technical facilities engaged in irrigation related activities (possible adverse impacts of irrigation water or waterworks); rules for areas identified as vulnerable zones; maintenance of land and soil in good agricultural and environmental conditions. According to the regulation, functions of the competent authorities are as follows:
The Basin Directorates are responsible for the assessment of the actual condition of the quantity and the quality of the waters for irrigation maintaining records of permits for water abstraction and of water abstraction facilities for irrigation as part of the registers under Art. 182, para. 1,
Deliverable 1.1: Regional state of play analyses
Page 47 of 274
item 1, letters "a" and "d" of the Water Act and provision of data according to the Law on Access to Public Information;
The Regional Inspectorates of Environment and Water is performing control over the compliance with the regulatory requirements for the soil qualities and the registered ones changes due to irrigation; the actions or omissions of organs or persons leading to soil contamination due to irrigation; the protection of soils with regard to pollution by harmful substances, including radioactive substances, acidification, salinization, surface over-wetting and erosion in irrigation.
The Regional Inspectorates for the Protection and Control of Public Health are responsible for the control over the microbiological parameters of potable water according Annex 1, item D.
The Directorate “Hydro melioration” in the Ministry of agriculture, food and forests organizes and control the activities for carrying out the own monitoring of the waters for irrigation fed by systems and facilities built with state resources; create and maintain a register of the hydromelioration fund, built with state resources, including water sources for irrigation and containing water quality information for irrigation of agricultural crops; provide the necessary information for issuing permits for water abstraction; performs ongoing inspections for the irrigation season and the observance of the gross irrigated and irrigated waters irrigation norms by regions for the country; interact with the basin directorates through the regional directorates of the hydromeliorations in the relevant area of activity, including data on water quality for irrigation; organize and participate in the development of the national water management plan and in the elaboration of the water and water economic balances of the country in their part related to irrigation and drainage.
The National Agricultural Advisory Service within the scope of their competence, provide the owners and users of agricultural land with information.
The Ministry of Agriculture, foods and forests through the natural and legal persons who: supply water for irrigation, provide landlords and landholders with official land irrigation water quality information as well as water banned for irrigation on the basis of official data of the Ministry of Environment and Water.
- East Aegean Region River Baisin’s management plan (2016-2021), which is a main instrument for water management.
-The main legal act in the field of hydro-melioration is the Irrigation Associations Act, which regulates the structure and activity of irrigation associations. The associations carry out the operation and maintenance of hydro-meliorative infrastructure, construction of new irrigation and drainage systems and facilities, supply and distribution of water for irrigation. According to the provisions of the aforementioned law, Irrigation Associations can acquire the right of using without compensation and subsequently rights of ownership over the hydro-meliorations’ infrastructure of their territory, comprised in the property of the companies, whose capital is owned by the state. The conditions and order of acquirement and withdraw of the right of usage are regulated with a respectful Regulation. (SG, бр.21/26.02.2002 y.).
- The Hydro-melioration Strategy was approved in 2016. It identifies restoration of irrigation and land drainage infrastructure as a priority and analyses the sector in the context of climate change in the medium and long term. The strategy concludes that, if rehabilitated and modernized, the existing irrigation infrastructure will be a critical element in reducing the risks of climate change in terms of productivity, sustainable agriculture, and land management. Expected long-term droughts, combined with more frequent and more severe floods, will lead to growing insecurity in the agriculture sector in Bulgaria. Under these conditions, the irrigation infrastructure will be used to meet the growing needs of crop for water, while drainage and flood protection infrastructure as well as river corrections would provide protection for arable land against
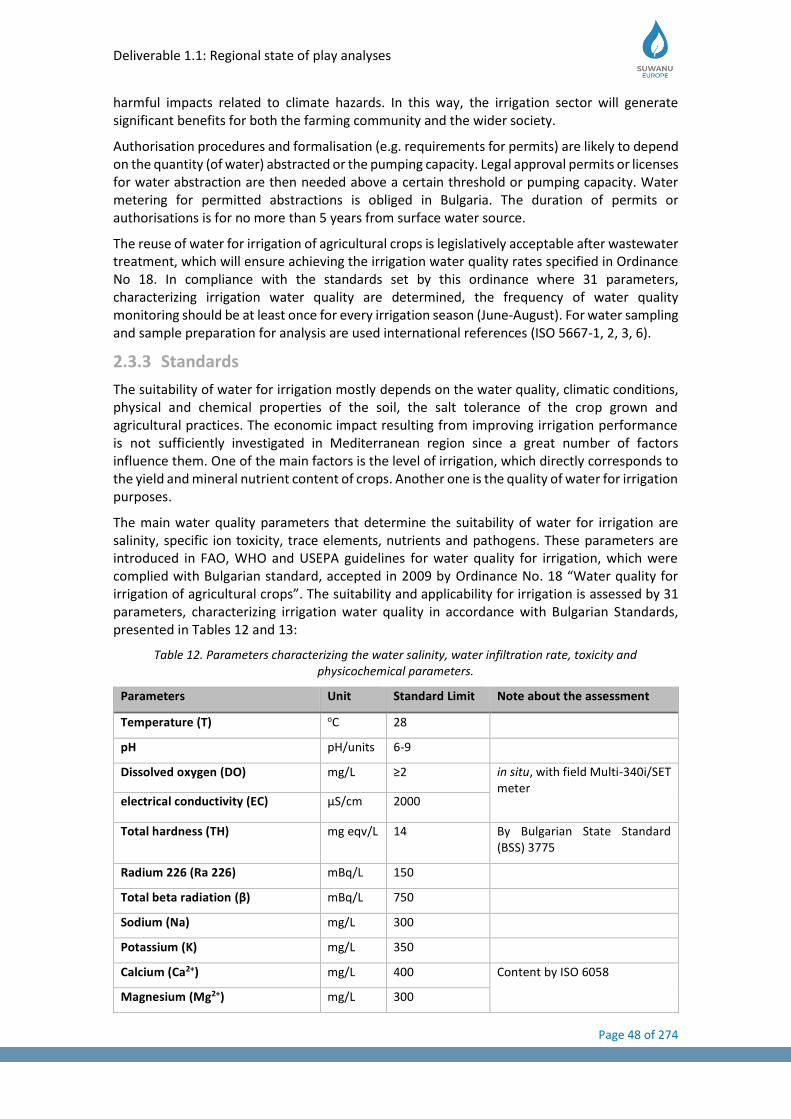
Deliverable 1.1: Regional state of play analyses
Page 48 of 274
harmful impacts related to climate hazards. In this way, the irrigation sector will generate significant benefits for both the farming community and the wider society.
Authorisation procedures and formalisation (e.g. requirements for permits) are likely to depend on the quantity (of water) abstracted or the pumping capacity. Legal approval permits or licenses for water abstraction are then needed above a certain threshold or pumping capacity. Water metering for permitted abstractions is obliged in Bulgaria. The duration of permits or authorisations is for no more than 5 years from surface water source.
The reuse of water for irrigation of agricultural crops is legislatively acceptable after wastewater treatment, which will ensure achieving the irrigation water quality rates specified in Ordinance No 18. In compliance with the standards set by this ordinance where 31 parameters, characterizing irrigation water quality are determined, the frequency of water quality monitoring should be at least once for every irrigation season (June-August). For water sampling and sample preparation for analysis are used international references (ISO 5667-1, 2, 3, 6).
2.3.3 Standards
The suitability of water for irrigation mostly depends on the water quality, climatic conditions, physical and chemical properties of the soil, the salt tolerance of the crop grown and agricultural practices. The economic impact resulting from improving irrigation performance is not sufficiently investigated in Mediterranean region since a great number of factors influence them. One of the main factors is the level of irrigation, which directly corresponds to the yield and mineral nutrient content of crops. Another one is the quality of water for irrigation purposes.
The main water quality parameters that determine the suitability of water for irrigation are salinity, specific ion toxicity, trace elements, nutrients and pathogens. These parameters are introduced in FAO, WHO and USEPA guidelines for water quality for irrigation, which were complied with Bulgarian standard, accepted in 2009 by Ordinance No. 18 “Water quality for irrigation of agricultural crops”. The suitability and applicability for irrigation is assessed by 31 parameters, characterizing irrigation water quality in accordance with Bulgarian Standards, presented in Tables 12 and 13:
Table 12. Parameters characterizing the water salinity, water infiltration rate, toxicity and physicochemical parameters.
Parameters Unit Standard Limit Note about the assessment
Temperature (T) oC 28
pH pH/units 6-9
Dissolved oxygen (DO) mg/L ≥2 in situ, with field Multi-340i/SET meter
electrical conductivity (EC) µS/cm 2000
Total hardness (TH) mg eqv/L 14 By Bulgarian State Standard (BSS) 3775
Radium 226 (Ra 226) mBq/L 150
Total beta radiation (β) mBq/L 750
Sodium (Na) mg/L 300
Potassium (K) mg/L 350
Calcium (Ca2+) mg/L 400 Content by ISO 6058
Magnesium (Mg2+) mg/L 300
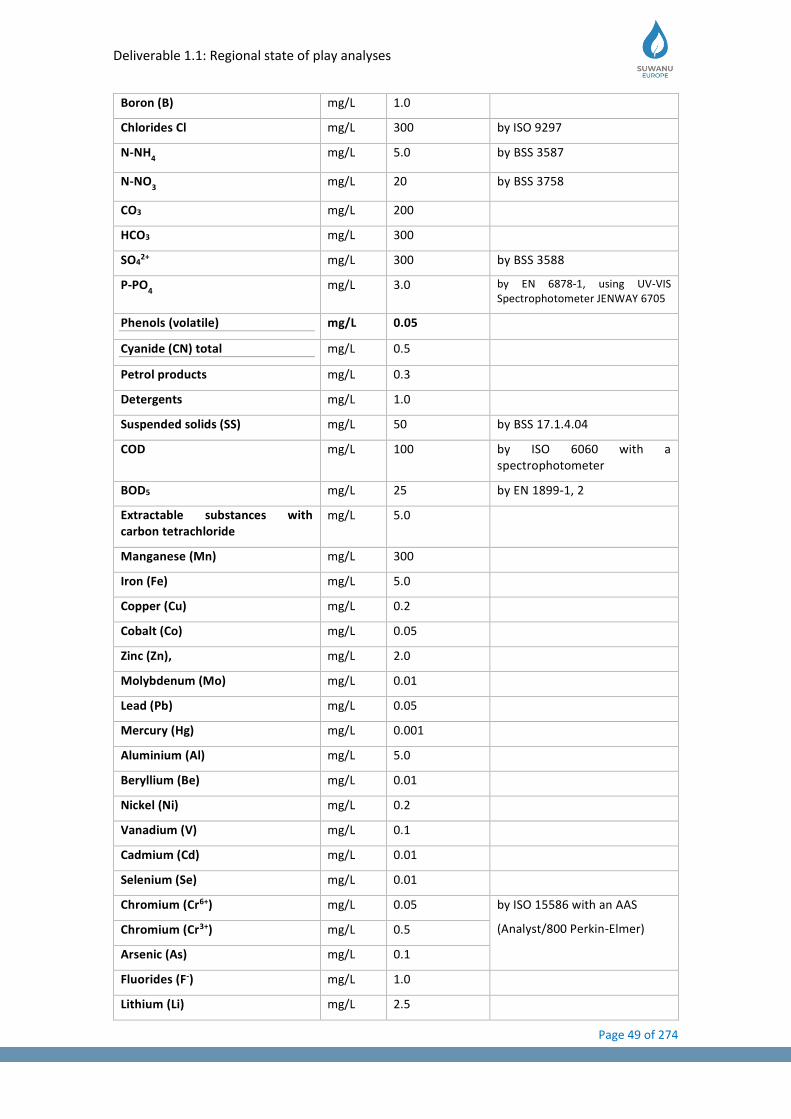
Deliverable 1.1: Regional state of play analyses
Page 49 of 274
Boron (B) mg/L 1.0
Chlorides Cl mg/L 300 by ISO 9297
N-NH4 mg/L 5.0 by BSS 3587
N-NO3 mg/L 20 by BSS 3758
CO3 mg/L 200
HCO3 mg/L 300
SO42+ mg/L 300 by BSS 3588
P-PO4 mg/L 3.0 by EN 6878-1, using UV-VIS
Spectrophotometer JENWAY 6705
Phenols (volatile) mg/L 0.05
Cyanide (CN) total mg/L 0.5
Petrol products mg/L 0.3
Detergents mg/L 1.0
Suspended solids (SS) mg/L 50 by BSS 17.1.4.04
COD mg/L 100 by ISO 6060 with a spectrophotometer
BOD5 mg/L 25 by EN 1899-1, 2
Extractable substances with carbon tetrachloride
mg/L 5.0
Manganese (Mn) mg/L 300
Iron (Fe) mg/L 5.0
Copper (Cu) mg/L 0.2
Cobalt (Co) mg/L 0.05
Zinc (Zn), mg/L 2.0
Molybdenum (Mo) mg/L 0.01
Lead (Pb) mg/L 0.05
Mercury (Hg) mg/L 0.001
Aluminium (Al) mg/L 5.0
Beryllium (Be) mg/L 0.01
Nickel (Ni) mg/L 0.2
Vanadium (V) mg/L 0.1
Cadmium (Cd) mg/L 0.01
Selenium (Se) mg/L 0.01
Chromium (Cr6+) mg/L 0.05 by ISO 15586 with an AAS
(Analyst/800 Perkin-Elmer) Chromium (Cr3+) mg/L 0.5
Arsenic (As) mg/L 0.1
Fluorides (F-) mg/L 1.0
Lithium (Li) mg/L 2.5
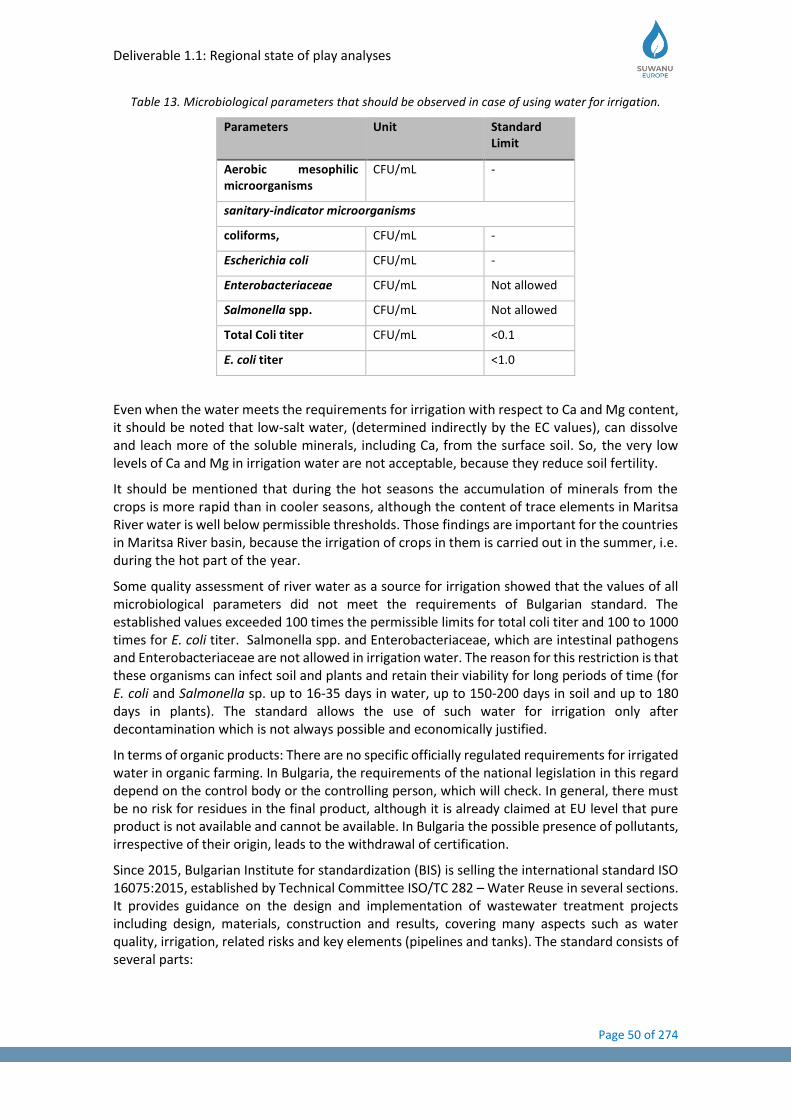
Deliverable 1.1: Regional state of play analyses
Page 50 of 274
Table 13. Microbiological parameters that should be observed in case of using water for irrigation.
Parameters
Unit Standard Limit
Aerobic mesophilic microorganisms
CFU/mL -
sanitary-indicator microorganisms
coliforms, CFU/mL -
Escherichia coli CFU/mL -
Enterobacteriaceae CFU/mL Not allowed
Salmonella spp. CFU/mL Not allowed
Total Coli titer CFU/mL ˂0.1
E. coli titer ˂1.0
Even when the water meets the requirements for irrigation with respect to Ca and Mg content, it should be noted that low-salt water, (determined indirectly by the EC values), can dissolve and leach more of the soluble minerals, including Ca, from the surface soil. So, the very low levels of Ca and Mg in irrigation water are not acceptable, because they reduce soil fertility.
It should be mentioned that during the hot seasons the accumulation of minerals from the crops is more rapid than in cooler seasons, although the content of trace elements in Maritsa River water is well below permissible thresholds. Those findings are important for the countries in Maritsa River basin, because the irrigation of crops in them is carried out in the summer, i.e. during the hot part of the year.
Some quality assessment of river water as a source for irrigation showed that the values of all microbiological parameters did not meet the requirements of Bulgarian standard. The established values exceeded 100 times the permissible limits for total coli titer and 100 to 1000 times for E. coli titer. Salmonella spp. and Enterobacteriaceae, which are intestinal pathogens and Enterobacteriaceae are not allowed in irrigation water. The reason for this restriction is that these organisms can infect soil and plants and retain their viability for long periods of time (for E. coli and Salmonella sp. up to 16-35 days in water, up to 150-200 days in soil and up to 180 days in plants). The standard allows the use of such water for irrigation only after decontamination which is not always possible and economically justified.
In terms of organic products: There are no specific officially regulated requirements for irrigated water in organic farming. In Bulgaria, the requirements of the national legislation in this regard depend on the control body or the controlling person, which will check. In general, there must be no risk for residues in the final product, although it is already claimed at EU level that pure product is not available and cannot be available. In Bulgaria the possible presence of pollutants, irrespective of their origin, leads to the withdrawal of certification.
Since 2015, Bulgarian Institute for standardization (BIS) is selling the international standard ISO 16075:2015, established by Technical Committee ISO/TC 282 – Water Reuse in several sections. It provides guidance on the design and implementation of wastewater treatment projects including design, materials, construction and results, covering many aspects such as water quality, irrigation, related risks and key elements (pipelines and tanks). The standard consists of several parts:
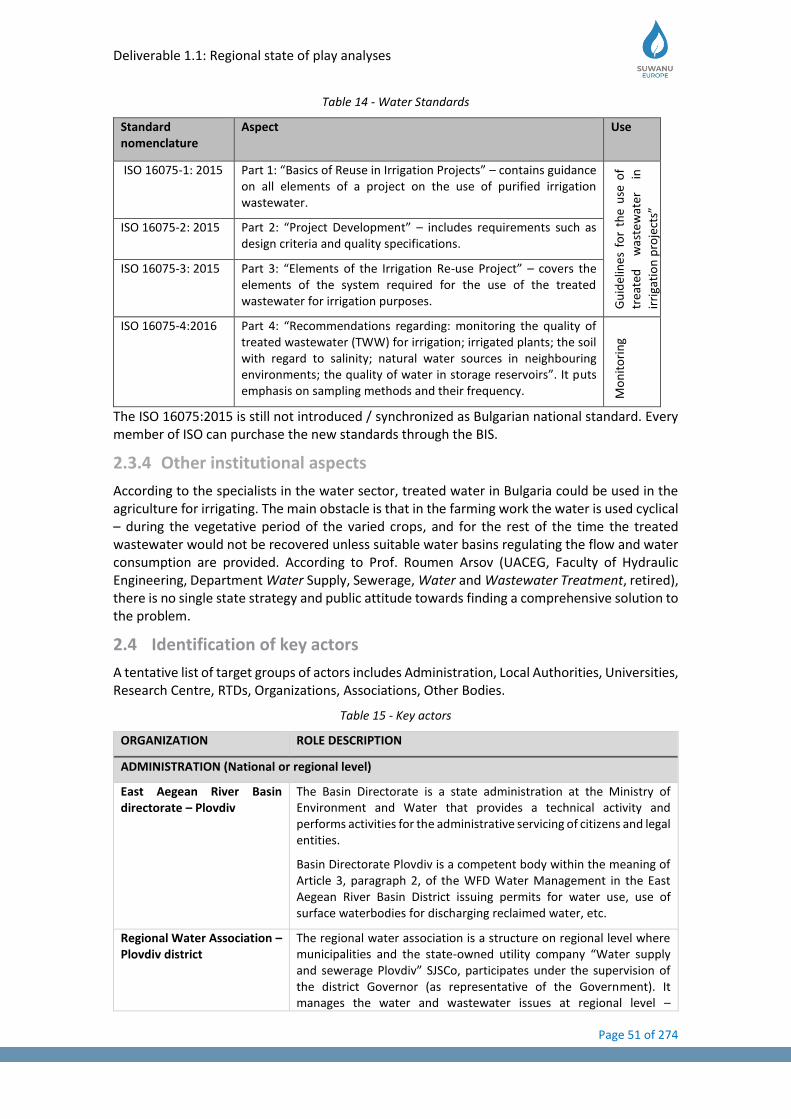
Deliverable 1.1: Regional state of play analyses
Page 51 of 274
Table 14 - Water Standards
Standard nomenclature
Aspect Use
ISO 16075-1: 2015 Part 1: “Basics of Reuse in Irrigation Projects” – contains guidance on all elements of a project on the use of purified irrigation wastewater.
Gu
idel
ine
s fo
r th
e u
se o
f
trea
ted
w
aste
wat
er
in
irri
gati
on
pro
ject
s”
ISO 16075-2: 2015 Part 2: “Project Development” – includes requirements such as design criteria and quality specifications.
ISO 16075-3: 2015 Part 3: “Elements of the Irrigation Re-use Project” – covers the elements of the system required for the use of the treated wastewater for irrigation purposes.
ISO 16075-4:2016 Part 4: “Recommendations regarding: monitoring the quality of treated wastewater (TWW) for irrigation; irrigated plants; the soil with regard to salinity; natural water sources in neighbouring environments; the quality of water in storage reservoirs”. It puts emphasis on sampling methods and their frequency. M
on
ito
rin
g
The ISO 16075:2015 is still not introduced / synchronized as Bulgarian national standard. Every member of ISO can purchase the new standards through the BIS.
2.3.4 Other institutional aspects
According to the specialists in the water sector, treated water in Bulgaria could be used in the agriculture for irrigating. The main obstacle is that in the farming work the water is used cyclical – during the vegetative period of the varied crops, and for the rest of the time the treated wastewater would not be recovered unless suitable water basins regulating the flow and water consumption are provided. According to Prof. Roumen Arsov (UACEG, Faculty of Hydraulic Engineering, Department Water Supply, Sewerage, Water and Wastewater Treatment, retired), there is no single state strategy and public attitude towards finding a comprehensive solution to the problem.
2.4 Identification of key actors
A tentative list of target groups of actors includes Administration, Local Authorities, Universities, Research Centre, RTDs, Organizations, Associations, Other Bodies.
Table 15 - Key actors
ORGANIZATION ROLE DESCRIPTION
ADMINISTRATION (National or regional level)
East Aegean River Basin directorate – Plovdiv
The Basin Directorate is a state administration at the Ministry of Environment and Water that provides a technical activity and performs activities for the administrative servicing of citizens and legal entities.
Basin Directorate Plovdiv is a competent body within the meaning of Article 3, paragraph 2, of the WFD Water Management in the East Aegean River Basin District issuing permits for water use, use of surface waterbodies for discharging reclaimed water, etc.
Regional Water Association – Plovdiv district
The regional water association is a structure on regional level where municipalities and the state-owned utility company “Water supply and sewerage Plovdiv” SJSCo, participates under the supervision of the district Governor (as representative of the Government). It manages the water and wastewater issues at regional level –
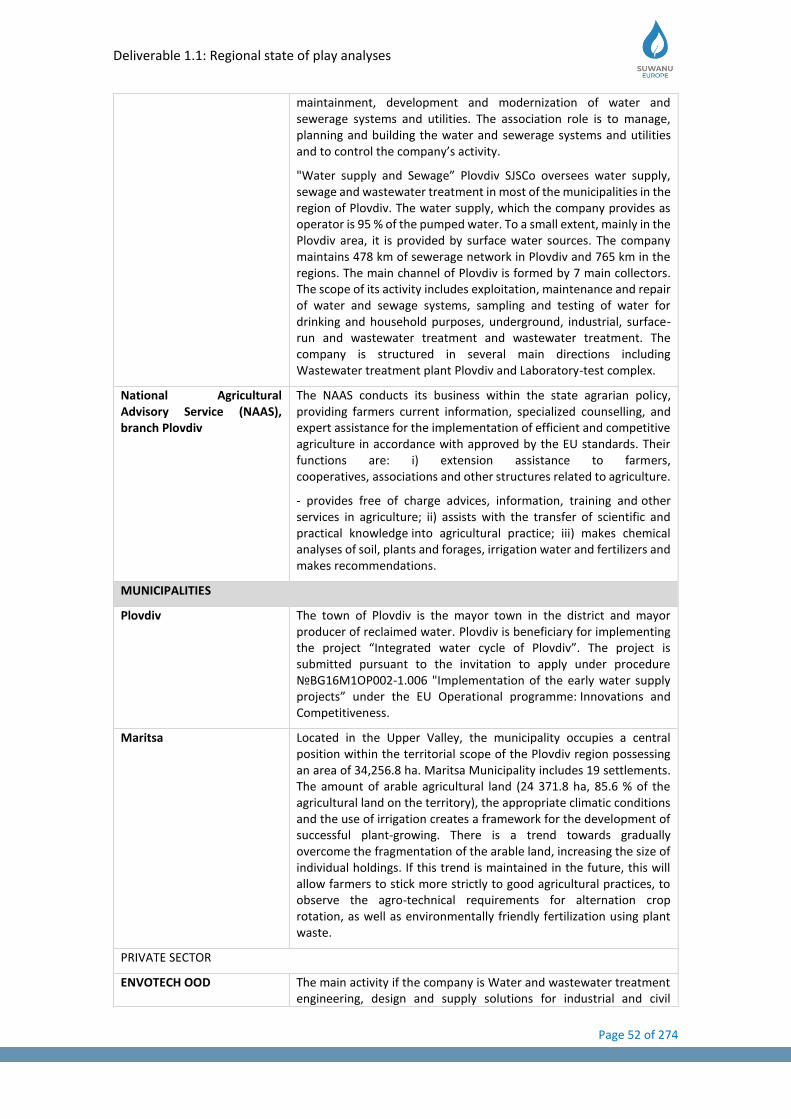
Deliverable 1.1: Regional state of play analyses
Page 52 of 274
maintainment, development and modernization of water and sewerage systems and utilities. The association role is to manage, planning and building the water and sewerage systems and utilities and to control the company’s activity.
"Water supply and Sewage” Plovdiv SJSCo oversees water supply, sewage and wastewater treatment in most of the municipalities in the region of Plovdiv. The water supply, which the company provides as operator is 95 % of the pumped water. To a small extent, mainly in the Plovdiv area, it is provided by surface water sources. The company maintains 478 km of sewerage network in Plovdiv and 765 km in the regions. The main channel of Plovdiv is formed by 7 main collectors. The scope of its activity includes exploitation, maintenance and repair of water and sewage systems, sampling and testing of water for drinking and household purposes, underground, industrial, surface-run and wastewater treatment and wastewater treatment. The company is structured in several main directions including Wastewater treatment plant Plovdiv and Laboratory-test complex.
National Agricultural Advisory Service (NAAS), branch Plovdiv
The NAAS conducts its business within the state agrarian policy, providing farmers current information, specialized counselling, and expert assistance for the implementation of efficient and competitive agriculture in accordance with approved by the EU standards. Their functions are: i) extension assistance to farmers, cooperatives, associations and other structures related to agriculture.
- provides free of charge advices, information, training and other services in agriculture; ii) assists with the transfer of scientific and practical knowledge into agricultural practice; iii) makes chemical analyses of soil, plants and forages, irrigation water and fertilizers and makes recommendations.
MUNICIPALITIES
Plovdiv The town of Plovdiv is the mayor town in the district and mayor producer of reclaimed water. Plovdiv is beneficiary for implementing the project “Integrated water cycle of Plovdiv”. The project is submitted pursuant to the invitation to apply under procedure №BG16M1OP002-1.006 "Implementation of the early water supply projects” under the EU Operational programme: Innovations and Competitiveness.
Maritsa Located in the Upper Valley, the municipality occupies a central position within the territorial scope of the Plovdiv region possessing an area of 34,256.8 ha. Maritsa Municipality includes 19 settlements. The amount of arable agricultural land (24 371.8 ha, 85.6 % of the agricultural land on the territory), the appropriate climatic conditions and the use of irrigation creates a framework for the development of successful plant-growing. There is a trend towards gradually overcome the fragmentation of the arable land, increasing the size of individual holdings. If this trend is maintained in the future, this will allow farmers to stick more strictly to good agricultural practices, to observe the agro-technical requirements for alternation crop rotation, as well as environmentally friendly fertilization using plant waste.
PRIVATE SECTOR
ENVOTECH OOD The main activity if the company is Water and wastewater treatment engineering, design and supply solutions for industrial and civil
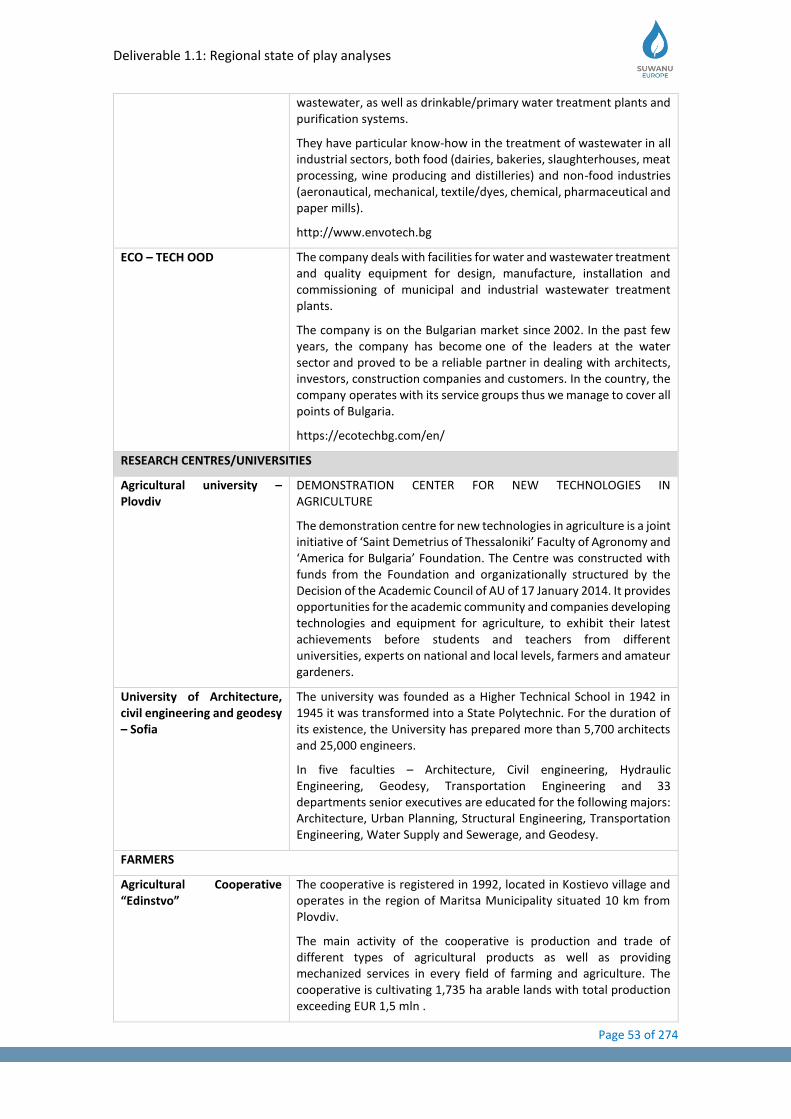
Deliverable 1.1: Regional state of play analyses
Page 53 of 274
wastewater, as well as drinkable/primary water treatment plants and purification systems.
They have particular know-how in the treatment of wastewater in all industrial sectors, both food (dairies, bakeries, slaughterhouses, meat processing, wine producing and distilleries) and non-food industries (aeronautical, mechanical, textile/dyes, chemical, pharmaceutical and paper mills).
http://www.envotech.bg
ECO – TECH OOD The company deals with facilities for water and wastewater treatment and quality equipment for design, manufacture, installation and commissioning of municipal and industrial wastewater treatment plants.
The company is on the Bulgarian market since 2002. In the past few years, the company has become one of the leaders at the water sector and proved to be a reliable partner in dealing with architects, investors, construction companies and customers. In the country, the company operates with its service groups thus we manage to cover all points of Bulgaria.
https://ecotechbg.com/en/
RESEARCH CENTRES/UNIVERSITIES
Agricultural university – Plovdiv
DEMONSTRATION CENTER FOR NEW TECHNOLOGIES IN AGRICULTURE
The demonstration centre for new technologies in agriculture is a joint initiative of ‘Saint Demetrius of Thessaloniki’ Faculty of Agronomy and ‘America for Bulgaria’ Foundation. The Centre was constructed with funds from the Foundation and organizationally structured by the Decision of the Academic Council of AU of 17 January 2014. It provides opportunities for the academic community and companies developing technologies and equipment for agriculture, to exhibit their latest achievements before students and teachers from different universities, experts on national and local levels, farmers and amateur gardeners.
University of Architecture, civil engineering and geodesy – Sofia
The university was founded as a Higher Technical School in 1942 in 1945 it was transformed into a State Polytechnic. For the duration of its existence, the University has prepared more than 5,700 architects and 25,000 engineers.
In five faculties – Architecture, Civil engineering, Hydraulic Engineering, Geodesy, Transportation Engineering and 33 departments senior executives are educated for the following majors: Architecture, Urban Planning, Structural Engineering, Transportation Engineering, Water Supply and Sewerage, and Geodesy.
FARMERS
Agricultural Cooperative “Edinstvo”
The cooperative is registered in 1992, located in Kostievo village and operates in the region of Maritsa Municipality situated 10 km from Plovdiv.
The main activity of the cooperative is production and trade of different types of agricultural products as well as providing mechanized services in every field of farming and agriculture. The cooperative is cultivating 1,735 ha arable lands with total production exceeding EUR 1,5 mln .

Deliverable 1.1: Regional state of play analyses
Page 54 of 274
The crop structure is as follows: wheat (durum and common wheat), barley, rape, sunflower, corn, rice, soybean.
Golden Rose Ltd, Zlatosel village, Municipality of Brezovo
Distillery for obtaining mainly rose essential water, but also lavender and chamomile. They have more than 500 ha of crops that are surface irrigated with reclaimed water. The distillation process is strictly and technically prescribed by the Bulgarian State Standard. The rose water is a natural obtained distillation mixture of water and essential rose oil and does not contain artificial colouring and fragrance.
Green Tech GREEN TECH is a registered farmer. The company processing areas over 300 ha own and rented land. The main crops grown by the manufacturer are corn for energy needs, triticale and wheat. A large part of the crops is aimed at their application as a main raw material in the production of electricity from biomass, a significant part of them being grown under irrigation conditions. It also has about 120 ha of pastures. The farmer has experience also in animal husbandry. For the current agricultural year, the company grows over 450 livestock – cows and calves.
Networks/projects
“Investing in refurbishment of the MRDPW infrastructure from irrigation systems”
The Operational program “Rural areas and development program 2014-2020” envisages 100 mil BGN for a hydro-melioration construction work, but they would be enough for no more than 30 companies.
According to data from the adopted strategy the Bulgarian HM (hydro-meliorative) infrastructure is seriously damaged. The incomes are hardly enough for basic maintenance. Only about 8% of the areas, that the state company irrigation systems manage to maintain, are actually irrigated.
Pursuant to the strategy’s authors prolonged dry periods are expected, in combination with more frequent and more severe floods, which will lead to growing insecurity in the Bulgarian agricultural activity.
INVESTORS (National or regional level)
Irrigation Systems EAD – branch Maritsa
Irrigation Systems EAD is a 100 % state property company as its head is the Minister of Agriculture, forestry and Foods. The territorial structure of the company consists of a central management in Sofia and network of 14 regional representations throughout the country, having branch status. Irrigation Systems EAD, Maritsa Branch, provides the upkeep of the sites on the territory of the city of Plovdiv and its neighbouring municipalities – the Municipality of Maritsa and the Municipality of Rodopi.
Branches are formed based on a technological principle (river valley) and are directly subordinate to the Executive Director. They provide with water for irrigation, industrial and drinking water supply, drainage and protection from flooding of agricultural lands, industrial sites, settlements and others. Some branches are registered as agricultural producers and farmland.
IS EAD is responsible for supply and sale of water for beverages, distribution of water to “Water Supply and Sewerage” companies; industrial water supply; filling fishponds and other needs, including ameliorative and agricultural construction. This group of activities has

Deliverable 1.1: Regional state of play analyses
Page 55 of 274
a commercial character. The cost of a “water supply” service for irrigation is determined by the next watering season, with an order from the Minister of Agriculture and Food issuing with an approved price for the service.
2.5 Existing situation of wastewater treatment and agriculture
2.5.1 Characterization of wastewater treatment sector:
Identification of wastewater treatment plants
At present, 13 urban WWTPs are operating in the territory of Plovdiv district. Much of them are built with European funding. By 2023, another 16 WWTP should be built to meet the requirements of the UWWTD for wastewater treatment of the settlements. Only 2 urban wastewater treatment plants have been built and operated in the area until 2010, that possessed secondary treatment. They serve the city of Hissarya and the city of Plovdiv with a total population of about 370,000 people. Separately, there are more than 70 local wastewater treatment plants of industrial sites and outlying settlements. In 2013 the new sewage treatment plant in Sopot was opened. It was part of a project for a complete renovation of the city's water and wastewater sector and its capacity is of 25,000 p.e. The construction of the new facility, which is one of the most modern in the Balkans, has invested BGN 18 mln. The water purification efficiency at the station's exit is 98 %. The project for the water sector in the town of Hissarya, reconstruction and modernization of the WWTP of Hissarya as well as construction of a sewerage network” was realized with a total value of more than BGN 18 mln. To improve the quality of surface water it is imperative to build (refurbish), reconstruct and modernize sewage treatment plants in the area.
Wastewater treatment plant of Plovdiv (WWTP Plovdiv)
UWWTP Plovdiv is situated in the southeast part of town, about 1.5 km outside the city limits, at an area of 23 hectares. It treats wastewater from industry and the population of Plovdiv (as well as 80-100 m3 of infiltrate per day from the "Tsalapitsa” landfill). The waters treated at UWWTP are discharged into the Maritsa River through an open channel with a length of 2.6 km.
WWTP Plovdiv is designed for treatment of domestic and industrial wastewater from Plovdiv. Until 2008, the WWTP treated wastewater only from the southern part of town (about 70% of the total flow of town). Wastewater from the north were collected and discharged directly into the Maritsa River without treatment. Currently, all wastewater is collected through a combined sewage system and enters the UWWTP for treatment. (In July 2008 a pumping station and a main north collector entered into service to bring wastewater from the northern part of town to UWWTP).
The existing UWWTP Plovdiv has a design capacity of BOD5 35.78 t/day 596,333 p.e. and a flow rate of 0.21 hm3/d (daily average water quantity).
The plant is designed for mechanical and biological treatment for removal of carbon up to the requirements for treated water to meet the Bulgarian standards for discharge into category III receiving water, the Maritsa River. The process scheme and the existing facilities are not intended for a higher level of wastewater treatment in terms of nutrients (N and P). The wastewater volume treated in UWWTP Plovdiv amounts between 145,000 and 202,000 m³/d, i.e. it does not currently exceed the design capacity (1984) – 213,000 m³/d (daily average water quantity). The proposed dimensional water quantities in the UWWTP Plovdiv project are Qday av. = 200,000 m3/day (level 2038 Qday av. = 173,937 m3/day – forecast). UWWTP performs self-monitoring. The laboratory at UWWTP Plovdiv performs daily laboratory analyses of pH, dissolved oxygen, suspended solids, BOD5, COD, NH4 and PO4 before and after the mechanical

Deliverable 1.1: Regional state of play analyses
Page 56 of 274
step and after the secondary settlement tank before the point of discharge. The total nitrogen and phosphorus are analysed each month, and heavy metals – every three months.
The wastewater from UWWTP Plovdiv will be treated up to the requirements for discharge into the receiving water and will not adversely affect the aquatic ecosystem in the area.
The Water Cycle Project of Plovdiv is currently being implemented. The project consists in reconstruction and extension of existing UWWTP Plovdiv by construction of new facilities, such as replacement of morally and physically obsolete equipment in some technological units, increasing the degree of purification in terms of nutrients N and P, upgrade of sludge management facility by commissioning modern equipment for anaerobic stabilization of the sludge, generated in the process of treatment and subsequent dewatering. The expected results from project realization include: suggestions for effective management of the sludge from UWWTP, achieving treated water parameters that meet the requirements of the permit for discharge into the Marishki Collector water body (South outflow channel), reducing the conditions for eutrophication, improving the quality of irrigation water and ensuring compliance with the regulatory requirements, ensuring sustainable development of the aquatic ecosystem of Maritsa water body achieving good emission status of the waters, and raising the self-purification ability of the Maritsa river and creating a positive effect on its cross-border impact, respectively.
The implementation of the project will ensure also optimal removal and treatment of wastewater collected in sewer networks that are currently discharged without appropriate purification that meets the goals set by Directive 91/271 / EEC requirements. This project includes the following measures concerning wastewaters: replacement of 13.428 km secondary sewerage network in order to improve the transportation and reduce the infiltration flow; rehabilitation of main collector VII and construction of a new collector with length of 2.746 km to ensure sufficient hydraulic capacity of the system. The approved project for reconstruction, modernization and completion of the WWTP – Plovdiv will reduce the flow of pollutants and biogenic elements in the receiving waterbody.
WWTP – Asenovgrad
"Project for rehabilitation of water supply and sewerage network and construction of WWTP, Assenovgrad, Bulgaria" is being implemented in the town of Asenovgrad in 2016. The project is planned to overcome the problems associated with existing water and wastewater infrastructure in the city of Asenovgrad and ensure environmentally sound water purification and discharge of domestic wastewater. The main activities envisaged under the project are:
1. Rehabilitation of water supply network with an expired service life, located in the sewerage network track
2. Rehabilitation of the combined sewer network with an expired service life. Expansion of the existing sewer network to the future construction of WWTP, closing the discharges of wastewater into the river and replacement/ rehabilitation and expansion of the existing sewers in the urban area as hydraulic future needs.
3. Construction of WWTP for 65,500 p.e. with mechanical and biological stage and degree of purification, including technical infrastructure in accordance with the requirements of Directive 91/271 / EEC.
The estimated population to be served by the rehabilitated water supply infrastructure is 2,645 permanent residents, while the population to be served by the rehabilitated mixed system is 49,626 permanent residents.
Identification of municipalities without any treatment
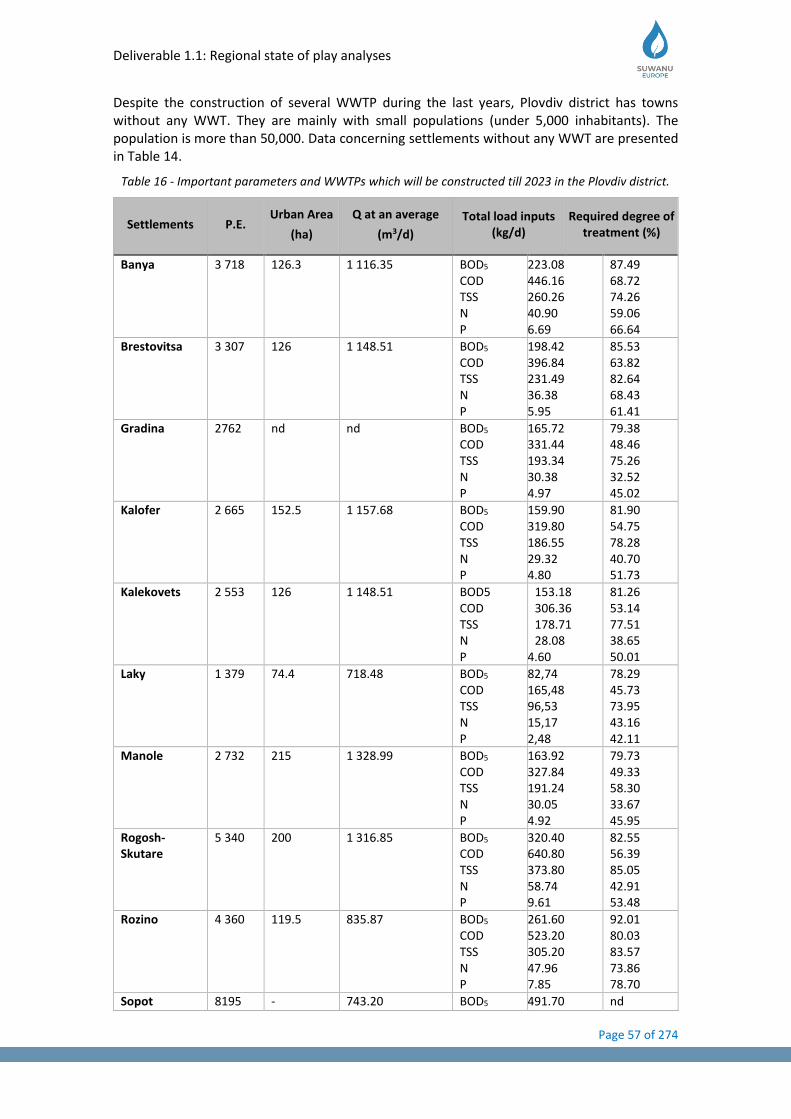
Deliverable 1.1: Regional state of play analyses
Page 57 of 274
Despite the construction of several WWTP during the last years, Plovdiv district has towns without any WWT. They are mainly with small populations (under 5,000 inhabitants). The population is more than 50,000. Data concerning settlements without any WWT are presented in Table 14.
Table 16 - Important parameters and WWTPs which will be constructed till 2023 in the Plovdiv district.
Settlements P.E. Urban Area
(ha)
Q at an average
(m3/d)
Total load inputs (kg/d)
Required degree of treatment (%)
Banya 3 718 126.3 1 116.35 BOD5 COD TSS N P
223.08 446.16 260.26 40.90 6.69
87.49 68.72 74.26 59.06 66.64
Brestovitsa 3 307 126 1 148.51 BOD5 COD TSS N P
198.42 396.84 231.49 36.38 5.95
85.53 63.82 82.64 68.43 61.41
Gradina 2762 nd nd BOD5 COD TSS N P
165.72 331.44 193.34 30.38 4.97
79.38 48.46 75.26 32.52 45.02
Kalofer 2 665 152.5 1 157.68 BOD5 COD TSS N P
159.90 319.80 186.55 29.32 4.80
81.90 54.75 78.28 40.70 51.73
Kalekovets 2 553 126 1 148.51 BOD5 COD TSS N P
153.18 306.36 178.71 28.08
4.60
81.26 53.14 77.51 38.65 50.01
Laky 1 379 74.4 718.48 BOD5 COD TSS N P
82,74 165,48 96,53 15,17 2,48
78.29 45.73 73.95 43.16 42.11
Manole 2 732 215 1 328.99 BOD5 COD TSS N P
163.92 327.84 191.24 30.05 4.92
79.73 49.33 58.30 33.67 45.95
Rogosh-Skutare
5 340 200 1 316.85 BOD5 COD TSS N P
320.40 640.80 373.80 58.74 9.61
82.55 56.39 85.05 42.91 53.48
Rozino 4 360 119.5 835.87 BOD5 COD TSS N P
261.60 523.20 305.20 47.96 7.85
92.01 80.03 83.57 73.86 78.70
Sopot 8195 - 743.20 BOD5 491.70 nd
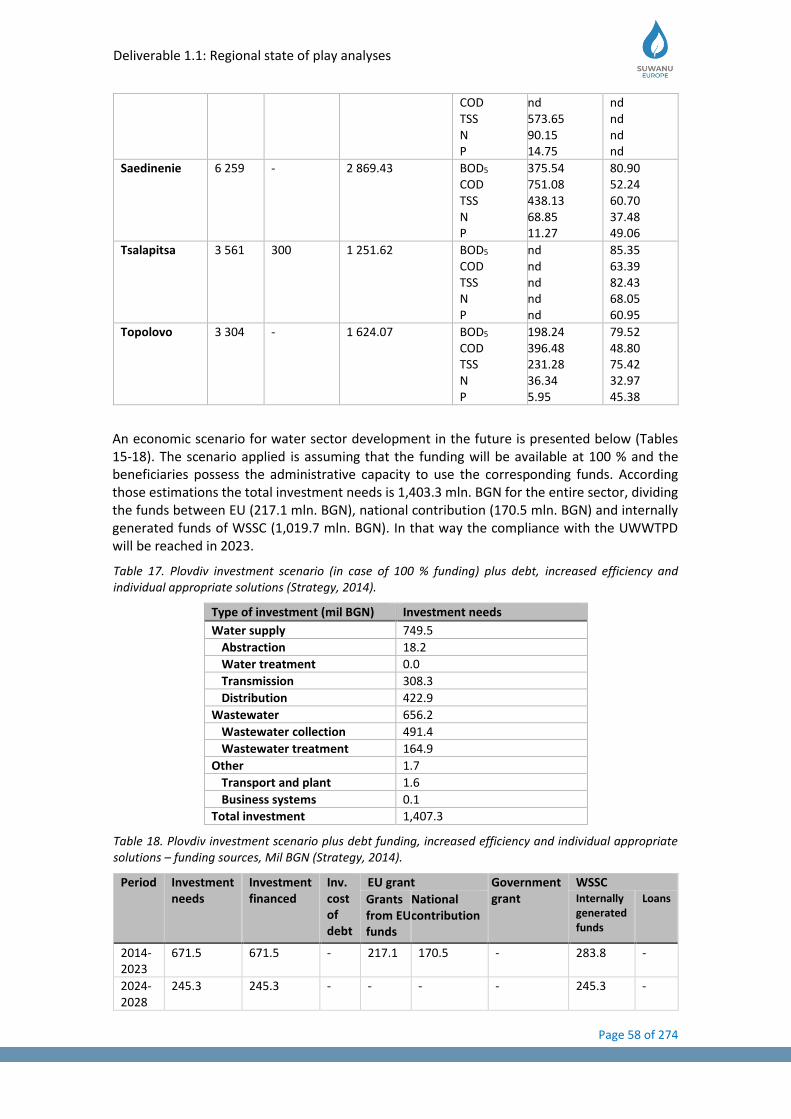
Deliverable 1.1: Regional state of play analyses
Page 58 of 274
COD TSS N P
nd 573.65 90.15 14.75
nd nd nd nd
Saedinenie 6 259 - 2 869.43 BOD5 COD TSS N P
375.54 751.08 438.13 68.85 11.27
80.90 52.24 60.70 37.48 49.06
Tsalapitsa 3 561 300 1 251.62 BOD5 COD TSS N P
nd nd nd nd nd
85.35 63.39 82.43 68.05 60.95
Topolovo 3 304 - 1 624.07 BOD5 COD TSS N P
198.24 396.48 231.28 36.34 5.95
79.52 48.80 75.42 32.97 45.38
An economic scenario for water sector development in the future is presented below (Tables 15-18). The scenario applied is assuming that the funding will be available at 100 % and the beneficiaries possess the administrative capacity to use the corresponding funds. According those estimations the total investment needs is 1,403.3 mln. BGN for the entire sector, dividing the funds between EU (217.1 mln. BGN), national contribution (170.5 mln. BGN) and internally generated funds of WSSC (1,019.7 mln. BGN). In that way the compliance with the UWWTPD will be reached in 2023.
Table 17. Plovdiv investment scenario (in case of 100 % funding) plus debt, increased efficiency and individual appropriate solutions (Strategy, 2014).
Type of investment (mil BGN) Investment needs
Water supply 749.5
Abstraction 18.2
Water treatment 0.0
Transmission 308.3
Distribution 422.9
Wastewater 656.2
Wastewater collection 491.4
Wastewater treatment 164.9
Other 1.7
Transport and plant 1.6
Business systems 0.1
Total investment 1,407.3
Table 18. Plovdiv investment scenario plus debt funding, increased efficiency and individual appropriate solutions – funding sources, Mil BGN (Strategy, 2014).
Period Investment needs
Investment financed
Inv. cost of debt
EU grant Government grant
WSSC
Grants from EU funds
National contribution
Internally generated funds
Loans
2014-2023
671.5 671.5 - 217.1 170.5 - 283.8 -
2024-2028
245.3 245.3 - - - - 245.3 -
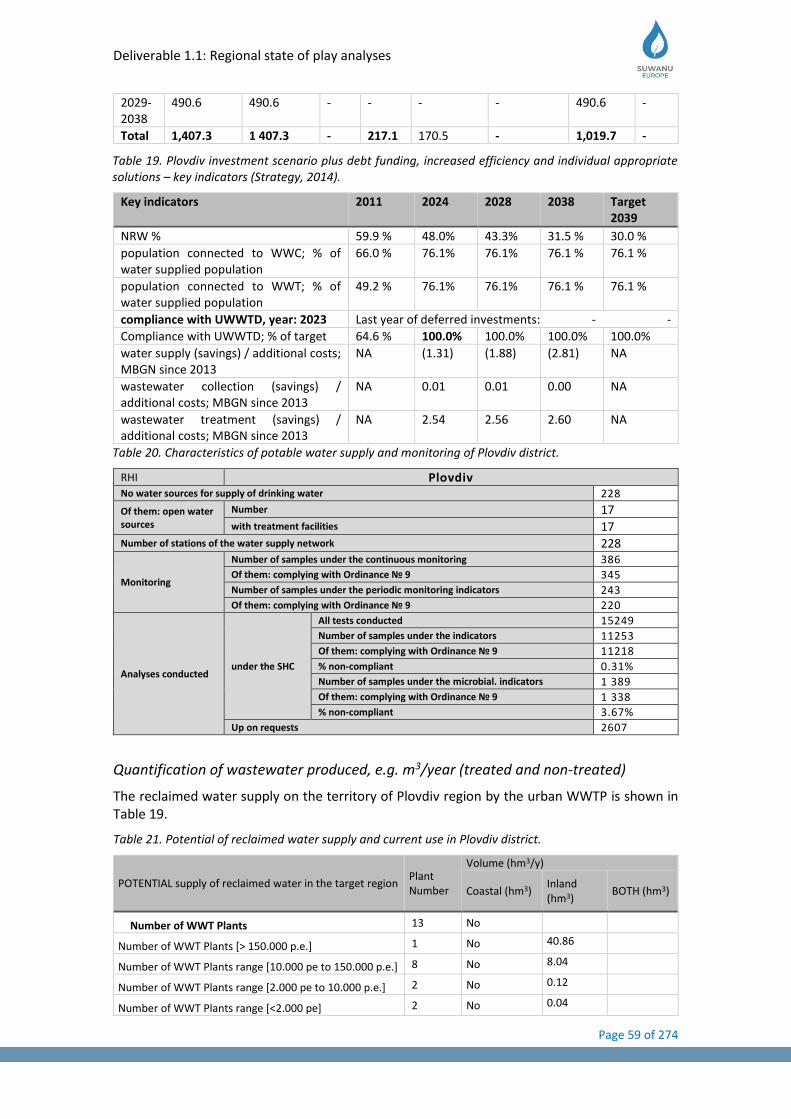
Deliverable 1.1: Regional state of play analyses
Page 59 of 274
2029-2038
490.6 490.6 - - - - 490.6 -
Total 1,407.3 1 407.3 - 217.1 170.5 - 1,019.7 -
Table 19. Plovdiv investment scenario plus debt funding, increased efficiency and individual appropriate solutions – key indicators (Strategy, 2014).
Key indicators 2011 2024 2028 2038 Target 2039
NRW % 59.9 % 48.0% 43.3% 31.5 % 30.0 %
population connected to WWC; % of water supplied population
66.0 % 76.1% 76.1% 76.1 % 76.1 %
population connected to WWT; % of water supplied population
49.2 % 76.1% 76.1% 76.1 % 76.1 %
compliance with UWWTD, year: 2023 Last year of deferred investments: - -
Compliance with UWWTD; % of target 64.6 % 100.0% 100.0% 100.0% 100.0%
water supply (savings) / additional costs; MBGN since 2013
NA (1.31) (1.88) (2.81) NA
wastewater collection (savings) / additional costs; MBGN since 2013
NA 0.01 0.01 0.00 NA
wastewater treatment (savings) / additional costs; MBGN since 2013
NA 2.54 2.56 2.60 NA
Table 20. Characteristics of potable water supply and monitoring of Plovdiv district.
RHI Plovdiv No water sources for supply of drinking water 228
Of them: open water sources
Number 17 with treatment facilities 17
Number of stations of the water supply network 228
Monitoring
Number of samples under the continuous monitoring 386 Of them: complying with Ordinance № 9 345 Number of samples under the periodic monitoring indicators 243 Of them: complying with Ordinance № 9 220
Analyses conducted under the SHC
All tests conducted 15249 Number of samples under the indicators 11253 Of them: complying with Ordinance № 9 11218 % non-compliant 0.31% Number of samples under the microbial. indicators 1 389 Of them: complying with Ordinance № 9 1 338 % non-compliant 3.67%
Up on requests 2607
Quantification of wastewater produced, e.g. m3/year (treated and non-treated)
The reclaimed water supply on the territory of Plovdiv region by the urban WWTP is shown in Table 19.
Table 21. Potential of reclaimed water supply and current use in Plovdiv district.
POTENTIAL supply of reclaimed water in the target region Plant Number
Volume (hm3/y)
Coastal (hm3) Inland (hm3)
BOTH (hm3)
Number of WWT Plants 13 No
Number of WWT Plants [> 150.000 p.e.] 1 No 40.86
Number of WWT Plants range [10.000 pe to 150.000 p.e.] 8 No 8.04
Number of WWT Plants range [2.000 pe to 10.000 p.e.] 2 No 0.12
Number of WWT Plants range [<2.000 pe] 2 No 0.04
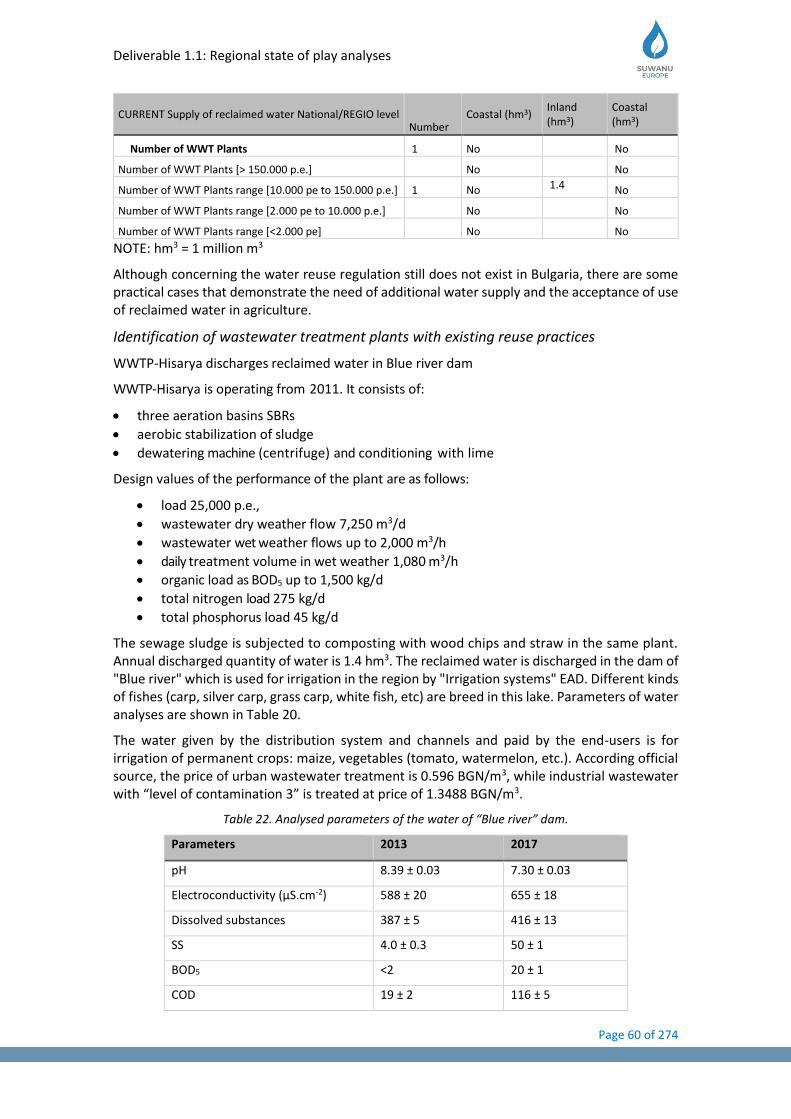
Deliverable 1.1: Regional state of play analyses
Page 60 of 274
CURRENT Supply of reclaimed water National/REGIO level Number
Coastal (hm3) Inland (hm3)
Coastal (hm3)
Number of WWT Plants 1 No No
Number of WWT Plants [> 150.000 p.e.] No No
Number of WWT Plants range [10.000 pe to 150.000 p.e.] 1 No 1.4 No
Number of WWT Plants range [2.000 pe to 10.000 p.e.] No No
Number of WWT Plants range [<2.000 pe] No No
NOTE: hm3 = 1 million m3
Although concerning the water reuse regulation still does not exist in Bulgaria, there are some practical cases that demonstrate the need of additional water supply and the acceptance of use of reclaimed water in agriculture.
Identification of wastewater treatment plants with existing reuse practices
WWTP-Hisarya discharges reclaimed water in Blue river dam
WWTP-Hisarya is operating from 2011. It consists of:
• three aeration basins SBRs
• aerobic stabilization of sludge
• dewatering machine (centrifuge) and conditioning with lime
Design values of the performance of the plant are as follows:
• load 25,000 p.e.,
• wastewater dry weather flow 7,250 m3/d
• wastewater wet weather flows up to 2,000 m3/h
• daily treatment volume in wet weather 1,080 m3/h
• organic load as BOD5 up to 1,500 kg/d
• total nitrogen load 275 kg/d
• total phosphorus load 45 kg/d
The sewage sludge is subjected to composting with wood chips and straw in the same plant. Annual discharged quantity of water is 1.4 hm3. The reclaimed water is discharged in the dam of "Blue river" which is used for irrigation in the region by "Irrigation systems" EAD. Different kinds of fishes (carp, silver carp, grass carp, white fish, etc) are breed in this lake. Parameters of water analyses are shown in Table 20.
The water given by the distribution system and channels and paid by the end-users is for irrigation of permanent crops: maize, vegetables (tomato, watermelon, etc.). According official source, the price of urban wastewater treatment is 0.596 BGN/m3, while industrial wastewater with “level of contamination 3” is treated at price of 1.3488 BGN/m3.
Table 22. Analysed parameters of the water of “Blue river” dam.
Parameters 2013 2017
pH 8.39 ± 0.03 7.30 ± 0.03
Electroconductivity (µS.cm-2) 588 ± 20 655 ± 18
Dissolved substances 387 ± 5 416 ± 13
SS 4.0 ± 0.3 50 ± 1
BOD5 <2 20 ± 1
COD 19 ± 2 116 ± 5
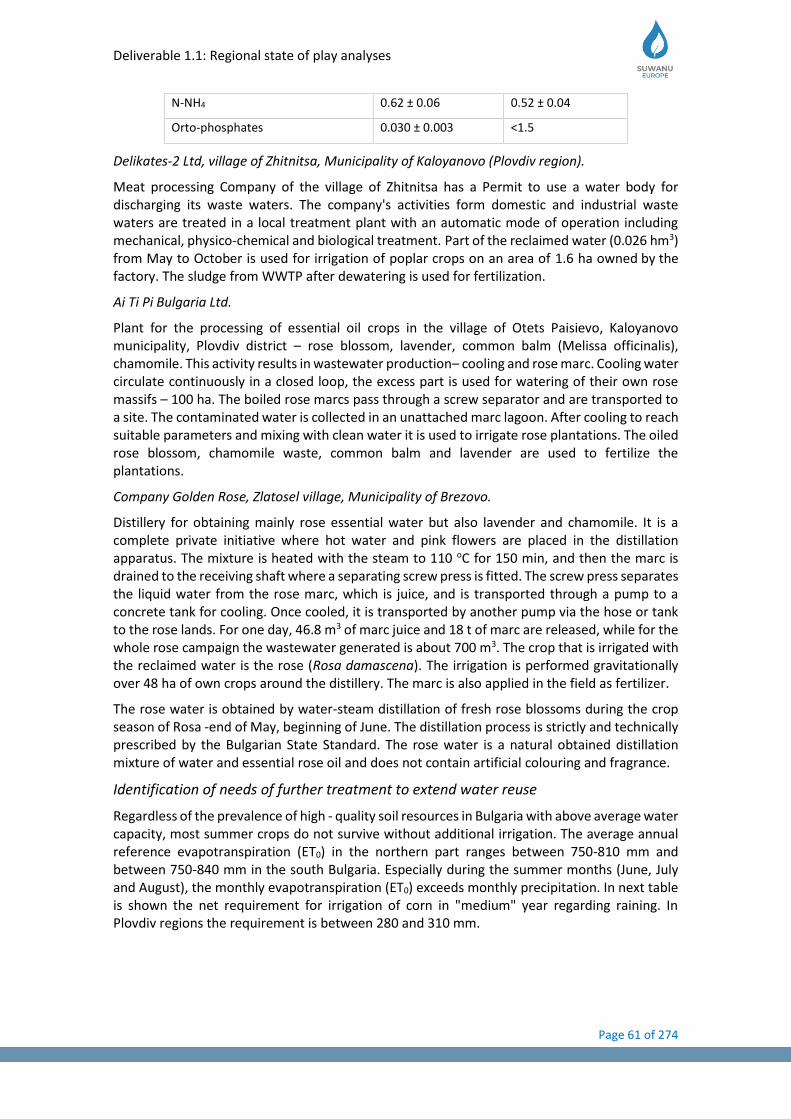
Deliverable 1.1: Regional state of play analyses
Page 61 of 274
N-NH4 0.62 ± 0.06 0.52 ± 0.04
Orto-phosphates 0.030 ± 0.003 <1.5
Delikates-2 Ltd, village of Zhitnitsa, Municipality of Kaloyanovo (Plovdiv region).
Meat processing Company of the village of Zhitnitsa has a Permit to use a water body for discharging its waste waters. The company's activities form domestic and industrial waste waters are treated in a local treatment plant with an automatic mode of operation including mechanical, physico-chemical and biological treatment. Part of the reclaimed water (0.026 hm3) from May to October is used for irrigation of poplar crops on an area of 1.6 ha owned by the factory. The sludge from WWTP after dewatering is used for fertilization.
Ai Ti Pi Bulgaria Ltd.
Plant for the processing of essential oil crops in the village of Otets Paisievo, Kaloyanovo municipality, Plovdiv district – rose blossom, lavender, common balm (Melissa officinalis), chamomile. This activity results in wastewater production– cooling and rose marc. Cooling water circulate continuously in a closed loop, the excess part is used for watering of their own rose massifs – 100 ha. The boiled rose marcs pass through a screw separator and are transported to a site. The contaminated water is collected in an unattached marc lagoon. After cooling to reach suitable parameters and mixing with clean water it is used to irrigate rose plantations. The oiled rose blossom, chamomile waste, common balm and lavender are used to fertilize the plantations.
Company Golden Rose, Zlatosel village, Municipality of Brezovo.
Distillery for obtaining mainly rose essential water but also lavender and chamomile. It is a complete private initiative where hot water and pink flowers are placed in the distillation apparatus. The mixture is heated with the steam to 110 oC for 150 min, and then the marc is drained to the receiving shaft where a separating screw press is fitted. The screw press separates the liquid water from the rose marc, which is juice, and is transported through a pump to a concrete tank for cooling. Once cooled, it is transported by another pump via the hose or tank to the rose lands. For one day, 46.8 m3 of marc juice and 18 t of marc are released, while for the whole rose campaign the wastewater generated is about 700 m3. The crop that is irrigated with the reclaimed water is the rose (Rosa damascena). The irrigation is performed gravitationally over 48 ha of own crops around the distillery. The marc is also applied in the field as fertilizer.
The rose water is obtained by water-steam distillation of fresh rose blossoms during the crop season of Rosa -end of May, beginning of June. The distillation process is strictly and technically prescribed by the Bulgarian State Standard. The rose water is a natural obtained distillation mixture of water and essential rose oil and does not contain artificial colouring and fragrance.
Identification of needs of further treatment to extend water reuse
Regardless of the prevalence of high - quality soil resources in Bulgaria with above average water capacity, most summer crops do not survive without additional irrigation. The average annual reference evapotranspiration (ET0) in the northern part ranges between 750-810 mm and between 750-840 mm in the south Bulgaria. Especially during the summer months (June, July and August), the monthly evapotranspiration (ET0) exceeds monthly precipitation. In next table is shown the net requirement for irrigation of corn in "medium" year regarding raining. In Plovdiv regions the requirement is between 280 and 310 mm.
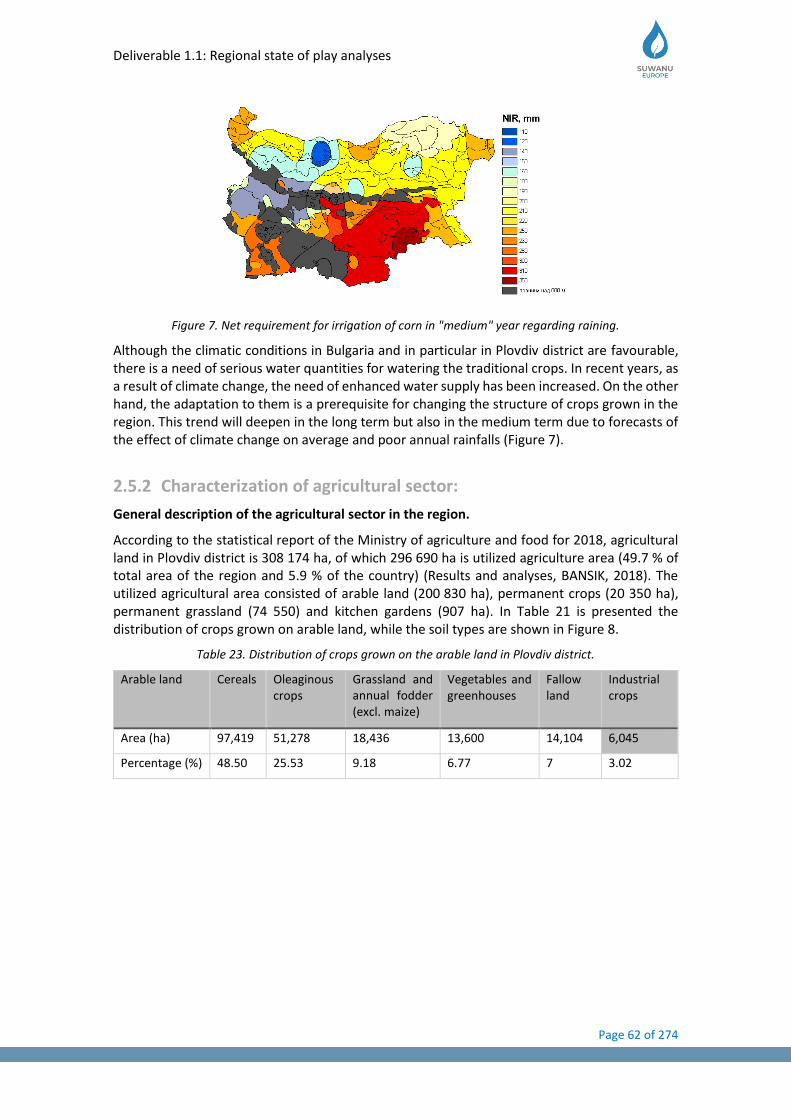
Deliverable 1.1: Regional state of play analyses
Page 62 of 274
Figure 7. Net requirement for irrigation of corn in "medium" year regarding raining.
Although the climatic conditions in Bulgaria and in particular in Plovdiv district are favourable, there is a need of serious water quantities for watering the traditional crops. In recent years, as a result of climate change, the need of enhanced water supply has been increased. On the other hand, the adaptation to them is a prerequisite for changing the structure of crops grown in the region. This trend will deepen in the long term but also in the medium term due to forecasts of the effect of climate change on average and poor annual rainfalls (Figure 7).
2.5.2 Characterization of agricultural sector:
General description of the agricultural sector in the region.
According to the statistical report of the Ministry of agriculture and food for 2018, agricultural land in Plovdiv district is 308 174 ha, of which 296 690 ha is utilized agriculture area (49.7 % of total area of the region and 5.9 % of the country) (Results and analyses, BANSIK, 2018). The utilized agricultural area consisted of arable land (200 830 ha), permanent crops (20 350 ha), permanent grassland (74 550) and kitchen gardens (907 ha). In Table 21 is presented the distribution of crops grown on arable land, while the soil types are shown in Figure 8.
Table 23. Distribution of crops grown on the arable land in Plovdiv district.
Arable land Cereals Oleaginous crops
Grassland and annual fodder (excl. maize)
Vegetables and greenhouses
Fallow land
Industrial crops
Area (ha) 97,419 51,278 18,436 13,600 14,104 6,045
Percentage (%) 48.50 25.53 9.18 6.77 7 3.02
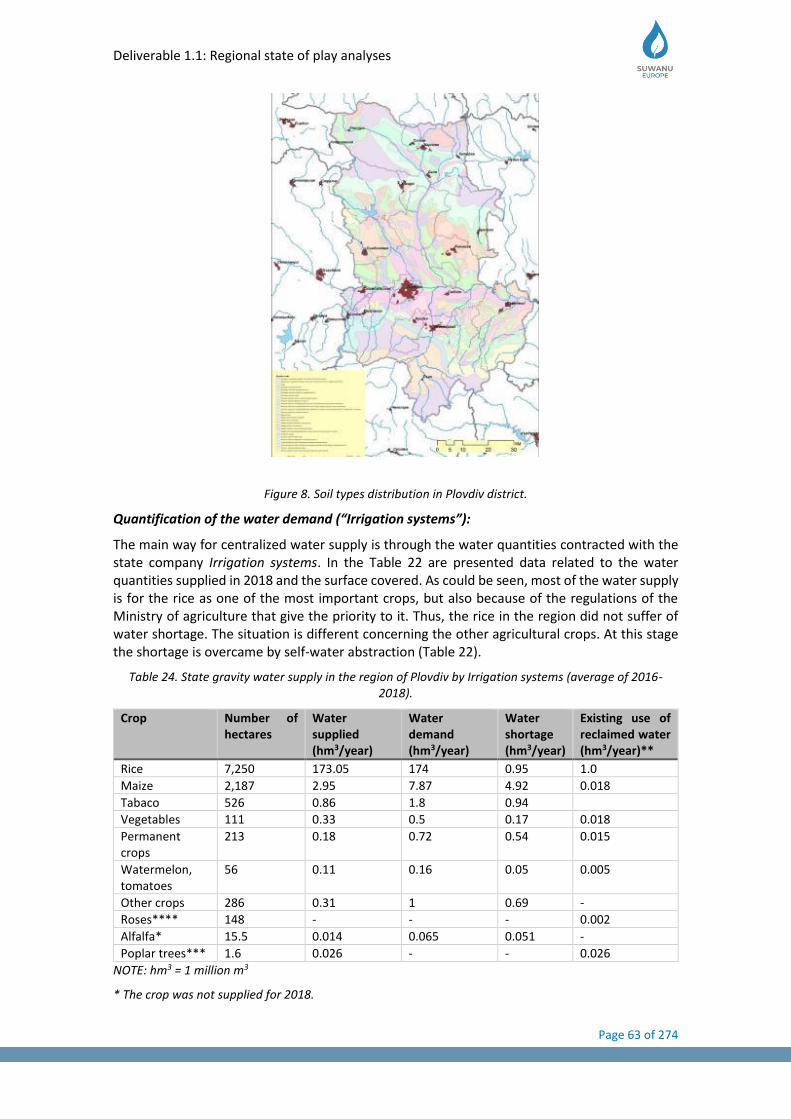
Deliverable 1.1: Regional state of play analyses
Page 63 of 274
Figure 8. Soil types distribution in Plovdiv district.
Quantification of the water demand (“Irrigation systems”):
The main way for centralized water supply is through the water quantities contracted with the state company Irrigation systems. In the Table 22 are presented data related to the water quantities supplied in 2018 and the surface covered. As could be seen, most of the water supply is for the rice as one of the most important crops, but also because of the regulations of the Ministry of agriculture that give the priority to it. Thus, the rice in the region did not suffer of water shortage. The situation is different concerning the other agricultural crops. At this stage the shortage is overcame by self-water abstraction (Table 22).
Table 24. State gravity water supply in the region of Plovdiv by Irrigation systems (average of 2016-2018).
Crop Number of hectares
Water supplied (hm3/year)
Water demand (hm3/year)
Water shortage (hm3/year)
Existing use of reclaimed water (hm3/year)**
Rice 7,250 173.05 174 0.95 1.0
Maize 2,187 2.95 7.87 4.92 0.018
Tabaco 526 0.86 1.8 0.94
Vegetables 111 0.33 0.5 0.17 0.018
Permanent crops
213 0.18 0.72 0.54 0.015
Watermelon, tomatoes
56 0.11 0.16 0.05 0.005
Other crops 286 0.31 1 0.69 -
Roses**** 148 - - - 0.002
Alfalfa* 15.5 0.014 0.065 0.051 -
Poplar trees*** 1.6 0.026 - - 0.026
NOTE: hm3 = 1 million m3
* The crop was not supplied for 2018.

Deliverable 1.1: Regional state of play analyses
Page 64 of 274
** Data related to the water supply from the dam “Blue river”
*** Case of Delikates-2, village of Zhitnitsa
**** Private initiatives of rose growing and oil distillation
Although the use of reclaimed water is not regulated in Bulgaria, there aren’t any prohibitions on it. The unique regulation is related to the Ordinance No 18 on the quality of water for irrigation of agricultural crops that establish certain restrictions. Based on that different companies apply reclaimed waters resulted by their own activities (Table 22).
Description of the cost for the service "Supply of water for irrigation" through the branch network of Irrigation Systems EAD
The supply of irrigation water through the branch network of Irrigation Systems EAD is carried, based on individual contract, between provider and users of the service supply of water for irrigation. Normally, the contracts are concluded for one year and, under certain conditions, for more, but not more than 10 years. The extended term is a new option.
The price of the service: "Supply of water for irrigation" is cost- oriented and regional – it is fixed up, according to the location of the areas each branch of the IS serves. The price is calculated, based on the costs of "Irrigation Systems" EAD related with the activity - Supply of water for irrigation and profit.
According to the European Parliament's Regulation (EU) 2016/679, two components are cumulatively included in the price: the price of a delivered volume of water and price per unit area. The proportion of components in the total price is determined by the supplier for each irrigation season.
Depending on how the water is delivered and the type of crop, the price for the delivered volume is determined for:
- gravity-supplied water for arable crops; - pumped water supply for arable crops, with maximum permissible prices for rise - up to
50m, over 50m and under 100m, over 100m; / bound to the pressure of the pumping water supply and how many steps it is. The Maritza Branch has only one step;
- gravity-supplied water for rice; - pumped water for rice;
The constant price per hectare/per unit area/ is determined by dividing the corresponding part of the expenditure into the estimated area in hectares.
The cost of water supplied/per cubic meter/ is determined by dividing the respective part of the cost into the estimated volume of water (m3) for the respective irrigation season. It is paid after each irrigation, based on volumes of water used in cubic meters;
Irrigation Systems EAD and water users with no obligations/owes to them and with areas over 500 hectares, can negotiate trade discounts of 8 % of the water price.
The prices determined by the Board of Directors of Irrigation Systems EAD tailored with respect to Methodology approved by the Minister of Agriculture and Forestry by letter No. 70-1851 / 04.05.2018 and remains unchanged for 2019 are as follows:
-Permanent price per decare of irrigated area rice BGN 48/ha
-Gravity-supplied water for rice BGN 0.02 /m3
-Pumped water for rice BGN 0.026/m3
-Permanent price per hectare area of arable crops BGN 70/ha
-Gravitationally supplied water BGN 0.11/m3
Deliverable 1.1: Regional state of play analyses
Page 65 of 274
-Pumping supplied water 1st step BGN 0.18/m3
Total price for irrigation per customer, is the sum of the constant price per decare, multiplied by the irrigated hectares, and the price per cubic meter (m3), multiplied by the volume of water delivered.
In the public discussion about applying the Tables (Annex 1 and 2 from Methodology approved by the Minister of Agriculture and Forestry by letter No. 70-1851 / 04.05.2018, it is found that the calculated price for water supply is not corresponding to the activity of irrigation – meaning large amount for constant price for decare in the first and each subsequent irrigation and extremely low price of the delivered volume of water.
Although the supply service is oriented towards WATER and considering the different water consumption norms (water need of a particular crop according to the way of water supply in the property with indicative irrigation standards once by dripping - 30 cubic meters/decare, by sprinkling - 70 cubic meters/decare and by gravity –110 cubic meters/decare), it does not matter how is irrigated, because the total value of the service was almost the same.
The approaches over the years have been on a similar principle, with the main aim to cover the expenditures. Profit is not calculated in the price - it is a result of the forecast. The estimation of the expected costs is a result of a careful calculation, on the basis of prognosis for planned farming, past periods and practical experience.
After price analysis is noticeable that in recent years, despite the changes that have been made in regulatory terms, the size of the price, as expense for the farmer is kept in the same range without abrupt changes, which is an important mechanism for preservation of agriculture in the region of Plovdiv, and a prerequisite for its development.
Description of water shortage risks and how this can affect to agriculture production
According to an analysis of projected water demand, Bulgaria is not a water stressed country. Over 60 rivers flow through Bulgaria, the Danube, is the longest one with 470 km within Bulgaria.
The identified risks which can affect agriculture production are:
• Increase in periods of heavy rainfall putting drainage systems under stress, leading to more frequent and more severe flooding.
• Heavy rains and muddy streams interrupting the functioning of pumping stations that are part of the irrigation systems
• Continuous dry periods and soil shrinkage causing the formation of expansion gaps in the earth and deformation of the hydro-melioration canals
• Hotter, drier summers leading to increased irrigation needs that, in combination with less water stored in dams, can lead to water shortage (Generation and discharge of wastewater, 2018).
Non-irrigated sector in the region
The entire irrigation system branch Maritsa's network was set up to serve 108,181 ha of agricultural land by gravity irrigation. Only 73,703 ha are currently supplied through the company's network. The remaining 34,478 ha of irrigation systems have to be restored because they have been compromised over the years, and the respective areas are officially under non-irrigable crop cultivation. Therefore, there are areas in the region of Plovdiv, for which the IS cannot provide any water quantities due to lack of water resources or reduction over the years, lack of infrastructure (dams) – almost whole the territory of the municipalities Karlovo, Sopot and Asenovgrad.
In the irrigation priority is given to feed the rice cells with water and to keep the full quantity of water necessary for its growing in the 4-month season - 0.024 hm3/ha and then for the other
Deliverable 1.1: Regional state of play analyses
Page 66 of 274
crops. Number of rice farms in Plovdiv region is 51 and the rice areas are more than 7,250 ha. Water needed for their use is 174 hm3/season (year) (Rice production, 2018).
Agribusiness description
Structure of agrifood firms (average size)
The market for agrifood products in Bulgaria is quite fragmented. Sixty percent of the products for this sector comes out of small and medium-sized companies. The sector is expected to consolidate in the near future. The sector has a strong export orientation.
Food industry structure and stakeholders
The food and beverage industry are boosted by the rapidly developing farming sector. Production is carried out by about 5 500 companies with almost half of them located in the South-Central and South-West region. Region of Plovdiv is one of the main centres of fruits and vegetables processing (fruits and vegetables canning and drying), where are located some of the top companies in the food industry with international importance.
International trade
The contribution of the agri sector to the country’s external trade is quite significant. About 72 % of Bulgarian exports of agricultural produce went to the EU, while Russia, Ukraine, Turkey, and the Arab countries recovered their former position as major export markets.
Competitiveness of Agri-business sector
The food industry ranks first in the territory of the Plovdiv region with about 30% of the total production in the region. The main problem in development of the agricultural sector is the competition of imported products which leads to negative trends and demotivation of producers.
International Fair Plovdiv organizes over 40 exhibition events per year. Among them is the only Balkan mega forum for agribusiness, food, wine and tourism, which brings together six exhibitions, related to agriculture, manufacturing and supply of food, wines and spirits. Each year, over 8,000 exhibitors from 60 countries and 250,000 visitors from Bulgaria and Europe take part in the business forums, representing about 250 sectors.
R+D support institutions
The state administration has assessed Plovdiv's need for a new economic cluster related to the integration of agricultural production and food technologies, which will fundamentally change its economic profile. Thus, the concept of creating a high-tech cluster with the name “Agro Food Tech” was set up in the city.
"Agro Food Tech" is a high-tech park, representing an administrative, business, logistical, scientific and production centre of the national cluster of food and food technologies. The Park is a cluster initiative bringing together companies, laboratories and agencies from all areas of agriculture and the food industry. The park is a combination of innovation and entrepreneurship that covers the territory of several municipalities - Plovdiv, Maritsa, Rodopi, Saedinovo, Karlovo, Kaloyanovo, as well as municipalities from neighbouring areas such as Pazardzhik and Stara Zagora. It is a territory where all kinds of agricultural produce are developed; there are key agricultural education units and several scientific institutes. At the same time, this territory has extensive experience in the storage, distribution and development of varieties for agricultural production.
Water user associations, role in water distribution and structure
Currently there are eight Irrigation associations (IA) existing on the territory of "Irrigation Systems" – Maritza Branch with total Serving area of 6,944.9 ha and water demand for irrigation
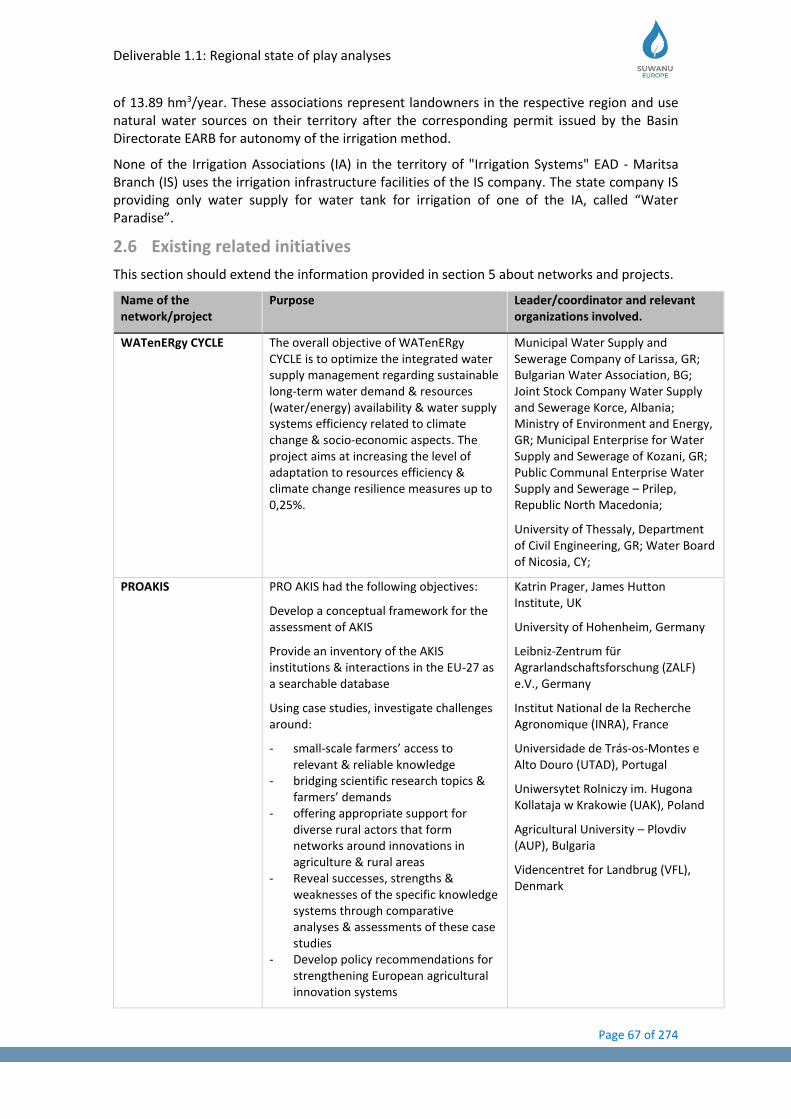
Deliverable 1.1: Regional state of play analyses
Page 67 of 274
of 13.89 hm3/year. These associations represent landowners in the respective region and use natural water sources on their territory after the corresponding permit issued by the Basin Directorate EARB for autonomy of the irrigation method.
None of the Irrigation Associations (IA) in the territory of "Irrigation Systems" EAD - Maritsa Branch (IS) uses the irrigation infrastructure facilities of the IS company. The state company IS providing only water supply for water tank for irrigation of one of the IA, called “Water Paradise”.
2.6 Existing related initiatives
This section should extend the information provided in section 5 about networks and projects.
Name of the network/project
Purpose Leader/coordinator and relevant organizations involved.
WATenERgy CYCLE The overall objective of WATenERgy CYCLE is to optimize the integrated water supply management regarding sustainable long-term water demand & resources (water/energy) availability & water supply systems efficiency related to climate change & socio-economic aspects. The project aims at increasing the level of adaptation to resources efficiency & climate change resilience measures up to 0,25%.
Municipal Water Supply and Sewerage Company of Larissa, GR; Bulgarian Water Association, BG; Joint Stock Company Water Supply and Sewerage Korce, Albania; Ministry of Environment and Energy, GR; Municipal Enterprise for Water Supply and Sewerage of Kozani, GR; Public Communal Enterprise Water Supply and Sewerage – Prilep, Republic North Macedonia;
University of Thessaly, Department of Civil Engineering, GR; Water Board of Nicosia, CY;
PROAKIS PRO AKIS had the following objectives:
Develop a conceptual framework for the assessment of AKIS
Provide an inventory of the AKIS institutions & interactions in the EU-27 as a searchable database
Using case studies, investigate challenges around:
- small-scale farmers’ access to relevant & reliable knowledge
- bridging scientific research topics & farmers’ demands
- offering appropriate support for diverse rural actors that form networks around innovations in agriculture & rural areas
- Reveal successes, strengths & weaknesses of the specific knowledge systems through comparative analyses & assessments of these case studies
- Develop policy recommendations for strengthening European agricultural innovation systems
Katrin Prager, James Hutton Institute, UK
University of Hohenheim, Germany
Leibniz-Zentrum für Agrarlandschaftsforschung (ZALF) e.V., Germany
Institut National de la Recherche Agronomique (INRA), France
Universidade de Trás-os-Montes e Alto Douro (UTAD), Portugal
Uniwersytet Rolniczy im. Hugona Kollataja w Krakowie (UAK), Poland
Agricultural University – Plovdiv (AUP), Bulgaria
Videncentret for Landbrug (VFL), Denmark
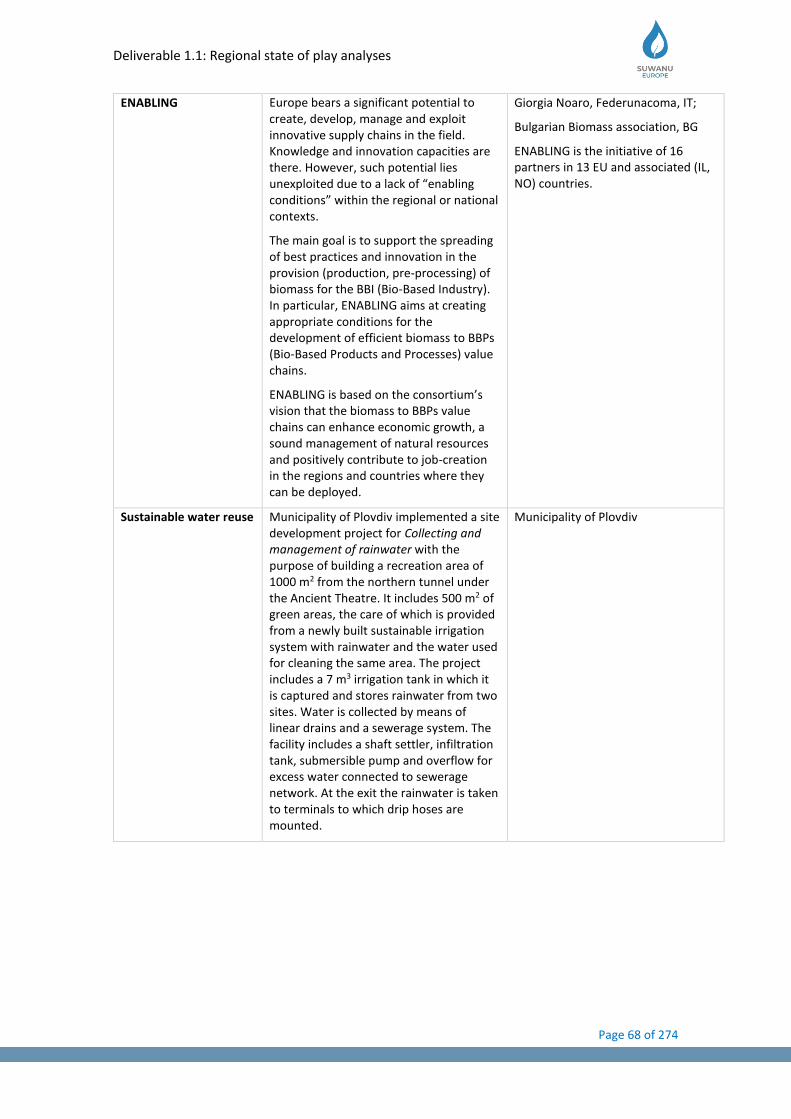
Deliverable 1.1: Regional state of play analyses
Page 68 of 274
ENABLING Europe bears a significant potential to create, develop, manage and exploit innovative supply chains in the field. Knowledge and innovation capacities are there. However, such potential lies unexploited due to a lack of “enabling conditions” within the regional or national contexts.
The main goal is to support the spreading of best practices and innovation in the provision (production, pre-processing) of biomass for the BBI (Bio-Based Industry). In particular, ENABLING aims at creating appropriate conditions for the development of efficient biomass to BBPs (Bio-Based Products and Processes) value chains.
ENABLING is based on the consortium’s vision that the biomass to BBPs value chains can enhance economic growth, a sound management of natural resources and positively contribute to job-creation in the regions and countries where they can be deployed.
Giorgia Noaro, Federunacoma, IT;
Bulgarian Biomass association, BG
ENABLING is the initiative of 16 partners in 13 EU and associated (IL, NO) countries.
Sustainable water reuse Municipality of Plovdiv implemented a site development project for Collecting and management of rainwater with the purpose of building a recreation area of 1000 m2 from the northern tunnel under the Ancient Theatre. It includes 500 m2 of green areas, the care of which is provided from a newly built sustainable irrigation system with rainwater and the water used for cleaning the same area. The project includes a 7 m3 irrigation tank in which it is captured and stores rainwater from two sites. Water is collected by means of linear drains and a sewerage system. The facility includes a shaft settler, infiltration tank, submersible pump and overflow for excess water connected to sewerage network. At the exit the rainwater is taken to terminals to which drip hoses are mounted.
Municipality of Plovdiv
Deliverable 1.1: Regional state of play analyses
Page 69 of 274
2.7 Discussion and conclusion remarks
At country level, there is no annual water resource deficit. The seasonal flow variations of surface water bodies are regulated by enough numbers of reservoirs. However, there are regions, suffering from water shortage for water supply needs in the summer months. The East Aegean River Basin is with highest amount of available water resources except the Danube River Basin, because of its huge external inflow. In addition, two-third of the groundwaters and one-third of the surface water bodies are in a good ecological status. The Black Sea River Basin has the smallest percentage of achieved objectives (5 percent) for surface water bodies and the highest number of groundwater bodies in “poor condition”.
Bulgaria has a significant stock of hydraulic storage capacity, including 216 large dams. The total capacity of 53 multi-purpose and significant dams amounts to 6,697.8 hm3. Twenty-three of them are in the East Aegean Region, representing a total storage volume of 3,105.5 hm3. In the period 2007–2015 there was a steady reduction in the volumes of abstracted water (decline of population, irrigation, and industrial use). Surface water resources are used mainly for industrial needs (cooling and energy production), while groundwater resources are used mainly for domestic water supply.
Despite the highest improvement dynamics in this subsector, in general till now the biggest part of the infrastructure is outdated as well as designed and operated without climate change considerations. On the other hand, future investments in the urban WWT sector is a good prerequisite for reclaimed water use in case of right planning.
The melioration infrastructure is either destroyed or in poor condition. Insufficient maintenance and monitoring related to engineering safety have created a situation, which represents risks to the population, settlements, agricultural land, and the infrastructure. In view of climate change, the probability of these risks increases.
There are good interconnections between different players in water sector that is a premise for future development in the field of reclaimed water use. The use of reclaimed water in Bulgaria is not regulated. In Plovdiv district there are several private initiatives related to the use of reclaimed water for irrigation of crops. Stimulation measures (financial and legislative) are needed to push the development of the sector.
Deliverable 1.1: Regional state of play analyses
Page 70 of 274
2.8 References
Advisory Services on a National Climate Change Adaptation Strategy and Action Plan. Appendix 9: Assessment of the Water Sector, Project number P160511, 2018.
Agri-environmental activities and other activities. 2018. Ministry of agriculture and food, http://www.mzh.government.bg/media/filer_public/2018/02/13/ac2010-5-.pdf
Assessment of operational costs for irrigation of agricultural crops with travelling gun sprinklers, Scientific proceedings II international scientific conference, "Conserving soils and water", 2017
Danube water program. Documents. (danube-water-program.org | danubis.org), 2015.
Dineva S. 2017. Sustainable Regional Development Perspectives. Irrigation. Hydromelioration and Human Resources in The Field of Agriculture. Jubilee International Scientific Conference “Bulgaria of regions 2017”.
Energy and water regulation commission. WAREG. European water regulators. (https://www.wareg.org/members.php?q=view&id=4).
Enumeration of the agricultural farms. 2011. Public census in 2010 [BG].
Generation and discharge of wastewater – total for the country, by Statistical Region and River Basin District, National statistical institute, http://www.nsi.bg/en/content/5148/generation-and-discharge-wastewater-total-country-statistical-region-and-river-basin .
Hydrology of Maritsa and Tundzha rivers, National Institute of Meteorology and Hydrology (NIMH) and the East Aegean River Basin Directorate of the Ministry of Environment and Water https://maritsa.meteo.bg/apache2-default/maritsa/static/about.php?infoto=hydro
Kostadinova, G., Dermendzhieva D., Beev G., et al., 2017. Quality assessment of Maritsa river water as a main source for irrigation in Thracian valley Fresenius Environmental Bulletin 26(7):4367-4374.
National Report on the Status and Protection of the Environment in Bulgaria, 2016. Executive Environment Agency, Sofia, 55-68.
Official report from Ministry of agriculture and food, Official farms counting” http://www.mzh.government.bg/media/filer_public/2018/02/21/216-publication-census2010-plovdiv.pdf
Regulation No. 18. 2009. Water quality for irrigation of agricultural crops. State Gazette No. 43, 09.06.2009.
Report on the status of surface water in the East Aegean Basin, Water Management Basin Directorate. RSSW-EAB, Plovdiv, 2015. 1-6.
Results and analysis, BANSIK, Final results of the Urban structure in Bulgaria, Agro statistics, Ministry of agriculture and food, 2018.
Rice production, trade and support in Bulgaria. 2017. Ministry of agriculture, food and forests. http://ec.europa.eu/transparency/regexpert/index.cfm?do=groupDetail.groupDetailDoc&id=32962&no=2
Sapundzhiev D, Mitreva Z. 2016. Agro-climatic potential of the South Central Planning Region, ISSAPP “N. Poushkarov”, Soil Science Agrochemisty and Ecology, 50, pp. 3-4.
Deliverable 1.1: Regional state of play analyses
Page 71 of 274
Statistical Yearbook. 2017. National statistical institute. http://www.nsi.bg/en/content/16248/%D0%BF%D1%83%D0%B1%D0%BB%D0%B8%D0%BA%D0%B0%D1%86%D0%B8%D1%8F/statistical-yearbook-2017
Strategy for development and management of the water supply and sanitation sector in the republic of Bulgaria 2014 – 2023 (Approved by Council of Minister’s Decision No 269 of May 7, 2014), vol. II: Appendices. 2014.
Strategy for development of Plovdiv district 2014-2020. District administration Plovdiv. 2013.
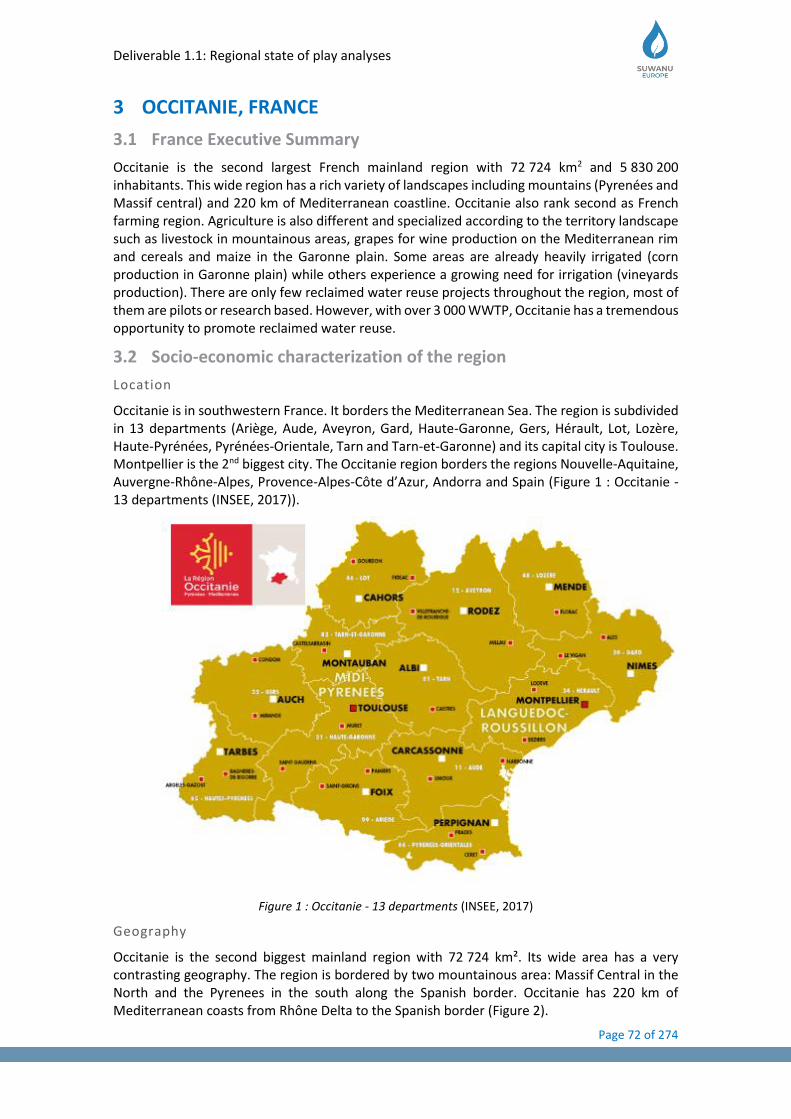
Deliverable 1.1: Regional state of play analyses
Page 72 of 274
3 OCCITANIE, FRANCE
3.1 France Executive Summary
Occitanie is the second largest French mainland region with 72 724 km2 and 5 830 200 inhabitants. This wide region has a rich variety of landscapes including mountains (Pyrenées and Massif central) and 220 km of Mediterranean coastline. Occitanie also rank second as French farming region. Agriculture is also different and specialized according to the territory landscape such as livestock in mountainous areas, grapes for wine production on the Mediterranean rim and cereals and maize in the Garonne plain. Some areas are already heavily irrigated (corn production in Garonne plain) while others experience a growing need for irrigation (vineyards production). There are only few reclaimed water reuse projects throughout the region, most of them are pilots or research based. However, with over 3 000 WWTP, Occitanie has a tremendous opportunity to promote reclaimed water reuse.
3.2 Socio-economic characterization of the region
Location
Occitanie is in southwestern France. It borders the Mediterranean Sea. The region is subdivided in 13 departments (Ariège, Aude, Aveyron, Gard, Haute-Garonne, Gers, Hérault, Lot, Lozère, Haute-Pyrénées, Pyrénées-Orientale, Tarn and Tarn-et-Garonne) and its capital city is Toulouse. Montpellier is the 2nd biggest city. The Occitanie region borders the regions Nouvelle-Aquitaine, Auvergne-Rhône-Alpes, Provence-Alpes-Côte d’Azur, Andorra and Spain (Figure 1 : Occitanie - 13 departments (INSEE, 2017)).
Figure 1 : Occitanie - 13 departments (INSEE, 2017)
Geography
Occitanie is the second biggest mainland region with 72 724 km². Its wide area has a very contrasting geography. The region is bordered by two mountainous area: Massif Central in the North and the Pyrenees in the south along the Spanish border. Occitanie has 220 km of Mediterranean coasts from Rhône Delta to the Spanish border (Figure 2).
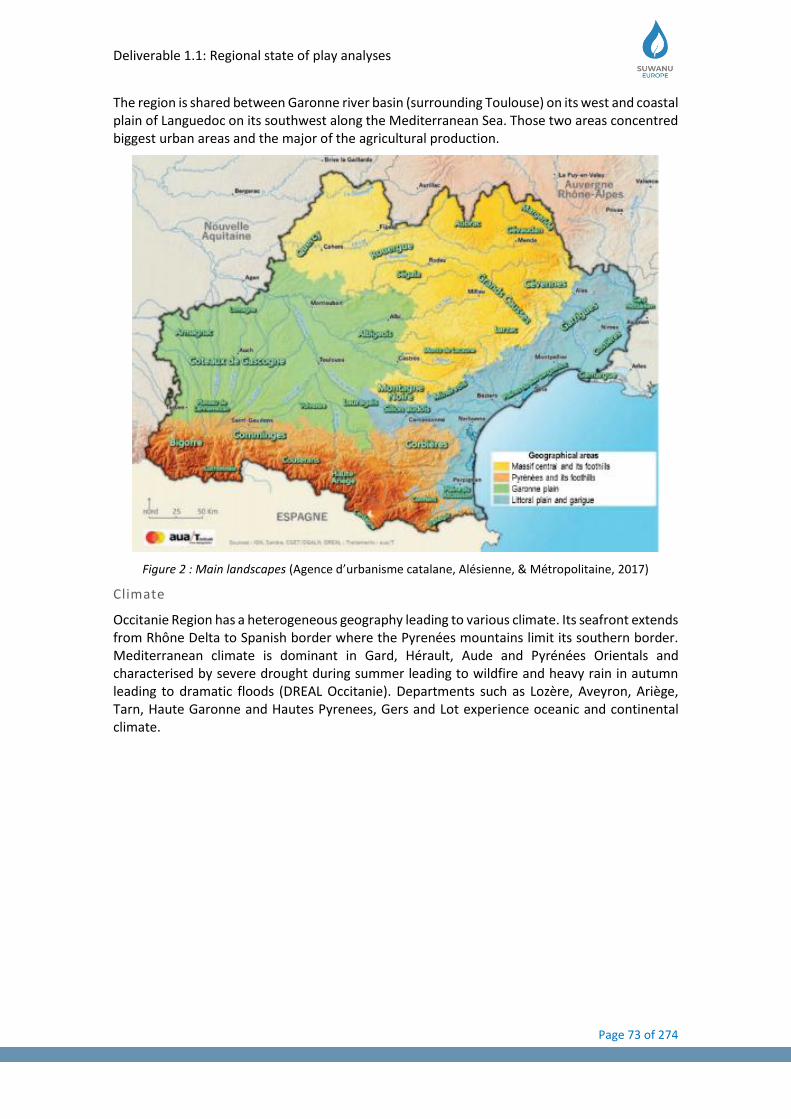
Deliverable 1.1: Regional state of play analyses
Page 73 of 274
The region is shared between Garonne river basin (surrounding Toulouse) on its west and coastal plain of Languedoc on its southwest along the Mediterranean Sea. Those two areas concentred biggest urban areas and the major of the agricultural production.
Figure 2 : Main landscapes (Agence d’urbanisme catalane, Alésienne, & Métropolitaine, 2017)
Climate
Occitanie Region has a heterogeneous geography leading to various climate. Its seafront extends from Rhône Delta to Spanish border where the Pyrenées mountains limit its southern border. Mediterranean climate is dominant in Gard, Hérault, Aude and Pyrénées Orientals and characterised by severe drought during summer leading to wildfire and heavy rain in autumn leading to dramatic floods (DREAL Occitanie). Departments such as Lozère, Aveyron, Ariège, Tarn, Haute Garonne and Hautes Pyrenees, Gers and Lot experience oceanic and continental climate.
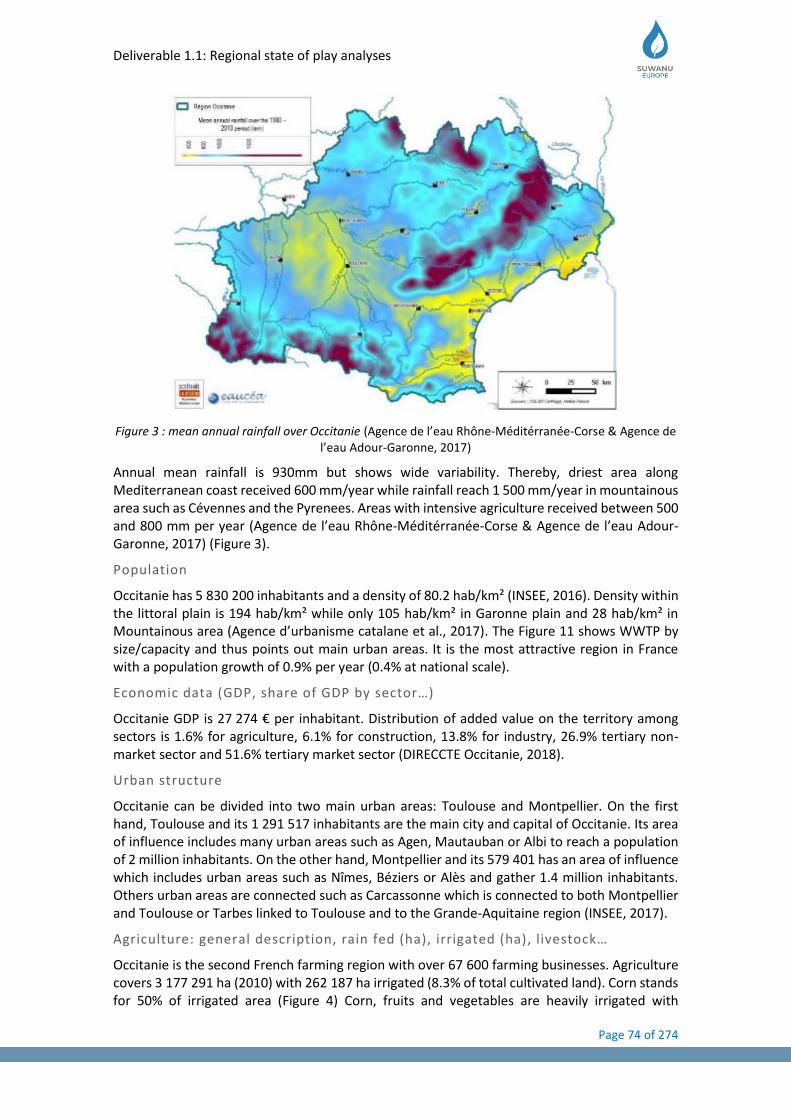
Deliverable 1.1: Regional state of play analyses
Page 74 of 274
Figure 3 : mean annual rainfall over Occitanie (Agence de l’eau Rhône-Méditérranée-Corse & Agence de l’eau Adour-Garonne, 2017)
Annual mean rainfall is 930mm but shows wide variability. Thereby, driest area along Mediterranean coast received 600 mm/year while rainfall reach 1 500 mm/year in mountainous area such as Cévennes and the Pyrenees. Areas with intensive agriculture received between 500 and 800 mm per year (Agence de l’eau Rhône-Méditérranée-Corse & Agence de l’eau Adour-Garonne, 2017) (Figure 3).
Population
Occitanie has 5 830 200 inhabitants and a density of 80.2 hab/km² (INSEE, 2016). Density within the littoral plain is 194 hab/km² while only 105 hab/km² in Garonne plain and 28 hab/km² in Mountainous area (Agence d’urbanisme catalane et al., 2017). The Figure 11 shows WWTP by size/capacity and thus points out main urban areas. It is the most attractive region in France with a population growth of 0.9% per year (0.4% at national scale).
Economic data (GDP, share of GDP by sector…)
Occitanie GDP is 27 274 € per inhabitant. Distribution of added value on the territory among sectors is 1.6% for agriculture, 6.1% for construction, 13.8% for industry, 26.9% tertiary non-market sector and 51.6% tertiary market sector (DIRECCTE Occitanie, 2018).
Urban structure
Occitanie can be divided into two main urban areas: Toulouse and Montpellier. On the first hand, Toulouse and its 1 291 517 inhabitants are the main city and capital of Occitanie. Its area of influence includes many urban areas such as Agen, Mautauban or Albi to reach a population of 2 million inhabitants. On the other hand, Montpellier and its 579 401 has an area of influence which includes urban areas such as Nîmes, Béziers or Alès and gather 1.4 million inhabitants. Others urban areas are connected such as Carcassonne which is connected to both Montpellier and Toulouse or Tarbes linked to Toulouse and to the Grande-Aquitaine region (INSEE, 2017).
Agriculture: general description, rain fed (ha), irrigated (ha), livestock…
Occitanie is the second French farming region with over 67 600 farming businesses. Agriculture covers 3 177 291 ha (2010) with 262 187 ha irrigated (8.3% of total cultivated land). Corn stands for 50% of irrigated area (Figure 4) Corn, fruits and vegetables are heavily irrigated with
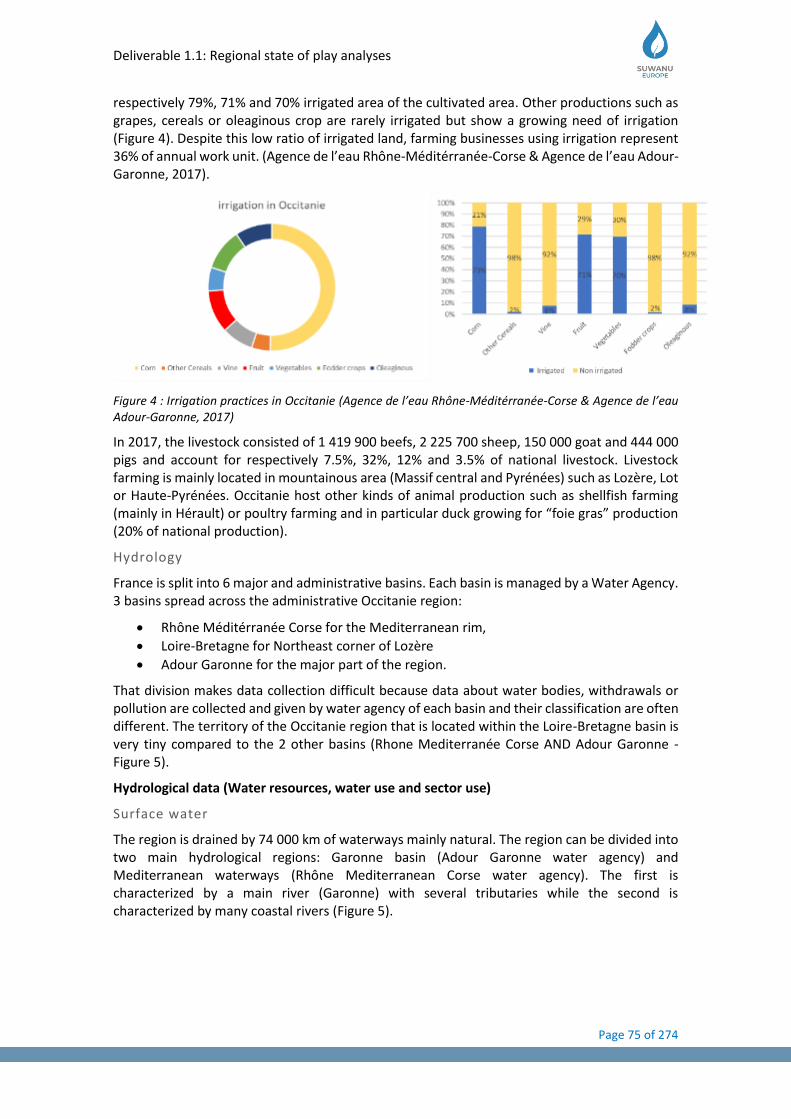
Deliverable 1.1: Regional state of play analyses
Page 75 of 274
respectively 79%, 71% and 70% irrigated area of the cultivated area. Other productions such as grapes, cereals or oleaginous crop are rarely irrigated but show a growing need of irrigation (Figure 4). Despite this low ratio of irrigated land, farming businesses using irrigation represent 36% of annual work unit. (Agence de l’eau Rhône-Méditérranée-Corse & Agence de l’eau Adour-Garonne, 2017).
Figure 4 : Irrigation practices in Occitanie (Agence de l’eau Rhône-Méditérranée-Corse & Agence de l’eau Adour-Garonne, 2017)
In 2017, the livestock consisted of 1 419 900 beefs, 2 225 700 sheep, 150 000 goat and 444 000 pigs and account for respectively 7.5%, 32%, 12% and 3.5% of national livestock. Livestock farming is mainly located in mountainous area (Massif central and Pyrénées) such as Lozère, Lot or Haute-Pyrénées. Occitanie host other kinds of animal production such as shellfish farming (mainly in Hérault) or poultry farming and in particular duck growing for “foie gras” production (20% of national production).
Hydrology
France is split into 6 major and administrative basins. Each basin is managed by a Water Agency. 3 basins spread across the administrative Occitanie region:
• Rhône Méditérranée Corse for the Mediterranean rim,
• Loire-Bretagne for Northeast corner of Lozère
• Adour Garonne for the major part of the region.
That division makes data collection difficult because data about water bodies, withdrawals or pollution are collected and given by water agency of each basin and their classification are often different. The territory of the Occitanie region that is located within the Loire-Bretagne basin is very tiny compared to the 2 other basins (Rhone Mediterranée Corse AND Adour Garonne - Figure 5).
Hydrological data (Water resources, water use and sector use)
Surface water
The region is drained by 74 000 km of waterways mainly natural. The region can be divided into two main hydrological regions: Garonne basin (Adour Garonne water agency) and Mediterranean waterways (Rhône Mediterranean Corse water agency). The first is characterized by a main river (Garonne) with several tributaries while the second is characterized by many coastal rivers (Figure 5).
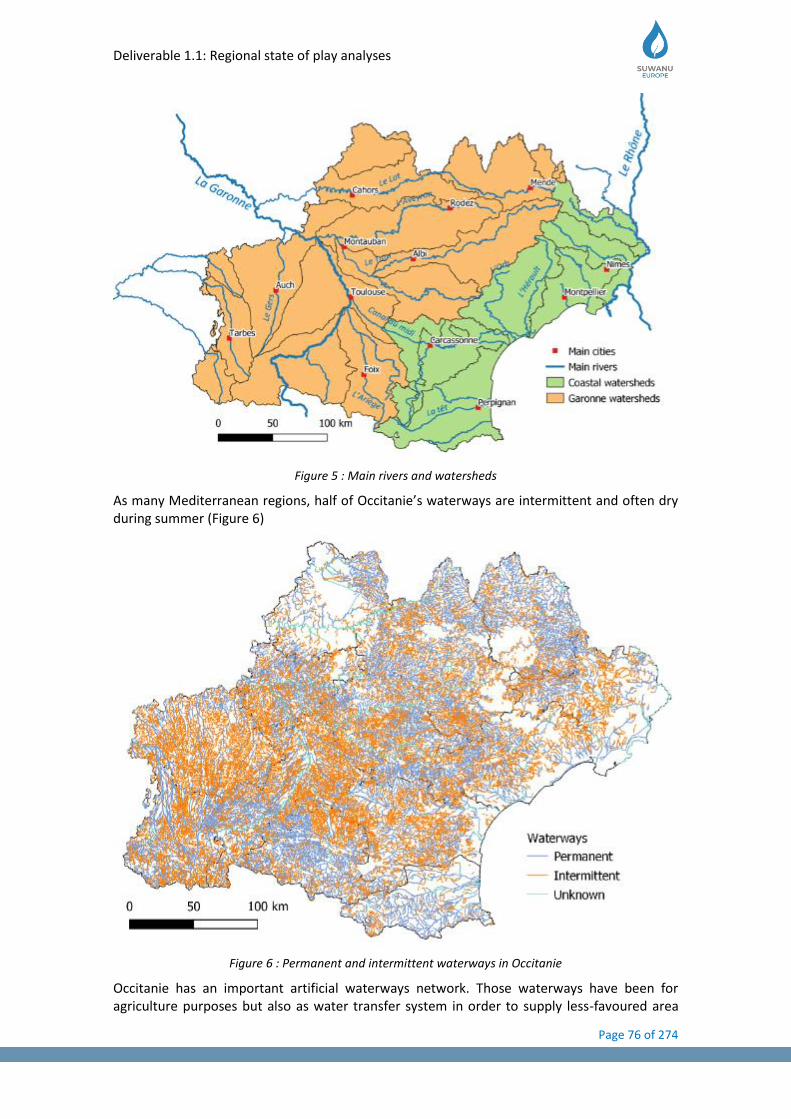
Deliverable 1.1: Regional state of play analyses
Page 76 of 274
Figure 5 : Main rivers and watersheds
As many Mediterranean regions, half of Occitanie’s waterways are intermittent and often dry during summer (Figure 6)
Figure 6 : Permanent and intermittent waterways in Occitanie
Occitanie has an important artificial waterways network. Those waterways have been for agriculture purposes but also as water transfer system in order to supply less-favoured area
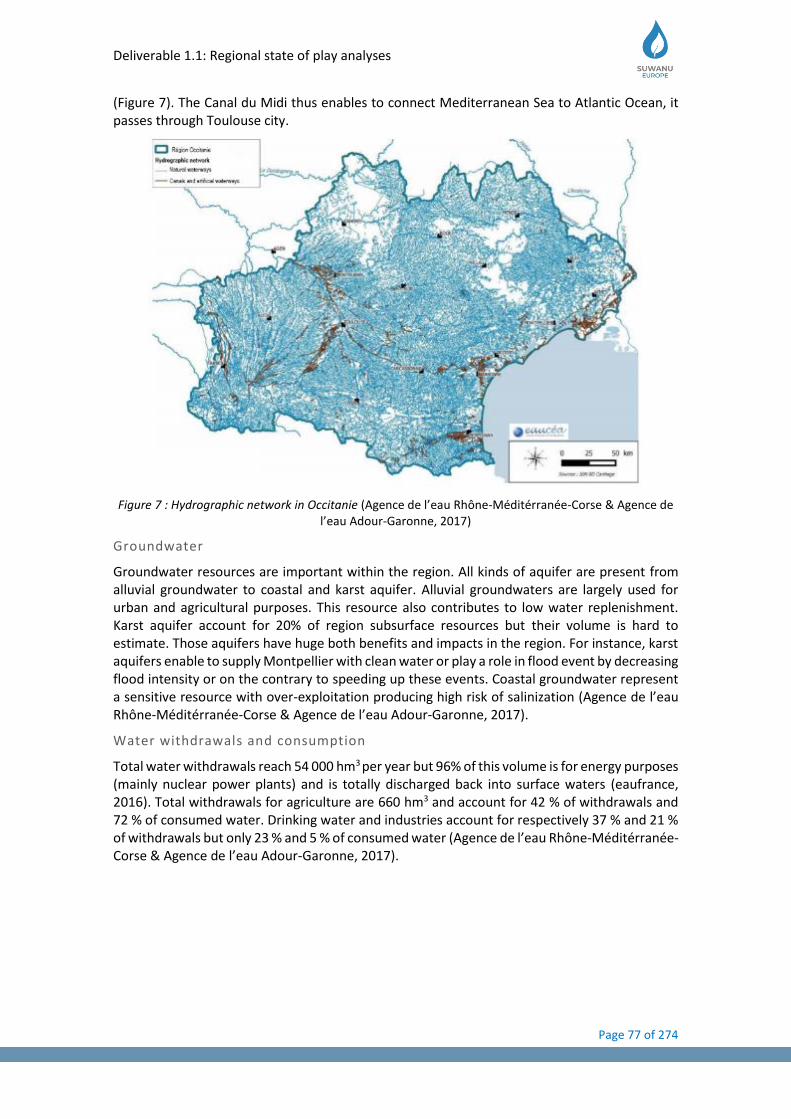
Deliverable 1.1: Regional state of play analyses
Page 77 of 274
(Figure 7). The Canal du Midi thus enables to connect Mediterranean Sea to Atlantic Ocean, it passes through Toulouse city.
Figure 7 : Hydrographic network in Occitanie (Agence de l’eau Rhône-Méditérranée-Corse & Agence de l’eau Adour-Garonne, 2017)
Groundwater
Groundwater resources are important within the region. All kinds of aquifer are present from alluvial groundwater to coastal and karst aquifer. Alluvial groundwaters are largely used for urban and agricultural purposes. This resource also contributes to low water replenishment. Karst aquifer account for 20% of region subsurface resources but their volume is hard to estimate. Those aquifers have huge both benefits and impacts in the region. For instance, karst aquifers enable to supply Montpellier with clean water or play a role in flood event by decreasing flood intensity or on the contrary to speeding up these events. Coastal groundwater represent a sensitive resource with over-exploitation producing high risk of salinization (Agence de l’eau Rhône-Méditérranée-Corse & Agence de l’eau Adour-Garonne, 2017).
Water withdrawals and consumption
Total water withdrawals reach 54 000 hm3 per year but 96% of this volume is for energy purposes (mainly nuclear power plants) and is totally discharged back into surface waters (eaufrance, 2016). Total withdrawals for agriculture are 660 hm3 and account for 42 % of withdrawals and 72 % of consumed water. Drinking water and industries account for respectively 37 % and 21 % of withdrawals but only 23 % and 5 % of consumed water (Agence de l’eau Rhône-Méditérranée-Corse & Agence de l’eau Adour-Garonne, 2017).
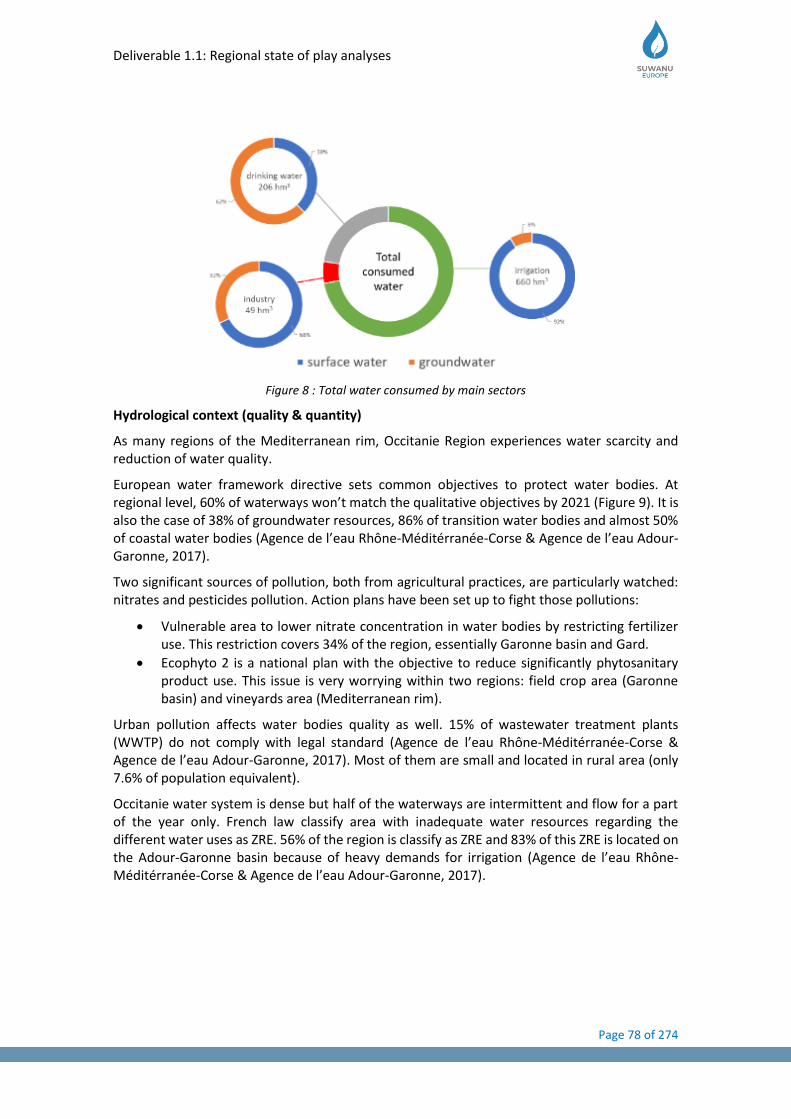
Deliverable 1.1: Regional state of play analyses
Page 78 of 274
Figure 8 : Total water consumed by main sectors
Hydrological context (quality & quantity)
As many regions of the Mediterranean rim, Occitanie Region experiences water scarcity and reduction of water quality.
European water framework directive sets common objectives to protect water bodies. At regional level, 60% of waterways won’t match the qualitative objectives by 2021 (Figure 9). It is also the case of 38% of groundwater resources, 86% of transition water bodies and almost 50% of coastal water bodies (Agence de l’eau Rhône-Méditérranée-Corse & Agence de l’eau Adour-Garonne, 2017).
Two significant sources of pollution, both from agricultural practices, are particularly watched: nitrates and pesticides pollution. Action plans have been set up to fight those pollutions:
• Vulnerable area to lower nitrate concentration in water bodies by restricting fertilizer use. This restriction covers 34% of the region, essentially Garonne basin and Gard.
• Ecophyto 2 is a national plan with the objective to reduce significantly phytosanitary product use. This issue is very worrying within two regions: field crop area (Garonne basin) and vineyards area (Mediterranean rim).
Urban pollution affects water bodies quality as well. 15% of wastewater treatment plants (WWTP) do not comply with legal standard (Agence de l’eau Rhône-Méditérranée-Corse & Agence de l’eau Adour-Garonne, 2017). Most of them are small and located in rural area (only 7.6% of population equivalent).
Occitanie water system is dense but half of the waterways are intermittent and flow for a part of the year only. French law classify area with inadequate water resources regarding the different water uses as ZRE. 56% of the region is classify as ZRE and 83% of this ZRE is located on the Adour-Garonne basin because of heavy demands for irrigation (Agence de l’eau Rhône-Méditérranée-Corse & Agence de l’eau Adour-Garonne, 2017).
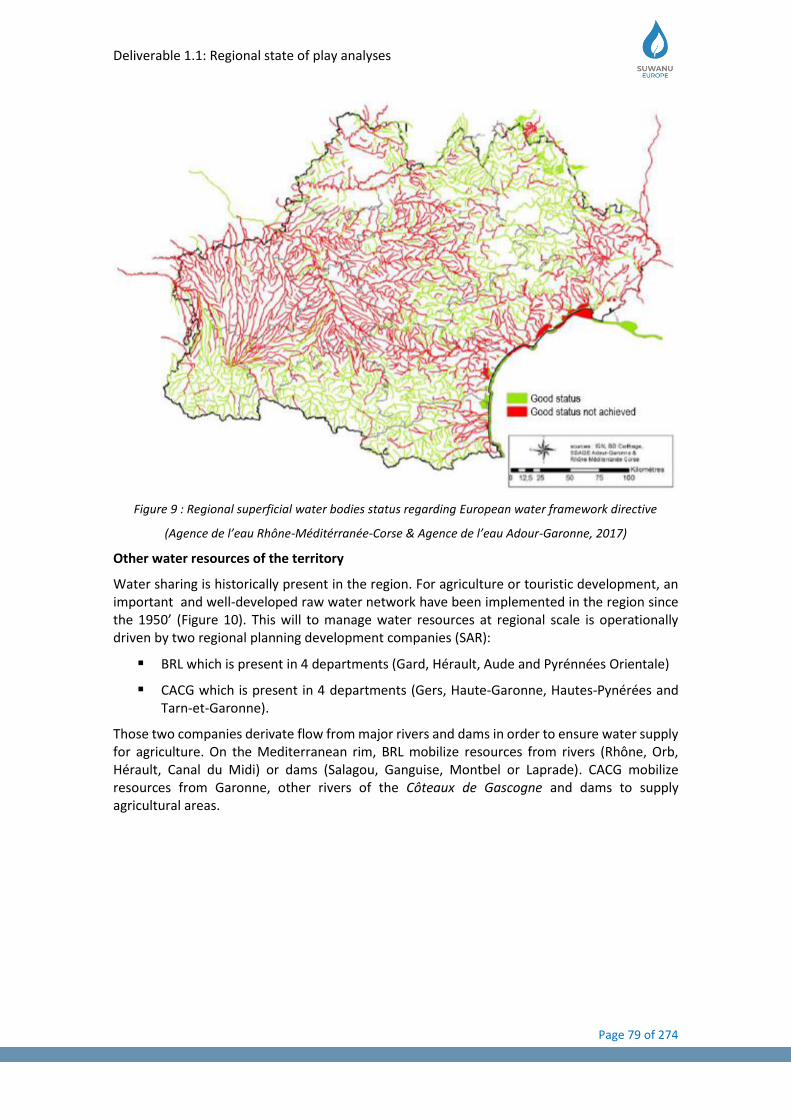
Deliverable 1.1: Regional state of play analyses
Page 79 of 274
Figure 9 : Regional superficial water bodies status regarding European water framework directive
(Agence de l’eau Rhône-Méditérranée-Corse & Agence de l’eau Adour-Garonne, 2017)
Other water resources of the territory
Water sharing is historically present in the region. For agriculture or touristic development, an important and well-developed raw water network have been implemented in the region since the 1950’ (Figure 10). This will to manage water resources at regional scale is operationally driven by two regional planning development companies (SAR):
▪ BRL which is present in 4 departments (Gard, Hérault, Aude and Pyrénnées Orientale)
▪ CACG which is present in 4 departments (Gers, Haute-Garonne, Hautes-Pynérées and Tarn-et-Garonne).
Those two companies derivate flow from major rivers and dams in order to ensure water supply for agriculture. On the Mediterranean rim, BRL mobilize resources from rivers (Rhône, Orb, Hérault, Canal du Midi) or dams (Salagou, Ganguise, Montbel or Laprade). CACG mobilize resources from Garonne, other rivers of the Côteaux de Gascogne and dams to supply agricultural areas.
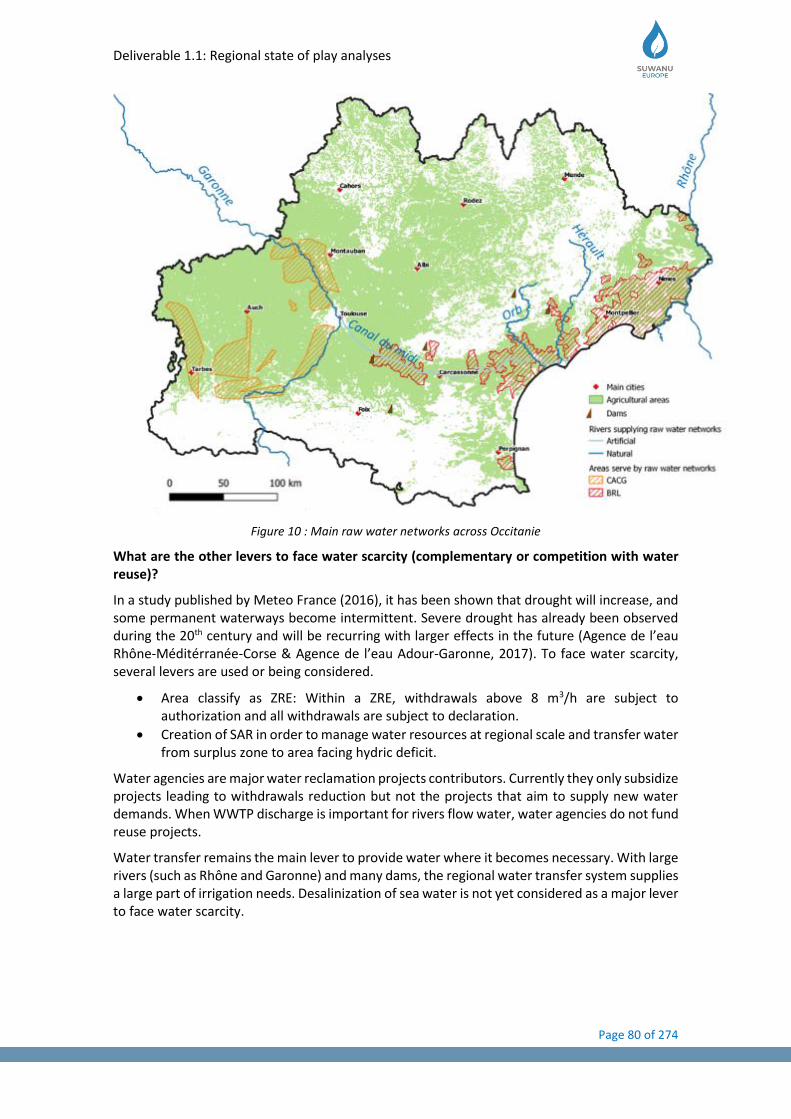
Deliverable 1.1: Regional state of play analyses
Page 80 of 274
Figure 10 : Main raw water networks across Occitanie
What are the other levers to face water scarcity (complementary or competition with water reuse)?
In a study published by Meteo France (2016), it has been shown that drought will increase, and some permanent waterways become intermittent. Severe drought has already been observed during the 20th century and will be recurring with larger effects in the future (Agence de l’eau Rhône-Méditérranée-Corse & Agence de l’eau Adour-Garonne, 2017). To face water scarcity, several levers are used or being considered.
• Area classify as ZRE: Within a ZRE, withdrawals above 8 m3/h are subject to authorization and all withdrawals are subject to declaration.
• Creation of SAR in order to manage water resources at regional scale and transfer water from surplus zone to area facing hydric deficit.
Water agencies are major water reclamation projects contributors. Currently they only subsidize projects leading to withdrawals reduction but not the projects that aim to supply new water demands. When WWTP discharge is important for rivers flow water, water agencies do not fund reuse projects.
Water transfer remains the main lever to provide water where it becomes necessary. With large rivers (such as Rhône and Garonne) and many dams, the regional water transfer system supplies a large part of irrigation needs. Desalinization of sea water is not yet considered as a major lever to face water scarcity.
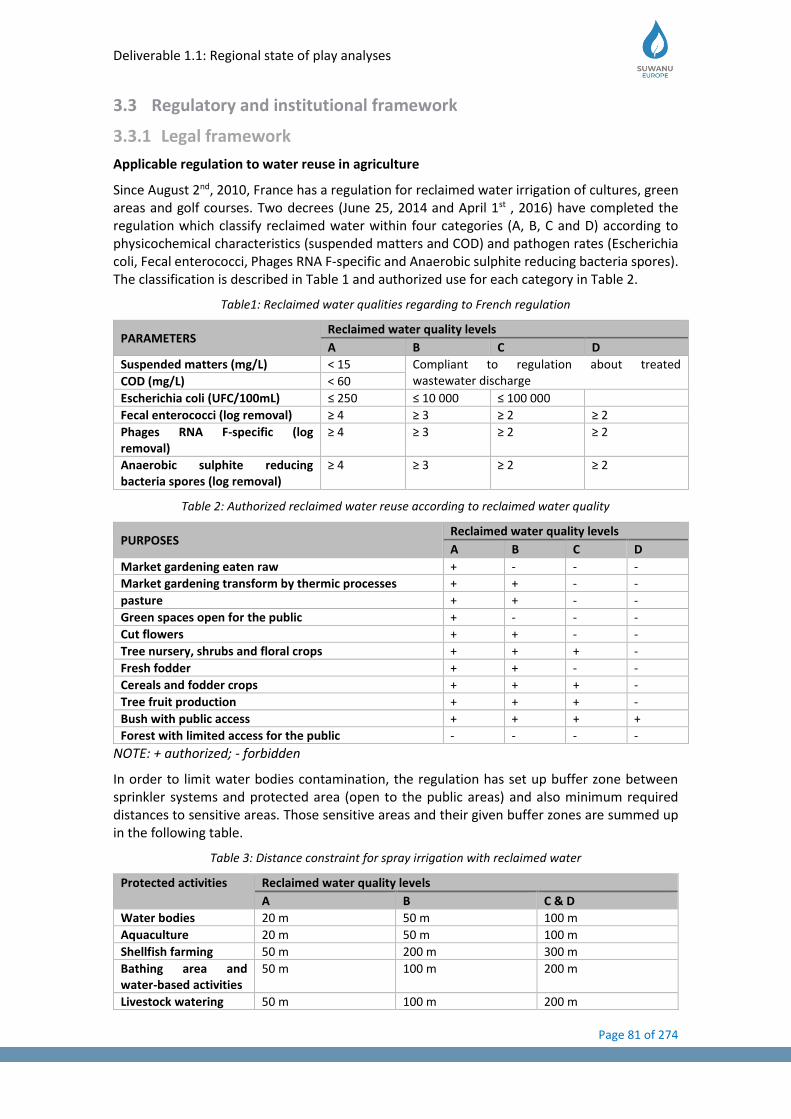
Deliverable 1.1: Regional state of play analyses
Page 81 of 274
3.3 Regulatory and institutional framework
3.3.1 Legal framework
Applicable regulation to water reuse in agriculture
Since August 2nd, 2010, France has a regulation for reclaimed water irrigation of cultures, green areas and golf courses. Two decrees (June 25, 2014 and April 1st , 2016) have completed the regulation which classify reclaimed water within four categories (A, B, C and D) according to physicochemical characteristics (suspended matters and COD) and pathogen rates (Escherichia coli, Fecal enterococci, Phages RNA F-specific and Anaerobic sulphite reducing bacteria spores). The classification is described in Table 1 and authorized use for each category in Table 2.
Table1: Reclaimed water qualities regarding to French regulation
PARAMETERS Reclaimed water quality levels
A B C D
Suspended matters (mg/L) < 15 Compliant to regulation about treated wastewater discharge COD (mg/L) < 60
Escherichia coli (UFC/100mL) ≤ 250 ≤ 10 000 ≤ 100 000
Fecal enterococci (log removal) ≥ 4 ≥ 3 ≥ 2 ≥ 2
Phages RNA F-specific (log removal)
≥ 4 ≥ 3 ≥ 2 ≥ 2
Anaerobic sulphite reducing bacteria spores (log removal)
≥ 4 ≥ 3 ≥ 2 ≥ 2
Table 2: Authorized reclaimed water reuse according to reclaimed water quality
PURPOSES Reclaimed water quality levels
A B C D
Market gardening eaten raw + - - -
Market gardening transform by thermic processes + + - -
pasture + + - -
Green spaces open for the public + - - -
Cut flowers + + - -
Tree nursery, shrubs and floral crops + + + -
Fresh fodder + + - -
Cereals and fodder crops + + + -
Tree fruit production + + + -
Bush with public access + + + +
Forest with limited access for the public - - - -
NOTE: + authorized; - forbidden
In order to limit water bodies contamination, the regulation has set up buffer zone between sprinkler systems and protected area (open to the public areas) and also minimum required distances to sensitive areas. Those sensitive areas and their given buffer zones are summed up in the following table.
Table 3: Distance constraint for spray irrigation with reclaimed water
Protected activities Reclaimed water quality levels
A B C & D
Water bodies 20 m 50 m 100 m
Aquaculture 20 m 50 m 100 m
Shellfish farming 50 m 200 m 300 m
Bathing area and water-based activities
50 m 100 m 200 m
Livestock watering 50 m 100 m 200 m

Deliverable 1.1: Regional state of play analyses
Page 82 of 274
Permissions and administrative requirements
For any water reuse project, a request for authorization must be granted. That can be done by WWTP owner or manager, irrigation system owner or plots owner. The authorization comes with a decree setting out irrigation system, financial model and the distribution of responsibility.
Sludge monitoring is also requirement (four times a year) except if as already be done for spread sludge plan. Soil initial analysis is necessary as well. The limits values for sludge and soil parameters are given in the following table:
Table 4: limit values for Sludge and Soil analysis
PARAMETERS LIMIT VALUE (mg/kg dry matters)
Cadmium 10 Sludge
Chromium 1000 Sludge
Copper 1000 Sludge
Mercury 10 Sludge
Nickel 200 Sludge
Lead 800 Sludge
Zinc 3000 Sludge
Chromium + Copper + Nickel + Zinc 4000 Sludge
Cadmium 2 Soil
Chromium 1500 Soil
Copper 100 Soil
Mercury 1 Soil
Nickel 50 Soil
Lead 100 Soil
Zinc 300 Soil
Monitoring and control requirement
Every 2 years a report must be performed on the 6 parameters (table 1) for the effluent entering and coming from the WWTP. Moreover, routine monitoring must be performed on three parameters (suspended matters, COD and E.coli) at different frequency according to reclaimed water categories.
Table 5: Routine monitoring frequency for reclaimed water quality
PARAMETERS Routine monitoring frequency
A B C & D
Suspended matters (mg/l) Every week Every two weeks Every month
COD (mg/l)
E.coli (UFC/100 mL)
3.3.2 Standards
Organic products irrigation with reclaimed water and exportation of produced irrigated with reclaimed water are authorized without constraints if the legal standards (soil, water and sludge quality) mentioned above are checked.
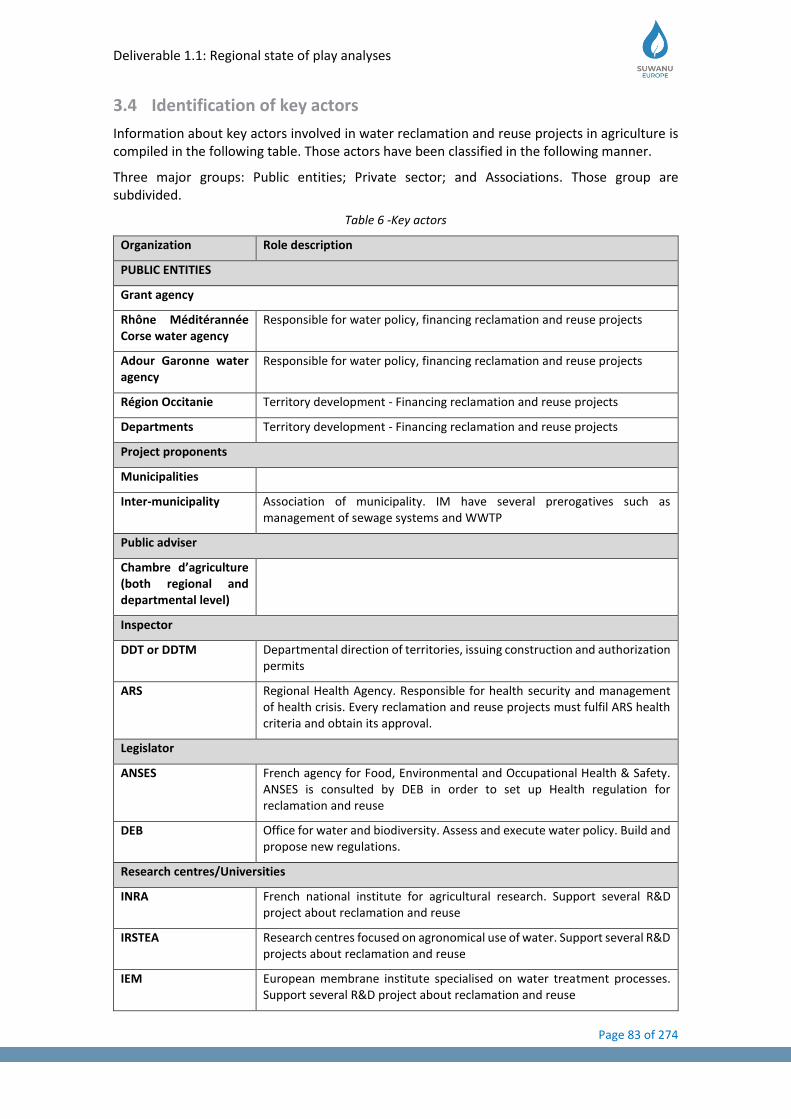
Deliverable 1.1: Regional state of play analyses
Page 83 of 274
3.4 Identification of key actors
Information about key actors involved in water reclamation and reuse projects in agriculture is compiled in the following table. Those actors have been classified in the following manner.
Three major groups: Public entities; Private sector; and Associations. Those group are subdivided.
Table 6 -Key actors
Organization Role description
PUBLIC ENTITIES
Grant agency
Rhône Méditérannée Corse water agency
Responsible for water policy, financing reclamation and reuse projects
Adour Garonne water agency
Responsible for water policy, financing reclamation and reuse projects
Région Occitanie Territory development - Financing reclamation and reuse projects
Departments Territory development - Financing reclamation and reuse projects
Project proponents
Municipalities
Inter-municipality Association of municipality. IM have several prerogatives such as management of sewage systems and WWTP
Public adviser
Chambre d’agriculture (both regional and departmental level)
Inspector
DDT or DDTM Departmental direction of territories, issuing construction and authorization permits
ARS Regional Health Agency. Responsible for health security and management of health crisis. Every reclamation and reuse projects must fulfil ARS health criteria and obtain its approval.
Legislator
ANSES French agency for Food, Environmental and Occupational Health & Safety. ANSES is consulted by DEB in order to set up Health regulation for reclamation and reuse
DEB Office for water and biodiversity. Assess and execute water policy. Build and propose new regulations.
Research centres/Universities
INRA French national institute for agricultural research. Support several R&D project about reclamation and reuse
IRSTEA Research centres focused on agronomical use of water. Support several R&D projects about reclamation and reuse
IEM European membrane institute specialised on water treatment processes. Support several R&D project about reclamation and reuse

Deliverable 1.1: Regional state of play analyses
Page 84 of 274
AgroParistech
Montpellier Supagro
Schools of Agronomy
University of Montpellier
Montpellier’s university of Science hosting many research centres and offering education focussed on water and waste management
Relevant cases of Inter municipalities
Grand Narbonne Narbonne Inter-municipality. Will to be pioneer in reclamation and reuse, host project such as Irrialt’eau.
CCGPSL (Communauté de commune du grand pic saint loup)
Inter-municipality nearby Montpellier. The Pic St-Loup area is specialised in wine production (AOP Pic saint loup) and hosts a reclamation and reuse pilot project (Rur’eaux)
Private sector
Builder and operator of WWTP
SUEZ Managed several WWTP. Involved in several reclamation and reuse projects
Veolia Eau Biggest French water company managing several WWTP. Involved in some reclamation and reuse project such as Irrialt’eaux or SmartFertiReuse
SAUR One of biggest water company in France managing many WWTP. Also involved in reclamation and reuse project
Aqualter Involved in reclamation and reuse projects
Others
SAR (regional landscaping company) – Irrigation network managers
BRL Manages raw water supply in Gard, Herault, Aude and Pyrénées Orientales. BRL is also a consulting firm.
CACG Manages raw water in the western part of Occitanie. Also, a consulting firm involved in some reclamation and reuse projects
SCP Manage raw water in border region PACA (Not in Occitanie). Also, a consulting firm involved in reclamation and reuse projects in Occitanie.
Independent consulting firm
GAXIEU ingénierie Consulting firm working on reclamation and reuse projects
ECOFILAE Consulting firm specialised in reclamation and reuse
Manufacturers and sellers – Irrigation material
AQUADOC Manufacturer and seller of irrigation systems
Manufacturers and sellers – Treatment for water reclamation
BIO-UV Engineering company specialised in water treatment processes (UV process)
MONTPELLIER ENGINEERING
Engineering company specialised in water treatment processes (Electro-oxydation processes)
POLYMEM Manufacturer of organic hollow fiber membranes for water treatment
SYNTEA Company specialised in treatment for domestic wastewater using constructed wetlands (EPURNATURE) and effluent from food-processing industry, distilleries or wine production.
Private finance investors – National level
BPI France Investment bank
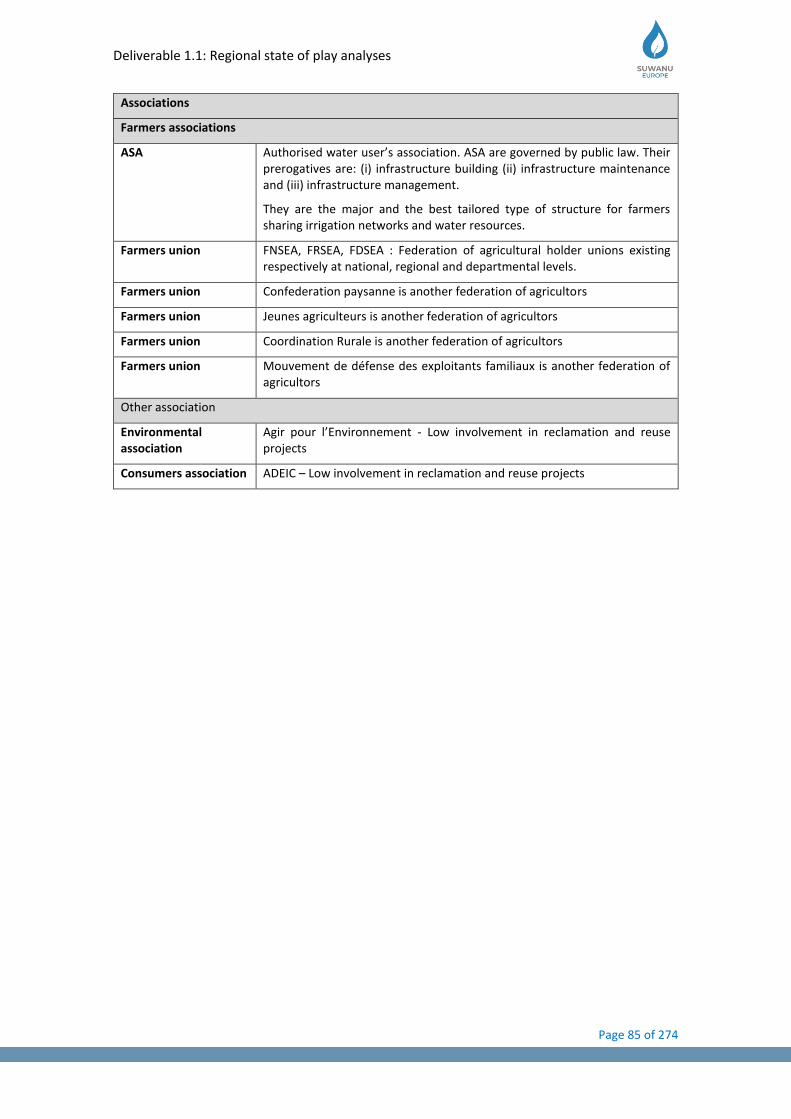
Deliverable 1.1: Regional state of play analyses
Page 85 of 274
Associations
Farmers associations
ASA Authorised water user’s association. ASA are governed by public law. Their prerogatives are: (i) infrastructure building (ii) infrastructure maintenance and (iii) infrastructure management.
They are the major and the best tailored type of structure for farmers sharing irrigation networks and water resources.
Farmers union FNSEA, FRSEA, FDSEA : Federation of agricultural holder unions existing respectively at national, regional and departmental levels.
Farmers union Confederation paysanne is another federation of agricultors
Farmers union Jeunes agriculteurs is another federation of agricultors
Farmers union Coordination Rurale is another federation of agricultors
Farmers union Mouvement de défense des exploitants familiaux is another federation of agricultors
Other association
Environmental association
Agir pour l’Environnement - Low involvement in reclamation and reuse projects
Consumers association ADEIC – Low involvement in reclamation and reuse projects

Deliverable 1.1: Regional state of play analyses
Page 86 of 274
3.5 Existing situation of wastewater treatment and agriculture
This section should provide a general background of wastewater treatment and agriculture sectors. Then we describe the potential offer of reclaimed water coming from WWTP and the water demand for irrigation.
3.5.1 Characterization of wastewater treatment sector
Figure 11 : Wastewater treatment plants across Occitanie (Ministère de la Transition écologique et Solidaire, n.d.)
Occitanie region has 3 124 collective wastewater treatment plants (WWTP). Very few small WWTP (under 200 p.e) have records of treated volumes but those volumes remain marginal compared to bigger WWTP. 84% of WWTP are smaller than 2 000 p.e but account for only 11% of reclaimed water volume, while biggest WWTP over 100 000 p.e represent only 0.6% of the plants but account for 38% of the volume (Figure 12). However, WWTP smaller than 10 000 p.e (almost 3 000 WWTP) are mostly located in rural territories with irrigation opportunities (Ministère de la Transition écologique et Solidaire, n.d.).
Figure 12 : Typology of WWTP by size (Ministère de la Transition écologique et Solidaire, n.d.)
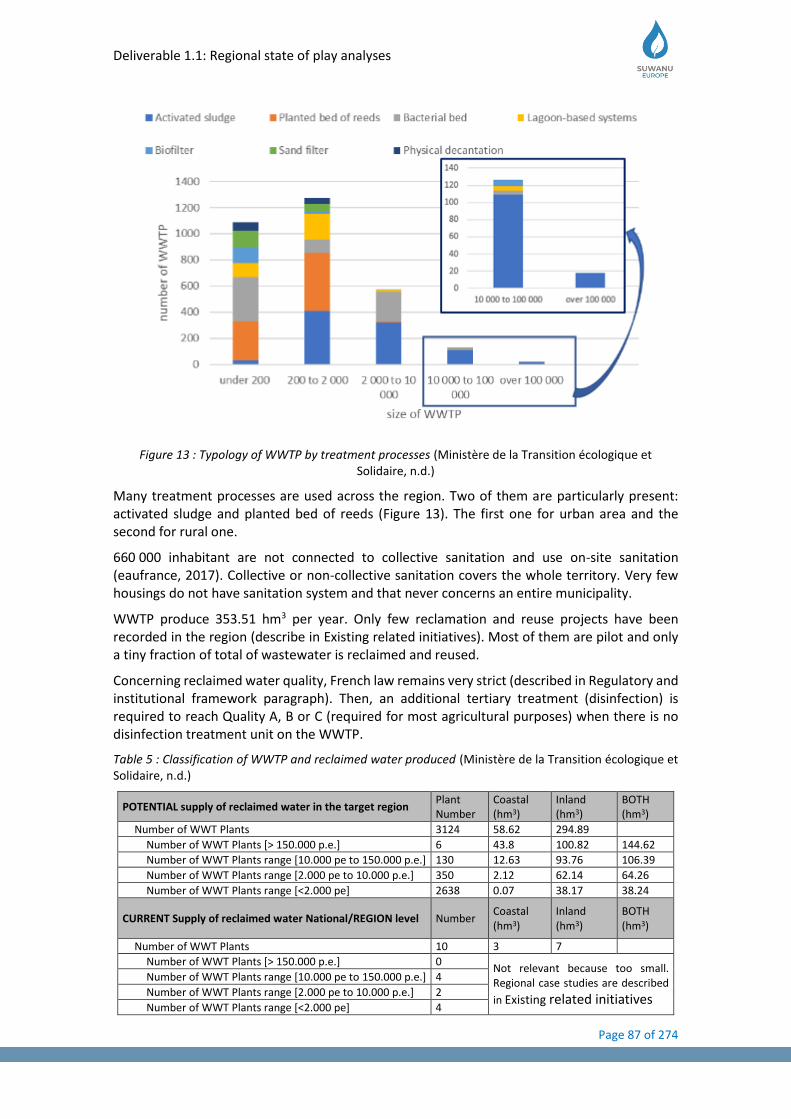
Deliverable 1.1: Regional state of play analyses
Page 87 of 274
Figure 13 : Typology of WWTP by treatment processes (Ministère de la Transition écologique et Solidaire, n.d.)
Many treatment processes are used across the region. Two of them are particularly present: activated sludge and planted bed of reeds (Figure 13). The first one for urban area and the second for rural one.
660 000 inhabitant are not connected to collective sanitation and use on-site sanitation (eaufrance, 2017). Collective or non-collective sanitation covers the whole territory. Very few housings do not have sanitation system and that never concerns an entire municipality.
WWTP produce 353.51 hm3 per year. Only few reclamation and reuse projects have been recorded in the region (describe in Existing related initiatives). Most of them are pilot and only a tiny fraction of total of wastewater is reclaimed and reused.
Concerning reclaimed water quality, French law remains very strict (described in Regulatory and institutional framework paragraph). Then, an additional tertiary treatment (disinfection) is required to reach Quality A, B or C (required for most agricultural purposes) when there is no disinfection treatment unit on the WWTP.
Table 5 : Classification of WWTP and reclaimed water produced (Ministère de la Transition écologique et Solidaire, n.d.)
POTENTIAL supply of reclaimed water in the target region Plant Number
Coastal (hm3)
Inland (hm3)
BOTH (hm3)
Number of WWT Plants 3124 58.62 294.89
Number of WWT Plants [> 150.000 p.e.] 6 43.8 100.82 144.62
Number of WWT Plants range [10.000 pe to 150.000 p.e.] 130 12.63 93.76 106.39
Number of WWT Plants range [2.000 pe to 10.000 p.e.] 350 2.12 62.14 64.26
Number of WWT Plants range [<2.000 pe] 2638 0.07 38.17 38.24
CURRENT Supply of reclaimed water National/REGION level Number Coastal (hm3)
Inland (hm3)
BOTH (hm3)
Number of WWT Plants 10 3 7
Number of WWT Plants [> 150.000 p.e.] 0 Not relevant because too small. Regional case studies are described
in Existing related initiatives
Number of WWT Plants range [10.000 pe to 150.000 p.e.] 4
Number of WWT Plants range [2.000 pe to 10.000 p.e.] 2
Number of WWT Plants range [<2.000 pe] 4
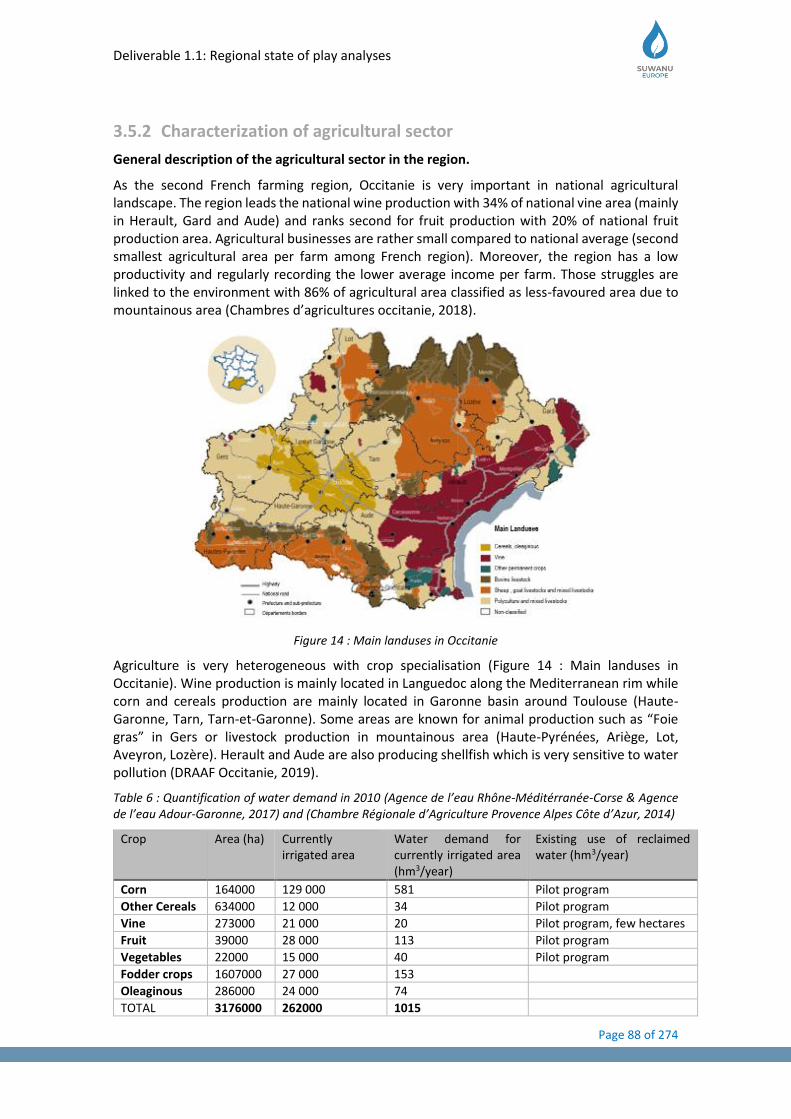
Deliverable 1.1: Regional state of play analyses
Page 88 of 274
3.5.2 Characterization of agricultural sector
General description of the agricultural sector in the region.
As the second French farming region, Occitanie is very important in national agricultural landscape. The region leads the national wine production with 34% of national vine area (mainly in Herault, Gard and Aude) and ranks second for fruit production with 20% of national fruit production area. Agricultural businesses are rather small compared to national average (second smallest agricultural area per farm among French region). Moreover, the region has a low productivity and regularly recording the lower average income per farm. Those struggles are linked to the environment with 86% of agricultural area classified as less-favoured area due to mountainous area (Chambres d’agricultures occitanie, 2018).
Figure 14 : Main landuses in Occitanie
Agriculture is very heterogeneous with crop specialisation (Figure 14 : Main landuses in Occitanie). Wine production is mainly located in Languedoc along the Mediterranean rim while corn and cereals production are mainly located in Garonne basin around Toulouse (Haute-Garonne, Tarn, Tarn-et-Garonne). Some areas are known for animal production such as “Foie gras” in Gers or livestock production in mountainous area (Haute-Pyrénées, Ariège, Lot, Aveyron, Lozère). Herault and Aude are also producing shellfish which is very sensitive to water pollution (DRAAF Occitanie, 2019).
Table 6 : Quantification of water demand in 2010 (Agence de l’eau Rhône-Méditérranée-Corse & Agence de l’eau Adour-Garonne, 2017) and (Chambre Régionale d’Agriculture Provence Alpes Côte d’Azur, 2014)
Crop Area (ha) Currently irrigated area
Water demand for currently irrigated area (hm3/year)
Existing use of reclaimed water (hm3/year)
Corn 164000 129 000 581 Pilot program
Other Cereals 634000 12 000 34 Pilot program
Vine 273000 21 000 20 Pilot program, few hectares
Fruit 39000 28 000 113 Pilot program
Vegetables 22000 15 000 40 Pilot program
Fodder crops 1607000 27 000 153
Oleaginous 286000 24 000 74
TOTAL 3176000 262000 1015
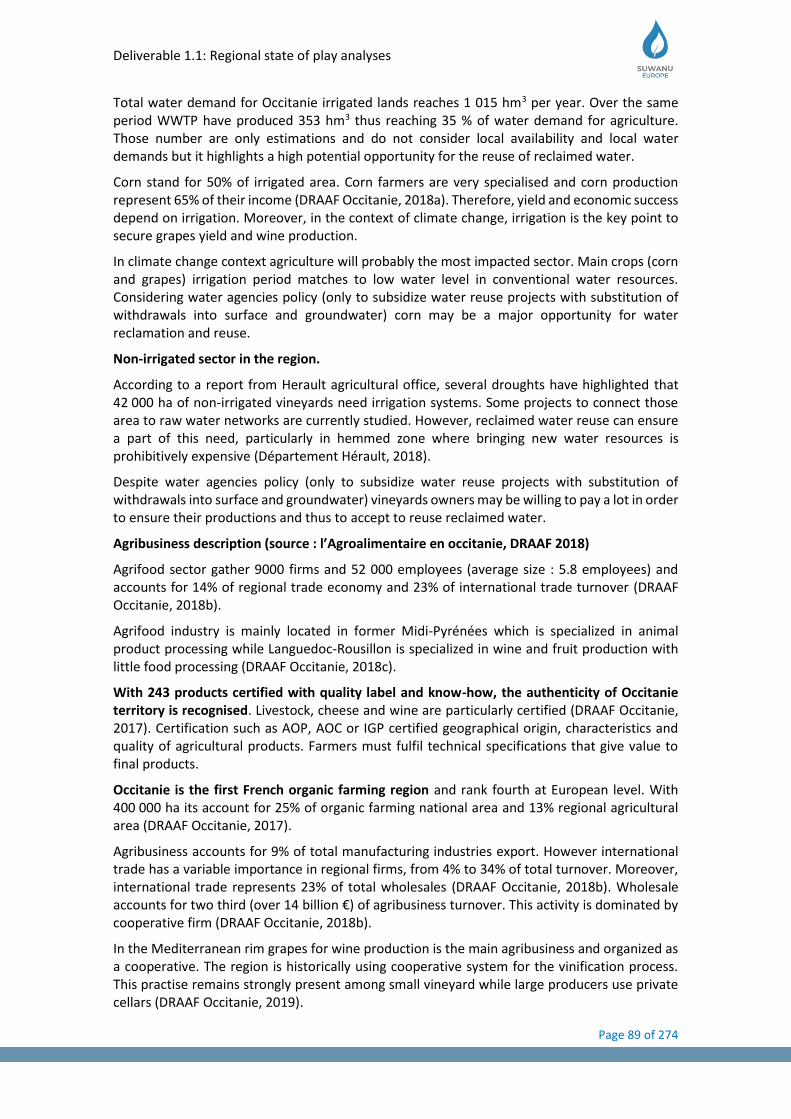
Deliverable 1.1: Regional state of play analyses
Page 89 of 274
Total water demand for Occitanie irrigated lands reaches 1 015 hm3 per year. Over the same period WWTP have produced 353 hm3 thus reaching 35 % of water demand for agriculture. Those number are only estimations and do not consider local availability and local water demands but it highlights a high potential opportunity for the reuse of reclaimed water.
Corn stand for 50% of irrigated area. Corn farmers are very specialised and corn production represent 65% of their income (DRAAF Occitanie, 2018a). Therefore, yield and economic success depend on irrigation. Moreover, in the context of climate change, irrigation is the key point to secure grapes yield and wine production.
In climate change context agriculture will probably the most impacted sector. Main crops (corn and grapes) irrigation period matches to low water level in conventional water resources. Considering water agencies policy (only to subsidize water reuse projects with substitution of withdrawals into surface and groundwater) corn may be a major opportunity for water reclamation and reuse.
Non-irrigated sector in the region.
According to a report from Herault agricultural office, several droughts have highlighted that 42 000 ha of non-irrigated vineyards need irrigation systems. Some projects to connect those area to raw water networks are currently studied. However, reclaimed water reuse can ensure a part of this need, particularly in hemmed zone where bringing new water resources is prohibitively expensive (Département Hérault, 2018).
Despite water agencies policy (only to subsidize water reuse projects with substitution of withdrawals into surface and groundwater) vineyards owners may be willing to pay a lot in order to ensure their productions and thus to accept to reuse reclaimed water.
Agribusiness description (source : l’Agroalimentaire en occitanie, DRAAF 2018)
Agrifood sector gather 9000 firms and 52 000 employees (average size : 5.8 employees) and accounts for 14% of regional trade economy and 23% of international trade turnover (DRAAF Occitanie, 2018b).
Agrifood industry is mainly located in former Midi-Pyrénées which is specialized in animal product processing while Languedoc-Rousillon is specialized in wine and fruit production with little food processing (DRAAF Occitanie, 2018c).
With 243 products certified with quality label and know-how, the authenticity of Occitanie territory is recognised. Livestock, cheese and wine are particularly certified (DRAAF Occitanie, 2017). Certification such as AOP, AOC or IGP certified geographical origin, characteristics and quality of agricultural products. Farmers must fulfil technical specifications that give value to final products.
Occitanie is the first French organic farming region and rank fourth at European level. With 400 000 ha its account for 25% of organic farming national area and 13% regional agricultural area (DRAAF Occitanie, 2017).
Agribusiness accounts for 9% of total manufacturing industries export. However international trade has a variable importance in regional firms, from 4% to 34% of total turnover. Moreover, international trade represents 23% of total wholesales (DRAAF Occitanie, 2018b). Wholesale accounts for two third (over 14 billion €) of agribusiness turnover. This activity is dominated by cooperative firm (DRAAF Occitanie, 2018b).
In the Mediterranean rim grapes for wine production is the main agribusiness and organized as a cooperative. The region is historically using cooperative system for the vinification process. This practise remains strongly present among small vineyard while large producers use private cellars (DRAAF Occitanie, 2019).

Deliverable 1.1: Regional state of play analyses
Page 90 of 274
Artisanal agribusiness is important in the region for both traditional and economic purposes. This diversified sector (meat, bakery, etc) generate 1.1 billion € and employ 8600 persons (DRAAF Occitanie, 2018b).
Irrigation is often managed collectively within farmers associations organized in ASA. ASA (for Authorizes water user Association) are key actors for collective irrigation. Those associations are governed by public law and manage structure and services (infrastructure financing and maintenance). Members must pay a rent. The membership goes with the land and cannot be cancelled. (Hérault irrigation, Schéma départemental)
Collective irrigation can also be managed by ASL (Free water user association). In that case, the associations are governed by private law and members have chosen to be part of the association.
OUGC are collective organizations in charge of water allocation for agriculture. Those organization are highly encouraged in ZRE and often managed by agricultural chamber.
The region hosts Montpellier Supagro which is one of the major Agronomic school at national level. Moreover, many research laboratories are present across de region (INRA, IRSTEA, Cirad, CNRS, French institude for vine and wine, IRD, etc)
3.6 Existing related initiatives
Name of the network/project,
location and irrigated area
Objectives Leader/coordinator and relevant
organizations involved.
PILOT PROJECTS
Irrialt’eau Gruissan (11) 2-3 Ha
R&D, Irrigation of vineyards Pilot for vineyards irrigation Plan to extend the project to 80 Ha
Veolia Eau, Grand Narbonne, INRA, AQUADOC, SCV la cave de gruissan, Région Ocitanie, Agence de l’eau RMC, BPI France
Rur’eaux Saint-Jean-de-Cornies (34)
R&D, irrigation (vegetables, garden, fodder) To prove opportunities of reclamation facility tailored for rural area & Assess sanitary, environmental and agronomic impacts of reclaimed water reuse
ECOFILAE, IRSTEA, Chambre d’agriculture du 34, IEM, EPURNATURE, BIO-UV, MONTPELLIER ENGINEERING
NOWMMA (34) R&D To test reclamation facility & Assess sanitary, environmental and agronomic impacts of reclaimed water reuse
SAUR, BRL, BIO-UV, PERAX, IRSTEA, MINES alès, INSA, technologies ApoH
Murviel-lès-Montpellier (34) 0.5 ha
R&D, Irrigation of vineyards Assess sanitary, environmental and agronomic impacts of reclaimed water reuse
IRSTEA, Agence de l’eau RMC, Université de Montpellier, IEM, Montpellier méditerranée Métropole
Roquefort des Corbières 12 ha
Vine irrigation BRL, Coopérative Cap Leucate, Grand Narbonne, Rhône Méditerranée water agency
Valfaunès R&D, Irrigation of vineyard ECOFILAE, CCGPSL
SmartFertiReuse Aureilhan (65) - 10 ha
R&D, Irrigation of corn Veolia Eau, CACG, Bio-Uv, Polymem, Ecofilae, FDSEA 65, Chambre d’agriculture Hautes-Pyénées, AgroParisTech, IRSTEA, INRA, BPI, Région Occitanie
Ongoing pilot projects
Deliverable 1.1: Regional state of play analyses
Page 91 of 274
Rur’eaux ; Valfaunès; SmartFertiReuse; Roquefort les Corbières
Finished pilot projects
NOWMMA ; Irrialt’eau (pilot stage)
FULL SCALE PROJECT
Negrepelisse (82) 3 ha - 6300 m3/year
Irrigation for forestry plantation (poplar and eucalyptus) reduce the impact of reclaimed water on the environment, provide biomass to produce heat
CCTVA, Adour Garonne Water Agency, DDT, FCBA, IRSTEA, SATESE, SDD
Montaut (31) 5 ha - 6 000 m3/year
Irrigation of corn reduction of reclaimed water discharge in natural environment
Deliverable 1.1: Regional state of play analyses
Page 92 of 274
3.7 Discussion and conclusion remarks
Water reclamation and reuse remains very limited in Occitanie. However, some pilots have been implemented in order to highlight the promising opportunity of using reclaimed water in a region strongly stricken by drought events. Regulations both at national and European level are major brakes on reclaimed water reuse development.
However specific conditions offer strong potential:
• Areas that cannot be reached by raw water system. Reclaimed water would be a new resource to ensure agricultural yield without competition;
• Areas without quantitative stress where reclaimed water discharged do not account into the surface and groundwater.
• Areas with qualitative threat where reclaimed water discharged has a negative impact on the environment
Deliverable 1.1: Regional state of play analyses
Page 93 of 274
3.8 References
Agence d’urbanisme catalane, Alésienne, A. d’urbanisme région nîmoise et alésienne, & Métropolitaine, A. d’urbanisme et d’aménagement T. aire. (2017). Regards croisés des agences d’urbanisme.
Agence de l’eau Rhône-Méditérranée-Corse, & Agence de l’eau Adour-Garonne. (2017). H2030 L’eau en partage - Etat des lieux régional sur l’eau en occitanie Pyrénées / Méditerranée.
Chambre Régionale d’Agriculture Provence Alpes Côte d’Azur. (2014). Référentiel des besoins en eau d’irrigation des productions agricoles de provence-alpes-côte d’azur.
Chambres d’agricultures occitanie. (2018). AGRI’SCOPIE OCCITANIE.
Département Hérault. (2018). HÉRAULT IRRIGATION Schéma départemental 2018-2030.
DIRECCTE Occitanie. (2018). Les chiffres clés.
DRAAF Occitanie. (2017). Signes officiels de qualité et d’origine. Retrieved from http://draaf.occitanie.agriculture.gouv.fr/Signes-officiels-de-qualite-et-d
DRAAF Occitanie. (2018a). Analyse & Etudes Occitanie.
DRAAF Occitanie. (2018b). L ’ agroalimentaire d ’ Occitanie : un rôle stratégique pour valoriser les produits agricoles. 9–14.
DRAAF Occitanie. (2018c). Panorama des industries agroalimentaires (Vol. 2).
DRAAF Occitanie. (2019). Mémento de la statistique agricole.
eaufrance. (2016). Données sur les prélèvements en eau. Retrieved from https://bnpe.eaufrance.fr/acces-donnees
eaufrance. (2017). données annuelles des services - assainissement non-collectif. Retrieved from données annuelles des services - assainissement non-collectif website: http://www.services.eaufrance.fr/donnees/telechargement
INSEE. (2016). Populations légales des régions en 2016. Retrieved from https://www.insee.fr/fr/statistiques/3677761?sommaire=3677855&q=population+région
INSEE. (2017). Aires urbaines en Occitanie : deux grands réseaux adossés.
Ministère de la Transition écologique et Solidaire. (n.d.). Portail d’information sur l’assainissement communal.
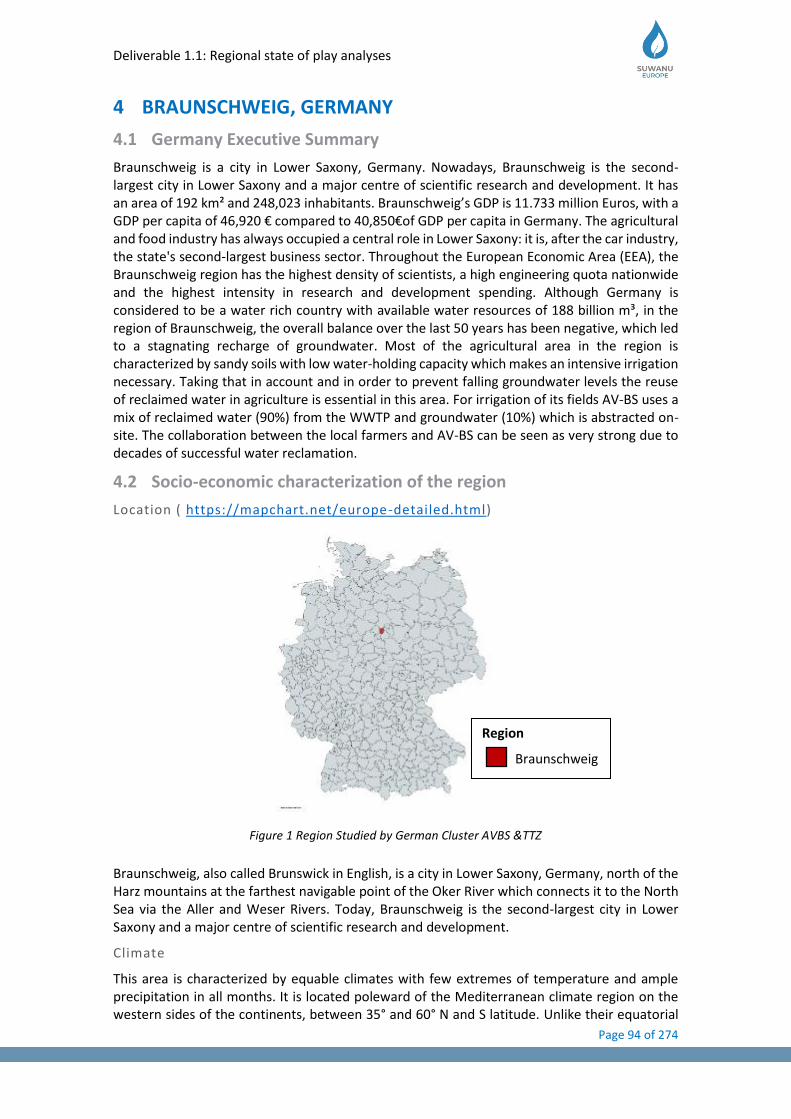
Deliverable 1.1: Regional state of play analyses
Page 94 of 274
4 BRAUNSCHWEIG, GERMANY
4.1 Germany Executive Summary
Braunschweig is a city in Lower Saxony, Germany. Nowadays, Braunschweig is the second-largest city in Lower Saxony and a major centre of scientific research and development. It has an area of 192 km² and 248,023 inhabitants. Braunschweig’s GDP is 11.733 million Euros, with a GDP per capita of 46,920 € compared to 40,850€of GDP per capita in Germany. The agricultural and food industry has always occupied a central role in Lower Saxony: it is, after the car industry, the state's second-largest business sector. Throughout the European Economic Area (EEA), the Braunschweig region has the highest density of scientists, a high engineering quota nationwide and the highest intensity in research and development spending. Although Germany is considered to be a water rich country with available water resources of 188 billion m³, in the region of Braunschweig, the overall balance over the last 50 years has been negative, which led to a stagnating recharge of groundwater. Most of the agricultural area in the region is characterized by sandy soils with low water-holding capacity which makes an intensive irrigation necessary. Taking that in account and in order to prevent falling groundwater levels the reuse of reclaimed water in agriculture is essential in this area. For irrigation of its fields AV-BS uses a mix of reclaimed water (90%) from the WWTP and groundwater (10%) which is abstracted on-site. The collaboration between the local farmers and AV-BS can be seen as very strong due to decades of successful water reclamation.
4.2 Socio-economic characterization of the region
Location ( https://mapchart.net/europe-detailed.html)
Braunschweig, also called Brunswick in English, is a city in Lower Saxony, Germany, north of the Harz mountains at the farthest navigable point of the Oker River which connects it to the North Sea via the Aller and Weser Rivers. Today, Braunschweig is the second-largest city in Lower Saxony and a major centre of scientific research and development.
Climate
This area is characterized by equable climates with few extremes of temperature and ample precipitation in all months. It is located poleward of the Mediterranean climate region on the western sides of the continents, between 35° and 60° N and S latitude. Unlike their equatorial
Region
Braunschweig
Figure 1 Region Studied by German Cluster AVBS &TTZ

Deliverable 1.1: Regional state of play analyses
Page 95 of 274
neighbours, marine west coast climates are located beyond the farthest poleward extent of the subtropical anticyclone, and they experience the mid-latitude westerlies and traveling frontal cyclones all year. Precipitation totals vary somewhat throughout the year in response to the changing location and intensity of these storm systems, but annual accumulations generally range from 500 to 2500mm (20 to 98 inches), with local totals exceeding 5000mm (197 inches) where onshore winds encounter mountain ranges. Not only is precipitation plentiful but it is also reliable and frequent. Many areas have rainfall more than 150 days per year, although the precipitation is often of low intensity. Fog is common in autumn and winter, but thunderstorms are infrequent. Strong gales with high winds may be encountered in winter.
The average amount of precipitation for the year in Braunschweig is 703.6 mm. The month with the most precipitation on average is June with 76.2 mm of precipitation. The month with the least precipitation on average is January with an average of 45.7 mm.
The average temperature for the year in Braunschweig is 7.8°C. The warmest month, on average, is July with an average temperature of 17.8°C. The coolest month on average is January, with an average temperature of 0°C.
Figure 2 Precipitation
Figure 3 Temperature
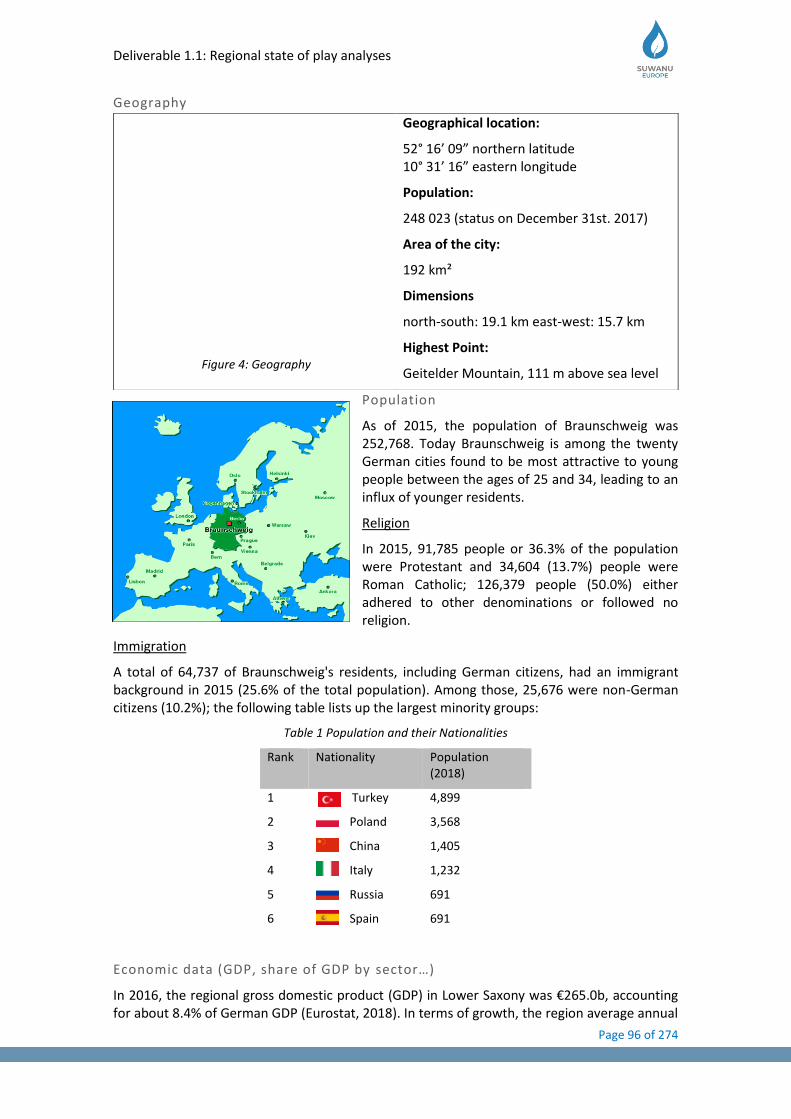
Deliverable 1.1: Regional state of play analyses
Page 96 of 274
Geography
Population
As of 2015, the population of Braunschweig was 252,768. Today Braunschweig is among the twenty German cities found to be most attractive to young people between the ages of 25 and 34, leading to an influx of younger residents.
Religion
In 2015, 91,785 people or 36.3% of the population were Protestant and 34,604 (13.7%) people were Roman Catholic; 126,379 people (50.0%) either adhered to other denominations or followed no religion.
Immigration
A total of 64,737 of Braunschweig's residents, including German citizens, had an immigrant background in 2015 (25.6% of the total population). Among those, 25,676 were non-German citizens (10.2%); the following table lists up the largest minority groups:
Table 1 Population and their Nationalities
Rank Nationality Population (2018)
1 Turkey 4,899
2 Poland 3,568
3 China 1,405
4 Italy 1,232
5 Russia 691
6 Spain 691
Economic data (GDP, share of GDP by sector…)
In 2016, the regional gross domestic product (GDP) in Lower Saxony was €265.0b, accounting for about 8.4% of German GDP (Eurostat, 2018). In terms of growth, the region average annual
Geographical location:
52° 16’ 09” northern latitude 10° 31’ 16” eastern longitude
Population:
248 023 (status on December 31st. 2017)
Area of the city:
192 km²
Dimensions
north-south: 19.1 km east-west: 15.7 km
Highest Point:
Geitelder Mountain, 111 m above sea level Figure 4: Geography
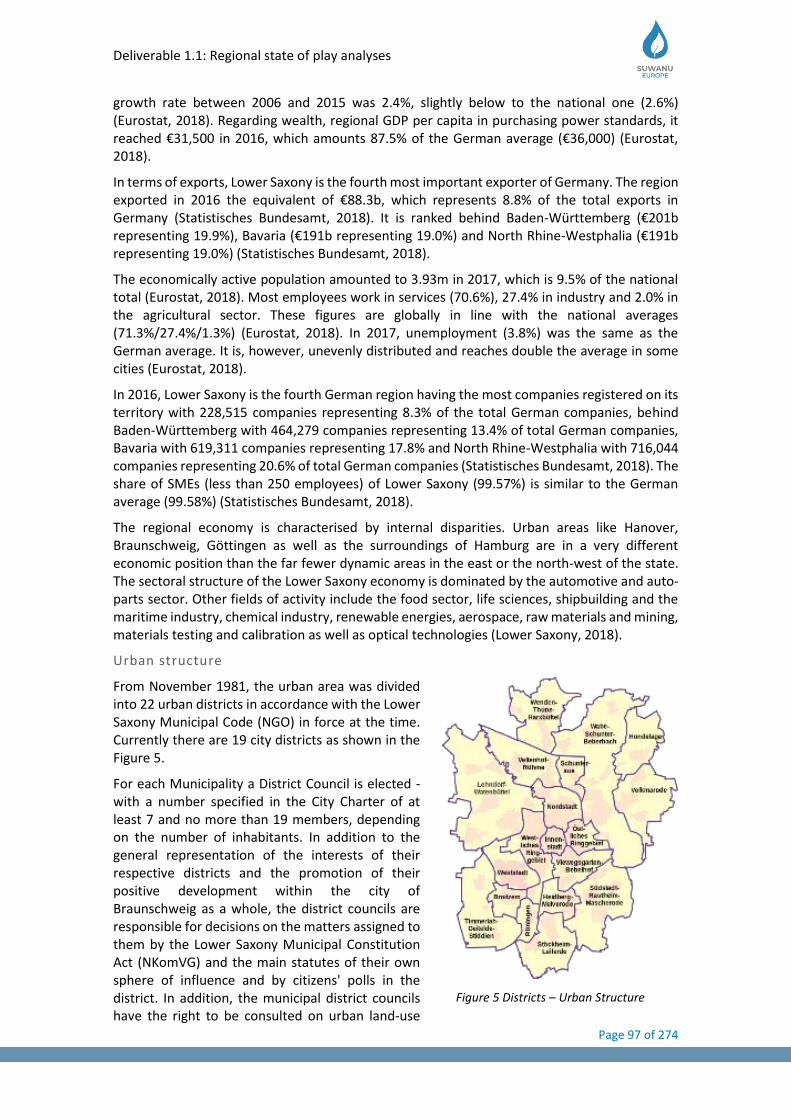
Deliverable 1.1: Regional state of play analyses
Page 97 of 274
growth rate between 2006 and 2015 was 2.4%, slightly below to the national one (2.6%) (Eurostat, 2018). Regarding wealth, regional GDP per capita in purchasing power standards, it reached €31,500 in 2016, which amounts 87.5% of the German average (€36,000) (Eurostat, 2018).
In terms of exports, Lower Saxony is the fourth most important exporter of Germany. The region exported in 2016 the equivalent of €88.3b, which represents 8.8% of the total exports in Germany (Statistisches Bundesamt, 2018). It is ranked behind Baden-Württemberg (€201b representing 19.9%), Bavaria (€191b representing 19.0%) and North Rhine-Westphalia (€191b representing 19.0%) (Statistisches Bundesamt, 2018).
The economically active population amounted to 3.93m in 2017, which is 9.5% of the national total (Eurostat, 2018). Most employees work in services (70.6%), 27.4% in industry and 2.0% in the agricultural sector. These figures are globally in line with the national averages (71.3%/27.4%/1.3%) (Eurostat, 2018). In 2017, unemployment (3.8%) was the same as the German average. It is, however, unevenly distributed and reaches double the average in some cities (Eurostat, 2018).
In 2016, Lower Saxony is the fourth German region having the most companies registered on its territory with 228,515 companies representing 8.3% of the total German companies, behind Baden-Württemberg with 464,279 companies representing 13.4% of total German companies, Bavaria with 619,311 companies representing 17.8% and North Rhine-Westphalia with 716,044 companies representing 20.6% of total German companies (Statistisches Bundesamt, 2018). The share of SMEs (less than 250 employees) of Lower Saxony (99.57%) is similar to the German average (99.58%) (Statistisches Bundesamt, 2018).
The regional economy is characterised by internal disparities. Urban areas like Hanover, Braunschweig, Göttingen as well as the surroundings of Hamburg are in a very different economic position than the far fewer dynamic areas in the east or the north-west of the state. The sectoral structure of the Lower Saxony economy is dominated by the automotive and auto-parts sector. Other fields of activity include the food sector, life sciences, shipbuilding and the maritime industry, chemical industry, renewable energies, aerospace, raw materials and mining, materials testing and calibration as well as optical technologies (Lower Saxony, 2018).
Urban structure
From November 1981, the urban area was divided into 22 urban districts in accordance with the Lower Saxony Municipal Code (NGO) in force at the time. Currently there are 19 city districts as shown in the Figure 5.
For each Municipality a District Council is elected - with a number specified in the City Charter of at least 7 and no more than 19 members, depending on the number of inhabitants. In addition to the general representation of the interests of their respective districts and the promotion of their positive development within the city of Braunschweig as a whole, the district councils are responsible for decisions on the matters assigned to them by the Lower Saxony Municipal Constitution Act (NKomVG) and the main statutes of their own sphere of influence and by citizens' polls in the district. In addition, the municipal district councils have the right to be consulted on urban land-use
Figure 5 Districts – Urban Structure
Deliverable 1.1: Regional state of play analyses
Page 98 of 274
planning and on other issues of their own and transferred sphere of activity before decisions are taken by the council and the administrative committee, to demand residents' meetings to be held by the chief administrative officer, to submit proposals, give suggestions and express concerns.
For the purpose of voting in political elections, the city is divided into 169 general constituencies and 36 postal constituencies. In municipal elections, the electoral area for the election of municipal councils is the area of the respective municipality, for the election of the representation (City Council) and the direct election of the chief administrative officer (Lord Mayor) from the entire city area, which is divided into eight electoral areas (Nordost, Östlicher Ring, Innenstadt/Südlicher Ring, Südost, Südwest, Westlicher Ring, Nordwest, Nördlicher Ring).
During state elections in Lower Saxony, the city area is divided into the three state electoral districts of Braunschweig-Nord, Braunschweig-Süd and Braunschweig-West.
Agriculture
The agricultural and food industry has always occupied a central role in Lower Saxony: it is, after the car industry, the state's second-largest business sector. The food industry employs 80,000 people, with this number rising to 100,000 if you include small, craftsman-run enterprises. The butchering and meat-processing industry form the leading sub-sector, followed by milk processing.
It is only thanks to the state's highly productive agricultural industry that the food sector has attained this strong position. One in every two potatoes produced in Germany comes from Lower Saxony, as do half of all the poultry meat, more than a third of the eggs, a third of all the pork and some 25 % of the sugar. The food industry and agriculture are partners on an equal footing; working together, they meet consumers' needs for healthy and affordable food.
The high flexibility of Lower Saxony's food industry is also ensured by the fact that the businesses involved are, overwhelmingly, small and medium-sized enterprises. Firms from Lower Saxony have for decades now been able to hold their own within the food production market.
It is not only recently that consumers have taken a critical look at the quality of produce as well as its cost. The issues of quality management and product safety have been growing in importance since before the BSE crisis emerged. Retailers place higher demands on food producers in terms of standardization, quality and product safety. Against a background of globalization, the state has seen new quality systems developed and successfully employed. Lower Saxony-based enterprises are already getting a foothold in the markets of the new EU countries: everything points towards further expansion in the future.
Hydrological data (Water resources, water use and sector use)
Although Germany is considered to be a water rich country with available water resources of 188 billion m3, the groundwater occurrence within the different states varies a lot due to the disparity in precipitation and soil condition. In these regions’ groundwater extraction is limited in regard to its consumable amount. Excessive usage can e.g. lead to the rising of deeper saline water which poses a threat to the usable groundwater resources in parts of the country.
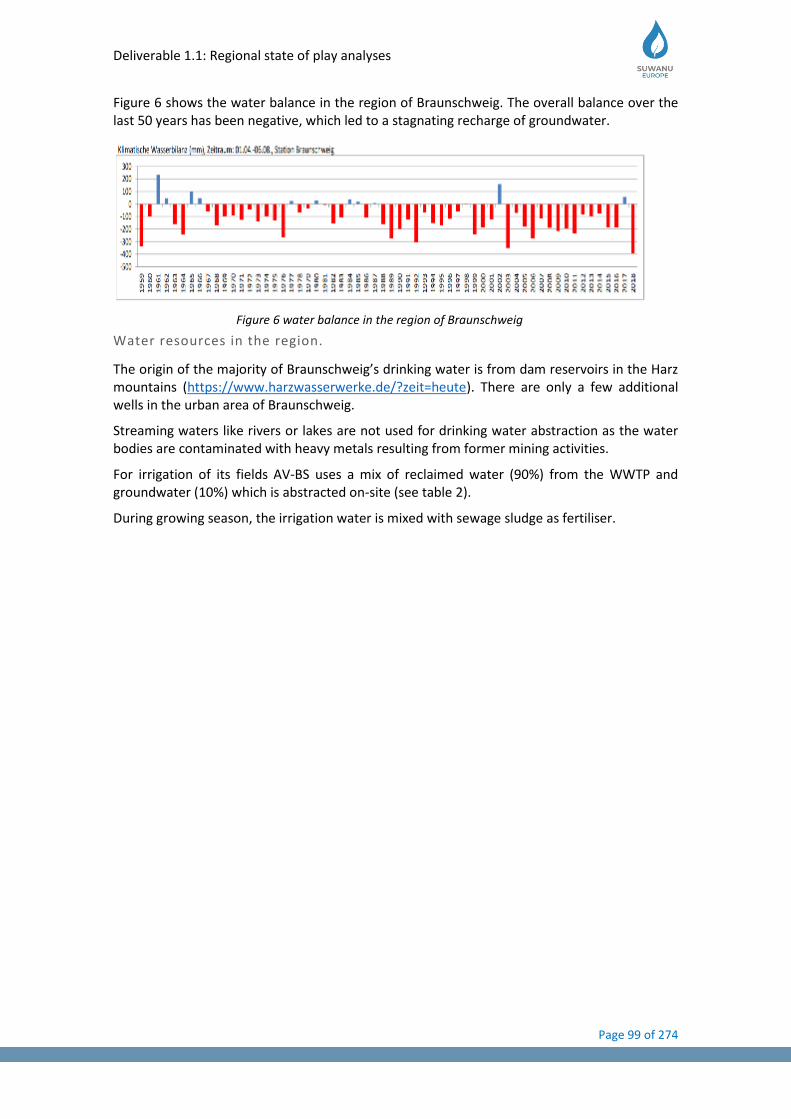
Deliverable 1.1: Regional state of play analyses
Page 99 of 274
Figure 6 shows the water balance in the region of Braunschweig. The overall balance over the last 50 years has been negative, which led to a stagnating recharge of groundwater.
Water resources in the region.
The origin of the majority of Braunschweig’s drinking water is from dam reservoirs in the Harz mountains (https://www.harzwasserwerke.de/?zeit=heute). There are only a few additional wells in the urban area of Braunschweig.
Streaming waters like rivers or lakes are not used for drinking water abstraction as the water bodies are contaminated with heavy metals resulting from former mining activities.
For irrigation of its fields AV-BS uses a mix of reclaimed water (90%) from the WWTP and groundwater (10%) which is abstracted on-site (see table 2).
During growing season, the irrigation water is mixed with sewage sludge as fertiliser.
Figure 6 water balance in the region of Braunschweig
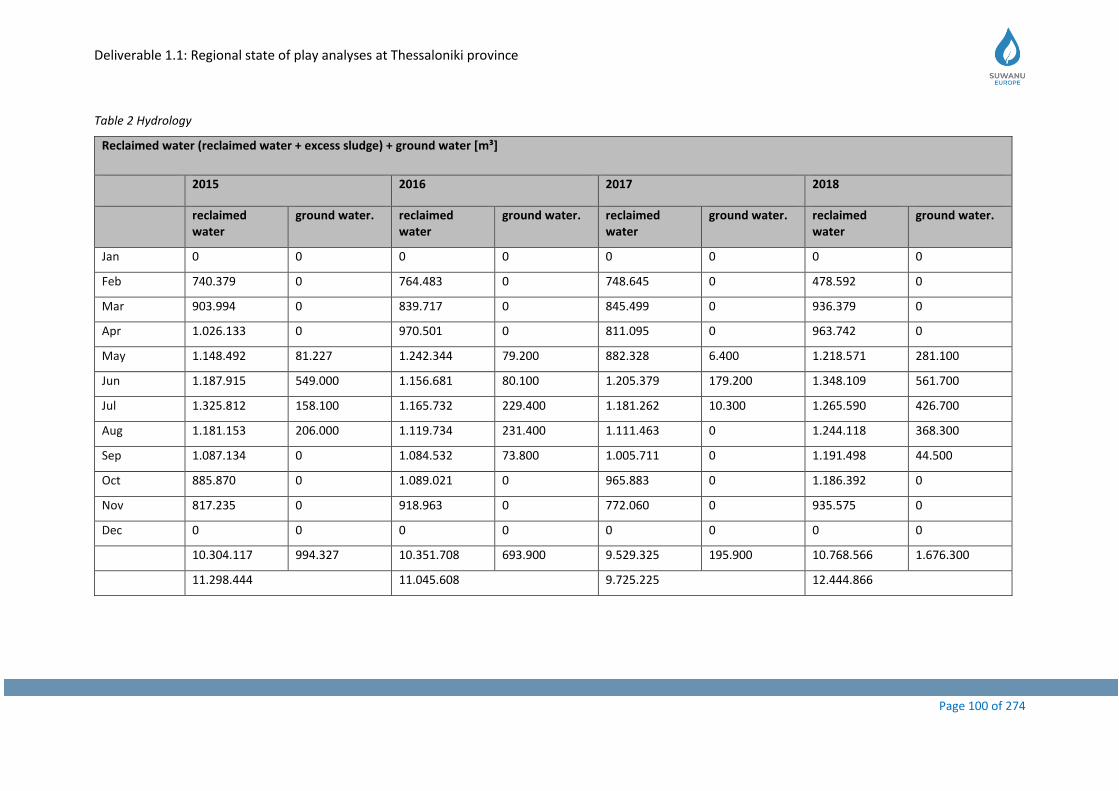
Deliverable 1.1: Regional state of play analyses at Thessaloniki province
Page 100 of 274
Table 2 Hydrology
Reclaimed water (reclaimed water + excess sludge) + ground water [m³]
2015 2016 2017 2018
reclaimed water
ground water. reclaimed water
ground water. reclaimed water
ground water. reclaimed water
ground water.
Jan 0 0 0 0 0 0 0 0
Feb 740.379 0 764.483 0 748.645 0 478.592 0
Mar 903.994 0 839.717 0 845.499 0 936.379 0
Apr 1.026.133 0 970.501 0 811.095 0 963.742 0
May 1.148.492 81.227 1.242.344 79.200 882.328 6.400 1.218.571 281.100
Jun 1.187.915 549.000 1.156.681 80.100 1.205.379 179.200 1.348.109 561.700
Jul 1.325.812 158.100 1.165.732 229.400 1.181.262 10.300 1.265.590 426.700
Aug 1.181.153 206.000 1.119.734 231.400 1.111.463 0 1.244.118 368.300
Sep 1.087.134 0 1.084.532 73.800 1.005.711 0 1.191.498 44.500
Oct 885.870 0 1.089.021 0 965.883 0 1.186.392 0
Nov 817.235 0 918.963 0 772.060 0 935.575 0
Dec 0 0 0 0 0 0 0 0
10.304.117 994.327 10.351.708 693.900 9.529.325 195.900 10.768.566 1.676.300
11.298.444 11.045.608 9.725.225 12.444.866
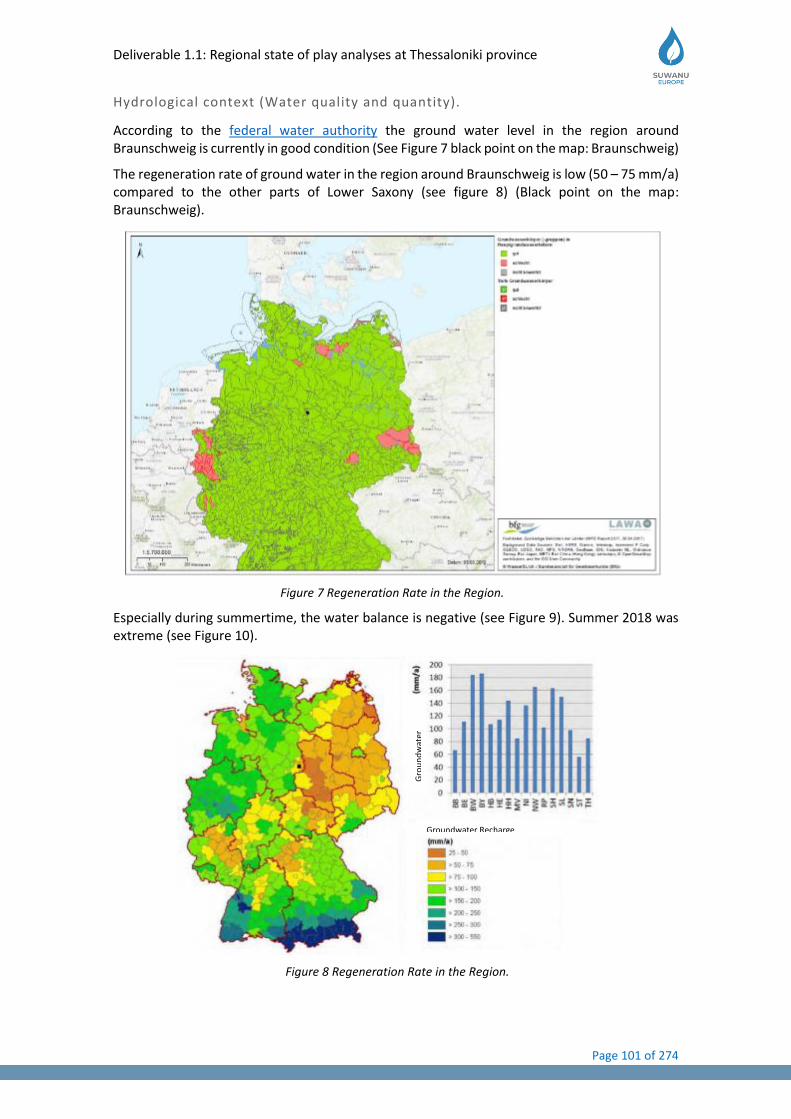
Deliverable 1.1: Regional state of play analyses at Thessaloniki province
Page 101 of 274
Hydrological context (Water quality and quantity).
According to the federal water authority the ground water level in the region around Braunschweig is currently in good condition (See Figure 7 black point on the map: Braunschweig)
The regeneration rate of ground water in the region around Braunschweig is low (50 – 75 mm/a) compared to the other parts of Lower Saxony (see figure 8) (Black point on the map: Braunschweig).
Especially during summertime, the water balance is negative (see Figure 9). Summer 2018 was extreme (see Figure 10).
Figure 8 Regeneration Rate in the Region.
Groundwater Recharge
Gro
un
dw
ater
Figure 7 Regeneration Rate in the Region.
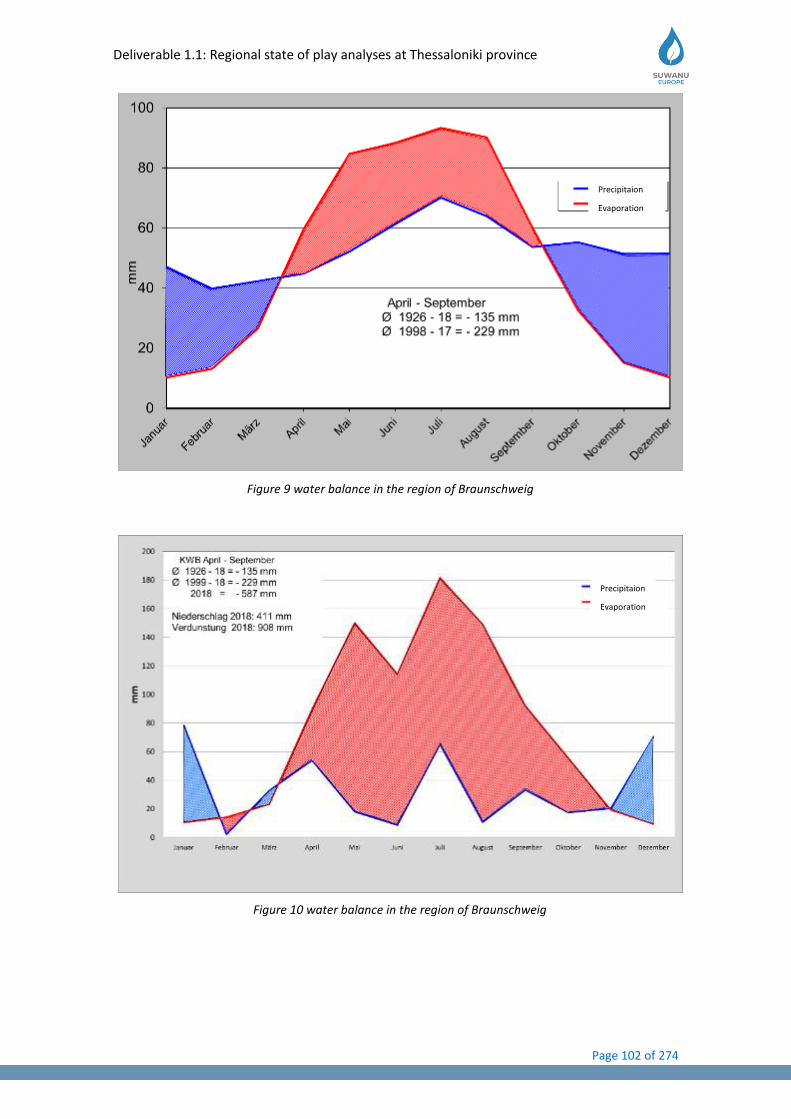
Deliverable 1.1: Regional state of play analyses at Thessaloniki province
Page 102 of 274
Precipitaion
Evaporation
Figure 9 water balance in the region of Braunschweig
Precipitaion
Evaporation
Figure 10 water balance in the region of Braunschweig
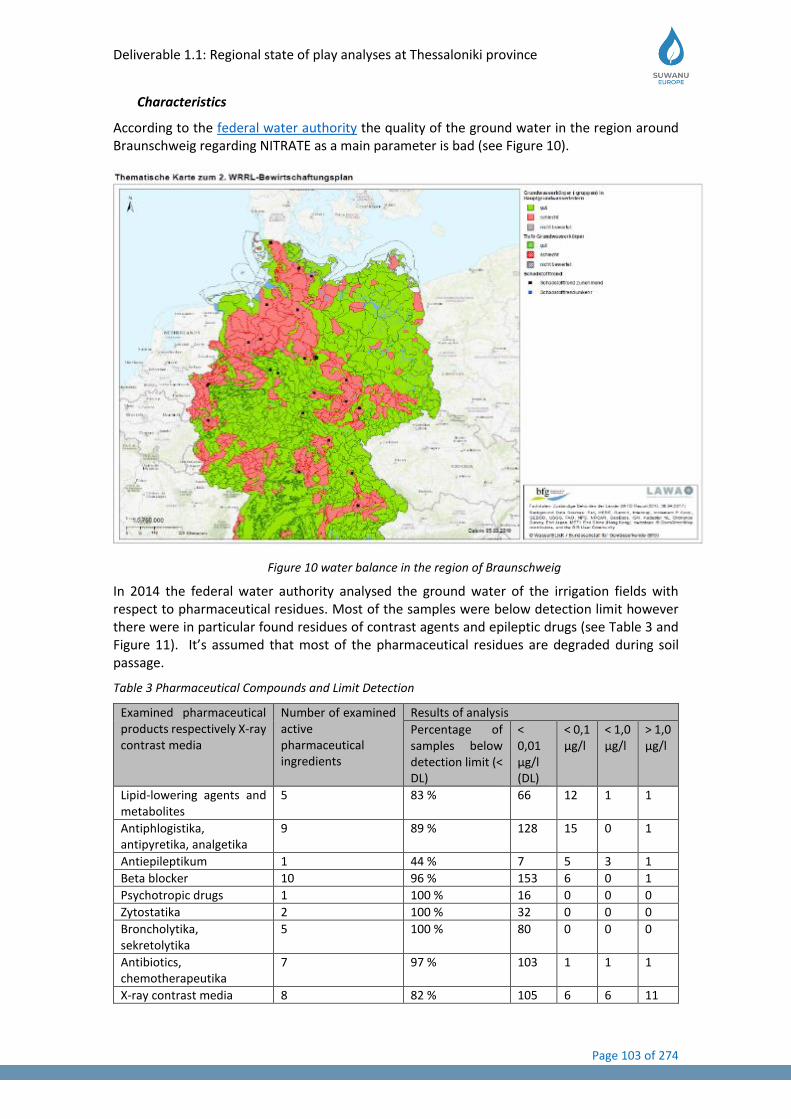
Deliverable 1.1: Regional state of play analyses at Thessaloniki province
Page 103 of 274
Characteristics
According to the federal water authority the quality of the ground water in the region around Braunschweig regarding NITRATE as a main parameter is bad (see Figure 10).
In 2014 the federal water authority analysed the ground water of the irrigation fields with respect to pharmaceutical residues. Most of the samples were below detection limit however there were in particular found residues of contrast agents and epileptic drugs (see Table 3 and Figure 11). It’s assumed that most of the pharmaceutical residues are degraded during soil passage.
Table 3 Pharmaceutical Compounds and Limit Detection
Examined pharmaceutical products respectively X-ray contrast media
Number of examined active pharmaceutical ingredients
Results of analysis
Percentage of samples below detection limit (< DL)
< 0,01 µg/l (DL)
< 0,1 µg/l
< 1,0 µg/l
> 1,0 µg/l
Lipid-lowering agents and metabolites
5 83 % 66 12 1 1
Antiphlogistika, antipyretika, analgetika
9 89 % 128 15 0 1
Antiepileptikum 1 44 % 7 5 3 1
Beta blocker 10 96 % 153 6 0 1
Psychotropic drugs 1 100 % 16 0 0 0
Zytostatika 2 100 % 32 0 0 0
Broncholytika, sekretolytika
5 100 % 80 0 0 0
Antibiotics, chemotherapeutika
7 97 % 103 1 1 1
X-ray contrast media 8 82 % 105 6 6 11
Figure 10 water balance in the region of Braunschweig

Deliverable 1.1: Regional state of play analyses at Thessaloniki province
Page 104 of 274
• Treatment Performance of the Reclamation Facility Braunschweig 2018:
The reclamation facility in Braunschweig had treated 20 Mio. m³/year of municipal wastewater on 2018. The system is mainly composed by the following operational units:
1. Primary Treatment (i.e., Screening, Areated Grit Chamber, Primary Sedimentation Tank) During this process the gross particles are removed from the water inlet.
2. Secondary Treatment (i.e., Activated Sludge Reactor), during this process aerobic, anaerobic and anoxic zone are mainly used to remove pollutants in the water. The system is composed by diverse interconnected tanks where the following biological process are undertaken:
• Biological Phosphorus Removal.
• Nitrification.
• Denitrification.
• Substrate respiration (BOD Removal).
Groundwater measuring wells with human medicine or X-ray contrast medium investigations (n=380)
GW. Measuring points with findings GW. Measuring points without findings
Figure 11 Groundwater Measuring Wells
Figure 12 Groundwater Measuring Wells
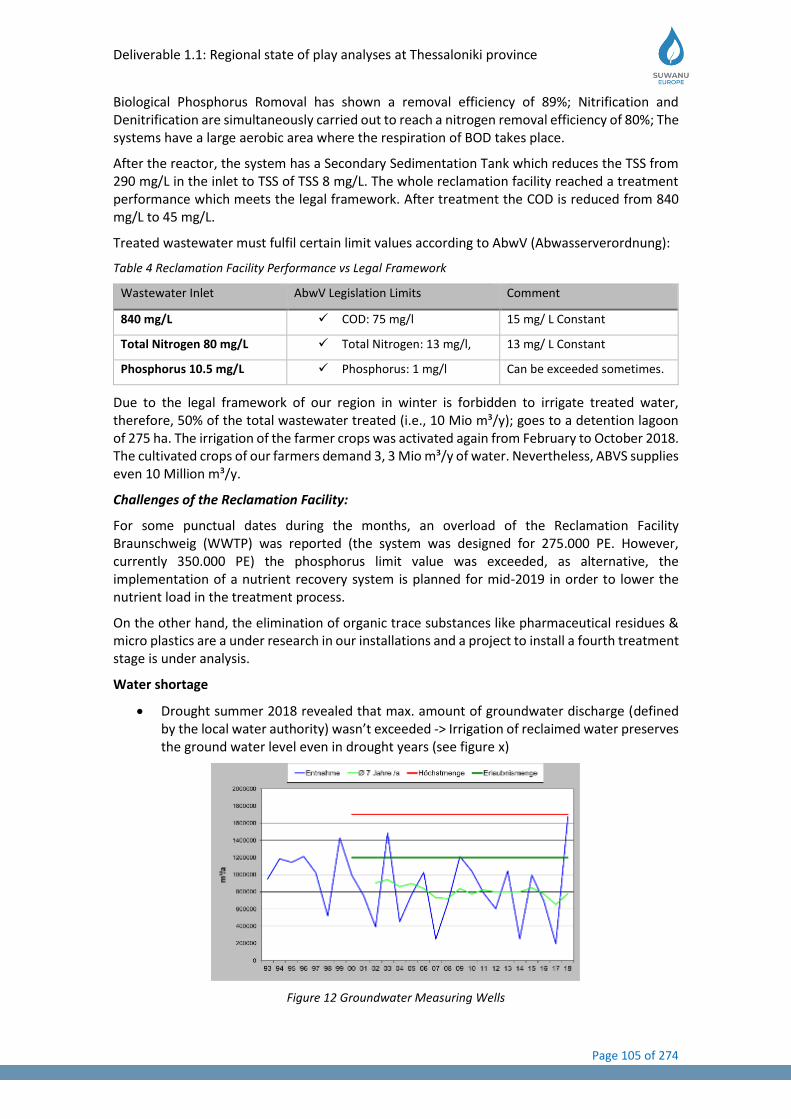
Deliverable 1.1: Regional state of play analyses at Thessaloniki province
Page 105 of 274
Biological Phosphorus Romoval has shown a removal efficiency of 89%; Nitrification and Denitrification are simultaneously carried out to reach a nitrogen removal efficiency of 80%; The systems have a large aerobic area where the respiration of BOD takes place.
After the reactor, the system has a Secondary Sedimentation Tank which reduces the TSS from 290 mg/L in the inlet to TSS of TSS 8 mg/L. The whole reclamation facility reached a treatment performance which meets the legal framework. After treatment the COD is reduced from 840 mg/L to 45 mg/L.
Treated wastewater must fulfil certain limit values according to AbwV (Abwasserverordnung):
Table 4 Reclamation Facility Performance vs Legal Framework
Wastewater Inlet AbwV Legislation Limits Comment
840 mg/L ✓ COD: 75 mg/l 15 mg/ L Constant
Total Nitrogen 80 mg/L ✓ Total Nitrogen: 13 mg/l, 13 mg/ L Constant
Phosphorus 10.5 mg/L ✓ Phosphorus: 1 mg/l Can be exceeded sometimes.
Due to the legal framework of our region in winter is forbidden to irrigate treated water, therefore, 50% of the total wastewater treated (i.e., 10 Mio m³/y); goes to a detention lagoon of 275 ha. The irrigation of the farmer crops was activated again from February to October 2018. The cultivated crops of our farmers demand 3, 3 Mio m³/y of water. Nevertheless, ABVS supplies even 10 Million m³/y.
Challenges of the Reclamation Facility:
For some punctual dates during the months, an overload of the Reclamation Facility Braunschweig (WWTP) was reported (the system was designed for 275.000 PE. However, currently 350.000 PE) the phosphorus limit value was exceeded, as alternative, the implementation of a nutrient recovery system is planned for mid-2019 in order to lower the nutrient load in the treatment process.
On the other hand, the elimination of organic trace substances like pharmaceutical residues & micro plastics are a under research in our installations and a project to install a fourth treatment stage is under analysis.
Water shortage
• Drought summer 2018 revealed that max. amount of groundwater discharge (defined by the local water authority) wasn’t exceeded -> Irrigation of reclaimed water preserves the ground water level even in drought years (see figure x)
Figure 12 Groundwater Measuring Wells
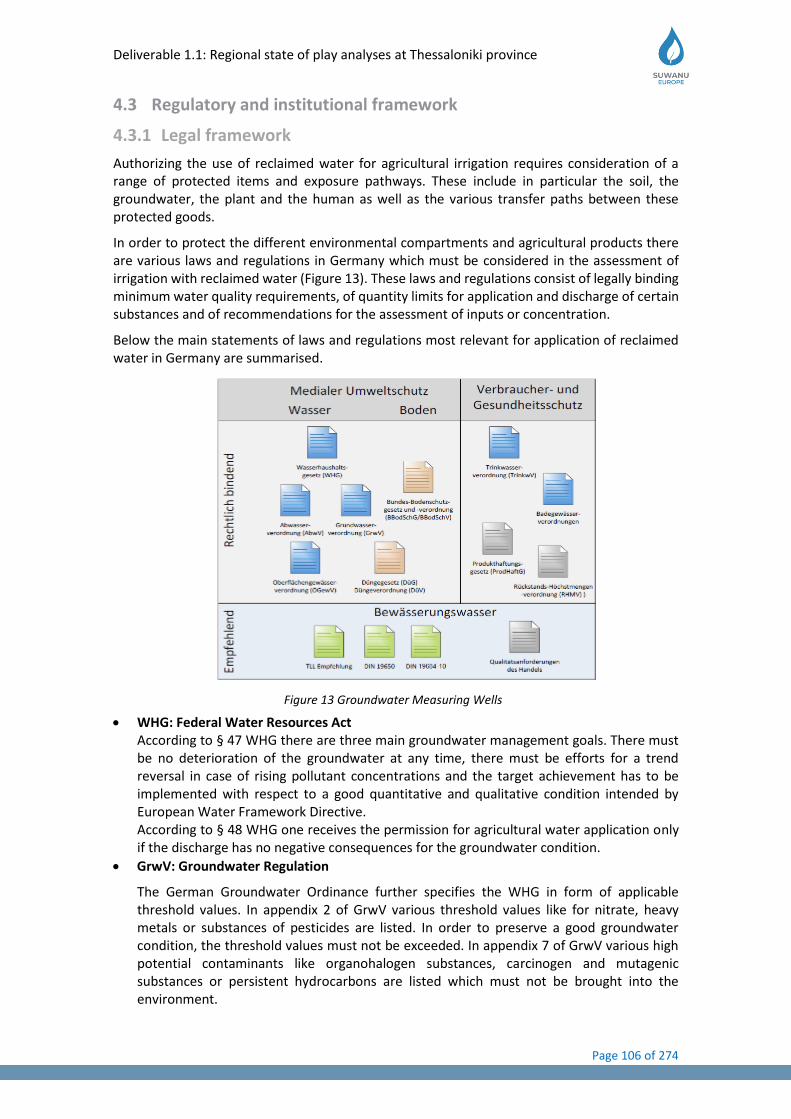
Deliverable 1.1: Regional state of play analyses at Thessaloniki province
Page 106 of 274
4.3 Regulatory and institutional framework
4.3.1 Legal framework
Authorizing the use of reclaimed water for agricultural irrigation requires consideration of a range of protected items and exposure pathways. These include in particular the soil, the groundwater, the plant and the human as well as the various transfer paths between these protected goods.
In order to protect the different environmental compartments and agricultural products there are various laws and regulations in Germany which must be considered in the assessment of irrigation with reclaimed water (Figure 13). These laws and regulations consist of legally binding minimum water quality requirements, of quantity limits for application and discharge of certain substances and of recommendations for the assessment of inputs or concentration.
Below the main statements of laws and regulations most relevant for application of reclaimed water in Germany are summarised.
• WHG: Federal Water Resources Act According to § 47 WHG there are three main groundwater management goals. There must be no deterioration of the groundwater at any time, there must be efforts for a trend reversal in case of rising pollutant concentrations and the target achievement has to be implemented with respect to a good quantitative and qualitative condition intended by European Water Framework Directive. According to § 48 WHG one receives the permission for agricultural water application only if the discharge has no negative consequences for the groundwater condition.
• GrwV: Groundwater Regulation
The German Groundwater Ordinance further specifies the WHG in form of applicable threshold values. In appendix 2 of GrwV various threshold values like for nitrate, heavy metals or substances of pesticides are listed. In order to preserve a good groundwater condition, the threshold values must not be exceeded. In appendix 7 of GrwV various high potential contaminants like organohalogen substances, carcinogen and mutagenic substances or persistent hydrocarbons are listed which must not be brought into the environment.
Figure 13 Groundwater Measuring Wells
Deliverable 1.1: Regional state of play analyses at Thessaloniki province
Page 107 of 274
• DüV: Fertiliser Regulation
The German Fertiliser Regulation represents the implementation of the European nitrate directive 91/676/EEC which was adopted in order to prevent high nitrate concentrations in the groundwater. Therefore, the application of mineral fertiliser is limited. The maximum nutrient loads according to §2 DüV are 50 kg N/(ha*y) and 13 kg P/(ha*y). According to §3 DüV the farmers has to identify the actual fertiliser demand of the crop before the application of the fertiliser.
• AbwV: Wastewater Regulation
The German Wastewater Regulation gives threshold values for the quality of treated wastewater which is discharged to the next receiving water. Appendix 1 of AbwV specifies the minimum requirements for discharge of treated with respect to COD, BOD5, nitrogen and phosphorus
• ProdHaftG: Product Liability Act
According to § 1 ProdHaftG the producers of products are liable for damages caused by a defective product. Thus, farmers can be held responsible for their products when they are contaminated with pathogens
Besides laws and regulations there are existing different legally non-binding guidelines which can be considered when one uses reclaimed water for agricultural irrigation. Below the main statements of the most important guideline, DIN 19650, is presented (Table 5).
Table 5 Hygienic and microbiological classification and application of irrigation water according to DIN 19650
Suitability Application Fecal strepto-coccus coliform count per 100 ml
E. coli coliform count per 100 ml
Salomo-nella per 1000 ml
Potential infectious stage of parasites per 1000 ml
1 drinking water
every greenhouse and outdoor cultivation
not detectable
not detectable
not detectable
not detectable
2 crops from greenhouse and outdoor cultivation for fresh consumption, school sports grounds, public parking places
< 100 < 200 not detectable
not detectable
3 not for crops for fresh consumption, vegetables until 2 weeks before harvest, crops for preservation, grass land until 2 weeks before harvest, all other outdoor crops without limitation
< 400 < 2000 not detectable
not detectable
4 as frost protection for wine and fruit crops, frost crops, wetlands, sugar beets, starch potatoes, oleiferous crops, non-food plants for industrial use, seeds until 2 weeks before harvest, grain until milk-ripe stage, fodder for preservation until 2 weeks before harvest
wastewater with at least secondary treatment
for nematodes of intestines no standard recommendation possible, for stages of teania: not detectable

Deliverable 1.1: Regional state of play analyses at Thessaloniki province
Page 108 of 274
Within the presentation of the legal framework the issue ‘Permissions and licensing’ as well as ‘Monitoring’ should also be discussed. Below all relevant data is shown.
Permissions/licensing
For the application of reclaimed water for agricultural irrigation and for the extraction of ground water a permission of the local water authority is necessary. Both permissions are assigned continuously to AV-BS.
In cases of soil or groundwater damages due to negative irrigation water characteristics the damage sum can be covered by a sewage sludge fund into which the farmers of AV-BS deposit continuously Insurance for farmers. Additional to that the liability insurance of AV-BS can be used for cases of soil or groundwater damages.
Monitoring
The agricultural land of AV-BS is monitored continuously. There is a monitoring of 6 discharge points from 500 ha drained area and additional a groundwater monitoring of 33 observation wells by the local water authority (4 samples / year). The samples are analysed for pH, conductibility, O2, P, Nitrite, Nitrate, Ammonia, TOC, COD and BOD5. Additional to that there is a sporadic monitoring of other parameters of the ground water below the agricultural land of AV-BS. Pharmaceutical residues were monitored in 2002 within the research project POSEIDON and in 2014 and in 2017 by the supreme water authority. Besides the effluent of the reclamation facility is monitored on a daily basis with analysis of pH, conductibility, O2, P, Nitrite, Nitrate, Ammonia, TOC, COD and BOD5. Moreover, there is a frequent monitoring of the effluent of the reclamation facility regarding heavy metals.
4.3.2 Standards
In Germany quality labels for agricultural products irrigated with reclaimed water don’t exist due to the fact that water reclamation in Germany is of small value.
Nevertheless, the products of the AV-BS farmers have to fulfil certain requirements if they are brought to further industrial processing like sugar refinery or baking industry. The grain delivered by the farmers has to fulfil certain baking qualities and the sugar bees need have to exceed a certain amount of sugar content so that they are accepted by the industry. Due to the not existing cultivation of crops for fresh consumption the farmers don’t have to consider any quality standard regarding microbiological pathogens.
4.3.3 Other institutional aspects
AV-BS is a public entity whose activities are controlled by a supervisory board consisting of municipality representatives and local farmers. Due to the successful long experience in water reclamation there is a strong collaboration between AV-BS and the local farmers.
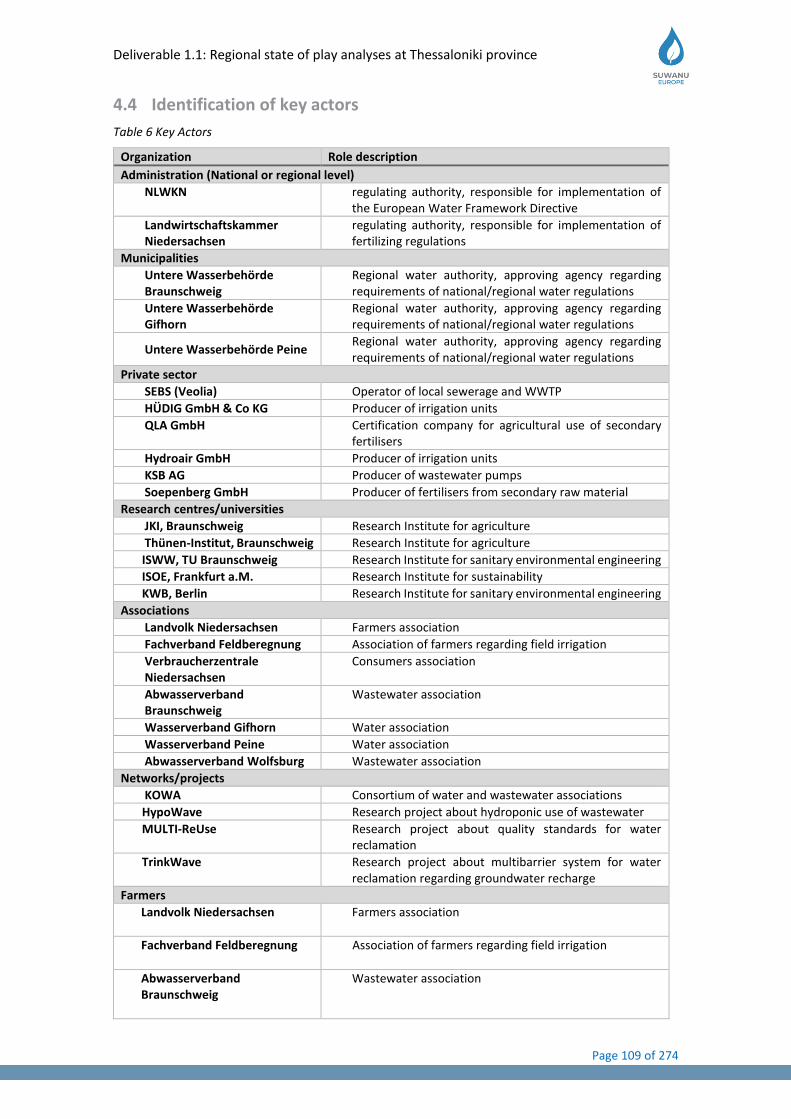
Deliverable 1.1: Regional state of play analyses at Thessaloniki province
Page 109 of 274
4.4 Identification of key actors
Table 6 Key Actors
Organization Role description
Administration (National or regional level)
NLWKN regulating authority, responsible for implementation of the European Water Framework Directive
Landwirtschaftskammer Niedersachsen
regulating authority, responsible for implementation of fertilizing regulations
Municipalities
Untere Wasserbehörde Braunschweig
Regional water authority, approving agency regarding requirements of national/regional water regulations
Untere Wasserbehörde Gifhorn
Regional water authority, approving agency regarding requirements of national/regional water regulations
Untere Wasserbehörde Peine Regional water authority, approving agency regarding requirements of national/regional water regulations
Private sector
SEBS (Veolia) Operator of local sewerage and WWTP
HÜDIG GmbH & Co KG Producer of irrigation units
QLA GmbH Certification company for agricultural use of secondary fertilisers
Hydroair GmbH Producer of irrigation units
KSB AG Producer of wastewater pumps
Soepenberg GmbH Producer of fertilisers from secondary raw material
Research centres/universities
JKI, Braunschweig Research Institute for agriculture
Thünen-Institut, Braunschweig Research Institute for agriculture
ISWW, TU Braunschweig Research Institute for sanitary environmental engineering
ISOE, Frankfurt a.M. Research Institute for sustainability
KWB, Berlin Research Institute for sanitary environmental engineering
Associations
Landvolk Niedersachsen Farmers association
Fachverband Feldberegnung Association of farmers regarding field irrigation
Verbraucherzentrale Niedersachsen
Consumers association
Abwasserverband Braunschweig
Wastewater association
Wasserverband Gifhorn Water association
Wasserverband Peine Water association
Abwasserverband Wolfsburg Wastewater association
Networks/projects
KOWA Consortium of water and wastewater associations
HypoWave Research project about hydroponic use of wastewater
MULTI-ReUse Research project about quality standards for water reclamation
TrinkWave Research project about multibarrier system for water reclamation regarding groundwater recharge
Farmers
Landvolk Niedersachsen
Farmers association
Fachverband Feldberegnung
Association of farmers regarding field irrigation
Abwasserverband Braunschweig
Wastewater association
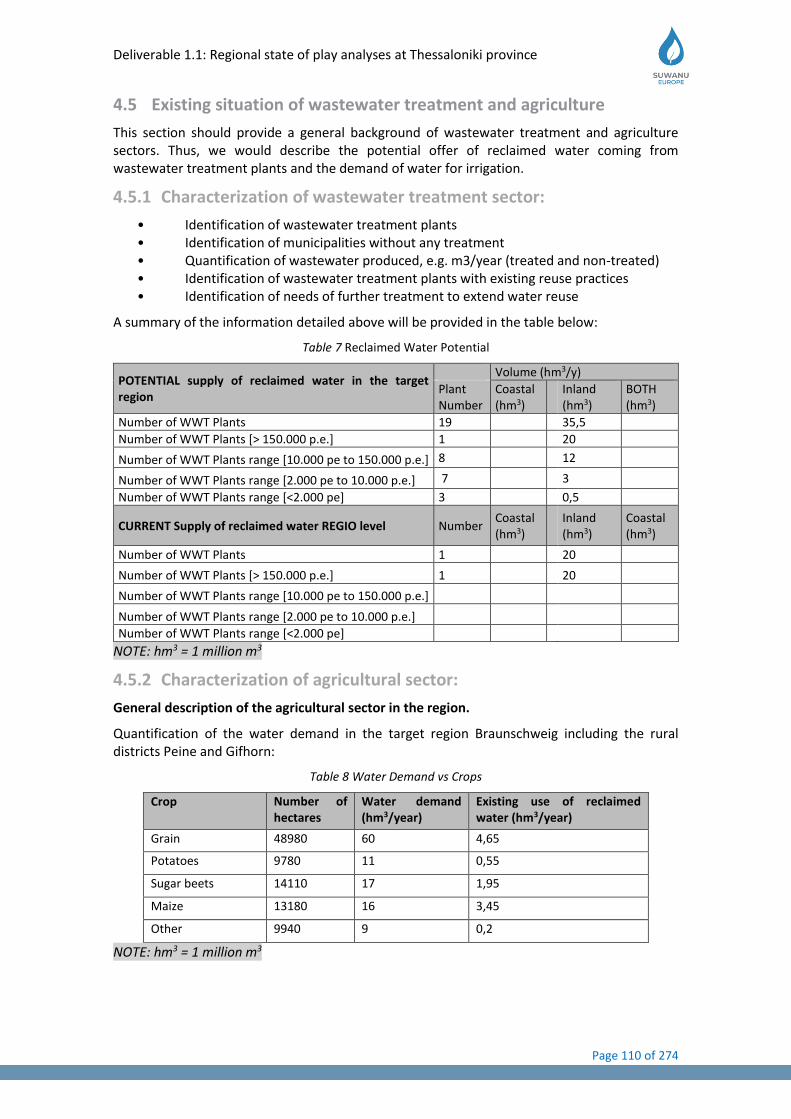
Deliverable 1.1: Regional state of play analyses at Thessaloniki province
Page 110 of 274
4.5 Existing situation of wastewater treatment and agriculture
This section should provide a general background of wastewater treatment and agriculture sectors. Thus, we would describe the potential offer of reclaimed water coming from wastewater treatment plants and the demand of water for irrigation.
4.5.1 Characterization of wastewater treatment sector:
• Identification of wastewater treatment plants • Identification of municipalities without any treatment • Quantification of wastewater produced, e.g. m3/year (treated and non-treated) • Identification of wastewater treatment plants with existing reuse practices • Identification of needs of further treatment to extend water reuse
A summary of the information detailed above will be provided in the table below:
Table 7 Reclaimed Water Potential
POTENTIAL supply of reclaimed water in the target region
Volume (hm3/y)
Plant Number
Coastal (hm3)
Inland (hm3)
BOTH (hm3)
Number of WWT Plants 19 35,5
Number of WWT Plants [> 150.000 p.e.] 1 20
Number of WWT Plants range [10.000 pe to 150.000 p.e.] 8 12
Number of WWT Plants range [2.000 pe to 10.000 p.e.] 7 3
Number of WWT Plants range [<2.000 pe] 3 0,5
CURRENT Supply of reclaimed water REGIO level Number Coastal (hm3)
Inland (hm3)
Coastal (hm3)
Number of WWT Plants 1 20
Number of WWT Plants [> 150.000 p.e.] 1 20
Number of WWT Plants range [10.000 pe to 150.000 p.e.]
Number of WWT Plants range [2.000 pe to 10.000 p.e.]
Number of WWT Plants range [<2.000 pe]
NOTE: hm3 = 1 million m3
4.5.2 Characterization of agricultural sector:
General description of the agricultural sector in the region.
Quantification of the water demand in the target region Braunschweig including the rural districts Peine and Gifhorn:
Table 8 Water Demand vs Crops
Crop Number of hectares
Water demand (hm3/year)
Existing use of reclaimed water (hm3/year)
Grain 48980 60 4,65
Potatoes 9780 11 0,55
Sugar beets 14110 17 1,95
Maize 13180 16 3,45
Other 9940 9 0,2
NOTE: hm3 = 1 million m3

Deliverable 1.1: Regional state of play analyses at Thessaloniki province
Page 111 of 274
Non-irrigated sector in the region.
In the target region Braunschweig including the rural districts Peine and Gifhorn about 50 % (50 000 ha) of the agricultural land is not irrigated. 55 hm³/year can be estimated regarding the theoretical additional potential water demand for this area. The percentage of grassland which needs in general no irrigation is about 20 % of the non-irrigated sector.
Agribusiness description
In the target region Braunschweig including the rural districts Peine and Gifhorn the majority (about 95 %) of the agricultural land is used to cultivate grain, energy maize, rapeseed, sugar beets and potatoes. It can be assumed that less than 2 % of the agricultural land is used for cultivation of other products for direct fresh consumption. The professional farms have an average size of 110 ha.
In line with the cultivation mix in the target area there are two major food processing companies in Braunschweig. Nordzucker AG is one of Europe’s biggest sugar refineries and Mühle Rüningen GmbH is of Europe’s biggest flour mills. About 70 % of the potatoes cultivated in the region are used by the German food industry. The table potatoes are mainly sold in the German retail. Due to the huge production of potatoes and sugar beets especially refined sugar and potato products are exported all over Europe. Especially little livestock holdings and market gardening farms are organised as cooperatives to establish a network for direct marketing. Besides there are local machinery cooperatives whose members use agricultural machines commonly. Moreover there a few organic grain farmers who have united to collectives in order to market their products together. Most of the farms sell their products to the local agri trade. More than 50 % of the local agri trade offices are part of cooperatives in which the farmers have voting rights.
An association for field irrigation (Fachverband Feldberegnung e.V.) was founded in 2004 representing the full spectrum of interests of the irrigating farmers in public. The association provides its members climate data about precipitation and evapotranspiration on a weekly basis including information about the right irrigation operation. Besides the association tests frequently irrigation machinery and examines new irrigation methods. The association represents the intersection between the irrigating famers and the research sector, authorities as well as other organisations and associations.
In the target region Braunschweig including the rural districts of Peine and Gifhorn the gross value of the agricultural sector is about 3,5 % which is clearly above the German average with 1,2 %. The total number of employees is about 4000 persons. Both numbers outline the economic importance of agriculture in the target region. Agriculture is an essential part of the local economy and receives accordingly frequent financial support by the national and EU institutions. The average financial support in the target region is 296 €/ha. According to F. Isermeyer German agriculture has developed relatively expansively over the past decade compared to the rather stagnant European agricultural area. The good competitive position of German agriculture is also reflected in rising land and lease prices. Meanwhile, the structural change towards bigger companies is continuing. Year after year, individual farms find that they can’t compete with their growing neighbours. In other words, agricultural production is competitive, but many farms are not. In estimating the future economic situation of agriculture, the estimation of future oil prices has become increasingly important, as world agricultural prices have been linked to oil prices.
In Braunschweig there are two agricultural research institutes: Thünen Institute targets at developing concepts for a sustainable, ecologically viable, and competitive agriculture and food economy. The Julius Kühn Institute is the Federal Research Centre for Cultivated Plants in German and promotes the sustainable production and use of crops as basic nutrients, as renewable resources and as essential elements in the living environment.

Deliverable 1.1: Regional state of play analyses at Thessaloniki province
Page 112 of 274
4.6 Existing related initiatives
Table 9: Existing Initiatives
Name of the network/project
purpose Leader/coordinator and relevant organizations
involved.
MULTIReUse
Application of new procedures in used water to reuse it in the industrial sector, agriculture or ground water recharge.
✓ Oldenburgisch-Ostfriesische Wasserverband (OOWV)
✓ DECHEMA (Society for Chemical Engineering and Biotechnology)
✓ Leibniz Centre for Agricultural Landscape Research (ZALF)
✓ ISOE – Institute for Social-Ecological Research ✓ IWW Water Centre ✓ The University of Duisburg-Essen (UDE)
HypoWave
A water-saving concept for agriculture, in which hydroponic plant production takes place using treated wastewater.
✓ Technical University Carolo-Wilhelmina of Braunschweig, Institute of Sanitary and Environmental Engineering (head of project)
✓ Fraunhofer Institute for Interfacial Engineering and Biotechnology (IGB)
✓ University of Hohenheim, Institute for tropical agricultural sciences
✓ Julius Kühn-Institut (JKI) Federal Research Institute for Cultivated Plants, Institute for Epidemiology and Pathogen Diagnostics
✓ Wastewater Association Braunschweig (AVB)
AquaRo
Reclaimed water from sugar beet processing in Uelzen to relieve groundwater abstraction and to close nutrient cycle in agriculture
✓ Irrigation association (IA) Uelzen ✓ IA Borg ✓ IA Katzen ✓ IA Rosche ✓ Sugar refinery Uelzen Nordzucker AG ✓ Agricultural chamber Uelzen ✓ University of Hamburg ✓ Water/Soil association Uelzen
MULTIReUse
Description
MULTI-ReUse closes this gap by the development and implementation of new procedures for the reuse of service water. It mainly is needed for industrial and agricultural purposes, for groundwater recharge and abroad also for the drinking water production.
The biggest task of MULTI-ReUse therefore is the development, demonstration and evaluation of a modular water treatment system, in order to offer service water in different qualities and volumes for the different purposes and to competitive prices.
MULTI-ReUse has four main objectives:
• Provisioning and adaption of innovative, modular process chains for the production of defined water qualities and –volumes, based on regular treated wastewater
• Monitoring procedures for the quality of the service water regarding health protection (hygiene) and plant protection (biofilms)
• Evaluation of action alternatives on an economic and ecologic level, as well as evaluation of socio-cultural acceptance
Deliverable 1.1: Regional state of play analyses at Thessaloniki province
Page 113 of 274
• Development of exemplary and marketable solutions for typical fields of application worldwide
The water treatment plant of Nordenham
The water treatment plant of Nordenham is run by the Stadtwerke Nordenham, which processes the water of around 36.000 inhabitants. The local and technical circumstances of the water treatment plant are optimal for the implementation and operation of a pilot plant.
The staff of the treatment plant supports the project by providing space and premises.
Research Approach
New and improved process technologies, mainly in the area of membrane processes – ultra filtration (UF) und reverse osmosis (UO) – are being researched and tested at the pilot plant. Furthermore, methodologies for a microbial monitoring are developed and tested to be able to monitor the quality of the processed service water.
During the operation phase, MULTI-ReUse will provide and qualitatively monitor three service waters in different qualities for different purposes. Another element is the evaluation of the suitability of different types of tube materials for the distribution networks for the particular service waters.
MULTI-ReUse also investigates further application possibilities of global significance beyond the industrial use. At the pilot plant, procedures are developed for the use in agricultural irrigation or artificial groundwater recharge. A special focus lies on the removal of anthropogenic – man-made – trace substances.
Stakeholders involved
Within the MULTI-ReUse project the waterboard of Oldenburg (Oldenburgisch-Ostfriesische Wasserverband, OOWV) at the location of the waste water treatment plant Nordenham in North Germany works together with the research partners IWW Water Centre, the Biofilm Centre of the University Duisburg-Essen (UDE) and the supplying companies inge GmbH, IAB Ionenaustauscher GmbH Bitterfeld – a 100% LANXESS- subsidiary company – and De.EnCon GmbH.
The interface to the industrial and agricultural sector is covered by the partners DECHEMA (Society for Chemical Engineering and Biotechnology) and the Leibniz Centre for Agricultural Landscape Research (ZALF). ISOE – Institute for Social-Ecological Research mainly focuses on the knowledge transfer of the results.
HypoWave – New Pathways Towards Wastewater Re-Use in Agriculture
Description
The research project HypoWave addresses the need for a more sustainable handling of the resource water combined with reuse of nutrients in wastewater. To this end, municipal wastewater is treated in such a way that it is available for the use within the hydroponic system. In a hydroponic system plants are cultivated in a nutrient solution and without soil. The aim is to define synergies between urban water management and agriculture, in order to use water in a more efficient way and at the same time produce agricultural products that are safe for human consumption.
Research Approach
The research association will as a first step establish a pilot plant near Wolfsburg which will make it possible to re-use municipal wastewater in agriculture. There, water treatment will be linked to an operating hydroponic system. Occuring technical processes are to be investigated as well as the plant’s economic efficiency and the quality of produced products. ISOE will determine the
Deliverable 1.1: Regional state of play analyses at Thessaloniki province
Page 114 of 274
actors involved, it will analyse the institutional and legal framework conditions and will develop models for a successful cooperation between urban water management and agriculture.
In a second step, acquired knowledge gained during the pilot period – will be examined in case studies in the Hessian Ried, in other European countries, in the border region between Belgium and Germany and in Évora (Portugal). With the help of a supplementary impact assessment performed by ISOE, possible types of application and use are to be determined.
Additionally, ISOE signs responsible for the quality of the interdisciplinary work within the joint research project. Therefore, ISOE inter alia regularly holds stakeholder dialogues thus enabling a discussion on research results with actors from practice. ISOE will also head the research association’s knowledge transfer to the interested public.
Stakeholders involved
Project Partners
• Technical University Carolo-Wilhelmina of Braunschweig, Institute of Sanitary and Environmental Engineering (head of project)
• Fraunhofer Institute for Interfacial Engineering and Biotechnology (IGB)
• University of Hohenheim, Institute for tropical agricultural sciences
• Julius Kühn-Institut (JKI) Federal Research Institute for Cultivated Plants, Institute for Epidemiology and Pathogen Diagnostics
• Wastewater Association Braunschweig (AVB)
• WEB – Wolfsburger Entwässerungsbetriebe
• ACS-Umwelttechnik GmbH & Co. KG
• Aquadrat ingenieure (a2i)
• Aquatectura
• Aquatune – Dr. Gebhardt & Co. GmbH
• BIOTEC Biologische Naturverpackungen GmbH und Co. KG
• Xylem Services GmbH
Associated partners
o Griesheim council for town planning and the environment
o Three-country-park Euregio, Maas-Rhein
o Universidade de Évora, Instituto de Ciências Agrárias e Ambientais Mediterrânicas, Portugal
AquaRo
Description
Within the project AquaRo a storage reservoir for approx. 400,000 m³ irrigation water from the sugar beet refinery in Uelzen was built. The purpose is on the one hand to relieve groundwater abstraction and on the other hand to return the remaining nutrients back to agriculture. The additional irrigation water rises the water availability from approx. 80 to 100 mm for 1250 hectares of agricultural land. The high water content of sugar beets (75 %) results in a high amount of process water coming from the refinery process. The process water is transported 18 km linear distance and 30 m difference in altitude from the sugar factory to the reservoir storage. There the water is stored almost the whole year-round and can be used during irrigation
Deliverable 1.1: Regional state of play analyses at Thessaloniki province
Page 115 of 274
season. Additionally, the farmers can reduce their demand of mineral fertiliser due to the high nutrient content of the reclaimed water. Moreover, the water from the reservoir is warmer compared to abstracted groundwater what prevents the plants from cold shocks.
Stakeholders involved
o Irrigation association (IA) Uelzen o IA Borg o IA Katzen o IA Rosche o Sugar refinery Uelzen Nordzucker AG o Agricultural chamber Uelzen o University of Hamburg o Water/Soil association Uelzen
Fachverband Feldberegnung
Description
The association for field irrigation was founded in 2004 representing the full spectrum of interests of the irrigating farmers in public. The main focus is on irrigation with groundwater. The association provides professional advice regarding irrigation practice and helps its members with construction and extension of irrigation systems. Moreover, it provides its members climate data about precipitation and evapotranspiration on a weekly basis including information about the right irrigation operation. Additionally, the climate data report contains weather forecasts for the coming week, water demand forecasts for the various crops, and soil moisture history curves. Besides the association tests frequently irrigation machinery and examines new irrigation methods. The association represents the intersection between the irrigating famers and the research sector, authorities as well as other organisations and associations.
Stakeholder
• Farmers‘ association Niedersachsen
• Authority Heidekreis
• Irrigation association Celle
• Water/soil association Lüchow-Danneberg
• Potato association Burgdorf
• Seeds association
• Authority Harburg
• Local water authority
• Irrigation association Elbe-Seitenkanal
• Irrigation association Peine
• Authority Uelzen
• Authority Lüneburg
• Farmers‘ association brewing barley
• Association organic farming
Deliverable 1.1: Regional state of play analyses at Thessaloniki province
Page 116 of 274
4.7 Discussion and conclusion remarks
Braunschweig is a city in Lower Saxony, Germany. Nowadays, Braunschweig is the second-largest city in Lower Saxony and a major centre of scientific research and development. It has an area of 192 km² and 248,023 inhabitants. The agricultural and food industry has always occupied a central role in Lower Saxony: it is, after the car industry, the state's second-largest business sector. Although Germany is considered to be a water rich country with available water resources of 188 billion m3, in the region of Braunschweig, the overall balance over the last 50 years has been negative, which led to a stagnating recharge of groundwater. Most of the agricultural area in the region is characterized by sandy soils with low water-holding capacity which makes an intensive irrigation necessary. Taking that in account and in order to prevent falling groundwater levels the reuse of reclaimed water in agriculture is essential in this area. For irrigation of its fields AV-BS uses a mix of reclaimed water (90%) from the WWTP and groundwater (10%) which is abstracted on-site.
Our studied region is a strong technology centre for water reclamation, which has a strong partnership between farmers and AV-BS Abwasserverband Braunschweig, with a long story and trajectory. In this region the farmer associations, work together to use 10.000.000 m3 /year reclaim water for their crops (February to October). Our reclaim water facility is composed by a primary treatment and a full equipped secondary treatment for nutrient recovery of phosphorus and removal nitrogen and COD. The treatment system fulfils the legal framework with exception of specific dates for Phosphorus, when the flow exceeds the design parameters.
4.8 References
Metcalf, E., & Eddy, H. (2003). Wastewater engineering: treatment and reuse. Wastewater Engineering, Treatment, Disposal and Reuse. Techobanoglous G, Burton FL, Stensel HD (eds). Tata McGraw-Hill Publishing Company Limited, 4th edition. New Delhi, India. http://doi.org/10.1016/0309-1708(80)90067-6
Mohan, G. R., Speth, T. F., Murray, D., & Garland, J. L. (2014). Municipal Wastewater: A Rediscovered Resource for Sustainable Water Reuse (Vol. 1007, pp. 153–179). http://doi.org/10.1007/978-3-319-06563-2_6
Monclús, H., Sipma, J., Ferrero, G., Rodriguez-Roda, I., & Comas, J. (2010). Biological nutrient removal in an MBR treating municipal wastewater with special focus on biological phosphorus removal. Bioresource Technology, 101(11), 3984–3991. http://doi.org/10.1016/j.biortech.2010.01.038
Urase, T., Kagawa, C., & Kikuta, T. (2005). Factors affecting removal of pharmaceutical substances and estrogens in membrane separation bioreactors. Desalination, 178(1-3 SPEC. ISS.), 107–113. http://doi.org/10.1016/j.desal.2004.11.031
https://www.braunschweig.de/english/city/townmap/location_in_europe.html
Deliverable 1.1: Regional state of play analyses at Thessaloniki province
Page 117 of 274
5 THESSALONIKI PROVINCE, GREECE
5.1 Greece Executive Summary
Greece – Thessaloniki: Thessaloniki is the second largest city of Greece. Thessaloniki is located on the Thermaikos Gulf, at the northwest part of the Aegean Sea. It is bounded on the west by the delta of the Axios River. According to the most recent census data the Thessaloniki Urban Area has a population of 824,676 inhabitants while the Thessaloniki Metropolitan Area has 1,030,338 inhabitants. It has an area of 1,285.61 km2 (metropolitan area) and is part of the Region of Central Macedonia. Although it is an area with high population density it has also a particularly important agricultural sector. Thessaloniki does not face particular water problems although the large population and the water requirements for irrigation make the area sensitive to water management issues. In addition, the environmental concerns of Thessaloniki residents and municipal authorities make sewage treatment a major issue in the area.
Indicators:
• Water consumption in Thessaloniki increases 1.4% per year (mainly for irrigation)
• The secondary effluent of the city’s Wastewater Treatment Plant (WWTP) is used for agricultural irrigation after mixing with freshwater at a 1:5 ratio.
• It was estimated that more than 75% of the population was connected to WWTPs with a total capacity of over 1.50 mm3/day.
• The major WWTP in Thessaloniki (Sindos) has a capacity of 165,00 m3/day and covers more than 2,500 ha irrigated land (mainly corn, sugar beet, rice)
5.2 Socio-economic characterization of the region
Location
The province of Thessaloniki (ex. Thessaloniki Prefecture) under the recent administrative reforms6 that were put on force by the low named “Kallikratis” has the status of Peripheral Unit (P.U.) of Thessaloniki and is one of the seven Peripheral Units that compose the Region of Central Macedonia (RCM) in northern Greece. The “Kallikratis” program is called the Greek law 3852/2010, which reformed the administrative division of Greece in 2011 and redefined the limits of the local authorities, the way of choosing the organs and their responsibilities.
Largest city and capital of northern Greece (second in size city of Greece) is Thessaloniki. The city concentrates almost half of the total RCM population. A key element of the position of the RCM at national level is the metropolitan role of Thessaloniki, which has a wide interregional (and marginal) national dimension.
The picture bellow gives an indicative view of the wider Thessaloniki province
6 Government Gazette 87 A/7-6-2010
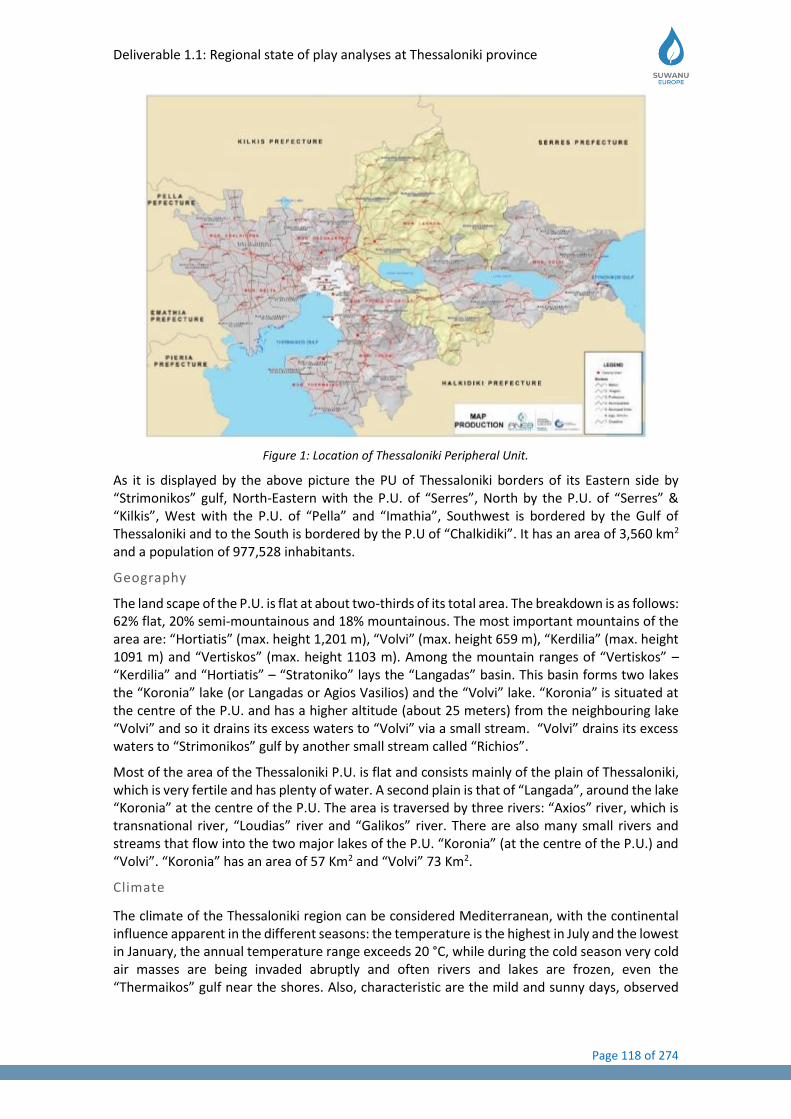
Deliverable 1.1: Regional state of play analyses at Thessaloniki province
Page 118 of 274
Figure 1: Location of Thessaloniki Peripheral Unit.
As it is displayed by the above picture the PU of Thessaloniki borders of its Eastern side by “Strimonikos” gulf, North-Eastern with the P.U. of “Serres”, North by the P.U. of “Serres” & “Kilkis”, West with the P.U. of “Pella” and “Imathia”, Southwest is bordered by the Gulf of Thessaloniki and to the South is bordered by the P.U of “Chalkidiki”. It has an area of 3,560 km2 and a population of 977,528 inhabitants.
Geography
The land scape of the P.U. is flat at about two-thirds of its total area. The breakdown is as follows: 62% flat, 20% semi-mountainous and 18% mountainous. The most important mountains of the area are: “Hortiatis” (max. height 1,201 m), “Volvi” (max. height 659 m), “Kerdilia” (max. height 1091 m) and “Vertiskos” (max. height 1103 m). Among the mountain ranges of “Vertiskos” – “Kerdilia” and “Hortiatis” – “Stratoniko” lays the “Langadas” basin. This basin forms two lakes the “Koronia” lake (or Langadas or Agios Vasilios) and the “Volvi” lake. “Koronia” is situated at the centre of the P.U. and has a higher altitude (about 25 meters) from the neighbouring lake “Volvi” and so it drains its excess waters to “Volvi” via a small stream. “Volvi” drains its excess waters to “Strimonikos” gulf by another small stream called “Richios”.
Most of the area of the Thessaloniki P.U. is flat and consists mainly of the plain of Thessaloniki, which is very fertile and has plenty of water. A second plain is that of “Langada”, around the lake “Koronia” at the centre of the P.U. The area is traversed by three rivers: “Axios” river, which is transnational river, “Loudias” river and “Galikos” river. There are also many small rivers and streams that flow into the two major lakes of the P.U. “Koronia” (at the centre of the P.U.) and “Volvi”. “Koronia” has an area of 57 Km2 and “Volvi” 73 Km2.
Climate
The climate of the Thessaloniki region can be considered Mediterranean, with the continental influence apparent in the different seasons: the temperature is the highest in July and the lowest in January, the annual temperature range exceeds 20 °C, while during the cold season very cold air masses are being invaded abruptly and often rivers and lakes are frozen, even the “Thermaikos” gulf near the shores. Also, characteristic are the mild and sunny days, observed
Deliverable 1.1: Regional state of play analyses at Thessaloniki province
Page 119 of 274
approximately in the middle of the winter, the relatively large number of summer and tropical days and the decrease of the rains in the summer.
The average annual air temperature is around 16.2 °C, the lowest average temperature (January) is around 2.2 °C and the highest (July) is around 32.0 ° C. The absolute maximum has reached 43.0 °C and their absolutely minimum -12.6 °C. Over the year, about 140 days have a maximum temperature above 25 °C and about 70 above 30 °C, while 107 are clear and 73 are cloud covered. Sunshine hours range from 2400 to 2600. The annual rainfall is around 462 mm. Snow is not a rare phenomenon.
As for the winds, they are different in seasons: in the winter prevail the northern, coming from the valley of Axios “Vardaris”, and less the west, the southwest (sea breezes) become more frequent in the spring, in the summer the northern and the Southwest, due first in the current of the year and the second in the sea breeze, while in September the Southwest is diminished and from November dominate again the north and the west. The table below displays main climate data for Thessaloniki area.
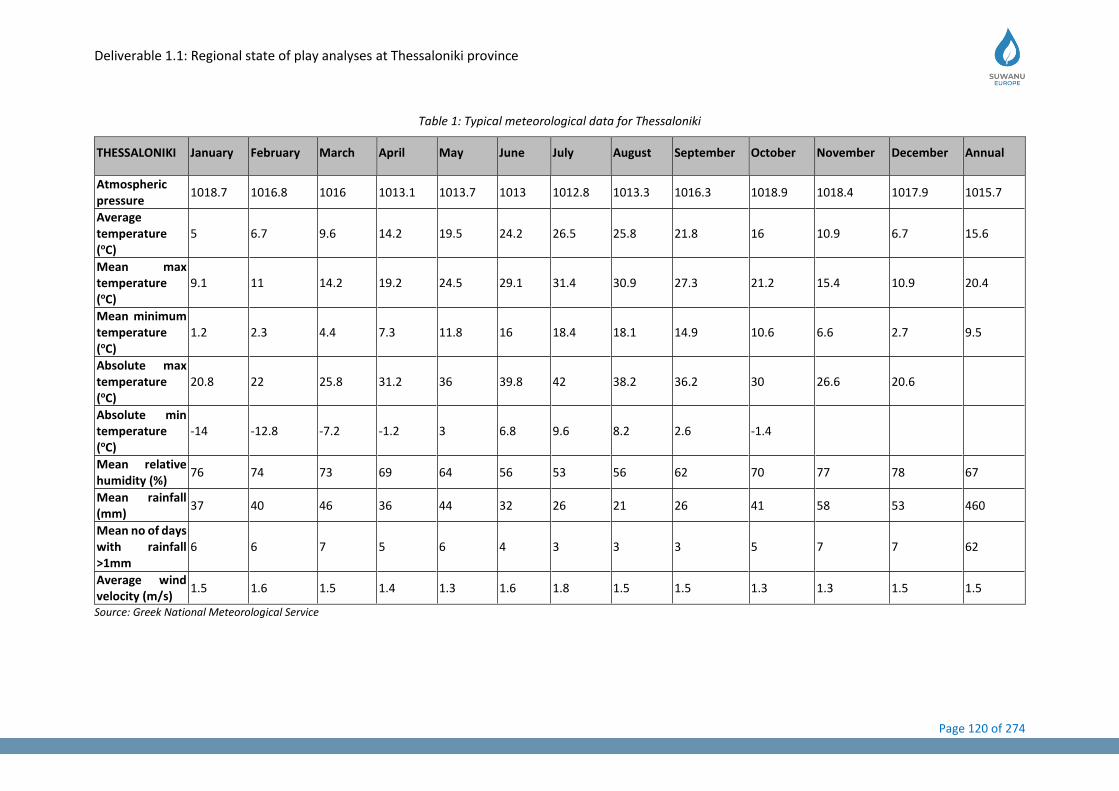
Deliverable 1.1: Regional state of play analyses at Thessaloniki province
Page 120 of 274
Table 1: Typical meteorological data for Thessaloniki
THESSALONIKI January February March April May June July August September October November December Annual
Atmospheric pressure
1018.7 1016.8 1016 1013.1 1013.7 1013 1012.8 1013.3 1016.3 1018.9 1018.4 1017.9 1015.7
Average temperature (oC)
5 6.7 9.6 14.2 19.5 24.2 26.5 25.8 21.8 16 10.9 6.7 15.6
Mean max temperature (oC)
9.1 11 14.2 19.2 24.5 29.1 31.4 30.9 27.3 21.2 15.4 10.9 20.4
Mean minimum temperature (oC)
1.2 2.3 4.4 7.3 11.8 16 18.4 18.1 14.9 10.6 6.6 2.7 9.5
Absolute max temperature (oC)
20.8 22 25.8 31.2 36 39.8 42 38.2 36.2 30 26.6 20.6
Absolute min temperature (oC)
-14 -12.8 -7.2 -1.2 3 6.8 9.6 8.2 2.6 -1.4
Mean relative humidity (%)
76 74 73 69 64 56 53 56 62 70 77 78 67
Mean rainfall (mm)
37 40 46 36 44 32 26 21 26 41 58 53 460
Mean no of days with rainfall >1mm
6 6 7 5 6 4 3 3 3 5 7 7 62
Average wind velocity (m/s)
1.5 1.6 1.5 1.4 1.3 1.6 1.8 1.5 1.5 1.3 1.3 1.5 1.5
Source: Greek National Meteorological Service
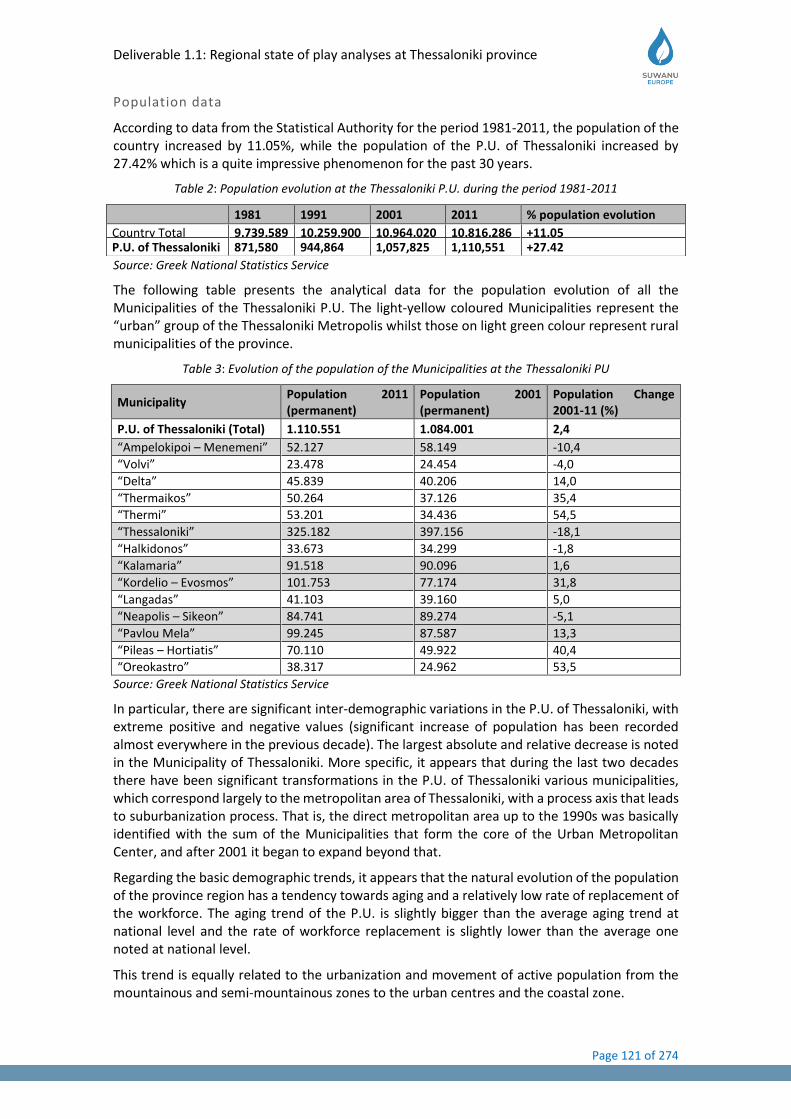
Deliverable 1.1: Regional state of play analyses at Thessaloniki province
Page 121 of 274
Population data
According to data from the Statistical Authority for the period 1981-2011, the population of the country increased by 11.05%, while the population of the P.U. of Thessaloniki increased by 27.42% which is a quite impressive phenomenon for the past 30 years.
Table 2: Population evolution at the Thessaloniki P.U. during the period 1981-2011
Source: Greek National Statistics Service
The following table presents the analytical data for the population evolution of all the Municipalities of the Thessaloniki P.U. The light-yellow coloured Municipalities represent the “urban” group of the Thessaloniki Metropolis whilst those on light green colour represent rural municipalities of the province.
Table 3: Evolution of the population of the Municipalities at the Thessaloniki PU
Municipality Population 2011 (permanent)
Population 2001 (permanent)
Population Change 2001-11 (%)
P.U. of Thessaloniki (Total) 1.110.551 1.084.001 2,4
“Ampelokipoi – Menemeni” 52.127 58.149 -10,4
“Volvi” 23.478 24.454 -4,0
“Delta” 45.839 40.206 14,0
“Thermaikos” 50.264 37.126 35,4
“Thermi” 53.201 34.436 54,5
“Thessaloniki” 325.182 397.156 -18,1
“Halkidonos” 33.673 34.299 -1,8
“Kalamaria” 91.518 90.096 1,6
“Kordelio – Evosmos” 101.753 77.174 31,8
“Langadas” 41.103 39.160 5,0
“Neapolis – Sikeon” 84.741 89.274 -5,1
“Pavlou Mela” 99.245 87.587 13,3
“Pileas – Hortiatis” 70.110 49.922 40,4
“Oreokastro” 38.317 24.962 53,5
Source: Greek National Statistics Service
In particular, there are significant inter-demographic variations in the P.U. of Thessaloniki, with extreme positive and negative values (significant increase of population has been recorded almost everywhere in the previous decade). The largest absolute and relative decrease is noted in the Municipality of Thessaloniki. More specific, it appears that during the last two decades there have been significant transformations in the P.U. of Thessaloniki various municipalities, which correspond largely to the metropolitan area of Thessaloniki, with a process axis that leads to suburbanization process. That is, the direct metropolitan area up to the 1990s was basically identified with the sum of the Municipalities that form the core of the Urban Metropolitan Center, and after 2001 it began to expand beyond that.
Regarding the basic demographic trends, it appears that the natural evolution of the population of the province region has a tendency towards aging and a relatively low rate of replacement of the workforce. The aging trend of the P.U. is slightly bigger than the average aging trend at national level and the rate of workforce replacement is slightly lower than the average one noted at national level.
This trend is equally related to the urbanization and movement of active population from the mountainous and semi-mountainous zones to the urban centres and the coastal zone.
1981 1991 2001 2011 % population evolution
Country Total 9,739,589 10,259,900 10,964,020 10,816,286 +11.05 P.U. of Thessaloniki 871,580 944,864 1,057,825 1,110,551 +27.42

Deliverable 1.1: Regional state of play analyses at Thessaloniki province
Page 122 of 274
Also, it must be noted that in almost all the spatial units of the Thessaloniki province the number of women slightly exceeds the number of men.
Economy data of wider Thessaloniki Province
Regarding the economic development of the entire Region of Central Macedonia, it is noted that it has a development gap with respect to the average of the country. Thus, the GDP of the Region is below the per capita GDP of the Country, although it has been evolving over time.
However, the P.U. of Thessaloniki displays a per capita GDP that is above of the average GDP per capita of the entire Region. Basically, the average per capita GDP of the Region is raised by the contribution of the P.U’s of Thessaloniki and Chalkidiki, as there are intense intraregional inequalities. The high position of the P.U. of Thessaloniki is due to its metropolitan character and the concentration of many industrial units as well as dynamic services.
All the P.U’s of the region suffer a significant decrease in GDP starting from the year 2010, due to the economic crisis that began in the country. The production system of the entire RGM is highly concentrated in a few sectors of industry and primary production, generally based on high intense of labour and capital, as well as in consumer services, and less in dynamic business support or export services (except for tourism).
The total percentage of the active population of the Region is just above the average of the country, but it is less than the benchmark of 70%, which is the goal of the Lisbon Strategy. During the crisis there is a constant fall in the number of people with a parallel increase in unemployment.
According to Greek Statistics Service data, the unemployment rate in the R.C.M. is the second highest in the country, with unemployment rates being particularly high for young people (over 50%), for women and for the unskilled elderly. Also, the number of long-term unemployed is also rising.
The table below shows the evolution of per capita GDP over the recent years for the R.C.M.
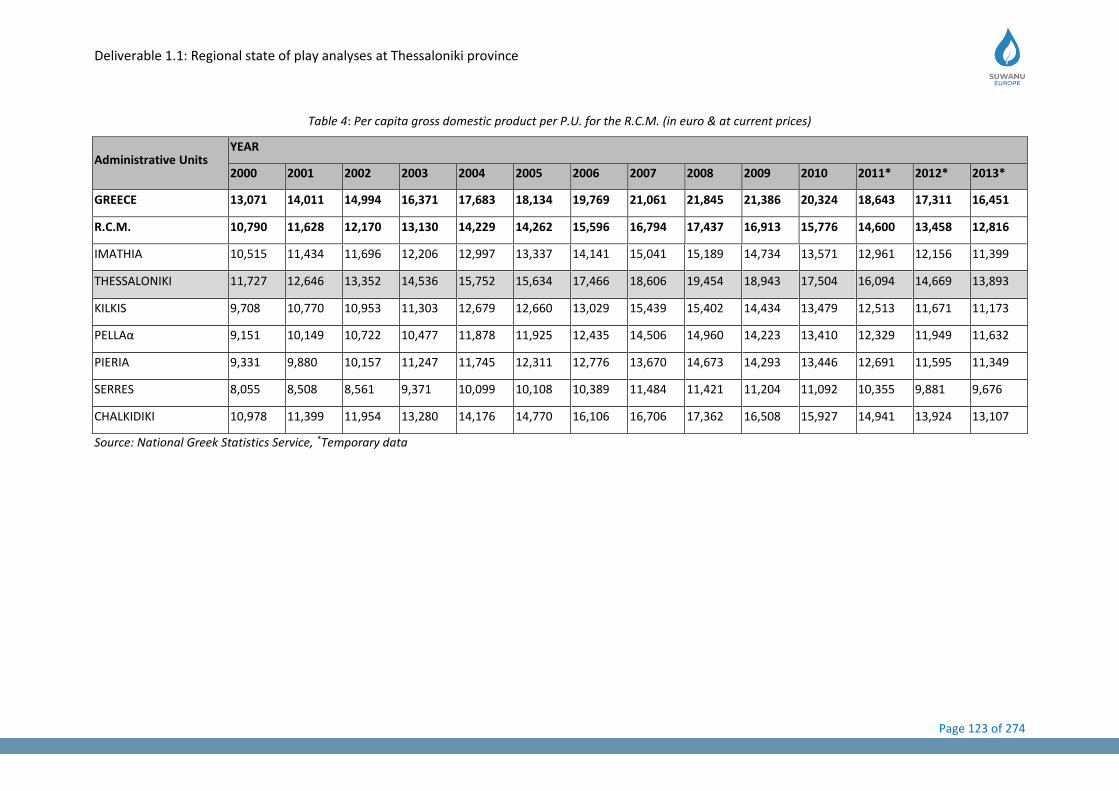
Deliverable 1.1: Regional state of play analyses at Thessaloniki province
Page 123 of 274
Table 4: Per capita gross domestic product per P.U. for the R.C.M. (in euro & at current prices)
Administrative Units YEAR
2000 2001 2002 2003 2004 2005 2006 2007 2008 2009 2010 2011* 2012* 2013*
GREECE 13,071 14,011 14,994 16,371 17,683 18,134 19,769 21,061 21,845 21,386 20,324 18,643 17,311 16,451
R.C.M. 10,790 11,628 12,170 13,130 14,229 14,262 15,596 16,794 17,437 16,913 15,776 14,600 13,458 12,816
IMATHIA 10,515 11,434 11,696 12,206 12,997 13,337 14,141 15,041 15,189 14,734 13,571 12,961 12,156 11,399
THESSALONIKI 11,727 12,646 13,352 14,536 15,752 15,634 17,466 18,606 19,454 18,943 17,504 16,094 14,669 13,893
KILKIS 9,708 10,770 10,953 11,303 12,679 12,660 13,029 15,439 15,402 14,434 13,479 12,513 11,671 11,173
PELLAα 9,151 10,149 10,722 10,477 11,878 11,925 12,435 14,506 14,960 14,223 13,410 12,329 11,949 11,632
PIERIA 9,331 9,880 10,157 11,247 11,745 12,311 12,776 13,670 14,673 14,293 13,446 12,691 11,595 11,349
SERRES 8,055 8,508 8,561 9,371 10,099 10,108 10,389 11,484 11,421 11,204 11,092 10,355 9,881 9,676
CHALKIDIKI 10,978 11,399 11,954 13,280 14,176 14,770 16,106 16,706 17,362 16,508 15,927 14,941 13,924 13,107
Source: National Greek Statistics Service, *Temporary data
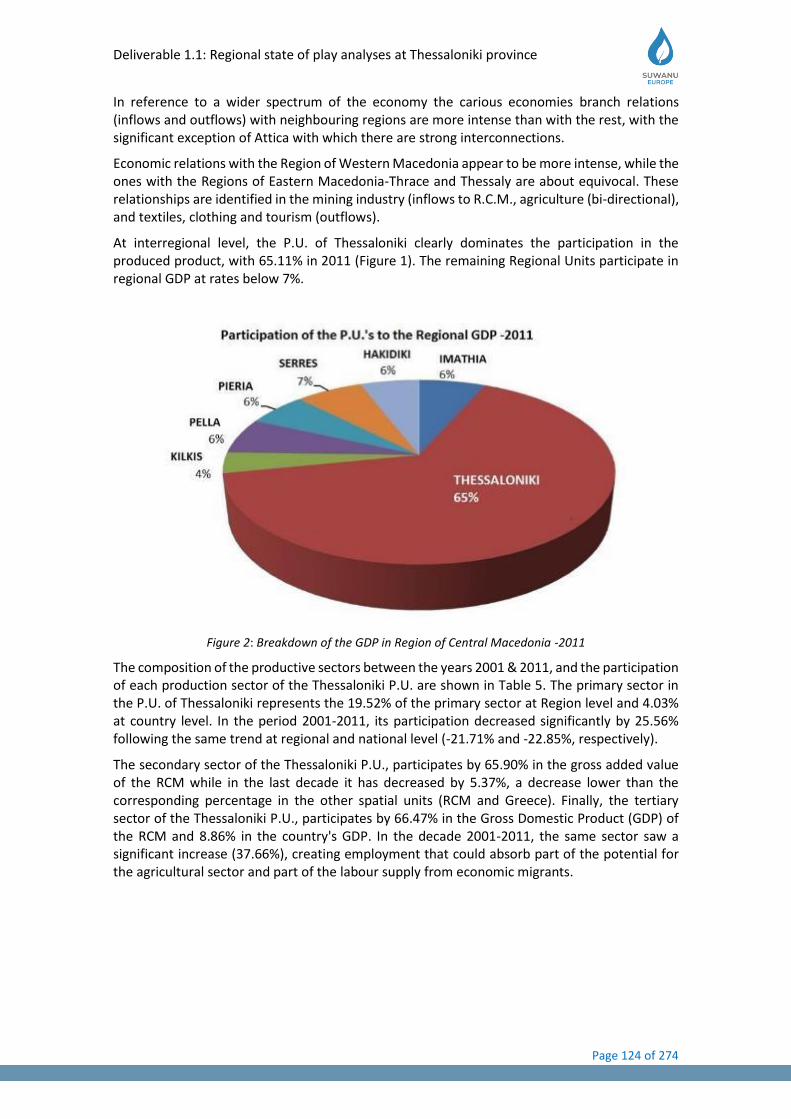
Deliverable 1.1: Regional state of play analyses at Thessaloniki province
Page 124 of 274
In reference to a wider spectrum of the economy the carious economies branch relations (inflows and outflows) with neighbouring regions are more intense than with the rest, with the significant exception of Attica with which there are strong interconnections.
Economic relations with the Region of Western Macedonia appear to be more intense, while the ones with the Regions of Eastern Macedonia-Thrace and Thessaly are about equivocal. These relationships are identified in the mining industry (inflows to R.C.M., agriculture (bi-directional), and textiles, clothing and tourism (outflows).
At interregional level, the P.U. of Thessaloniki clearly dominates the participation in the produced product, with 65.11% in 2011 (Figure 1). The remaining Regional Units participate in regional GDP at rates below 7%.
Figure 2: Breakdown of the GDP in Region of Central Macedonia -2011
The composition of the productive sectors between the years 2001 & 2011, and the participation of each production sector of the Thessaloniki P.U. are shown in Table 5. The primary sector in the P.U. of Thessaloniki represents the 19.52% of the primary sector at Region level and 4.03% at country level. In the period 2001-2011, its participation decreased significantly by 25.56% following the same trend at regional and national level (-21.71% and -22.85%, respectively).
The secondary sector of the Thessaloniki P.U., participates by 65.90% in the gross added value of the RCM while in the last decade it has decreased by 5.37%, a decrease lower than the corresponding percentage in the other spatial units (RCM and Greece). Finally, the tertiary sector of the Thessaloniki P.U., participates by 66.47% in the Gross Domestic Product (GDP) of the RCM and 8.86% in the country's GDP. In the decade 2001-2011, the same sector saw a significant increase (37.66%), creating employment that could absorb part of the potential for the agricultural sector and part of the labour supply from economic migrants.
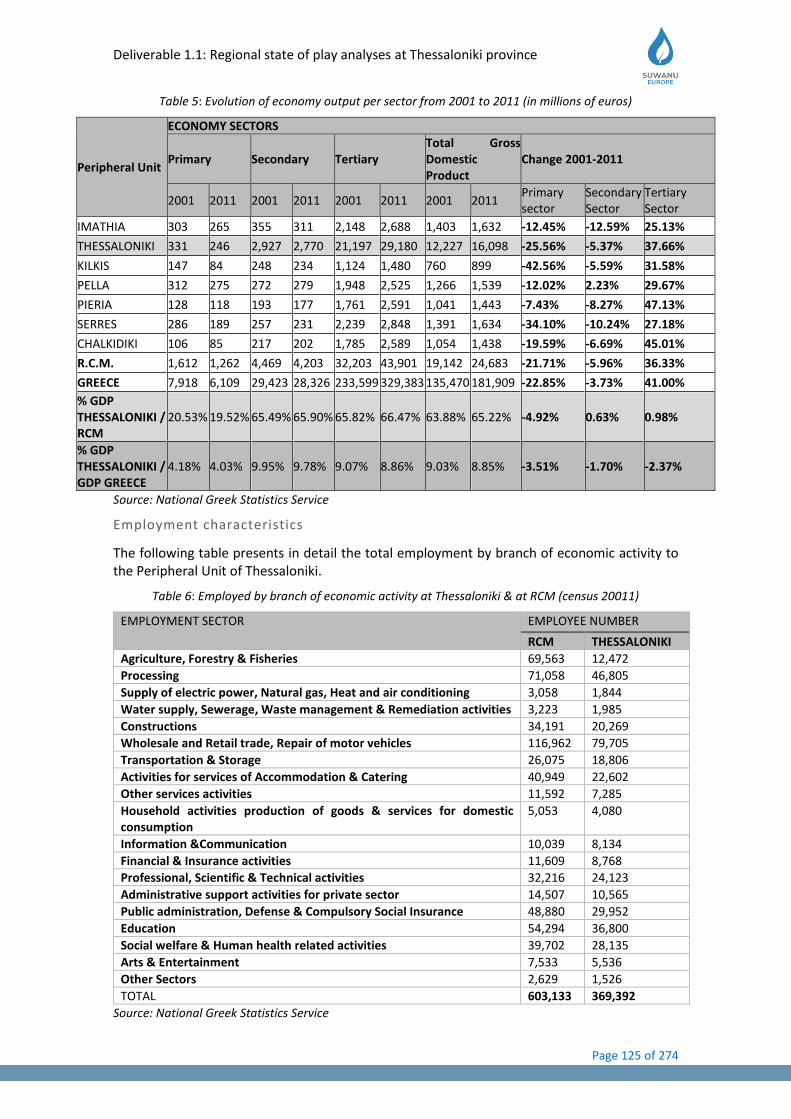
Deliverable 1.1: Regional state of play analyses at Thessaloniki province
Page 125 of 274
Table 5: Evolution of economy output per sector from 2001 to 2011 (in millions of euros)
Peripheral Unit
ECONOMY SECTORS
Primary Secondary Tertiary Total Gross Domestic Product
Change 2001-2011
2001 2011 2001 2011 2001 2011 2001 2011 Primary sector
Secondary Sector
Tertiary Sector
IMATHIA 303 265 355 311 2,148 2,688 1,403 1,632 -12.45% -12.59% 25.13%
THESSALONIKI 331 246 2,927 2,770 21,197 29,180 12,227 16,098 -25.56% -5.37% 37.66%
KILKIS 147 84 248 234 1,124 1,480 760 899 -42.56% -5.59% 31.58%
PELLA 312 275 272 279 1,948 2,525 1,266 1,539 -12.02% 2.23% 29.67%
PIERIA 128 118 193 177 1,761 2,591 1,041 1,443 -7.43% -8.27% 47.13%
SERRES 286 189 257 231 2,239 2,848 1,391 1,634 -34.10% -10.24% 27.18%
CHALKIDIKI 106 85 217 202 1,785 2,589 1,054 1,438 -19.59% -6.69% 45.01%
R.C.M. 1,612 1,262 4,469 4,203 32,203 43,901 19,142 24,683 -21.71% -5.96% 36.33%
GREECE 7,918 6,109 29,423 28,326 233,599 329,383 135,470 181,909 -22.85% -3.73% 41.00%
% GDP THESSALONIKI / RCM
20.53% 19.52% 65.49% 65.90% 65.82% 66.47% 63.88% 65.22% -4.92% 0.63% 0.98%
% GDP THESSALONIKI / GDP GREECE
4.18% 4.03% 9.95% 9.78% 9.07% 8.86% 9.03% 8.85% -3.51% -1.70% -2.37%
Source: National Greek Statistics Service
Employment characteristics
The following table presents in detail the total employment by branch of economic activity to the Peripheral Unit of Thessaloniki.
Table 6: Employed by branch of economic activity at Thessaloniki & at RCM (census 20011)
EMPLOYMENT SECTOR EMPLOYEE NUMBER
RCM THESSALONIKI
Agriculture, Forestry & Fisheries 69,563 12,472
Processing 71,058 46,805
Supply of electric power, Natural gas, Heat and air conditioning 3,058 1,844
Water supply, Sewerage, Waste management & Remediation activities 3,223 1,985
Constructions 34,191 20,269
Wholesale and Retail trade, Repair of motor vehicles 116,962 79,705
Transportation & Storage 26,075 18,806
Activities for services of Accommodation & Catering 40,949 22,602
Other services activities 11,592 7,285
Household activities production of goods & services for domestic consumption
5,053 4,080
Information &Communication 10,039 8,134
Financial & Insurance activities 11,609 8,768
Professional, Scientific & Technical activities 32,216 24,123
Administrative support activities for private sector 14,507 10,565
Public administration, Defense & Compulsory Social Insurance 48,880 29,952
Education 54,294 36,800
Social welfare & Human health related activities 39,702 28,135
Arts & Entertainment 7,533 5,536
Other Sectors 2,629 1,526
TOTAL 603,133 369,392
Source: National Greek Statistics Service
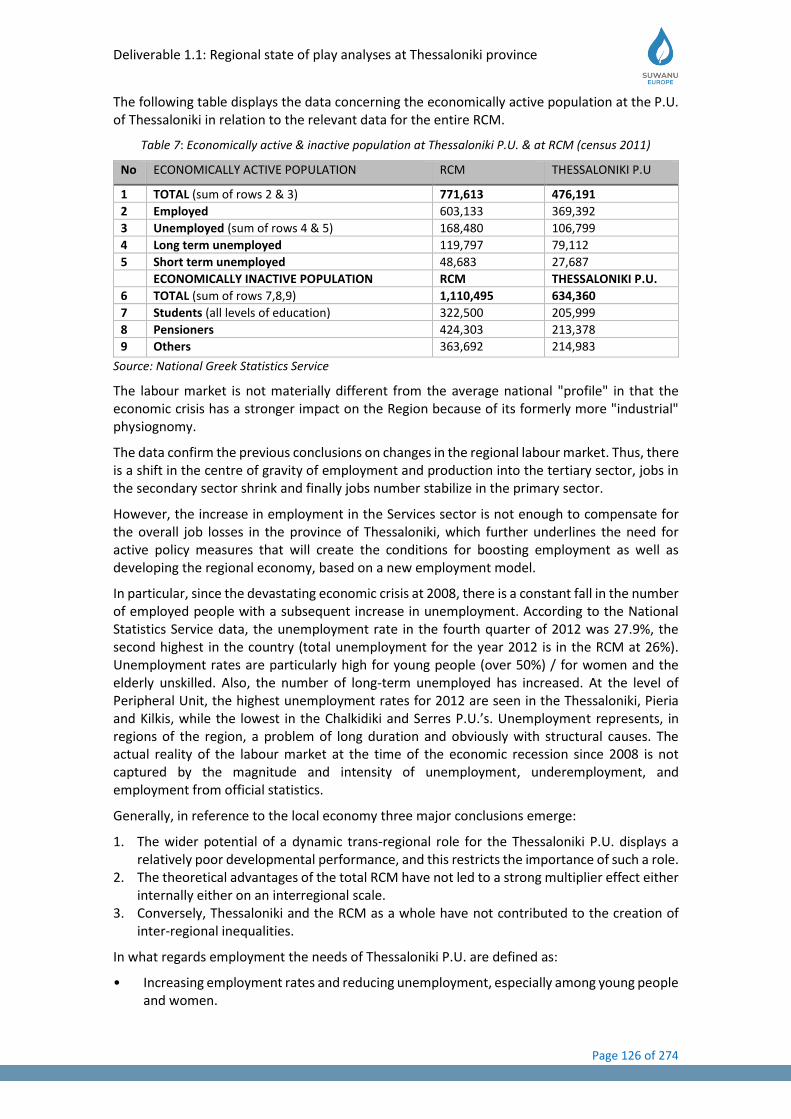
Deliverable 1.1: Regional state of play analyses at Thessaloniki province
Page 126 of 274
The following table displays the data concerning the economically active population at the P.U. of Thessaloniki in relation to the relevant data for the entire RCM.
Table 7: Economically active & inactive population at Thessaloniki P.U. & at RCM (census 2011)
No ECONOMICALLY ACTIVE POPULATION RCM THESSALONIKI P.U
1 TOTAL (sum of rows 2 & 3) 771,613 476,191
2 Employed 603,133 369,392
3 Unemployed (sum of rows 4 & 5) 168,480 106,799
4 Long term unemployed 119,797 79,112
5 Short term unemployed 48,683 27,687
ECONOMICALLY INACTIVE POPULATION RCM THESSALONIKI P.U.
6 TOTAL (sum of rows 7,8,9) 1,110,495 634,360
7 Students (all levels of education) 322,500 205,999
8 Pensioners 424,303 213,378
9 Others 363,692 214,983
Source: National Greek Statistics Service
The labour market is not materially different from the average national "profile" in that the economic crisis has a stronger impact on the Region because of its formerly more "industrial" physiognomy.
The data confirm the previous conclusions on changes in the regional labour market. Thus, there is a shift in the centre of gravity of employment and production into the tertiary sector, jobs in the secondary sector shrink and finally jobs number stabilize in the primary sector.
However, the increase in employment in the Services sector is not enough to compensate for the overall job losses in the province of Thessaloniki, which further underlines the need for active policy measures that will create the conditions for boosting employment as well as developing the regional economy, based on a new employment model.
In particular, since the devastating economic crisis at 2008, there is a constant fall in the number of employed people with a subsequent increase in unemployment. According to the National Statistics Service data, the unemployment rate in the fourth quarter of 2012 was 27.9%, the second highest in the country (total unemployment for the year 2012 is in the RCM at 26%). Unemployment rates are particularly high for young people (over 50%) / for women and the elderly unskilled. Also, the number of long-term unemployed has increased. At the level of Peripheral Unit, the highest unemployment rates for 2012 are seen in the Thessaloniki, Pieria and Kilkis, while the lowest in the Chalkidiki and Serres P.U.’s. Unemployment represents, in regions of the region, a problem of long duration and obviously with structural causes. The actual reality of the labour market at the time of the economic recession since 2008 is not captured by the magnitude and intensity of unemployment, underemployment, and employment from official statistics.
Generally, in reference to the local economy three major conclusions emerge:
1. The wider potential of a dynamic trans-regional role for the Thessaloniki P.U. displays a relatively poor developmental performance, and this restricts the importance of such a role.
2. The theoretical advantages of the total RCM have not led to a strong multiplier effect either internally either on an interregional scale.
3. Conversely, Thessaloniki and the RCM as a whole have not contributed to the creation of inter-regional inequalities.
In what regards employment the needs of Thessaloniki P.U. are defined as:
• Increasing employment rates and reducing unemployment, especially among young people and women.
Deliverable 1.1: Regional state of play analyses at Thessaloniki province
Page 127 of 274
• Promoting regional economic growth to create sustainable jobs. • Strengthening investment for self-employment, micro-enterprises, and business creation. • Support entrepreneurship and especially entrepreneurship for young people and women. • Continuous improvement of human resources. • Improve services and programs for access to the labour market. • Promoting active employment programs, community work, local employment initiatives
and work experience. • Improving geographical and sectoral mobility of workers.
Among the advantages of the region, despite the major problems of under-employment created by the crisis and its long-term de-industrialization, are the existence of specialized human resources of high educational level and also the significant size of the productive base, which with appropriate structural interventions to create a core of employment in dynamic and emerging industries.
Urban structure data
The Region of Central Macedonia is the second periphery of population concentration after Attica, with intense urbanization and a high concentration of population in the Metropolitan urban area of Thessaloniki.
According to the approved Master Plan of Central Macedonia7 its residential network is structured in three levels:
1) Metropolitan Urban Complex of Thessaloniki 2) Scattered urban centres in the western part of the Region: “Veria”, “Giannitsa”, “Naoussa”,
and “Edessa”. 3) Urban centres being developed in correlation and radially around Thessaloniki: “Katerini”,
“Kilkis”, and “Serres”.
The most important residential development is located in the coastal area of the Region, i.e. the so called arch of Thermaikos gulf formed by the peripheral units of Pieria – Thessaloniki - Chalkidiki, with a clear dominance of the Metropolis of Thessaloniki.
The peripheral unit of Thessaloniki, in particular, presents a typical strong unipolar residential structure model (a large metropolitan urban area surrounded by small towns & villages). In the mountainous areas of the P.U. there aren’t any coherent networks of settlements, on the contrary there are very strong dependencies of the scattered mountainous settlements on the dominant metropolitan urban centre located on the coastline. In the wider region space, all areas with a high percentage of urban population also display more growth opportunities.
However, the uncontrolled concentration of the population at the metropolitan urban centre in recent decades has been accompanied by the need to solve the housing problem. The impressive rates of house building, and the limited role of the public housing sector have resulted in the deterioration of the urban area with major negative symptoms such as:
• the deterioration of the physical characteristics of urban areas,
• difficulties on access and traffic,
• inadequate technical infrastructure,
• disproportion among private and social space,
• mixture of land uses and conflicting land uses,
• degradation of the natural, artificial and cultural environment
Existing Land use in general
7 Government Gazette 218 B’/6-2-2004
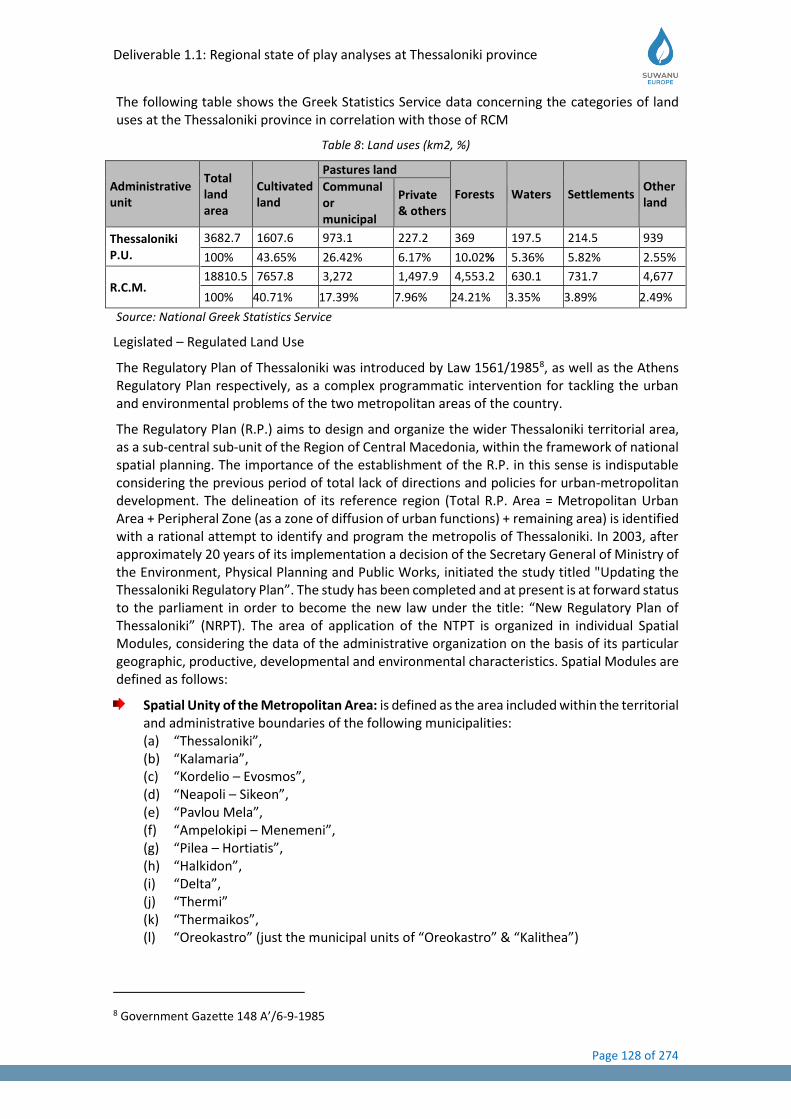
Deliverable 1.1: Regional state of play analyses at Thessaloniki province
Page 128 of 274
The following table shows the Greek Statistics Service data concerning the categories of land uses at the Thessaloniki province in correlation with those of RCM
Table 8: Land uses (km2, %)
Administrative unit
Total land area
Cultivated land
Pastures land
Forests Waters Settlements Other land
Communal or municipal
Private & others
Thessaloniki P.U.
3682.7 1607.6 973.1 227.2 369 197.5 214.5 939
100% 43.65% 26.42% 6.17% 10.02% 5.36% 5.82% 2.55%
R.C.M. 18810.5 7657.8 3,272 1,497.9 4,553.2 630.1 731.7 4,677
100% 40.71% 17.39% 7.96% 24.21% 3.35% 3.89% 2.49%
Source: National Greek Statistics Service
Legislated – Regulated Land Use
The Regulatory Plan of Thessaloniki was introduced by Law 1561/19858, as well as the Athens Regulatory Plan respectively, as a complex programmatic intervention for tackling the urban and environmental problems of the two metropolitan areas of the country.
The Regulatory Plan (R.P.) aims to design and organize the wider Thessaloniki territorial area, as a sub-central sub-unit of the Region of Central Macedonia, within the framework of national spatial planning. The importance of the establishment of the R.P. in this sense is indisputable considering the previous period of total lack of directions and policies for urban-metropolitan development. The delineation of its reference region (Total R.P. Area = Metropolitan Urban Area + Peripheral Zone (as a zone of diffusion of urban functions) + remaining area) is identified with a rational attempt to identify and program the metropolis of Thessaloniki. In 2003, after approximately 20 years of its implementation a decision of the Secretary General of Ministry of the Environment, Physical Planning and Public Works, initiated the study titled "Updating the Thessaloniki Regulatory Plan”. The study has been completed and at present is at forward status to the parliament in order to become the new law under the title: “New Regulatory Plan of Thessaloniki” (NRPT). The area of application of the NTPT is organized in individual Spatial Modules, considering the data of the administrative organization on the basis of its particular geographic, productive, developmental and environmental characteristics. Spatial Modules are defined as follows:
Spatial Unity of the Metropolitan Area: is defined as the area included within the territorial and administrative boundaries of the following municipalities: (a) “Thessaloniki”, (b) “Kalamaria”, (c) “Kordelio – Evosmos”, (d) “Neapoli – Sikeon”, (e) “Pavlou Mela”, (f) “Ampelokipi – Menemeni”, (g) “Pilea – Hortiatis”, (h) “Halkidon”, (i) “Delta”, (j) “Thermi” (k) “Thermaikos”, (l) “Oreokastro” (just the municipal units of “Oreokastro” & “Kalithea”)
8 Government Gazette 148 A’/6-9-1985
Deliverable 1.1: Regional state of play analyses at Thessaloniki province
Page 129 of 274
Within the Territorial Unity of the Metropolitan Center, the following spatial subdivisions are distinguished and defined, with the aim of analysing the specialization of spatial planning:
→ Spatial Sub-Area of the Thessaloniki Territory and the Suburban Zone of Thessaloniki: the area included within the territorial administrative boundaries of the municipalities of: a) Thessaloniki, b) Kordelio - Evosmos, c) Neapoli - Sikeon, d) Pavlou Mela, e) Ampelokipi - Menemeni, f) Kalamaria, g) Pilea - Hortiatis as well as the municipal units: a) “Oreokastro” and “Kallithea” of the Municipality of Oreokastro, b) “Echedorou” of the municipality of Delta, and c) “Thermi” of the municipality of Thermi.
The Thessaloniki Town Urban Complex is defined as the main urban area and as a privileged field of urban policy. Based on the current administrative structure, the town is defined as the area included within the territorial - administrative boundaries of the municipalities: a) Thessaloniki, b) Kordelio - Evosmos, c) Neapoli - Sikeon, d) Pavlou Mela, e) Ampelokipi - f) Kalamaria, as well as of the municipal units of Panorama and Pilea from the Municipality of Pilea-Hortiatis.
As the Suburban Zone of Thessaloniki is defined as the area included within the territorial and administrative boundaries of the municipalities: a) the municipal unit of Echedorou of the municipality of Delta, b) the municipal units of Kallithea and Oreokastro of the Municipality of Oreokastro, c) the municipal unit of Hortiatis of the Municipality of Pilea- Hortiatis and d) the municipal unity of Thermi of the municipality of Thermi.
→ Spatial Sub-Area of Other Remaining Metropolitan Region: it is defined as the area included within the territorial and administrative boundaries of the other municipal units and municipalities, namely: a) Halkidon, b) Thermaikos as well as the municipal units of, c) “Axios” and “Halastra” of the municipality of Delta c) Municipal units of “Mikra” and “Vasilika” of the municipality of Thermi.
Spatial Unity of the Wider Range of the Lakes Area: the area included within the territorial administrative boundaries of the municipalities of Langadas, Volvi, and the municipal unity of Mygdonia of the municipality of Oreokastro, (actually the remaining rest of the Peripheral Unity of Thessaloniki).
Spatial Unity of Chalkidiki Area: the area included within the territorial administrative boundaries of the municipalities of “Poligiros”, “Sithonia”, Kassandra”, “Nea Propontida” and “Aristotle” of the Peripheral Unity of Chalkidiki.
Spatial Unity of Kilkis Area: the area included within the territorial administrative boundaries of the municipalities of “Kilkis” and “Peonia” of the Kilkis Peripheral Unity.
Spatial Unity of West Axios Zone is defined as the area included within the territorial administrative boundaries of the Municipality of “Pella” of the Peripheral Unity of Pella, the Municipality of “Alexandria” of the Peripheral Unity of Imathia and the Municipality of “Pidna – Kolindros” of the Peripheral Unity of Pieria.
It is generally stated that within the other Territorial Units, specific spatial sub-units are defined on the basis of the developmental physiognomy and dynamics of each Spatial Unity. All sectoral and spatial directions, objectives and measures made in the New Thessaloniki Regulatory Plan for the Metropolitan Centre’s Territorial Unity consider the functional dependencies and influences that develop between the Metropolitan Center and the other Territorial Units. Organization and physical planning in the overall area of application of the New Thessaloniki Regulatory Plan aims at capitalizing on the comparative advantages of the Metropolitan Center, at the same time as protecting the regional wealth resources, ensuring local development conditions, protecting the local production structure and quality of life in all areas of the other Territorial Units.
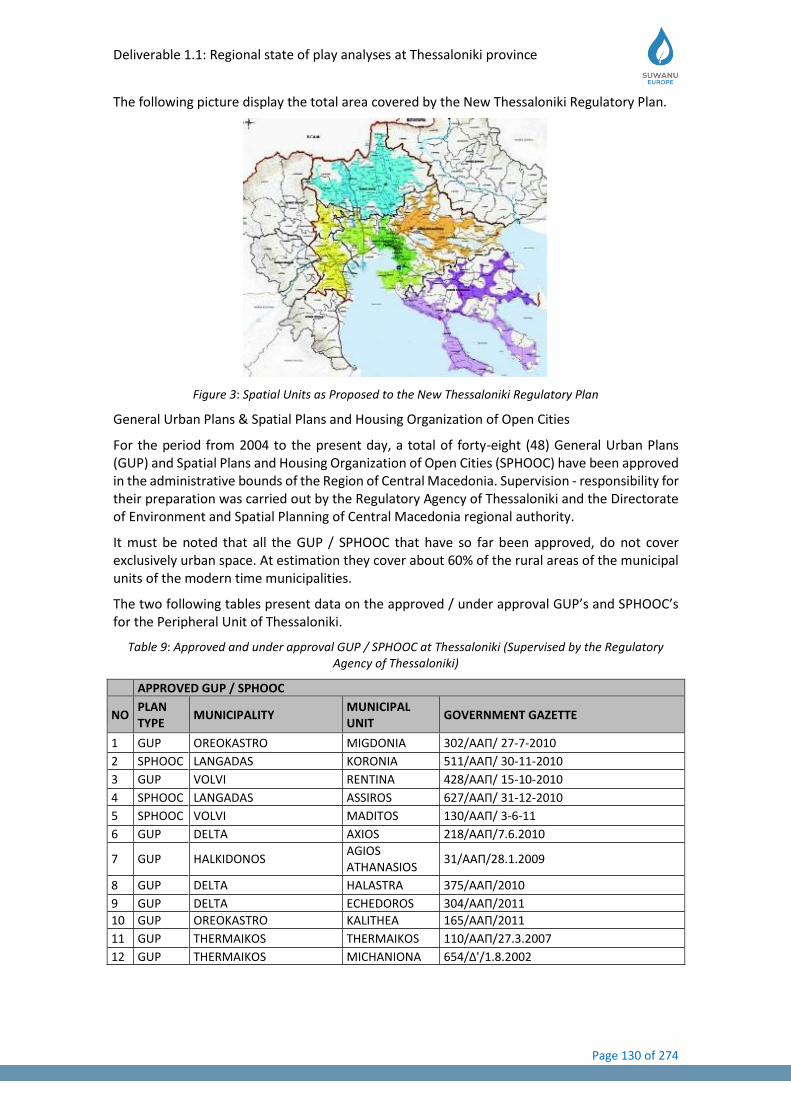
Deliverable 1.1: Regional state of play analyses at Thessaloniki province
Page 130 of 274
The following picture display the total area covered by the New Thessaloniki Regulatory Plan.
Figure 3: Spatial Units as Proposed to the New Thessaloniki Regulatory Plan
General Urban Plans & Spatial Plans and Housing Organization of Open Cities
For the period from 2004 to the present day, a total of forty-eight (48) General Urban Plans (GUP) and Spatial Plans and Housing Organization of Open Cities (SPHOOC) have been approved in the administrative bounds of the Region of Central Macedonia. Supervision - responsibility for their preparation was carried out by the Regulatory Agency of Thessaloniki and the Directorate of Environment and Spatial Planning of Central Macedonia regional authority.
It must be noted that all the GUP / SPHOOC that have so far been approved, do not cover exclusively urban space. At estimation they cover about 60% of the rural areas of the municipal units of the modern time municipalities.
The two following tables present data on the approved / under approval GUP’s and SPHOOC’s for the Peripheral Unit of Thessaloniki.
Table 9: Approved and under approval GUP / SPHOOC at Thessaloniki (Supervised by the Regulatory Agency of Thessaloniki)
APPROVED GUP / SPHOOC
NO PLAN TYPE
MUNICIPALITY MUNICIPAL UNIT
GOVERNMENT GAZETTE
1 GUP OREOKASTRO MIGDONIA 302/ΑΑΠ/ 27-7-2010
2 SPHOOC LANGADAS KORONIA 511/ΑΑΠ/ 30-11-2010
3 GUP VOLVI RENTINA 428/ΑΑΠ/ 15-10-2010
4 SPHOOC LANGADAS ASSIROS 627/ΑΑΠ/ 31-12-2010
5 SPHOOC VOLVI MADITOS 130/ΑΑΠ/ 3-6-11
6 GUP DELTA AXIOS 218/ΑΑΠ/7.6.2010
7 GUP HALKIDONOS AGIOS ATHANASIOS
31/ΑΑΠ/28.1.2009
8 GUP DELTA HALASTRA 375/ΑΑΠ/2010
9 GUP DELTA ECHEDOROS 304/ΑΑΠ/2011
10 GUP OREOKASTRO KALITHEA 165/ΑΑΠ/2011
11 GUP THERMAIKOS THERMAIKOS 110/ΑΑΠ/27.3.2007
12 GUP THERMAIKOS MICHANIONA 654/Δ'/1.8.2002

Deliverable 1.1: Regional state of play analyses at Thessaloniki province
Page 131 of 274
13 GUP THERMI MIKRA
137/Δ/2004 – amendments - 468/Δ/2006 &100/ΑΑΠ/10.3.2009 P.D Building Control Zone of Mikra: 537/ΑΑΠ/2007 & amendment 82/ΑΑΠ/2009
UNDER APPROVAL GUP / SPHOOC
NO PLAN TYPE
MUNICIPALITY MUNICIPAL UNIT
NOTIFICATIONS
1 GUP PAVLOU MELA EFKARPIA Directions document for B’ phase / 6-7-2011
2 GUP KORDELIO -EVOSMOS EVOSMOS Directions document for B’ phase / 8-7-2011
3 GUP AMPELOKIPI - MENEMENI MENEMENI Submission of B2 phase
4 GUP PILEA - HORTIATIS PILEA Completed B2 phase / 24-4 - 2012
5 GUP KORDELIO -EVOSMOS ELEFTHERIO - KORDELIO
Directions document for B’ phase / 25-5-2011 6 GUP PAVLOU MELA POLICHNI Directions document for B1 phase / 19-12-2011 7 GUP KALAMARIA KALAMARIA Under deliberation at the Executive Committee 8 GYP THESSALONIKI THESSALONIKI Delivery of the A phase
9 CUP THERMI THERMI Finalization of regulation of B1 phase 10 GUP PILEA - HORTIATIS HORTIATIS Directions document for B1 phase
11 GUP NEAPOLI -SIKEON PEFKA Directions document for B1 phase / 12-12-2011 12 GUP OREOKASTRO OREOKASTRO Directions document for B1 phase / 25-7-2011
13 GUP THERMI VASILIKA Competition of b1 phase / 16-2-2011
14 GUP HALKIDONOS KOYFALIA Opinion document for A’ phase / 28-3-2012
Source: Regulation Agency of Thessaloniki
Table 10: Under approval Gup / SPHOOC at Thessaloniki. (Supervised by Directorate of Environment and Spatial Planning of Central Macedonia regional authority).
UNDER APPROVAL GUP / SPHOOC
NO PLAN TYPE MUNICIPALITY MUNICIPAL UNIT NOTIFICATIONS
1 GUP VOLVI AGIOS GEORGIOS Phase B1 has been delivered
2 SPHOOC VOLVI APOLLONIA Phase B2 has been delivered
3 SPHOOC VOLVI ARETHOUSA Phase B1 has been delivered
4 SPHOOC LANGADAS VERTISKOS Phase B1 under study. Pending the Nature 2000 protection terms
5 SPHOOC VOLVI EGNATIA Phase A’ has been delivered
6 GUP LANGADAS LANGADAS Phase B1 has been delivered
7 SPHOOC LANGADAS LAHANAS Phase B2 has been delivered
Source: Directorate of Environment & Spatial Planning of RCM
Zones of Controlled Residential Building
Under the Presidential Decree on 10.10.1985, published on Government Gazette 689/Δ/1985 was established the Zone of Controlled Residential Building of Thessaloniki with intent to prevent the uncontrolled spatial development of land uses & various production activities. The Zone concerns all the outside the settlements areas and has a unique regulation: the setting of a minimum limit of 10.000 m2 (1 ha) for land division for building purposes. Since then, a series of decrees have been introduced in combination with permitted land uses and conditions constraints for building.
Other types of regulated spatial areas
At the Thessaloniki Peripheral unit there are 3 established Industrial and Business Areas under the relatively low 2545/1997. The following table displays the relative data for these areas.
Table 11: Organized Industrial & Business Areas at Thessaloniki
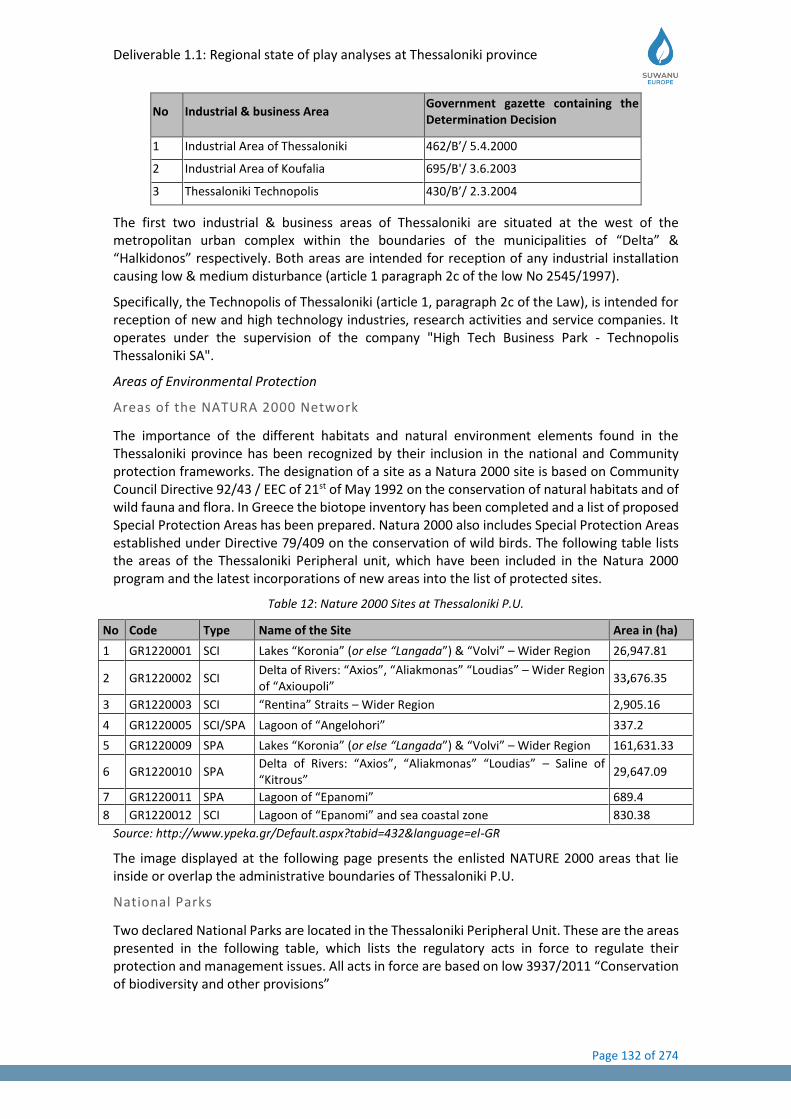
Deliverable 1.1: Regional state of play analyses at Thessaloniki province
Page 132 of 274
No Industrial & business Area Government gazette containing the Determination Decision
1 Industrial Area of Thessaloniki 462/Β’/ 5.4.2000
2 Industrial Area of Koufalia 695/Β'/ 3.6.2003
3 Thessaloniki Technopolis 430/Β’/ 2.3.2004
The first two industrial & business areas of Thessaloniki are situated at the west of the metropolitan urban complex within the boundaries of the municipalities of “Delta” & “Halkidonos” respectively. Both areas are intended for reception of any industrial installation causing low & medium disturbance (article 1 paragraph 2c of the low No 2545/1997).
Specifically, the Technopolis of Thessaloniki (article 1, paragraph 2c of the Law), is intended for reception of new and high technology industries, research activities and service companies. It operates under the supervision of the company "High Tech Business Park - Technopolis Thessaloniki SA".
Areas of Environmental Protection
Areas of the NATURA 2000 Network
The importance of the different habitats and natural environment elements found in the Thessaloniki province has been recognized by their inclusion in the national and Community protection frameworks. The designation of a site as a Natura 2000 site is based on Community Council Directive 92/43 / EEC of 21st of May 1992 on the conservation of natural habitats and of wild fauna and flora. In Greece the biotope inventory has been completed and a list of proposed Special Protection Areas has been prepared. Natura 2000 also includes Special Protection Areas established under Directive 79/409 on the conservation of wild birds. The following table lists the areas of the Thessaloniki Peripheral unit, which have been included in the Natura 2000 program and the latest incorporations of new areas into the list of protected sites.
Table 12: Nature 2000 Sites at Thessaloniki P.U.
No Code Type Name of the Site Area in (ha)
1 GR1220001 SCI Lakes “Koronia” (or else “Langada”) & “Volvi” – Wider Region 26,947.81
2 GR1220002 SCI Delta of Rivers: “Axios”, “Aliakmonas” “Loudias” – Wider Region of “Axioupoli”
33,676.35
3 GR1220003 SCI “Rentina” Straits – Wider Region 2,905.16
4 GR1220005 SCI/SPA Lagoon of “Angelohori” 337.2
5 GR1220009 SPA Lakes “Koronia” (or else “Langada”) & “Volvi” – Wider Region 161,631.33
6 GR1220010 SPA Delta of Rivers: “Axios”, “Aliakmonas” “Loudias” – Saline of “Kitrous”
29,647.09
7 GR1220011 SPA Lagoon of “Epanomi” 689.4
8 GR1220012 SCI Lagoon of “Epanomi” and sea coastal zone 830.38
Source: http://www.ypeka.gr/Default.aspx?tabid=432&language=el-GR
The image displayed at the following page presents the enlisted NATURE 2000 areas that lie inside or overlap the administrative boundaries of Thessaloniki P.U.
National Parks
Two declared National Parks are located in the Thessaloniki Peripheral Unit. These are the areas presented in the following table, which lists the regulatory acts in force to regulate their protection and management issues. All acts in force are based on low 3937/2011 “Conservation of biodiversity and other provisions”
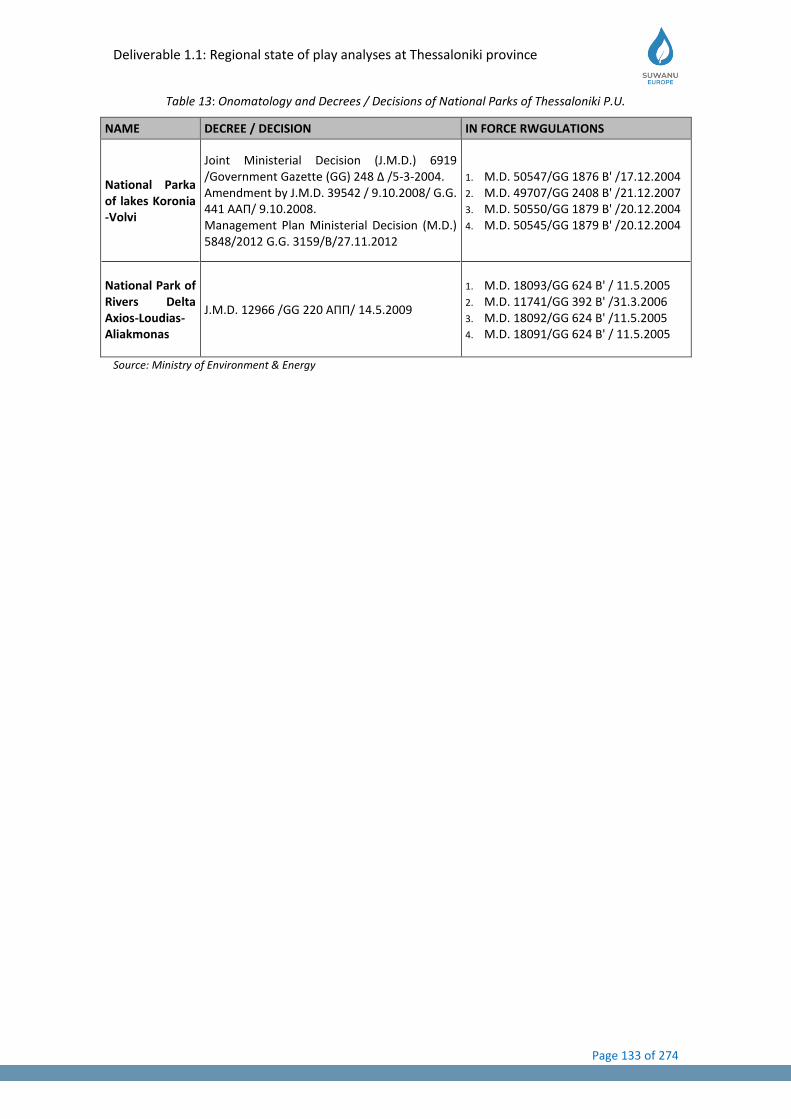
Deliverable 1.1: Regional state of play analyses at Thessaloniki province
Page 133 of 274
Table 13: Onomatology and Decrees / Decisions of National Parks of Thessaloniki P.U.
NAME DECREE / DECISION IN FORCE RWGULATIONS
National Parka of lakes Koronia -Volvi
Joint Ministerial Decision (J.M.D.) 6919 /Government Gazette (GG) 248 Δ /5-3-2004. Amendment by J.M.D. 39542 / 9.10.2008/ G.G. 441 ΑΑΠ/ 9.10.2008. Management Plan Ministerial Decision (M.D.) 5848/2012 G.G. 3159/B/27.11.2012
1. M.D. 50547/GG 1876 Β' /17.12.2004 2. M.D. 49707/GG 2408 Β' /21.12.2007 3. M.D. 50550/GG 1879 Β' /20.12.2004 4. M.D. 50545/GG 1879 Β' /20.12.2004
National Park of Rivers Delta Axios-Loudias-Aliakmonas
J.M.D. 12966 /GG 220 ΑΠΠ/ 14.5.2009
1. M.D. 18093/GG 624 Β' / 11.5.2005 2. M.D. 11741/GG 392 Β' /31.3.2006 3. M.D. 18092/GG 624 Β' /11.5.2005 4. M.D. 18091/GG 624 Β' / 11.5.2005
Source: Ministry of Environment & Energy
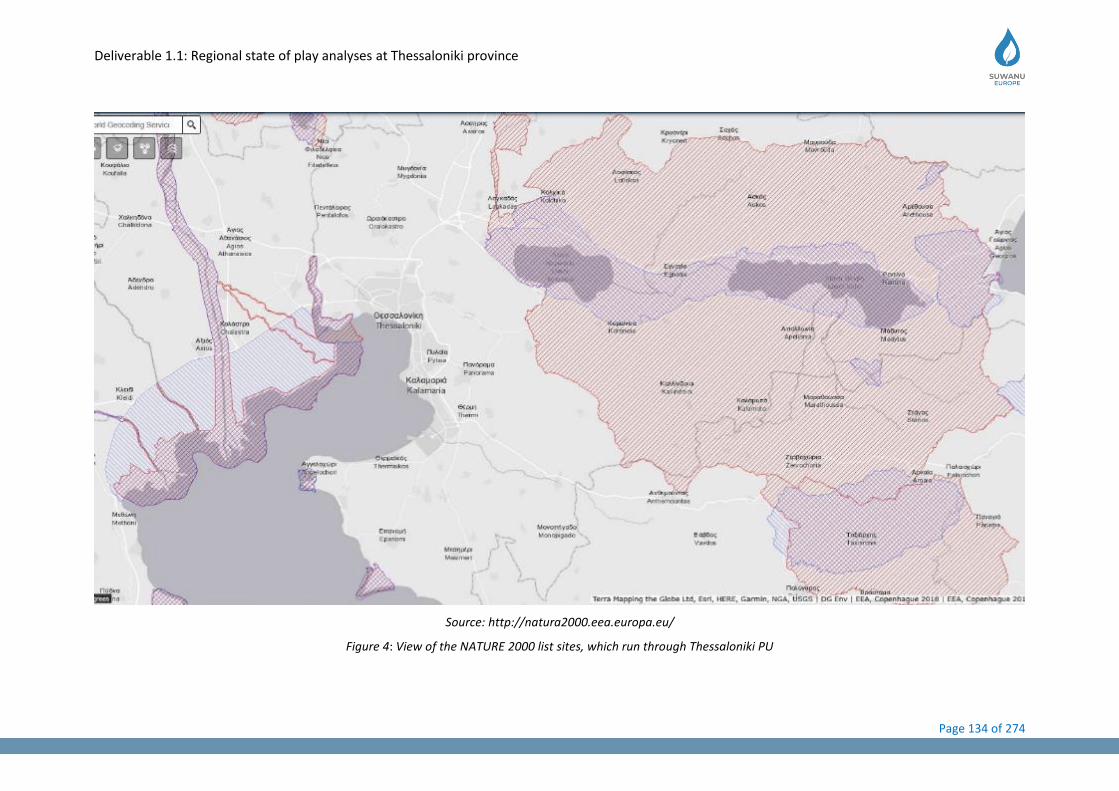
Deliverable 1.1: Regional state of play analyses at Thessaloniki province
Page 134 of 274
Source: http://natura2000.eea.europa.eu/
Figure 4: View of the NATURE 2000 list sites, which run through Thessaloniki PU
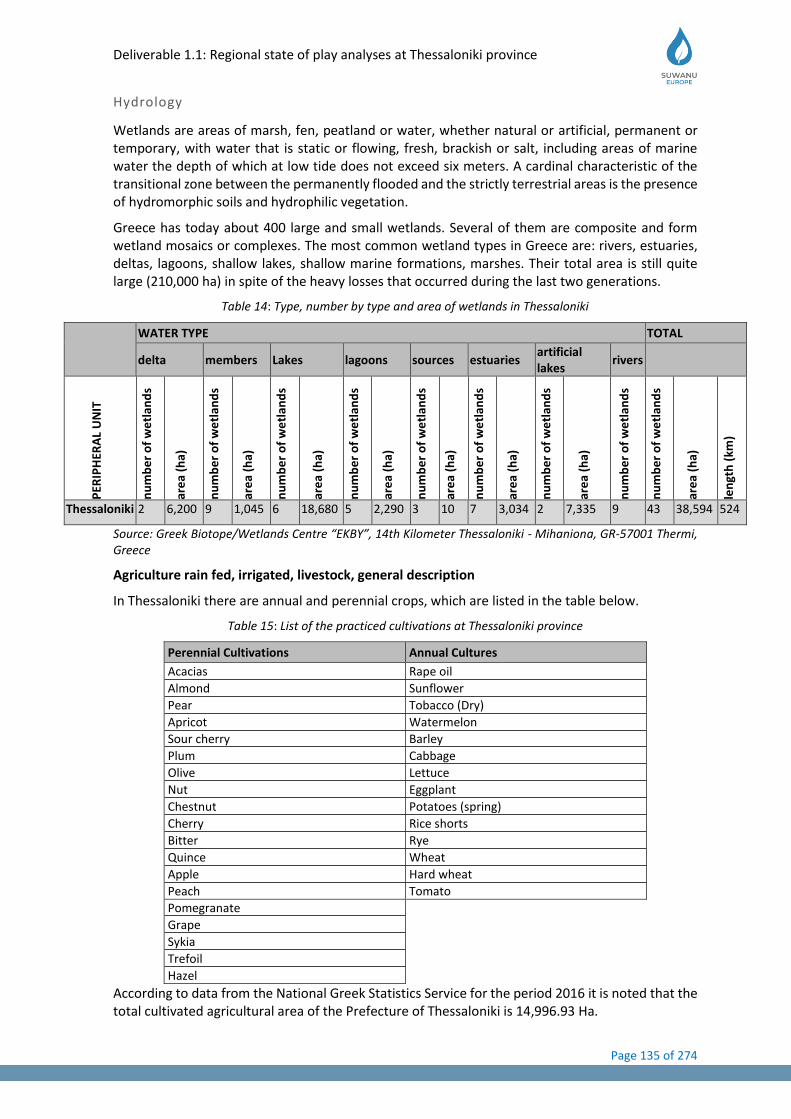
Deliverable 1.1: Regional state of play analyses at Thessaloniki province
Page 135 of 274
Hydrology
Wetlands are areas of marsh, fen, peatland or water, whether natural or artificial, permanent or temporary, with water that is static or flowing, fresh, brackish or salt, including areas of marine water the depth of which at low tide does not exceed six meters. A cardinal characteristic of the transitional zone between the permanently flooded and the strictly terrestrial areas is the presence of hydromorphic soils and hydrophilic vegetation.
Greece has today about 400 large and small wetlands. Several of them are composite and form wetland mosaics or complexes. The most common wetland types in Greece are: rivers, estuaries, deltas, lagoons, shallow lakes, shallow marine formations, marshes. Their total area is still quite large (210,000 ha) in spite of the heavy losses that occurred during the last two generations.
Table 14: Type, number by type and area of wetlands in Thessaloniki
WATER TYPE TOTAL
delta members Lakes lagoons sources estuaries artificial lakes
rivers
PER
IPH
ERA
L U
NIT
nu
mb
er
of
we
tlan
ds
are
a (h
a)
nu
mb
er
of
we
tlan
ds
are
a (h
a)
nu
mb
er
of
we
tlan
ds
are
a (h
a)
nu
mb
er
of
we
tlan
ds
are
a (h
a)
nu
mb
er
of
we
tlan
ds
are
a (h
a)
nu
mb
er
of
we
tlan
ds
are
a (h
a)
nu
mb
er
of
we
tlan
ds
are
a (h
a)
nu
mb
er
of
we
tlan
ds
nu
mb
er
of
we
tlan
ds
are
a (h
a)
len
gth
(km
)
Thessaloniki 2 6,200 9 1,045 6 18,680 5 2,290 3 10 7 3,034 2 7,335 9 43 38,594 524
Source: Greek Biotope/Wetlands Centre “EKBY”, 14th Kilometer Thessaloniki - Mihaniona, GR-57001 Thermi, Greece
Agriculture rain fed, irrigated, livestock, general description
In Thessaloniki there are annual and perennial crops, which are listed in the table below.
Table 15: List of the practiced cultivations at Thessaloniki province
Perennial Cultivations Annual Cultures
Acacias Rape oil
Almond Sunflower
Pear Tobacco (Dry)
Apricot Watermelon
Sour cherry Barley
Plum Cabbage
Olive Lettuce
Nut Eggplant
Chestnut Potatoes (spring)
Cherry Rice shorts
Bitter Rye
Quince Wheat
Apple Hard wheat
Peach Tomato
Pomegranate
Grape
Sykia
Trefoil
Hazel
According to data from the National Greek Statistics Service for the period 2016 it is noted that the total cultivated agricultural area of the Prefecture of Thessaloniki is 14,996.93 Ha.
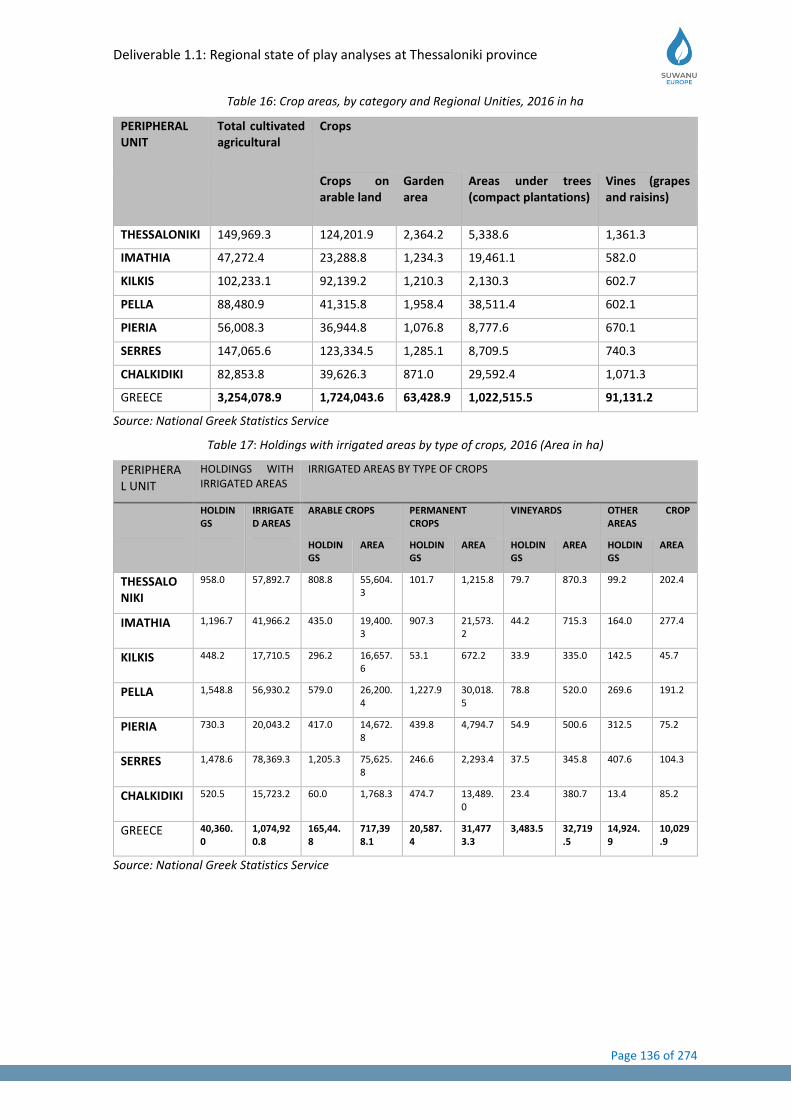
Deliverable 1.1: Regional state of play analyses at Thessaloniki province
Page 136 of 274
Table 16: Crop areas, by category and Regional Unities, 2016 in ha
PERIPHERAL UNIT
Total cultivated agricultural
Crops
Crops on arable land
Garden area
Areas under trees (compact plantations)
Vines (grapes and raisins)
THESSALONIKI 149,969.3 124,201.9 2,364.2 5,338.6 1,361.3
IMATHIA 47,272.4 23,288.8 1,234.3 19,461.1 582.0
KILKIS 102,233.1 92,139.2 1,210.3 2,130.3 602.7
PELLA 88,480.9 41,315.8 1,958.4 38,511.4 602.1
PIERIA 56,008.3 36,944.8 1,076.8 8,777.6 670.1
SERRES 147,065.6 123,334.5 1,285.1 8,709.5 740.3
CHALKIDIKI 82,853.8 39,626.3 871.0 29,592.4 1,071.3
GREECE 3,254,078.9 1,724,043.6 63,428.9 1,022,515.5 91,131.2
Source: National Greek Statistics Service
Table 17: Holdings with irrigated areas by type of crops, 2016 (Area in ha)
PERIPHERAL UNIT
HOLDINGS WITH IRRIGATED AREAS
IRRIGATED AREAS BY TYPE OF CROPS
HOLDINGS
IRRIGATED AREAS
ARABLE CROPS PERMANENT CROPS
VINEYARDS OTHER CROP AREAS
HOLDINGS
AREA HOLDINGS
AREA HOLDINGS
AREA HOLDINGS
AREA
THESSALONIKI
958.0 57,892.7 808.8 55,604.3
101.7 1,215.8 79.7 870.3 99.2 202.4
IMATHIA 1,196.7 41,966.2 435.0 19,400.3
907.3 21,573.2
44.2 715.3 164.0 277.4
KILKIS 448.2 17,710.5 296.2 16,657.6
53.1 672.2 33.9 335.0 142.5 45.7
PELLA 1,548.8 56,930.2 579.0 26,200.4
1,227.9 30,018.5
78.8 520.0 269.6 191.2
PIERIA 730.3 20,043.2 417.0 14,672.8
439.8 4,794.7 54.9 500.6 312.5 75.2
SERRES 1,478.6 78,369.3 1,205.3 75,625.8
246.6 2,293.4 37.5 345.8 407.6 104.3
CHALKIDIKI 520.5 15,723.2 60.0 1,768.3 474.7 13,489.0
23.4 380.7 13.4 85.2
GREECE 40,360.0
1,074,920.8
165,44.8
717,398.1
20,587.4
31,4773.3
3,483.5 32,719.5
14,924.9
10,029.9
Source: National Greek Statistics Service
Deliverable 1.1: Regional state of play analyses at Thessaloniki province
Page 137 of 274
Table 18: Holdings and livestock units by species
PERIPHERAL UNIT
Cattle Sheep Goats Pigs
Holdings Animal Units
Holdings Animal Units
Holdings Animal Units
Holdings Animal Units
THESSALONIKI
721 52,917 930 16,529 787 13,494 183 3,056
IMATHIA 271 14,023 521 6,271 306 2,180 146 6,511
KILKIS 482 19,243 687 14,246 398 4,963 123 1,639
PELLA 562 14,833 1,043 17,006 704 4,894 387 2,735
PIERIA 112 2,646 670 9,954 699 5,328 260 13,344
SERRES 895 31,383 1,278 19,405 829 10,447 328 4,818
CHALKIDIKI 97 4,078 293 5,815 471 10,839 87 5,101
GREECE 16,679 462,800 91,933 915,682 71,585 421,323 19,332 243,697
Source: National Greek Statistics Service
Forest “Sheikh Sou”
The suburban forest of Thessaloniki, known as Sheikh Sou or Kedrinos Hill, which is one of the most important peri-urban forests of the country, is nowadays considered one of the elements of Thessaloniki. The exact extent of the Forest was determined by the Regulatory Agency at 3,033.969 ha. Sheikh Sou consists of plantations of coniferous species and mainly of pine-tree trachea.
The suburban forest of Thessaloniki, known as Sheikh Sou or “Kedrinos Lofos”, is located in the city of Thessaloniki and is one of the most important forests of the country. The peri-urban forest occupies a part of the southern and western sides of the hillside of “Kissos / Hortiatis” which starts from the French River and heads east to the top of Hortiatis, whose southern sides are bent towards the sea and the northern to Lake Koronia, or otherwise Lake Langada, Agios Vasilios.
Its coordinates are: longitude 22º57 'to 23º04. Latitude 40º3530 to 40º3930.
Figure 5: “Kedrinos Lofos” of Thessaloniki (Sheikh Sou)”.
General Organization for Land Reclamation (ΓΟΕΒ)
The General Organization for Land Reclamation (ΓΟΕΒ) is one of the ten such organizations that have been set up throughout the country, with the largest area of competence, transporting and
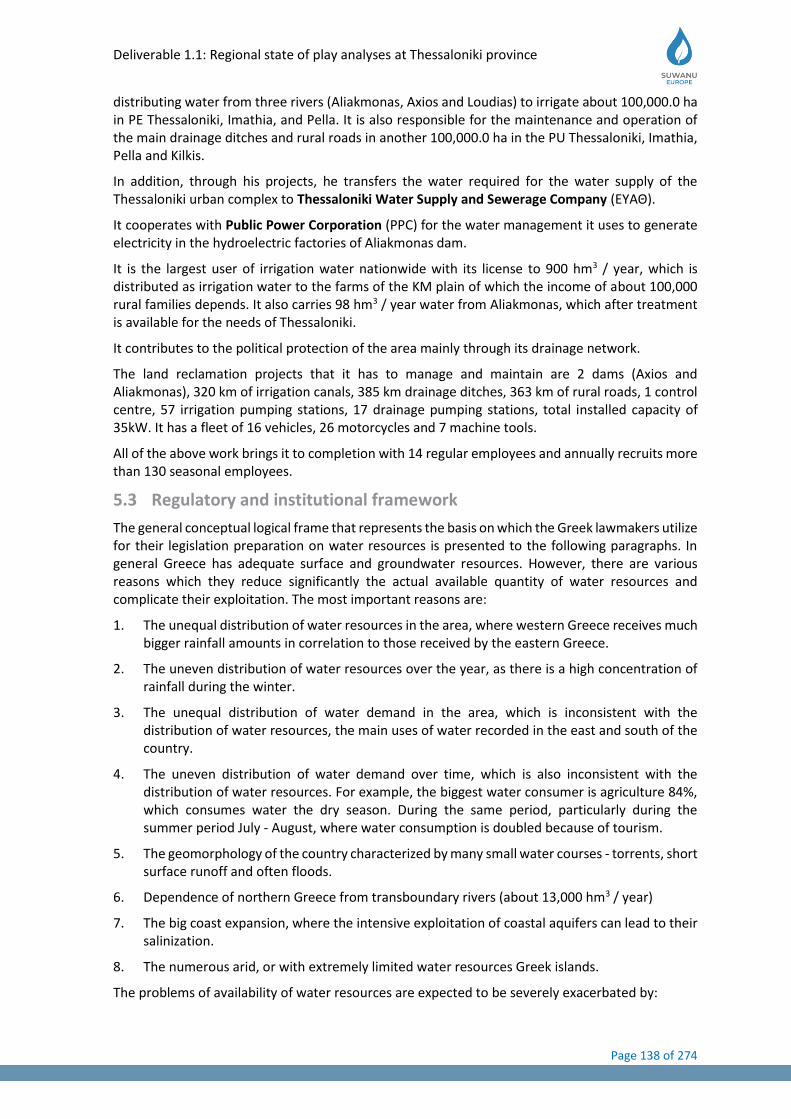
Deliverable 1.1: Regional state of play analyses at Thessaloniki province
Page 138 of 274
distributing water from three rivers (Aliakmonas, Axios and Loudias) to irrigate about 100,000.0 ha in PE Thessaloniki, Imathia, and Pella. It is also responsible for the maintenance and operation of the main drainage ditches and rural roads in another 100,000.0 ha in the PU Thessaloniki, Imathia, Pella and Kilkis.
In addition, through his projects, he transfers the water required for the water supply of the Thessaloniki urban complex to Thessaloniki Water Supply and Sewerage Company (EYAΘ).
It cooperates with Public Power Corporation (PPC) for the water management it uses to generate electricity in the hydroelectric factories of Aliakmonas dam.
It is the largest user of irrigation water nationwide with its license to 900 hm3 / year, which is distributed as irrigation water to the farms of the KM plain of which the income of about 100,000 rural families depends. It also carries 98 hm3 / year water from Aliakmonas, which after treatment is available for the needs of Thessaloniki.
It contributes to the political protection of the area mainly through its drainage network.
The land reclamation projects that it has to manage and maintain are 2 dams (Axios and Aliakmonas), 320 km of irrigation canals, 385 km drainage ditches, 363 km of rural roads, 1 control centre, 57 irrigation pumping stations, 17 drainage pumping stations, total installed capacity of 35kW. It has a fleet of 16 vehicles, 26 motorcycles and 7 machine tools.
All of the above work brings it to completion with 14 regular employees and annually recruits more than 130 seasonal employees.
5.3 Regulatory and institutional framework
The general conceptual logical frame that represents the basis on which the Greek lawmakers utilize for their legislation preparation on water resources is presented to the following paragraphs. In general Greece has adequate surface and groundwater resources. However, there are various reasons which they reduce significantly the actual available quantity of water resources and complicate their exploitation. The most important reasons are:
1. The unequal distribution of water resources in the area, where western Greece receives much bigger rainfall amounts in correlation to those received by the eastern Greece.
2. The uneven distribution of water resources over the year, as there is a high concentration of rainfall during the winter.
3. The unequal distribution of water demand in the area, which is inconsistent with the distribution of water resources, the main uses of water recorded in the east and south of the country.
4. The uneven distribution of water demand over time, which is also inconsistent with the distribution of water resources. For example, the biggest water consumer is agriculture 84%, which consumes water the dry season. During the same period, particularly during the summer period July - August, where water consumption is doubled because of tourism.
5. The geomorphology of the country characterized by many small water courses - torrents, short surface runoff and often floods.
6. Dependence of northern Greece from transboundary rivers (about 13,000 hm3 / year)
7. The big coast expansion, where the intensive exploitation of coastal aquifers can lead to their salinization.
8. The numerous arid, or with extremely limited water resources Greek islands.
The problems of availability of water resources are expected to be severely exacerbated by:
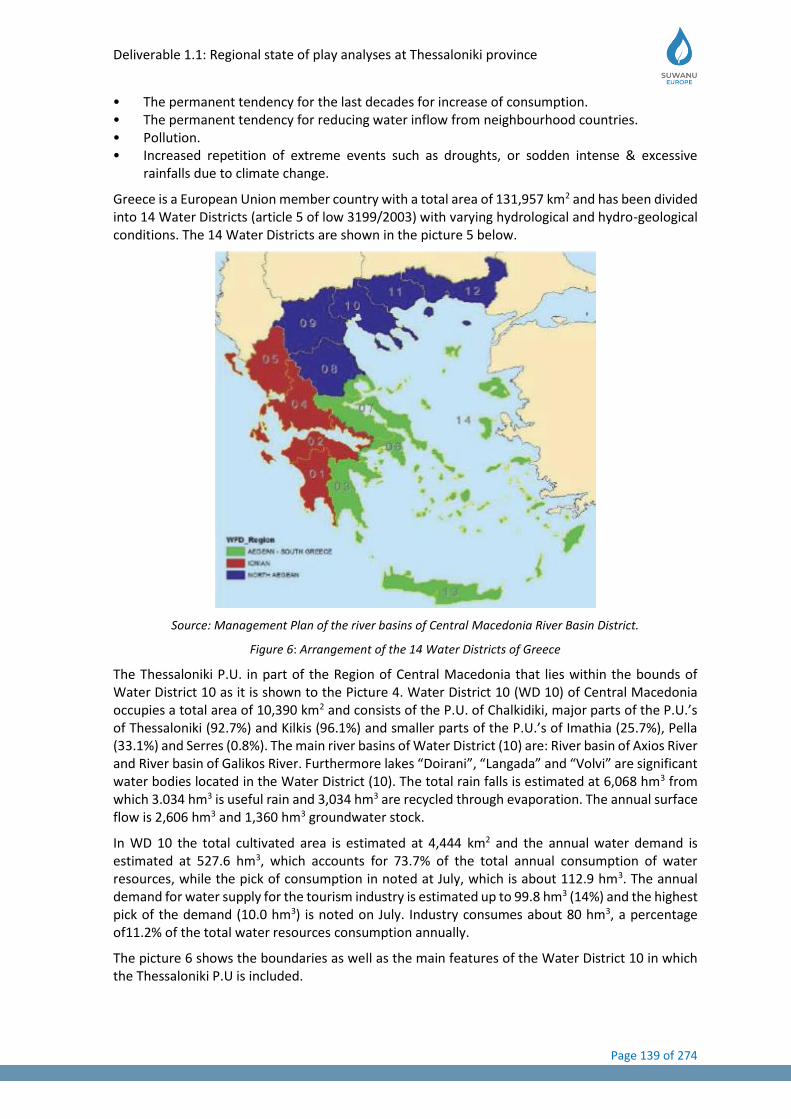
Deliverable 1.1: Regional state of play analyses at Thessaloniki province
Page 139 of 274
• The permanent tendency for the last decades for increase of consumption. • The permanent tendency for reducing water inflow from neighbourhood countries. • Pollution. • Increased repetition of extreme events such as droughts, or sodden intense & excessive
rainfalls due to climate change.
Greece is a European Union member country with a total area of 131,957 km2 and has been divided into 14 Water Districts (article 5 of low 3199/2003) with varying hydrological and hydro-geological conditions. The 14 Water Districts are shown in the picture 5 below.
Source: Management Plan of the river basins of Central Macedonia River Basin District.
Figure 6: Arrangement of the 14 Water Districts of Greece
The Thessaloniki P.U. in part of the Region of Central Macedonia that lies within the bounds of Water District 10 as it is shown to the Picture 4. Water District 10 (WD 10) of Central Macedonia occupies a total area of 10,390 km2 and consists of the P.U. of Chalkidiki, major parts of the P.U.’s of Thessaloniki (92.7%) and Kilkis (96.1%) and smaller parts of the P.U.’s of Imathia (25.7%), Pella (33.1%) and Serres (0.8%). The main river basins of Water District (10) are: River basin of Axios River and River basin of Galikos River. Furthermore lakes “Doirani”, “Langada” and “Volvi” are significant water bodies located in the Water District (10). The total rain falls is estimated at 6,068 hm3 from which 3.034 hm3 is useful rain and 3,034 hm3 are recycled through evaporation. The annual surface flow is 2,606 hm3 and 1,360 hm3 groundwater stock.
In WD 10 the total cultivated area is estimated at 4,444 km2 and the annual water demand is estimated at 527.6 hm3, which accounts for 73.7% of the total annual consumption of water resources, while the pick of consumption in noted at July, which is about 112.9 hm3. The annual demand for water supply for the tourism industry is estimated up to 99.8 hm3 (14%) and the highest pick of the demand (10.0 hm3) is noted on July. Industry consumes about 80 hm3, a percentage of11.2% of the total water resources consumption annually.
The picture 6 shows the boundaries as well as the main features of the Water District 10 in which the Thessaloniki P.U is included.
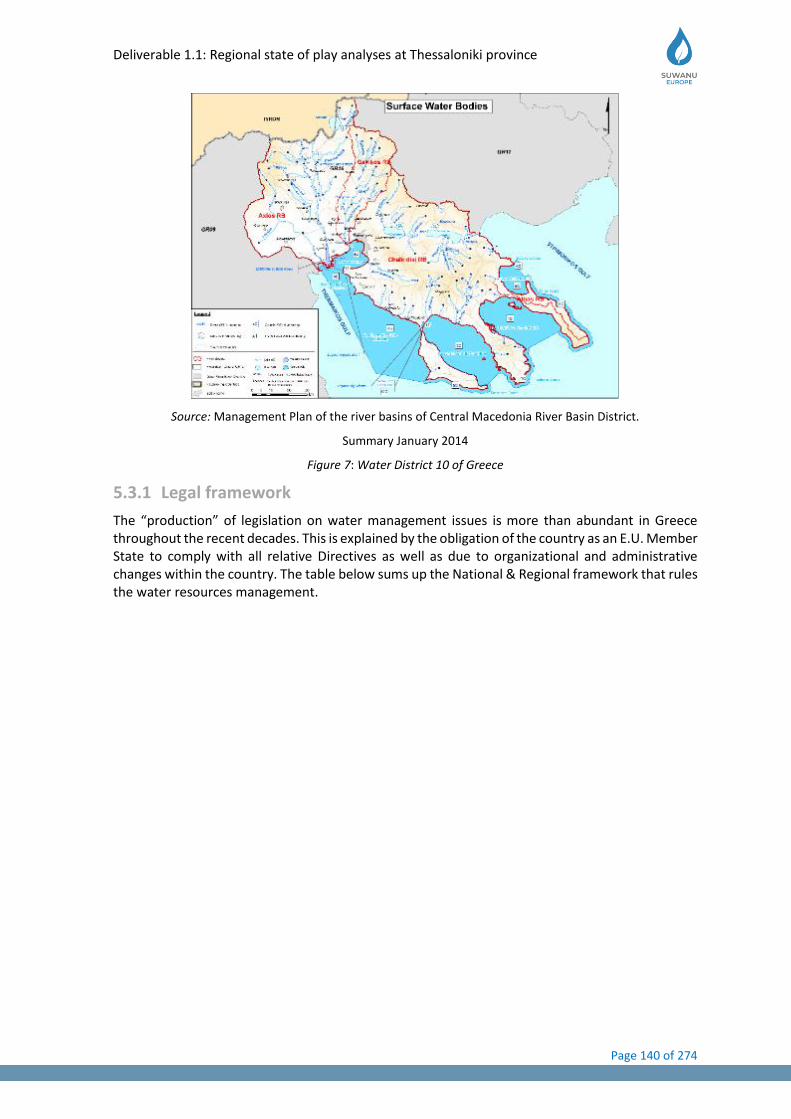
Deliverable 1.1: Regional state of play analyses at Thessaloniki province
Page 140 of 274
Source: Management Plan of the river basins of Central Macedonia River Basin District.
Summary January 2014
Figure 7: Water District 10 of Greece
5.3.1 Legal framework
The “production” of legislation on water management issues is more than abundant in Greece throughout the recent decades. This is explained by the obligation of the country as an E.U. Member State to comply with all relative Directives as well as due to organizational and administrative changes within the country. The table below sums up the National & Regional framework that rules the water resources management.

Deliverable 1.1: Regional state of play analyses at Thessaloniki province
Page 141 of 274
Table 19: National & Regional legal framework on water resources
No LEGISLATION TYPE DESCRIPTION
1 Low 4519/2018 “Management Bodies of Protected Areas and other provisions”
2 J.M.D. 135275/2017 “Adopt general cost accounting and pricing rules for water services. Method and procedures for recovering the cost of water services in its various uses.”
3 J.M.D. 140424/2017 “Amendment of J.M.D. no 146896/2014 (G.G. B 2878 and B 3142 2014), as it was amended by J.M.D. no 101123/2015 (G.G. B 1435) and the J.M.D. no. 170766/2016 (G.G. B 69) and the J.M.D. no 145026/2014 (G.G. B 31), as it was amended by J.M.D. no 145893/2014 (G.G. B 1212).”
4 J.M.D. 182314/1241/2016 "Amendment of Annex II of Article 8 of J.M.D. no. 39626/2208/2009 (G.G. 2075 / B) in compliance with the provisions of Directive 2014/80/EU -Amending Annex II to Directive 2006/118/EC of the European Parliament and of the Council of Groundwater from Pollution and Degradation- of the European Commission of 20 June 2014"
5 J.M.D. 170766/2016 "Modification of the J.M.D. no. 51354/2641/E103/2010 (G.G. 1909/B), in compliance with the provisions of Directive 2013/39/EU -Amending Directives 2000/60/EC and 2008/105/EC as regards priority substances in the field of water policy 'of the European Parliament and of the Council of 12 August 2013 and other relevant provisions”
6 M.D. 1420/82031/2015 “Code of Good Agricultural Practice for Protection of Waters by Nitrates from Agricultural sources”
The M.D. was modified by: • M.D. 2001/118518/2015 “Modification of No. 1420/82031 (G. G. 1709/Β/2015) of the Deputy Minister of Production
Reconstruction, Environment and Energy -Code of Good Agricultural Practice for the Protection of Waters by Nitrates from Agricultural sources"
7 J.M.D. 145026/2014 “Establishment, management and operation of the National Register of Water Collection Points from Surface and Underground Water Systems”
The J.M.D. was modified by: • J.M.D. 146896/2014 “Categories of permits for the use and execution of water projects. Procedure and conditions for the issue of
licenses, their content and duration and other relevant provisions” • J.M.D. 101123/2015 “Amendment of J.M.D. No 146896/2014 "Categories of permits for the Use and Implementation of Water
Development Projects. Procedures and conditions for the issue of licenses, their content and duration and other relevant provisions "(B 2878), as corrected by the G.G. (B 3142)"
• J.M.D. 170766/2016 “Modification of the J.M.D. no. 51354/2641/E103/2010 (G.G. B 1909), in compliance with the provisions of Directive 2013/39/EU – for amending Directives 2000/60/EC and 2008/105/EC with regard to priority substances in the field of water policy -of the European Parliament and of the Council of 12 August 2013 and other relevant provisions” (article 4)
• J.M.D 140424/2017 “Amendment of J.M.D. no 146896/2014 (G.G. B 2878 and B 3142 2014), as amended by J.M.D. no.101123/2015 (G.G. B '1435) and the J.M.D. no. 170766/2016 (G.G. B '69) and J.M.D. no 145026/2014 (G.G. B 31)”
Relative Documents:

Deliverable 1.1: Regional state of play analyses at Thessaloniki province
Page 142 of 274
• Deed no 100089/2015 “Clarifications-explanations (directives) on the correct implementation of Joint Ministerial Decision 146896/2014 (G.G. Β '2878) "Licensing and exploitation of water projects. Procedures and conditions for the issue of licenses, their content and duration and other relevant provisions "
8 Decision no 106/2014 of the National Water Committee
“Approval of the River Basin Management Plan of the Water District of Central Macedonia”
9 J.M.D. 171923/3071/2013 “Standard Environmental Commitments for projects and activities in category B of the 2nd Group Hydraulic Works of Annex II to no. 1958/2012 Ministerial Decision (G.G. B21) as applicable "
10 J.M.D. 191002/2013 "Modification of the Joint Ministerial Decision no. 145116/2011 "Determination of measures, conditions and procedures for the re-use of treated wastewater (G.G. 354/B) and related provisions"
11 M.D. Φ.15/4187/266/2012 “Determination of Standard Environmental Commitments (SEC) by branch of activity in the operating permit for the activities that fall under the scope of Law 3982/2011 and are classified in Category B of Article 1 of Law 4014/2011”
12 M.D. 1958/2011 “Classification of public and private projects and activities in categories and subcategories according to articles 1&4 of Law 4014/21.9.2011 (G.G. 209 /A/2011)"
The M.D. was modified by:
• M.D. 20741/2012 “Amendment of M.D. no 1958/13-1-2012 of the Minister of Environment, Energy and Climate Change -Classification of public and private projects and activities in categories and subcategories according to article 1 paragraph 4 of L. 4014/21.09.2011 (A 209) "(B21)".
13 Low 4014/2011 “Environmental permits of projects and activities, arbitrary adjustment in connection with the creation of an environmental balance and other provisions of competence of the Ministry of the Environment”
Relative Documents:
• Deed no 161486/2014 “Applying the provisions of article 2 par. 8c of Law 4014/2011”
• Deed no 205988/2011 “Clarifications on the issues referred to in Article 12 of Law 4014/2011 on the permit for the disposal of wastewater or industrial waste”
The Low was modified by:
• M.D. no 5688/2018 “Amendment of the Annexes to Law 4014/2011 (209/A), in accordance with Article 36A of this Law, in compliance with Directive 2014/52/EU -Amending Directive 2011/92/EU on the assessment of Impact of certain public and private projects on the environment -of the European Parliament and of the Council of 16 April 2014”
• Low 4519/2018 “Management Bodies of Protected Areas and other provisions”
• Low 4281/2014 “Measures for the support and development of the Greek economy, organizational issues of the Ministry of Finance and other provisions”
• Low 4042/2012 “Sanctions for protection of the environment-Harmonization with Directive 2008/99/EC - Framework for the production and management of waste - Regulation of issues of the Ministry of the Environment, Energy and Climate Change”
• M.D. 1958/2012 “Classification of public and private projects and activities in categories and subcategories according to articles 1&4 of Law 4014/21.9.2011 (G.G. 209/A/2011) "
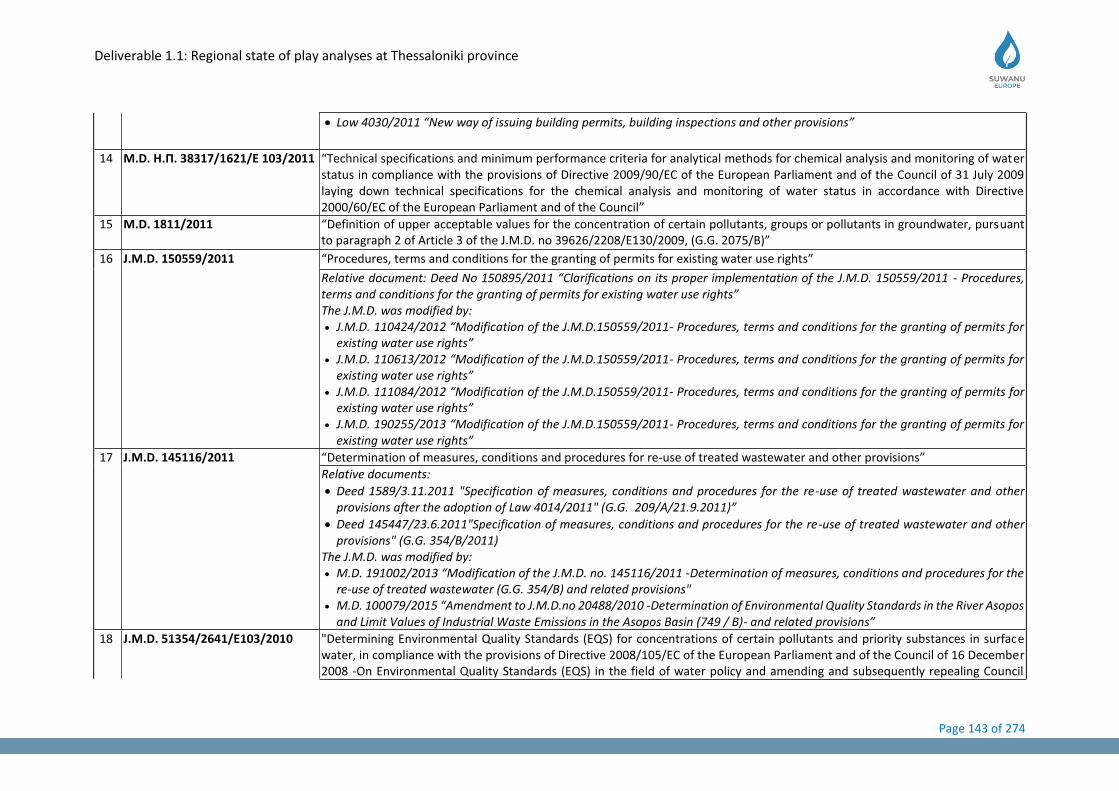
Deliverable 1.1: Regional state of play analyses at Thessaloniki province
Page 143 of 274
• Low 4030/2011 “New way of issuing building permits, building inspections and other provisions”
14 M.D. Η.Π. 38317/1621/Ε 103/2011 “Technical specifications and minimum performance criteria for analytical methods for chemical analysis and monitoring of water status in compliance with the provisions of Directive 2009/90/EC of the European Parliament and of the Council of 31 July 2009 laying down technical specifications for the chemical analysis and monitoring of water status in accordance with Directive 2000/60/EC of the European Parliament and of the Council”
15 M.D. 1811/2011 “Definition of upper acceptable values for the concentration of certain pollutants, groups or pollutants in groundwater, pursuant to paragraph 2 of Article 3 of the J.M.D. no 39626/2208/Ε130/2009, (G.G. 2075/B)”
16 J.M.D. 150559/2011 “Procedures, terms and conditions for the granting of permits for existing water use rights”
Relative document: Deed No 150895/2011 “Clarifications on its proper implementation of the J.M.D. 150559/2011 - Procedures, terms and conditions for the granting of permits for existing water use rights” The J.M.D. was modified by: • J.M.D. 110424/2012 “Modification of the J.M.D.150559/2011- Procedures, terms and conditions for the granting of permits for
existing water use rights” • J.M.D. 110613/2012 “Modification of the J.M.D.150559/2011- Procedures, terms and conditions for the granting of permits for
existing water use rights” • J.M.D. 111084/2012 “Modification of the J.M.D.150559/2011- Procedures, terms and conditions for the granting of permits for
existing water use rights” • J.M.D. 190255/2013 “Modification of the J.M.D.150559/2011- Procedures, terms and conditions for the granting of permits for
existing water use rights”
17 J.M.D. 145116/2011 “Determination of measures, conditions and procedures for re-use of treated wastewater and other provisions”
Relative documents:
• Deed 1589/3.11.2011 "Specification of measures, conditions and procedures for the re-use of treated wastewater and other provisions after the adoption of Law 4014/2011" (G.G. 209/A/21.9.2011)”
• Deed 145447/23.6.2011"Specification of measures, conditions and procedures for the re-use of treated wastewater and other provisions" (G.G. 354/Β/2011)
The J.M.D. was modified by: • M.D. 191002/2013 “Modification of the J.M.D. no. 145116/2011 -Determination of measures, conditions and procedures for the
re-use of treated wastewater (G.G. 354/B) and related provisions" • M.D. 100079/2015 “Amendment to J.M.D.no 20488/2010 -Determination of Environmental Quality Standards in the River Asopos
and Limit Values of Industrial Waste Emissions in the Asopos Basin (749 / B)- and related provisions”
18 J.M.D. 51354/2641/Ε103/2010 "Determining Environmental Quality Standards (EQS) for concentrations of certain pollutants and priority substances in surface water, in compliance with the provisions of Directive 2008/105/EC of the European Parliament and of the Council of 16 December 2008 -On Environmental Quality Standards (EQS) in the field of water policy and amending and subsequently repealing Council
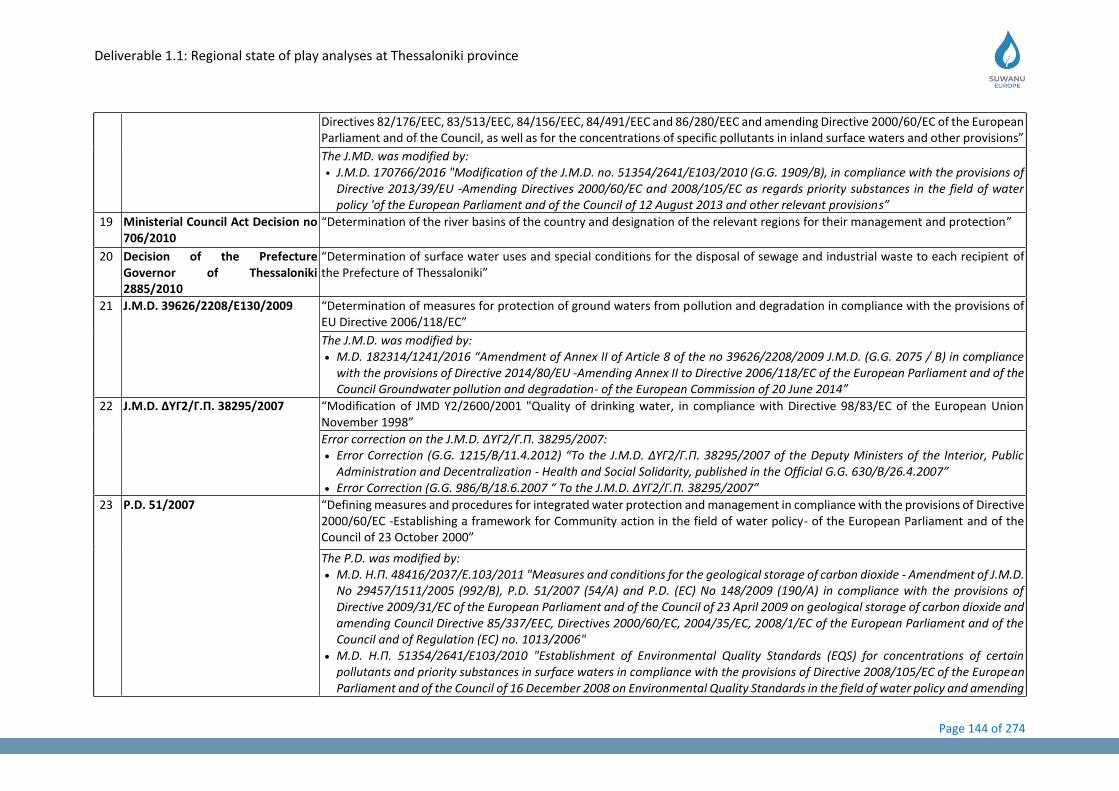
Deliverable 1.1: Regional state of play analyses at Thessaloniki province
Page 144 of 274
Directives 82/176/EEC, 83/513/EEC, 84/156/EEC, 84/491/EEC and 86/280/EEC and amending Directive 2000/60/EC of the European Parliament and of the Council, as well as for the concentrations of specific pollutants in inland surface waters and other provisions”
The J.MD. was modified by: • J.M.D. 170766/2016 "Modification of the J.M.D. no. 51354/2641/E103/2010 (G.G. 1909/B), in compliance with the provisions of
Directive 2013/39/EU -Amending Directives 2000/60/EC and 2008/105/EC as regards priority substances in the field of water policy 'of the European Parliament and of the Council of 12 August 2013 and other relevant provisions”
19 Ministerial Council Act Decision no 706/2010
“Determination of the river basins of the country and designation of the relevant regions for their management and protection”
20 Decision of the Prefecture Governor of Thessaloniki 2885/2010
“Determination of surface water uses and special conditions for the disposal of sewage and industrial waste to each recipient of the Prefecture of Thessaloniki”
21 J.M.D. 39626/2208/E130/2009 “Determination of measures for protection of ground waters from pollution and degradation in compliance with the provisions of EU Directive 2006/118/EC”
The J.M.D. was modified by: • M.D. 182314/1241/2016 “Amendment of Annex II of Article 8 of the no 39626/2208/2009 J.M.D. (G.G. 2075 / B) in compliance
with the provisions of Directive 2014/80/EU -Amending Annex II to Directive 2006/118/EC of the European Parliament and of the Council Groundwater pollution and degradation- of the European Commission of 20 June 2014”
22 J.M.D. ΔΥΓ2/Γ.Π. 38295/2007 “Modification of JMD Y2/2600/2001 "Quality of drinking water, in compliance with Directive 98/83/EC of the European Union November 1998”
Error correction on the J.M.D. ΔΥΓ2/Γ.Π. 38295/2007: • Error Correction (G.G. 1215/B/11.4.2012) “To the J.M.D. ΔΥΓ2/Γ.Π. 38295/2007 of the Deputy Ministers of the Interior, Public
Administration and Decentralization - Health and Social Solidarity, published in the Official G.G. 630/Β/26.4.2007” • Error Correction (G.G. 986/B/18.6.2007 “ To the J.M.D. ΔΥΓ2/Γ.Π. 38295/2007”
23 P.D. 51/2007 “Defining measures and procedures for integrated water protection and management in compliance with the provisions of Directive 2000/60/EC -Establishing a framework for Community action in the field of water policy- of the European Parliament and of the Council of 23 October 2000”
The P.D. was modified by: • M.D. Η.Π. 48416/2037/Ε.103/2011 "Measures and conditions for the geological storage of carbon dioxide - Amendment of J.M.D.
No 29457/1511/2005 (992/B), P.D. 51/2007 (54/A) and P.D. (EC) No 148/2009 (190/A) in compliance with the provisions of Directive 2009/31/EC of the European Parliament and of the Council of 23 April 2009 on geological storage of carbon dioxide and amending Council Directive 85/337/EEC, Directives 2000/60/EC, 2004/35/EC, 2008/1/EC of the European Parliament and of the Council and of Regulation (EC) no. 1013/2006"
• M.D. Η.Π. 51354/2641/Ε103/2010 "Establishment of Environmental Quality Standards (EQS) for concentrations of certain pollutants and priority substances in surface waters in compliance with the provisions of Directive 2008/105/EC of the European Parliament and of the Council of 16 December 2008 on Environmental Quality Standards in the field of water policy and amending
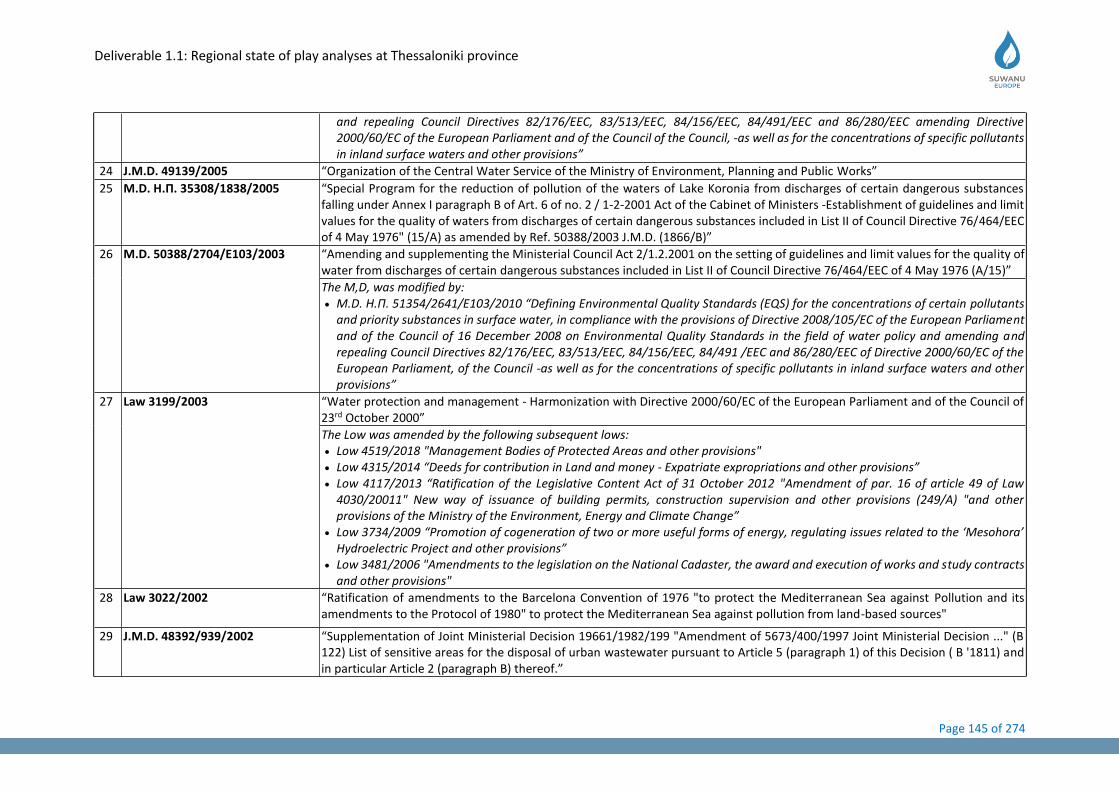
Deliverable 1.1: Regional state of play analyses at Thessaloniki province
Page 145 of 274
and repealing Council Directives 82/176/EEC, 83/513/EEC, 84/156/EEC, 84/491/EEC and 86/280/EEC amending Directive 2000/60/EC of the European Parliament and of the Council of the Council, -as well as for the concentrations of specific pollutants in inland surface waters and other provisions”
24 J.M.D. 49139/2005 “Organization of the Central Water Service of the Ministry of Environment, Planning and Public Works”
25 M.D. Η.Π. 35308/1838/2005 “Special Program for the reduction of pollution of the waters of Lake Koronia from discharges of certain dangerous substances falling under Annex I paragraph B of Art. 6 of no. 2 / 1-2-2001 Act of the Cabinet of Ministers -Establishment of guidelines and limit values for the quality of waters from discharges of certain dangerous substances included in List II of Council Directive 76/464/EEC of 4 May 1976" (15/A) as amended by Ref. 50388/2003 J.M.D. (1866/B)”
26 M.D. 50388/2704/Ε103/2003 “Amending and supplementing the Ministerial Council Act 2/1.2.2001 on the setting of guidelines and limit values for the quality of water from discharges of certain dangerous substances included in List II of Council Directive 76/464/EEC of 4 May 1976 (A/15)”
The M,D, was modified by: • M.D. Η.Π. 51354/2641/Ε103/2010 “Defining Environmental Quality Standards (EQS) for the concentrations of certain pollutants
and priority substances in surface water, in compliance with the provisions of Directive 2008/105/EC of the European Parliament and of the Council of 16 December 2008 on Environmental Quality Standards in the field of water policy and amending and repealing Council Directives 82/176/EEC, 83/513/EEC, 84/156/EEC, 84/491 /EEC and 86/280/EEC of Directive 2000/60/EC of the European Parliament, of the Council -as well as for the concentrations of specific pollutants in inland surface waters and other provisions”
27 Law 3199/2003 “Water protection and management - Harmonization with Directive 2000/60/EC of the European Parliament and of the Council of 23rd October 2000”
The Low was amended by the following subsequent lows: • Low 4519/2018 "Management Bodies of Protected Areas and other provisions" • Low 4315/2014 “Deeds for contribution in Land and money - Expatriate expropriations and other provisions” • Low 4117/2013 “Ratification of the Legislative Content Act of 31 October 2012 "Amendment of par. 16 of article 49 of Law
4030/20011" New way of issuance of building permits, construction supervision and other provisions (249/A) "and other provisions of the Ministry of the Environment, Energy and Climate Change”
• Low 3734/2009 “Promotion of cogeneration of two or more useful forms of energy, regulating issues related to the ‘Mesohora’ Hydroelectric Project and other provisions”
• Low 3481/2006 "Amendments to the legislation on the National Cadaster, the award and execution of works and study contracts and other provisions"
28 Law 3022/2002 “Ratification of amendments to the Barcelona Convention of 1976 "to protect the Mediterranean Sea against Pollution and its amendments to the Protocol of 1980" to protect the Mediterranean Sea against pollution from land-based sources"
29 J.M.D. 48392/939/2002 “Supplementation of Joint Ministerial Decision 19661/1982/199 "Amendment of 5673/400/1997 Joint Ministerial Decision ..." (B 122) List of sensitive areas for the disposal of urban wastewater pursuant to Article 5 (paragraph 1) of this Decision ( B '1811) and in particular Article 2 (paragraph B) thereof.”

Deliverable 1.1: Regional state of play analyses at Thessaloniki province
Page 146 of 274
30 Ministerial Council Act 2/2001 “Determination of the guide and limit values for water quality from discharges of certain dangerous substances falling within List II of Council Directive 76/464/EEC of 4 May 1976”
The M.C.A. 2/2001 was modified by: • P.D. Π.Δ. 51/2007 “Determination of measures and procedures for integrated water protection and management in compliance
with the provisions of Directive 2000/60/EC "establishing a framework for Community action in the field of water policy" of the European Parliament and of the Council of 23 October 2000”
• M.D. 0388/2704/Ε103/2003 “Amending and supplementing the Ministerial Council Act 2 /1.2.2001 on the setting of guidelines and limit values for the quality of water from discharges of certain dangerous substances included in List II of Council Directive 76/464/EEC of 4 May 1976 (A/15)”
31 J.M.D. Υ2/2600/2001 "Quality of drinking water, in compliance with Directive 98/83/EC of the European Union of 3 November 1998”
32 J.M.D. 4859/726/2001 “Restrictions and measures on the protection of the aquatic environment from discharges and in particular the fixing of limit values for certain dangerous substances falling within List II of Council Directive 76/464/EEC of 4 May 1976'”
33 J.M.D. 19661/1982/1999 “Amendment of Joint Ministerial Decision 5673/400/1997 Measures and conditions for the urban wastewater treatment» (Β/192 - List of sensitive areas for the disposal of urban wastewater pursuant to Art. 5 (paragraph 1) of that decision”
34 M.D. 19652/1906/1999 “Determination of waters subject to nitrate pollution of agricultural origin - List of vulnerable zones in accordance with paragraphs 1 and 2 respectively of Article 4 of Joint Ministerial Decision No 16190/1335/1997 "Measures and conditions for the protection of nitrate waters of agricultural origin" "(B 519). Amendment of Articles 3, 4, 5 and 8 of this Decision”
The M.D was modified by: • M.D. 147070/2014 “Amendment of Article 2 of M.D. 19652/1906/1999 -Determination of nitrate waters of agricultural origin -
List of vulnerable zones in accordance with paragraphs 1 and 2 respectively of Article 4 of M.D. No 16190/1335/1997 decision (519/B), as amended and in force”
• M.D. 190126/2013 “Amendment of Article 2 of M.D. 19652/1906/1999 -Determination of nitrate waters of agricultural origin -List of vulnerable zones in accordance with paragraphs 1 and 2 respectively of Article 4 of M.D. 16190/1335/1997 decision (519/B), as amended and in force”
• M.D. 106253/2010 “Amendment of Article 2 of M.D. 19652/1906/1999 -Determination of nitrate waters of agricultural origin -List of vulnerable zones in accordance with paragraphs 1 and 2 respectively of Article 4 of M.D. 16190/1335/1997 decision (519/B), as amended and in force”
• M.D. Η.Π. Η.Π. 24838/1400/Ε103/2008«Amendment of Article 2 of M.D. 19652/1906/1999 -Determination of nitrate waters of agricultural origin -List of vulnerable zones in accordance with paragraphs 1 and 2 respectively of Article 4 of M.D. 16190/1335/1997 decision (519 / B), as amended and in force”
The M.D. was supplemented by: • M.D. 20419/2522/2001 “Supplementing M.D. No 19652/1906/1999 on -Determination of nitrate waters of agricultural origin -
List of vulnerable zones in accordance with paragraphs 1 and 2 respectively of Article 4 of Common Position No 16190/1335/1997 M. D.(B 519), as amended and in force (B1575)”
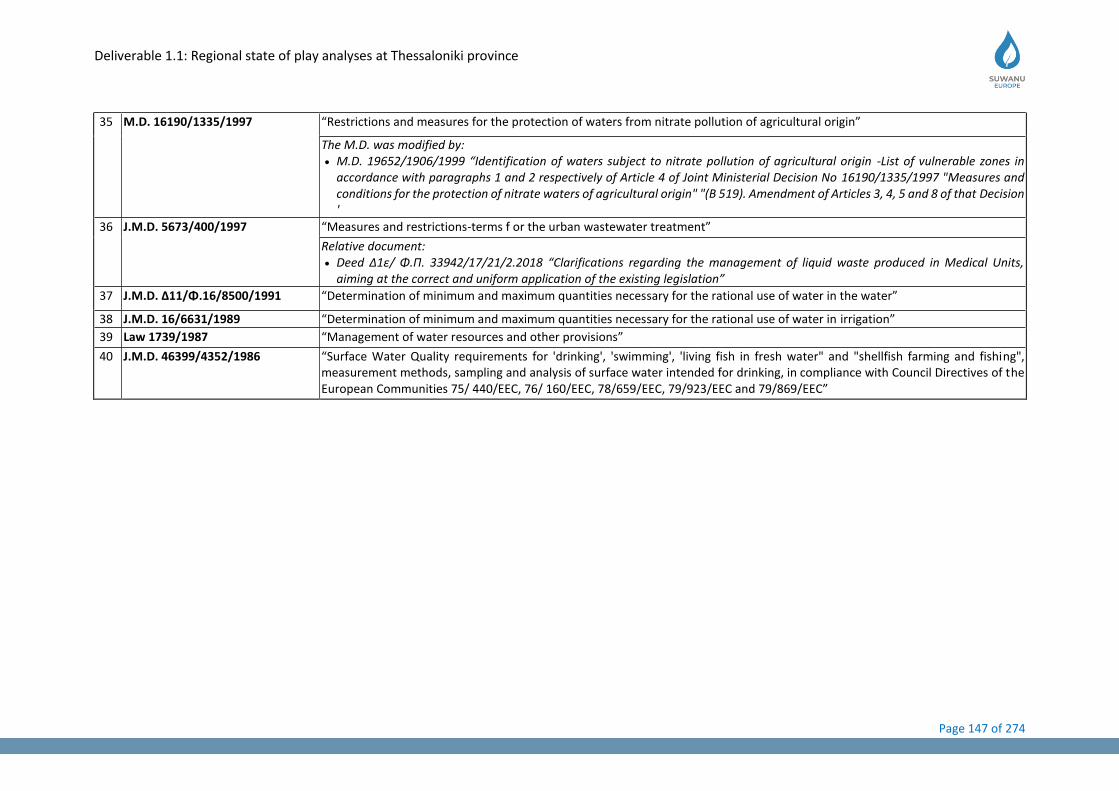
Deliverable 1.1: Regional state of play analyses at Thessaloniki province
Page 147 of 274
35 M.D. 16190/1335/1997 “Restrictions and measures for the protection of waters from nitrate pollution of agricultural origin”
The M.D. was modified by: • M.D. 19652/1906/1999 “Identification of waters subject to nitrate pollution of agricultural origin -List of vulnerable zones in
accordance with paragraphs 1 and 2 respectively of Article 4 of Joint Ministerial Decision No 16190/1335/1997 "Measures and conditions for the protection of nitrate waters of agricultural origin" "(B 519). Amendment of Articles 3, 4, 5 and 8 of that Decision '
36 J.M.D. 5673/400/1997 “Measures and restrictions-terms f or the urban wastewater treatment”
Relative document: • Deed Δ1ε/ Φ.Π. 33942/17/21/2.2018 “Clarifications regarding the management of liquid waste produced in Medical Units,
aiming at the correct and uniform application of the existing legislation”
37 J.M.D. Δ11/Φ.16/8500/1991 “Determination of minimum and maximum quantities necessary for the rational use of water in the water”
38 J.M.D. 16/6631/1989 “Determination of minimum and maximum quantities necessary for the rational use of water in irrigation”
39 Law 1739/1987 “Management of water resources and other provisions”
40 J.M.D. 46399/4352/1986 “Surface Water Quality requirements for 'drinking', 'swimming', 'living fish in fresh water" and "shellfish farming and fishing", measurement methods, sampling and analysis of surface water intended for drinking, in compliance with Council Directives of the European Communities 75/ 440/EEC, 76/ 160/EEC, 78/659/EEC, 79/923/EEC and 79/869/EEC”
Deliverable 1.1: Regional state of play analyses at Thessaloniki province
Page 148 of 274
5.3.2 Applicable regulations
Joint Ministerial Decision 5673/400/14.03.1997: “Measures and conditions for the treatment of urban wastewater"
Greece, as a member country of the EU, has been fully harmonized with the EU Directives. With the Law: 3199/2003 (G.G. A’ 280/9.12.2003), the Greek water resources legislation was harmonized with the Directive 2000/60/EC. The low refers to recycling and reuse of reclaimed water, mainly from an environmental point of view.
Urban wastewater management is governed by the European Directive 91/271 / EEC. Greece was fully harmonized with this Directive with the adoption of Joint Ministerial Decision 5673/400/14.03.1997 (G.G. B’192/14.3.1997), titled: "Measures and conditions for the treatment of urban wastewater". According to the J.M.D. 5673/400/1997, the populated areas of the country (urban & sub-urban areas) have been divided in to three classes of priority A, B, & C:
Priority area A: Settlements with population equivalent (p.e.) over 10.000 that discharge their wastewater to "sensitive" water bodies must complete the installations of sewage, central collection and treatment systems until 31/12/1998.
Priority area B: Settlements with p.e. over 15.000 that discharge their wastewater to "normal" water bodies must complete the installations of sewage, central collection, and treatment systems until 31/12/2000.
Priority area C: Settlements with p.e. over 2.000 that are not included in the priority areas A & B must complete the installation of sewage, central collection and treatment systems until 31/12/2005. In this priority it is also included settlements in which sewage central collection system has already been installed.
The J.M.D. in its Annexes (I, II & III) provides specific directions about:
- Requirements for the discharges from urban wastewater treatment plants (WWTP’s) - Requirements for the discharges from WWTP’s into sensitive areas (according to Annex
II of the same J.M.D.) where eutrophication occurs. - The number of samples that should be taken during each year in correlation to the
WWTP capacity, as well as the maximum permitted number of samples that is accepted to deviate per each capacity category of the WWTP.
- Categorization of the Industrial WWTPs that can utilize urban WWTP sites for the disposal of their properly treated waste waters.
The J.M.D. was modified for the first time by the J.M.D. 19661/1982/1999 titled: “Amendment of Joint Ministerial Decision 5673/400/1997 Measures and conditions for the urban wastewater treatment» (Β/192) - List of sensitive areas for the disposal of urban waste water pursuant to Article 5 (paragraph 1) of that decision.” The modifications were mainly about the list of the sensitive areas (Annex II of the J.M.D. no 5673/400/1997), and the table 2: requirements for the discharges from WWTP’s into sensitive areas (Annex I of the J.M.D. no 5673/400/1997).
The J.M.D. 19661/1982/1999 was subsequently supplemented by the J.M.D. 48392/939/2002 titled: “Supplementation of Joint Ministerial Decision 19661/1982/199 "Amendment of 5673/400/1997 Joint Ministerial Decision ..." (B 122) List of sensitive areas for the disposal of urban waste water pursuant to Article 5 (paragraph 1) of this Decision (B '1811) and in particular Article 2 (paragraph B) thereof.” The interesting supplementation for the purposes of this report was the inclusion of the entire Thermaikos Gulf to the list of the sensitive areas (Annex II of the J.M.D. 5673/400/1997).
Deliverable 1.1: Regional state of play analyses
Page 149 of 274
Presidential Decree 51/2007: “Defining measures and procedures for integrated water protection and management in compliance with the provisions of Directive 2000/60/EC -Establishing a framework for Community action in the field of water policy- of the European Parliament and of the Council of 23 October 2000”
The P.D. sets the foundation of modern water resources management in Greece. It sets the administrative frame for governance of the water resources issues at central – regional & local level (articles 3, 5, 6, 7, 8, 10, 12, 15, 16 & Annexes V, VII & VII). It also sets the frame for the environmental approach of water resources management and monitoring of their quantities & qualities data (articles 4, 9, 11, 13, and 14 & Annexes I, II, III, VI, & IX).
− The P.D. by its article 17 abolished several parts of the J.M.D. 46399/4352/1986 in two stages: 1st on 23.12.2007 were abolished the articles 3A paragraphs 1, 4, 5, 1-3a, 6, 7a, and 8-10
− 2nd on 13.12.2013 were abolished articles 3, 3B paragraphs 1-1.4, 5 paragraph 3 subparagraph B.
The P.D. also abolished completely the J.M.D. 26857/553/1988 and the J.M.D. 4859/726/2001.
− The P.D. was firstly modified by M.D. Η.Π. 51354/2641/Ε103/2010 “Establishment of Environmental Quality Standards (EQS) for concentrations of certain pollutants and priority substances in surface waters in compliance with the provisions of Directive 2008/105/EC of the European Parliament and of the Council of 16 December 2008 on Environmental Quality Standards) in the field of water policy and amending and repealing Council Directives 82/176/EEC, 83/513/EEC, 84/156/EEC, 84/491/EEC and 86/280/EEC amending Directive 2000/60/EC of the European Parliament and of the Council of the Council,-as well as for the concentrations of specific pollutants in inland surface waters and other provisions”. The major modification concerning the purposes of the water reuse is the replacement of the Annex IX of the P.D. 51/2007 with a new “List of priority substances in the field of water policies”
− The P.D. was secondly modified by M.D. Η.Π. 48416/2037/Ε.103/2011 in compliance to the EU Directives 85/337/EEC, 2000/60/EC, 2004/35/EC, 2008/1/EC regulating issues on CO2 underground storage.
Joint Ministerial Decision 145116/2011: "Determination of measures, conditions and procedures for the re-use of treated wastewater and other provisions" (as it was amended by the J.M.D. 191005/2013)
In 2011, the re-use of treated wastewater was instituted through the J.M.D. 145116/2011 (G. G. 354B / 8.3.2011), titled: "Determination of measures, conditions and procedures for the re-use of treated wastewater and other provisions". The J.M.D. aims to: cover the legislative gap due to lack of common European Legislation, to promote the utilization of the treated waste waters, and to secure public health by setting appropriate terms and criteria.
The J.M.D. based on the crops type, the irrigation method and the public access to the irrigated fields, defines the re-use of treated wastewater for irrigation by 2 distinct ways:
1. Irrigation with restrictions (restricted irrigation) 2. Irrigation without restrictions (unrestricted irrigation)
The J.M.D. has a scope of application which includes:
• Urban wastewater and some categories of industrial wastewater (provided they present characteristics within the acceptable limits set by the J.M.D. 5673/400/1997):
Agricultural use (irrigation), groundwater supply, urban and sub-urban use, and industrial use, reuse in the water systems referred to article 7 of the Presidential. Directive (P.D.) 51/2007,
Deliverable 1.1: Regional state of play analyses
Page 150 of 274
• Industrial wastewater (all categories with characteristics outside the limits set by J.M.D. 5673/400/1997): Industrial use, restricted irrigation and through subsoil delivery systems, replenishment of aquifers (which do not fall into those named to article 7 of the P.D. 51/2007), only through filtration.
In particular the article 4 of the J.M.D.: “Reuse for irrigation” sets the following conditions for the use of treated wastewater:
Table 20: Conditions to be met for reuse of treated wastewater for irrigation
Restricted Irrigation Unrestricted Irrigation
Crops whom the products are:
− consumed by people after processing (e.g. thermal),
− or aren’t meant for human consumption,
− or do not have direct contact with the soil
All types of crops
Water application by sprinkles is not allowed All methods of water application to the field are allowed (sprinkles included)
Peoples access to the crops field is prohibited Free access of people to the fields
E. Coli ≤200 EC/100ml E. Coli ≤ EC/100ml for 80% of the samples
BOD < 25mg/l BOD ≤ 10 mg/l for 80% of the samples
SS < 35mg/l SS ≤10 mg/l for 80% of the samples
Turbidity ≤ 2ntu
Secondary Treatment + Disinfection Secondary Treatment + Tertiary Treatment + Disinfection
Both types of irrigation with treated wastewater must also comply with the conditions set by:
• The Table 4: “Maximum permissible concentrations of metals and elements” of Annex II of the J.M.D. 145116/2011
• The Table 5: “Desirable agronomic characteristics of the wastewater to be irrigated” of Annex III of the J.M.D. 145116/2011
• The Table 6: “Maximum permissible concentrations of priority substances in wastes” of Annex IV of the J.M.D. 145116/2011
In article 4 of the J.M.D. 145116/2011 is set the prerequisites for reuse of treated water for irrigation regarding the administrative frame of the action. The reuse requires the elaboration of design and implementation of the irrigation study with the following contents:
• Water balance and organic load balance per unit of the irrigated area, irrigation loads
• Calculation of the total required area
• Design of tracking programs for the characteristics of the soil of the irrigated crops
• Suggestion of any additive new protection measures
• Prescription of the necessary measures for public information & protection
• The definition of the appropriate radius from water reception points, other land uses etc.
Furthermore, in article 6 for urban & suburban reuse of treated wastewaters the following conditions are set:
• The reuse of treated wastewater is allowed on urban / suburban green landscapes, motorways slopes, golf coerces, public parks, fire fight needs, fountains etc.
• The origin of the treated wastewater must present characteristics within the acceptable limits set by the J.M.D. 5673/400/1997.
• The limits for microbiological and conventional parameters as well as the minimum required treatment and frequency of sampling and analysis in case of re-use of treated

Deliverable 1.1: Regional state of play analyses
Page 151 of 274
wastewater for urban and suburban use, as set by Table 3 (Annex I), of the J.M.D. 145116/2011.
The modifications brought by the J.M.D. 191002/2013 titled: "Modification of the Joint Ministerial Decision no. 145116/2011 "Determination of measures, conditions and procedures for the re-use of treated wastewater (G.G. 354/B) and related provisions", were focused mainly on article 9 of the J.M.D. 145116/2011.
The article refers to the obligatory permission receipt procedures that must be done by the responsible user of treated wastewater for irrigation. The modification is done in conjunction with the provisions of the Low 4014/2011 titled: “Environmental permits of projects and activities, arbitrary adjustment in connection with the creation of an environmental balance and other provisions of competence of the Ministry of the Environment”. The modification abolishes the previous procedures and their integration to the procedures for reception of the Environmental Conditions Permit. The new procedure is as follows:
The User or the Management Carrier of the treated wastewater makes an application – request for Environmental Conditions Permit, to the appropriate Directorate for Water Resources Management. The application is accompanied by the Irrigation Reuse Study as a part of the Environmental Impacts Study.
All the involved Public Competent Services express their formal opinion, and if all is positive, the applicant receives the Environmental Conditions Permit which includes the permit for water reuse. Exception for the previous procedure is granted for cases of reuse of urban WWTPs with capacity < 50 p.e., were the reuse can be done without the permit but nevertheless the conditions set by the J.M.D. 145116/2011 must be Kept.
Ministerial Council Act Decision no 706/2010: "Determination of the river basins of the country and designation of the relevant regions for their management and protection "
The Decision sets the foundation for the creation of modern coherent administration structures for governance of the water resources at all levels: central government, regional government, local authorities.
The National Waters Committee in compliance to the Low 3199/2003 designated 45 river basins for the entire country utilizing the Thematic Data Levels «EGY_RB_2010» & «EGY_RBD_2010» and determined the 14 Water Districts (WD) of the country. It also determined the competent
Regional Authorities for governance of the water resources in its WD.
Decision no 106/2014 of the National Water Committee: " Approval of the River Basin Management Plan of the Water District of Central Macedonia "
Practically the decision is the formal set up of the in force of the Management Plan for the Water District no 10 in which leys Thessaloniki P.U. In short, the W.D. 10 Management Plan includes:
• The general characteristics of the W.D. 10
• The identification and delimitation of surface and groundwater bodies
• The description of the anthropogenic pressures that affect the state of the systems and their impacts
• The Protected Areas of the W.D. 10, i.e. those characterized by: particular environmental characteristics or their use for water abstraction for human consumption or sensitivity to certain anthropogenic pressures such as nitrogen oxides discharges or their association with aquatic life of economic importance
• The main features of the National Monitoring Network for water resources, as it has been developed so far inside the W.D. 10 boundaries
• The state of water bodies of the W.D. 10, as determined by the available measurement data and estimates
• The economic analysis of water uses within the W.D. 10
Deliverable 1.1: Regional state of play analyses
Page 152 of 274
• The presentation of the environmental objectives for each water system, as defined in relation to the status of the systems and the acceptable exceptions to the achievement of these objectives
• The elements of the program of measures that will be required to achieve the objectives of the Directive 2000/60/ΕΚ (article 10 & Annex VII of the P.D. 51/2007), namely, to achieve (or maintain) the good status or good ecological potential of water bodies in the W.D. 10
5.3.3 Administrative requirements
A) National Competent Authorities
According to Low 3199,-”for the Protection & Management of the Water Resources”, as it has been modified and is in force, the following central government, responsible authorities for the protection & management of the water resources are set:
The National Committee for Waters is the highest level instrument for planning policies for waters protection & management for the entire country. It is composed by the entire relative to water resources ministers.
The National Council for Waters, which expresses opinions to the National Committee for Waters on national programs for protection & management of the country’s water resources. It is composed by high government officials and experts at ministerial & parliament level.
The Special Secretariat for Waters which has the responsibilities: to elaborate programs for water protection & management, to coordinate the various government services on all issues related to water resources management & protection. It is the National Competent Authority that generates and oversees the implementation of water policies at country level
B) Regional Competent Authorities
B1) Decentralised Regional Government
According to Low 3852/2010 the competences deriving from Low 3199/2003 for the protection & management of the water resources are shared among the Government Administration and the elected Regional Government. The Government Administration is entrusted with the responsibility of defining strategic protection and management and the elected regions mainly with the implementation of strategic planning.
The National Water Committee with its Decision no. 706/16.07.10 and in particular in its Annex II, as it was corrected to the G.G. 1572/28.09.2010, defines that for the Water District 10, the competent authority is the Decentralised Administration of Macedonia–Thrace and its competences are exercised through the Directorate of Waters of Central Macedonia.
B2) Elected Regional Government
The Regions Hydrogeology Department of the Peripheral Unit of Thessaloniki is the competent authority for the management and also the implementation of the chosen policies & strategies on water resources issues. There are other bodies and sub-departments of Central or Regional Services involved in matters directly or indirectly related to the management of water resources, such as the design, construction, and operation of water use projects and the provision of water services. Following is a complete as possible, a list of services or involved bodies:
Decentralised Administration of Macedonia – Thrace (central government branch at regional level)
- Directorate of Environment and Spatial Planning of Central Macedonia - Directorate of Rural Affairs of Central Macedonia - Directorate of Coordination and Inspection of Forests
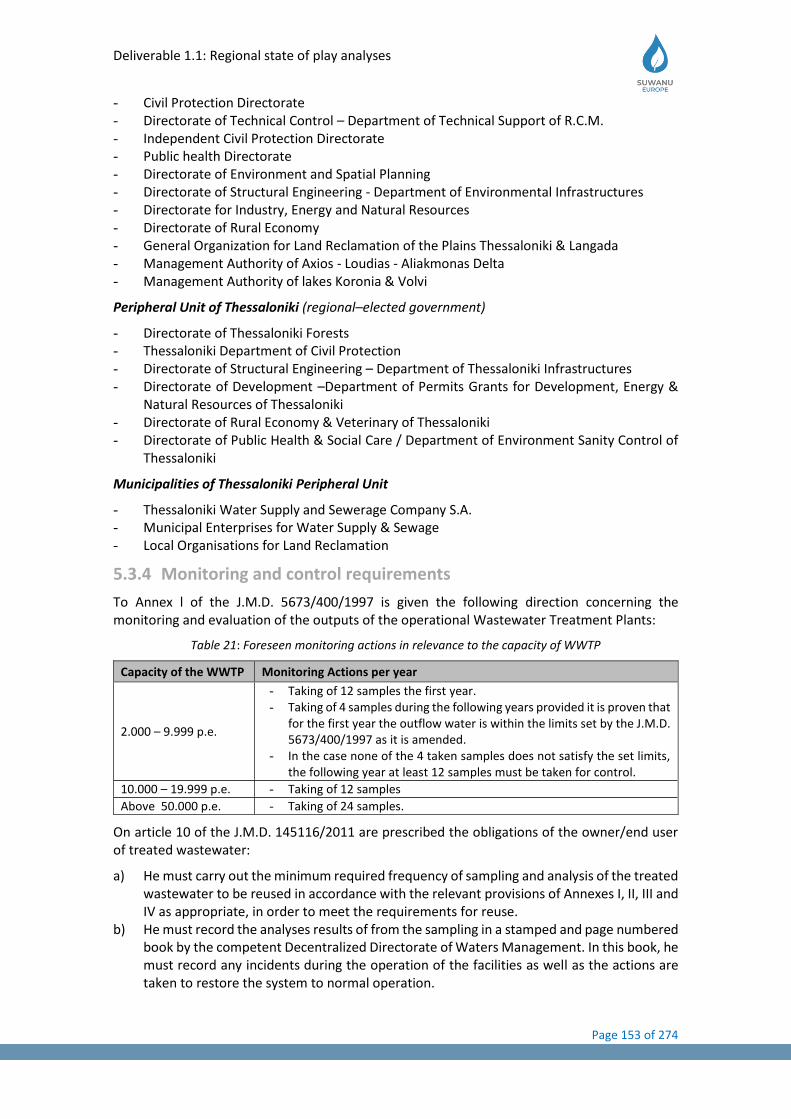
Deliverable 1.1: Regional state of play analyses
Page 153 of 274
- Civil Protection Directorate - Directorate of Technical Control – Department of Technical Support of R.C.M. - Independent Civil Protection Directorate - Public health Directorate - Directorate of Environment and Spatial Planning - Directorate of Structural Engineering - Department of Environmental Infrastructures - Directorate for Industry, Energy and Natural Resources - Directorate of Rural Economy - General Organization for Land Reclamation of the Plains Thessaloniki & Langada - Management Authority of Axios - Loudias - Aliakmonas Delta - Management Authority of lakes Koronia & Volvi
Peripheral Unit of Thessaloniki (regional–elected government)
- Directorate of Thessaloniki Forests - Thessaloniki Department of Civil Protection - Directorate of Structural Engineering – Department of Thessaloniki Infrastructures - Directorate of Development –Department of Permits Grants for Development, Energy &
Natural Resources of Thessaloniki - Directorate of Rural Economy & Veterinary of Thessaloniki - Directorate of Public Health & Social Care / Department of Environment Sanity Control of
Thessaloniki
Municipalities of Thessaloniki Peripheral Unit
- Thessaloniki Water Supply and Sewerage Company S.A. - Municipal Enterprises for Water Supply & Sewage - Local Organisations for Land Reclamation
5.3.4 Monitoring and control requirements
To Annex l of the J.M.D. 5673/400/1997 is given the following direction concerning the monitoring and evaluation of the outputs of the operational Wastewater Treatment Plants:
Table 21: Foreseen monitoring actions in relevance to the capacity of WWTP
Capacity of the WWTP Monitoring Actions per year
2.000 – 9.999 p.e.
- Taking of 12 samples the first year. - Taking of 4 samples during the following years provided it is proven that
for the first year the outflow water is within the limits set by the J.M.D. 5673/400/1997 as it is amended.
- In the case none of the 4 taken samples does not satisfy the set limits, the following year at least 12 samples must be taken for control.
10.000 – 19.999 p.e. - Taking of 12 samples
Above 50.000 p.e. - Taking of 24 samples.
On article 10 of the J.M.D. 145116/2011 are prescribed the obligations of the owner/end user of treated wastewater:
a) He must carry out the minimum required frequency of sampling and analysis of the treated wastewater to be reused in accordance with the relevant provisions of Annexes I, II, III and IV as appropriate, in order to meet the requirements for reuse.
b) He must record the analyses results of from the sampling in a stamped and page numbered book by the competent Decentralized Directorate of Waters Management. In this book, he must record any incidents during the operation of the facilities as well as the actions are taken to restore the system to normal operation.
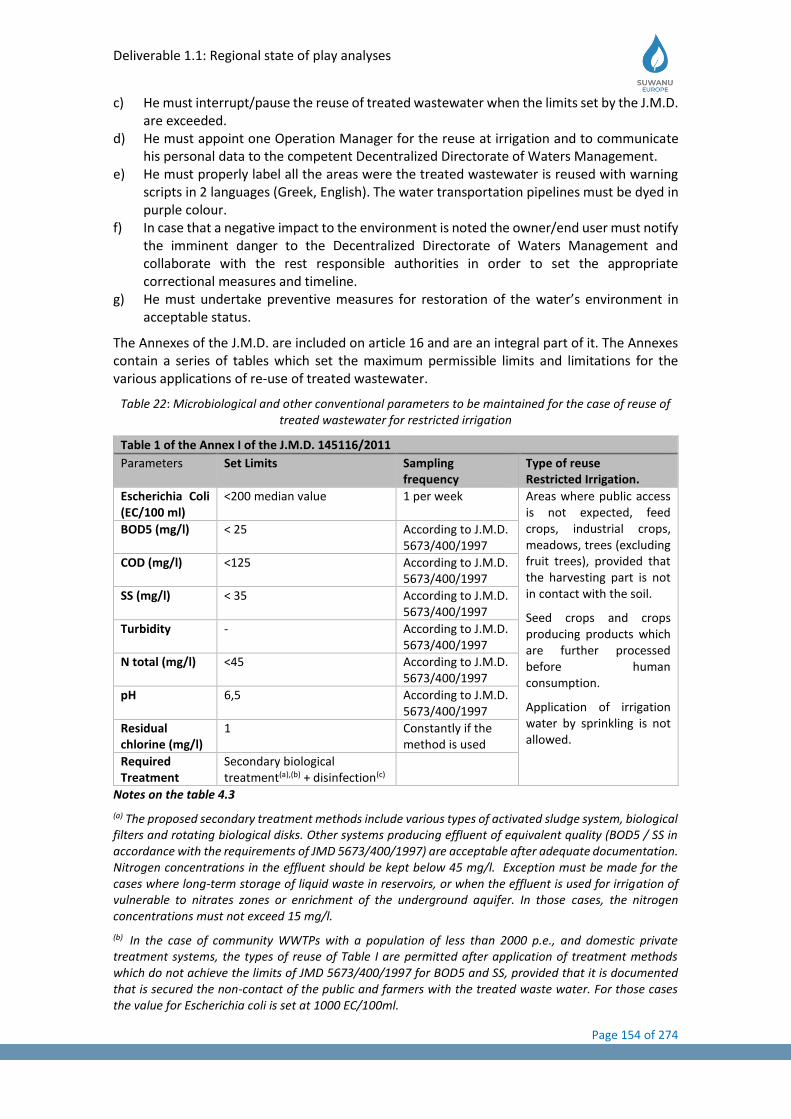
Deliverable 1.1: Regional state of play analyses
Page 154 of 274
c) He must interrupt/pause the reuse of treated wastewater when the limits set by the J.M.D. are exceeded.
d) He must appoint one Operation Manager for the reuse at irrigation and to communicate his personal data to the competent Decentralized Directorate of Waters Management.
e) He must properly label all the areas were the treated wastewater is reused with warning scripts in 2 languages (Greek, English). The water transportation pipelines must be dyed in purple colour.
f) In case that a negative impact to the environment is noted the owner/end user must notify the imminent danger to the Decentralized Directorate of Waters Management and collaborate with the rest responsible authorities in order to set the appropriate correctional measures and timeline.
g) He must undertake preventive measures for restoration of the water’s environment in acceptable status.
The Annexes of the J.M.D. are included on article 16 and are an integral part of it. The Annexes contain a series of tables which set the maximum permissible limits and limitations for the various applications of re-use of treated wastewater.
Table 22: Microbiological and other conventional parameters to be maintained for the case of reuse of treated wastewater for restricted irrigation
Table 1 of the Annex I of the J.M.D. 145116/2011
Parameters Set Limits Sampling frequency
Type of reuse Restricted Irrigation.
Escherichia Coli (EC/100 ml)
<200 median value 1 per week Areas where public access is not expected, feed crops, industrial crops, meadows, trees (excluding fruit trees), provided that the harvesting part is not in contact with the soil.
Seed crops and crops producing products which are further processed before human consumption.
Application of irrigation water by sprinkling is not allowed.
BOD5 (mg/l) < 25 According to J.M.D. 5673/400/1997
COD (mg/l) <125 According to J.M.D. 5673/400/1997
SS (mg/l) < 35 According to J.M.D. 5673/400/1997
Turbidity - According to J.M.D. 5673/400/1997
N total (mg/l) <45 According to J.M.D. 5673/400/1997
pH 6,5 According to J.M.D. 5673/400/1997
Residual chlorine (mg/l)
1 Constantly if the method is used
Required Treatment
Secondary biological treatment(a),(b) + disinfection(c)
Notes on the table 4.3
(a) The proposed secondary treatment methods include various types of activated sludge system, biological filters and rotating biological disks. Other systems producing effluent of equivalent quality (BOD5 / SS in accordance with the requirements of JMD 5673/400/1997) are acceptable after adequate documentation. Nitrogen concentrations in the effluent should be kept below 45 mg/l. Exception must be made for the cases where long-term storage of liquid waste in reservoirs, or when the effluent is used for irrigation of vulnerable to nitrates zones or enrichment of the underground aquifer. In those cases, the nitrogen concentrations must not exceed 15 mg/l.
(b) In the case of community WWTPs with a population of less than 2000 p.e., and domestic private treatment systems, the types of reuse of Table I are permitted after application of treatment methods which do not achieve the limits of JMD 5673/400/1997 for BOD5 and SS, provided that it is documented that is secured the non-contact of the public and farmers with the treated waste water. For those cases the value for Escherichia coli is set at 1000 EC/100ml.

Deliverable 1.1: Regional state of play analyses
Page 155 of 274
(c) Chlorination, ozonisation, ultraviolet (UV) or other methods of pathogen destruction or containment, which ensure the required median concentration of Escherichia coli in the effluent. In each case and to the extent that the treatment is the minimum required in the application of chlorination, a residual chlorine product with a contact time (C t) greater than or equal to 30 mg-min/l, piston flow (Longitudinal flow / width ratio or equal to 40) and a minimum contact time of 30 minutes, while for UV disinfection a minimum dose of 70 mWsec/cm at the end of lamp life will be ensured and no more than 50% permeability value will be obtained for the UV system design. Adequate study, included in the design and implementation study, should demonstrate the adequacy, effectiveness and, above all, the ability to control the effectiveness of disinfection.
Table 23: Microbiological and other conventional parameters to be maintained for the case of re-use of treated wastewater for unrestricted irrigation
Table 2 of the Annex I of the J.M.D. 145116/2011
Parameters Set Limits Sampling frequency Type of reuse Unrestricted Irrigation.
Escherichia Coli (EC/100 ml)
≤ 5 for the 80% of samples ≤ 50 for 95% of the samples
4 per week from WWTP with capacity > 50000 p.e. 2 per week From WWTP with capacity < 50000 p.e. Exception for islands with no lab infrastructure 1 per week
All crops such as vegetables, vines or crops whose products are consumed raw, greenhouses. Unrestricted irrigation allows the application of various methods of irrigation, including irrigation with sprinklers.
BOD5 (mg/l) ≤ 10 for 80% of the samples
According to J.M.D. 5673/400/1997
COD (mg/l) ≤125 According to J.M.D. 5673/400/1997
SS (mg/l) ≤ 10 for 80% of the samples
According to J.M.D. 5673/400/1997
Turbidity < 2 median value 4 per week from WWTP with capacity > 50000 p.e. 2 per week from WWTP with capacity < 50000 p.e.
N total (mg/l) <15 According to J.M.D. 5673/400/1997
pH > 6,5 According to J.M.D. 5673/400/1997
Residual chlorine (mg/l)
1 Constantly if the method is used
Required Treatment
Secondary biological treatment(a) + tertiary treatment(b) + disinfection(c)
Notes on the table 4.4
(a) Like the note (a) of table 4.3. In the case of irrigation in areas characterized as vulnerable by nitrate pollution, nitrogen removal by nitrification-denitrification is required so that the concentrations of ammoniac nitrogen and total nitrogen are less than 2 mg/l and 15 mg/l respectively.
(b) A suitable system to achieve the limits for BOD5, SS and turbidity referred to in Table 2 of Annex I of the J.M.D. 5673/400/1997. Indicatively, at least a suitable flocculants (e.g. aluminium Sulphated) at a dose greater than 10 mg/l and direct refining in a sand refinery, with the following characteristics: minimum depth of refining medium (L) ≥ 1,40 m, active grain diameter sand (Do) = 1 mm, grain uniformity factor (U) of 1,45-1,60 and surface load ≤ 8 m3/m2/hr. for normal operating conditions.
(c) Chlorination, ozonisation, ultraviolet (UV) or other methods of pathogen destruction or containment, which ensure the required median concentration of Escherichia coli in the effluent. In each case and to the extent that the treatment is the minimum required in the application of chlorination, a residual chlorine product with a contact time (C t) greater than or equal to 30 mg-min/l, piston flow (Longitudinal flow / width ratio or equal to 40) and a minimum contact time of 60 minutes, while for UV disinfection a minimum

Deliverable 1.1: Regional state of play analyses
Page 156 of 274
dose of 50 mWsec/cm at the end of lamp life will be ensured and no more than 70% permeability value will be obtained for the UV system design. Adequate study, included in the design and implementation study, should demonstrate the adequacy, effectiveness and, above all, the ability to control the effectiveness of disinfection.
Table 24: Maximum permitted concentrations of metals and elements in reclaimed water for irrigation.
Table 4 of the Annex II of the J.M.D. 145116/2011
Element Maximum concentration (mg/l)
Element Maximum concentration (mg/l)
Al (aluminium) 5 Mn (manganese) 0.2
As (arsenic) 0.1 Mo (molybdenum) 0.01
Be (beryllium) 0.1 Ni (nickel) 0.2
Cd (cadmium) 0.01 Pb (lead) 0.1
Co (cobalt) 0.05 Se (selenium) 0.02
Cr (chromium) 0.1 V (vanadium) 0.1
Cu (copper) 0.2 Zn (zinc) 2.0
F (fluorine) 1.0 Hg (mercury) 0.002
Fe (iron) 3.0 B (boron) 2
Li (lithium) 2.5
The minimum sampling and analysis frequency for the parameters in Table 4.5 is determined as:
→ 12 per year for reclaimed wastewater from treatment facilities with a population equivalent of more than 200000 inhabitants and liquid industrial wastes from industrial activities not falling within the banned categories (irrespective of the size of activity) from the J.M.D. 5673/400/1997 (G.G. 192/14.3.1997).
→ 4 per year for reclaimed wastewater from treatment facilities with a population equivalent of 50000 to 200000 inhabitants.
→ 2 per year for reclaimed wastewater from treatment facilities with a population equivalent of between 10000 and 50000 inhabitants and liquid industrial wastes from industrial activities falling within the categories (irrespective of the size of activity) of the J.M.D. 5673/400/1997 (G.G. 192/14.3.1997).
→ 1 per year for reclaimed wastewater from treatment facilities with a population equivalent of 2000 - 10000 inhabitants.
→ For treatment plants with a population equivalent of less than 2000 and domestic private treatment systems, no check is required to verify compliance with the limits in Table 4.5.
Table 25: Desirable agronomic characteristics of the reusable treated wastewater for irrigation.
Table 5 of Annex III of the J.M.D. 145116/2011
Possible problem during irrigation Units Degree of implementation restrictions
Minimal Small-Medium Large
Salinity (Affects the availability of water in the soil)
ECw(1) dS/m < 0.7 0.7 -3.0 > 3.0
or
TDS (totally dissolved solids) mg/l < 450 450 -2000 > 2000
Permeability
SAR(2) = 0 - 3 and ECw = > 0.7 0.7 - 0.2 < 0.2
3 - 6 > 1.2 1.2 - 0.3 < 0.3
6 - 12 > 1.9 1.9 - 0.5 < 0.5
12 - 20 > 2.9 2.9 - 1.3 < 1.3
20 - 40 > 5.0 5.0 - 2.9 < 2.9
Specific ion toxicity

Deliverable 1.1: Regional state of play analyses
Page 157 of 274
Sodium (Na)
Surface irrigation (root adsorption) SAR < 3 3 - 9 > 9
Irrigation by sprinklers (leaf adsorption) mg/l <70 > 70
Chlorine ions (Cl)
Surface irrigation (root adsorption) mg/l < 140 140 - 350 > 350
Irrigation by sprinklers (leaf adsorption) mg/l < 100 > 100
Other impacts
Nitrogen (NO3-N)(3) mg/l < 5 5 - 30 > 30
HCO3 (only for sprinklers irrigation) mg/l < 90 90 - 500 > 500
pH Typical fluctuation 6.5 - 8.5
Notes on the table 4.6
(1) ECw: Electrical Conductivity of water in Deci-Siemens per meter at 25°C (2) SAR: Sodium Absorption Rate (3) NO3-N: Ntrate nitrogen (form of Nitrogen absorbable by plants)
The minimum sampling and analysis frequency for the parameters in Table 4.6 is determined as:
→ 2 per year for reclaimed wastewater from treatment facilities with a population equivalent of more than 10000 inhabitants.
→ 1 per year for the rest lower cases.
It must be noted that the limits in Table 4.6 are indicative and desirable without being mandatory and their potency will be determined on a case-by-case basis depending on the possible mixing of the reclaimed wastewater with clear water, the type of crop, soil characteristics, climatic conditions, irrigation equipment and other elements of each specific irrigation study.
Table 26: Maximum permitted concentrations of priority substances and toxicity in reclaimed wastewater.
Table 6 of Annex IV of the J.M.D. 145116/2011
Substance Name CAS Maximum concentration (μg/l)
Alachlor 15972-60-8 0,7
Anthracene 120-12-7 1
Atrazine 1912-24-9 2
benzoyl 71-43-2 5
brominated diphenyl ether 32534-81-9 0,025
Carbon-tetrachloride 56-23-5 MA
C10-13 Chlorinated alkanes 85535-84-8 1,4
Clofenvinphos 470-90-6 0,3
Chlorpyrifos (Chlorpyrifos-ethyl) 2921-88-2 0,1
Aldrin 309-00-2 ND
Dieldrin 60-57-1 ND
Eldrin( 72-20-8 ND
Isodrin 465-73-6 0,01
DDT total - ND
para-para-DDT 50-29-3 ND
1,2 dichloride ethane 107-06-2 20
Dichloromethane 75-09-2 50
Phthalate di(2- ethylexyl) - (DEHP) 117-81-7 10
Diuron 330-54-1 1,0
Endosulfan 115-29-7 0,01
fluoranthene 206-44-0 1
6-chlorobenzene 118-74-1 ND
6-chlorobutadiene 87-68-3 0,6

Deliverable 1.1: Regional state of play analyses
Page 158 of 274
6-chlorocyclohexane 608-73-1 ND
Isoproturon 34123-59-6 1
Naphthalene 91-20-3 2,4
Nonylphenol [4- Nonylphenol] 104-40-5 2
Octylphenol [(4-(1,1', 3,3'- tetra methyl-butyl)- phenol)] 140-66-9 1
Five Chlorobenzene 608-93-5 0,1
Pentachlorophenol 87-86-5 1
Benzo (a) pyrene 50-32-8 0,1
Benzo (b) fluoranthene Benzo (k) fluoranthene
205-99-2 207-08-9
Cumulatively =0,03
Benzo (ζ,η,θ) -perylene indeno(1,2,3-γδ)pyene
191-24-2 193-39-5
Cumulatively =0,02
Simazine 122-34-9 1
Tetrachloroethylene 127-18-4 10
3-chlorethylene 79-01-6 10
3-butyltin compounds (+) 36643-28-4 0,003
3-chlorobenzene (all isomers) 12002-48-1 0,4
3-chloromethane 67-66-3 2,5
3-fluoraline 1582-09-8 0,03
Acute toxicity to the indicator organism Daphnia Magna (before disinfection)
1 Unit of Toxicity (TU 50 <1
ND: Non Detectable
The limits in Table 4.7 apply only to reclaimed wastewater from urban waste water treatment plants with a population equivalent of more than 100000 inhabitants, and for all cases of industrial waste liquids from industries not included in the categories (irrespective of the size of industrial activity) referred to in the J.M.D. 5673/400/1997.
The minimum sampling and analysis frequency for the parameters in Table 4.7 is determined as:
→ 2 per year for reclaimed wastewater from treatment facilities with a population equivalent of more than 10000 inhabitants.

Deliverable 1.1: Regional state of play analyses
Page 159 of 274
5.4 Identification of key actors
A list of key actors shall be provided in this section. We have to include information on organizations (not people). Although, the focus of this report is the target regions, other organizations at national level with influence in water reuse sector.
A tentative list of target groups of actors is: Administration, Local Authorities, Universities, Research Centres, RTDs, Organizations, Associations, Other Bodies
Description of the role of each organization in the use of reclaimed water in agriculture is also relevant in this section.
All the information shall be compiled in the following table:
Organization Role description
Administration (National level)
Ministry of Environment & Energy
Policy making legislative, regulatory. Set policy for the water protection and management, control and inspection of its implementation and adoption of national plans to protect and manage the national water resources.
National Water Committee & National Water Council 1. Deputy Minister for the
Environment and Energy. 2. Minister of Interior Affairs. 3. Minister of Economy &
Development. 4. Minister of Health. 5. Minister of Economy. 6. Minister of Infrastructures
& Transportation. 7. Minister of Rural
Development & Food
The National Water Committee has been designated as a high-level interministerial body and is responsible for policy-making for the management and protection of the country's water resources. In particular, it establishes the policy for the protection and management of waters, monitors and controls its implementation and approves the national water protection and management programs of the country, following the recommendations of the Minister of Environment and the National Water Council. The National Council of Waters delivers an opinion to the National Water Committee on National Water Protection and Management Plans of the country and takes note of the Annual Report submitted by the National Water Committee on the state of the country's water environment, the implementation of legislation on water protection and management, and compatibility with the “acquis Communautaire”. It consists of 26 members (representatives of parties and institutions) and the President is the Minister of Peace. The National Water Council is convened by its President at least once a year.
SPECIAL SECRETARIAT FOR WATER
The Special Secretariat for Water is responsible for the development and implementation of all programs related to the protection and management of the water resources of Greece and the coordination of all competent authorities dealing with the aquatic environment. The implementation of the Water Framework and the Marine Strategy Directives as well of the related daughter Directives fall within the scope of the activities of the Secretariat. The Secretariat, in collaboration with the Regional Water Authorities, formulates and, upon approval by the National Council for Water, implements the River Basin Management Plans and the national monitoring program. The Secretariat is composed of four Directorates and is headed by a Special Secretary, appointed by the Ministry of Environment, Energy and Climate Change and the Government.
Department of Environmental Inspectors
Surveillance and inspection. Surveillance in compliance with environmental legislation and environmental conditions. Inspects activities that may have impacts on the environment in general.
Ministry of Health Competences in: Inspection, surveillance, legislative, regulatory. Health protection of surface, drinking, recreation and ground waters
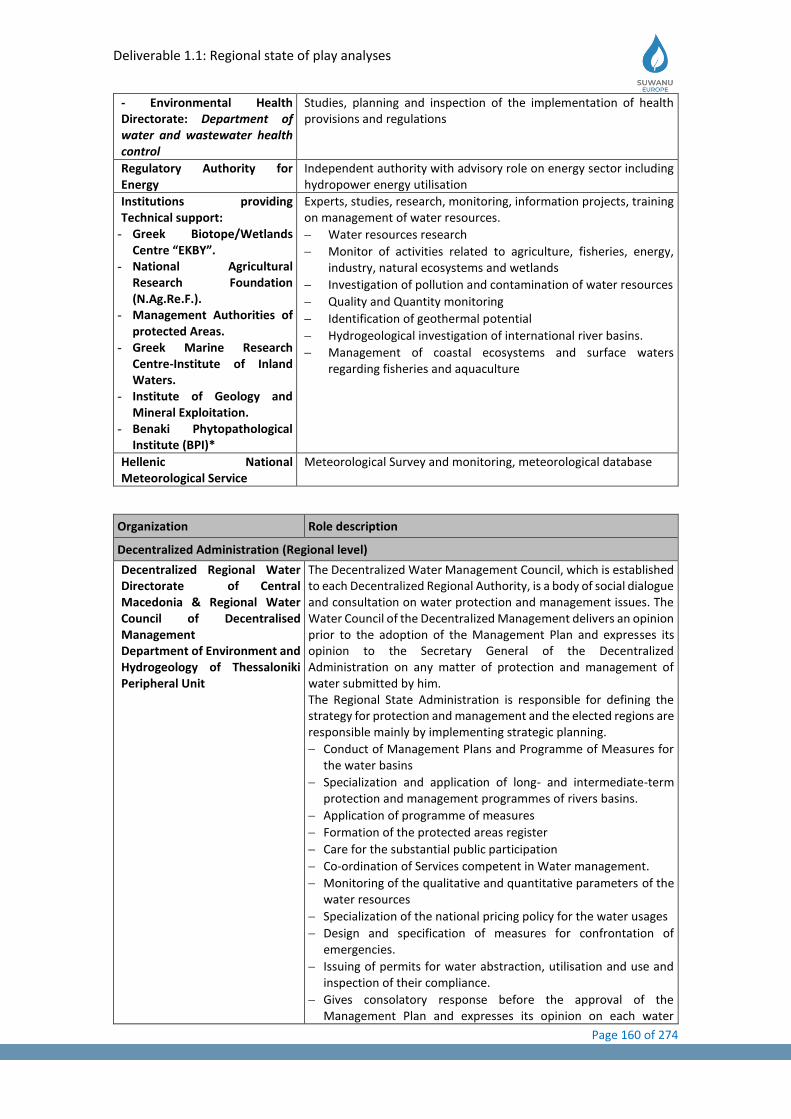
Deliverable 1.1: Regional state of play analyses
Page 160 of 274
- Environmental Health Directorate: Department of water and wastewater health control
Studies, planning and inspection of the implementation of health provisions and regulations
Regulatory Authority for Energy
Independent authority with advisory role on energy sector including hydropower energy utilisation
Institutions providing Technical support:
- Greek Biotope/Wetlands Centre “EKBY”.
- National Agricultural Research Foundation (N.Ag.Re.F.).
- Management Authorities of protected Areas.
- Greek Marine Research Centre-Institute of Inland Waters.
- Institute of Geology and Mineral Exploitation.
- Benaki Phytopathological Institute (BPI)*
Experts, studies, research, monitoring, information projects, training on management of water resources.
− Water resources research
− Monitor of activities related to agriculture, fisheries, energy, industry, natural ecosystems and wetlands
− Investigation of pollution and contamination of water resources
− Quality and Quantity monitoring
− Identification of geothermal potential
− Hydrogeological investigation of international river basins.
− Management of coastal ecosystems and surface waters regarding fisheries and aquaculture
Hellenic National Meteorological Service
Meteorological Survey and monitoring, meteorological database
Organization Role description
Decentralized Administration (Regional level)
Decentralized Regional Water Directorate of Central Macedonia & Regional Water Council of Decentralised Management Department of Environment and Hydrogeology of Thessaloniki Peripheral Unit
The Decentralized Water Management Council, which is established to each Decentralized Regional Authority, is a body of social dialogue and consultation on water protection and management issues. The Water Council of the Decentralized Management delivers an opinion prior to the adoption of the Management Plan and expresses its opinion to the Secretary General of the Decentralized Administration on any matter of protection and management of water submitted by him. The Regional State Administration is responsible for defining the strategy for protection and management and the elected regions are responsible mainly by implementing strategic planning.
− Conduct of Management Plans and Programme of Measures for the water basins
− Specialization and application of long- and intermediate-term protection and management programmes of rivers basins.
− Application of programme of measures
− Formation of the protected areas register
− Care for the substantial public participation
− Co-ordination of Services competent in Water management.
− Monitoring of the qualitative and quantitative parameters of the water resources
− Specialization of the national pricing policy for the water usages
− Design and specification of measures for confrontation of emergencies.
− Issuing of permits for water abstraction, utilisation and use and inspection of their compliance.
− Gives consolatory response before the approval of the Management Plan and expresses its opinion on each water
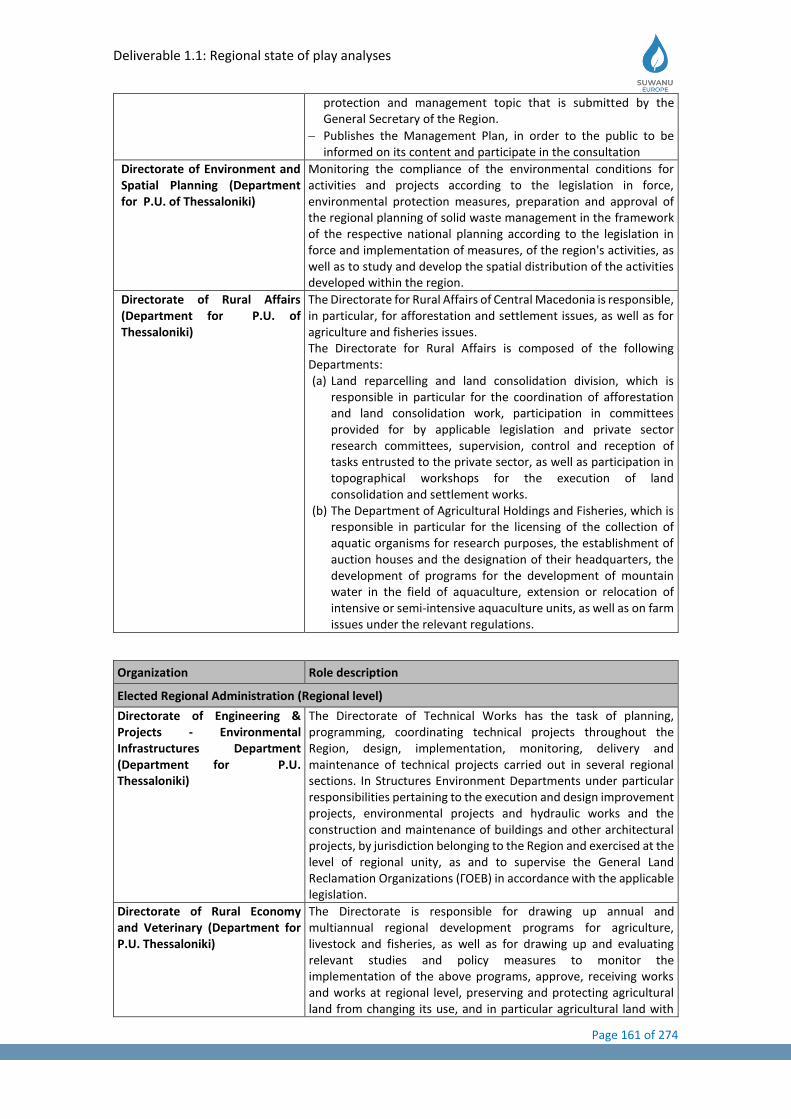
Deliverable 1.1: Regional state of play analyses
Page 161 of 274
protection and management topic that is submitted by the General Secretary of the Region.
− Publishes the Management Plan, in order to the public to be informed on its content and participate in the consultation
Directorate of Environment and Spatial Planning (Department for P.U. of Thessaloniki)
Monitoring the compliance of the environmental conditions for activities and projects according to the legislation in force, environmental protection measures, preparation and approval of the regional planning of solid waste management in the framework of the respective national planning according to the legislation in force and implementation of measures, of the region's activities, as well as to study and develop the spatial distribution of the activities developed within the region.
Directorate of Rural Affairs (Department for P.U. of Thessaloniki)
The Directorate for Rural Affairs of Central Macedonia is responsible, in particular, for afforestation and settlement issues, as well as for agriculture and fisheries issues. The Directorate for Rural Affairs is composed of the following Departments: (a) Land reparcelling and land consolidation division, which is
responsible in particular for the coordination of afforestation and land consolidation work, participation in committees provided for by applicable legislation and private sector research committees, supervision, control and reception of tasks entrusted to the private sector, as well as participation in topographical workshops for the execution of land consolidation and settlement works.
(b) The Department of Agricultural Holdings and Fisheries, which is responsible in particular for the licensing of the collection of aquatic organisms for research purposes, the establishment of auction houses and the designation of their headquarters, the development of programs for the development of mountain water in the field of aquaculture, extension or relocation of intensive or semi-intensive aquaculture units, as well as on farm issues under the relevant regulations.
Organization Role description
Elected Regional Administration (Regional level)
Directorate of Engineering & Projects - Environmental Infrastructures Department (Department for P.U. Thessaloniki)
The Directorate of Technical Works has the task of planning, programming, coordinating technical projects throughout the Region, design, implementation, monitoring, delivery and maintenance of technical projects carried out in several regional sections. In Structures Environment Departments under particular responsibilities pertaining to the execution and design improvement projects, environmental projects and hydraulic works and the construction and maintenance of buildings and other architectural projects, by jurisdiction belonging to the Region and exercised at the level of regional unity, as and to supervise the General Land Reclamation Organizations (ΓΟΕΒ) in accordance with the applicable legislation.
Directorate of Rural Economy and Veterinary (Department for P.U. Thessaloniki)
The Directorate is responsible for drawing up annual and multiannual regional development programs for agriculture, livestock and fisheries, as well as for drawing up and evaluating relevant studies and policy measures to monitor the implementation of the above programs, approve, receiving works and works at regional level, preserving and protecting agricultural land from changing its use, and in particular agricultural land with
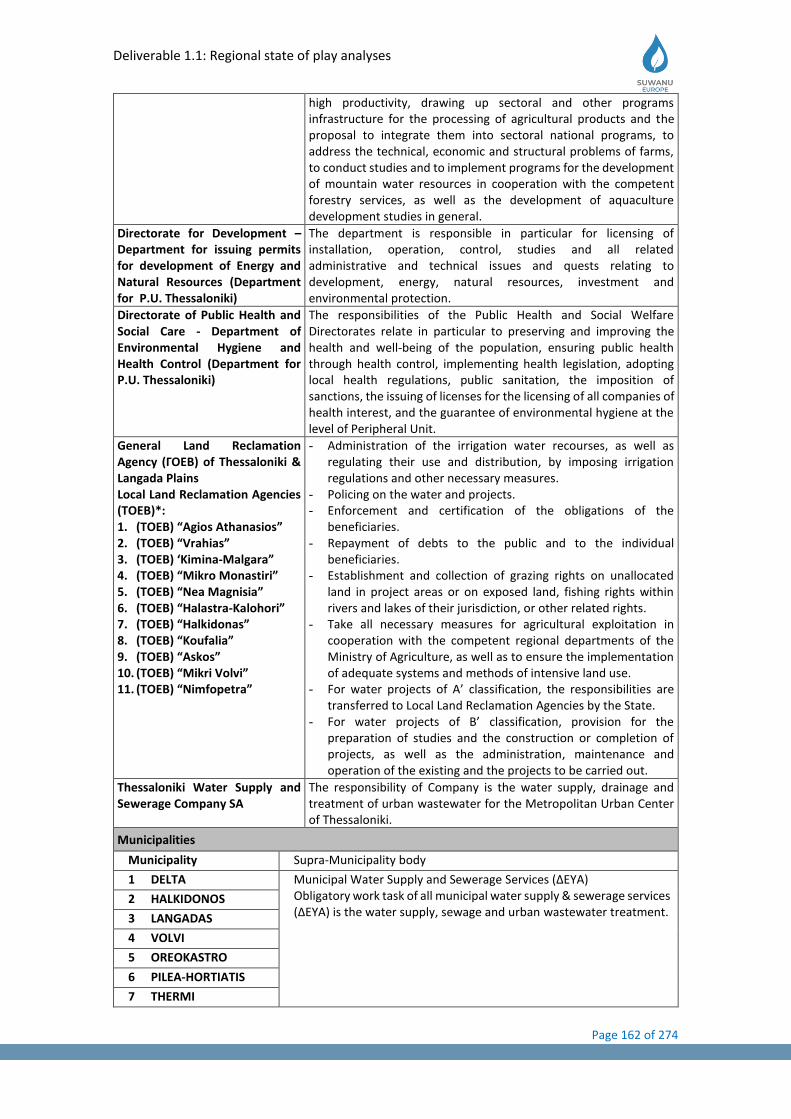
Deliverable 1.1: Regional state of play analyses
Page 162 of 274
high productivity, drawing up sectoral and other programs infrastructure for the processing of agricultural products and the proposal to integrate them into sectoral national programs, to address the technical, economic and structural problems of farms, to conduct studies and to implement programs for the development of mountain water resources in cooperation with the competent forestry services, as well as the development of aquaculture development studies in general.
Directorate for Development – Department for issuing permits for development of Energy and Natural Resources (Department for P.U. Thessaloniki)
The department is responsible in particular for licensing of installation, operation, control, studies and all related administrative and technical issues and quests relating to development, energy, natural resources, investment and environmental protection.
Directorate of Public Health and Social Care - Department of Environmental Hygiene and Health Control (Department for P.U. Thessaloniki)
The responsibilities of the Public Health and Social Welfare Directorates relate in particular to preserving and improving the health and well-being of the population, ensuring public health through health control, implementing health legislation, adopting local health regulations, public sanitation, the imposition of sanctions, the issuing of licenses for the licensing of all companies of health interest, and the guarantee of environmental hygiene at the level of Peripheral Unit.
General Land Reclamation Agency (ΓΟΕΒ) of Thessaloniki & Langada Plains Local Land Reclamation Agencies (ΤΟΕΒ)*: 1. (ΤΟΕΒ) “Agios Athanasios” 2. (ΤΟΕΒ) “Vrahias” 3. (ΤΟΕΒ) ‘Kimina-Malgara” 4. (ΤΟΕΒ) “Mikro Monastiri” 5. (ΤΟΕΒ) “Nea Magnisia” 6. (ΤΟΕΒ) “Halastra-Kalohori” 7. (ΤΟΕΒ) “Halkidonas” 8. (ΤΟΕΒ) “Koufalia” 9. (ΤΟΕΒ) “Askos” 10. (ΤΟΕΒ) “Mikri Volvi” 11. (ΤΟΕΒ) “Nimfopetra”
- Administration of the irrigation water recourses, as well as regulating their use and distribution, by imposing irrigation regulations and other necessary measures.
- Policing on the water and projects. - Enforcement and certification of the obligations of the
beneficiaries. - Repayment of debts to the public and to the individual
beneficiaries. - Establishment and collection of grazing rights on unallocated
land in project areas or on exposed land, fishing rights within rivers and lakes of their jurisdiction, or other related rights.
- Take all necessary measures for agricultural exploitation in cooperation with the competent regional departments of the Ministry of Agriculture, as well as to ensure the implementation of adequate systems and methods of intensive land use.
- For water projects of A’ classification, the responsibilities are transferred to Local Land Reclamation Agencies by the State.
- For water projects of B’ classification, provision for the preparation of studies and the construction or completion of projects, as well as the administration, maintenance and operation of the existing and the projects to be carried out.
Thessaloniki Water Supply and Sewerage Company SA
The responsibility of Company is the water supply, drainage and treatment of urban wastewater for the Metropolitan Urban Center of Thessaloniki.
Municipalities
Municipality Supra-Municipality body
1 DELTA Municipal Water Supply and Sewerage Services (ΔΕΥΑ) Obligatory work task of all municipal water supply & sewerage services (ΔΕΥΑ) is the water supply, sewage and urban wastewater treatment.
2 HALKIDONOS
3 LANGADAS
4 VOLVI
5 OREOKASTRO
6 PILEA-HORTIATIS
7 THERMI
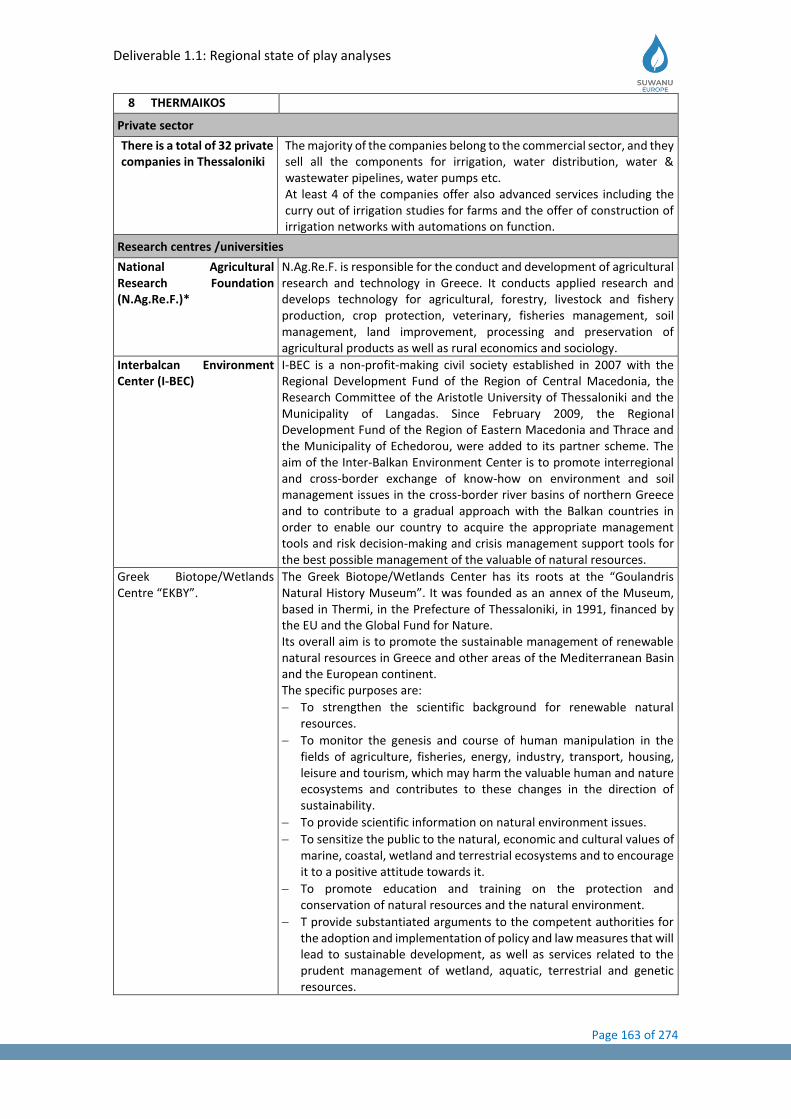
Deliverable 1.1: Regional state of play analyses
Page 163 of 274
8 THERMAIKOS
Private sector
There is a total of 32 private companies in Thessaloniki
The majority of the companies belong to the commercial sector, and they sell all the components for irrigation, water distribution, water & wastewater pipelines, water pumps etc. At least 4 of the companies offer also advanced services including the curry out of irrigation studies for farms and the offer of construction of irrigation networks with automations on function.
Research centres /universities
National Agricultural Research Foundation (N.Ag.Re.F.)*
N.Ag.Re.F. is responsible for the conduct and development of agricultural research and technology in Greece. It conducts applied research and develops technology for agricultural, forestry, livestock and fishery production, crop protection, veterinary, fisheries management, soil management, land improvement, processing and preservation of agricultural products as well as rural economics and sociology.
Interbalcan Environment Center (I-BEC)
I-BEC is a non-profit-making civil society established in 2007 with the Regional Development Fund of the Region of Central Macedonia, the Research Committee of the Aristotle University of Thessaloniki and the Municipality of Langadas. Since February 2009, the Regional Development Fund of the Region of Eastern Macedonia and Thrace and the Municipality of Echedorou, were added to its partner scheme. The aim of the Inter-Balkan Environment Center is to promote interregional and cross-border exchange of know-how on environment and soil management issues in the cross-border river basins of northern Greece and to contribute to a gradual approach with the Balkan countries in order to enable our country to acquire the appropriate management tools and risk decision-making and crisis management support tools for the best possible management of the valuable of natural resources.
Greek Biotope/Wetlands Centre “EKBY”.
The Greek Biotope/Wetlands Center has its roots at the “Goulandris Natural History Museum”. It was founded as an annex of the Museum, based in Thermi, in the Prefecture of Thessaloniki, in 1991, financed by the EU and the Global Fund for Nature. Its overall aim is to promote the sustainable management of renewable natural resources in Greece and other areas of the Mediterranean Basin and the European continent. The specific purposes are:
− To strengthen the scientific background for renewable natural resources.
− To monitor the genesis and course of human manipulation in the fields of agriculture, fisheries, energy, industry, transport, housing, leisure and tourism, which may harm the valuable human and nature ecosystems and contributes to these changes in the direction of sustainability.
− To provide scientific information on natural environment issues.
− To sensitize the public to the natural, economic and cultural values of marine, coastal, wetland and terrestrial ecosystems and to encourage it to a positive attitude towards it.
− To promote education and training on the protection and conservation of natural resources and the natural environment.
− T provide substantiated arguments to the competent authorities for the adoption and implementation of policy and law measures that will lead to sustainable development, as well as services related to the prudent management of wetland, aquatic, terrestrial and genetic resources.
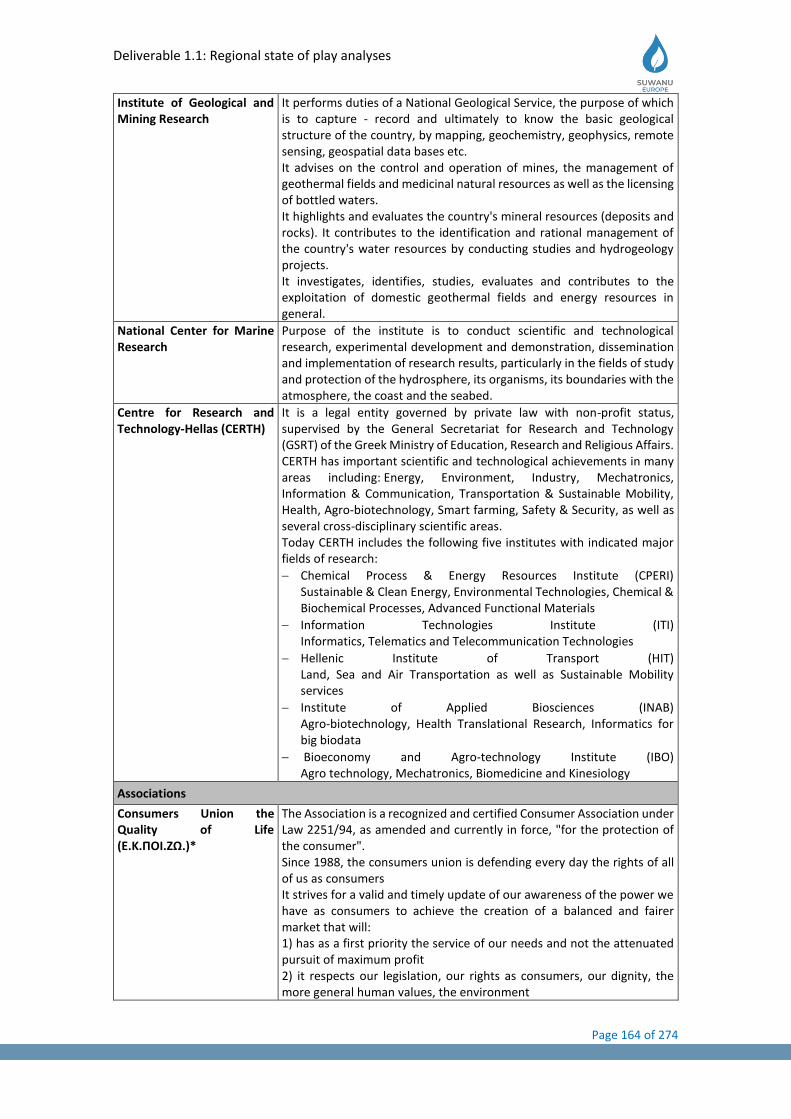
Deliverable 1.1: Regional state of play analyses
Page 164 of 274
Institute of Geological and Mining Research
It performs duties of a National Geological Service, the purpose of which is to capture - record and ultimately to know the basic geological structure of the country, by mapping, geochemistry, geophysics, remote sensing, geospatial data bases etc. It advises on the control and operation of mines, the management of geothermal fields and medicinal natural resources as well as the licensing of bottled waters. It highlights and evaluates the country's mineral resources (deposits and rocks). It contributes to the identification and rational management of the country's water resources by conducting studies and hydrogeology projects. It investigates, identifies, studies, evaluates and contributes to the exploitation of domestic geothermal fields and energy resources in general.
National Center for Marine Research
Purpose of the institute is to conduct scientific and technological research, experimental development and demonstration, dissemination and implementation of research results, particularly in the fields of study and protection of the hydrosphere, its organisms, its boundaries with the atmosphere, the coast and the seabed.
Centre for Research and Technology-Hellas (CERTH)
It is a legal entity governed by private law with non-profit status, supervised by the General Secretariat for Research and Technology (GSRT) of the Greek Ministry of Education, Research and Religious Affairs. CERTH has important scientific and technological achievements in many areas including: Energy, Environment, Industry, Mechatronics, Information & Communication, Transportation & Sustainable Mobility, Health, Agro-biotechnology, Smart farming, Safety & Security, as well as several cross-disciplinary scientific areas. Today CERTH includes the following five institutes with indicated major fields of research:
− Chemical Process & Energy Resources Institute (CPERI) Sustainable & Clean Energy, Environmental Technologies, Chemical & Biochemical Processes, Advanced Functional Materials
− Information Technologies Institute (ITI) Informatics, Telematics and Telecommunication Technologies
− Hellenic Institute of Transport (HIT) Land, Sea and Air Transportation as well as Sustainable Mobility services
− Institute of Applied Biosciences (INAB) Agro-biotechnology, Health Translational Research, Informatics for big biodata
− Bioeconomy and Agro-technology Institute (IBO) Agro technology, Mechatronics, Biomedicine and Kinesiology
Associations
Consumers Union the Quality of Life (Ε.Κ.ΠΟΙ.ΖΩ.)*
The Association is a recognized and certified Consumer Association under Law 2251/94, as amended and currently in force, "for the protection of the consumer". Since 1988, the consumers union is defending every day the rights of all of us as consumers It strives for a valid and timely update of our awareness of the power we have as consumers to achieve the creation of a balanced and fairer market that will: 1) has as a first priority the service of our needs and not the attenuated pursuit of maximum profit 2) it respects our legislation, our rights as consumers, our dignity, the more general human values, the environment
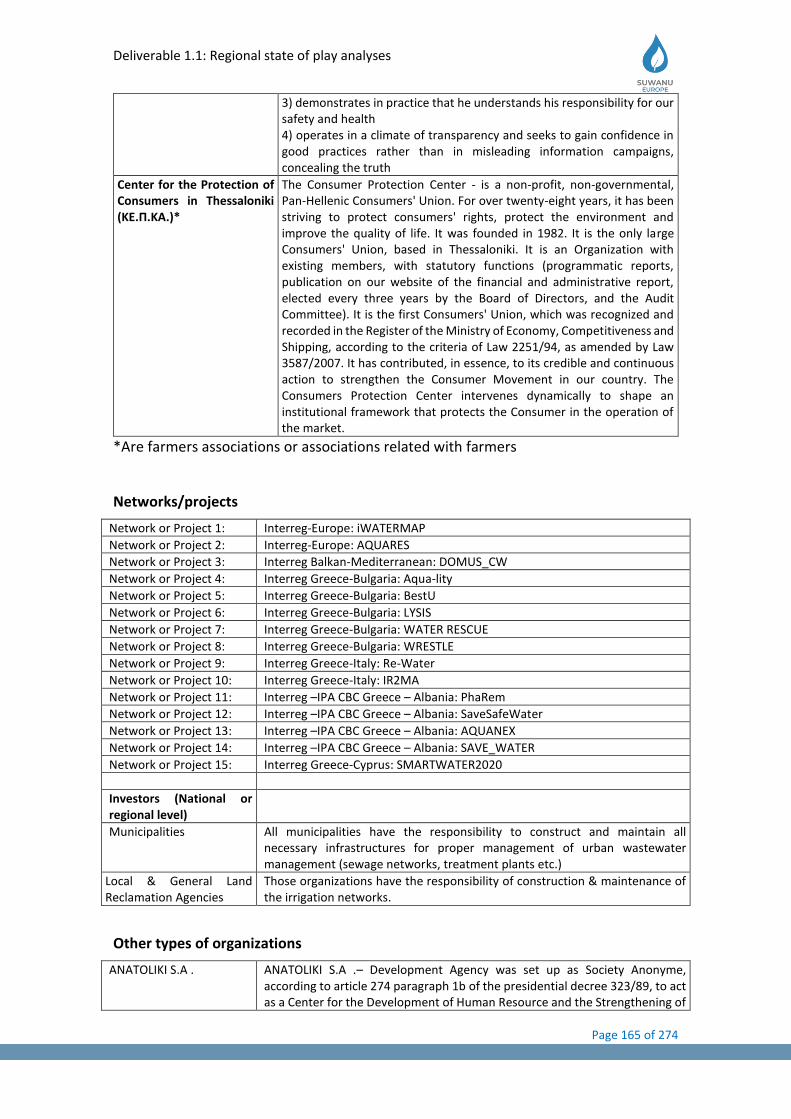
Deliverable 1.1: Regional state of play analyses
Page 165 of 274
3) demonstrates in practice that he understands his responsibility for our safety and health 4) operates in a climate of transparency and seeks to gain confidence in good practices rather than in misleading information campaigns, concealing the truth
Center for the Protection of Consumers in Thessaloniki (ΚΕ.Π.ΚΑ.)*
The Consumer Protection Center - is a non-profit, non-governmental, Pan-Hellenic Consumers' Union. For over twenty-eight years, it has been striving to protect consumers' rights, protect the environment and improve the quality of life. It was founded in 1982. It is the only large Consumers' Union, based in Thessaloniki. It is an Organization with existing members, with statutory functions (programmatic reports, publication on our website of the financial and administrative report, elected every three years by the Board of Directors, and the Audit Committee). It is the first Consumers' Union, which was recognized and recorded in the Register of the Ministry of Economy, Competitiveness and Shipping, according to the criteria of Law 2251/94, as amended by Law 3587/2007. It has contributed, in essence, to its credible and continuous action to strengthen the Consumer Movement in our country. The Consumers Protection Center intervenes dynamically to shape an institutional framework that protects the Consumer in the operation of the market.
*Are farmers associations or associations related with farmers
Networks/projects
Network or Project 1: Interreg-Europe: iWATERMAP
Network or Project 2: Interreg-Europe: AQUARES
Network or Project 3: Interreg Balkan-Mediterranean: DOMUS_CW
Network or Project 4: Interreg Greece-Bulgaria: Aqua-lity
Network or Project 5: Interreg Greece-Bulgaria: BestU
Network or Project 6: Interreg Greece-Bulgaria: LYSIS
Network or Project 7: Interreg Greece-Bulgaria: WATER RESCUE
Network or Project 8: Interreg Greece-Bulgaria: WRESTLE
Network or Project 9: Interreg Greece-Italy: Re-Water
Network or Project 10: Interreg Greece-Italy: IR2MA
Network or Project 11: Interreg –IPA CBC Greece – Albania: PhaRem
Network or Project 12: Interreg –IPA CBC Greece – Albania: SaveSafeWater
Network or Project 13: Interreg –IPA CBC Greece – Albania: AQUANEX
Network or Project 14: Interreg –IPA CBC Greece – Albania: SAVE_WATER
Network or Project 15: Interreg Greece-Cyprus: SMARTWATER2020
Investors (National or regional level)
Municipalities All municipalities have the responsibility to construct and maintain all necessary infrastructures for proper management of urban wastewater management (sewage networks, treatment plants etc.)
Local & General Land Reclamation Agencies
Those organizations have the responsibility of construction & maintenance of the irrigation networks.
Other types of organizations
ANATOLIKI S.A . ANATOLIKI S.A .– Development Agency was set up as Society Anonyme, according to article 274 paragraph 1b of the presidential decree 323/89, to act as a Center for the Development of Human Resource and the Strengthening of
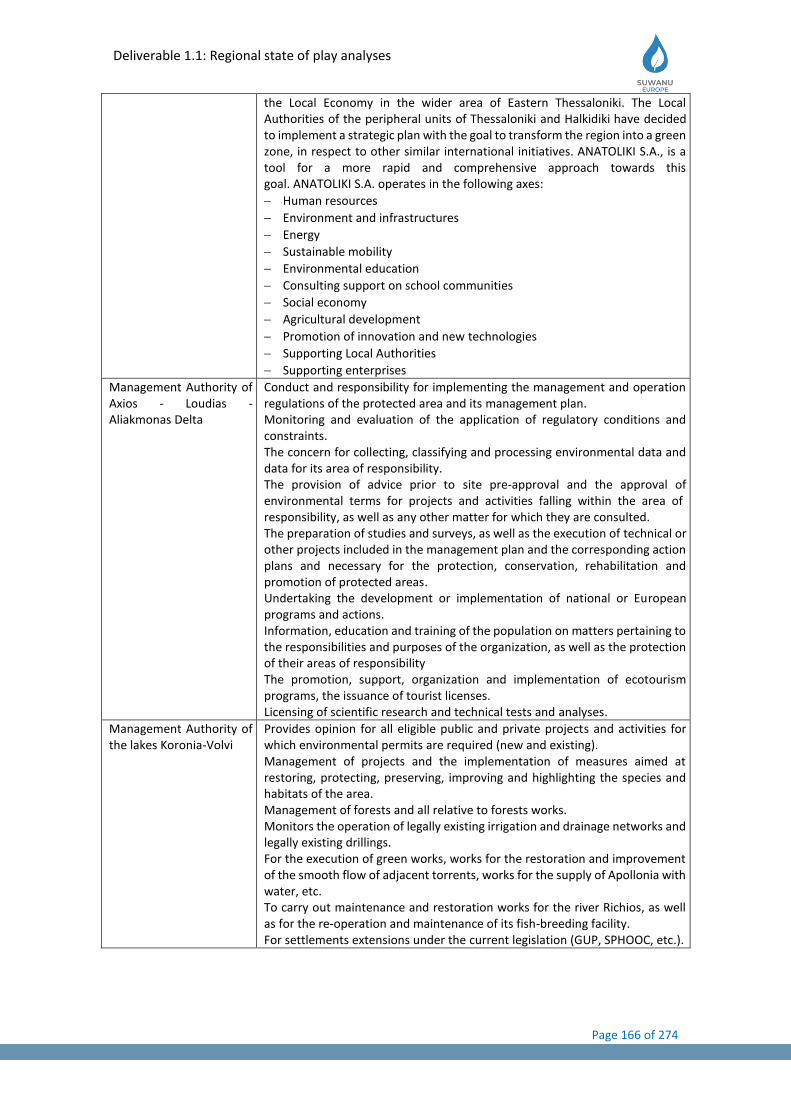
Deliverable 1.1: Regional state of play analyses
Page 166 of 274
the Local Economy in the wider area of Eastern Thessaloniki. The Local Authorities of the peripheral units of Thessaloniki and Halkidiki have decided to implement a strategic plan with the goal to transform the region into a green zone, in respect to other similar international initiatives. ANATOLIKI S.A., is a tool for a more rapid and comprehensive approach towards this goal. ANATOLIKI S.A. operates in the following axes:
− Human resources
− Environment and infrastructures
− Energy
− Sustainable mobility
− Environmental education
− Consulting support on school communities
− Social economy
− Agricultural development
− Promotion of innovation and new technologies
− Supporting Local Authorities
− Supporting enterprises
Management Authority of Axios - Loudias - Aliakmonas Delta
Conduct and responsibility for implementing the management and operation regulations of the protected area and its management plan. Monitoring and evaluation of the application of regulatory conditions and constraints. The concern for collecting, classifying and processing environmental data and data for its area of responsibility. The provision of advice prior to site pre-approval and the approval of environmental terms for projects and activities falling within the area of responsibility, as well as any other matter for which they are consulted. The preparation of studies and surveys, as well as the execution of technical or other projects included in the management plan and the corresponding action plans and necessary for the protection, conservation, rehabilitation and promotion of protected areas. Undertaking the development or implementation of national or European programs and actions. Information, education and training of the population on matters pertaining to the responsibilities and purposes of the organization, as well as the protection of their areas of responsibility The promotion, support, organization and implementation of ecotourism programs, the issuance of tourist licenses. Licensing of scientific research and technical tests and analyses.
Management Authority of the lakes Koronia-Volvi
Provides opinion for all eligible public and private projects and activities for which environmental permits are required (new and existing). Management of projects and the implementation of measures aimed at restoring, protecting, preserving, improving and highlighting the species and habitats of the area. Management of forests and all relative to forests works. Monitors the operation of legally existing irrigation and drainage networks and legally existing drillings. For the execution of green works, works for the restoration and improvement of the smooth flow of adjacent torrents, works for the supply of Apollonia with water, etc. To carry out maintenance and restoration works for the river Richios, as well as for the re-operation and maintenance of its fish-breeding facility. For settlements extensions under the current legislation (GUP, SPHOOC, etc.).
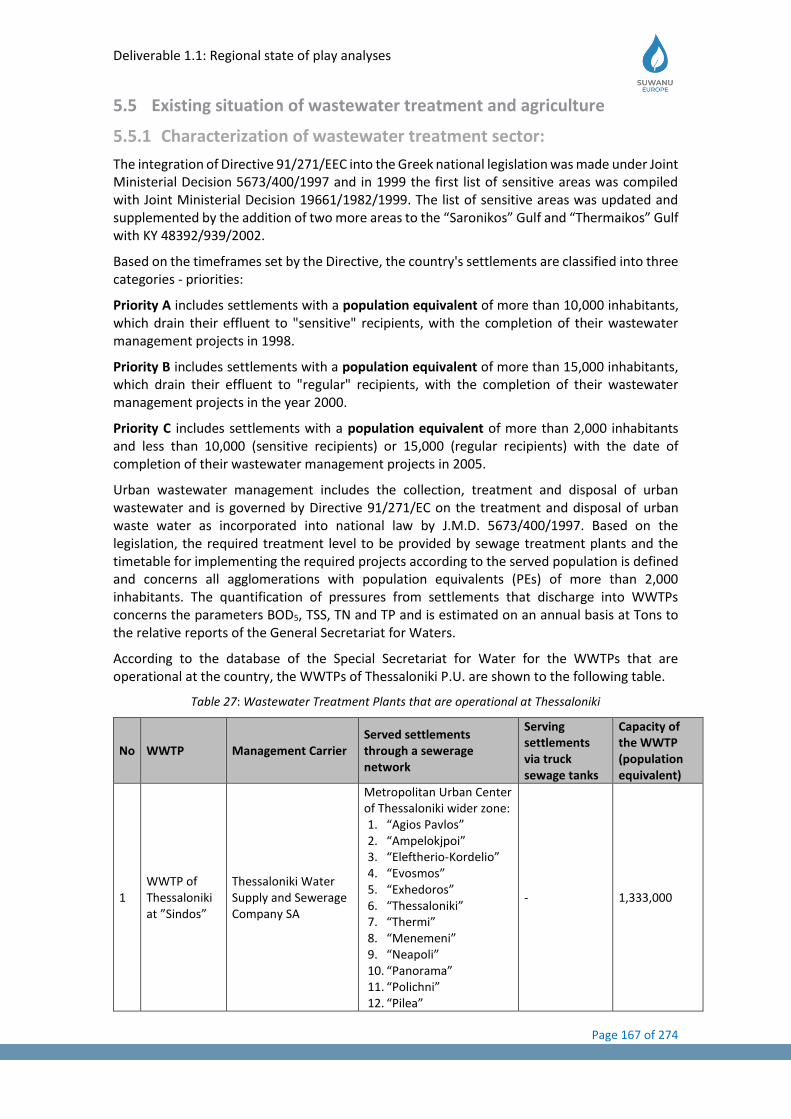
Deliverable 1.1: Regional state of play analyses
Page 167 of 274
5.5 Existing situation of wastewater treatment and agriculture
5.5.1 Characterization of wastewater treatment sector:
The integration of Directive 91/271/EEC into the Greek national legislation was made under Joint Ministerial Decision 5673/400/1997 and in 1999 the first list of sensitive areas was compiled with Joint Ministerial Decision 19661/1982/1999. The list of sensitive areas was updated and supplemented by the addition of two more areas to the “Saronikos” Gulf and “Thermaikos” Gulf with KY 48392/939/2002.
Based on the timeframes set by the Directive, the country's settlements are classified into three categories - priorities:
Priority A includes settlements with a population equivalent of more than 10,000 inhabitants, which drain their effluent to "sensitive" recipients, with the completion of their wastewater management projects in 1998.
Priority B includes settlements with a population equivalent of more than 15,000 inhabitants, which drain their effluent to "regular" recipients, with the completion of their wastewater management projects in the year 2000.
Priority C includes settlements with a population equivalent of more than 2,000 inhabitants and less than 10,000 (sensitive recipients) or 15,000 (regular recipients) with the date of completion of their wastewater management projects in 2005.
Urban wastewater management includes the collection, treatment and disposal of urban wastewater and is governed by Directive 91/271/EC on the treatment and disposal of urban waste water as incorporated into national law by J.M.D. 5673/400/1997. Based on the legislation, the required treatment level to be provided by sewage treatment plants and the timetable for implementing the required projects according to the served population is defined and concerns all agglomerations with population equivalents (PEs) of more than 2,000 inhabitants. The quantification of pressures from settlements that discharge into WWTPs concerns the parameters BOD5, TSS, TN and TP and is estimated on an annual basis at Tons to the relative reports of the General Secretariat for Waters.
According to the database of the Special Secretariat for Water for the WWTPs that are operational at the country, the WWTPs of Thessaloniki P.U. are shown to the following table.
Table 27: Wastewater Treatment Plants that are operational at Thessaloniki
No WWTP Management Carrier Served settlements through a sewerage network
Serving settlements via truck sewage tanks
Capacity of the WWTP (population equivalent)
1 WWTP of Thessaloniki at ”Sindos”
Thessaloniki Water Supply and Sewerage Company SA
Metropolitan Urban Center of Thessaloniki wider zone: 1. “Agios Pavlos” 2. “Ampelokjpoi” 3. “Eleftherio-Kordelio” 4. “Evosmos” 5. “Exhedoros” 6. “Thessaloniki” 7. “Thermi” 8. “Menemeni” 9. “Neapoli” 10. “Panorama” 11. “Polichni” 12. “Pilea”
- 1,333,000
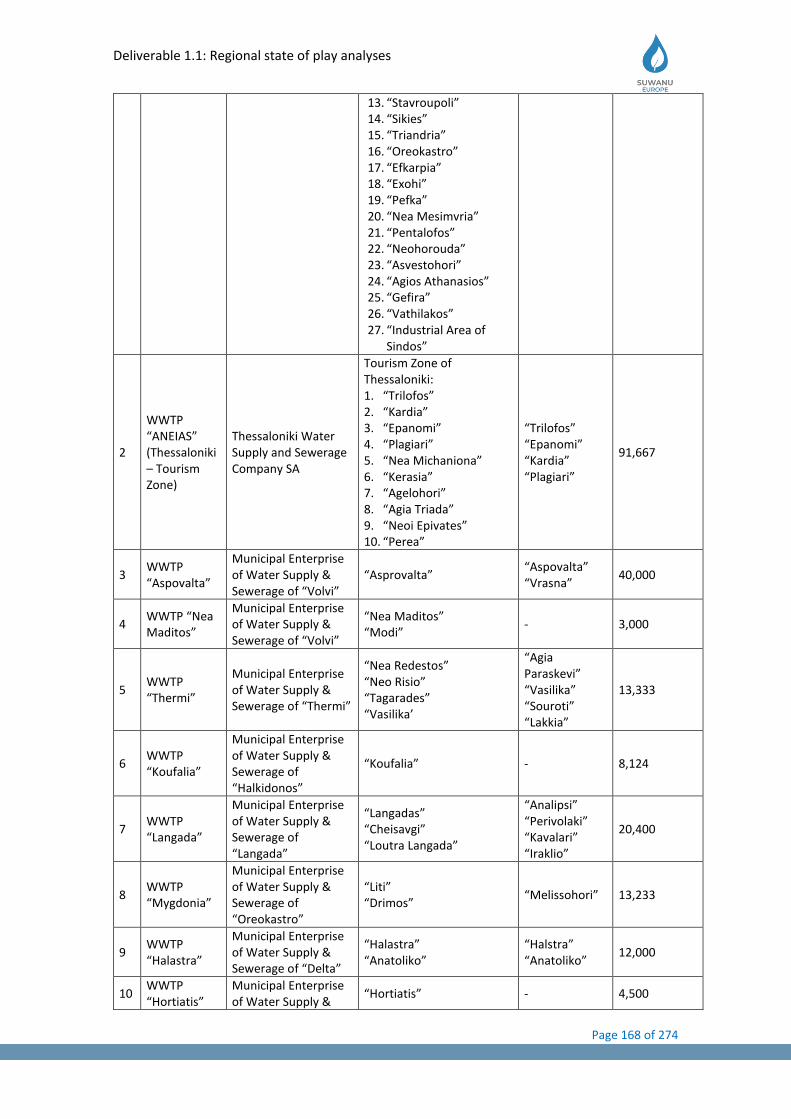
Deliverable 1.1: Regional state of play analyses
Page 168 of 274
13. “Stavroupoli” 14. “Sikies” 15. “Triandria” 16. “Oreokastro” 17. “Efkarpia” 18. “Exohi” 19. “Pefka” 20. “Nea Mesimvria” 21. “Pentalofos” 22. “Neohorouda” 23. “Asvestohori” 24. “Agios Athanasios” 25. “Gefira” 26. “Vathilakos” 27. “Industrial Area of
Sindos”
2
WWTP “ANEIAS” (Thessaloniki – Tourism Zone)
Thessaloniki Water Supply and Sewerage Company SA
Tourism Zone of Thessaloniki: 1. “Trilofos” 2. “Kardia” 3. “Epanomi” 4. “Plagiari” 5. “Nea Michaniona” 6. “Kerasia” 7. “Agelohori” 8. “Agia Triada” 9. “Neoi Epivates” 10. “Perea”
“Trilofos” “Epanomi” “Kardia” “Plagiari”
91,667
3 WWTP “Aspovalta”
Municipal Enterprise of Water Supply & Sewerage of “Volvi”
“Asprovalta” “Aspovalta” “Vrasna”
40,000
4 WWTP “Nea Maditos”
Municipal Enterprise of Water Supply & Sewerage of “Volvi”
“Nea Maditos” “Modi”
- 3,000
5 WWTP “Thermi”
Municipal Enterprise of Water Supply & Sewerage of “Thermi”
“Nea Redestos” “Neo Risio” “Tagarades” “Vasilika’
“Agia Paraskevi” “Vasilika” “Souroti” “Lakkia”
13,333
6 WWTP “Koufalia”
Municipal Enterprise of Water Supply & Sewerage of “Halkidonos”
“Koufalia” - 8,124
7 WWTP “Langada”
Municipal Enterprise of Water Supply & Sewerage of “Langada”
“Langadas” “Cheisavgi” “Loutra Langada”
“Analipsi” “Perivolaki” “Kavalari” “Iraklio”
20,400
8 WWTP “Mygdonia”
Municipal Enterprise of Water Supply & Sewerage of “Oreokastro”
“Liti” “Drimos”
“Melissohori” 13,233
9 WWTP “Halastra”
Municipal Enterprise of Water Supply & Sewerage of “Delta”
“Halastra” “Anatoliko”
“Halstra” “Anatoliko”
12,000
10 WWTP “Hortiatis”
Municipal Enterprise of Water Supply &
“Hortiatis” - 4,500

Deliverable 1.1: Regional state of play analyses
Page 169 of 274
Sewerage of “Pilea – Hortiatis”
11 WWTP “Xiloupoli”
Municipal Enterprise of Water Supply & Sewerage of “Langada”
“Xiloupoli” “Lahanas”
- 2,000
12 WWTP “Polidendri”
Municipal Enterprise of Water Supply & Sewerage of “Langada”
“Polidendri” “Vertiskos”
- 600
Most of the WWTPs of Thessaloniki P.U. have the capability to receive wastewater via truck sewerage tanks for servicing settlements that luck sewerage networks. With regard to the degree of treatment, almost all plants have secondary treatment and in most cases nitrogen removal and disinfection.
Regarding to the sensitive areas in the Water District 10, the first list of sensitive recipients, finalized by the J.M.D. 19661/1982/1999, was prepared in 1999 on the basis of J.M.D. 5673/400/1997. The list of sensitive areas was updated and supplemented with J.M.D. 48392/939/2002 with the addition of two more areas in the “Saronikos” and “Thermaikos” Gulf. The following have been set up as sensitive recipients in the Water District 10:
The settlements that have isolated sewerage networks and do not have wastewater treatment facilities in Thessaloniki province are displayed to the following table. It must be noted that they all fall under Priority C of the classification made by the J.M.D. 5673/400/1997.
Table 28: Settlements of Thessaloniki P.U. without WWTP
No Settlement Priority according to J.M.D. 5673/400/1997
1. “Adendro” C
2. “Anatoliko” C
3. “Assiros” C
4. “Vasilika” C
5. “Zagliveri” C
6. “Kimina” C
7. “Lagina” C
8. “Nea Malgara” C
9. “Sohos” C
10. “Trilofos” C
11. “Halkidona” C
Table 29: Sensitive recipients at Water District 10, according legislation in force
Sensitive Recipient Year of Characterization LAKE “VOLVI” 1999
LAKE “LANGADAS” or “KORONIA” 1999
Inlet of Thessaloniki 1999
“VARDAROVASIS” (Axios River Tributary) (Were the WWTP of “Koufalia” discharges)
1999
THERMAIKOS GULF (Were the WTTP “Sindos” of Thessaloniki discharges) 2002
The WTTPs of “Langadas”, “Mygdonia”, “Polydendri” & “Xiloupoli” discharge at streams that end up to Lake “Koronia”.
The WTTP of “Nea Maditos” discharge at stream that end up at Lake “Volvi”
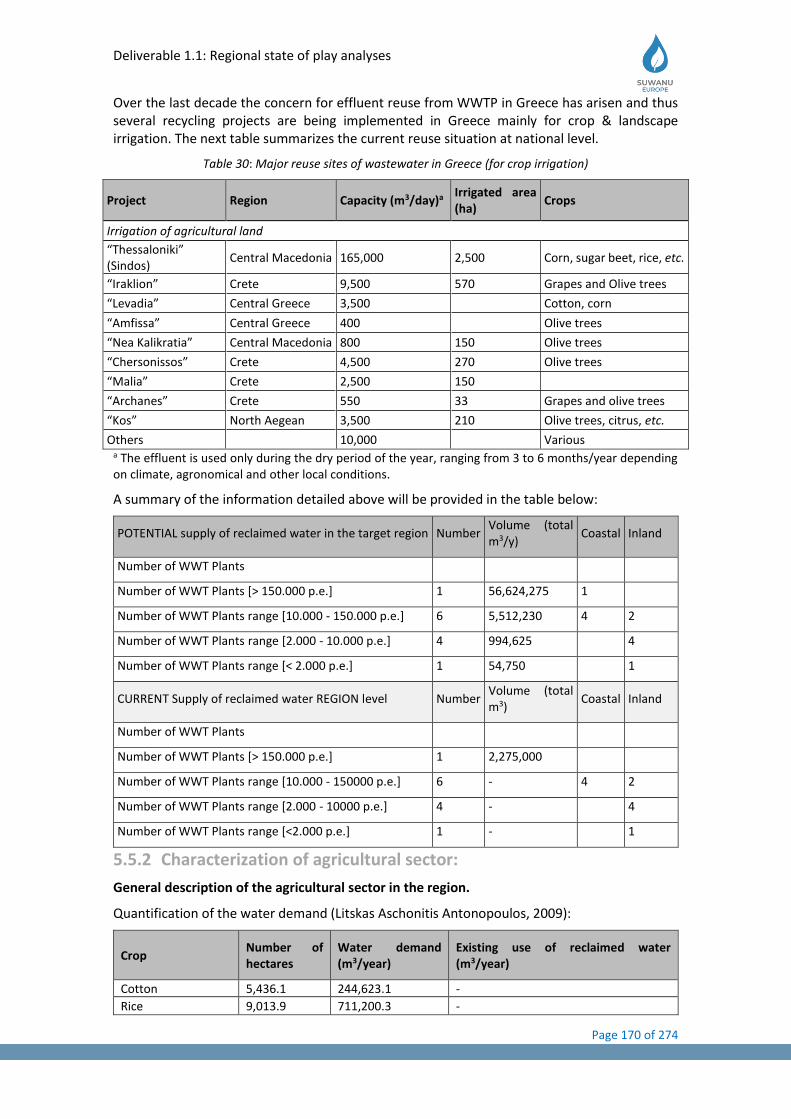
Deliverable 1.1: Regional state of play analyses
Page 170 of 274
Over the last decade the concern for effluent reuse from WWTP in Greece has arisen and thus several recycling projects are being implemented in Greece mainly for crop & landscape irrigation. The next table summarizes the current reuse situation at national level.
Table 30: Major reuse sites of wastewater in Greece (for crop irrigation)
Project Region Capacity (m3/day)a Irrigated area (ha)
Crops
Irrigation of agricultural land
“Thessaloniki” (Sindos)
Central Macedonia 165,000 2,500 Corn, sugar beet, rice, etc.
“Iraklion” Crete 9,500 570 Grapes and Olive trees
“Levadia” Central Greece 3,500 Cotton, corn
“Amfissa” Central Greece 400 Olive trees
“Nea Kalikratia” Central Macedonia 800 150 Olive trees
“Chersonissos” Crete 4,500 270 Olive trees
“Malia” Crete 2,500 150
“Archanes” Crete 550 33 Grapes and olive trees
“Kos” North Aegean 3,500 210 Olive trees, citrus, etc.
Others 10,000 Various a The effluent is used only during the dry period of the year, ranging from 3 to 6 months/year depending on climate, agronomical and other local conditions.
A summary of the information detailed above will be provided in the table below:
POTENTIAL supply of reclaimed water in the target region Number Volume (total m3/y)
Coastal Inland
Number of WWT Plants
Number of WWT Plants [> 150.000 p.e.] 1 56,624,275 1
Number of WWT Plants range [10.000 - 150.000 p.e.] 6 5,512,230 4 2
Number of WWT Plants range [2.000 - 10.000 p.e.] 4 994,625
4
Number of WWT Plants range [< 2.000 p.e.] 1 54,750
1
CURRENT Supply of reclaimed water REGION level Number Volume (total m3)
Coastal Inland
Number of WWT Plants
Number of WWT Plants [> 150.000 p.e.] 1 2,275,000
Number of WWT Plants range [10.000 - 150000 p.e.] 6 - 4 2
Number of WWT Plants range [2.000 - 10000 p.e.] 4 -
4
Number of WWT Plants range [<2.000 p.e.] 1 -
1
5.5.2 Characterization of agricultural sector:
General description of the agricultural sector in the region.
Quantification of the water demand (Litskas Aschonitis Antonopoulos, 2009):
Crop Number of hectares
Water demand (m3/year)
Existing use of reclaimed water (m3/year)
Cotton 5,436.1 244,623.1 -
Rice 9,013.9 711,200.3 -
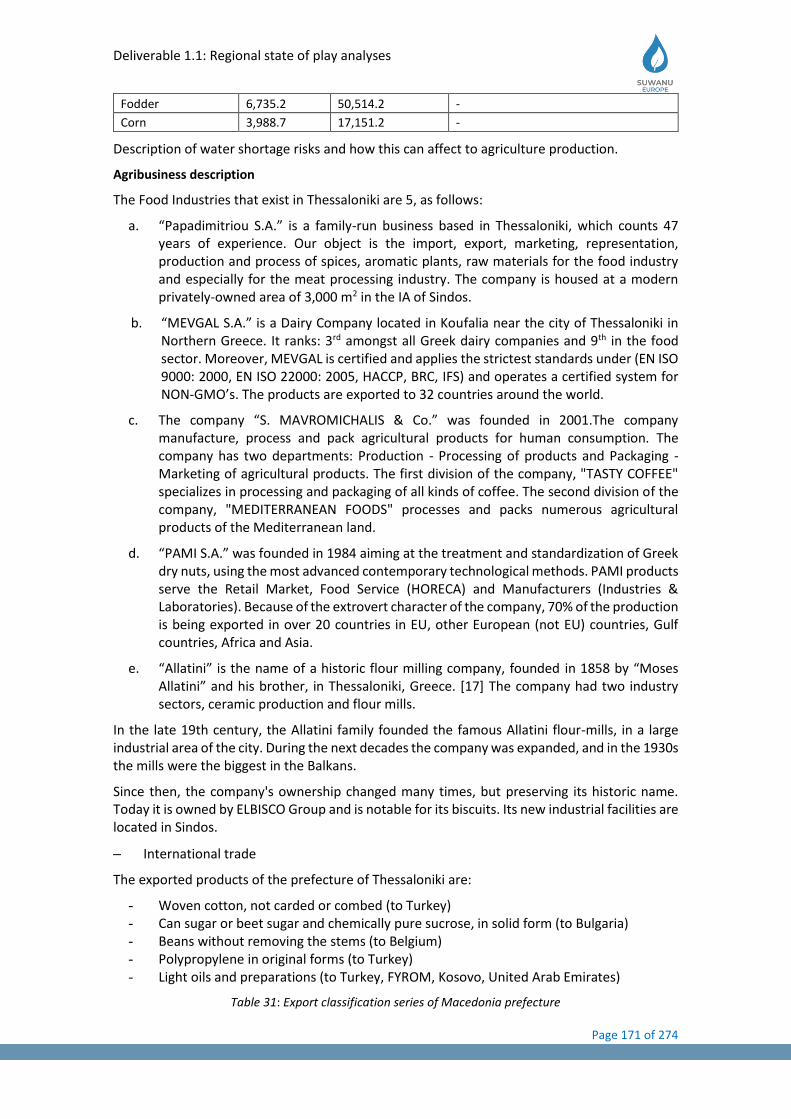
Deliverable 1.1: Regional state of play analyses
Page 171 of 274
Fodder 6,735.2 50,514.2 -
Corn 3,988.7 17,151.2 -
Description of water shortage risks and how this can affect to agriculture production.
Agribusiness description
The Food Industries that exist in Thessaloniki are 5, as follows:
a. “Papadimitriou S.A.” is a family-run business based in Thessaloniki, which counts 47 years of experience. Our object is the import, export, marketing, representation, production and process of spices, aromatic plants, raw materials for the food industry and especially for the meat processing industry. The company is housed at a modern privately-owned area of 3,000 m2 in the IA of Sindos.
b. “MEVGAL S.A.” is a Dairy Company located in Koufalia near the city of Thessaloniki in Northern Greece. It ranks: 3rd amongst all Greek dairy companies and 9th in the food sector. Moreover, MEVGAL is certified and applies the strictest standards under (EN ISO 9000: 2000, EN ISO 22000: 2005, HACCP, BRC, IFS) and operates a certified system for NON-GMO’s. The products are exported to 32 countries around the world.
c. The company “S. MAVROMICHALIS & Co.” was founded in 2001.The company manufacture, process and pack agricultural products for human consumption. The company has two departments: Production - Processing of products and Packaging - Marketing of agricultural products. The first division of the company, "TASTY COFFEE" specializes in processing and packaging of all kinds of coffee. The second division of the company, "MEDITERRANEAN FOODS" processes and packs numerous agricultural products of the Mediterranean land.
d. “PAMI S.A.” was founded in 1984 aiming at the treatment and standardization of Greek dry nuts, using the most advanced contemporary technological methods. PAMI products serve the Retail Market, Food Service (HORECA) and Manufacturers (Industries & Laboratories). Because of the extrovert character of the company, 70% of the production is being exported in over 20 countries in EU, other European (not EU) countries, Gulf countries, Africa and Asia.
e. “Allatini” is the name of a historic flour milling company, founded in 1858 by “Moses Allatini” and his brother, in Thessaloniki, Greece. [17] The company had two industry sectors, ceramic production and flour mills.
In the late 19th century, the Allatini family founded the famous Allatini flour-mills, in a large industrial area of the city. During the next decades the company was expanded, and in the 1930s the mills were the biggest in the Balkans.
Since then, the company's ownership changed many times, but preserving its historic name. Today it is owned by ELBISCO Group and is notable for its biscuits. Its new industrial facilities are located in Sindos.
− International trade
The exported products of the prefecture of Thessaloniki are:
- Woven cotton, not carded or combed (to Turkey) - Can sugar or beet sugar and chemically pure sucrose, in solid form (to Bulgaria) - Beans without removing the stems (to Belgium) - Polypropylene in original forms (to Turkey) - Light oils and preparations (to Turkey, FYROM, Kosovo, United Arab Emirates)
Table 31: Export classification series of Macedonia prefecture
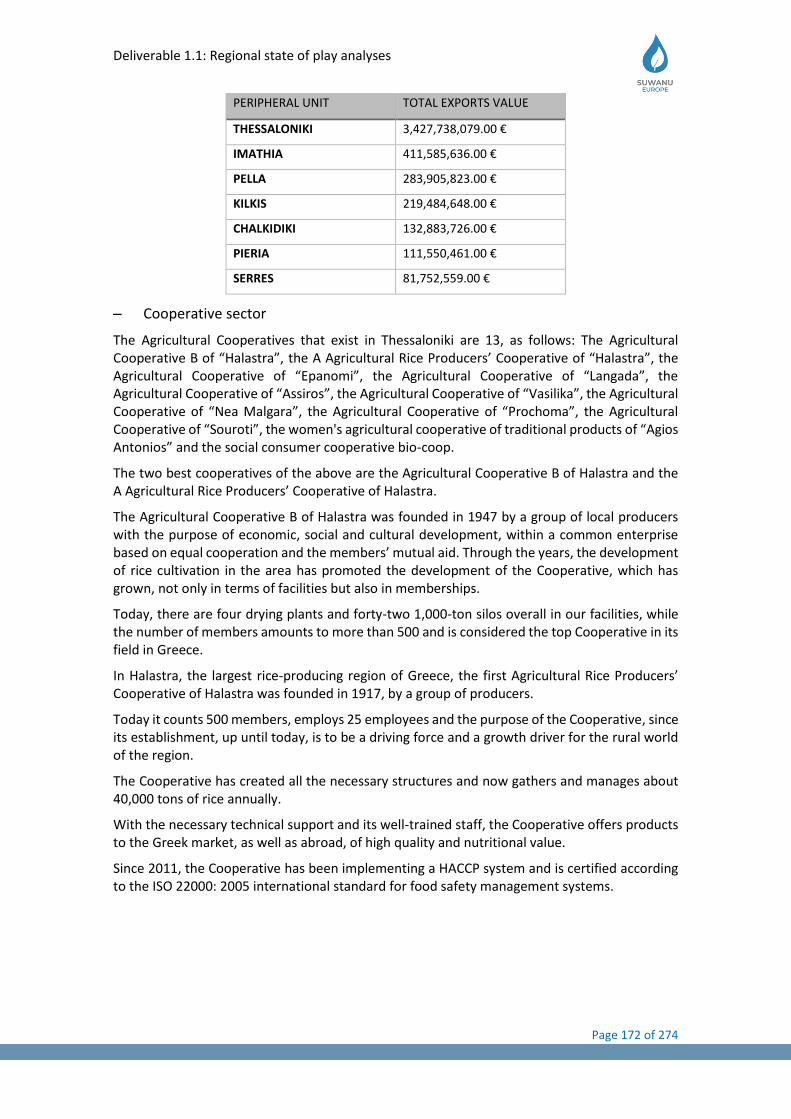
Deliverable 1.1: Regional state of play analyses
Page 172 of 274
PERIPHERAL UNIT TOTAL EXPORTS VALUE
THESSALONIKI 3,427,738,079.00 €
IMATHIA 411,585,636.00 €
PELLA 283,905,823.00 €
KILKIS 219,484,648.00 €
CHALKIDIKI 132,883,726.00 €
PIERIA 111,550,461.00 €
SERRES 81,752,559.00 €
− Cooperative sector
The Agricultural Cooperatives that exist in Thessaloniki are 13, as follows: The Agricultural Cooperative B of “Halastra”, the Α Agricultural Rice Producers’ Cooperative of “Halastra”, the Agricultural Cooperative of “Epanomi”, the Agricultural Cooperative of “Langada”, the Agricultural Cooperative of “Assiros”, the Agricultural Cooperative of “Vasilika”, the Agricultural Cooperative of “Nea Malgara”, the Agricultural Cooperative of “Prochoma”, the Agricultural Cooperative of “Souroti”, the women's agricultural cooperative of traditional products of “Agios Antonios” and the social consumer cooperative bio-coop.
The two best cooperatives of the above are the Agricultural Cooperative B of Halastra and the Α Agricultural Rice Producers’ Cooperative of Halastra.
The Agricultural Cooperative B of Halastra was founded in 1947 by a group of local producers with the purpose of economic, social and cultural development, within a common enterprise based on equal cooperation and the members’ mutual aid. Through the years, the development of rice cultivation in the area has promoted the development of the Cooperative, which has grown, not only in terms of facilities but also in memberships.
Today, there are four drying plants and forty-two 1,000-ton silos overall in our facilities, while the number of members amounts to more than 500 and is considered the top Cooperative in its field in Greece.
In Halastra, the largest rice-producing region of Greece, the first Agricultural Rice Producers’ Cooperative of Halastra was founded in 1917, by a group of producers.
Today it counts 500 members, employs 25 employees and the purpose of the Cooperative, since its establishment, up until today, is to be a driving force and a growth driver for the rural world of the region.
The Cooperative has created all the necessary structures and now gathers and manages about 40,000 tons of rice annually.
With the necessary technical support and its well-trained staff, the Cooperative offers products to the Greek market, as well as abroad, of high quality and nutritional value.
Since 2011, the Cooperative has been implementing a HACCP system and is certified according to the ISO 22000: 2005 international standard for food safety management systems.
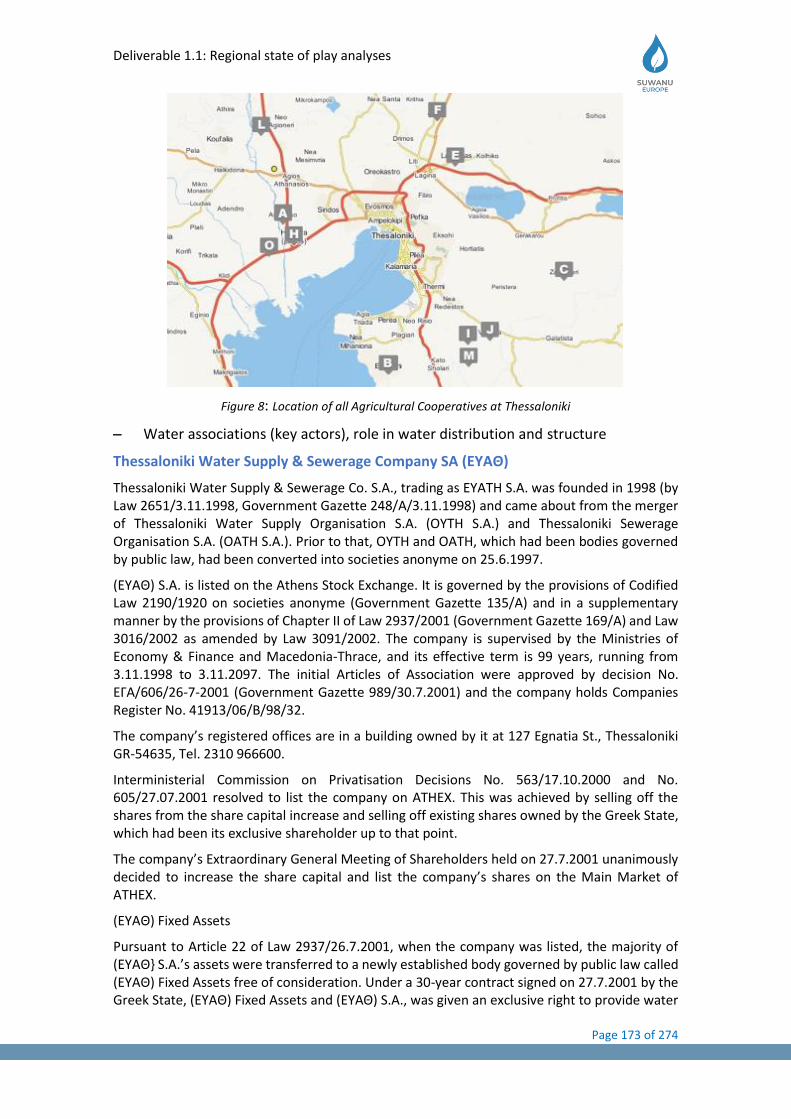
Deliverable 1.1: Regional state of play analyses
Page 173 of 274
Figure 8: Location of all Agricultural Cooperatives at Thessaloniki
− Water associations (key actors), role in water distribution and structure
Thessaloniki Water Supply & Sewerage Company SA (EYAΘ)
Thessaloniki Water Supply & Sewerage Co. S.A., trading as EYATH S.A. was founded in 1998 (by Law 2651/3.11.1998, Government Gazette 248/A/3.11.1998) and came about from the merger of Thessaloniki Water Supply Organisation S.A. (OYTH S.A.) and Thessaloniki Sewerage Organisation S.A. (OATH S.A.). Prior to that, OYTH and OATH, which had been bodies governed by public law, had been converted into societies anonyme on 25.6.1997.
(ΕΥΑΘ) S.A. is listed on the Athens Stock Exchange. It is governed by the provisions of Codified Law 2190/1920 on societies anonyme (Government Gazette 135/A) and in a supplementary manner by the provisions of Chapter II of Law 2937/2001 (Government Gazette 169/A) and Law 3016/2002 as amended by Law 3091/2002. The company is supervised by the Ministries of Economy & Finance and Macedonia-Thrace, and its effective term is 99 years, running from 3.11.1998 to 3.11.2097. The initial Articles of Association were approved by decision No. ΕΓΑ/606/26-7-2001 (Government Gazette 989/30.7.2001) and the company holds Companies Register No. 41913/06/B/98/32.
The company’s registered offices are in a building owned by it at 127 Egnatia St., Thessaloniki GR-54635, Tel. 2310 966600.
Interministerial Commission on Privatisation Decisions No. 563/17.10.2000 and No. 605/27.07.2001 resolved to list the company on ATHEX. This was achieved by selling off the shares from the share capital increase and selling off existing shares owned by the Greek State, which had been its exclusive shareholder up to that point.
The company’s Extraordinary General Meeting of Shareholders held on 27.7.2001 unanimously decided to increase the share capital and list the company’s shares on the Main Market of ATHEX.
(ΕΥΑΘ) Fixed Assets
Pursuant to Article 22 of Law 2937/26.7.2001, when the company was listed, the majority of (ΕΥΑΘ} S.A.’s assets were transferred to a newly established body governed by public law called (ΕΥΑΘ) Fixed Assets free of consideration. Under a 30-year contract signed on 27.7.2001 by the Greek State, (ΕΥΑΘ) Fixed Assets and (ΕΥΑΘ) S.A., was given an exclusive right to provide water

Deliverable 1.1: Regional state of play analyses
Page 174 of 274
supply and sewerage services within its geographical remit. Under that same contract (ΕΥΑΘ) Fixed Assets was obliged to provide (ΕΥΑΘ) S.A. with the necessary quantities of water for a fee to meet its consumers’ needs, and (ΕΥΑΘ) S.A. was obliged to ensure the rational use of the water sold and make concerted efforts to ensure a reduction in leaks and water losses as much as possible by improving and rebuilding the water supply network.
General Organisation for Land Reclamation (ΓΟΕΒ)
The General Organization for Land Reclamation (ΓΟΕΒ) is one of the ten such organisations that have been set up throughout the country, with the largest area of competence, transporting and distributing water from three rivers (Aliakmonas, Axios and Loudias) to irrigate about 100,000.0 ha in PU of Thessaloniki, Imathia, and Pella. It is also responsible for the maintenance and operation of the main drainage ditches and rural roads in another 100,000.0 ha in the P.U. of Thessaloniki, Imathia, Pella and Kilkis.
In addition, through his projects, he transfers the water required for the water supply of the Thessaloniki urban complex to Thessaloniki Water Supply and Sewerage Company (ΕΥΑΘ).
It cooperates with Public Power Corporation (PPC) for the water management it uses to generate electricity in the hydroelectric factories of Aliakmonas dam.
It is the largest user of irrigation water nationwide with its license to 900 hm3 / year, which is distributed as irrigation water to the farms of the KM plain of which the income of about 100,000 rural families depends. It also carries 98 hm3 / year water from Aliakmonas, which after treatment is available for the needs of Thessaloniki.
It contributes to the political protection of the area mainly through its drainage network.
The land reclamation projects that it has to manage and maintain are 2 dams (Axios and Aliakmonas), 320 km of irrigation canals, 385 km drainage ditches, 363 km of rural roads, 1 control centre, 57 irrigation pumping stations, 17 drainage pumping stations, total installed capacity of 35KW. It has a fleet of 16 vehicles, 26 motorcycles and 7 machine tools.
All of the above work brings it to completion with 14 regular employees and annually recruits more than 130 seasonal employees.
− Competitiveness of Agri-business sector
The competitiveness of Greek agricultural products and food through the commercial relations of Greece – Bulgaria
Specifically, Table 1 shows the development of the trade balance of agricultural and food products in Greece in constant currency, namely the euro (€). The analysis of this table shows that over the period 2005-2010 the trade balance between Greece and Bulgaria is predominantly deficit with the exception of the years 2008 and 2010 when it became surplus. However, the fluctuations are particularly sharp.
In 2005-2006, while the deficit showed a drastic reduction of around 66.5% in 2007 it expanded rapidly - specifically it doubled. In 2008, there was a dramatic change in the balance and the transition from deficit to surplus. In 2009 the picture changes again to negative, with a return of balance to deficit at the highest levels throughout the period. In 2010 a new subversion comes in a positive direction for Greece this time, because the difference between imports-exports led to very substantial trade surplus. Not only was the high deficit of 32 million euros in 2009 eliminated but also a surplus of around 27 million euros was achieved.
From the data presented in Table 2, we find that exports of agricultural products develop positively, with the exception of fall in 2009. In 2005-2006 exports were improved by 16.5% and by 33.6% in 2007, while in 2008 they soared with an increase rate of 52.4%. In 2009 exports dropped for the first time by 4.3% and then launched with an impressive increase of 37.7% in
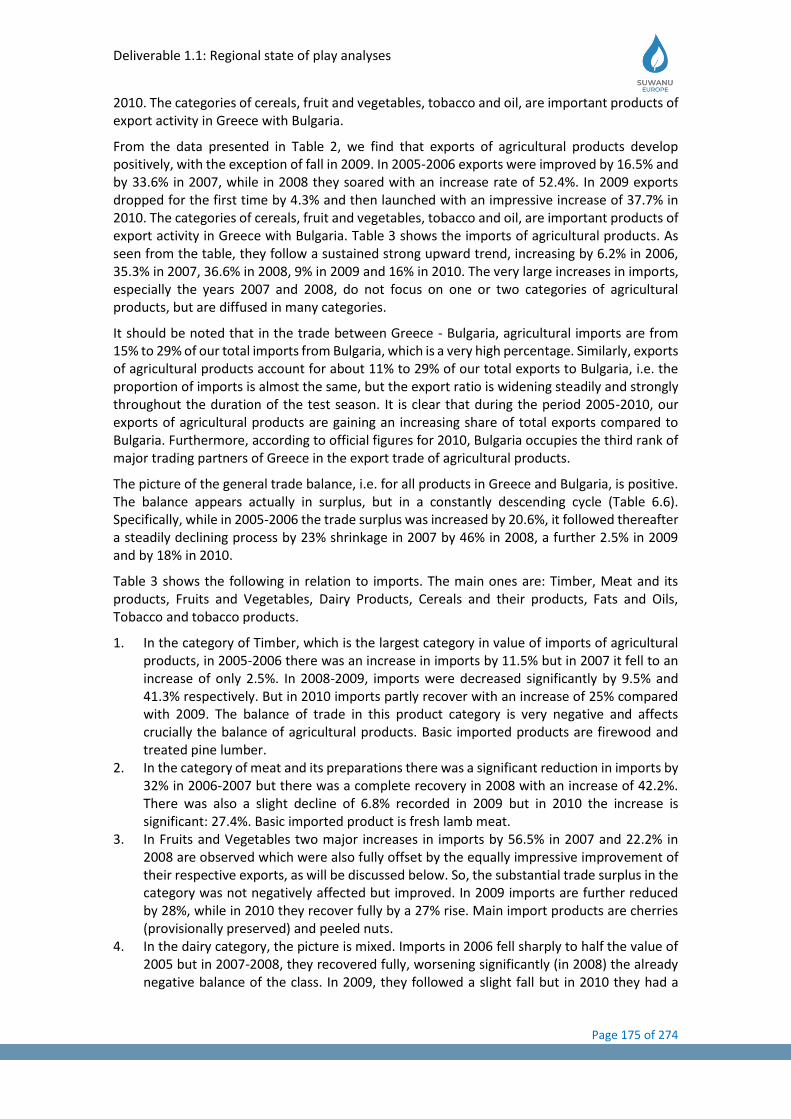
Deliverable 1.1: Regional state of play analyses
Page 175 of 274
2010. The categories of cereals, fruit and vegetables, tobacco and oil, are important products of export activity in Greece with Bulgaria.
From the data presented in Table 2, we find that exports of agricultural products develop positively, with the exception of fall in 2009. In 2005-2006 exports were improved by 16.5% and by 33.6% in 2007, while in 2008 they soared with an increase rate of 52.4%. In 2009 exports dropped for the first time by 4.3% and then launched with an impressive increase of 37.7% in 2010. The categories of cereals, fruit and vegetables, tobacco and oil, are important products of export activity in Greece with Bulgaria. Table 3 shows the imports of agricultural products. As seen from the table, they follow a sustained strong upward trend, increasing by 6.2% in 2006, 35.3% in 2007, 36.6% in 2008, 9% in 2009 and 16% in 2010. The very large increases in imports, especially the years 2007 and 2008, do not focus on one or two categories of agricultural products, but are diffused in many categories.
It should be noted that in the trade between Greece - Bulgaria, agricultural imports are from 15% to 29% of our total imports from Bulgaria, which is a very high percentage. Similarly, exports of agricultural products account for about 11% to 29% of our total exports to Bulgaria, i.e. the proportion of imports is almost the same, but the export ratio is widening steadily and strongly throughout the duration of the test season. It is clear that during the period 2005-2010, our exports of agricultural products are gaining an increasing share of total exports compared to Bulgaria. Furthermore, according to official figures for 2010, Bulgaria occupies the third rank of major trading partners of Greece in the export trade of agricultural products.
The picture of the general trade balance, i.e. for all products in Greece and Bulgaria, is positive. The balance appears actually in surplus, but in a constantly descending cycle (Table 6.6). Specifically, while in 2005-2006 the trade surplus was increased by 20.6%, it followed thereafter a steadily declining process by 23% shrinkage in 2007 by 46% in 2008, a further 2.5% in 2009 and by 18% in 2010.
Table 3 shows the following in relation to imports. The main ones are: Timber, Meat and its products, Fruits and Vegetables, Dairy Products, Cereals and their products, Fats and Oils, Tobacco and tobacco products.
1. In the category of Timber, which is the largest category in value of imports of agricultural products, in 2005-2006 there was an increase in imports by 11.5% but in 2007 it fell to an increase of only 2.5%. In 2008-2009, imports were decreased significantly by 9.5% and 41.3% respectively. But in 2010 imports partly recover with an increase of 25% compared with 2009. The balance of trade in this product category is very negative and affects crucially the balance of agricultural products. Basic imported products are firewood and treated pine lumber.
2. In the category of meat and its preparations there was a significant reduction in imports by 32% in 2006-2007 but there was a complete recovery in 2008 with an increase of 42.2%. There was also a slight decline of 6.8% recorded in 2009 but in 2010 the increase is significant: 27.4%. Basic imported product is fresh lamb meat.
3. In Fruits and Vegetables two major increases in imports by 56.5% in 2007 and 22.2% in 2008 are observed which were also fully offset by the equally impressive improvement of their respective exports, as will be discussed below. So, the substantial trade surplus in the category was not negatively affected but improved. In 2009 imports are further reduced by 28%, while in 2010 they recover fully by a 27% rise. Main import products are cherries (provisionally preserved) and peeled nuts.
4. In the dairy category, the picture is mixed. Imports in 2006 fell sharply to half the value of 2005 but in 2007-2008, they recovered fully, worsening significantly (in 2008) the already negative balance of the class. In 2009, they followed a slight fall but in 2010 they had a

Deliverable 1.1: Regional state of play analyses
Page 176 of 274
small increase. Main imported products were fresh kinds of cheese and other unidentified kinds of cheese and yogurt, flavoured or with added fruit or cocoa.
5. In Cereals and their preparations, imports are increasing every year. Indeed, in 2009 there was a booming of 43%, thus causing a significant widening of the trade deficit in this category since exports remained almost unchanged. In 2010, imports are also growing rapidly by 67.6% compared with 2009. Given that our respective exports appear trapped, the deficit in this category takes off from € 19 million to 49 million €. Thus, Bulgaria is emerging as one of the main suppliers of the Greek market in products in which the production of our country is in deficit. The soft wheat, barley and corn, wheat flour and various bakery products, pastry, cakes, biscuits are the main imported products in the category.
6. In Oils and Fats, the trend is steadily increasing. After 2007 when they tripled in value, they have steadily increased by around € 5 million per year. We mostly import raw sunflower or not and processed corn.
7. Tobacco and its products, following the slump of Greek production, present a steady upward trend in imports at a fast rate. There was an increase of 43% in 2006, a nearly quadrupling in value in 2007, a further increase of 37% in 2008 and a 56.4% surge in 2009. In 2010 this continuous and impressive process is disrupted when they are reduced by 38% compared with 2009. It is noted however that in this category there is a surplus balance in favour of Greece, as will be seen below. From Bulgaria we import tobacco of all types (eastern, Virginia and Burley).
Table 33 shows the following in relation to exports. The main exports are: Fruits and Vegetables, Tobacco, Oils and fats, cereals, meat, dairy and sugar preparations.
1. In Fruits and Vegetables there is an improvement in exports by 30% in 2007 and by 17% in 2008. In 2009 they have recorded a decline of 18.5%. But in 2010 the recovery of our exports has been spectacular by 53.2% increase compared with 2009. Over time, vegetables emerge as the flagship of our agricultural exports to Bulgaria. Main export products are: fresh bananas, chips (crisps), cherries (provisionally preserved), prepared tomatoes, fresh sweet oranges, peaches (including nectarines and brounion), clementines, mandarins and olives prepared. From 2009 onwards, almonds, walnuts and kiwi are also exported.
2. In the category of cereals and their preparations there is a dynamic export growth until 2008. From 2009 onwards, they are de-escalating in a slow pace. Raw rice (milled), corn, wheat flour, various pastas, flour and meal of wheat and soft wheat for sowing are mainly exported.
3. Tobacco and tobacco products exports are also developed with a tremendous pace until 2008 and the years 2009-2010 they are stabilized. Especially in 2007-2008 their rise was by 83%. Raw oriental and other unidentified tobacco and cigarettes are mainly exported.
4. In the category Oils & Fats exports doubled in value in 2007 and in 2008 they further recorded an impressive growth of 79%. But in 2009 they dropped by 34.2%. In 2010, they recover fully and dramatically with an increase of 59%. Main export products are vegetable oils (peanut oil, cottonseed oil, soybean oil, sunflower oil, processed palm oil, and processed soybean oil) and other fats and vegetable oils not specified.
5. In Meat and their preparations there is a steady upward trend in exports until 2008, in 2009 they record a decline by 34.6% while in 2010 they are stabilized at 2009 levels. Meat and by-products from frozen poultry and frozen pork are mainly exported.
6. Dairy products exports in 2007 quadrupled in value compared with 2006. In 2008-2009 they continued to rise with further improvement by 13% and 36% respectively. But in 2010 they recorded a decline of 11%. Basic export products are some kinds of cheese (unidentified), whey and unflavoured yoghurt without added fruit or cocoa. In 2009, the feta cheese is first in rank of exports in the category.
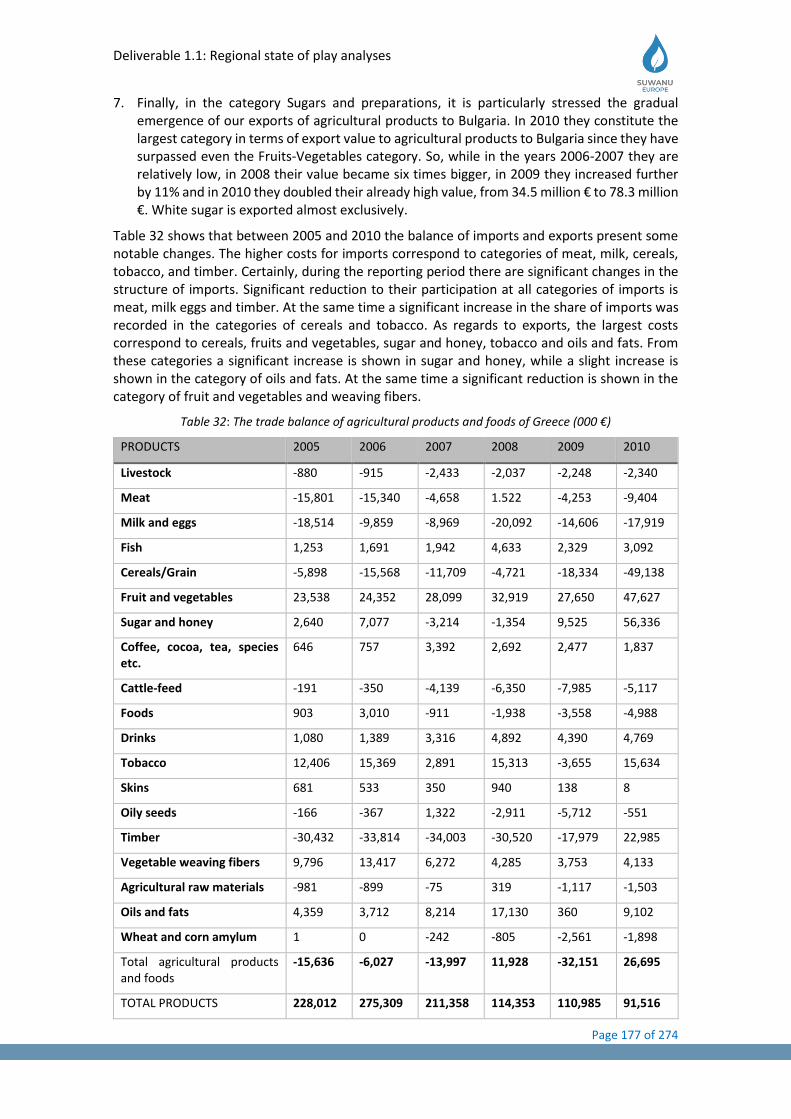
Deliverable 1.1: Regional state of play analyses
Page 177 of 274
7. Finally, in the category Sugars and preparations, it is particularly stressed the gradual emergence of our exports of agricultural products to Bulgaria. In 2010 they constitute the largest category in terms of export value to agricultural products to Bulgaria since they have surpassed even the Fruits-Vegetables category. So, while in the years 2006-2007 they are relatively low, in 2008 their value became six times bigger, in 2009 they increased further by 11% and in 2010 they doubled their already high value, from 34.5 million € to 78.3 million €. White sugar is exported almost exclusively.
Table 32 shows that between 2005 and 2010 the balance of imports and exports present some notable changes. The higher costs for imports correspond to categories of meat, milk, cereals, tobacco, and timber. Certainly, during the reporting period there are significant changes in the structure of imports. Significant reduction to their participation at all categories of imports is meat, milk eggs and timber. At the same time a significant increase in the share of imports was recorded in the categories of cereals and tobacco. As regards to exports, the largest costs correspond to cereals, fruits and vegetables, sugar and honey, tobacco and oils and fats. From these categories a significant increase is shown in sugar and honey, while a slight increase is shown in the category of oils and fats. At the same time a significant reduction is shown in the category of fruit and vegetables and weaving fibers.
Table 32: The trade balance of agricultural products and foods of Greece (000 €)
PRODUCTS 2005 2006 2007 2008 2009 2010
Livestock -880 -915 -2,433 -2,037 -2,248 -2,340
Meat -15,801 -15,340 -4,658 1.522 -4,253 -9,404
Milk and eggs -18,514 -9,859 -8,969 -20,092 -14,606 -17,919
Fish 1,253 1,691 1,942 4,633 2,329 3,092
Cereals/Grain -5,898 -15,568 -11,709 -4,721 -18,334 -49,138
Fruit and vegetables 23,538 24,352 28,099 32,919 27,650 47,627
Sugar and honey 2,640 7,077 -3,214 -1,354 9,525 56,336
Coffee, cocoa, tea, species etc.
646 757 3,392 2,692 2,477 1,837
Cattle-feed -191 -350 -4,139 -6,350 -7,985 -5,117
Foods 903 3,010 -911 -1,938 -3,558 -4,988
Drinks 1,080 1,389 3,316 4,892 4,390 4,769
Tobacco 12,406 15,369 2,891 15,313 -3,655 15,634
Skins 681 533 350 940 138 8
Oily seeds -166 -367 1,322 -2,911 -5,712 -551
Timber -30,432 -33,814 -34,003 -30,520 -17,979 22,985
Vegetable weaving fibers 9,796 13,417 6,272 4,285 3,753 4,133
Agricultural raw materials -981 -899 -75 319 -1,117 -1,503
Oils and fats 4,359 3,712 8,214 17,130 360 9,102
Wheat and corn amylum 1 0 -242 -805 -2,561 -1,898
Total agricultural products and foods
-15,636 -6,027 -13,997 11,928 -32,151 26,695
TOTAL PRODUCTS 228,012 275,309 211,358 114,353 110,985 91,516
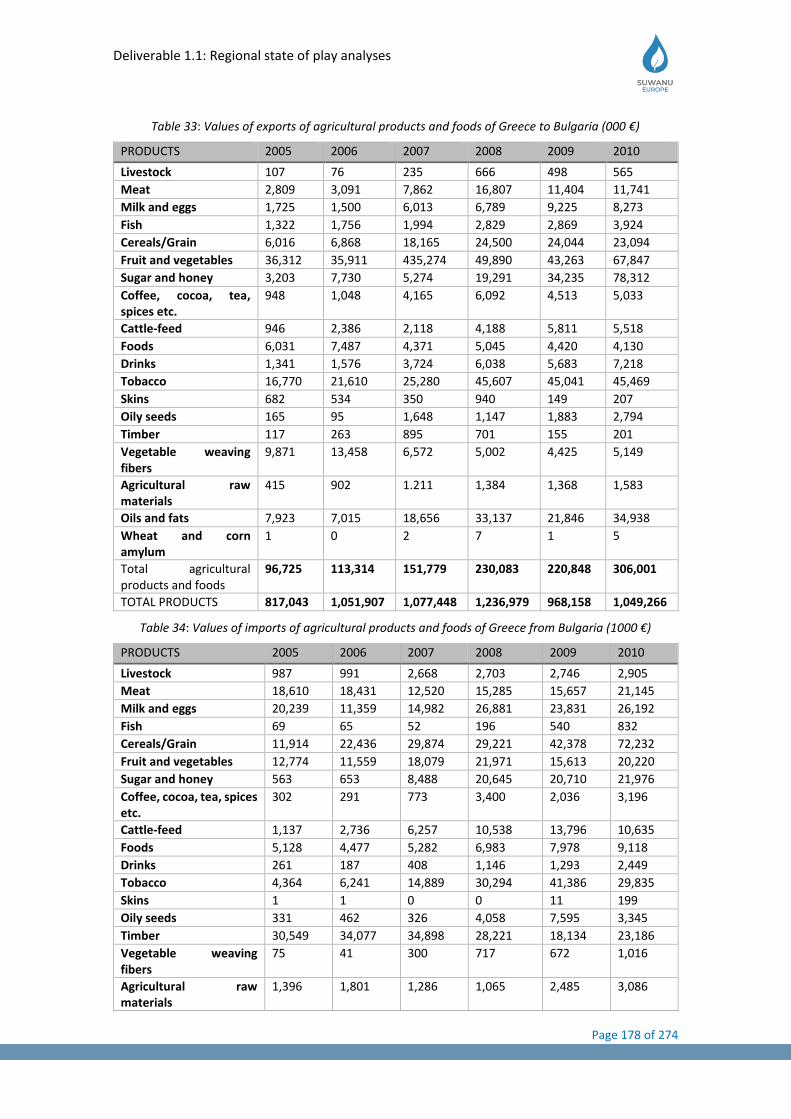
Deliverable 1.1: Regional state of play analyses
Page 178 of 274
Table 33: Values of exports of agricultural products and foods of Greece to Bulgaria (000 €)
PRODUCTS 2005 2006 2007 2008 2009 2010
Livestock 107 76 235 666 498 565
Meat 2,809 3,091 7,862 16,807 11,404 11,741
Milk and eggs 1,725 1,500 6,013 6,789 9,225 8,273
Fish 1,322 1,756 1,994 2,829 2,869 3,924
Cereals/Grain 6,016 6,868 18,165 24,500 24,044 23,094
Fruit and vegetables 36,312 35,911 435,274 49,890 43,263 67,847
Sugar and honey 3,203 7,730 5,274 19,291 34,235 78,312
Coffee, cocoa, tea, spices etc.
948 1,048 4,165 6,092 4,513 5,033
Cattle-feed 946 2,386 2,118 4,188 5,811 5,518
Foods 6,031 7,487 4,371 5,045 4,420 4,130
Drinks 1,341 1,576 3,724 6,038 5,683 7,218
Tobacco 16,770 21,610 25,280 45,607 45,041 45,469
Skins 682 534 350 940 149 207
Oily seeds 165 95 1,648 1,147 1,883 2,794
Timber 117 263 895 701 155 201
Vegetable weaving fibers
9,871 13,458 6,572 5,002 4,425 5,149
Agricultural raw materials
415 902 1.211 1,384 1,368 1,583
Oils and fats 7,923 7,015 18,656 33,137 21,846 34,938
Wheat and corn amylum
1 0 2 7 1 5
Total agricultural products and foods
96,725 113,314 151,779 230,083 220,848 306,001
TOTAL PRODUCTS 817,043 1,051,907 1,077,448 1,236,979 968,158 1,049,266
Table 34: Values of imports of agricultural products and foods of Greece from Bulgaria (1000 €)
PRODUCTS 2005 2006 2007 2008 2009 2010
Livestock 987 991 2,668 2,703 2,746 2,905
Meat 18,610 18,431 12,520 15,285 15,657 21,145
Milk and eggs 20,239 11,359 14,982 26,881 23,831 26,192
Fish 69 65 52 196 540 832
Cereals/Grain 11,914 22,436 29,874 29,221 42,378 72,232
Fruit and vegetables 12,774 11,559 18,079 21,971 15,613 20,220
Sugar and honey 563 653 8,488 20,645 20,710 21,976
Coffee, cocoa, tea, spices etc.
302 291 773 3,400 2,036 3,196
Cattle-feed 1,137 2,736 6,257 10,538 13,796 10,635
Foods 5,128 4,477 5,282 6,983 7,978 9,118
Drinks 261 187 408 1,146 1,293 2,449
Tobacco 4,364 6,241 14,889 30,294 41,386 29,835
Skins 1 1 0 0 11 199
Oily seeds 331 462 326 4,058 7,595 3,345
Timber 30,549 34,077 34,898 28,221 18,134 23,186
Vegetable weaving fibers
75 41 300 717 672 1,016
Agricultural raw materials
1,396 1,801 1,286 1,065 2,485 3,086
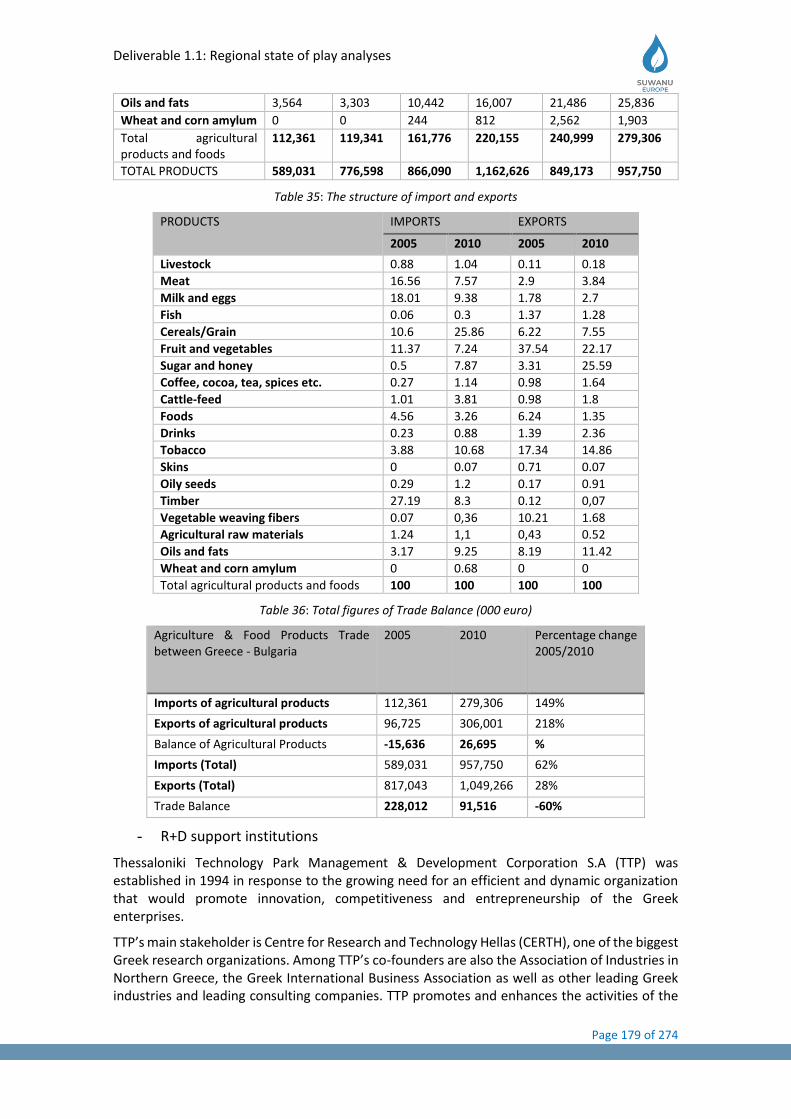
Deliverable 1.1: Regional state of play analyses
Page 179 of 274
Oils and fats 3,564 3,303 10,442 16,007 21,486 25,836
Wheat and corn amylum 0 0 244 812 2,562 1,903
Total agricultural products and foods
112,361 119,341 161,776 220,155 240,999 279,306
TOTAL PRODUCTS 589,031 776,598 866,090 1,162,626 849,173 957,750
Table 35: The structure of import and exports
PRODUCTS IMPORTS EXPORTS
2005 2010 2005 2010
Livestock 0.88 1.04 0.11 0.18
Meat 16.56 7.57 2.9 3.84
Milk and eggs 18.01 9.38 1.78 2.7
Fish 0.06 0.3 1.37 1.28
Cereals/Grain 10.6 25.86 6.22 7.55
Fruit and vegetables 11.37 7.24 37.54 22.17
Sugar and honey 0.5 7.87 3.31 25.59
Coffee, cocoa, tea, spices etc. 0.27 1.14 0.98 1.64
Cattle-feed 1.01 3.81 0.98 1.8
Foods 4.56 3.26 6.24 1.35
Drinks 0.23 0.88 1.39 2.36
Tobacco 3.88 10.68 17.34 14.86
Skins 0 0.07 0.71 0.07
Oily seeds 0.29 1.2 0.17 0.91
Timber 27.19 8.3 0.12 0,07
Vegetable weaving fibers 0.07 0,36 10.21 1.68
Agricultural raw materials 1.24 1,1 0,43 0.52
Oils and fats 3.17 9.25 8.19 11.42
Wheat and corn amylum 0 0.68 0 0
Total agricultural products and foods 100 100 100 100
Table 36: Total figures of Trade Balance (000 euro)
Agriculture & Food Products Trade between Greece - Bulgaria
2005 2010 Percentage change 2005/2010
Imports of agricultural products 112,361 279,306 149%
Exports of agricultural products 96,725 306,001 218%
Balance of Agricultural Products -15,636 26,695 %
Imports (Total) 589,031 957,750 62%
Exports (Total) 817,043 1,049,266 28%
Trade Balance 228,012 91,516 -60%
- R+D support institutions
Thessaloniki Technology Park Management & Development Corporation S.A (TTP) was established in 1994 in response to the growing need for an efficient and dynamic organization that would promote innovation, competitiveness and entrepreneurship of the Greek enterprises.
TTP’s main stakeholder is Centre for Research and Technology Hellas (CERTH), one of the biggest Greek research organizations. Among TTP’s co-founders are also the Association of Industries in Northern Greece, the Greek International Business Association as well as other leading Greek industries and leading consulting companies. TTP promotes and enhances the activities of the

Deliverable 1.1: Regional state of play analyses
Page 180 of 274
Thessaloniki Technology Park in close cooperation with the Association of Industries of Northern Greece, Universities and research centres.
TTP actively participates in a number of regional and interregional initiatives enhancing innovative entrepreneurship.
One of the main aims of TTP is to strengthen its capacity to provide support services for its customers especially, training assistance and guidance for sustaining innovative and knowledge-based entrepreneurship. During the last years, in the area off e-learning and training TTP, has organized intensive training programmes like: creativity at work, knowledge and innovation management, intellectual property rights management, targeted to local SMEs and R&D organizations. As a result, TTP has managed to foster a new generation of R&D managers, SMEs executive capable of operation in a global knowledge economy, equipped with the necessary skills for becoming agents and catalysts of change and development in the region.
Thessaloniki Technology Park is an official member of International Association of Science Parks (IASP) and a founding member of the Greek Association of Science & Technology Parks
TTP supports the INCUBATOR CENTRE by providing services such as: secretarial support, telecommunications, photocopying, ISDN networking, Internet, email and assistance for participation in European and National programmes.
5.6 Existing related initiatives
This section should extend the information provided in section x about networks and projects.
Name of the network/project
purpose Leader/coordinator and relevant organizations involved.
Interreg Balkan-Mediterranean:
DOMUS_CW
The DOMUS_CW project proposes the adoption of a simple, cost efficient and highly effective practice for the treatment of domestic/household wastewaters in rural areas of Balkan and Mediterranean (BalkanMed) countries, i.e. treatment via constructed wetlands (CWs). Two free surface flow CWs that have already been constructed in one Greek and one Cypriot community, will be modified and upgraded and will serve as case studies to be further optimized based on the model that has been previously developed by the team of LP. Through the systematic and detailed monitoring of the two CWs their operational efficiency will be evaluated, and the response to operational factors that have not been extensively studied yet, such as supply variations and recirculation, will be recorded and incorporated into the model. In addition, the effect and fate of xenobiotics, the interactions among plants and microorganisms, the toxic potency of effluents, the cropping frequency etc., will also be evaluated aiming to the better understanding and thus further improvement of the operation of the systems. An exploitation plan for CW effluents and plant biomass will also be investigated, aiming at the recovery of water and nutrients, contributing thus to the European goals for Sustainable Development. The main outcome of the project will be the creation of a generic assessment tool, a model platform via
Lead Partner: Foundation for Research & Technology - Hellas (FORTH), Institute of Chemical Engineering Sciences
Partners:
1. Agricultural University of Tirana.
2. Cyprus University of Technology.
3. Development Agency “Paphos” Aphrodite Ltd.
4. Municipality of “Andrichaina-Krestena”.
Observer Partner:
Institute of Environment and Sustainable Development (Cyprus)
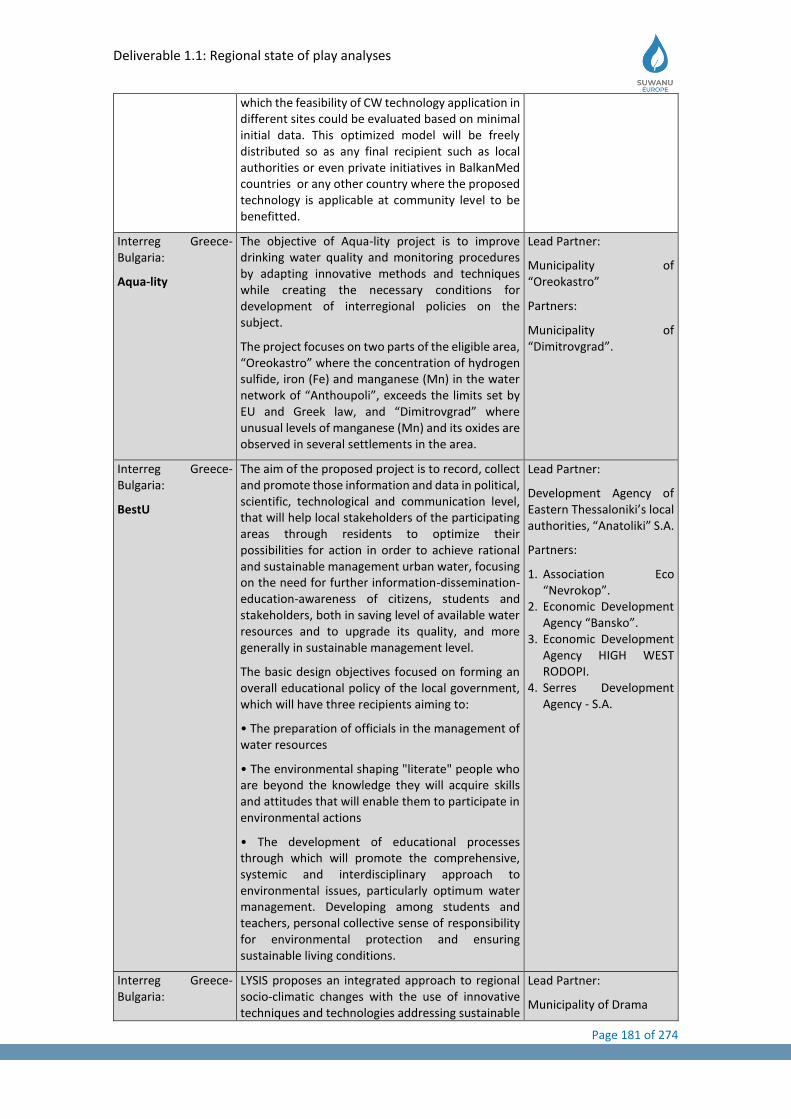
Deliverable 1.1: Regional state of play analyses
Page 181 of 274
which the feasibility of CW technology application in different sites could be evaluated based on minimal initial data. This optimized model will be freely distributed so as any final recipient such as local authorities or even private initiatives in BalkanMed countries or any other country where the proposed technology is applicable at community level to be benefitted.
Interreg Greece-Bulgaria:
Aqua-lity
The objective of Aqua-lity project is to improve drinking water quality and monitoring procedures by adapting innovative methods and techniques while creating the necessary conditions for development of interregional policies on the subject.
The project focuses on two parts of the eligible area, “Oreokastro” where the concentration of hydrogen sulfide, iron (Fe) and manganese (Mn) in the water network of “Anthoupoli”, exceeds the limits set by EU and Greek law, and “Dimitrovgrad” where unusual levels of manganese (Mn) and its oxides are observed in several settlements in the area.
Lead Partner:
Municipality of “Oreokastro”
Partners:
Municipality of “Dimitrovgrad”.
Interreg Greece-Bulgaria:
BestU
The aim of the proposed project is to record, collect and promote those information and data in political, scientific, technological and communication level, that will help local stakeholders of the participating areas through residents to optimize their possibilities for action in order to achieve rational and sustainable management urban water, focusing on the need for further information-dissemination-education-awareness of citizens, students and stakeholders, both in saving level of available water resources and to upgrade its quality, and more generally in sustainable management level.
The basic design objectives focused on forming an overall educational policy of the local government, which will have three recipients aiming to:
• The preparation of officials in the management of water resources
• The environmental shaping "literate" people who are beyond the knowledge they will acquire skills and attitudes that will enable them to participate in environmental actions
• The development of educational processes through which will promote the comprehensive, systemic and interdisciplinary approach to environmental issues, particularly optimum water management. Developing among students and teachers, personal collective sense of responsibility for environmental protection and ensuring sustainable living conditions.
Lead Partner:
Development Agency of Eastern Thessaloniki’s local authorities, “Anatoliki” S.A.
Partners:
1. Association Eco “Nevrokop”.
2. Economic Development Agency “Bansko”.
3. Economic Development Agency HIGH WEST RODOPI.
4. Serres Development Agency - S.A.
Interreg Greece-Bulgaria:
LYSIS proposes an integrated approach to regional socio-climatic changes with the use of innovative techniques and technologies addressing sustainable
Lead Partner:
Municipality of Drama
Deliverable 1.1: Regional state of play analyses
Page 182 of 274
LYSIS urban water management. Although a wide range of EU Directives and national legislative acts address water management and monitoring, established methodologies and technical and operational implementation standards are generally lacking at the municipal level. The development of these methodologies and standards present a common challenge to both Greece and Bulgaria in their efforts to promote sustainable municipal water management and reduce ecological footprint of urban green spaces. Specifically, this project establishes problem solution strategies for municipalities facing water excess or shortage issues. The main project outputs are: implementation of smart urban irrigation systems addressing exact water needs in space and time; development of excess water management techniques emphasizing on water quality and reuse; development of a Good Practice Guide for ecological footprint reduction in urban green spaces; knowhow dissemination seminars and public awareness events addressing efficient municipal water management.
Partners:
1. Aristotle University of Thessaloniki, Department of Chemistry.
2. Municipality of Blagoevgrad.
3. Municipality of “Pavlos Melas”.
4. NGO "Active Youths".
Interreg Greece-Bulgaria:
WATER RESCUE
WATER RESCUE project aims at sustainable drinking water supply management through the increase of water use efficiency and the monitoring & improvement of water quality throughout the whole water supply chain (from the water intake points & back to the environment).The project not only safeguards water resources quality and quantity from natural and human pressures but, more importantly, it assures the water consumers safety and health as well as their quality of life, being in line with EU & national legislation. As water meets no borders and Greece and Bulgaria share international river basins, it is imperative the common water management problems to be tackled jointly in the cross border area.
The project aims at the reduction of Non-Revenue Water in drinking water supply systems and the monitoring of surface water used for drinking purposes in the cross border area. The project’s outputs will be joint innovative methodological approaches, technologies & tools used to tackle drinking water management problems taking also into consideration human & natural pressures including climate change. These methodologies, serving as early warning systems, will be tested in pilot areas in the CB area and finally joint policy recommendation papers will highlight the results and lessons learnt. WATER RESCUE results will have a positive impact to the whole Cross Border area.
Lead Partner:
Municipal Water Supply & Sewerage Company of “Komotini”
Partners:
1. Municipal Water Supply & Sewerage Company of “Thermaikos”.
2. Municipal Water Supply & Sewerage Company of “Thermi”.
3. Municipality of “Gotse Delchev”.
4. Municipality of “Kardzhali”.
5. University of Thessaly-Special Account Funds for Research-Department of Civil Engineering.
Interreg Greece-Bulgaria:
The overall objective of the project WRESTLE is to design and implement a Joint System in Greek - Bulgarian CB area for the sustainable management
Lead Partner:
Deliverable 1.1: Regional state of play analyses
Page 183 of 274
WRESTLE of the CB water resources available. The Joint System will facilitate protection of water quality/quantity and ensure efficient use in response to EU Directives and National legislative acts.
Moreover, for providing a holistic approach, beneficiaries will work together in order to analyze the cross-border existing conditions and jointly develop a common cross-border approach for sustainable water management contributing to the adaptation of the Water Framework Directive requirements. The project will provide CB competent authorities and involved stakeholders with a detailed policy guide both for short-medium term and long term achievements.
Municipal Enterprise for Water and Sewage of “Alexandroupoli”
Partners:
1. Central Union of Municipalities in Greece.
2. Democritus University of Thrace - Department of Economics.
3. Municipality of “Kresna”.
4. Municipality of “Xanthi”.
5. NGO "South West Public Information Center“.
Interreg Greece-Italy:
Re-Water
The project main objective is to introduce sustainable technologies and processes to manage wastewater disposal, with the final aim of reducing marine pollution caused by the effluents derived from water treatment and improve the quality of the sewerage treatment plants.
More precisely, the project aims to prevent marine pollution and improve the quality of effluents. By doing so, recycled water will be used in other sectors, in full compliance with the European regulations. Two pilot actions will be carried out in the two Municipalities involved in the project, Gallipoli in Puglia Region and “Patra” in Western Greece Region. Both Municipalities are based on tourism and marine activities as the main economic drivers; for this reason, they both decided to invest in the quality of their marine environments.
Lead Partner:
“Acqedotto Pugliese S.P.A.”
Partners:
1. Municipality of “Gallipoli”.
2. Polytechnic University of Bari.
3. Municipality of “Patra”. 4. Special Account for
research of University of Patra.
Associated Partners:
1. Water Resources Section of Region of Puglia.
2. Municipal Enterprise of Water Supply & sewerage of Patra.
Interreg Greece-Italy:
IR2MA
Large Scale Irrigation Management Tools for Sustainable Water Management in Rural Areas and Protection of Receiving Aquatic Ecosystems. A fruitful cooperation between scientific research and Italian and Greek policymakers will improve the water management, in particular the irrigation-drainage systems, in order to reduce contamination of receiving aquatic ecosystems. IR2MA project capitalizes the results of the previous project IRMA, already funded during the 2007-2013 Programming Period: the application of a common decision support system (DSS) for water management at end-user level will promote cooperation among the involved stakeholders. With this project Greece and Italy try to put in practice the rules of the directive 2000/60/EC in order to protect water both in qualitative and quantitative terms.
Lead Partner:
Technological Educational Institute of Epirus - Special Accounts for
Research Funds
Partners:
1. CNR-ISPA. 2. “Consorzio Bonifica
della Capitana” (CBC). 3. Mediterranean
Agronomic Institute of Bari (CIHEAMB).
4. University of Ioannina. 5. Region of Epirus.
Deliverable 1.1: Regional state of play analyses
Page 184 of 274
Associate Partners:
Region of Puglia.
Interreg-Europe:
iWATERMAP
The iWATERMAP project focuses on supporting the innovation policies in water technology sector, helping to increase the critical mass of innovation ecosystems in partner regions in this sector. The critical mass in innovation ecosystem approach means that all the necessary elements for innovation ecosystem are identified and put in place stage by stage, such as academia and business cooperation, cross-cluster fertilization, interregional networks and cooperation, science and education, thus ensuring stable and sustainable development of the system. Overall Project objective is to improve innovation policies for enhancing the critical mass development of innovation ecosystems in the water technology sector. Reaching the critical mass in innovation will allow partner regions in future to rise above their own weight in innovation development, creating the conditions for raising competitiveness, growth and jobs in the regions.
Lead Partner:
- Wetsus, European Centre of Excellence for Sustainable Water Technology (Holland).
- Province of “Fryslân” (Holland).
- Ministry of Education & Science of Republic of Latvia (MoES) (Latvia).
- Riga Technical University (Latvia)
Partners:
1. CREA Hydro & Energy, z.s. (Austria).
2. North-East Regional Development Agency (Romania).
3. University of Minho (Portugal).
4. Food & Agriculture Foundation of the Murcia Region (Spain).
5. Region of Crete (Greece)
Interreg-Europe:
AQUARES
AQUARES brings together 10 partners from 9 countries, to achieve efficient water management through water reuse, profit from the opportunities in the water market, and secure the protection of water bodies.
Water reuse is a keyway to both promote resource efficiency in water scarce areas of Europe, and to profit from opportunities in the expanding water market, thereby alleviating pressure on wetlands and littoral areas of Europe. The EC "Strategic Implementation Plan of the European Innovation Partnership on Water”, was set in place to promote and support efficient water management in Europe where water scarcity affects 11% of its population.
In this context, AQUARES will support public authorities to initiate efforts, join forces and exchange experiences to:
1. identify viable strategies to utilize water reuse to confront inefficient uses of water
2. make the most of EU financing tools, and
3. promote public dialogue to address conflicting interests
Lead Partner:
- Regional Government of Murcia, Ministry of water, Agriculture, Livestock & Fisheries, General Direction of Water (Spain).
- Euro-Mediterranean Water Institute Foundation (FIEA)(Spain).
Partners:
1. Water Board of “Oldenburg” & East “Frisia” (Germany).
2. Association Baltic Coasts (Latvia).
3. “Lodzkie” Region (Poland).
4. The Regional Development Agency of the Pardubice Region (Czech Republic).
5. The Municipality of “Trebnje” (Slovenia).
6. Lombardy Foundation for Environment (Italy).
Deliverable 1.1: Regional state of play analyses
Page 185 of 274
7. Energy & Water Agency (Malta).
8. Ministry of Environment & Energy, Special Secretariat for Water (Greece)
Interreg –IPA CBC Greece –Albania:
PhaRem
Development and application of a system based on advanced oxidation processes for the treatment of hospital wastewaters in order to remove pharmaceutical compounds with high persistence in aquatic environment.
The presence of organic micro-pollutants, (pharmaceuticals, agrochemicals, etc.) in the environment is a problem that has caused great social and scientific concern in the last years as can be deduced from the strict legislation developed by various governments. Pharmaceuticals active compounds (PhACs) are being used at an increasing rate and end up in wastewater through excretion and disposal.
The aim of the proposed project is the assessment of the current needs for the treatment of hospital effluents and the current concentration levels of PhACs and the development of an efficient and competitive technology of water treatment for the removal of organic micropollutants such as pharmaceuticals and the wastewater detoxification.
Advanced wastewater treatment options should be considered for removal of PhACs from urban, hospital and industrial wastewaters. There is a need for efficient treatment options which can effectively reduce/alter/modify the recalcitrance/toxicity profile of the wastewater.
One of the possible strategies for up-grading treatment is the application of advanced oxidation processes (AOPs) such as Photo-Fenton, Photolytic and Photocatalytic Oxidation which constitute a promising technology for the treatment of wastewaters containing non-biodegradable organic compounds. The major advantage of the photolytic oxidation based processes are operation at room temperature and the possibility to effectively use sunlight or near UV for irradiation.
The overall project objective is to establish an innovative mechanism for the secondary treatment of hospital wastewaters in Ioannina and Vlore hospitals with the use of advanced oxidation processes.
Lead Partner:
University of Ioannina – Research Committee
Partners:
1. Decentralized Administration of Epirus – Western Macedonia.
2. University Hospital od Ioannina
3. University of “Vlora Ismail Qemali”
4. Regional Council of “Vlora”
5. Regional Hospital of “Vlora”
Interreg –IPA CBC Greece – Albania:
SaveSafeWater
Networking for Reciprocal Safe Cross Border Water Supply towards a Worth Living Environment.
Water Knows No Borders. Greece & Albania share CB river basins; therefore, water resources management & supply aspects are common
Lead Partner:
Water Association of Ioannina Basin
Partners:
Deliverable 1.1: Regional state of play analyses
Page 186 of 274
challenges that should be jointly tackled. In the meantime, existing financial/human investments are not sufficient to ensure proper operation & maintenance of the water supply (WS) infrastructure, while the capacity of water utilities to manage basic services in delivering safe drinking water & treating waste water is weak. Thus, SaveSafeWater overall objective is to increase the capacity of CB infrastructure in water management, through their rehabilitation, drinking water quality monitoring & reduction of NRW, throughout the whole WS chain (from the water abstraction points back to the environment).
SaveSafeWater not only safeguards water resources quality & quantity from natural & human pressures, but also assures water consumers safety & health as well as their quality of life, in compliance with EU & national legislation.
The expected change is the increase of water operators’ capacity in delivering safe drinking water &the management of wastewater treatment. Smart Growth will be enhanced by utilizing ICT, Sustainable Growth by supporting construction of water infrastructure & promoting environmental protection, adaptation to Climate Change (CC) & risk prevention, sustainable use of natural resources. Inclusive Growth will be enhanced by assuring public safety & health.
1. Municipal Enterprise for Water Supply and Sewerage of “Igoumenitsa”
2. Municipal Enterprise for Water Supply and Sewerage of “Kefallonia”.
3. University of Thessaly - Research Committee.
4. Directorate of Water Supply and Sewerage “Korce”.
5. Regional Council of “Korca”.
Interreg –IPA CBC Greece – Albania:
AQUANEX
Conservation and quality assurance of the surface water bodies in Greece and Albania using earth observation techniques.
AquaNEX addresses the challenges of WFD application and water resources management in the CB area. Albania needs to apply the WFD to enable water resources protection and sustainable management, and also support its accession to EU. Greece needs to update water quality monitoring networks to better serve the WFD and enhance resources management efficiency in the CB region.
The overall AquaNEX objective is to enable joint sustainable water resources management in the CB area and enhance its efficiency within the WFD with the application of advanced water monitoring tools. This is accomplished by ensuring technical compliance of CB Albania to WFD; paving the way for harmonizing national Albanian legislation to WFD; and updating water quality monitoring systems in pilot areas with innovative technology while further applying WFD. The project’s added value is enabling comprehensive water resources management in Albania resulting from legislative harmonization to WFD and generating long-term improvements in pilot areas. Sophisticated datasets produced by advanced water monitoring
Lead Partner:
Albanian Ministry of Tourism and Environment.
Partners:
1. Decentralized Administration of Epirus - Western Macedonia.
2. Decentralized Administration of Peloponnese, Western Greece and the Ionian.
3. Interbalkan Environment Center.
4. National Agency of Natural Resources.

Deliverable 1.1: Regional state of play analyses
Page 187 of 274
infrastructure and services will be valuable input for future water, land and wastewater management and research further enhancing sustainability in the CB area and attracting investments in agriculture and tourism.
AquaNEX is based on NEXUS approach of intergrading water, energy and agricultural production at the watershed level to optimize agricultural productivity and ecosystem services. CB border approach ensures know-how transference among beneficiaries, as each one is differentially capable of applying the WFD and establishes communication among stakeholders enabling similar problem solution for the duration and after the completion of the project. Progressive management approaches and innovative technological tools never before used in the CB area will be applied in two pilot basins, with the purpose of improving water monitoring efficiency and increasing resource sustainability.
Interreg –IPA CBC Greece – Albania:
SAVE_WATER
Improving water management and supply infrastructure via smart technologies, policies and tools
Water is essential for human life, nature and the economy. It is permanently renewed but it is also finite and cannot be made or replaced with other resources. Freshwater constitutes only about 2% of the water on the planet and competing demands may lead to an estimated 40% global water supply shortage by 2030, while drinking water losses from ageing water distribution networks leakage within Member States vary from 7 % to 50% or more. It is the aim of SAVE-WATER project to address these challenges to preserve our resource base for life, nature and the economy and protect human health.
The expected changes that SAVE-WATER will initiate are: 1. Elaborate transnational and join-up approaches to respond to common drinking water pressures, 2. Produce state of the art sustainable technological solutions for robust drinking water monitoring, 3. Elaborate the effectiveness of the local administrations for protection, conservation and sound use of water resources and 4. Improve operational reliability and safety of water supply systems especially in touristic areas.
The main target groups of SAVE_WATER project is: 1. Local population served by improved drinking water supply, 2. regional administrations and local entities, achieving efficient & effective management of drinking water resources, and 3. tourists due to the sustainable use of water resources.
The project’s approach focusses in i) the enhancement of drinking water quality against natural and man-made pressures ii) the
Lead Partner:
Region of Ionian Islands.
Partners:
1. Region of “Epirus” 2. Regional Council of
“Vlora”. 3. Regional Council of
“Korca”. 4. Environmental Center of
Region of Western Macedonia.
5. Municipal Enterprise for Water Supply and Sewerage of Ioannina.
6. Ionian University Research Committee.
7. Western Macedonia University of Applied Sciences, School of Engineering, Department of Environmental Engineering and Pollution Control, Laboratory of Environmental Chemistry and Wastewater Treatment.
Deliverable 1.1: Regional state of play analyses
Page 188 of 274
enhancement of partners’ capacity to water management and iii) the sustainable use of water resources.
The transnational approach is essential for SAVE-WATER since main causes of negative impacts on water status such that climate change, industry, agriculture and tourism have a transnational character, 60% of the EU’s territory having trans-boundary river basins. The originality of SAVE-WATER steams to the introduction of low cost smart sensors and networks which, for the first time, will cover very large transnational areas leading to the development of a robust monitoring infrastructure and decision making tool producing valuable tools with significant added value.
Interreg Greece-Cyprus:
SMARTWATER2020
Intelligent Water Distribution Networks to Reduce Losses.
The project aims to the modernization of four water utilities in Cyprus and Crete, through the development of smart software and smart network monitoring devices for leakage and quality problems, as well as the creation of an innovative real-time network pressure control system.
In particular, the project will enhance the capacity of water bodies to manage the ever-increasing flow of data from state-of-the-art sensors to monitor their networks, with the aim of timely diagnosis of problems such as leakages and infections through smart software designed and developed by the partners. In addition, an innovative network pressure control system will be implemented in real time using automatic valves.
Lead Partner:
University of Cyprus
Partners:
1. Water Supply Council of “Lemessos”.
2. Department of Water Resources Development.
3. Water Supply Council of “Larnaka”.
4. Institute of Technology & Research.
5. Municipal Enterprise for Water Supply & Sewerage of “Malevizio”.
Deliverable 1.1: Regional state of play analyses
Page 189 of 274
5.7 Discussions and conclusions remarks
The entire Mediterranean basin is prone to severe negative impacts due to climate changes. Under this context it is expected that water reuse practices will be rapidly expanding for the next decades. Those practices must provide sustainable, safe, low energy consumption, and cost-effective options for water resources managers that will lead to improved water availability depended on the reuse capacity. In order to increase the recycling capacity, the wastewater processing systems (WWTPs) must be retrofitted with the proper technologies via a bottom –up approach from use to source, whilst simultaneously we must evaluate different scenarios in the context of each case environmental hazards, legislation terms, and local socio-economic characteristics. Successful interventions of this type onto WTTP and water users for irrigation, could ultimately “transform” WWTP facilities from a compulsory environment protection and cost claiming process, to a “new” and “additional” water resource recovery facility, leading to a more circular economy.
Regarding the specific area of Thessaloniki province, early initiatives in the field of wastewater re-use have been taken since late 90’s. Early projects implemented by the NAgReF, -were focused on the re-use of treated wastewater from the WWTP site at “Sindos” for irrigation of sugar beet, cotton, rice as well as tomato and gerbera in a greenhouse with particularly positive results. The project has led to the permanent reuse of the secondary effluent of the city's Wastewater Treatment Plant (WWTP) (165,000 m3/day) for agricultural irrigation after mixing with freshwater at a 1:5 ratio. The main crops irrigated are rice, corn, alfalfa and cotton. Approximately 2,500 ha of spring crops are irrigated in the “Halastra-Kalohori” area, with the freshwater—effluent mixture.
Furthermore another initiative concerning reuse of reclaimed water was taken by Thessaloniki Water Supply and Sewerage Company SA and was funded by the Greek Ministry of Environment, Energy and Climate Change to assess the impact of recycled water injection into a confined aquifer at the area of Sindos, around 12 km West to the city of Thessaloniki (Greece). The groundwater table is below sea level at the entire coastal area stretching from the “Egnatia” road axis to the sea. The project involves the injection of water coming from the Thessaloniki sewage treatment plant after being subjected to tertiary treatment and pre-treated to reach the standards required before it is discharged into the ground. Based on preliminary results it is concluded that, artificial recharge via boreholes using pre-treated wastewater including microfiltration and inverse osmosis, is one of the options available for increasing the groundwater reserves in the Sindos aquifer system.
Some critical issues that need to be further examined on the effort to broaden the re-use of treated wastewater for irrigation at Thessaloniki province are:
• The ongoing severe economic crisis that has led to “evaporation” of available public funds that are essential for implementing large scale interventions on existing irrigation infrastructures and WWTP’s for reclamation and reuse of treated effluents.
• The multiple administrative layers of water resources government (local, regional, national) that are involved in any action / initiative to implement reuse of reclaimed water. Multiple different administration branches that must be involved for granting the permits and monitoring the quantitatively / qualitative characteristics of the re-used water.
• The natures “blessing” of the Thessaloniki province by abundant surface water bodies (3 rivers, 2 lakes) that facilitate the existing trend to use them as reservoirs’ for irrigation water abstraction.
• The contradicting axes of the policies for improvement of food production chain, safety (that tends to adopt more austere terms on all hygiene parameters) and the policies to move to a more circular economy by more intense exploitation of available local resources.
Deliverable 1.1: Regional state of play analyses
Page 190 of 274
• The existence of a considerable number of relatively small capacity WWTP’s located inland as well as the programmed addition of new ones for covering all the Priority C settlements indicated at table 6.2, offers a significant opportunity to implement “smart” solution that will combine low investment cost, low operation cost, environmental & health safety, thus allowing a wider reclamation and reuse of WWTP’s effluent for agricultural irrigation purposes.
• The need to inform / educate the water users as well as the consumers for the benefits of water reclamation and reuse for agriculture for irrigation purposes and the effort to overcome the expected oppositions set a task of extra-large dimensions for the policy makers.
Deliverable 1.1: Regional state of play analyses
Page 191 of 274
5.8 References
Revision of the CENTRAL MACEDONIA SOLID WASTE MANAGEMENT PLAN & Strategy Study of Environmental Implications
‘’GREEK BIOTOPE/WETLAND CENTRE.’’ [Online] Available: http://www.ekby.gr/ [Accessed: 7-Apr-2019].
‘’Hellenic Statistical Authority.’’ [Online] Available: http://www.statistics.gr/ [Accessed: 10-Apr-2019].
Seich Sou: [Online] Available: https://en.wikipedia.org/wiki/Kedrinos_Lofos [Accessed: 10-Apr-2019].
(ΓΟΕΒ): [Online] Available: http://goev-ptl.gr/ [Accessed: 11-Apr-2019] Management Plan of the river basins of Central Macedonia River Basin District. Summary
January 2014 (ΕΛ.ΙΝ.Υ.Α.Ε.): [Online] Available: http://www.elinyae.gr/el/category_details.jsp?cat_id=735
[Accessed: 10-Febr-2019]. General Secretariat of Waters [Online] Available: http://wfdver.ypeka.gr/en/management-
plans-en/approved-management-plans-en/gr10-approved-en/ [Accessed: 13-Febr-2019].
http://astikalimata.ypeka.gr/Services/Pages/WtpViewApp.aspx (Accessed 15-Mar.-2019) Management Plan of the river basins of Water District 10. Annex B Analysis of the human
pressures and their impacts to the surface & ground water bodies. Sustainability 2014, ISSN 2071-1050 [Online] www.mdpi.com/journal/sustainability:
“Wastewater Recycling in Greece: The Case of Thessaloniki” {Accessed 16-Mar.-2019) Vassilis D. Litskas, Vassilis G. Aschonitis, Vassilis Z. Antonopoulos, “Water quality in irrigation and
drainage networks of Thessaloniki plain in Greece related to land use, water management, and agroecosystem protection,’’ 2009.
Papadimitriou S.A., ‘’Spices, aromatic plants, raw materials for foodstuff & meat processing industry’’ [Online]. Available: http://www.europages.gr/PAPADIMITRIOU [Accessed: 17-Apr-2019].
Mevgal S.A., [Online]. Available: http://www.europages.gr/MEVGAL. [Accessed: 17-Apr-2019] Mavromixalis S. & Co E.E, [Online]. Available: http://maurocoffee.com [Accessed: 17-Apr-2019]. Pami, [Online]. Available: http://pami.gr [Accessed: 17-Apr-2019]. Allatini, [Online] Available: http://www.wikipedia.org/wiki/Allatini_(company) [Accessed: 17-
Apr-2019]. [Online]. Available: http://www.voria.gr [Accessed: 17-Apr-2019]. ‘’Agricultural co-operative of Halastra B.’’ [Online]. Available: http://www.ricegreece.gr
[Accessed: 15-Apr-2019]. ‘’Agricultural co-operative of Halastra A.’’ [Online]. Available: http://www.chalastrarice.gr
[Accessed: 15-Apr-2019]. EYATH Thessaloniki, [Online]. Available: http://www.eyath.gr/ [Accessed: 15-May-2019] (Γ.Ο.Ε.Β.): [Online] Available: http://goev-ptl.gr/. [Accessed: 11-Apr-2019] Kyriazopoulos George, “The competitiveness of Agricultural products (trade relations between
Greece-Bulgaria).’’ 2012. “Thessaloniki Technology Park.’’ [Online] Available: http://www.thestep.gr [Accessed: 23-Apr-
2019] Interreg [Online] Available: http://www.interreg-balkanmed.eu/approved-projects/ [Accessed:
10-Apr-2019] Interreg [Online] Available: http://www.greece-bulgaria.eu/approved-projects/ [Accessed: 10-
Apr-2019] Interreg [Online] Available: https://greece-italy.eu/discover-project/integrated-environmental-
management/ [Accessed: 10-Apr-2019]
Deliverable 1.1: Regional state of play analyses
Page 192 of 274
Interreg [Online] Available: https://www.interregeurope.eu/search/?tx_tevsearch_search%5Bkeywords%5D=&tx_tevsearch_search%5BentityTypes%5D%5B0%5D=project&tx_tevsearch_search%5Bcountry%5D=&tx_tevsearch_search%5BthematicInterests%5D%5B0%5D=2&cHash=dc7f8167fed1615ca614a0c1b76a807e [Accessed: 10-Apr-2019]
Interreg [Online] Available: https://greece-albania.eu/projects [Accessed: 10-Apr-2019] Interreg [Online] Available: https: http://greece-
cyprus.eu/%CF%80%CF%81%CE%BF%CF%83%CE%BA%CE%BB%CE%AE%CF%83%CE%B5%CE%B9%CF%82/%CE%B5%CE%B3%CE%BA%CE%B5%CE%BA%CF%81%CE%B9%CE%BC%CE%AD%CE%BD%CE%B1-%CE%AD%CF%81%CE%B3%CE%B1/ [Accessed: 10-Apr-2019]
Sustainability ISSN 2071-1050 “Wastewater Recycling in Greece: The Case of Thessaloniki” www.mdpi.com/journal/sustainability [Accessed: 12-Apr-2019]
Research Gate “Preliminary results of artificial recharge via borehole using treated wastewater in Sindos, Greece”. Authors: K. Voudouris, Georgios Argyropoulos.
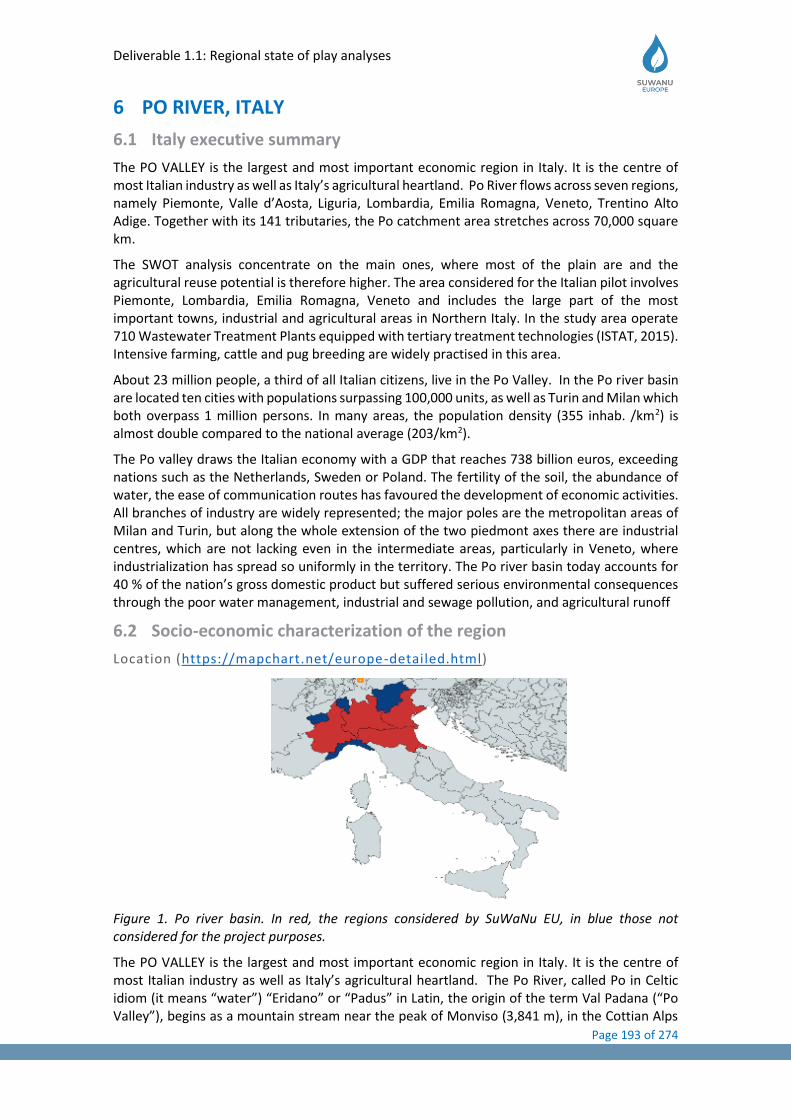
Deliverable 1.1: Regional state of play analyses
Page 193 of 274
6 PO RIVER, ITALY
6.1 Italy executive summary
The PO VALLEY is the largest and most important economic region in Italy. It is the centre of most Italian industry as well as Italy’s agricultural heartland. Po River flows across seven regions, namely Piemonte, Valle d’Aosta, Liguria, Lombardia, Emilia Romagna, Veneto, Trentino Alto Adige. Together with its 141 tributaries, the Po catchment area stretches across 70,000 square km.
The SWOT analysis concentrate on the main ones, where most of the plain are and the agricultural reuse potential is therefore higher. The area considered for the Italian pilot involves Piemonte, Lombardia, Emilia Romagna, Veneto and includes the large part of the most important towns, industrial and agricultural areas in Northern Italy. In the study area operate 710 Wastewater Treatment Plants equipped with tertiary treatment technologies (ISTAT, 2015). Intensive farming, cattle and pug breeding are widely practised in this area.
About 23 million people, a third of all Italian citizens, live in the Po Valley. In the Po river basin are located ten cities with populations surpassing 100,000 units, as well as Turin and Milan which both overpass 1 million persons. In many areas, the population density (355 inhab. /km2) is almost double compared to the national average (203/km2).
The Po valley draws the Italian economy with a GDP that reaches 738 billion euros, exceeding nations such as the Netherlands, Sweden or Poland. The fertility of the soil, the abundance of water, the ease of communication routes has favoured the development of economic activities. All branches of industry are widely represented; the major poles are the metropolitan areas of Milan and Turin, but along the whole extension of the two piedmont axes there are industrial centres, which are not lacking even in the intermediate areas, particularly in Veneto, where industrialization has spread so uniformly in the territory. The Po river basin today accounts for 40 % of the nation’s gross domestic product but suffered serious environmental consequences through the poor water management, industrial and sewage pollution, and agricultural runoff
6.2 Socio-economic characterization of the region
Location (https://mapchart.net/europe-detailed.html)
Figure 1. Po river basin. In red, the regions considered by SuWaNu EU, in blue those not considered for the project purposes.
The PO VALLEY is the largest and most important economic region in Italy. It is the centre of most Italian industry as well as Italy’s agricultural heartland. The Po River, called Po in Celtic idiom (it means “water”) “Eridano” or “Padus” in Latin, the origin of the term Val Padana (“Po Valley”), begins as a mountain stream near the peak of Monviso (3,841 m), in the Cottian Alps
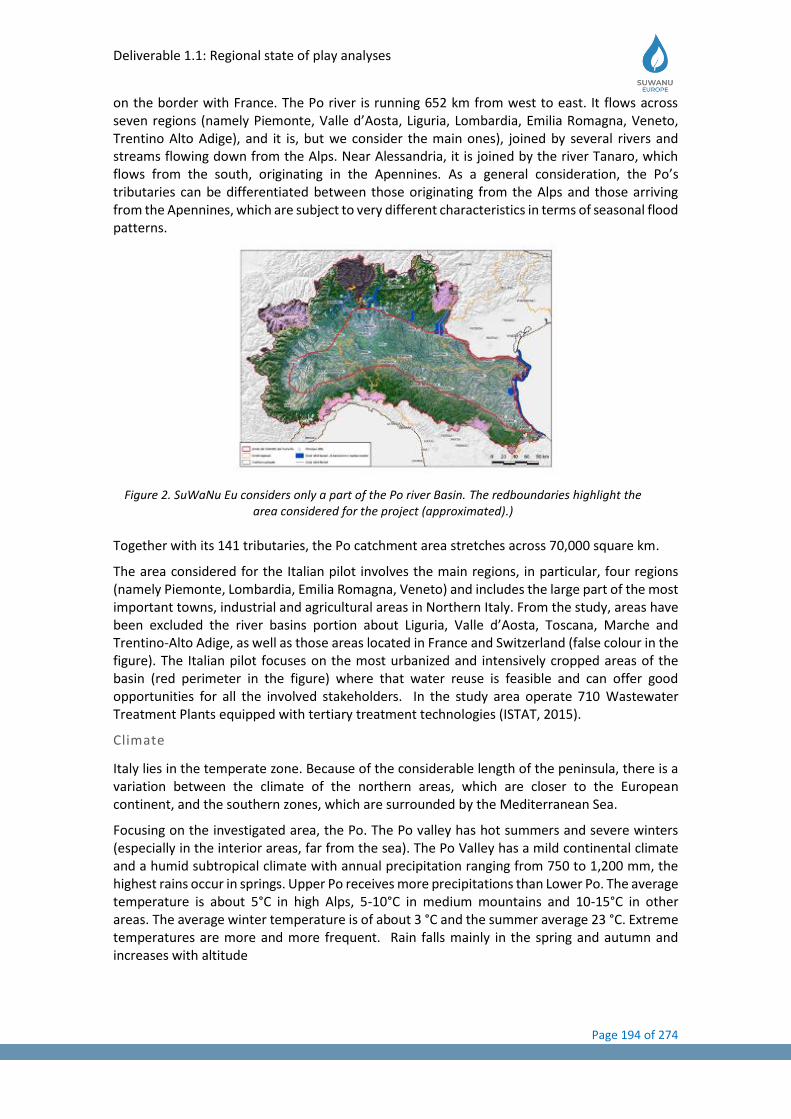
Deliverable 1.1: Regional state of play analyses
Page 194 of 274
on the border with France. The Po river is running 652 km from west to east. It flows across seven regions (namely Piemonte, Valle d’Aosta, Liguria, Lombardia, Emilia Romagna, Veneto, Trentino Alto Adige), and it is, but we consider the main ones), joined by several rivers and streams flowing down from the Alps. Near Alessandria, it is joined by the river Tanaro, which flows from the south, originating in the Apennines. As a general consideration, the Po’s tributaries can be differentiated between those originating from the Alps and those arriving from the Apennines, which are subject to very different characteristics in terms of seasonal flood patterns.
Together with its 141 tributaries, the Po catchment area stretches across 70,000 square km.
The area considered for the Italian pilot involves the main regions, in particular, four regions (namely Piemonte, Lombardia, Emilia Romagna, Veneto) and includes the large part of the most important towns, industrial and agricultural areas in Northern Italy. From the study, areas have been excluded the river basins portion about Liguria, Valle d’Aosta, Toscana, Marche and Trentino-Alto Adige, as well as those areas located in France and Switzerland (false colour in the figure). The Italian pilot focuses on the most urbanized and intensively cropped areas of the basin (red perimeter in the figure) where that water reuse is feasible and can offer good opportunities for all the involved stakeholders. In the study area operate 710 Wastewater Treatment Plants equipped with tertiary treatment technologies (ISTAT, 2015).
Climate
Italy lies in the temperate zone. Because of the considerable length of the peninsula, there is a variation between the climate of the northern areas, which are closer to the European continent, and the southern zones, which are surrounded by the Mediterranean Sea.
Focusing on the investigated area, the Po. The Po valley has hot summers and severe winters (especially in the interior areas, far from the sea). The Po Valley has a mild continental climate and a humid subtropical climate with annual precipitation ranging from 750 to 1,200 mm, the highest rains occur in springs. Upper Po receives more precipitations than Lower Po. The average temperature is about 5°C in high Alps, 5-10°C in medium mountains and 10-15°C in other areas. The average winter temperature is of about 3 °C and the summer average 23 °C. Extreme temperatures are more and more frequent. Rain falls mainly in the spring and autumn and increases with altitude
Figure 2. SuWaNu Eu considers only a part of the Po river Basin. The redboundaries highlight the area considered for the project (approximated).)
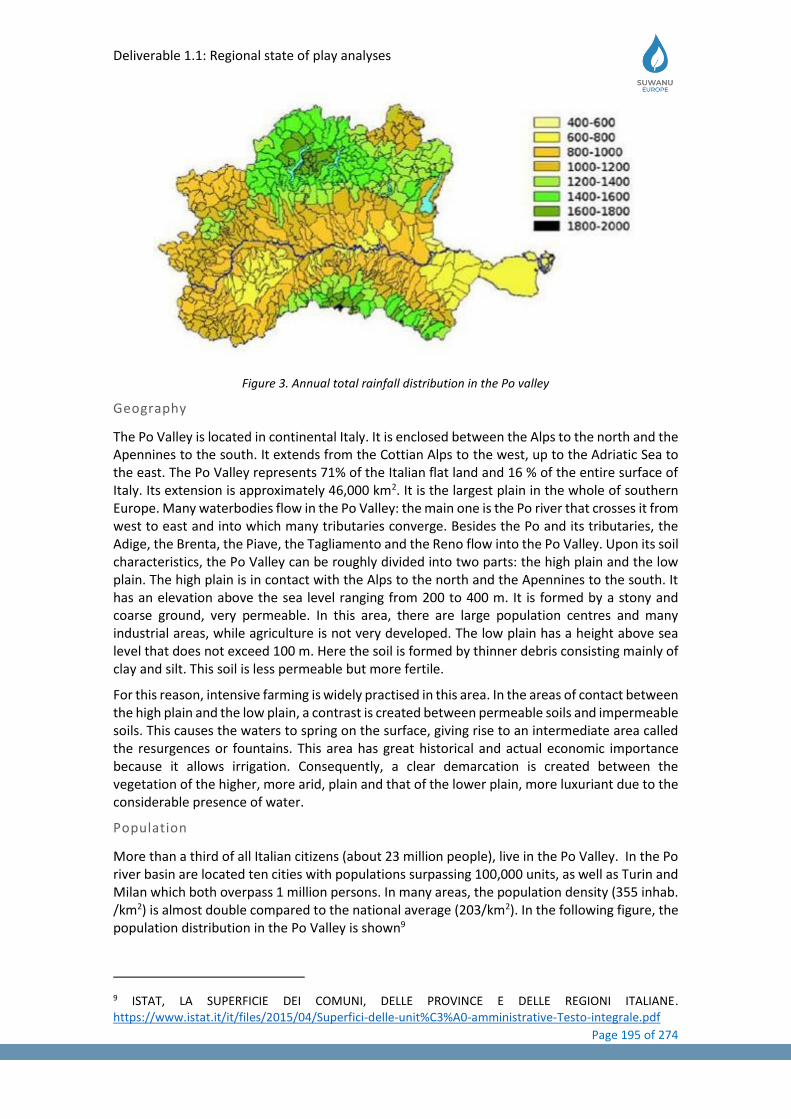
Deliverable 1.1: Regional state of play analyses
Page 195 of 274
Figure 3. Annual total rainfall distribution in the Po valley
Geography
The Po Valley is located in continental Italy. It is enclosed between the Alps to the north and the Apennines to the south. It extends from the Cottian Alps to the west, up to the Adriatic Sea to the east. The Po Valley represents 71% of the Italian flat land and 16 % of the entire surface of Italy. Its extension is approximately 46,000 km2. It is the largest plain in the whole of southern Europe. Many waterbodies flow in the Po Valley: the main one is the Po river that crosses it from west to east and into which many tributaries converge. Besides the Po and its tributaries, the Adige, the Brenta, the Piave, the Tagliamento and the Reno flow into the Po Valley. Upon its soil characteristics, the Po Valley can be roughly divided into two parts: the high plain and the low plain. The high plain is in contact with the Alps to the north and the Apennines to the south. It has an elevation above the sea level ranging from 200 to 400 m. It is formed by a stony and coarse ground, very permeable. In this area, there are large population centres and many industrial areas, while agriculture is not very developed. The low plain has a height above sea level that does not exceed 100 m. Here the soil is formed by thinner debris consisting mainly of clay and silt. This soil is less permeable but more fertile.
For this reason, intensive farming is widely practised in this area. In the areas of contact between the high plain and the low plain, a contrast is created between permeable soils and impermeable soils. This causes the waters to spring on the surface, giving rise to an intermediate area called the resurgences or fountains. This area has great historical and actual economic importance because it allows irrigation. Consequently, a clear demarcation is created between the vegetation of the higher, more arid, plain and that of the lower plain, more luxuriant due to the considerable presence of water.
Population
More than a third of all Italian citizens (about 23 million people), live in the Po Valley. In the Po river basin are located ten cities with populations surpassing 100,000 units, as well as Turin and Milan which both overpass 1 million persons. In many areas, the population density (355 inhab. /km2) is almost double compared to the national average (203/km2). In the following figure, the population distribution in the Po Valley is shown9
9 ISTAT, LA SUPERFICIE DEI COMUNI, DELLE PROVINCE E DELLE REGIONI ITALIANE. https://www.istat.it/it/files/2015/04/Superfici-delle-unit%C3%A0-amministrative-Testo-integrale.pdf

Deliverable 1.1: Regional state of play analyses
Page 196 of 274
Figure 4. population distribution in the Po Valley
Economic data (GDP, the share of GDP by sector…)
The Po valley draws the Italian economy with a GDP that reaches 738 billion euros, exceeding nations such as the Netherlands, Sweden or Poland. The fertility of the soil, the abundance of water, the ease of communication routes has favoured the development of economic activities. The daily work of man during centuries has increased the richness of this area through the reclamation of the marshy areas of the low plain and the irrigation of the upper part. The river’s agricultural and industrial relevance has played a primary part in the political and social history of Italy—the basin today accounts for 40 % of the nation’s gross domestic product—but suffered serious environmental consequences through the poor water management, industrial and sewage pollution, and agricultural runoff. All branches of industry are widely represented; the major poles are the metropolitan areas of Milan and Turin, but along the whole extension of the two piedmont axes there are industrial centres, which are not lacking even in the intermediate areas, particularly in Veneto, where industrialization has spread so uniformly in the territory.
Urban structure
Nearly half of the Italian towns >100.000 inhabitants are located in the Po Valley (18 out of 43). Out of the major centres, the urban network of Padania is well structured in a dense articulation of small cities, by now well-equipped also from services and of the commercial supply. The Po Valley is the most developed region of the country in almost all sectors of the economy, starting from very efficient and intensive agriculture.
The following map shows the tight interdependences and interrelations between the hydrological network of the Po tributaries, and of the Po river itself, with the main cities. The urban structure has developed along millennia on the banks of the main rivers, and then
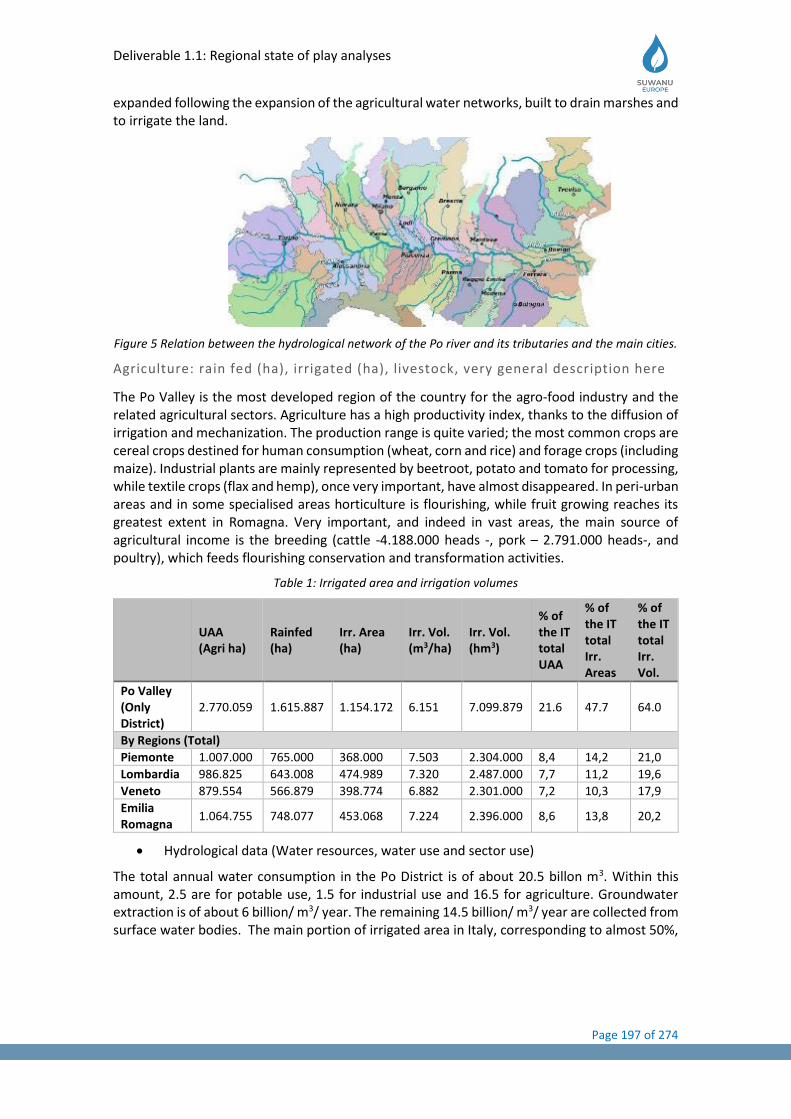
Deliverable 1.1: Regional state of play analyses
Page 197 of 274
expanded following the expansion of the agricultural water networks, built to drain marshes and to irrigate the land.
Figure 5 Relation between the hydrological network of the Po river and its tributaries and the main cities.
Agriculture: rain fed (ha), irrigated (ha), livestock, very general description here
The Po Valley is the most developed region of the country for the agro-food industry and the related agricultural sectors. Agriculture has a high productivity index, thanks to the diffusion of irrigation and mechanization. The production range is quite varied; the most common crops are cereal crops destined for human consumption (wheat, corn and rice) and forage crops (including maize). Industrial plants are mainly represented by beetroot, potato and tomato for processing, while textile crops (flax and hemp), once very important, have almost disappeared. In peri-urban areas and in some specialised areas horticulture is flourishing, while fruit growing reaches its greatest extent in Romagna. Very important, and indeed in vast areas, the main source of agricultural income is the breeding (cattle -4.188.000 heads -, pork – 2.791.000 heads-, and poultry), which feeds flourishing conservation and transformation activities.
Table 1: Irrigated area and irrigation volumes
UAA (Agri ha)
Rainfed (ha)
Irr. Area (ha)
Irr. Vol. (m3/ha)
Irr. Vol. (hm3)
% of the IT total UAA
% of the IT total Irr. Areas
% of the IT total Irr. Vol.
Po Valley (Only District)
2.770.059 1.615.887 1.154.172 6.151 7.099.879 21.6 47.7 64.0
By Regions (Total)
Piemonte 1.007.000 765.000 368.000 7.503 2.304.000 8,4 14,2 21,0
Lombardia 986.825 643.008 474.989 7.320 2.487.000 7,7 11,2 19,6
Veneto 879.554 566.879 398.774 6.882 2.301.000 7,2 10,3 17,9
Emilia Romagna
1.064.755 748.077 453.068 7.224 2.396.000 8,6 13,8 20,2
• Hydrological data (Water resources, water use and sector use)
The total annual water consumption in the Po District is of about 20.5 billon m3. Within this amount, 2.5 are for potable use, 1.5 for industrial use and 16.5 for agriculture. Groundwater extraction is of about 6 billion/ m3/ year. The remaining 14.5 billion/ m3/ year are collected from surface water bodies. The main portion of irrigated area in Italy, corresponding to almost 50%,
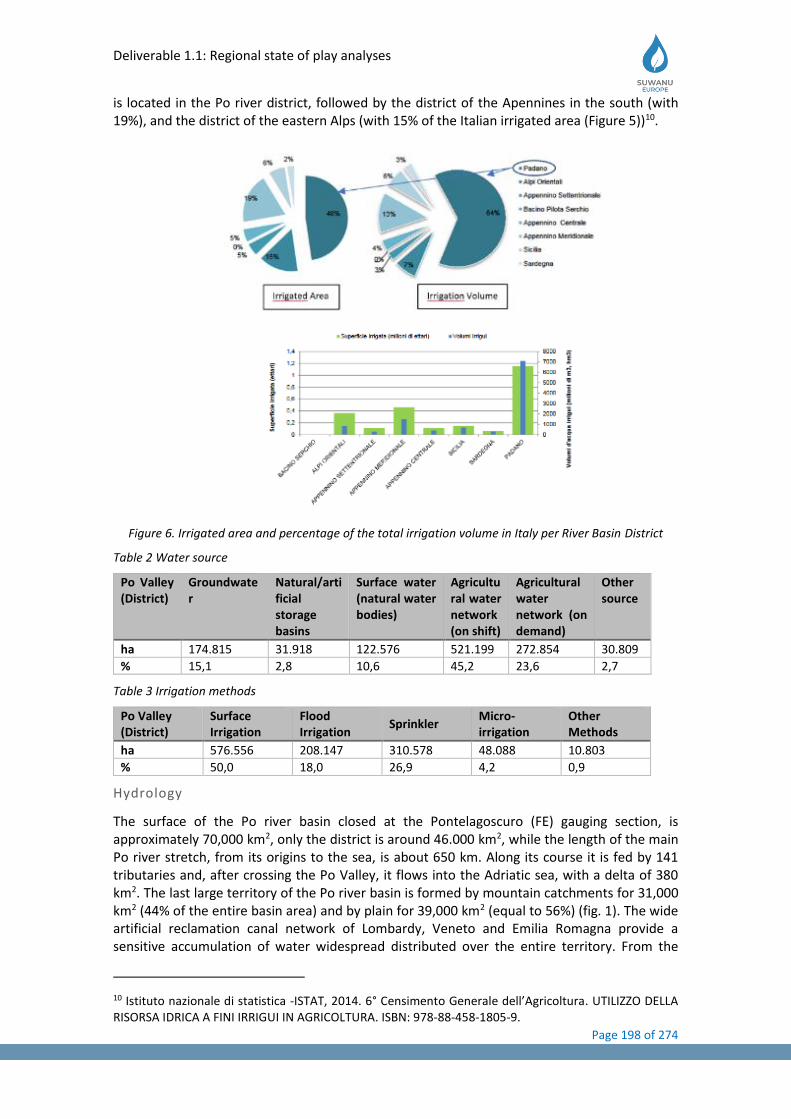
Deliverable 1.1: Regional state of play analyses
Page 198 of 274
is located in the Po river district, followed by the district of the Apennines in the south (with 19%), and the district of the eastern Alps (with 15% of the Italian irrigated area (Figure 5))10.
Figure 6. Irrigated area and percentage of the total irrigation volume in Italy per River Basin District
Table 2 Water source
Po Valley (District)
Groundwater
Natural/artificial storage basins
Surface water (natural water bodies)
Agricultural water network (on shift)
Agricultural water network (on demand)
Other source
ha 174.815 31.918 122.576 521.199 272.854 30.809
% 15,1 2,8 10,6 45,2 23,6 2,7
Table 3 Irrigation methods
Po Valley (District)
Surface Irrigation
Flood Irrigation
Sprinkler Micro-irrigation
Other Methods
ha 576.556 208.147 310.578 48.088 10.803
% 50,0 18,0 26,9 4,2 0,9
Hydrology
The surface of the Po river basin closed at the Pontelagoscuro (FE) gauging section, is approximately 70,000 km2, only the district is around 46.000 km2, while the length of the main Po river stretch, from its origins to the sea, is about 650 km. Along its course it is fed by 141 tributaries and, after crossing the Po Valley, it flows into the Adriatic sea, with a delta of 380 km2. The last large territory of the Po river basin is formed by mountain catchments for 31,000 km2 (44% of the entire basin area) and by plain for 39,000 km2 (equal to 56%) (fig. 1). The wide artificial reclamation canal network of Lombardy, Veneto and Emilia Romagna provide a sensitive accumulation of water widespread distributed over the entire territory. From the
10 Istituto nazionale di statistica -ISTAT, 2014. 6° Censimento Generale dell’Agricoltura. UTILIZZO DELLA RISORSA IDRICA A FINI IRRIGUI IN AGRICOLTURA. ISBN: 978-88-458-1805-9.

Deliverable 1.1: Regional state of play analyses
Page 199 of 274
hydrological point of view, an extremely important role is played by the huge amount of canals (especially in the vast plain area) which slow down the hydrological cycle, providing water supply for irrigation and industrial purposes and sustaining the flood lamination with the significant delay delivering water delivery to the main collector. For their storage and buffer capabilities, we must also remember the analogous situation exercised by the large pre-Alpine lakes (Garda, Iseo, Como, Maggiore), all regulated, as well as the artificial reservoirs. Mainly built for hydropower production. The total annual water volume in the basin is up to 78 billion m³, which is mainly supplied by rains. The existing reservoirs in the Po basin have a total volume that reaches 2.2 billion m3 of water which, compared to 8.4 billion m3 in reservoirs throughout Italy, represents 26% of the national lake reserves. Concerning the as for groundwater hydrology (which is less known), it, it has been highlighted that the Padano aquifer, whose consistency is estimated at over 5 billion m3, is among the biggest at European level. The. Following the monthly examination of the precipitation, five classes - provided the average monthly precipitation, which makes it possible to define the pluviometry regimes of the Po basin. During last decades, several classifications have been proposed, in terms of number, characteristics and aims, all of which originated from the classical schemes adopted in the past by the National Hydrographic Service, which envisage the five known classes of pluviometry types (fig. 3):
- The "of pluviometry are identified in the Po basin: the “continental”, characterized by maximum summer and minimum winter precipitation, affecting;
- the "alpine sub-littoral", with maximum rainfall in spring-autumn and minimum winter and summer;
- the "sublitoraneo occidentale"; - western sub-littoral"; the "Padano sub-littoral" and - the " Apennines sub-littoral", with two maximums and two minimums, with the highest
autumn maximum and the lowest summer minimum.
Concerning the basin average annual precipitation (i.e. 1100 mm), equivalent to an average annual inflow volume of approximately 77 billion m3, the Po conveys to the sea only about 2/3 of its water discharge (namely about 47 billion m3, equal to 670 mm of uniformly distributed water height). The remaining volume of 30 billion m3, corresponding to 430 mm of the water height, represents consumption for evapotranspiration, irrigation and infiltration into the soil.
6.3 Regulatory and institutional framework
6.3.1 Legal framework
The current legal framework in Italy allows reusing around 233 million m³/year, mostly to irrigate crops11. The largest European water reuse scheme for agricultural irrigation is located in Rogoredo, near Milan, where rice, corn, grass and horticulture are supplied with approximately 86 million m3/year of reclaimed water.
In Italy, the national legislation sets out very high-quality standards for agricultural, urban, and industrial application, but regional authorities may impose even stricter quality standards. It should be noted that many regions have imposed stricter quality standards, bringing the quality of reclaimed water almost to the same standard as drinking water, even for non-potable uses12.
Compared to the Commission proposal for a Regulation on water reuse, the Italian framework is quite detailed concerning the parameters controlled (and monitored). However, the Italian framework neither differentiates water uses into classes, nor considers detailed differentiation of microbial and pathogens loads. The Italian legislative framework does not include
11 BIO Deloitte, ICFGHK and Cranfield University, 2015, Optimising water reuse in the EU, Final report (data referred to the year 2006). 12 Angelakis et al. (2007) Wastewater recycling and reuse in EUREAU countries –Report for EUREAU
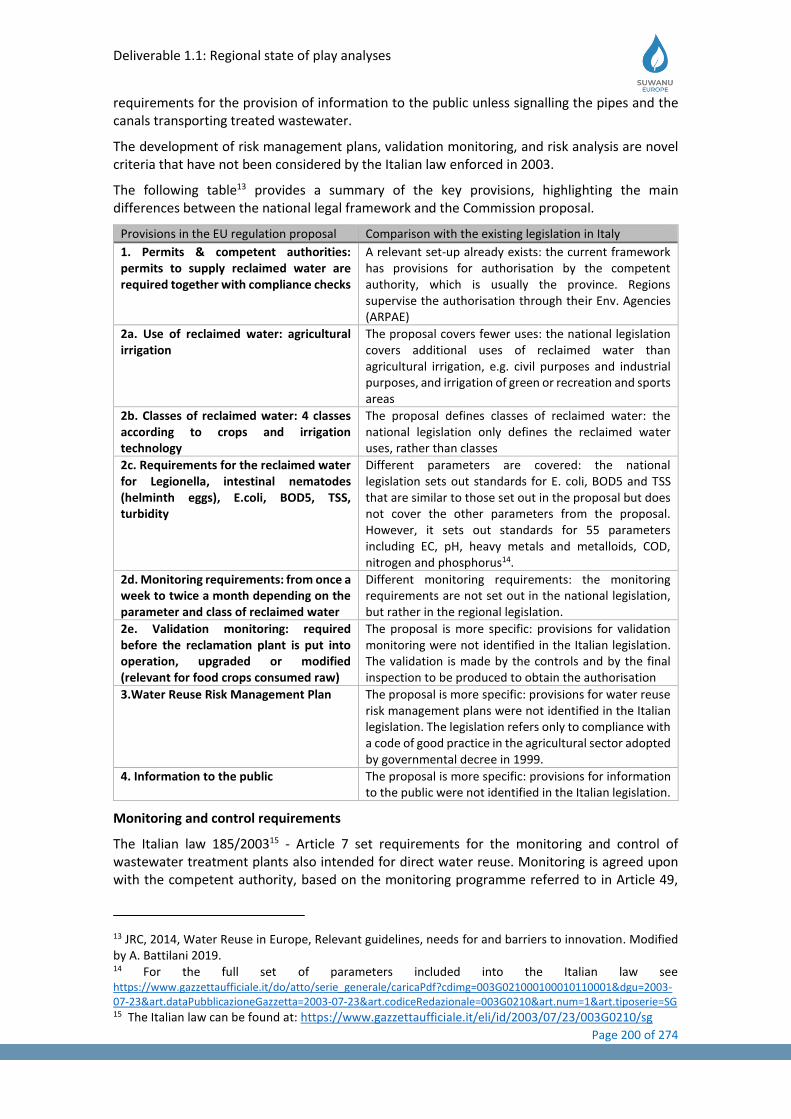
Deliverable 1.1: Regional state of play analyses
Page 200 of 274
requirements for the provision of information to the public unless signalling the pipes and the canals transporting treated wastewater.
The development of risk management plans, validation monitoring, and risk analysis are novel criteria that have not been considered by the Italian law enforced in 2003.
The following table13 provides a summary of the key provisions, highlighting the main differences between the national legal framework and the Commission proposal.
Provisions in the EU regulation proposal Comparison with the existing legislation in Italy
1. Permits & competent authorities: permits to supply reclaimed water are required together with compliance checks
A relevant set-up already exists: the current framework has provisions for authorisation by the competent authority, which is usually the province. Regions supervise the authorisation through their Env. Agencies (ARPAE)
2a. Use of reclaimed water: agricultural irrigation
The proposal covers fewer uses: the national legislation covers additional uses of reclaimed water than agricultural irrigation, e.g. civil purposes and industrial purposes, and irrigation of green or recreation and sports areas
2b. Classes of reclaimed water: 4 classes according to crops and irrigation technology
The proposal defines classes of reclaimed water: the national legislation only defines the reclaimed water uses, rather than classes
2c. Requirements for the reclaimed water for Legionella, intestinal nematodes (helminth eggs), E.coli, BOD5, TSS, turbidity
Different parameters are covered: the national legislation sets out standards for E. coli, BOD5 and TSS that are similar to those set out in the proposal but does not cover the other parameters from the proposal. However, it sets out standards for 55 parameters including EC, pH, heavy metals and metalloids, COD, nitrogen and phosphorus14.
2d. Monitoring requirements: from once a week to twice a month depending on the parameter and class of reclaimed water
Different monitoring requirements: the monitoring requirements are not set out in the national legislation, but rather in the regional legislation.
2e. Validation monitoring: required before the reclamation plant is put into operation, upgraded or modified (relevant for food crops consumed raw)
The proposal is more specific: provisions for validation monitoring were not identified in the Italian legislation. The validation is made by the controls and by the final inspection to be produced to obtain the authorisation
3.Water Reuse Risk Management Plan The proposal is more specific: provisions for water reuse risk management plans were not identified in the Italian legislation. The legislation refers only to compliance with a code of good practice in the agricultural sector adopted by governmental decree in 1999.
4. Information to the public The proposal is more specific: provisions for information to the public were not identified in the Italian legislation.
Monitoring and control requirements
The Italian law 185/200315 - Article 7 set requirements for the monitoring and control of wastewater treatment plants also intended for direct water reuse. Monitoring is agreed upon with the competent authority, based on the monitoring programme referred to in Article 49,
13 JRC, 2014, Water Reuse in Europe, Relevant guidelines, needs for and barriers to innovation. Modified by A. Battilani 2019. 14 For the full set of parameters included into the Italian law see https://www.gazzettaufficiale.it/do/atto/serie_generale/caricaPdf?cdimg=003G021000100010110001&dgu=2003-07-23&art.dataPubblicazioneGazzetta=2003-07-23&art.codiceRedazionale=003G0210&art.num=1&art.tiposerie=SG 15 The Italian law can be found at: https://www.gazzettaufficiale.it/eli/id/2003/07/23/003G0210/sg
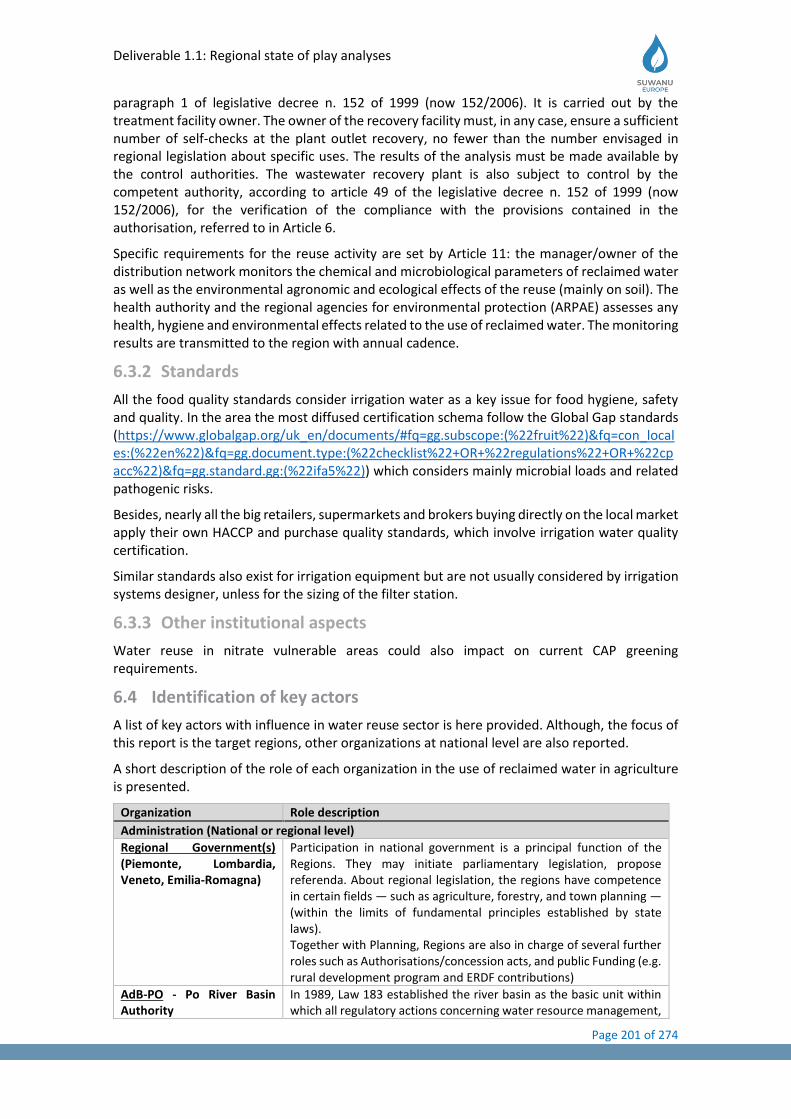
Deliverable 1.1: Regional state of play analyses
Page 201 of 274
paragraph 1 of legislative decree n. 152 of 1999 (now 152/2006). It is carried out by the treatment facility owner. The owner of the recovery facility must, in any case, ensure a sufficient number of self-checks at the plant outlet recovery, no fewer than the number envisaged in regional legislation about specific uses. The results of the analysis must be made available by the control authorities. The wastewater recovery plant is also subject to control by the competent authority, according to article 49 of the legislative decree n. 152 of 1999 (now 152/2006), for the verification of the compliance with the provisions contained in the authorisation, referred to in Article 6.
Specific requirements for the reuse activity are set by Article 11: the manager/owner of the distribution network monitors the chemical and microbiological parameters of reclaimed water as well as the environmental agronomic and ecological effects of the reuse (mainly on soil). The health authority and the regional agencies for environmental protection (ARPAE) assesses any health, hygiene and environmental effects related to the use of reclaimed water. The monitoring results are transmitted to the region with annual cadence.
6.3.2 Standards
All the food quality standards consider irrigation water as a key issue for food hygiene, safety and quality. In the area the most diffused certification schema follow the Global Gap standards (https://www.globalgap.org/uk_en/documents/#fq=gg.subscope:(%22fruit%22)&fq=con_locales:(%22en%22)&fq=gg.document.type:(%22checklist%22+OR+%22regulations%22+OR+%22cpacc%22)&fq=gg.standard.gg:(%22ifa5%22)) which considers mainly microbial loads and related pathogenic risks.
Besides, nearly all the big retailers, supermarkets and brokers buying directly on the local market apply their own HACCP and purchase quality standards, which involve irrigation water quality certification.
Similar standards also exist for irrigation equipment but are not usually considered by irrigation systems designer, unless for the sizing of the filter station.
6.3.3 Other institutional aspects
Water reuse in nitrate vulnerable areas could also impact on current CAP greening requirements.
6.4 Identification of key actors
A list of key actors with influence in water reuse sector is here provided. Although, the focus of this report is the target regions, other organizations at national level are also reported.
A short description of the role of each organization in the use of reclaimed water in agriculture is presented.
Organization Role description
Administration (National or regional level)
Regional Government(s) (Piemonte, Lombardia, Veneto, Emilia-Romagna)
Participation in national government is a principal function of the Regions. They may initiate parliamentary legislation, propose referenda. About regional legislation, the regions have competence in certain fields — such as agriculture, forestry, and town planning — (within the limits of fundamental principles established by state laws). Together with Planning, Regions are also in charge of several further roles such as Authorisations/concession acts, and public Funding (e.g. rural development program and ERDF contributions)
AdB-PO - Po River Basin Authority
In 1989, Law 183 established the river basin as the basic unit within which all regulatory actions concerning water resource management,

Deliverable 1.1: Regional state of play analyses
Page 202 of 274
water pollution control and soil protection were to be coordinated for economic and social development and environmental protection. The law also established major basin authorities and entrusted them with planning responsibilities. The Po river basin Authority has been thus created. National river basin authorities, whose members include representatives of the central and regional administrations (7 + 1 Province in the Po basin), have as their main role the preparation of basin plans, which aim to:
• protect water resources,
• mitigate hydrogeological risks (such as floods, landslides and erosion, including that of riverbanks) and
• Promote sustainable use of water resources in an environmentally conscious way.
• Rule land-use to ensure the objectives mentioned above are met.
Italian Ministries of: - Environment - Agriculture - Health
Ministers are in charge of policies and planning activities concerning their specific perimeters of action. Ministers have two distinct but co-existing roles. Politically they are the supreme executive authorities appointed by Parliament, but they are also the administrative heads of the State, whose activities they direct by the political process. As administrators, the individual ministers can produce "regulations" (regolamenti), which are legal implements subordinate to legislation (e.g. Food safety, Health protection).
ISS - Istituto Superiore Sanità
The Institute conducts scientific research in a wide variety of fields among which population-based studies of risk factors for disease and disability. Research priorities are based on those outlined in the National Health Plan. The Institute is also involved in several major clinical trials, which are frequently conducted in cooperation with the Scientific Institutes for Research and Care (IRCCS) network and Hospitals. ISS is also responsible for setting hygiene and health protection parameters and BMPs
ARPA - Regional Agency for the Protection of the Environment (Piemonte, Lombardia, Veneto, Emilia-Romagna)
Public bodies with independent status for administrative, technical-juridical, asset management and accounting purposes. They operate under the oversight of the Chairman of the Executive Committee of the regional governments to ensure compliance with the policy guidelines issued by the Regions in the fields of forecasting, preventive actions and preservation of the environment.
Municipalities (very relevant cases of cities only)
Metropolitan Cities (Turin, Milan, Bologna, Venice)
The Metropolitan Cities, as defined by law, includes large core cities and the smaller surrounding towns that are closely related to them about economic activities and essential public services, as well as to cultural relations and territorial features.
The main functions devolved to the new metropolitan cities are:
• local planning and zoning;
• provision of local police services;
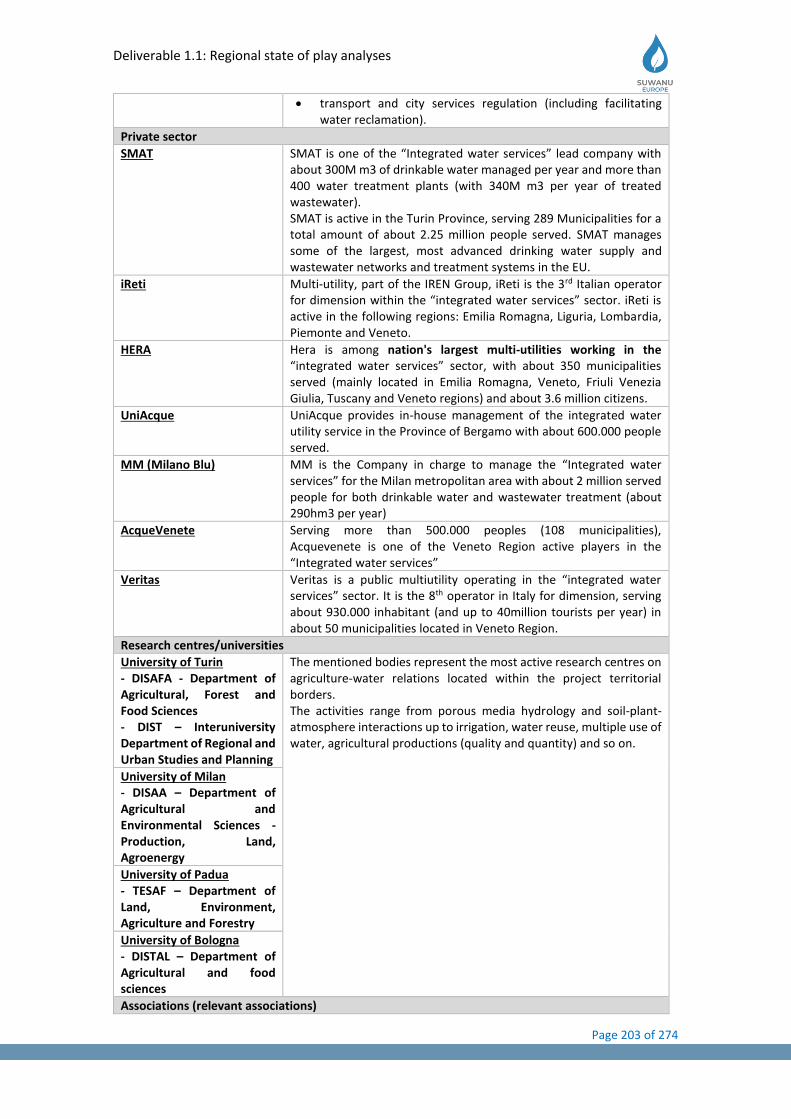
Deliverable 1.1: Regional state of play analyses
Page 203 of 274
• transport and city services regulation (including facilitating water reclamation).
Private sector
SMAT SMAT is one of the “Integrated water services” lead company with about 300M m3 of drinkable water managed per year and more than 400 water treatment plants (with 340M m3 per year of treated wastewater). SMAT is active in the Turin Province, serving 289 Municipalities for a total amount of about 2.25 million people served. SMAT manages some of the largest, most advanced drinking water supply and wastewater networks and treatment systems in the EU.
iReti Multi-utility, part of the IREN Group, iReti is the 3rd Italian operator for dimension within the “integrated water services” sector. iReti is active in the following regions: Emilia Romagna, Liguria, Lombardia, Piemonte and Veneto.
HERA Hera is among nation's largest multi-utilities working in the “integrated water services” sector, with about 350 municipalities served (mainly located in Emilia Romagna, Veneto, Friuli Venezia Giulia, Tuscany and Veneto regions) and about 3.6 million citizens.
UniAcque UniAcque provides in-house management of the integrated water utility service in the Province of Bergamo with about 600.000 people served.
MM (Milano Blu) MM is the Company in charge to manage the “Integrated water services” for the Milan metropolitan area with about 2 million served people for both drinkable water and wastewater treatment (about 290hm3 per year)
AcqueVenete Serving more than 500.000 peoples (108 municipalities), Acquevenete is one of the Veneto Region active players in the “Integrated water services”
Veritas Veritas is a public multiutility operating in the “integrated water services” sector. It is the 8th operator in Italy for dimension, serving about 930.000 inhabitant (and up to 40million tourists per year) in about 50 municipalities located in Veneto Region.
Research centres/universities
University of Turin - DISAFA - Department of Agricultural, Forest and Food Sciences - DIST – Interuniversity Department of Regional and Urban Studies and Planning
The mentioned bodies represent the most active research centres on agriculture-water relations located within the project territorial borders. The activities range from porous media hydrology and soil-plant-atmosphere interactions up to irrigation, water reuse, multiple use of water, agricultural productions (quality and quantity) and so on.
University of Milan - DISAA – Department of Agricultural and Environmental Sciences - Production, Land, Agroenergy
University of Padua - TESAF – Department of Land, Environment, Agriculture and Forestry
University of Bologna - DISTAL – Department of Agricultural and food sciences
Associations (relevant associations)
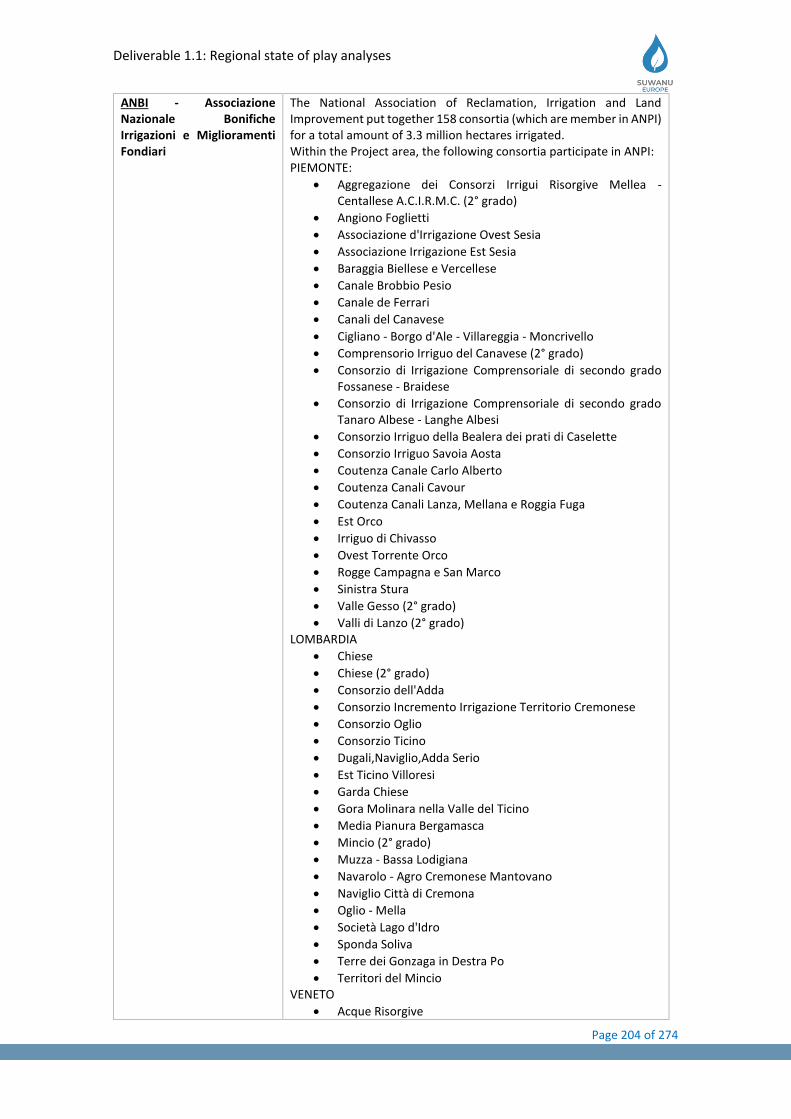
Deliverable 1.1: Regional state of play analyses
Page 204 of 274
ANBI - Associazione Nazionale Bonifiche Irrigazioni e Miglioramenti Fondiari
The National Association of Reclamation, Irrigation and Land Improvement put together 158 consortia (which are member in ANPI) for a total amount of 3.3 million hectares irrigated. Within the Project area, the following consortia participate in ANPI: PIEMONTE:
• Aggregazione dei Consorzi Irrigui Risorgive Mellea - Centallese A.C.I.R.M.C. (2° grado)
• Angiono Foglietti
• Associazione d'Irrigazione Ovest Sesia
• Associazione Irrigazione Est Sesia
• Baraggia Biellese e Vercellese
• Canale Brobbio Pesio
• Canale de Ferrari
• Canali del Canavese
• Cigliano - Borgo d'Ale - Villareggia - Moncrivello
• Comprensorio Irriguo del Canavese (2° grado)
• Consorzio di Irrigazione Comprensoriale di secondo grado Fossanese - Braidese
• Consorzio di Irrigazione Comprensoriale di secondo grado Tanaro Albese - Langhe Albesi
• Consorzio Irriguo della Bealera dei prati di Caselette
• Consorzio Irriguo Savoia Aosta
• Coutenza Canale Carlo Alberto
• Coutenza Canali Cavour
• Coutenza Canali Lanza, Mellana e Roggia Fuga
• Est Orco
• Irriguo di Chivasso
• Ovest Torrente Orco
• Rogge Campagna e San Marco
• Sinistra Stura
• Valle Gesso (2° grado)
• Valli di Lanzo (2° grado) LOMBARDIA
• Chiese
• Chiese (2° grado)
• Consorzio dell'Adda
• Consorzio Incremento Irrigazione Territorio Cremonese
• Consorzio Oglio
• Consorzio Ticino
• Dugali,Naviglio,Adda Serio
• Est Ticino Villoresi
• Garda Chiese
• Gora Molinara nella Valle del Ticino
• Media Pianura Bergamasca
• Mincio (2° grado)
• Muzza - Bassa Lodigiana
• Navarolo - Agro Cremonese Mantovano
• Naviglio Città di Cremona
• Oglio - Mella
• Società Lago d'Idro
• Sponda Soliva
• Terre dei Gonzaga in Destra Po
• Territori del Mincio VENETO
• Acque Risorgive
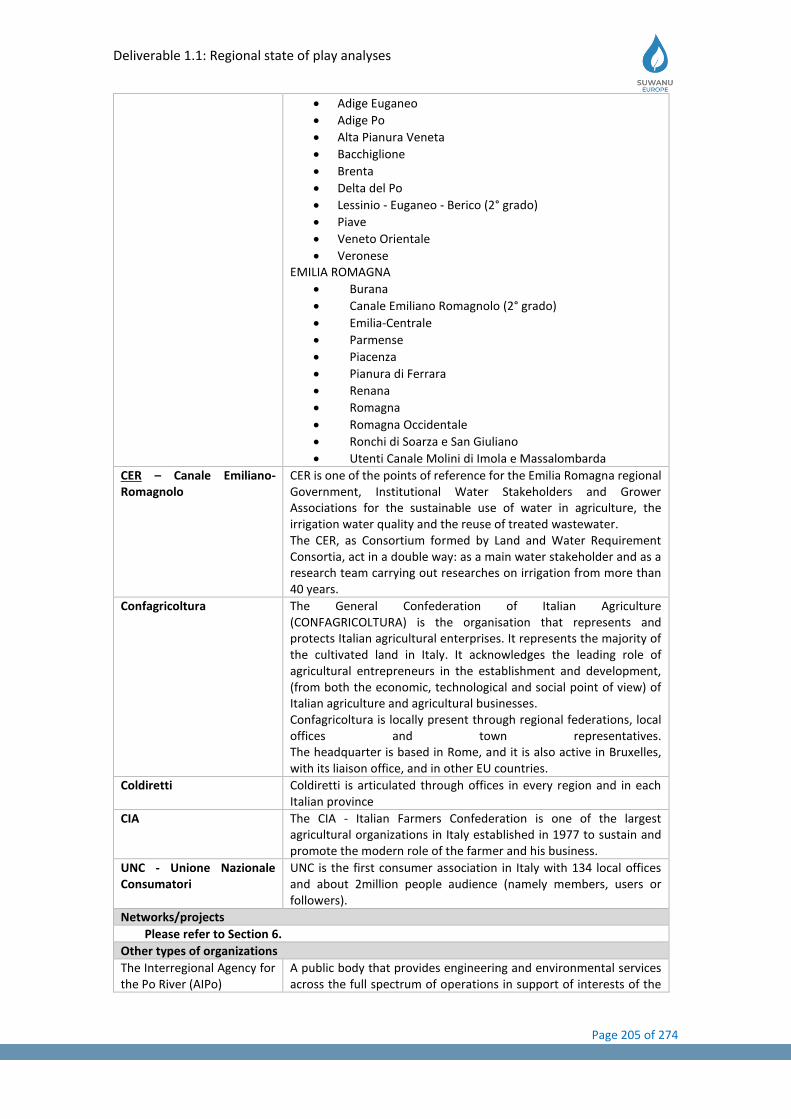
Deliverable 1.1: Regional state of play analyses
Page 205 of 274
• Adige Euganeo
• Adige Po
• Alta Pianura Veneta
• Bacchiglione
• Brenta
• Delta del Po
• Lessinio - Euganeo - Berico (2° grado)
• Piave
• Veneto Orientale
• Veronese EMILIA ROMAGNA
• Burana
• Canale Emiliano Romagnolo (2° grado)
• Emilia-Centrale
• Parmense
• Piacenza
• Pianura di Ferrara
• Renana
• Romagna
• Romagna Occidentale
• Ronchi di Soarza e San Giuliano
• Utenti Canale Molini di Imola e Massalombarda
CER – Canale Emiliano-Romagnolo
CER is one of the points of reference for the Emilia Romagna regional Government, Institutional Water Stakeholders and Grower Associations for the sustainable use of water in agriculture, the irrigation water quality and the reuse of treated wastewater. The CER, as Consortium formed by Land and Water Requirement Consortia, act in a double way: as a main water stakeholder and as a research team carrying out researches on irrigation from more than 40 years.
Confagricoltura The General Confederation of Italian Agriculture (CONFAGRICOLTURA) is the organisation that represents and protects Italian agricultural enterprises. It represents the majority of the cultivated land in Italy. It acknowledges the leading role of agricultural entrepreneurs in the establishment and development, (from both the economic, technological and social point of view) of Italian agriculture and agricultural businesses. Confagricoltura is locally present through regional federations, local offices and town representatives. The headquarter is based in Rome, and it is also active in Bruxelles, with its liaison office, and in other EU countries.
Coldiretti Coldiretti is articulated through offices in every region and in each Italian province
CIA The CIA - Italian Farmers Confederation is one of the largest agricultural organizations in Italy established in 1977 to sustain and promote the modern role of the farmer and his business.
UNC - Unione Nazionale Consumatori
UNC is the first consumer association in Italy with 134 local offices and about 2million people audience (namely members, users or followers).
Networks/projects
Please refer to Section 6.
Other types of organizations
The Interregional Agency for the Po River (AIPo)
A public body that provides engineering and environmental services across the full spectrum of operations in support of interests of the
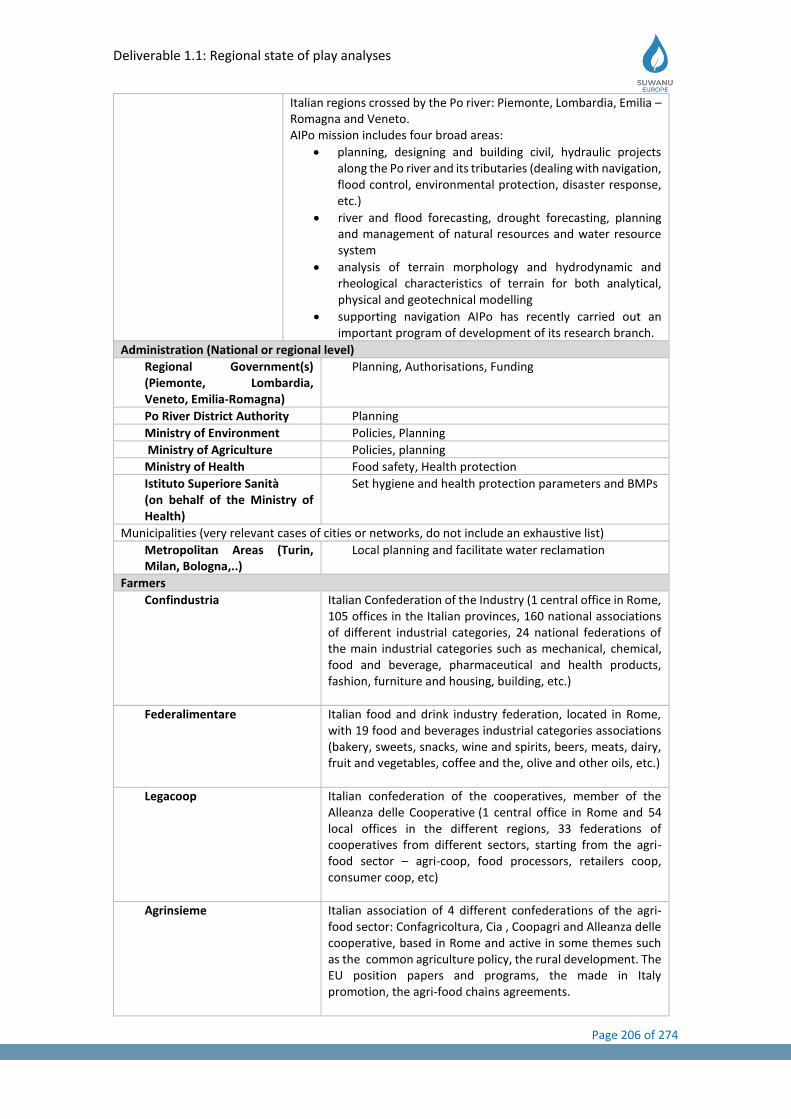
Deliverable 1.1: Regional state of play analyses
Page 206 of 274
Italian regions crossed by the Po river: Piemonte, Lombardia, Emilia – Romagna and Veneto. AIPo mission includes four broad areas:
• planning, designing and building civil, hydraulic projects along the Po river and its tributaries (dealing with navigation, flood control, environmental protection, disaster response, etc.)
• river and flood forecasting, drought forecasting, planning and management of natural resources and water resource system
• analysis of terrain morphology and hydrodynamic and rheological characteristics of terrain for both analytical, physical and geotechnical modelling
• supporting navigation AIPo has recently carried out an important program of development of its research branch.
Administration (National or regional level)
Regional Government(s) (Piemonte, Lombardia, Veneto, Emilia-Romagna)
Planning, Authorisations, Funding
Po River District Authority Planning
Ministry of Environment Policies, Planning
Ministry of Agriculture Policies, planning
Ministry of Health Food safety, Health protection
Istituto Superiore Sanità (on behalf of the Ministry of Health)
Set hygiene and health protection parameters and BMPs
Municipalities (very relevant cases of cities or networks, do not include an exhaustive list)
Metropolitan Areas (Turin, Milan, Bologna,..)
Local planning and facilitate water reclamation
Farmers
Confindustria Italian Confederation of the Industry (1 central office in Rome, 105 offices in the Italian provinces, 160 national associations of different industrial categories, 24 national federations of the main industrial categories such as mechanical, chemical, food and beverage, pharmaceutical and health products, fashion, furniture and housing, building, etc.)
Federalimentare Italian food and drink industry federation, located in Rome, with 19 food and beverages industrial categories associations (bakery, sweets, snacks, wine and spirits, beers, meats, dairy, fruit and vegetables, coffee and the, olive and other oils, etc.)
Legacoop Italian confederation of the cooperatives, member of the Alleanza delle Cooperative (1 central office in Rome and 54 local offices in the different regions, 33 federations of cooperatives from different sectors, starting from the agri-food sector – agri-coop, food processors, retailers coop, consumer coop, etc)
Agrinsieme Italian association of 4 different confederations of the agri-food sector: Confagricoltura, Cia , Coopagri and Alleanza delle cooperative, based in Rome and active in some themes such as the common agriculture policy, the rural development. The EU position papers and programs, the made in Italy promotion, the agri-food chains agreements.
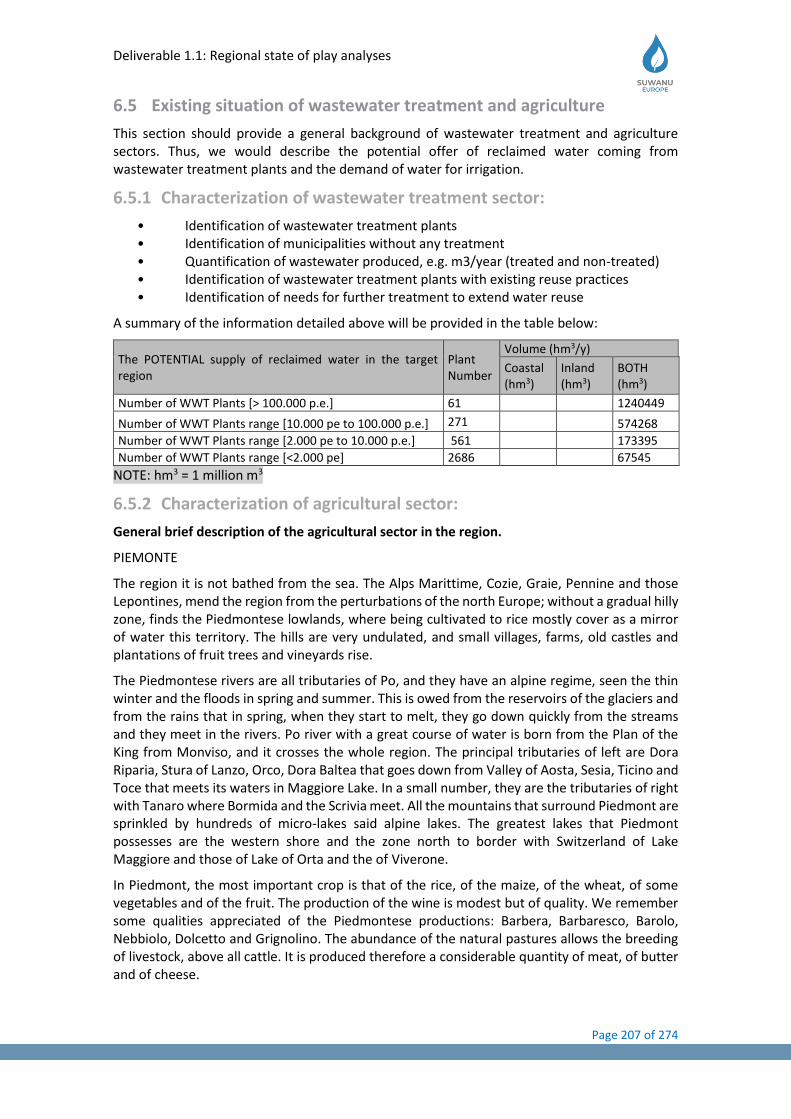
Deliverable 1.1: Regional state of play analyses
Page 207 of 274
6.5 Existing situation of wastewater treatment and agriculture
This section should provide a general background of wastewater treatment and agriculture sectors. Thus, we would describe the potential offer of reclaimed water coming from wastewater treatment plants and the demand of water for irrigation.
6.5.1 Characterization of wastewater treatment sector:
• Identification of wastewater treatment plants • Identification of municipalities without any treatment • Quantification of wastewater produced, e.g. m3/year (treated and non-treated) • Identification of wastewater treatment plants with existing reuse practices • Identification of needs for further treatment to extend water reuse
A summary of the information detailed above will be provided in the table below:
The POTENTIAL supply of reclaimed water in the target region
Plant Number
Volume (hm3/y)
Coastal (hm3)
Inland (hm3)
BOTH (hm3)
Number of WWT Plants [> 100.000 p.e.] 61 1240449
Number of WWT Plants range [10.000 pe to 100.000 p.e.] 271 574268
Number of WWT Plants range [2.000 pe to 10.000 p.e.] 561 173395
Number of WWT Plants range [<2.000 pe] 2686 67545
NOTE: hm3 = 1 million m3
6.5.2 Characterization of agricultural sector:
General brief description of the agricultural sector in the region.
PIEMONTE
The region it is not bathed from the sea. The Alps Marittime, Cozie, Graie, Pennine and those Lepontines, mend the region from the perturbations of the north Europe; without a gradual hilly zone, finds the Piedmontese lowlands, where being cultivated to rice mostly cover as a mirror of water this territory. The hills are very undulated, and small villages, farms, old castles and plantations of fruit trees and vineyards rise.
The Piedmontese rivers are all tributaries of Po, and they have an alpine regime, seen the thin winter and the floods in spring and summer. This is owed from the reservoirs of the glaciers and from the rains that in spring, when they start to melt, they go down quickly from the streams and they meet in the rivers. Po river with a great course of water is born from the Plan of the King from Monviso, and it crosses the whole region. The principal tributaries of left are Dora Riparia, Stura of Lanzo, Orco, Dora Baltea that goes down from Valley of Aosta, Sesia, Ticino and Toce that meets its waters in Maggiore Lake. In a small number, they are the tributaries of right with Tanaro where Bormida and the Scrivia meet. All the mountains that surround Piedmont are sprinkled by hundreds of micro-lakes said alpine lakes. The greatest lakes that Piedmont possesses are the western shore and the zone north to border with Switzerland of Lake Maggiore and those of Lake of Orta and the of Viverone.
In Piedmont, the most important crop is that of the rice, of the maize, of the wheat, of some vegetables and of the fruit. The production of the wine is modest but of quality. We remember some qualities appreciated of the Piedmontese productions: Barbera, Barbaresco, Barolo, Nebbiolo, Dolcetto and Grignolino. The abundance of the natural pastures allows the breeding of livestock, above all cattle. It is produced therefore a considerable quantity of meat, of butter and of cheese.
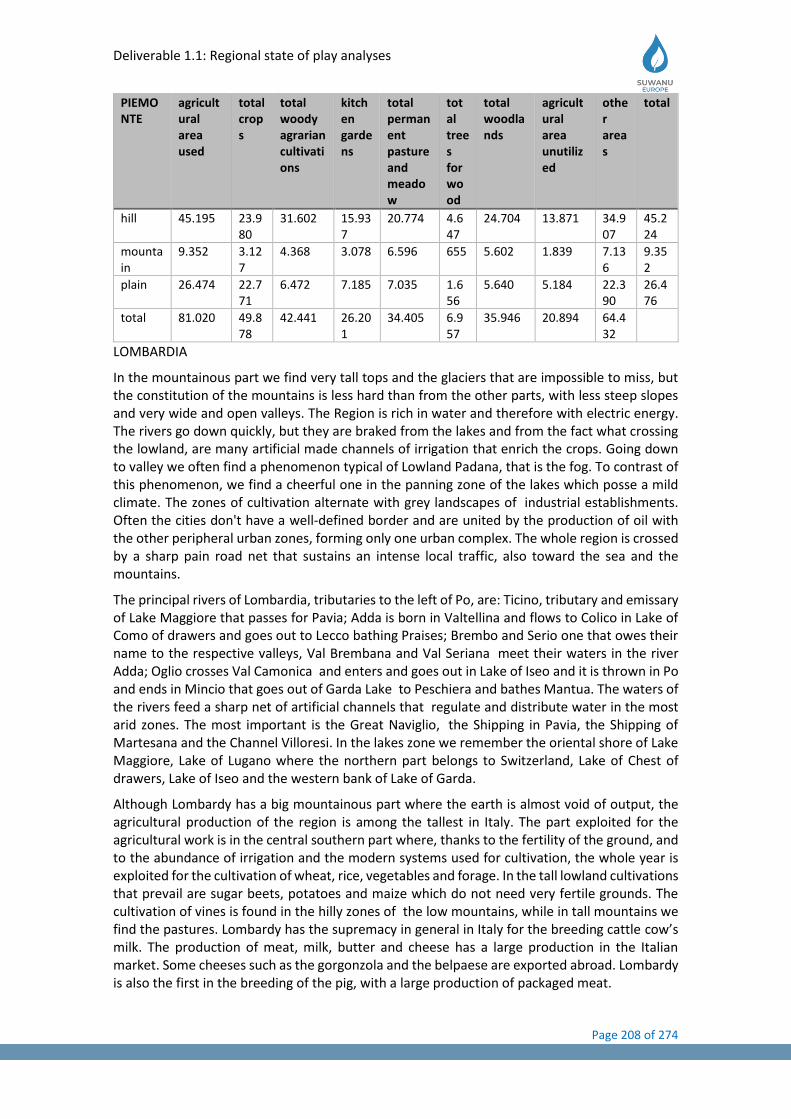
Deliverable 1.1: Regional state of play analyses
Page 208 of 274
PIEMONTE
agricultural area used
total crops
total woody agrarian cultivations
kitchen gardens
total permanent pasture and meadow
total trees for wood
total woodlands
agricultural area unutilized
other areas
total
hill 45.195 23.980
31.602 15.937
20.774 4.647
24.704 13.871 34.907
45.224
mountain
9.352 3.127
4.368 3.078 6.596 655 5.602 1.839 7.136
9.352
plain 26.474 22.771
6.472 7.185 7.035 1.656
5.640 5.184 22.390
26.476
total 81.020 49.878
42.441 26.201
34.405 6.957
35.946 20.894 64.432
LOMBARDIA
In the mountainous part we find very tall tops and the glaciers that are impossible to miss, but the constitution of the mountains is less hard than from the other parts, with less steep slopes and very wide and open valleys. The Region is rich in water and therefore with electric energy. The rivers go down quickly, but they are braked from the lakes and from the fact what crossing the lowland, are many artificial made channels of irrigation that enrich the crops. Going down to valley we often find a phenomenon typical of Lowland Padana, that is the fog. To contrast of this phenomenon, we find a cheerful one in the panning zone of the lakes which posse a mild climate. The zones of cultivation alternate with grey landscapes of industrial establishments. Often the cities don't have a well-defined border and are united by the production of oil with the other peripheral urban zones, forming only one urban complex. The whole region is crossed by a sharp pain road net that sustains an intense local traffic, also toward the sea and the mountains.
The principal rivers of Lombardia, tributaries to the left of Po, are: Ticino, tributary and emissary of Lake Maggiore that passes for Pavia; Adda is born in Valtellina and flows to Colico in Lake of Como of drawers and goes out to Lecco bathing Praises; Brembo and Serio one that owes their name to the respective valleys, Val Brembana and Val Seriana meet their waters in the river Adda; Oglio crosses Val Camonica and enters and goes out in Lake of Iseo and it is thrown in Po and ends in Mincio that goes out of Garda Lake to Peschiera and bathes Mantua. The waters of the rivers feed a sharp net of artificial channels that regulate and distribute water in the most arid zones. The most important is the Great Naviglio, the Shipping in Pavia, the Shipping of Martesana and the Channel Villoresi. In the lakes zone we remember the oriental shore of Lake Maggiore, Lake of Lugano where the northern part belongs to Switzerland, Lake of Chest of drawers, Lake of Iseo and the western bank of Lake of Garda.
Although Lombardy has a big mountainous part where the earth is almost void of output, the agricultural production of the region is among the tallest in Italy. The part exploited for the agricultural work is in the central southern part where, thanks to the fertility of the ground, and to the abundance of irrigation and the modern systems used for cultivation, the whole year is exploited for the cultivation of wheat, rice, vegetables and forage. In the tall lowland cultivations that prevail are sugar beets, potatoes and maize which do not need very fertile grounds. The cultivation of vines is found in the hilly zones of the low mountains, while in tall mountains we find the pastures. Lombardy has the supremacy in general in Italy for the breeding cattle cow’s milk. The production of meat, milk, butter and cheese has a large production in the Italian market. Some cheeses such as the gorgonzola and the belpaese are exported abroad. Lombardy is also the first in the breeding of the pig, with a large production of packaged meat.
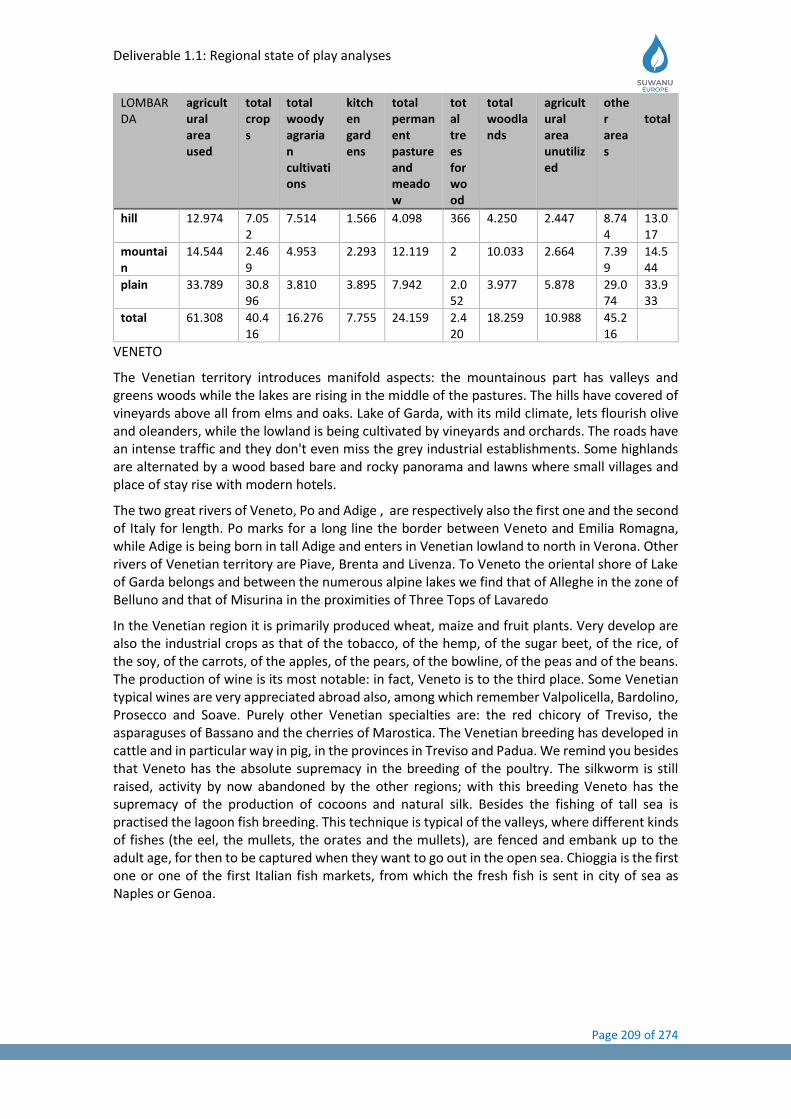
Deliverable 1.1: Regional state of play analyses
Page 209 of 274
LOMBARDA
agricultural area used
total crops
total woody agrarian cultivations
kitchen gardens
total permanent pasture and meadow
total trees for wood
total woodlands
agricultural area unutilized
other areas
total
hill 12.974 7.052
7.514 1.566 4.098 366 4.250 2.447 8.744
13.017
mountain
14.544 2.469
4.953 2.293 12.119 2 10.033 2.664 7.399
14.544
plain 33.789 30.896
3.810 3.895 7.942 2.052
3.977 5.878 29.074
33.933
total 61.308 40.416
16.276 7.755 24.159 2.420
18.259 10.988 45.216
VENETO
The Venetian territory introduces manifold aspects: the mountainous part has valleys and greens woods while the lakes are rising in the middle of the pastures. The hills have covered of vineyards above all from elms and oaks. Lake of Garda, with its mild climate, lets flourish olive and oleanders, while the lowland is being cultivated by vineyards and orchards. The roads have an intense traffic and they don't even miss the grey industrial establishments. Some highlands are alternated by a wood based bare and rocky panorama and lawns where small villages and place of stay rise with modern hotels.
The two great rivers of Veneto, Po and Adige , are respectively also the first one and the second of Italy for length. Po marks for a long line the border between Veneto and Emilia Romagna, while Adige is being born in tall Adige and enters in Venetian lowland to north in Verona. Other rivers of Venetian territory are Piave, Brenta and Livenza. To Veneto the oriental shore of Lake of Garda belongs and between the numerous alpine lakes we find that of Alleghe in the zone of Belluno and that of Misurina in the proximities of Three Tops of Lavaredo
In the Venetian region it is primarily produced wheat, maize and fruit plants. Very develop are also the industrial crops as that of the tobacco, of the hemp, of the sugar beet, of the rice, of the soy, of the carrots, of the apples, of the pears, of the bowline, of the peas and of the beans. The production of wine is its most notable: in fact, Veneto is to the third place. Some Venetian typical wines are very appreciated abroad also, among which remember Valpolicella, Bardolino, Prosecco and Soave. Purely other Venetian specialties are: the red chicory of Treviso, the asparaguses of Bassano and the cherries of Marostica. The Venetian breeding has developed in cattle and in particular way in pig, in the provinces in Treviso and Padua. We remind you besides that Veneto has the absolute supremacy in the breeding of the poultry. The silkworm is still raised, activity by now abandoned by the other regions; with this breeding Veneto has the supremacy of the production of cocoons and natural silk. Besides the fishing of tall sea is practised the lagoon fish breeding. This technique is typical of the valleys, where different kinds of fishes (the eel, the mullets, the orates and the mullets), are fenced and embank up to the adult age, for then to be captured when they want to go out in the open sea. Chioggia is the first one or one of the first Italian fish markets, from which the fresh fish is sent in city of sea as Naples or Genoa.
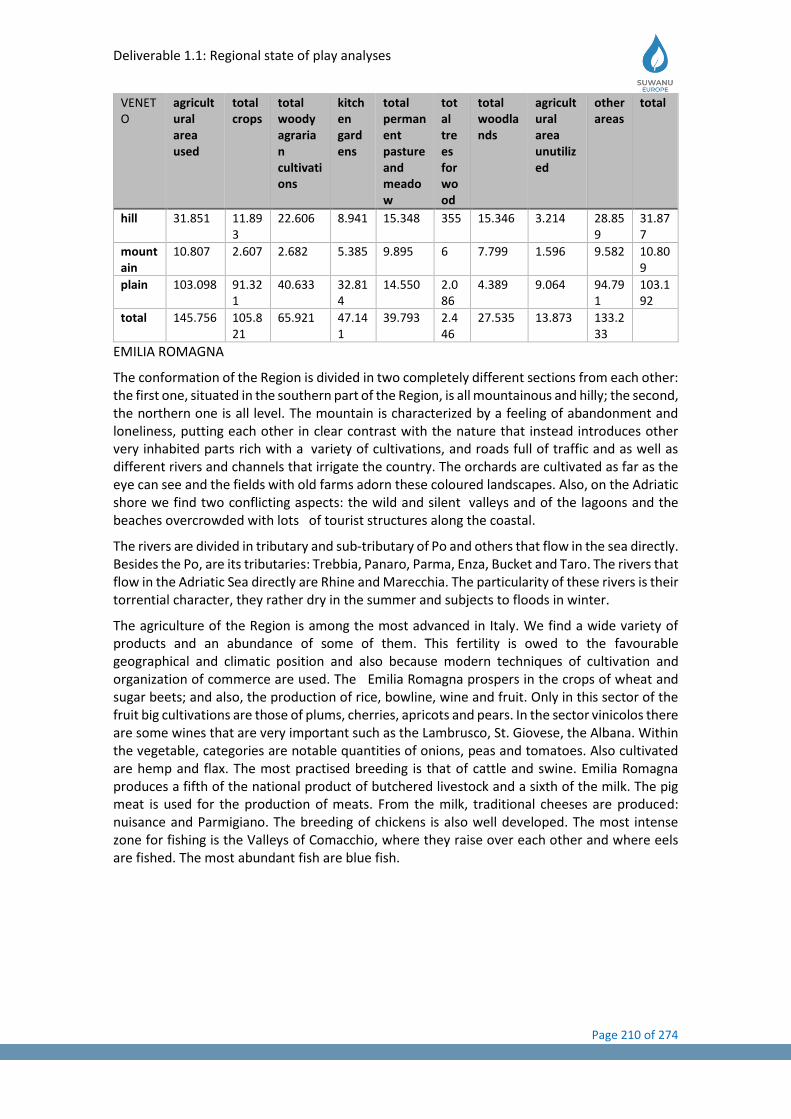
Deliverable 1.1: Regional state of play analyses
Page 210 of 274
VENETO
agricultural area used
total crops
total woody agrarian cultivations
kitchen gardens
total permanent pasture and meadow
total trees for wood
total woodlands
agricultural area unutilized
other areas
total
hill 31.851 11.893
22.606 8.941 15.348 355 15.346 3.214 28.859
31.877
mountain
10.807 2.607 2.682 5.385 9.895 6 7.799 1.596 9.582 10.809
plain 103.098 91.321
40.633 32.814
14.550 2.086
4.389 9.064 94.791
103.192
total 145.756 105.821
65.921 47.141
39.793 2.446
27.535 13.873 133.233
EMILIA ROMAGNA
The conformation of the Region is divided in two completely different sections from each other: the first one, situated in the southern part of the Region, is all mountainous and hilly; the second, the northern one is all level. The mountain is characterized by a feeling of abandonment and loneliness, putting each other in clear contrast with the nature that instead introduces other very inhabited parts rich with a variety of cultivations, and roads full of traffic and as well as different rivers and channels that irrigate the country. The orchards are cultivated as far as the eye can see and the fields with old farms adorn these coloured landscapes. Also, on the Adriatic shore we find two conflicting aspects: the wild and silent valleys and of the lagoons and the beaches overcrowded with lots of tourist structures along the coastal.
The rivers are divided in tributary and sub-tributary of Po and others that flow in the sea directly. Besides the Po, are its tributaries: Trebbia, Panaro, Parma, Enza, Bucket and Taro. The rivers that flow in the Adriatic Sea directly are Rhine and Marecchia. The particularity of these rivers is their torrential character, they rather dry in the summer and subjects to floods in winter.
The agriculture of the Region is among the most advanced in Italy. We find a wide variety of products and an abundance of some of them. This fertility is owed to the favourable geographical and climatic position and also because modern techniques of cultivation and organization of commerce are used. The Emilia Romagna prospers in the crops of wheat and sugar beets; and also, the production of rice, bowline, wine and fruit. Only in this sector of the fruit big cultivations are those of plums, cherries, apricots and pears. In the sector vinicolos there are some wines that are very important such as the Lambrusco, St. Giovese, the Albana. Within the vegetable, categories are notable quantities of onions, peas and tomatoes. Also cultivated are hemp and flax. The most practised breeding is that of cattle and swine. Emilia Romagna produces a fifth of the national product of butchered livestock and a sixth of the milk. The pig meat is used for the production of meats. From the milk, traditional cheeses are produced: nuisance and Parmigiano. The breeding of chickens is also well developed. The most intense zone for fishing is the Valleys of Comacchio, where they raise over each other and where eels are fished. The most abundant fish are blue fish.
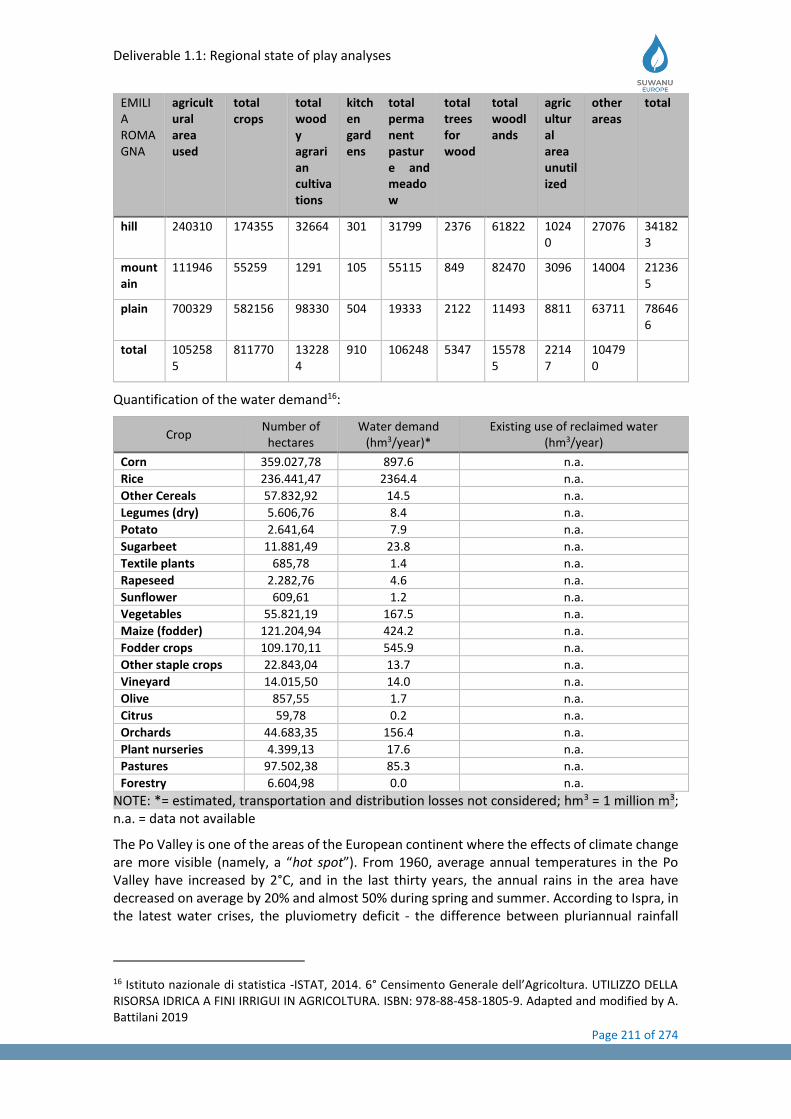
Deliverable 1.1: Regional state of play analyses
Page 211 of 274
EMILIA ROMAGNA
agricultural area used
total crops
total woody agrarian cultivations
kitchen gardens
total permanent pasture and meadow
total trees for wood
total woodlands
agricultural area unutilized
other areas
total
hill 240310 174355 32664 301 31799 2376 61822 10240
27076 341823
mountain
111946 55259 1291 105 55115 849 82470 3096 14004 212365
plain 700329 582156 98330 504 19333 2122 11493 8811 63711 786466
total 1052585
811770 132284
910 106248 5347 155785
22147
104790
Quantification of the water demand16:
Crop Number of hectares
Water demand (hm3/year)*
Existing use of reclaimed water (hm3/year)
Corn 359.027,78 897.6 n.a.
Rice 236.441,47 2364.4 n.a.
Other Cereals 57.832,92 14.5 n.a.
Legumes (dry) 5.606,76 8.4 n.a.
Potato 2.641,64 7.9 n.a.
Sugarbeet 11.881,49 23.8 n.a.
Textile plants 685,78 1.4 n.a.
Rapeseed 2.282,76 4.6 n.a.
Sunflower 609,61 1.2 n.a.
Vegetables 55.821,19 167.5 n.a.
Maize (fodder) 121.204,94 424.2 n.a.
Fodder crops 109.170,11 545.9 n.a.
Other staple crops 22.843,04 13.7 n.a.
Vineyard 14.015,50 14.0 n.a.
Olive 857,55 1.7 n.a.
Citrus 59,78 0.2 n.a.
Orchards 44.683,35 156.4 n.a.
Plant nurseries 4.399,13 17.6 n.a.
Pastures 97.502,38 85.3 n.a.
Forestry 6.604,98 0.0 n.a.
NOTE: *= estimated, transportation and distribution losses not considered; hm3 = 1 million m3; n.a. = data not available
The Po Valley is one of the areas of the European continent where the effects of climate change are more visible (namely, a “hot spot”). From 1960, average annual temperatures in the Po Valley have increased by 2°C, and in the last thirty years, the annual rains in the area have decreased on average by 20% and almost 50% during spring and summer. According to Ispra, in the latest water crises, the pluviometry deficit - the difference between pluriannual rainfall
16 Istituto nazionale di statistica -ISTAT, 2014. 6° Censimento Generale dell’Agricoltura. UTILIZZO DELLA RISORSA IDRICA A FINI IRRIGUI IN AGRICOLTURA. ISBN: 978-88-458-1805-9. Adapted and modified by A. Battilani 2019

Deliverable 1.1: Regional state of play analyses
Page 212 of 274
average and how much it falls - reached 30-40% in 2012 and 2017. Moreover, even 40-50% in 2007.
The 2017 drought, although with jeopardised intensity and affecting in different ways the crops, caused losses of about 2 billion euro to the agricultural sector, not considering long term damages to natural ecosystems and to the agro-ecosystems. The damages mostly related to quantitative production losses, but also to lower quality of agricultural production involving price reductions, stock rejection and penalties for farmers.
Non-irrigated sector in the region.
In the area, the only those crops that are not irrigated are those that cannot pay back the cost of the irrigation. Some niche production is not irrigated aiming to higher quality or organoleptic characteristics, able to compensate with the higher price the production losses. One of the most diffused rainfed crop is the winter wheat, although pilot studies indicate that it would greatly benefit of targeted irrigations in sensible phenological stages.
Agribusiness description
The food sector is one of the most important Italian industries, employing around 385,000 people and generating a total turnover of more than EUR 142 billion in 2018, with both domestic and export sales being robust. There has been a modest increase in turnover since the fourth quarter after years of rather stagnant domestic consumption. Many Italian food businesses (especially in the pasta and bakery segments) benefit from the strong international reputation of the “Made in Italy” trademark, in particular in Piemonte, Lombardia, Veneto and Emilia Romagna Regions.
The 4 regions food and beverages sector value added growth is expected to increase 2.2% in 2017 and 2.4% in 2018, mainly driven by exports, while domestic demand is expected to remain stable. Profit margins are also expected to remain stable, although on a generally low level. Food producers and processors are often highly geared in order to maintain working capital requirements. However, due to its anticyclical business performance lending to the food industry remains appealing to banks and other financial institutions, enabling them to diversify asset investments.
Italian food sector production, processing and retail remain heavily fragmented, with a very competitive business environment. Even the biggest Italian food retail businesses are small compared to other major international players. The average size of food producers is typically small, which often hampers international expansion. At the same time e-commerce is increasingly challenging traditional brick-and-mortar food retailers. In order to consolidate their market, position a concentration process among Italian food retailers is ongoing.
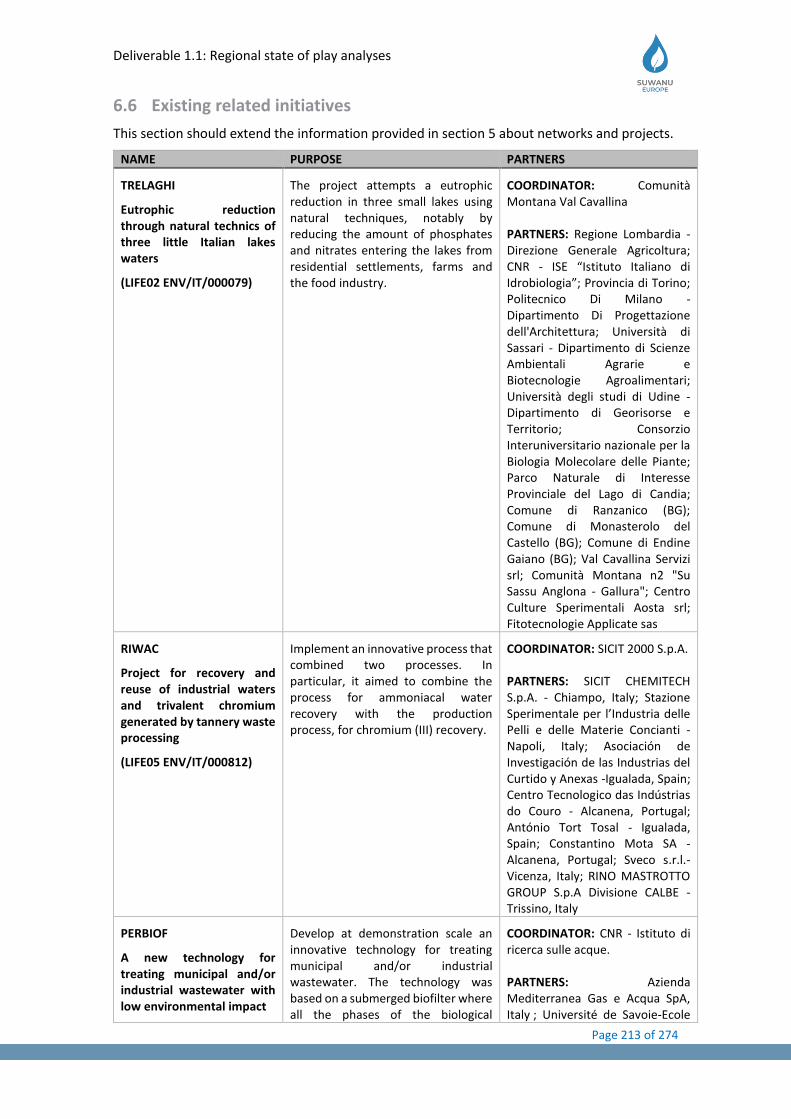
Deliverable 1.1: Regional state of play analyses
Page 213 of 274
6.6 Existing related initiatives
This section should extend the information provided in section 5 about networks and projects.
NAME PURPOSE PARTNERS
TRELAGHI
Eutrophic reduction through natural technics of three little Italian lakes waters
(LIFE02 ENV/IT/000079)
The project attempts a eutrophic reduction in three small lakes using natural techniques, notably by reducing the amount of phosphates and nitrates entering the lakes from residential settlements, farms and the food industry.
COORDINATOR: Comunità Montana Val Cavallina PARTNERS: Regione Lombardia - Direzione Generale Agricoltura; CNR - ISE “Istituto Italiano di Idrobiologia”; Provincia di Torino; Politecnico Di Milano - Dipartimento Di Progettazione dell'Architettura; Università di Sassari - Dipartimento di Scienze Ambientali Agrarie e Biotecnologie Agroalimentari; Università degli studi di Udine - Dipartimento di Georisorse e Territorio; Consorzio Interuniversitario nazionale per la Biologia Molecolare delle Piante; Parco Naturale di Interesse Provinciale del Lago di Candia; Comune di Ranzanico (BG); Comune di Monasterolo del Castello (BG); Comune di Endine Gaiano (BG); Val Cavallina Servizi srl; Comunità Montana n2 "Su Sassu Anglona - Gallura"; Centro Culture Sperimentali Aosta srl; Fitotecnologie Applicate sas
RIWAC
Project for recovery and reuse of industrial waters and trivalent chromium generated by tannery waste processing
(LIFE05 ENV/IT/000812)
Implement an innovative process that combined two processes. In particular, it aimed to combine the process for ammoniacal water recovery with the production process, for chromium (III) recovery.
COORDINATOR: SICIT 2000 S.p.A. PARTNERS: SICIT CHEMITECH S.p.A. - Chiampo, Italy; Stazione Sperimentale per l’Industria delle Pelli e delle Materie Concianti - Napoli, Italy; Asociación de Investigación de las Industrias del Curtido y Anexas -Igualada, Spain; Centro Tecnologico das Indústrias do Couro - Alcanena, Portugal; António Tort Tosal - Igualada, Spain; Constantino Mota SA - Alcanena, Portugal; Sveco s.r.l.-Vicenza, Italy; RINO MASTROTTO GROUP S.p.A Divisione CALBE - Trissino, Italy
PERBIOF
A new technology for treating municipal and/or industrial wastewater with low environmental impact
Develop at demonstration scale an innovative technology for treating municipal and/or industrial wastewater. The technology was based on a submerged biofilter where all the phases of the biological
COORDINATOR: CNR - Istituto di ricerca sulle acque. PARTNERS: Azienda Mediterranea Gas e Acqua SpA, Italy ; Université de Savoie-Ecole
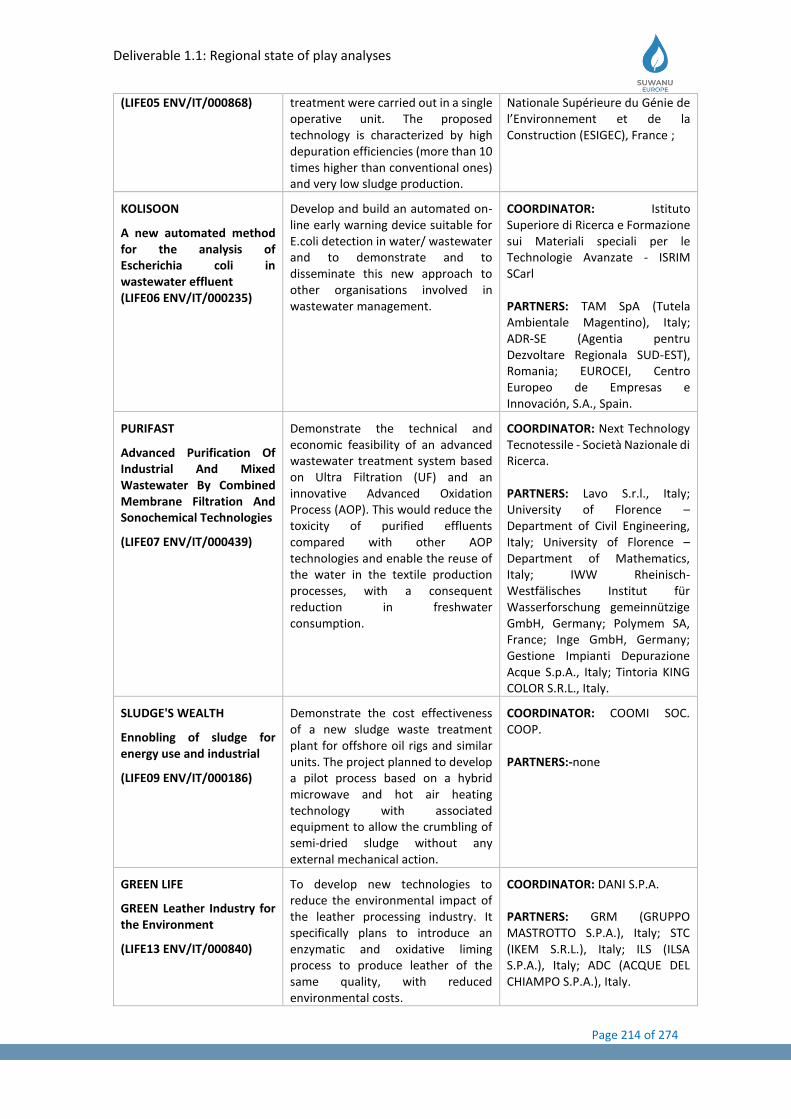
Deliverable 1.1: Regional state of play analyses
Page 214 of 274
(LIFE05 ENV/IT/000868) treatment were carried out in a single operative unit. The proposed technology is characterized by high depuration efficiencies (more than 10 times higher than conventional ones) and very low sludge production.
Nationale Supérieure du Génie de l’Environnement et de la Construction (ESIGEC), France ;
KOLISOON
A new automated method for the analysis of Escherichia coli in wastewater effluent (LIFE06 ENV/IT/000235)
Develop and build an automated on-line early warning device suitable for E.coli detection in water/ wastewater and to demonstrate and to disseminate this new approach to other organisations involved in wastewater management.
COORDINATOR: Istituto Superiore di Ricerca e Formazione sui Materiali speciali per le Technologie Avanzate - ISRIM SCarl PARTNERS: TAM SpA (Tutela Ambientale Magentino), Italy; ADR-SE (Agentia pentru Dezvoltare Regionala SUD-EST), Romania; EUROCEI, Centro Europeo de Empresas e Innovación, S.A., Spain.
PURIFAST
Advanced Purification Of Industrial And Mixed Wastewater By Combined Membrane Filtration And Sonochemical Technologies
(LIFE07 ENV/IT/000439)
Demonstrate the technical and economic feasibility of an advanced wastewater treatment system based on Ultra Filtration (UF) and an innovative Advanced Oxidation Process (AOP). This would reduce the toxicity of purified effluents compared with other AOP technologies and enable the reuse of the water in the textile production processes, with a consequent reduction in freshwater consumption.
COORDINATOR: Next Technology Tecnotessile - Società Nazionale di Ricerca. PARTNERS: Lavo S.r.l., Italy; University of Florence – Department of Civil Engineering, Italy; University of Florence – Department of Mathematics, Italy; IWW Rheinisch-Westfälisches Institut für Wasserforschung gemeinnützige GmbH, Germany; Polymem SA, France; Inge GmbH, Germany; Gestione Impianti Depurazione Acque S.p.A., Italy; Tintoria KING COLOR S.R.L., Italy.
SLUDGE'S WEALTH
Ennobling of sludge for energy use and industrial
(LIFE09 ENV/IT/000186)
Demonstrate the cost effectiveness of a new sludge waste treatment plant for offshore oil rigs and similar units. The project planned to develop a pilot process based on a hybrid microwave and hot air heating technology with associated equipment to allow the crumbling of semi-dried sludge without any external mechanical action.
COORDINATOR: COOMI SOC. COOP. PARTNERS:-none
GREEN LIFE
GREEN Leather Industry for the Environment
(LIFE13 ENV/IT/000840)
To develop new technologies to reduce the environmental impact of the leather processing industry. It specifically plans to introduce an enzymatic and oxidative liming process to produce leather of the same quality, with reduced environmental costs.
COORDINATOR: DANI S.P.A. PARTNERS: GRM (GRUPPO MASTROTTO S.P.A.), Italy; STC (IKEM S.R.L.), Italy; ILS (ILSA S.P.A.), Italy; ADC (ACQUE DEL CHIAMPO S.P.A.), Italy.
Deliverable 1.1: Regional state of play analyses
Page 215 of 274
LIFE ELECTRO-SLUDGE
Innovative Electro Dewatering system for the maximisation of the urban sludge Dry Solid content.
(LIFE14 ENV/IT/000039)
To design, develop and demonstrate an innovative electro-osmotic dewatering system that is able to dewater urban sludge from wastewater treatment plants and thus obtain a dry solid content (DS) equal to, or greater than, 30%.
COORDINATOR: AST srl PARTNERS: POLIMI (Politecnico di Milano), Italy; CAP (CAP Holding S.p.A.), Italy.
LIFE DeNTreat
Decentralized innovative treatment of ammonium-rich urban wastewater
(LIFE16 ENV/IT/000345)
Demonstrate innovative decentralised wastewater pre-treatment modules, based on the Anammox (ANaerobic AMMonium Oxidation) microbial process, and to show that this technology can sustainably reduce nitrogen pollutants linked to discharges from the textile industry, hence reducing the nitrogen content of urban wastewaters.
COORDINATOR: LARIANA DEPUR S.p.A PARTNERS: CENTRO TECNOLOGICO DAS INDUSTRIAS TEXTIL E DO VESTUARIO DE PORTUGAL, Portugal; Stamperia di Cassina Rizzardi S.p.A., Italy; European Apparel and Textile Confederation, Belgium; Politecnico di Milano, Italy.
LIFE LESSWATT
Innovative wireless tool for reducing energy consumption and GHGs emission of water resource recovery facilities
(LIFE16 ENV/IT/000486)
Target both the environmental issues related to the energy consumption of Water Resource Recovery Facilities (WRRF) and their direct GHG emissions. The project will develop an innovative tool for assessing and minimising both direct and indirect contributions of aerated compartments in WRRFs to the facility’s overall carbon footprint.
COORDINATOR: Dipartimento di Ingegneria Civile e Ambientale - Università degli Studi di Firenze PARTNERS: West Systems S.r.l., Italy; Consorzio Cuoiodepur SpA, Italy; Universiteit Gent, Belgium; UTILITATIS pro Acqua Energia Ambiente, Italy.
LIFE OptiMa-N
Optimisation of nitrogen management for groundwater quality improvement and conservation.
(LIFE04 ENV/IT/000454)
Fostering environmentally and economically sustainable practices that enabled farmers to balance production and environmental goals, via crop rotation techniques, use of cover crops and improved quantities of fertilise inputs.
COORDINATOR: Centro Ricerche Produzioni Animali S.p.A. PARTNERS: Fondazione CRPA Studi Ricerche ONLUS, Italy; Azienda Agraria Sperimentale Stuard, Italy.
LIFE REQUPRO
A model to REclaim and reuse wastewater for Quality crop PROduction
(LIFE11 ENV/IT/000156)
Contribute to the protection of water resources through efficient re-use of treated wastewater for irrigation of agricultural land, thus replacing the use of surface water and groundwater resources. This objective will be achieved by developing a model of water reclamation and re-use for irrigation of high quality crops.
COORDINATOR: Centro Ricerche Produzioni Animali - CRPA SpA PARTNERS: IREN Emilia, Italy; Consorzio di Bonifica dell'Emilia Centrale, Italy; Consorzio di Bonifica di secondo grado per il Canale Emiliano Romagnolo, Italy; Autorità di Bacino del Fiume Po, Italy.

Deliverable 1.1: Regional state of play analyses
Page 216 of 274
6.7 Discussion and conclusion remarks
The PO VALLEY is the largest and most important economic region in Italy. It is the centre of most Italian industry as well as Italy’s agricultural heartland (with an increase in Tourism also). At the same time this area is progressively increasing its fragility as a consequence of Climate change effects (such as elongated drought in summer as well as early snowmelt in springtime – Cassardo et al., 2018). This may exert unfavourable impacts for agriculture, but also for other activities related to water supply (e.g. industry, hydroelectric power generation, tourism, etc) with a consequent competition for having access to the water resource.
Within this context the water reuse may represent a valuable source of alternative/additional water volumes for both the environmental and human needs. But this opportunity requires the involvement of several actors along the chain such as territorial bodies (from national government down to local bodies), multiutilities in charge of managing the “integrated water services”, users and user’s associations (for both sensitization, awareness creation, and good practices adoption).
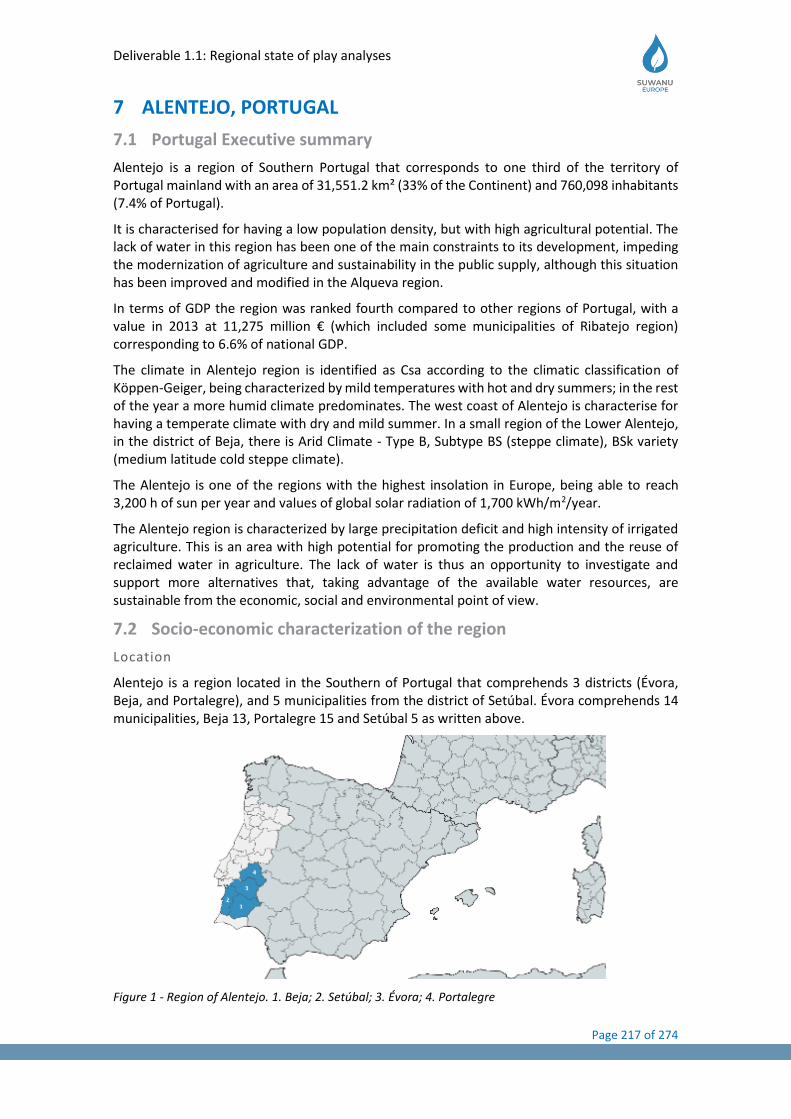
Deliverable 1.1: Regional state of play analyses
Page 217 of 274
7 ALENTEJO, PORTUGAL
7.1 Portugal Executive summary
Alentejo is a region of Southern Portugal that corresponds to one third of the territory of Portugal mainland with an area of 31,551.2 km² (33% of the Continent) and 760,098 inhabitants (7.4% of Portugal).
It is characterised for having a low population density, but with high agricultural potential. The lack of water in this region has been one of the main constraints to its development, impeding the modernization of agriculture and sustainability in the public supply, although this situation has been improved and modified in the Alqueva region.
In terms of GDP the region was ranked fourth compared to other regions of Portugal, with a value in 2013 at 11,275 million € (which included some municipalities of Ribatejo region) corresponding to 6.6% of national GDP.
The climate in Alentejo region is identified as Csa according to the climatic classification of Köppen-Geiger, being characterized by mild temperatures with hot and dry summers; in the rest of the year a more humid climate predominates. The west coast of Alentejo is characterise for having a temperate climate with dry and mild summer. In a small region of the Lower Alentejo, in the district of Beja, there is Arid Climate - Type B, Subtype BS (steppe climate), BSk variety (medium latitude cold steppe climate).
The Alentejo is one of the regions with the highest insolation in Europe, being able to reach 3,200 h of sun per year and values of global solar radiation of 1,700 kWh/m2/year.
The Alentejo region is characterized by large precipitation deficit and high intensity of irrigated agriculture. This is an area with high potential for promoting the production and the reuse of reclaimed water in agriculture. The lack of water is thus an opportunity to investigate and support more alternatives that, taking advantage of the available water resources, are sustainable from the economic, social and environmental point of view.
7.2 Socio-economic characterization of the region
Location
Alentejo is a region located in the Southern of Portugal that comprehends 3 districts (Évora, Beja, and Portalegre), and 5 municipalities from the district of Setúbal. Évora comprehends 14 municipalities, Beja 13, Portalegre 15 and Setúbal 5 as written above.
Figure 1 - Region of Alentejo. 1. Beja; 2. Setúbal; 3. Évora; 4. Portalegre
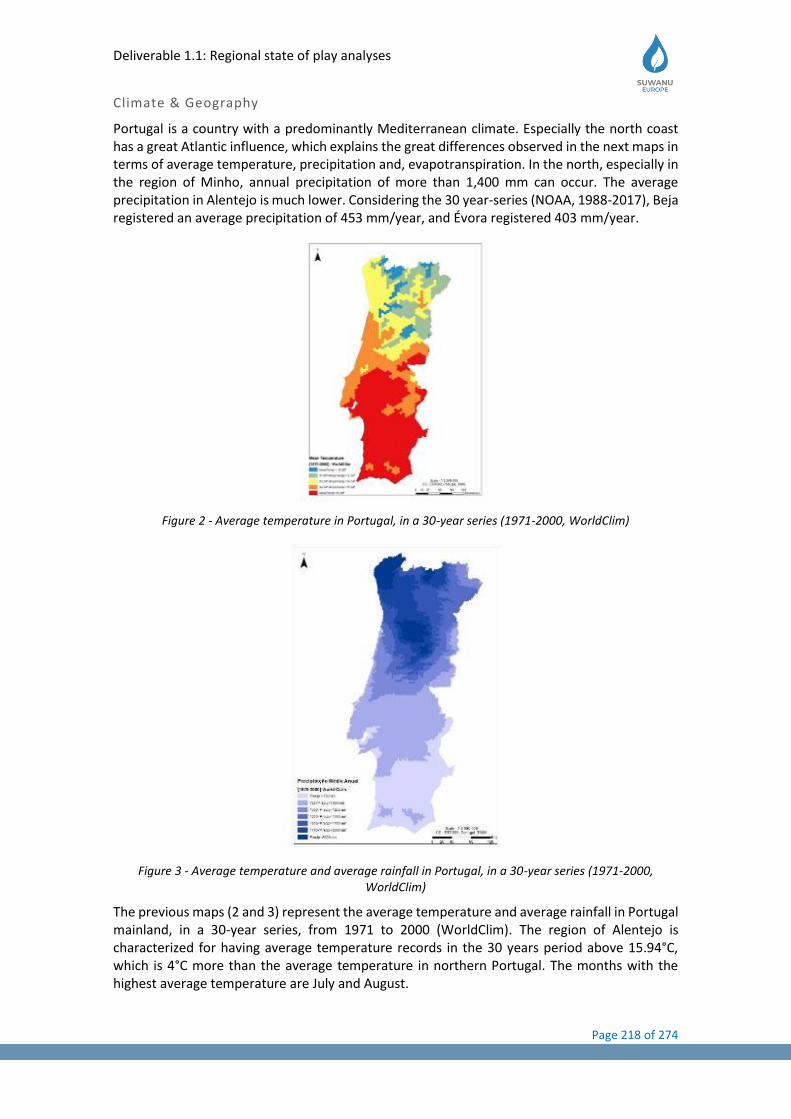
Deliverable 1.1: Regional state of play analyses
Page 218 of 274
Climate & Geography
Portugal is a country with a predominantly Mediterranean climate. Especially the north coast has a great Atlantic influence, which explains the great differences observed in the next maps in terms of average temperature, precipitation and, evapotranspiration. In the north, especially in the region of Minho, annual precipitation of more than 1,400 mm can occur. The average precipitation in Alentejo is much lower. Considering the 30 year-series (NOAA, 1988-2017), Beja registered an average precipitation of 453 mm/year, and Évora registered 403 mm/year.
Figure 2 - Average temperature in Portugal, in a 30-year series (1971-2000, WorldClim)
Figure 3 - Average temperature and average rainfall in Portugal, in a 30-year series (1971-2000, WorldClim)
The previous maps (2 and 3) represent the average temperature and average rainfall in Portugal mainland, in a 30-year series, from 1971 to 2000 (WorldClim). The region of Alentejo is characterized for having average temperature records in the 30 years period above 15.94°C, which is 4°C more than the average temperature in northern Portugal. The months with the highest average temperature are July and August.

Deliverable 1.1: Regional state of play analyses
Page 219 of 274
The records of average precipitation in the Alentejo region indicate that it is lower than the rest of the country, reinforcing the importance of the need for irrigation in this region. This is even more critical, considering that the lowest levels of precipitation occur during the period with the highest temperatures. The month with the highest level of precipitation in Portugal is December, although October, November and January also register high levels of precipitation.
Figure 4 - Potential evapotranspiration (PET) of Portugal mainland, in a 30-year series, from 1960 to 1990 (IPMA)
The map in Figure 4 represents the average potential evapotranspiration (PET) of Portugal mainland, in a 30-year series, from 1960 to 1990 (IPMA). PET increases from North to South and from the coast to the interior of the country. Alentejo region shows a higher PET particularly where the Alqueva dam is currently installed, including the irrigation perimeter.
Portugal is characterized for having a more accentuated mountainous system in the North of the country, with an average altitude above 1,000 meters. The region South of the Tagus river has an average altitude of less than 200 meters with very little relief and large plains, revealing a great potential for the installation of irrigated crops.
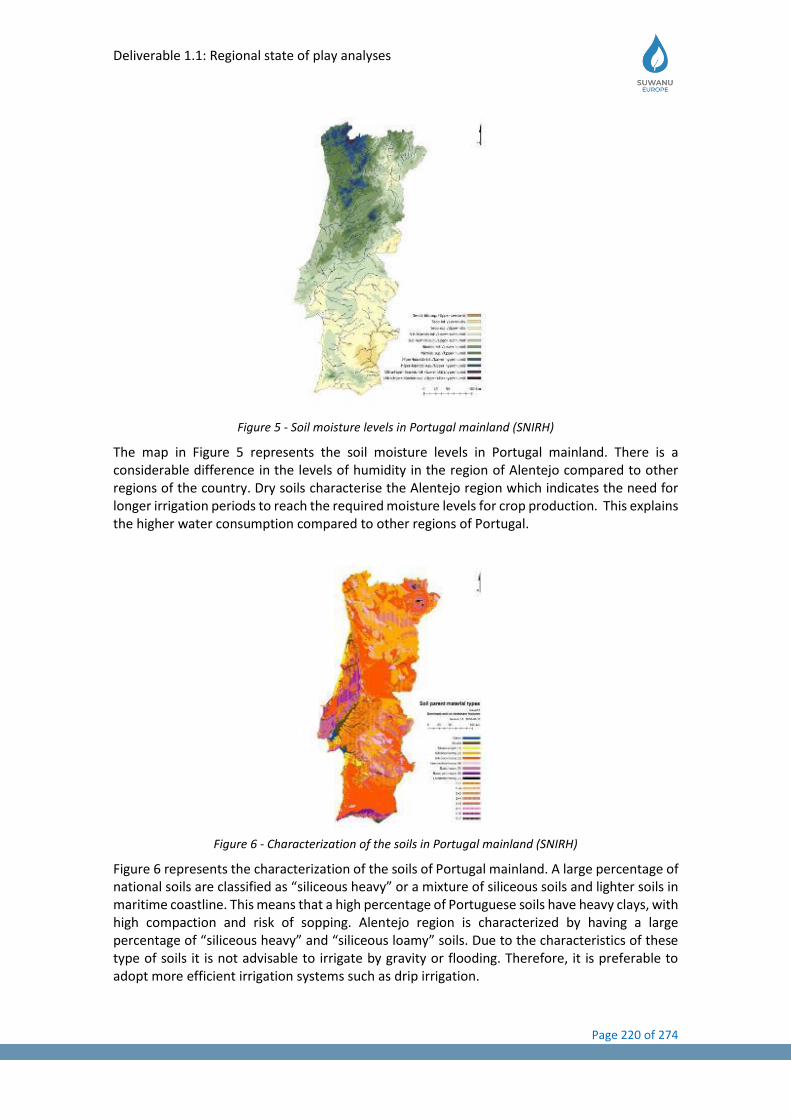
Deliverable 1.1: Regional state of play analyses
Page 220 of 274
Figure 5 - Soil moisture levels in Portugal mainland (SNIRH)
The map in Figure 5 represents the soil moisture levels in Portugal mainland. There is a considerable difference in the levels of humidity in the region of Alentejo compared to other regions of the country. Dry soils characterise the Alentejo region which indicates the need for longer irrigation periods to reach the required moisture levels for crop production. This explains the higher water consumption compared to other regions of Portugal.
Figure 6 - Characterization of the soils in Portugal mainland (SNIRH)
Figure 6 represents the characterization of the soils of Portugal mainland. A large percentage of national soils are classified as “siliceous heavy” or a mixture of siliceous soils and lighter soils in maritime coastline. This means that a high percentage of Portuguese soils have heavy clays, with high compaction and risk of sopping. Alentejo region is characterized by having a large percentage of “siliceous heavy” and “siliceous loamy” soils. Due to the characteristics of these type of soils it is not advisable to irrigate by gravity or flooding. Therefore, it is preferable to adopt more efficient irrigation systems such as drip irrigation.
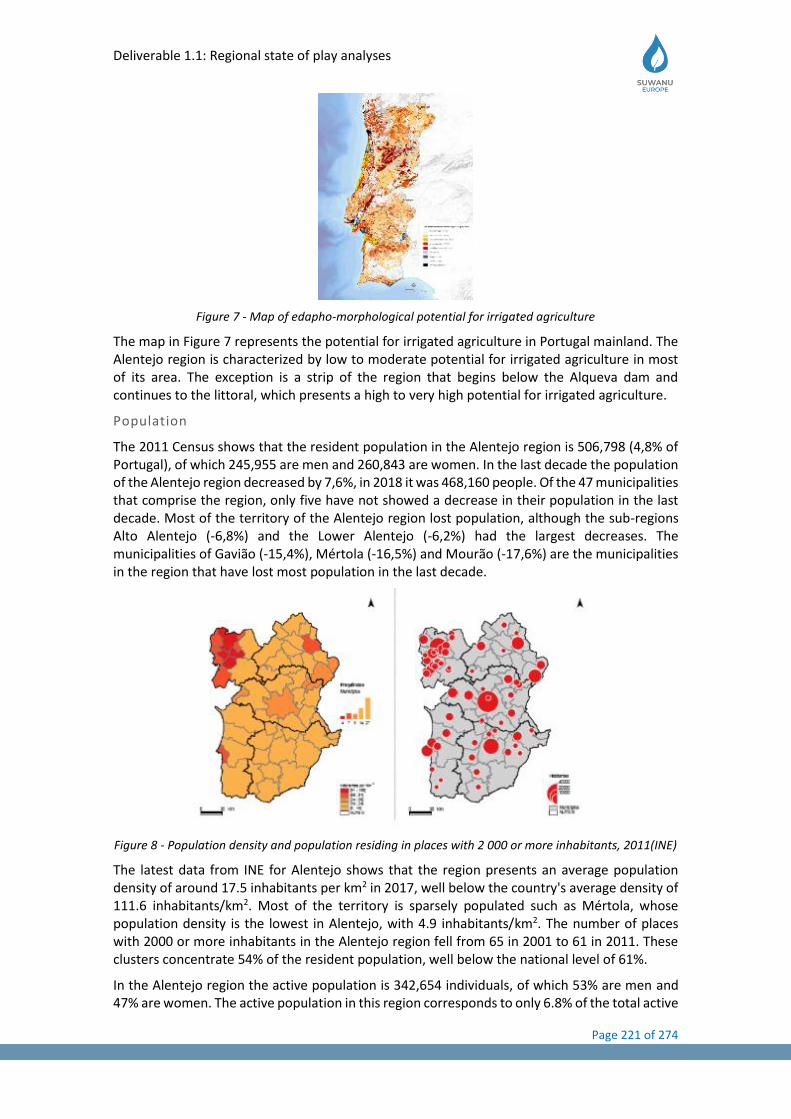
Deliverable 1.1: Regional state of play analyses
Page 221 of 274
Figure 7 - Map of edapho-morphological potential for irrigated agriculture
The map in Figure 7 represents the potential for irrigated agriculture in Portugal mainland. The Alentejo region is characterized by low to moderate potential for irrigated agriculture in most of its area. The exception is a strip of the region that begins below the Alqueva dam and continues to the littoral, which presents a high to very high potential for irrigated agriculture.
Population
The 2011 Census shows that the resident population in the Alentejo region is 506,798 (4,8% of Portugal), of which 245,955 are men and 260,843 are women. In the last decade the population of the Alentejo region decreased by 7,6%, in 2018 it was 468,160 people. Of the 47 municipalities that comprise the region, only five have not showed a decrease in their population in the last decade. Most of the territory of the Alentejo region lost population, although the sub-regions Alto Alentejo (-6,8%) and the Lower Alentejo (-6,2%) had the largest decreases. The municipalities of Gavião (-15,4%), Mértola (-16,5%) and Mourão (-17,6%) are the municipalities in the region that have lost most population in the last decade.
Figure 8 - Population density and population residing in places with 2 000 or more inhabitants, 2011(INE)
The latest data from INE for Alentejo shows that the region presents an average population density of around 17.5 inhabitants per km2 in 2017, well below the country's average density of 111.6 inhabitants/km2. Most of the territory is sparsely populated such as Mértola, whose population density is the lowest in Alentejo, with 4.9 inhabitants/km2. The number of places with 2000 or more inhabitants in the Alentejo region fell from 65 in 2001 to 61 in 2011. These clusters concentrate 54% of the resident population, well below the national level of 61%.
In the Alentejo region the active population is 342,654 individuals, of which 53% are men and 47% are women. The active population in this region corresponds to only 6.8% of the total active
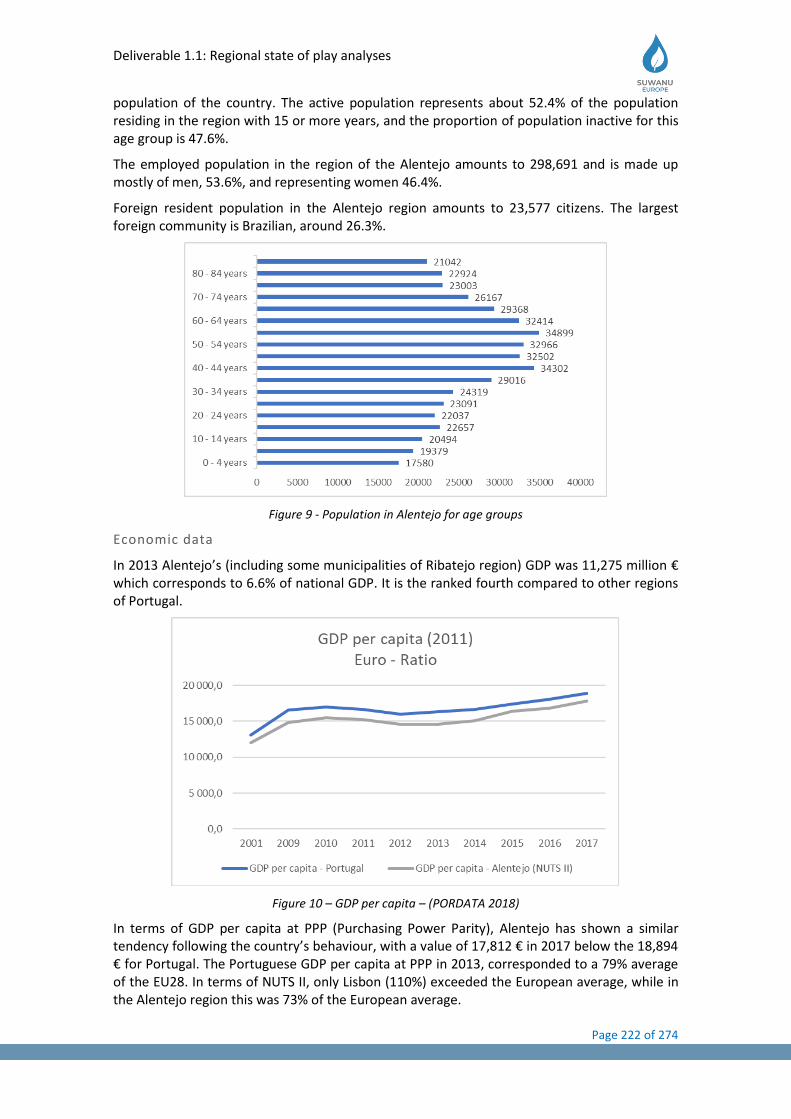
Deliverable 1.1: Regional state of play analyses
Page 222 of 274
population of the country. The active population represents about 52.4% of the population residing in the region with 15 or more years, and the proportion of population inactive for this age group is 47.6%.
The employed population in the region of the Alentejo amounts to 298,691 and is made up mostly of men, 53.6%, and representing women 46.4%.
Foreign resident population in the Alentejo region amounts to 23,577 citizens. The largest foreign community is Brazilian, around 26.3%.
Figure 9 - Population in Alentejo for age groups
Economic data
In 2013 Alentejo’s (including some municipalities of Ribatejo region) GDP was 11,275 million € which corresponds to 6.6% of national GDP. It is the ranked fourth compared to other regions of Portugal.
Figure 10 – GDP per capita – (PORDATA 2018)
In terms of GDP per capita at PPP (Purchasing Power Parity), Alentejo has shown a similar tendency following the country’s behaviour, with a value of 17,812 € in 2017 below the 18,894 € for Portugal. The Portuguese GDP per capita at PPP in 2013, corresponded to a 79% average of the EU28. In terms of NUTS II, only Lisbon (110%) exceeded the European average, while in the Alentejo region this was 73% of the European average.
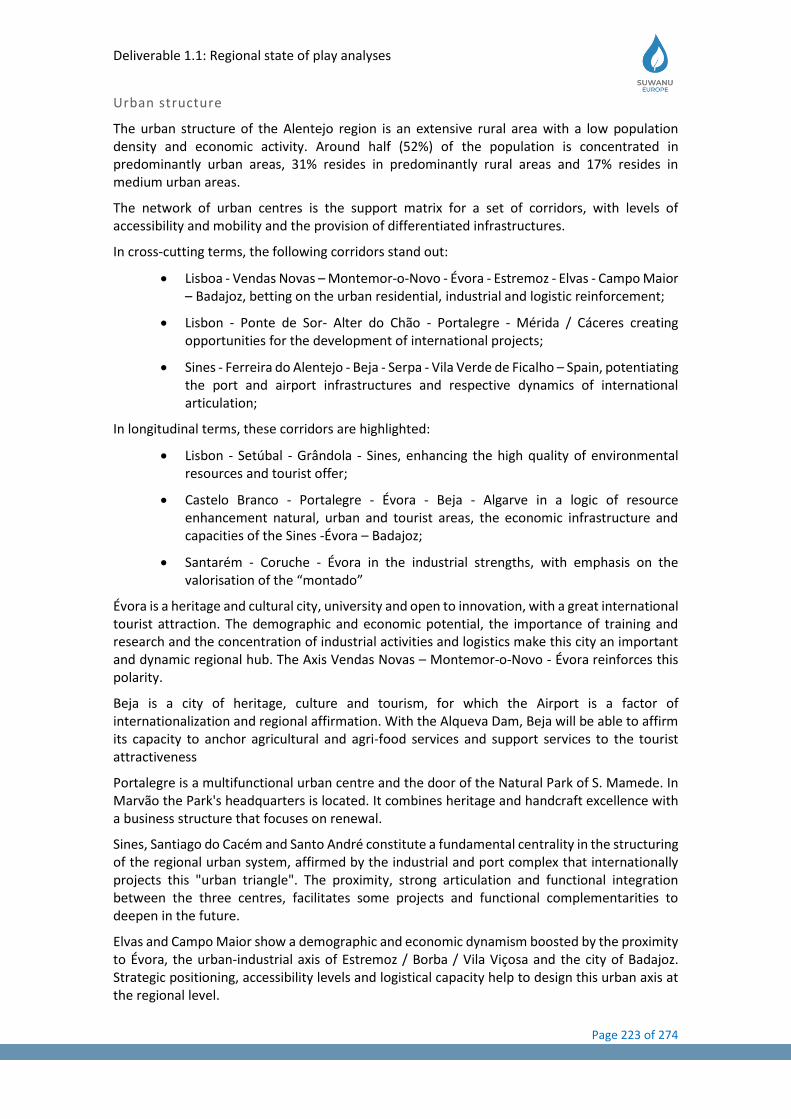
Deliverable 1.1: Regional state of play analyses
Page 223 of 274
Urban structure
The urban structure of the Alentejo region is an extensive rural area with a low population density and economic activity. Around half (52%) of the population is concentrated in predominantly urban areas, 31% resides in predominantly rural areas and 17% resides in medium urban areas.
The network of urban centres is the support matrix for a set of corridors, with levels of accessibility and mobility and the provision of differentiated infrastructures.
In cross-cutting terms, the following corridors stand out:
• Lisboa - Vendas Novas – Montemor-o-Novo - Évora - Estremoz - Elvas - Campo Maior – Badajoz, betting on the urban residential, industrial and logistic reinforcement;
• Lisbon - Ponte de Sor- Alter do Chão - Portalegre - Mérida / Cáceres creating opportunities for the development of international projects;
• Sines - Ferreira do Alentejo - Beja - Serpa - Vila Verde de Ficalho – Spain, potentiating the port and airport infrastructures and respective dynamics of international articulation;
In longitudinal terms, these corridors are highlighted:
• Lisbon - Setúbal - Grândola - Sines, enhancing the high quality of environmental resources and tourist offer;
• Castelo Branco - Portalegre - Évora - Beja - Algarve in a logic of resource enhancement natural, urban and tourist areas, the economic infrastructure and capacities of the Sines -Évora – Badajoz;
• Santarém - Coruche - Évora in the industrial strengths, with emphasis on the valorisation of the “montado”
Évora is a heritage and cultural city, university and open to innovation, with a great international tourist attraction. The demographic and economic potential, the importance of training and research and the concentration of industrial activities and logistics make this city an important and dynamic regional hub. The Axis Vendas Novas – Montemor-o-Novo - Évora reinforces this polarity.
Beja is a city of heritage, culture and tourism, for which the Airport is a factor of internationalization and regional affirmation. With the Alqueva Dam, Beja will be able to affirm its capacity to anchor agricultural and agri-food services and support services to the tourist attractiveness
Portalegre is a multifunctional urban centre and the door of the Natural Park of S. Mamede. In Marvão the Park's headquarters is located. It combines heritage and handcraft excellence with a business structure that focuses on renewal.
Sines, Santiago do Cacém and Santo André constitute a fundamental centrality in the structuring of the regional urban system, affirmed by the industrial and port complex that internationally projects this "urban triangle". The proximity, strong articulation and functional integration between the three centres, facilitates some projects and functional complementarities to deepen in the future.
Elvas and Campo Maior show a demographic and economic dynamism boosted by the proximity to Évora, the urban-industrial axis of Estremoz / Borba / Vila Viçosa and the city of Badajoz. Strategic positioning, accessibility levels and logistical capacity help to design this urban axis at the regional level.
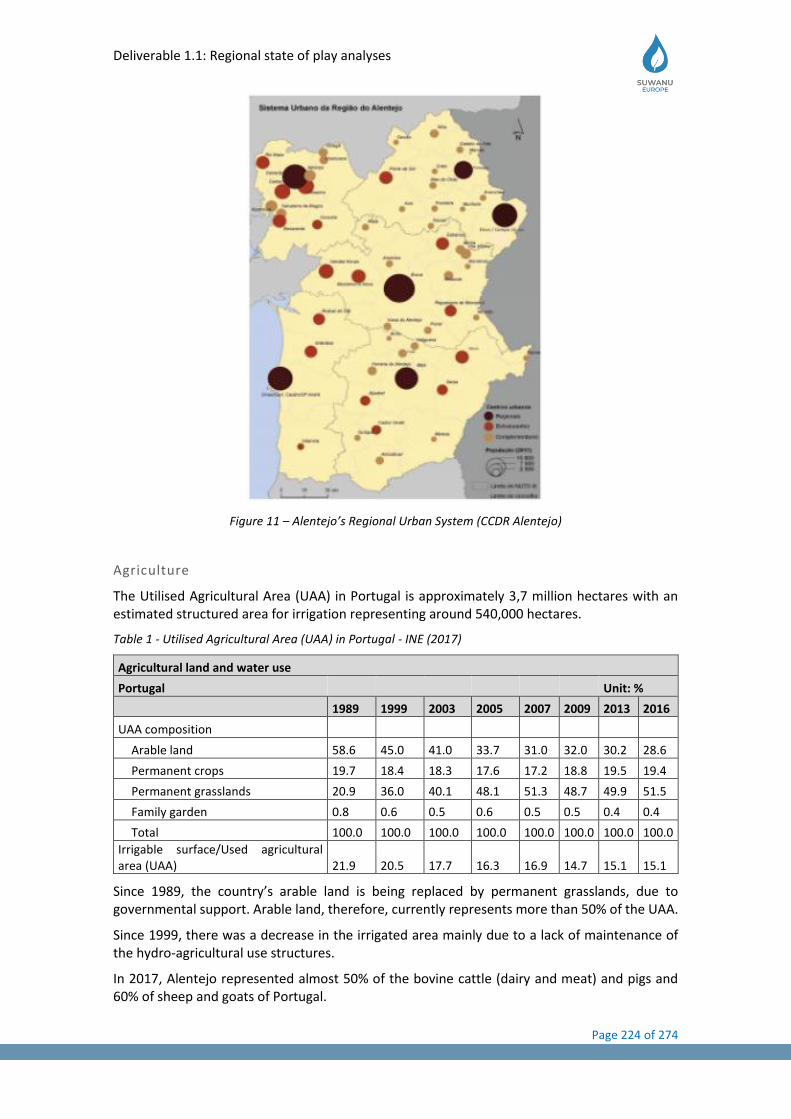
Deliverable 1.1: Regional state of play analyses
Page 224 of 274
Figure 11 – Alentejo’s Regional Urban System (CCDR Alentejo)
Agriculture
The Utilised Agricultural Area (UAA) in Portugal is approximately 3,7 million hectares with an estimated structured area for irrigation representing around 540,000 hectares.
Table 1 - Utilised Agricultural Area (UAA) in Portugal - INE (2017)
Agricultural land and water use
Portugal Unit: %
1989 1999 2003 2005 2007 2009 2013 2016
UAA composition
Arable land 58.6 45.0 41.0 33.7 31.0 32.0 30.2 28.6
Permanent crops 19.7 18.4 18.3 17.6 17.2 18.8 19.5 19.4
Permanent grasslands 20.9 36.0 40.1 48.1 51.3 48.7 49.9 51.5
Family garden 0.8 0.6 0.5 0.6 0.5 0.5 0.4 0.4
Total 100.0 100.0 100.0 100.0 100.0 100.0 100.0 100.0
Irrigable surface/Used agricultural area (UAA) 21.9 20.5 17.7 16.3 16.9 14.7 15.1 15.1
Since 1989, the country’s arable land is being replaced by permanent grasslands, due to governmental support. Arable land, therefore, currently represents more than 50% of the UAA.
Since 1999, there was a decrease in the irrigated area mainly due to a lack of maintenance of the hydro-agricultural use structures.
In 2017, Alentejo represented almost 50% of the bovine cattle (dairy and meat) and pigs and 60% of sheep and goats of Portugal.
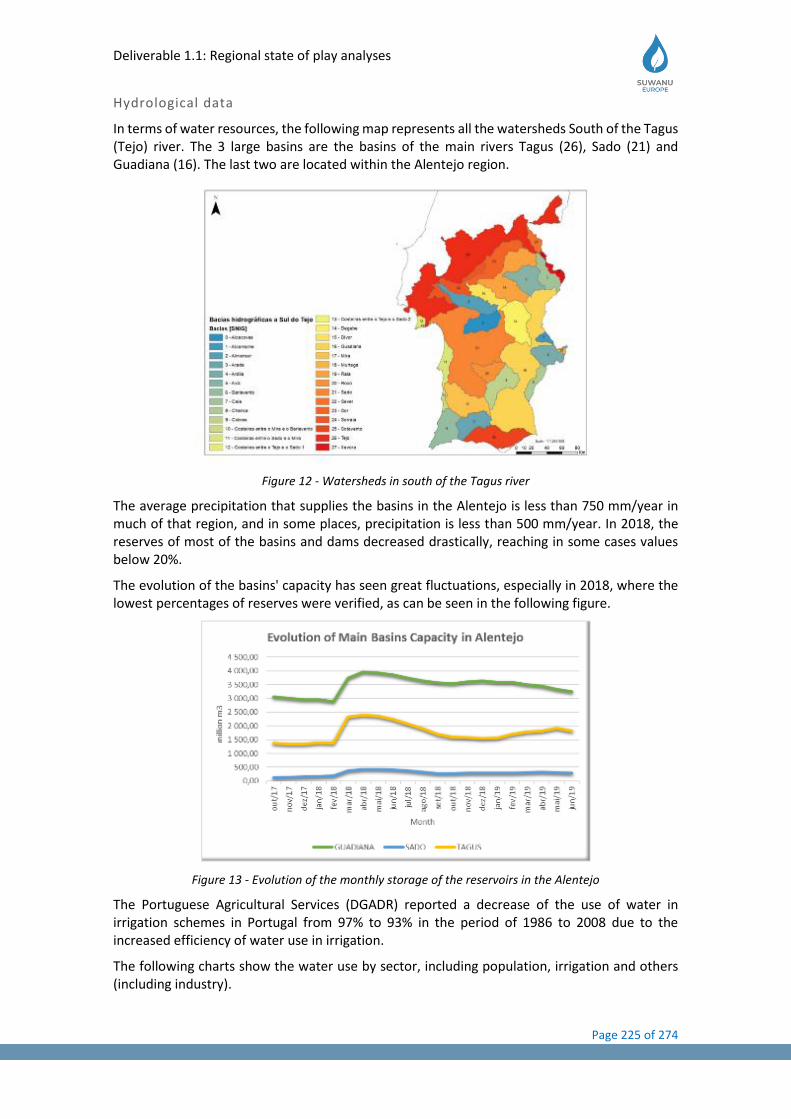
Deliverable 1.1: Regional state of play analyses
Page 225 of 274
Hydrological data
In terms of water resources, the following map represents all the watersheds South of the Tagus (Tejo) river. The 3 large basins are the basins of the main rivers Tagus (26), Sado (21) and Guadiana (16). The last two are located within the Alentejo region.
Figure 12 - Watersheds in south of the Tagus river
The average precipitation that supplies the basins in the Alentejo is less than 750 mm/year in much of that region, and in some places, precipitation is less than 500 mm/year. In 2018, the reserves of most of the basins and dams decreased drastically, reaching in some cases values below 20%.
The evolution of the basins' capacity has seen great fluctuations, especially in 2018, where the lowest percentages of reserves were verified, as can be seen in the following figure.
Figure 13 - Evolution of the monthly storage of the reservoirs in the Alentejo
The Portuguese Agricultural Services (DGADR) reported a decrease of the use of water in irrigation schemes in Portugal from 97% to 93% in the period of 1986 to 2008 due to the increased efficiency of water use in irrigation.
The following charts show the water use by sector, including population, irrigation and others (including industry).
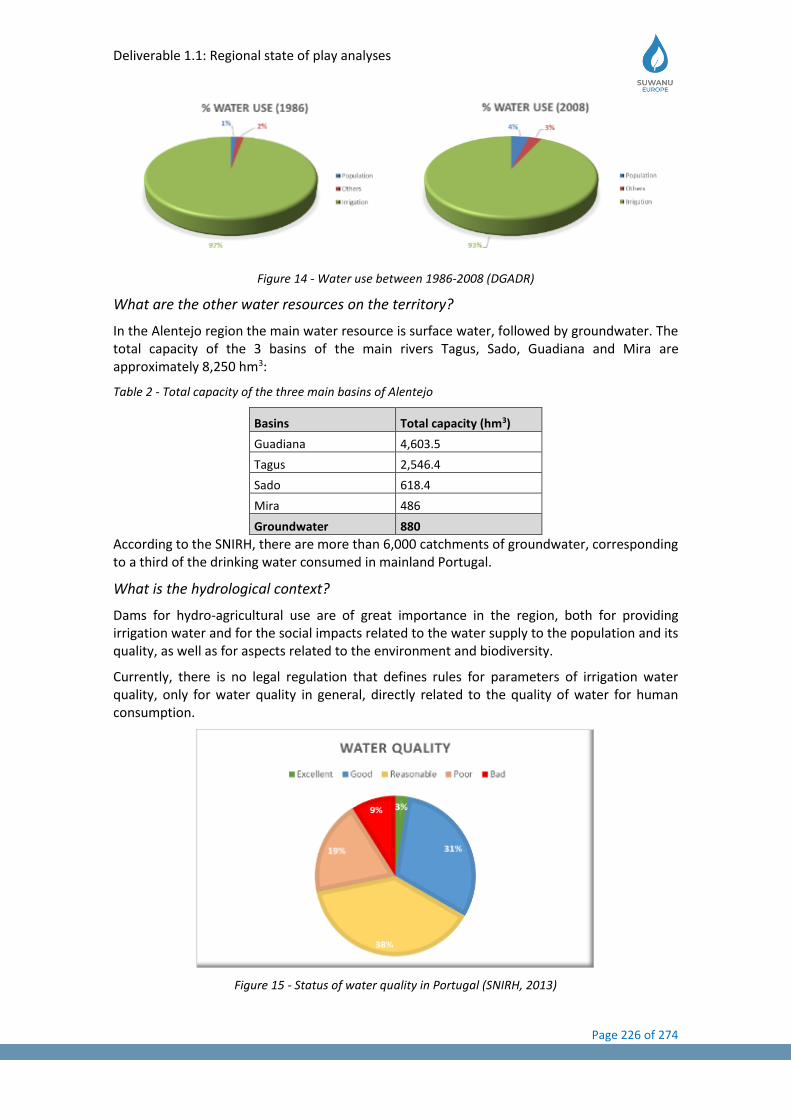
Deliverable 1.1: Regional state of play analyses
Page 226 of 274
Figure 14 - Water use between 1986-2008 (DGADR)
What are the other water resources on the territory?
In the Alentejo region the main water resource is surface water, followed by groundwater. The total capacity of the 3 basins of the main rivers Tagus, Sado, Guadiana and Mira are approximately 8,250 hm3:
Table 2 - Total capacity of the three main basins of Alentejo
Basins Total capacity (hm3)
Guadiana 4,603.5
Tagus 2,546.4
Sado 618.4
Mira 486
Groundwater 880
According to the SNIRH, there are more than 6,000 catchments of groundwater, corresponding to a third of the drinking water consumed in mainland Portugal.
What is the hydrological context?
Dams for hydro-agricultural use are of great importance in the region, both for providing irrigation water and for the social impacts related to the water supply to the population and its quality, as well as for aspects related to the environment and biodiversity.
Currently, there is no legal regulation that defines rules for parameters of irrigation water quality, only for water quality in general, directly related to the quality of water for human consumption.
Figure 15 - Status of water quality in Portugal (SNIRH, 2013)
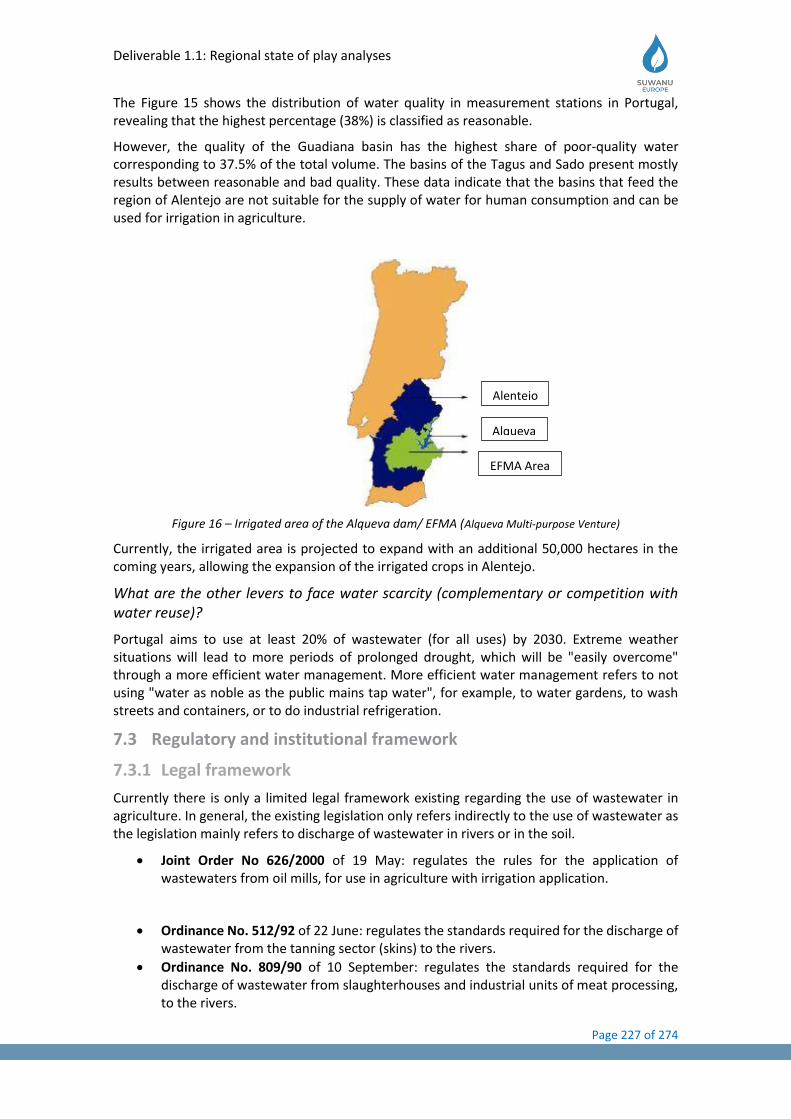
Deliverable 1.1: Regional state of play analyses
Page 227 of 274
The Figure 15 shows the distribution of water quality in measurement stations in Portugal, revealing that the highest percentage (38%) is classified as reasonable.
However, the quality of the Guadiana basin has the highest share of poor-quality water corresponding to 37.5% of the total volume. The basins of the Tagus and Sado present mostly results between reasonable and bad quality. These data indicate that the basins that feed the region of Alentejo are not suitable for the supply of water for human consumption and can be used for irrigation in agriculture.
Figure 16 – Irrigated area of the Alqueva dam/ EFMA (Alqueva Multi-purpose Venture)
Currently, the irrigated area is projected to expand with an additional 50,000 hectares in the coming years, allowing the expansion of the irrigated crops in Alentejo.
What are the other levers to face water scarcity (complementary or competition with water reuse)?
Portugal aims to use at least 20% of wastewater (for all uses) by 2030. Extreme weather situations will lead to more periods of prolonged drought, which will be "easily overcome" through a more efficient water management. More efficient water management refers to not using "water as noble as the public mains tap water", for example, to water gardens, to wash streets and containers, or to do industrial refrigeration.
7.3 Regulatory and institutional framework
7.3.1 Legal framework
Currently there is only a limited legal framework existing regarding the use of wastewater in agriculture. In general, the existing legislation only refers indirectly to the use of wastewater as the legislation mainly refers to discharge of wastewater in rivers or in the soil.
• Joint Order No 626/2000 of 19 May: regulates the rules for the application of wastewaters from oil mills, for use in agriculture with irrigation application.
• Ordinance No. 512/92 of 22 June: regulates the standards required for the discharge of wastewater from the tanning sector (skins) to the rivers.
• Ordinance No. 809/90 of 10 September: regulates the standards required for the discharge of wastewater from slaughterhouses and industrial units of meat processing, to the rivers.
Alentejo
Alqueva
EFMA Area
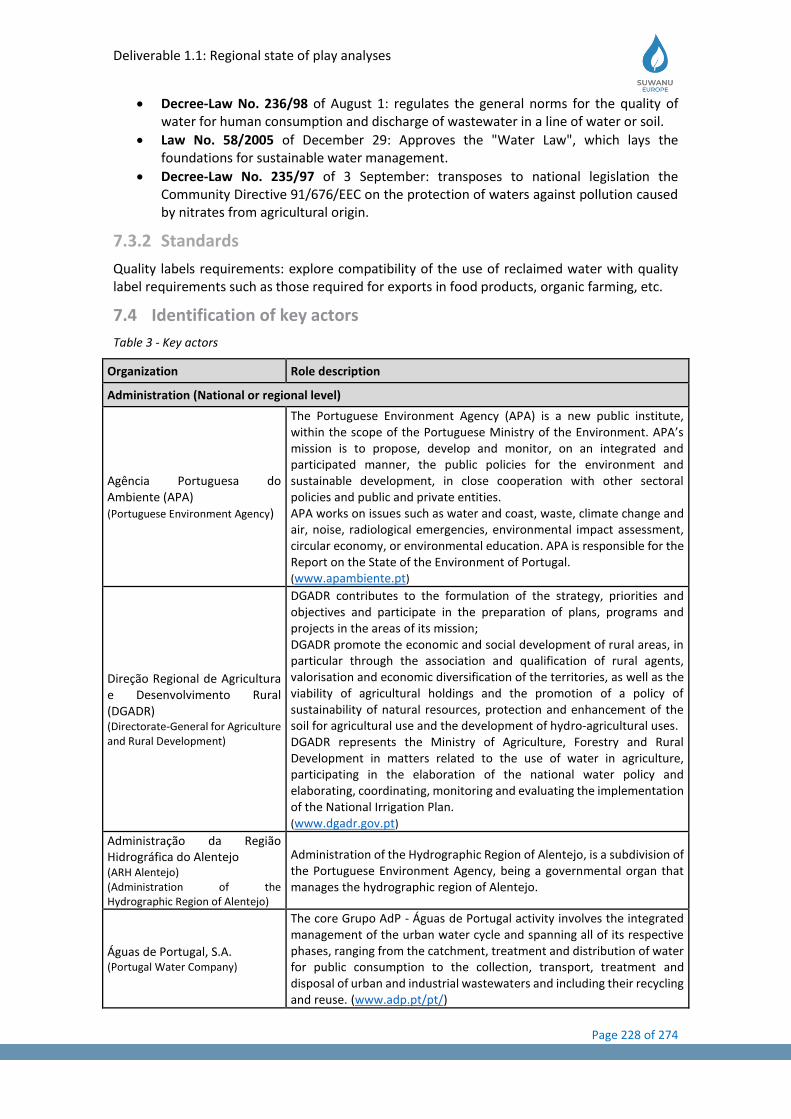
Deliverable 1.1: Regional state of play analyses
Page 228 of 274
• Decree-Law No. 236/98 of August 1: regulates the general norms for the quality of water for human consumption and discharge of wastewater in a line of water or soil.
• Law No. 58/2005 of December 29: Approves the "Water Law", which lays the foundations for sustainable water management.
• Decree-Law No. 235/97 of 3 September: transposes to national legislation the Community Directive 91/676/EEC on the protection of waters against pollution caused by nitrates from agricultural origin.
7.3.2 Standards
Quality labels requirements: explore compatibility of the use of reclaimed water with quality label requirements such as those required for exports in food products, organic farming, etc.
7.4 Identification of key actors
Table 3 - Key actors
Organization Role description
Administration (National or regional level)
Agência Portuguesa do Ambiente (APA) (Portuguese Environment Agency)
The Portuguese Environment Agency (APA) is a new public institute, within the scope of the Portuguese Ministry of the Environment. APA’s mission is to propose, develop and monitor, on an integrated and participated manner, the public policies for the environment and sustainable development, in close cooperation with other sectoral policies and public and private entities. APA works on issues such as water and coast, waste, climate change and air, noise, radiological emergencies, environmental impact assessment, circular economy, or environmental education. APA is responsible for the Report on the State of the Environment of Portugal. (www.apambiente.pt)
Direção Regional de Agricultura e Desenvolvimento Rural (DGADR) (Directorate-General for Agriculture and Rural Development)
DGADR contributes to the formulation of the strategy, priorities and objectives and participate in the preparation of plans, programs and projects in the areas of its mission; DGADR promote the economic and social development of rural areas, in particular through the association and qualification of rural agents, valorisation and economic diversification of the territories, as well as the viability of agricultural holdings and the promotion of a policy of sustainability of natural resources, protection and enhancement of the soil for agricultural use and the development of hydro-agricultural uses. DGADR represents the Ministry of Agriculture, Forestry and Rural Development in matters related to the use of water in agriculture, participating in the elaboration of the national water policy and elaborating, coordinating, monitoring and evaluating the implementation of the National Irrigation Plan. (www.dgadr.gov.pt)
Administração da Região Hidrográfica do Alentejo (ARH Alentejo) (Administration of the Hydrographic Region of Alentejo)
Administration of the Hydrographic Region of Alentejo, is a subdivision of the Portuguese Environment Agency, being a governmental organ that manages the hydrographic region of Alentejo.
Águas de Portugal, S.A. (Portugal Water Company)
The core Grupo AdP - Águas de Portugal activity involves the integrated management of the urban water cycle and spanning all of its respective phases, ranging from the catchment, treatment and distribution of water for public consumption to the collection, transport, treatment and disposal of urban and industrial wastewaters and including their recycling and reuse. (www.adp.pt/pt/)
Deliverable 1.1: Regional state of play analyses
Page 229 of 274
Organization Role description
Águas Públicas do Alentejo (Public Water Company of Alentejo)
AgdA - Águas Públicas do Alentejo, SA carries out the exploration and management of water services related to the Public Integrated Water Partnership of Alentejo (SPIAAlentejo), under a public partnership, aiming at the provision of a quality service, with respect for essential social and environmental aspects, as well as the provision of their capacities to serve the national interest. (www.agda.pt)
EDIA - Empresa de Desenvolvimento e Infraestruturas do Alqueva, AS (Alqueva Development and Infrastructure Company)
EDIA - Empresa de Desenvolvimento e Infraestruturas do Alqueva, S.A. was set up in 1995. It is a public limited company with an exclusively public share capital and belongs to the state corporate sector. Its mission is to design, execute, build and operate the Alqueva Multi-purpose Undertaking (EFMA), thereby contributing to the economic and social development of its area of intervention, i.e. 20 municipalities in the districts of Beja, Évora, Portalegre and Setúbal. EDIA's tasks include infrastructure management, environmental assessment, farmer support, irrigation promotion and monitoring. (www.edia.pt/pt/)
Municipalities
Águas do Tejo Atlântico, S.A. (Public Water Company of Tagus Atlantic)
Management and operation of the multi-municipal wastewater sanitation system of Greater Lisbon and Oeste. (www.aguasdotejoatlantico.adp.pt)
Câmara Municipal de Lisboa (Municipality of Lisbon)
The Municipality of Lisbon is the executive body of the municipality and its mission is to define and execute policies that promote the development of the Municipality in different areas. (www.cm-lisboa.pt)
Câmara Municipal de Almada (Municipality of Almada)
The Municipality of Almada is the executive body of the municipality and its mission is to define and execute policies that promote the development of the Municipality in different areas. (www.m-almada.pt)
Private sector
EFACEC Engineering EFACEC offers integrated solutions in the environmental area ranging from project design and development to operation of systems. (www.efacec.pt)
Advantech
Adventech is a Portuguese SME with core business on the design, on-site installation, start-up and maintenance of treatment plants for industrial water and wastewater, including advanced oxidation technologies (e.g., ozonation, catalytic wet oxidation and/or Fenton process) and other treatments (membrane filtration, biological processes, coagulation/flocculation, and adsorption). Most of the plants are custom built to meet the customer requirements, involving a first step of research at laboratory scale where the actual industrial effluents are tested to select the best cost/effective solution and the optimal operating conditions that can be also validated in pilot plants. (www.adventech.pt)
Herdade do Esporão (Farm)
As a part of the Alentejo’s montado ecosystem (cork oak forests), in Portugal, Herdade do Esporão has extraordinary conditions for agriculture – large temperature amplitudes, poor and various soils and extraordinary biodiversity that helps us produce in balance with the environment. 691,9 hectares of vineyards, olive groves and other crops are grown using organic methods. In this region, around 40 grape varieties, 4 types of olives are grown in both orchards and vegetable gardens. (www.esporao.com)
Research centres/Universities
Laboratório Nacional de Engenharia Civil (LNEC) (National Laboratory of Civil Engineering)
As an independent and impartial R&D institute, LNEC's priority is to make science, as to contribute to the creation, development and dissemination of applied research in areas related to civil engineering, such as: Public works: dams, harbors, airports, roads and railways infrastructures;
Deliverable 1.1: Regional state of play analyses
Page 230 of 274
Organization Role description
buildings; housing and urban planning; water resources, coastline and environment; transport; materials, components and other products for industry. LNEC activity essentially aims to the following objectives: The quality, the safety and the economy of works; the safety of persons and assets; the protection and rehabilitation of the natural and built heritage; the technological modernization and innovation. (www.lnec.pt)
Instituto Politécnico de Beja (IP Beja) (Polytechnic Institute of Beja - School)
The Beja Polytechnic Institute is a higher education institution at the service of society, dedicated to the production and diffusion of knowledge, creation, transmission and diffusion of culture and knowledge of a professional nature, guided research and experimental development, concentrated especially in formations vocational training and advanced technical, vocationally oriented training and encouraging lifelong learning. (www.ipbeja.pt)
Instituto Superior Técnico (IST) (University)
Instituto Superior Técnico's mission is to contribute to the development of society by promoting high quality education in the areas of architecture, engineering, science and technology, in the fields of undergraduate, postgraduate and lifelong training, and Research, Development and Innovation (ID & I), essential for the progress of knowledge, and to deliver education to the highest international standards. (https://tecnico.ulisboa.pt/pt/)
Instituto Superior de Engenharia de Lisboa (ISEL) (University)
ISEL, being one of the oldest educational Institutions in the field of engineering in Portugal, has shown a remarkable internal growth, both in the scope of the educational offer and in the scope of Research and Development. (www.isel.pt)
Instituto Superior de Agronomia de Lisboa (ISA) (University)
The Instituto Superior de Agronomia (ISA), School of Agriculture, is the largest and most qualified school of graduate and post-graduate degrees in the Agricultural Sciences, in Portugal, and its know-how is recognized nationally and internationally. ISA's vision is to consolidate its status as a reference school of Higher Education in Agriculture, nationally and internationally, particularly in Portuguese-Speaking Countries, asserting itself as a Research University, based on the excellence of its research and development based on innovation. (www.isa.ulisboa.pt)
Associations
Centro Operativo e de Tecnologia de Regadio (COTR) (Competence Center for National Irrigation)
To promote agricultural development, in particular through the coordination and promotion of scientific research, experimentation, demonstration and dissemination of results and training and professional qualification; promote and carry out projects necessary for the creation and diffusion of knowledge and for the Technical-Scientific exchange; (www.cotr.pt)
Associations of Irrigators of Portugal, represented by FENAREG
Most of the irrigation associations in Portugal are represented by FENAREG. The Irrigation Associations are responsible for the management of collective irrigation systems in Portugal. (www.fenareg.pt/)
Networks/projects
Hydroreuse
The HYDROREUSE project aims to develop innovative processes for the management of the main agro industrial wastewater produced in the Alentejo region (from slaughterhouses, wineries, mills and dairies) through a treatment / reuse line composed of low-cost and environmentally friendly technologies, namely new pre-treatment, double function hydroponic system with fruit production compatible with market needs and oxidation processes.
Deliverable 1.1: Regional state of play analyses
Page 231 of 274
Organization Role description
Treatment and reuse of agro industrial wastewater using an innovative hydroponic system with tomato plants. Objective: To strengthen research, technological development and innovation. Supported by the
“Portugal 2020”. (http://hydroreuse.pt)
Reuse
Promotion of the production and use of water for reuse (ApR) in the irrigation activity in the Alentejo region, a region that presents typically low precipitation and, simultaneously, a high intensity of irrigated agriculture, accompanied by a worrying evolution of the effects of climate change. Reuse is supported by the "Portuguese Environmental Fund"
MeProWaRe
Reused water has emerged as a viable alternative to address water scarcity in agriculture in Mediterranean countries, promoting a circular economy as it leads to water and nutrient recovery. The MeProWaRe project aims to develop a methodological approach to the reuse of treated water in crops typical of Mediterranean countries, such as olive groves and vines, considering the agricultural practices and water limitations of these countries.
Investors (National or regional level)
Other types of organizations
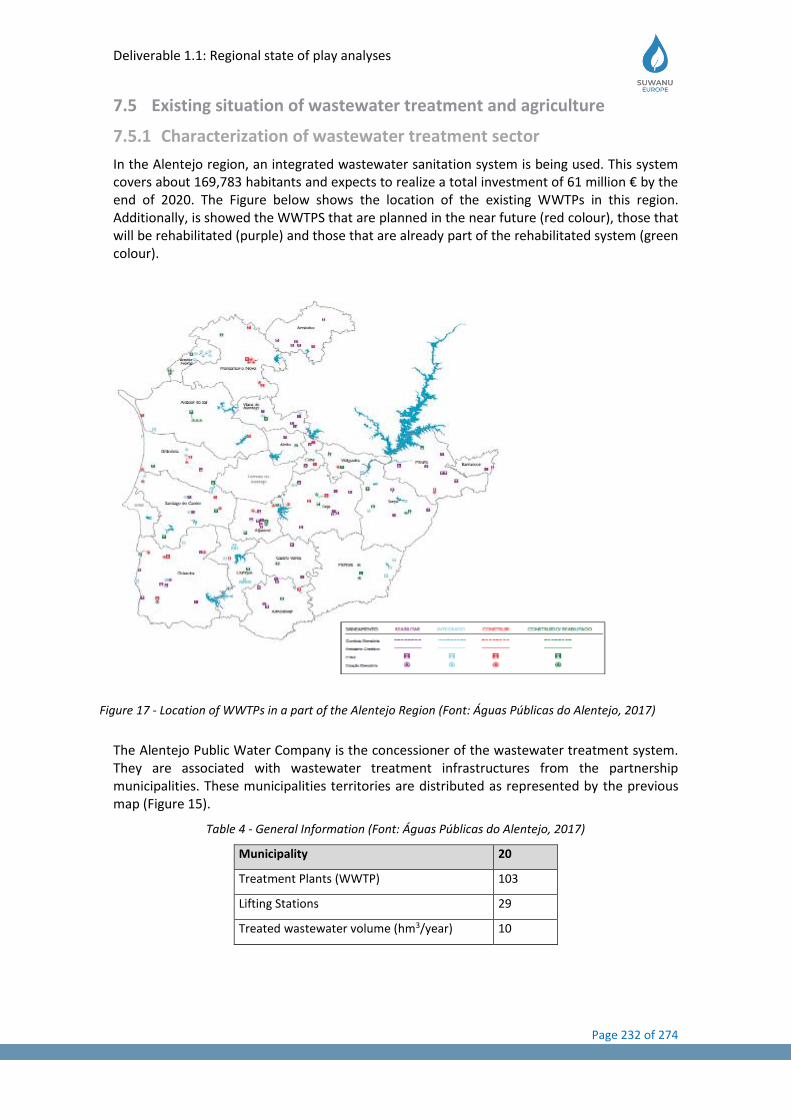
Deliverable 1.1: Regional state of play analyses
Page 232 of 274
7.5 Existing situation of wastewater treatment and agriculture
7.5.1 Characterization of wastewater treatment sector
In the Alentejo region, an integrated wastewater sanitation system is being used. This system covers about 169,783 habitants and expects to realize a total investment of 61 million € by the end of 2020. The Figure below shows the location of the existing WWTPs in this region. Additionally, is showed the WWTPS that are planned in the near future (red colour), those that will be rehabilitated (purple) and those that are already part of the rehabilitated system (green colour).
The Alentejo Public Water Company is the concessioner of the wastewater treatment system. They are associated with wastewater treatment infrastructures from the partnership municipalities. These municipalities territories are distributed as represented by the previous map (Figure 15).
Table 4 - General Information (Font: Águas Públicas do Alentejo, 2017)
Municipality 20
Treatment Plants (WWTP) 103
Lifting Stations 29
Treated wastewater volume (hm3/year) 10
Figure 17 - Location of WWTPs in a part of the Alentejo Region (Font: Águas Públicas do Alentejo, 2017)
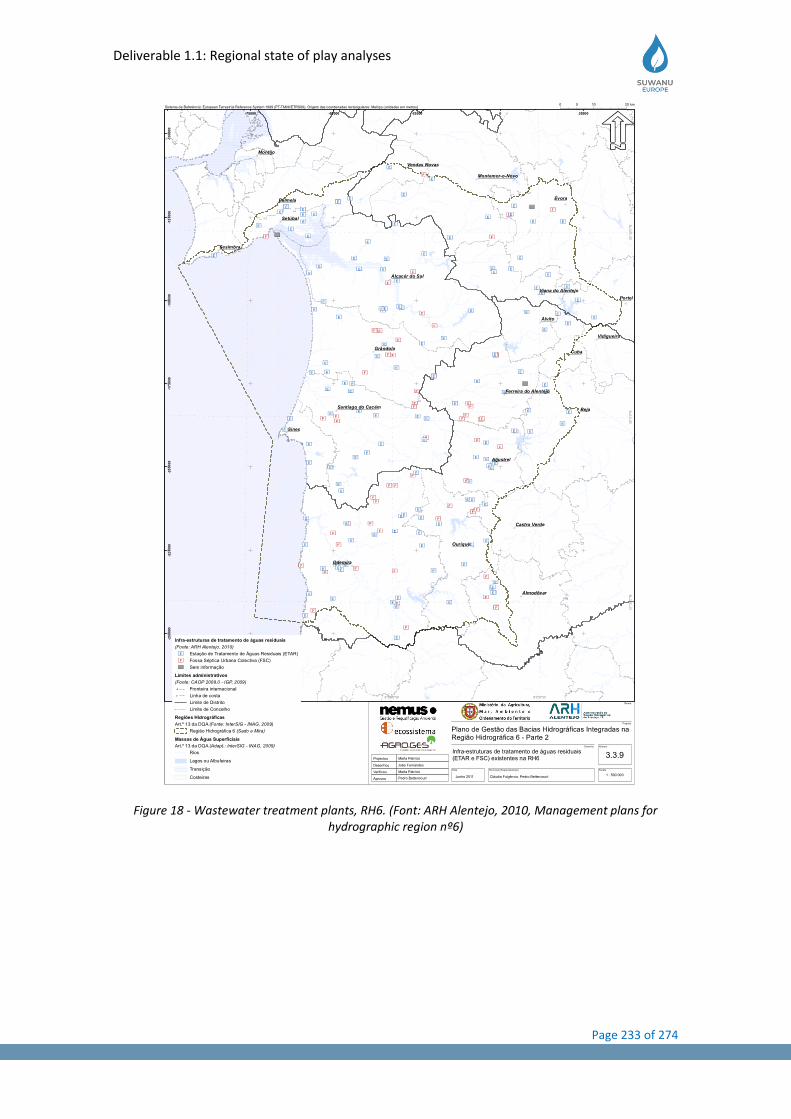
Deliverable 1.1: Regional state of play analyses
Page 233 of 274
Figure 18 - Wastewater treatment plants, RH6. (Font: ARH Alentejo, 2010, Management plans for hydrographic region nº6)
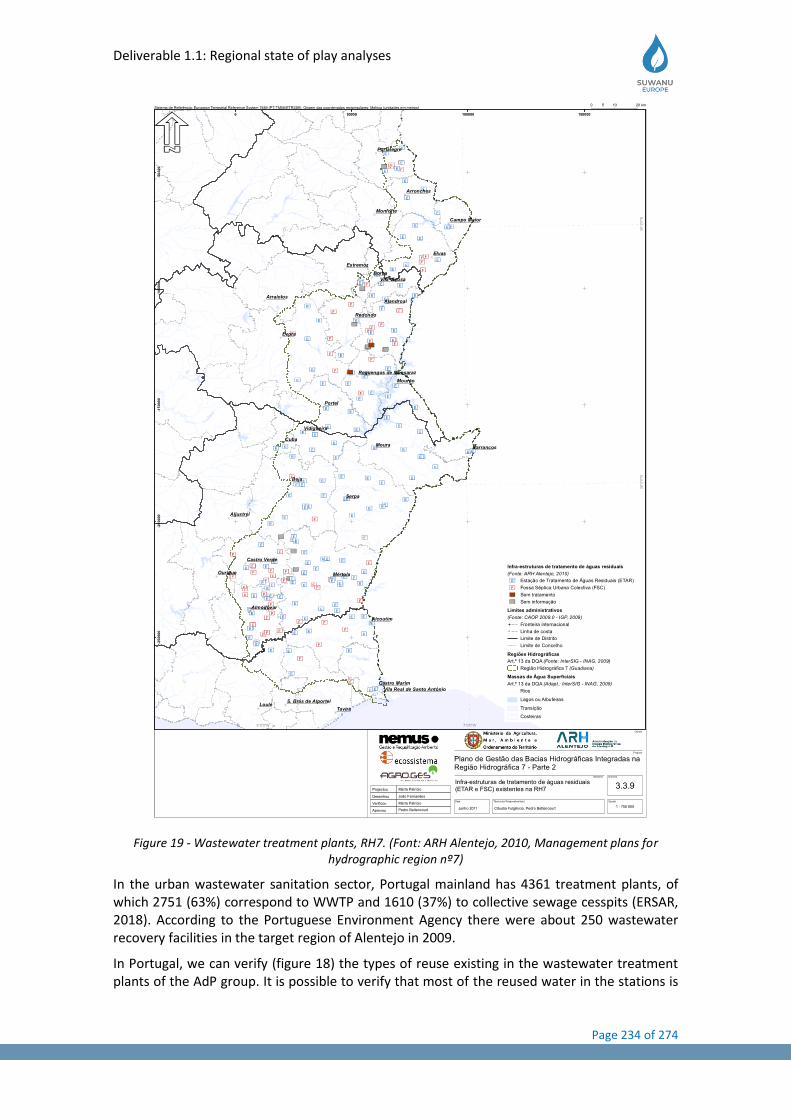
Deliverable 1.1: Regional state of play analyses
Page 234 of 274
Figure 19 - Wastewater treatment plants, RH7. (Font: ARH Alentejo, 2010, Management plans for hydrographic region nº7)
In the urban wastewater sanitation sector, Portugal mainland has 4361 treatment plants, of which 2751 (63%) correspond to WWTP and 1610 (37%) to collective sewage cesspits (ERSAR, 2018). According to the Portuguese Environment Agency there were about 250 wastewater recovery facilities in the target region of Alentejo in 2009.
In Portugal, we can verify (figure 18) the types of reuse existing in the wastewater treatment plants of the AdP group. It is possible to verify that most of the reused water in the stations is
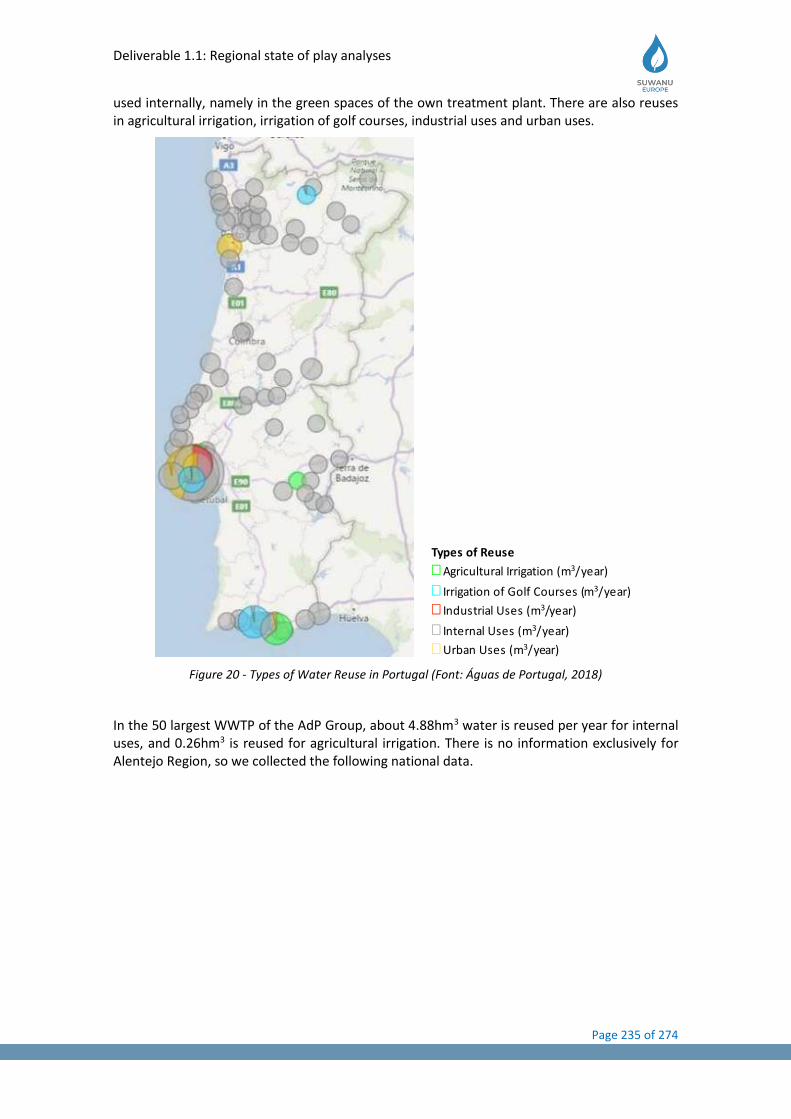
Deliverable 1.1: Regional state of play analyses
Page 235 of 274
used internally, namely in the green spaces of the own treatment plant. There are also reuses in agricultural irrigation, irrigation of golf courses, industrial uses and urban uses.
Figure 20 - Types of Water Reuse in Portugal (Font: Águas de Portugal, 2018)
In the 50 largest WWTP of the AdP Group, about 4.88hm3 water is reused per year for internal uses, and 0.26hm3 is reused for agricultural irrigation. There is no information exclusively for Alentejo Region, so we collected the following national data.
Types of Reuse
• Agricultural Irrigation (m3/year)
• Irrigation of Golf Courses (m3/year)
• Industrial Uses (m3/year)
• Internal Uses (m3/year)
• Urban Uses (m3/year)
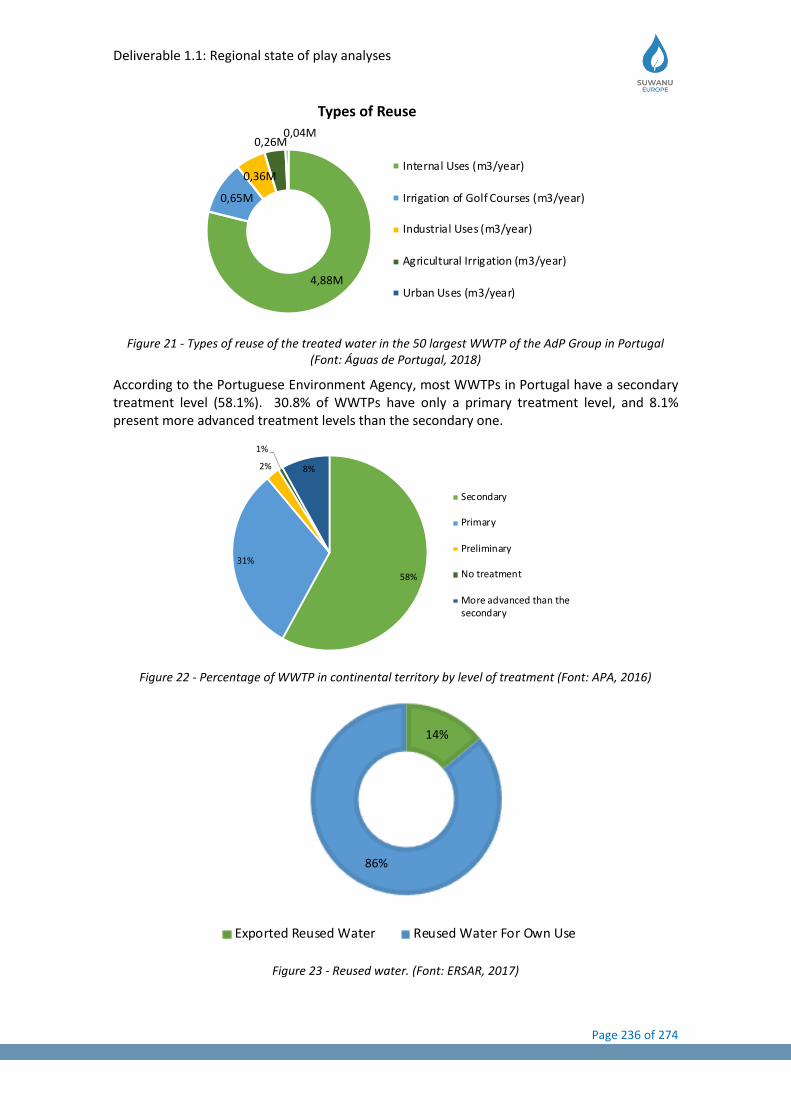
Deliverable 1.1: Regional state of play analyses
Page 236 of 274
Figure 21 - Types of reuse of the treated water in the 50 largest WWTP of the AdP Group in Portugal (Font: Águas de Portugal, 2018)
According to the Portuguese Environment Agency, most WWTPs in Portugal have a secondary treatment level (58.1%). 30.8% of WWTPs have only a primary treatment level, and 8.1% present more advanced treatment levels than the secondary one.
Figure 22 - Percentage of WWTP in continental territory by level of treatment (Font: APA, 2016)
Figure 23 - Reused water. (Font: ERSAR, 2017)
4,88M
0,65M
0,36M
0,26M0,04M
Types of Reuse
Internal Uses (m3/year)
Irrigation of Golf Courses (m3/year)
Industrial Uses (m3/year)
Agricultural Irrigation (m3/year)
Urban Uses (m3/year)
58%
31%
2%
1%
8%
Secondary
Primary
Preliminary
No treatment
More advanced than thesecondary
14%
86%
Exported Reused Water Reused Water For Own Use
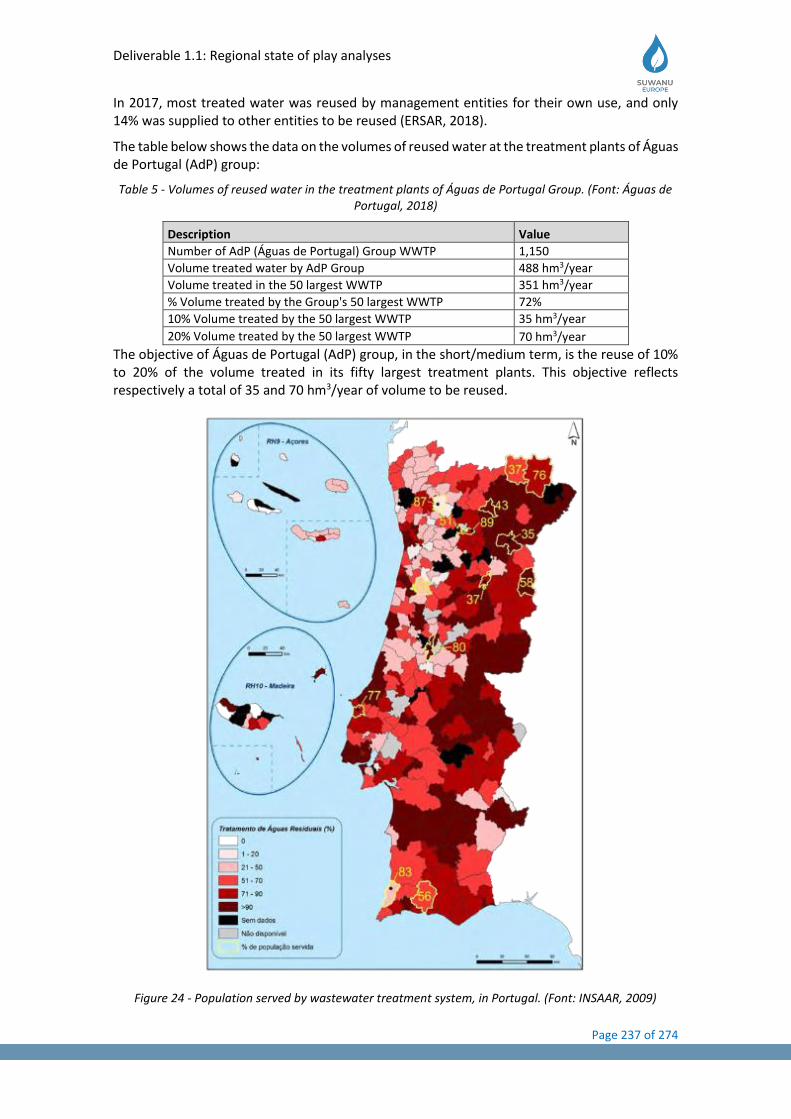
Deliverable 1.1: Regional state of play analyses
Page 237 of 274
In 2017, most treated water was reused by management entities for their own use, and only 14% was supplied to other entities to be reused (ERSAR, 2018).
The table below shows the data on the volumes of reused water at the treatment plants of Águas de Portugal (AdP) group:
Table 5 - Volumes of reused water in the treatment plants of Águas de Portugal Group. (Font: Águas de Portugal, 2018)
Description Value
Number of AdP (Águas de Portugal) Group WWTP 1,150
Volume treated water by AdP Group 488 hm3/year
Volume treated in the 50 largest WWTP 351 hm3/year
% Volume treated by the Group's 50 largest WWTP 72%
10% Volume treated by the 50 largest WWTP 35 hm3/year
20% Volume treated by the 50 largest WWTP 70 hm3/year
The objective of Águas de Portugal (AdP) group, in the short/medium term, is the reuse of 10% to 20% of the volume treated in its fifty largest treatment plants. This objective reflects respectively a total of 35 and 70 hm3/year of volume to be reused.
Figure 24 - Population served by wastewater treatment system, in Portugal. (Font: INSAAR, 2009)
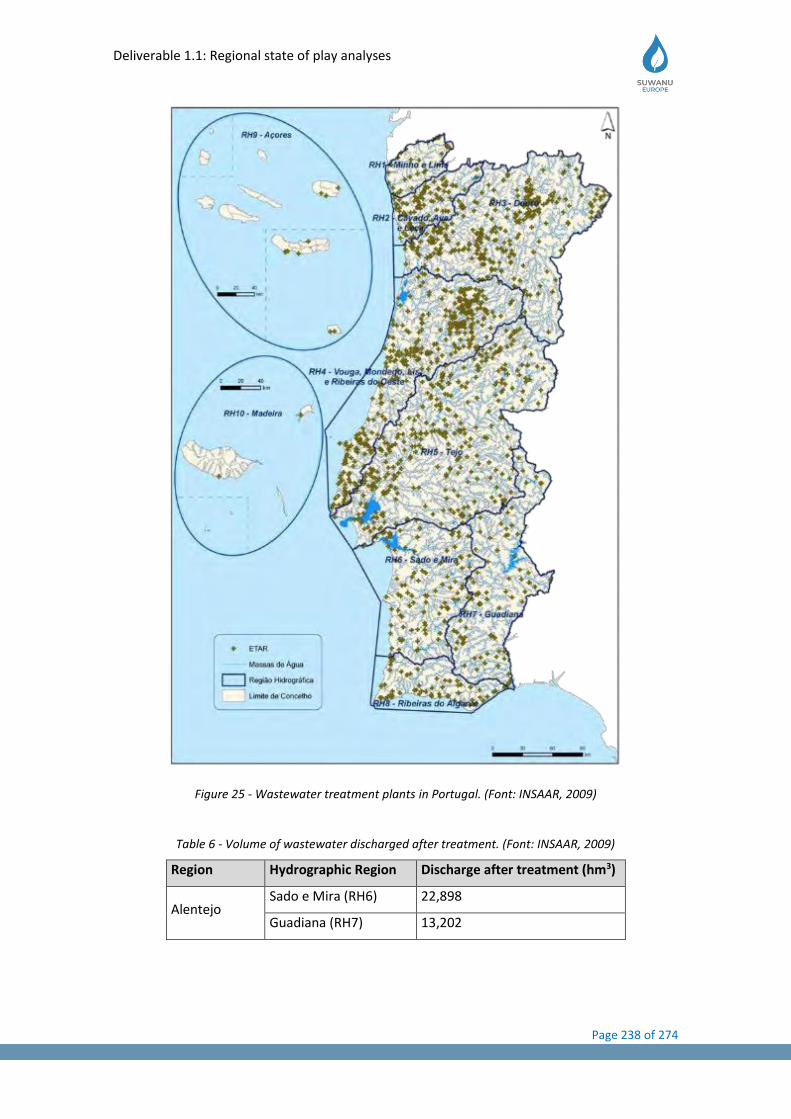
Deliverable 1.1: Regional state of play analyses
Page 238 of 274
Figure 25 - Wastewater treatment plants in Portugal. (Font: INSAAR, 2009)
Table 6 - Volume of wastewater discharged after treatment. (Font: INSAAR, 2009)
Region Hydrographic Region Discharge after treatment (hm3)
Alentejo Sado e Mira (RH6) 22,898
Guadiana (RH7) 13,202
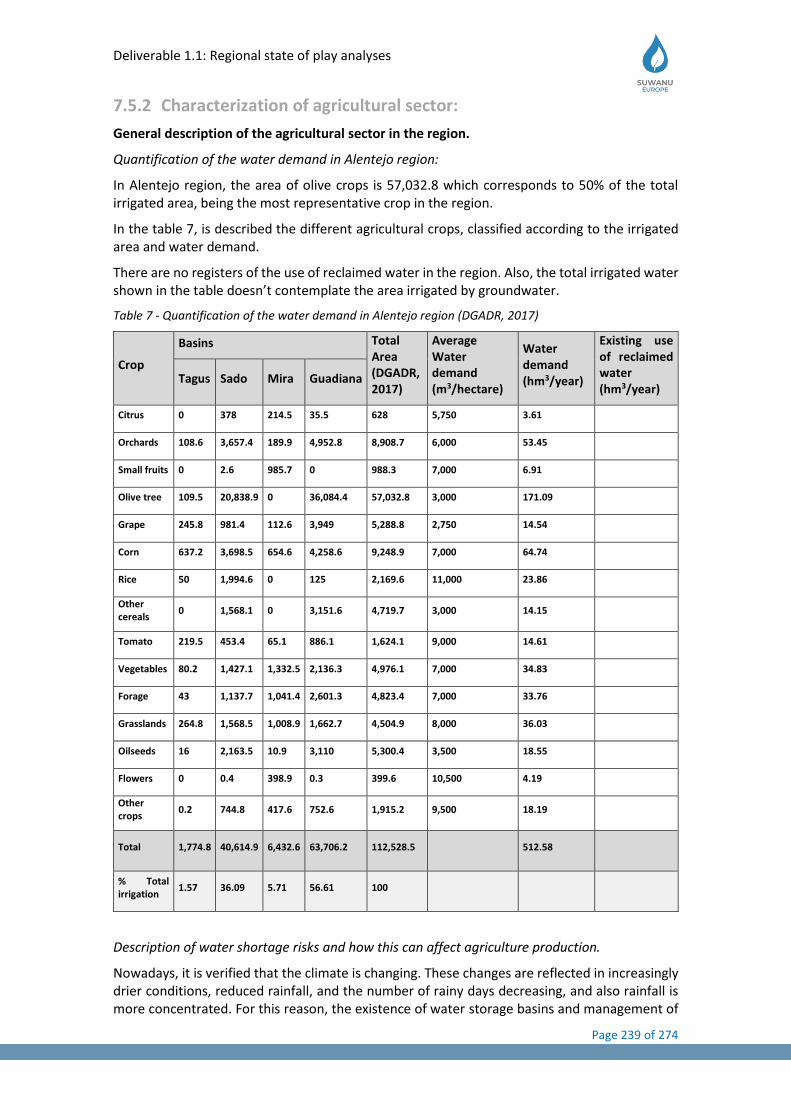
Deliverable 1.1: Regional state of play analyses
Page 239 of 274
7.5.2 Characterization of agricultural sector:
General description of the agricultural sector in the region.
Quantification of the water demand in Alentejo region:
In Alentejo region, the area of olive crops is 57,032.8 which corresponds to 50% of the total irrigated area, being the most representative crop in the region.
In the table 7, is described the different agricultural crops, classified according to the irrigated area and water demand.
There are no registers of the use of reclaimed water in the region. Also, the total irrigated water shown in the table doesn’t contemplate the area irrigated by groundwater.
Table 7 - Quantification of the water demand in Alentejo region (DGADR, 2017)
Crop
Basins Total Area (DGADR, 2017)
Average Water demand (m3/hectare)
Water demand (hm3/year)
Existing use of reclaimed water (hm3/year)
Tagus Sado Mira Guadiana
Citrus 0 378 214.5 35.5 628 5,750 3.61
Orchards 108.6 3,657.4 189.9 4,952.8 8,908.7 6,000 53.45
Small fruits 0 2.6 985.7 0 988.3 7,000 6.91
Olive tree 109.5 20,838.9 0 36,084.4 57,032.8 3,000 171.09
Grape 245.8 981.4 112.6 3,949 5,288.8 2,750 14.54
Corn 637.2 3,698.5 654.6 4,258.6 9,248.9 7,000 64.74
Rice 50 1,994.6 0 125 2,169.6 11,000 23.86
Other cereals
0 1,568.1 0 3,151.6 4,719.7 3,000 14.15
Tomato 219.5 453.4 65.1 886.1 1,624.1 9,000 14.61
Vegetables 80.2 1,427.1 1,332.5 2,136.3 4,976.1 7,000 34.83
Forage 43 1,137.7 1,041.4 2,601.3 4,823.4 7,000 33.76
Grasslands 264.8 1,568.5 1,008.9 1,662.7 4,504.9 8,000 36.03
Oilseeds 16 2,163.5 10.9 3,110 5,300.4 3,500 18.55
Flowers 0 0.4 398.9 0.3 399.6 10,500 4.19
Other crops
0.2 744.8 417.6 752.6 1,915.2 9,500 18.19
Total 1,774.8 40,614.9 6,432.6 63,706.2 112,528.5 512.58
% Total irrigation
1.57 36.09 5.71 56.61 100
Description of water shortage risks and how this can affect agriculture production.
Nowadays, it is verified that the climate is changing. These changes are reflected in increasingly drier conditions, reduced rainfall, and the number of rainy days decreasing, and also rainfall is more concentrated. For this reason, the existence of water storage basins and management of
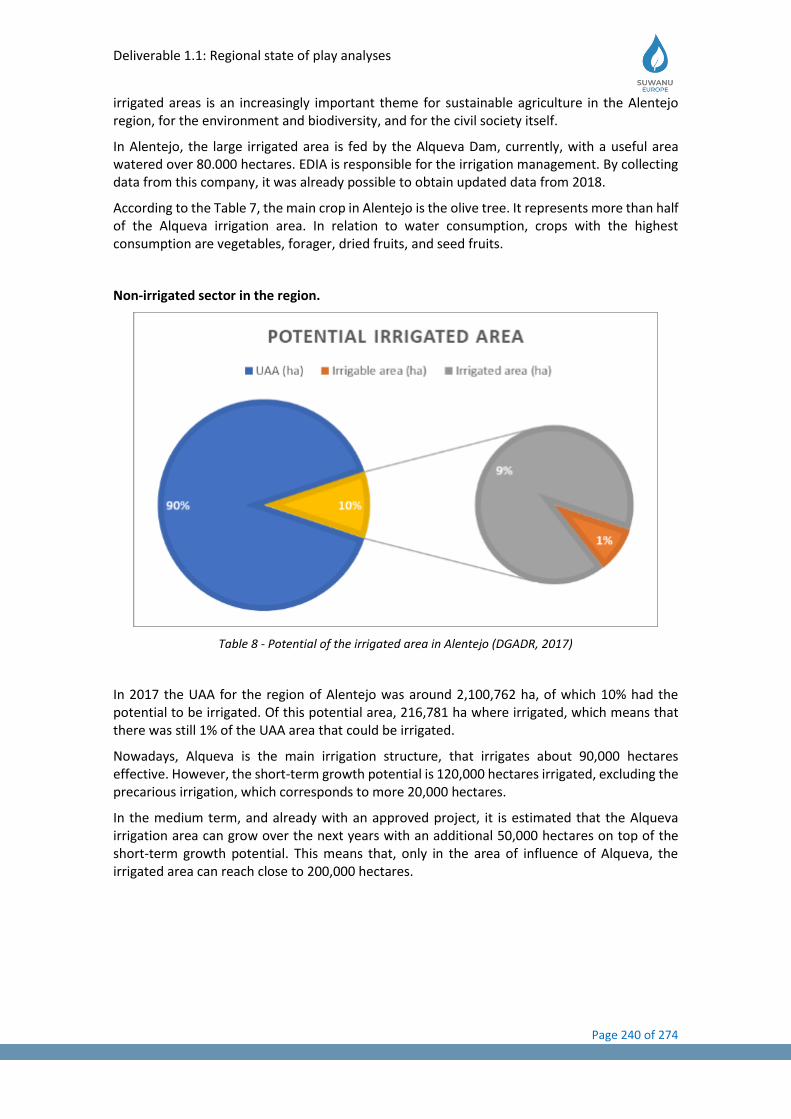
Deliverable 1.1: Regional state of play analyses
Page 240 of 274
irrigated areas is an increasingly important theme for sustainable agriculture in the Alentejo region, for the environment and biodiversity, and for the civil society itself.
In Alentejo, the large irrigated area is fed by the Alqueva Dam, currently, with a useful area watered over 80.000 hectares. EDIA is responsible for the irrigation management. By collecting data from this company, it was already possible to obtain updated data from 2018.
According to the Table 7, the main crop in Alentejo is the olive tree. It represents more than half of the Alqueva irrigation area. In relation to water consumption, crops with the highest consumption are vegetables, forager, dried fruits, and seed fruits.
Non-irrigated sector in the region.
Table 8 - Potential of the irrigated area in Alentejo (DGADR, 2017)
In 2017 the UAA for the region of Alentejo was around 2,100,762 ha, of which 10% had the potential to be irrigated. Of this potential area, 216,781 ha where irrigated, which means that there was still 1% of the UAA area that could be irrigated.
Nowadays, Alqueva is the main irrigation structure, that irrigates about 90,000 hectares effective. However, the short-term growth potential is 120,000 hectares irrigated, excluding the precarious irrigation, which corresponds to more 20,000 hectares.
In the medium term, and already with an approved project, it is estimated that the Alqueva irrigation area can grow over the next years with an additional 50,000 hectares on top of the short-term growth potential. This means that, only in the area of influence of Alqueva, the irrigated area can reach close to 200,000 hectares.
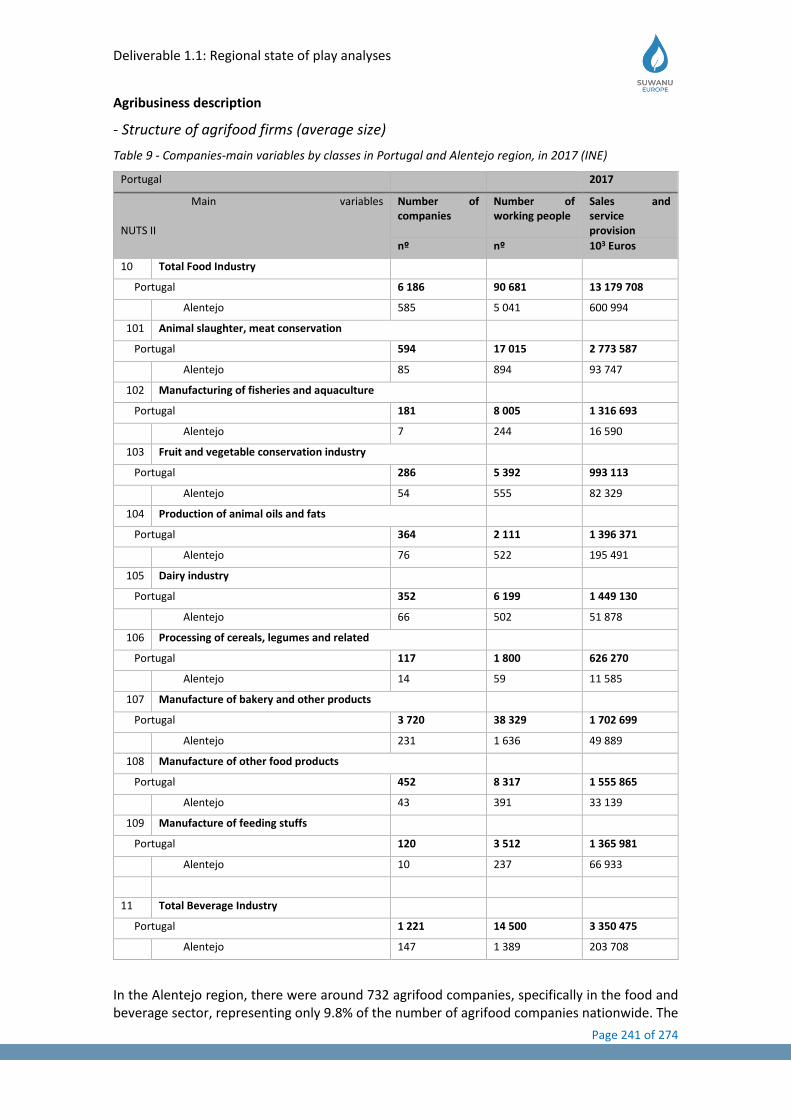
Deliverable 1.1: Regional state of play analyses
Page 241 of 274
Agribusiness description
- Structure of agrifood firms (average size)
Table 9 - Companies-main variables by classes in Portugal and Alentejo region, in 2017 (INE)
Portugal
2017
Main variables NUTS II
Number of companies
Number of working people
Sales and service provision
nº nº 103 Euros
10 Total Food Industry
Portugal 6 186 90 681 13 179 708
Alentejo 585 5 041 600 994
101 Animal slaughter, meat conservation
Portugal 594 17 015 2 773 587
Alentejo 85 894 93 747
102 Manufacturing of fisheries and aquaculture
Portugal 181 8 005 1 316 693
Alentejo 7 244 16 590
103 Fruit and vegetable conservation industry
Portugal 286 5 392 993 113
Alentejo 54 555 82 329
104 Production of animal oils and fats
Portugal 364 2 111 1 396 371
Alentejo 76 522 195 491
105 Dairy industry
Portugal 352 6 199 1 449 130
Alentejo 66 502 51 878
106 Processing of cereals, legumes and related
Portugal 117 1 800 626 270
Alentejo 14 59 11 585
107 Manufacture of bakery and other products
Portugal 3 720 38 329 1 702 699
Alentejo 231 1 636 49 889
108 Manufacture of other food products
Portugal 452 8 317 1 555 865
Alentejo 43 391 33 139
109 Manufacture of feeding stuffs
Portugal 120 3 512 1 365 981
Alentejo 10 237 66 933
11 Total Beverage Industry
Portugal 1 221 14 500 3 350 475
Alentejo 147 1 389 203 708
In the Alentejo region, there were around 732 agrifood companies, specifically in the food and beverage sector, representing only 9.8% of the number of agrifood companies nationwide. The
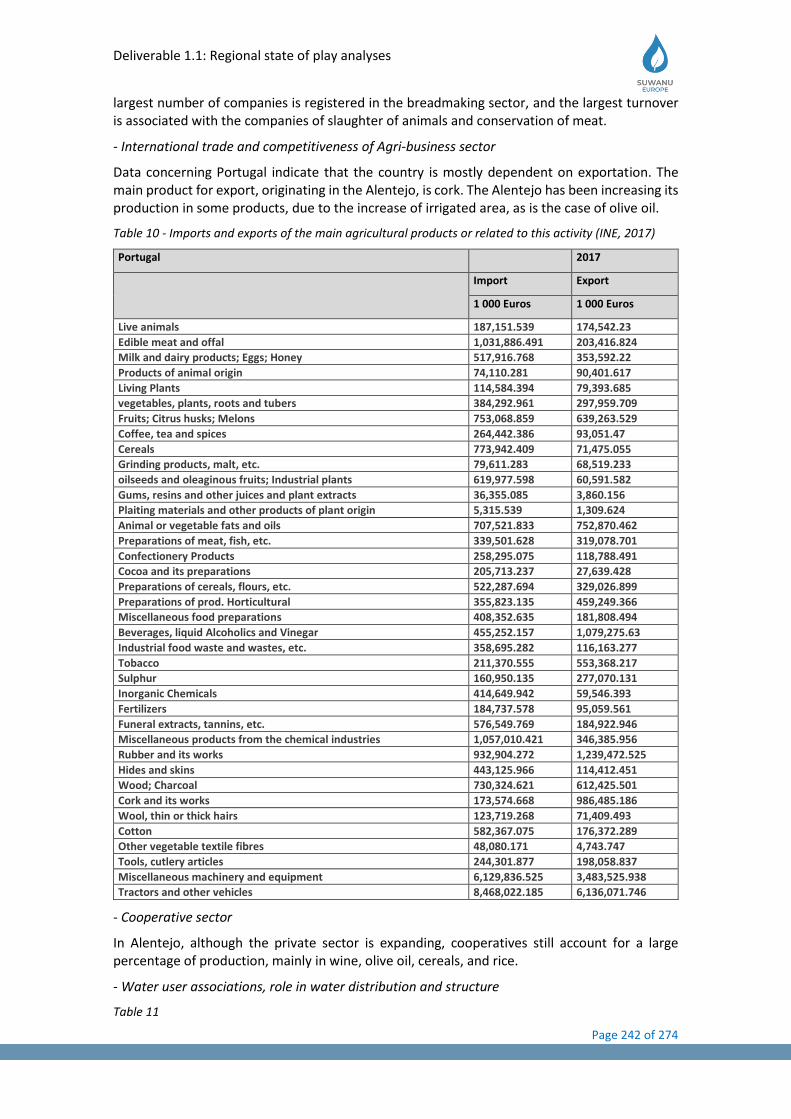
Deliverable 1.1: Regional state of play analyses
Page 242 of 274
largest number of companies is registered in the breadmaking sector, and the largest turnover is associated with the companies of slaughter of animals and conservation of meat.
- International trade and competitiveness of Agri-business sector
Data concerning Portugal indicate that the country is mostly dependent on exportation. The main product for export, originating in the Alentejo, is cork. The Alentejo has been increasing its production in some products, due to the increase of irrigated area, as is the case of olive oil.
Table 10 - Imports and exports of the main agricultural products or related to this activity (INE, 2017)
Portugal 2017
Import Export
1 000 Euros 1 000 Euros
Live animals 187,151.539 174,542.23
Edible meat and offal 1,031,886.491 203,416.824
Milk and dairy products; Eggs; Honey 517,916.768 353,592.22
Products of animal origin 74,110.281 90,401.617
Living Plants 114,584.394 79,393.685
vegetables, plants, roots and tubers 384,292.961 297,959.709
Fruits; Citrus husks; Melons 753,068.859 639,263.529
Coffee, tea and spices 264,442.386 93,051.47
Cereals 773,942.409 71,475.055
Grinding products, malt, etc. 79,611.283 68,519.233
oilseeds and oleaginous fruits; Industrial plants 619,977.598 60,591.582
Gums, resins and other juices and plant extracts 36,355.085 3,860.156
Plaiting materials and other products of plant origin 5,315.539 1,309.624
Animal or vegetable fats and oils 707,521.833 752,870.462
Preparations of meat, fish, etc. 339,501.628 319,078.701
Confectionery Products 258,295.075 118,788.491
Cocoa and its preparations 205,713.237 27,639.428
Preparations of cereals, flours, etc. 522,287.694 329,026.899
Preparations of prod. Horticultural 355,823.135 459,249.366
Miscellaneous food preparations 408,352.635 181,808.494
Beverages, liquid Alcoholics and Vinegar 455,252.157 1,079,275.63
Industrial food waste and wastes, etc. 358,695.282 116,163.277
Tobacco 211,370.555 553,368.217
Sulphur 160,950.135 277,070.131
Inorganic Chemicals 414,649.942 59,546.393
Fertilizers 184,737.578 95,059.561
Funeral extracts, tannins, etc. 576,549.769 184,922.946
Miscellaneous products from the chemical industries 1,057,010.421 346,385.956
Rubber and its works 932,904.272 1,239,472.525
Hides and skins 443,125.966 114,412.451
Wood; Charcoal 730,324.621 612,425.501
Cork and its works 173,574.668 986,485.186
Wool, thin or thick hairs 123,719.268 71,409.493
Cotton 582,367.075 176,372.289
Other vegetable textile fibres 48,080.171 4,743.747
Tools, cutlery articles 244,301.877 198,058.837
Miscellaneous machinery and equipment 6,129,836.525 3,483,525.938
Tractors and other vehicles 8,468,022.185 6,136,071.746
- Cooperative sector
In Alentejo, although the private sector is expanding, cooperatives still account for a large percentage of production, mainly in wine, olive oil, cereals, and rice.
- Water user associations, role in water distribution and structure
Table 11

Deliverable 1.1: Regional state of play analyses
Page 243 of 274
Name Role
FENAREG National Federation of Irrigators
COTR Technical Scientific Center
EDIA Alqueva Development and Infrastructure Company
AgdA Public Water of Alentejo
IP Beja Higher Education Institution of Beja
APA Portuguese Environment Agency
DGADR Directorate-General for Agriculture and Rural Development
ARH Alentejo Administration of the Hydrographic Region of Alentejo
CEBAL Private research and development unit
7.6 Existing related initiatives
Table 12
Name of the network/project
Purpose Leader/coordinator and relevant organizations involved.
MeProWaRe
Novel Methodology for the Promotion of treated Wastewater Reuse for Mediterranean crops improvement
The MeProWaRe project aims to develop a methodological approach to the reuse of WWT in crops typical of Mediterranean countries, such as olive groves and vines, considering the agricultural practices and water limitations of these countries.
IRSA-CNR, Italy (Coordinator)
ISA-LEAF, Portugal
CIHEAM-IAMB, Italy
University of Castilla-La Mancha, Spain
HYDROREUSE
Treatment, and reuse of agroindustry wastewater using an innovative hydroponic system with tomato plants
To develop innovative processes for the management of the main agro-industrial wastewater produced in the Alentejo region (from slaughterhouses, wineries, mills, and dairies) through a treatment/reuse line composed of low-cost and environmentally friendly technologies, namely pre-treatment new, double function hydroponic system with fruit production compatible with market needs and oxidation processes.
CEBAL, Portugal
(Coordinator)
ESA/IP Beja, Portugal
UBI, Portugal
UEX, Spain
IST, Portugal
REUSE Promotion of the production and use of water for reuse (ApR) in the irrigation activity in the Alentejo region, a region that presents typically low precipitation and, simultaneously, a high intensity of irrigated agriculture, accompanied by a worrying evolution of the effects of climate change. Supported by the "Environmental Fund"
AdP Serviços Ambientais, Portugal (Coordinator)
AgdA, Portugal
EFACEC, Portugal
ISA, Portugal
COTR, Portugal
EDIA, Portugal
7.7 Discussion and conclusion remarks
According to the analysis carried out, we can conclude that in Portugal there are not enough structures that allow the reuse of treated wastewater from agro-industrial or urban origin in agriculture, consistently and continuously.
Deliverable 1.1: Regional state of play analyses
Page 244 of 274
Another determining factor is the legal vacuum in the water reuse sector and the lack of technical guidance for both water suppliers and end-users.
On the other hand, there is a potential for using this resource, especially in the Alentejo region, where there are high constraints related to water resources. Recent phenomena related to climate change, which have manifested themselves in situations of extreme drought in recent years have been emphasizing the importance of finding alternatives or complementarities, not only in crops but also in factors of production, that are economically and environmentally viable.
There are many state and private bodies in Portugal that are currently developing projects and actions to raise awareness in the area of re-use of reclaimed water, although not specifically in agriculture. But whose know-how can be applied to the sector, namely the AdP (Águas de Portugal), which has developed much work in this area, in particular in the management of public WWTPs.
7.8 References
▪ Agência Portuguesa do Ambiente (APA). (2015). Planos de Gestão de Região Hidrográfica. Retrieved Data, from https://www.apambiente.pt/?ref=16&subref=7&sub2ref=9&sub3ref=834#pgbh-tabela ▪ Agência Portuguesa do Ambiente (APA). (2019). Relatório do Estado do Ambiente. Retrieved
Data, from https://rea.apambiente.pt ▪ Entidade Reguladora de Águas e Resíduos. (2018). Relatório Anual do Sector. Retrieved Data,
from http://www.ersar.pt/pt ▪ INSAAR. (2010). Relatório 2010. Retrieved Data, from
http://insaar.apambiente.pt/index.php?id=21 ▪ https://www.bportugal.pt/page/quadros-do-setor ▪ https://www.edia.pt ▪ https://www.ine.pt/xportal/xmain?xpid=INE&xpgid=ine_base_dados ▪ http://insaar.apambiente.pt/index.php?id=31 ▪ https://www.pordata.pt/en/DB/Municipalities/Search+Environment/Map ▪ http://www.portugalglobal.pt/EN/InvestInPortugal/RegionsofPortugal/Pages/TheRegionsofP
ortugal.aspx ▪ http://sir.dgadr.gov.pt/ ▪ https://snirh.apambiente.pt
Deliverable 1.1: Regional state of play analyses
Page 245 of 274
8 ANDALUSIA, SPAIN
8.1 Spain Executive summary
Andalusia is the most populated region in Spain and the second in terms of extension. More than eight million people live in Andalusia. The capital city is Seville and it is divided into eight provinces. The urban agglomeration around the top ten cities with more than 100,000 inhabitants (the eight provincial capitals, plus Jerez de la Frontera and Algeciras) brings together more than 50% of the Andalusian population and an even greater proportion of employment and economic activity.
Andalusia’s GDP is 155.213 million Euros, representing the third largest economy in Spain by volume of GDP although the 17th GDP per capita, in 2017 was 18,470€, compared to 25,900€of GDP per capita in Spain. The main sectors are services, followed by agriculture, construction, manufactured industry and logistics and communication.
Andalusia’s climate is the Mediterranean, characterised by dry and hot summers, warm winters and irregular rainfall. However, due to geographical factors, the region has some areas where the climate is diverse, you can find mountains, aridity areas or even Atlantic influenced climate areas. The water availability is also irregular, alternating droughts and rainy periods. For that reason, the water resources vary according to every year rainfall. Nowadays, 70% of water is on the surface, 28% is grounded and around 2% comes from alternative resources like desalinate or reclaimed water. Alternative water resources are mainly desalinated water. There are four plants to desalinate water, three of them are situated in Almeria, the driest province of the region and one in Malaga.
Reclaimed water is not already allowed in Andalusia as irrigating source. The Spanish law, RD 1620/2007 allows the use of reclaimed water for five main beneficial uses: 1) urban, 2) agricultural and landscape, 3) industrial, 4) recreational and 5) environmental. In the RD 1620/2007 are also include certain uses of reclaimed water that are not allowed because of the risks regarding public health and the environment 1) drinking water, 2) food industries, 3) hospitals supplies, 4) cooling in hospital facilities, 4) aquaculture of filtering seafood species, 5) bathing water, 6) water supply for cooling towers and evaporative condensers, 7) landscape fountains and ornamental lakes and 8) any other use that public health authorities may consider a source of public health risk. This prohibition contrast with the 695 treatment plants working in the region and another 27 under construction. These treatment plants benefit a population of 7,118,859 people. This data also means that 12.40% of the population in Andalusia remain unserved of appropriate treatment of their wastewater
With regards to the potential of reclaimed water reuse, Andalusia reuse (not for agriculture, with some exceptions) is higher than the Spanish average. With 27% of the more than 2,000 wastewater treatment plants (WWTP) in Spain, the country is technologically prepared to offer tertiary treatments that enable the reuse of reclaimed water, it is estimated that we already reuse more than 492 cubic hectometres per year, 10.43% of the treated wastewater. 90% of the total water reused is concentrated in the Valencian Community, Murcia, Andalusia, Canary Islands and the Balearic Islands and large cities such as Madrid or Barcelona.
The use of reclaimed water can also benefit the agrobusiness sector. The third most important sector in the Andalusian economy, behind the service sector and construction. In the following pages more information about these issues is provided.
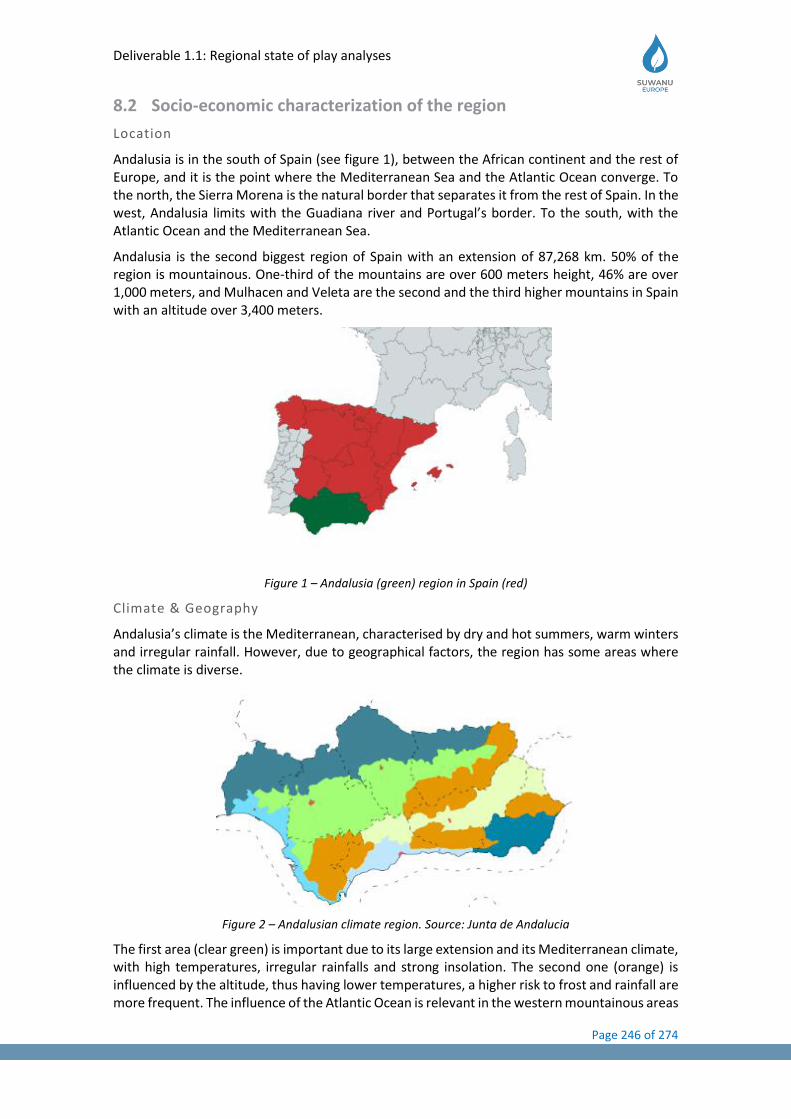
Deliverable 1.1: Regional state of play analyses
Page 246 of 274
8.2 Socio-economic characterization of the region
Location
Andalusia is in the south of Spain (see figure 1), between the African continent and the rest of Europe, and it is the point where the Mediterranean Sea and the Atlantic Ocean converge. To the north, the Sierra Morena is the natural border that separates it from the rest of Spain. In the west, Andalusia limits with the Guadiana river and Portugal’s border. To the south, with the Atlantic Ocean and the Mediterranean Sea.
Andalusia is the second biggest region of Spain with an extension of 87,268 km. 50% of the region is mountainous. One-third of the mountains are over 600 meters height, 46% are over 1,000 meters, and Mulhacen and Veleta are the second and the third higher mountains in Spain with an altitude over 3,400 meters.
Figure 1 – Andalusia (green) region in Spain (red)
Climate & Geography
Andalusia’s climate is the Mediterranean, characterised by dry and hot summers, warm winters and irregular rainfall. However, due to geographical factors, the region has some areas where the climate is diverse.
Figure 2 – Andalusian climate region. Source: Junta de Andalucia
The first area (clear green) is important due to its large extension and its Mediterranean climate, with high temperatures, irregular rainfalls and strong insolation. The second one (orange) is influenced by the altitude, thus having lower temperatures, a higher risk to frost and rainfall are more frequent. The influence of the Atlantic Ocean is relevant in the western mountainous areas
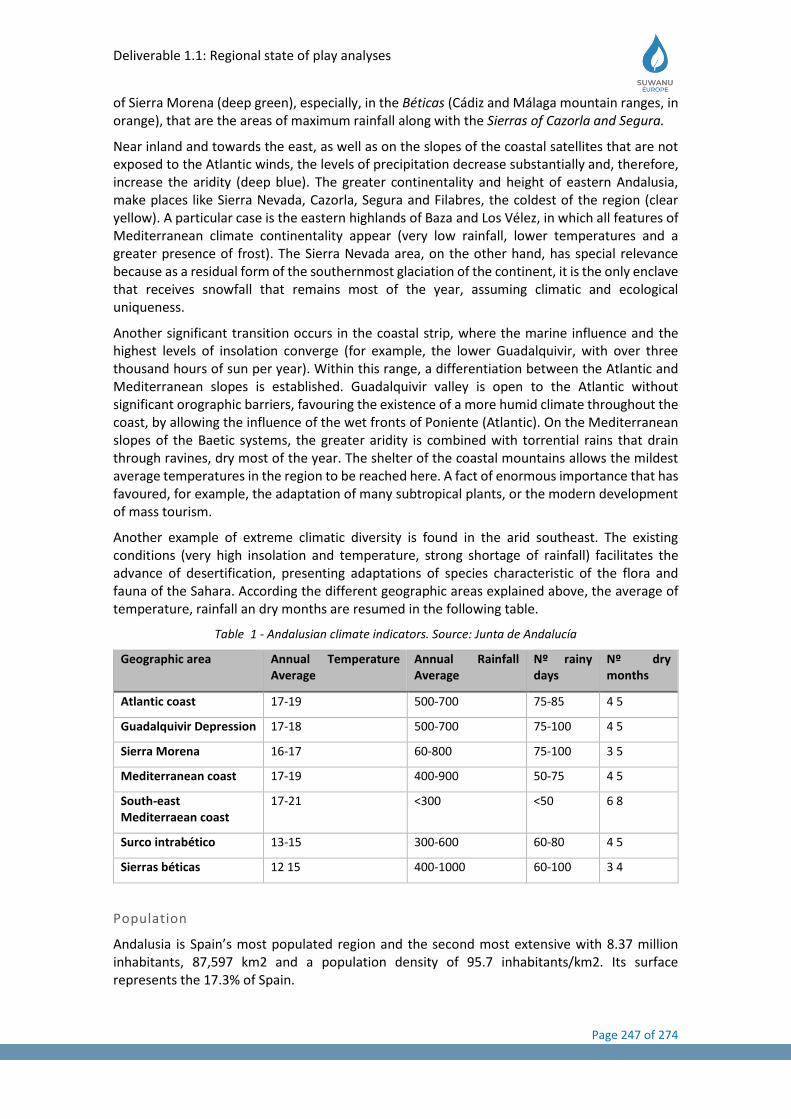
Deliverable 1.1: Regional state of play analyses
Page 247 of 274
of Sierra Morena (deep green), especially, in the Béticas (Cádiz and Málaga mountain ranges, in orange), that are the areas of maximum rainfall along with the Sierras of Cazorla and Segura.
Near inland and towards the east, as well as on the slopes of the coastal satellites that are not exposed to the Atlantic winds, the levels of precipitation decrease substantially and, therefore, increase the aridity (deep blue). The greater continentality and height of eastern Andalusia, make places like Sierra Nevada, Cazorla, Segura and Filabres, the coldest of the region (clear yellow). A particular case is the eastern highlands of Baza and Los Vélez, in which all features of Mediterranean climate continentality appear (very low rainfall, lower temperatures and a greater presence of frost). The Sierra Nevada area, on the other hand, has special relevance because as a residual form of the southernmost glaciation of the continent, it is the only enclave that receives snowfall that remains most of the year, assuming climatic and ecological uniqueness.
Another significant transition occurs in the coastal strip, where the marine influence and the highest levels of insolation converge (for example, the lower Guadalquivir, with over three thousand hours of sun per year). Within this range, a differentiation between the Atlantic and Mediterranean slopes is established. Guadalquivir valley is open to the Atlantic without significant orographic barriers, favouring the existence of a more humid climate throughout the coast, by allowing the influence of the wet fronts of Poniente (Atlantic). On the Mediterranean slopes of the Baetic systems, the greater aridity is combined with torrential rains that drain through ravines, dry most of the year. The shelter of the coastal mountains allows the mildest average temperatures in the region to be reached here. A fact of enormous importance that has favoured, for example, the adaptation of many subtropical plants, or the modern development of mass tourism.
Another example of extreme climatic diversity is found in the arid southeast. The existing conditions (very high insolation and temperature, strong shortage of rainfall) facilitates the advance of desertification, presenting adaptations of species characteristic of the flora and fauna of the Sahara. According the different geographic areas explained above, the average of temperature, rainfall an dry months are resumed in the following table.
Table 1 - Andalusian climate indicators. Source: Junta de Andalucía
Geographic area Annual Temperature Average
Annual Rainfall Average
Nº rainy days
Nº dry months
Atlantic coast 17-19 500-700 75-85 4 5
Guadalquivir Depression 17-18 500-700 75-100 4 5
Sierra Morena 16-17 60-800 75-100 3 5
Mediterranean coast 17-19 400-900 50-75 4 5
South-east Mediterraean coast
17-21 <300 <50 6 8
Surco intrabético 13-15 300-600 60-80 4 5
Sierras béticas 12 15 400-1000 60-100 3 4
Population
Andalusia is Spain’s most populated region and the second most extensive with 8.37 million inhabitants, 87,597 km2 and a population density of 95.7 inhabitants/km2. Its surface represents the 17.3% of Spain.
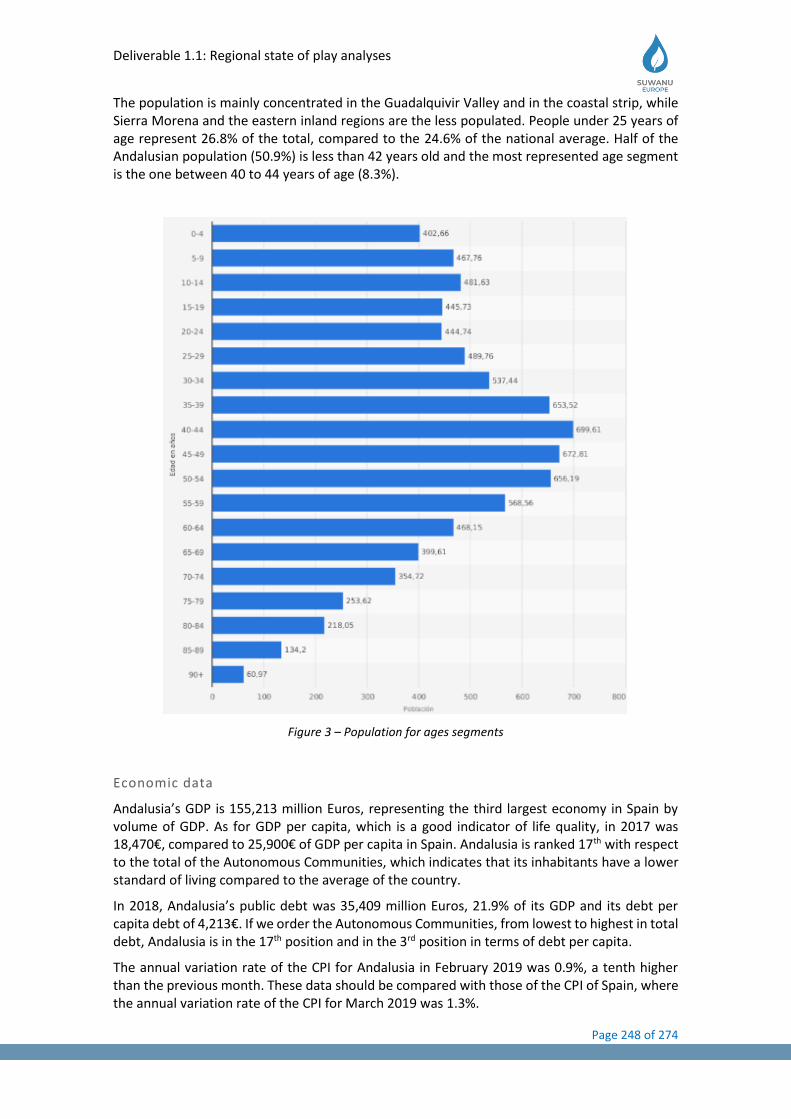
Deliverable 1.1: Regional state of play analyses
Page 248 of 274
The population is mainly concentrated in the Guadalquivir Valley and in the coastal strip, while Sierra Morena and the eastern inland regions are the less populated. People under 25 years of age represent 26.8% of the total, compared to the 24.6% of the national average. Half of the Andalusian population (50.9%) is less than 42 years old and the most represented age segment is the one between 40 to 44 years of age (8.3%).
Figure 3 – Population for ages segments
Economic data
Andalusia’s GDP is 155,213 million Euros, representing the third largest economy in Spain by volume of GDP. As for GDP per capita, which is a good indicator of life quality, in 2017 was 18,470€, compared to 25,900€ of GDP per capita in Spain. Andalusia is ranked 17th with respect to the total of the Autonomous Communities, which indicates that its inhabitants have a lower standard of living compared to the average of the country.
In 2018, Andalusia’s public debt was 35,409 million Euros, 21.9% of its GDP and its debt per capita debt of 4,213€. If we order the Autonomous Communities, from lowest to highest in total debt, Andalusia is in the 17th position and in the 3rd position in terms of debt per capita.
The annual variation rate of the CPI for Andalusia in February 2019 was 0.9%, a tenth higher than the previous month. These data should be compared with those of the CPI of Spain, where the annual variation rate of the CPI for March 2019 was 1.3%.
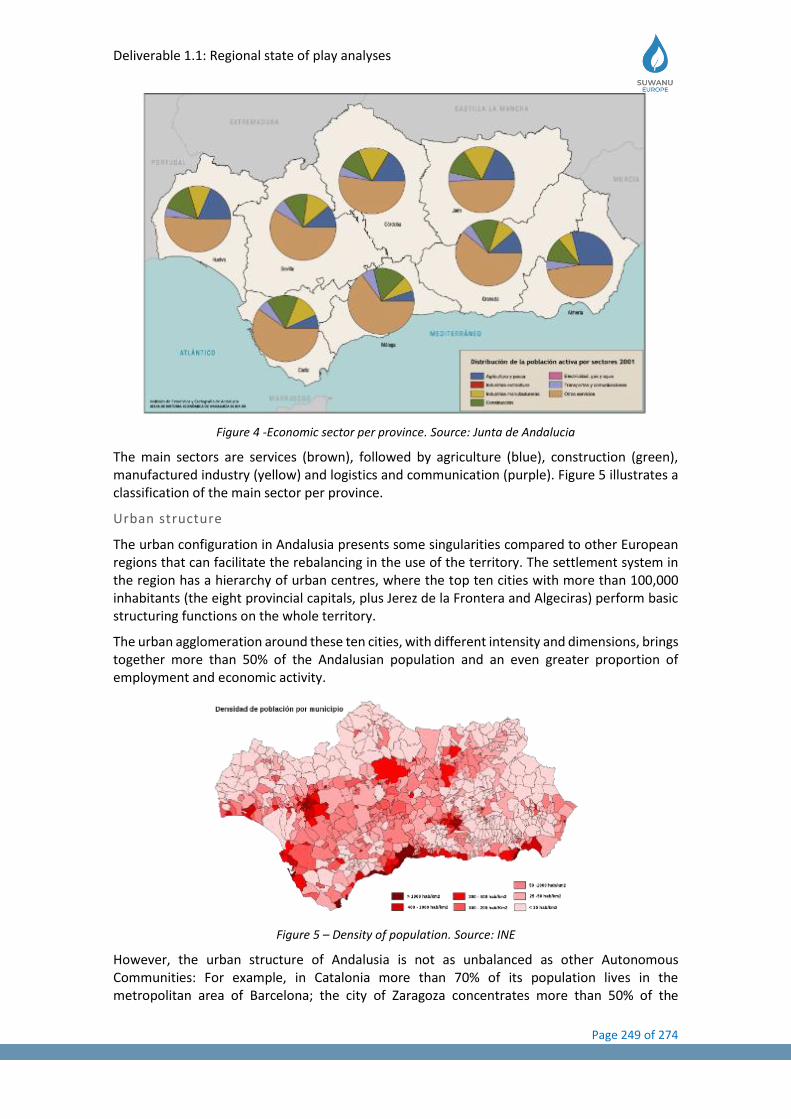
Deliverable 1.1: Regional state of play analyses
Page 249 of 274
Figure 4 -Economic sector per province. Source: Junta de Andalucia
The main sectors are services (brown), followed by agriculture (blue), construction (green), manufactured industry (yellow) and logistics and communication (purple). Figure 5 illustrates a classification of the main sector per province.
Urban structure
The urban configuration in Andalusia presents some singularities compared to other European regions that can facilitate the rebalancing in the use of the territory. The settlement system in the region has a hierarchy of urban centres, where the top ten cities with more than 100,000 inhabitants (the eight provincial capitals, plus Jerez de la Frontera and Algeciras) perform basic structuring functions on the whole territory.
The urban agglomeration around these ten cities, with different intensity and dimensions, brings together more than 50% of the Andalusian population and an even greater proportion of employment and economic activity.
Figure 5 – Density of population. Source: INE
However, the urban structure of Andalusia is not as unbalanced as other Autonomous Communities: For example, in Catalonia more than 70% of its population lives in the metropolitan area of Barcelona; the city of Zaragoza concentrates more than 50% of the
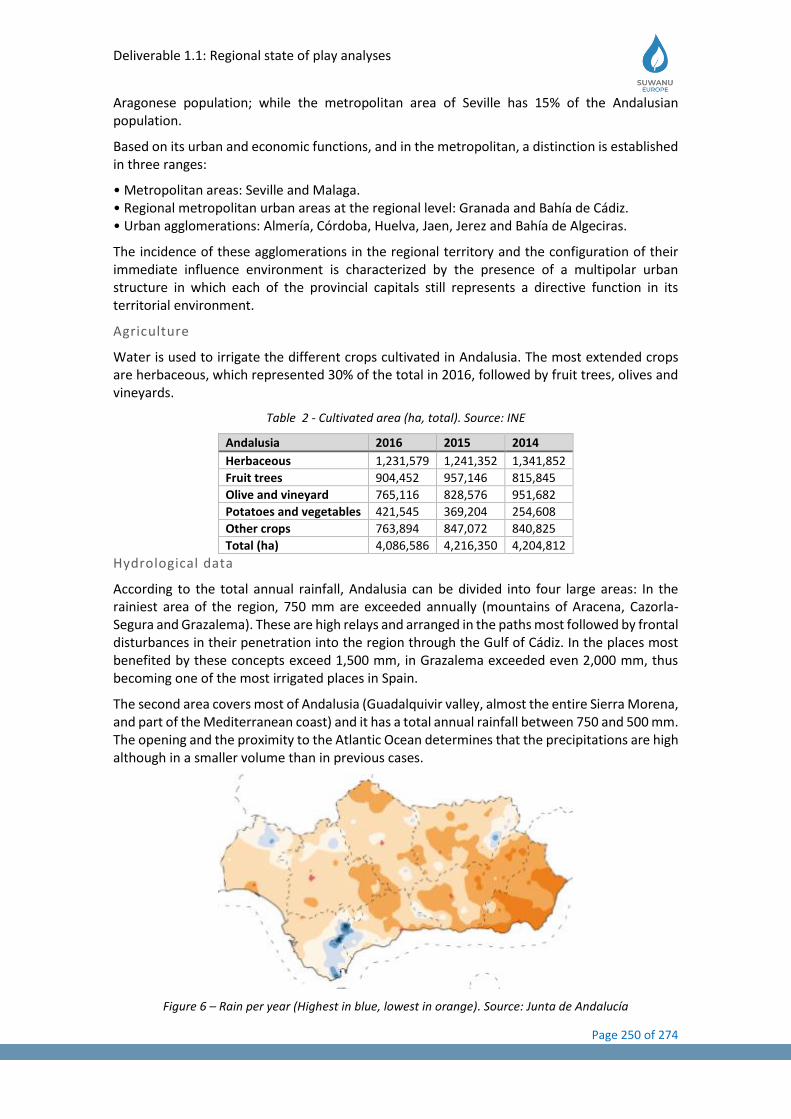
Deliverable 1.1: Regional state of play analyses
Page 250 of 274
Aragonese population; while the metropolitan area of Seville has 15% of the Andalusian population.
Based on its urban and economic functions, and in the metropolitan, a distinction is established in three ranges:
• Metropolitan areas: Seville and Malaga. • Regional metropolitan urban areas at the regional level: Granada and Bahía de Cádiz. • Urban agglomerations: Almería, Córdoba, Huelva, Jaen, Jerez and Bahía de Algeciras.
The incidence of these agglomerations in the regional territory and the configuration of their immediate influence environment is characterized by the presence of a multipolar urban structure in which each of the provincial capitals still represents a directive function in its territorial environment.
Agriculture
Water is used to irrigate the different crops cultivated in Andalusia. The most extended crops are herbaceous, which represented 30% of the total in 2016, followed by fruit trees, olives and vineyards.
Table 2 - Cultivated area (ha, total). Source: INE
Andalusia 2016 2015 2014
Herbaceous 1,231,579 1,241,352 1,341,852
Fruit trees 904,452 957,146 815,845
Olive and vineyard 765,116 828,576 951,682
Potatoes and vegetables 421,545 369,204 254,608
Other crops 763,894 847,072 840,825
Total (ha) 4,086,586 4,216,350 4,204,812
Hydrological data
According to the total annual rainfall, Andalusia can be divided into four large areas: In the rainiest area of the region, 750 mm are exceeded annually (mountains of Aracena, Cazorla-Segura and Grazalema). These are high relays and arranged in the paths most followed by frontal disturbances in their penetration into the region through the Gulf of Cádiz. In the places most benefited by these concepts exceed 1,500 mm, in Grazalema exceeded even 2,000 mm, thus becoming one of the most irrigated places in Spain.
The second area covers most of Andalusia (Guadalquivir valley, almost the entire Sierra Morena, and part of the Mediterranean coast) and it has a total annual rainfall between 750 and 500 mm. The opening and the proximity to the Atlantic Ocean determines that the precipitations are high although in a smaller volume than in previous cases.
Figure 6 – Rain per year (Highest in blue, lowest in orange). Source: Junta de Andalucía
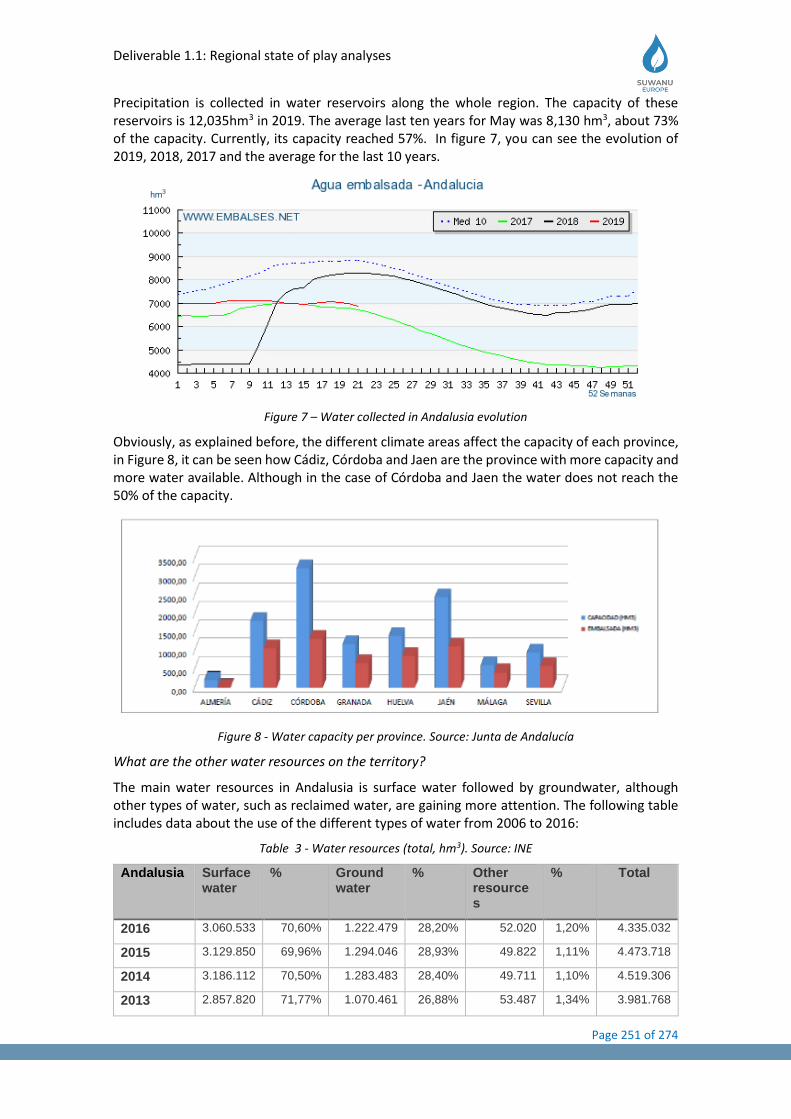
Deliverable 1.1: Regional state of play analyses
Page 251 of 274
Precipitation is collected in water reservoirs along the whole region. The capacity of these reservoirs is 12,035hm3 in 2019. The average last ten years for May was 8,130 hm3, about 73% of the capacity. Currently, its capacity reached 57%. In figure 7, you can see the evolution of 2019, 2018, 2017 and the average for the last 10 years.
Figure 7 – Water collected in Andalusia evolution
Obviously, as explained before, the different climate areas affect the capacity of each province, in Figure 8, it can be seen how Cádiz, Córdoba and Jaen are the province with more capacity and more water available. Although in the case of Córdoba and Jaen the water does not reach the 50% of the capacity.
Figure 8 - Water capacity per province. Source: Junta de Andalucía
What are the other water resources on the territory?
The main water resources in Andalusia is surface water followed by groundwater, although other types of water, such as reclaimed water, are gaining more attention. The following table includes data about the use of the different types of water from 2006 to 2016:
Table 3 - Water resources (total, hm3). Source: INE
Andalusia Surface water
% Ground water
% Other resources
% Total
2016 3.060.533 70,60% 1.222.479 28,20% 52.020 1,20% 4.335.032
2015 3.129.850 69,96% 1.294.046 28,93% 49.822 1,11% 4.473.718
2014 3.186.112 70,50% 1.283.483 28,40% 49.711 1,10% 4.519.306
2013 2.857.820 71,77% 1.070.461 26,88% 53.487 1,34% 3.981.768
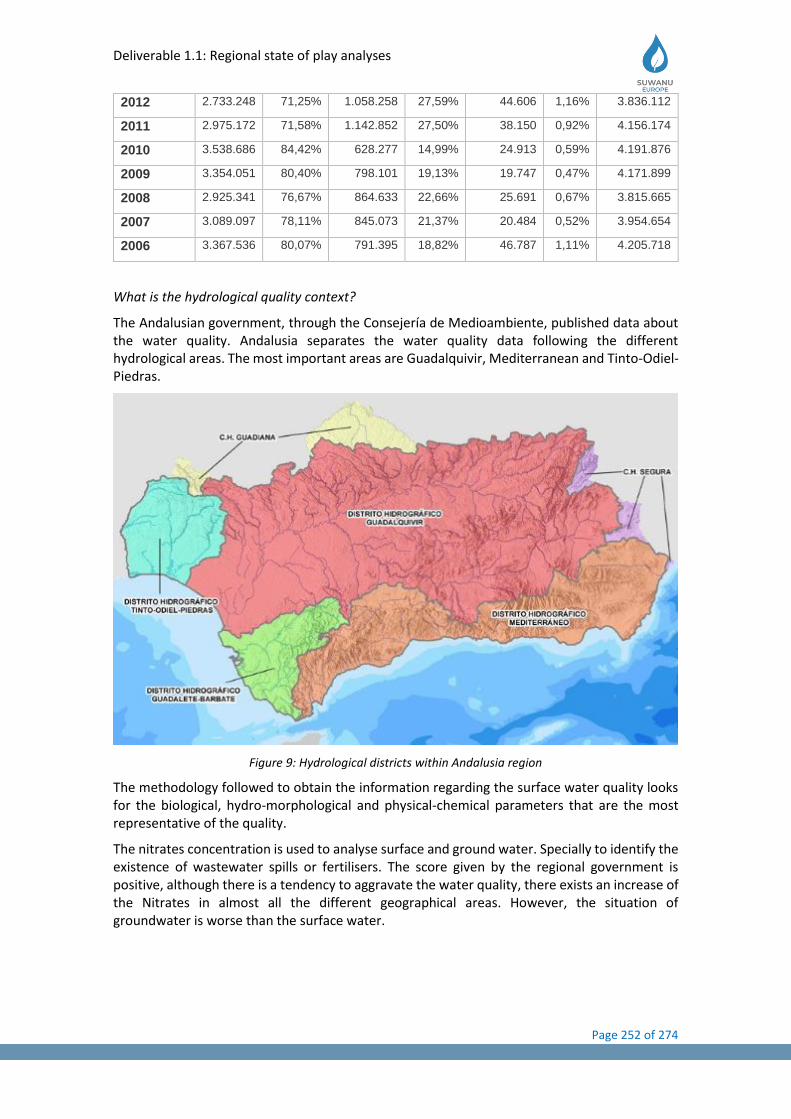
Deliverable 1.1: Regional state of play analyses
Page 252 of 274
2012 2.733.248 71,25% 1.058.258 27,59% 44.606 1,16% 3.836.112
2011 2.975.172 71,58% 1.142.852 27,50% 38.150 0,92% 4.156.174
2010 3.538.686 84,42% 628.277 14,99% 24.913 0,59% 4.191.876
2009 3.354.051 80,40% 798.101 19,13% 19.747 0,47% 4.171.899
2008 2.925.341 76,67% 864.633 22,66% 25.691 0,67% 3.815.665
2007 3.089.097 78,11% 845.073 21,37% 20.484 0,52% 3.954.654
2006 3.367.536 80,07% 791.395 18,82% 46.787 1,11% 4.205.718
What is the hydrological quality context?
The Andalusian government, through the Consejería de Medioambiente, published data about the water quality. Andalusia separates the water quality data following the different hydrological areas. The most important areas are Guadalquivir, Mediterranean and Tinto-Odiel-Piedras.
Figure 9: Hydrological districts within Andalusia region
The methodology followed to obtain the information regarding the surface water quality looks for the biological, hydro-morphological and physical-chemical parameters that are the most representative of the quality.
The nitrates concentration is used to analyse surface and ground water. Specially to identify the existence of wastewater spills or fertilisers. The score given by the regional government is positive, although there is a tendency to aggravate the water quality, there exists an increase of the Nitrates in almost all the different geographical areas. However, the situation of groundwater is worse than the surface water.
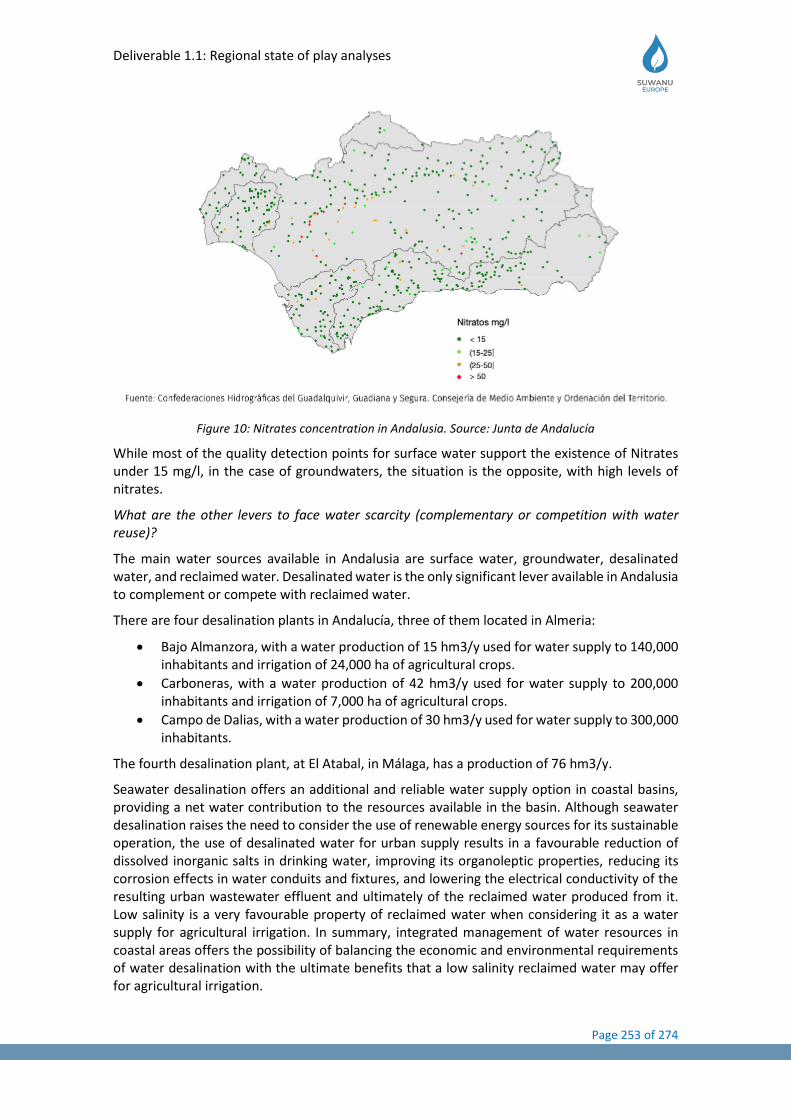
Deliverable 1.1: Regional state of play analyses
Page 253 of 274
Figure 10: Nitrates concentration in Andalusia. Source: Junta de Andalucía
While most of the quality detection points for surface water support the existence of Nitrates under 15 mg/l, in the case of groundwaters, the situation is the opposite, with high levels of nitrates.
What are the other levers to face water scarcity (complementary or competition with water reuse)?
The main water sources available in Andalusia are surface water, groundwater, desalinated water, and reclaimed water. Desalinated water is the only significant lever available in Andalusia to complement or compete with reclaimed water.
There are four desalination plants in Andalucía, three of them located in Almeria:
• Bajo Almanzora, with a water production of 15 hm3/y used for water supply to 140,000 inhabitants and irrigation of 24,000 ha of agricultural crops.
• Carboneras, with a water production of 42 hm3/y used for water supply to 200,000 inhabitants and irrigation of 7,000 ha of agricultural crops.
• Campo de Dalias, with a water production of 30 hm3/y used for water supply to 300,000 inhabitants.
The fourth desalination plant, at El Atabal, in Málaga, has a production of 76 hm3/y.
Seawater desalination offers an additional and reliable water supply option in coastal basins, providing a net water contribution to the resources available in the basin. Although seawater desalination raises the need to consider the use of renewable energy sources for its sustainable operation, the use of desalinated water for urban supply results in a favourable reduction of dissolved inorganic salts in drinking water, improving its organoleptic properties, reducing its corrosion effects in water conduits and fixtures, and lowering the electrical conductivity of the resulting urban wastewater effluent and ultimately of the reclaimed water produced from it. Low salinity is a very favourable property of reclaimed water when considering it as a water supply for agricultural irrigation. In summary, integrated management of water resources in coastal areas offers the possibility of balancing the economic and environmental requirements of water desalination with the ultimate benefits that a low salinity reclaimed water may offer for agricultural irrigation.
Deliverable 1.1: Regional state of play analyses
Page 254 of 274
8.3 Regulatory and institutional framework
8.3.1 Legal framework
Legal framework in Spain
The Spanish regulations for water reuse were approved in December 2007, as a Royal Decree 1620/2007. The legal text (Ministerio de la Presidencia, 2007) is attached to this report. It has also been attached to English translation, published by ASERSA in September 2011 (ASERSA, 2011).
The RD 1620/2007 defines the practice of “water reuse”, introducing the term “reclaimed water”, determining the minimum requirements for implementing the reuse of reclaimed water, setting the protocols to be followed for getting reclaimed water rights, establishing the scope of water reuse practices (with specific prohibition of certain reclaimed water uses) and setting forth the quality requirements associated to each specific water reuse option. That terminology is in complete agreement with the “Article 3 Definitions” of the “Regulation on water reuse for agricultural irrigation”, as amended by the EU Parliament during its session of 12 February 2019.
Although the RD 1620/2007 is entirely devoted to regulating the use of reclaimed water, its title includes a direct reference to “treated wastewater”, because of its legal dependence from the Spanish Water Code amendment introduced by Law 11/2005, as described in the foreword of the RD 1620/2007. Spanish Water Law establishes that all water resources (surface water and groundwater) are public and consequently any potential water user has to obtain the right water permit (authorization, concession) for its use.
The RD 1620/2007 allows the use of reclaimed water for five main beneficial uses: 1) urban, 2) agricultural and landscape, 3) industrial, 4) recreational and 5) environmental. Some of them have several subcategories of use, up to 13 in total, depending on the degree of contact of reclaimed water with agriculture products, agriculture workers, and the public at large. Water Authority (Basin Agency) is responsible for obtaining a binding report from public health authorities, as a prerequisite for the approval of any water reuse proposal.
Before a treated wastewater effluent can be reused, it has to undergo a water reclamation process capable of ensuring that its quality satisfies the health and environmental quality limits associated with the proposed use. In addition, the RD 1620/2007 specifically forbids certain uses of reclaimed water, because of the risks regarding public health and the environment, such as 1) drinking water (with the possible exception of natural disasters, when public health authorities will have to establish the water quality required), 2) food industries, 3) hospitals supplies, 4) cooling in hospital facilities, 4) aquaculture of filtering seafood species, 5) bathing water, 6) water supply for cooling towers and evaporative condensers, 7) landscape fountains and ornamental lakes and 8) any other use that public health authorities may consider a source of public health risk.
The RD 1620/2007 sets the administrative procedure that the proponent of a water reuse project has to follow, as to obtain the legal right of using a treated effluent as the influent of a subsequent reclamation process. In particular, the regulation establishes that the recipient of a water right permit will be responsible for all the costs associated to the reclamation process necessary to bring reclaimed water quality in accordance with the quality limits included in the regulation. In particular, the regulation contemplates the possibility that State, Regional and Local governments may develop water reuse plans and programs as a way to promote water reuse and integrated water resources management.
Annex I of RD 1620/2007 describes the water quality criteria applicable to the 5 main categories and 13 subcategories of reclaimed water uses. Those quality criteria are considered minimum compulsory requirements. The four basic quality parameters considered in those criteria are 1)
Deliverable 1.1: Regional state of play analyses
Page 255 of 274
intestinal nematodes, 2) E. coli, 3) suspended solids and 4) turbidity. The most restrictive numerical limits for those parameters are associated to the use of reclaimed water for landscape irrigation in private and urban gardens, and are the following: 1 nematode egg/10 L, absence of E. coli (cfu/100 mL), 10 mg SS/L and turbidity of 2 UNT, respectively. The quality limits for agricultural irrigation of unrestricted irrigation of food crops eaten raw are 1 nematode egg/10 L, 100 E. coli (cfu/100 mL), 20 mg SS/L and turbidity of 10 UNT.
That set of water quality parameters was based in the World Health Organization recommendations and the State of California criteria. The numerical limits adopted were based on the treatment performance of the reclamation processes regularly applied to reclaim water, mostly representing conventional drinking water treatment processes. None of the quality limits adopted in the RD 1620/2007 was based on risk evaluation assessments, other than the lack of known public health impacts of using reclaimed water of similar quality levels, as reported by water reuse projects conducted in Spain, California and Florida.
Annex I of RD 1620/2007 also includes the minimum number of water samples and analyses applicable to the four main water quality parameters, the maximum deviation of those quality parameters from the applicable minimum requirements, and the analytical methods proposed for evaluating microbiological and chemical parameters.
Annex II of the RD 1620/2007 includes the normalized formulary required for submitting the water right permit application necessary for implementing a water reuse project.
Legal framework in the European Union
On 12 February 2019, the European Parliament adopted a proposal of the European Parliament and of the Council for a regulation on minimum requirements for water reuse T8-0071/2019 (as a continuation of proposals COM(2018)0337 – C8-0220/2018 – 2018/0169(COD)).
The official procedure applicable to that proposal establishes that the European Parliament:
1. Adopts its position at first reading hereinafter set out;
2. Calls on the Commission to refer the matter to Parliament again if it replaces substantially amends or intends to substantially amend its proposal;
3. Instructs its President to forward its position to the Council, the Commission and the national parliaments.
The European Parliament considered all the legal instruments that this proposal could take, namely amending one of the existing Directives, a new Directive or Regulation, or Guidance. The legal instrument finally selected was a Regulation, defined as a “Legislative act that has general application and is binding in its entirety. It is directly applicable in all Member States”. The reasons for selecting that legal instrument was:
1. It would be directly applicable to business operators, thus stimulating market uptake, potentially even in those Member States that are currently not facing the issue of water scarcity, but where good "green" technologies are being produced.
2. It would come into force much faster than any potential future amendment to the Urban Wastewater Treatment Directive, thus facilitating a fast achievement of the main objective of addressing water scarcity. The resolution of the European Parliament can be downloaded, in any of the official languages of the EU, using this link T8-0071/2019.
The legislative resolution covers exclusively the use of reclaimed water for agriculture irrigation. After an extensive introduction, Chapter 3 presents a detailed glossary of terms applicable to water reuse and water reclamation.
Deliverable 1.1: Regional state of play analyses
Page 256 of 274
The most significant elements of the proposed regulation are:
1. The minimum requirements that reclaimed water have to comply with before it can be used for agricultural irrigation. They are referred to the content of E. coli, BOD5, suspended solids and turbidity. The limits applicable for those four parameters are included in Annex I of the proposed regulation.
2. The quality requirements for reclaimed water of Class A, as the one specifically allowed for unrestricted irrigation of food crops eaten raw, are E. coli ≤10 cfu/100 mL, BOD5
≤10 mg/L, suspended solids ≤10 mg/L, and turbidity ≤5 NTU. 3. The risk management plan that the reclamation facility operator shall elaborate and
carry out in cooperation with relevant parties, like the end-user of the reclaimed water and the urban wastewater treatment plant supplying water to the reclamation facility. This plan should identify additional requirements that further mitigate risks and would be part of the permit issued by the competent authority.
4. The obligations for relevant actors in the permitting procedure, with a definition of the conditions to be included in the permit and the requirement to review the permit at least every 5 years.
5. The identification of the four main actors in a water reuse project: 1) the wastewater treatment operator, 2) the reclamation facility operator, 3) the reclaimed water distribution operator and 4) the reclaimed water storage operator.
6. The requirement of a validation process for facilities producing reclaimed water of Class A, before the reclamation facility goes into operation when equipment is upgraded, when new equipment or processes are added, and at any time when a new permit is granted, or an existing permit is modified.
7. The indicator microorganisms selected for validation are E. coli for pathogenic bacteria, F-specific coliphages, somatic coliphages or coliphages for pathogenic viruses, and Clostridium perfringens spores or spore-forming sulphate-reducing bacteria for protozoa. Performance targets (log10 reduction) for the validation monitoring of the selected indicator microorganisms are set out in Annex I.
8. The reference pathogens Campylobacter, Rotavirus and Cryptosporidium can also be used for validation monitoring purposes instead of the proposed indicator microorganisms. The following log10 reduction performance targets should then apply Campylobacter (≥ 5.0), Rotavirus (≥ 6.0) and Cryptosporidium (≥ 5.0).
Several technical aspects of the proposed regulations will need further review and clarification, among them:
1. The compliance criteria established in Article 8, point 3 is inconsistent with that established in Table 2, Section 1, of Annex I. According to Article 8.3, when the individual value of any parameter exceeds the minimum water quality requirement, the operator of the reclamation facility should suspend the supply of reclaimed water. By contrast, Table 2 of Section 1, of Annex I indicates that reclaimed water will be considered in compliance when the limits for E. coli, Legionella spp and intestinal nematodes are met in 90 % or more of the samples and none of the values exceeds a maximum deviation limit of 1 log unit from the indicated value for E. coli and Legionella and 100 % of the indicated value for intestinal nematodes.
2. There is a critical need for a clear indication of the number of analytical samples used for determining compliance of the reclamation process to the applicable water quality criteria. Although the proposed regulation establishes the minimum monitoring frequencies, the lack of an explicit indication of the period over which to apply the compliance criteria prevents the unambiguous determination of the samples to be considered. International regulations normally use a criterion like “the last (given number) of consecutive samples collected” or the “samples consecutively collected over
Deliverable 1.1: Regional state of play analyses
Page 257 of 274
a given period of time”. This last requirement, together with the monitoring frequency applicable, allows the identification of the samples to be used for verifying compliance.
3. This critical aspect of the proposed regulation is equally applicable to the validation compliance section. The proposed regulation should establish the total number of consecutive samples or the days of an operation whose values should be used to determine validation compliance. That specification is particularly critical since the validation process will take place before the reclamation facility goes into operation when the equipment is upgraded, when new equipment or processes are added, and at any time when a new permit is granted, or an existing permit is modified.
4. The absolute need to adhere to the International System (IS) of units and abandoning others that don’t belong to it, like “…from 1.7 billion m³ to 6.6 billion m³ per year…”. That common monetary English unit (the short billion) introduces considerable confusion because it means 1.000 million when its direct translation into other languages (long billion) takes the meaning of one million. Article 13 2a of the proposed regulation includes a promising provision that allows the Commission to assess the feasibility of extending the scope of this regulation to other possible uses like industrial, indirect use of “reclaimed water” and aquifer recharge. Annex I, section 1 indicates to the Member States that they may use reclaimed water for further uses, such as industrial water reuse and amenity-related and environmental purposes. Current water reclamation facilities producing reclaimed water in compliance with the Spanish regulations for unrestricted irrigation of agricultural food crops eaten raw will have to be remodelled as to improve their removal performance: from ≤ 100 E. coli cfu/100 mL to ≤ 10 E. coli cfu/100 mL, from ≤ 20 mg SS/L to ≤ 10 mg SS/L and from ≤ 10 UNT to ≤ 5 NTU. In addition, water reclamation facilities will have to comply with a validation process, in terms of either the proposed indicator microorganisms or the pathogenic microorganisms considered by the proposed regulation of the EU Parliament.
Agricultural irrigation and landscape irrigation (golf course and urban and private gardens) are frequently conducted using the same water reclamation facility, as well as water distribution and storage facilities. The quality requirements established by the proposed regulation for Class A reclaimed water (≤ 10 E. coli, cfu/100 mL) will not satisfy the microbial requirement established in the Spanish regulations for water reuse in urban and landscape irrigation uses (irrigation of private gardens, golf course and parks). Consequently, water reclamation facilities producing water for agricultural irrigation that satisfies the proposed regulation of the EU Parliament would not be suitable for providing reclaimed water that satisfies the Spanish regulations for urban and landscape irrigation.
On the contrary, water reclamation facilities producing water for urban and landscape irrigation that satisfies the applicable Spanish regulations will equally be able to provide reclaimed water for unrestricted agricultural irrigation that comply with the proposed regulation of the EU Parliament, assuming the most likely event that reclaimed water also complies with the BOD5 limit, and that the reclamation facility complies with the validation process established by the proposed regulation of the EU Parliament.
Once the EU proposed regulation is approved, its provisions will be directly incorporated into the Spanish legislation and will immediately supersede those sections of the RD 1620/2007 referring to irrigation of food crops to be eaten raw. The inception of that legislative adaptation process could be used to update the provisions of the RD 1620/2007, for all the reclaimed water

Deliverable 1.1: Regional state of play analyses
Page 258 of 274
uses included, in accordance to the considerable knowledge and experience gathered during the last decade on the operation and management of water reuse projects.
8.3.2 Standards
A complementary set of water quality standards for agricultural irrigation is included in the “Commission notice on a guidance document on addressing microbiological risks in fresh fruits and vegetables at primary production through good hygiene (2017/C 163/01)” that was published by the Official Journal of the European Union C 163/1, on 23 May 2017.
Section 7.3. of the Commission Notice focuses on the “Control of water for primary production and associated operations at the place of such production (harvest and post-harvest)”, with different sections devoted to:
1. The evaluation of the diversity of types of agricultural water and agricultural practices in EU production of (ready-to-eat) FFV.
2. Practical tools to assess the source and the intended use of agricultural water. 3. Practical ways to assess the risk assessment of agricultural water. 4. General recommendations for source, storage and distribution of water. 5. Good practice recommendations regarding irrigation methods. 6. Good practice recommendations regarding the water used during harvest and post-
harvest (associated operations). 7. Additional good practice for leafy greens, tomatoes and melons. 8. Good practice recommendations as regards analyses of water for agricultural use.
Private standards related with issues like food quality or food chain systems have also special mentions about water quality or water resources. These types of standards reached special attention due to their role as quality assurance. Whether a food product do not have any of these certifications it can be considered as not quality enough for its exportation. For that reason, some of the most important standards have been resume in the following table:
Table 4 - International food certifications
Certification Purpose Water requirement
BRC – Global Standard for Food Safety
Improve food safety. To facilitate compliance with legislation on foodstuffs. To establish the quality and food safety criteria required of suppliers of foodstuffs to distribution chains in the UK. Standardised third-party audits. To ensure transparency and rigour in certification systems.
Includes the possibility of irrigating with reclaimed water, always the distribution systems are appropriated (pg. 50)
HACCP – Hazard analysis and critical control points
Identification of the key principles of food hygiene applicable across the food chain Increase the level of food safety
Reclaim water use is allowed if there is no hazard for the inequity and integrity of food (pg. 15)
Global GAP It gives assurance to consumers with respect to food safety and environmental and work-related standards. In order to do this, an operational standard has been devised that covers the entire production process of the certified product, from the start (sowing or planting), covering all subsequent agricultural activities, to the time the product is withdrawn from use
Reclaimed water use is considered as a recommendation. AF 7.4 encourage reusing water when the quality is assured and if the local regulation allows it (pg. 21).

Deliverable 1.1: Regional state of play analyses
Page 259 of 274
ISO 2200 – Food safety management systems
Improve food safety. Promote cooperation between all the parties involved in the food chain, national governments and multi-national organisations. Ensure consumer protection and strengthen consumer confidence. Establish reference requirements as "key elements" for food safety management systems. Improve cost performance throughout the food supply chain.
No mention to reclaimed water resources
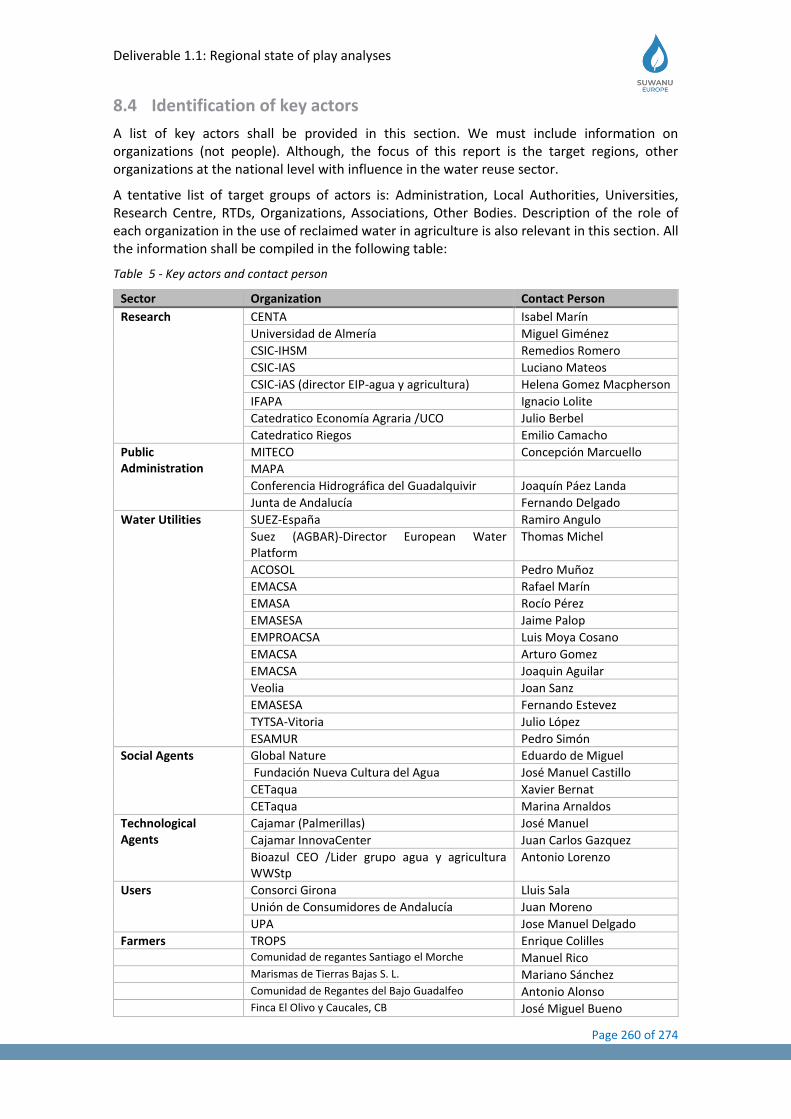
Deliverable 1.1: Regional state of play analyses
Page 260 of 274
8.4 Identification of key actors
A list of key actors shall be provided in this section. We must include information on organizations (not people). Although, the focus of this report is the target regions, other organizations at the national level with influence in the water reuse sector.
A tentative list of target groups of actors is: Administration, Local Authorities, Universities, Research Centre, RTDs, Organizations, Associations, Other Bodies. Description of the role of each organization in the use of reclaimed water in agriculture is also relevant in this section. All the information shall be compiled in the following table:
Table 5 - Key actors and contact person
Sector Organization Contact Person
Research CENTA Isabel Marín
Universidad de Almería Miguel Giménez
CSIC-IHSM Remedios Romero
CSIC-IAS Luciano Mateos
CSIC-iAS (director EIP-agua y agricultura) Helena Gomez Macpherson
IFAPA Ignacio Lolite
Catedratico Economía Agraria /UCO Julio Berbel
Catedratico Riegos Emilio Camacho
Public Administration
MITECO Concepción Marcuello
MAPA
Conferencia Hidrográfica del Guadalquivir Joaquín Páez Landa
Junta de Andalucía Fernando Delgado
Water Utilities SUEZ-España Ramiro Angulo
Suez (AGBAR)-Director European Water Platform
Thomas Michel
ACOSOL Pedro Muñoz
EMACSA Rafael Marín
EMASA Rocío Pérez
EMASESA Jaime Palop
EMPROACSA Luis Moya Cosano
EMACSA Arturo Gomez
EMACSA Joaquin Aguilar
Veolia Joan Sanz
EMASESA Fernando Estevez
TYTSA-Vitoria Julio López
ESAMUR Pedro Simón
Social Agents Global Nature Eduardo de Miguel
Fundación Nueva Cultura del Agua José Manuel Castillo
CETaqua Xavier Bernat
CETaqua Marina Arnaldos
Technological Agents
Cajamar (Palmerillas) José Manuel
Cajamar InnovaCenter Juan Carlos Gazquez
Bioazul CEO /Lider grupo agua y agricultura WWStp
Antonio Lorenzo
Users Consorci Girona Lluis Sala
Unión de Consumidores de Andalucía Juan Moreno
UPA Jose Manuel Delgado
Farmers TROPS Enrique Colilles Comunidad de regantes Santiago el Morche Manuel Rico
Marismas de Tierras Bajas S. L. Mariano Sánchez
Comunidad de Regantes del Bajo Guadalfeo Antonio Alonso Finca El Olivo y Caucales, CB José Miguel Bueno
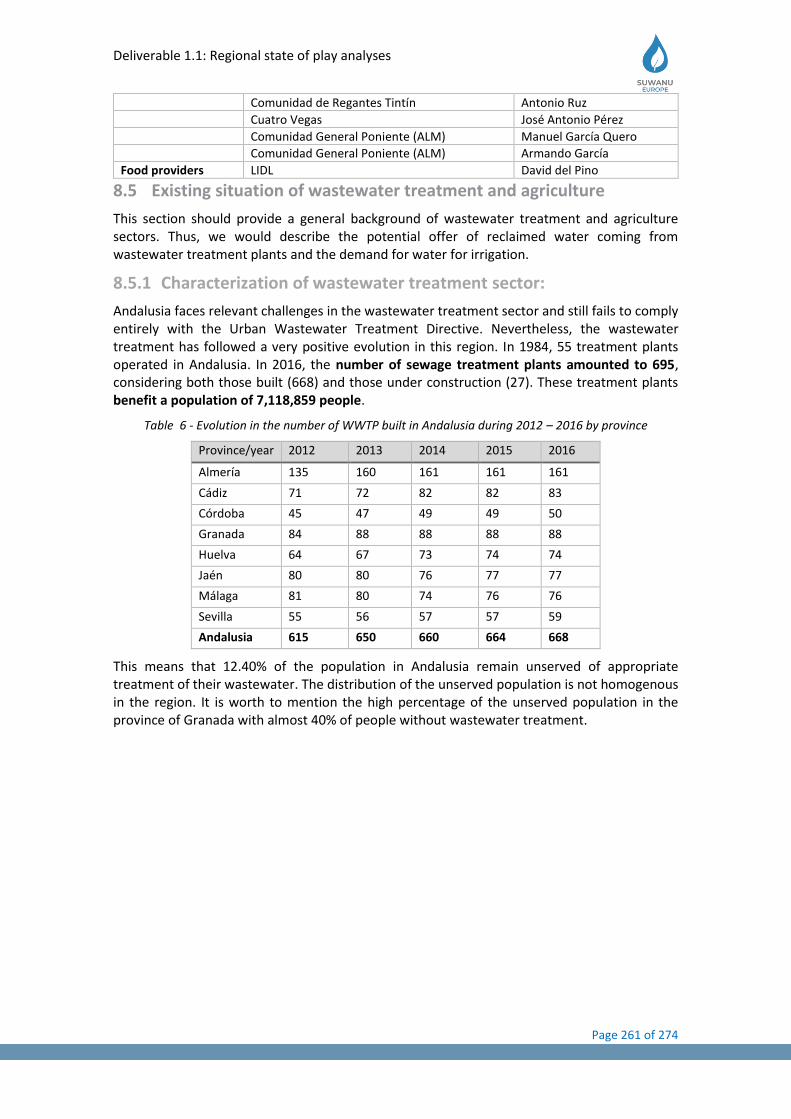
Deliverable 1.1: Regional state of play analyses
Page 261 of 274
Comunidad de Regantes Tintín Antonio Ruz
Cuatro Vegas José Antonio Pérez
Comunidad General Poniente (ALM) Manuel García Quero
Comunidad General Poniente (ALM) Armando García
Food providers LIDL David del Pino
8.5 Existing situation of wastewater treatment and agriculture
This section should provide a general background of wastewater treatment and agriculture sectors. Thus, we would describe the potential offer of reclaimed water coming from wastewater treatment plants and the demand for water for irrigation.
8.5.1 Characterization of wastewater treatment sector:
Andalusia faces relevant challenges in the wastewater treatment sector and still fails to comply entirely with the Urban Wastewater Treatment Directive. Nevertheless, the wastewater treatment has followed a very positive evolution in this region. In 1984, 55 treatment plants operated in Andalusia. In 2016, the number of sewage treatment plants amounted to 695, considering both those built (668) and those under construction (27). These treatment plants benefit a population of 7,118,859 people.
Table 6 - Evolution in the number of WWTP built in Andalusia during 2012 – 2016 by province
Province/year 2012 2013 2014 2015 2016
Almería 135 160 161 161 161
Cádiz 71 72 82 82 83
Córdoba 45 47 49 49 50
Granada 84 88 88 88 88
Huelva 64 67 73 74 74
Jaén 80 80 76 77 77
Málaga 81 80 74 76 76
Sevilla 55 56 57 57 59
Andalusia 615 650 660 664 668
This means that 12.40% of the population in Andalusia remain unserved of appropriate treatment of their wastewater. The distribution of the unserved population is not homogenous in the region. It is worth to mention the high percentage of the unserved population in the province of Granada with almost 40% of people without wastewater treatment.
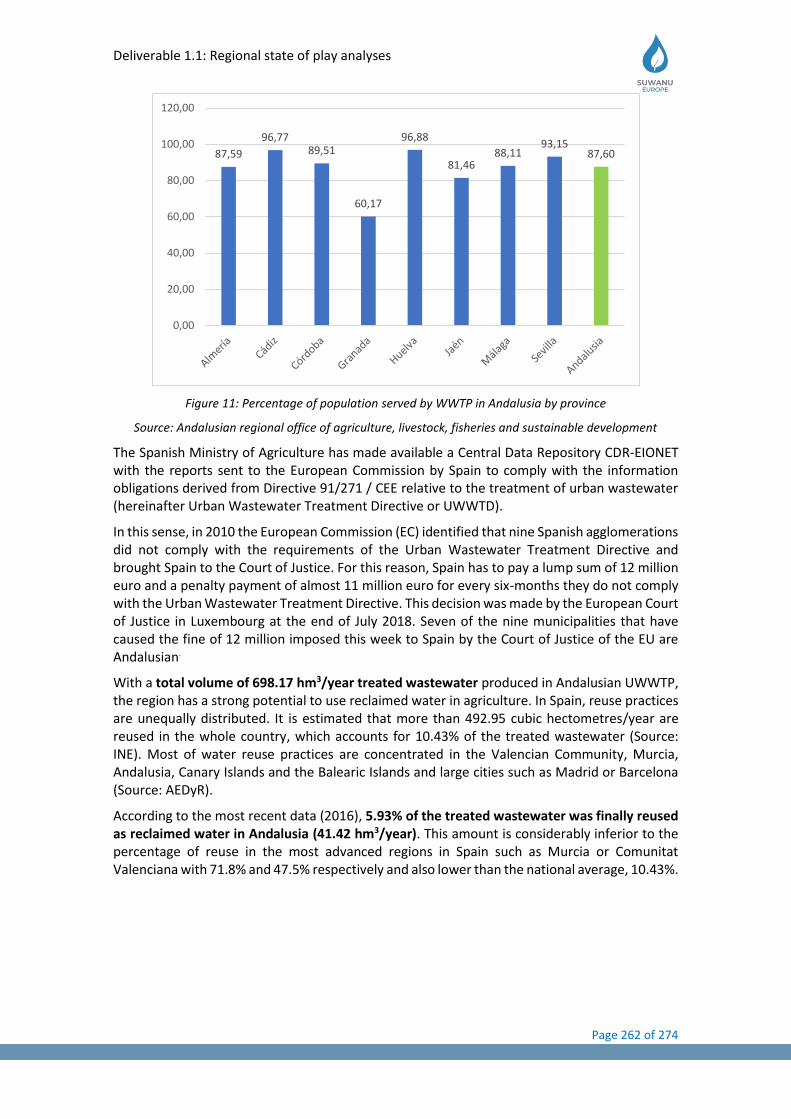
Deliverable 1.1: Regional state of play analyses
Page 262 of 274
Figure 11: Percentage of population served by WWTP in Andalusia by province
Source: Andalusian regional office of agriculture, livestock, fisheries and sustainable development
The Spanish Ministry of Agriculture has made available a Central Data Repository CDR-EIONET
with the reports sent to the European Commission by Spain to comply with the information obligations derived from Directive 91/271 / CEE relative to the treatment of urban wastewater (hereinafter Urban Wastewater Treatment Directive or UWWTD).
In this sense, in 2010 the European Commission (EC) identified that nine Spanish agglomerations did not comply with the requirements of the Urban Wastewater Treatment Directive and brought Spain to the Court of Justice. For this reason, Spain has to pay a lump sum of 12 million euro and a penalty payment of almost 11 million euro for every six-months they do not comply with the Urban Wastewater Treatment Directive. This decision was made by the European Court of Justice in Luxembourg at the end of July 2018. Seven of the nine municipalities that have caused the fine of 12 million imposed this week to Spain by the Court of Justice of the EU are Andalusian.
With a total volume of 698.17 hm3/year treated wastewater produced in Andalusian UWWTP, the region has a strong potential to use reclaimed water in agriculture. In Spain, reuse practices are unequally distributed. It is estimated that more than 492.95 cubic hectometres/year are reused in the whole country, which accounts for 10.43% of the treated wastewater (Source: INE). Most of water reuse practices are concentrated in the Valencian Community, Murcia, Andalusia, Canary Islands and the Balearic Islands and large cities such as Madrid or Barcelona (Source: AEDyR).
According to the most recent data (2016), 5.93% of the treated wastewater was finally reused as reclaimed water in Andalusia (41.42 hm3/year). This amount is considerably inferior to the percentage of reuse in the most advanced regions in Spain such as Murcia or Comunitat Valenciana with 71.8% and 47.5% respectively and also lower than the national average, 10.43%.
87,59
96,7789,51
60,17
96,88
81,4688,11
93,1587,60
0,00
20,00
40,00
60,00
80,00
100,00
120,00
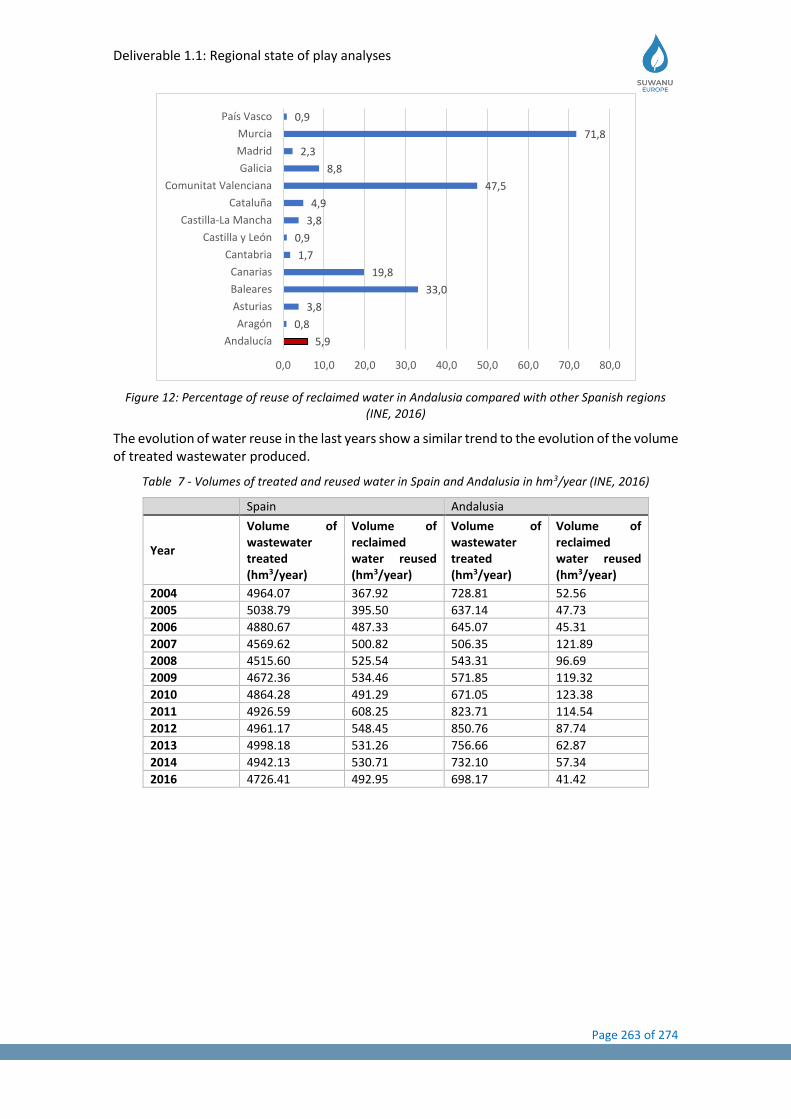
Deliverable 1.1: Regional state of play analyses
Page 263 of 274
Figure 12: Percentage of reuse of reclaimed water in Andalusia compared with other Spanish regions (INE, 2016)
The evolution of water reuse in the last years show a similar trend to the evolution of the volume of treated wastewater produced.
Table 7 - Volumes of treated and reused water in Spain and Andalusia in hm3/year (INE, 2016)
Spain Andalusia
Year
Volume of wastewater treated (hm3/year)
Volume of reclaimed water reused (hm3/year)
Volume of wastewater treated (hm3/year)
Volume of reclaimed water reused (hm3/year)
2004 4964.07 367.92 728.81 52.56
2005 5038.79 395.50 637.14 47.73
2006 4880.67 487.33 645.07 45.31
2007 4569.62 500.82 506.35 121.89
2008 4515.60 525.54 543.31 96.69
2009 4672.36 534.46 571.85 119.32
2010 4864.28 491.29 671.05 123.38
2011 4926.59 608.25 823.71 114.54
2012 4961.17 548.45 850.76 87.74
2013 4998.18 531.26 756.66 62.87
2014 4942.13 530.71 732.10 57.34
2016 4726.41 492.95 698.17 41.42
5,9
0,8
3,8
33,0
19,8
1,7
0,9
3,8
4,9
47,5
8,8
2,3
71,8
0,9
0,0 10,0 20,0 30,0 40,0 50,0 60,0 70,0 80,0
Andalucía
Aragón
Asturias
Baleares
Canarias
Cantabria
Castilla y León
Castilla-La Mancha
Cataluña
Comunitat Valenciana
Galicia
Madrid
Murcia
País Vasco
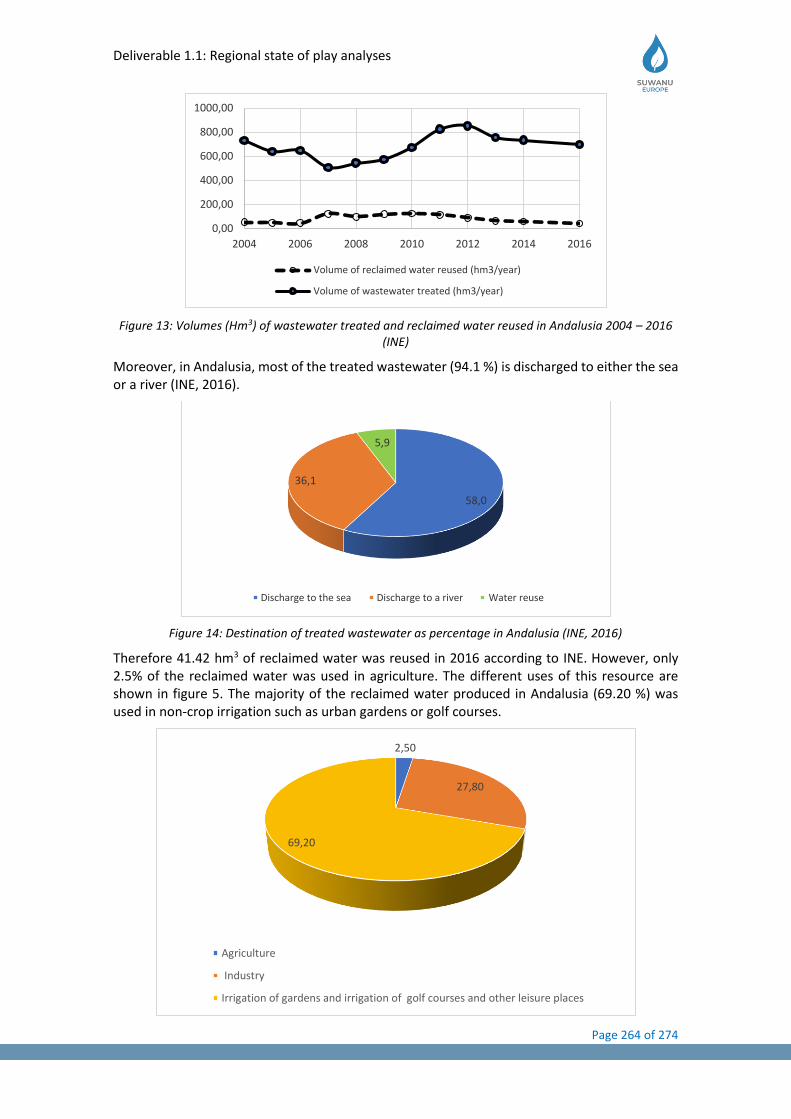
Deliverable 1.1: Regional state of play analyses
Page 264 of 274
Figure 13: Volumes (Hm3) of wastewater treated and reclaimed water reused in Andalusia 2004 – 2016 (INE)
Moreover, in Andalusia, most of the treated wastewater (94.1 %) is discharged to either the sea or a river (INE, 2016).
Figure 14: Destination of treated wastewater as percentage in Andalusia (INE, 2016)
Therefore 41.42 hm3 of reclaimed water was reused in 2016 according to INE. However, only 2.5% of the reclaimed water was used in agriculture. The different uses of this resource are shown in figure 5. The majority of the reclaimed water produced in Andalusia (69.20 %) was used in non-crop irrigation such as urban gardens or golf courses.
0,00
200,00
400,00
600,00
800,00
1000,00
2004 2006 2008 2010 2012 2014 2016
Volume of reclaimed water reused (hm3/year)
Volume of wastewater treated (hm3/year)
58,0
36,1
5,9
Discharge to the sea Discharge to a river Water reuse
2,50
27,80
69,20
Agriculture
Industry
Irrigation of gardens and irrigation of golf courses and other leisure places
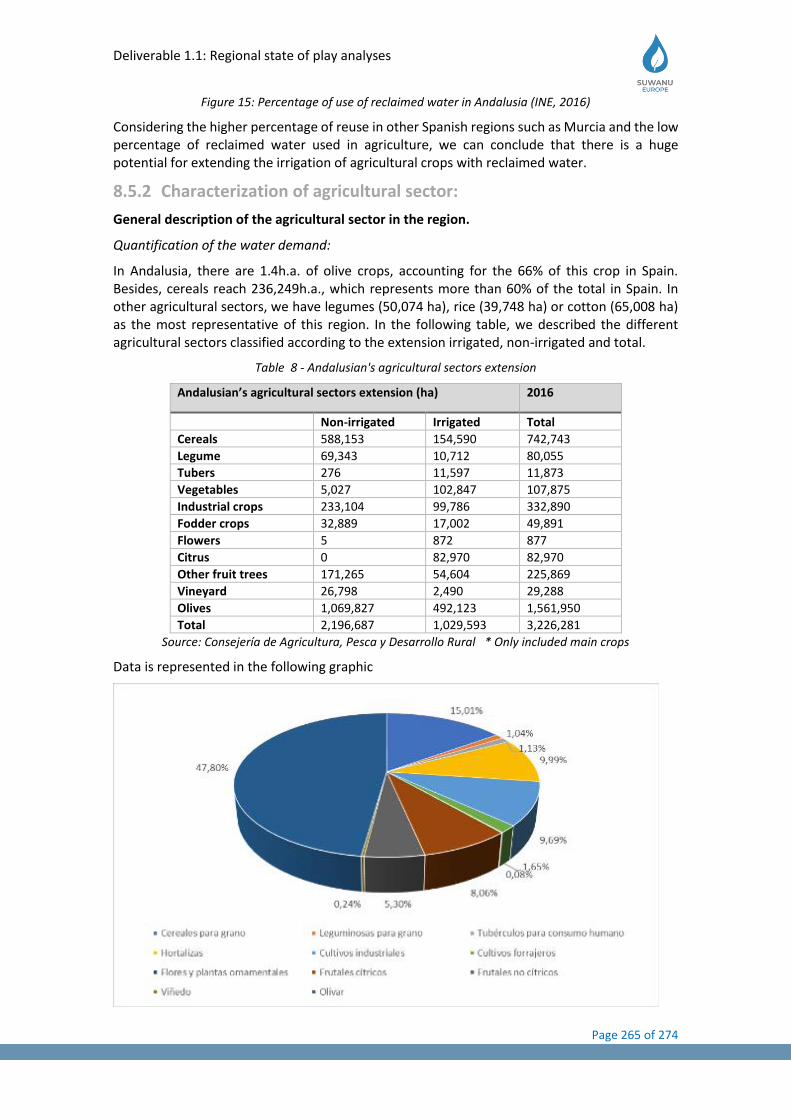
Deliverable 1.1: Regional state of play analyses
Page 265 of 274
Figure 15: Percentage of use of reclaimed water in Andalusia (INE, 2016)
Considering the higher percentage of reuse in other Spanish regions such as Murcia and the low percentage of reclaimed water used in agriculture, we can conclude that there is a huge potential for extending the irrigation of agricultural crops with reclaimed water.
8.5.2 Characterization of agricultural sector:
General description of the agricultural sector in the region.
Quantification of the water demand:
In Andalusia, there are 1.4h.a. of olive crops, accounting for the 66% of this crop in Spain. Besides, cereals reach 236,249h.a., which represents more than 60% of the total in Spain. In other agricultural sectors, we have legumes (50,074 ha), rice (39,748 ha) or cotton (65,008 ha) as the most representative of this region. In the following table, we described the different agricultural sectors classified according to the extension irrigated, non-irrigated and total.
Table 8 - Andalusian's agricultural sectors extension
Andalusian’s agricultural sectors extension (ha) 2016
Non-irrigated Irrigated Total
Cereals 588,153 154,590 742,743
Legume 69,343 10,712 80,055
Tubers 276 11,597 11,873
Vegetables 5,027 102,847 107,875
Industrial crops 233,104 99,786 332,890
Fodder crops 32,889 17,002 49,891
Flowers 5 872 877
Citrus 0 82,970 82,970
Other fruit trees 171,265 54,604 225,869
Vineyard 26,798 2,490 29,288
Olives 1,069,827 492,123 1,561,950
Total 2,196,687 1,029,593 3,226,281
Source: Consejería de Agricultura, Pesca y Desarrollo Rural * Only included main crops
Data is represented in the following graphic
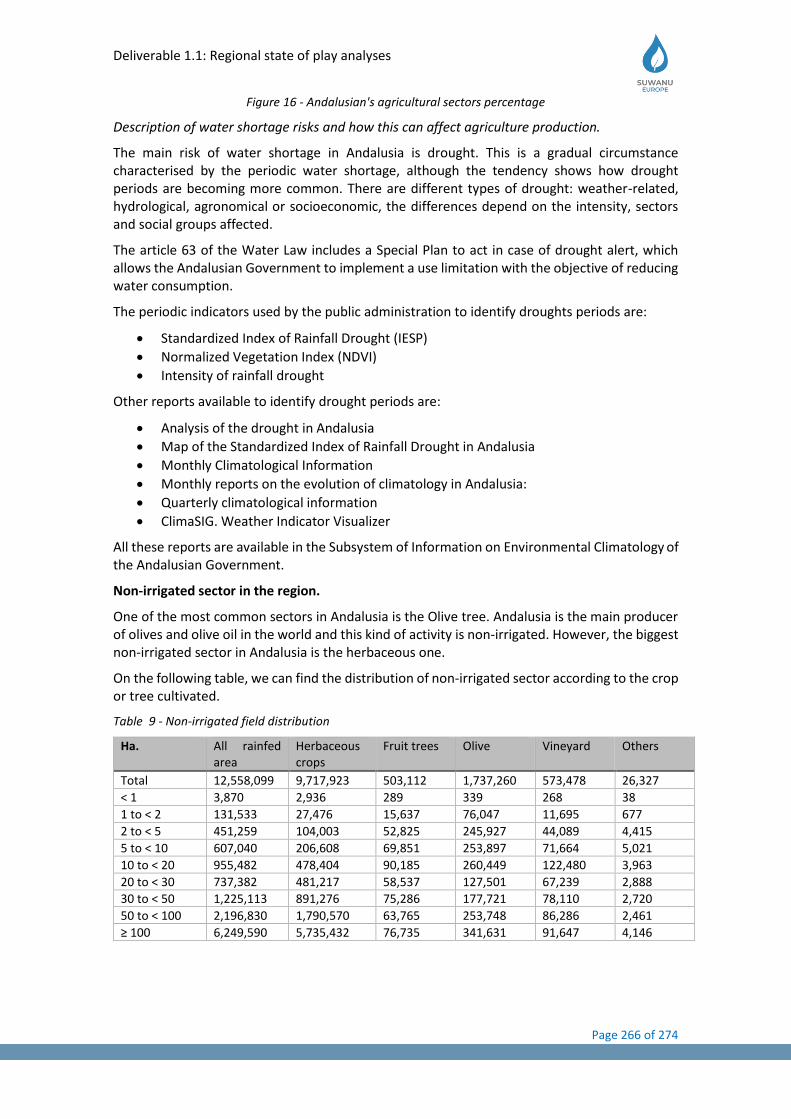
Deliverable 1.1: Regional state of play analyses
Page 266 of 274
Figure 16 - Andalusian's agricultural sectors percentage
Description of water shortage risks and how this can affect agriculture production.
The main risk of water shortage in Andalusia is drought. This is a gradual circumstance characterised by the periodic water shortage, although the tendency shows how drought periods are becoming more common. There are different types of drought: weather-related, hydrological, agronomical or socioeconomic, the differences depend on the intensity, sectors and social groups affected.
The article 63 of the Water Law includes a Special Plan to act in case of drought alert, which allows the Andalusian Government to implement a use limitation with the objective of reducing water consumption.
The periodic indicators used by the public administration to identify droughts periods are:
• Standardized Index of Rainfall Drought (IESP)
• Normalized Vegetation Index (NDVI)
• Intensity of rainfall drought
Other reports available to identify drought periods are:
• Analysis of the drought in Andalusia
• Map of the Standardized Index of Rainfall Drought in Andalusia
• Monthly Climatological Information
• Monthly reports on the evolution of climatology in Andalusia:
• Quarterly climatological information
• ClimaSIG. Weather Indicator Visualizer
All these reports are available in the Subsystem of Information on Environmental Climatology of the Andalusian Government.
Non-irrigated sector in the region.
One of the most common sectors in Andalusia is the Olive tree. Andalusia is the main producer of olives and olive oil in the world and this kind of activity is non-irrigated. However, the biggest non-irrigated sector in Andalusia is the herbaceous one.
On the following table, we can find the distribution of non-irrigated sector according to the crop or tree cultivated.
Table 9 - Non-irrigated field distribution
Ha. All rainfed area
Herbaceous crops
Fruit trees Olive Vineyard Others
Total 12,558,099 9,717,923 503,112 1,737,260 573,478 26,327
< 1 3,870 2,936 289 339 268 38
1 to < 2 131,533 27,476 15,637 76,047 11,695 677
2 to < 5 451,259 104,003 52,825 245,927 44,089 4,415
5 to < 10 607,040 206,608 69,851 253,897 71,664 5,021
10 to < 20 955,482 478,404 90,185 260,449 122,480 3,963
20 to < 30 737,382 481,217 58,537 127,501 67,239 2,888
30 to < 50 1,225,113 891,276 75,286 177,721 78,110 2,720
50 to < 100 2,196,830 1,790,570 63,765 253,748 86,286 2,461
≥ 100 6,249,590 5,735,432 76,735 341,631 91,647 4,146
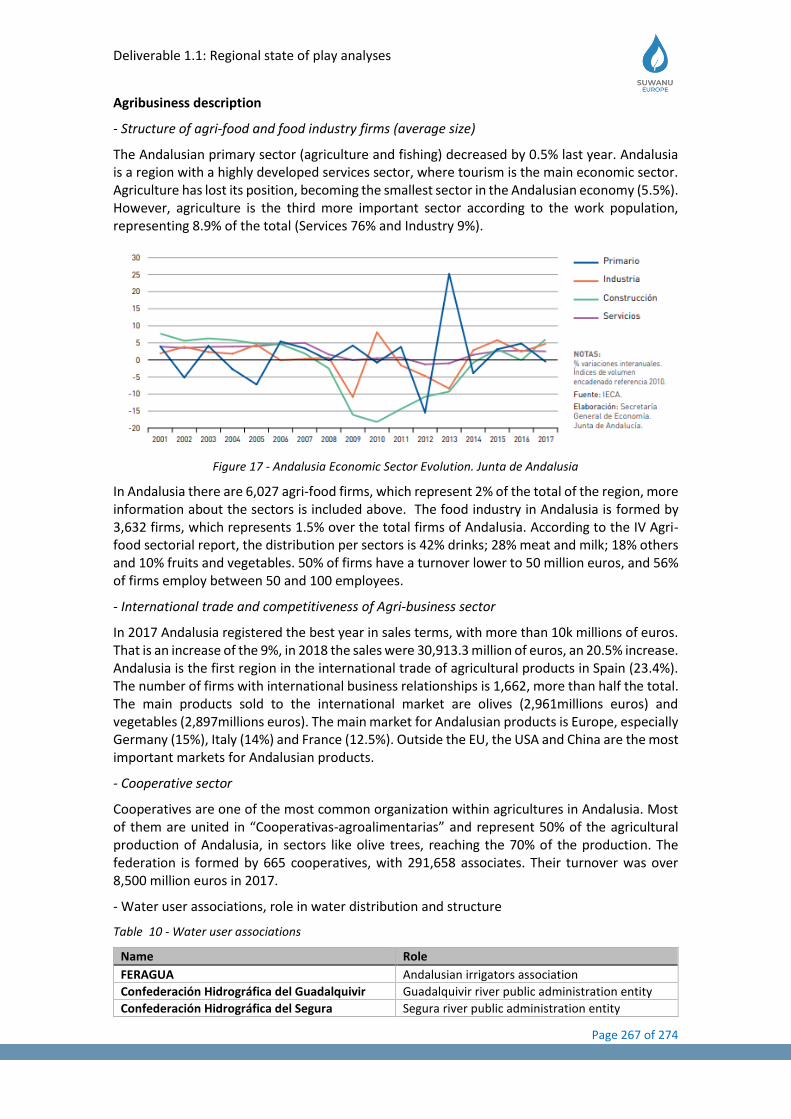
Deliverable 1.1: Regional state of play analyses
Page 267 of 274
Agribusiness description
- Structure of agri-food and food industry firms (average size)
The Andalusian primary sector (agriculture and fishing) decreased by 0.5% last year. Andalusia is a region with a highly developed services sector, where tourism is the main economic sector. Agriculture has lost its position, becoming the smallest sector in the Andalusian economy (5.5%). However, agriculture is the third more important sector according to the work population, representing 8.9% of the total (Services 76% and Industry 9%).
Figure 17 - Andalusia Economic Sector Evolution. Junta de Andalusia
In Andalusia there are 6,027 agri-food firms, which represent 2% of the total of the region, more information about the sectors is included above. The food industry in Andalusia is formed by 3,632 firms, which represents 1.5% over the total firms of Andalusia. According to the IV Agri-food sectorial report, the distribution per sectors is 42% drinks; 28% meat and milk; 18% others and 10% fruits and vegetables. 50% of firms have a turnover lower to 50 million euros, and 56% of firms employ between 50 and 100 employees.
- International trade and competitiveness of Agri-business sector
In 2017 Andalusia registered the best year in sales terms, with more than 10k millions of euros. That is an increase of the 9%, in 2018 the sales were 30,913.3 million of euros, an 20.5% increase. Andalusia is the first region in the international trade of agricultural products in Spain (23.4%). The number of firms with international business relationships is 1,662, more than half the total. The main products sold to the international market are olives (2,961millions euros) and vegetables (2,897millions euros). The main market for Andalusian products is Europe, especially Germany (15%), Italy (14%) and France (12.5%). Outside the EU, the USA and China are the most important markets for Andalusian products.
- Cooperative sector
Cooperatives are one of the most common organization within agricultures in Andalusia. Most of them are united in “Cooperativas-agroalimentarias” and represent 50% of the agricultural production of Andalusia, in sectors like olive trees, reaching the 70% of the production. The federation is formed by 665 cooperatives, with 291,658 associates. Their turnover was over 8,500 million euros in 2017.
- Water user associations, role in water distribution and structure
Table 10 - Water user associations
Name Role
FERAGUA Andalusian irrigators association
Confederación Hidrográfica del Guadalquivir Guadalquivir river public administration entity
Confederación Hidrográfica del Segura Segura river public administration entity
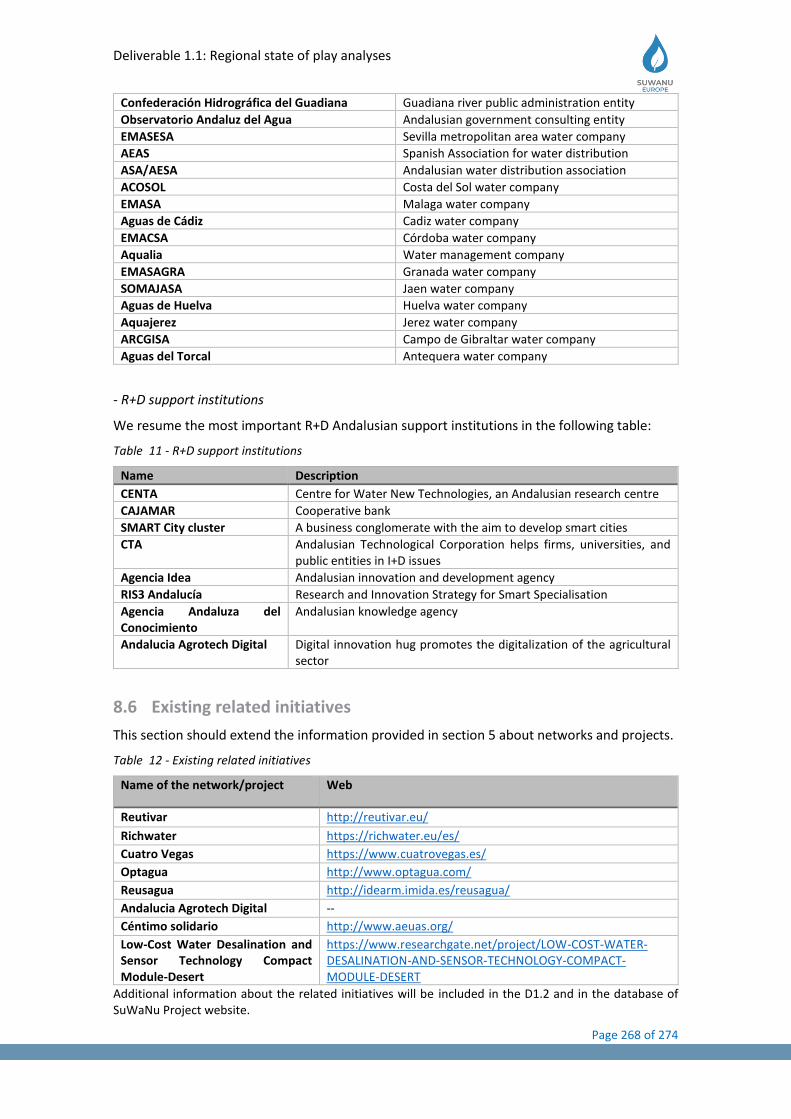
Deliverable 1.1: Regional state of play analyses
Page 268 of 274
Confederación Hidrográfica del Guadiana Guadiana river public administration entity
Observatorio Andaluz del Agua Andalusian government consulting entity
EMASESA Sevilla metropolitan area water company
AEAS Spanish Association for water distribution
ASA/AESA Andalusian water distribution association
ACOSOL Costa del Sol water company
EMASA Malaga water company
Aguas de Cádiz Cadiz water company
EMACSA Córdoba water company
Aqualia Water management company
EMASAGRA Granada water company
SOMAJASA Jaen water company
Aguas de Huelva Huelva water company
Aquajerez Jerez water company
ARCGISA Campo de Gibraltar water company
Aguas del Torcal Antequera water company
- R+D support institutions
We resume the most important R+D Andalusian support institutions in the following table:
Table 11 - R+D support institutions
Name Description
CENTA Centre for Water New Technologies, an Andalusian research centre
CAJAMAR Cooperative bank
SMART City cluster A business conglomerate with the aim to develop smart cities
CTA Andalusian Technological Corporation helps firms, universities, and public entities in I+D issues
Agencia Idea Andalusian innovation and development agency
RIS3 Andalucía Research and Innovation Strategy for Smart Specialisation
Agencia Andaluza del Conocimiento
Andalusian knowledge agency
Andalucia Agrotech Digital Digital innovation hug promotes the digitalization of the agricultural sector
8.6 Existing related initiatives
This section should extend the information provided in section 5 about networks and projects.
Table 12 - Existing related initiatives
Name of the network/project Web
Reutivar http://reutivar.eu/
Richwater https://richwater.eu/es/
Cuatro Vegas https://www.cuatrovegas.es/
Optagua http://www.optagua.com/
Reusagua http://idearm.imida.es/reusagua/
Andalucia Agrotech Digital --
Céntimo solidario http://www.aeuas.org/
Low-Cost Water Desalination and Sensor Technology Compact Module-Desert
https://www.researchgate.net/project/LOW-COST-WATER-DESALINATION-AND-SENSOR-TECHNOLOGY-COMPACT-MODULE-DESERT
Additional information about the related initiatives will be included in the D1.2 and in the database of SuWaNu Project website.
Deliverable 1.1: Regional state of play analyses
Page 269 of 274
8.7 Discussion and conclusion remarks
Andalusia is the second region of Spain in extension and the first in population. Its climatic conditions are characterized by rain irregularity in time and space, a pattern that is expected to be further intensified by climate change and probably resulting in higher temperatures and longer and persistent droughts. All these conditions are already affecting water availability in the region and will raise the need for a renovated search of additional water sources, among them reclaimed water.
Besides the hydrological risks raised by climate change, Andalusia’s economy is highly dependent on tourism, especially during the summer season. The summer water demands of large cities further increase the risk of water scarcity for the agricultural sector. Other regions in Spain with a similar situation are promoting the use of reclaimed water as a strategic resource for agricultural irrigation. For instance, Murcia and Comunitat Valenciana the use of reclaimed water accounts for 71.8% and 47.5% respectively. However, only 5.93% of the treated wastewater was finally reused as reclaimed water in Andalusia. This value is even lower than the national average. These figures show a strong potential to extend water reuse practices in the region. Andalusia is technologically prepared, has a suitable national regulation and enough practical experience to support and operate the water reclamation processes necessary to ensure safe and successful water reuse for agricultural irrigation.
Moreover, the review presented in this document shows that Andalusian water availability is highly dependent on surface water and groundwater which are becoming increasingly scarce, conditions that greatly favour the need for using reclaimed water.
New initiatives and research projects are proposed in Andalusia to promote the use of reclaimed water for agricultural irrigation. EU funded projects like SuWaNu, RichWater or Reutivar are focusing on the use of reclaimed water for irrigation for different food crops. The large surface area of non-irrigated land in Andalucía (twice as much as that of irrigated land) raises the need of developing additional water supplies, both to ensure adequate and sustainable water supplies to existing irrigated areas as well as to offer additional water supplies for a potential transformation of some non-irrigated land into irrigation land.
The Andalusian agricultural sector, with its typical climatic conditions and water availability patterns offer ideal conditions for the promotion of agricultural irrigation of food crops using reclaimed water. This is especially critical at a time when the EU is promoting the development of minimum quality requirements for water reuse in agricultural irrigation. An Andalusian strategy for promoting the use of reclaimed water for agricultural irrigation is highly needed.
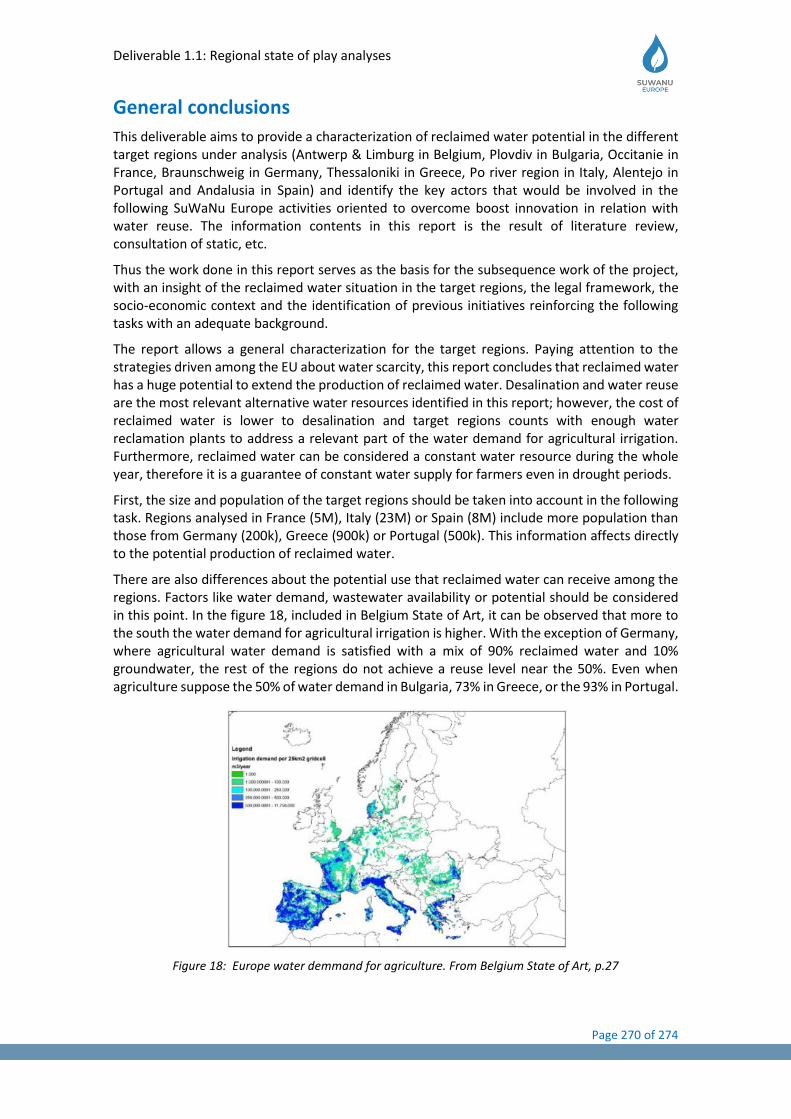
Deliverable 1.1: Regional state of play analyses
Page 270 of 274
General conclusions
This deliverable aims to provide a characterization of reclaimed water potential in the different target regions under analysis (Antwerp & Limburg in Belgium, Plovdiv in Bulgaria, Occitanie in France, Braunschweig in Germany, Thessaloniki in Greece, Po river region in Italy, Alentejo in Portugal and Andalusia in Spain) and identify the key actors that would be involved in the following SuWaNu Europe activities oriented to overcome boost innovation in relation with water reuse. The information contents in this report is the result of literature review, consultation of static, etc.
Thus the work done in this report serves as the basis for the subsequence work of the project, with an insight of the reclaimed water situation in the target regions, the legal framework, the socio-economic context and the identification of previous initiatives reinforcing the following tasks with an adequate background.
The report allows a general characterization for the target regions. Paying attention to the strategies driven among the EU about water scarcity, this report concludes that reclaimed water has a huge potential to extend the production of reclaimed water. Desalination and water reuse are the most relevant alternative water resources identified in this report; however, the cost of reclaimed water is lower to desalination and target regions counts with enough water reclamation plants to address a relevant part of the water demand for agricultural irrigation. Furthermore, reclaimed water can be considered a constant water resource during the whole year, therefore it is a guarantee of constant water supply for farmers even in drought periods.
First, the size and population of the target regions should be taken into account in the following task. Regions analysed in France (5M), Italy (23M) or Spain (8M) include more population than those from Germany (200k), Greece (900k) or Portugal (500k). This information affects directly to the potential production of reclaimed water.
There are also differences about the potential use that reclaimed water can receive among the regions. Factors like water demand, wastewater availability or potential should be considered in this point. In the figure 18, included in Belgium State of Art, it can be observed that more to the south the water demand for agricultural irrigation is higher. With the exception of Germany, where agricultural water demand is satisfied with a mix of 90% reclaimed water and 10% groundwater, the rest of the regions do not achieve a reuse level near the 50%. Even when agriculture suppose the 50% of water demand in Bulgaria, 73% in Greece, or the 93% in Portugal.
Figure 18: Europe water demmand for agriculture. From Belgium State of Art, p.27
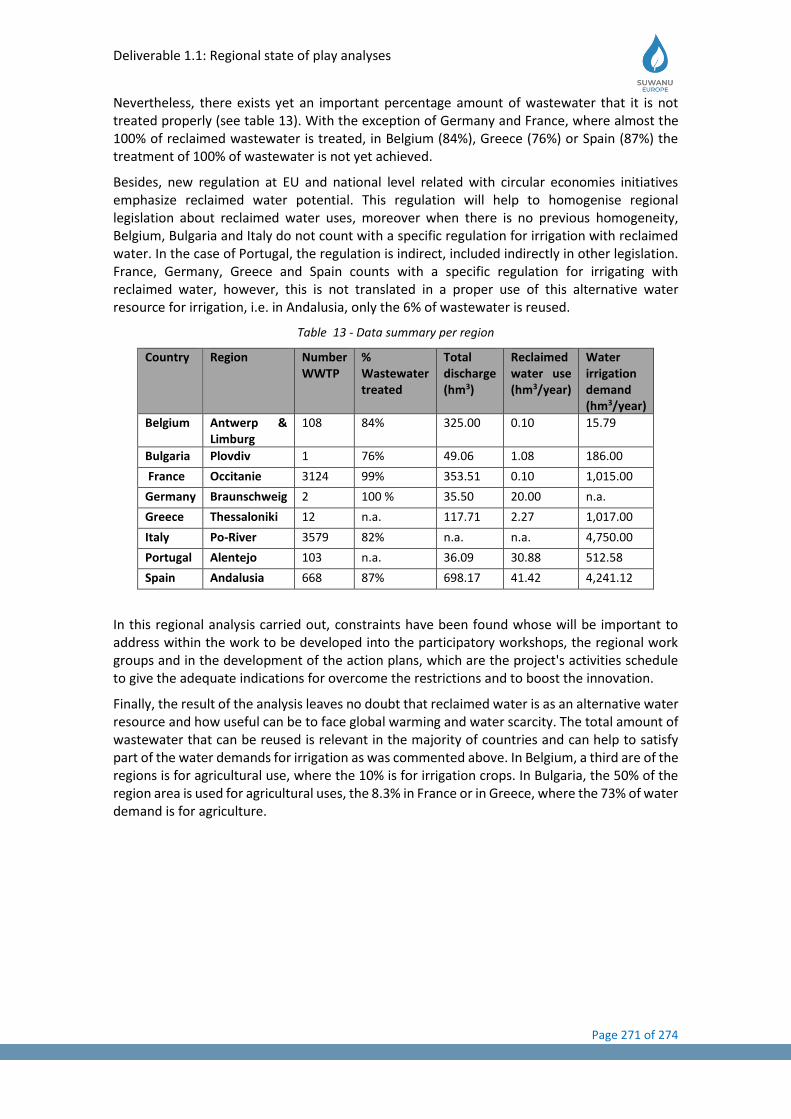
Deliverable 1.1: Regional state of play analyses
Page 271 of 274
Nevertheless, there exists yet an important percentage amount of wastewater that it is not treated properly (see table 13). With the exception of Germany and France, where almost the 100% of reclaimed wastewater is treated, in Belgium (84%), Greece (76%) or Spain (87%) the treatment of 100% of wastewater is not yet achieved.
Besides, new regulation at EU and national level related with circular economies initiatives emphasize reclaimed water potential. This regulation will help to homogenise regional legislation about reclaimed water uses, moreover when there is no previous homogeneity, Belgium, Bulgaria and Italy do not count with a specific regulation for irrigation with reclaimed water. In the case of Portugal, the regulation is indirect, included indirectly in other legislation. France, Germany, Greece and Spain counts with a specific regulation for irrigating with reclaimed water, however, this is not translated in a proper use of this alternative water resource for irrigation, i.e. in Andalusia, only the 6% of wastewater is reused.
Table 13 - Data summary per region
Country Region Number WWTP
% Wastewater treated
Total discharge (hm3)
Reclaimed water use (hm3/year)
Water irrigation demand (hm3/year)
Belgium Antwerp & Limburg
108 84% 325.00 0.10 15.79
Bulgaria Plovdiv 1 76% 49.06 1.08 186.00
France Occitanie 3124 99% 353.51 0.10 1,015.00
Germany Braunschweig 2 100 % 35.50 20.00 n.a.
Greece Thessaloniki 12 n.a. 117.71 2.27 1,017.00
Italy Po-River 3579 82% n.a. n.a. 4,750.00
Portugal Alentejo 103 n.a. 36.09 30.88 512.58
Spain Andalusia 668 87% 698.17 41.42 4,241.12
In this regional analysis carried out, constraints have been found whose will be important to address within the work to be developed into the participatory workshops, the regional work groups and in the development of the action plans, which are the project's activities schedule to give the adequate indications for overcome the restrictions and to boost the innovation.
Finally, the result of the analysis leaves no doubt that reclaimed water is as an alternative water resource and how useful can be to face global warming and water scarcity. The total amount of wastewater that can be reused is relevant in the majority of countries and can help to satisfy part of the water demands for irrigation as was commented above. In Belgium, a third are of the regions is for agricultural use, where the 10% is for irrigation crops. In Bulgaria, the 50% of the region area is used for agricultural uses, the 8.3% in France or in Greece, where the 73% of water demand is for agriculture.
Deliverable 1.1: Regional state of play analyses
Page 272 of 274
References
Asociación Española de Reutilización Sostenible del Agua (ASERSA) (2011). Spanish Regulations for Water Reuse. Royal Decree 1620/2007 of 7 December.
Court of Justice of the European Union (2018). On account of its delay in implementing the Urban Waste Water Treatment Directive, Spain is ordered to pay a lump sum of €12 million and a penalty payment of almost €11 million per six-month period of delay. PRESS RELEASE No 120/18, visited at: https://curia.europa.eu/jcms/upload/docs/application/pdf/2018-07/cp180120en.pdf
EU Parliament (2018). Regulation Legislative proposal COM (2018/307)
European Environment Agency (2019). Eionet - Central Data Repository.
http://cdr.eionet.europa.eu/es/eu/uwwt/
Expansion (2019). Datos de Andalucía. Visited Friday, 28th June at: https://datosmacro.expansion.com/ccaa/andalucia
INE (2019). Disponibilidad y origen del agua por comunidad autónoma y period 2000-2016. Visited in: http://www.ine.es/jaxi/Datos.htm?path=/t26/p067/p03/serie/l0/&file=02001.px
INE: Estadística sobre el suministro y saneamiento del agua. Serie 2000-2016. Retrieved from: http://www.ine.es/dynt3/inebase/index.htm?type=pcaxis&path=/t26/p067/p01/serie&file=pcaxis&L=0
Junta de Andalucía (2018). Informe de medioambiente de Andalucía, IMA 2017. Visited Friday, 28th June at:
http://www.juntadeandalucia.es/medioambiente/portal_web/ima/2017/IMA_2017.pdf
Junta de Andalucía (2019): Indicadores de seguimiento de las sequías. Visited Friday, 28th June at: http://www.juntadeandalucia.es/medioambiente/site/portalweb/menuitem.7e1cf46ddf59bb227a9ebe205510e1ca/?vgnextoid=d53ebe380e931510VgnVCM2000000624e50aRCRD&vgnextchannel=76709f5c10bc6410VgnVCM2000000624e50aRCRD&lr=lang_es
Junta de Andalucía (2019): Población joven. Visited Friday, 28th June at: https://www.juntadeandalucia.es/andalucia/alsur/poblacion_joven.html
Junta de Andalucía (2019): Regiones climáticas de Andalucía. Visited Friday, 28th June at: http://www.juntadeandalucia.es/medioambiente/site/portalweb/menuitem.7e1cf46ddf59bb227a9ebe205510e1ca/?vgnextoid=3beae207c1935310VgnVCM2000000624e50aRCRD&vgnextchannel=871e4d0e54345310VgnVCM1000001325e50aRCRD
Junta de Andalucía (2019): Relación de indicadores ambientales de Andalucía. Visited Friday, 28th June at: http://www.juntadeandalucia.es/medioambiente/site/rediam/menuitem.04dc44281e5d53cf8ca78ca731525ea0/?vgnextoid=c6695471dced9610VgnVCM100000341de50aRCRD&vgnextchannel=64899dde67bbf310VgnVCM1000001325e50aRCRD&vgnextfmt=rediam&lr=lang_es
Junta de Andalucía (2019). Situación geográfica. Visited Friday, 28th June at: http://www.andalucia.org/es/conoce-andalucia/situacion-geografica/
L. Alcalde-Sanz, B. M. Gawlik, Minimum quality requirements for water reuse in agricultural irrigation and aquifer recharge - Towards a water reuse regulatory instrument at EU level,
Deliverable 1.1: Regional state of play analyses
Page 273 of 274
EUR-EN, Publications Office of the European Union, Luxembourg, 2017, ISBN 978-9[2]-79-77[1]76-7, doi 10.2760/887727, PUBSY No.109291
Martín Arroyo, J. (2019). Doce municipios andaluces, denunciados por la fiscalía por vertidos sin control. Published at elPaís: https://elpais.com/politica/2018/07/28/actualidad/1532736839_955299.html
Ministerio de la Presidencia (2007). Real Decreto 1620/2007, de 7 de diciembre, por el que se establece el régimen jurídico de la reutilización de las aguas depuradas. «BOE» núm. 294, de 8 de diciembre de 2007, páginas 50639 a 50661 (23 págs.). https://www.boe.es/eli/es/rd/2007/12/07/1620
Deliverable 1.1: Regional state of play analyses
Page 274 of 274
ANNEX I: EU Legislative procedure and terminology adopted in the European Regulation on water reuse for agricultural
irrigation
Page 1
Asociación Española de Reutilización Sostenible del Agua (ASERSA); NIF: G - 85.431.914 Avda. de la Zarzuela, 107; 28523 Rivas-Vaciamadrid. Teléfono: 618 326 444; Número de registro: 591 126. www.asersagua.es
EU Legislative procedure and terminology adopted in the European Regulation on water reuse for agricultural irrigation
Prepared by Dr. Rafael Mujeriego
President of ASERSA Partner of SuWaNu Europe Project
4 March 2019 Legal Procedure: 2018/0169(COD) Minimum requirements for water reuse https://oeil.secure.europarl.europa.eu/oeil/popups/ficheprocedure.do?reference=2018/0169(COD)&l=en Key Events: 28/05/2018 Legislative proposal published COM(2018)0337 29/01/2019 Committee report tabled for plenary, 1st reading/single reading A8-0044/2019 12/02/2019 Decision by Parliament, 1st reading/single reading T8-0071/2019 European Parliament legislative resolution of 12 February 2019 on the proposal for a regulation of the European Parliament and of the Council on minimum requirements for water reuse (COM(2018)0337 – C8-0220/2018 – 2018/0169(COD)) (Ordinary legislative procedure: first reading) The European Parliament
1. Adopts its position at first reading hereinafter set out; 2. Calls on the Commission to refer the matter to Parliament again if it replaces,
substantially amends or intends to substantially amend its proposal; 3. Instructs its President to forward its position to the Council, the Commission and the
national parliaments. Background, nature of the legal text, glossary and significant dates for application extracted from the latest official Parliament session,
including its amendments: The general objective is to contribute to alleviating water scarcity across the EU, in the context of adaptation to climate change, notably by increasing the uptake of water reuse, in particular for agricultural irrigation wherever this is relevant and cost-effective while

Page 2
Asociación Española de Reutilización Sostenible del Agua (ASERSA); NIF: G - 85.431.914 Avda. de la Zarzuela, 107; 28523 Rivas-Vaciamadrid. Teléfono: 618 326 444; Número de registro: 591 126. www.asersagua.es
ensuring the maintenance of a high level of public health and environmental protection. Setting harmonised minimum requirements (notably key parameters on reference pathogens) on the quality of reclaimed water and monitoring together with harmonised risk management tasks would ensure a level playing field for those engaged in water reuse and those affected, prevent potential obstacles to the free movement of agricultural products irrigated with reclaimed water, ensure health and the environment are protected and thereby also increase confidence in the practice of water reuse. The impact assessment for this proposal has considered the full array of legal instruments, namely amending one of the existing Directives, a new Directive or Regulation, or Guidance. [Information Note: According to the Handbook on the Ordinary Legislative Procedure (http://www.epgenpro.europarl.europa.eu/static/ordinary-legislative-procedure/en/ordinary-legislative-procedure/handbook-on-the-ordinary-legislative-procedure.html), a “Regulation” is defined as a “Legislative act that has general application and is binding in its entirety. It is directly applicable in all Member States”.] The Regulation has been finally selected as the most appropriate legal instrument to achieve the objectives for the following reasons:
• It would be directly applicable to business operators (next to Member States), thus stimulating market uptake, potentially even in those Member States that are currently not facing the issue of water scarcity, but where good "green" technologies are being produced. This could have a positive impact on research and innovation, as well as the emergence of best technologies and new business opportunities in the internal market.
• A Regulation would come into force much faster than any potential future amendment to the Urban Waste Water Treatment Directive (for which the ongoing evaluation is scheduled to be completed in 2019; any subsequent legislative proposal for amendment would only be possible following an impact assessment process), thus delivering faster on the main objective of addressing water scarcity.
Transparency and access to information is a critical aspect for promoting trust among users and also the general public as regards the safety of reclaimed water. Thus emphasis has been made on providing information to the public instead of traditional reporting obligations. The monitoring requirements will primarily be imposed to the operators of the reclamation plants and the Member States shall ensure that the information is made available online to the public. The proposed Regulation includes additional monitoring requirements on the quality of reclaimed water. Member States shall verify compliance with the permit conditions based
Page 3
Asociación Española de Reutilización Sostenible del Agua (ASERSA); NIF: G - 85.431.914 Avda. de la Zarzuela, 107; 28523 Rivas-Vaciamadrid. Teléfono: 618 326 444; Número de registro: 591 126. www.asersagua.es
on monitoring data obtained pursuant to this proposed Regulation, the Water Framework Directive and the Urban Waste Water Treatment Directive and other relevant information. The Member States shall publish the outcome of the compliance check and ensure that the Commission has access to relevant data. The text proposed by the Comission (COM_COM(2018)0337_EN) appear in black. Parliament amendments (P8_TA-PROV(2019)0071) approved during the session of 12/02/2019 appear in red, with actual changes marked in bold red).
Article 3 Definitions
For the purposes of this Regulation, the following definitions apply:
1. 'competent authority' means an authority or body designated by a Member State to carry out obligations arising from this Regulation;
2. 'water authority' means an authority or authorities identified in accordance with Article 3(2) or (3) of Directive 2000/60/EC;
3. 'end-user' means a natural or legal person who uses reclaimed water;
'end-user' means a natural or legal person, a public or private entity, who uses reclaimed water for the use it is intended for;
4. 'urban waste water' means urban waste water as defined in Article 2(1) of Directive 91/271/EEC;
4a. 'treated waste water' means urban waste water that has been treated in compliance with the requirements set out in Directive 91/271/EEC;
5. 'reclaimed water' means urban waste water that has been treated in compliance with the requirements set out in Directive 91/271/EEC and which results from further treatment in a reclamation plant;
5. ‘reclaimed water’ means treated waste water which results from further treatment in a reclamation facility that makes its quality suitable for the use it is intended for;
5a. ‘water reuse’ means use of reclaimed water of a specific quality suitable for a use specified in Section 1 of Annex I, through a distribution system, thereby partially or wholly replacing the use of surface waters or groundwater;
6. 'reclamation plant' means an urban waste water treatment plant or other plant that further treats urban waste water complying with the requirements set out in Directive
Page 4
Asociación Española de Reutilización Sostenible del Agua (ASERSA); NIF: G - 85.431.914 Avda. de la Zarzuela, 107; 28523 Rivas-Vaciamadrid. Teléfono: 618 326 444; Número de registro: 591 126. www.asersagua.es
91/271/EEC in order to produce water that is fit for a use specified in section 1 of Annex I to this Regulation;
6. 'reclamation facility' means a part of an urban waste water treatment plant or other facility that further treats urban waste water previously treated in accordance with the requirements set out in Directive 91/271/EEC in order to produce reclaimed water that is fit for a use specified in section 1 of Annex I to this Regulation and includes any storage infrastructure and any infrastructure designed to deliver the reclaimed water to the reclaimed water distribution infrastructure, or to the end-user;
7. 'reclamation plant operator' means a natural or legal person who operates or controls a reclamation plant;
7. 'reclamation facility operator' means a natural or legal person who operates or controls a reclamation facility;
7a. ‘reclaimed water distribution infrastructure’ means a system of dedicated pipelines and pumps, or other dedicated transporting facilities, designed to deliver the reclaimed water to the end-user, including any facilities for equalisation, further treatment and storage, outside the reclamation facility;
7b. ‘reclaimed water distribution operator’ means a natural or legal person which operates or controls the reclaimed water distribution infrastructure;
7c. ‘reclaimed water storage infrastructure’ means a system of dedicated storage facilities designed to store the reclaimed water;
7d. ‘reclaimed water storage operator’ means a natural or legal person that operates or controls reclaimed water storage infrastructure;
8. 'hazard' means a biological, chemical, physical or radiological agent that has the potential to cause harm to people, animals, crops or plants, other terrestrial biota, aquatic biota, soils or the general environment;
9. 'risk' means the likelihood of identified hazards causing harm in a specified timeframe, including the severity of the consequences;
10. 'risk management' is a systematic management that consistently ensures the safety of water reuse in a specific context;
11. 'preventive measure' means any action or activity that can be used to prevent or eliminate a health and environmental risk, or reduce it to an acceptable level.
11. ‘preventive measure’ means appropriate action or activity that can be used to prevent or eliminate a health and environmental risk, or reduce it to an acceptable level;
Page 5
Asociación Española de Reutilización Sostenible del Agua (ASERSA); NIF: G - 85.431.914 Avda. de la Zarzuela, 107; 28523 Rivas-Vaciamadrid. Teléfono: 618 326 444; Número de registro: 591 126. www.asersagua.es
11a. ‘point of compliance’ means the point where a reclamation facility operator delivers the reclaimed water to the next actor in the chain;
11b. ‘micropollutant’ means an undesirable substance detectable in the environment at a very low concentration, as referred to in Annex VIII to Directive 2000/60/EC.
Article 11
Information on monitoring of implementation
1. Without prejudice to Directives 2003/4/EC and 2007/2/EC, each Member State, assisted by the European Environment Agency, shall:
(a) set up and publish by … [three four years after the date of entry into force of this Regulation], and update every 6 years thereafter, a data set containing information on the outcome of the compliance check performed in accordance with Article 10;
Article 13 Evaluation
The Commission shall, by … [6 five years after the date of entry into force of this Regulation], carry out an evaluation of this Regulation. The evaluation shall be based at least on the following elements:
Article 16 Penalties
Member States shall lay down the rules on penalties applicable to infringements of this Regulation and shall take all measures necessary to ensure that they are implemented. The penalties provided for shall be effective, proportionate and dissuasive. Member States shall, by … [three four years after the date of entry into force of this Regulation], notify the Commission of those rules and of those measures and shall notify it of any subsequent amendment affecting them.
Article 17 Entry into force and application
This Regulation shall enter into force on the twentieth day following that of its publication in the Official Journal of the European Union. It shall apply from ... [one year two years after the date of entry into force of this Regulation]. This Regulation shall be binding in its entirety and directly applicable in all Member States. [The above information can be accessed in the different official languages of the EU]