WP1 – Deliverable D1.4. - Circular economy best pratices in ...
Upload
khangminh22Category
view
0download
0
Action D3
IMPROVE LIFE13 ENV/ES/000263
Coordinated by
LIFE13 ENV/ES/000263
DELIVERABLE 18 Proceedings of an International Conference


SCHEDULE
3 to 6 July, BarcelonaResidence of researchers CSIC:c/Hospital, 64,08001 Barcelona, España
14.3015.00 - 15.1015.10 - 15.30
15.30 - 15.50
15.50 - 16.10
16.10 - 16.40
16.40 - 17.00
17.00 - 17.20
17.20 - 17.40
17.40 - 18.1518.15
9.009.30 - 9.459.45 - 10.30
10.30 - 11.15
11.15 - 12.15
12.15 - 13.00
13.00 - 13.45
13.45 - 15.15
15.15 - 16.00
16.00 - 16.45
16.45 - 17.1520.00-22.00
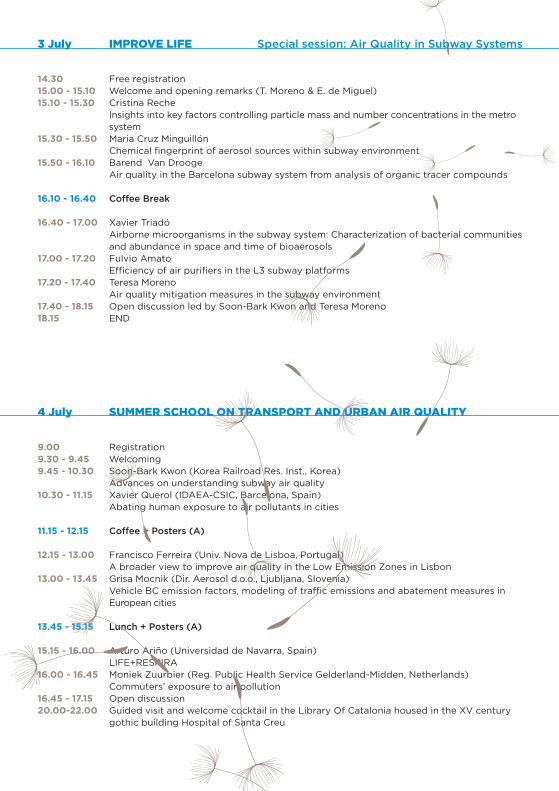
RegistrationWelcomingSoon-Bark Kwon (Korea Railroad Res. Inst., Korea)Advances on understanding subway air qualityXavier Querol (IDAEA-CSIC, Barcelona, Spain)Abating human exposure to air pollutants in cities
Co�ee + Posters (A)
Francisco Ferreira (Univ. Nova de Lisboa, Portugal)A broader view to improve air quality in the Low Emission Zones in LisbonGrisa Mocnik (Dir. Aerosol d.o.o., Ljubljana, Slovenia)Vehicle BC emission factors, modeling of tra�ic emissions and abatement measures inEuropean cities
Lunch + Posters (A)
Arturo Ariño (Universidad de Navarra, Spain)LIFE+RESPIRAMoniek Zuurbier (Reg. Public Health Service Gelderland-Midden, Netherlands)Commuters’ exposure to air pollutionOpen discussionGuided visit and welcome cocktail in the Library Of Catalonia housed in the XV centurygothic building Hospital of Santa Creu
4 July SUMMER SCHOOL ON TRANSPORT AND URBAN AIR QUALITY
3 July Special session: Air Quality in Subway SystemsIMPROVE LIFE
Free registrationWelcome and opening remarks (T. Moreno & E. de Miguel)Cristina RecheInsights into key factors controlling particle mass and number concentrations in the metrosystemMaria Cruz MinguillónChemical fingerprint of aerosol sources within subway environment Barend Van Drooge Air quality in the Barcelona subway system from analysis of organic tracer compounds
Co�ee Break
Xavier TriadóAirborne microorganisms in the subway system: Characterization of bacterial communities and abundance in space and time of bioaerosolsFulvio AmatoE�iciency of air purifiers in the L3 subway platforms Teresa Moreno Air quality mitigation measures in the subway environment Open discussion led by Soon-Bark Kwon and Teresa MorenoEND
1.
2.
3.
4.
5.
6.
7.
8.
9.
10.
11.
12.
13.
14.
15.
16.
17.
18.
19.
20.
21.
22.
23.
24.
25.
26.
27.
28.
29.
30.
31.
32.
33.
34.
4 July
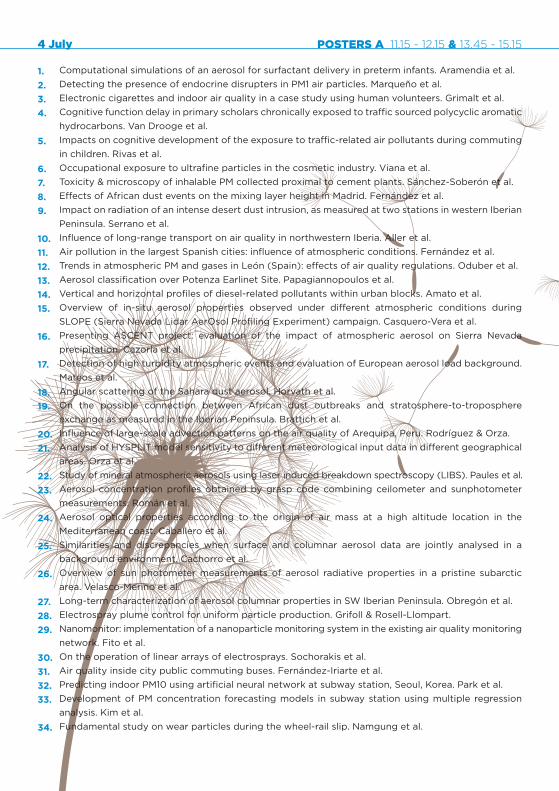
Computational simulations of an aerosol for surfactant delivery in preterm infants. Aramendia et al. Detecting the presence of endocrine disrupters in PM1 air particles. Marqueño et al. Electronic cigarettes and indoor air quality in a case study using human volunteers. Grimalt et al. Cognitive function delay in primary scholars chronically exposed to tra�ic sourced polycyclic aromatic hydrocarbons. Van Drooge et al. Impacts on cognitive development of the exposure to tra�ic-related air pollutants during commuting in children. Rivas et al. Occupational exposure to ultrafine particles in the cosmetic industry. Viana et al. Toxicity & microscopy of inhalable PM collected proximal to cement plants. Sánchez-Soberón et al. E�ects of African dust events on the mixing layer height in Madrid. Fernández et al. Impact on radiation of an intense desert dust intrusion, as measured at two stations in western Iberian Peninsula. Serrano et al. Influence of long-range transport on air quality in northwestern Iberia. Aller et al. Air pollution in the largest Spanish cities: influence of atmospheric conditions. Fernández et al. Trends in atmospheric PM and gases in León (Spain): e�ects of air quality regulations. Oduber et al.Aerosol classification over Potenza Earlinet Site. Papagiannopoulos et al. Vertical and horizontal profiles of diesel-related pollutants within urban blocks. Amato et al.Overview of in-situ aerosol properties observed under di�erent atmospheric conditions during SLOPE (Sierra Nevada Lidar AerOsol Profiling Experiment) campaign. Casquero-Vera et al. Presenting ASCENT project: evaluation of the impact of atmospheric aerosol on Sierra Nevada precipitation. Cazorla et al. Detection of high turbidity atmospheric events and evaluation of European aerosol load background. Mateos et al.Angular scattering of the Sahara dust aerosol. Horvath et al. On the possible connection between African dust outbreaks and stratosphere-to-troposphere exchange as measured in the Iberian Peninsula. Brattich et al. Influence of large-scale advection patterns on the air quality of Arequipa, Peru. Rodríguez & Orza.Analysis of HYSPLIT model sensitivity to di�erent meteorological input data in di�erent geographical areas. Orza et al.Study of mineral atmospheric aerosols using laser induced breakdown spectroscopy (LIBS). Paules et al.Aerosol concentration profiles obtained by grasp code combining ceilometer and sunphotometer measurements. Román et al. Aerosol optical properties according to the origin of air mass at a high altitude location in the Mediterranean coast. Caballero et al. Similarities and discrepancies when surface and columnar aerosol data are jointly analysed in a background environment. Cachorro et al. Overview of sun photometer measurements of aerosol radiative properties in a pristine subarctic area. Velasco-Merino et al. Long-term characterization of aerosol columnar properties in SW Iberian Peninsula. Obregón et al. Electrospray plume control for uniform particle production. Grifoll & Rosell-Llompart. Nanomonitor: implementation of a nanoparticle monitoring system in the existing air quality monitoring network. Fito et al. On the operation of linear arrays of electrosprays. Sochorakis et al. Air quality inside city public commuting buses. Fernández-Iriarte et al. Predicting indoor PM10 using artificial neural network at subway station, Seoul, Korea. Park et al.Development of PM concentration forecasting models in subway station using multiple regression analysis. Kim et al.Fundamental study on wear particles during the wheel-rail slip. Namgung et al.
POSTERS A 11.15 - 12.15 & 13.45 - 15.15
1.
2.
3.
4.
5.
6.
7.
8.
9.
10.
11.
12.
13.
14.
15.
16.
17.
18.
19.
20.
21.
22.
23.
24.
25.
26.
27.
28.
29.
30.
31.
32.
33.
34.
Olive pollen counts and aeroallergen levels in the atmosphere of Alicante. Martínez-Pérez et al. Airborne pollen in Alicante (2010-2015). Martínez-Pérez et al. Loss of airborne pollen integrity during transport: atmospheric conditions a�ecting cupressaceae pollen. Galveias et al.New methods in air quality monitoring: is total protein a feasible marker of bioaerosol load in ambient air? Arriegas et al. Airborne particulate polyromantic hydrocarbon pollution in Andalusia. Esquinas et al. Simultaneously measurements of black carbon in an urban and a suburban site of A Coruña (northwest of Spain). Gallego-Fernández et al. A one-year record of polycyclic aromatic hydrocarbons in atmospheric particulate matter from an urban background site in Lisbon, Portugal. Cerqueira & Matos. Control of PM emissions from combustion of Mediterranean residual biomass using a hybrid filter. Sanz et al. Particulate and gaseous emissions from prescribed fires in a protected natural area. Blanco-Alegre et al.Particulate-bond organic compounds from charcoal burning in barbecue grills. Vicente et al.Polycyclic aromatic hydrocarbons and their derivatives (nitro-PAHS, oxyPAHS, and azaarenes) in PM10 from São Paulo, Brazil. Vicente et al. Impact of wood combustion on indoor air quality. Vicente et al. Trace metal and PAH enrichment within the penetration window of an ESP. Ibarra et al. Hygroscopic properties of freshly formed particles during an intensive summertime field campaign in Madrid. Alonso-Blanco et al. Homogenization and mixing chamber of aerosol particles. Rojas-García et al. Di�use sunlight based calibration of the water vapour channel in the UPC RAMAN LIDAR. Muñoz-Porcar et al. Intercomparación de siete analizadores ELPI y ELPI+. Setién et al. Quality-assured measurements of particle depolarization ratio at Barcelona: channel design and calibration procedure and stability. Ben Chaed et al. The REDMAAS 2017 intercomparison campaign: CPC and SMPS results. Gómez-Moreno et al. TEEMS-total turbofan engine emissions measurement system. A research & innovation Spanish program. Archilla et al.Diseño de experimentos aplicado a la combustión de biomasa. Análisis de impactos ambientales de las emisiones. Gomar et al. Intercomparison of methods to estimate BC emissions from cookstoves. Viana et al.Passive monitoring of PM and gaseous pollutants in Fogo Island, Cape Verde. Alves et al. Inorganic ions and trace metals bulk deposition at an Atlantic coastal European region. López-Mahía et al.2001-2011 trends of PM2.5, PM10 and aerosol chemical compounds in Lisbon, Portugal. Faria et al. Major and trace metals in PM1 & PM10 samples collected at a tra�ic site in western Mediterranean. Nicolás et al.Identification and quantification of PM10 sources in a regional background station. Yubero et al.Diurnal and seasonal variation of water-soluble ions and PM10 concentrations at a tra�ic site in Elche (SE Spain). Galindo et al. Major components of PM10 and their relationships with sub-micron particles in a suburban area of northwest Spain. Fernández-Amado et al. Impact of abatement technology of a copper smelter on the air quality of Huelva (SW Spain). Sánchez-Rodas et al.Impact of mine activity on the air quality in the district mining of Riotinto (SW Huelva). Sánchez de la Campa et al. High resolution determination of gaseous HF at the city of Huelva (SW Spain) near a phosphogypsum pond. Torres-Sánchez et al.High-e�iciency simultaneous removal of trace HM & organic pollutants from an iron ore sintering plant. Gonzalez et al.Two years of atmospheric mercury concentrations (Hgg and Hgp) near a clinker plant using residues derived combustibles. Carratalá et al.
5 July POSTERS B 10.45 - 11.45 & 14.00 - 15.30
5 JulyAtmospheric Aerosols (transport and processes)Chaired by Cristina Gutiérrez Cañas & Mário CerqueiraMain features of an outstanding desert dust transport over Iberia. Costa et al. Contribution of natural dust in PM10 and PM2.5 concentrations over Portugal from 2013 to 2015. Monjardino et al.Upper-level disturbances and the impact of dust outbreaks in Spain. Orza et al.Long-term comparison of high-time resolution in-situ and ceilometer measurements at Montsec. Titos et al. A European aerosol phenomenology-6: scattering characteristics of atmospheric aerosol particles from 28 ACTRIS sites. Pandolfi et al.Synoptic scale transport analysis based on a combined technique of trajectories clustering and expert criteria. Escudero et al.
Co�ee + Posters (B)
Aerosols in industry (applications and exposure)Chaired by Ana Isabel Calvo & Jose Antonio OrzaDevelopment of processes to reduce crystalline silica toxicity. SILIFE project. Lopez- Lilao et al.Is dustiness a predictor of exposure to particles in the ceramic industry? Ribalta et al. Nanoparticle release mechanisms during laser ablation of ceramic tiles. Salmatonidis et al.In-vitro metabolomics to evaluate toxicity of PM nearby a petrochemical complex. Sánchez-Soberón et al.On the challenges and the decision-making process for an optimal exposure assessment methodology in multi-source industrial scenarios. Lopez de Ipina et al.A new growth tube nanocharger-concentrator for improved particle charging e�iciency. Eiguren et al.Electrospray deposition system as sample preparation technique for nanoparticle analysis by electron microscopy. Mugica et al.Structure of granular deposits from electrosprayed catalytic inks. Martin et al.
Lunch + Posters (B)
Exposure in indoor and transport microenvironmentsChaired by MariCruz Minguillón & Constantinos SioutasExposure to air pollutants during commuting: exploring socio-economic inequalities and di�erences between travel modes. Rivas et al.Particulate matter in public transportation in Istanbul. Sahin and OnatEvaluation of BC, ultrafine particles and PM2,5 concentrations in Istanbul subways. Onat et al.Indoor air quality and energy performance in Portuguese climactic schools. Almeida et al.Exposure to particulate matter during sleep. Canha et al.Long‐term evaluation and source apportionment of redox‐active metals using a novel metal monitor and PMF. Mousavi et al.
Co�ee break
ALAVA INGENIEROS BioaerosolsChaired by Maria João CostaThe e�ect of wind on daily airborne pollen concentrations in Catalonia (NE Iberian Peninsula). Periago et al.First forecasts of platanus and pinus pollen in Catalonia, Spain: evaluation with a ground‐ based lidar. Sicard et al. Bioaerosols sampling procedure in the context of a bioterrorist attack: IB-BIOALERTNET project. Sánchez et al.
Conference dinner
9.00 - 10.45
9.00 - 9.159.15 - 9.30
9.30 - 9.459.45 - 10.00
10.00 - 10.15
10.15 - 10.30
10.45 - 11.45
11.45 - 14.00
11.45 - 12.0012.00 - 12.15 12.15 - 12.3012.30 - 12.45
12.45 - 13.00
13.00 - 13.15
13.15 - 13.30
13.30 - 13.45
14.00 - 15.30
15.30 - 17.00
15.30 - 15.45
15.45 - 16.0016.00 - 16.1516.15 - 16.3016.30 - 16.4516.45 - 17.00
17.00-17.30
17.30 - 17.45 17.45 - 18.30
17.45 - 18.00
18.00 - 18.15
18.15 - 18.30
20.30
6 JulyAir quality (sources and ultrafines)Chaired by Jesús de la Rosa & Aurelio TobíasSource apportionment in a street canyon: first approach within REMEDIO project. Almeida- Silva et al.3-years background gas and aerosol measurements in Mallorca Island, in WMB: Preliminary source apportionment outputs. Cerro et al.Estimation of daily fine particles in Italy at fine spatial resolution using monitoring stations, satellite data, land use and meteorology. Stafoggia et al.Ultrafine particle events during anticyclonic and advection conditions in Madrid. Pérez et al.High O3 & UFP summer episodes in and around Madrid. Querol et al.Study of the temporal variability and gas-aerosol partitioning of ammonium nitrate at an urban site in Northern France. Roig et al. Continuous air particulate analysers and PM10 particle reference samplers: a study about the equivalence between the reference and other ambient air particulate measuring methods. Abad Valle et al.
Co�ee break
Carbonaceous aerosolsChaired by Marta Almeida & Gloria TitosDetermination of Black Carbon age by the determination of the filter photometer loading parameter. Drinovec et al.EC, OC and PM2.5 emission factors from wood burning in improved ceramic cookstoves. Padilla-Barrera et al.Biomass burning impact on air quality in Spain using ACSM. Minguillón et al. Comparative chemistry and toxicity of rural and urban organic aerosols. Van Drooge et al.Intense biomass burning event removed by Aeronet at level 1.5. Obregón et al.Characterization of PAH, OC, EC and HM in atmospheric particles from a fire at the used tire landfill located between Seseña and Valdemoro (Spain). García dos Santos et al.Closing remarks and awards
Lunch
9.00 - 11.00
9.00 - 9.15
9.15 - 9.30
9.30 - 9.45
9.45 - 10.0010.00 - 10.1510.15 - 10.30
10.30 - 10.45
11.00 - 11.30
11.30 - 13.00
11.30 - 11.45
11.45 - 12.00
12.00 - 12.15 12.15 - 12.3012.30 - 12.4512.45 - 13.00
13.00 - 13.30
13.30 - 15.00

© F
otog
rafía
s: C
C0 b
y Ka
z (p
ixaba
y.com
)
TransportsMetropolitansde Barcelona
R CTABarcelona
‘17
5th
Iberian Meeting on Aerosol Science and Technology 4 - 6 July 2017 Barcelona, Spain
CONTINUOUS AIR PARTICULATE ANALYSERS AND PM10 PARTICLE REFERENCE SAMPLERS: A STUDY ABOUT THE EQUIVALENCE BETWEEN THE REFERENCE AND OTHER AMBIENT AIR
PARTICULATE MEASURING METHODS Patricia Abad Valle
1*, Francisco J. Sánchez Iñigo
1, Mihaela Craciun
1, Saúl García Dos Santos-Alves
1, Pilar Morillo
Gómez1, Luis Martín Hernández
2, Rosalía Fernández Patier
1
1 Instituto de Salud Carlos III, National Centre for Environmental Health (Department of Air Pollution),
Ctra.Majadahonda-Pozuelo km 2,2. 28220 - Majadahonda (Madrid), Spain 2 Proyectos Medioambientales S.A. (PROYMASA), C/ Tutor, 3. 28008 - Madrid, Spain
Keywords: PM10, correction factor, particulate analysers. *Presenting author email: [email protected]
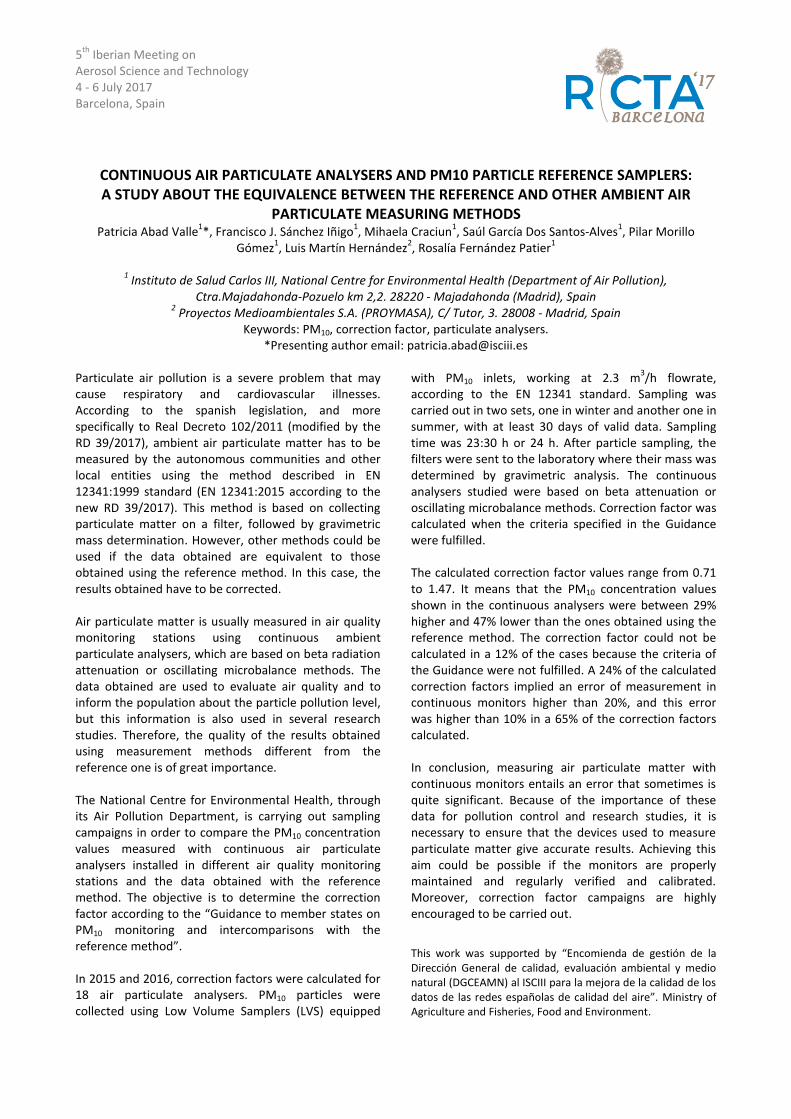
Particulate air pollution is a severe problem that may cause respiratory and cardiovascular illnesses. According to the spanish legislation, and more specifically to Real Decreto 102/2011 (modified by the RD 39/2017), ambient air particulate matter has to be measured by the autonomous communities and other local entities using the method described in EN 12341:1999 standard (EN 12341:2015 according to the new RD 39/2017). This method is based on collecting particulate matter on a filter, followed by gravimetric mass determination. However, other methods could be used if the data obtained are equivalent to those obtained using the reference method. In this case, the results obtained have to be corrected. Air particulate matter is usually measured in air quality monitoring stations using continuous ambient particulate analysers, which are based on beta radiation attenuation or oscillating microbalance methods. The data obtained are used to evaluate air quality and to inform the population about the particle pollution level, but this information is also used in several research studies. Therefore, the quality of the results obtained using measurement methods different from the reference one is of great importance. The National Centre for Environmental Health, through its Air Pollution Department, is carrying out sampling campaigns in order to compare the PM10 concentration values measured with continuous air particulate analysers installed in different air quality monitoring stations and the data obtained with the reference method. The objective is to determine the correction factor according to the “Guidance to member states on PM10 monitoring and intercomparisons with the reference method”. In 2015 and 2016, correction factors were calculated for 18 air particulate analysers. PM10 particles were collected using Low Volume Samplers (LVS) equipped
with PM10 inlets, working at 2.3 m3/h flowrate,
according to the EN 12341 standard. Sampling was carried out in two sets, one in winter and another one in summer, with at least 30 days of valid data. Sampling time was 23:30 h or 24 h. After particle sampling, the filters were sent to the laboratory where their mass was determined by gravimetric analysis. The continuous analysers studied were based on beta attenuation or oscillating microbalance methods. Correction factor was calculated when the criteria specified in the Guidance were fulfilled. The calculated correction factor values range from 0.71 to 1.47. It means that the PM10 concentration values shown in the continuous analysers were between 29% higher and 47% lower than the ones obtained using the reference method. The correction factor could not be calculated in a 12% of the cases because the criteria of the Guidance were not fulfilled. A 24% of the calculated correction factors implied an error of measurement in continuous monitors higher than 20%, and this error was higher than 10% in a 65% of the correction factors calculated. In conclusion, measuring air particulate matter with continuous monitors entails an error that sometimes is quite significant. Because of the importance of these data for pollution control and research studies, it is necessary to ensure that the devices used to measure particulate matter give accurate results. Achieving this aim could be possible if the monitors are properly maintained and regularly verified and calibrated. Moreover, correction factor campaigns are highly encouraged to be carried out.
This work was supported by “Encomienda de gestión de la Dirección General de calidad, evaluación ambiental y medio natural (DGCEAMN) al ISCIII para la mejora de la calidad de los datos de las redes españolas de calidad del aire”. Ministry of Agriculture and Fisheries, Food and Environment.
5th Iberian Meeting on Aerosol Science and Technology 4 - 6 July 2017 Barcelona, Spain
INFLUENCE OF LONG-RANGE TRANSPORT ON AIR QUALITY IN NORTHWESTERN IBERIA Aller V., Calvo A.*, Castro A., Fernández C., Blanco-Alegre C., Oduber F., Fraile R.
Department of Physics, IMARENAB University of León, 24071 León, Spain
Keywords: air quality, long range transport, Sahara dust outbreaks, weather types *[email protected]
Atmospheric transport and dispersion of air pollutants are key factors in the study of air quality. These processes can promote the cleaning of the local atmosphere and/or the arrival of pollutants from sources located far away from the study point. These pollution incomings can cause important impacts on the levels of air pollutants of the places affected. In Spain, some of the most important sources related to the long range transport (LRT) are Sahara Desert, biomass burning (mainly forest fires) and european sulphates incoming. Sahara Desert constitutes a primary source of dust aerosols, with an estimated load of mineral dust uplifted into the atmosphere of 1400 Tg per year (McKendry et al., 2007). Regarding sulphate, several studies have pointed out that LRT can have a significant impact on the fine fraction of aerosols at surface level (Wagstrom and Pandis, 2011). On the other hand, the smoke plumes generated during the forest fires can travel long distances, affecting areas located at thousand of kilometers from the fire. Some authors have detected an important increase in the number of hospital admissions under these smoke plumes influence. A complete description of these source emissions as well as the meteorological processes leading to the emissions transport are of key importance for evaluating the impacts of pollutants under some LRT episodes. The aim of this study is to analyse the frequency of the arrival of pollutants from three different sources: i) Saharan Desert, ii) biomass burning and iii) sulphates from Europe to the northwest sector of the Iberia Peninsula during the period 2004-2016. The database containing the ocurrence of these episodes has been obtained from the CALIMA network (www.calima.ws). Data are provided as a result of the collaboration agreement for the study and evaluation of air pollution by suspended particulate matter in Spain between D.G. of Quality and Environmental Assessment of the Ministry of Environment, the Higher Council of Scientific Research and the National Institute of Meteorology of the Ministry of Environment. Furthermore, the impact of these events on the air quality of the city of León has been studied in detail.
León (42° 36′ N, 05° 35′ W and 838 m above sea level) is located in a mining region, with a population of about 150 000 inhabitants. Due to the low industrial activity, the main local air pollutant sources are road traffic and combustion proceses in domestic devices (biomass and mineral coal). Data from four air quality stations, corresponding to the Castilla y León air quality network (www.jcyl.es), have been analysed. The concentrations of PM10, NO, NOX, SO2, O3 and CO have been studied and the variations registered during the pollution episodes evaluated. Furthermore, a weather type classification (Lamb, 1972) has been carried out in order to identify under which meteorological conditions these three types of events take place. According to CALIMA network, during the thirteen years studied, a total of 389, 545 and 69 days were affected by Saharan dust outbreaks, biomass burning and incoming of sulphate from Europe, respectively. Sahara dust intrussion occurs mainly during summer months and PM10 exceedes in 82 days the daily concentration limit of 50 µg m-3 established by the Directive 2008/50/EC. Regarding biomass burning and european sulphates emissions, this limit concentration was exceeded in 46 and 4 days, respectively. The events with higher impact on the air quality of León have been analysed in detail. This work was partially supported by the Spanish Ministry of Economy and Competitiveness (Grants TEC2014-57821-R, BES-2015-074473 -F. Oduber- and CGL2014-52556-R, AERORAIN co-financed with FEDER funds), the University of León (Programa Propio 2015/00054/001). We would like express their gratitude to the CALIMA project. Lamb H. (1972). British Isles Weather types and a
register of daily sequence of circulation patterns: 1861–1971. Geophys. Mem. 116: 85.
McKendry et al. (2007). Trans-Pacific transport of Saharan dust to western North America: A case study. J. Geophys. Res., 112(D01103).
Wagstrom, K.M and Pandis S.N. (2011). Contribution of Long Range Transport to local Fine Particulate Matter Concerns. Atmos. Environ. 45, 16: 2730-35.
5th
Iberian Meeting on Aerosol Science and Technology 4 - 6 July 2017 Barcelona, Spain
INDOOR AIR QUALITY AND ENERGY PERFORMANCE IN PORTUGUESE CLIMACT SCHOOLS
Almeida S.M.1, Manteigas V.
1, Pina C.
1, Canha N.
1, Almeida-Silva M.
1, Lage J.
1, Mafra C.
2, Rato R.
2
1Centro de Ciências e Tecnologias Nucleares (C2TN), Instituto Superior Técnico, Universidade de Lisboa, Estrada
Nacional 10, ao km 139.7, 2695-066 Bobadela-LRS, Portugal 2Instituto de Soldadura e Qualidade, Av. Prof. Dr. Cavaco Silva, nº 33, 2740-120 Porto Salvo, Portugal
Keywords: Indoor air quality, comfort, energy efficiency, low carbon, schools
*Presenting author email: [email protected]
The implementation of a low carbon economy in schools - by incorporating complementary approaches such as energy efficiency, smart growth initiatives, transportation control measures, energy-efficient product procurement and resources conservation - conducts to important environment, economic and social benefits. It contributes for the accomplishment of the European energy related targets and for the implementation of the 3
rd priority defined by the 7
th
Environment Action Program “to safeguard the Union’s citizens from environment-related pressures and risks to health and well-being”. The main objective of the Interreg Sudoe project ClimACT (www.climact.net) is to promote the transition to a low carbon economy in schools. To this end, ClimACT is developing tools to support schools managers and, not less important, students in the identification of intelligent solutions that consider energy efficiency and respect for the environment. The ClimACT solutions are being validated in real-life conditions in 35 pilot schools from Portugal, Spain, France and Gibraltar. This paper will present the work developed in six ClimACT schools where integrated energy and indoor air quality audits were performed. Energy used, building envelope, installed equipment, lighting and occupancy were assessed in the school buildings. Indoor air quality and comfort parameters were examined in two classrooms, in each school, during five weekdays from Monday to Friday. Volatile organic compounds and aldehydes were measured with Radiello diffusive samplers, PM2.5 and PM10 were assessed with a Dusttrak 8533 and CO2, CO, total VOC, temperature and relative humidity were evaluated with a GrayWolf Direct Sense IAQ Plus. Ventilation rates were calculated using the build-up method based on CO2 concentrations as a tracer (Canha et al., 2013). The survey revealed the main parameters affecting the overall performance of the investigated buildings. The problematic building envelope, the improper control of
heating and lighting systems, and the lack of interest concerning the efficiency of such buildings were the main factors in the reported efficiency. Despite the existing indoor air quality legislation in Portugal, results showed that it is rather difficult to achieve its requirements, especially those regarding to CO2 and PM10 concentrations, as the operating profile, the high occupation density, the lack of intelligent ventilation systems and the occupants’ behaviours, in most cases, complicate its practical application. After the evaluation of energy, comfort and indoor air quality performance, this work identified and evaluated a package of measures that promote sustainability to the schools, and ensure a comfortable and healthy environment for educational purposes. This work was supported by the European Regional Development Fund (ERDF) through the Interreg Sudoe project ClimACT – Acting for the transition to a low carbon economy in schools – development of support tools (SOE1/P3/P0429). C2TN/IST authors gratefully acknowledge the Fundação para a Ciência e Tecnologia support to the UID/Multi/04349/2013 project. Canha, N., Almeida, S.M., Freitas, M.C., Taubel, M., Hanninen, O. (2013) Journal of Toxicology and Environmental Health-Part A-Current Issues 76, 400-408.
5th Iberian Meeting on Aerosol Science and Technology 4 - 6 July 2017 Barcelona, Spain
Source apportionment in a street canyon: first approach within REMEDIO project
Almeida-Silva M.1*, Almeida S.M.1, Diapouli E.2, Alves C.3, Canha N.1,3, Faria T.1 1 Centro de Ciências e Tecnologias Nucleares, Instituto Superior Técnico, Universidade de Lisboa, E.N. 10 ao km
139,7, 2695-066 Bobadela LRS, Portugal 2 National Centre for Scientific Research “Demokritos”, Institute of Nuclear & Radiological
Sciences & Technology, Energy & Safety, 15310 Ag. Paraskevi, Attiki, Greece 3 Centre for Environmental and Marine Studies (CESAM), Department of Environment, University of Aveiro,
3810-193 Aveiro, Portugal Keywords: urban, street, source apportionment
*Presenting author email: [email protected]
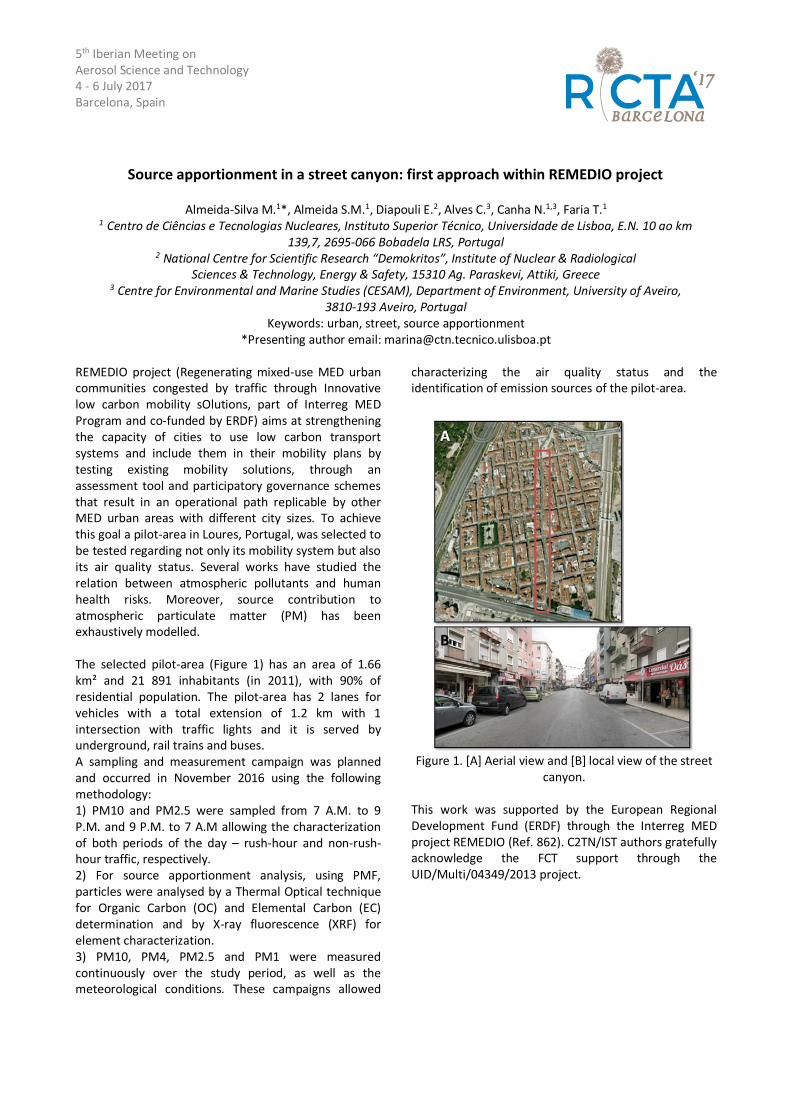
REMEDIO project (Regenerating mixed-use MED urban communities congested by traffic through Innovative low carbon mobility sOlutions, part of Interreg MED Program and co-funded by ERDF) aims at strengthening the capacity of cities to use low carbon transport systems and include them in their mobility plans by testing existing mobility solutions, through an assessment tool and participatory governance schemes that result in an operational path replicable by other MED urban areas with different city sizes. To achieve this goal a pilot-area in Loures, Portugal, was selected to be tested regarding not only its mobility system but also its air quality status. Several works have studied the relation between atmospheric pollutants and human health risks. Moreover, source contribution to atmospheric particulate matter (PM) has been exhaustively modelled. The selected pilot-area (Figure 1) has an area of 1.66 km² and 21 891 inhabitants (in 2011), with 90% of residential population. The pilot-area has 2 lanes for vehicles with a total extension of 1.2 km with 1 intersection with traffic lights and it is served by underground, rail trains and buses. A sampling and measurement campaign was planned and occurred in November 2016 using the following methodology: 1) PM10 and PM2.5 were sampled from 7 A.M. to 9 P.M. and 9 P.M. to 7 A.M allowing the characterization of both periods of the day – rush-hour and non-rush-hour traffic, respectively. 2) For source apportionment analysis, using PMF, particles were analysed by a Thermal Optical technique for Organic Carbon (OC) and Elemental Carbon (EC) determination and by X-ray fluorescence (XRF) for element characterization. 3) PM10, PM4, PM2.5 and PM1 were measured continuously over the study period, as well as the meteorological conditions. These campaigns allowed
characterizing the air quality status and the identification of emission sources of the pilot-area.
Figure 1. [A] Aerial view and [B] local view of the street
canyon. This work was supported by the European Regional Development Fund (ERDF) through the Interreg MED project REMEDIO (Ref. 862). C2TN/IST authors gratefully acknowledge the FCT support through the UID/Multi/04349/2013 project.
5th
Iberian Meeting on Aerosol Science and Technology 4 - 6 July 2017 Barcelona, Spain
HYGROSCOPIC PROPERTIES OF FRESHLY FORMED PARTICLES DURING AN INTENSIVE SUMMERTIME FIELD CAMPAIGN IN MADRID
Alonso-Blanco E.1, Gómez-Moreno F. J.
1, E. Coz
1, E. Diaz
1, Peréz N.
2, Alastuey A.
2, Querol X.
2, Reche C.
2, Titos
G.2, Ealo M.
2, Tritscher T.
3, Filimundi E.
4, Latorre E.
5 and Artiñano B.
1*
1 Department of Environment, Joint Research Unit Atmospheric Pollution CIEMAT-CSIC, Madrid, 28040 Spain
2Institute of Environmental Assessment and Water Research (IDAEA-CSIC), Barcelona, 08034 Spain
3TSI GmbH, Aachen, D-52068, Germany
4TSI France Incorporated, Technopôle de Château-Gombert, Marseille, 13382, France
5Álava Ingenieros, Madrid, E-28037, Spain
Keywords: Aerosol Growth Factor, Aerosol Hygroscopicity, HTDMA, New Particle Formation (NPF), Ultrafine Particle
*Presenting author email: [email protected]
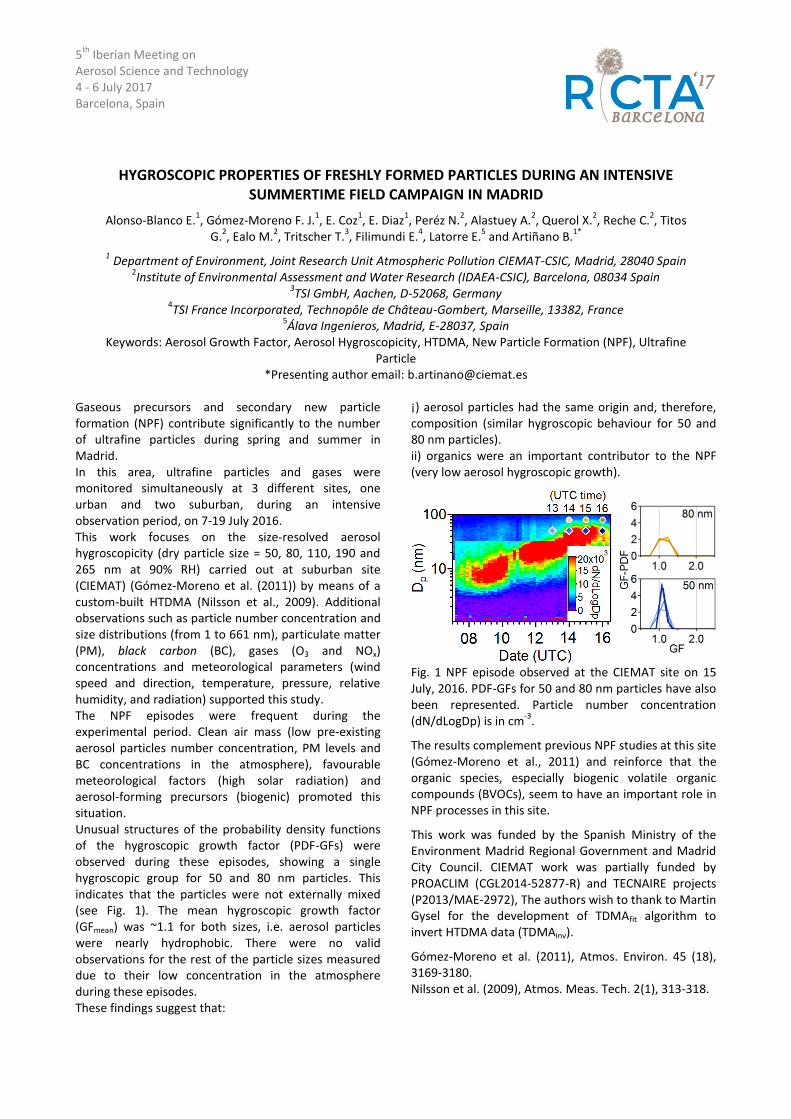
Gaseous precursors and secondary new particle formation (NPF) contribute significantly to the number of ultrafine particles during spring and summer in Madrid. In this area, ultrafine particles and gases were monitored simultaneously at 3 different sites, one urban and two suburban, during an intensive observation period, on 7-19 July 2016. This work focuses on the size-resolved aerosol hygroscopicity (dry particle size = 50, 80, 110, 190 and 265 nm at 90% RH) carried out at suburban site (CIEMAT) (Gómez-Moreno et al. (2011)) by means of a custom-built HTDMA (Nilsson et al., 2009). Additional observations such as particle number concentration and size distributions (from 1 to 661 nm), particulate matter (PM), black carbon (BC), gases (O3 and NOx) concentrations and meteorological parameters (wind speed and direction, temperature, pressure, relative humidity, and radiation) supported this study. The NPF episodes were frequent during the experimental period. Clean air mass (low pre-existing aerosol particles number concentration, PM levels and BC concentrations in the atmosphere), favourable meteorological factors (high solar radiation) and aerosol-forming precursors (biogenic) promoted this situation. Unusual structures of the probability density functions of the hygroscopic growth factor (PDF-GFs) were observed during these episodes, showing a single hygroscopic group for 50 and 80 nm particles. This indicates that the particles were not externally mixed (see Fig. 1). The mean hygroscopic growth factor (GFmean) was ~1.1 for both sizes, i.e. aerosol particles were nearly hydrophobic. There were no valid observations for the rest of the particle sizes measured due to their low concentration in the atmosphere during these episodes. These findings suggest that:
¡) aerosol particles had the same origin and, therefore, composition (similar hygroscopic behaviour for 50 and 80 nm particles). ii) organics were an important contributor to the NPF (very low aerosol hygroscopic growth).
Fig. 1 NPF episode observed at the CIEMAT site on 15 July, 2016. PDF-GFs for 50 and 80 nm particles have also been represented. Particle number concentration (dN/dLogDp) is in cm
-3.
The results complement previous NPF studies at this site (Gómez-Moreno et al., 2011) and reinforce that the organic species, especially biogenic volatile organic compounds (BVOCs), seem to have an important role in NPF processes in this site.
This work was funded by the Spanish Ministry of the Environment Madrid Regional Government and Madrid City Council. CIEMAT work was partially funded by PROACLIM (CGL2014-52877-R) and TECNAIRE projects (P2013/MAE-2972), The authors wish to thank to Martin Gysel for the development of TDMAfit algorithm to invert HTDMA data (TDMAinv).
Gómez-Moreno et al. (2011), Atmos. Environ. 45 (18), 3169-3180. Nilsson et al. (2009), Atmos. Meas. Tech. 2(1), 313-318.
5th
Iberian Meeting on Aerosol Science and Technology 4 - 6 July 2017 Barcelona, Spain
PASSIVE MONITORING OF PARTICULATE MATTER AND GASEOUS POLLUTANTS IN FOGO
ISLAND, CAPE VERDE
ALVES C.
1, CANDEIAS C.
2, GUIMARÃES C.
1, ÁVILA, P.F.
3, NUNES T.
1, VICENTE E.
1, ROCHA F.
2
1Centre for Environmental and Marine Studies (CESAM), Department of Environment and Planning, University of
Aveiro, Aveiro, 3810-193, Portugal 2Department of Geosciences, Geobiosciences, Geotechnologies and Geoengineering Research Centre
(GeoBioTec), University of Aveiro, 3810-193 Aveiro, Portugal
3National Laboratory of Energy and Geology (LNEG), Rua da Amieira, Apartado 1089, 4466-901 S. Mamede de
Infesta, Portugal
Keywords: dust deposition, acid gases, SO2, VOCs. *Presenting author email [email protected]
Fogo is the island of the Sotavento group of Cape Verde that reaches the highest altitude: nearly 3,000 metres above sea level at its summit, Pico do Fogo. Although the 2014 eruption of its vulcano has ceased, minor fumarolic activity is still present at the edge of the new crater. Moreover, the deposited ash is frequently remobilised by the wind causing significant health concerns. Aiming at evaluating air quality, settleable particulate matter was collected on quartz fibre filters of 47 mm, which were placed in petri dishes. Filter pairs were exposed to dust fall for 2 months (Nov. 2016 - Jan. 2017) at 20 indoor environments distributed by the island. Passive sampling tubes for volatile organic compounds (VOCs), acid gases and SO2 from Gradko International Ltd. (UK) were exposed at the same sites for 3 weeks. Acid gases (HF, HCl, HNO3, HBr, H3PO4 and H2SO4) and SO2 were analysed by ion chromatography (IC). VOCs were determined by thermal desorption coupled to gas chromatography-mass spectrometry. Each filter of a pair was analysed for its carbonaceous content by a thermal-optical technique and for water soluble ions by IC (Custódio et al., 2016.) The respective pairs were investigated by scanning electron microscopy (SEM) in order to determine the type of minerals present, their size and shape. According to the EA’s Technical Guidance document M17 V2 (2013), no statutory or official air quality criterion for dust annoyance has been set at European or WHO level. Also, there are no Cape Verdean standards for dust deposition. Clark (2013) refers nuisance dust deposition limit values from nine countries, ranging from 100 mg/m
2/day in New York
State, USA, to 333 mg/m2/day in Finland. Dust
deposition in Fogo island ranged from 23 to 155 mg/m
2/day. Most of the total mass of particulate
matter was usually made up of mineral matter, whereas carbonaceous constituents represented a minor fraction.
Levels of acid gases were, in most cases, below the detection limits. The only exception was observed at a place where traditional pig slaughter is regularly performed for the commercial distribution of meat within the island. To clean the hair off the pig, each animal is burned with oil or similar combustion fuels. The slaughter is followed by barbecue and preparation of crispy fried pork greaves. The bonfire is lit with dry acacia leaves, plastics and cardboards, and then the embers are fed with acacia logs. These practices last a minimum of 10 hours a day and have possibly contributed to the high levels registered at this location: 36, 427, 15, 101 and 11 µg/m
3 for HF, HCl, HNO3, H2SO4
and H3PO4, respectively. In general, concentrations of SO2 were also below the detection limit, except at the place mentioned above (85.3 µg/m
3). The dominant
VOCs were alkylpentanes, hexane, cycloalkanes and toluene. The remaining fumarolic activity seems to have little impact on gaseous air pollution, which is most affected by anthropogenic emission sources. This work was funded by the Portuguese Foundation for Science and Technology through the project “Fogo Island volcano: multidisciplinary Research on 2014 Eruption (FIRE)”, PTDC/GEOGEO/1123/201, and grants SFRH/BPD/99636/2014 and SFRH/BD/117993/2016. Clark D.R. (2013), TANBREEZ Project Dust Dispersion
Study. Tanbrez MIining Greenland A/S. Custódio et al. (2014), A one-year record of
carbonaceous components and major ions in aerosols from an urban kerbside location in Oporto, Portugal, Sci. Total. Environ. 562, 822-833.
5th Iberian MAerosol Scien4 ‐ 6 July 201Barcelona, Sp
VERTIC
AmatoDro
In the city ofof vehiclesconcentratiopollutants mdistance froarchitecture relatively hipollutants. variability ofcurb, and theBC (4 profilethat a greatheight than inputs can bair quality pcanyon simupopulation eminimum disprovided, in playgrounds (schools, hos
Fig. 1. Mapvertical pro
Meeting on nce and Techn17 pain
CAL AND H
, F.1*, Perez, Nooge, B.1, Vian
f Barcelona, as are dieseons of NO2 anmay be signom the curhampers su
igh buildingsWe have f BC (29 proe vertical varies) with height share of pethat of air e useful for apolicies and ulations. In fexposure quastances to acview of a saand othe
spitals, daiy ca
p of BC horizoofiles. At most
were
nology
ORIZONTA
N.1, Alastuey, na, M.1, Reche
Marcoccia,
Keywords: B*Prese
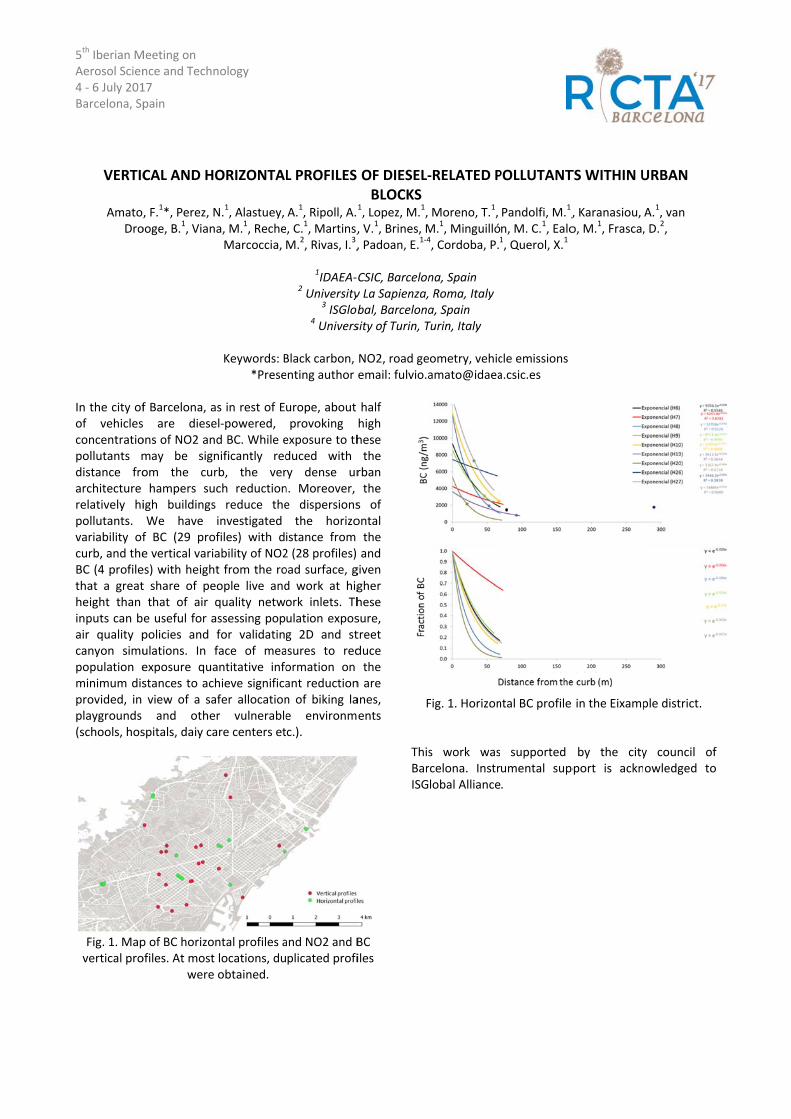
as in rest of Eel‐powered, nd BC. While enificantly redrb, the veruch reductions reduce theinvestigated
ofiles) with dability of NO2t from the roeople live andquality netwassessing popfor validatinface of meaantitative infohieve significaafer allocationer vulnerableare centers et
ntal profiles a locations, duobtained.
L PROFILES
A.1, Ripoll, A.e, C.1, Martins,M.2, Rivas, I.3,
1IDAEA‐2 University
3 ISGlob4 Univers
Black carbon, enting author
urope, about provoking
exposure to thduced with ry dense urn. Moreover, e dispersionsthe horizo
istance from 2 (28 profiles) oad surface, gd work at higork inlets. Thulation exposg 2D and stasures to redormation on ant reductionn of biking lae environmc.).
and NO2 and Bplicated profi
OF DIESEL‐BLOCKS
1, Lopez, M.1, , V.1, Brines, M, Padoan, E.1‐4
CSIC, Barcelony La Sapienza,bal, Barcelonasity of Turin, T
NO2, road geemail: fulvio.a
half high hese the
rban the
s of ontal the and given gher hese sure, treet duce the
n are anes, ents
BC iles
F ThisBarISG
‐RELATED P
Moreno, T.1, M.1, Minguilló4, Cordoba, P.
na, Spain Roma, Italya, Spain Turin, Italy
ometry, vehicamato@idaea
Fig. 1. Horizon
s work wasrcelona. Instrlobal Alliance
POLLUTANT
Pandolfi, M.1,n, M. C.1, Ealo1, Querol, X.1
cle emissions a.csic.es
ntal BC profile
supported umental sup.
TS WITHIN U
, Karanasiou, o, M.1, Frasca,
in the Eixamp
by the citypport is ackn
URBAN
A.1, van , D.2,
ple district.
y council ofowledged to
f o
5th Iberian Meeting on Aerosol Science and Technology 4 ‐ 6 July 2017 Barcelona, Spain
COMPUTATIONAL SIMULATIONS OF AN AEROSOL FOR SURFACTANT DELIVERY IN PRETERM INFANTS
I. Aramendia1*, A. Lopez‐Arraiza2, M.A. Gómez Solaetxe2, U. Fernandez‐Gamiz1, J. Sancho1, C. Rey‐Santano3,
V. Mielgo3, J. Lopez de Heredia4
1University of the Basque Country, Nuclear Engineering and Fluid Mechanics Department, Vitoria‐Gasteiz,
Araba, Spain 2 University of the Basque Country (UPV/EHU), Department of Nautical Science and Marine Systems, Bilbao,
Bizkaia, Spain 3Research Unit for Experimental Neonatal Respiratory Physiology, Cruces University Hospital, Barakaldo,
Bizkaia, Spain 4Neonatal Intensive Care Unit, Cruces University Hospital, Barakaldo, Bizkaia, Spain
Keywords: Surfactant, Microjet, CFD, Particle injections. *Presenting author email: [email protected]
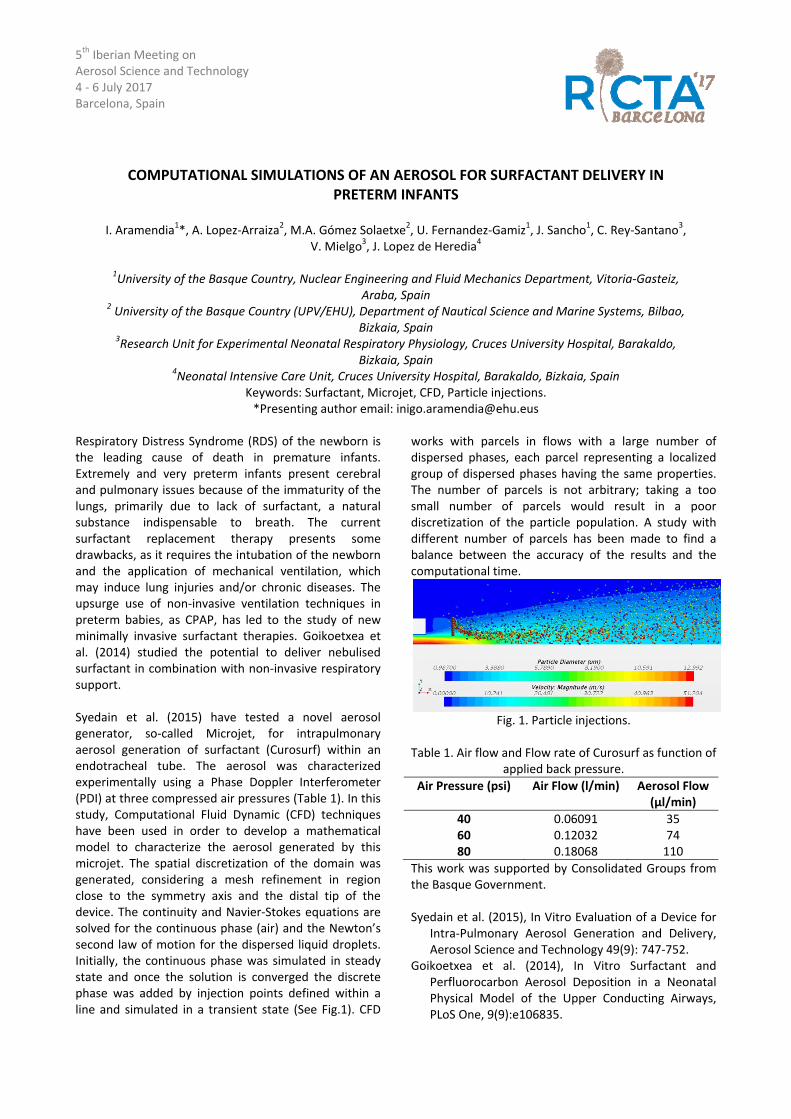
Respiratory Distress Syndrome (RDS) of the newborn is the leading cause of death in premature infants. Extremely and very preterm infants present cerebral and pulmonary issues because of the immaturity of the lungs, primarily due to lack of surfactant, a natural substance indispensable to breath. The current surfactant replacement therapy presents some drawbacks, as it requires the intubation of the newborn and the application of mechanical ventilation, which may induce lung injuries and/or chronic diseases. The upsurge use of non‐invasive ventilation techniques in preterm babies, as CPAP, has led to the study of new minimally invasive surfactant therapies. Goikoetxea et al. (2014) studied the potential to deliver nebulised surfactant in combination with non‐invasive respiratory support. Syedain et al. (2015) have tested a novel aerosol generator, so‐called Microjet, for intrapulmonary aerosol generation of surfactant (Curosurf) within an endotracheal tube. The aerosol was characterized experimentally using a Phase Doppler Interferometer (PDI) at three compressed air pressures (Table 1). In this study, Computational Fluid Dynamic (CFD) techniques have been used in order to develop a mathematical model to characterize the aerosol generated by this microjet. The spatial discretization of the domain was generated, considering a mesh refinement in region close to the symmetry axis and the distal tip of the device. The continuity and Navier‐Stokes equations are solved for the continuous phase (air) and the Newton’s second law of motion for the dispersed liquid droplets. Initially, the continuous phase was simulated in steady state and once the solution is converged the discrete phase was added by injection points defined within a line and simulated in a transient state (See Fig.1). CFD
works with parcels in flows with a large number of dispersed phases, each parcel representing a localized group of dispersed phases having the same properties. The number of parcels is not arbitrary; taking a too small number of parcels would result in a poor discretization of the particle population. A study with different number of parcels has been made to find a balance between the accuracy of the results and the computational time.
Fig. 1. Particle injections.
Table 1. Air flow and Flow rate of Curosurf as function of
applied back pressure.
Air Pressure (psi) Air Flow (l/min) Aerosol Flow (µl/min)
40 0.06091 3560 0.12032 7480 0.18068 110
This work was supported by Consolidated Groups from the Basque Government. Syedain et al. (2015), In Vitro Evaluation of a Device for
Intra‐Pulmonary Aerosol Generation and Delivery, Aerosol Science and Technology 49(9): 747‐752.
Goikoetxea et al. (2014), In Vitro Surfactant and Perfluorocarbon Aerosol Deposition in a Neonatal Physical Model of the Upper Conducting Airways, PLoS One, 9(9):e106835.
5th Iberian Meeting on Aerosol Science and Technology 4 - 6 July 2017 Barcelona, Spain
TEEMS - TOTAL TURBOFAN ENGINE EMISSIONS MEASUREMENT SYSTEM. A RESEARCH AND INNOVATION SPANISH PROGRAM
Victor Archilla1*, Gaizka Aragón1, Jesús Rodriguez-Maroto2, German Barrera2, Enrique Rojas2, Begoña Ahedo2, David Sanz2, Dévora Hormigo1, Manuel Pujadas2, Susana García-Alonso2, Rosa Pérez-Pastor2
1 Turbojet Engine Test Centre, INTA, Torrejón de Ardoz, 28850, Spain. 2 Department of Environment, CIEMAT, Madrid, 28040, Spain
Keywords: aircraft, emissions, PM, turbojet *Presenting author email: [email protected]
The reduction of pollutants produced by the aviation sec-tor is one of the pillars of Flight Path 2050 and SRIA ACARE1. This has driven different research programmes as part of Horizon 2020 and Clean Sky research funding. With a view to supporting European industry, research groups and the new nvPM regulation for the aviation sector, the INTA Turbojet Testing Centre, in collaboration with CIEMAT and Rolls-Royce, are developing a unique scientific and technological infrastructure serving to demonstrate and assess new measurement technologies for the characterization of turbofan engine gases and PM emissions.
The research program called TEEMS enables characterization of all the emission sources generated by a turbofan engine:
1. Combustion emissions at two different planes: a. Measurement at the engine exhaust exit plane, where the sampling probe is subject to extreme conditions (T> 500 °C and v> 300 m/s). b. Measurement downstream in the mixed plume at 55 meters from the engine where cooling and mixing of the sample can provide fundamental data for environmental assessment2.
2. Oil breather emissions: The aircraft engine lubrication oil emitted from the turbofan vent system can be an important emission contribution of semi-volatile hydrocarbon mass, which does not have to do with the combustion process.
3. Cabin bleed emissions: Some of the fresh ambient air from inside the engine compressor before the combustor is used as the pressurised ambient air source for the aircraft cabin. INTA has developed the capability to characterise this air and proven that it meets the contaminant requirements from the engine.
TEEMS also supports and encourages the development of scientific and technological infrastructure including novel non-intrusive emission measurement methods. In this area, INTA and CIEMAT have developed one
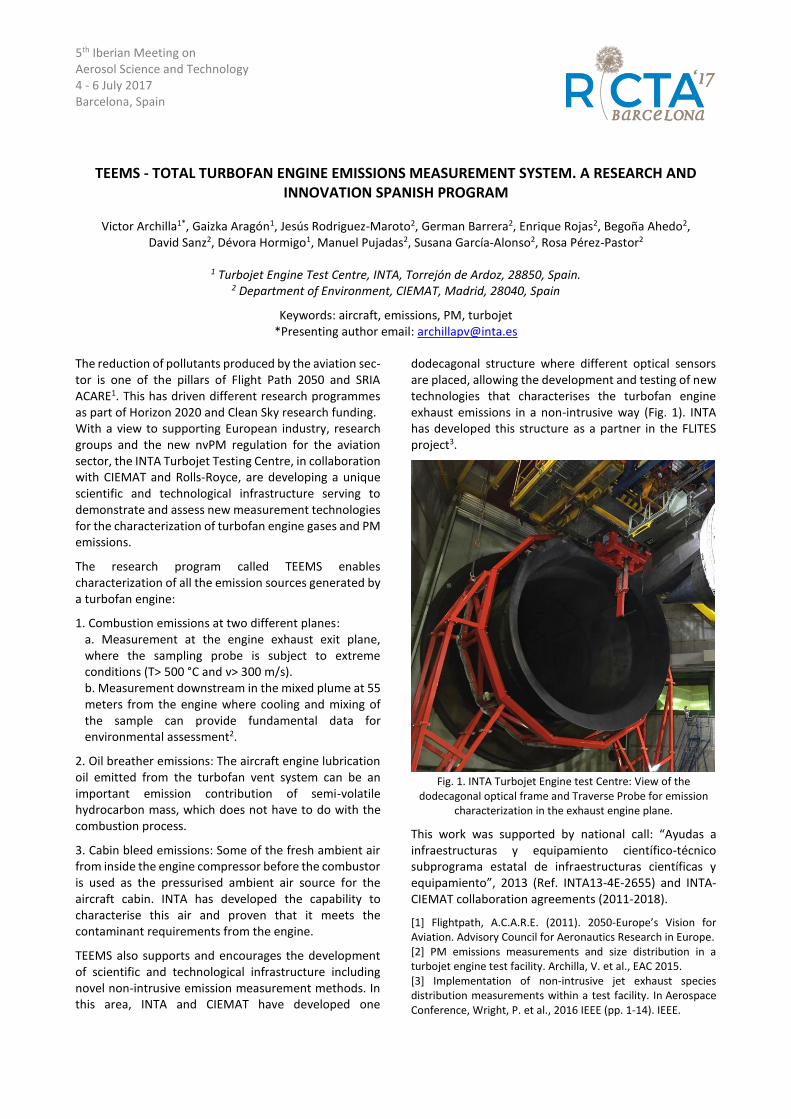
dodecagonal structure where different optical sensors are placed, allowing the development and testing of new technologies that characterises the turbofan engine exhaust emissions in a non-intrusive way (Fig. 1). INTA has developed this structure as a partner in the FLITES project3.
Fig. 1. INTA Turbojet Engine test Centre: View of the
dodecagonal optical frame and Traverse Probe for emission characterization in the exhaust engine plane.
This work was supported by national call: “Ayudas a infraestructuras y equipamiento científico-técnico subprograma estatal de infraestructuras científicas y equipamiento”, 2013 (Ref. INTA13-4E-2655) and INTA-CIEMAT collaboration agreements (2011-2018).
[1] Flightpath, A.C.A.R.E. (2011). 2050-Europe’s Vision for Aviation. Advisory Council for Aeronautics Research in Europe. [2] PM emissions measurements and size distribution in a turbojet engine test facility. Archilla, V. et al., EAC 2015. [3] Implementation of non-intrusive jet exhaust species distribution measurements within a test facility. In Aerospace Conference, Wright, P. et al., 2016 IEEE (pp. 1-14). IEEE.
5th Iberian Meeting on Aerosol Science and Technology 4 - 6 July 2017 Barcelona, Spain
NEW METHODS IN AIR QUALITY MONITORING: IS TOTAL PROTEIN A FEASIBLE MARKER OF BIOAEROSOL LOAD IN AMBIENT AIR?
Rute Arriegas1,2*, Pedro Alves1, Marta Otilio1, Ana Galveias1,2, Ana Costa1,2; Célia Antunes1,2
1Departamento de Química, Escola de Ciências e Tecnologia & Instituto de Ciências da Terra, IIFA, Universidade
de Évora, Évora, Portugal
2 Instituto de Ciências da Terra, Universidade de Évora, Évora, Portugal Keywords: air quality, pollen, protein, allergen, bioaerosols.
*Presenting author email: [email protected]
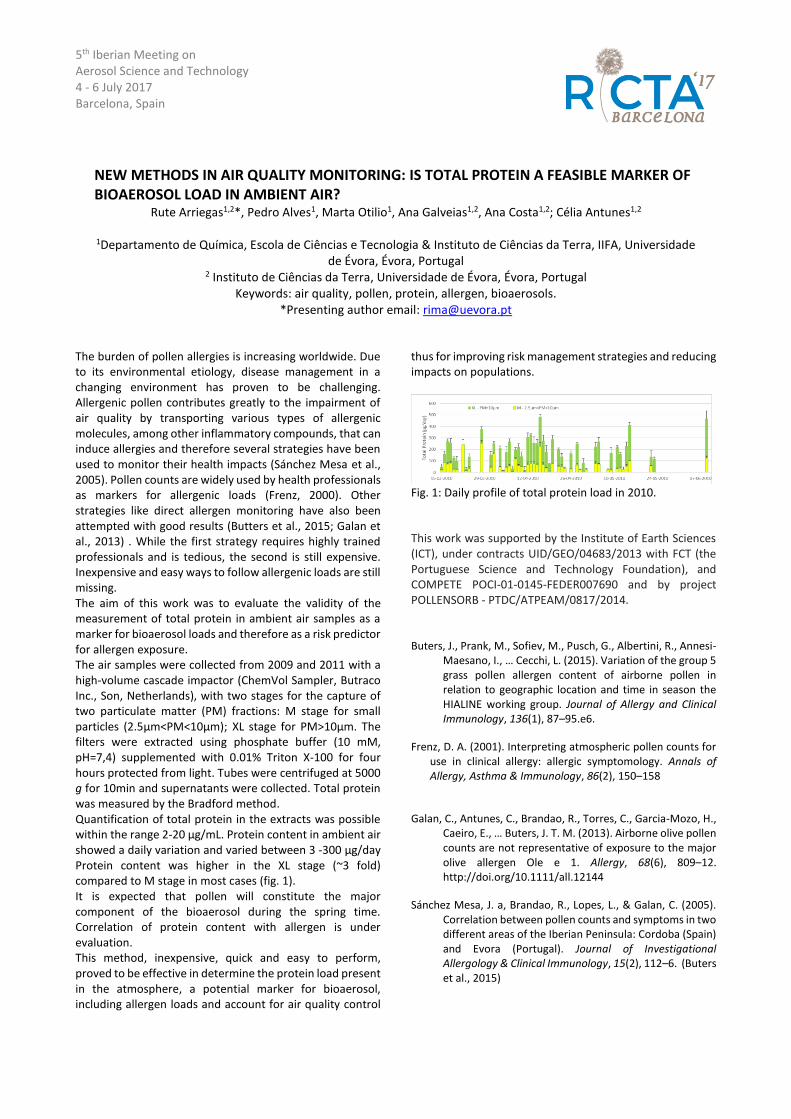
The burden of pollen allergies is increasing worldwide. Due to its environmental etiology, disease management in a changing environment has proven to be challenging. Allergenic pollen contributes greatly to the impairment of air quality by transporting various types of allergenic molecules, among other inflammatory compounds, that can induce allergies and therefore several strategies have been used to monitor their health impacts (Sánchez Mesa et al., 2005). Pollen counts are widely used by health professionals as markers for allergenic loads (Frenz, 2000). Other strategies like direct allergen monitoring have also been attempted with good results (Butters et al., 2015; Galan et al., 2013) . While the first strategy requires highly trained professionals and is tedious, the second is still expensive. Inexpensive and easy ways to follow allergenic loads are still missing. The aim of this work was to evaluate the validity of the measurement of total protein in ambient air samples as a marker for bioaerosol loads and therefore as a risk predictor for allergen exposure. The air samples were collected from 2009 and 2011 with a high-volume cascade impactor (ChemVol Sampler, Butraco Inc., Son, Netherlands), with two stages for the capture of two particulate matter (PM) fractions: M stage for small particles (2.5μm<PM<10μm); XL stage for PM>10μm. The filters were extracted using phosphate buffer (10 mM, pH=7,4) supplemented with 0.01% Triton X-100 for four hours protected from light. Tubes were centrifuged at 5000 g for 10min and supernatants were collected. Total protein was measured by the Bradford method. Quantification of total protein in the extracts was possible within the range 2-20 µg/mL. Protein content in ambient air showed a daily variation and varied between 3 -300 µg/day Protein content was higher in the XL stage (~3 fold) compared to M stage in most cases (fig. 1). It is expected that pollen will constitute the major component of the bioaerosol during the spring time. Correlation of protein content with allergen is under evaluation. This method, inexpensive, quick and easy to perform, proved to be effective in determine the protein load present in the atmosphere, a potential marker for bioaerosol, including allergen loads and account for air quality control
thus for improving risk management strategies and reducing impacts on populations.
Fig. 1: Daily profile of total protein load in 2010. This work was supported by the Institute of Earth Sciences (ICT), under contracts UID/GEO/04683/2013 with FCT (the Portuguese Science and Technology Foundation), and COMPETE POCI-01-0145-FEDER007690 and by project POLLENSORB - PTDC/ATPEAM/0817/2014. Buters, J., Prank, M., Sofiev, M., Pusch, G., Albertini, R., Annesi-
Maesano, I., … Cecchi, L. (2015). Variation of the group 5 grass pollen allergen content of airborne pollen in relation to geographic location and time in season the HIALINE working group. Journal of Allergy and Clinical Immunology, 136(1), 87–95.e6.
Frenz, D. A. (2001). Interpreting atmospheric pollen counts for use in clinical allergy: allergic symptomology. Annals of Allergy, Asthma & Immunology, 86(2), 150–158
Galan, C., Antunes, C., Brandao, R., Torres, C., Garcia-Mozo, H., Caeiro, E., … Buters, J. T. M. (2013). Airborne olive pollen counts are not representative of exposure to the major olive allergen Ole e 1. Allergy, 68(6), 809–12. http://doi.org/10.1111/all.12144
Sánchez Mesa, J. a, Brandao, R., Lopes, L., & Galan, C. (2005). Correlation between pollen counts and symptoms in two different areas of the Iberian Peninsula: Cordoba (Spain) and Evora (Portugal). Journal of Investigational Allergology & Clinical Immunology, 15(2), 112–6. (Buters et al., 2015)
5th Iberian Meeting on Aerosol Science and Technology4 - 6 July 2017Barcelona, Spain
QUALITY-ASSURED MEASUREMENTS OF PARTICULEDEPOLARIZATION RATIO AT BARCELONA: CHANNEL DESIGN AND
CALIBRATION PROCEDURE AND STABILITY
Ben Chahed E.1,*, Rodríguez-Gómez A.1, Sicard M.1,2, Comerón A.1, Muñoz-Porcar C.1,Barragan R.1,2
1Remote Sensing Laboratory, Universitat Politècnica de Catalunya, Barcelona, Spain2Ciències i Tecnologies de l'Espai - Centre de Recerca de l'Aeronàutica i de l'Espai /
Institut d'Estudis Espacials de Catalunya (CTE-CRAE / IEEC), Universitat Politècnica deCatalunya, Barcelona, Spain
Keywords: depolarization ratio, calibration, stability.*Presenting author email: [email protected]
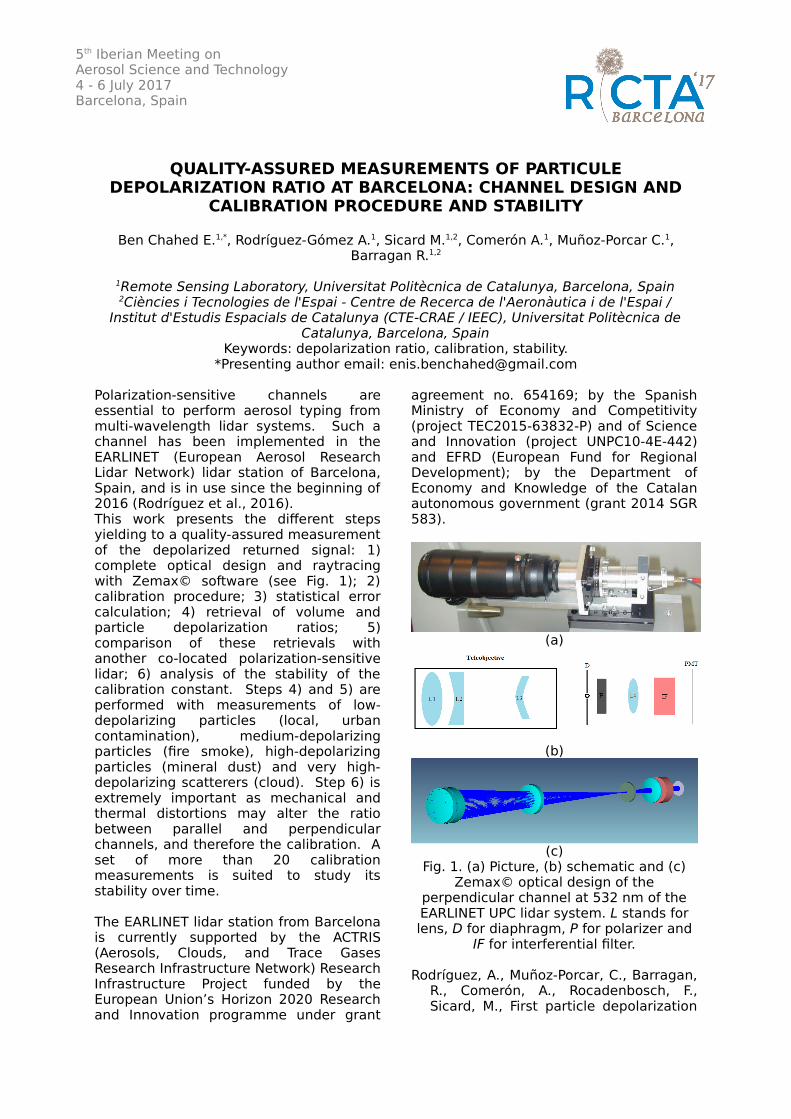
Polarization-sensitive channels areessential to perform aerosol typing frommulti-wavelength lidar systems. Such achannel has been implemented in theEARLINET (European Aerosol ResearchLidar Network) lidar station of Barcelona,Spain, and is in use since the beginning of2016 (Rodríguez et al., 2016).This work presents the different stepsyielding to a quality-assured measurementof the depolarized returned signal: 1)complete optical design and raytracingwith Zemax© software (see Fig. 1); 2)calibration procedure; 3) statistical errorcalculation; 4) retrieval of volume andparticle depolarization ratios; 5)comparison of these retrievals withanother co-located polarization-sensitivelidar; 6) analysis of the stability of thecalibration constant. Steps 4) and 5) areperformed with measurements of low-depolarizing particles (local, urbancontamination), medium-depolarizingparticles (fire smoke), high-depolarizingparticles (mineral dust) and very high-depolarizing scatterers (cloud). Step 6) isextremely important as mechanical andthermal distortions may alter the ratiobetween parallel and perpendicularchannels, and therefore the calibration. Aset of more than 20 calibrationmeasurements is suited to study itsstability over time.
The EARLINET lidar station from Barcelonais currently supported by the ACTRIS(Aerosols, Clouds, and Trace GasesResearch Infrastructure Network) ResearchInfrastructure Project funded by theEuropean Union’s Horizon 2020 Researchand Innovation programme under grant
agreement no. 654169; by the SpanishMinistry of Economy and Competitivity(project TEC2015-63832-P) and of Scienceand Innovation (project UNPC10-4E-442)and EFRD (European Fund for RegionalDevelopment); by the Department ofEconomy and Knowledge of the Catalanautonomous government (grant 2014 SGR583).
(a)
(b)
(c)Fig. 1. (a) Picture, (b) schematic and (c)
Zemax© optical design of theperpendicular channel at 532 nm of theEARLINET UPC lidar system. L stands forlens, D for diaphragm, P for polarizer and
IF for interferential filter.
Rodríguez, A., Muñoz-Porcar, C., Barragan,R., Comerón, A., Rocadenbosch, F.,Sicard, M., First particle depolarization

5th Iberian Meeting on Aerosol Science and Technology4 - 6 July 2017Barcelona, Spain
ratio measurements at the Barcelona(Spain) EARLINET/ACTRIS station:developments, implementation andfirst results, in Book of Abstracts of the
4th Iberian Meeting on Aerosol Scienceand Technology (RICTA), pp. 27, Aveiro(Portugal) , 29 June – 1 July 2016.
5th Iberian Meeting on Aerosol Science and Technology 4 - 6 July 2017 Barcelona, Spain
PARTICULATE AND GASEOUS EMISSIONS FROM PRESCRIBED FIRES IN A PROTECTED NATURAL AREA
Blanco-Alegre C.1, Calvo A.I.1, Castro A.1, Oduber F.1, Alves C.2, Coz E.3, Nunes T.2, Valbuena L.4,
Cárdenas R.M.4, Castedo F.4, Fraile R.1
1 Department of Physics, IMARENAB University of León, 24071 León, Spain
2 Centre for Environmental and Marine Studies (CESAM), Department of Environment and Planning, University of Aveiro, Aveiro, 3810-193, Portugal
3Centre for Energy, Environment and Technology Research (CIEMAT), Department of the Environment, Madrid, Spain
4 Department of Biodiversity and Environmental Management, Area of Ecology, University of León, 24071 León, Spain
Keywords: aerosol characterization, combustion gases, prescribed fire, shrub. *[email protected]
In Europe, forest fires have increased in number and surface over the last 50 years and the Mediterranean area is specially affected. Shrub fires produce large amounts of atmospheric carbonaceous material and greenhouse gases greatly affecting air quality and climate (Jacobson, 2001). In particular, elemental carbon (EC) is an important absorber of solar radiation playing an important role in global warming. On the other hand, organic carbon (OC) primarily scatters solar radiation opposing the heating effect of EC (Penner et al., 1998). Six prescribed fires have been carried out on two types of shrub species in order to characterize the emission (particulate and gases) from the combustion process. The fires have been carried out in La Cueta, León (NW Spain), within a protected natural area (“Valle de San Emiliano”) on October, 3rd and 4th, 2016. Several sampling instruments were used: i) a low volume Echo PM of TECORA to collect PM2.5 onto quartz filter; ii) a Gent stacked filter unit sampler to collect PM10 onto polycarbonate filters (0.2 µm pore size); iii) a thermocouple network to register the temperature evolution of the fires; iv) TEDLAR bags for smoke sampling; v) CO and CO2 Combo IAQ Meter. Two different species were burned: Calluna vulgaris and Genista scorpius. The air measuring equipment was placed about 10 meters upwind from the fire.
Four quartz filters have been sampled during Genista scorpius burning and two during Calluna vulgaris fire. Besides, four and one polycarbonate filters have been sampled during Genista scorpius and Calluna vulgaris, respectively. Subsequently the quartz filters have been analyzed by the thermo-optical method for EC and OC
determination. Furthermore, the concentration of the main ions present in the filters has been obtained through ion chromatography. Major organic components in the smoke samples have also been obtained. Finally, polycarbonate filters have been analyzed by Scanning Electron Microscopy (SEM) in order to obtain an individual particle morphology characterization and to estimate the aerosol size distribution. This study can acquire noteworthy implications not only for the air quality itself, but also for the ecological aspects of the environment due to the recent finding about the narrow relation between the smoke produced in shrub fires and the seeds germination processes after the fire (Bargmann et al., 2014). Besides, this work is the result of a field campaign, not a laboratory study, with real, not simulated, conditions. This work was partially supported by the Spanish Ministry of Economy and Competitiveness (Grants TEC2014-57821-R, BES-2015-074473 -F. Oduber- and CGL2014-52556-R, AERORAIN co-financed with FEDER funds), the University of León (Programa Propio 2015/00054/001). Special thanks to the firefighters and the auxiliary people for their kindness and help during the sampling campaign. Bargmann et al., (2014) Life after fire: smoke and ash as
germination cues in ericads, herbs and graminoids of northern heathlands, Appl. Veget. Sci., 17, 670–679.
Jacobson, M.Z., (2001) Strong radiative heating due to the mixing state of black carbon in atmospheric aerosols, Nature, 409 (6821), 695-697.
Penner et al., (1998) Climate forcing by carbonaceous and sulfate aerosols, Clim. Dynamics, 14, 839-881.
5th Iberian Meeting on Aerosol Science and Technology 4 - 6 July 2017 Barcelona, Spain
ON THE POSSIBLE CONNECTION BETWEEN AFRICAN DUST OUTBREAKS AND STRATOSPHERE-TO-TROPOSPHERE EXCHANGE AS MEASURED IN THE IBERIAN PENINSULA
Brattich E.1, Chham E.2, Garcia F.P.2, Orza J.A.G.3*, Casquero-Vera, J.A.4, Lyamani, H.4, Tositti L.1, Ferro M.A.2,
Camacho A.5, Hernández-Ceballos M.A.6, Martiny N.7, Alados-Arboledas, L.4, Olmo, F.J.4
1 Environmental Chemistry and Radioactivity Laboratory, Department of Chemistry “G. Ciamician”, Alma Mater Studiorum University of Bologna, Bologna, Italy
2 Laboratorio de Radioquímica y Radiología Ambiental, Departamento de Química Inorgánica, Universidad de Granada, Granada, Spain
3 SCOLAb, Física Aplicada, Universidad Miguel Hernández, Elche, Spain 4 Andalusian Institute for Earth System Research, IISTA-CEAMA, University of Granada, Junta de Andalucía, and
Department of Applied Physics, University of Granada Granada, Spain 5 INTE, Universitat Politècnica de Catalunya, Barcelona, Spain
6 European Commission, JRC, Knowledge for Nuclear Safety, Security & Safeguards Unit, REM&EPR, Ispra, Italy 7 Centre de Recherches de Climatologie, CNRS/Université de Bourgogne, Dijon, France
Keywords: radionuclides, African dust outbreak, stratosphere-to-troposphere exchange, lee cyclogenesis. *Presenting author email: [email protected]
The FRESA (“Impacto de las intrusiones de masas de aire con polvo aFRicano y de masas de aire EStratosférico en la Península Ibérica. Influencia de El Atlas”) Spanish national project aims to study the interaction between upper level disturbances and the Atlas Mountains in promoting low-level instability and cyclone formation in the lee of the Atlas Mountains, responsible of dust uplift over the Sahara Desert and also of upper troposphere-lower stratosphere (UT-LS) to troposphere transport. This work presents an overview of the results obtained during a preliminary campaign of the FRESA project (June-October 2016) at Sierra Nevada (Granada) (37.096 N, 3.387 W, 2550 m a.s.l.) analysing weekly samples of 7Be, 210Pb (tracers of UTLS and continental origin, respectively) and PM10, as well as hourly particle number size distribution from a Grimm OPC. 96-hour 3D backward trajectories starting every 6 h (00, 06, 12, and 18Z) were calculated using the HYSPLIT4 model with the meteorological input from the ERA-Interim 0.5 deg meteorological dataset. Moreover, potential vorticity (PV) data was associated to each of the 96 trajectory endpoints by performing a 3D nearest-neighbour interpolation to the 27 isobaric levels between 100 and 1000 hPa of the ERA-Interim reanalysis. During this pre-campaign, 12 Saharan dust and 14 stratospheric intrusions days were identified analysing back-trajectories, BSC-DREAM model, particle number concentrations and synoptic charts: the meteorological situation leading to these outbreaks will be further studied in detail. The analysis of the source-receptor relationship for 7Be, 210Pb and PM10 shows the influence of the Sahara Desert and of air parcels which passed over
the North Sea with strong subsidence and then at lower heights over the western Mediterranean basin on all the three parameters. The analysis also shows that the Atlantic air masses are more associated to 7Be than 210Pb increases. The fine and coarse fractions (smaller and larger than 1 µm in diameter) were analysed on both a weekly and 6-hourly basis. Locations to the south of the Atlas and the western Mediterranean were identified as important sources of the coarse fraction while the origin of the fine fraction was quite similar to that of 7Be, probably because of the attachment of 7Be nuclide to accumulation-mode aerosols soon after its production. The comparison between 7Be/210Pb potential sources with those of high PV crossing shows that the Atlas is connected both to events of high PV values and to a strong PSCF probability of the 7Be/210Pb ratio. This result suggests that the high PV areas located around the Atlas Mountains are not linked to friction and turbulence over the mountains themselves, but are rather associated to tropopause crossing and Stratosphere-Troposphere-Exchange (STE) occurring in the leeward side of mountain ranges, in agreement with the recent work of Brattich et al. (submitted). This work was supported by the Spanish MINECO under grant CGL2015-70741-R (FRESA). Brattich et al. (submitted to JGR), Influence of
stratospheric air masses on radiotracers and ozone over the central Mediterranean.
5th
Iberian Meeting on Aerosol Science and Technology 4 - 6 July 2017 Barcelona, Spain
AEROSOL OPTICAL PROPERTIES ACCORDING TO THE ORIGIN OF AIR MASS AT A HIGH ALTITUDE LOCATION IN THE MEDITERRANEAN COAST
Caballero S*., Castañer R., Nicolás J.F., Galindo N., Yubero E., Varea C., Pastor C., Crespo J., Gil-Moltó J.
Atmospheric Pollution Laboratory (LCA-UMH), Miguel Hernández University, Elche, Spain
Keywords: Scattering coefficient, High mountain, Saharan dust. *Presenting author email: [email protected]
Between January 2014 and December 2015, measurements of aerosol properties (scattering and backscattering coefficients and Scattering Angströn Exponent-SAE) were performed at Mt. Aitana (38°39´N; 0°16´W; 1558 m a.s.l). The sampling site is on the top of a mountain range located in the province of Alicante
(southeastern Spain) near the coast (16 km). Particle scattering (σsp: 10-171º) and hemispheric backscattering (σbsp: 90-171º) coefficients at three wavelengths (450, 525 and 635 nm) were measured every 5 min with a LED-based integrating Nephelometer (model Aurora 3000, ECOTECH Pty Ltd, Knoxfield, Australia). The statistical parameters obtained of: σsp (λ=525 nm), σbsp, σbsp/σsp and SAE are shown in table 1. Table 1. Statistical parameters of σsp (Mm
-1), σbsp (Mm
-1),
σbsp/σsp and SAE obtained during the study period.
Mean SD* Median Max Min
σsp 30.7 21.3 27.2 142.4 0.7
σbsp 3.9 2.6 3.6 16.4 0.1
σbsp/σsp 0.129 0.047 0.136 0.440 0.004
SAE 1.302 0.688 1.356 3.550 -0.750
*SD: standard deviation.
The average value of σsp was quite similar to those registered at mountain stations located in northeastern Spain, e.g., 25.4 Mm
-1 in Montsec-1570 m a.s.l (Pandolfi
et al., 2014). Nevertheless, this value was higher than those recorded at mountain stations located at higher altitudes because they are most of the time in the free troposphere: 22.3 Mm
-1 in Mt. Cimone-2165 m a.s.l. or
18.9 Mm-1
in Moussala peak-2971 m a.s.l. (Andrews et al., 2011). The mean value of the SAE, 1.302, indicating that, although the scattering was in general determined by submicron particles, there was a certain contribution of coarse particles. This contribution depended on the origin of air masses arriving at the sampling site, although it should be taken into account the permanent presence of coarse mode marine aerosols in the sampling site. The vast majority of remote stations often present SAE mean values higher than 1.5, with a few exceptions, as Izaña station in Canary Island.
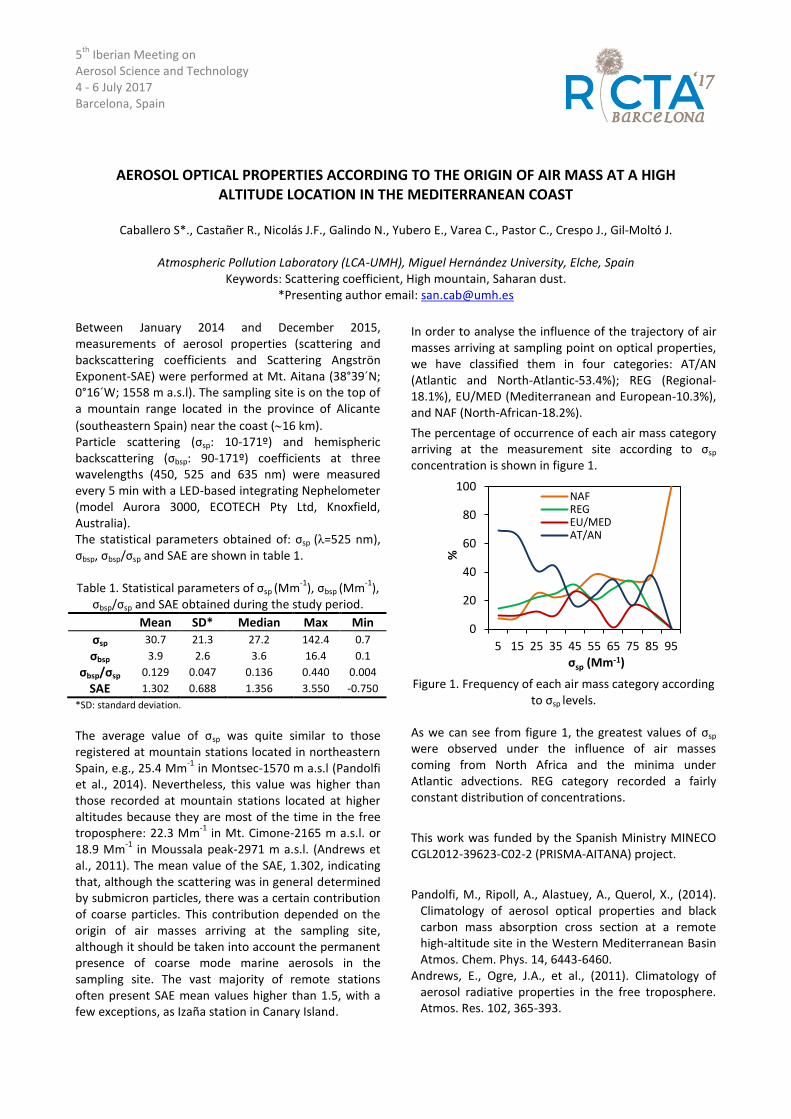
In order to analyse the influence of the trajectory of air masses arriving at sampling point on optical properties, we have classified them in four categories: AT/AN (Atlantic and North-Atlantic-53.4%); REG (Regional-18.1%), EU/MED (Mediterranean and European-10.3%), and NAF (North-African-18.2%).
The percentage of occurrence of each air mass category arriving at the measurement site according to σsp concentration is shown in figure 1.
Figure 1. Frequency of each air mass category according
to σsp levels.
As we can see from figure 1, the greatest values of σsp were observed under the influence of air masses coming from North Africa and the minima under Atlantic advections. REG category recorded a fairly constant distribution of concentrations.
This work was funded by the Spanish Ministry MINECO CGL2012-39623-C02-2 (PRISMA-AITANA) project.
Pandolfi, M., Ripoll, A., Alastuey, A., Querol, X., (2014). Climatology of aerosol optical properties and black carbon mass absorption cross section at a remote high-altitude site in the Western Mediterranean Basin Atmos. Chem. Phys. 14, 6443-6460.
Andrews, E., Ogre, J.A., et al., (2011). Climatology of aerosol radiative properties in the free troposphere. Atmos. Res. 102, 365-393.
0
20
40
60
80
100
5 15 25 35 45 55 65 75 85 95
%
σsp (Mm-1)
NAFREGEU/MEDAT/AN
5th Iberian Meeting on Aerosol Science and Technology 4 - 6 July 2017 Barcelona, Spain
SIMILARITIES AND DISCREPANCIES WHEN SURFACE AND COLUMNAR AEROSOL DATA ARE
JOINTLY ANALYSED IN A BACKGROUND ENVIRONMENT
V.E. Cachorro, D. Mateos, M.A. Burgos, Y.S. Bennouna, C. Toledano, R. González, C. Velasco-Merino, C. Guirado, A. Berjón, A. Calle, A.M. De Frutos
Grupo de Óptica Atmosférica, University of Valladolid, Valladolid, Paseo Belén 7, 47011, Spain
Keywords: surface and columnar aerosols, regional background, atmospheric turbidity, long-term database * Presenting author email: [email protected]
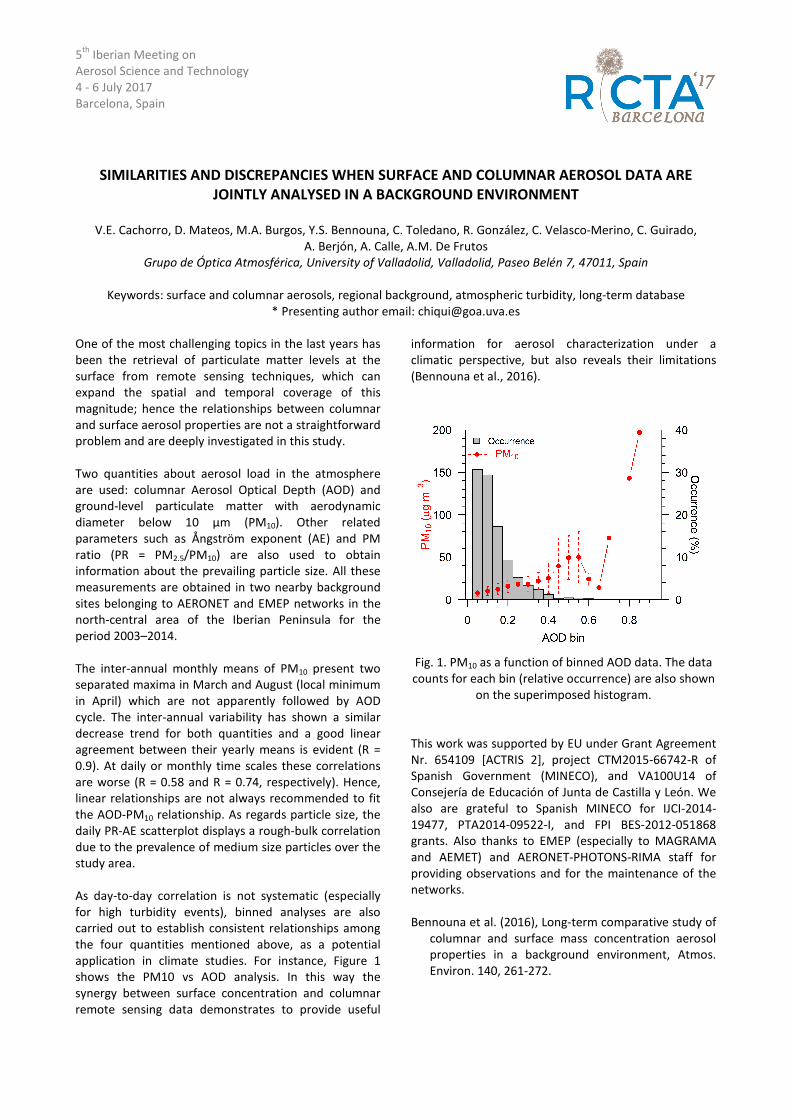
One of the most challenging topics in the last years has been the retrieval of particulate matter levels at the surface from remote sensing techniques, which can expand the spatial and temporal coverage of this magnitude; hence the relationships between columnar and surface aerosol properties are not a straightforward problem and are deeply investigated in this study. Two quantities about aerosol load in the atmosphere are used: columnar Aerosol Optical Depth (AOD) and ground-level particulate matter with aerodynamic diameter below 10 μm (PM10). Other related parameters such as Ångström exponent (AE) and PM ratio (PR = PM2.5/PM10) are also used to obtain information about the prevailing particle size. All these measurements are obtained in two nearby background sites belonging to AERONET and EMEP networks in the north-central area of the Iberian Peninsula for the period 2003–2014. The inter-annual monthly means of PM10 present two separated maxima in March and August (local minimum in April) which are not apparently followed by AOD cycle. The inter-annual variability has shown a similar decrease trend for both quantities and a good linear agreement between their yearly means is evident (R = 0.9). At daily or monthly time scales these correlations are worse (R = 0.58 and R = 0.74, respectively). Hence, linear relationships are not always recommended to fit the AOD-PM10 relationship. As regards particle size, the daily PR-AE scatterplot displays a rough-bulk correlation due to the prevalence of medium size particles over the study area. As day-to-day correlation is not systematic (especially for high turbidity events), binned analyses are also carried out to establish consistent relationships among the four quantities mentioned above, as a potential application in climate studies. For instance, Figure 1 shows the PM10 vs AOD analysis. In this way the synergy between surface concentration and columnar remote sensing data demonstrates to provide useful
information for aerosol characterization under a climatic perspective, but also reveals their limitations (Bennouna et al., 2016).
Fig. 1. PM10 as a function of binned AOD data. The data counts for each bin (relative occurrence) are also shown
on the superimposed histogram.
This work was supported by EU under Grant Agreement Nr. 654109 [ACTRIS 2], project CTM2015-66742-R of Spanish Government (MINECO), and VA100U14 of Consejería de Educación of Junta de Castilla y León. We also are grateful to Spanish MINECO for IJCI-2014-19477, PTA2014-09522-I, and FPI BES-2012-051868 grants. Also thanks to EMEP (especially to MAGRAMA and AEMET) and AERONET-PHOTONS-RIMA staff for providing observations and for the maintenance of the networks. Bennouna et al. (2016), Long-term comparative study of
columnar and surface mass concentration aerosol properties in a background environment, Atmos. Environ. 140, 261-272.
5th
Iberian Meeting on Aerosol Science and Technology 4 - 6 July 2017 Barcelona, Spain
EXPOSURE TO PARTICULATE MATTER DURING SLEEP
Canha N.1,2
*, Lage J.1, Alves C.
2, Almeida S.M.
1
1 Centro de Ciências e Tecnologias Nucleares, Instituto Superior Técnico, Universidade de Lisboa, E.N. 10 ao km
139,7, 2695-066 Bobadela LRS, Portugal 2 Centre for Environmental and Marine Studies (CESAM), Department of Environment, University of Aveiro,
3810-193 Aveiro, Portugal Keywords: particulate matter, sleep, exposure, ultrafines
*Presenting author email: [email protected]
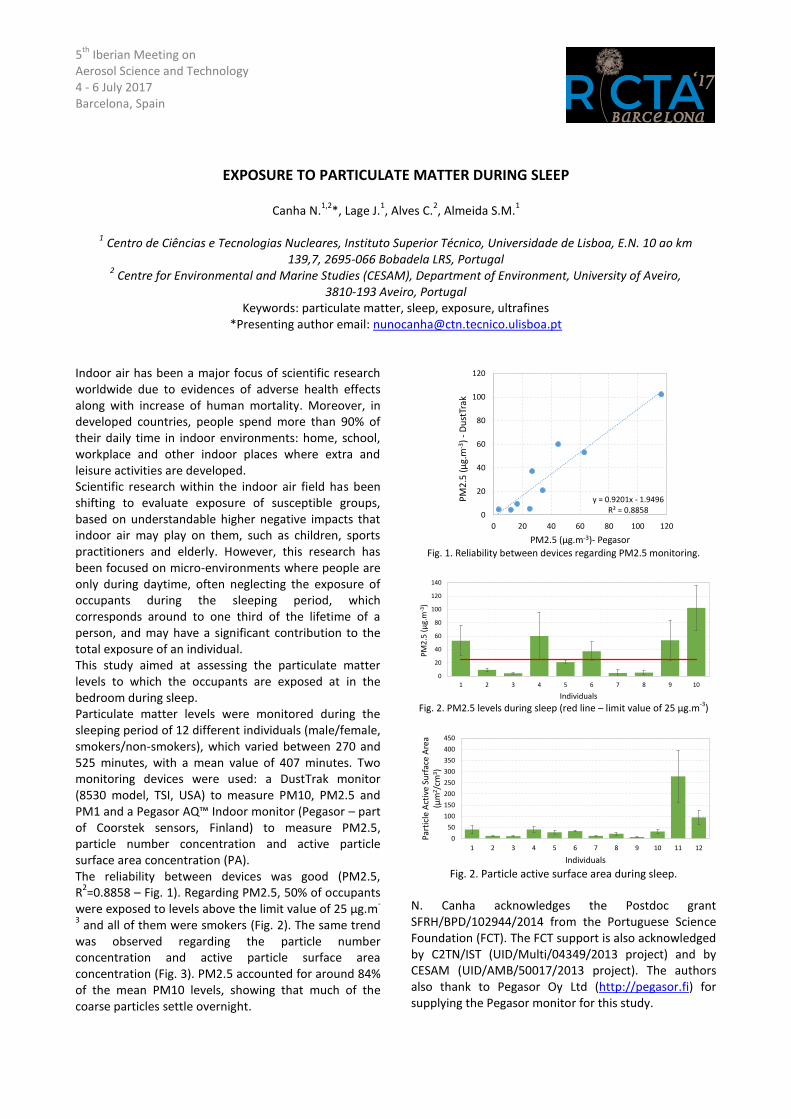
Indoor air has been a major focus of scientific research worldwide due to evidences of adverse health effects along with increase of human mortality. Moreover, in developed countries, people spend more than 90% of their daily time in indoor environments: home, school, workplace and other indoor places where extra and leisure activities are developed. Scientific research within the indoor air field has been shifting to evaluate exposure of susceptible groups, based on understandable higher negative impacts that indoor air may play on them, such as children, sports practitioners and elderly. However, this research has been focused on micro-environments where people are only during daytime, often neglecting the exposure of occupants during the sleeping period, which corresponds around to one third of the lifetime of a person, and may have a significant contribution to the total exposure of an individual. This study aimed at assessing the particulate matter levels to which the occupants are exposed at in the bedroom during sleep. Particulate matter levels were monitored during the sleeping period of 12 different individuals (male/female, smokers/non-smokers), which varied between 270 and 525 minutes, with a mean value of 407 minutes. Two monitoring devices were used: a DustTrak monitor (8530 model, TSI, USA) to measure PM10, PM2.5 and PM1 and a Pegasor AQ™ Indoor monitor (Pegasor – part of Coorstek sensors, Finland) to measure PM2.5, particle number concentration and active particle surface area concentration (PA). The reliability between devices was good (PM2.5, R
2=0.8858 – Fig. 1). Regarding PM2.5, 50% of occupants
were exposed to levels above the limit value of 25 µg.m-
3 and all of them were smokers (Fig. 2). The same trend
was observed regarding the particle number concentration and active particle surface area concentration (Fig. 3). PM2.5 accounted for around 84% of the mean PM10 levels, showing that much of the coarse particles settle overnight.
Fig. 1. Reliability between devices regarding PM2.5 monitoring.
Fig. 2. PM2.5 levels during sleep (red line – limit value of 25 µg.m-3)
Fig. 2. Particle active surface area during sleep.
N. Canha acknowledges the Postdoc grant SFRH/BPD/102944/2014 from the Portuguese Science Foundation (FCT). The FCT support is also acknowledged by C2TN/IST (UID/Multi/04349/2013 project) and by CESAM (UID/AMB/50017/2013 project). The authors also thank to Pegasor Oy Ltd (http://pegasor.fi) for supplying the Pegasor monitor for this study.
y = 0.9201x - 1.9496R² = 0.8858
0
20
40
60
80
100
120
0 20 40 60 80 100 120
PM
2.5
(µ
g.m
-3)
-D
ust
Trak
PM2.5 (µg.m-3)- Pegasor
0
20
40
60
80
100
120
140
1 2 3 4 5 6 7 8 9 10
PM
2.5
(µ
g.m
-3)
Individuals
0
50
100
150
200
250
300
350
400
450
1 2 3 4 5 6 7 8 9 10 11 12
Part
icle
Act
ive
Surf
ace
Are
a (µ
m2/c
m3)
Individuals
5th
Iberian Meeting on
Aerosol Science and Technology
4 - 6 July 2017
Barcelona, Spain
TWO YEARS OF ATMOSPHERIC MERCURY CONCENTRATIONS (Hgg and Hgp) NEAR A
CLINKER PLANT USING RESIDUES DERIVED COMBUSTIBLES.
A. Carratalá
1, F.A. Santos
1, F. Tellez
1 and M. Santacatalina
2
1Department of Chemical Engineering, University of Alicante, P.O. Box 99, 03080 Alicante, Spain
2University Institute of Engineering of Chemical Processes., University of Alicante, P.O. Box 99, 03080 Alicante,
Spain
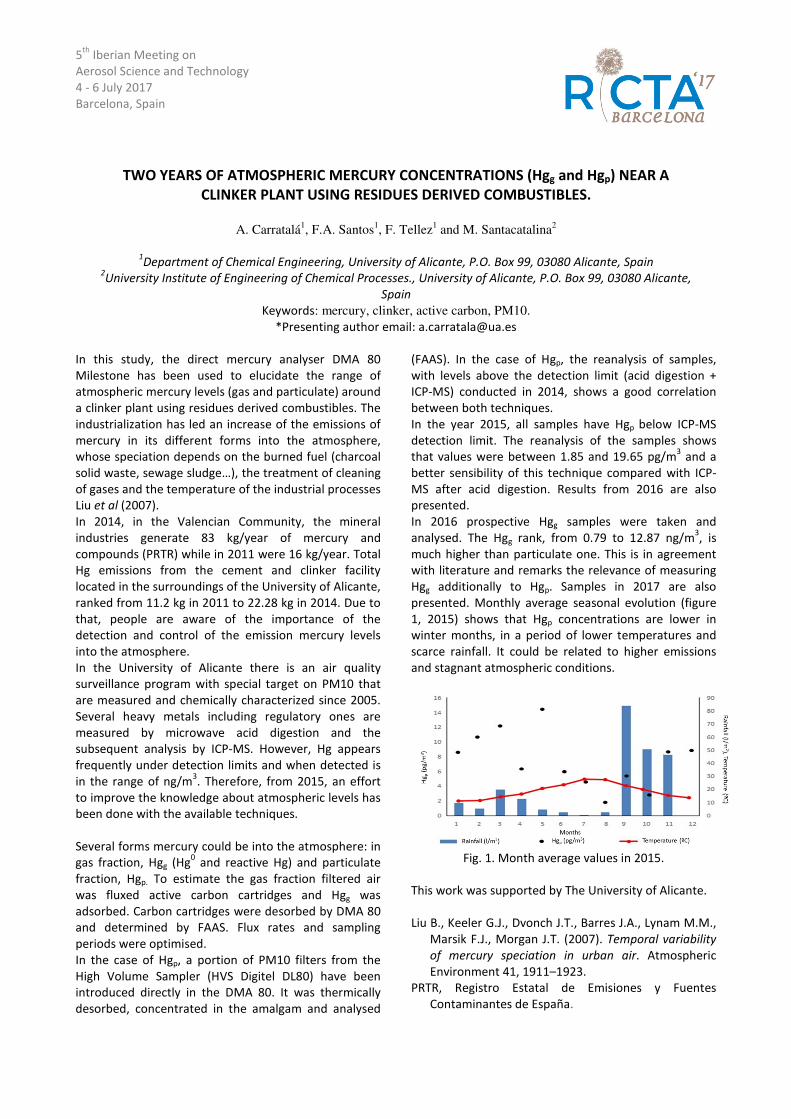
Keywords: mercury, clinker, active carbon, PM10.
*Presenting author email: [email protected]
In this study, the direct mercury analyser DMA 80
Milestone has been used to elucidate the range of
atmospheric mercury levels (gas and particulate) around
a clinker plant using residues derived combustibles. The
industrialization has led an increase of the emissions of
mercury in its different forms into the atmosphere,
whose speciation depends on the burned fuel (charcoal
solid waste, sewage sludge…), the treatment of cleaning
of gases and the temperature of the industrial processes
Liu et al (2007).
In 2014, in the Valencian Community, the mineral
industries generate 83 kg/year of mercury and
compounds (PRTR) while in 2011 were 16 kg/year. Total
Hg emissions from the cement and clinker facility
located in the surroundings of the University of Alicante,
ranked from 11.2 kg in 2011 to 22.28 kg in 2014. Due to
that, people are aware of the importance of the
detection and control of the emission mercury levels
into the atmosphere.
In the University of Alicante there is an air quality
surveillance program with special target on PM10 that
are measured and chemically characterized since 2005.
Several heavy metals including regulatory ones are
measured by microwave acid digestion and the
subsequent analysis by ICP-MS. However, Hg appears
frequently under detection limits and when detected is
in the range of ng/m3. Therefore, from 2015, an effort
to improve the knowledge about atmospheric levels has
been done with the available techniques.
Several forms mercury could be into the atmosphere: in
gas fraction, Hgg (Hg0 and reactive Hg) and particulate
fraction, Hgp. To estimate the gas fraction filtered air
was fluxed active carbon cartridges and Hgg was
adsorbed. Carbon cartridges were desorbed by DMA 80
and determined by FAAS. Flux rates and sampling
periods were optimised.
In the case of Hgp, a portion of PM10 filters from the
High Volume Sampler (HVS Digitel DL80) have been
introduced directly in the DMA 80. It was thermically
desorbed, concentrated in the amalgam and analysed
(FAAS). In the case of Hgp, the reanalysis of samples,
with levels above the detection limit (acid digestion +
ICP-MS) conducted in 2014, shows a good correlation
between both techniques.
In the year 2015, all samples have Hgp below ICP-MS
detection limit. The reanalysis of the samples shows
that values were between 1.85 and 19.65 pg/m3 and a
better sensibility of this technique compared with ICP-
MS after acid digestion. Results from 2016 are also
presented.
In 2016 prospective Hgg samples were taken and
analysed. The Hgg rank, from 0.79 to 12.87 ng/m3, is
much higher than particulate one. This is in agreement
with literature and remarks the relevance of measuring
Hgg additionally to Hgp. Samples in 2017 are also
presented. Monthly average seasonal evolution (figure
1, 2015) shows that Hgp concentrations are lower in
winter months, in a period of lower temperatures and
scarce rainfall. It could be related to higher emissions
and stagnant atmospheric conditions.
Fig. 1. Month average values in 2015.
This work was supported by The University of Alicante.
Liu B., Keeler G.J., Dvonch J.T., Barres J.A., Lynam M.M.,
Marsik F.J., Morgan J.T. (2007). Temporal variability
of mercury speciation in urban air. Atmospheric
Environment 41, 1911–1923.
PRTR, Registro Estatal de Emisiones y Fuentes
Contaminantes de España.
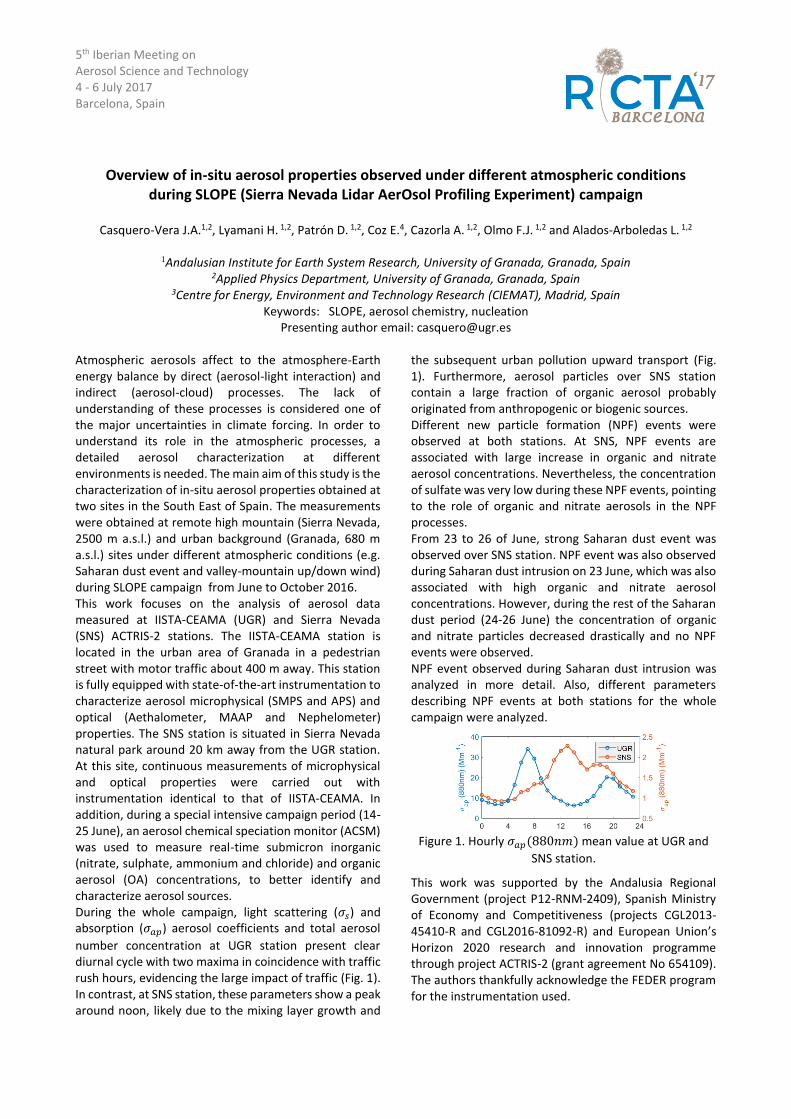
5th Iberian Meeting on Aerosol Science and Technology 4 - 6 July 2017 Barcelona, Spain
Overview of in-situ aerosol properties observed under different atmospheric conditions during SLOPE (Sierra Nevada Lidar AerOsol Profiling Experiment) campaign
Casquero-Vera J.A.1,2, Lyamani H. 1,2, Patrón D. 1,2, Coz E.4, Cazorla A. 1,2, Olmo F.J. 1,2 and Alados-Arboledas L. 1,2
1Andalusian Institute for Earth System Research, University of Granada, Granada, Spain
2Applied Physics Department, University of Granada, Granada, Spain 3Centre for Energy, Environment and Technology Research (CIEMAT), Madrid, Spain
Keywords: SLOPE, aerosol chemistry, nucleation Presenting author email: [email protected]
Atmospheric aerosols affect to the atmosphere-Earth energy balance by direct (aerosol-light interaction) and indirect (aerosol-cloud) processes. The lack of understanding of these processes is considered one of the major uncertainties in climate forcing. In order to understand its role in the atmospheric processes, a detailed aerosol characterization at different environments is needed. The main aim of this study is the characterization of in-situ aerosol properties obtained at two sites in the South East of Spain. The measurements were obtained at remote high mountain (Sierra Nevada, 2500 m a.s.l.) and urban background (Granada, 680 m a.s.l.) sites under different atmospheric conditions (e.g. Saharan dust event and valley-mountain up/down wind) during SLOPE campaign from June to October 2016. This work focuses on the analysis of aerosol data measured at IISTA-CEAMA (UGR) and Sierra Nevada (SNS) ACTRIS-2 stations. The IISTA-CEAMA station is located in the urban area of Granada in a pedestrian street with motor traffic about 400 m away. This station is fully equipped with state-of-the-art instrumentation to characterize aerosol microphysical (SMPS and APS) and optical (Aethalometer, MAAP and Nephelometer) properties. The SNS station is situated in Sierra Nevada natural park around 20 km away from the UGR station. At this site, continuous measurements of microphysical and optical properties were carried out with instrumentation identical to that of IISTA-CEAMA. In addition, during a special intensive campaign period (14-25 June), an aerosol chemical speciation monitor (ACSM) was used to measure real-time submicron inorganic (nitrate, sulphate, ammonium and chloride) and organic aerosol (OA) concentrations, to better identify and characterize aerosol sources. During the whole campaign, light scattering (𝜎𝑠) and absorption (𝜎𝑎𝑝) aerosol coefficients and total aerosol
number concentration at UGR station present clear diurnal cycle with two maxima in coincidence with traffic rush hours, evidencing the large impact of traffic (Fig. 1). In contrast, at SNS station, these parameters show a peak around noon, likely due to the mixing layer growth and
the subsequent urban pollution upward transport (Fig. 1). Furthermore, aerosol particles over SNS station contain a large fraction of organic aerosol probably originated from anthropogenic or biogenic sources. Different new particle formation (NPF) events were observed at both stations. At SNS, NPF events are associated with large increase in organic and nitrate aerosol concentrations. Nevertheless, the concentration of sulfate was very low during these NPF events, pointing to the role of organic and nitrate aerosols in the NPF processes. From 23 to 26 of June, strong Saharan dust event was observed over SNS station. NPF event was also observed during Saharan dust intrusion on 23 June, which was also associated with high organic and nitrate aerosol concentrations. However, during the rest of the Saharan dust period (24-26 June) the concentration of organic and nitrate particles decreased drastically and no NPF events were observed. NPF event observed during Saharan dust intrusion was analyzed in more detail. Also, different parameters describing NPF events at both stations for the whole campaign were analyzed.
Figure 1. Hourly 𝜎𝑎𝑝(880𝑛𝑚) mean value at UGR and
SNS station.
This work was supported by the Andalusia Regional Government (project P12-RNM-2409), Spanish Ministry of Economy and Competitiveness (projects CGL2013-45410-R and CGL2016-81092-R) and European Union’s Horizon 2020 research and innovation programme through project ACTRIS-2 (grant agreement No 654109). The authors thankfully acknowledge the FEDER program for the instrumentation used.
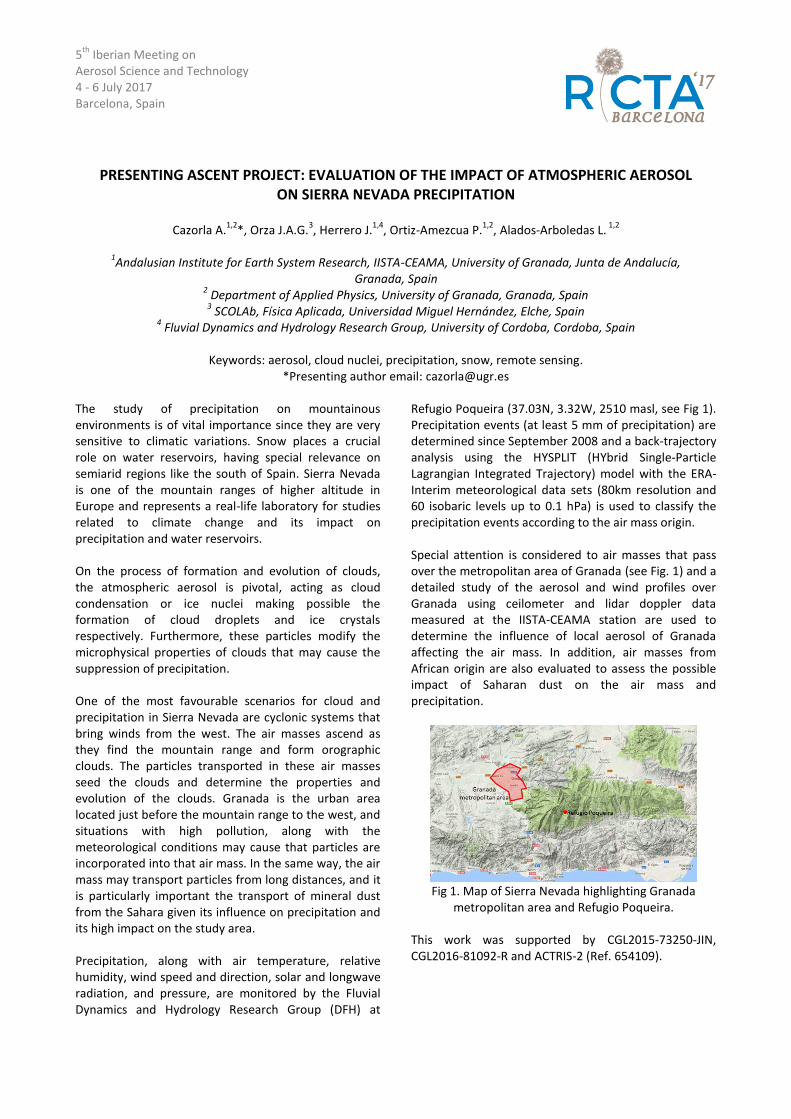
5th
Iberian Meeting on Aerosol Science and Technology 4 - 6 July 2017 Barcelona, Spain
PRESENTING ASCENT PROJECT: EVALUATION OF THE IMPACT OF ATMOSPHERIC AEROSOL ON SIERRA NEVADA PRECIPITATION
Cazorla A.
1,2*, Orza J.A.G.
3, Herrero J.
1,4, Ortiz-Amezcua P.
1,2, Alados-Arboledas L.
1,2
1Andalusian Institute for Earth System Research, IISTA-CEAMA, University of Granada, Junta de Andalucía,
Granada, Spain 2 Department of Applied Physics, University of Granada, Granada, Spain 3 SCOLAb, Física Aplicada, Universidad Miguel Hernández, Elche, Spain
4 Fluvial Dynamics and Hydrology Research Group, University of Cordoba, Cordoba, Spain
Keywords: aerosol, cloud nuclei, precipitation, snow, remote sensing.
*Presenting author email: [email protected]
The study of precipitation on mountainous environments is of vital importance since they are very sensitive to climatic variations. Snow places a crucial role on water reservoirs, having special relevance on semiarid regions like the south of Spain. Sierra Nevada is one of the mountain ranges of higher altitude in Europe and represents a real-life laboratory for studies related to climate change and its impact on precipitation and water reservoirs. On the process of formation and evolution of clouds, the atmospheric aerosol is pivotal, acting as cloud condensation or ice nuclei making possible the formation of cloud droplets and ice crystals respectively. Furthermore, these particles modify the microphysical properties of clouds that may cause the suppression of precipitation. One of the most favourable scenarios for cloud and precipitation in Sierra Nevada are cyclonic systems that bring winds from the west. The air masses ascend as they find the mountain range and form orographic clouds. The particles transported in these air masses seed the clouds and determine the properties and evolution of the clouds. Granada is the urban area located just before the mountain range to the west, and situations with high pollution, along with the meteorological conditions may cause that particles are incorporated into that air mass. In the same way, the air mass may transport particles from long distances, and it is particularly important the transport of mineral dust from the Sahara given its influence on precipitation and its high impact on the study area. Precipitation, along with air temperature, relative humidity, wind speed and direction, solar and longwave radiation, and pressure, are monitored by the Fluvial Dynamics and Hydrology Research Group (DFH) at
Refugio Poqueira (37.03N, 3.32W, 2510 masl, see Fig 1). Precipitation events (at least 5 mm of precipitation) are determined since September 2008 and a back-trajectory analysis using the HYSPLIT (HYbrid Single-Particle Lagrangian Integrated Trajectory) model with the ERA-Interim meteorological data sets (80km resolution and 60 isobaric levels up to 0.1 hPa) is used to classify the precipitation events according to the air mass origin. Special attention is considered to air masses that pass over the metropolitan area of Granada (see Fig. 1) and a detailed study of the aerosol and wind profiles over Granada using ceilometer and lidar doppler data measured at the IISTA-CEAMA station are used to determine the influence of local aerosol of Granada affecting the air mass. In addition, air masses from African origin are also evaluated to assess the possible impact of Saharan dust on the air mass and precipitation.
Fig 1. Map of Sierra Nevada highlighting Granada
metropolitan area and Refugio Poqueira. This work was supported by CGL2015-73250-JIN, CGL2016-81092-R and ACTRIS-2 (Ref. 654109).
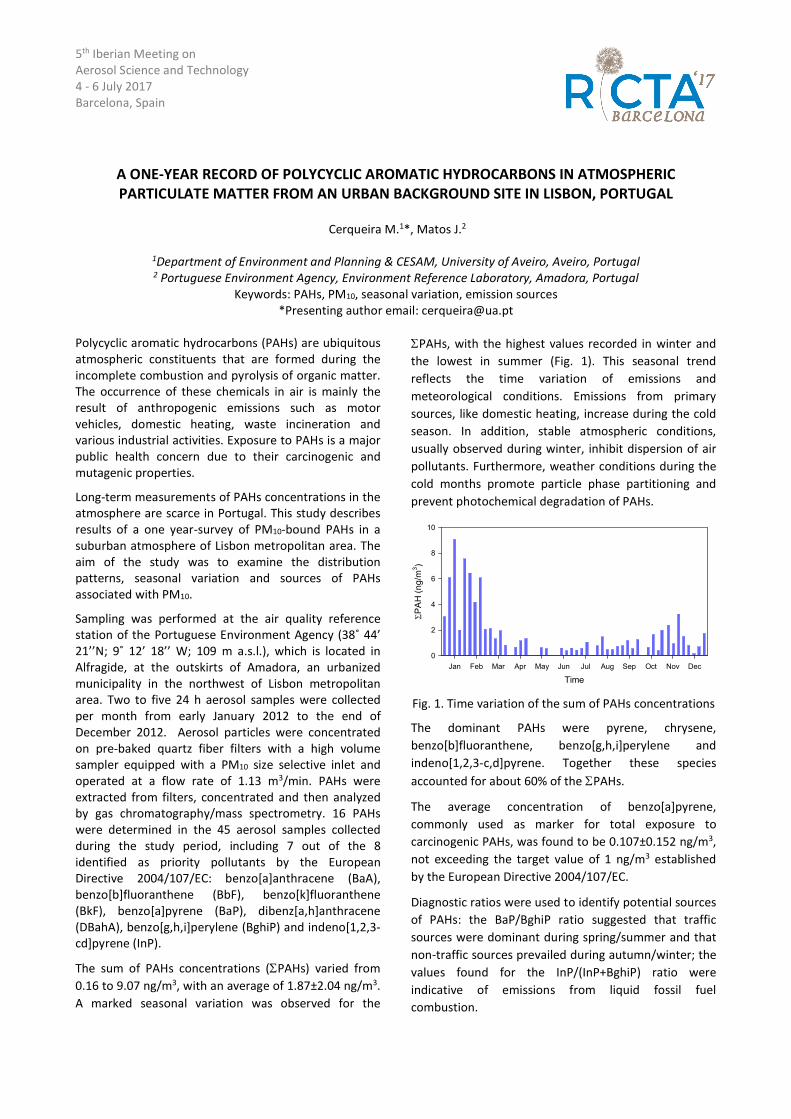
5th Iberian Meeting on Aerosol Science and Technology 4 - 6 July 2017 Barcelona, Spain
A ONE-YEAR RECORD OF POLYCYCLIC AROMATIC HYDROCARBONS IN ATMOSPHERIC PARTICULATE MATTER FROM AN URBAN BACKGROUND SITE IN LISBON, PORTUGAL
Cerqueira M.1*, Matos J.2
1Department of Environment and Planning & CESAM, University of Aveiro, Aveiro, Portugal 2 Portuguese Environment Agency, Environment Reference Laboratory, Amadora, Portugal
Keywords: PAHs, PM10, seasonal variation, emission sources *Presenting author email: [email protected]
Polycyclic aromatic hydrocarbons (PAHs) are ubiquitous atmospheric constituents that are formed during the incomplete combustion and pyrolysis of organic matter. The occurrence of these chemicals in air is mainly the result of anthropogenic emissions such as motor vehicles, domestic heating, waste incineration and various industrial activities. Exposure to PAHs is a major public health concern due to their carcinogenic and mutagenic properties.
Long-term measurements of PAHs concentrations in the atmosphere are scarce in Portugal. This study describes results of a one year-survey of PM10-bound PAHs in a suburban atmosphere of Lisbon metropolitan area. The aim of the study was to examine the distribution patterns, seasonal variation and sources of PAHs associated with PM10.
Sampling was performed at the air quality reference station of the Portuguese Environment Agency (38˚ 44’ 21’’N; 9˚ 12’ 18’’ W; 109 m a.s.l.), which is located in Alfragide, at the outskirts of Amadora, an urbanized municipality in the northwest of Lisbon metropolitan area. Two to five 24 h aerosol samples were collected per month from early January 2012 to the end of December 2012. Aerosol particles were concentrated on pre-baked quartz fiber filters with a high volume sampler equipped with a PM10 size selective inlet and operated at a flow rate of 1.13 m3/min. PAHs were extracted from filters, concentrated and then analyzed by gas chromatography/mass spectrometry. 16 PAHs were determined in the 45 aerosol samples collected during the study period, including 7 out of the 8 identified as priority pollutants by the European Directive 2004/107/EC: benzo[a]anthracene (BaA), benzo[b]fluoranthene (BbF), benzo[k]fluoranthene (BkF), benzo[a]pyrene (BaP), dibenz[a,h]anthracene (DBahA), benzo[g,h,i]perylene (BghiP) and indeno[1,2,3-cd]pyrene (InP).
The sum of PAHs concentrations (PAHs) varied from 0.16 to 9.07 ng/m3, with an average of 1.87±2.04 ng/m3. A marked seasonal variation was observed for the
PAHs, with the highest values recorded in winter and the lowest in summer (Fig. 1). This seasonal trend reflects the time variation of emissions and meteorological conditions. Emissions from primary sources, like domestic heating, increase during the cold season. In addition, stable atmospheric conditions, usually observed during winter, inhibit dispersion of air pollutants. Furthermore, weather conditions during the cold months promote particle phase partitioning and prevent photochemical degradation of PAHs.
Fig. 1. Time variation of the sum of PAHs concentrations
The dominant PAHs were pyrene, chrysene, benzo[b]fluoranthene, benzo[g,h,i]perylene and indeno[1,2,3-c,d]pyrene. Together these species accounted for about 60% of the PAHs.
The average concentration of benzo[a]pyrene, commonly used as marker for total exposure to carcinogenic PAHs, was found to be 0.107±0.152 ng/m3, not exceeding the target value of 1 ng/m3 established by the European Directive 2004/107/EC.
Diagnostic ratios were used to identify potential sources of PAHs: the BaP/BghiP ratio suggested that traffic sources were dominant during spring/summer and that non-traffic sources prevailed during autumn/winter; the values found for the InP/(InP+BghiP) ratio were indicative of emissions from liquid fossil fuel combustion.
Time
Jan Feb Mar Apr May Jun Jul Aug Sep Oct Nov Dec
PA
H (
ng/
m3)
0
2
4
6
8
10
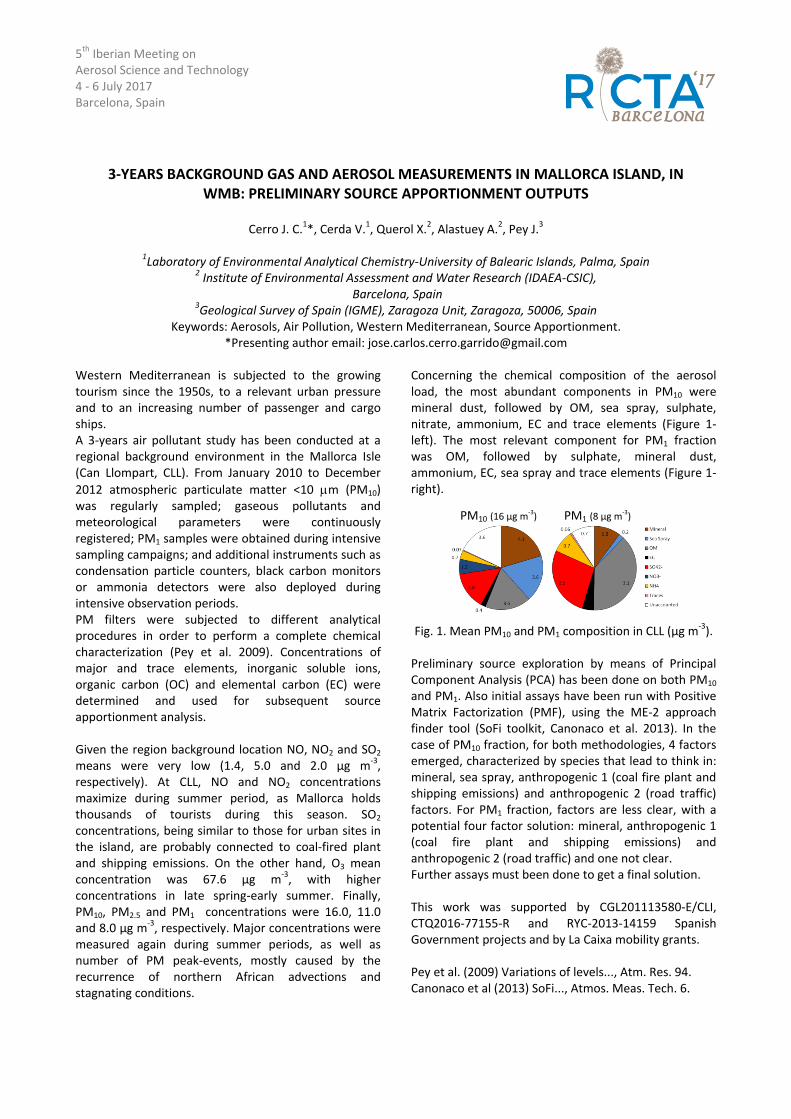
5th Iberian Meeting on Aerosol Science and Technology 4 - 6 July 2017 Barcelona, Spain
3-YEARS BACKGROUND GAS AND AEROSOL MEASUREMENTS IN MALLORCA ISLAND, IN WMB: PRELIMINARY SOURCE APPORTIONMENT OUTPUTS
Cerro J. C.1*, Cerda V.1, Querol X.2, Alastuey A.2, Pey J.3
1Laboratory of Environmental Analytical Chemistry-University of Balearic Islands, Palma, Spain
2 Institute of Environmental Assessment and Water Research (IDAEA-CSIC), Barcelona, Spain
3Geological Survey of Spain (IGME), Zaragoza Unit, Zaragoza, 50006, Spain Keywords: Aerosols, Air Pollution, Western Mediterranean, Source Apportionment.
*Presenting author email: [email protected]
Western Mediterranean is subjected to the growing tourism since the 1950s, to a relevant urban pressure and to an increasing number of passenger and cargo ships. A 3-years air pollutant study has been conducted at a regional background environment in the Mallorca Isle (Can Llompart, CLL). From January 2010 to December
2012 atmospheric particulate matter <10 m (PM10) was regularly sampled; gaseous pollutants and meteorological parameters were continuously registered; PM1 samples were obtained during intensive sampling campaigns; and additional instruments such as condensation particle counters, black carbon monitors or ammonia detectors were also deployed during intensive observation periods. PM filters were subjected to different analytical procedures in order to perform a complete chemical characterization (Pey et al. 2009). Concentrations of major and trace elements, inorganic soluble ions, organic carbon (OC) and elemental carbon (EC) were determined and used for subsequent source apportionment analysis. Given the region background location NO, NO2 and SO2 means were very low (1.4, 5.0 and 2.0 µg m-3, respectively). At CLL, NO and NO2 concentrations maximize during summer period, as Mallorca holds thousands of tourists during this season. SO2 concentrations, being similar to those for urban sites in the island, are probably connected to coal-fired plant and shipping emissions. On the other hand, O3 mean concentration was 67.6 µg m-3, with higher concentrations in late spring-early summer. Finally, PM10, PM2.5 and PM1 concentrations were 16.0, 11.0 and 8.0 µg m-3, respectively. Major concentrations were measured again during summer periods, as well as number of PM peak-events, mostly caused by the recurrence of northern African advections and stagnating conditions.
Concerning the chemical composition of the aerosol load, the most abundant components in PM10 were mineral dust, followed by OM, sea spray, sulphate, nitrate, ammonium, EC and trace elements (Figure 1-left). The most relevant component for PM1 fraction was OM, followed by sulphate, mineral dust, ammonium, EC, sea spray and trace elements (Figure 1-right).
Fig. 1. Mean PM10 and PM1 composition in CLL (µg m-3).
Preliminary source exploration by means of Principal Component Analysis (PCA) has been done on both PM10 and PM1. Also initial assays have been run with Positive Matrix Factorization (PMF), using the ME-2 approach finder tool (SoFi toolkit, Canonaco et al. 2013). In the case of PM10 fraction, for both methodologies, 4 factors emerged, characterized by species that lead to think in: mineral, sea spray, anthropogenic 1 (coal fire plant and shipping emissions) and anthropogenic 2 (road traffic) factors. For PM1 fraction, factors are less clear, with a potential four factor solution: mineral, anthropogenic 1 (coal fire plant and shipping emissions) and anthropogenic 2 (road traffic) and one not clear. Further assays must been done to get a final solution. This work was supported by CGL201113580-E/CLI, CTQ2016-77155-R and RYC-2013-14159 Spanish Government projects and by La Caixa mobility grants. Pey et al. (2009) Variations of levels..., Atm. Res. 94. Canonaco et al (2013) SoFi..., Atmos. Meas. Tech. 6.
PM10 (16 µg m-3
) PM1 (8 µg m-3
)
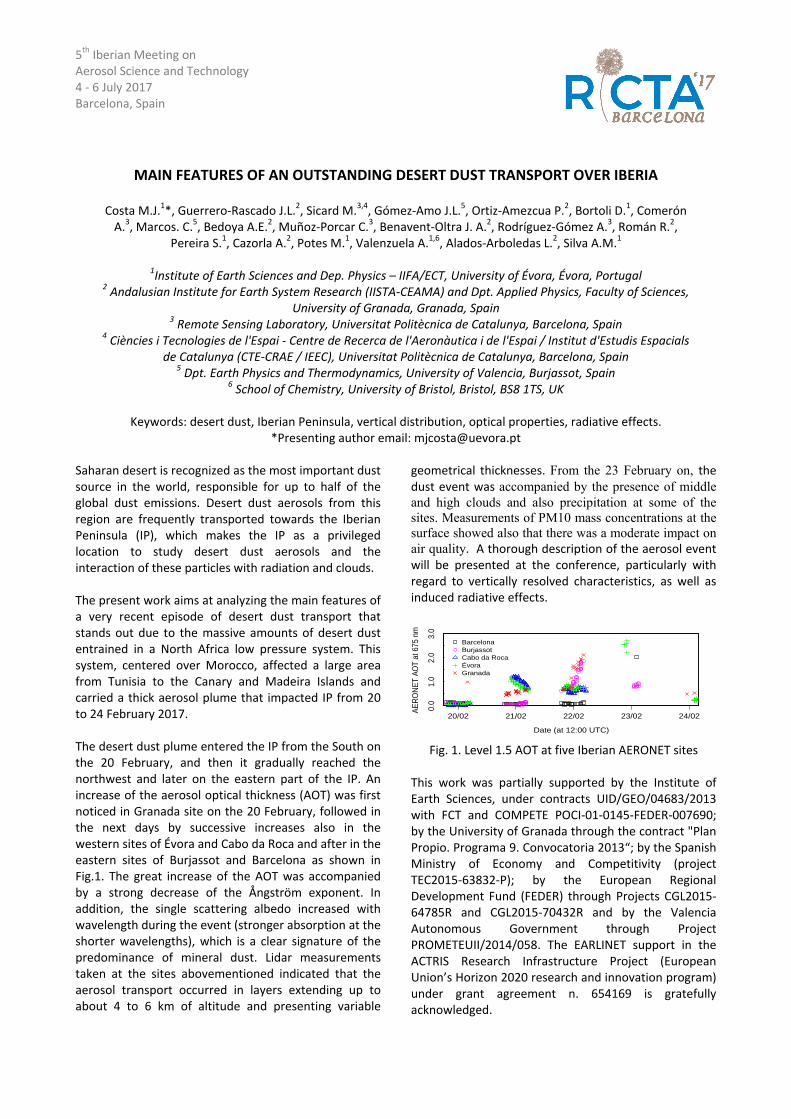
5th Iberian Meeting on Aerosol Science and Technology 4 ‐ 6 July 2017 Barcelona, Spain
MAIN FEATURES OF AN OUTSTANDING DESERT DUST TRANSPORT OVER IBERIA
Costa M.J.1*, Guerrero‐Rascado J.L.2, Sicard M.3,4, Gómez‐Amo J.L.5, Ortiz‐Amezcua P.2, Bortoli D.1, Comerón A.3, Marcos. C.5, Bedoya A.E.2, Muñoz‐Porcar C.3, Benavent‐Oltra J. A.2, Rodríguez‐Gómez A.3, Román R.2,
Pereira S.1, Cazorla A.2, Potes M.1, Valenzuela A.1,6, Alados‐Arboledas L.2, Silva A.M.1
1Institute of Earth Sciences and Dep. Physics – IIFA/ECT, University of Évora, Évora, Portugal 2 Andalusian Institute for Earth System Research (IISTA‐CEAMA) and Dpt. Applied Physics, Faculty of Sciences,
University of Granada, Granada, Spain 3 Remote Sensing Laboratory, Universitat Politècnica de Catalunya, Barcelona, Spain
4 Ciències i Tecnologies de l'Espai ‐ Centre de Recerca de l'Aeronàutica i de l'Espai / Institut d'Estudis Espacials de Catalunya (CTE‐CRAE / IEEC), Universitat Politècnica de Catalunya, Barcelona, Spain
5 Dpt. Earth Physics and Thermodynamics, University of Valencia, Burjassot, Spain 6 School of Chemistry, University of Bristol, Bristol, BS8 1TS, UK
Keywords: desert dust, Iberian Peninsula, vertical distribution, optical properties, radiative effects.
*Presenting author email: [email protected]
Saharan desert is recognized as the most important dust source in the world, responsible for up to half of the global dust emissions. Desert dust aerosols from this region are frequently transported towards the Iberian Peninsula (IP), which makes the IP as a privileged location to study desert dust aerosols and the interaction of these particles with radiation and clouds. The present work aims at analyzing the main features of a very recent episode of desert dust transport that stands out due to the massive amounts of desert dust entrained in a North Africa low pressure system. This system, centered over Morocco, affected a large area from Tunisia to the Canary and Madeira Islands and carried a thick aerosol plume that impacted IP from 20 to 24 February 2017. The desert dust plume entered the IP from the South on the 20 February, and then it gradually reached the northwest and later on the eastern part of the IP. An increase of the aerosol optical thickness (AOT) was first noticed in Granada site on the 20 February, followed in the next days by successive increases also in the western sites of Évora and Cabo da Roca and after in the eastern sites of Burjassot and Barcelona as shown in Fig.1. The great increase of the AOT was accompanied by a strong decrease of the Ångström exponent. In addition, the single scattering albedo increased with wavelength during the event (stronger absorption at the shorter wavelengths), which is a clear signature of the predominance of mineral dust. Lidar measurements taken at the sites abovementioned indicated that the aerosol transport occurred in layers extending up to about 4 to 6 km of altitude and presenting variable
geometrical thicknesses. From the 23 February on, the dust event was accompanied by the presence of middle and high clouds and also precipitation at some of the sites. Measurements of PM10 mass concentrations at the surface showed also that there was a moderate impact on air quality. A thorough description of the aerosol event will be presented at the conference, particularly with regard to vertically resolved characteristics, as well as induced radiative effects.
Fig. 1. Level 1.5 AOT at five Iberian AERONET sites
This work was partially supported by the Institute of Earth Sciences, under contracts UID/GEO/04683/2013 with FCT and COMPETE POCI‐01‐0145‐FEDER‐007690; by the University of Granada through the contract "Plan Propio. Programa 9. Convocatoria 2013“; by the Spanish Ministry of Economy and Competitivity (project TEC2015‐63832‐P); by the European Regional Development Fund (FEDER) through Projects CGL2015‐64785R and CGL2015‐70432R and by the Valencia Autonomous Government through Project PROMETEUII/2014/058. The EARLINET support in the ACTRIS Research Infrastructure Project (European Union’s Horizon 2020 research and innovation program) under grant agreement n. 654169 is gratefully acknowledged.
0.0
1.0
2.0
3.0
Date (at 12:00 UTC)
AE
RO
NE
T AO
T at
675
nm
20/02 21/02 22/02 23/02 24/02
BarcelonaBurjassotCabo da RocaÉvoraGranada
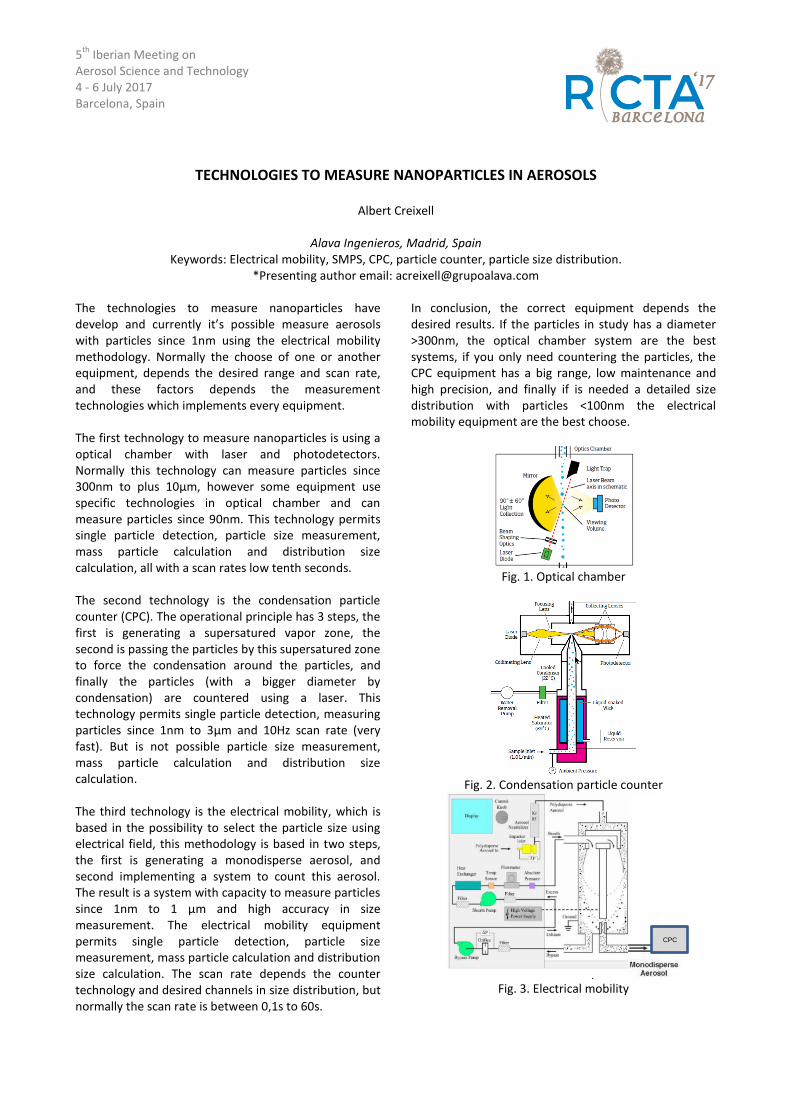
5th
Iberian Meeting on Aerosol Science and Technology 4 - 6 July 2017 Barcelona, Spain
TECHNOLOGIES TO MEASURE NANOPARTICLES IN AEROSOLS
Albert Creixell
Alava Ingenieros, Madrid, Spain Keywords: Electrical mobility, SMPS, CPC, particle counter, particle size distribution.
*Presenting author email: [email protected]
The technologies to measure nanoparticles have develop and currently it’s possible measure aerosols with particles since 1nm using the electrical mobility methodology. Normally the choose of one or another equipment, depends the desired range and scan rate, and these factors depends the measurement technologies which implements every equipment. The first technology to measure nanoparticles is using a optical chamber with laser and photodetectors. Normally this technology can measure particles since 300nm to plus 10µm, however some equipment use specific technologies in optical chamber and can measure particles since 90nm. This technology permits single particle detection, particle size measurement, mass particle calculation and distribution size calculation, all with a scan rates low tenth seconds. The second technology is the condensation particle counter (CPC). The operational principle has 3 steps, the first is generating a supersatured vapor zone, the second is passing the particles by this supersatured zone to force the condensation around the particles, and finally the particles (with a bigger diameter by condensation) are countered using a laser. This technology permits single particle detection, measuring particles since 1nm to 3µm and 10Hz scan rate (very fast). But is not possible particle size measurement, mass particle calculation and distribution size calculation. The third technology is the electrical mobility, which is based in the possibility to select the particle size using electrical field, this methodology is based in two steps, the first is generating a monodisperse aerosol, and second implementing a system to count this aerosol. The result is a system with capacity to measure particles since 1nm to 1 µm and high accuracy in size measurement. The electrical mobility equipment permits single particle detection, particle size measurement, mass particle calculation and distribution size calculation. The scan rate depends the counter technology and desired channels in size distribution, but normally the scan rate is between 0,1s to 60s.
In conclusion, the correct equipment depends the desired results. If the particles in study has a diameter >300nm, the optical chamber system are the best systems, if you only need countering the particles, the CPC equipment has a big range, low maintenance and high precision, and finally if is needed a detailed size distribution with particles <100nm the electrical mobility equipment are the best choose.
Fig. 1. Optical chamber
Fig. 2. Condensation particle counter
Fig. 3. Electrical mobility
CPC
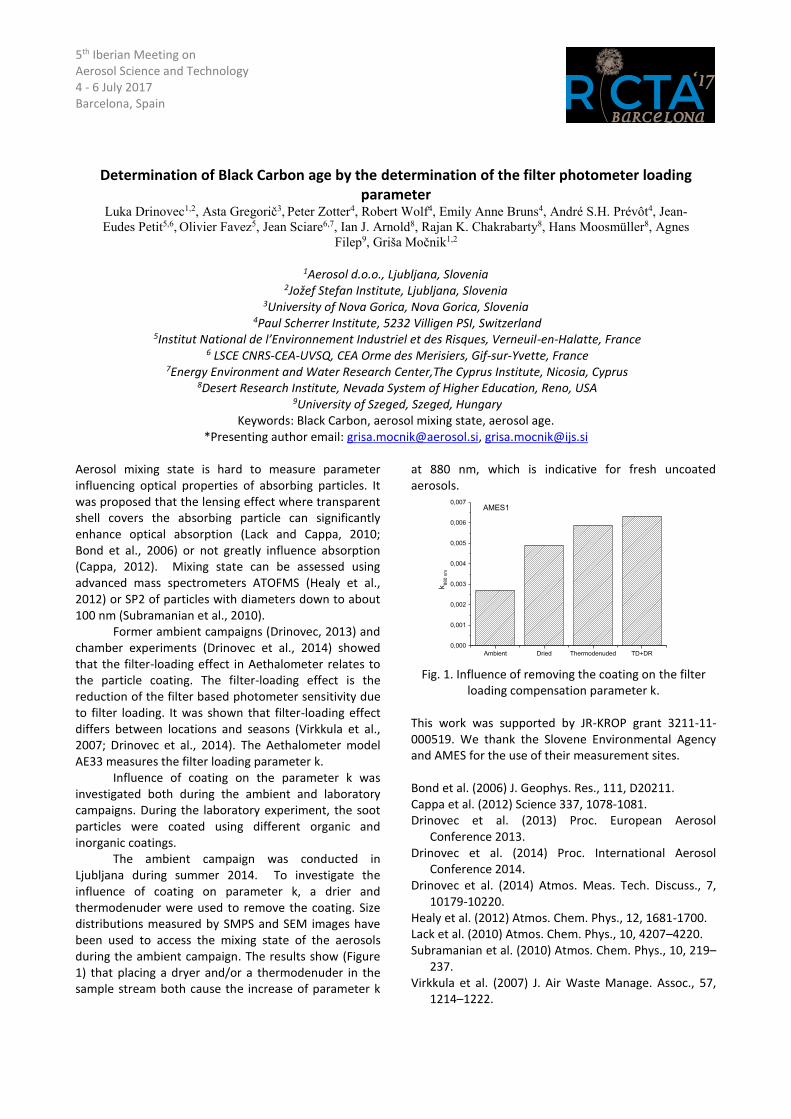
5th Iberian Meeting on Aerosol Science and Technology 4 - 6 July 2017 Barcelona, Spain
Determination of Black Carbon age by the determination of the filter photometer loading parameter
Luka Drinovec1,2, Asta Gregorič3, Peter Zotter4, Robert Wolf4, Emily Anne Bruns4, André S.H. Prévôt4, Jean-
Eudes Petit5,6, Olivier Favez5, Jean Sciare6,7, Ian J. Arnold8, Rajan K. Chakrabarty8, Hans Moosmüller8, Agnes
Filep9, Griša Močnik1,2
1Aerosol d.o.o., Ljubljana, Slovenia 2Jožef Stefan Institute, Ljubljana, Slovenia
3University of Nova Gorica, Nova Gorica, Slovenia 4Paul Scherrer Institute, 5232 Villigen PSI, Switzerland
5Institut National de l’Environnement Industriel et des Risques, Verneuil-en-Halatte, France 6 LSCE CNRS-CEA-UVSQ, CEA Orme des Merisiers, Gif-sur-Yvette, France
7Energy Environment and Water Research Center,The Cyprus Institute, Nicosia, Cyprus 8Desert Research Institute, Nevada System of Higher Education, Reno, USA
9University of Szeged, Szeged, Hungary Keywords: Black Carbon, aerosol mixing state, aerosol age.
*Presenting author email: [email protected], [email protected]
Aerosol mixing state is hard to measure parameter influencing optical properties of absorbing particles. It was proposed that the lensing effect where transparent shell covers the absorbing particle can significantly enhance optical absorption (Lack and Cappa, 2010; Bond et al., 2006) or not greatly influence absorption (Cappa, 2012). Mixing state can be assessed using advanced mass spectrometers ATOFMS (Healy et al., 2012) or SP2 of particles with diameters down to about 100 nm (Subramanian et al., 2010). Former ambient campaigns (Drinovec, 2013) and chamber experiments (Drinovec et al., 2014) showed that the filter-loading effect in Aethalometer relates to the particle coating. The filter-loading effect is the reduction of the filter based photometer sensitivity due to filter loading. It was shown that filter-loading effect differs between locations and seasons (Virkkula et al., 2007; Drinovec et al., 2014). The Aethalometer model AE33 measures the filter loading parameter k. Influence of coating on the parameter k was investigated both during the ambient and laboratory campaigns. During the laboratory experiment, the soot particles were coated using different organic and inorganic coatings. The ambient campaign was conducted in Ljubljana during summer 2014. To investigate the influence of coating on parameter k, a drier and thermodenuder were used to remove the coating. Size distributions measured by SMPS and SEM images have been used to access the mixing state of the aerosols during the ambient campaign. The results show (Figure 1) that placing a dryer and/or a thermodenuder in the sample stream both cause the increase of parameter k
at 880 nm, which is indicative for fresh uncoated aerosols.
Fig. 1. Influence of removing the coating on the filter
loading compensation parameter k.
This work was supported by JR-KROP grant 3211-11-000519. We thank the Slovene Environmental Agency and AMES for the use of their measurement sites. Bond et al. (2006) J. Geophys. Res., 111, D20211. Cappa et al. (2012) Science 337, 1078-1081. Drinovec et al. (2013) Proc. European Aerosol
Conference 2013. Drinovec et al. (2014) Proc. International Aerosol
Conference 2014. Drinovec et al. (2014) Atmos. Meas. Tech. Discuss., 7,
10179-10220. Healy et al. (2012) Atmos. Chem. Phys., 12, 1681-1700. Lack et al. (2010) Atmos. Chem. Phys., 10, 4207–4220. Subramanian et al. (2010) Atmos. Chem. Phys., 10, 219–
237. Virkkula et al. (2007) J. Air Waste Manage. Assoc., 57,
1214–1222.
Ambient Dried Thermodenuded TD+DR
0,000
0,001
0,002
0,003
0,004
0,005
0,006
0,007
k8
80
nm
AMES1
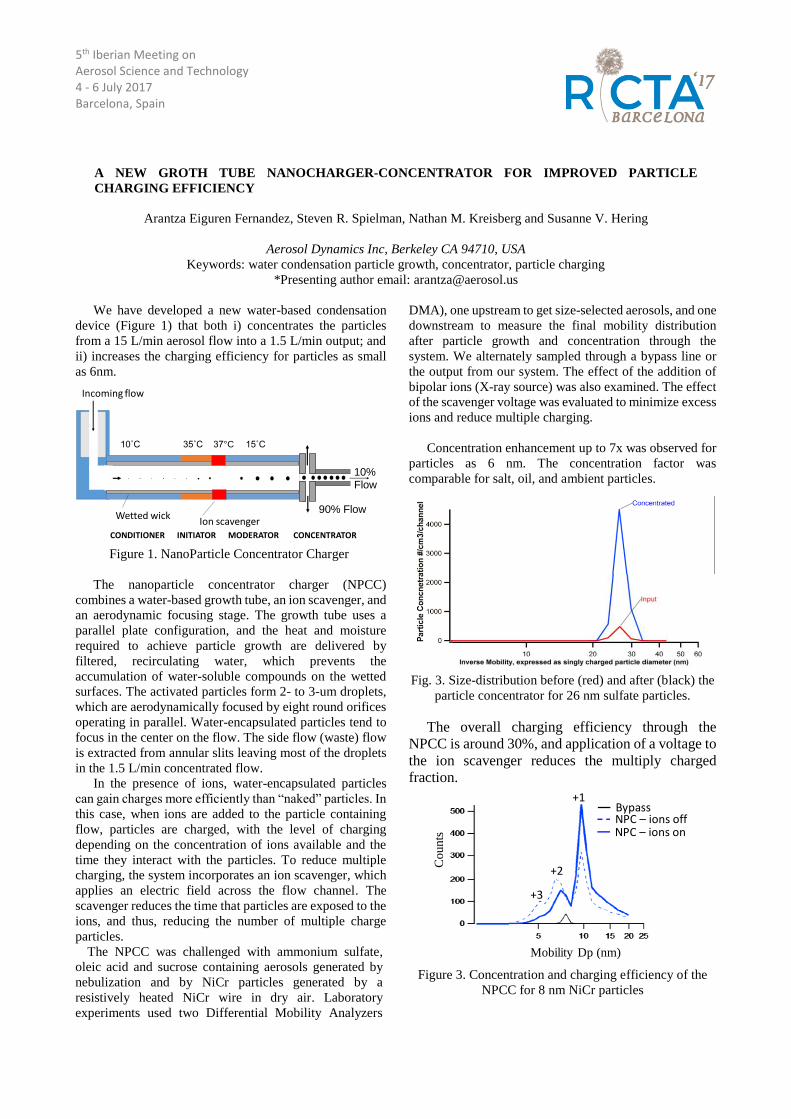
5th Iberian Meeting on Aerosol Science and Technology 4 - 6 July 2017 Barcelona, Spain
A NEW GROTH TUBE NANOCHARGER-CONCENTRATOR FOR IMPROVED PARTICLE
CHARGING EFFICIENCY
Arantza Eiguren Fernandez, Steven R. Spielman, Nathan M. Kreisberg and Susanne V. Hering
Aerosol Dynamics Inc, Berkeley CA 94710, USA
Keywords: water condensation particle growth, concentrator, particle charging *Presenting author email: [email protected]
We have developed a new water-based condensation device (Figure 1) that both i) concentrates the particles from a 15 L/min aerosol flow into a 1.5 L/min output; and ii) increases the charging efficiency for particles as small as 6nm.
Figure 1. NanoParticle Concentrator Charger
The nanoparticle concentrator charger (NPCC) combines a water-based growth tube, an ion scavenger, and an aerodynamic focusing stage. The growth tube uses a parallel plate configuration, and the heat and moisture required to achieve particle growth are delivered by filtered, recirculating water, which prevents the accumulation of water-soluble compounds on the wetted surfaces. The activated particles form 2- to 3-um droplets, which are aerodynamically focused by eight round orifices operating in parallel. Water-encapsulated particles tend to focus in the center on the flow. The side flow (waste) flow is extracted from annular slits leaving most of the droplets in the 1.5 L/min concentrated flow. In the presence of ions, water-encapsulated particles can gain charges more efficiently than “naked” particles. In
this case, when ions are added to the particle containing flow, particles are charged, with the level of charging depending on the concentration of ions available and the time they interact with the particles. To reduce multiple charging, the system incorporates an ion scavenger, which applies an electric field across the flow channel. The scavenger reduces the time that particles are exposed to the ions, and thus, reducing the number of multiple charge particles. The NPCC was challenged with ammonium sulfate, oleic acid and sucrose containing aerosols generated by nebulization and by NiCr particles generated by a resistively heated NiCr wire in dry air. Laboratory experiments used two Differential Mobility Analyzers
DMA), one upstream to get size-selected aerosols, and one downstream to measure the final mobility distribution after particle growth and concentration through the system. We alternately sampled through a bypass line or the output from our system. The effect of the addition of bipolar ions (X-ray source) was also examined. The effect of the scavenger voltage was evaluated to minimize excess ions and reduce multiple charging. Concentration enhancement up to 7x was observed for particles as 6 nm. The concentration factor was comparable for salt, oil, and ambient particles.
Fig. 3. Size-distribution before (red) and after (black) the particle concentrator for 26 nm sulfate particles.
The overall charging efficiency through the
NPCC is around 30%, and application of a voltage to the ion scavenger reduces the multiply charged fraction.
Figure 3. Concentration and charging efficiency of the
NPCC for 8 nm NiCr particles
10˚C 35˚C 37°C 15˚C
10%Flow
90% Flow
Incoming flow
Wetted wick Ion scavenger
CONDITIONER INITIATOR MODERATOR CONCENTRATOR
Cou
nts
Mobility Dp (nm)
+1
+2
+3
BypassNPC – ions offNPC – ions on
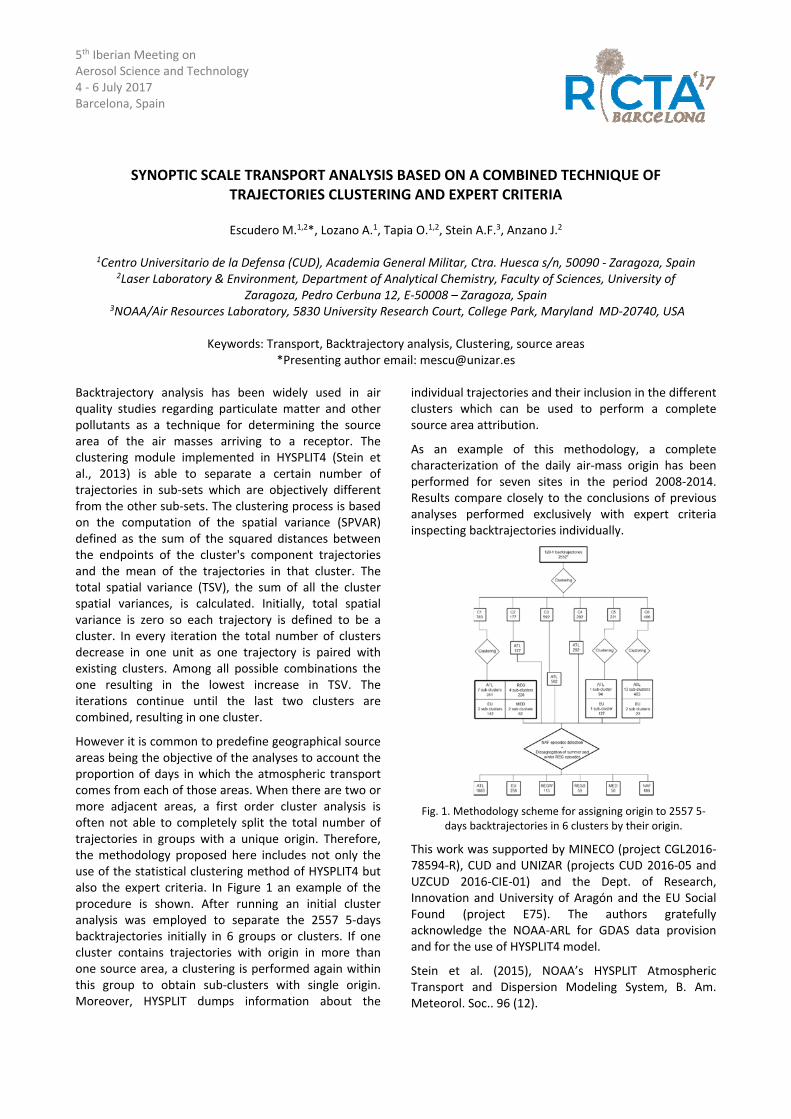
5th Iberian Meeting on Aerosol Science and Technology 4 ‐ 6 July 2017 Barcelona, Spain
SYNOPTIC SCALE TRANSPORT ANALYSIS BASED ON A COMBINED TECHNIQUE OF TRAJECTORIES CLUSTERING AND EXPERT CRITERIA
Escudero M.1,2*, Lozano A.1, Tapia O.1,2, Stein A.F.3, Anzano J.2
1Centro Universitario de la Defensa (CUD), Academia General Militar, Ctra. Huesca s/n, 50090 ‐ Zaragoza, Spain
2Laser Laboratory & Environment, Department of Analytical Chemistry, Faculty of Sciences, University of Zaragoza, Pedro Cerbuna 12, E‐50008 – Zaragoza, Spain
3NOAA/Air Resources Laboratory, 5830 University Research Court, College Park, Maryland MD‐20740, USA
Keywords: Transport, Backtrajectory analysis, Clustering, source areas *Presenting author email: [email protected]
Backtrajectory analysis has been widely used in air quality studies regarding particulate matter and other pollutants as a technique for determining the source area of the air masses arriving to a receptor. The clustering module implemented in HYSPLIT4 (Stein et al., 2013) is able to separate a certain number of trajectories in sub‐sets which are objectively different from the other sub‐sets. The clustering process is based on the computation of the spatial variance (SPVAR) defined as the sum of the squared distances between the endpoints of the cluster's component trajectories and the mean of the trajectories in that cluster. The total spatial variance (TSV), the sum of all the cluster spatial variances, is calculated. Initially, total spatial variance is zero so each trajectory is defined to be a cluster. In every iteration the total number of clusters decrease in one unit as one trajectory is paired with existing clusters. Among all possible combinations the one resulting in the lowest increase in TSV. The iterations continue until the last two clusters are combined, resulting in one cluster.
However it is common to predefine geographical source areas being the objective of the analyses to account the proportion of days in which the atmospheric transport comes from each of those areas. When there are two or more adjacent areas, a first order cluster analysis is often not able to completely split the total number of trajectories in groups with a unique origin. Therefore, the methodology proposed here includes not only the use of the statistical clustering method of HYSPLIT4 but also the expert criteria. In Figure 1 an example of the procedure is shown. After running an initial cluster analysis was employed to separate the 2557 5‐days backtrajectories initially in 6 groups or clusters. If one cluster contains trajectories with origin in more than one source area, a clustering is performed again within this group to obtain sub‐clusters with single origin. Moreover, HYSPLIT dumps information about the
individual trajectories and their inclusion in the different clusters which can be used to perform a complete source area attribution.
As an example of this methodology, a complete characterization of the daily air‐mass origin has been performed for seven sites in the period 2008‐2014. Results compare closely to the conclusions of previous analyses performed exclusively with expert criteria inspecting backtrajectories individually.
Fig. 1. Methodology scheme for assigning origin to 2557 5‐days backtrajectories in 6 clusters by their origin.
This work was supported by MINECO (project CGL2016‐78594‐R), CUD and UNIZAR (projects CUD 2016‐05 and UZCUD 2016‐CIE‐01) and the Dept. of Research, Innovation and University of Aragón and the EU Social Found (project E75). The authors gratefully acknowledge the NOAA‐ARL for GDAS data provision and for the use of HYSPLIT4 model.
Stein et al. (2015), NOAA’s HYSPLIT Atmospheric Transport and Dispersion Modeling System, B. Am. Meteorol. Soc.. 96 (12).
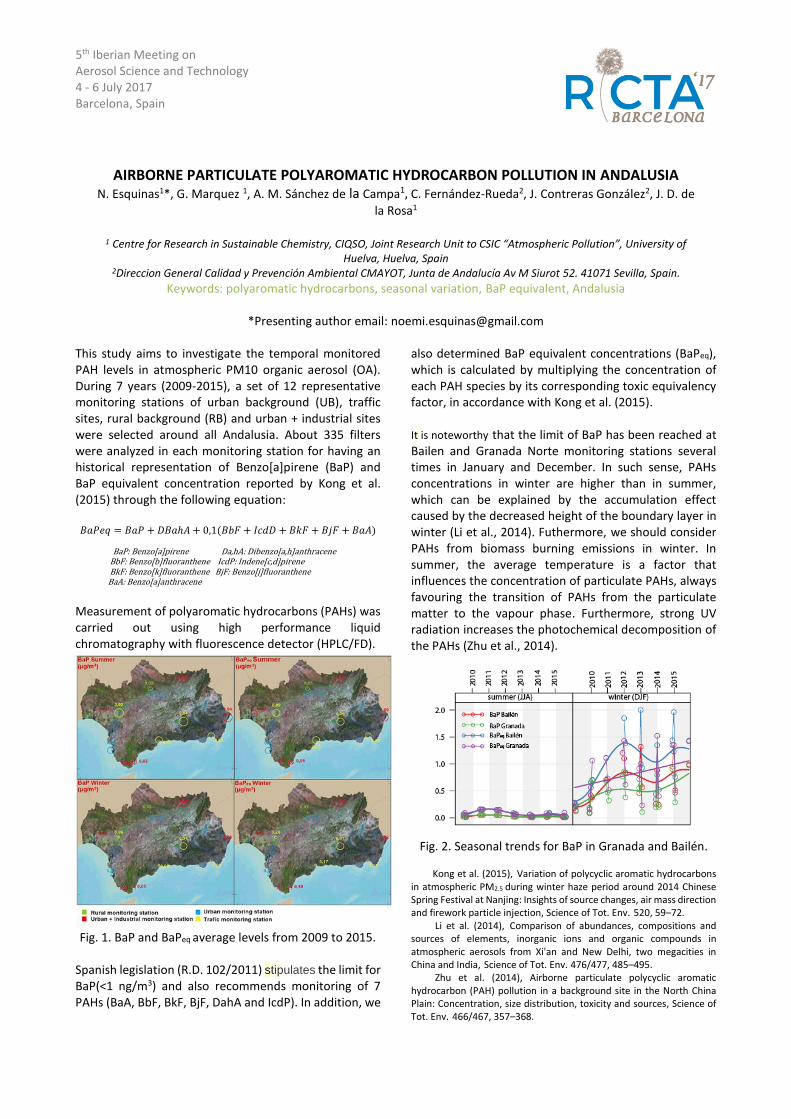
5th Iberian Meeting on Aerosol Science and Technology 4 - 6 July 2017 Barcelona, Spain
AIRBORNE PARTICULATE POLYAROMATIC HYDROCARBON POLLUTION IN ANDALUSIA N. Esquinas1*, G. Marquez 1, A. M. Sánchez de la Campa1, C. Fernández-Rueda2, J. Contreras González2, J. D. de
la Rosa1
1 Centre for Research in Sustainable Chemistry, CIQSO, Joint Research Unit to CSIC “Atmospheric Pollution”, University of Huelva, Huelva, Spain
2Direccion General Calidad y Prevención Ambiental CMAYOT, Junta de Andalucía Av M Siurot 52. 41071 Sevilla, Spain.
Keywords: polyaromatic hydrocarbons, seasonal variation, BaP equivalent, Andalusia
*Presenting author email: [email protected]
This study aims to investigate the temporal monitored PAH levels in atmospheric PM10 organic aerosol (OA). During 7 years (2009-2015), a set of 12 representative monitoring stations of urban background (UB), traffic sites, rural background (RB) and urban + industrial sites were selected around all Andalusia. About 335 filters were analyzed in each monitoring station for having an historical representation of Benzo[a]pirene (BaP) and BaP equivalent concentration reported by Kong et al. (2015) through the following equation:
𝐵𝑎𝑃𝑒𝑞 = 𝐵𝑎𝑃 + 𝐷𝐵𝑎ℎ𝐴 + 0,1(𝐵𝑏𝐹 + 𝐼𝑐𝑑𝐷 + 𝐵𝑘𝐹 + 𝐵𝑗𝐹 + 𝐵𝑎𝐴)
BaP: Benzo[a]pirene Da,hA: Dibenzo[a,h]anthracene
BbF: Benzo[b]fluoranthene IcdP: Indene[c,d]pirene BkF: Benzo[k]fluoranthene BjF: Benzo[j]fluoranthene BaA: Benzo[a]anthracene
Measurement of polyaromatic hydrocarbons (PAHs) was carried out using high performance liquid chromatography with fluorescence detector (HPLC/FD).
Fig. 1. BaP and BaPeq average levels from 2009 to 2015.
Spanish legislation (R.D. 102/2011) stipulates the limit for BaP(<1 ng/m3) and also recommends monitoring of 7 PAHs (BaA, BbF, BkF, BjF, DahA and IcdP). In addition, we
also determined BaP equivalent concentrations (BaPeq), which is calculated by multiplying the concentration of each PAH species by its corresponding toxic equivalency factor, in accordance with Kong et al. (2015). It is noteworthy that the limit of BaP has been reached at Bailen and Granada Norte monitoring stations several times in January and December. In such sense, PAHs concentrations in winter are higher than in summer, which can be explained by the accumulation effect caused by the decreased height of the boundary layer in winter (Li et al., 2014). Futhermore, we should consider PAHs from biomass burning emissions in winter. In summer, the average temperature is a factor that influences the concentration of particulate PAHs, always favouring the transition of PAHs from the particulate matter to the vapour phase. Furthermore, strong UV radiation increases the photochemical decomposition of the PAHs (Zhu et al., 2014).
Fig. 2. Seasonal trends for BaP in Granada and Bailén.
Kong et al. (2015), Variation of polycyclic aromatic hydrocarbons in atmospheric PM2.5 during winter haze period around 2014 Chinese Spring Festival at Nanjing: Insights of source changes, air mass direction and firework particle injection, Science of Tot. Env. 520, 59–72. Li et al. (2014), Comparison of abundances, compositions and sources of elements, inorganic ions and organic compounds in atmospheric aerosols from Xi'an and New Delhi, two megacities in China and India, Science of Tot. Env. 476/477, 485–495. Zhu et al. (2014), Airborne particulate polycyclic aromatic hydrocarbon (PAH) pollution in a background site in the North China Plain: Concentration, size distribution, toxicity and sources, Science of Tot. Env. 466/467, 357–368.
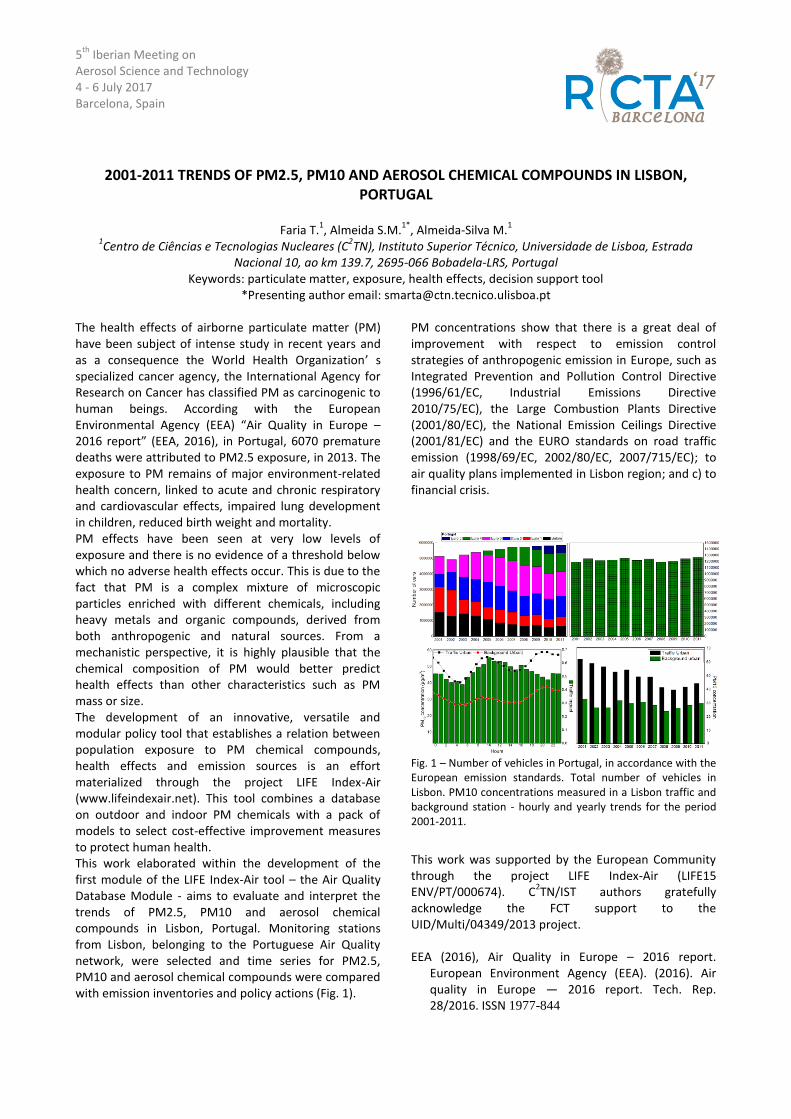
5th
Iberian Meeting on Aerosol Science and Technology 4 - 6 July 2017 Barcelona, Spain
2001-2011 TRENDS OF PM2.5, PM10 AND AEROSOL CHEMICAL COMPOUNDS IN LISBON, PORTUGAL
Faria T.
1, Almeida S.M.
1*, Almeida-Silva M.
1
1Centro de Ciências e Tecnologias Nucleares (C
2TN), Instituto Superior Técnico, Universidade de Lisboa, Estrada
Nacional 10, ao km 139.7, 2695-066 Bobadela-LRS, Portugal Keywords: particulate matter, exposure, health effects, decision support tool
*Presenting author email: [email protected]
The health effects of airborne particulate matter (PM) have been subject of intense study in recent years and as a consequence the World Health Organization’ s specialized cancer agency, the International Agency for Research on Cancer has classified PM as carcinogenic to human beings. According with the European Environmental Agency (EEA) “Air Quality in Europe – 2016 report” (EEA, 2016), in Portugal, 6070 premature deaths were attributed to PM2.5 exposure, in 2013. The exposure to PM remains of major environment-related health concern, linked to acute and chronic respiratory and cardiovascular effects, impaired lung development in children, reduced birth weight and mortality. PM effects have been seen at very low levels of exposure and there is no evidence of a threshold below which no adverse health effects occur. This is due to the fact that PM is a complex mixture of microscopic particles enriched with different chemicals, including heavy metals and organic compounds, derived from both anthropogenic and natural sources. From a mechanistic perspective, it is highly plausible that the chemical composition of PM would better predict health effects than other characteristics such as PM mass or size. The development of an innovative, versatile and modular policy tool that establishes a relation between population exposure to PM chemical compounds, health effects and emission sources is an effort materialized through the project LIFE Index-Air (www.lifeindexair.net). This tool combines a database on outdoor and indoor PM chemicals with a pack of models to select cost-effective improvement measures to protect human health. This work elaborated within the development of the first module of the LIFE Index-Air tool – the Air Quality Database Module - aims to evaluate and interpret the trends of PM2.5, PM10 and aerosol chemical compounds in Lisbon, Portugal. Monitoring stations from Lisbon, belonging to the Portuguese Air Quality network, were selected and time series for PM2.5, PM10 and aerosol chemical compounds were compared with emission inventories and policy actions (Fig. 1).
PM concentrations show that there is a great deal of improvement with respect to emission control strategies of anthropogenic emission in Europe, such as Integrated Prevention and Pollution Control Directive (1996/61/EC, Industrial Emissions Directive 2010/75/EC), the Large Combustion Plants Directive (2001/80/EC), the National Emission Ceilings Directive (2001/81/EC) and the EURO standards on road traffic emission (1998/69/EC, 2002/80/EC, 2007/715/EC); to air quality plans implemented in Lisbon region; and c) to financial crisis.
Fig. 1 – Number of vehicles in Portugal, in accordance with the European emission standards. Total number of vehicles in Lisbon. PM10 concentrations measured in a Lisbon traffic and background station - hourly and yearly trends for the period 2001-2011.
This work was supported by the European Community through the project LIFE Index-Air (LIFE15 ENV/PT/000674). C
2TN/IST authors gratefully
acknowledge the FCT support to the UID/Multi/04349/2013 project. EEA (2016), Air Quality in Europe – 2016 report.
European Environment Agency (EEA). (2016). Air quality in Europe — 2016 report. Tech. Rep. 28/2016. ISSN 1977-844
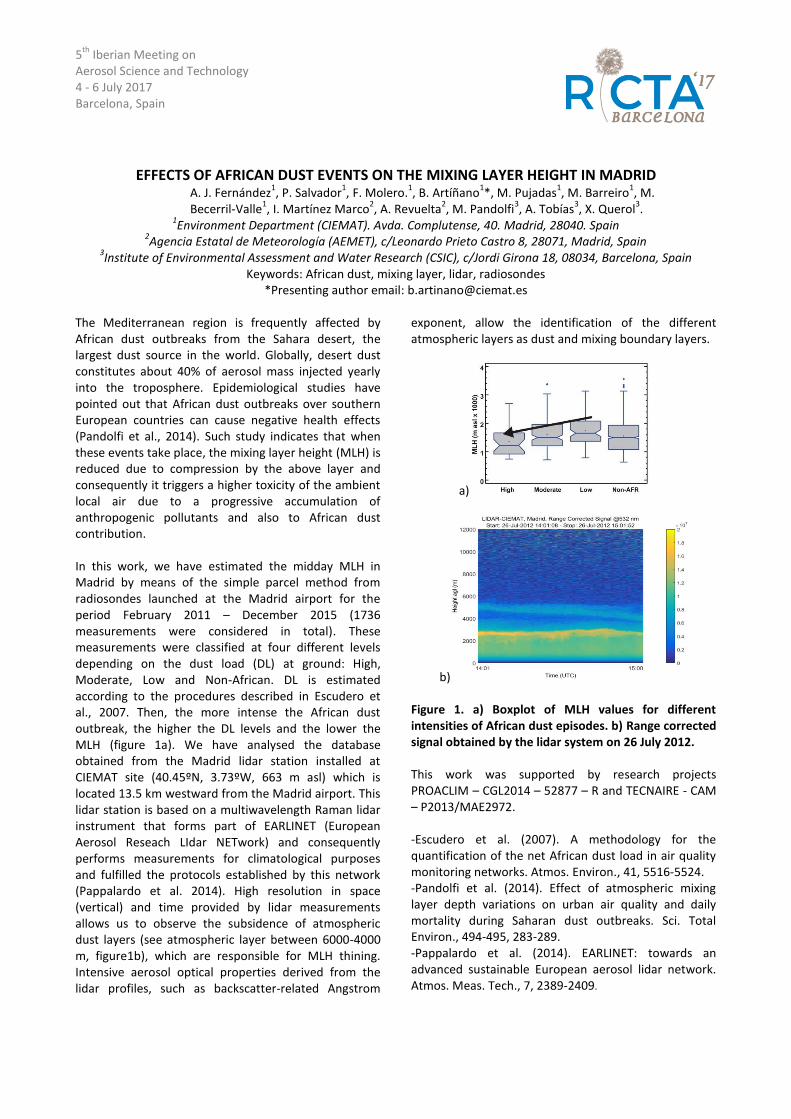
5th
Iberian Meeting on Aerosol Science and Technology 4 - 6 July 2017 Barcelona, Spain
EFFECTS OF AFRICAN DUST EVENTS ON THE MIXING LAYER HEIGHT IN MADRID A. J. Fernández
1, P. Salvador
1, F. Molero.
1, B. Artíñano
1*, M. Pujadas
1, M. Barreiro
1, M.
Becerril-Valle1, I. Martínez Marco
2, A. Revuelta
2, M. Pandolfi
3, A. Tobías
3, X. Querol
3.
1Environment Department (CIEMAT). Avda. Complutense, 40. Madrid, 28040. Spain
2Agencia Estatal de Meteorología (AEMET), c/Leonardo Prieto Castro 8, 28071, Madrid, Spain
3Institute of Environmental Assessment and Water Research (CSIC), c/Jordi Girona 18, 08034, Barcelona, Spain
Keywords: African dust, mixing layer, lidar, radiosondes *Presenting author email: [email protected]
The Mediterranean region is frequently affected by African dust outbreaks from the Sahara desert, the largest dust source in the world. Globally, desert dust constitutes about 40% of aerosol mass injected yearly into the troposphere. Epidemiological studies have pointed out that African dust outbreaks over southern European countries can cause negative health effects (Pandolfi et al., 2014). Such study indicates that when these events take place, the mixing layer height (MLH) is reduced due to compression by the above layer and consequently it triggers a higher toxicity of the ambient local air due to a progressive accumulation of anthropogenic pollutants and also to African dust contribution. In this work, we have estimated the midday MLH in Madrid by means of the simple parcel method from radiosondes launched at the Madrid airport for the period February 2011 – December 2015 (1736 measurements were considered in total). These measurements were classified at four different levels depending on the dust load (DL) at ground: High, Moderate, Low and Non-African. DL is estimated according to the procedures described in Escudero et al., 2007. Then, the more intense the African dust outbreak, the higher the DL levels and the lower the MLH (figure 1a). We have analysed the database obtained from the Madrid lidar station installed at CIEMAT site (40.45ºN, 3.73ºW, 663 m asl) which is located 13.5 km westward from the Madrid airport. This lidar station is based on a multiwavelength Raman lidar instrument that forms part of EARLINET (European Aerosol Reseach LIdar NETwork) and consequently performs measurements for climatological purposes and fulfilled the protocols established by this network (Pappalardo et al. 2014). High resolution in space (vertical) and time provided by lidar measurements allows us to observe the subsidence of atmospheric dust layers (see atmospheric layer between 6000-4000 m, figure1b), which are responsible for MLH thining. Intensive aerosol optical properties derived from the lidar profiles, such as backscatter-related Angstrom
exponent, allow the identification of the different atmospheric layers as dust and mixing boundary layers.
a)
b) Figure 1. a) Boxplot of MLH values for different intensities of African dust episodes. b) Range corrected signal obtained by the lidar system on 26 July 2012. This work was supported by research projects PROACLIM – CGL2014 – 52877 – R and TECNAIRE - CAM – P2013/MAE2972. -Escudero et al. (2007). A methodology for the quantification of the net African dust load in air quality monitoring networks. Atmos. Environ., 41, 5516-5524. -Pandolfi et al. (2014). Effect of atmospheric mixing layer depth variations on urban air quality and daily mortality during Saharan dust outbreaks. Sci. Total Environ., 494-495, 283-289. -Pappalardo et al. (2014). EARLINET: towards an advanced sustainable European aerosol lidar network. Atmos. Meas. Tech., 7, 2389-2409.
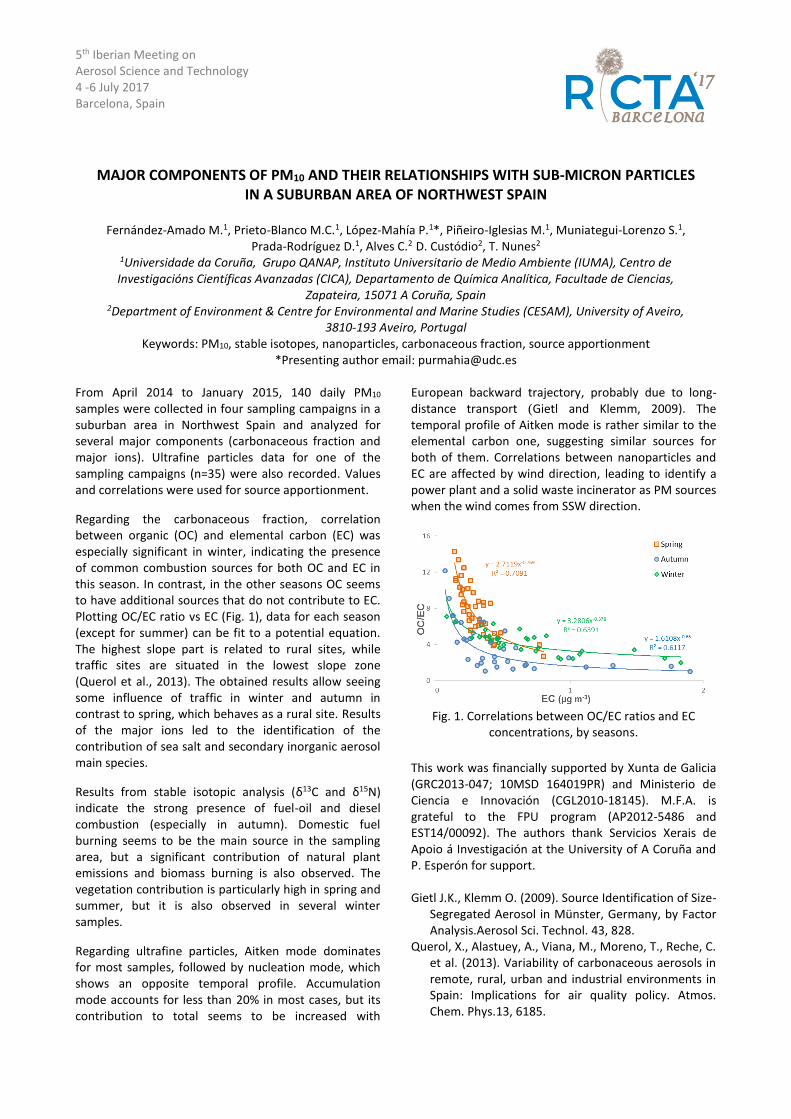
5th Iberian Meeting on Aerosol Science and Technology 4 -6 July 2017 Barcelona, Spain
MAJOR COMPONENTS OF PM10 AND THEIR RELATIONSHIPS WITH SUB-MICRON PARTICLES IN A SUBURBAN AREA OF NORTHWEST SPAIN
Fernández-Amado M.1, Prieto-Blanco M.C.1, López-Mahía P.1*, Piñeiro-Iglesias M.1, Muniategui-Lorenzo S.1,
Prada-Rodríguez D.1, Alves C.2 D. Custódio2, T. Nunes2 1Universidade da Coruña, Grupo QANAP, Instituto Universitario de Medio Ambiente (IUMA), Centro de Investigacións Científicas Avanzadas (CICA), Departamento de Química Analítica, Facultade de Ciencias,
Zapateira, 15071 A Coruña, Spain 2Department of Environment & Centre for Environmental and Marine Studies (CESAM), University of Aveiro,
3810-193 Aveiro, Portugal Keywords: PM10, stable isotopes, nanoparticles, carbonaceous fraction, source apportionment
*Presenting author email: [email protected]
From April 2014 to January 2015, 140 daily PM10 samples were collected in four sampling campaigns in a suburban area in Northwest Spain and analyzed for several major components (carbonaceous fraction and major ions). Ultrafine particles data for one of the sampling campaigns (n=35) were also recorded. Values and correlations were used for source apportionment.
Regarding the carbonaceous fraction, correlation between organic (OC) and elemental carbon (EC) was especially significant in winter, indicating the presence of common combustion sources for both OC and EC in this season. In contrast, in the other seasons OC seems to have additional sources that do not contribute to EC. Plotting OC/EC ratio vs EC (Fig. 1), data for each season (except for summer) can be fit to a potential equation. The highest slope part is related to rural sites, while traffic sites are situated in the lowest slope zone (Querol et al., 2013). The obtained results allow seeing some influence of traffic in winter and autumn in contrast to spring, which behaves as a rural site. Results of the major ions led to the identification of the contribution of sea salt and secondary inorganic aerosol main species.
Results from stable isotopic analysis (δ13C and δ15N) indicate the strong presence of fuel-oil and diesel combustion (especially in autumn). Domestic fuel burning seems to be the main source in the sampling area, but a significant contribution of natural plant emissions and biomass burning is also observed. The vegetation contribution is particularly high in spring and summer, but it is also observed in several winter samples.
Regarding ultrafine particles, Aitken mode dominates for most samples, followed by nucleation mode, which shows an opposite temporal profile. Accumulation mode accounts for less than 20% in most cases, but its contribution to total seems to be increased with
European backward trajectory, probably due to long-distance transport (Gietl and Klemm, 2009). The temporal profile of Aitken mode is rather similar to the elemental carbon one, suggesting similar sources for both of them. Correlations between nanoparticles and EC are affected by wind direction, leading to identify a power plant and a solid waste incinerator as PM sources when the wind comes from SSW direction.
Fig. 1. Correlations between OC/EC ratios and EC
concentrations, by seasons.
This work was financially supported by Xunta de Galicia (GRC2013-047; 10MSD 164019PR) and Ministerio de Ciencia e Innovación (CGL2010-18145). M.F.A. is grateful to the FPU program (AP2012-5486 and EST14/00092). The authors thank Servicios Xerais de Apoio á Investigación at the University of A Coruña and P. Esperón for support. Gietl J.K., Klemm O. (2009). Source Identification of Size-
Segregated Aerosol in Münster, Germany, by Factor Analysis.Aerosol Sci. Technol. 43, 828.
Querol, X., Alastuey, A., Viana, M., Moreno, T., Reche, C. et al. (2013). Variability of carbonaceous aerosols in remote, rural, urban and industrial environments in Spain: Implications for air quality policy. Atmos. Chem. Phys.13, 6185.
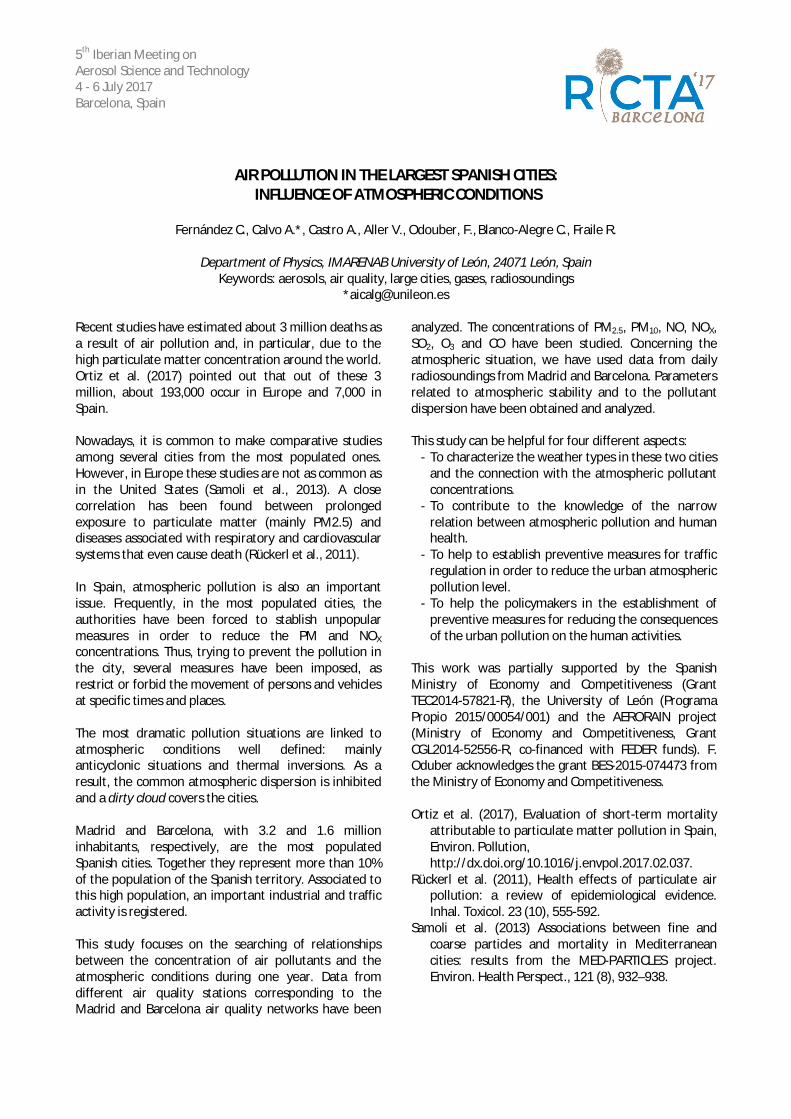
5th Iberian Meeting on Aerosol Science and Technology 4 - 6 July 2017 Barcelona, Spain
AIR POLLUTION IN THE LARGEST SPANISH CITIES: INFLUENCE OF ATMOSPHERIC CONDITIONS
Fernández C., Calvo A.*, Castro A., Aller V., Odouber, F., Blanco-Alegre C., Fraile R.
Department of Physics, IMARENAB University of León, 24071 León, Spain
Keywords: aerosols, air quality, large cities, gases, radiosoundings *[email protected]
Recent studies have estimated about 3 million deaths as a result of air pollution and, in particular, due to the high particulate matter concentration around the world. Ortiz et al. (2017) pointed out that out of these 3 million, about 193,000 occur in Europe and 7,000 in Spain. Nowadays, it is common to make comparative studies among several cities from the most populated ones. However, in Europe these studies are not as common as in the United States (Samoli et al., 2013). A close correlation has been found between prolonged exposure to particulate matter (mainly PM2.5) and diseases associated with respiratory and cardiovascular systems that even cause death (Rückerl et al., 2011). In Spain, atmospheric pollution is also an important issue. Frequently, in the most populated cities, the authorities have been forced to stablish unpopular measures in order to reduce the PM and NOX
concentrations. Thus, trying to prevent the pollution in the city, several measures have been imposed, as restrict or forbid the movement of persons and vehicles at specific times and places. The most dramatic pollution situations are linked to atmospheric conditions well defined: mainly anticyclonic situations and thermal inversions. As a result, the common atmospheric dispersion is inhibited and a dirty cloud covers the cities. Madrid and Barcelona, with 3.2 and 1.6 million inhabitants, respectively, are the most populated Spanish cities. Together they represent more than 10% of the population of the Spanish territory. Associated to this high population, an important industrial and traffic activity is registered. This study focuses on the searching of relationships between the concentration of air pollutants and the atmospheric conditions during one year. Data from different air quality stations corresponding to the Madrid and Barcelona air quality networks have been
analyzed. The concentrations of PM2.5, PM10, NO, NOX, SO2, O3 and CO have been studied. Concerning the atmospheric situation, we have used data from daily radiosoundings from Madrid and Barcelona. Parameters related to atmospheric stability and to the pollutant dispersion have been obtained and analyzed. This study can be helpful for four different aspects:
- To characterize the weather types in these two cities and the connection with the atmospheric pollutant concentrations.
- To contribute to the knowledge of the narrow relation between atmospheric pollution and human health.
- To help to establish preventive measures for traffic regulation in order to reduce the urban atmospheric pollution level.
- To help the policymakers in the establishment of preventive measures for reducing the consequences of the urban pollution on the human activities.
This work was partially supported by the Spanish Ministry of Economy and Competitiveness (Grant TEC2014-57821-R), the University of León (Programa Propio 2015/00054/001) and the AERORAIN project (Ministry of Economy and Competitiveness, Grant CGL2014-52556-R, co-financed with FEDER funds). F. Oduber acknowledges the grant BES-2015-074473 from the Ministry of Economy and Competitiveness. Ortiz et al. (2017), Evaluation of short-term mortality
attributable to particulate matter pollution in Spain, Environ. Pollution, http://dx.doi.org/10.1016/j.envpol.2017.02.037.
Rückerl et al. (2011), Health effects of particulate air pollution: a review of epidemiological evidence. Inhal. Toxicol. 23 (10), 555-592.
Samoli et al. (2013) Associations between fine and coarse particles and mortality in Mediterranean cities: results from the MED-PARTICLES project. Environ. Health Perspect., 121 (8), 932–938.
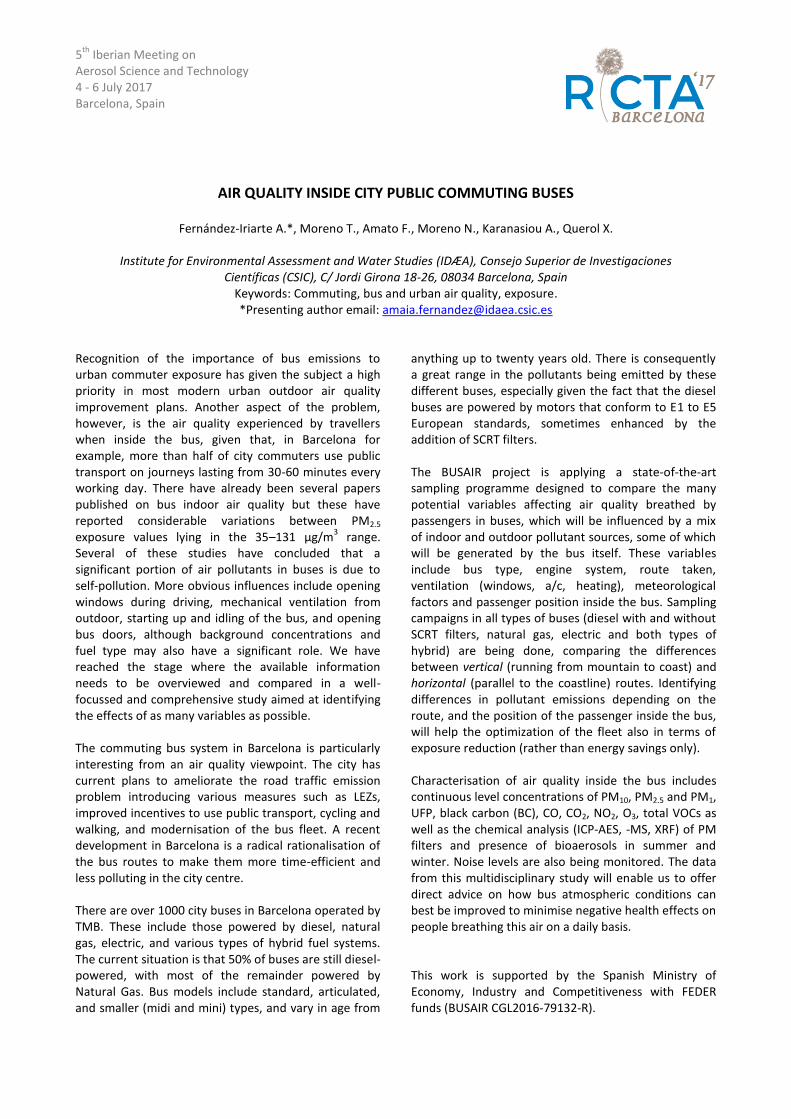
5th
Iberian Meeting on Aerosol Science and Technology 4 - 6 July 2017 Barcelona, Spain
AIR QUALITY INSIDE CITY PUBLIC COMMUTING BUSES
Fernández-Iriarte A.*, Moreno T., Amato F., Moreno N., Karanasiou A., Querol X.
Institute for Environmental Assessment and Water Studies (IDÆA), Consejo Superior de Investigaciones Científicas (CSIC), C/ Jordi Girona 18-26, 08034 Barcelona, Spain
Keywords: Commuting, bus and urban air quality, exposure. *Presenting author email: [email protected]
Recognition of the importance of bus emissions to urban commuter exposure has given the subject a high priority in most modern urban outdoor air quality improvement plans. Another aspect of the problem, however, is the air quality experienced by travellers when inside the bus, given that, in Barcelona for example, more than half of city commuters use public transport on journeys lasting from 30-60 minutes every working day. There have already been several papers published on bus indoor air quality but these have reported considerable variations between PM2.5 exposure values lying in the 35–131 μg/m
3 range.
Several of these studies have concluded that a significant portion of air pollutants in buses is due to self-pollution. More obvious influences include opening windows during driving, mechanical ventilation from outdoor, starting up and idling of the bus, and opening bus doors, although background concentrations and fuel type may also have a significant role. We have reached the stage where the available information needs to be overviewed and compared in a well-focussed and comprehensive study aimed at identifying the effects of as many variables as possible. The commuting bus system in Barcelona is particularly interesting from an air quality viewpoint. The city has current plans to ameliorate the road traffic emission problem introducing various measures such as LEZs, improved incentives to use public transport, cycling and walking, and modernisation of the bus fleet. A recent development in Barcelona is a radical rationalisation of the bus routes to make them more time-efficient and less polluting in the city centre. There are over 1000 city buses in Barcelona operated by TMB. These include those powered by diesel, natural gas, electric, and various types of hybrid fuel systems. The current situation is that 50% of buses are still diesel-powered, with most of the remainder powered by Natural Gas. Bus models include standard, articulated, and smaller (midi and mini) types, and vary in age from
anything up to twenty years old. There is consequently a great range in the pollutants being emitted by these different buses, especially given the fact that the diesel buses are powered by motors that conform to E1 to E5 European standards, sometimes enhanced by the addition of SCRT filters. The BUSAIR project is applying a state-of-the-art sampling programme designed to compare the many potential variables affecting air quality breathed by passengers in buses, which will be influenced by a mix of indoor and outdoor pollutant sources, some of which will be generated by the bus itself. These variables include bus type, engine system, route taken, ventilation (windows, a/c, heating), meteorological factors and passenger position inside the bus. Sampling campaigns in all types of buses (diesel with and without SCRT filters, natural gas, electric and both types of hybrid) are being done, comparing the differences between vertical (running from mountain to coast) and horizontal (parallel to the coastline) routes. Identifying differences in pollutant emissions depending on the route, and the position of the passenger inside the bus, will help the optimization of the fleet also in terms of exposure reduction (rather than energy savings only). Characterisation of air quality inside the bus includes continuous level concentrations of PM10, PM2.5 and PM1, UFP, black carbon (BC), CO, CO2, NO2, O3, total VOCs as well as the chemical analysis (ICP-AES, -MS, XRF) of PM filters and presence of bioaerosols in summer and winter. Noise levels are also being monitored. The data from this multidisciplinary study will enable us to offer direct advice on how bus atmospheric conditions can best be improved to minimise negative health effects on people breathing this air on a daily basis. This work is supported by the Spanish Ministry of Economy, Industry and Competitiveness with FEDER funds (BUSAIR CGL2016-79132-R).
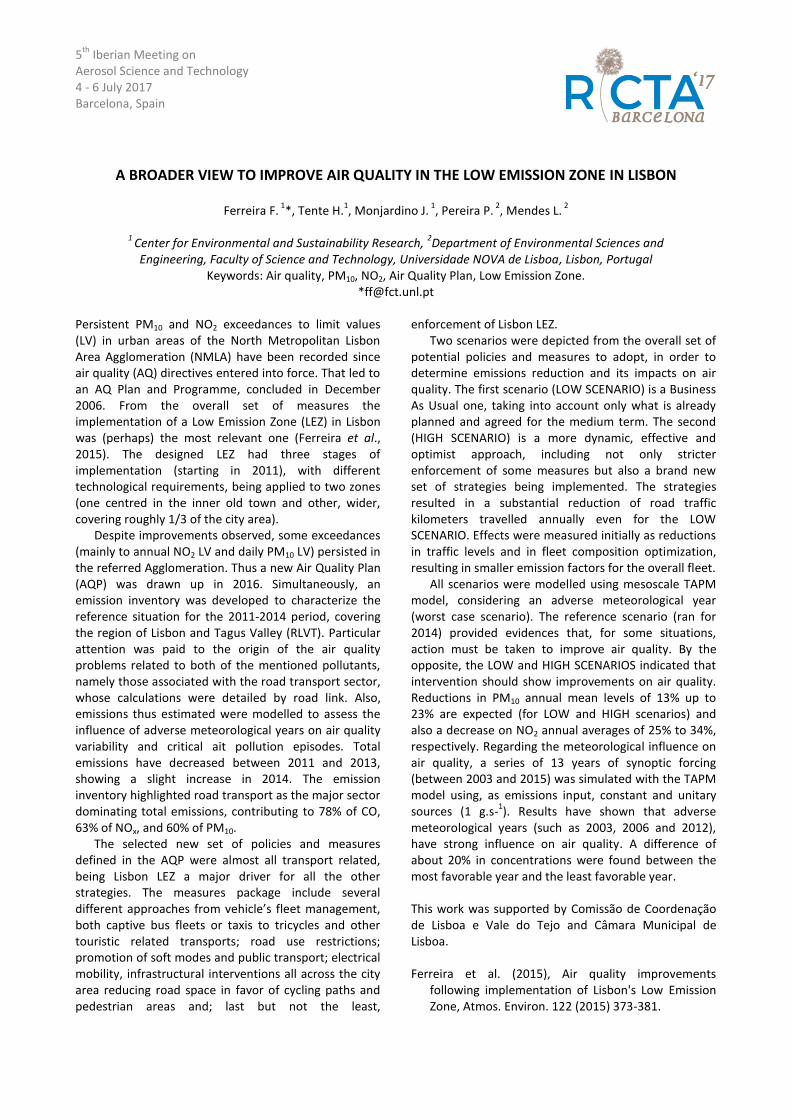
5th
Iberian Meeting on Aerosol Science and Technology 4 - 6 July 2017 Barcelona, Spain
A BROADER VIEW TO IMPROVE AIR QUALITY IN THE LOW EMISSION ZONE IN LISBON
Ferreira F. 1
*, Tente H.1, Monjardino J.
1, Pereira P.
2, Mendes L.
2
1
Center for Environmental and Sustainability Research, 2Department of Environmental Sciences and
Engineering, Faculty of Science and Technology, Universidade NOVA de Lisboa, Lisbon, Portugal Keywords: Air quality, PM10, NO2, Air Quality Plan, Low Emission Zone.
Persistent PM10 and NO2 exceedances to limit values (LV) in urban areas of the North Metropolitan Lisbon Area Agglomeration (NMLA) have been recorded since air quality (AQ) directives entered into force. That led to an AQ Plan and Programme, concluded in December 2006. From the overall set of measures the implementation of a Low Emission Zone (LEZ) in Lisbon was (perhaps) the most relevant one (Ferreira et al., 2015). The designed LEZ had three stages of implementation (starting in 2011), with different technological requirements, being applied to two zones (one centred in the inner old town and other, wider, covering roughly 1/3 of the city area).
Despite improvements observed, some exceedances (mainly to annual NO2 LV and daily PM10 LV) persisted in the referred Agglomeration. Thus a new Air Quality Plan (AQP) was drawn up in 2016. Simultaneously, an emission inventory was developed to characterize the reference situation for the 2011-2014 period, covering the region of Lisbon and Tagus Valley (RLVT). Particular attention was paid to the origin of the air quality problems related to both of the mentioned pollutants, namely those associated with the road transport sector, whose calculations were detailed by road link. Also, emissions thus estimated were modelled to assess the influence of adverse meteorological years on air quality variability and critical ait pollution episodes. Total emissions have decreased between 2011 and 2013, showing a slight increase in 2014. The emission inventory highlighted road transport as the major sector dominating total emissions, contributing to 78% of CO, 63% of NOx, and 60% of PM10.
The selected new set of policies and measures defined in the AQP were almost all transport related, being Lisbon LEZ a major driver for all the other strategies. The measures package include several different approaches from vehicle’s fleet management, both captive bus fleets or taxis to tricycles and other touristic related transports; road use restrictions; promotion of soft modes and public transport; electrical mobility, infrastructural interventions all across the city area reducing road space in favor of cycling paths and pedestrian areas and; last but not the least,
enforcement of Lisbon LEZ. Two scenarios were depicted from the overall set of
potential policies and measures to adopt, in order to determine emissions reduction and its impacts on air quality. The first scenario (LOW SCENARIO) is a Business As Usual one, taking into account only what is already planned and agreed for the medium term. The second (HIGH SCENARIO) is a more dynamic, effective and optimist approach, including not only stricter enforcement of some measures but also a brand new set of strategies being implemented. The strategies resulted in a substantial reduction of road traffic kilometers travelled annually even for the LOW SCENARIO. Effects were measured initially as reductions in traffic levels and in fleet composition optimization, resulting in smaller emission factors for the overall fleet.
All scenarios were modelled using mesoscale TAPM model, considering an adverse meteorological year (worst case scenario). The reference scenario (ran for 2014) provided evidences that, for some situations, action must be taken to improve air quality. By the opposite, the LOW and HIGH SCENARIOS indicated that intervention should show improvements on air quality. Reductions in PM10 annual mean levels of 13% up to 23% are expected (for LOW and HIGH scenarios) and also a decrease on NO2 annual averages of 25% to 34%, respectively. Regarding the meteorological influence on air quality, a series of 13 years of synoptic forcing (between 2003 and 2015) was simulated with the TAPM model using, as emissions input, constant and unitary sources (1 g.s-
1). Results have shown that adverse
meteorological years (such as 2003, 2006 and 2012), have strong influence on air quality. A difference of about 20% in concentrations were found between the most favorable year and the least favorable year. This work was supported by Comissão de Coordenação de Lisboa e Vale do Tejo and Câmara Municipal de Lisboa. Ferreira et al. (2015), Air quality improvements
following implementation of Lisbon's Low Emission Zone, Atmos. Environ. 122 (2015) 373-381.
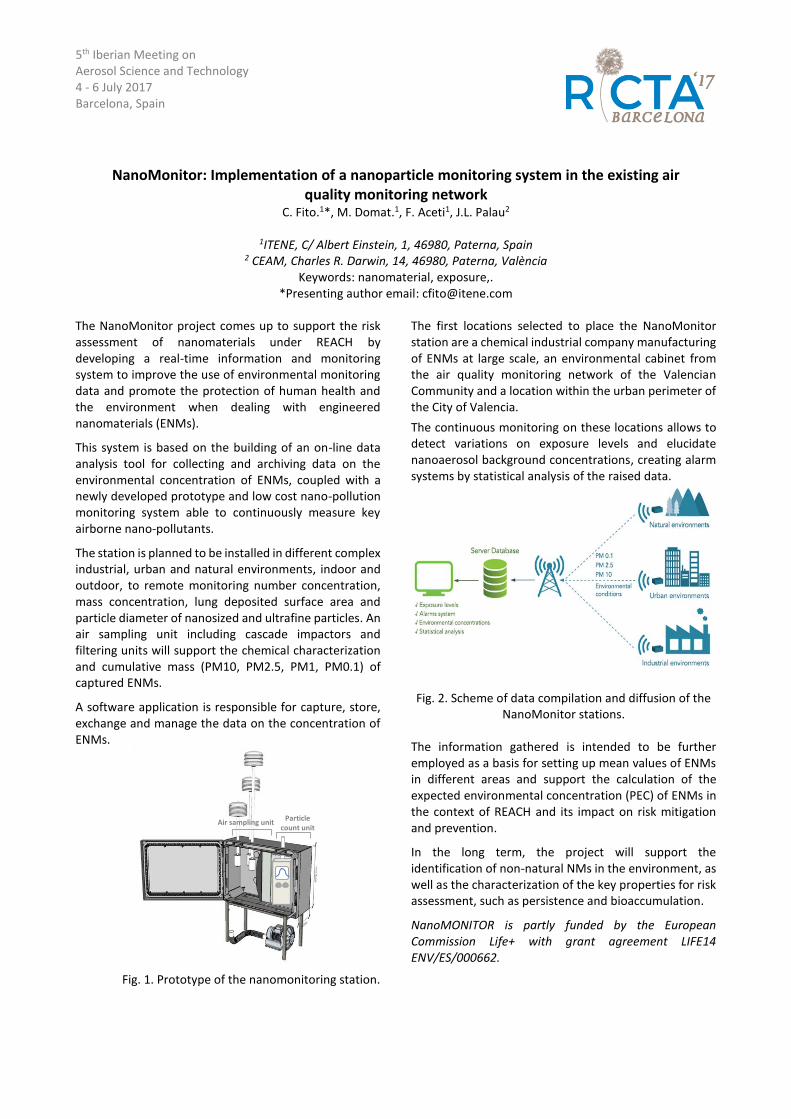
5th Iberian Meeting on Aerosol Science and Technology 4 - 6 July 2017 Barcelona, Spain
NanoMonitor: Implementation of a nanoparticle monitoring system in the existing air quality monitoring network
C. Fito.1*, M. Domat.1, F. Aceti1, J.L. Palau2
1ITENE, C/ Albert Einstein, 1, 46980, Paterna, Spain 2 CEAM, Charles R. Darwin, 14, 46980, Paterna, València
Keywords: nanomaterial, exposure,. *Presenting author email: [email protected]
The NanoMonitor project comes up to support the risk assessment of nanomaterials under REACH by developing a real-time information and monitoring system to improve the use of environmental monitoring data and promote the protection of human health and the environment when dealing with engineered nanomaterials (ENMs).
This system is based on the building of an on-line data analysis tool for collecting and archiving data on the environmental concentration of ENMs, coupled with a newly developed prototype and low cost nano-pollution monitoring system able to continuously measure key airborne nano-pollutants.
The station is planned to be installed in different complex industrial, urban and natural environments, indoor and outdoor, to remote monitoring number concentration, mass concentration, lung deposited surface area and particle diameter of nanosized and ultrafine particles. An air sampling unit including cascade impactors and filtering units will support the chemical characterization and cumulative mass (PM10, PM2.5, PM1, PM0.1) of captured ENMs.
A software application is responsible for capture, store, exchange and manage the data on the concentration of ENMs.
Fig. 1. Prototype of the nanomonitoring station.
The first locations selected to place the NanoMonitor station are a chemical industrial company manufacturing of ENMs at large scale, an environmental cabinet from the air quality monitoring network of the Valencian Community and a location within the urban perimeter of the City of Valencia.
The continuous monitoring on these locations allows to detect variations on exposure levels and elucidate nanoaerosol background concentrations, creating alarm systems by statistical analysis of the raised data.
Fig. 2. Scheme of data compilation and diffusion of the
NanoMonitor stations.
The information gathered is intended to be further employed as a basis for setting up mean values of ENMs in different areas and support the calculation of the expected environmental concentration (PEC) of ENMs in the context of REACH and its impact on risk mitigation and prevention.
In the long term, the project will support the identification of non-natural NMs in the environment, as well as the characterization of the key properties for risk assessment, such as persistence and bioaccumulation.
NanoMONITOR is partly funded by the European Commission Life+ with grant agreement LIFE14 ENV/ES/000662.
Air sampling unit Particle
count unit
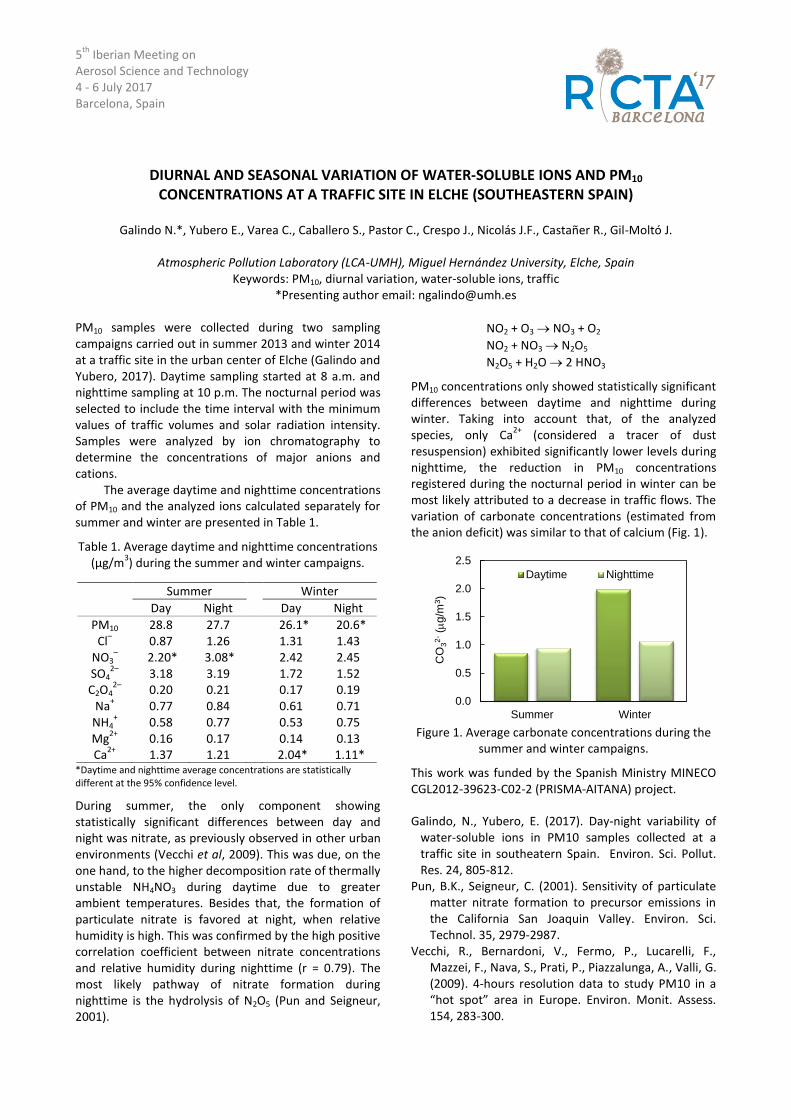
5th
Iberian Meeting on Aerosol Science and Technology 4 - 6 July 2017 Barcelona, Spain
DIURNAL AND SEASONAL VARIATION OF WATER-SOLUBLE IONS AND PM10 CONCENTRATIONS AT A TRAFFIC SITE IN ELCHE (SOUTHEASTERN SPAIN)
Galindo N.*, Yubero E., Varea C., Caballero S., Pastor C., Crespo J., Nicolás J.F., Castañer R., Gil-Moltó J.
Atmospheric Pollution Laboratory (LCA-UMH), Miguel Hernández University, Elche, Spain
Keywords: PM10, diurnal variation, water-soluble ions, traffic *Presenting author email: [email protected]
PM10 samples were collected during two sampling campaigns carried out in summer 2013 and winter 2014 at a traffic site in the urban center of Elche (Galindo and Yubero, 2017). Daytime sampling started at 8 a.m. and nighttime sampling at 10 p.m. The nocturnal period was selected to include the time interval with the minimum values of traffic volumes and solar radiation intensity. Samples were analyzed by ion chromatography to determine the concentrations of major anions and cations. The average daytime and nighttime concentrations of PM10 and the analyzed ions calculated separately for summer and winter are presented in Table 1.
Table 1. Average daytime and nighttime concentrations (µg/m
3) during the summer and winter campaigns.
*Daytime and nighttime average concentrations are statistically different at the 95% confidence level.
During summer, the only component showing statistically significant differences between day and night was nitrate, as previously observed in other urban environments (Vecchi et al, 2009). This was due, on the one hand, to the higher decomposition rate of thermally unstable NH4NO3 during daytime due to greater ambient temperatures. Besides that, the formation of particulate nitrate is favored at night, when relative humidity is high. This was confirmed by the high positive correlation coefficient between nitrate concentrations and relative humidity during nighttime (r = 0.79). The most likely pathway of nitrate formation during nighttime is the hydrolysis of N2O5 (Pun and Seigneur, 2001).
NO2 + O3 NO3 + O2
NO2 + NO3 N2O5
N2O5 + H2O 2 HNO3
PM10 concentrations only showed statistically significant differences between daytime and nighttime during winter. Taking into account that, of the analyzed species, only Ca
2+ (considered a tracer of dust
resuspension) exhibited significantly lower levels during nighttime, the reduction in PM10 concentrations registered during the nocturnal period in winter can be most likely attributed to a decrease in traffic flows. The variation of carbonate concentrations (estimated from the anion deficit) was similar to that of calcium (Fig. 1).
Figure 1. Average carbonate concentrations during the
summer and winter campaigns.
This work was funded by the Spanish Ministry MINECO CGL2012-39623-C02-2 (PRISMA-AITANA) project.
Galindo, N., Yubero, E. (2017). Day-night variability of water-soluble ions in PM10 samples collected at a traffic site in southeatern Spain. Environ. Sci. Pollut. Res. 24, 805-812.
Pun, B.K., Seigneur, C. (2001). Sensitivity of particulate matter nitrate formation to precursor emissions in the California San Joaquin Valley. Environ. Sci. Technol. 35, 2979-2987.
Vecchi, R., Bernardoni, V., Fermo, P., Lucarelli, F., Mazzei, F., Nava, S., Prati, P., Piazzalunga, A., Valli, G. (2009). 4-hours resolution data to study PM10 in a “hot spot” area in Europe. Environ. Monit. Assess. 154, 283-300.
0.0
0.5
1.0
1.5
2.0
2.5
Summer Winter
CO
32-(m
g/m
3)
Daytime Nighttime
Summer Winter
Day Night Day Night
PM10 28.8 27.7 26.1* 20.6* Cl
– 0.87 1.26 1.31 1.43
NO3– 2.20* 3.08* 2.42 2.45
SO42–
3.18 3.19 1.72 1.52 C2O4
2– 0.20 0.21 0.17 0.19
Na+ 0.77 0.84 0.61 0.71
NH4+ 0.58 0.77 0.53 0.75
Mg2+
0.16 0.17 0.14 0.13 Ca
2+ 1.37 1.21 2.04* 1.11*
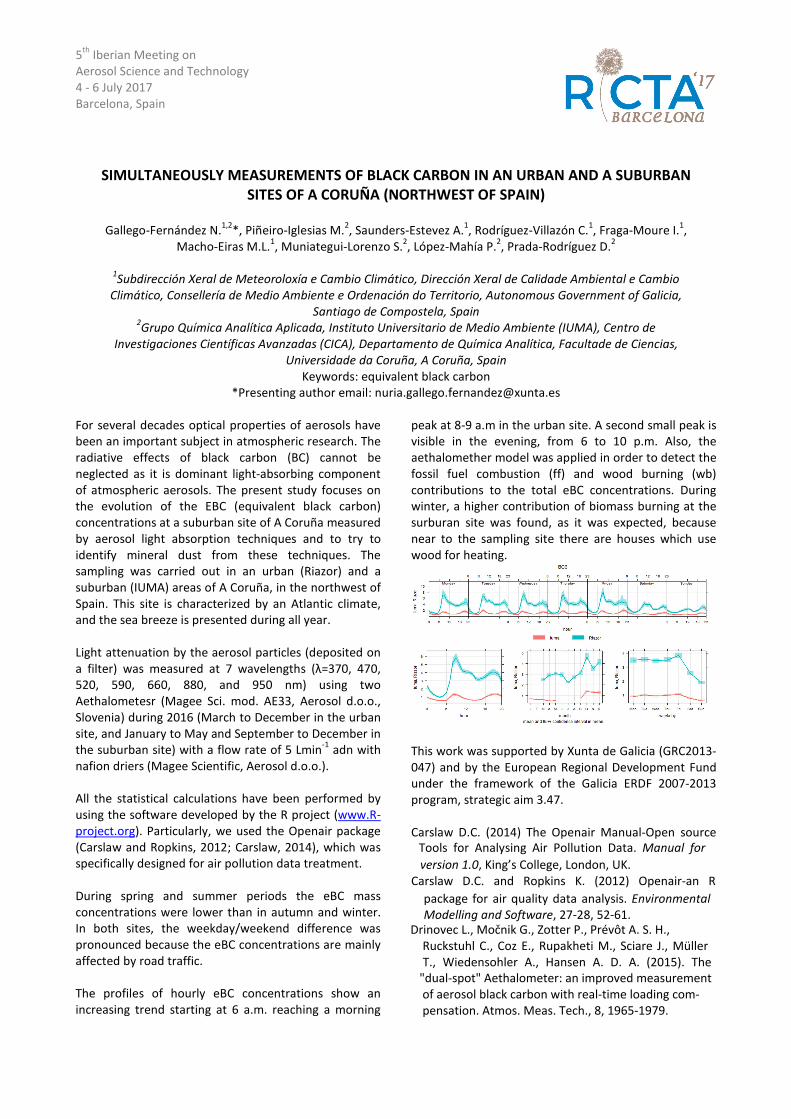
5th
Iberian Meeting on
Aerosol Science and Technology
4 - 6 July 2017
Barcelona, Spain
SIMULTANEOUSLY MEASUREMENTS OF BLACK CARBON IN AN URBAN AND A SUBURBAN SITES OF A CORUÑA (NORTHWEST OF SPAIN)
Gallego-Fernández N.1,2
*, Piñeiro-Iglesias M.2, Saunders-Estevez A.
1, Rodríguez-Villazón C.
1, Fraga-Moure I.
1,
Macho-Eiras M.L.1, Muniategui-Lorenzo S.
2, López-Mahía P.
2, Prada-Rodríguez D.
2
1Subdirección Xeral de Meteoroloxía e Cambio Climático, Dirección Xeral de Calidade Ambiental e Cambio
Climático, Consellería de Medio Ambiente e Ordenación do Territorio, Autonomous Government of Galicia,
Santiago de Compostela, Spain 2Grupo Química Analítica Aplicada, Instituto Universitario de Medio Ambiente (IUMA), Centro de
Investigaciones Científicas Avanzadas (CICA), Departamento de Química Analítica, Facultade de Ciencias,
Universidade da Coruña, A Coruña, Spain
Keywords: equivalent black carbon
*Presenting author email: [email protected]
For several decades optical properties of aerosols have
been an important subject in atmospheric research. The
radiative effects of black carbon (BC) cannot be
neglected as it is dominant light-absorbing component
of atmospheric aerosols. The present study focuses on
the evolution of the EBC (equivalent black carbon)
concentrations at a suburban site of A Coruña measured
by aerosol light absorption techniques and to try to
identify mineral dust from these techniques. The
sampling was carried out in an urban (Riazor) and a
suburban (IUMA) areas of A Coruña, in the northwest of
Spain. This site is characterized by an Atlantic climate,
and the sea breeze is presented during all year.
Light attenuation by the aerosol particles (deposited on
a filter) was measured at 7 wavelengths (λ=370, 470,
520, 590, 660, 880, and 950 nm) using two
Aethalometesr (Magee Sci. mod. AE33, Aerosol d.o.o.,
Slovenia) during 2016 (March to December in the urban
site, and January to May and September to December in
the suburban site) with a flow rate of 5 Lmin-1
adn with
nafion driers (Magee Scientific, Aerosol d.o.o.).
All the statistical calculations have been performed by
using the software developed by the R project (www.R-
project.org). Particularly, we used the Openair package
(Carslaw and Ropkins, 2012; Carslaw, 2014), which was
specifically designed for air pollution data treatment.
During spring and summer periods the eBC mass
concentrations were lower than in autumn and winter.
In both sites, the weekday/weekend difference was
pronounced because the eBC concentrations are mainly
affected by road traffic.
The profiles of hourly eBC concentrations show an
increasing trend starting at 6 a.m. reaching a morning
peak at 8-9 a.m in the urban site. A second small peak is
visible in the evening, from 6 to 10 p.m. Also, the
aethalomether model was applied in order to detect the
fossil fuel combustion (ff) and wood burning (wb)
contributions to the total eBC concentrations. During
winter, a higher contribution of biomass burning at the
surburan site was found, as it was expected, because
near to the sampling site there are houses which use
wood for heating.
This work was supported by Xunta de Galicia (GRC2013-
047) and by the European Regional Development Fund
under the framework of the Galicia ERDF 2007-2013
program, strategic aim 3.47.
Carslaw D.C. (2014) The Openair Manual-Open source
Tools for Analysing Air Pollution Data. Manual for
version 1.0, King’s College, London, UK.
Carslaw D.C. and Ropkins K. (2012) Openair-an R
package for air quality data analysis. Environmental
Modelling and Software, 27-28, 52-61.
Drinovec L., Močnik G., Zotter P., Prévôt A. S. H.,
Ruckstuhl C., Coz E., Rupakheti M., Sciare J., Müller
T., Wiedensohler A., Hansen A. D. A. (2015). The
"dual-spot" Aethalometer: an improved measurement of aerosol black carbon with real-time loading com- pensation. Atmos. Meas. Tech., 8, 1965-1979.
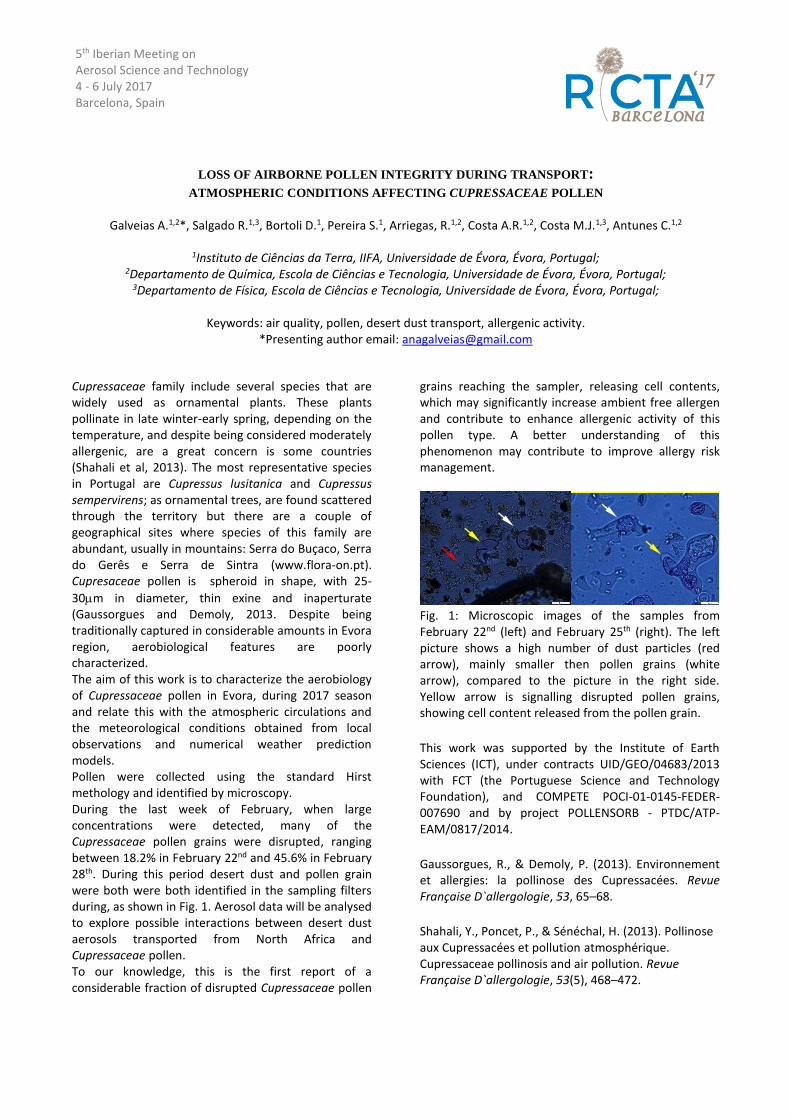
5th Iberian Meeting on Aerosol Science and Technology 4 - 6 July 2017 Barcelona, Spain
LOSS OF AIRBORNE POLLEN INTEGRITY DURING TRANSPORT:
ATMOSPHERIC CONDITIONS AFFECTING CUPRESSACEAE POLLEN
Galveias A.1,2*, Salgado R.1,3, Bortoli D.1, Pereira S.1, Arriegas, R.1,2, Costa A.R.1,2, Costa M.J.1,3, Antunes C.1,2
1Instituto de Ciências da Terra, IIFA, Universidade de Évora, Évora, Portugal;
2Departamento de Química, Escola de Ciências e Tecnologia, Universidade de Évora, Évora, Portugal; 3Departamento de Física, Escola de Ciências e Tecnologia, Universidade de Évora, Évora, Portugal;
Keywords: air quality, pollen, desert dust transport, allergenic activity.
*Presenting author email: [email protected]
Cupressaceae family include several species that are widely used as ornamental plants. These plants pollinate in late winter-early spring, depending on the temperature, and despite being considered moderately allergenic, are a great concern is some countries (Shahali et al, 2013). The most representative species in Portugal are Cupressus lusitanica and Cupressus sempervirens; as ornamental trees, are found scattered through the territory but there are a couple of geographical sites where species of this family are abundant, usually in mountains: Serra do Buçaco, Serra do Gerês e Serra de Sintra (www.flora-on.pt). Cupresaceae pollen is spheroid in shape, with 25-
30m in diameter, thin exine and inaperturate (Gaussorgues and Demoly, 2013. Despite being traditionally captured in considerable amounts in Evora region, aerobiological features are poorly characterized. The aim of this work is to characterize the aerobiology of Cupressaceae pollen in Evora, during 2017 season and relate this with the atmospheric circulations and the meteorological conditions obtained from local observations and numerical weather prediction models. Pollen were collected using the standard Hirst methology and identified by microscopy. During the last week of February, when large concentrations were detected, many of the Cupressaceae pollen grains were disrupted, ranging between 18.2% in February 22nd and 45.6% in February 28th. During this period desert dust and pollen grain were both were both identified in the sampling filters during, as shown in Fig. 1. Aerosol data will be analysed to explore possible interactions between desert dust aerosols transported from North Africa and Cupressaceae pollen. To our knowledge, this is the first report of a considerable fraction of disrupted Cupressaceae pollen
grains reaching the sampler, releasing cell contents, which may significantly increase ambient free allergen and contribute to enhance allergenic activity of this pollen type. A better understanding of this phenomenon may contribute to improve allergy risk management.
Fig. 1: Microscopic images of the samples from February 22nd (left) and February 25th (right). The left picture shows a high number of dust particles (red arrow), mainly smaller then pollen grains (white arrow), compared to the picture in the right side. Yellow arrow is signalling disrupted pollen grains, showing cell content released from the pollen grain.
This work was supported by the Institute of Earth Sciences (ICT), under contracts UID/GEO/04683/2013 with FCT (the Portuguese Science and Technology Foundation), and COMPETE POCI-01-0145-FEDER-007690 and by project POLLENSORB - PTDC/ATP-EAM/0817/2014.
Gaussorgues, R., & Demoly, P. (2013). Environnement et allergies: la pollinose des Cupressacées. Revue Française D`allergologie, 53, 65–68.
Shahali, Y., Poncet, P., & Sénéchal, H. (2013). Pollinose aux Cupressacées et pollution atmosphérique. Cupressaceae pollinosis and air pollution. Revue Française D`allergologie, 53(5), 468–472.
5th
Iberian Meeting on Aerosol Science and Technology 4 - 6 July 2017 Barcelona, Spain
Characterization of PAH, OC, EC and HM in atmospheric particles from a fire at the used
tire landfill located between Seseña and Valdemoro (Spain)
Saúl García dos Santos*, David Galán Madruga, Jesús Alonso Herreros, Almudena Aguiar Sánchez, Regina Muñoz Úbeda, Patricia Abad Valle, Francisco Javier Sánchez Iñigo, Belén Ruíz Suarez de Puga and Rosalía
Fernández Patier
ISCIII - Instituto de Salud Carlos III, National Centre for Environmental Health (Department of Air Pollution), Ctra.Majadahonda-Pozuelo km 2,2, 28220.Majadahonda. Madrid, Spain
Keywords: Atmospheric particles, PAHs, heavy metals, used tire burning. *Presenting author email: [email protected]
From 13th
of May to 7th
of June (2016), a fire took place in a used tire landfill located between Seseña (Toledo) and Valdemoro (Madrid), in Spain. PAHs (polycyclic aromatic hydrocarbons), OC (organic carbon), EC (elemental carbon) and HM (heavy metal), among other pollutants, were sampled and analyzed during this period. Both PM10 and PM2,5 particles were collected in Seseña and Aranjuez. Sampling points were located at Quiñon public school (Seseña) and at Maestro Rodrigo public school (Aranjuez) located 750 m and 10,5 km east and southwest of the Seseña tires landfill, respectively. Particles were collected in quartz fiber filters (Muntkell MK 360) using DIGITEL DHA-80 samplers at 30 m
3/h
flowrate equipped with PM10 and PM2,5 inlets, according to annex B of EN 12341: 2014 standard. The sampling time was 24 h, except the three first days in which the sampling time was 12 h. The OC and EC sampling started on May 27
th using a SWAN/FAI
instruments analyser using 47 mm diameter quartz fiber filters (PallFlex Tisssue QT 2500AT-UP). PAHs, OC+EC and heavy metals were analyzed according to EN 15549: 2008 EN 14902: 2005 standard, an internal procedure and EN 14902: 2005 standard, respectively. Based on results, mean values of PM10/PM2,5 ratio were found to be 1,81 and 1,38 in Seseña and Aranjuez, respectively. PM10 and PM2,5 daily concentrations observed during the fire period were lower, assuming these values as annual means, than the limit values set by the European Legislation. In general, pollutant concentrations were higher in Seseña (Toledo) than in Aranjuez (Madrid). Two periods were identified in Seseña the first one from May 14
th to
29th
and the second period from May 30th
to June 07th
. BaP mean concentrations showed two concentration levels, higher during the first period and lower during the second period with values of 17,54 ng/m
3 and 15,47
ng/m3 (first period) )and 0,18 ng/m
3 and 0,13 ng/m
3
(second period) in PM10 and PM2,5 particles, respectively. Low molecular weight PAHs values were lower than high molecular weight PAHs in Seseña and Aranjuez. The maximum values of evaluated PAHs in Seseña and Aranjuez were observed for benzo-j-fluoranthene + benzo-b-fluoranthene and chrysene. Acenaphthylene was not detected in both locations. The OC and EC pick values, in PM10 and PM2,5, were obtained on May 28
th. This day for PM10, OC and EC
values were 16,74 µg/m3 and 0,49 µg/m
3 respectively.
While, the PM2,5 concentrations reached 15,36 µg/m3
and 0,36 µg/m3 apiece. These results means most of
those carbon fractions were in PM2,5. Moreover, the biggest OC/EC ratio was 42,67 in PM2,5 and 34,16 in PM10 instead. Notice, high OC/EC levels have been reported for clean environments where biological sources were predominant. Metal concentrations (lead, cadmium, nickel and arsenic) in PM10 and PM2,5 fraction in Seseña and Aranjuez were lower than the limit value for lead and those target values for cadmium, nickel and arsenic set by the European Legislation. The remains of the evaluated metals (cupper, chromium, zinc and iron) not have normative values. Higher average concentrations for cupper, chromium and zinc were found in Seseña both PM10 and PM2,5 particles. However, higher average concentration of iron were found in Seseña in PM10 particles and in Aranjuez in PM2,5 particles. The beryllium was in both sites below the quantification limit. Finally, upon the fire was declared extinguish, a further monitoring on the atmospheric pollutants was carried out in order to monitor their trend and the population exposure of the population to them. This work was supported by both Madrid and Castilla- La Mancha Autonomies.
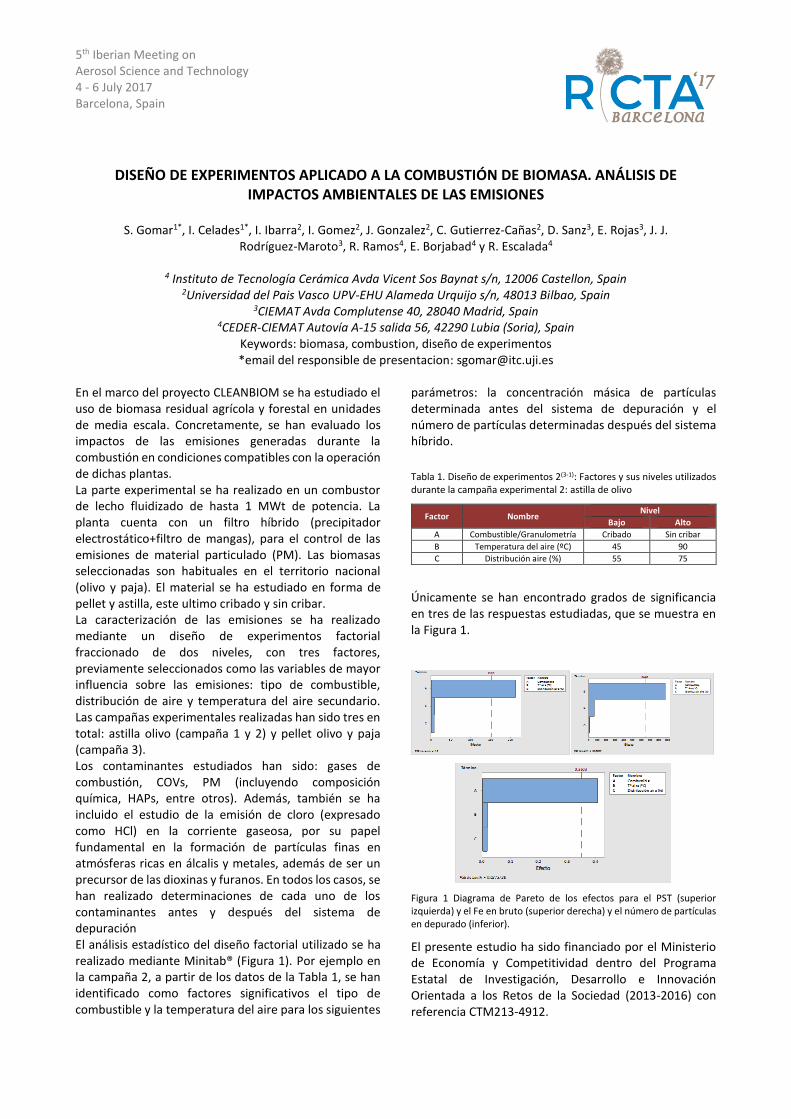
5th Iberian Meeting on Aerosol Science and Technology 4 - 6 July 2017 Barcelona, Spain
DISEÑO DE EXPERIMENTOS APLICADO A LA COMBUSTIÓN DE BIOMASA. ANÁLISIS DE IMPACTOS AMBIENTALES DE LAS EMISIONES
S. Gomar1*, I. Celades1*, I. Ibarra2, I. Gomez2, J. Gonzalez2, C. Gutierrez-Cañas2, D. Sanz3, E. Rojas3, J. J.
Rodríguez-Maroto3, R. Ramos4, E. Borjabad4 y R. Escalada4
4 Instituto de Tecnología Cerámica Avda Vicent Sos Baynat s/n, 12006 Castellon, Spain 2Universidad del Pais Vasco UPV-EHU Alameda Urquijo s/n, 48013 Bilbao, Spain
3CIEMAT Avda Complutense 40, 28040 Madrid, Spain 4CEDER-CIEMAT Autovía A-15 salida 56, 42290 Lubia (Soria), Spain
Keywords: biomasa, combustion, diseño de experimentos *email del responsible de presentacion: [email protected]
En el marco del proyecto CLEANBIOM se ha estudiado el uso de biomasa residual agrícola y forestal en unidades de media escala. Concretamente, se han evaluado los impactos de las emisiones generadas durante la combustión en condiciones compatibles con la operación de dichas plantas. La parte experimental se ha realizado en un combustor de lecho fluidizado de hasta 1 MWt de potencia. La planta cuenta con un filtro híbrido (precipitador electrostático+filtro de mangas), para el control de las emisiones de material particulado (PM). Las biomasas seleccionadas son habituales en el territorio nacional (olivo y paja). El material se ha estudiado en forma de pellet y astilla, este ultimo cribado y sin cribar. La caracterización de las emisiones se ha realizado mediante un diseño de experimentos factorial fraccionado de dos niveles, con tres factores, previamente seleccionados como las variables de mayor influencia sobre las emisiones: tipo de combustible, distribución de aire y temperatura del aire secundario. Las campañas experimentales realizadas han sido tres en total: astilla olivo (campaña 1 y 2) y pellet olivo y paja (campaña 3). Los contaminantes estudiados han sido: gases de combustión, COVs, PM (incluyendo composición química, HAPs, entre otros). Además, también se ha incluido el estudio de la emisión de cloro (expresado como HCl) en la corriente gaseosa, por su papel fundamental en la formación de partículas finas en atmósferas ricas en álcalis y metales, además de ser un precursor de las dioxinas y furanos. En todos los casos, se han realizado determinaciones de cada uno de los contaminantes antes y después del sistema de depuración El análisis estadístico del diseño factorial utilizado se ha realizado mediante Minitab® (Figura 1). Por ejemplo en la campaña 2, a partir de los datos de la Tabla 1, se han identificado como factores significativos el tipo de combustible y la temperatura del aire para los siguientes
parámetros: la concentración másica de partículas determinada antes del sistema de depuración y el número de partículas determinadas después del sistema híbrido.
Tabla 1. Diseño de experimentos 2(3-1): Factores y sus niveles utilizados durante la campaña experimental 2: astilla de olivo
Factor Nombre Nivel
Bajo Alto
A Combustible/Granulometría Cribado Sin cribar
B Temperatura del aire (ºC) 45 90
C Distribución aire (%) 55 75
Únicamente se han encontrado grados de significancia en tres de las respuestas estudiadas, que se muestra en la Figura 1.
Figura 1 Diagrama de Pareto de los efectos para el PST (superior izquierda) y el Fe en bruto (superior derecha) y el número de partículas en depurado (inferior).
El presente estudio ha sido financiado por el Ministerio de Economía y Competitividad dentro del Programa Estatal de Investigación, Desarrollo e Innovación Orientada a los Retos de la Sociedad (2013-2016) con referencia CTM213-4912.
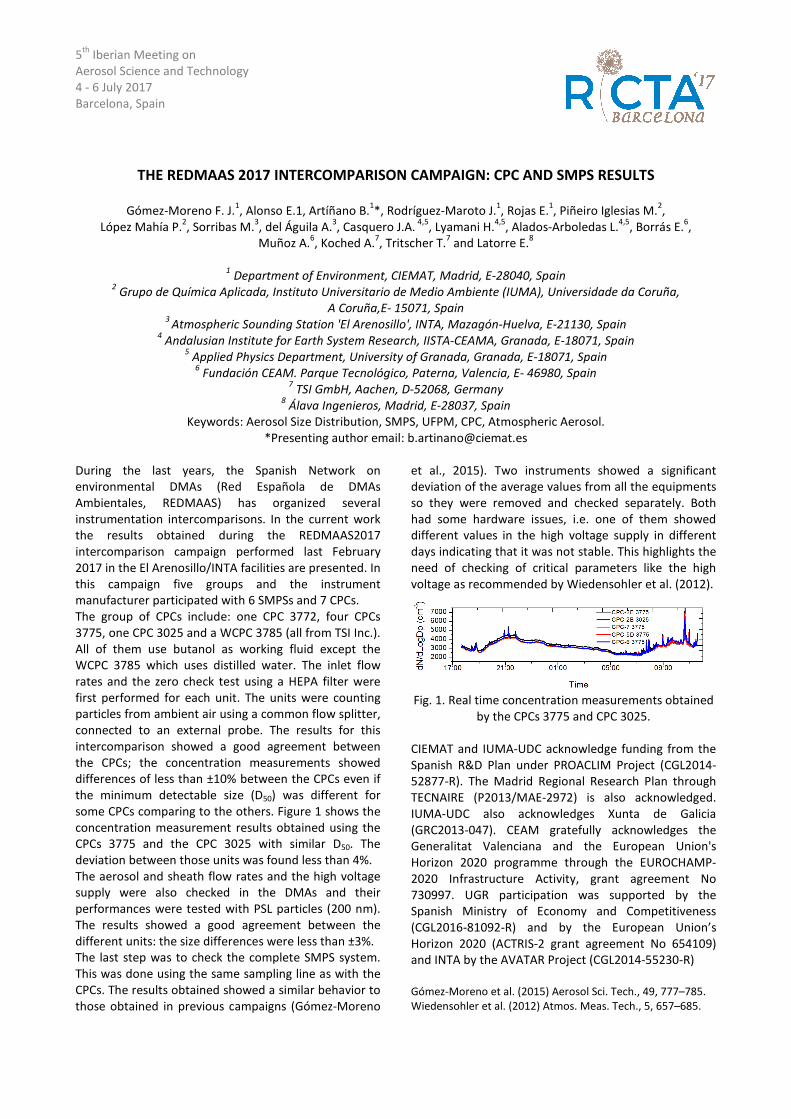
5th
Iberian Meeting on Aerosol Science and Technology 4 - 6 July 2017 Barcelona, Spain
THE REDMAAS 2017 INTERCOMPARISON CAMPAIGN: CPC AND SMPS RESULTS
Gómez-Moreno F. J.1, Alonso E.1, Artíñano B.
1*, Rodríguez-Maroto J.
1, Rojas E.
1, Piñeiro Iglesias M.
2,
López Mahía P.2, Sorribas M.
3, del Águila A.
3, Casquero J.A.
4,5, Lyamani H.
4,5, Alados-Arboledas L.
4,5, Borrás E.
6,
Muñoz A.6, Koched A.
7, Tritscher T.
7 and Latorre E.
8
1 Department of Environment, CIEMAT, Madrid, E-28040, Spain
2 Grupo de Química Aplicada, Instituto Universitario de Medio Ambiente (IUMA), Universidade da Coruña,
A Coruña,E- 15071, Spain 3
Atmospheric Sounding Station 'El Arenosillo', INTA, Mazagón-Huelva, E-21130, Spain 4 Andalusian Institute for Earth System Research, IISTA-CEAMA, Granada, E-18071, Spain
5 Applied Physics Department, University of Granada, Granada, E-18071, Spain
6 Fundación CEAM. Parque Tecnológico, Paterna, Valencia, E- 46980, Spain
7 TSI GmbH, Aachen, D-52068, Germany
8 Álava Ingenieros, Madrid, E-28037, Spain
Keywords: Aerosol Size Distribution, SMPS, UFPM, CPC, Atmospheric Aerosol. *Presenting author email: [email protected]
During the last years, the Spanish Network on environmental DMAs (Red Española de DMAs Ambientales, REDMAAS) has organized several instrumentation intercomparisons. In the current work the results obtained during the REDMAAS2017 intercomparison campaign performed last February 2017 in the El Arenosillo/INTA facilities are presented. In this campaign five groups and the instrument manufacturer participated with 6 SMPSs and 7 CPCs. The group of CPCs include: one CPC 3772, four CPCs 3775, one CPC 3025 and a WCPC 3785 (all from TSI Inc.). All of them use butanol as working fluid except the WCPC 3785 which uses distilled water. The inlet flow rates and the zero check test using a HEPA filter were first performed for each unit. The units were counting particles from ambient air using a common flow splitter, connected to an external probe. The results for this intercomparison showed a good agreement between the CPCs; the concentration measurements showed differences of less than ±10% between the CPCs even if the minimum detectable size (D50) was different for some CPCs comparing to the others. Figure 1 shows the concentration measurement results obtained using the CPCs 3775 and the CPC 3025 with similar D50. The deviation between those units was found less than 4%. The aerosol and sheath flow rates and the high voltage supply were also checked in the DMAs and their performances were tested with PSL particles (200 nm). The results showed a good agreement between the different units: the size differences were less than ±3%. The last step was to check the complete SMPS system. This was done using the same sampling line as with the CPCs. The results obtained showed a similar behavior to those obtained in previous campaigns (Gómez-Moreno
et al., 2015). Two instruments showed a significant deviation of the average values from all the equipments so they were removed and checked separately. Both had some hardware issues, i.e. one of them showed different values in the high voltage supply in different days indicating that it was not stable. This highlights the need of checking of critical parameters like the high voltage as recommended by Wiedensohler et al. (2012).
Fig. 1. Real time concentration measurements obtained
by the CPCs 3775 and CPC 3025. CIEMAT and IUMA-UDC acknowledge funding from the Spanish R&D Plan under PROACLIM Project (CGL2014-52877-R). The Madrid Regional Research Plan through TECNAIRE (P2013/MAE-2972) is also acknowledged. IUMA-UDC also acknowledges Xunta de Galicia (GRC2013-047). CEAM gratefully acknowledges the Generalitat Valenciana and the European Union's Horizon 2020 programme through the EUROCHAMP-2020 Infrastructure Activity, grant agreement No 730997. UGR participation was supported by the Spanish Ministry of Economy and Competitiveness (CGL2016-81092-R) and by the European Union’s Horizon 2020 (ACTRIS-2 grant agreement No 654109) and INTA by the AVATAR Project (CGL2014-55230-R) Gómez-Moreno et al. (2015) Aerosol Sci. Tech., 49, 777–785. Wiedensohler et al. (2012) Atmos. Meas. Tech., 5, 657–685.
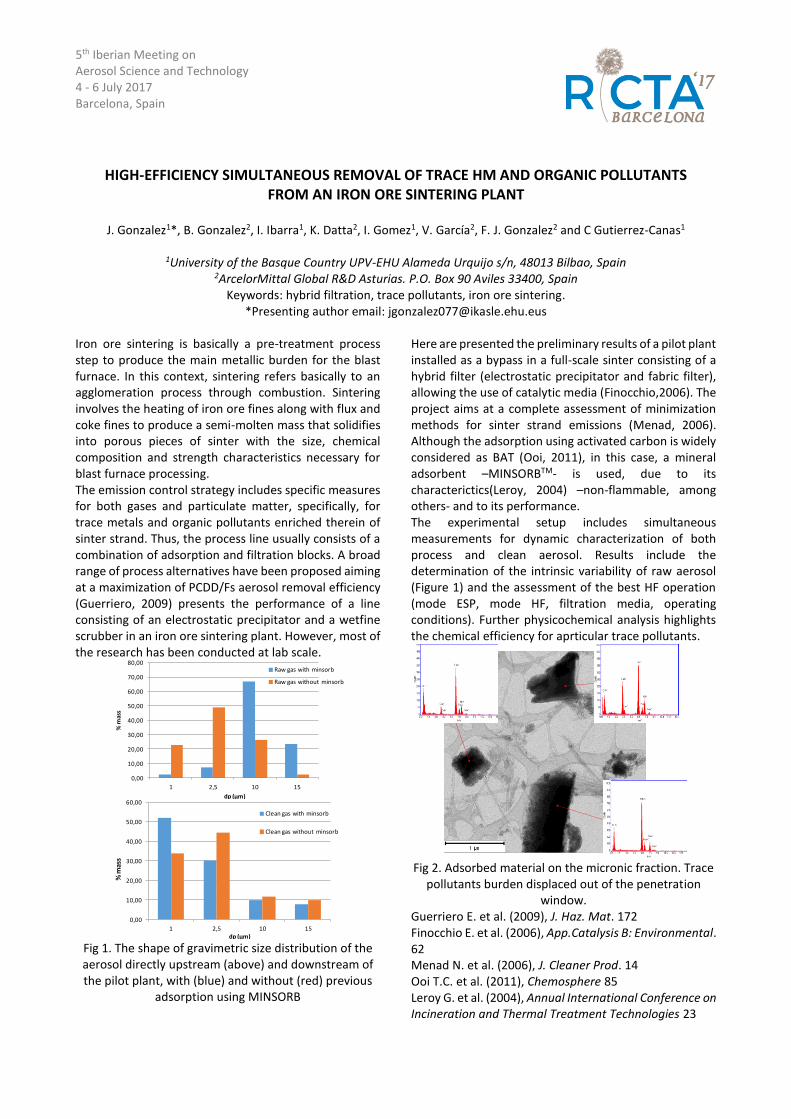
5th Iberian Meeting on Aerosol Science and Technology 4 - 6 July 2017 Barcelona, Spain
HIGH-EFFICIENCY SIMULTANEOUS REMOVAL OF TRACE HM AND ORGANIC POLLUTANTS FROM AN IRON ORE SINTERING PLANT
J. Gonzalez1*, B. Gonzalez2, I. Ibarra1, K. Datta2, I. Gomez1, V. García2, F. J. Gonzalez2 and C Gutierrez-Canas1
1University of the Basque Country UPV-EHU Alameda Urquijo s/n, 48013 Bilbao, Spain
2ArcelorMittal Global R&D Asturias. P.O. Box 90 Aviles 33400, Spain Keywords: hybrid filtration, trace pollutants, iron ore sintering.
*Presenting author email: [email protected]
Iron ore sintering is basically a pre-treatment process step to produce the main metallic burden for the blast furnace. In this context, sintering refers basically to an agglomeration process through combustion. Sintering involves the heating of iron ore fines along with flux and coke fines to produce a semi-molten mass that solidifies into porous pieces of sinter with the size, chemical composition and strength characteristics necessary for blast furnace processing. The emission control strategy includes specific measures for both gases and particulate matter, specifically, for trace metals and organic pollutants enriched therein of sinter strand. Thus, the process line usually consists of a combination of adsorption and filtration blocks. A broad range of process alternatives have been proposed aiming at a maximization of PCDD/Fs aerosol removal efficiency (Guerriero, 2009) presents the performance of a line consisting of an electrostatic precipitator and a wetfine scrubber in an iron ore sintering plant. However, most of the research has been conducted at lab scale.
Fig 1. The shape of gravimetric size distribution of the aerosol directly upstream (above) and downstream of the pilot plant, with (blue) and without (red) previous
adsorption using MINSORB
Here are presented the preliminary results of a pilot plant installed as a bypass in a full-scale sinter consisting of a hybrid filter (electrostatic precipitator and fabric filter), allowing the use of catalytic media (Finocchio,2006). The project aims at a complete assessment of minimization methods for sinter strand emissions (Menad, 2006). Although the adsorption using activated carbon is widely considered as BAT (Ooi, 2011), in this case, a mineral adsorbent –MINSORBTM- is used, due to its characterictics(Leroy, 2004) –non-flammable, among others- and to its performance. The experimental setup includes simultaneous measurements for dynamic characterization of both process and clean aerosol. Results include the determination of the intrinsic variability of raw aerosol (Figure 1) and the assessment of the best HF operation (mode ESP, mode HF, filtration media, operating conditions). Further physicochemical analysis highlights the chemical efficiency for aprticular trace pollutants.
Fig 2. Adsorbed material on the micronic fraction. Trace
pollutants burden displaced out of the penetration window.
Guerriero E. et al. (2009), J. Haz. Mat. 172 Finocchio E. et al. (2006), App.Catalysis B: Environmental. 62 Menad N. et al. (2006), J. Cleaner Prod. 14 Ooi T.C. et al. (2011), Chemosphere 85 Leroy G. et al. (2004), Annual International Conference on Incineration and Thermal Treatment Technologies 23
0,00
10,00
20,00
30,00
40,00
50,00
60,00
70,00
80,00
1 2,5 10 15
% m
ass
dp (µm)
Raw gas with minsorb
Raw gas without minsorb
0,00
10,00
20,00
30,00
40,00
50,00
60,00
1 2,5 10 15
% m
ass
dp (µm)
Clean gas with minsorb
Clean gas without minsorb
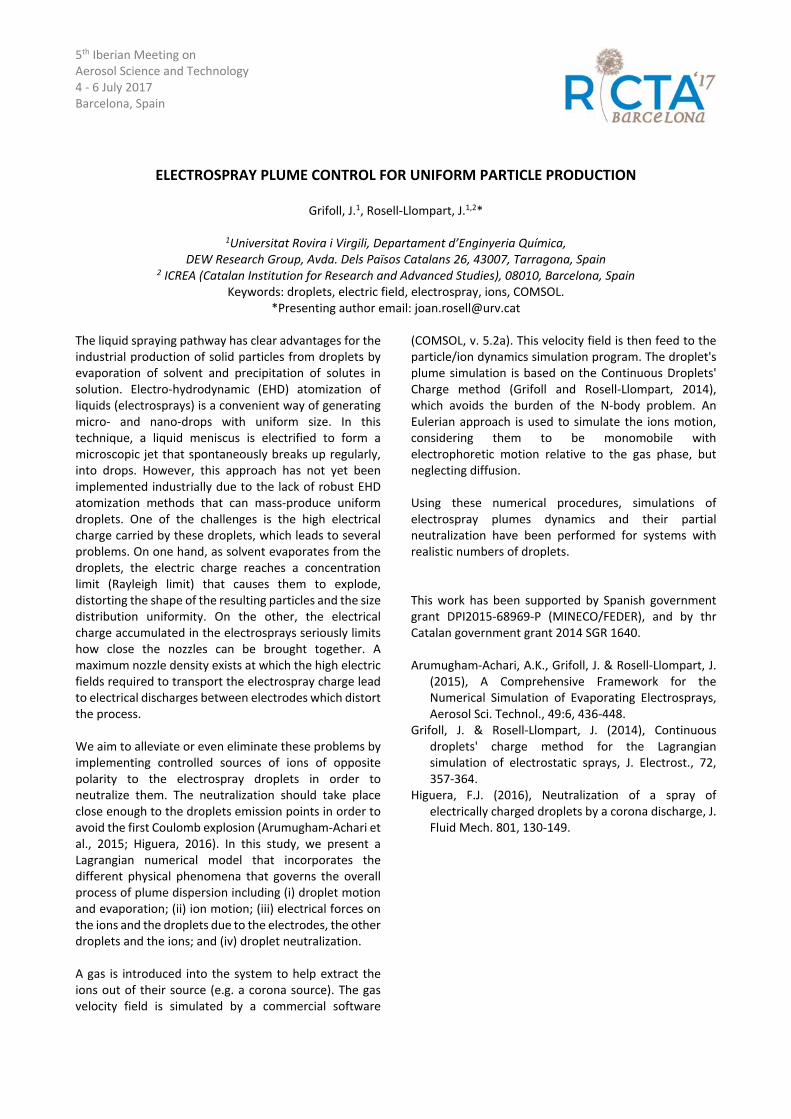
5th Iberian Meeting on Aerosol Science and Technology 4 ‐ 6 July 2017 Barcelona, Spain
ELECTROSPRAY PLUME CONTROL FOR UNIFORM PARTICLE PRODUCTION
Grifoll, J.1, Rosell‐Llompart, J.1,2*
1Universitat Rovira i Virgili, Departament d’Enginyeria Química, DEW Research Group, Avda. Dels Països Catalans 26, 43007, Tarragona, Spain
2 ICREA (Catalan Institution for Research and Advanced Studies), 08010, Barcelona, Spain Keywords: droplets, electric field, electrospray, ions, COMSOL.
*Presenting author email: [email protected]
The liquid spraying pathway has clear advantages for the industrial production of solid particles from droplets by evaporation of solvent and precipitation of solutes in solution. Electro‐hydrodynamic (EHD) atomization of liquids (electrosprays) is a convenient way of generating micro‐ and nano‐drops with uniform size. In this technique, a liquid meniscus is electrified to form a microscopic jet that spontaneously breaks up regularly, into drops. However, this approach has not yet been implemented industrially due to the lack of robust EHD atomization methods that can mass‐produce uniform droplets. One of the challenges is the high electrical charge carried by these droplets, which leads to several problems. On one hand, as solvent evaporates from the droplets, the electric charge reaches a concentration limit (Rayleigh limit) that causes them to explode, distorting the shape of the resulting particles and the size distribution uniformity. On the other, the electrical charge accumulated in the electrosprays seriously limits how close the nozzles can be brought together. A maximum nozzle density exists at which the high electric fields required to transport the electrospray charge lead to electrical discharges between electrodes which distort the process. We aim to alleviate or even eliminate these problems by implementing controlled sources of ions of opposite polarity to the electrospray droplets in order to neutralize them. The neutralization should take place close enough to the droplets emission points in order to avoid the first Coulomb explosion (Arumugham‐Achari et al., 2015; Higuera, 2016). In this study, we present a Lagrangian numerical model that incorporates the different physical phenomena that governs the overall process of plume dispersion including (i) droplet motion and evaporation; (ii) ion motion; (iii) electrical forces on the ions and the droplets due to the electrodes, the other droplets and the ions; and (iv) droplet neutralization. A gas is introduced into the system to help extract the ions out of their source (e.g. a corona source). The gas velocity field is simulated by a commercial software
(COMSOL, v. 5.2a). This velocity field is then feed to the particle/ion dynamics simulation program. The droplet's plume simulation is based on the Continuous Droplets' Charge method (Grifoll and Rosell‐Llompart, 2014), which avoids the burden of the N‐body problem. An Eulerian approach is used to simulate the ions motion, considering them to be monomobile with electrophoretic motion relative to the gas phase, but neglecting diffusion. Using these numerical procedures, simulations of electrospray plumes dynamics and their partial neutralization have been performed for systems with realistic numbers of droplets. This work has been supported by Spanish government grant DPI2015‐68969‐P (MINECO/FEDER), and by thr Catalan government grant 2014 SGR 1640. Arumugham‐Achari, A.K., Grifoll, J. & Rosell‐Llompart, J.
(2015), A Comprehensive Framework for the Numerical Simulation of Evaporating Electrosprays, Aerosol Sci. Technol., 49:6, 436‐448.
Grifoll, J. & Rosell‐Llompart, J. (2014), Continuous droplets' charge method for the Lagrangian simulation of electrostatic sprays, J. Electrost., 72, 357‐364.
Higuera, F.J. (2016), Neutralization of a spray of electrically charged droplets by a corona discharge, J. Fluid Mech. 801, 130‐149.
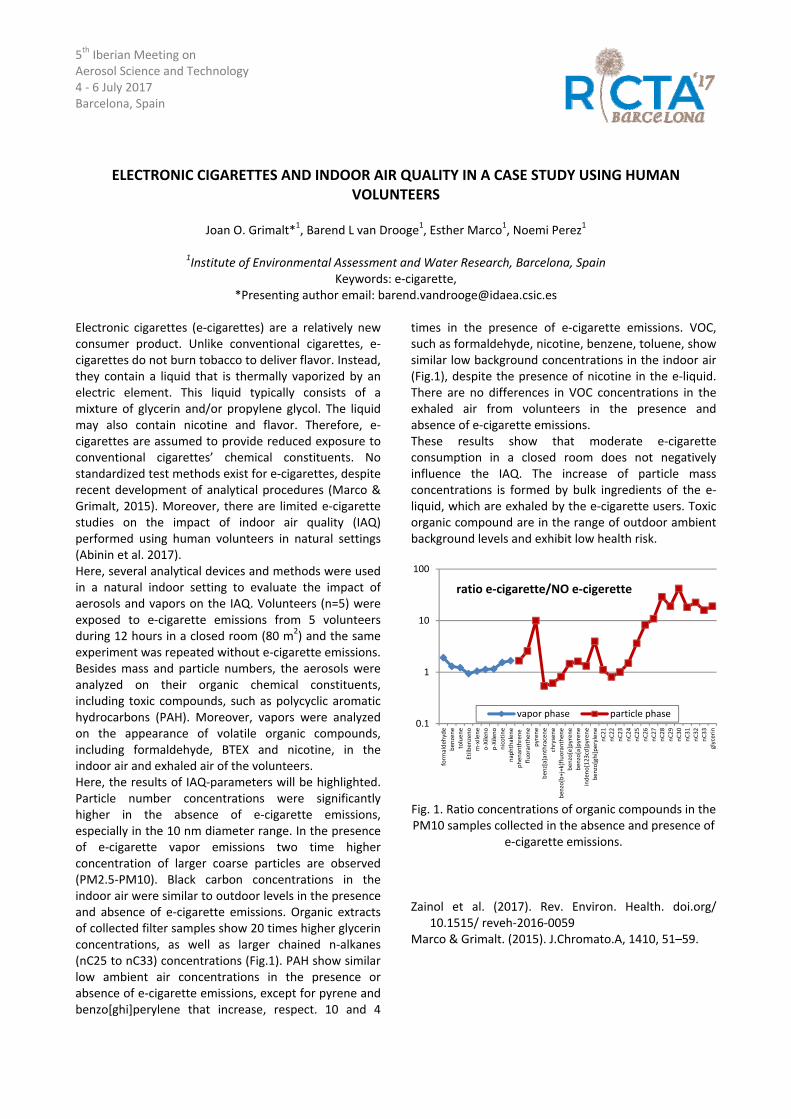
5th Iberian Meeting on Aerosol Science and Technology 4 ‐ 6 July 2017 Barcelona, Spain
ELECTRONIC CIGARETTES AND INDOOR AIR QUALITY IN A CASE STUDY USING HUMAN VOLUNTEERS
Joan O. Grimalt*1, Barend L van Drooge1, Esther Marco1, Noemi Perez1
1Institute of Environmental Assessment and Water Research, Barcelona, Spain
Keywords: e‐cigarette, *Presenting author email: [email protected]
Electronic cigarettes (e‐cigarettes) are a relatively new consumer product. Unlike conventional cigarettes, e‐cigarettes do not burn tobacco to deliver flavor. Instead, they contain a liquid that is thermally vaporized by an electric element. This liquid typically consists of a mixture of glycerin and/or propylene glycol. The liquid may also contain nicotine and flavor. Therefore, e‐cigarettes are assumed to provide reduced exposure to conventional cigarettes’ chemical constituents. No standardized test methods exist for e‐cigarettes, despite recent development of analytical procedures (Marco & Grimalt, 2015). Moreover, there are limited e‐cigarette studies on the impact of indoor air quality (IAQ) performed using human volunteers in natural settings (Abinin et al. 2017). Here, several analytical devices and methods were used in a natural indoor setting to evaluate the impact of aerosols and vapors on the IAQ. Volunteers (n=5) were exposed to e‐cigarette emissions from 5 volunteers during 12 hours in a closed room (80 m2) and the same experiment was repeated without e‐cigarette emissions. Besides mass and particle numbers, the aerosols were analyzed on their organic chemical constituents, including toxic compounds, such as polycyclic aromatic hydrocarbons (PAH). Moreover, vapors were analyzed on the appearance of volatile organic compounds, including formaldehyde, BTEX and nicotine, in the indoor air and exhaled air of the volunteers. Here, the results of IAQ‐parameters will be highlighted. Particle number concentrations were significantly higher in the absence of e‐cigarette emissions, especially in the 10 nm diameter range. In the presence of e‐cigarette vapor emissions two time higher concentration of larger coarse particles are observed (PM2.5‐PM10). Black carbon concentrations in the indoor air were similar to outdoor levels in the presence and absence of e‐cigarette emissions. Organic extracts of collected filter samples show 20 times higher glycerin concentrations, as well as larger chained n‐alkanes (nC25 to nC33) concentrations (Fig.1). PAH show similar low ambient air concentrations in the presence or absence of e‐cigarette emissions, except for pyrene and benzo[ghi]perylene that increase, respect. 10 and 4
times in the presence of e‐cigarette emissions. VOC, such as formaldehyde, nicotine, benzene, toluene, show similar low background concentrations in the indoor air (Fig.1), despite the presence of nicotine in the e‐liquid. There are no differences in VOC concentrations in the exhaled air from volunteers in the presence and absence of e‐cigarette emissions. These results show that moderate e‐cigarette consumption in a closed room does not negatively influence the IAQ. The increase of particle mass concentrations is formed by bulk ingredients of the e‐liquid, which are exhaled by the e‐cigarette users. Toxic organic compound are in the range of outdoor ambient background levels and exhibit low health risk.
Fig. 1. Ratio concentrations of organic compounds in the PM10 samples collected in the absence and presence of
e‐cigarette emissions.
Zainol et al. (2017). Rev. Environ. Health. doi.org/ 10.1515/ reveh‐2016‐0059
Marco & Grimalt. (2015). J.Chromato.A, 1410, 51–59.
0.1
1
10
100
form
aldeh
yde
ben
zene
toluen
e
Etilben
zeno
m‐xilene
o‐Xileno
p‐Xileno
nicotine
naphthalen
e
phen
anthrene
fluoranthen
e
pyren
e
ben
z[a]anthracene
chrysene
ben
zo[b+j+k]fluoranthene
ben
zo[e]pyrene
ben
zo[a]pyren
e
inden
o[123cd]pyrene
ben
zo[ghi]perylene
nC21
nC22
nC23
nC24
nC25
nC26
nC27
nC28
nC29
nC30
nC31
nC32
nC33
glycerin
ratio e‐cigarette/NO e‐cigerette
vapor phase particle phase
5th Iberian MAerosol Scien4 ‐ 6 July 201Barcelona, Sp
1Univer
Soil erosion distances, thJune 2016 atmospheric Nevada, Spintrusion wawith almost a heavy loadthe aerosol sof 192 Mm‐1
In period 2 whereas in prose to 317Within the pstill the perioshows the s
Figure 1: Me The sdifferent, forphase functioSahara dust,is less and Sahara aerohigher forwbackscatterinirregular shadifference inangle of 5.5°is 1.6 times h
Meeting on nce and Techn17 pain
A
Helmrsity of Vienna
2 Unive
aerosols canhe Sahara is the volume aerosol has pain. At thes observed (pnegligible infd of Sahara dscattering coe1, correspondthe values wperiod 3 the 7 Mm‐1 droperiods considods definitelycattering coe
easured scatte
cattering funcr average phaon, measured is more symthe backscatosol. The Sahward scatter,ng is consideape of the dn the forward° the value of higher than in
nology
ANGULAR S
muth Horvath1
a, Faculty of Persity of Grana
Keywords: *Present
n be transporone of the m scattering been measu
e beginning period 1), follofluence, finallyust was obseefficient had ing to a visuawere 85 Mm‐
average scatping the visierable variati can be distinefficient as a
ering coefficie
ction in the tase functions d during the pmetric, the fottering is highhara aerosol , due to lerably smallerdust particlesd scattering othe phase fun period 2.
SCATTERING
, Lucas AladosPhysics, Aerosoada, DepartmLight scatterinting author em
rted considermajor sourcesfunction of red in the Simoderate
owed by perioy during perioerved. In perioan average val range of 19 ‐1 and 43 tering coefficibility to 12 ons occurred,nguished. Figufunction of t
ent.
hree periods see figure 2. period which lorward scatteher than for particles havarger size. r, caused by s. A consideroccurs, e.g. anction in perio
G OF THE SA
s Arboledas2 ,ol Physics and
ment of Appliedng, Asymmetrmail: Helmuth
rable s. In the
ierra dust od 2 od 3 od 1 value km. km, cient km. , but ure 1 ime.
was The little ering the
ve a The the
rable t an od 3
Figu Thisalmpostheme(asySah
FigurepConnepdist
AHARA DUS
and Franciscod Environmentd Physics, E‐18ry, Sahara, Phh.Horvath@un
ure 2: Average
s is difficult tomost 5 orders ssible by com backscatteasurement iymmetry,backhara and non‐
ure 3: Data oresented in thnclusion: Uphelometer, tinguished.
ST AEROSO
o Jose Olmo Rtal Physics, A‐8071 Granadaase function nivie.ac.at
e Phase Funct
o see, since thof magnitud
mparing the aered fractions representekscattering ) p‐Sahara aeros
obtained withhe (asymmetrysing a nesoil erosion
OL
Reyes2 ‐1090 Vienna,a, Spain
tions in the th
he phase funcdes. A better asymmetry pan. In figued as a pplane. With osols are clear
h the polar ny vs backscattewly develparticles ca
Austria
hree periods.
tion varies bydistinction isarameter andre 3 eachoint in theone exceptionrly separated.
nephelometertering) space.oped polaran easily be
y s d h e n .
r
r e
5th Iberian Meeting on Aerosol Science and Technology 4 - 6 July 2017 Barcelona, Spain
TRACE METAL AND PAH ENRICHMENT WITHIN THE PENETRATION WINDOW OF AN ESP
I. Ibarra1*, I. Gomez1, J. Gonzalez1, S. García2, D. Sanz2, E. Rojas2, J. J. Rodríguez-Maroto2, R. Ramos3, E. Borjabad3, R. Escalada3, I. Celades4, S. Gomar4, V. Sanfelix4 and C Gutierrez-Cañas1
1Universidad del Pais Vasco UPV-EHU Alameda Urquijo s/n, 48013 Bilbao, Spain
2CIEMAT Avda Complutense 40, 28040 Madrid, Spain 3CEDER-CIEMAT Autovía A-15 salida 56, 42290 Lubia (Soria), Spain
4 Instituto de Tecnología Cerámica Avda Vicent Sos Baynat s/n, 12006 Castellon, Spain Keywords: biomass, combustion, PAH
*Presenting author email: [email protected]
Medium-scale Combustion Plants (MCPs) are a feasible alternative for agricultural or forestry waste management. In this work a MCP is equipped with a Hybrid Filter (HF), which integrates electrostatic precipitator (ESP) with 4 collected hoppers and bag filter (BF), as described in detail by Aragon et al (2015). The experimental campaigns were performed using olive tree pruning and wheat straw pellets, with 30% of excess air for combustion and a bed temperature of 840ºC. In order to study the trace metal and PAH presence in the ESP penetration window, emission measurements (mass and number size distributions) and the composition of ashes collected along the HF were made.
Fig 1. Total number concentration (red: raw and blue: clean gas) firing olive tree pruning pellets (left) and
wheat straw pellets (right).
The HF is able to deal with different raw gas concentrations depending on the fuel, as it is observed in Figure 1. In the Figure 2 is shown the mass distribution before and after de HF using both fuels. In this case the mass distribution over size depends strongly on the fuel and the air-to-fuel ratio. The residence time is roughly the same along the process line. The PAHs are distributed unevenly within the penetration window of the ESP (Figure 3). The bag filter downstream ensures the removal of this fraction. For multiproduct biomass boilers, the HF ensures not only the performance when challenged with different aerosol loads, but also an enough efficient control of the trace pollutants mainly present in the near-micronic size range.
Fig 2. Mass relative distribution in raw (left) and clean (right) gas firing olive tree pruning pellets (above) and
wheat straw pellets (below).
Fig 3. PAHs distribution (%) in the ashes collected along de HF firing olive tree pruning. Aragon, G. et al. (2015), Enhanced Control of Fine Particle Emissions from Waste Biomass Combustion Using a Hybrid Filter, Energy & Fuels 29.
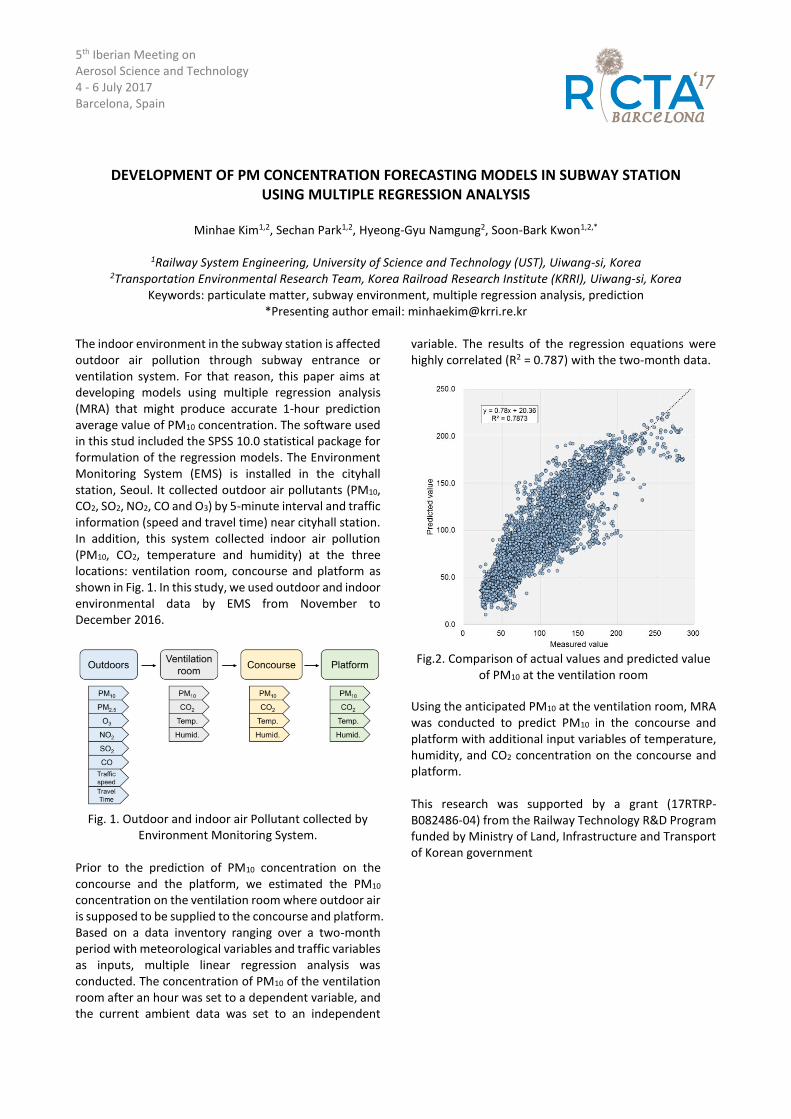
5th Iberian Meeting on Aerosol Science and Technology 4 - 6 July 2017 Barcelona, Spain
DEVELOPMENT OF PM CONCENTRATION FORECASTING MODELS IN SUBWAY STATION USING MULTIPLE REGRESSION ANALYSIS
Minhae Kim1,2, Sechan Park1,2, Hyeong-Gyu Namgung2, Soon-Bark Kwon1,2,*
1Railway System Engineering, University of Science and Technology (UST), Uiwang-si, Korea
2Transportation Environmental Research Team, Korea Railroad Research Institute (KRRI), Uiwang-si, Korea Keywords: particulate matter, subway environment, multiple regression analysis, prediction
*Presenting author email: [email protected]
The indoor environment in the subway station is affected outdoor air pollution through subway entrance or ventilation system. For that reason, this paper aims at developing models using multiple regression analysis (MRA) that might produce accurate 1-hour prediction average value of PM10 concentration. The software used in this stud included the SPSS 10.0 statistical package for formulation of the regression models. The Environment Monitoring System (EMS) is installed in the cityhall station, Seoul. It collected outdoor air pollutants (PM10, CO2, SO2, NO2, CO and O3) by 5-minute interval and traffic information (speed and travel time) near cityhall station. In addition, this system collected indoor air pollution (PM10, CO2, temperature and humidity) at the three locations: ventilation room, concourse and platform as shown in Fig. 1. In this study, we used outdoor and indoor environmental data by EMS from November to December 2016.
Fig. 1. Outdoor and indoor air Pollutant collected by
Environment Monitoring System. Prior to the prediction of PM10 concentration on the concourse and the platform, we estimated the PM10 concentration on the ventilation room where outdoor air is supposed to be supplied to the concourse and platform. Based on a data inventory ranging over a two-month period with meteorological variables and traffic variables as inputs, multiple linear regression analysis was conducted. The concentration of PM10 of the ventilation room after an hour was set to a dependent variable, and the current ambient data was set to an independent
variable. The results of the regression equations were highly correlated (R2 = 0.787) with the two-month data.
Fig.2. Comparison of actual values and predicted value
of PM10 at the ventilation room
Using the anticipated PM10 at the ventilation room, MRA was conducted to predict PM10 in the concourse and platform with additional input variables of temperature, humidity, and CO2 concentration on the concourse and platform. This research was supported by a grant (17RTRP-B082486-04) from the Railway Technology R&D Program funded by Ministry of Land, Infrastructure and Transport of Korean government
5th Iberian Meeting on Aerosol Science and Technology 4 -‐ 6 July 2017 Barcelona, Spain
ON THE CHALLENGES AND THE DECISION-‐MAKING PROCESSS FOR AN OPTIMAL EXPOSURE
ASSESSMENT METHODOLOGY IN MULTI-‐SOURCE INDUSTRIAL SCENARIOS (MSIS) Lopez de Ipina J.1*, Vaquero C.1, Gutierrez-‐Canas C.2
1TECNALIA – Industry and Transport Division, Parque Tecnológico de Alava, 01510 Miñano/Spain
2U. del Pais Vasco UPV/EHU, Chem. and Env. Eng. Department, Alameda de Urquijo s/n, 48013 Bilbao/Spain Keywords: exposure assessment, NOAA, background, ,MSIS. *Presenting author email: [email protected]
Due to the progressive increase of the industrial processes that manufacture of intermediate and end products incorporating ENMs, the assessment of occupational exposure to airborne NOAA will migrate, from the simple and well-‐controlled contexts towards much more complex exposure scenarios. Multisource and dynamic release patterns (MSIS; López de Ipiña JM et al, in press) associated with these processes – which will also coexist with conventional processes -‐ will in near future make the assessment of exposure to NOAA more complex and probably expensive for industrial hygienists. The use of PNC (Particle Number Concentration) records in the assessment of low-‐medium complexity exposure scenarios following the well-‐established tiered approaches has been well demonstrated and documented (Asbach, 2015). The significant development achieved during recent years in the field of occupational exposure assessment to NOAA (availability of direct-‐reading instrumentation (DRI) – including portable and personal devices -‐tiered approaches, recommended NRVs/OELs, among others) allows a widespread use of new methods and instruments in industrial scenarios. However, the mere use of this metric in MSIS can lead to erroneous assessment due to unforeseen influences of simultaneously running processes (Ono-‐Ogasawara et al, 2009; Vaquero et al, 2016). In addition, the choice of the instrument, if possible, determines the measurement strategy and the final accuracy of the data. In this work some examples of typical challenging situations using PNC for risk assessment of occupational exposure to airborne NOAA will be presented when confronted to those complex industrial scenarios. 1 Temporal background signal masking the potential contribution of NOAA release from the raw series of PNC.
2 Significant disagreement between signals of the background aerosol (PNC) measured in two positions situated very close to each other. 3 Discrepancies in PNC records from collocated instruments. Instrument choice. 4 Aerosol characteristics retrieval (PNC) from simultaneously measured metrics, such as aerodynamic and mobility equivalent diameters. The complexity of workplaces highlighted the next step directions in research:
§ The determination of the most reliable strategy for the background assessment
§ The identification/development of cost effective and chemical selective methods
§ The use of DRI as the core block of the engineering controls
This paper exploits the results of Project SCAFFOLD (EU FP7 grant agreement No. 280535) and EHS Advance (Basque Government, Etortek grant). This paper reflects only the authors’ views and the Commission is not responsible for any use that may be made of the information contained therein. Project. The authors would also acknowledge BOSTLAN (Bizkaia, Spain) and TECNAN (Navarra, Spain) for the support provided to carry out the exposure measurements in their respective facilities. Asbach C (2015) Exposure Measurement at Workplaces.
In Nanoengineering, Elsevier (2015), 523-‐555. López de Ipiña JM, Vaquero C., C Gutierrez-‐Cañas,
Towards an optimal adaptation of exposure to NOAA assessment methodology in Multi-‐Source Industrial Scenarios (MSIS): the challenges and the decision-‐making process, J. Physics, (in press)
Ono-‐Ogasawara M, Serita F and Takaya M (2009) Distinguishing nanomaterial particles from background airborne particulate matter for quantitative exposure assessment. J Nanopart Res 2009, 11, 1651-‐1659.
Vaquero C, Gutierrez-‐Cañas C, Galarza N and Lopez de Ipiña JM Exposure assessment to engineered nanoparticles handled in industrial workplaces: The case of alloying nano-‐TiO2 in new steel formulations. J. Aerosol Sci. Vol. 102 (2016), 1–15.
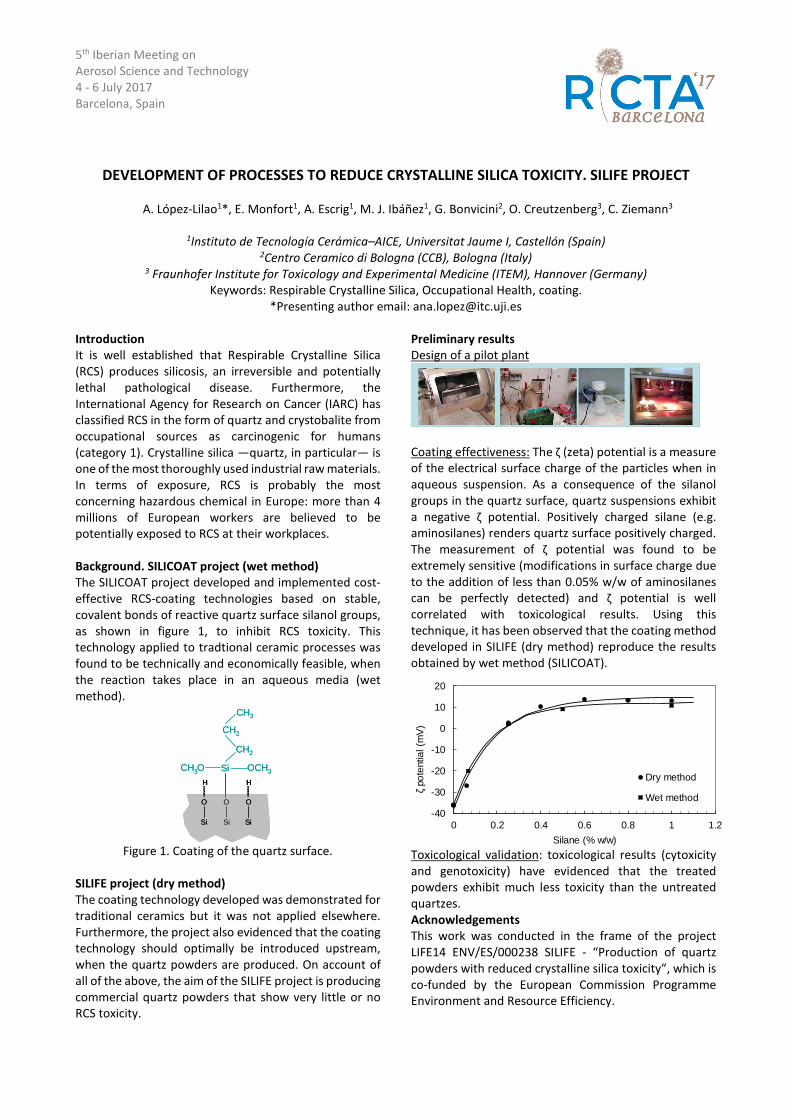
5th Iberian Meeting on
Aerosol Science and Technology
4 - 6 July 2017
Barcelona, Spain
DEVELOPMENT OF PROCESSES TO REDUCE CRYSTALLINE SILICA TOXICITY. SILIFE PROJECT
A. López-Lilao1*, E. Monfort1, A. Escrig1, M. J. Ibáñez1, G. Bonvicini2, O. Creutzenberg3, C. Ziemann3
1Instituto de Tecnología Cerámica–AICE, Universitat Jaume I, Castellón (Spain)
2Centro Ceramico di Bologna (CCB), Bologna (Italy) 3 Fraunhofer Institute for Toxicology and Experimental Medicine (ITEM), Hannover (Germany)
Keywords: Respirable Crystalline Silica, Occupational Health, coating.
*Presenting author email: [email protected]
Introduction
It is well established that Respirable Crystalline Silica
(RCS) produces silicosis, an irreversible and potentially
lethal pathological disease. Furthermore, the
International Agency for Research on Cancer (IARC) has
classified RCS in the form of quartz and crystobalite from
occupational sources as carcinogenic for humans
(category 1). Crystalline silica —quartz, in particular— is
one of the most thoroughly used industrial raw materials.
In terms of exposure, RCS is probably the most
concerning hazardous chemical in Europe: more than 4
millions of European workers are believed to be
potentially exposed to RCS at their workplaces.
Background. SILICOAT project (wet method)
The SILICOAT project developed and implemented cost-
effective RCS-coating technologies based on stable,
covalent bonds of reactive quartz surface silanol groups,
as shown in figure 1, to inhibit RCS toxicity. This
technology applied to tradtional ceramic processes was
found to be technically and economically feasible, when
the reaction takes place in an aqueous media (wet
method).
Figure 1. Coating of the quartz surface.
SILIFE project (dry method)
The coating technology developed was demonstrated for
traditional ceramics but it was not applied elsewhere.
Furthermore, the project also evidenced that the coating
technology should optimally be introduced upstream,
when the quartz powders are produced. On account of
all of the above, the aim of the SILIFE project is producing
commercial quartz powders that show very little or no
RCS toxicity.
Preliminary results
Design of a pilot plant
Coating effectiveness: The ζ (zeta) potential is a measure
of the electrical surface charge of the particles when in
aqueous suspension. As a consequence of the silanol
groups in the quartz surface, quartz suspensions exhibit
a negative ζ potential. Positively charged silane (e.g.
aminosilanes) renders quartz surface positively charged.
The measurement of ζ potential was found to be
extremely sensitive (modifications in surface charge due
to the addition of less than 0.05% w/w of aminosilanes
can be perfectly detected) and ζ potential is well
correlated with toxicological results. Using this
technique, it has been observed that the coating method
developed in SILIFE (dry method) reproduce the results
obtained by wet method (SILICOAT).
Toxicological validation: toxicological results (cytoxicity
and genotoxicity) have evidenced that the treated
powders exhibit much less toxicity than the untreated
quartzes.
Acknowledgements
This work was conducted in the frame of the project
LIFE14 ENV/ES/000238 SILIFE - “Production of quartz
powders with reduced crystalline silica toxicity”, which is
co-funded by the European Commission Programme
Environment and Resource Efficiency.
CH3
CH2
CH2
Si OCH3CH3O
O
H
Si
O
H
Si
O
Si
CH3
CH2
CH2
Si OCH3CH3O
O
H
Si
O
H
Si
O
H
Si
O
H
Si
O
Si-40
-30
-20
-10
0
10
20
0 0.2 0.4 0.6 0.8 1 1.2
ζ po
tent
ial (
mV
)
Silane (% w/w)
Dry method
Wet method
5th Iberian Meeting on Aerosol Science and Technology 4 - 6 July 2017 Barcelona, Spain
Inorganic Ions and Trace Metals Bulk Deposition at an Atlantic Coastal European Region
López-Mahía P.1*, Moreda-Piñeiro J.1, Alonso-Rodríguez E.1, Turnes-Carou I.1, Moscoso-Pérez C.1, Blanco-Heras G.1, Gómez Tellado L.2, Muniategui-Lorenzo S.1, Prada-Rodríguez D.1
1 Grupo Química Analítica Aplicada (QANAP), University Institute of Research in Environmental Studies (IUMA), Centro de Investigaciones Científicas Avanzadas (CICA), Department of Analytical Chemistry. Faculty of Sciences.
University of A Coruña. Campus de A Coruña, s/n. 15071 – A Coruña. Spain. 2 Laboratorio de Medio Ambiente de Galicia, Consellería de Medio Ambiente, Territorio e Infraestructuras,
15008 – A Coruña. Spain. Keywords: Bulk deposition, Major ions, Trace metals, Urban sites, Atlantic Coastal European Region
*Presenting author email: [email protected]
Rainwater compositional measurements allows us to understand several atmospheric processes, quantify the spatial and seasonal distribution of wet and dry deposition, the sources, and altitude of atmospheric transport or dispersion of nutrient and pollutants in a region. Potential impacts to ecosystems, through deposition processes, of nutrients and pollutants could be predicted (Zunckel et al. 2003, Powell et al. 2015). The objective of this short-term study is the assessment of the inorganic chemistry of bulk deposition, the identification of possible sources of major ions and trace metals and the establishment of data of those species at coastal urban sites of the northwest of peninsular Iberian, where data are not available. Also, solubility of trace metals (partition coefficients) was assessed. Although in this investigation the sources of major ions and trace metals are identified at a local site (coastal urban sites of the northwest of peninsular Iberian), some results obtained can be extrapolated to northwest Atlantic coast sites of Europe. This fact is due to according to NOAA HYSPLIT Model, main air mass samples in the northwest Atlantic facade of Europe are transported from the Atlantic Ocean. The inorganic chemical composition of bulk deposition samples were collected monthly with bulk collectors at seven Atlantic Coastal European cities (Galicia, Northwest of Spain) during wet season (September 2011 to March 2012) has been assessed and compared. Trace metals (Al, As, Ba, Co, Cr, Cu, Fe, Mn, Ni, Pb, Sr, V and Zn) were analysed in soluble fraction (SF) and non-soluble fraction (NSF) of the bulk deposition by ICP-MS. Major inorganic ions (Cl−, NO3−, SO42−, Na+, K+, Ca2+, Mg2+ and NH4+) were analysed in the soluble fraction of the bulk deposition by CZE. The abundance of Ca2+ (alkaline character) and Cl− and SO42− (acidic nature) dictates the pH of the rain events. High Al, Ba, Fe and Zn concentrations from SF and NSF
were found at seven sites. Some differences on the major inorganic composition of bulk deposition at coastal and inland sites were achieved. High sea salt ions (Cl−, Na+ and also Mg2+) concentrations were found in coastal site. High NH4+ concentrations were associated to inland sites with major agricultural activity. Cl−, Na+ and also Mg2+ concentrations in bulk deposition at these sites are due to sea contribution. On contrary, SO42−, Ca2+, Al and Fe concentrations in bulk deposition are due to crustal source (high nss-SO42− and nss-Ca2+ concentrations and high crust enrich factor values for Fe have been achieved). Low NO3− concentrations were found due to the transport of cleaner Atlantic air masses from the sea. Anthropogenic activities such as the use of ammonium nitrate fertilizer and biomass burning are the main NH4+ and K+ sources. Trace metals such as Co, Cr, Cu, Mn, Ni, Pb, Sr, V and Zn were emitted mainly by anthropogenic sources (high crust enrich factor values, which showed a non-crustal origin of these metals). Finally, trace metals solubilities were lower than 5.8 % for crustal metals (Al and Fe) and in the range of 7 to 93% for anthropogenic metals such as Ba, Co, Cr, Cu, Mn, Ni, Pb, Sr, V and Zn. This work was supported by Xunta de Galicia (Programa de Consolidación y Estructuración de Unidades de Investigación Competitivas 2013-2016, ref: GRC2013-047 and Dirección Xeral de Desevolvemento e innovación, ref: 10MSD 164019PR) and Ministerio de Ciencia e Innovación (Plan Nacional I+D+I 2008-2011, ref: CGL2010-18145) for financial support. The authors thank Laboratorio de Medio Ambiente de Galicia (Consellería de Medio Ambiente, Territorio e Infraestructuras, Xunta de Galicia) and Servicios Xerais de Apoio a Investigación at the University of A Coruña. Powell, et al. (2015), Estimation of the Atmospheric Flux
of Nutrients and Trace Metals to the Eastern Tropical North Atlantic Ocean, J. Atmos. Sci. 72, 4029−4045.
Zunckel et al. (2003), Rainwater composition in northeast Uruguay, Atmos. Environ. 37, 1601–1611.
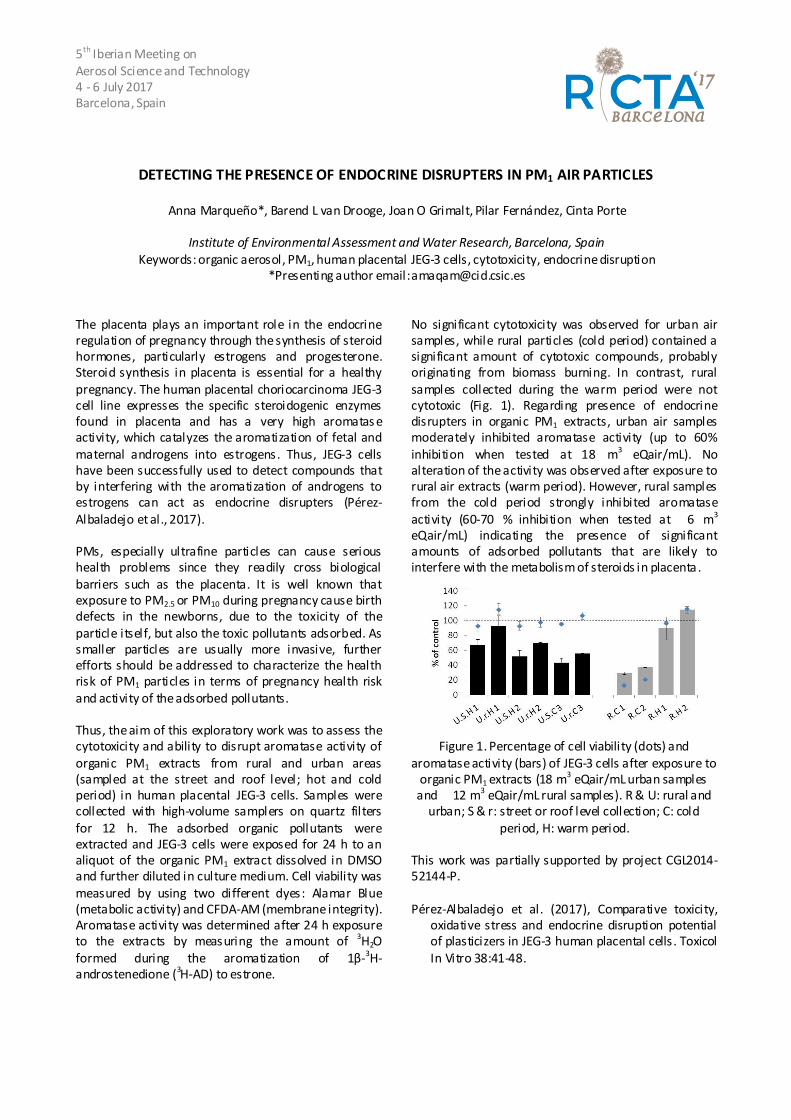
5th Iberian Meeting on Aerosol Science and Technology 4 - 6 July 2017 Barcelona, Spain
DETECTING THE PRESENCE OF ENDOCRINE DISRUPTERS IN PM1 AIR PARTICLES
Anna Marqueño*, Barend L van Drooge, Joan O Grimalt, Pilar Fernández, Cinta Porte
Institute of Environmental Assessment and Water Research, Barcelona, Spain Keywords: organic aerosol, PM1, human placental JEG-3 cells, cytotoxicity, endocrine disruption
*Presenting author email: [email protected]
The placenta plays an important role in the endocrine regulation of pregnancy through the synthesis of steroid hormones, particularly estrogens and progesterone. Steroid synthesis in placenta is essential for a healthy pregnancy. The human placental choriocarcinoma JEG-3 cell line expresses the specific steroidogenic enzymes found in placenta and has a very high aromatas e activity, which catalyzes the aromatization of fetal and maternal androgens into estrogens. Thus, JEG-3 cells have been successfully used to detect compounds that by interfering with the aromatization of androgens to estrogens can act as endocrine disrupters (Pérez-Albaladejo et al., 2017). PMs, especially ultrafine particles can cause serious health problems since they readily cross biological barriers such as the placenta. It is well known that exposure to PM2.5 or PM10 during pregnancy cause birth defects in the newborns, due to the toxicity of the particle itself, but also the toxic pollutants adsorbed. As smaller particles are usually more invasive, further efforts should be addressed to characterize the health risk of PM1 particles in terms of pregnancy health risk and activity of the adsorbed pollutants. Thus, the aim of this exploratory work was to assess the cytotoxicity and ability to disrupt aromatase activity of organic PM1 extracts from rural and urban areas (sampled at the street and roof level; hot and cold period) in human placental JEG-3 cells. Samples were collected with high-volume samplers on quartz filters for 12 h. The adsorbed organic pollutants were extracted and JEG-3 cells were exposed for 24 h to an aliquot of the organic PM1 extract dissolved in DMSO and further diluted in culture medium. Cell viability was measured by using two different dyes: Alamar Blue (metabolic activity) and CFDA-AM (membrane integrity). Aromatase activity was determined after 24 h exposure to the extracts by measuring the amount of 3H2O formed during the aromatization of 1β-3H-androstenedione (3H-AD) to estrone.
No significant cytotoxicity was observed for urban air samples, while rural particles (cold period) contained a significant amount of cytotoxic compounds, probably originating from biomass burning. In contrast, rural samples collected during the warm period were not cytotoxic (Fig. 1). Regarding presence of endocrine disrupters in organic PM1 extracts, urban air samples moderately inhibited aromatase activity (up to 60% inhibition when tested at 18 m3 eQair/mL). No alteration of the activity was observed after exposure to rural air extracts (warm period). However, rural samples from the cold period strongly inhibited aromatase activity (60-70 % inhibition when tested at 6 m3 eQair/mL) indicating the presence of significant amounts of adsorbed pollutants that are likely to interfere with the metabolism of steroids in placenta.
Figure 1. Percentage of cell viability (dots) and aromatase activity (bars) of JEG-3 cells after exposure to
organic PM1 extracts (18 m3 eQair/mL urban samples and 12 m3 eQair/mL rural samples). R & U: rural and
urban; S & r: street or roof level collection; C: cold period, H: warm period.
This work was partially supported by project CGL2014-52144-P. Pérez-Albaladejo et al. (2017), Comparative toxicity,
oxidative stress and endocrine disruption potential of plasticizers in JEG-3 human placental cells . Toxicol In Vitro 38:41-48.
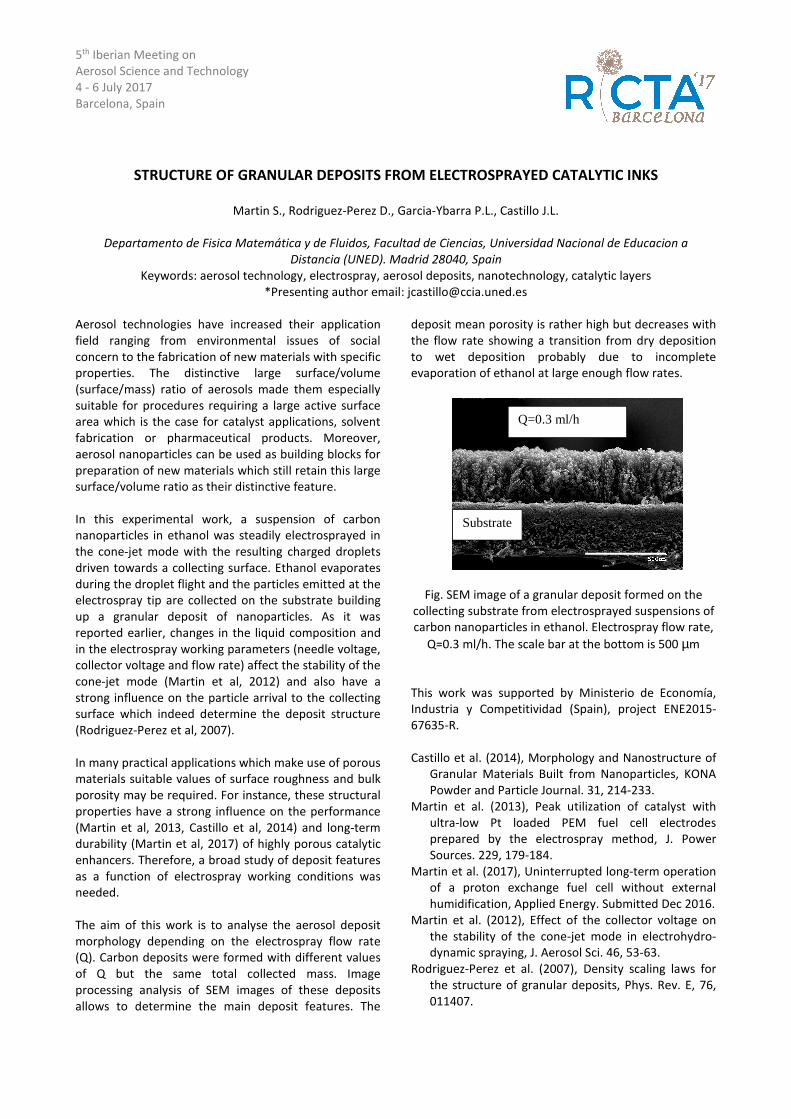
5th Iberian Meeting on
Aerosol Science and Technology
4 - 6 July 2017
Barcelona, Spain
STRUCTURE OF GRANULAR DEPOSITS FROM ELECTROSPRAYED CATALYTIC INKS
Martin S., Rodriguez-Perez D., Garcia-Ybarra P.L., Castillo J.L.
Departamento de Fisica Matemática y de Fluidos, Facultad de Ciencias, Universidad Nacional de Educacion a
Distancia (UNED). Madrid 28040, Spain
Keywords: aerosol technology, electrospray, aerosol deposits, nanotechnology, catalytic layers
*Presenting author email: [email protected]
Aerosol technologies have increased their application
field ranging from environmental issues of social
concern to the fabrication of new materials with specific
properties. The distinctive large surface/volume
(surface/mass) ratio of aerosols made them especially
suitable for procedures requiring a large active surface
area which is the case for catalyst applications, solvent
fabrication or pharmaceutical products. Moreover,
aerosol nanoparticles can be used as building blocks for
preparation of new materials which still retain this large
surface/volume ratio as their distinctive feature.
In this experimental work, a suspension of carbon
nanoparticles in ethanol was steadily electrosprayed in
the cone-jet mode with the resulting charged droplets
driven towards a collecting surface. Ethanol evaporates
during the droplet flight and the particles emitted at the
electrospray tip are collected on the substrate building
up a granular deposit of nanoparticles. As it was
reported earlier, changes in the liquid composition and
in the electrospray working parameters (needle voltage,
collector voltage and flow rate) affect the stability of the
cone-jet mode (Martin et al, 2012) and also have a
strong influence on the particle arrival to the collecting
surface which indeed determine the deposit structure
(Rodriguez-Perez et al, 2007).
In many practical applications which make use of porous
materials suitable values of surface roughness and bulk
porosity may be required. For instance, these structural
properties have a strong influence on the performance
(Martin et al, 2013, Castillo et al, 2014) and long-term
durability (Martin et al, 2017) of highly porous catalytic
enhancers. Therefore, a broad study of deposit features
as a function of electrospray working conditions was
needed.
The aim of this work is to analyse the aerosol deposit
morphology depending on the electrospray flow rate
(Q). Carbon deposits were formed with different values
of Q but the same total collected mass. Image
processing analysis of SEM images of these deposits
allows to determine the main deposit features. The
deposit mean porosity is rather high but decreases with
the flow rate showing a transition from dry deposition
to wet deposition probably due to incomplete
evaporation of ethanol at large enough flow rates.
Fig. SEM image of a granular deposit formed on the
collecting substrate from electrosprayed suspensions of
carbon nanoparticles in ethanol. Electrospray flow rate,
Q=0.3 ml/h. The scale bar at the bottom is 500 µm
This work was supported by Ministerio de Economía,
Industria y Competitividad (Spain), project ENE2015-
67635-R.
Castillo et al. (2014), Morphology and Nanostructure of
Granular Materials Built from Nanoparticles, KONA
Powder and Particle Journal. 31, 214-233.
Martin et al. (2013), Peak utilization of catalyst with
ultra-low Pt loaded PEM fuel cell electrodes
prepared by the electrospray method, J. Power
Sources. 229, 179-184.
Martin et al. (2017), Uninterrupted long-term operation
of a proton exchange fuel cell without external
humidification, Applied Energy. Submitted Dec 2016.
Martin et al. (2012), Effect of the collector voltage on
the stability of the cone-jet mode in electrohydro-
dynamic spraying, J. Aerosol Sci. 46, 53-63.
Rodriguez-Perez et al. (2007), Density scaling laws for
the structure of granular deposits, Phys. Rev. E, 76,
011407.
Q=0.3 ml/h
Substrate
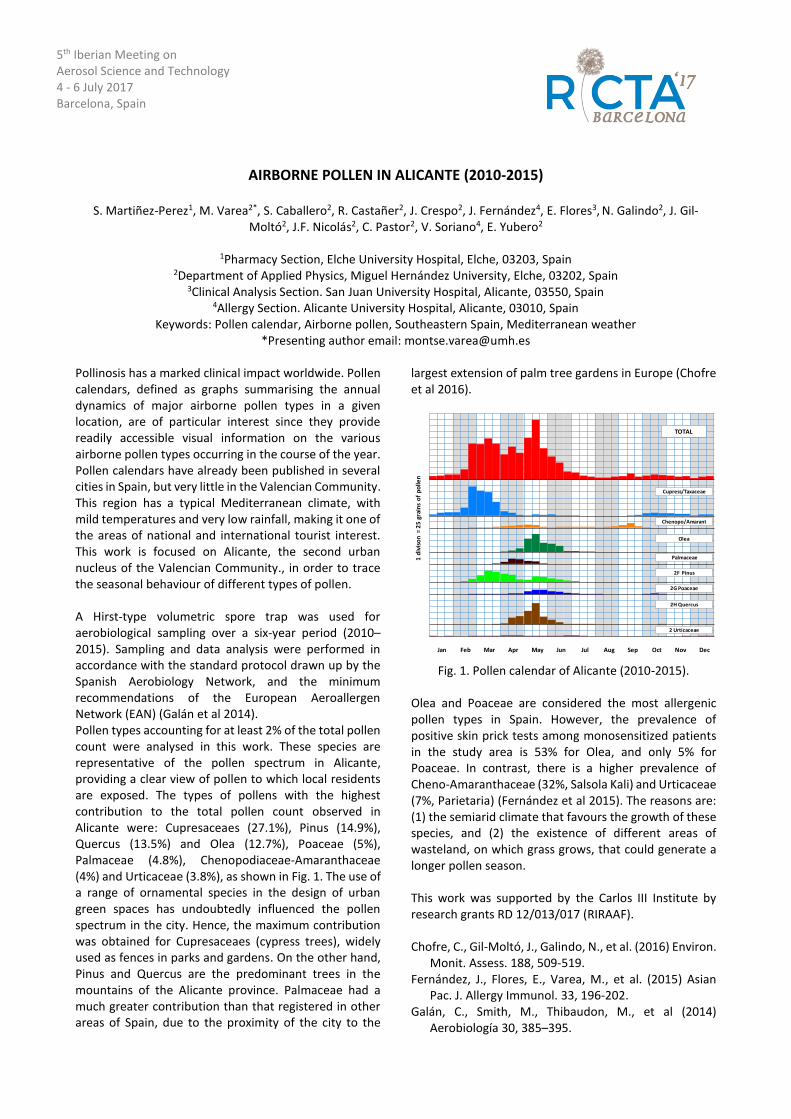
5th Iberian Meeting on Aerosol Science and Technology 4 - 6 July 2017 Barcelona, Spain
AIRBORNE POLLEN IN ALICANTE (2010-2015)
S. Martiñez-Perez1, M. Varea2*, S. Caballero2, R. Castañer2, J. Crespo2, J. Fernández4, E. Flores3, N. Galindo2, J. Gil-Moltó2, J.F. Nicolás2, C. Pastor2, V. Soriano4, E. Yubero2
1Pharmacy Section, Elche University Hospital, Elche, 03203, Spain
2Department of Applied Physics, Miguel Hernández University, Elche, 03202, Spain 3Clinical Analysis Section. San Juan University Hospital, Alicante, 03550, Spain
4Allergy Section. Alicante University Hospital, Alicante, 03010, Spain Keywords: Pollen calendar, Airborne pollen, Southeastern Spain, Mediterranean weather
*Presenting author email: [email protected]
Pollinosis has a marked clinical impact worldwide. Pollen calendars, defined as graphs summarising the annual dynamics of major airborne pollen types in a given location, are of particular interest since they provide readily accessible visual information on the various airborne pollen types occurring in the course of the year. Pollen calendars have already been published in several cities in Spain, but very little in the Valencian Community. This region has a typical Mediterranean climate, with mild temperatures and very low rainfall, making it one of the areas of national and international tourist interest. This work is focused on Alicante, the second urban nucleus of the Valencian Community., in order to trace the seasonal behaviour of different types of pollen. A Hirst-type volumetric spore trap was used for aerobiological sampling over a six-year period (2010–2015). Sampling and data analysis were performed in accordance with the standard protocol drawn up by the Spanish Aerobiology Network, and the minimum recommendations of the European Aeroallergen Network (EAN) (Galán et al 2014). Pollen types accounting for at least 2% of the total pollen count were analysed in this work. These species are representative of the pollen spectrum in Alicante, providing a clear view of pollen to which local residents are exposed. The types of pollens with the highest contribution to the total pollen count observed in Alicante were: Cupresaceaes (27.1%), Pinus (14.9%), Quercus (13.5%) and Olea (12.7%), Poaceae (5%), Palmaceae (4.8%), Chenopodiaceae-Amaranthaceae (4%) and Urticaceae (3.8%), as shown in Fig. 1. The use of a range of ornamental species in the design of urban green spaces has undoubtedly influenced the pollen spectrum in the city. Hence, the maximum contribution was obtained for Cupresaceaes (cypress trees), widely used as fences in parks and gardens. On the other hand, Pinus and Quercus are the predominant trees in the mountains of the Alicante province. Palmaceae had a much greater contribution than that registered in other areas of Spain, due to the proximity of the city to the
largest extension of palm tree gardens in Europe (Chofre et al 2016).
Fig. 1. Pollen calendar of Alicante (2010-2015).
Olea and Poaceae are considered the most allergenic pollen types in Spain. However, the prevalence of positive skin prick tests among monosensitized patients in the study area is 53% for Olea, and only 5% for Poaceae. In contrast, there is a higher prevalence of Cheno-Amaranthaceae (32%, Salsola Kali) and Urticaceae (7%, Parietaria) (Fernández et al 2015). The reasons are: (1) the semiarid climate that favours the growth of these species, and (2) the existence of different areas of wasteland, on which grass grows, that could generate a longer pollen season.
This work was supported by the Carlos III Institute by research grants RD 12/013/017 (RIRAAF).
Chofre, C., Gil-Moltó, J., Galindo, N., et al. (2016) Environ.
Monit. Assess. 188, 509-519. Fernández, J., Flores, E., Varea, M., et al. (2015) Asian
Pac. J. Allergy Immunol. 33, 196-202. Galán, C., Smith, M., Thibaudon, M., et al (2014)
Aerobiología 30, 385–395.
TOTAL
Jan Feb Mar Apr May Jun Jul Aug Sep Oct Nov Dec
1 d
ivis
on
= 2
5 g
rain
so
f p
olle
n
Cupress/Taxaceae
Chenopo/Amarant
Olea
Palmaceae
2F Pinus
2G Poaceae
2H Quercus
2 Urticaceae
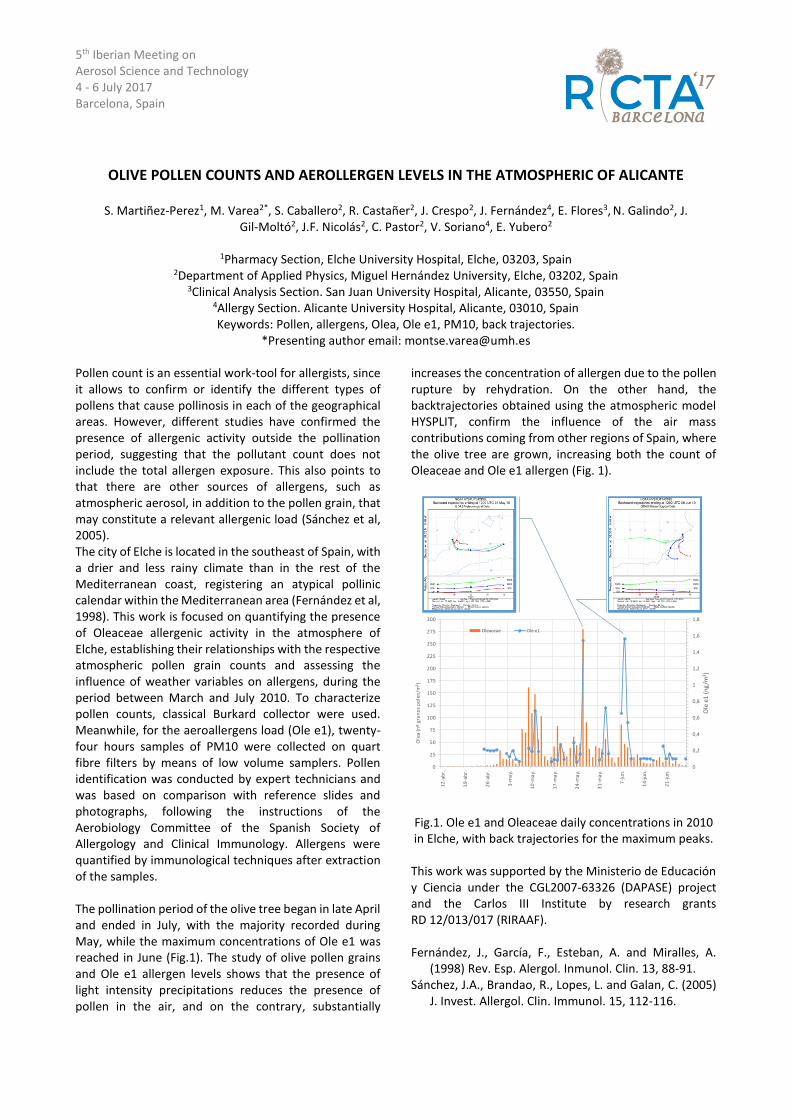
5th Iberian Meeting on Aerosol Science and Technology 4 - 6 July 2017 Barcelona, Spain
OLIVE POLLEN COUNTS AND AEROLLERGEN LEVELS IN THE ATMOSPHERIC OF ALICANTE
S. Martiñez-Perez1, M. Varea2*, S. Caballero2, R. Castañer2, J. Crespo2, J. Fernández4, E. Flores3, N. Galindo2, J. Gil-Moltó2, J.F. Nicolás2, C. Pastor2, V. Soriano4, E. Yubero2
1Pharmacy Section, Elche University Hospital, Elche, 03203, Spain
2Department of Applied Physics, Miguel Hernández University, Elche, 03202, Spain 3Clinical Analysis Section. San Juan University Hospital, Alicante, 03550, Spain
4Allergy Section. Alicante University Hospital, Alicante, 03010, Spain Keywords: Pollen, allergens, Olea, Ole e1, PM10, back trajectories.
*Presenting author email: [email protected]
Pollen count is an essential work-tool for allergists, since it allows to confirm or identify the different types of pollens that cause pollinosis in each of the geographical areas. However, different studies have confirmed the presence of allergenic activity outside the pollination period, suggesting that the pollutant count does not include the total allergen exposure. This also points to that there are other sources of allergens, such as atmospheric aerosol, in addition to the pollen grain, that may constitute a relevant allergenic load (Sánchez et al, 2005). The city of Elche is located in the southeast of Spain, with a drier and less rainy climate than in the rest of the Mediterranean coast, registering an atypical pollinic calendar within the Mediterranean area (Fernández et al, 1998). This work is focused on quantifying the presence of Oleaceae allergenic activity in the atmosphere of Elche, establishing their relationships with the respective atmospheric pollen grain counts and assessing the influence of weather variables on allergens, during the period between March and July 2010. To characterize pollen counts, classical Burkard collector were used. Meanwhile, for the aeroallergens load (Ole e1), twenty-four hours samples of PM10 were collected on quart fibre filters by means of low volume samplers. Pollen identification was conducted by expert technicians and was based on comparison with reference slides and photographs, following the instructions of the Aerobiology Committee of the Spanish Society of Allergology and Clinical Immunology. Allergens were quantified by immunological techniques after extraction of the samples. The pollination period of the olive tree began in late April and ended in July, with the majority recorded during May, while the maximum concentrations of Ole e1 was reached in June (Fig.1). The study of olive pollen grains and Ole e1 allergen levels shows that the presence of light intensity precipitations reduces the presence of pollen in the air, and on the contrary, substantially
increases the concentration of allergen due to the pollen rupture by rehydration. On the other hand, the backtrajectories obtained using the atmospheric model HYSPLIT, confirm the influence of the air mass contributions coming from other regions of Spain, where the olive tree are grown, increasing both the count of Oleaceae and Ole e1 allergen (Fig. 1).
Fig.1. Ole e1 and Oleaceae daily concentrations in 2010 in Elche, with back trajectories for the maximum peaks.
This work was supported by the Ministerio de Educación y Ciencia under the CGL2007-63326 (DAPASE) project and the Carlos III Institute by research grants RD 12/013/017 (RIRAAF). Fernández, J., García, F., Esteban, A. and Miralles, A.
(1998) Rev. Esp. Alergol. Inmunol. Clin. 13, 88-91. Sánchez, J.A., Brandao, R., Lopes, L. and Galan, C. (2005)
J. Invest. Allergol. Clin. Immunol. 15, 112-116.
Ole
a(n
o. p
olle
n/m
3)
0
0,2
0,4
0,6
0,8
1
1,2
1,4
1,6
1,8
0
25
50
75
100
125
150
175
200
225
250
275
300
12
-ab
r.
19
-ab
r.
26
-ab
r.
3-m
ay.
10
-ma
y.
17
-ma
y.
24
-ma
y.
31
-ma
y.
7-j
un
.
14
-ju
n.
21
-ju
n.
Ole
e1
(ng
/m3)
Ole
a (n
º gr
an
os
po
len
/m3)
Oleaceae Ole e1
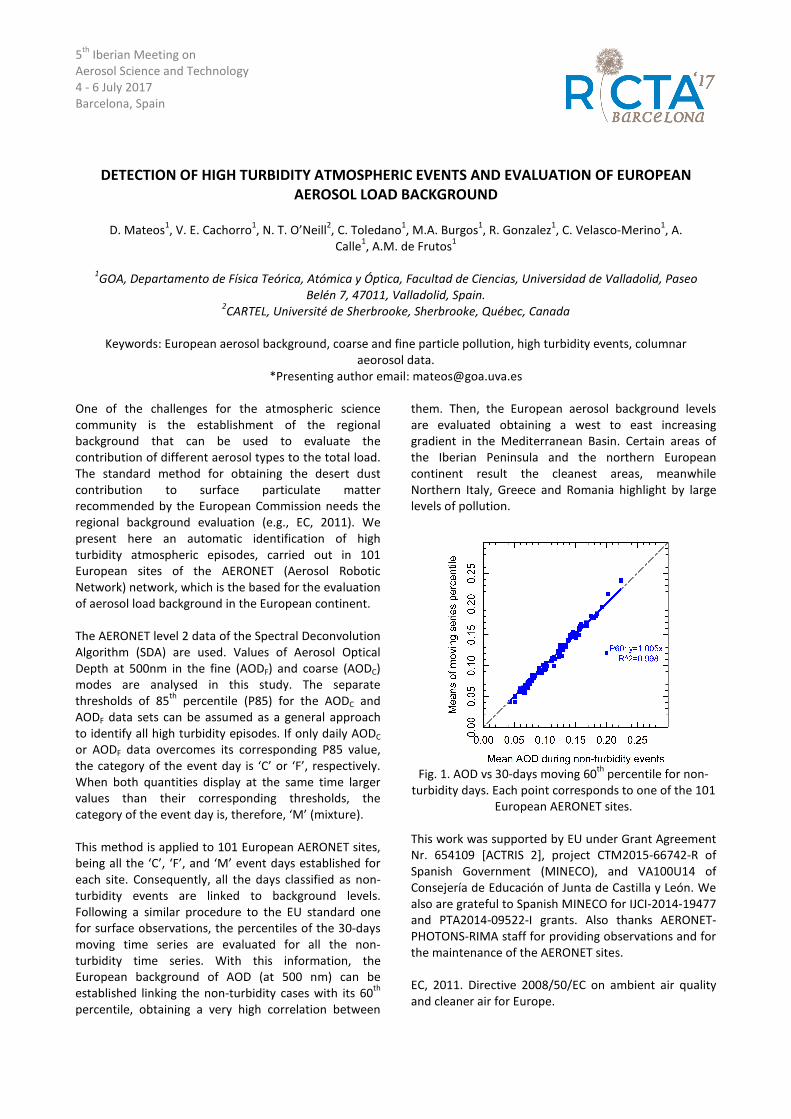
5th Iberian Meeting on Aerosol Science and Technology 4 - 6 July 2017 Barcelona, Spain
DETECTION OF HIGH TURBIDITY ATMOSPHERIC EVENTS AND EVALUATION OF EUROPEAN
AEROSOL LOAD BACKGROUND
D. Mateos1, V. E. Cachorro1, N. T. O’Neill2, C. Toledano1, M.A. Burgos1, R. Gonzalez1, C. Velasco-Merino1, A. Calle1, A.M. de Frutos1
1GOA, Departamento de Física Teórica, Atómica y Óptica, Facultad de Ciencias, Universidad de Valladolid, Paseo
Belén 7, 47011, Valladolid, Spain. 2CARTEL, Université de Sherbrooke, Sherbrooke, Québec, Canada
Keywords: European aerosol background, coarse and fine particle pollution, high turbidity events, columnar aeorosol data.
*Presenting author email: [email protected]
One of the challenges for the atmospheric science community is the establishment of the regional background that can be used to evaluate the contribution of different aerosol types to the total load. The standard method for obtaining the desert dust contribution to surface particulate matter recommended by the European Commission needs the regional background evaluation (e.g., EC, 2011). We present here an automatic identification of high turbidity atmospheric episodes, carried out in 101 European sites of the AERONET (Aerosol Robotic Network) network, which is the based for the evaluation of aerosol load background in the European continent. The AERONET level 2 data of the Spectral Deconvolution Algorithm (SDA) are used. Values of Aerosol Optical Depth at 500nm in the fine (AODF) and coarse (AODC) modes are analysed in this study. The separate thresholds of 85th percentile (P85) for the AODC and AODF data sets can be assumed as a general approach to identify all high turbidity episodes. If only daily AODC or AODF data overcomes its corresponding P85 value, the category of the event day is ‘C’ or ‘F’, respectively. When both quantities display at the same time larger values than their corresponding thresholds, the category of the event day is, therefore, ‘M’ (mixture). This method is applied to 101 European AERONET sites, being all the ‘C’, ‘F’, and ‘M’ event days established for each site. Consequently, all the days classified as non-turbidity events are linked to background levels. Following a similar procedure to the EU standard one for surface observations, the percentiles of the 30-days moving time series are evaluated for all the non-turbidity time series. With this information, the European background of AOD (at 500 nm) can be established linking the non-turbidity cases with its 60th percentile, obtaining a very high correlation between
them. Then, the European aerosol background levels are evaluated obtaining a west to east increasing gradient in the Mediterranean Basin. Certain areas of the Iberian Peninsula and the northern European continent result the cleanest areas, meanwhile Northern Italy, Greece and Romania highlight by large levels of pollution.
Fig. 1. AOD vs 30-days moving 60th percentile for non-
turbidity days. Each point corresponds to one of the 101 European AERONET sites.
This work was supported by EU under Grant Agreement Nr. 654109 [ACTRIS 2], project CTM2015-66742-R of Spanish Government (MINECO), and VA100U14 of Consejería de Educación of Junta de Castilla y León. We also are grateful to Spanish MINECO for IJCI-2014-19477 and PTA2014-09522-I grants. Also thanks AERONET-PHOTONS-RIMA staff for providing observations and for the maintenance of the AERONET sites. EC, 2011. Directive 2008/50/EC on ambient air quality and cleaner air for Europe.
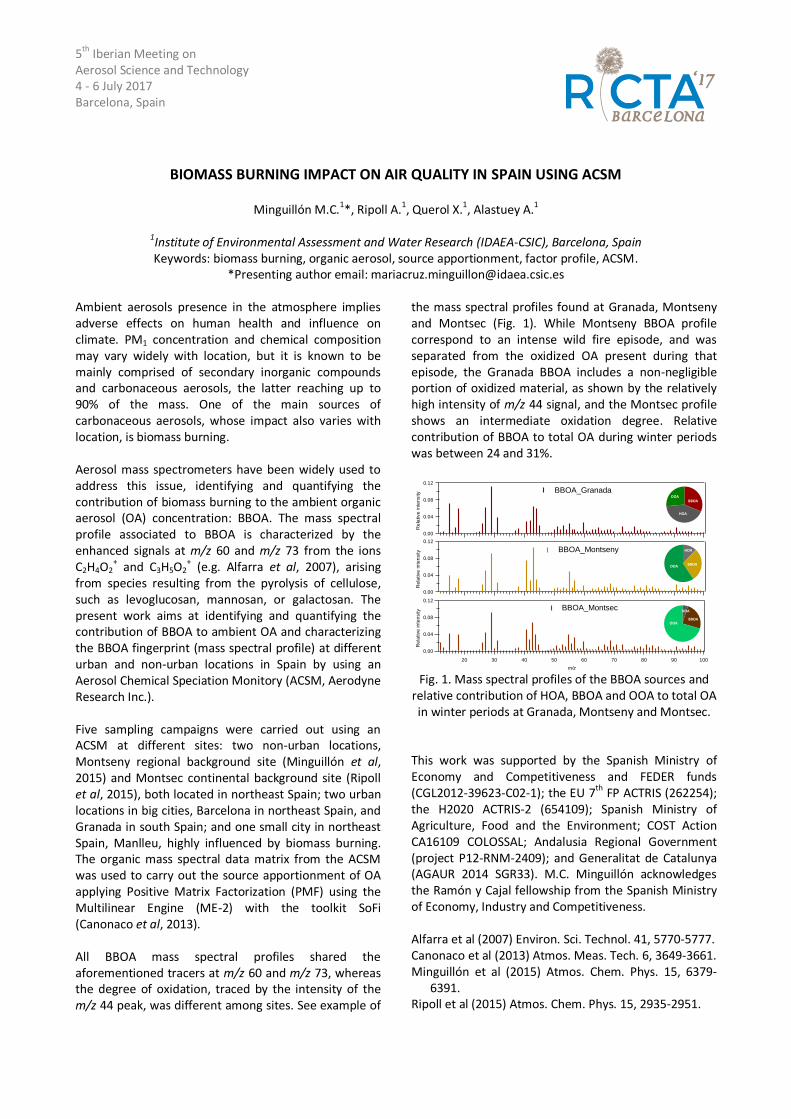
5th
Iberian Meeting on Aerosol Science and Technology 4 - 6 July 2017 Barcelona, Spain
BIOMASS BURNING IMPACT ON AIR QUALITY IN SPAIN USING ACSM
Minguillón M.C.1*, Ripoll A.1, Querol X.1, Alastuey A.1
1Institute of Environmental Assessment and Water Research (IDAEA-CSIC), Barcelona, Spain Keywords: biomass burning, organic aerosol, source apportionment, factor profile, ACSM.
*Presenting author email: [email protected]
Ambient aerosols presence in the atmosphere implies adverse effects on human health and influence on climate. PM1 concentration and chemical composition may vary widely with location, but it is known to be mainly comprised of secondary inorganic compounds and carbonaceous aerosols, the latter reaching up to 90% of the mass. One of the main sources of carbonaceous aerosols, whose impact also varies with location, is biomass burning. Aerosol mass spectrometers have been widely used to address this issue, identifying and quantifying the contribution of biomass burning to the ambient organic aerosol (OA) concentration: BBOA. The mass spectral profile associated to BBOA is characterized by the enhanced signals at m/z 60 and m/z 73 from the ions C2H4O2
+ and C3H5O2+ (e.g. Alfarra et al, 2007), arising
from species resulting from the pyrolysis of cellulose, such as levoglucosan, mannosan, or galactosan. The present work aims at identifying and quantifying the contribution of BBOA to ambient OA and characterizing the BBOA fingerprint (mass spectral profile) at different urban and non-urban locations in Spain by using an Aerosol Chemical Speciation Monitory (ACSM, Aerodyne Research Inc.). Five sampling campaigns were carried out using an ACSM at different sites: two non-urban locations, Montseny regional background site (Minguillón et al, 2015) and Montsec continental background site (Ripoll et al, 2015), both located in northeast Spain; two urban locations in big cities, Barcelona in northeast Spain, and Granada in south Spain; and one small city in northeast Spain, Manlleu, highly influenced by biomass burning. The organic mass spectral data matrix from the ACSM was used to carry out the source apportionment of OA applying Positive Matrix Factorization (PMF) using the Multilinear Engine (ME-2) with the toolkit SoFi (Canonaco et al, 2013). All BBOA mass spectral profiles shared the aforementioned tracers at m/z 60 and m/z 73, whereas the degree of oxidation, traced by the intensity of the m/z 44 peak, was different among sites. See example of
the mass spectral profiles found at Granada, Montseny and Montsec (Fig. 1). While Montseny BBOA profile correspond to an intense wild fire episode, and was separated from the oxidized OA present during that episode, the Granada BBOA includes a non-negligible portion of oxidized material, as shown by the relatively high intensity of m/z 44 signal, and the Montsec profile shows an intermediate oxidation degree. Relative contribution of BBOA to total OA during winter periods was between 24 and 31%.
Fig. 1. Mass spectral profiles of the BBOA sources and
relative contribution of HOA, BBOA and OOA to total OA in winter periods at Granada, Montseny and Montsec.
This work was supported by the Spanish Ministry of Economy and Competitiveness and FEDER funds (CGL2012-39623-C02-1); the EU 7th FP ACTRIS (262254); the H2020 ACTRIS-2 (654109); Spanish Ministry of Agriculture, Food and the Environment; COST Action CA16109 COLOSSAL; Andalusia Regional Government (project P12-RNM-2409); and Generalitat de Catalunya (AGAUR 2014 SGR33). M.C. Minguillón acknowledges the Ramón y Cajal fellowship from the Spanish Ministry of Economy, Industry and Competitiveness. Alfarra et al (2007) Environ. Sci. Technol. 41, 5770-5777. Canonaco et al (2013) Atmos. Meas. Tech. 6, 3649-3661. Minguillón et al (2015) Atmos. Chem. Phys. 15, 6379-
6391. Ripoll et al (2015) Atmos. Chem. Phys. 15, 2935-2951.
0.12
0.08
0.04
0.00
Re
lative
in
ten
sity
1009080706050403020
m/z
BBOA_Montseny
0.12
0.08
0.04
0.00
Re
lative
in
ten
sity
1009080706050403020
m/z
BBOA_Granada
0.12
0.08
0.04
0.00
Re
lative
in
ten
sity
1009080706050403020
m/z
BBOA_Montsec
BBOA
HOA
OOA
BBOA
HOA
OOA
HOA
BBOAOOA
HOA
BBOAOOA
5th Iberian Meeting on Aerosol Science and Technology 4 - 6 July 2017 Barcelona, Spain
CONTRIBUTION OF NATURAL DUST IN PM10 AND PM2.5 CONCENTRATIONS OVER PORTUGAL FROM 2013 TO 2015
Monjardino J. 1*, Ferreira F.1, Mendes L.1, Tente H.1, Pereira P.1
1 Center for Environmental and Sustainability Research, Department of Environmental Sciences and Engineering,
Faculty of Science and Technology, Universidade NOVA de Lisboa, Lisbon, Portugal Keywords: Air quality, Particulate matter, PM10, PM2.5, Natural dust, Saharan dust.
In Europe, African dust can significantly increase ambient particulate matter levels, particularly in southern European countries (Bergametti et al., 1989). In particular, the Sahara and Sahel desert areas are the most important natural sources of mineral aerosols for the Iberian Peninsula (Cachorro et al., 2016). In Portugal, since 2006, a methodology is applied, in an annual basis, to determine the contribution of re-suspended and transported Saharan dust on PM10 daily concentrations (Querol et al., 2006). The impact of desert dust on PM concentrations assessment is based on the PM10 concentrations analysis (Escudero et al., 2007, Pey, 2008) and complementary information provided mainly by the air masses back-trajectories analysis provided by HYSPLIT (Hybrid Single Particle Lagrangian Integrated Trajectory Model) and forecasting aerosol models as BSC-DREAM8b (Dust REgional atmospheric model) and SKIRON which predict the impact of dust on surface level particulate matter concentrations. This procedure allowed to identify the occurrence and intensity of African dust episodes over Portugal by determining its contribution on PM10 concentrations. African dust outbreaks in Portugal (mainland territory) occur in 26% of the year (in a daily basis analysis from 2010 to 2015). The natural contribution deduction to PM10 annual mean has been, in average, of 11% (being 6% in the north and 15% in the south regions). Besides this location influence (for monitoring stations located from north to south) results also show inter-annual variability and seasonal patterns. This study aims to apply the same methodology to estimate the influence of desert dust on PM2.5 levels. Air quality data sets obtained from Portuguese monitoring network, from 2013 to 2015, were used. The spatial-temporal behaviour of PM10 and PM2.5 concentrations over Portugal (mainland territory) was studied, as well as the inter-relations between both fractions of PM. Also, correlations were performed in order to understand the sources contributing to particulate matter levels at Portuguese rural background stations and to validate the referred methodology in use. Results
were obtained for correlations between PM10 levels measured in each rural background station and pollutants concentrations obtained in all other stations within the same region, distinguishing the days with and without occurrence of African dust episodes. For cases where doubts were raised, relating the origin of the air mass and the presence of dust influence, the HYSPLIT back trajectory and cluster analysis were performed, for days with exceedances to PM10 daily limit value. In the southern locations of Portugal, closer to north African Deserts, the percentage of trajectories coming from Africa is higher than in northern locations. For trajectories coming from Africa, lower PM2.5/PM10 ratios were obtained and higher PM10 levels were registered, enlightening the natural dust influence. Locations with higher PM2.5 levels and ratios reveal anthropogenic influence. In all inland stations there is some anthropogenic contribution, at least through the trajectories coming from east and northeast, crossing Spanish areas, and contributing with higher PM2.5 levels. Bergametti et al. (1989), Paleoclimatology and
Paleometeorology: Modern and Past Patterns of Global Atmospheric Transport, in: Leinen, M. and Sarnthein, M. (eds).
Cachorro et al. (2016), Inventory of African desert dust events in the north-central Iberian Peninsula in 2003-2014 based on sun-photometer-AERONET and particulate-mass-EMEP data, Atmos. Chem. Phys. 16, Issue 13.
Escudero et al. (2007), A methodology for the quantification of the net African dust load in air quality monitoring networks, Atmos. Env. 41, Issue 26.
PEY, J. (2008), Caracterización físico-química de aerosoles atmosféricos en el Mediterráneo ocidental, Tesis Doctoral.
Querol et al. (2006), Spain and Portugal Methodology for the identification of natural African dust episodes in PM10 and PM2,5, and justification with regards to the exceedances of the PM10 daily limit value, MMAMRM-Spain and MAOTDR–Portugal.
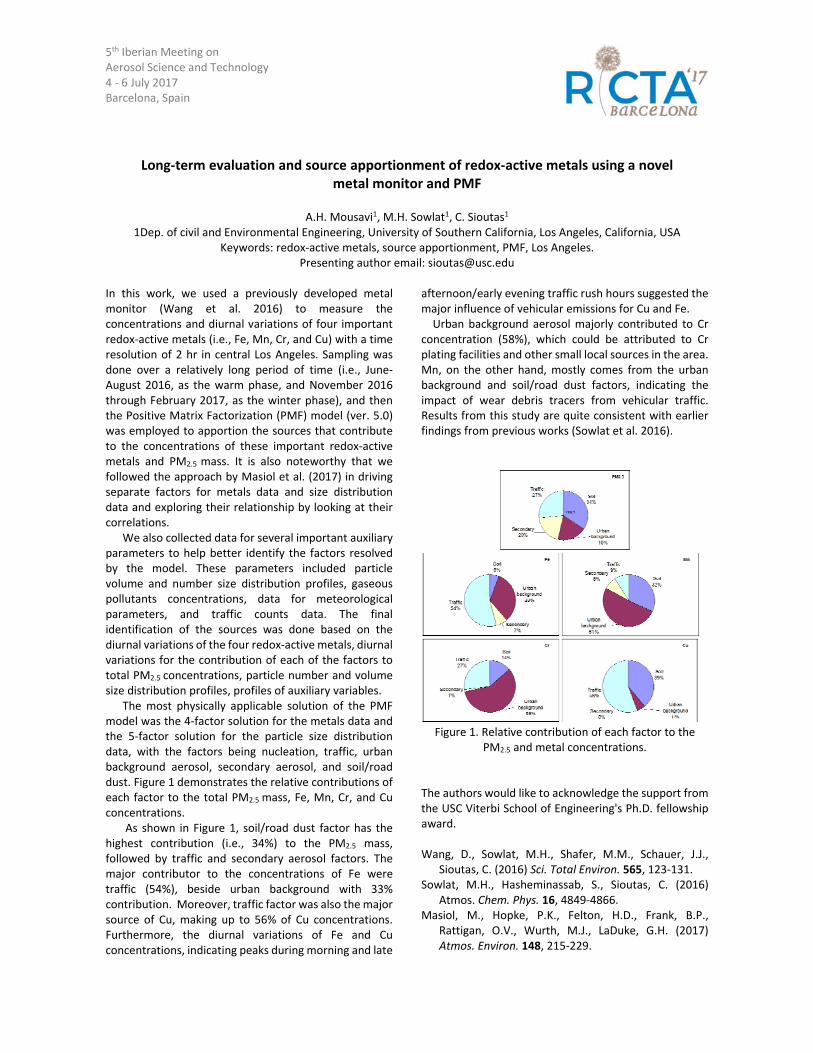
5th Iberian Meeting on Aerosol Science and Technology 4 ‐ 6 July 2017 Barcelona, Spain
Long‐term evaluation and source apportionment of redox‐active metals using a novel metal monitor and PMF
A.H. Mousavi1, M.H. Sowlat1, C. Sioutas1
1Dep. of civil and Environmental Engineering, University of Southern California, Los Angeles, California, USA Keywords: redox‐active metals, source apportionment, PMF, Los Angeles.
Presenting author email: [email protected]
In this work, we used a previously developed metal monitor (Wang et al. 2016) to measure the concentrations and diurnal variations of four important redox‐active metals (i.e., Fe, Mn, Cr, and Cu) with a time resolution of 2 hr in central Los Angeles. Sampling was done over a relatively long period of time (i.e., June‐August 2016, as the warm phase, and November 2016 through February 2017, as the winter phase), and then the Positive Matrix Factorization (PMF) model (ver. 5.0) was employed to apportion the sources that contribute to the concentrations of these important redox‐active metals and PM2.5 mass. It is also noteworthy that we followed the approach by Masiol et al. (2017) in driving separate factors for metals data and size distribution data and exploring their relationship by looking at their correlations. We also collected data for several important auxiliary parameters to help better identify the factors resolved by the model. These parameters included particle volume and number size distribution profiles, gaseous pollutants concentrations, data for meteorological parameters, and traffic counts data. The final identification of the sources was done based on the diurnal variations of the four redox‐active metals, diurnal variations for the contribution of each of the factors to total PM2.5 concentrations, particle number and volume size distribution profiles, profiles of auxiliary variables. The most physically applicable solution of the PMF model was the 4‐factor solution for the metals data and the 5‐factor solution for the particle size distribution data, with the factors being nucleation, traffic, urban background aerosol, secondary aerosol, and soil/road dust. Figure 1 demonstrates the relative contributions of each factor to the total PM2.5 mass, Fe, Mn, Cr, and Cu concentrations. As shown in Figure 1, soil/road dust factor has the highest contribution (i.e., 34%) to the PM2.5 mass, followed by traffic and secondary aerosol factors. The major contributor to the concentrations of Fe were traffic (54%), beside urban background with 33% contribution. Moreover, traffic factor was also the major source of Cu, making up to 56% of Cu concentrations. Furthermore, the diurnal variations of Fe and Cu concentrations, indicating peaks during morning and late
afternoon/early evening traffic rush hours suggested the major influence of vehicular emissions for Cu and Fe. Urban background aerosol majorly contributed to Cr concentration (58%), which could be attributed to Cr plating facilities and other small local sources in the area. Mn, on the other hand, mostly comes from the urban background and soil/road dust factors, indicating the impact of wear debris tracers from vehicular traffic. Results from this study are quite consistent with earlier findings from previous works (Sowlat et al. 2016).
Figure 1. Relative contribution of each factor to the
PM2.5 and metal concentrations. The authors would like to acknowledge the support from the USC Viterbi School of Engineering's Ph.D. fellowship award. Wang, D., Sowlat, M.H., Shafer, M.M., Schauer, J.J.,
Sioutas, C. (2016) Sci. Total Environ. 565, 123‐131. Sowlat, M.H., Hasheminassab, S., Sioutas, C. (2016)
Atmos. Chem. Phys. 16, 4849‐4866. Masiol, M., Hopke, P.K., Felton, H.D., Frank, B.P.,
Rattigan, O.V., Wurth, M.J., LaDuke, G.H. (2017) Atmos. Environ. 148, 215‐229.
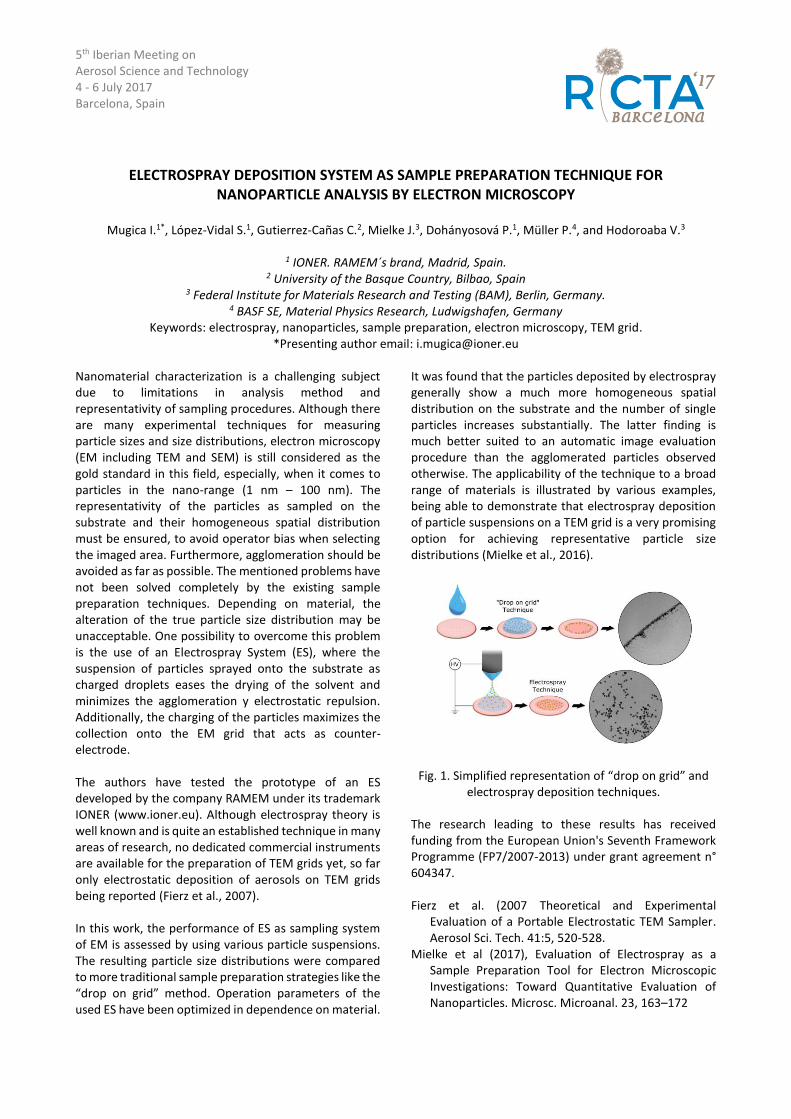
5th Iberian Meeting on Aerosol Science and Technology 4 - 6 July 2017 Barcelona, Spain
ELECTROSPRAY DEPOSITION SYSTEM AS SAMPLE PREPARATION TECHNIQUE FOR NANOPARTICLE ANALYSIS BY ELECTRON MICROSCOPY
Mugica I.1*, López-Vidal S.1, Gutierrez-Cañas C.2, Mielke J.3, Dohányosová P.1, Müller P.4, and Hodoroaba V.3
1 IONER. RAMEM´s brand, Madrid, Spain.
2 University of the Basque Country, Bilbao, Spain 3 Federal Institute for Materials Research and Testing (BAM), Berlin, Germany.
4 BASF SE, Material Physics Research, Ludwigshafen, Germany Keywords: electrospray, nanoparticles, sample preparation, electron microscopy, TEM grid.
*Presenting author email: [email protected]
Nanomaterial characterization is a challenging subject due to limitations in analysis method and representativity of sampling procedures. Although there are many experimental techniques for measuring particle sizes and size distributions, electron microscopy (EM including TEM and SEM) is still considered as the gold standard in this field, especially, when it comes to particles in the nano-range (1 nm – 100 nm). The representativity of the particles as sampled on the substrate and their homogeneous spatial distribution must be ensured, to avoid operator bias when selecting the imaged area. Furthermore, agglomeration should be avoided as far as possible. The mentioned problems have not been solved completely by the existing sample preparation techniques. Depending on material, the alteration of the true particle size distribution may be unacceptable. One possibility to overcome this problem is the use of an Electrospray System (ES), where the suspension of particles sprayed onto the substrate as charged droplets eases the drying of the solvent and minimizes the agglomeration y electrostatic repulsion. Additionally, the charging of the particles maximizes the collection onto the EM grid that acts as counter-electrode. The authors have tested the prototype of an ES developed by the company RAMEM under its trademark IONER (www.ioner.eu). Although electrospray theory is well known and is quite an established technique in many areas of research, no dedicated commercial instruments are available for the preparation of TEM grids yet, so far only electrostatic deposition of aerosols on TEM grids being reported (Fierz et al., 2007). In this work, the performance of ES as sampling system of EM is assessed by using various particle suspensions. The resulting particle size distributions were compared to more traditional sample preparation strategies like the “drop on grid” method. Operation parameters of the used ES have been optimized in dependence on material.
It was found that the particles deposited by electrospray generally show a much more homogeneous spatial distribution on the substrate and the number of single particles increases substantially. The latter finding is much better suited to an automatic image evaluation procedure than the agglomerated particles observed otherwise. The applicability of the technique to a broad range of materials is illustrated by various examples, being able to demonstrate that electrospray deposition of particle suspensions on a TEM grid is a very promising option for achieving representative particle size distributions (Mielke et al., 2016).
Fig. 1. Simplified representation of “drop on grid” and electrospray deposition techniques.
The research leading to these results has received funding from the European Union's Seventh Framework Programme (FP7/2007-2013) under grant agreement n° 604347. Fierz et al. (2007 Theoretical and Experimental
Evaluation of a Portable Electrostatic TEM Sampler. Aerosol Sci. Tech. 41:5, 520-528.
Mielke et al (2017), Evaluation of Electrospray as a Sample Preparation Tool for Electron Microscopic Investigations: Toward Quantitative Evaluation of Nanoparticles. Microsc. Microanal. 23, 163–172
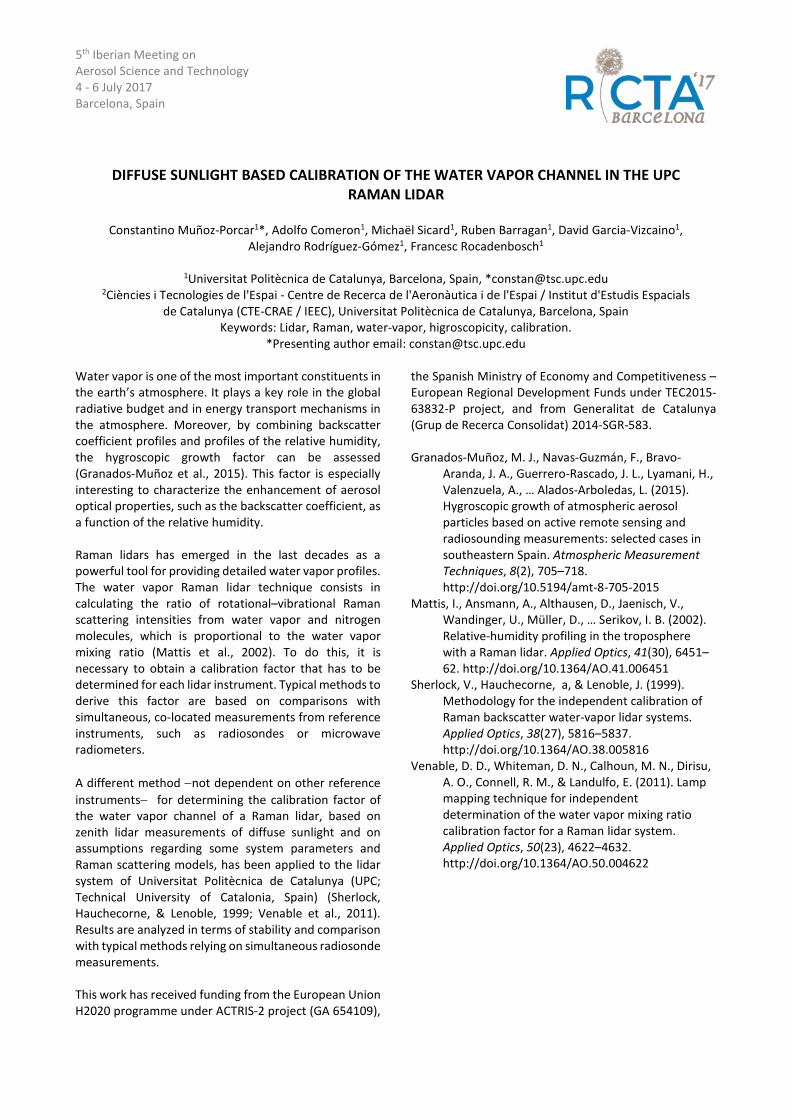
5th Iberian Meeting on Aerosol Science and Technology 4 - 6 July 2017 Barcelona, Spain
DIFFUSE SUNLIGHT BASED CALIBRATION OF THE WATER VAPOR CHANNEL IN THE UPC RAMAN LIDAR
Constantino Muñoz-Porcar1*, Adolfo Comeron1, Michaël Sicard1, Ruben Barragan1, David Garcia-Vizcaino1,
Alejandro Rodríguez-Gómez1, Francesc Rocadenbosch1
1Universitat Politècnica de Catalunya, Barcelona, Spain, *[email protected] 2Ciències i Tecnologies de l'Espai - Centre de Recerca de l'Aeronàutica i de l'Espai / Institut d'Estudis Espacials
de Catalunya (CTE-CRAE / IEEC), Universitat Politècnica de Catalunya, Barcelona, Spain Keywords: Lidar, Raman, water-vapor, higroscopicity, calibration.
*Presenting author email: [email protected]
Water vapor is one of the most important constituents in the earth’s atmosphere. It plays a key role in the global radiative budget and in energy transport mechanisms in the atmosphere. Moreover, by combining backscatter coefficient profiles and profiles of the relative humidity, the hygroscopic growth factor can be assessed (Granados-Muñoz et al., 2015). This factor is especially interesting to characterize the enhancement of aerosol optical properties, such as the backscatter coefficient, as a function of the relative humidity. Raman lidars has emerged in the last decades as a powerful tool for providing detailed water vapor profiles. The water vapor Raman lidar technique consists in calculating the ratio of rotational–vibrational Raman scattering intensities from water vapor and nitrogen molecules, which is proportional to the water vapor mixing ratio (Mattis et al., 2002). To do this, it is necessary to obtain a calibration factor that has to be determined for each lidar instrument. Typical methods to derive this factor are based on comparisons with simultaneous, co-located measurements from reference instruments, such as radiosondes or microwave radiometers. A different method −not dependent on other reference instruments− for determining the calibration factor of the water vapor channel of a Raman lidar, based on zenith lidar measurements of diffuse sunlight and on assumptions regarding some system parameters and Raman scattering models, has been applied to the lidar system of Universitat Politècnica de Catalunya (UPC; Technical University of Catalonia, Spain) (Sherlock, Hauchecorne, & Lenoble, 1999; Venable et al., 2011). Results are analyzed in terms of stability and comparison with typical methods relying on simultaneous radiosonde measurements. This work has received funding from the European Union H2020 programme under ACTRIS-2 project (GA 654109),
the Spanish Ministry of Economy and Competitiveness – European Regional Development Funds under TEC2015-63832-P project, and from Generalitat de Catalunya (Grup de Recerca Consolidat) 2014-SGR-583. Granados-Muñoz, M. J., Navas-Guzmán, F., Bravo-
Aranda, J. A., Guerrero-Rascado, J. L., Lyamani, H., Valenzuela, A., … Alados-Arboledas, L. (2015). Hygroscopic growth of atmospheric aerosol particles based on active remote sensing and radiosounding measurements: selected cases in southeastern Spain. Atmospheric Measurement Techniques, 8(2), 705–718. http://doi.org/10.5194/amt-8-705-2015
Mattis, I., Ansmann, A., Althausen, D., Jaenisch, V., Wandinger, U., Müller, D., … Serikov, I. B. (2002). Relative-humidity profiling in the troposphere with a Raman lidar. Applied Optics, 41(30), 6451–62. http://doi.org/10.1364/AO.41.006451
Sherlock, V., Hauchecorne, a, & Lenoble, J. (1999). Methodology for the independent calibration of Raman backscatter water-vapor lidar systems. Applied Optics, 38(27), 5816–5837. http://doi.org/10.1364/AO.38.005816
Venable, D. D., Whiteman, D. N., Calhoun, M. N., Dirisu, A. O., Connell, R. M., & Landulfo, E. (2011). Lamp mapping technique for independent determination of the water vapor mixing ratio calibration factor for a Raman lidar system. Applied Optics, 50(23), 4622–4632. http://doi.org/10.1364/AO.50.004622
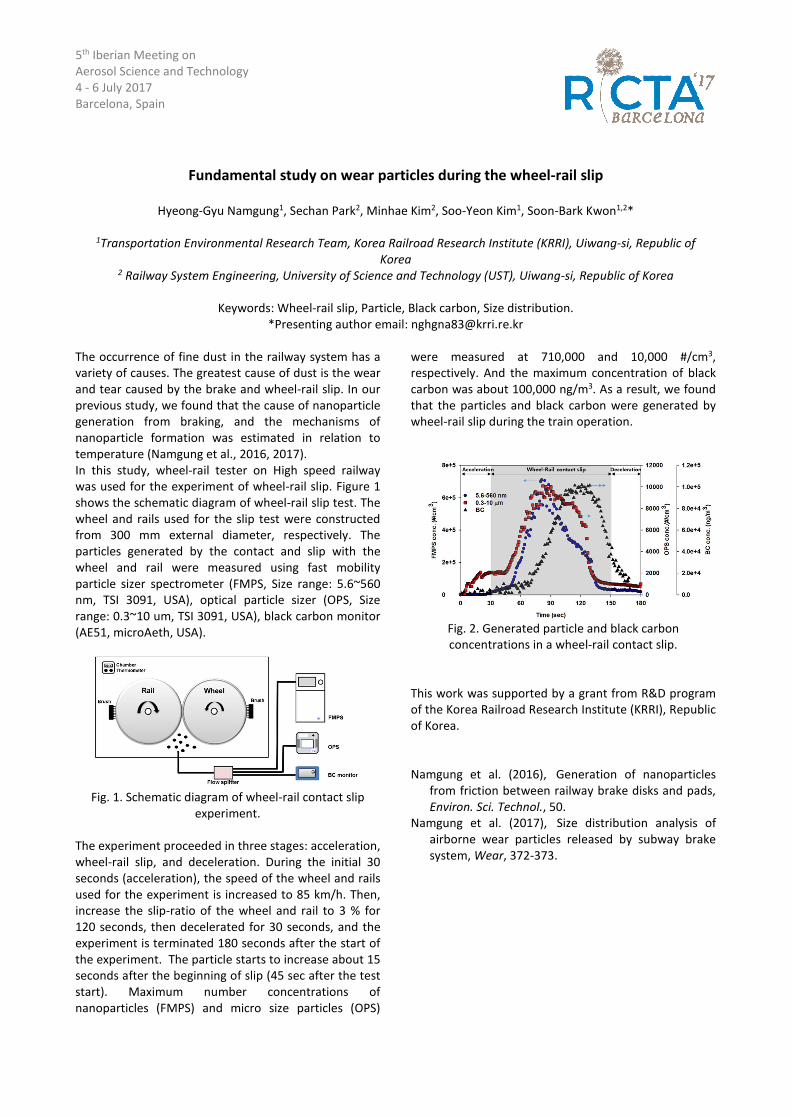
5th Iberian Meeting on Aerosol Science and Technology 4 - 6 July 2017 Barcelona, Spain
Fundamental study on wear particles during the wheel-rail slip
Hyeong-Gyu Namgung1, Sechan Park2, Minhae Kim2, Soo-Yeon Kim1, Soon-Bark Kwon1,2*
1Transportation Environmental Research Team, Korea Railroad Research Institute (KRRI), Uiwang-si, Republic of Korea
2 Railway System Engineering, University of Science and Technology (UST), Uiwang-si, Republic of Korea
Keywords: Wheel-rail slip, Particle, Black carbon, Size distribution. *Presenting author email: [email protected]
The occurrence of fine dust in the railway system has a variety of causes. The greatest cause of dust is the wear and tear caused by the brake and wheel-rail slip. In our previous study, we found that the cause of nanoparticle generation from braking, and the mechanisms of nanoparticle formation was estimated in relation to temperature (Namgung et al., 2016, 2017). In this study, wheel-rail tester on High speed railway was used for the experiment of wheel-rail slip. Figure 1 shows the schematic diagram of wheel-rail slip test. The wheel and rails used for the slip test were constructed from 300 mm external diameter, respectively. The particles generated by the contact and slip with the wheel and rail were measured using fast mobility particle sizer spectrometer (FMPS, Size range: 5.6~560 nm, TSI 3091, USA), optical particle sizer (OPS, Size range: 0.3~10 um, TSI 3091, USA), black carbon monitor (AE51, microAeth, USA).
Fig. 1. Schematic diagram of wheel-rail contact slip
experiment.
The experiment proceeded in three stages: acceleration, wheel-rail slip, and deceleration. During the initial 30 seconds (acceleration), the speed of the wheel and rails used for the experiment is increased to 85 km/h. Then, increase the slip-ratio of the wheel and rail to 3 % for 120 seconds, then decelerated for 30 seconds, and the experiment is terminated 180 seconds after the start of the experiment. The particle starts to increase about 15 seconds after the beginning of slip (45 sec after the test start). Maximum number concentrations of nanoparticles (FMPS) and micro size particles (OPS)
were measured at 710,000 and 10,000 #/cm3, respectively. And the maximum concentration of black carbon was about 100,000 ng/m3. As a result, we found that the particles and black carbon were generated by wheel-rail slip during the train operation.
Fig. 2. Generated particle and black carbon concentrations in a wheel-rail contact slip.
This work was supported by a grant from R&D program of the Korea Railroad Research Institute (KRRI), Republic of Korea. Namgung et al. (2016), Generation of nanoparticles
from friction between railway brake disks and pads, Environ. Sci. Technol., 50.
Namgung et al. (2017), Size distribution analysis of airborne wear particles released by subway brake system, Wear, 372-373.
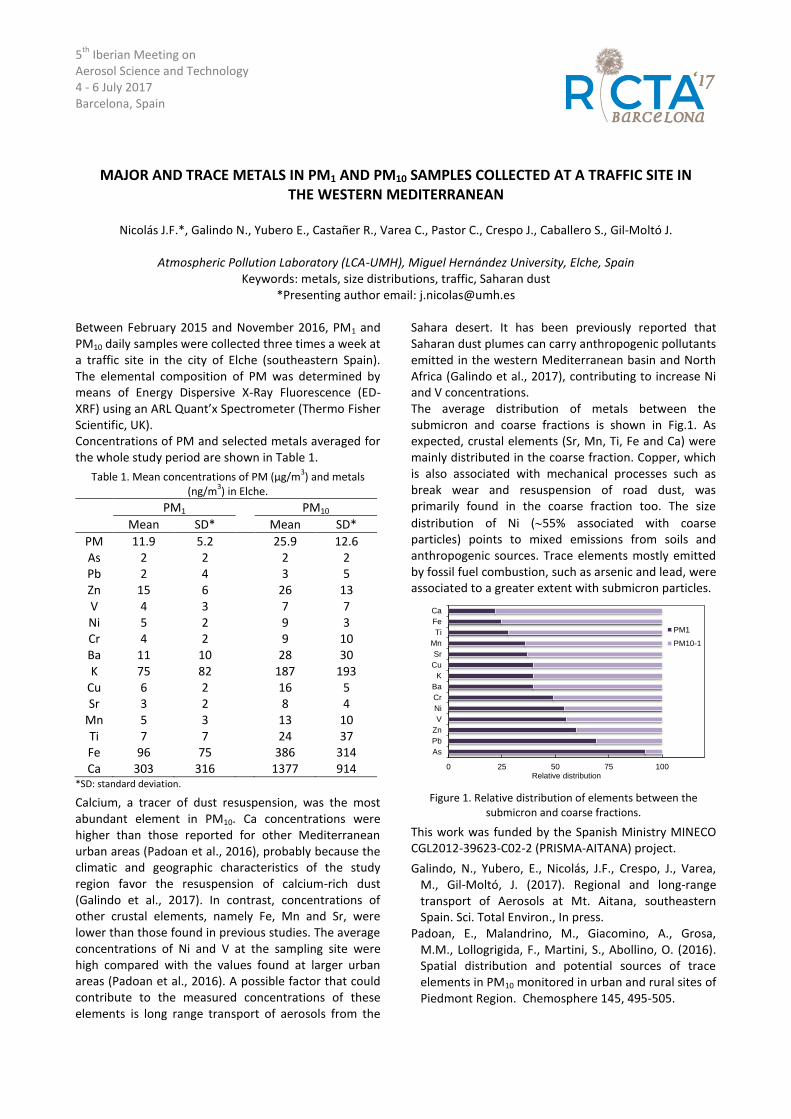
5th
Iberian Meeting on Aerosol Science and Technology 4 - 6 July 2017 Barcelona, Spain
MAJOR AND TRACE METALS IN PM1 AND PM10 SAMPLES COLLECTED AT A TRAFFIC SITE IN THE WESTERN MEDITERRANEAN
Nicolás J.F.*, Galindo N., Yubero E., Castañer R., Varea C., Pastor C., Crespo J., Caballero S., Gil-Moltó J.
Atmospheric Pollution Laboratory (LCA-UMH), Miguel Hernández University, Elche, Spain
Keywords: metals, size distributions, traffic, Saharan dust *Presenting author email: [email protected]
Between February 2015 and November 2016, PM1 and PM10 daily samples were collected three times a week at a traffic site in the city of Elche (southeastern Spain). The elemental composition of PM was determined by means of Energy Dispersive X-Ray Fluorescence (ED-XRF) using an ARL Quant’x Spectrometer (Thermo Fisher Scientific, UK). Concentrations of PM and selected metals averaged for the whole study period are shown in Table 1.
Table 1. Mean concentrations of PM (µg/m3) and metals
(ng/m3) in Elche.
PM1 PM10 Mean SD* Mean SD*
PM 11.9 5.2 25.9 12.6 As 2 2 2 2 Pb 2 4 3 5 Zn 15 6 26 13 V 4 3 7 7 Ni 5 2 9 3 Cr 4 2 9 10 Ba 11 10 28 30 K 75 82 187 193
Cu 6 2 16 5 Sr 3 2 8 4
Mn 5 3 13 10 Ti 7 7 24 37 Fe 96 75 386 314 Ca 303 316 1377 914
*SD: standard deviation.
Calcium, a tracer of dust resuspension, was the most abundant element in PM10. Ca concentrations were higher than those reported for other Mediterranean urban areas (Padoan et al., 2016), probably because the climatic and geographic characteristics of the study region favor the resuspension of calcium-rich dust (Galindo et al., 2017). In contrast, concentrations of other crustal elements, namely Fe, Mn and Sr, were lower than those found in previous studies. The average concentrations of Ni and V at the sampling site were high compared with the values found at larger urban areas (Padoan et al., 2016). A possible factor that could contribute to the measured concentrations of these elements is long range transport of aerosols from the
Sahara desert. It has been previously reported that Saharan dust plumes can carry anthropogenic pollutants emitted in the western Mediterranean basin and North Africa (Galindo et al., 2017), contributing to increase Ni and V concentrations. The average distribution of metals between the submicron and coarse fractions is shown in Fig.1. As expected, crustal elements (Sr, Mn, Ti, Fe and Ca) were mainly distributed in the coarse fraction. Copper, which is also associated with mechanical processes such as break wear and resuspension of road dust, was primarily found in the coarse fraction too. The size
distribution of Ni (55% associated with coarse particles) points to mixed emissions from soils and anthropogenic sources. Trace elements mostly emitted by fossil fuel combustion, such as arsenic and lead, were associated to a greater extent with submicron particles.
Figure 1. Relative distribution of elements between the
submicron and coarse fractions.
This work was funded by the Spanish Ministry MINECO CGL2012-39623-C02-2 (PRISMA-AITANA) project.
Galindo, N., Yubero, E., Nicolás, J.F., Crespo, J., Varea, M., Gil-Moltó, J. (2017). Regional and long-range transport of Aerosols at Mt. Aitana, southeastern Spain. Sci. Total Environ., In press.
Padoan, E., Malandrino, M., Giacomino, A., Grosa, M.M., Lollogrigida, F., Martini, S., Abollino, O. (2016). Spatial distribution and potential sources of trace elements in PM10 monitored in urban and rural sites of Piedmont Region. Chemosphere 145, 495-505.
0 25 50 75 100
As
Pb
Zn
V
Ni
Cr
Ba
K
Cu
Sr
Mn
Ti
Fe
Ca
Relative distribution
PM1
PM10-1
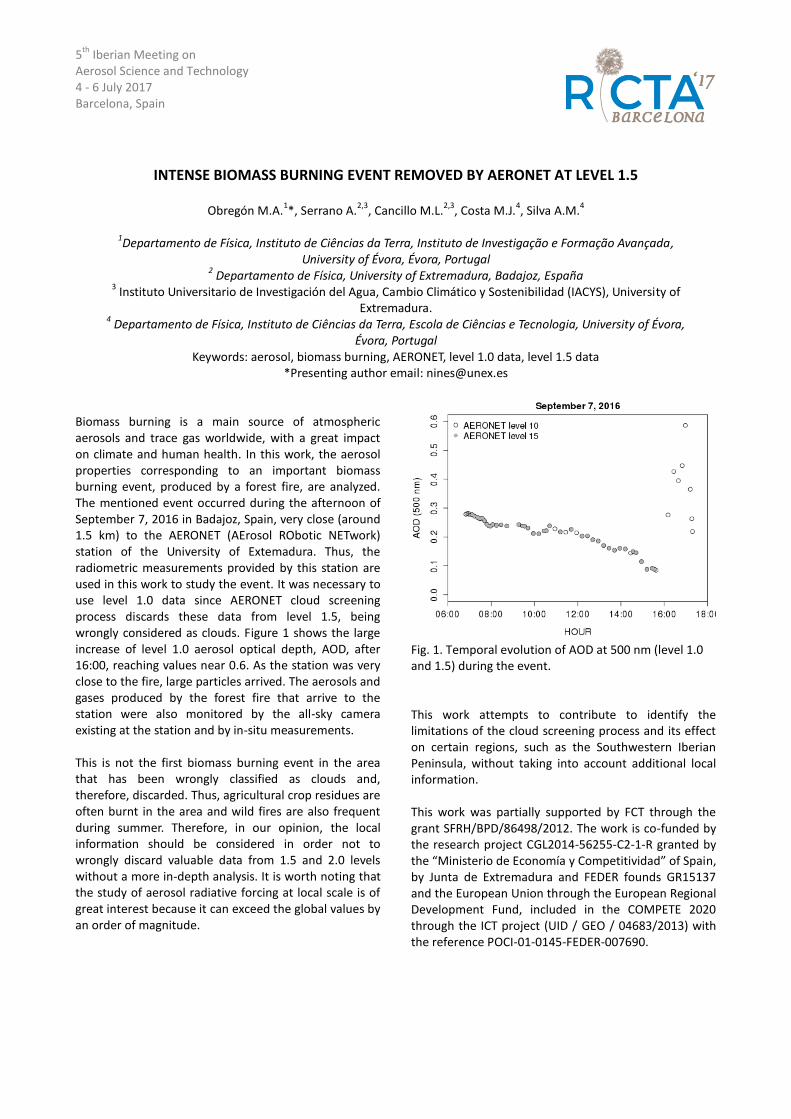
5th
Iberian Meeting on Aerosol Science and Technology 4 - 6 July 2017 Barcelona, Spain
INTENSE BIOMASS BURNING EVENT REMOVED BY AERONET AT LEVEL 1.5
Obregón M.A.1*, Serrano A.
2,3, Cancillo M.L.
2,3, Costa M.J.
4, Silva A.M.
4
1Departamento de Física, Instituto de Ciências da Terra, Instituto de Investigação e Formação Avançada,
University of Évora, Évora, Portugal
2 Departamento de Física, University of Extremadura, Badajoz, España
3 Instituto Universitario de Investigación del Agua, Cambio Climático y Sostenibilidad (IACYS), University of
Extremadura.
4 Departamento de Física, Instituto de Ciências da Terra, Escola de Ciências e Tecnologia, University of Évora,
Évora, Portugal Keywords: aerosol, biomass burning, AERONET, level 1.0 data, level 1.5 data
*Presenting author email: [email protected]
Biomass burning is a main source of atmospheric aerosols and trace gas worldwide, with a great impact on climate and human health. In this work, the aerosol properties corresponding to an important biomass burning event, produced by a forest fire, are analyzed. The mentioned event occurred during the afternoon of September 7, 2016 in Badajoz, Spain, very close (around 1.5 km) to the AERONET (AErosol RObotic NETwork) station of the University of Extemadura. Thus, the radiometric measurements provided by this station are used in this work to study the event. It was necessary to use level 1.0 data since AERONET cloud screening process discards these data from level 1.5, being wrongly considered as clouds. Figure 1 shows the large increase of level 1.0 aerosol optical depth, AOD, after 16:00, reaching values near 0.6. As the station was very close to the fire, large particles arrived. The aerosols and gases produced by the forest fire that arrive to the station were also monitored by the all-sky camera existing at the station and by in-situ measurements. This is not the first biomass burning event in the area that has been wrongly classified as clouds and, therefore, discarded. Thus, agricultural crop residues are often burnt in the area and wild fires are also frequent during summer. Therefore, in our opinion, the local information should be considered in order not to wrongly discard valuable data from 1.5 and 2.0 levels without a more in-depth analysis. It is worth noting that the study of aerosol radiative forcing at local scale is of great interest because it can exceed the global values by an order of magnitude.
Fig. 1. Temporal evolution of AOD at 500 nm (level 1.0 and 1.5) during the event. This work attempts to contribute to identify the limitations of the cloud screening process and its effect on certain regions, such as the Southwestern Iberian Peninsula, without taking into account additional local information. This work was partially supported by FCT through the grant SFRH/BPD/86498/2012. The work is co-funded by the research project CGL2014-56255-C2-1-R granted by the “Ministerio de Economía y Competitividad” of Spain, by Junta de Extremadura and FEDER founds GR15137 and the European Union through the European Regional Development Fund, included in the COMPETE 2020 through the ICT project (UID / GEO / 04683/2013) with the reference POCI-01-0145-FEDER-007690.
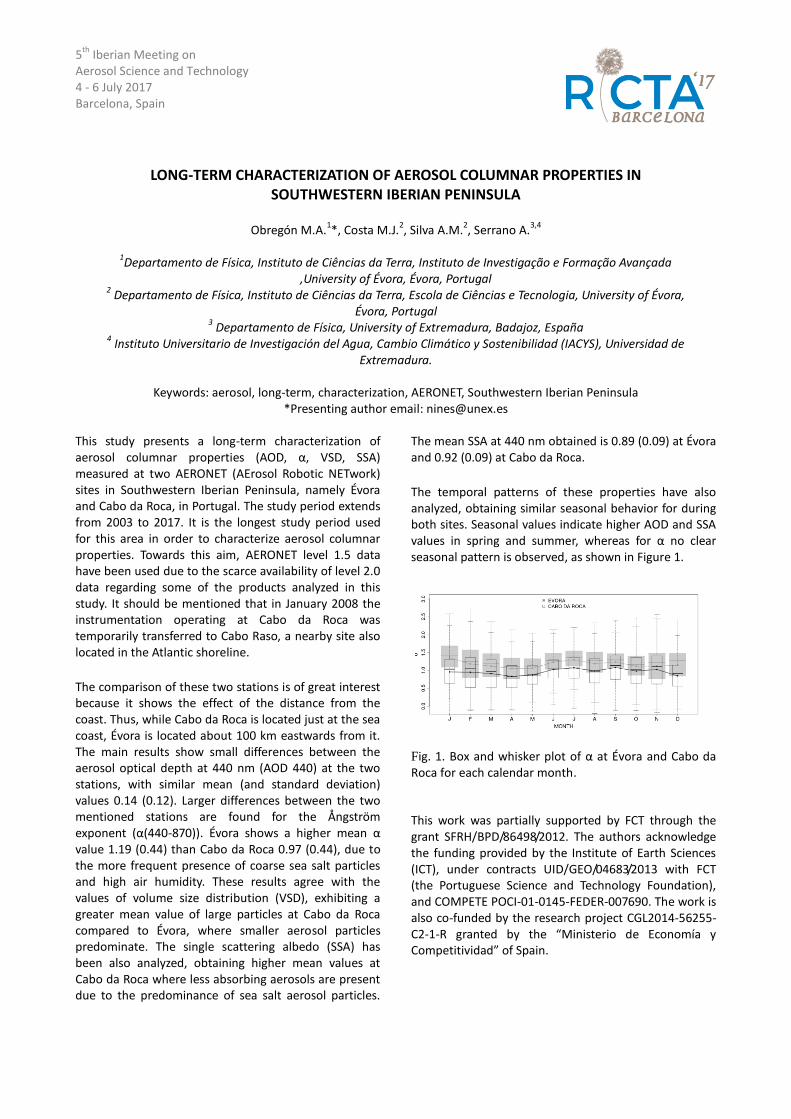
5th
Iberian Meeting on Aerosol Science and Technology 4 - 6 July 2017 Barcelona, Spain
LONG-TERM CHARACTERIZATION OF AEROSOL COLUMNAR PROPERTIES IN SOUTHWESTERN IBERIAN PENINSULA
Obregón M.A.
1*, Costa M.J.
2, Silva A.M.
2, Serrano A.
3,4
1Departamento de Física, Instituto de Ciências da Terra, Instituto de Investigação e Formação Avançada
,University of Évora, Évora, Portugal
2 Departamento de Física, Instituto de Ciências da Terra, Escola de Ciências e Tecnologia, University of Évora,
Évora, Portugal
3 Departamento de Física, University of Extremadura, Badajoz, España
4 Instituto Universitario de Investigación del Agua, Cambio Climático y Sostenibilidad (IACYS), Universidad de
Extremadura.
Keywords: aerosol, long-term, characterization, AERONET, Southwestern Iberian Peninsula *Presenting author email: [email protected]
This study presents a long-term characterization of aerosol columnar properties (AOD, α, VSD, SSA) measured at two AERONET (AErosol Robotic NETwork) sites in Southwestern Iberian Peninsula, namely Évora and Cabo da Roca, in Portugal. The study period extends from 2003 to 2017. It is the longest study period used for this area in order to characterize aerosol columnar properties. Towards this aim, AERONET level 1.5 data have been used due to the scarce availability of level 2.0 data regarding some of the products analyzed in this study. It should be mentioned that in January 2008 the instrumentation operating at Cabo da Roca was temporarily transferred to Cabo Raso, a nearby site also located in the Atlantic shoreline. The comparison of these two stations is of great interest because it shows the effect of the distance from the coast. Thus, while Cabo da Roca is located just at the sea coast, Évora is located about 100 km eastwards from it. The main results show small differences between the aerosol optical depth at 440 nm (AOD 440) at the two stations, with similar mean (and standard deviation) values 0.14 (0.12). Larger differences between the two mentioned stations are found for the Ångström exponent (α(440-870)). Évora shows a higher mean α value 1.19 (0.44) than Cabo da Roca 0.97 (0.44), due to the more frequent presence of coarse sea salt particles and high air humidity. These results agree with the values of volume size distribution (VSD), exhibiting a greater mean value of large particles at Cabo da Roca compared to Évora, where smaller aerosol particles predominate. The single scattering albedo (SSA) has been also analyzed, obtaining higher mean values at Cabo da Roca where less absorbing aerosols are present due to the predominance of sea salt aerosol particles.
The mean SSA at 440 nm obtained is 0.89 (0.09) at Évora and 0.92 (0.09) at Cabo da Roca. The temporal patterns of these properties have also analyzed, obtaining similar seasonal behavior for during both sites. Seasonal values indicate higher AOD and SSA values in spring and summer, whereas for α no clear seasonal pattern is observed, as shown in Figure 1.
Fig. 1. Box and whisker plot of α at Évora and Cabo da Roca for each calendar month.
This work was partially supported by FCT through the grant SFRH/BPD/86498/2012. The authors acknowledge the funding provided by the Institute of Earth Sciences (ICT), under contracts UID/GEO/04683/2013 with FCT (the Portuguese Science and Technology Foundation), and COMPETE POCI-01-0145-FEDER-007690. The work is also co-funded by the research project CGL2014-56255-C2-1-R granted by the “Ministerio de Economía y Competitividad” of Spain.
5th Iberian Meeting on Aerosol Science and Technology 4 - 6 July 2017 Barcelona, Spain
TRENDS IN ATMOSPHERIC PARTICULATE MATTER AND GASES IN LEÓN (SPAIN): EFFECTS OF AIR QUALITY REGULATIONS
Oduber F., Blanco-Alegre C., Calvo A.I., Castro A., Fraile R.*
Department of Physics, IMARENAB University of León, 24071 León, Spain
Keywords: air quality, environmental legislation, gases, PM10, trends. * [email protected]
Several studies have demonstrated that the exposure to high levels of air pollutants may cause a negative impact on human health and also may negatively affect the environment (Kampa & Castanas, 2008; Tang et al., 2005). For many years, in Europe some efforts have been made for diminishing the air pollutants emission. Thus, the Directive 2008/50/EC relative to Ambient Air Quality and a Cleaner Atmosphere in Europe was approved in 2008. In Spain, the legal basis relative to the Air Quality and Atmosphere Protection and Improvement of Air Quality is contained in the Law 34/2007 and Royal Decree 102/2011, respectively. The study of the air pollutants trends is essential to show the evolution of emission sources over the years and to assess the effectiveness of emission control policies. In Spain, the studies show that the Spanish Government efforts for the reduction of the air pollutants emissions have achieved convincing results (Querol et al., 2014). Data from four air quality stations (three traffic and one background stations), corresponding to the Castilla y León air quality network (www.jcyl.es), have been used, trying to establish the impact of the policies implemented by the European, Spanish and local Government in the last 19 years, concerning the reduction in the emission of air pollutants. The calculations of trends were made with the ThielSen methodology that derives from the non-parametric Mann-Kendall test (Hipel & McLeod, 2005). The trend shows, in general, a statistical significant decrease in the CO, NO, NO2, SO2, O3 and PM10 concentrations (up to -7.25, -6.04, -3.79, -8.54, -2.91 and -6.53 %/year, respectively, p< 0.001) in León city. This pattern has also been observed by the Spanish System of the Emissions Inventory (MAGRAMA), which reports a statistical significant decrease in the air pollutant concentrations mainly due to the reduction in the emissions from road traffic and public power in Spain between 1997 and 2014. Also, the change in the energy consumption and production in the province of León has had an important impact on this decreasing
trend. The Pearson coefficient in the traffic stations of León shows that there is a statistical significant correlation between PM10 and NO (R > 0.3, p < 0.01) suggesting that both pollutants could have road traffic as a common source. Furthermore, a high correlation between PM10 and CO (R > 0.6, p < 0.01) was observed, which reflects the relationship with the primary emissions from combustion process. In urban stations there is a significant correlation between PM10 and SO2 (R > 0.4, p< 0.001), indicating the contribution from combustion processes. In León, there is a significant decrease in the atmospheric pollutant emissions as a consequence of several measures taken by the international, national and local government. The decrease in the air pollutant concentrations is evident since 2002. However, is from 2008 when the recorded values are within the allowed limit values, especially for PM10 and SO2 concentrations. The mainly sources of air pollutants in León are the road traffic and the combustion process (biomass and fossil fuels) in domestic heating systems. This work was partially supported by the Spanish Ministry of Economy and Competitiveness (Grants TEC2014-57821-R, BES-2015-074473 -F. Oduber- and CGL2014-52556-R, AERORAIN co-financed with FEDER funds), the University of León (Programa Propio 2015/00054/001). Hipel K.W. & McLeod A.I. (2005). Time series modelling
of water resources and environmental systems. Amsterdam: Elsevier.
Kampa M. & Castanas E. (2008). Human health effects of air pollution. Environ. Pollut. 151(2), 362–367.
Querol X. et al., (2014). 2001-2012 trends on air quality in Spain. Sci. Total Environ. 490, 957–969.
Tang et al. (2005). The chemistry of precipitation and its relation to aerosol in Beijing. Atmos. Environ., 39(19), 3397–3406.
5th
Iberian Meeting on Aerosol Science and Technology 4 - 6 July 2017 Barcelona, Spain
EVALUATION OF BLACK CARBON, ULTRAFINE PARTICLES AND PM2,5 CONCENTRATIONS IN ISTANBUL SUBWAYS
Burcu Onat, Burcu Uzun*, Özcan Akın, Ülkü Alver Şahin
Istanbul University Environmental Engineering Department Avcilar 34320, Istanbul, Turkey
Keywords: personal exposure, subway, black carbon, ultrafine particles, PM2,5. *Presenting author email: [email protected]
Subway systems are one of the most preferred transportation type because of its speed and comfort in Istanbul. Commuters are exposed to air pollutants when they traveling and waiting in the station platforms during the day. Particulate matter is one of the indoor air pollutants, especially fine particulate matter, is a pollutant which has adverse effects on human health and its characteristics vary with time and place. Ultra-fine particles (<100 nm) (UFP) have more harmful to human health than PM2.5. Increasing evidence suggests that ultrafine particles (UFPs) may contribute to cardiore- spiratory morbidity. Black carbon (BC) is a new indicator for determination of adverse health effects associated with air pollution in traffic. In this study, BC, UFP and PM2.5 measurements were done in train and station platforms of three subway lines in Istanbul. Real time exposure BC concentrations were recorded by MicroAeth AE51 BC monitor. PM2.5 was measured with a portable real-time aerosol monitor (pDR 1200, Thermo, USA). Ultrafine particles were counted with (Condensation particle counter). The mean PM2.5 concentrations were found between 14,3 μg/m³ - 74,5 μg/m³. The range of mean concentrations of BC in PM2.5 changed between 0,9 μg/m³ –12,4 μg/m³. The average UFP number concentration was found between 4343 particles/cm³ - 39150 particles/cm³.
We gratefully acknowledge the Scientific and Technical Research Council of Turkey (TUBITAK) with project no 115Y263 for financially supporting this study.
5th Iberian Meeting on Aerosol Science and Technology 4 - 6 July 2017 Barcelona, Spain
ANALYSIS OF HYSPLIT MODEL SENSITIVITY TO DIFFERENT METEOROLOGICAL INPUT DATA
IN DIFFERENT GEOGRAPHICAL AREAS
Orza J.A.G.1*, Reizer M.2, Juda-Rezler K.2
1 SCOLAb, Física Aplicada, Universidad Miguel Hernández, Elche, Spain 2 Faculty of Building Services, Hydro and Environmental Engineering, Warsaw University of Technology,
Warsaw, Poland Keywords: back trajectories, HYSPLIT, meteorological input, k-means clustering.
*Presenting author email: [email protected]
Analysis of air mass back trajectories is widely used for identification of atmospheric transport patterns, as well as of the origins and pathways of air pollution (e.g. Fleming et al, 2012). Various methods of trajectory calculation have been developed; however, the accuracy of trajectory models always depends on a variety of parameters, including the source of wind field data, wind field spatial and temporal resolution, trajectory type as well as the numerical integration scheme (Stohl, 1998). One of the models, which is most extensively used to generate trajectories backward in time at a given starting location, is the Hybrid Single-Particle Lagrangian Integrated Trajectory (HYSPLIT), developed by the National Oceanic and Atmospheric Administration (NOAA) Air Resources Laboratory (ARL) (Stein et al, 2015). The aim of the present work is to gain further insight into differences between the results of HYSPLIT model driven by different meteorological input data and to quantify the possible reasons responsible for the discrepancies. 4-day back trajectories starting at 4 sites representative of different environments in Europe (Mediterranean, Atlantic, Continental and Scandinavian), at 200, 500, 1500 and 3000 m for the 2-year period 2014-2016 have been computed. The results of the model, forced by four commonly used meteorological data sets with different horizontal and vertical resolutions the NCEP/NCAR Reanalysis (2.5°), Global Data Assimilation System (GDAS) data (1° and 0.5°), as well as the ECMWF ERA-Interim (0.5°), have been compared. The results show significant differences between trajectories computed with the four meteorological datasets. Strong deviations from the average behaviour are studied in connection with meteorological conditions and geographical locations. The average and median differences grow quadratically over time along the back trajectories independently of the site considered. Analysis of the results indicate a dependence with the
starting height also a seasonal variation in the differences. Moreover, meteorological input data influence the number of clusters identified by k-means cluster analysis. Factors that might be responsible for these discrepancies have been identified.
This work was supported by the project financed by the Dean of Faculty of Building Services, Hydro and Environmental Engineering, Warsaw University of Technology. The authors also gratefully acknowledge the NOAA Air Resources Laboratory (ARL) for the provision of the HYSPLIT transport and dispersion model used in this publication. Fleming et al. (2012), Review: Untangling the influence of
air-mass history in interpreting observed atmospheric composition. Environ. Res. 104-105, 1-39.
Stein et al. (2015), NOAA's HYSPLIT atmospheric transport and dispersion modeling system. Bull. Amer. Meteor. Soc. 96, 2059-2077.
Stohl (1998), Computation, accuracy and applications of trajectories – a review and bibliography. Atmos. Environ. 32, 947-966.
5th Iberian Meeting on Aerosol Science and Technology 4 - 6 July 2017 Barcelona, Spain
UPPER-LEVEL DISTURBANCES AND THE IMPACT OF DUST OUTBREAKS IN SPAIN Orza J.A.G.1*, Gómez-Cascales, J.P. 1, Cazorla, A.2, Martiny N.3, Brattich E.4, Garcia F.P.5, Chham E.5, Tositti L.4,
Ferro M.A.5, Camacho A.6, Hernández-Ceballos M.A.7, Alados-Arboledas, L.2
1 SCOLAb, Física Aplicada, Universidad Miguel Hernández, Elche, Spain 2 Andalusian Institute for Earth System Research, IISTA-CEAMA, University of Granada, Junta de Andalucía, and
Department of Applied Physics, University of Granada, Granada, Spain 3 Centre de Recherches de Climatologie, CNRS/Université de Bourgogne, Dijon, France
4Environmental Chemistry and Radioactivity Laboratory, Department of Chemistry “G. Ciamician”, Alma Mater Studiorum University of Bologna, Bologna, Italy
5 Laboratorio de Radioquímica y Radiología Ambiental, Departamento de Química Inorgánica, Universidad de Granada, Granada, Spain
6 INTE, Universitat Politècnica de Catalunya, Barcelona, Spain 7 European Commission, JRC, Knowledge for Nuclear Safety, Security & Safeguards Unit, REM&EPR, Ispra, Italy
Keywords: African dust outbreak, upper-level disturbances, meteorological processes. *Presenting author email: [email protected]
The interaction between upper-level disturbances and major orographic features in north-western Africa is a key element for cyclogenesis and the development of convective storms, which promote instability at lower levels and lead to dust mobilization. It may also induce stratospheric to tropospheric exchange. The analysis of these processes and their subsequent impact over the Iberian Peninsula (IP) is the objective of the FRESA (“Impacto de las intrusiones de masas de aire con polvo aFRicano y de masas de aire EStratosférico en la Península Ibérica. Influencia de El Atlas”) research project. After a long term (2004-2016) analysis of jet streams in NW Africa and the analysis of a number of representative cases, in this work we present a description of the large-scale meteorological processes leading to massive dust mobilization in NW Africa and transport to the IP after passing over the Saharan Atlas for three episodes (October 2008, September 2007, and February 2016). The three events had a strong impact either at the ground level or in the vertical. Contrarily to most of African events over the IP, none of these events occurred during the summertime, when African dust outbreaks are more common but the jet streams are by far less frequent over the study area. The interaction of upper-level troughs and cut-off lows with the Atlas Mountains as well as the interaction of tropical plumes and/or the subtropical jet with the Hoggar Massif were the large-scale relevant processes, but the precise location of the meteorological features is found to be crucial as indicated by the differences among the three episodes. In the case of October 2008, a cut-off low moving westwards over the Atlas was the cause of both dust
mobilization (cold pool and density current formation, leading to a haboob that ran parallel to the SE slope of the Atlas) and transport to the IP. On September 2007, a low to the SW of St. Vincent Cape in combination with the North African high advected dust to the IP at mid-low tropospheric altitude after mobilization due to moist convection produced to the SW and N of the Hoggar. On February 2016, three main synoptic features at mid-upper levels were involved: a cut-off low to the SW of St. Vincent Cape, which was mostly responsible for the dust advection to the IP during the first part of the event; a tropical moist plume accompanied by an intense south-westerly subtropical jet streak that interacted with the Hoggar and triggered the instability at low levels; and the North African high (extended to the north when the trough was cut-off and the polar front jet retreated northwards) which advected the dust laden air masses to the east of the IP in the second part of the event. The analysis of back-trajectories calculated at multiple heights for the event of February 2016 in connection with aerodrome present-weather reports and satellite observations shows the orographic uplifting of the dust laden flows in the southern slope of the Saharan Atlas and their entrance into the IP at mid-low levels, in good agreement with the backscatter coefficient profiles of the CEAMA (Granada) ceilometer (Cazorla et al., submitted). This work was supported by the Spanish MINECO under grant CGL2015-70741-R (FRESA). Cazorla et al. (submitted to ACP), Near real time
processing of ceilometer network data: characterizing and extraordinary dust outbreak over the Iberian Peninsula.
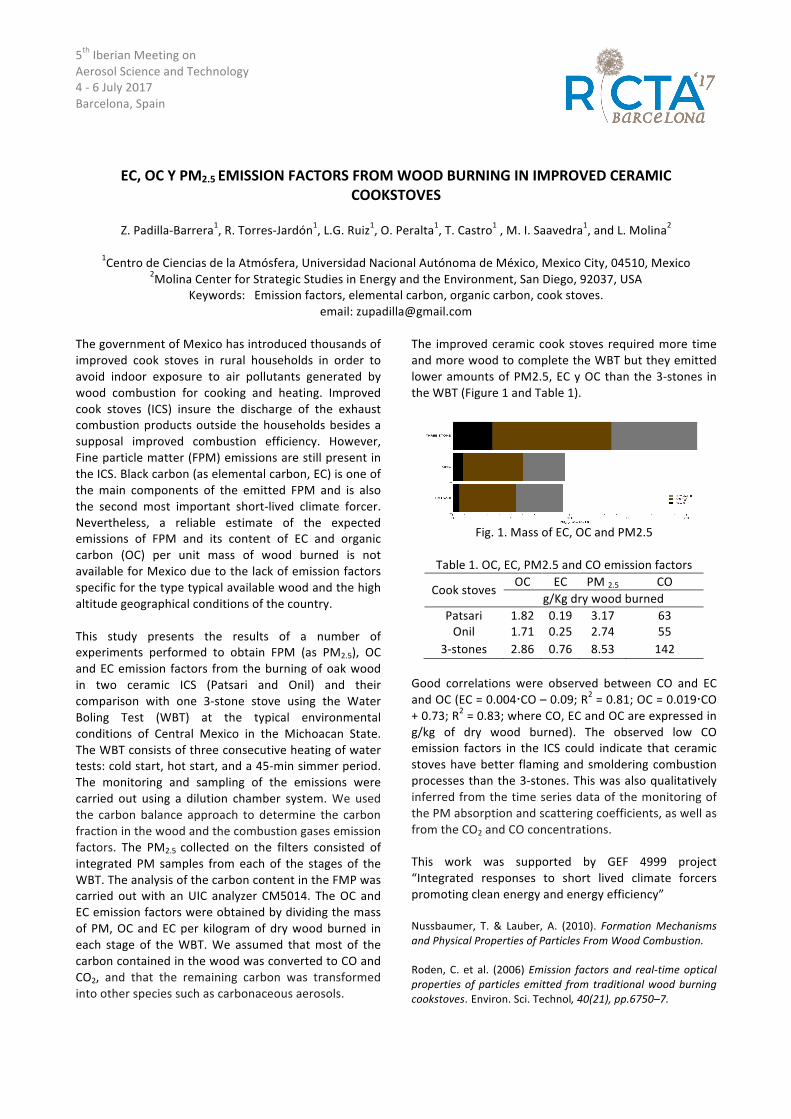
5th Iberian Meeting on Aerosol Science and Technology 4 -‐ 6 July 2017 Barcelona, Spain
EC, OC Y PM2.5 EMISSION FACTORS FROM WOOD BURNING IN IMPROVED CERAMIC COOKSTOVES
Z. Padilla-‐Barrera1, R. Torres-‐Jardón1, L.G. Ruiz1, O. Peralta1, T. Castro1 , M. I. Saavedra1, and L. Molina2
1Centro de Ciencias de la Atmósfera, Universidad Nacional Autónoma de México, Mexico City, 04510, Mexico
2Molina Center for Strategic Studies in Energy and the Environment, San Diego, 92037, USA Keywords: Emission factors, elemental carbon, organic carbon, cook stoves.
email: [email protected] The government of Mexico has introduced thousands of improved cook stoves in rural households in order to avoid indoor exposure to air pollutants generated by wood combustion for cooking and heating. Improved cook stoves (ICS) insure the discharge of the exhaust combustion products outside the households besides a supposal improved combustion efficiency. However, Fine particle matter (FPM) emissions are still present in the ICS. Black carbon (as elemental carbon, EC) is one of the main components of the emitted FPM and is also the second most important short-‐lived climate forcer. Nevertheless, a reliable estimate of the expected emissions of FPM and its content of EC and organic carbon (OC) per unit mass of wood burned is not available for Mexico due to the lack of emission factors specific for the type typical available wood and the high altitude geographical conditions of the country. This study presents the results of a number of experiments performed to obtain FPM (as PM2.5), OC and EC emission factors from the burning of oak wood in two ceramic ICS (Patsari and Onil) and their comparison with one 3-‐stone stove using the Water Boling Test (WBT) at the typical environmental conditions of Central Mexico in the Michoacan State. The WBT consists of three consecutive heating of water tests: cold start, hot start, and a 45-‐min simmer period. The monitoring and sampling of the emissions were carried out using a dilution chamber system. We used the carbon balance approach to determine the carbon fraction in the wood and the combustion gases emission factors. The PM2.5 collected on the filters consisted of integrated PM samples from each of the stages of the WBT. The analysis of the carbon content in the FMP was carried out with an UIC analyzer CM5014. The OC and EC emission factors were obtained by dividing the mass of PM, OC and EC per kilogram of dry wood burned in each stage of the WBT. We assumed that most of the carbon contained in the wood was converted to CO and CO2, and that the remaining carbon was transformed into other species such as carbonaceous aerosols.
The improved ceramic cook stoves required more time and more wood to complete the WBT but they emitted lower amounts of PM2.5, EC y OC than the 3-‐stones in the WBT (Figure 1 and Table 1).
Fig. 1. Mass of EC, OC and PM2.5
Table 1. OC, EC, PM2.5 and CO emission factors
Cook stoves OC EC PM 2.5 CO
g/Kg dry wood burned Patsari 1.82 0.19 3.17 63 Onil 1.71 0.25 2.74 55
3-‐stones 2.86 0.76 8.53 142 Good correlations were observed between CO and EC and OC (EC = 0.004�CO – 0.09; R2 = 0.81; OC = 0.019�CO + 0.73; R2 = 0.83; where CO, EC and OC are expressed in g/kg of dry wood burned). The observed low CO emission factors in the ICS could indicate that ceramic stoves have better flaming and smoldering combustion processes than the 3-‐stones. This was also qualitatively inferred from the time series data of the monitoring of the PM absorption and scattering coefficients, as well as from the CO2 and CO concentrations. This work was supported by GEF 4999 project “Integrated responses to short lived climate forcers promoting clean energy and energy efficiency” Nussbaumer, T. & Lauber, A. (2010). Formation Mechanisms and Physical Properties of Particles From Wood Combustion. Roden, C. et al. (2006) Emission factors and real-‐time optical properties of particles emitted from traditional wood burning cookstoves. Environ. Sci. Technol, 40(21), pp.6750–7.
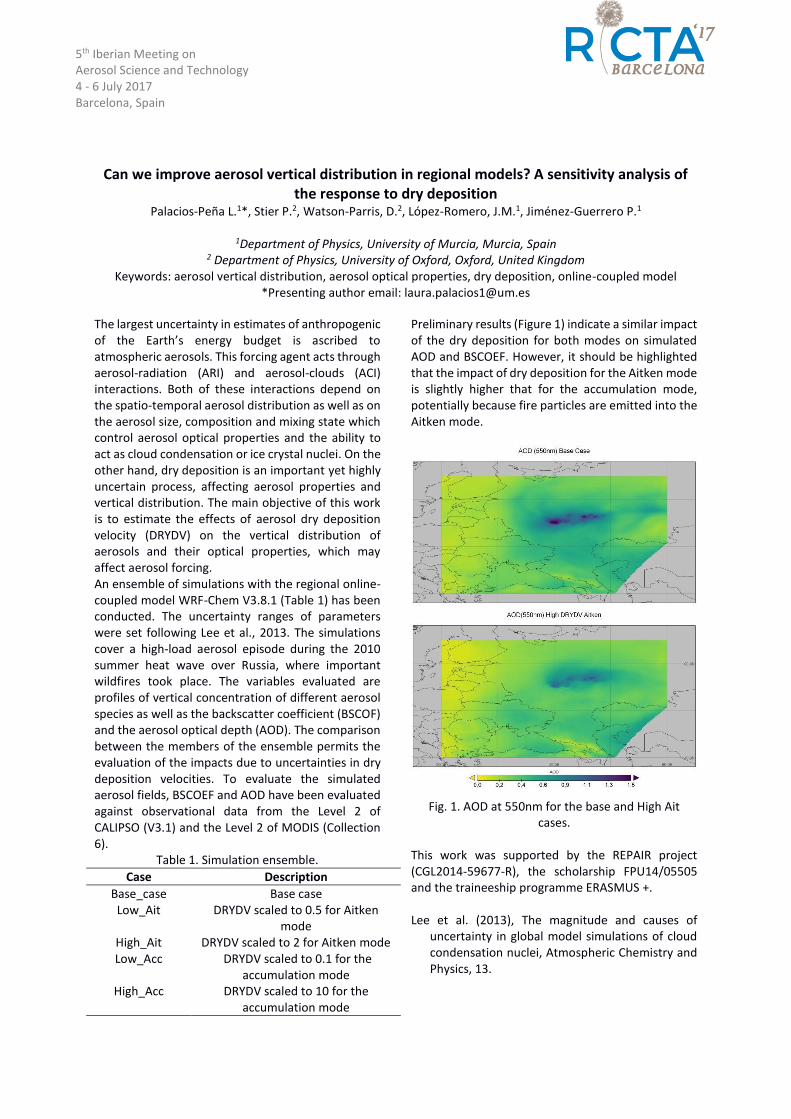
5th Iberian Meeting on Aerosol Science and Technology 4 - 6 July 2017 Barcelona, Spain
Can we improve aerosol vertical distribution in regional models? A sensitivity analysis of the response to dry deposition
Palacios-Peña L.1*, Stier P.2, Watson-Parris, D.2, López-Romero, J.M.1, Jiménez-Guerrero P.1
1Department of Physics, University of Murcia, Murcia, Spain 2 Department of Physics, University of Oxford, Oxford, United Kingdom
Keywords: aerosol vertical distribution, aerosol optical properties, dry deposition, online-coupled model *Presenting author email: [email protected]
The largest uncertainty in estimates of anthropogenic of the Earth’s energy budget is ascribed to atmospheric aerosols. This forcing agent acts through aerosol-radiation (ARI) and aerosol-clouds (ACI) interactions. Both of these interactions depend on the spatio-temporal aerosol distribution as well as on the aerosol size, composition and mixing state which control aerosol optical properties and the ability to act as cloud condensation or ice crystal nuclei. On the other hand, dry deposition is an important yet highly uncertain process, affecting aerosol properties and vertical distribution. The main objective of this work is to estimate the effects of aerosol dry deposition velocity (DRYDV) on the vertical distribution of aerosols and their optical properties, which may affect aerosol forcing. An ensemble of simulations with the regional online-coupled model WRF-Chem V3.8.1 (Table 1) has been conducted. The uncertainty ranges of parameters were set following Lee et al., 2013. The simulations cover a high-load aerosol episode during the 2010 summer heat wave over Russia, where important wildfires took place. The variables evaluated are profiles of vertical concentration of different aerosol species as well as the backscatter coefficient (BSCOF) and the aerosol optical depth (AOD). The comparison between the members of the ensemble permits the evaluation of the impacts due to uncertainties in dry deposition velocities. To evaluate the simulated aerosol fields, BSCOEF and AOD have been evaluated against observational data from the Level 2 of CALIPSO (V3.1) and the Level 2 of MODIS (Collection 6).
Table 1. Simulation ensemble. Case Description
Base_case Base case Low_Ait DRYDV scaled to 0.5 for Aitken
mode High_Ait DRYDV scaled to 2 for Aitken mode Low_Acc DRYDV scaled to 0.1 for the
accumulation mode High_Acc DRYDV scaled to 10 for the
accumulation mode
Preliminary results (Figure 1) indicate a similar impact of the dry deposition for both modes on simulated AOD and BSCOEF. However, it should be highlighted that the impact of dry deposition for the Aitken mode is slightly higher that for the accumulation mode, potentially because fire particles are emitted into the Aitken mode.
Fig. 1. AOD at 550nm for the base and High Ait
cases.
This work was supported by the REPAIR project (CGL2014-59677-R), the scholarship FPU14/05505 and the traineeship programme ERASMUS +. Lee et al. (2013), The magnitude and causes of
uncertainty in global model simulations of cloud condensation nuclei, Atmospheric Chemistry and Physics, 13.
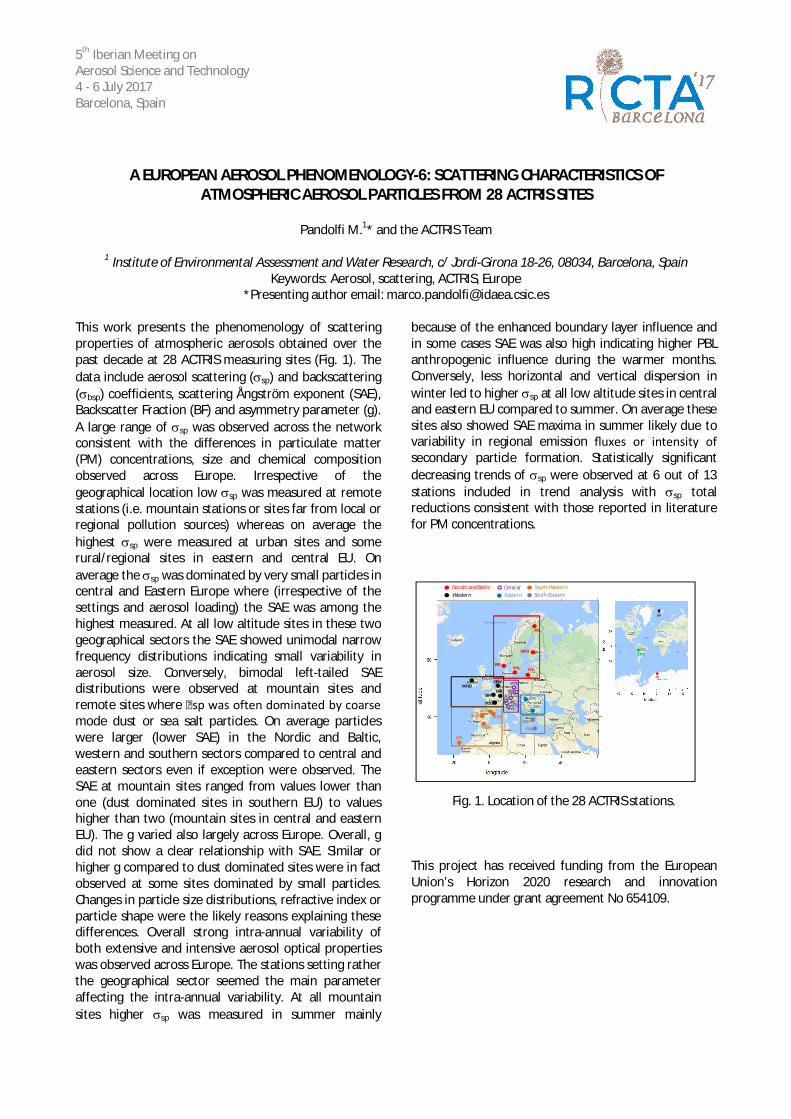
5th Iberian Meeting on Aerosol Science and Technology 4 - 6 July 2017 Barcelona, Spain
A EUROPEAN AEROSOL PHENOMENOLOGY-6: SCATTERING CHARACTERISTICS OF ATMOSPHERIC AEROSOL PARTICLES FROM 28 ACTRIS SITES
Pandolfi M.1* and the ACTRIS Team
1 Institute of Environmental Assessment and Water Research, c/ Jordi-Girona 18-26, 08034, Barcelona, Spain
Keywords: Aerosol, scattering, ACTRIS, Europe *Presenting author email: [email protected]
This work presents the phenomenology of scattering properties of atmospheric aerosols obtained over the past decade at 28 ACTRIS measuring sites (Fig. 1). The data include aerosol scattering (sp) and backscattering (bsp) coefficients, scattering Ångström exponent (SAE), Backscatter Fraction (BF) and asymmetry parameter (g). A large range of sp was observed across the network consistent with the differences in particulate matter (PM) concentrations, size and chemical composition observed across Europe. Irrespective of the geographical location low sp was measured at remote stations (i.e. mountain stations or sites far from local or regional pollution sources) whereas on average the highest sp were measured at urban sites and some rural/regional sites in eastern and central EU. On average the sp was dominated by very small particles in central and Eastern Europe where (irrespective of the settings and aerosol loading) the SAE was among the highest measured. At all low altitude sites in these two geographical sectors the SAE showed unimodal narrow frequency distributions indicating small variability in aerosol size. Conversely, bimodal left-tailed SAE distributions were observed at mountain sites and remote sites where sp was often dominated by coarse mode dust or sea salt particles. On average particles were larger (lower SAE) in the Nordic and Baltic, western and southern sectors compared to central and eastern sectors even if exception were observed. The SAE at mountain sites ranged from values lower than one (dust dominated sites in southern EU) to values higher than two (mountain sites in central and eastern EU). The g varied also largely across Europe. Overall, g did not show a clear relationship with SAE. Similar or higher g compared to dust dominated sites were in fact observed at some sites dominated by small particles. Changes in particle size distributions, refractive index or particle shape were the likely reasons explaining these differences. Overall strong intra-annual variability of both extensive and intensive aerosol optical properties was observed across Europe. The stations setting rather the geographical sector seemed the main parameter affecting the intra-annual variability. At all mountain sites higher sp was measured in summer mainly
because of the enhanced boundary layer influence and in some cases SAE was also high indicating higher PBL anthropogenic influence during the warmer months. Conversely, less horizontal and vertical dispersion in winter led to higher sp at all low altitude sites in central and eastern EU compared to summer. On average these sites also showed SAE maxima in summer likely due to variability in regional emission fluxes or intensity of secondary particle formation. Statistically significant decreasing trends of sp were observed at 6 out of 13 stations included in trend analysis with sp total reductions consistent with those reported in literature for PM concentrations.
Fig. 1. Location of the 28 ACTRIS stations.
This project has received funding from the European Union’s Horizon 2020 research and innovation programme under grant agreement No 654109.
BIR
SMR
PAL
VHL PLA
Nordic and Baltic
PDD
MHDCBW
SIROPE
MTC
WesternCentral
JRCJFJ
HPB
MPZ
KUP
KPO
BEO
Eastern
IZA
UGR
MADMSA
MSY
South-Western
DEM
South-Eastern
FKL
ZEP
TRL
CHC
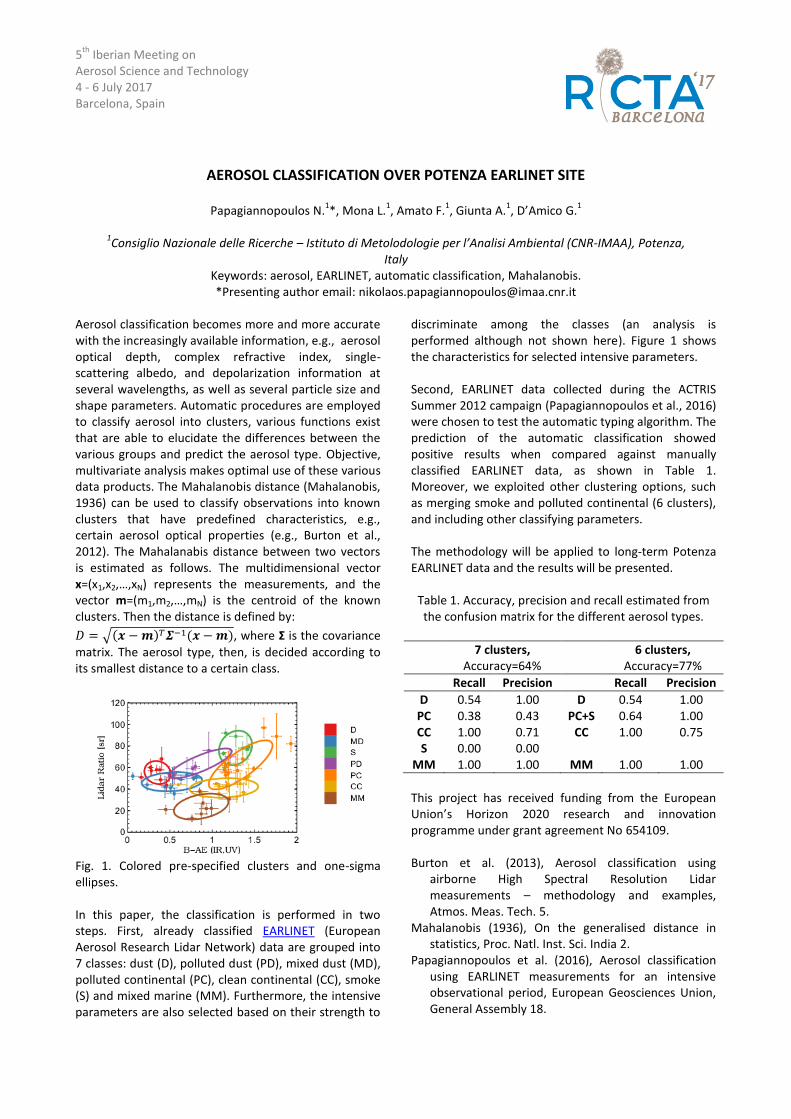
5th
Iberian Meeting on Aerosol Science and Technology 4 - 6 July 2017 Barcelona, Spain
AEROSOL CLASSIFICATION OVER POTENZA EARLINET SITE
Papagiannopoulos N.1*, Mona L.
1, Amato F.
1, Giunta A.
1, D’Amico G.
1
1Consiglio Nazionale delle Ricerche – Istituto di Metolodologie per l’Analisi Ambiental (CNR-IMAA), Potenza,
Italy Keywords: aerosol, EARLINET, automatic classification, Mahalanobis. *Presenting author email: [email protected]
Aerosol classification becomes more and more accurate with the increasingly available information, e.g., aerosol optical depth, complex refractive index, single-scattering albedo, and depolarization information at several wavelengths, as well as several particle size and shape parameters. Automatic procedures are employed to classify aerosol into clusters, various functions exist that are able to elucidate the differences between the various groups and predict the aerosol type. Objective, multivariate analysis makes optimal use of these various data products. The Mahalanobis distance (Mahalanobis, 1936) can be used to classify observations into known clusters that have predefined characteristics, e.g., certain aerosol optical properties (e.g., Burton et al., 2012). The Mahalanabis distance between two vectors is estimated as follows. The multidimensional vector x=(x1,x2,…,xN) represents the measurements, and the vector m=(m1,m2,…,mN) is the centroid of the known clusters. Then the distance is defined by:
, where Σ is the covariance
matrix. The aerosol type, then, is decided according to its smallest distance to a certain class.
Fig. 1. Colored pre-specified clusters and one-sigma ellipses. In this paper, the classification is performed in two steps. First, already classified EARLINET (European Aerosol Research Lidar Network) data are grouped into 7 classes: dust (D), polluted dust (PD), mixed dust (MD), polluted continental (PC), clean continental (CC), smoke (S) and mixed marine (MM). Furthermore, the intensive parameters are also selected based on their strength to
discriminate among the classes (an analysis is performed although not shown here). Figure 1 shows the characteristics for selected intensive parameters. Second, EARLINET data collected during the ACTRIS Summer 2012 campaign (Papagiannopoulos et al., 2016) were chosen to test the automatic typing algorithm. The prediction of the automatic classification showed positive results when compared against manually classified EARLINET data, as shown in Table 1. Moreover, we exploited other clustering options, such as merging smoke and polluted continental (6 clusters), and including other classifying parameters. The methodology will be applied to long-term Potenza EARLINET data and the results will be presented.
Table 1. Accuracy, precision and recall estimated from the confusion matrix for the different aerosol types.
7 clusters, Accuracy=64%
6 clusters, Accuracy=77%
Recall Precision Recall Precision
D 0.54 1.00 D 0.54 1.00 PC 0.38 0.43 PC+S 0.64 1.00 CC 1.00 0.71 CC 1.00 0.75 S 0.00 0.00
MM 1.00 1.00 MM 1.00 1.00
This project has received funding from the European Union’s Horizon 2020 research and innovation programme under grant agreement No 654109. Burton et al. (2013), Aerosol classification using
airborne High Spectral Resolution Lidar measurements – methodology and examples, Atmos. Meas. Tech. 5.
Mahalanobis (1936), On the generalised distance in statistics, Proc. Natl. Inst. Sci. India 2.
Papagiannopoulos et al. (2016), Aerosol classification using EARLINET measurements for an intensive observational period, European Geosciences Union, General Assembly 18.
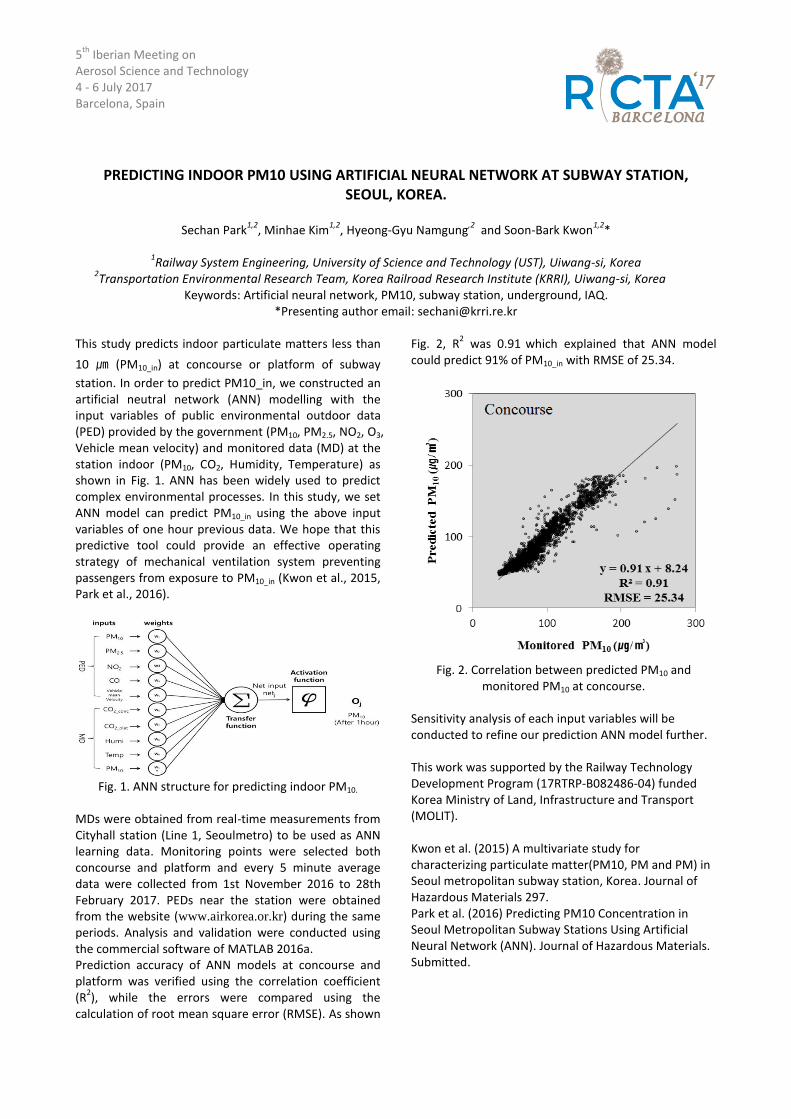
5th
Iberian Meeting on Aerosol Science and Technology 4 - 6 July 2017 Barcelona, Spain
PREDICTING INDOOR PM10 USING ARTIFICIAL NEURAL NETWORK AT SUBWAY STATION, SEOUL, KOREA.
Sechan Park
1,2, Minhae Kim
1,2, Hyeong-Gyu Namgung
,2 and Soon-Bark Kwon
1,2*
1Railway System Engineering, University of Science and Technology (UST), Uiwang-si, Korea
2Transportation Environmental Research Team, Korea Railroad Research Institute (KRRI), Uiwang-si, Korea
Keywords: Artificial neural network, PM10, subway station, underground, IAQ. *Presenting author email: [email protected]
This study predicts indoor particulate matters less than
10 ㎛ (PM10_in) at concourse or platform of subway
station. In order to predict PM10_in, we constructed an artificial neutral network (ANN) modelling with the input variables of public environmental outdoor data (PED) provided by the government (PM10, PM2.5, NO2, O3, Vehicle mean velocity) and monitored data (MD) at the station indoor (PM10, CO2, Humidity, Temperature) as shown in Fig. 1. ANN has been widely used to predict complex environmental processes. In this study, we set ANN model can predict PM10_in using the above input variables of one hour previous data. We hope that this predictive tool could provide an effective operating strategy of mechanical ventilation system preventing passengers from exposure to PM10_in (Kwon et al., 2015, Park et al., 2016).
Fig. 1. ANN structure for predicting indoor PM10.
MDs were obtained from real-time measurements from Cityhall station (Line 1, Seoulmetro) to be used as ANN learning data. Monitoring points were selected both concourse and platform and every 5 minute average data were collected from 1st November 2016 to 28th February 2017. PEDs near the station were obtained from the website (www.airkorea.or.kr) during the same periods. Analysis and validation were conducted using the commercial software of MATLAB 2016a. Prediction accuracy of ANN models at concourse and platform was verified using the correlation coefficient (R
2), while the errors were compared using the
calculation of root mean square error (RMSE). As shown
Fig. 2, R2 was 0.91 which explained that ANN model
could predict 91% of PM10_in with RMSE of 25.34.
Fig. 2. Correlation between predicted PM10 and
monitored PM10 at concourse.
Sensitivity analysis of each input variables will be conducted to refine our prediction ANN model further. This work was supported by the Railway Technology Development Program (17RTRP-B082486-04) funded Korea Ministry of Land, Infrastructure and Transport (MOLIT). Kwon et al. (2015) A multivariate study for characterizing particulate matter(PM10, PM and PM) in Seoul metropolitan subway station, Korea. Journal of Hazardous Materials 297. Park et al. (2016) Predicting PM10 Concentration in Seoul Metropolitan Subway Stations Using Artificial Neural Network (ANN). Journal of Hazardous Materials. Submitted.
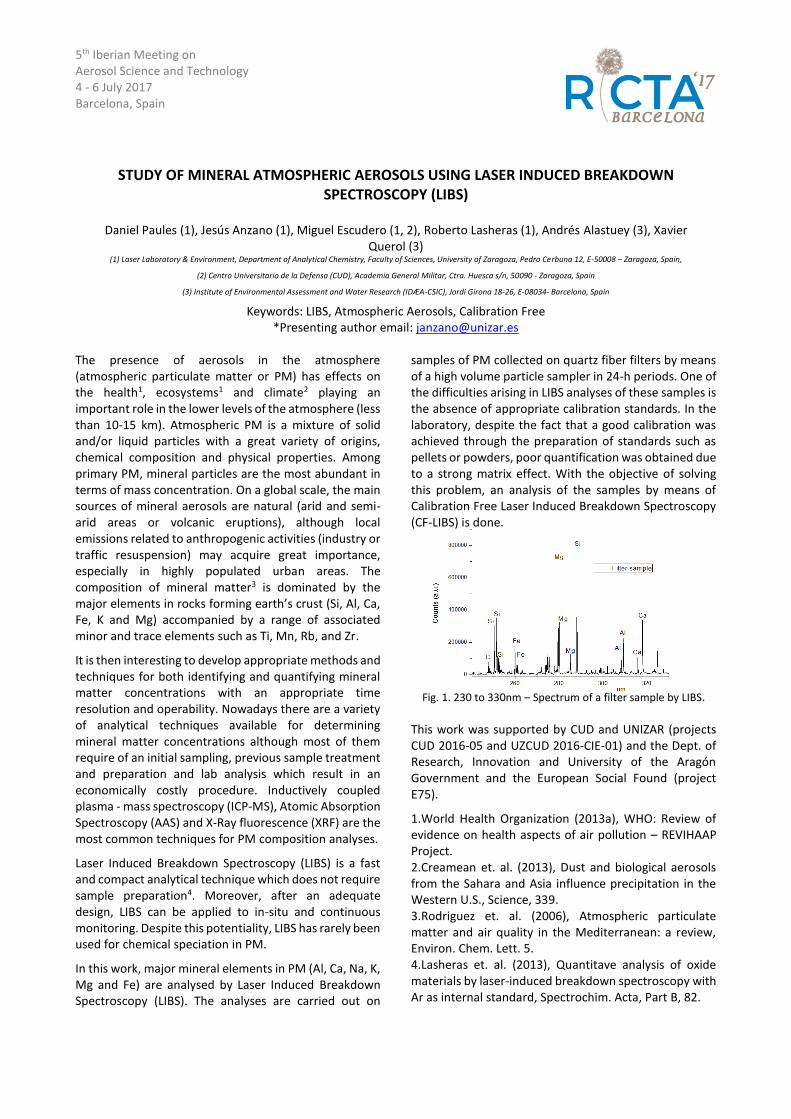
5th Iberian Meeting on Aerosol Science and Technology 4 - 6 July 2017 Barcelona, Spain
STUDY OF MINERAL ATMOSPHERIC AEROSOLS USING LASER INDUCED BREAKDOWN SPECTROSCOPY (LIBS)
Daniel Paules (1), Jesús Anzano (1), Miguel Escudero (1, 2), Roberto Lasheras (1), Andrés Alastuey (3), Xavier
Querol (3) (1) Laser Laboratory & Environment, Department of Analytical Chemistry, Faculty of Sciences, University of Zaragoza, Pedro Cerbuna 12, E-50008 – Zaragoza, Spain,
(2) Centro Universitario de la Defensa (CUD), Academia General Militar, Ctra. Huesca s/n, 50090 - Zaragoza, Spain
(3) Institute of Environmental Assessment and Water Research (IDÆA-CSIC), Jordi Girona 18-26, E-08034- Barcelona, Spain
Keywords: LIBS, Atmospheric Aerosols, Calibration Free *Presenting author email: [email protected]
The presence of aerosols in the atmosphere (atmospheric particulate matter or PM) has effects on the health1, ecosystems1 and climate2 playing an important role in the lower levels of the atmosphere (less than 10-15 km). Atmospheric PM is a mixture of solid and/or liquid particles with a great variety of origins, chemical composition and physical properties. Among primary PM, mineral particles are the most abundant in terms of mass concentration. On a global scale, the main sources of mineral aerosols are natural (arid and semi-arid areas or volcanic eruptions), although local emissions related to anthropogenic activities (industry or traffic resuspension) may acquire great importance, especially in highly populated urban areas. The composition of mineral matter3 is dominated by the major elements in rocks forming earth’s crust (Si, Al, Ca, Fe, K and Mg) accompanied by a range of associated minor and trace elements such as Ti, Mn, Rb, and Zr.
It is then interesting to develop appropriate methods and techniques for both identifying and quantifying mineral matter concentrations with an appropriate time resolution and operability. Nowadays there are a variety of analytical techniques available for determining mineral matter concentrations although most of them require of an initial sampling, previous sample treatment and preparation and lab analysis which result in an economically costly procedure. Inductively coupled plasma - mass spectroscopy (ICP-MS), Atomic Absorption Spectroscopy (AAS) and X-Ray fluorescence (XRF) are the most common techniques for PM composition analyses.
Laser Induced Breakdown Spectroscopy (LIBS) is a fast and compact analytical technique which does not require sample preparation4. Moreover, after an adequate design, LIBS can be applied to in-situ and continuous monitoring. Despite this potentiality, LIBS has rarely been used for chemical speciation in PM.
In this work, major mineral elements in PM (Al, Ca, Na, K, Mg and Fe) are analysed by Laser Induced Breakdown Spectroscopy (LIBS). The analyses are carried out on
samples of PM collected on quartz fiber filters by means of a high volume particle sampler in 24-h periods. One of the difficulties arising in LIBS analyses of these samples is the absence of appropriate calibration standards. In the laboratory, despite the fact that a good calibration was achieved through the preparation of standards such as pellets or powders, poor quantification was obtained due to a strong matrix effect. With the objective of solving this problem, an analysis of the samples by means of Calibration Free Laser Induced Breakdown Spectroscopy (CF-LIBS) is done.
Fig. 1. 230 to 330nm – Spectrum of a filter sample by LIBS. This work was supported by CUD and UNIZAR (projects CUD 2016-05 and UZCUD 2016-CIE-01) and the Dept. of Research, Innovation and University of the Aragón Government and the European Social Found (project E75).
1.World Health Organization (2013a), WHO: Review of evidence on health aspects of air pollution – REVIHAAP Project. 2.Creamean et. al. (2013), Dust and biological aerosols from the Sahara and Asia influence precipitation in the Western U.S., Science, 339. 3.Rodriguez et. al. (2006), Atmospheric particulate matter and air quality in the Mediterranean: a review, Environ. Chem. Lett. 5. 4.Lasheras et. al. (2013), Quantitave analysis of oxide materials by laser-induced breakdown spectroscopy with Ar as internal standard, Spectrochim. Acta, Part B, 82.
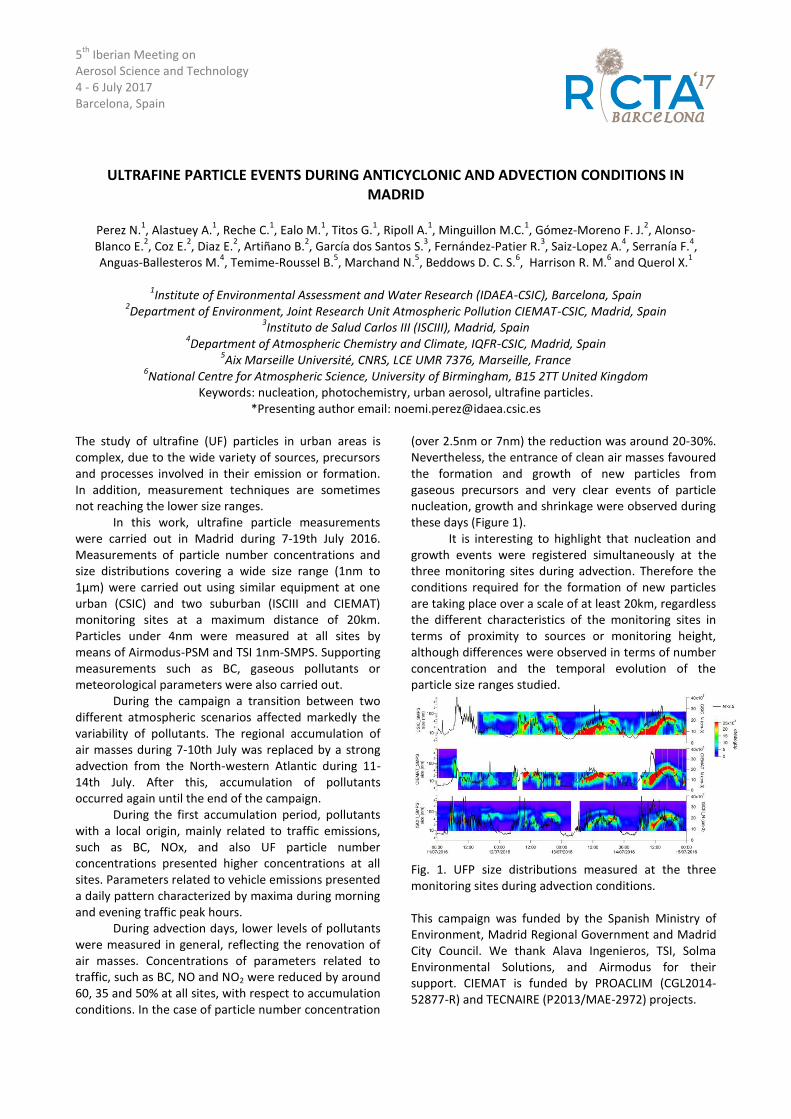
5th
Iberian Meeting on Aerosol Science and Technology 4 - 6 July 2017 Barcelona, Spain
ULTRAFINE PARTICLE EVENTS DURING ANTICYCLONIC AND ADVECTION CONDITIONS IN MADRID
Perez N.
1, Alastuey A.
1, Reche C.
1, Ealo M.
1, Titos G.
1, Ripoll A.
1, Minguillon M.C.
1, Gómez-Moreno F. J.
2, Alonso-
Blanco E.2, Coz E.
2, Diaz E.
2, Artiñano B.
2, García dos Santos S.
3, Fernández-Patier R.
3, Saiz-Lopez A.
4, Serranía F.
4,
Anguas-Ballesteros M.4, Temime-Roussel B.
5, Marchand N.
5, Beddows D. C. S.
6, Harrison R. M.
6 and Querol X.
1
1Institute of Environmental Assessment and Water Research (IDAEA-CSIC), Barcelona, Spain
2Department of Environment, Joint Research Unit Atmospheric Pollution CIEMAT-CSIC, Madrid, Spain
3Instituto de Salud Carlos III (ISCIII), Madrid, Spain
4Department of Atmospheric Chemistry and Climate, IQFR-CSIC, Madrid, Spain
5Aix Marseille Université, CNRS, LCE UMR 7376, Marseille, France
6National Centre for Atmospheric Science, University of Birmingham, B15 2TT United Kingdom
Keywords: nucleation, photochemistry, urban aerosol, ultrafine particles. *Presenting author email: [email protected]
The study of ultrafine (UF) particles in urban areas is complex, due to the wide variety of sources, precursors and processes involved in their emission or formation. In addition, measurement techniques are sometimes not reaching the lower size ranges. In this work, ultrafine particle measurements were carried out in Madrid during 7-19th July 2016. Measurements of particle number concentrations and size distributions covering a wide size range (1nm to 1µm) were carried out using similar equipment at one urban (CSIC) and two suburban (ISCIII and CIEMAT) monitoring sites at a maximum distance of 20km. Particles under 4nm were measured at all sites by means of Airmodus-PSM and TSI 1nm-SMPS. Supporting measurements such as BC, gaseous pollutants or meteorological parameters were also carried out. During the campaign a transition between two different atmospheric scenarios affected markedly the variability of pollutants. The regional accumulation of air masses during 7-10th July was replaced by a strong advection from the North-western Atlantic during 11-14th July. After this, accumulation of pollutants occurred again until the end of the campaign. During the first accumulation period, pollutants with a local origin, mainly related to traffic emissions, such as BC, NOx, and also UF particle number concentrations presented higher concentrations at all sites. Parameters related to vehicle emissions presented a daily pattern characterized by maxima during morning and evening traffic peak hours. During advection days, lower levels of pollutants were measured in general, reflecting the renovation of air masses. Concentrations of parameters related to traffic, such as BC, NO and NO2 were reduced by around 60, 35 and 50% at all sites, with respect to accumulation conditions. In the case of particle number concentration
(over 2.5nm or 7nm) the reduction was around 20-30%. Nevertheless, the entrance of clean air masses favoured the formation and growth of new particles from gaseous precursors and very clear events of particle nucleation, growth and shrinkage were observed during these days (Figure 1). It is interesting to highlight that nucleation and growth events were registered simultaneously at the three monitoring sites during advection. Therefore the conditions required for the formation of new particles are taking place over a scale of at least 20km, regardless the different characteristics of the monitoring sites in terms of proximity to sources or monitoring height, although differences were observed in terms of number concentration and the temporal evolution of the particle size ranges studied.
Fig. 1. UFP size distributions measured at the three monitoring sites during advection conditions. This campaign was funded by the Spanish Ministry of Environment, Madrid Regional Government and Madrid City Council. We thank Alava Ingenieros, TSI, Solma Environmental Solutions, and Airmodus for their support. CIEMAT is funded by PROACLIM (CGL2014-52877-R) and TECNAIRE (P2013/MAE-2972) projects.
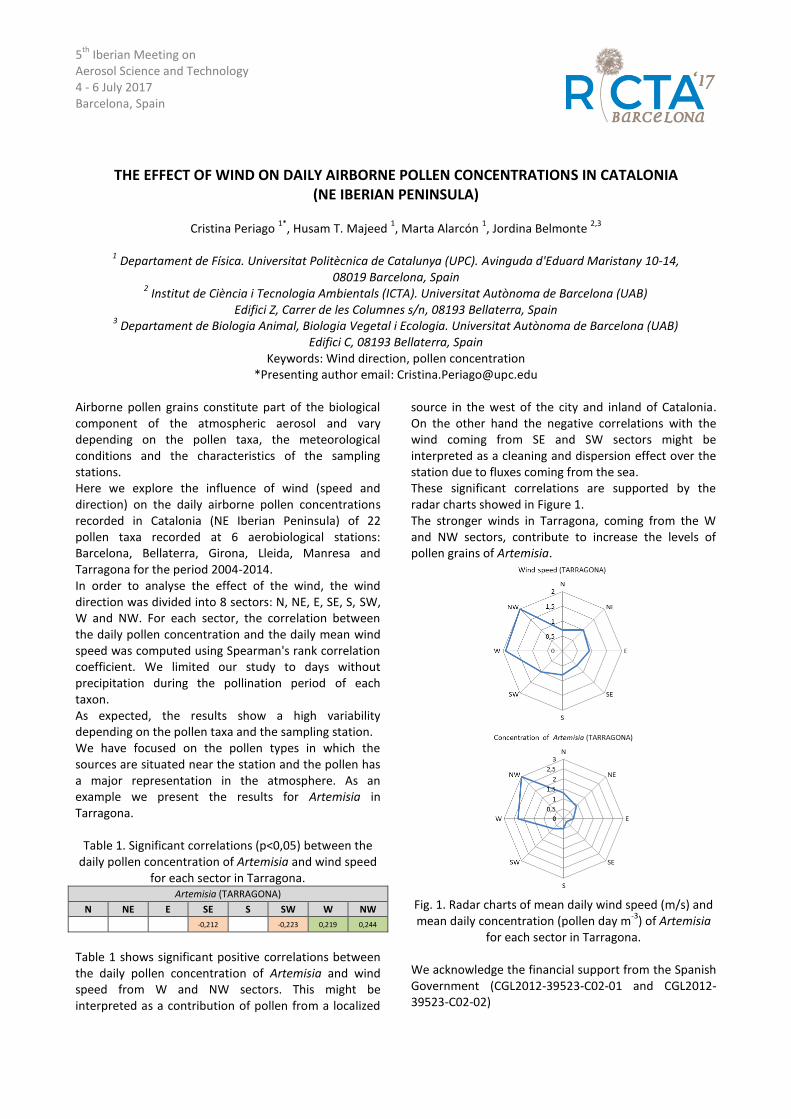
5th
Iberian Meeting on Aerosol Science and Technology 4 - 6 July 2017 Barcelona, Spain
THE EFFECT OF WIND ON DAILY AIRBORNE POLLEN CONCENTRATIONS IN CATALONIA (NE IBERIAN PENINSULA)
Cristina Periago
1*, Husam T. Majeed
1, Marta Alarcón
1, Jordina Belmonte
2,3
1 Departament de Física. Universitat Politècnica de Catalunya (UPC). Avinguda d'Eduard Maristany 10-14,
08019 Barcelona, Spain 2 Institut de Ciència i Tecnologia Ambientals (ICTA). Universitat Autònoma de Barcelona (UAB)
Edifici Z, Carrer de les Columnes s/n, 08193 Bellaterra, Spain 3 Departament de Biologia Animal, Biologia Vegetal i Ecologia. Universitat Autònoma de Barcelona (UAB)
Edifici C, 08193 Bellaterra, Spain Keywords: Wind direction, pollen concentration
*Presenting author email: [email protected]
Airborne pollen grains constitute part of the biological component of the atmospheric aerosol and vary depending on the pollen taxa, the meteorological conditions and the characteristics of the sampling stations. Here we explore the influence of wind (speed and direction) on the daily airborne pollen concentrations recorded in Catalonia (NE Iberian Peninsula) of 22 pollen taxa recorded at 6 aerobiological stations: Barcelona, Bellaterra, Girona, Lleida, Manresa and Tarragona for the period 2004-2014. In order to analyse the effect of the wind, the wind direction was divided into 8 sectors: N, NE, E, SE, S, SW, W and NW. For each sector, the correlation between the daily pollen concentration and the daily mean wind speed was computed using Spearman's rank correlation coefficient. We limited our study to days without precipitation during the pollination period of each taxon. As expected, the results show a high variability depending on the pollen taxa and the sampling station. We have focused on the pollen types in which the sources are situated near the station and the pollen has a major representation in the atmosphere. As an example we present the results for Artemisia in Tarragona.
Table 1. Significant correlations (p<0,05) between the daily pollen concentration of Artemisia and wind speed
for each sector in Tarragona. Artemisia (TARRAGONA)
N NE E SE S SW W NW
-0,212 -0,223 0,219 0,244
Table 1 shows significant positive correlations between the daily pollen concentration of Artemisia and wind speed from W and NW sectors. This might be interpreted as a contribution of pollen from a localized
source in the west of the city and inland of Catalonia. On the other hand the negative correlations with the wind coming from SE and SW sectors might be interpreted as a cleaning and dispersion effect over the station due to fluxes coming from the sea. These significant correlations are supported by the radar charts showed in Figure 1. The stronger winds in Tarragona, coming from the W and NW sectors, contribute to increase the levels of pollen grains of Artemisia.
Fig. 1. Radar charts of mean daily wind speed (m/s) and mean daily concentration (pollen day m
-3) of Artemisia
for each sector in Tarragona. We acknowledge the financial support from the Spanish Government (CGL2012-39523-C02-01 and CGL2012-39523-C02-02)
5th
Iberian Meeting on Aerosol Science and Technology 4 - 6 July 2017 Barcelona, Spain
HIGH O3 & UFP SUMMER EPISODES IN AND AROUND MADRID
Querol X.1
, Alastuey A.1, Perez N.
1, Gangoiti G.
2, Carnerero C.
1, Reche C.
1, Ealo M.
1, Titos G.
1, Ripoll A.
1,
Minguillón M.C.1, Amato F.
1, Moreno T.
1, Pandolfi M.
1, Lee H.K.
3, Eun H.R.
3, Park H.Y.
3, Mantilla E.
4, Escudero
M.5, Alonso L.
2, Salvador P.
6, Gómez-Moreno J.F.
6, Alonso-Blanco E.
6, Coz E.
6, Diaz E.
6, Artiñano B.
6, García-
Vivanco M.6, Martín F.
6, García dos Santos S.
7, Fernández-Patier R.
7, Saiz-Lopez A.
8, Serranía F.
8, Anguas-
Ballesteros M.8, Orio A.
9, Moreta J.R.
10, Hernández Pérez J.L.
10, Santamaría Lancho J.J.
10, Temime-Roussel B.
11,
Marchand N.11
, Pérez J.12
, de la Paz D.12
, Borge R.12
, Beddows D.C.S.13
, Harrison R.M.13
, Ahn K.-H. 3
1Institute of Environmental Assessment and Water Research (IDAEA-CSIC), C/Jordi Girona 18-26, Barcelona, 08034 Spain 2Escuela Técnica Superior Ingeniería de Bilbao, Departamento Ingeniería Química y del Medio Ambiente, Universidad del País Vasco UPV/EHU, Urkixo Zumarkalea, S/N, 48013 Bilbao, Spain 3Department of Mechanical Engineering, Hanyang University, Ansan 425-791, Republic of Korea 4Centro de Estudios Ambientales del Mediterráneo, CEAM, Unidad Asociada al CSIC, P. Tecnológico C/ Charles R. Darwin, 14 46980 Paterna, Valencia, Spain 5Centro Universitario de la Defensa de Zaragoza, Academia General Militar, Ctra. de Huesca s/n, 50090 Zaragoza, Spain 6Department of Environment, Joint Research Unit Atmospheric Pollution CIEMAT-CSIC, Madrid, 28040 Spain 7Instituto de Salud Carlos III (ISCIII), Madrid, 28222 Spain 8Department of Atmospheric Chemistry and Climate, IQFR-CSIC, Madrid 28006, Spain 9D.G. Calidad y Evaluación Ambiental, MAPAMA, Pl. San Juan de la Cruz s/n - 6ºplanta - A602, 28003 Madrid, Spain 10Agencia Estatal de Meteorología (AEMET), C/ Leonardo Prietro Castro, 8, 28071 Madrid, Spain 11Aix Marseille Université, CNRS, LCE UMR 7376, 13331 Marseille, France 12Escuela Técnica Superior de Ingenieros Industriales. Departamento de Ingeniería Química Industrial y Medio Ambiente, UPM, José Gutiérrez Abascal 2, 28006 Madrid, Spain 13National Centre for Atmospheric Science, University of Birmingham, B15 2TT United Kingdom. +Also at: Department of Environmental Sciences/Centre for Excellence in Environmental Studies, King Abdulaziz University, Jeddah, Saudi Arabia.
Keywords: Air quality, ozone, ultrafine particles, photochemistry. *Presenting author email: [email protected]
We present here results of an intensive international measurement campaign for O3 and ultrafine particles (UFP) performed on July 2016 in the Madrid Metropolitan Area (MMA). We used a large number of diffusion tubes for measuring concentrations of NO2 and O3 to complement online intensive measurements of size resolved UFP concentrations (SMPS), PM1, BC, NO2, NO, O3, at 3 supersites of the MMA. From 11 to 14/07/2016 we carried out high time resolved vertical measurements up to 1.2 km a.g.l. of O3 and size resolved UFP using tethered balloons. We identify an O3 hotspot in the N and NW areas of the MMA, where supersites and vertical profile measurements were taken place. Results evidenced the importance of surface fumigation of high altitude O3-rich layers due to the growth of the planetary boundary layer (PBL), although local/regional generation of O3 might also contribute to enhance surface concentrations. Furthermore, photochemical nucleation episodes simultaneously recorded across the MMA dominated the concentration of UFP. This accounted for a very different BC and UFP time variability. It is expected under these conditions that primary UFP from road traffic have relatively low impact on ambient air
urban UFP. The vertical profiles obtained evidenced that the photochemical nucleation occurs across the PBL from early morning, whereas in similar measurements performed in highly polluted urban areas of Barcelona, nucleation took place only at relatively high altitude, as particles are diluted and the condensation sink decreases. We evidenced also relatively independent spatial patterns for O3 and UFP. Thus, vertical variation of UFP levels was strongly depending of being inside or outside of the PBL until mid-morning, when the PBL exceeded the maximum height reached with the tethered balloons. Levels of O3 were very little affected by the PBL growth. These were increasing upwards (up to the highest altitude reached) in the early morning profiles, homogenous at midday and again increasing upwards in the afternoon. In this case the comparison of O3 and UFP evidenced top-down and bottom-up processes, respectively. This work is supported by the Spanish Ministry of Agriculture, Fishing, Food and Environment, Madrid City Council and Madrid Regional Government, and by the Ministry of Economy, Industry and Competitiveness (and FEDER funds under the project HOUSE, CGL2016-78594-R).
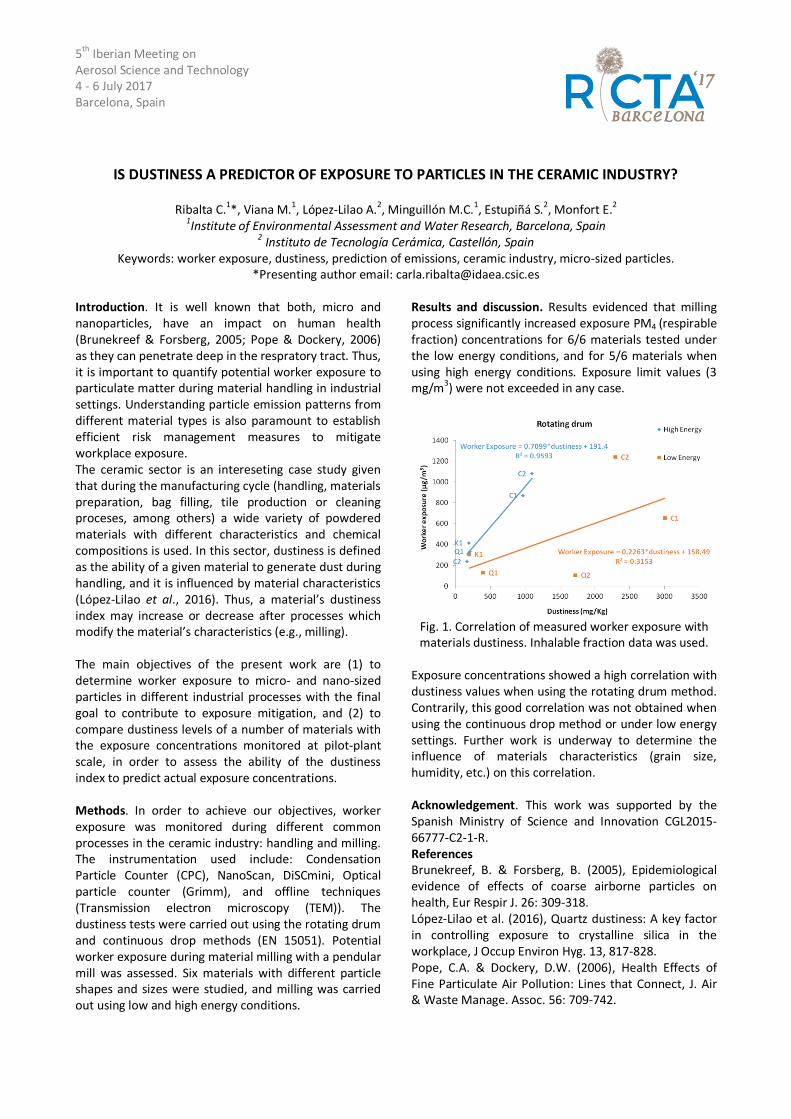
5th
Iberian Meeting on Aerosol Science and Technology 4 - 6 July 2017 Barcelona, Spain
IS DUSTINESS A PREDICTOR OF EXPOSURE TO PARTICLES IN THE CERAMIC INDUSTRY?
Ribalta C.1*, Viana M.1, López-Lilao A.2, Minguillón M.C.1, Estupiñá S.2, Monfort E.2 1Institute of Environmental Assessment and Water Research, Barcelona, Spain
2 Instituto de Tecnología Cerámica, Castellón, Spain Keywords: worker exposure, dustiness, prediction of emissions, ceramic industry, micro-sized particles.
*Presenting author email: [email protected]
Introduction. It is well known that both, micro and nanoparticles, have an impact on human health (Brunekreef & Forsberg, 2005; Pope & Dockery, 2006) as they can penetrate deep in the respratory tract. Thus, it is important to quantify potential worker exposure to particulate matter during material handling in industrial settings. Understanding particle emission patterns from different material types is also paramount to establish efficient risk management measures to mitigate workplace exposure. The ceramic sector is an intereseting case study given that during the manufacturing cycle (handling, materials preparation, bag filling, tile production or cleaning proceses, among others) a wide variety of powdered materials with different characteristics and chemical compositions is used. In this sector, dustiness is defined as the ability of a given material to generate dust during handling, and it is influenced by material characteristics (López-Lilao et al., 2016). Thus, a material’s dustiness index may increase or decrease after processes which modify the material’s characteristics (e.g., milling). The main objectives of the present work are (1) to determine worker exposure to micro- and nano-sized particles in different industrial processes with the final goal to contribute to exposure mitigation, and (2) to compare dustiness levels of a number of materials with the exposure concentrations monitored at pilot-plant scale, in order to assess the ability of the dustiness index to predict actual exposure concentrations. Methods. In order to achieve our objectives, worker exposure was monitored during different common processes in the ceramic industry: handling and milling. The instrumentation used include: Condensation Particle Counter (CPC), NanoScan, DiSCmini, Optical particle counter (Grimm), and offline techniques (Transmission electron microscopy (TEM)). The dustiness tests were carried out using the rotating drum and continuous drop methods (EN 15051). Potential worker exposure during material milling with a pendular mill was assessed. Six materials with different particle shapes and sizes were studied, and milling was carried out using low and high energy conditions.
Results and discussion. Results evidenced that milling process significantly increased exposure PM4 (respirable fraction) concentrations for 6/6 materials tested under the low energy conditions, and for 5/6 materials when using high energy conditions. Exposure limit values (3 mg/m3) were not exceeded in any case.
Fig. 1. Correlation of measured worker exposure with materials dustiness. Inhalable fraction data was used.
Exposure concentrations showed a high correlation with dustiness values when using the rotating drum method. Contrarily, this good correlation was not obtained when using the continuous drop method or under low energy settings. Further work is underway to determine the influence of materials characteristics (grain size, humidity, etc.) on this correlation. Acknowledgement. This work was supported by the Spanish Ministry of Science and Innovation CGL2015-66777-C2-1-R. References Brunekreef, B. & Forsberg, B. (2005), Epidemiological evidence of effects of coarse airborne particles on health, Eur Respir J. 26: 309-318. López-Lilao et al. (2016), Quartz dustiness: A key factor in controlling exposure to crystalline silica in the workplace, J Occup Environ Hyg. 13, 817-828. Pope, C.A. & Dockery, D.W. (2006), Health Effects of Fine Particulate Air Pollution: Lines that Connect, J. Air & Waste Manage. Assoc. 56: 709-742.
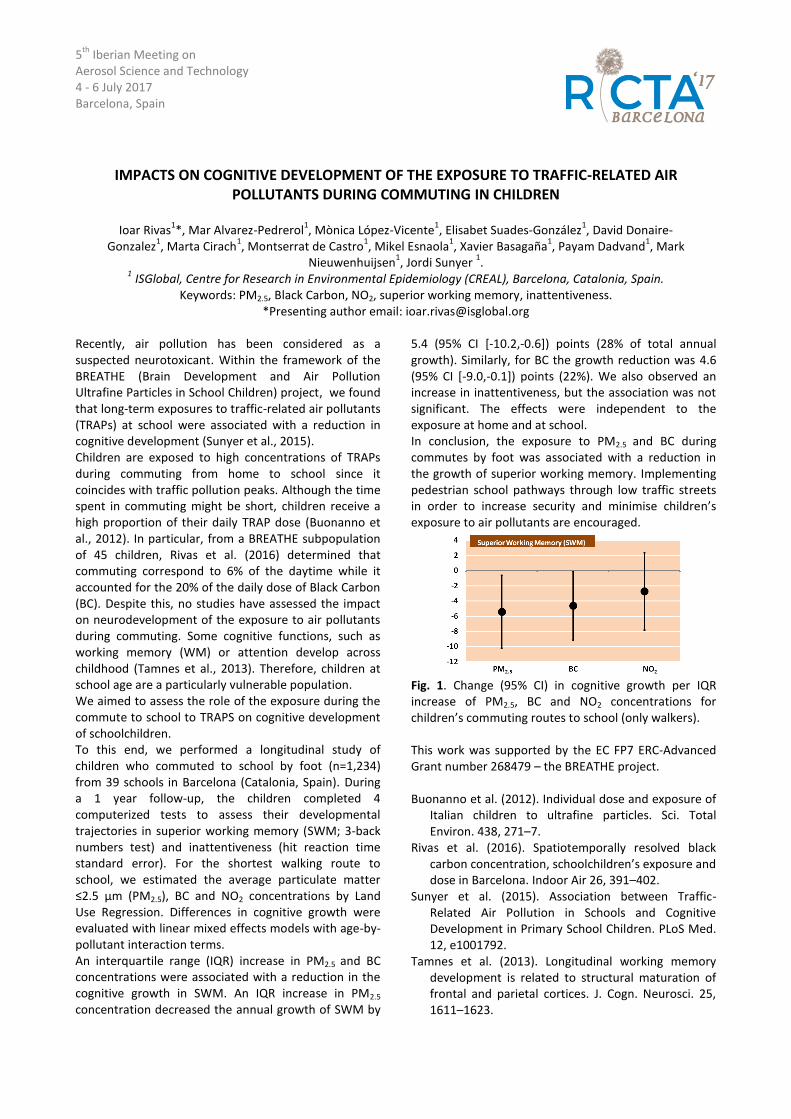
5th
Iberian Meeting on Aerosol Science and Technology 4 - 6 July 2017 Barcelona, Spain
IMPACTS ON COGNITIVE DEVELOPMENT OF THE EXPOSURE TO TRAFFIC-RELATED AIR POLLUTANTS DURING COMMUTING IN CHILDREN
Ioar Rivas
1*, Mar Alvarez-Pedrerol
1, Mònica López-Vicente
1, Elisabet Suades-González
1, David Donaire-
Gonzalez1, Marta Cirach
1, Montserrat de Castro
1, Mikel Esnaola
1, Xavier Basagaña
1, Payam Dadvand
1, Mark
Nieuwenhuijsen1, Jordi Sunyer
1.
1 ISGlobal, Centre for Research in Environmental Epidemiology (CREAL), Barcelona, Catalonia, Spain. Keywords: PM2.5, Black Carbon, NO2, superior working memory, inattentiveness.
*Presenting author email: [email protected]
Recently, air pollution has been considered as a suspected neurotoxicant. Within the framework of the BREATHE (Brain Development and Air Pollution Ultrafine Particles in School Children) project, we found that long-term exposures to traffic-related air pollutants (TRAPs) at school were associated with a reduction in cognitive development (Sunyer et al., 2015). Children are exposed to high concentrations of TRAPs during commuting from home to school since it coincides with traffic pollution peaks. Although the time spent in commuting might be short, children receive a high proportion of their daily TRAP dose (Buonanno et al., 2012). In particular, from a BREATHE subpopulation of 45 children, Rivas et al. (2016) determined that commuting correspond to 6% of the daytime while it accounted for the 20% of the daily dose of Black Carbon (BC). Despite this, no studies have assessed the impact on neurodevelopment of the exposure to air pollutants during commuting. Some cognitive functions, such as working memory (WM) or attention develop across childhood (Tamnes et al., 2013). Therefore, children at school age are a particularly vulnerable population. We aimed to assess the role of the exposure during the commute to school to TRAPS on cognitive development of schoolchildren. To this end, we performed a longitudinal study of children who commuted to school by foot (n=1,234) from 39 schools in Barcelona (Catalonia, Spain). During a 1 year follow-up, the children completed 4 computerized tests to assess their developmental trajectories in superior working memory (SWM; 3-back numbers test) and inattentiveness (hit reaction time standard error). For the shortest walking route to school, we estimated the average particulate matter ≤2.5 µm (PM2.5), BC and NO2 concentrations by Land Use Regression. Differences in cognitive growth were evaluated with linear mixed effects models with age-by-pollutant interaction terms. An interquartile range (IQR) increase in PM2.5 and BC concentrations were associated with a reduction in the cognitive growth in SWM. An IQR increase in PM2.5
concentration decreased the annual growth of SWM by
5.4 (95% CI [-10.2,-0.6]) points (28% of total annual growth). Similarly, for BC the growth reduction was 4.6 (95% CI [-9.0,-0.1]) points (22%). We also observed an increase in inattentiveness, but the association was not significant. The effects were independent to the exposure at home and at school. In conclusion, the exposure to PM2.5 and BC during commutes by foot was associated with a reduction in the growth of superior working memory. Implementing pedestrian school pathways through low traffic streets in order to increase security and minimise children’s exposure to air pollutants are encouraged.
Fig. 1. Change (95% CI) in cognitive growth per IQR increase of PM2.5, BC and NO2 concentrations for children’s commuting routes to school (only walkers). This work was supported by the EC FP7 ERC-Advanced Grant number 268479 – the BREATHE project. Buonanno et al. (2012). Individual dose and exposure of
Italian children to ultrafine particles. Sci. Total Environ. 438, 271–7.
Rivas et al. (2016). Spatiotemporally resolved black carbon concentration, schoolchildren’s exposure and dose in Barcelona. Indoor Air 26, 391–402.
Sunyer et al. (2015). Association between Traffic-Related Air Pollution in Schools and Cognitive Development in Primary School Children. PLoS Med. 12, e1001792.
Tamnes et al. (2013). Longitudinal working memory development is related to structural maturation of frontal and parietal cortices. J. Cogn. Neurosci. 25, 1611–1623.

5th
Iberian Meeting on Aerosol Science and Technology 4 - 6 July 2017 Barcelona, Spain
EXPOSURE TO AIR POLLUTANTS DURING COMMUTING: EXPLORING SOCIO-ECONOMIC INEQUALITIES AND DIFFERENCES BETWEN TRAVEL MODES
Ioar Rivas1,2
, Prashant Kumar2, Alex Hagen-Zanker
2.
1 ISGlobal, Centre for Research in Environmental Epidemiology (CREAL), Barcelona, Catalonia, Spain.
2Department of Civil and Environmental Engineering, Faculty of Engineering and Physical Sciences, University of Surrey,
Guildford GU2 7XH, United Kingdom Keywords:Personal exposure; Environmental Justice; Travel mode; Particulate matter; Ultrafine particles; Black Carbon
*Presenting author email: [email protected] Commuters are particularly affected by traffic-related air pollutants owing to their proximity to the source. Moreover, combustion emissions (i.e. traffic emissions), especially particles in various size ranges, are suspected to be particularly harmful (WHO, 2013). Commuters are particularly affected by traffic-related air pollutants owing to their proximity to the source (Dons et al., 2011). Therefore, exposure assessment during commuting deserves special attention. Besides, some studies found that the exposure to air pollutants was inequitable, with people living in most deprived areas generally suffering from higher concentrations of air pollutants (Fecht et al., 2015). The objective is to determine differences between transport mode and to assess if there are inequalities related to income deprivation in the exposure during commuting to different fractions of Particulate Matter (PM), Black Carbon (BC) and ultrafine particle number concentrations (PNC) in London. We assessed the concentrations of the abovementioned pollutants in the three most popular transport modes (car, underground and bus) for typical commutes from 4 London areas with different levels of income deprivation (G1 to G4, from most to least deprived). We assessed three different periods of the day (morning peak, afternoon off-peak and evening peak). The highest BC and PM concentrations were found in G1 while the highest PNC in G3. Lowest concentrations for all pollutants were observed in G2. We found no systematic relationship between income deprivation and pollutant concentrations, indicating that differences between transport modes were a stronger influence. The highest PM concentrations took place in the underground, followed by buses and a much lower concentration in cars. BC concentrations were also higher in buses than cars because of a lower infiltration of outside pollutants into the car cabin. PNCs were highest in buses, closely followed by cars, and lowest in underground due to the absence of combustion sources. Underground trains with non-openable windows showed lower concentrations compared to those with openable windows. People from lower income deprivation areas have a predominant use of car, receiving the lowest
doses (RDD<1 µg h-1
) during commute while generating the largest emissions per commuter. On the other hand, commuters from higher income deprivation areas have a major reliance on the bus receiving higher exposures (RDD between 1.52-3.49 µg h
-1) while generating less
emissions per person. This can be considered a violation of the core principle of environmental justice as reviewed by Brulle and Pellow (2006). These findings suggest an aspect of environmental injustice and a need to incorporate the socioeconomic dimension in exposure assessments.
Fig. 1. BC, PNC, PM2.5 and PM10 concentrations (colour indicates the ranking) by income deprivation categories and transport modes. This work is within the ASTRID project, funded by ESRC-NWO-FAPESP (ES/N011481/1). Brulle et al. (2006). Human Health and Environmental Inequalities. Annu. Rev. Public Health 273, 1–3. Dons et al. (2011). Impact of time–activity patterns on personal exposure to black carbon. Atmos. Environ. 45, 3594–3602. Fecht et al. (2015). Associations between air pollution and socioeconomic characteristics, ethnicity and age profile of neighbourhoods in England and the Netherlands. Environ. Pollut. 198, 201–210 WHO, 2013. Review of evidence on health aspects of air
pollution – REVIHAAP Project.
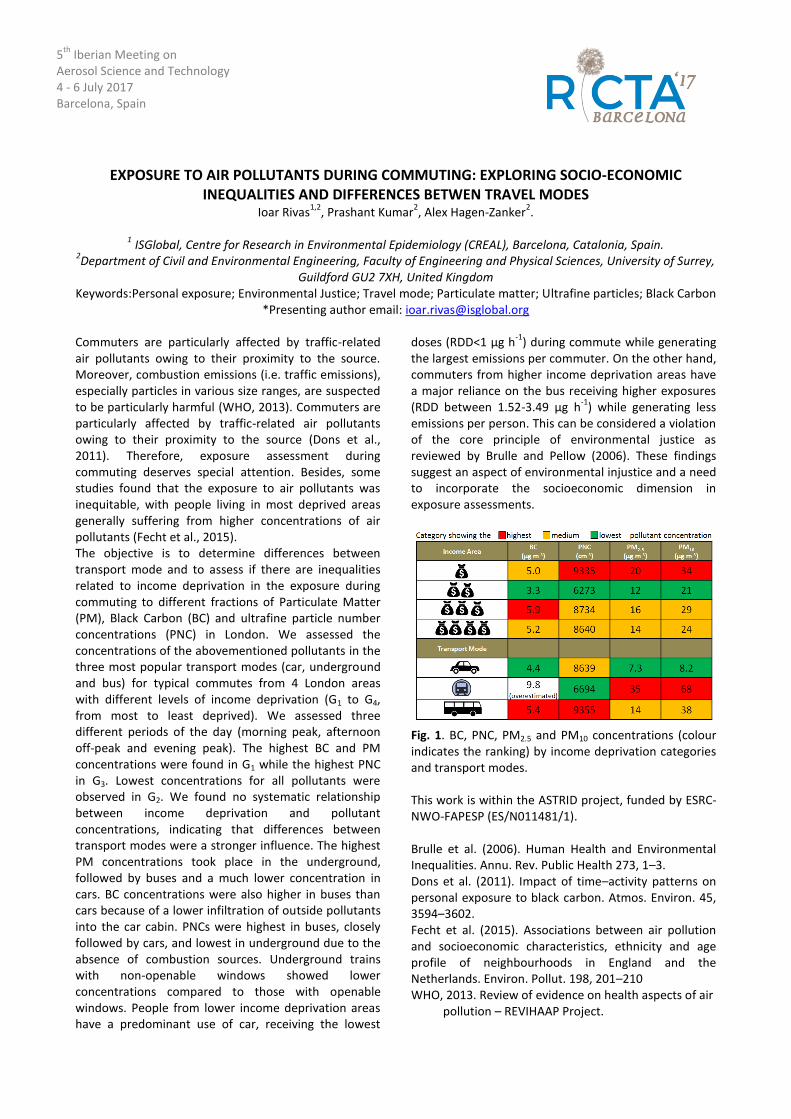
5th Iberian Meeting on Aerosol Science and Technology 4 - 6 July 2017 Barcelona, Spain
INFLUENCE OF LARGE-SCALE ADVECTION PATTERNS ON THE AIR QUALITY OF AREQUIPA, PERU
Rodríguez C.M.1,2, Orza J.A.G.2*
1 Ingeniería Industrial, Universidad Andina Néstor Cáceres Velásquez, Juliaca, Peru
2 SCOLAb, Física Aplicada, Universidad Miguel Hernández, Elche, Spain Keywords: air quality, PM2.5, advection patterns, Peru.
*Presenting author email: [email protected]
Arequipa is the second most populated city and metropolitan area in Peru (around one million inhabitants). It is as well the second industrial and commercial center of the country, and serves not only as a link between the coast and the highlands (Altiplano), but also between Peru and Chile, Bolivia and Brasil. It is located at 2335 m asl in the western slope of the Central Andes, between the coastal and the Altiplano regions of the southern part of the country, in a valley which is open towards the Pacific. PM2.5, SO2 and O3 concentrations, as well as meteorological parameters in Arequipa, have been studied in relation to the major large-scale advection patterns. The work is accomplished by back-trajectory analysis. This technique is widely used for the identification of the origin and history of the air masses reaching a site, and therefore for the assessment of the origin and pathway of air pollutants. The elevated altitude of the site and the area specific meteorology (strongly influenced by the Andes) in addition to the scarcity of air quality studies, motivate this work. Hourly data for the 2014-2016 period from the “Gerencia Regional de Salud” urban station, belonging to the Regional Government of Arequipa, and from the Arequipa’s Airport have been analyzed. Back-trajectories were calculated with the latest version of the HYSPLIT model (NOAA/ARL) using ERA-Interim reanalysis data of 0.75°; trajectories were grouped into advection patterns by means of a robust cluster analysis procedure (Orza et al., 2012) and differences in pollutant levels and meteorological parameters by advection pattern have been studied. Potential sources have been identified by the use of statistical procedures and the analysis of individual episodes. Five major atmospheric transport patterns are found. From September to March, southerlies (separated into two types, fS and S, according the overall speed of the air parcels) prevail in connection with the quasi-permanent Southeast Pacific Anticyclone (Garreaud, 2009), which
promotes low-level south flows along all the coast parallel to the Andes. Southerlies reach Arequipa as upslope flows after flowing over the Ocean at low altitude. During the central part of the year, and with more than a half of the transport patterns on May and June, NW flows arrive essentially following the coastal line after passing over the Pacific. These flows do not present changes in height and are associated to a northerly jet which resides over the Andean western slope. Light local winds (Reg) are found all year round though in July and August account for over the half of the time. Flows reaching Arequipa from the Altiplano (NE) are also found from January to June, with low frequency except in April and March. These flows can arrive from the tropical areas (Amazonas) to the East of the Andes, as far as relative humidity is the highest for such flows. PM2.5 levels are the highest for the NE flows coming down from the Altiplano and also for the fast-moving southerlies (fS). In turn, NW flows are associated to the lowest concentrations. Southerlies may transport pollutants from the southern coastal cities of Peru, and in addition they may transport air masses affected by intense forest fires in Chile. A singular feature of the southern flows is the high mean and median SO2 concentrations with a frequency distribution which is skewed to low values, as opposite to what is common to other locations and other pollutants. The highest O3 levels are found for the non-fast southerlies (S), which points to the transport of secondary pollutants to Arequipa. Garreaud (2009), The Andes climate and weather, Adv.
Geosci. 7, 1-9. Orza et al. (2012) The Association Between the North
Atlantic Oscillation and the Interannual Variability of the Tropospheric Transport Pathways in Western Europe, in Lagrangian Modeling of the Atmosphere (eds J. Lin, D. Brunner, C. Gerbig, A. Stohl, A. Luhar and P. Webley), American Geophysical Union, Washington, D. C.. doi: 10.1029/2012GM001315.
5th
Iberian Meeting on Aerosol Science and Technology 4 - 6 July 2017 Barcelona, Spain
Study of the temporal variability and gas-aerosol partitioning of ammonium nitrate at an urban site in Northern France
R. Roig, E. Perdrix, B. Herbin, V. Riffault
IMT Lille Douai, Univ. Lille, SAGE - Département Sciences de l'Atmosphère et Génie de l'Environnement,
59000 Lille, France Keywords: PM2.5, SIA, Precursor gases, MARGA, ISORROPIA
*Presenting author email: [email protected]
Fine particulate matter with diameter smaller than 2.5 µm (PM2.5) gives rise to human health and environmental concerns. In Europe, its concentration in ambient air is regulated by the 2008/50/EC Directive, which sets an annual limit value of 25 µg m
-3. This limit
is frequently exceeded in the French Hauts-de-France region. The main reasons for this are its location within an extensive road network, urban density, and the proximity to European capitals (London, Paris, and Brussels) as well as significant industrial areas.
A large contributor to PM2.5 is secondary inorganic aerosol (SIA), which in Europe may account for more than half of its mass. Specifically, in North-Western Europe, ammonium nitrate (NH4NO3) alone might reach up to 27% of the PM2.5 mass on average (Putaud et al., 2004), and this ratio uses to increase during high-pollution events. Moreover, the concentrations of SIA strongly depend on their gaseous precursors, in a non-linearly manner in the case of NH4NO3. Nevertheless, there is a current lack of high-time resolution data on the chemical composition of PM2.5 as well as of information on the partitioning between the gas and aerosol phases of SIA in the area. Consequently, improvement on the knowledge of SIA concentrations and their formation processes from precursor gases appears as a cornerstone in order to implement efficient policies to reduce the levels of PM2.5 in the region and thus improve air quality.
In this context, a 1-year field campaign at an urban site in Douai, France, was carried out from August 2015 to July 2016. Concentrations of 8 water-soluble inorganic ions (WSII) (NO3
-, SO4
2-, NH4
+, Na
+, K
+, Ca
2+,
Mg2+
, Cl-), 1 water-soluble organic ion (oxalate) and 5
precursor gases (NH3, SO2, HONO, HNO3 and HCl) were determined every hour with a MARGA 1S (Monitor for AeRosols and GAses in ambient Air) (ten Brink et al, 2007). NOx were monitored every 15 minutes with a NOx 2000G monitor. The PM2.5 total mass was measured by a Beta Attenuation Monitor (BAM-1020) every hour. Meteorological parameters such as temperature, relative humidity, pressure, wind speed
and direction, and precipitation were also monitored on site.
The daily and seasonal variability for ammonium nitrate and its gaseous precursors will be presented and discussed. The gas-particle equilibrium of semi-volatile species based on hourly observations has been studied, and compared for NH4NO3 with that calculated by the thermodynamic equilibrium model ISORROPIA II (Fountoukis and Nenes, 2007).
This study is the first one in France to conduct such a measurement campaign with a MARGA, delivering a long-term hourly database on inorganic aerosols and their precursor gases. Hence, it has contributed to improve the knowledge of SIA and their formation from the gas-phase precursors, and has proven the valuable use of MARGA for air quality monitoring.
This work is funded under the AACT-AIR (ADEME) program grant 1562C0011 and has also been supported by ARMINES. IMT Lille Douai participates in the CaPPA project, which is funded by the French National Research Agency (ANR) through the PIA (Programme d’Investissement d’Avenir) under contract ANR-11-LABX-0005-01, and in the CLIMIBIO project, both financed by the Regional Council “Hauts-de-France” and the European Funds for Regional Economic Development (FEDER)”.
Fountoukis, C. and Nenes, A. (2007) Atmos. Chem. Phys. 7, 4639–4659. Putaud, J.P., Raes, F., Van Dingenen, R., Brüggemann, E., Facchini, M.-C., Decesari, S., Fuzzi, S. et al. (2004) Atmos. Environ. 38, 2579–2595. ten Brink, H, Otjes, R., Jongejan, P. and Slanina, S. (2007). Atmos. Environ. 41, 2768–2779.
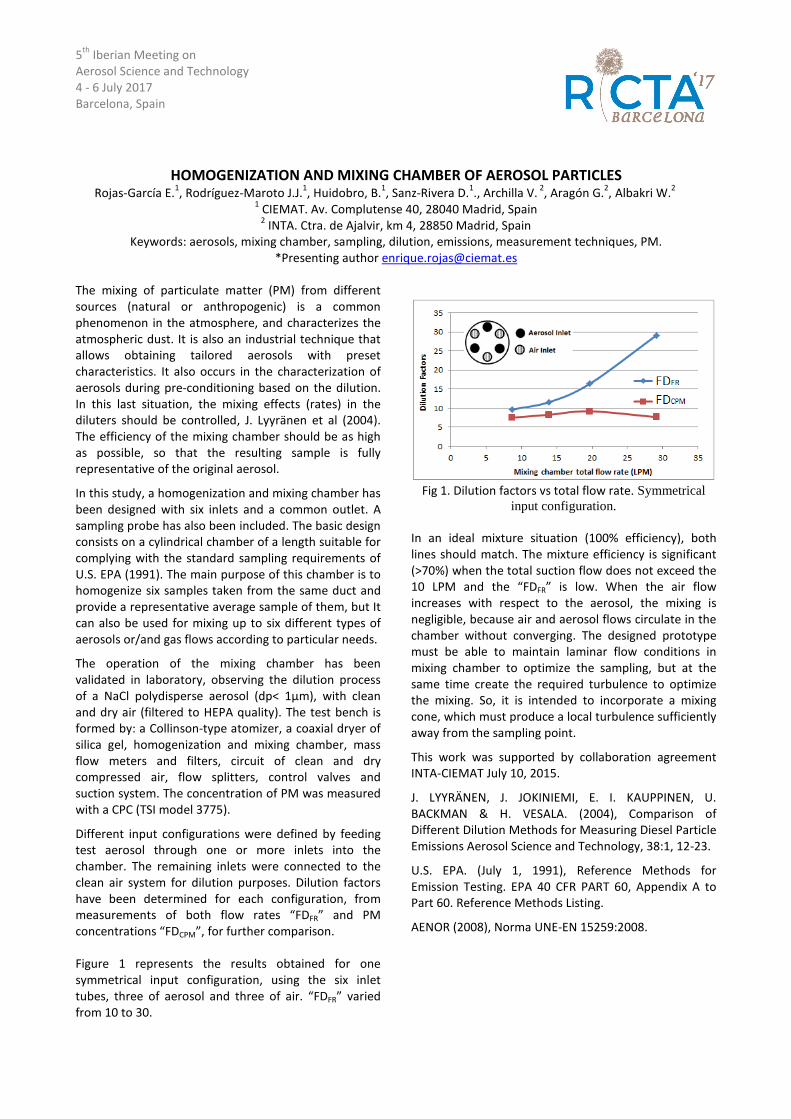
5th
Iberian Meeting on
Aerosol Science and Technology
4 - 6 July 2017
Barcelona, Spain
HOMOGENIZATION AND MIXING CHAMBER OF AEROSOL PARTICLES
Rojas-García E.1, Rodríguez-Maroto J.J.
1, Huidobro, B.
1, Sanz-Rivera D.
1., Archilla V.
2, Aragón G.
2, Albakri W.
2
1 CIEMAT. Av. Complutense 40, 28040 Madrid, Spain 2 INTA. Ctra. de Ajalvir, km 4, 28850 Madrid, Spain
Keywords: aerosols, mixing chamber, sampling, dilution, emissions, measurement techniques, PM.
*Presenting author [email protected]
The mixing of particulate matter (PM) from different
sources (natural or anthropogenic) is a common
phenomenon in the atmosphere, and characterizes the
atmospheric dust. It is also an industrial technique that
allows obtaining tailored aerosols with preset
characteristics. It also occurs in the characterization of
aerosols during pre-conditioning based on the dilution.
In this last situation, the mixing effects (rates) in the
diluters should be controlled, J. Lyyränen et al (2004).
The efficiency of the mixing chamber should be as high
as possible, so that the resulting sample is fully
representative of the original aerosol.
In this study, a homogenization and mixing chamber has
been designed with six inlets and a common outlet. A
sampling probe has also been included. The basic design
consists on a cylindrical chamber of a length suitable for
complying with the standard sampling requirements of
U.S. EPA (1991). The main purpose of this chamber is to
homogenize six samples taken from the same duct and
provide a representative average sample of them, but It
can also be used for mixing up to six different types of
aerosols or/and gas flows according to particular needs.
The operation of the mixing chamber has been
validated in laboratory, observing the dilution process
of a NaCl polydisperse aerosol (dp< 1µm), with clean
and dry air (filtered to HEPA quality). The test bench is
formed by: a Collinson-type atomizer, a coaxial dryer of
silica gel, homogenization and mixing chamber, mass
flow meters and filters, circuit of clean and dry
compressed air, flow splitters, control valves and
suction system. The concentration of PM was measured
with a CPC (TSI model 3775).
Different input configurations were defined by feeding
test aerosol through one or more inlets into the
chamber. The remaining inlets were connected to the
clean air system for dilution purposes. Dilution factors
have been determined for each configuration, from
measurements of both flow rates “FDFR” and PM
concentrations “FDCPM”, for further comparison.
Figure 1 represents the results obtained for one
symmetrical input configuration, using the six inlet
tubes, three of aerosol and three of air. “FDFR” varied
from 10 to 30.
Fig 1. Dilution factors vs total flow rate. Symmetrical
input configuration.
In an ideal mixture situation (100% efficiency), both
lines should match. The mixture efficiency is significant
(>70%) when the total suction flow does not exceed the
10 LPM and the “FDFR” is low. When the air flow
increases with respect to the aerosol, the mixing is
negligible, because air and aerosol flows circulate in the
chamber without converging. The designed prototype
must be able to maintain laminar flow conditions in
mixing chamber to optimize the sampling, but at the
same time create the required turbulence to optimize
the mixing. So, it is intended to incorporate a mixing
cone, which must produce a local turbulence sufficiently
away from the sampling point.
This work was supported by collaboration agreement
INTA-CIEMAT July 10, 2015.
J. LYYRÄNEN, J. JOKINIEMI, E. I. KAUPPINEN, U.
BACKMAN & H. VESALA. (2004), Comparison of
Different Dilution Methods for Measuring Diesel Particle
Emissions Aerosol Science and Technology, 38:1, 12-23.
U.S. EPA. (July 1, 1991), Reference Methods for
Emission Testing. EPA 40 CFR PART 60, Appendix A to
Part 60. Reference Methods Listing.
AENOR (2008), Norma UNE-EN 15259:2008.
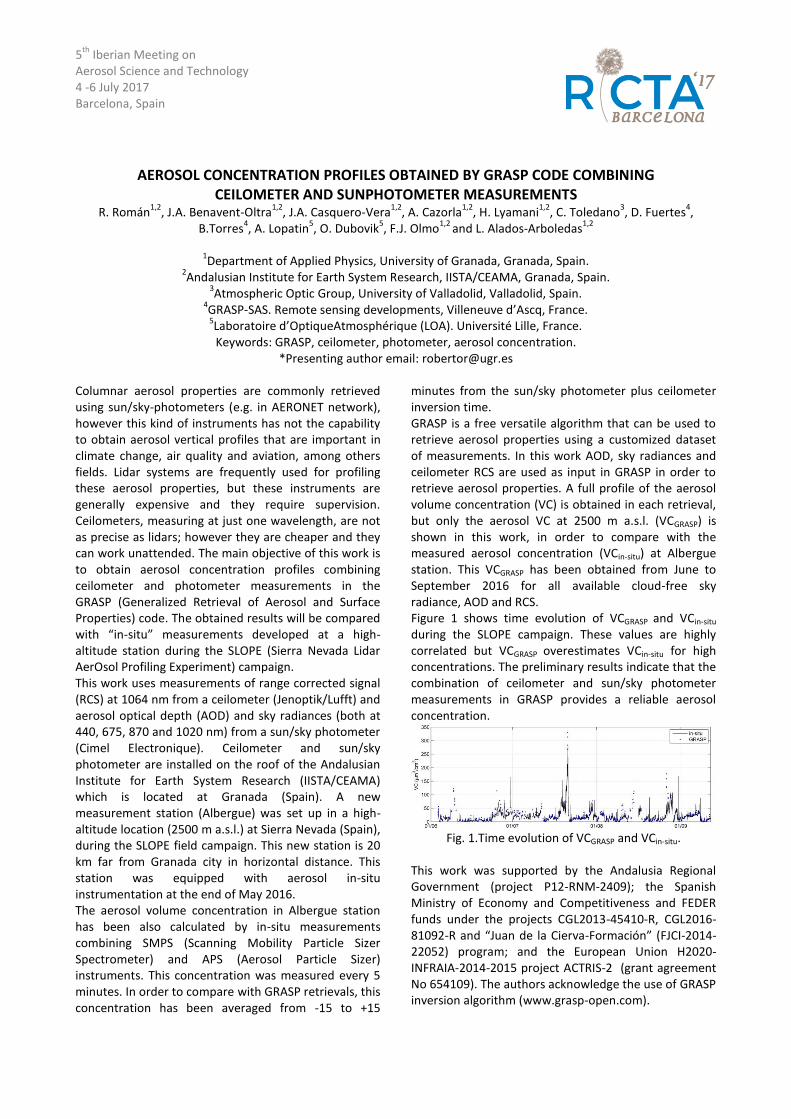
5th
Iberian Meeting on Aerosol Science and Technology 4 -6 July 2017 Barcelona, Spain
AEROSOL CONCENTRATION PROFILES OBTAINED BY GRASP CODE COMBINING CEILOMETER AND SUNPHOTOMETER MEASUREMENTS
R. Román1,2
, J.A. Benavent-Oltra1,2
, J.A. Casquero-Vera1,2
, A. Cazorla1,2
, H. Lyamani1,2
, C. Toledano3, D. Fuertes
4,
B.Torres4, A. Lopatin
5, O. Dubovik
5, F.J. Olmo
1,2 and L. Alados-Arboledas
1,2
1Department of Applied Physics, University of Granada, Granada, Spain.
2Andalusian Institute for Earth System Research, IISTA/CEAMA, Granada, Spain.
3Atmospheric Optic Group, University of Valladolid, Valladolid, Spain.
4GRASP-SAS. Remote sensing developments, Villeneuve d’Ascq, France. 5Laboratoire d’OptiqueAtmosphérique (LOA). Université Lille, France. Keywords: GRASP, ceilometer, photometer, aerosol concentration.
*Presenting author email: [email protected]
Columnar aerosol properties are commonly retrieved using sun/sky-photometers (e.g. in AERONET network), however this kind of instruments has not the capability to obtain aerosol vertical profiles that are important in climate change, air quality and aviation, among others fields. Lidar systems are frequently used for profiling these aerosol properties, but these instruments are generally expensive and they require supervision. Ceilometers, measuring at just one wavelength, are not as precise as lidars; however they are cheaper and they can work unattended. The main objective of this work is to obtain aerosol concentration profiles combining ceilometer and photometer measurements in the GRASP (Generalized Retrieval of Aerosol and Surface Properties) code. The obtained results will be compared with “in-situ” measurements developed at a high-altitude station during the SLOPE (Sierra Nevada Lidar AerOsol Profiling Experiment) campaign. This work uses measurements of range corrected signal (RCS) at 1064 nm from a ceilometer (Jenoptik/Lufft) and aerosol optical depth (AOD) and sky radiances (both at 440, 675, 870 and 1020 nm) from a sun/sky photometer (Cimel Electronique). Ceilometer and sun/sky photometer are installed on the roof of the Andalusian Institute for Earth System Research (IISTA/CEAMA) which is located at Granada (Spain). A new measurement station (Albergue) was set up in a high-altitude location (2500 m a.s.l.) at Sierra Nevada (Spain), during the SLOPE field campaign. This new station is 20 km far from Granada city in horizontal distance. This station was equipped with aerosol in-situ instrumentation at the end of May 2016. The aerosol volume concentration in Albergue station has been also calculated by in-situ measurements combining SMPS (Scanning Mobility Particle Sizer Spectrometer) and APS (Aerosol Particle Sizer) instruments. This concentration was measured every 5 minutes. In order to compare with GRASP retrievals, this concentration has been averaged from -15 to +15
minutes from the sun/sky photometer plus ceilometer inversion time. GRASP is a free versatile algorithm that can be used to retrieve aerosol properties using a customized dataset of measurements. In this work AOD, sky radiances and ceilometer RCS are used as input in GRASP in order to retrieve aerosol properties. A full profile of the aerosol volume concentration (VC) is obtained in each retrieval, but only the aerosol VC at 2500 m a.s.l. (VCGRASP) is shown in this work, in order to compare with the measured aerosol concentration (VCin-situ) at Albergue station. This VCGRASP has been obtained from June to September 2016 for all available cloud-free sky radiance, AOD and RCS. Figure 1 shows time evolution of VCGRASP and VCin-situ during the SLOPE campaign. These values are highly correlated but VCGRASP overestimates VCin-situ for high concentrations. The preliminary results indicate that the combination of ceilometer and sun/sky photometer measurements in GRASP provides a reliable aerosol concentration.
Fig. 1.Time evolution of VCGRASP and VCin-situ.
This work was supported by the Andalusia Regional Government (project P12-RNM-2409); the Spanish Ministry of Economy and Competitiveness and FEDER funds under the projects CGL2013-45410-R, CGL2016-81092-R and “Juan de la Cierva-Formación” (FJCI-2014-22052) program; and the European Union H2020-INFRAIA-2014-2015 project ACTRIS-2 (grant agreement No 654109). The authors acknowledge the use of GRASP inversion algorithm (www.grasp-open.com).
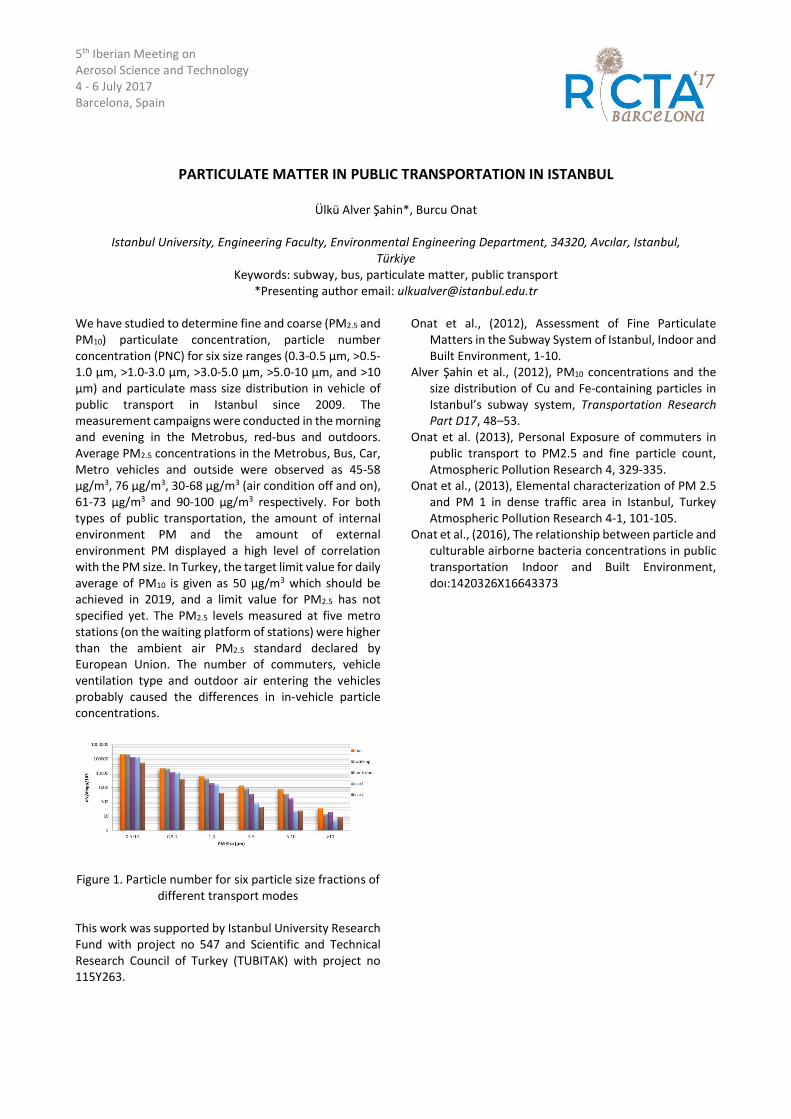
5th Iberian Meeting on Aerosol Science and Technology 4 - 6 July 2017 Barcelona, Spain
PARTICULATE MATTER IN PUBLIC TRANSPORTATION IN ISTANBUL
Ülkü Alver Şahin*, Burcu Onat
Istanbul University, Engineering Faculty, Environmental Engineering Department, 34320, Avcılar, Istanbul, Türkiye
Keywords: subway, bus, particulate matter, public transport *Presenting author email: [email protected]
We have studied to determine fine and coarse (PM2.5 and PM10) particulate concentration, particle number concentration (PNC) for six size ranges (0.3-0.5 µm, >0.5-1.0 µm, >1.0-3.0 µm, >3.0-5.0 µm, >5.0-10 µm, and >10 µm) and particulate mass size distribution in vehicle of public transport in Istanbul since 2009. The measurement campaigns were conducted in the morning and evening in the Metrobus, red-bus and outdoors. Average PM2.5 concentrations in the Metrobus, Bus, Car, Metro vehicles and outside were observed as 45-58 µg/m3, 76 µg/m3, 30-68 µg/m3 (air condition off and on), 61-73 µg/m3 and 90-100 µg/m3 respectively. For both types of public transportation, the amount of internal environment PM and the amount of external environment PM displayed a high level of correlation with the PM size. In Turkey, the target limit value for daily average of PM10 is given as 50 µg/m3 which should be achieved in 2019, and a limit value for PM2.5 has not specified yet. The PM2.5 levels measured at five metro stations (on the waiting platform of stations) were higher than the ambient air PM2.5 standard declared by European Union. The number of commuters, vehicle ventilation type and outdoor air entering the vehicles probably caused the differences in in-vehicle particle concentrations.
Figure 1. Particle number for six particle size fractions of
different transport modes This work was supported by Istanbul University Research Fund with project no 547 and Scientific and Technical Research Council of Turkey (TUBITAK) with project no 115Y263.
Onat et al., (2012), Assessment of Fine Particulate Matters in the Subway System of Istanbul, Indoor and Built Environment, 1-10.
Alver Şahin et al., (2012), PM10 concentrations and the size distribution of Cu and Fe-containing particles in Istanbul’s subway system, Transportation Research Part D17, 48–53.
Onat et al. (2013), Personal Exposure of commuters in public transport to PM2.5 and fine particle count, Atmospheric Pollution Research 4, 329-335.
Onat et al., (2013), Elemental characterization of PM 2.5 and PM 1 in dense traffic area in Istanbul, Turkey Atmospheric Pollution Research 4-1, 101-105.
Onat et al., (2016), The relationship between particle and culturable airborne bacteria concentrations in public transportation Indoor and Built Environment, doı:1420326X16643373
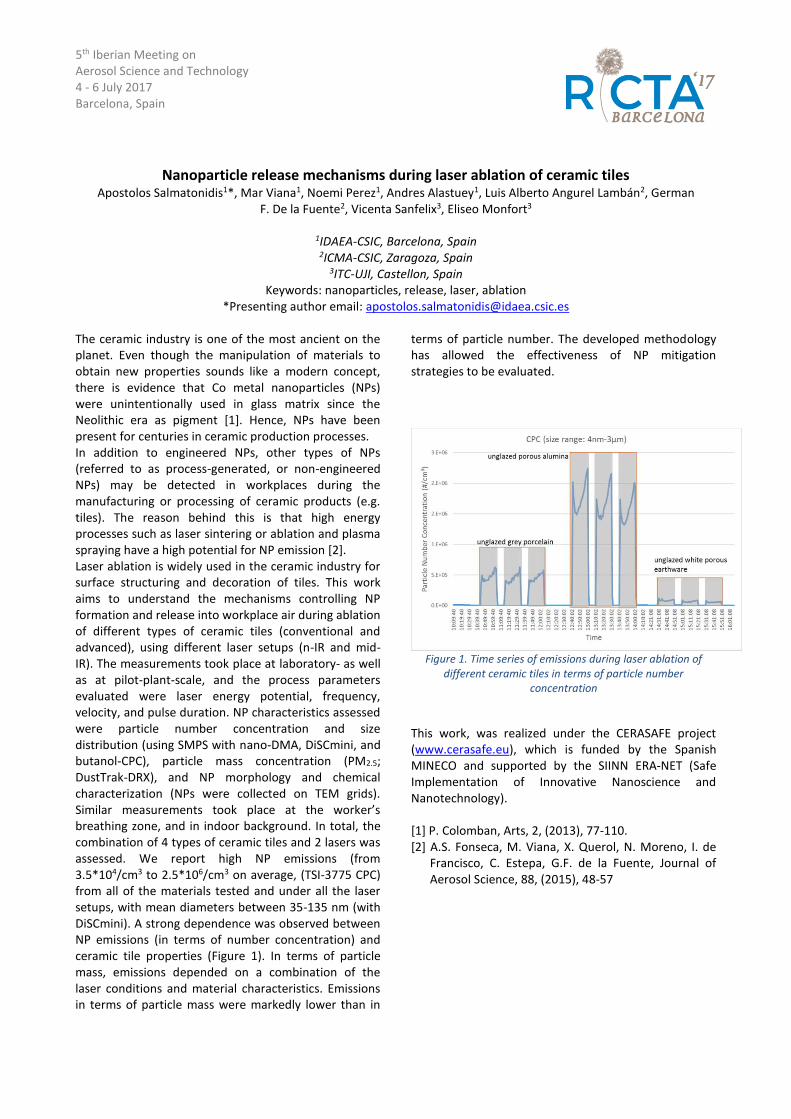
5th Iberian Meeting on Aerosol Science and Technology 4 - 6 July 2017 Barcelona, Spain
Nanoparticle release mechanisms during laser ablation of ceramic tiles Apostolos Salmatonidis1*, Mar Viana1, Noemi Perez1, Andres Alastuey1, Luis Alberto Angurel Lambán2, German
F. De la Fuente2, Vicenta Sanfelix3, Eliseo Monfort3
1IDAEA-CSIC, Barcelona, Spain
2ICMA-CSIC, Zaragoza, Spain 3ITC-UJI, Castellon, Spain
Keywords: nanoparticles, release, laser, ablation *Presenting author email: [email protected]
The ceramic industry is one of the most ancient on the planet. Even though the manipulation of materials to obtain new properties sounds like a modern concept, there is evidence that Co metal nanoparticles (NPs) were unintentionally used in glass matrix since the Neolithic era as pigment [1]. Hence, NPs have been present for centuries in ceramic production processes. In addition to engineered NPs, other types of NPs (referred to as process-generated, or non-engineered NPs) may be detected in workplaces during the manufacturing or processing of ceramic products (e.g. tiles). The reason behind this is that high energy processes such as laser sintering or ablation and plasma spraying have a high potential for NP emission [2]. Laser ablation is widely used in the ceramic industry for surface structuring and decoration of tiles. This work aims to understand the mechanisms controlling NP formation and release into workplace air during ablation of different types of ceramic tiles (conventional and advanced), using different laser setups (n-IR and mid-IR). The measurements took place at laboratory- as well as at pilot-plant-scale, and the process parameters evaluated were laser energy potential, frequency, velocity, and pulse duration. NP characteristics assessed were particle number concentration and size distribution (using SMPS with nano-DMA, DiSCmini, and butanol-CPC), particle mass concentration (PM2.5; DustTrak-DRX), and NP morphology and chemical characterization (NPs were collected on TEM grids). Similar measurements took place at the worker’s breathing zone, and in indoor background. In total, the combination of 4 types of ceramic tiles and 2 lasers was assessed. We report high NP emissions (from 3.5*104/cm3 to 2.5*106/cm3 on average, (TSI-3775 CPC) from all of the materials tested and under all the laser setups, with mean diameters between 35-135 nm (with DiSCmini). A strong dependence was observed between NP emissions (in terms of number concentration) and ceramic tile properties (Figure 1). In terms of particle mass, emissions depended on a combination of the laser conditions and material characteristics. Emissions in terms of particle mass were markedly lower than in
terms of particle number. The developed methodology has allowed the effectiveness of NP mitigation strategies to be evaluated.
Figure 1. Time series of emissions during laser ablation of
different ceramic tiles in terms of particle number concentration
This work, was realized under the CERASAFE project (www.cerasafe.eu), which is funded by the Spanish MINECO and supported by the SIINN ERA-NET (Safe Implementation of Innovative Nanoscience and Nanotechnology). [1] P. Colomban, Arts, 2, (2013), 77-110. [2] A.S. Fonseca, M. Viana, X. Querol, N. Moreno, I. de
Francisco, C. Estepa, G.F. de la Fuente, Journal of Aerosol Science, 88, (2015), 48-57
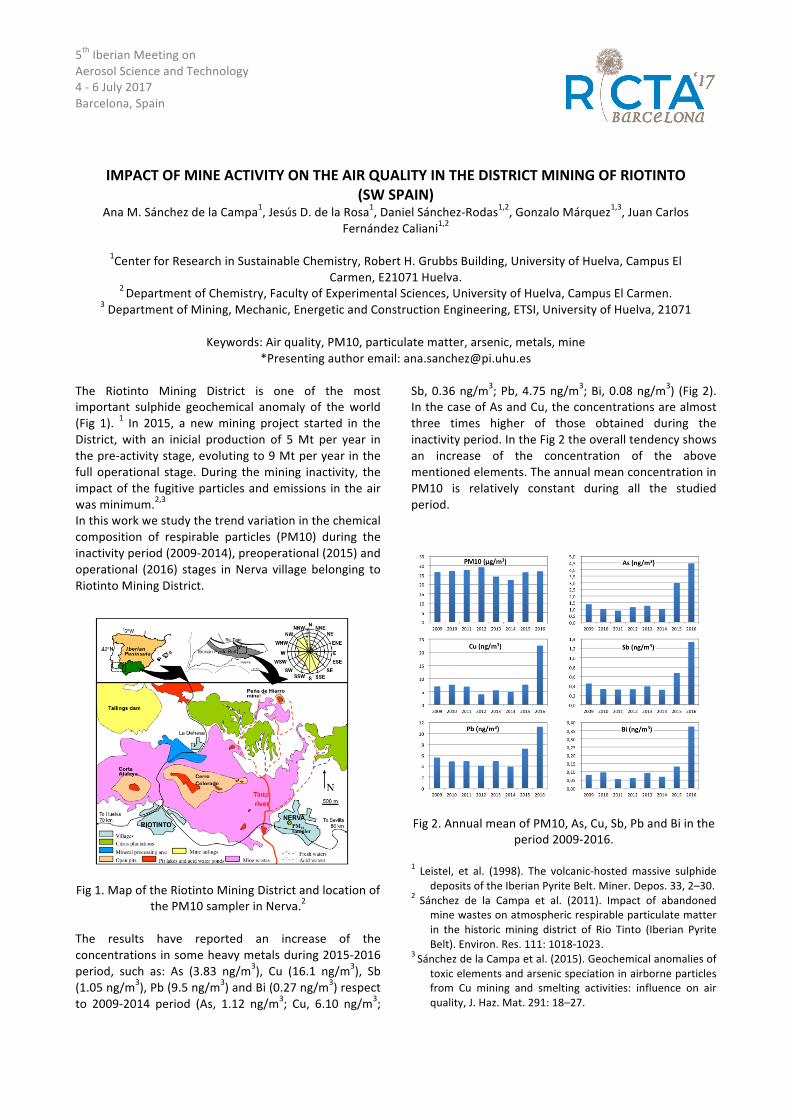
5th Iberian Meeting on Aerosol Science and Technology 4 -‐ 6 July 2017 Barcelona, Spain
IMPACT OF MINE ACTIVITY ON THE AIR QUALITY IN THE DISTRICT MINING OF RIOTINTO
(SW SPAIN) Ana M. Sánchez de la Campa1, Jesús D. de la Rosa1, Daniel Sánchez-‐Rodas1,2, Gonzalo Márquez1,3, Juan Carlos
Fernández Caliani1,2
1Center for Research in Sustainable Chemistry, Robert H. Grubbs Building, University of Huelva, Campus El Carmen, E21071 Huelva.
2 Department of Chemistry, Faculty of Experimental Sciences, University of Huelva, Campus El Carmen. 3 Department of Mining, Mechanic, Energetic and Construction Engineering, ETSI, University of Huelva, 21071
Keywords: Air quality, PM10, particulate matter, arsenic, metals, mine
*Presenting author email: [email protected]
The Riotinto Mining District is one of the most important sulphide geochemical anomaly of the world (Fig 1). 1 In 2015, a new mining project started in the District, with an inicial production of 5 Mt per year in the pre-‐activity stage, evoluting to 9 Mt per year in the full operational stage. During the mining inactivity, the impact of the fugitive particles and emissions in the air was minimum.2,3 In this work we study the trend variation in the chemical composition of respirable particles (PM10) during the inactivity period (2009-‐2014), preoperational (2015) and operational (2016) stages in Nerva village belonging to Riotinto Mining District.
Fig 1. Map of the Riotinto Mining District and location of the PM10 sampler in Nerva.2
The results have reported an increase of the concentrations in some heavy metals during 2015-‐2016 period, such as: As (3.83 ng/m3), Cu (16.1 ng/m3), Sb (1.05 ng/m3), Pb (9.5 ng/m3) and Bi (0.27 ng/m3) respect to 2009-‐2014 period (As, 1.12 ng/m3; Cu, 6.10 ng/m3;
Sb, 0.36 ng/m3; Pb, 4.75 ng/m3; Bi, 0.08 ng/m3) (Fig 2). In the case of As and Cu, the concentrations are almost three times higher of those obtained during the inactivity period. In the Fig 2 the overall tendency shows an increase of the concentration of the above mentioned elements. The annual mean concentration in PM10 is relatively constant during all the studied period.
Fig 2. Annual mean of PM10, As, Cu, Sb, Pb and Bi in the
period 2009-‐2016.
1 Leistel, et al. (1998). The volcanic-‐hosted massive sulphide deposits of the Iberian Pyrite Belt. Miner. Depos. 33, 2–30.
2 Sánchez de la Campa et al. (2011). Impact of abandoned mine wastes on atmospheric respirable particulate matter in the historic mining district of Rio Tinto (Iberian Pyrite Belt). Environ. Res. 111: 1018-‐1023.
3 Sánchez de la Campa et al. (2015). Geochemical anomalies of toxic elements and arsenic speciation in airborne particles from Cu mining and smelting activities: influence on air quality, J. Haz. Mat. 291: 18–27.
5th Iberian Meeting on Aerosol Science and Technology 4 - 6 July 2017 Barcelona, Spain
Bioaerosols sampling procedure in the context of a bioterrorist attack: IB-BIOALERTNET project
Sánchez F.J.1*, Galán D. 1, Díaz G.1, Fernández, R.1
1ISCIII - Instituto de Salud Carlos III, National Centre for Environmental Health (Department of Air Pollution), Ctra.Majadahonda-Pozuelo km 2,2, 28220.Majadahonda. Madrid, Spain Keywords: sampling, microorganism, pathogen, bioaerosol, bioterrorism
*Presenting author email: [email protected]
IB-BIOALERTNET was a project funded by the Prevention and Fight against Crime (ISEC) programme of the European Comission (Directorate-General Home Affairs). Its main aim was to stablish an ‘Iberian network of laboratories of biological alert’ in order to promote among them the exchange of information, training, technology transfer, standardization and accreditation of procedures to become an effective tool to respond rapidly and efficiently to biological threats. In the frame of the project, different workpackages were assumed by the National Centre for Environmental Health, namely the development of sampling procedures of highly pathogen microorganisms in relevant matrices (atmospheric, aquatic and solid -soil & sediment-) together with the implementation of a Quality Management System. In this communication we’ll only tackle with what is related with the atmospheric matrix. Taking into account the significance of the topic and in order to accomplish with the task committed with the highest level of rigor possible, an extensive search and comprehensive reading of scientific & technical documentation related (national and international) was undertaken. Altogether, more than 420 sources were consulted. The elaborated manuscript ‘Standard Operating Procedure to sample potentially pathogenic bioaerosols in air’ considers four main parts: a) Safety of the personnel in charge of sampling: this section summarizes the key points of the European Directive Directive 2000/54/EC ‘biological agents at work’ about the protection of workers from risks related to exposure to biological agents at work. b) Pre-sampling considerations: this point covers the need to have the equipment calibrated and sterilized and also aspects related with the manipulation and shipment of all the equipment to the sampling point. c) Sampling: this is the where the technical process of sampling is explained individually for each kind of bioaerosol, namely bacteria by impingement in sterile
saline solution (VDI 4252-3:2008), moulds by filtration in gelatin filters (UNE-CEN/TS 16115-1:2013) and viruses also by impingement in sterile deionized water (Lin et al. 1997; Dart and Thornburg 2008). d) Post-sampling considerations: a summary of key aspects such as the period, conditions of storage, shipping and custody of the samples, shipping containers, and the equipment decontamination is covered in this paragraph. In order to test the operative capacity of the procedure written, the IB-BIOALERNET/CNSA workgroup undertook different field trials. Its final proof was carried out during the “Luñol” simulation exercise of national interest organized by the Unidad Militar de Emergencias of the Spanish army. Throughout the writing process it was shown that it is still necessary to: - Uniform procedures for the sampling of airborne microorganisms, given the lack of consensus (especially for viruses due mainly to their small size and to the multitude of factors that influence their rate of recovery: relative humidity, temperature, exposure time, or chemical composition of the air, among others). - Standardize key pre- and post-sampling aspects such as disinfection of equipment, storage and transport conditions, etc.). The results of this work were made public in two workshops: one directed to potential new members of the network and another one intended to transfer the technology for environmental sampling to both the Spanish and Portuguese Security Forces.
VDI 4252 Part 3 (2008) UNE-CEN/TS 16115-1:2013 Lin, X., Willeke, K., Ulevicius, V. and Grinshpun, S. (1997) Effect
of sampling time on the collection efficiency of all-glass impingers. Am Ind Hyg Assoc J 58, 480–488.
Dart, A. and Thornburg, J. (2008) Collection efficiencies of bioaerosol impingers for virus-containing aerosols. Atmos Environ 42, 828–832.
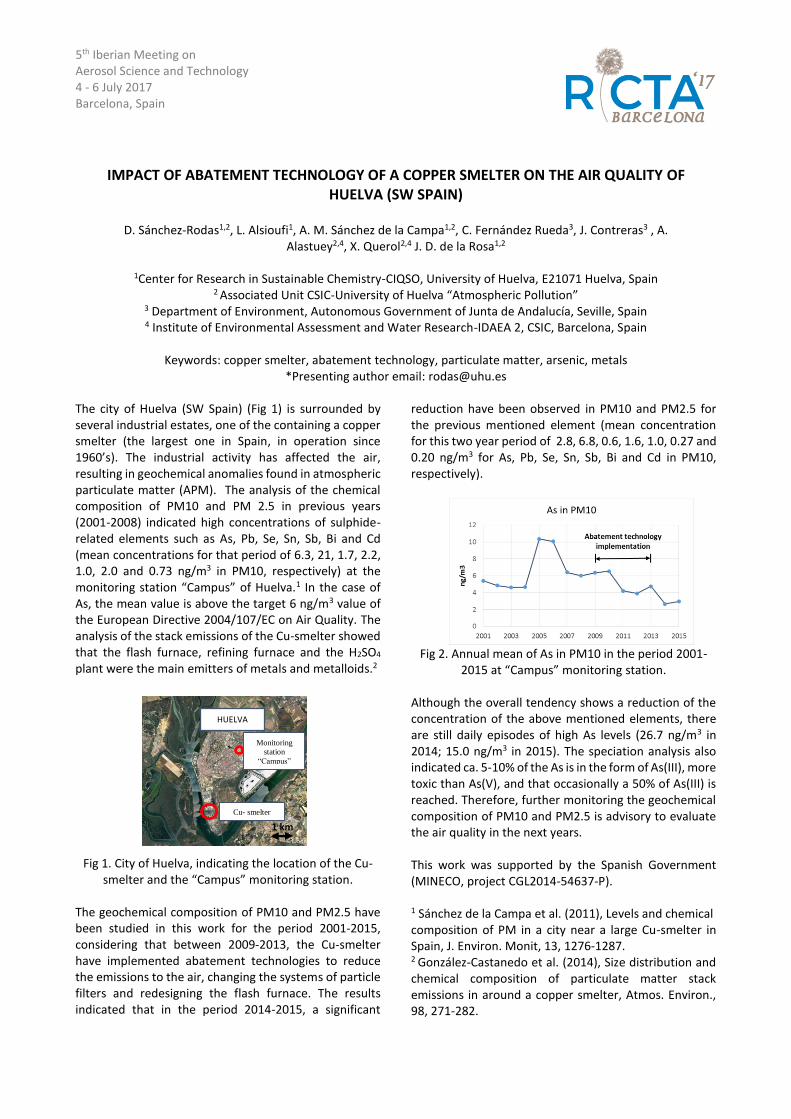
5th Iberian Meeting on Aerosol Science and Technology 4 - 6 July 2017 Barcelona, Spain
IMPACT OF ABATEMENT TECHNOLOGY OF A COPPER SMELTER ON THE AIR QUALITY OF HUELVA (SW SPAIN)
D. Sánchez-Rodas1,2, L. Alsioufi1, A. M. Sánchez de la Campa1,2, C. Fernández Rueda3, J. Contreras3 , A.
Alastuey2,4, X. Querol2,4 J. D. de la Rosa1,2
1Center for Research in Sustainable Chemistry-CIQSO, University of Huelva, E21071 Huelva, Spain
2 Associated Unit CSIC-University of Huelva “Atmospheric Pollution” 3 Department of Environment, Autonomous Government of Junta de Andalucía, Seville, Spain 4 Institute of Environmental Assessment and Water Research-IDAEA 2, CSIC, Barcelona, Spain
Keywords: copper smelter, abatement technology, particulate matter, arsenic, metals
*Presenting author email: [email protected]
The city of Huelva (SW Spain) (Fig 1) is surrounded by several industrial estates, one of the containing a copper smelter (the largest one in Spain, in operation since 1960’s). The industrial activity has affected the air, resulting in geochemical anomalies found in atmospheric particulate matter (APM). The analysis of the chemical composition of PM10 and PM 2.5 in previous years (2001-2008) indicated high concentrations of sulphide-related elements such as As, Pb, Se, Sn, Sb, Bi and Cd
(mean concentrations for that period of 6.3, 21, 1.7, 2.2, 1.0, 2.0 and 0.73 ng/m3 in PM10, respectively) at the monitoring station “Campus” of Huelva.1 In the case of As, the mean value is above the target 6 ng/m3 value of the European Directive 2004/107/EC on Air Quality. The analysis of the stack emissions of the Cu-smelter showed that the flash furnace, refining furnace and the H2SO4 plant were the main emitters of metals and metalloids.2
Fig 1. City of Huelva, indicating the location of the Cu-smelter and the “Campus” monitoring station.
The geochemical composition of PM10 and PM2.5 have been studied in this work for the period 2001-2015, considering that between 2009-2013, the Cu-smelter have implemented abatement technologies to reduce the emissions to the air, changing the systems of particle filters and redesigning the flash furnace. The results indicated that in the period 2014-2015, a significant
reduction have been observed in PM10 and PM2.5 for the previous mentioned element (mean concentration for this two year period of 2.8, 6.8, 0.6, 1.6, 1.0, 0.27 and 0.20 ng/m3 for As, Pb, Se, Sn, Sb, Bi and Cd in PM10, respectively).
Fig 2. Annual mean of As in PM10 in the period 2001-
2015 at “Campus” monitoring station.
Although the overall tendency shows a reduction of the concentration of the above mentioned elements, there are still daily episodes of high As levels (26.7 ng/m3 in 2014; 15.0 ng/m3 in 2015). The speciation analysis also indicated ca. 5-10% of the As is in the form of As(III), more toxic than As(V), and that occasionally a 50% of As(III) is reached. Therefore, further monitoring the geochemical composition of PM10 and PM2.5 is advisory to evaluate the air quality in the next years.
This work was supported by the Spanish Government (MINECO, project CGL2014-54637-P). 1 Sánchez de la Campa et al. (2011), Levels and chemical composition of PM in a city near a large Cu-smelter in Spain, J. Environ. Monit, 13, 1276-1287. 2 González-Castanedo et al. (2014), Size distribution and chemical composition of particulate matter stack emissions in around a copper smelter, Atmos. Environ., 98, 271-282.
Cu- smelter
HUELVA
Monitoring
station
“Campus”
1 km
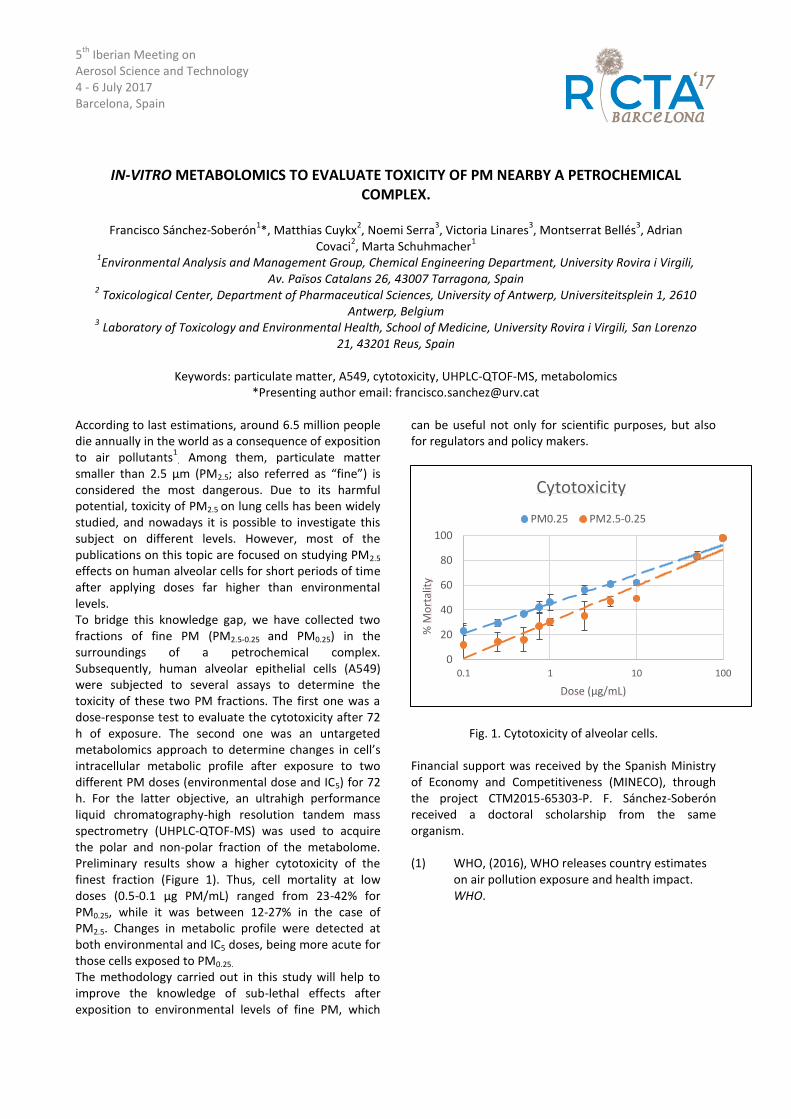
5th
Iberian Meeting on Aerosol Science and Technology 4 - 6 July 2017 Barcelona, Spain
IN-VITRO METABOLOMICS TO EVALUATE TOXICITY OF PM NEARBY A PETROCHEMICAL COMPLEX.
Francisco Sánchez-Soberón
1*, Matthias Cuykx
2, Noemi Serra
3, Victoria Linares
3, Montserrat Bellés
3, Adrian
Covaci2, Marta Schuhmacher
1
1Environmental Analysis and Management Group, Chemical Engineering Department, University Rovira i Virgili,
Av. Països Catalans 26, 43007 Tarragona, Spain 2 Toxicological Center, Department of Pharmaceutical Sciences, University of Antwerp, Universiteitsplein 1, 2610
Antwerp, Belgium 3 Laboratory of Toxicology and Environmental Health, School of Medicine, University Rovira i Virgili, San Lorenzo
21, 43201 Reus, Spain
Keywords: particulate matter, A549, cytotoxicity, UHPLC-QTOF-MS, metabolomics *Presenting author email: [email protected]
According to last estimations, around 6.5 million people die annually in the world as a consequence of exposition to air pollutants
1. Among them, particulate matter
smaller than 2.5 µm (PM2.5; also referred as “fine”) is considered the most dangerous. Due to its harmful potential, toxicity of PM2.5 on lung cells has been widely studied, and nowadays it is possible to investigate this subject on different levels. However, most of the publications on this topic are focused on studying PM2.5
effects on human alveolar cells for short periods of time after applying doses far higher than environmental levels. To bridge this knowledge gap, we have collected two fractions of fine PM (PM2.5-0.25 and PM0.25) in the surroundings of a petrochemical complex. Subsequently, human alveolar epithelial cells (A549) were subjected to several assays to determine the toxicity of these two PM fractions. The first one was a dose-response test to evaluate the cytotoxicity after 72 h of exposure. The second one was an untargeted metabolomics approach to determine changes in cell’s intracellular metabolic profile after exposure to two different PM doses (environmental dose and IC5) for 72 h. For the latter objective, an ultrahigh performance liquid chromatography-high resolution tandem mass spectrometry (UHPLC-QTOF-MS) was used to acquire the polar and non-polar fraction of the metabolome. Preliminary results show a higher cytotoxicity of the finest fraction (Figure 1). Thus, cell mortality at low doses (0.5-0.1 µg PM/mL) ranged from 23-42% for PM0.25, while it was between 12-27% in the case of PM2.5. Changes in metabolic profile were detected at both environmental and IC5 doses, being more acute for those cells exposed to PM0.25. The methodology carried out in this study will help to improve the knowledge of sub-lethal effects after exposition to environmental levels of fine PM, which
can be useful not only for scientific purposes, but also for regulators and policy makers.
Fig. 1. Cytotoxicity of alveolar cells.
Financial support was received by the Spanish Ministry of Economy and Competitiveness (MINECO), through the project CTM2015-65303-P. F. Sánchez-Soberón received a doctoral scholarship from the same organism. (1) WHO, (2016), WHO releases country estimates
on air pollution exposure and health impact. WHO.
0
20
40
60
80
100
0.1 1 10 100
% M
ort
alit
y
Dose (µg/mL)
Cytotoxicity
PM0.25 PM2.5-0.25
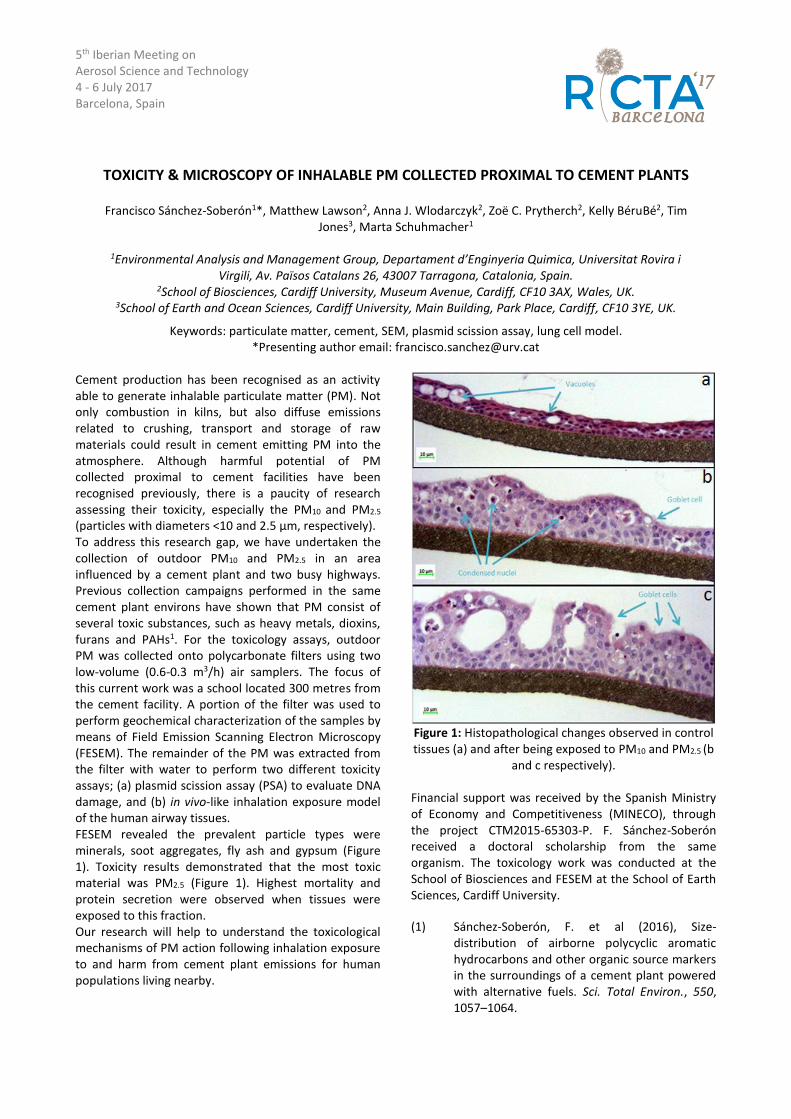
5th Iberian Meeting on Aerosol Science and Technology 4 - 6 July 2017 Barcelona, Spain
TOXICITY & MICROSCOPY OF INHALABLE PM COLLECTED PROXIMAL TO CEMENT PLANTS
Francisco Sánchez-Soberón1*, Matthew Lawson2, Anna J. Wlodarczyk2, Zoë C. Prytherch2, Kelly BéruBé2, Tim Jones3, Marta Schuhmacher1
1Environmental Analysis and Management Group, Departament d’Enginyeria Quimica, Universitat Rovira i
Virgili, Av. Països Catalans 26, 43007 Tarragona, Catalonia, Spain. 2School of Biosciences, Cardiff University, Museum Avenue, Cardiff, CF10 3AX, Wales, UK.
3School of Earth and Ocean Sciences, Cardiff University, Main Building, Park Place, Cardiff, CF10 3YE, UK.
Keywords: particulate matter, cement, SEM, plasmid scission assay, lung cell model. *Presenting author email: [email protected]
Cement production has been recognised as an activity able to generate inhalable particulate matter (PM). Not only combustion in kilns, but also diffuse emissions related to crushing, transport and storage of raw materials could result in cement emitting PM into the atmosphere. Although harmful potential of PM collected proximal to cement facilities have been recognised previously, there is a paucity of research assessing their toxicity, especially the PM10 and PM2.5
(particles with diameters <10 and 2.5 µm, respectively). To address this research gap, we have undertaken the collection of outdoor PM10 and PM2.5 in an area influenced by a cement plant and two busy highways. Previous collection campaigns performed in the same cement plant environs have shown that PM consist of several toxic substances, such as heavy metals, dioxins, furans and PAHs1. For the toxicology assays, outdoor PM was collected onto polycarbonate filters using two low-volume (0.6-0.3 m3/h) air samplers. The focus of this current work was a school located 300 metres from the cement facility. A portion of the filter was used to perform geochemical characterization of the samples by means of Field Emission Scanning Electron Microscopy (FESEM). The remainder of the PM was extracted from the filter with water to perform two different toxicity assays; (a) plasmid scission assay (PSA) to evaluate DNA damage, and (b) in vivo-like inhalation exposure model of the human airway tissues. FESEM revealed the prevalent particle types were minerals, soot aggregates, fly ash and gypsum (Figure 1). Toxicity results demonstrated that the most toxic material was PM2.5 (Figure 1). Highest mortality and protein secretion were observed when tissues were exposed to this fraction. Our research will help to understand the toxicological mechanisms of PM action following inhalation exposure to and harm from cement plant emissions for human populations living nearby.
Figure 1: Histopathological changes observed in control tissues (a) and after being exposed to PM10 and PM2.5 (b
and c respectively).
Financial support was received by the Spanish Ministry of Economy and Competitiveness (MINECO), through the project CTM2015-65303-P. F. Sánchez-Soberón received a doctoral scholarship from the same organism. The toxicology work was conducted at the School of Biosciences and FESEM at the School of Earth Sciences, Cardiff University. (1) Sánchez-Soberón, F. et al (2016), Size-
distribution of airborne polycyclic aromatic hydrocarbons and other organic source markers in the surroundings of a cement plant powered with alternative fuels. Sci. Total Environ., 550, 1057–1064.
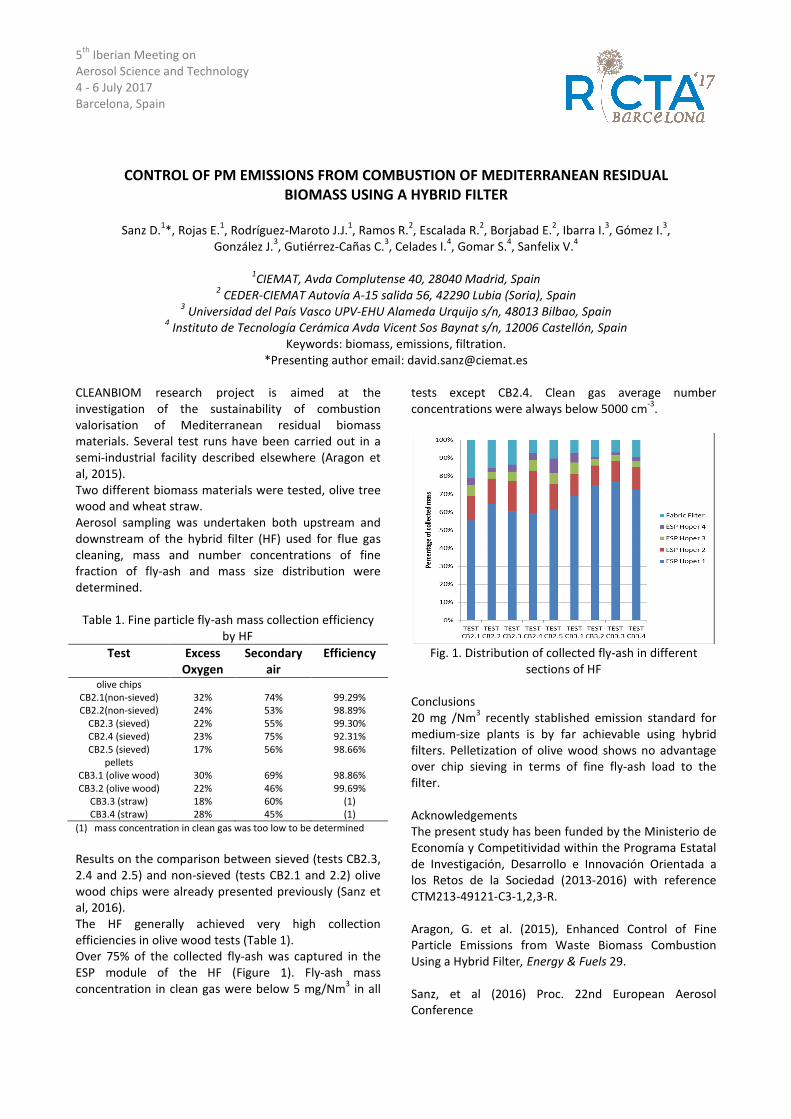
5th
Iberian Meeting on
Aerosol Science and Technology
4 - 6 July 2017
Barcelona, Spain
CONTROL OF PM EMISSIONS FROM COMBUSTION OF MEDITERRANEAN RESIDUAL
BIOMASS USING A HYBRID FILTER
Sanz D.1*, Rojas E.
1, Rodríguez-Maroto J.J.
1, Ramos R.
2, Escalada R.
2, Borjabad E.
2, Ibarra I.
3, Gómez I.
3,
González J.3, Gutiérrez-Cañas C.
3, Celades I.
4, Gomar S.
4, Sanfelix V.
4
1CIEMAT, Avda Complutense 40, 28040 Madrid, Spain
2 CEDER-CIEMAT Autovía A-15 salida 56, 42290 Lubia (Soria), Spain
3 Universidad del País Vasco UPV-EHU Alameda Urquijo s/n, 48013 Bilbao, Spain
4 Instituto de Tecnología Cerámica Avda Vicent Sos Baynat s/n, 12006 Castellón, Spain
Keywords: biomass, emissions, filtration.
*Presenting author email: [email protected]
CLEANBIOM research project is aimed at the
investigation of the sustainability of combustion
valorisation of Mediterranean residual biomass
materials. Several test runs have been carried out in a
semi-industrial facility described elsewhere (Aragon et
al, 2015).
Two different biomass materials were tested, olive tree
wood and wheat straw.
Aerosol sampling was undertaken both upstream and
downstream of the hybrid filter (HF) used for flue gas
cleaning, mass and number concentrations of fine
fraction of fly-ash and mass size distribution were
determined.
Table 1. Fine particle fly-ash mass collection efficiency
by HF
Test Excess
Oxygen
Secondary
air
Efficiency
olive chips
CB2.1(non-sieved)
CB2.2(non-sieved)
CB2.3 (sieved)
CB2.4 (sieved)
CB2.5 (sieved)
pellets
CB3.1 (olive wood)
CB3.2 (olive wood)
CB3.3 (straw)
CB3.4 (straw)
32%
24%
22%
23%
17%
30%
22%
18%
28%
74%
53%
55%
75%
56%
69%
46%
60%
45%
99.29%
98.89%
99.30%
92.31%
98.66%
98.86%
99.69%
(1)
(1)
(1) mass concentration in clean gas was too low to be determined
Results on the comparison between sieved (tests CB2.3,
2.4 and 2.5) and non-sieved (tests CB2.1 and 2.2) olive
wood chips were already presented previously (Sanz et
al, 2016).
The HF generally achieved very high collection
efficiencies in olive wood tests (Table 1).
Over 75% of the collected fly-ash was captured in the
ESP module of the HF (Figure 1). Fly-ash mass
concentration in clean gas were below 5 mg/Nm3 in all
tests except CB2.4. Clean gas average number
concentrations were always below 5000 cm-3
.
Fig. 1. Distribution of collected fly-ash in different
sections of HF
Conclusions
20 mg /Nm3 recently stablished emission standard for
medium-size plants is by far achievable using hybrid
filters. Pelletization of olive wood shows no advantage
over chip sieving in terms of fine fly-ash load to the
filter.
Acknowledgements
The present study has been funded by the Ministerio de
Economía y Competitividad within the Programa Estatal
de Investigación, Desarrollo e Innovación Orientada a
los Retos de la Sociedad (2013-2016) with reference
CTM213-49121-C3-1,2,3-R.
Aragon, G. et al. (2015), Enhanced Control of Fine
Particle Emissions from Waste Biomass Combustion
Using a Hybrid Filter, Energy & Fuels 29.
Sanz, et al (2016) Proc. 22nd European Aerosol
Conference
5th Iberian Meeting on Aerosol Science and Technology 4 - 6 July 2017 Barcelona, Spain
IMPACT ON RADIATION OF AN INTENSE DESERT DUST INTRUSION, AS MEASURED AT TWO
STATIONS IN WESTERN IBERIAN PENINSULA
Serrano A.1, 2 *, Obregón M.A.3, Cancillo M.L.1, 2, Costa M.J.4, Silva A.M.4, Sánchez G.1, Piedehierro A.A.1
1 Departamento de Física, University of Extremadura, Badajoz, Spain 2 Instituto Universitario de Investigación del Agua, Cambio Climático y Sostenibilidad (IACYS), Universidad de
Extremadura, Badajoz, Spain 3 Departamento de Física, Instituto de Ciências da Terra, Instituto de Investigação e Formação Avançada,
University of Évora, Évora, Portugal 4 Departamento de Física, Instituto de Ciências da Terra, Escola de Ciências e Tecnologia, University of Évora,
Évora, Portugal
Keywords: aerosol, desert dust, intrusion, radiation *Presenting author email: [email protected]
An intense Saharan dust outbreak entered the Southern half of the Iberian Peninsula on 21st February 2017, lasted five days and left the area on 25th February. During these days, it notably influenced the surface radiation balance and reduced the atmospheric visibility. These intrusions are common to the Mediterranean region, with several events being reported every year. In these events, the dust is lifted from The Sahara Desert and carried aloft by strong winds. The Sahara Desert is by far the most important source of aerosols for the Iberian Peninsula and these intrusions constitute a typical characteristic of the aerosol annual regime for this region. Although they are more commonly frequent during summer, some intense events have occurred in winter these last years. The 21st-25th February 2017 event was detected by the radiometric stations of Évora (Portugal) and Badajoz (Spain) among others. These stations are equipped with CIMEL CE-318 sunphotometers and additional radiometric instrumentation. Both stations belong to NASA AERONET (AErosol RObotic NETwork) and RIMA (Red Ibérica de Medida fotométrica de Aerosoles) networks and follow their calibration and measuring protocols. As expected, the arrival of the dust intrusion caused a large increase in the aerosol optical depth and a simultaneous decrease in the Ångström exponent over both stations. Additionally, significant changes in the solar radiation as measured by broadband radiometers were detected in regard to the magnitude and the diffuse fraction. These changes were less obvious in the ultraviolet range due to the
greater scattering at shorter wavelengths. In the afternoon of 22nd February clouds formed, and showers of red rains fell on 23rd and 24th February. Since the CIMEL CE-318 provides no aerosol information when clouds are present, the event needed to be followed by broadband radiometer measurements. This fact emphasizes the convenience of using a variety of instruments for a complete monitoring of this type of events. The event declined on 24th February and was finally over on 25th. The origin of the dust plume was studied by computing back-trajectories using the Hybrid Single Particle Lagrangian Integrated Trajectory model (HYSPLIT version 4). It was confirmed that the air mass was proceeding from the Sahara region on 21st, 22nd and 23rd February 2017. This work was partially supported by FCT through the grant SFRH/BPD/86498/2012. The work is co-funded by the research project CGL2014-56255-C2-1-R granted by the “Ministerio de Economía y Competitividad” of Spain and the European Union through FEDER; and the European Union through the European Regional Development Fund, included in the COMPETE 2020 through the ICT project (UID / GEO / 04683/2013) with the reference POCI-01-0145-FEDER-007690.
5th Iberian Meeting on Aerosol Science and Technology 4 - 6 July 2017 Barcelona, Spain
INTERCOMPARACIÓN DE SIETE ANALIZADORES ELPI Y ELPI+
Setién I.1, Aragón G.2, Vaquero C.3, Mediavilla I.4, Correa E.5, Gutiérrez-Cañas C.6, Rojas E.5, Penalva J.5, Setién E.1, Archilla V.2, Ramos R.4, Lanzas R.5, Ibarra I.6, Sanz D.5, Hormigo D.2, Borjabad E.4,
Gómez I.6, Rodríguez-Maroto J.J.5, Escalada R.4, Pérez V.4, Arias J.M.7, Lamminen E.8
1SolMa Environmental Solutions, Fuente el Saz de Jarama, 28140, Spain 2 INTA, Torrejón de Ardoz, 28850, Spain
3 TECNALIA, Miñano, 01510, Spain 4 CEDER/CIEMAT, Lubia, 42290, Spain
5 CIEMAT, Madrid, 28040, Spain 6 UPV/EHU, Bilbao, 48013, Spain
7 INTA-ITM San Martín de la Vega, 28330, Spain 8 Dekati, Kangasala FI-36240, Finland
Keywords: ELPI, kernel, intercomparación, diluidores, splitters. *Presenting author email: [email protected]
Uno de los instrumentos más versátiles para el análisis on-line y la caracterización de aerosoles en un amplio rango de contextos experimentales es la familia ELPI/ELPI+. El resultado directo, aunque no la medida primaria, es la concentración en número, derivada a través del kernel del instrumento1-2. La trazabilidad de las medidas frente a un estándar primario, en términos estrictos de calibración, es extremadamente difícil por la cantidad de variables implicadas en la señal en número3. Por ello, incluso usando principios de medida mucho más directos, como es el caso de electrómetros de aerosoles 4 se recurre a la intercomparación, entendiendo por tal, exclusivamente, el estudio de la respuesta de instrumentos basados en el mismo principio, enfrentados a la misma señal.
En esta intercomparación (CEDER-CIEMAT 2017) se emplearon siete modelos ELPI y ELPI+ (DEKATI, Ltd.), con una antigüedad de entre 1 y 13 años. En los años 2014 y 2015 tres unidades ELPI fueron sometidas a revisión y calibración en fábrica y una unidad ELPI+ se revisó y ajustó en dos ocasiones. Los ensayos se realizaron a baja y alta concentración de aerosol polidisperso. Para baja concentración se muestreó el aire ambiente del interior del laboratorio y para producir la alta concentración se emplearon dos fuentes independientes; la primera consistía en una caldera de biomasa de 17,5KW, alimentada con pellets de serrín de pino de calidad A1,ISO 17225-2 y la segunda era un dispersador
SAG40 (TOPAS), alimentado con polvo de bicarbonato sódico. Para homogeneizar el flujo en el punto de muestreo se utilizó una línea de transporte de acero inoxidable aislada térmicamente. El punto de muestreo se ubicó a 8 y a 2 diámetros de la entrada y salida de gases, respectivamente. El muestreo consistía en una “T” modificada para conectar en serie dos diluidores por eyección DI2000 (DEKATI, Ltd.), en caliente y en frío, sucesivamente. A la salida de los dilutores se dividió el flujo en siete partes para asegurar la equivalencia de muestra a todos los analizadores conectados5. Previo a la realización del ejercicio comparativo, se comprobó el correcto funcionamiento de todos los instrumentos.
En este trabajo se presentarán los resultados, conclusiones y posibles recomendaciones de uso aplicadas a ambas series de experimentos, en ambiente y en emisión.
1Lemmetty M. et al (2005). Aerosol Science and Technology, 39, 583–595. 2Marjamaki M. et al (2005). Aerosol Science and Technology, 39, 575-582. 3Ouf F.-X. et al (2009). Aerosol Science and Technology, 43, 685-698. 4Hogstrom R. et al. (2014. Metrología 51. 293-303. 5Rodríguez J.J. et al. (2017), Diseño de Splitters de Flujo Variable, Informes Técnicos Ciemat 1399, Ed. Ciemat.
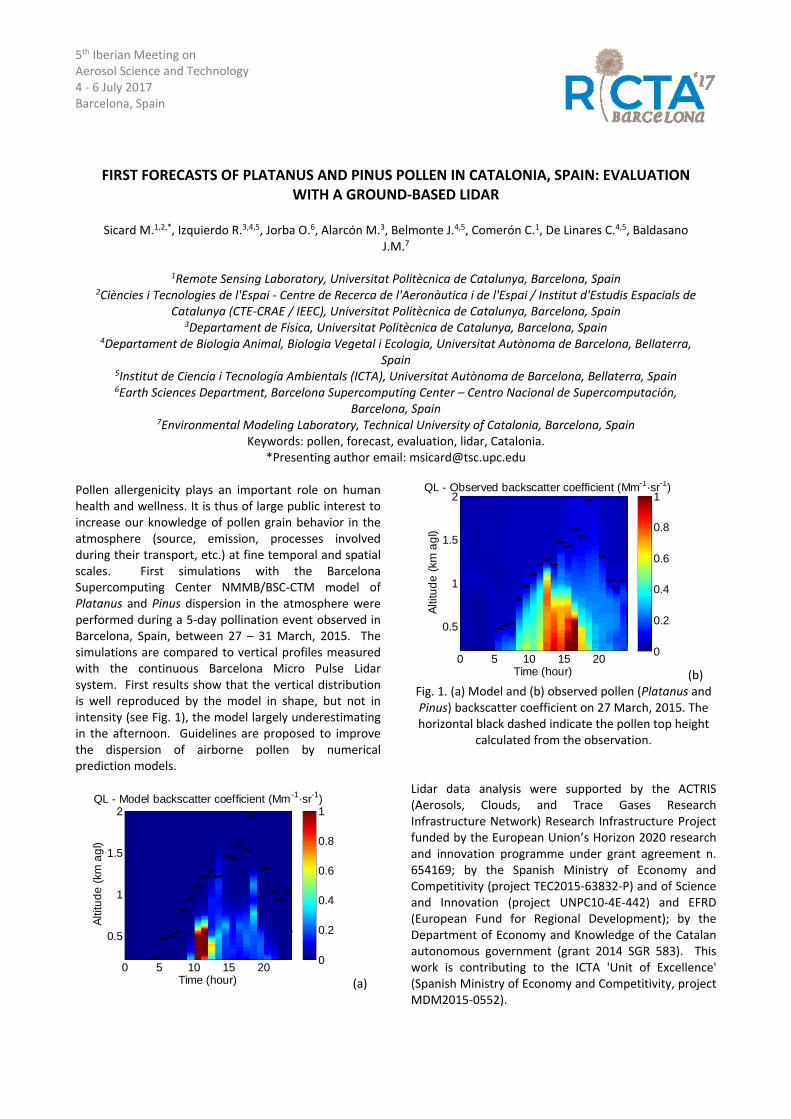
5th Iberian Meeting on Aerosol Science and Technology 4 ‐ 6 July 2017 Barcelona, Spain
FIRST FORECASTS OF PLATANUS AND PINUS POLLEN IN CATALONIA, SPAIN: EVALUATION WITH A GROUND‐BASED LIDAR
Sicard M.1,2,*, Izquierdo R.3,4,5, Jorba O.6, Alarcón M.3, Belmonte J.4,5, Comerón C.1, De Linares C.4,5, Baldasano
J.M.7
1Remote Sensing Laboratory, Universitat Politècnica de Catalunya, Barcelona, Spain 2Ciències i Tecnologies de l'Espai ‐ Centre de Recerca de l'Aeronàutica i de l'Espai / Institut d'Estudis Espacials de
Catalunya (CTE‐CRAE / IEEC), Universitat Politècnica de Catalunya, Barcelona, Spain 3Departament de Física, Universitat Politècnica de Catalunya, Barcelona, Spain
4Departament de Biologia Animal, Biologia Vegetal i Ecologia, Universitat Autònoma de Barcelona, Bellaterra, Spain
5Institut de Ciencia i Tecnología Ambientals (ICTA), Universitat Autònoma de Barcelona, Bellaterra, Spain 6Earth Sciences Department, Barcelona Supercomputing Center – Centro Nacional de Supercomputación,
Barcelona, Spain 7Environmental Modeling Laboratory, Technical University of Catalonia, Barcelona, Spain
Keywords: pollen, forecast, evaluation, lidar, Catalonia. *Presenting author email: [email protected]
Pollen allergenicity plays an important role on human health and wellness. It is thus of large public interest to increase our knowledge of pollen grain behavior in the atmosphere (source, emission, processes involved during their transport, etc.) at fine temporal and spatial scales. First simulations with the Barcelona Supercomputing Center NMMB/BSC‐CTM model of Platanus and Pinus dispersion in the atmosphere were performed during a 5‐day pollination event observed in Barcelona, Spain, between 27 – 31 March, 2015. The simulations are compared to vertical profiles measured with the continuous Barcelona Micro Pulse Lidar system. First results show that the vertical distribution is well reproduced by the model in shape, but not in intensity (see Fig. 1), the model largely underestimating in the afternoon. Guidelines are proposed to improve the dispersion of airborne pollen by numerical prediction models.
(a)
(b) Fig. 1. (a) Model and (b) observed pollen (Platanus and Pinus) backscatter coefficient on 27 March, 2015. The horizontal black dashed indicate the pollen top height
calculated from the observation.
Lidar data analysis were supported by the ACTRIS (Aerosols, Clouds, and Trace Gases Research Infrastructure Network) Research Infrastructure Project funded by the European Union’s Horizon 2020 research and innovation programme under grant agreement n. 654169; by the Spanish Ministry of Economy and Competitivity (project TEC2015‐63832‐P) and of Science and Innovation (project UNPC10‐4E‐442) and EFRD (European Fund for Regional Development); by the Department of Economy and Knowledge of the Catalan autonomous government (grant 2014 SGR 583). This work is contributing to the ICTA 'Unit of Excellence' (Spanish Ministry of Economy and Competitivity, project MDM2015‐0552).
Time (hour)
Altit
ude
(km
agl
)
QL - Model backscatter coefficient (Mm-1·sr-1)
0 5 10 15 20
0.5
1
1.5
2
0
0.2
0.4
0.6
0.8
1
Time (hour)
Altit
ude
(km
agl
)
QL - Observed backscatter coefficient (Mm-1·sr-1)
0 5 10 15 20
0.5
1
1.5
2
0
0.2
0.4
0.6
0.8
1
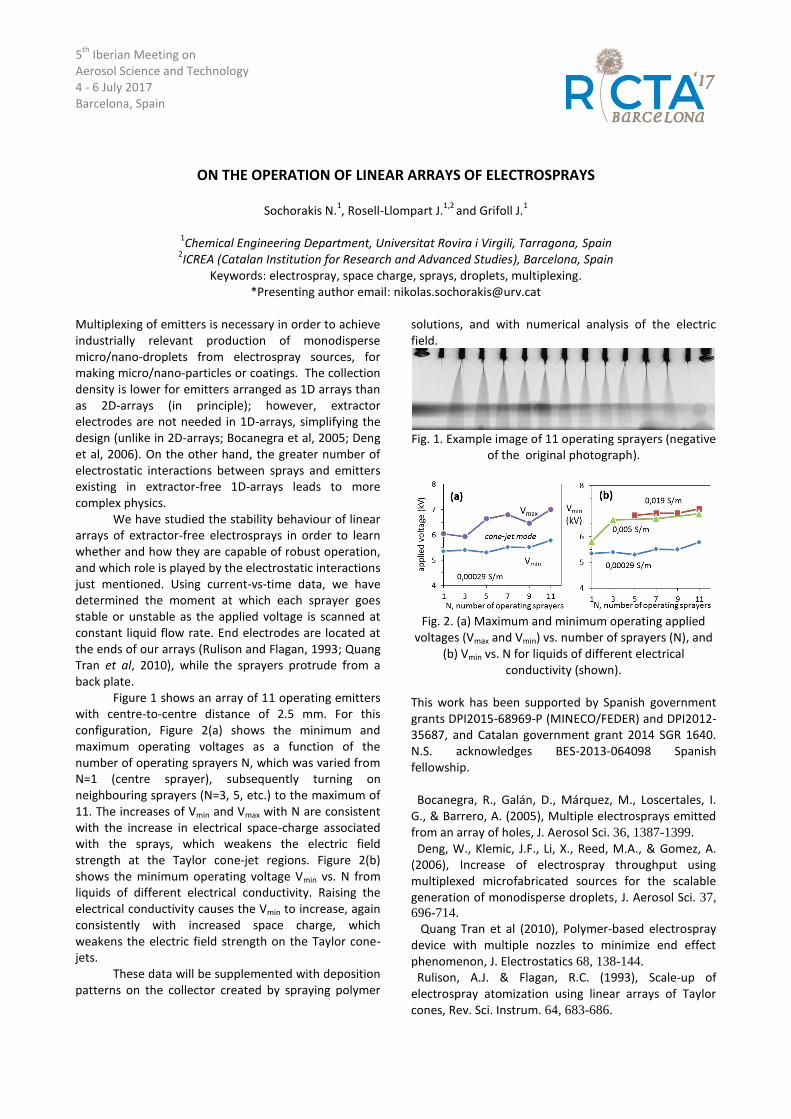
5th
Iberian Meeting on Aerosol Science and Technology 4 - 6 July 2017 Barcelona, Spain
ON THE OPERATION OF LINEAR ARRAYS OF ELECTROSPRAYS
Sochorakis N.1, Rosell-Llompart J.
1,2 and Grifoll J.
1
1Chemical Engineering Department, Universitat Rovira i Virgili, Tarragona, Spain
2ICREA (Catalan Institution for Research and Advanced Studies), Barcelona, Spain
Keywords: electrospray, space charge, sprays, droplets, multiplexing. *Presenting author email: [email protected]
Multiplexing of emitters is necessary in order to achieve industrially relevant production of monodisperse micro/nano-droplets from electrospray sources, for making micro/nano-particles or coatings. The collection density is lower for emitters arranged as 1D arrays than as 2D-arrays (in principle); however, extractor electrodes are not needed in 1D-arrays, simplifying the design (unlike in 2D-arrays; Bocanegra et al, 2005; Deng et al, 2006). On the other hand, the greater number of electrostatic interactions between sprays and emitters existing in extractor-free 1D-arrays leads to more complex physics. We have studied the stability behaviour of linear arrays of extractor-free electrosprays in order to learn whether and how they are capable of robust operation, and which role is played by the electrostatic interactions just mentioned. Using current-vs-time data, we have determined the moment at which each sprayer goes stable or unstable as the applied voltage is scanned at constant liquid flow rate. End electrodes are located at the ends of our arrays (Rulison and Flagan, 1993; Quang Tran et al, 2010), while the sprayers protrude from a back plate. Figure 1 shows an array of 11 operating emitters with centre-to-centre distance of 2.5 mm. For this configuration, Figure 2(a) shows the minimum and maximum operating voltages as a function of the number of operating sprayers N, which was varied from N=1 (centre sprayer), subsequently turning on neighbouring sprayers (N=3, 5, etc.) to the maximum of 11. The increases of Vmin and Vmax with N are consistent with the increase in electrical space-charge associated with the sprays, which weakens the electric field strength at the Taylor cone-jet regions. Figure 2(b) shows the minimum operating voltage Vmin vs. N from liquids of different electrical conductivity. Raising the electrical conductivity causes the Vmin to increase, again consistently with increased space charge, which weakens the electric field strength on the Taylor cone-jets. These data will be supplemented with deposition patterns on the collector created by spraying polymer
solutions, and with numerical analysis of the electric field.
Fig. 1. Example image of 11 operating sprayers (negative
of the original photograph).
Fig. 2. (a) Maximum and minimum operating applied
voltages (Vmax and Vmin) vs. number of sprayers (N), and (b) Vmin vs. N for liquids of different electrical
conductivity (shown). This work has been supported by Spanish government grants DPI2015-68969-P (MINECO/FEDER) and DPI2012-35687, and Catalan government grant 2014 SGR 1640. N.S. acknowledges BES-2013-064098 Spanish fellowship.
Bocanegra, R., Galán, D., Márquez, M., Loscertales, I. G., & Barrero, A. (2005), Multiple electrosprays emitted from an array of holes, J. Aerosol Sci. 36, 1387-1399.
Deng, W., Klemic, J.F., Li, X., Reed, M.A., & Gomez, A. (2006), Increase of electrospray throughput using multiplexed microfabricated sources for the scalable generation of monodisperse droplets, J. Aerosol Sci. 37,
696-714. Quang Tran et al (2010), Polymer-based electrospray
device with multiple nozzles to minimize end effect phenomenon, J. Electrostatics 68, 138-144.
Rulison, A.J. & Flagan, R.C. (1993), Scale‐up of electrospray atomization using linear arrays of Taylor cones, Rev. Sci. Instrum. 64, 683-686.
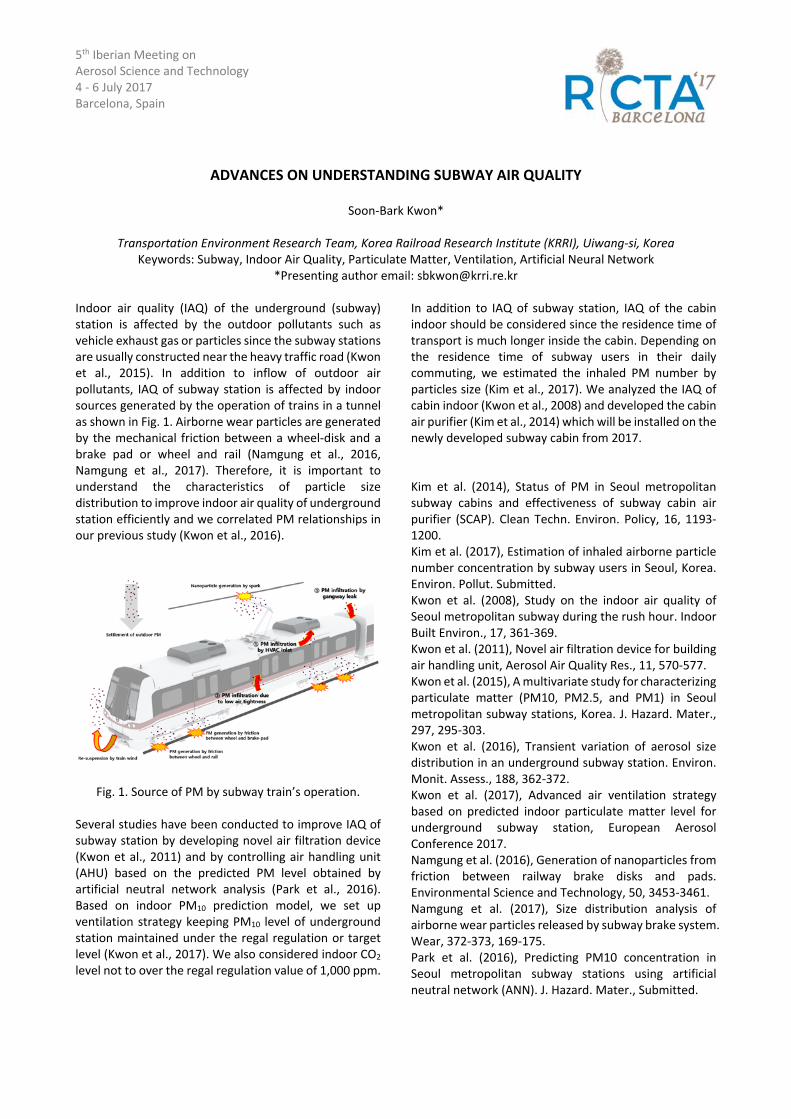
5th Iberian Meeting on Aerosol Science and Technology 4 ‐ 6 July 2017 Barcelona, Spain
ADVANCES ON UNDERSTANDING SUBWAY AIR QUALITY
Soon‐Bark Kwon*
Transportation Environment Research Team, Korea Railroad Research Institute (KRRI), Uiwang‐si, Korea Keywords: Subway, Indoor Air Quality, Particulate Matter, Ventilation, Artificial Neural Network
*Presenting author email: [email protected] Indoor air quality (IAQ) of the underground (subway) station is affected by the outdoor pollutants such as vehicle exhaust gas or particles since the subway stations are usually constructed near the heavy traffic road (Kwon et al., 2015). In addition to inflow of outdoor air pollutants, IAQ of subway station is affected by indoor sources generated by the operation of trains in a tunnel as shown in Fig. 1. Airborne wear particles are generated by the mechanical friction between a wheel‐disk and a brake pad or wheel and rail (Namgung et al., 2016, Namgung et al., 2017). Therefore, it is important to understand the characteristics of particle size distribution to improve indoor air quality of underground station efficiently and we correlated PM relationships in our previous study (Kwon et al., 2016).
Fig. 1. Source of PM by subway train’s operation. Several studies have been conducted to improve IAQ of subway station by developing novel air filtration device (Kwon et al., 2011) and by controlling air handling unit (AHU) based on the predicted PM level obtained by artificial neutral network analysis (Park et al., 2016). Based on indoor PM10 prediction model, we set up ventilation strategy keeping PM10 level of underground station maintained under the regal regulation or target level (Kwon et al., 2017). We also considered indoor CO2 level not to over the regal regulation value of 1,000 ppm.
In addition to IAQ of subway station, IAQ of the cabin indoor should be considered since the residence time of transport is much longer inside the cabin. Depending on the residence time of subway users in their daily commuting, we estimated the inhaled PM number by particles size (Kim et al., 2017). We analyzed the IAQ of cabin indoor (Kwon et al., 2008) and developed the cabin air purifier (Kim et al., 2014) which will be installed on the newly developed subway cabin from 2017. Kim et al. (2014), Status of PM in Seoul metropolitan subway cabins and effectiveness of subway cabin air purifier (SCAP). Clean Techn. Environ. Policy, 16, 1193‐1200. Kim et al. (2017), Estimation of inhaled airborne particle number concentration by subway users in Seoul, Korea. Environ. Pollut. Submitted. Kwon et al. (2008), Study on the indoor air quality of Seoul metropolitan subway during the rush hour. Indoor Built Environ., 17, 361‐369. Kwon et al. (2011), Novel air filtration device for building air handling unit, Aerosol Air Quality Res., 11, 570‐577. Kwon et al. (2015), A multivariate study for characterizing particulate matter (PM10, PM2.5, and PM1) in Seoul metropolitan subway stations, Korea. J. Hazard. Mater., 297, 295‐303. Kwon et al. (2016), Transient variation of aerosol size distribution in an underground subway station. Environ. Monit. Assess., 188, 362‐372. Kwon et al. (2017), Advanced air ventilation strategy based on predicted indoor particulate matter level for underground subway station, European Aerosol Conference 2017. Namgung et al. (2016), Generation of nanoparticles from friction between railway brake disks and pads. Environmental Science and Technology, 50, 3453‐3461. Namgung et al. (2017), Size distribution analysis of airborne wear particles released by subway brake system. Wear, 372‐373, 169‐175. Park et al. (2016), Predicting PM10 concentration in Seoul metropolitan subway stations using artificial neutral network (ANN). J. Hazard. Mater., Submitted.
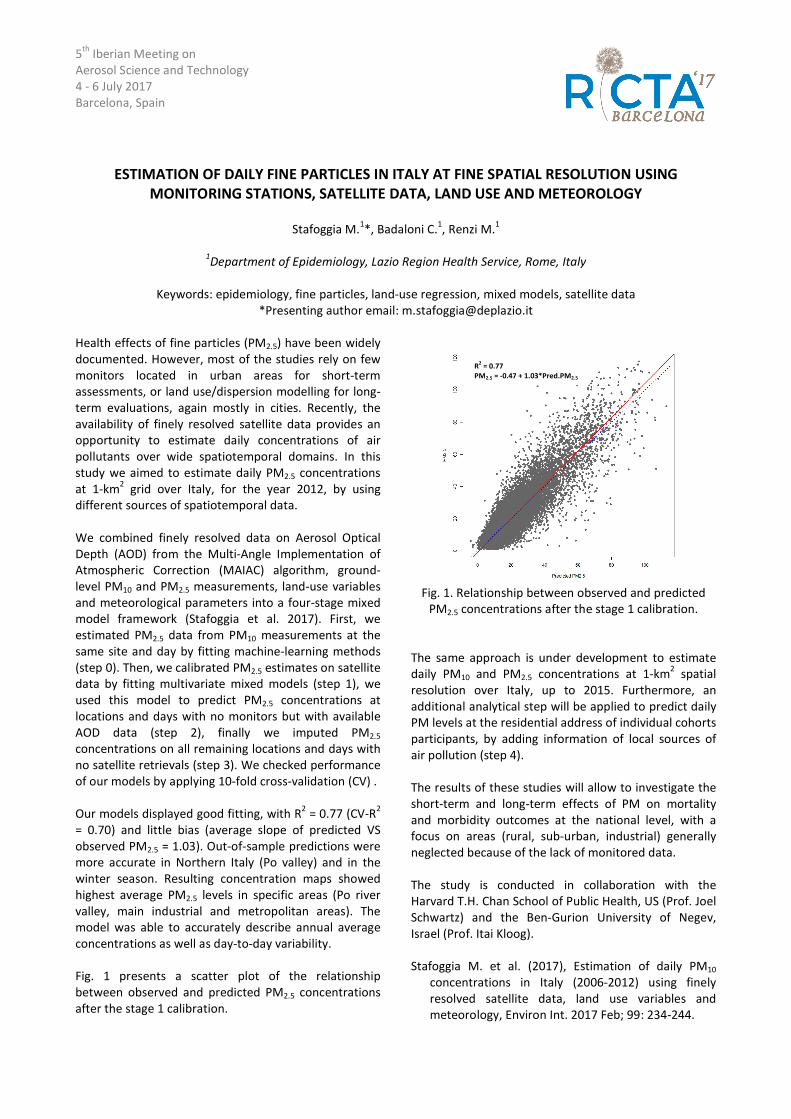
5th Iberian Meeting on Aerosol Science and Technology 4 - 6 July 2017 Barcelona, Spain ESTIMATION OF DAILY FINE PARTICLES IN ITALY AT FINE SPATIAL RESOLUTION USING MONITORING STATIONS, SATELLITE DATA, LAND USE AND METEOROLOGY Stafoggia M.1*, Badaloni C.1, Renzi M.1 1Department of Epidemiology, Lazio Region Health Service, Rome, Italy Keywords: epidemiology, fine particles, land-use regression, mixed models, satellite data *Presenting author email: [email protected] Health effects of fine particles (PM2.5) have been widely documented. However, most of the studies rely on few monitors located in urban areas for short-term assessments, or land use/dispersion modelling for long-term evaluations, again mostly in cities. Recently, the availability of finely resolved satellite data provides an opportunity to estimate daily concentrations of air pollutants over wide spatiotemporal domains. In this study we aimed to estimate daily PM2.5 concentrations at 1-km2 grid over Italy, for the year 2012, by using different sources of spatiotemporal data. We combined finely resolved data on Aerosol Optical Depth (AOD) from the Multi-Angle Implementation of Atmospheric Correction (MAIAC) algorithm, ground-level PM10 and PM2.5 measurements, land-use variables and meteorological parameters into a four-stage mixed model framework (Stafoggia et al. 2017). First, we estimated PM2.5 data from PM10 measurements at the same site and day by fitting machine-learning methods (step 0). Then, we calibrated PM2.5 estimates on satellite data by fitting multivariate mixed models (step 1), we used this model to predict PM2.5 concentrations at locations and days with no monitors but with available AOD data (step 2), finally we imputed PM2.5 concentrations on all remaining locations and days with no satellite retrievals (step 3). We checked performance of our models by applying 10-fold cross-validation (CV) . Our models displayed good fitting, with R2 = 0.77 (CV-R2 = 0.70) and little bias (average slope of predicted VS observed PM2.5 = 1.03). Out-of-sample predictions were more accurate in Northern Italy (Po valley) and in the winter season. Resulting concentration maps showed highest average PM2.5 levels in specific areas (Po river valley, main industrial and metropolitan areas). The model was able to accurately describe annual average concentrations as well as day-to-day variability. Fig. 1 presents a scatter plot of the relationship between observed and predicted PM2.5 concentrations after the stage 1 calibration.
Fig. 1. Relationship between observed and predicted PM2.5 concentrations after the stage 1 calibration. The same approach is under development to estimate daily PM10 and PM2.5 concentrations at 1-km2 spatial resolution over Italy, up to 2015. Furthermore, an additional analytical step will be applied to predict daily PM levels at the residential address of individual cohorts participants, by adding information of local sources of air pollution (step 4). The results of these studies will allow to investigate the short-term and long-term effects of PM on mortality and morbidity outcomes at the national level, with a focus on areas (rural, sub-urban, industrial) generally neglected because of the lack of monitored data. The study is conducted in collaboration with the Harvard T.H. Chan School of Public Health, US (Prof. Joel Schwartz) and the Ben-Gurion University of Negev, Israel (Prof. Itai Kloog). Stafoggia M. et al. (2017), Estimation of daily PM10 concentrations in Italy (2006-2012) using finely resolved satellite data, land use variables and meteorology, Environ Int. 2017 Feb; 99: 234-244.
R2 = 0.77 PM2.5 = -0.47 + 1.03*Pred.PM2.5
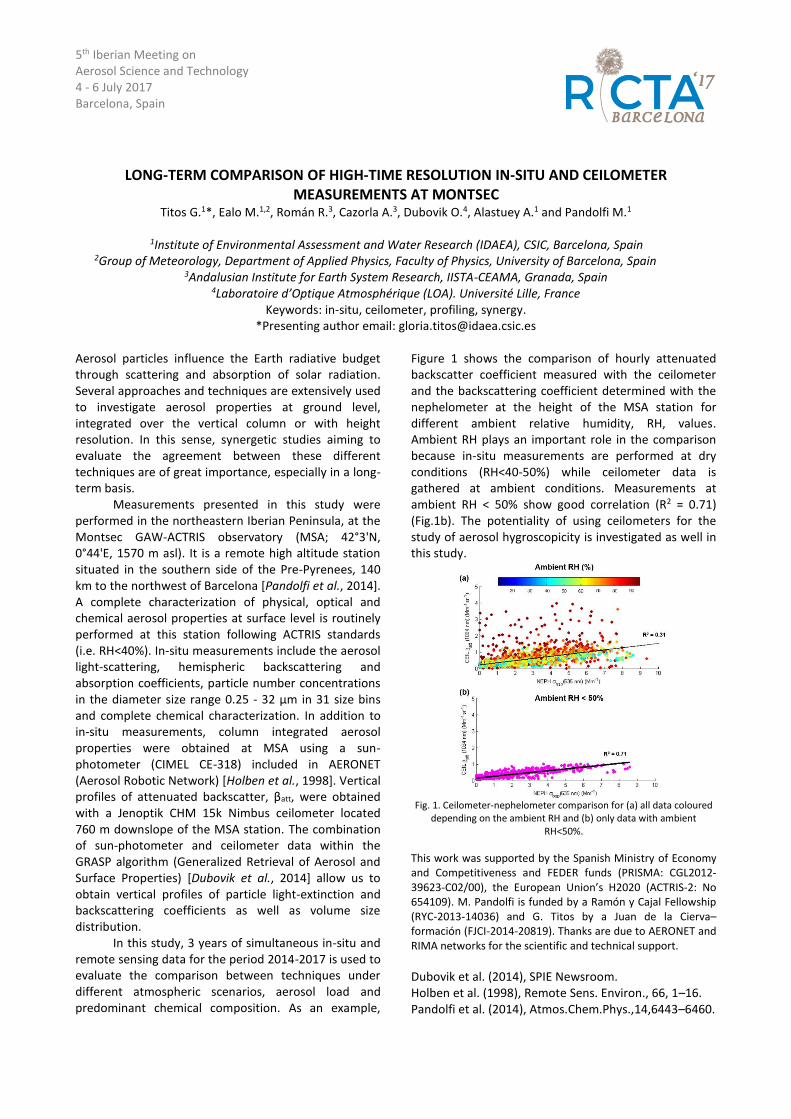
5th Iberian Meeting on Aerosol Science and Technology 4 - 6 July 2017 Barcelona, Spain
LONG-TERM COMPARISON OF HIGH-TIME RESOLUTION IN-SITU AND CEILOMETER MEASUREMENTS AT MONTSEC
Titos G.1*, Ealo M.1,2, Román R.3, Cazorla A.3, Dubovik O.4, Alastuey A.1 and Pandolfi M.1
1Institute of Environmental Assessment and Water Research (IDAEA), CSIC, Barcelona, Spain 2Group of Meteorology, Department of Applied Physics, Faculty of Physics, University of Barcelona, Spain
3Andalusian Institute for Earth System Research, IISTA-CEAMA, Granada, Spain 4Laboratoire d’Optique Atmosphérique (LOA). Université Lille, France
Keywords: in-situ, ceilometer, profiling, synergy. *Presenting author email: [email protected]
Aerosol particles influence the Earth radiative budget through scattering and absorption of solar radiation. Several approaches and techniques are extensively used to investigate aerosol properties at ground level, integrated over the vertical column or with height resolution. In this sense, synergetic studies aiming to evaluate the agreement between these different techniques are of great importance, especially in a long-term basis. Measurements presented in this study were performed in the northeastern Iberian Peninsula, at the Montsec GAW-ACTRIS observatory (MSA; 42°3'N, 0°44'E, 1570 m asl). It is a remote high altitude station situated in the southern side of the Pre-Pyrenees, 140 km to the northwest of Barcelona [Pandolfi et al., 2014]. A complete characterization of physical, optical and chemical aerosol properties at surface level is routinely performed at this station following ACTRIS standards (i.e. RH<40%). In-situ measurements include the aerosol light-scattering, hemispheric backscattering and absorption coefficients, particle number concentrations in the diameter size range 0.25 - 32 µm in 31 size bins and complete chemical characterization. In addition to in-situ measurements, column integrated aerosol properties were obtained at MSA using a sun-photometer (CIMEL CE-318) included in AERONET (Aerosol Robotic Network) [Holben et al., 1998]. Vertical profiles of attenuated backscatter, βatt, were obtained with a Jenoptik CHM 15k Nimbus ceilometer located 760 m downslope of the MSA station. The combination of sun-photometer and ceilometer data within the GRASP algorithm (Generalized Retrieval of Aerosol and Surface Properties) [Dubovik et al., 2014] allow us to obtain vertical profiles of particle light-extinction and backscattering coefficients as well as volume size distribution. In this study, 3 years of simultaneous in-situ and remote sensing data for the period 2014-2017 is used to evaluate the comparison between techniques under different atmospheric scenarios, aerosol load and predominant chemical composition. As an example,
Figure 1 shows the comparison of hourly attenuated backscatter coefficient measured with the ceilometer and the backscattering coefficient determined with the nephelometer at the height of the MSA station for different ambient relative humidity, RH, values. Ambient RH plays an important role in the comparison because in-situ measurements are performed at dry conditions (RH<40-50%) while ceilometer data is gathered at ambient conditions. Measurements at ambient RH < 50% show good correlation (R2 = 0.71) (Fig.1b). The potentiality of using ceilometers for the study of aerosol hygroscopicity is investigated as well in this study.
Fig. 1. Ceilometer-nephelometer comparison for (a) all data coloured
depending on the ambient RH and (b) only data with ambient RH<50%.
This work was supported by the Spanish Ministry of Economy and Competitiveness and FEDER funds (PRISMA: CGL2012-39623-C02/00), the European Union’s H2020 (ACTRIS-2: No 654109). M. Pandolfi is funded by a Ramón y Cajal Fellowship (RYC-2013-14036) and G. Titos by a Juan de la Cierva–formación (FJCI-2014-20819). Thanks are due to AERONET and RIMA networks for the scientific and technical support.
Dubovik et al. (2014), SPIE Newsroom. Holben et al. (1998), Remote Sens. Environ., 66, 1–16. Pandolfi et al. (2014), Atmos.Chem.Phys.,14,6443–6460.
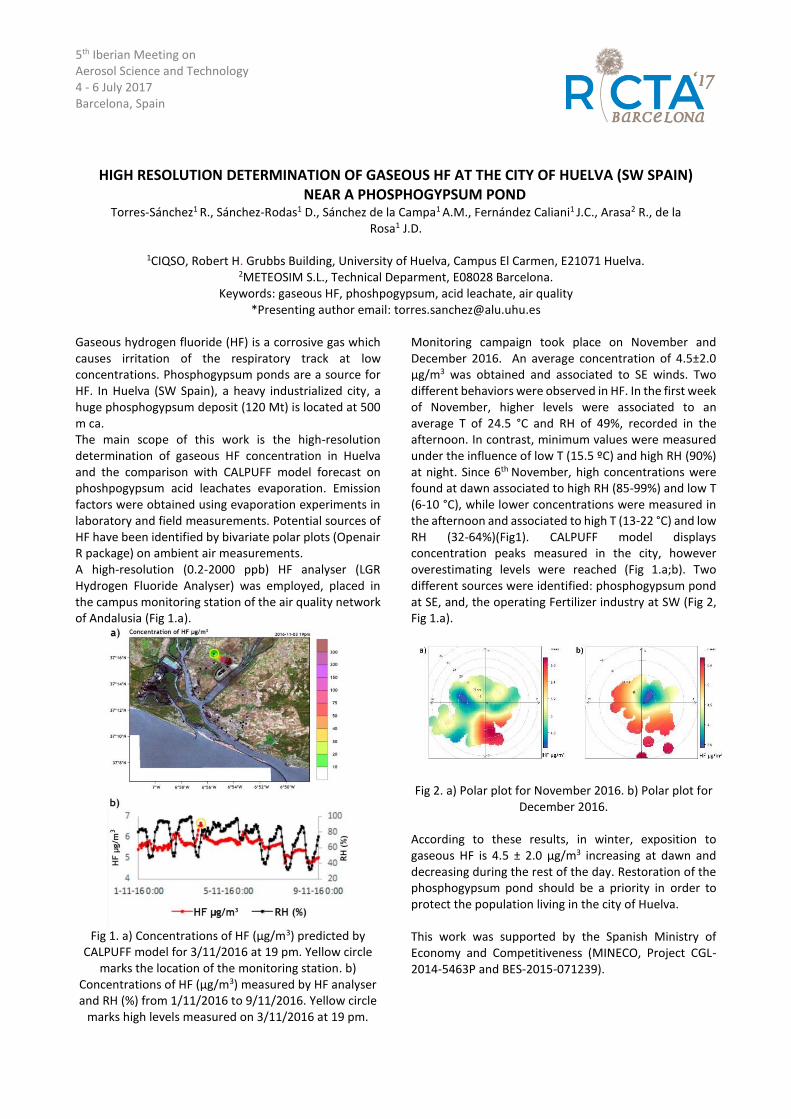
5th Iberian Meeting on Aerosol Science and Technology 4 - 6 July 2017 Barcelona, Spain
HIGH RESOLUTION DETERMINATION OF GASEOUS HF AT THE CITY OF HUELVA (SW SPAIN) NEAR A PHOSPHOGYPSUM POND
Torres-Sánchez1 R., Sánchez-Rodas1 D., Sánchez de la Campa1 A.M., Fernández Caliani1 J.C., Arasa2 R., de la Rosa1 J.D.
1CIQSO, Robert H. Grubbs Building, University of Huelva, Campus El Carmen, E21071 Huelva.
2METEOSIM S.L., Technical Deparment, E08028 Barcelona. Keywords: gaseous HF, phoshpogypsum, acid leachate, air quality
*Presenting author email: [email protected]
Gaseous hydrogen fluoride (HF) is a corrosive gas which causes irritation of the respiratory track at low concentrations. Phosphogypsum ponds are a source for HF. In Huelva (SW Spain), a heavy industrialized city, a huge phosphogypsum deposit (120 Mt) is located at 500 m ca. The main scope of this work is the high-resolution determination of gaseous HF concentration in Huelva and the comparison with CALPUFF model forecast on phoshpogypsum acid leachates evaporation. Emission factors were obtained using evaporation experiments in laboratory and field measurements. Potential sources of HF have been identified by bivariate polar plots (Openair R package) on ambient air measurements. A high-resolution (0.2-2000 ppb) HF analyser (LGR Hydrogen Fluoride Analyser) was employed, placed in the campus monitoring station of the air quality network of Andalusia (Fig 1.a).
Fig 1. a) Concentrations of HF (µg/m3) predicted by
CALPUFF model for 3/11/2016 at 19 pm. Yellow circle marks the location of the monitoring station. b)
Concentrations of HF (µg/m3) measured by HF analyser and RH (%) from 1/11/2016 to 9/11/2016. Yellow circle
marks high levels measured on 3/11/2016 at 19 pm.
Monitoring campaign took place on November and December 2016. An average concentration of 4.5±2.0 µg/m3 was obtained and associated to SE winds. Two different behaviors were observed in HF. In the first week of November, higher levels were associated to an average T of 24.5 °C and RH of 49%, recorded in the afternoon. In contrast, minimum values were measured under the influence of low T (15.5 ºC) and high RH (90%) at night. Since 6th November, high concentrations were found at dawn associated to high RH (85-99%) and low T (6-10 °C), while lower concentrations were measured in the afternoon and associated to high T (13-22 °C) and low RH (32-64%)(Fig1). CALPUFF model displays concentration peaks measured in the city, however overestimating levels were reached (Fig 1.a;b). Two different sources were identified: phosphogypsum pond at SE, and, the operating Fertilizer industry at SW (Fig 2, Fig 1.a).
Fig 2. a) Polar plot for November 2016. b) Polar plot for
December 2016. According to these results, in winter, exposition to gaseous HF is 4.5 ± 2.0 µg/m3 increasing at dawn and decreasing during the rest of the day. Restoration of the phosphogypsum pond should be a priority in order to protect the population living in the city of Huelva. This work was supported by the Spanish Ministry of Economy and Competitiveness (MINECO, Project CGL-2014-5463P and BES-2015-071239).
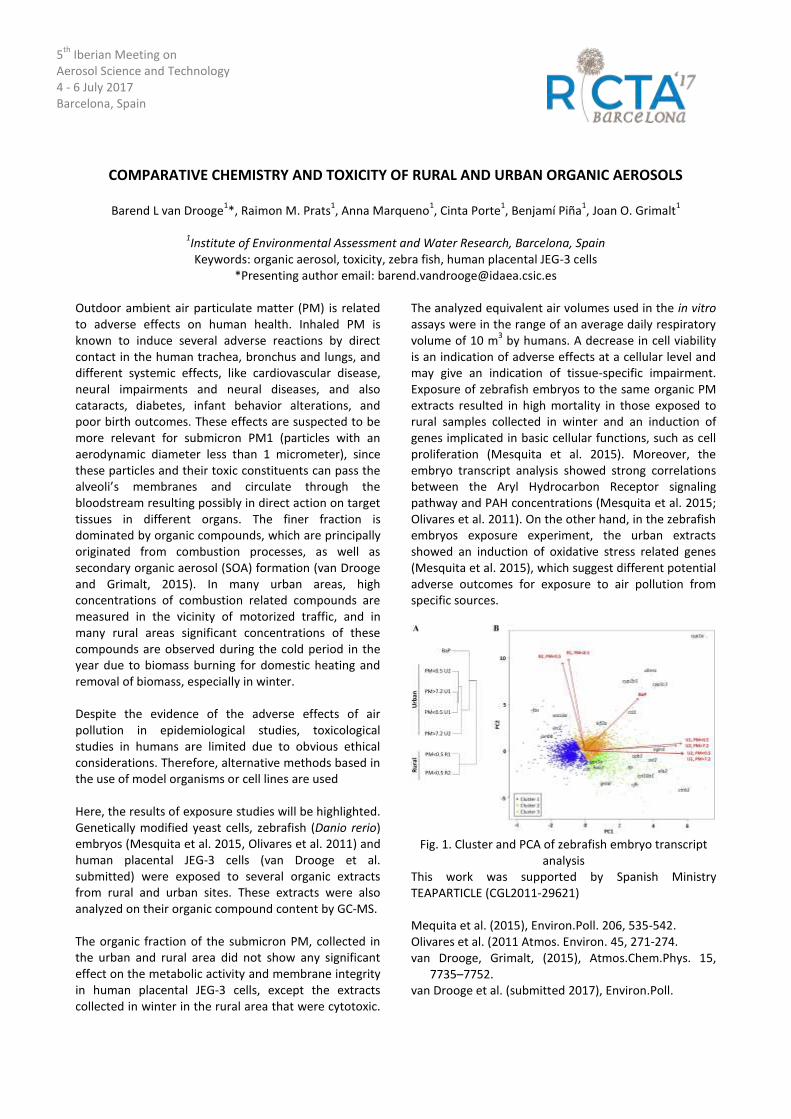
5th
Iberian Meeting on Aerosol Science and Technology 4 - 6 July 2017 Barcelona, Spain
COMPARATIVE CHEMISTRY AND TOXICITY OF RURAL AND URBAN ORGANIC AEROSOLS
Barend L van Drooge1*, Raimon M. Prats
1, Anna Marqueno
1, Cinta Porte
1, Benjamí Piña
1, Joan O. Grimalt
1
1Institute of Environmental Assessment and Water Research, Barcelona, Spain Keywords: organic aerosol, toxicity, zebra fish, human placental JEG-3 cells
*Presenting author email: [email protected] Outdoor ambient air particulate matter (PM) is related to adverse effects on human health. Inhaled PM is known to induce several adverse reactions by direct contact in the human trachea, bronchus and lungs, and different systemic effects, like cardiovascular disease, neural impairments and neural diseases, and also cataracts, diabetes, infant behavior alterations, and poor birth outcomes. These effects are suspected to be more relevant for submicron PM1 (particles with an aerodynamic diameter less than 1 micrometer), since these particles and their toxic constituents can pass the alveoli’s membranes and circulate through the bloodstream resulting possibly in direct action on target tissues in different organs. The finer fraction is dominated by organic compounds, which are principally originated from combustion processes, as well as secondary organic aerosol (SOA) formation (van Drooge and Grimalt, 2015). In many urban areas, high concentrations of combustion related compounds are measured in the vicinity of motorized traffic, and in many rural areas significant concentrations of these compounds are observed during the cold period in the year due to biomass burning for domestic heating and removal of biomass, especially in winter. Despite the evidence of the adverse effects of air pollution in epidemiological studies, toxicological studies in humans are limited due to obvious ethical considerations. Therefore, alternative methods based in the use of model organisms or cell lines are used Here, the results of exposure studies will be highlighted. Genetically modified yeast cells, zebrafish (Danio rerio) embryos (Mesquita et al. 2015, Olivares et al. 2011) and human placental JEG-3 cells (van Drooge et al. submitted) were exposed to several organic extracts from rural and urban sites. These extracts were also analyzed on their organic compound content by GC-MS. The organic fraction of the submicron PM, collected in the urban and rural area did not show any significant effect on the metabolic activity and membrane integrity in human placental JEG-3 cells, except the extracts collected in winter in the rural area that were cytotoxic.
The analyzed equivalent air volumes used in the in vitro assays were in the range of an average daily respiratory volume of 10 m
3 by humans. A decrease in cell viability
is an indication of adverse effects at a cellular level and may give an indication of tissue-specific impairment. Exposure of zebrafish embryos to the same organic PM extracts resulted in high mortality in those exposed to rural samples collected in winter and an induction of genes implicated in basic cellular functions, such as cell proliferation (Mesquita et al. 2015). Moreover, the embryo transcript analysis showed strong correlations between the Aryl Hydrocarbon Receptor signaling pathway and PAH concentrations (Mesquita et al. 2015; Olivares et al. 2011). On the other hand, in the zebrafish embryos exposure experiment, the urban extracts showed an induction of oxidative stress related genes (Mesquita et al. 2015), which suggest different potential adverse outcomes for exposure to air pollution from specific sources.
Fig. 1. Cluster and PCA of zebrafish embryo transcript
analysis This work was supported by Spanish Ministry TEAPARTICLE (CGL2011-29621) Mequita et al. (2015), Environ.Poll. 206, 535-542. Olivares et al. (2011 Atmos. Environ. 45, 271-274. van Drooge, Grimalt, (2015), Atmos.Chem.Phys. 15,
7735–7752. van Drooge et al. (submitted 2017), Environ.Poll.
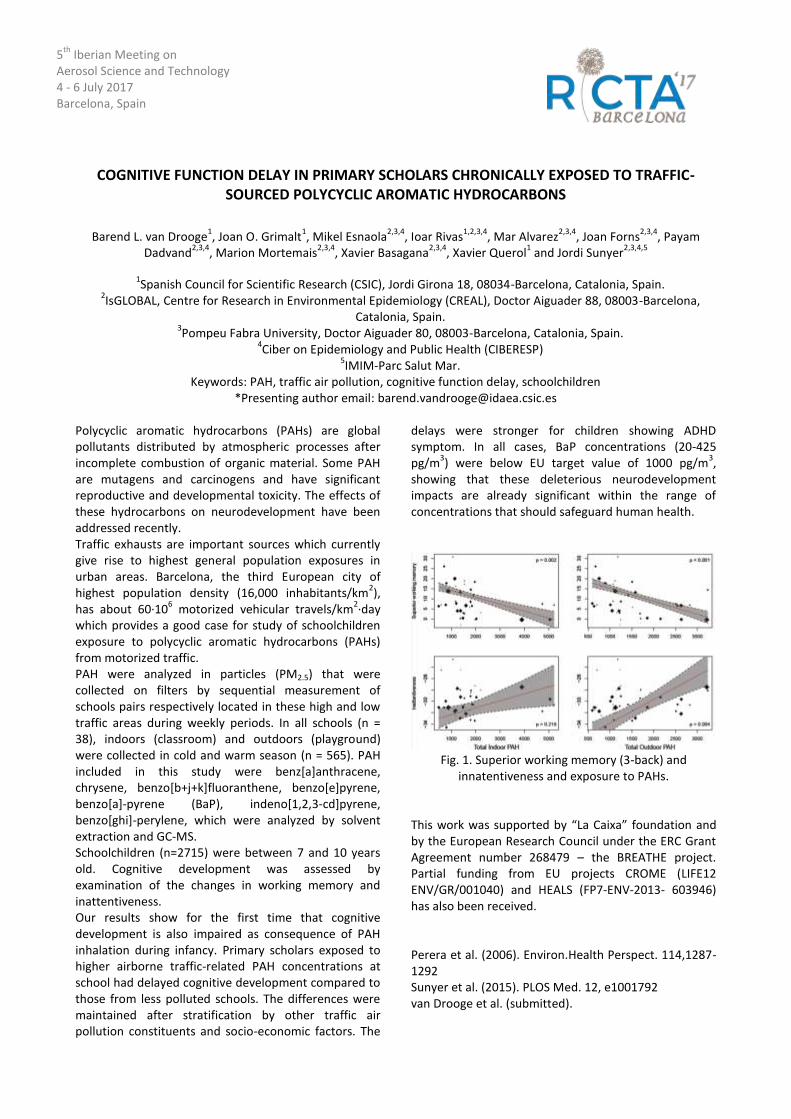
5th
Iberian Meeting on Aerosol Science and Technology 4 - 6 July 2017 Barcelona, Spain
COGNITIVE FUNCTION DELAY IN PRIMARY SCHOLARS CHRONICALLY EXPOSED TO TRAFFIC-SOURCED POLYCYCLIC AROMATIC HYDROCARBONS
Barend L. van Drooge1, Joan O. Grimalt
1, Mikel Esnaola
2,3,4, Ioar Rivas
1,2,3,4, Mar Alvarez
2,3,4, Joan Forns
2,3,4, Payam
Dadvand2,3,4
, Marion Mortemais2,3,4
, Xavier Basagana2,3,4
, Xavier Querol1 and Jordi Sunyer
2,3,4,5
1Spanish Council for Scientific Research (CSIC), Jordi Girona 18, 08034-Barcelona, Catalonia, Spain.
2IsGLOBAL, Centre for Research in Environmental Epidemiology (CREAL), Doctor Aiguader 88, 08003-Barcelona,
Catalonia, Spain. 3Pompeu Fabra University, Doctor Aiguader 80, 08003-Barcelona, Catalonia, Spain.
4Ciber on Epidemiology and Public Health (CIBERESP)
5IMIM-Parc Salut Mar.
Keywords: PAH, traffic air pollution, cognitive function delay, schoolchildren *Presenting author email: [email protected]
Polycyclic aromatic hydrocarbons (PAHs) are global pollutants distributed by atmospheric processes
after
incomplete combustion of organic material. Some PAH are mutagens and carcinogens and have significant reproductive and developmental toxicity. The effects of these hydrocarbons on neurodevelopment have been addressed recently. Traffic exhausts are important sources which currently give rise to highest general population exposures in urban areas. Barcelona, the third European city of highest population density (16,000 inhabitants/km
2),
has about 60·106 motorized vehicular travels/km
2·day
which provides a good case for study of schoolchildren exposure to polycyclic aromatic hydrocarbons (PAHs) from motorized traffic. PAH were analyzed in particles (PM2.5) that were collected on filters by sequential measurement of schools pairs respectively located in these high and low traffic areas during weekly periods. In all schools (n = 38), indoors (classroom) and outdoors (playground) were collected in cold and warm season (n = 565). PAH included in this study were benz[a]anthracene, chrysene, benzo[b+j+k]fluoranthene, benzo[e]pyrene, benzo[a]-pyrene (BaP), indeno[1,2,3-cd]pyrene, benzo[ghi]-perylene, which were analyzed by solvent extraction and GC-MS. Schoolchildren (n=2715) were between 7 and 10 years old. Cognitive development was assessed by examination of the changes in working memory and inattentiveness. Our results show for the first time that cognitive development is also impaired as consequence of PAH inhalation during infancy. Primary scholars exposed to higher airborne traffic-related PAH concentrations at school had delayed cognitive development compared to those from less polluted schools. The differences were maintained after stratification by other traffic air pollution constituents and socio-economic factors. The
delays were stronger for children showing ADHD symptom. In all cases, BaP concentrations (20-425 pg/m
3) were below EU target value of 1000 pg/m
3,
showing that these deleterious neurodevelopment impacts are already significant within the range of concentrations that should safeguard human health.
Fig. 1. Superior working memory (3-back) and
innatentiveness and exposure to PAHs.
This work was supported by “La Caixa” foundation and by the European Research Council under the ERC Grant Agreement number 268479 – the BREATHE project. Partial funding from EU projects CROME (LIFE12 ENV/GR/001040) and HEALS (FP7-ENV-2013- 603946) has also been received. Perera et al. (2006). Environ.Health Perspect. 114,1287-1292 Sunyer et al. (2015). PLOS Med. 12, e1001792 van Drooge et al. (submitted).
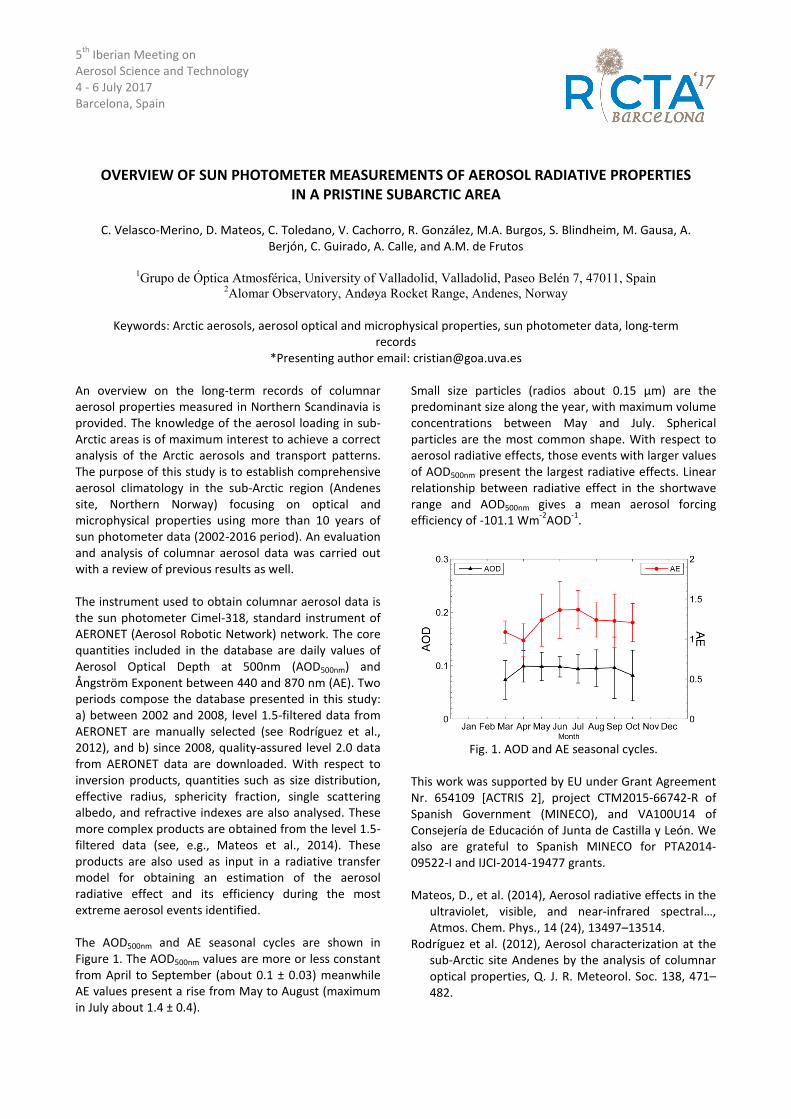
5th Iberian Meeting on Aerosol Science and Technology 4 - 6 July 2017 Barcelona, Spain
OVERVIEW OF SUN PHOTOMETER MEASUREMENTS OF AEROSOL RADIATIVE PROPERTIES
IN A PRISTINE SUBARCTIC AREA
C. Velasco-Merino, D. Mateos, C. Toledano, V. Cachorro, R. González, M.A. Burgos, S. Blindheim, M. Gausa, A. Berjón, C. Guirado, A. Calle, and A.M. de Frutos
1Grupo de Óptica Atmosférica, University of Valladolid, Valladolid, Paseo Belén 7, 47011, Spain
2Alomar Observatory, Andøya Rocket Range, Andenes, Norway
Keywords: Arctic aerosols, aerosol optical and microphysical properties, sun photometer data, long-term records
*Presenting author email: [email protected]
An overview on the long-term records of columnar aerosol properties measured in Northern Scandinavia is provided. The knowledge of the aerosol loading in sub-Arctic areas is of maximum interest to achieve a correct analysis of the Arctic aerosols and transport patterns. The purpose of this study is to establish comprehensive aerosol climatology in the sub-Arctic region (Andenes site, Northern Norway) focusing on optical and microphysical properties using more than 10 years of sun photometer data (2002-2016 period). An evaluation and analysis of columnar aerosol data was carried out with a review of previous results as well. The instrument used to obtain columnar aerosol data is the sun photometer Cimel-318, standard instrument of AERONET (Aerosol Robotic Network) network. The core quantities included in the database are daily values of Aerosol Optical Depth at 500nm (AOD500nm) and Ångström Exponent between 440 and 870 nm (AE). Two periods compose the database presented in this study: a) between 2002 and 2008, level 1.5-filtered data from AERONET are manually selected (see Rodríguez et al., 2012), and b) since 2008, quality-assured level 2.0 data from AERONET data are downloaded. With respect to inversion products, quantities such as size distribution, effective radius, sphericity fraction, single scattering albedo, and refractive indexes are also analysed. These more complex products are obtained from the level 1.5-filtered data (see, e.g., Mateos et al., 2014). These products are also used as input in a radiative transfer model for obtaining an estimation of the aerosol radiative effect and its efficiency during the most extreme aerosol events identified. The AOD500nm and AE seasonal cycles are shown in Figure 1. The AOD500nm values are more or less constant from April to September (about 0.1 ± 0.03) meanwhile AE values present a rise from May to August (maximum in July about 1.4 ± 0.4).
Small size particles (radios about 0.15 µm) are the predominant size along the year, with maximum volume concentrations between May and July. Spherical particles are the most common shape. With respect to aerosol radiative effects, those events with larger values of AOD500nm present the largest radiative effects. Linear relationship between radiative effect in the shortwave range and AOD500nm gives a mean aerosol forcing efficiency of -101.1 Wm-2AOD-1.
Fig. 1. AOD and AE seasonal cycles.
This work was supported by EU under Grant Agreement Nr. 654109 [ACTRIS 2], project CTM2015-66742-R of Spanish Government (MINECO), and VA100U14 of Consejería de Educación of Junta de Castilla y León. We also are grateful to Spanish MINECO for PTA2014-09522-I and IJCI-2014-19477 grants. Mateos, D., et al. (2014), Aerosol radiative effects in the
ultraviolet, visible, and near-infrared spectral…, Atmos. Chem. Phys., 14 (24), 13497–13514.
Rodríguez et al. (2012), Aerosol characterization at the sub-Arctic site Andenes by the analysis of columnar optical properties, Q. J. R. Meteorol. Soc. 138, 471–482.
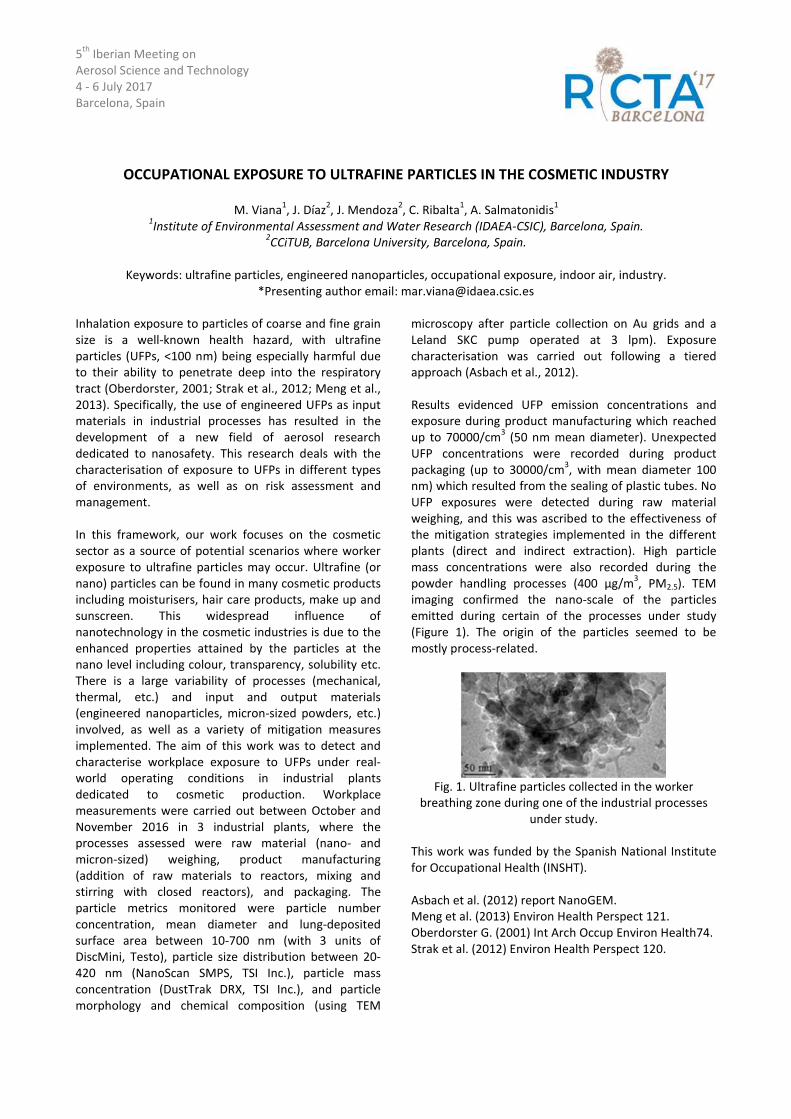
5th
Iberian Meeting on Aerosol Science and Technology 4 - 6 July 2017 Barcelona, Spain
OCCUPATIONAL EXPOSURE TO ULTRAFINE PARTICLES IN THE COSMETIC INDUSTRY
M. Viana1, J. Díaz
2, J. Mendoza
2, C. Ribalta
1, A. Salmatonidis
1
1Institute of Environmental Assessment and Water Research (IDAEA-CSIC), Barcelona, Spain.
2CCiTUB, Barcelona University, Barcelona, Spain.
Keywords: ultrafine particles, engineered nanoparticles, occupational exposure, indoor air, industry.
*Presenting author email: [email protected]
Inhalation exposure to particles of coarse and fine grain size is a well-known health hazard, with ultrafine particles (UFPs, <100 nm) being especially harmful due to their ability to penetrate deep into the respiratory tract (Oberdorster, 2001; Strak et al., 2012; Meng et al., 2013). Specifically, the use of engineered UFPs as input materials in industrial processes has resulted in the development of a new field of aerosol research dedicated to nanosafety. This research deals with the characterisation of exposure to UFPs in different types of environments, as well as on risk assessment and management. In this framework, our work focuses on the cosmetic sector as a source of potential scenarios where worker exposure to ultrafine particles may occur. Ultrafine (or nano) particles can be found in many cosmetic products including moisturisers, hair care products, make up and sunscreen. This widespread influence of nanotechnology in the cosmetic industries is due to the enhanced properties attained by the particles at the nano level including colour, transparency, solubility etc. There is a large variability of processes (mechanical, thermal, etc.) and input and output materials (engineered nanoparticles, micron-sized powders, etc.) involved, as well as a variety of mitigation measures implemented. The aim of this work was to detect and characterise workplace exposure to UFPs under real-world operating conditions in industrial plants dedicated to cosmetic production. Workplace measurements were carried out between October and November 2016 in 3 industrial plants, where the processes assessed were raw material (nano- and micron-sized) weighing, product manufacturing (addition of raw materials to reactors, mixing and stirring with closed reactors), and packaging. The particle metrics monitored were particle number concentration, mean diameter and lung-deposited surface area between 10-700 nm (with 3 units of DiscMini, Testo), particle size distribution between 20-420 nm (NanoScan SMPS, TSI Inc.), particle mass concentration (DustTrak DRX, TSI Inc.), and particle morphology and chemical composition (using TEM
microscopy after particle collection on Au grids and a Leland SKC pump operated at 3 lpm). Exposure characterisation was carried out following a tiered approach (Asbach et al., 2012). Results evidenced UFP emission concentrations and exposure during product manufacturing which reached up to 70000/cm
3 (50 nm mean diameter). Unexpected
UFP concentrations were recorded during product packaging (up to 30000/cm
3, with mean diameter 100
nm) which resulted from the sealing of plastic tubes. No UFP exposures were detected during raw material weighing, and this was ascribed to the effectiveness of the mitigation strategies implemented in the different plants (direct and indirect extraction). High particle mass concentrations were also recorded during the powder handling processes (400 µg/m
3, PM2.5). TEM
imaging confirmed the nano-scale of the particles emitted during certain of the processes under study (Figure 1). The origin of the particles seemed to be mostly process-related.
Fig. 1. Ultrafine particles collected in the worker
breathing zone during one of the industrial processes under study.
This work was funded by the Spanish National Institute for Occupational Health (INSHT). Asbach et al. (2012) report NanoGEM. Meng et al. (2013) Environ Health Perspect 121. Oberdorster G. (2001) Int Arch Occup Environ Health74. Strak et al. (2012) Environ Health Perspect 120.
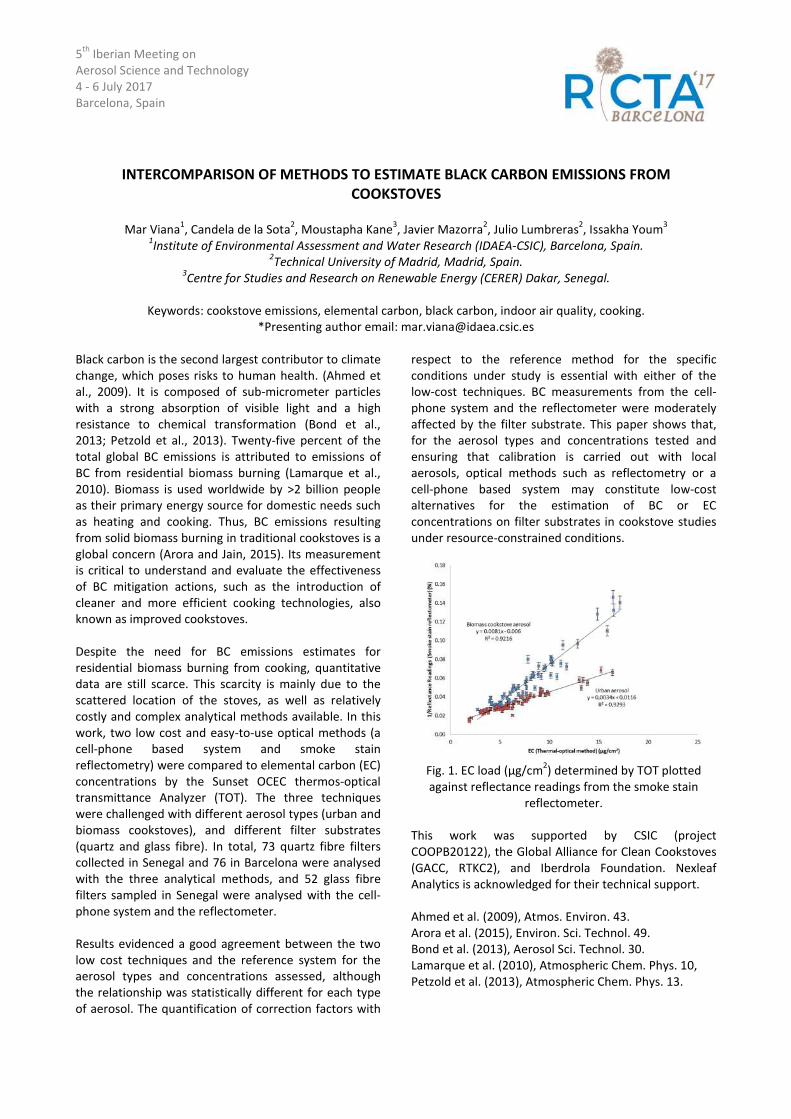
5th
Iberian Meeting on Aerosol Science and Technology 4 - 6 July 2017 Barcelona, Spain
INTERCOMPARISON OF METHODS TO ESTIMATE BLACK CARBON EMISSIONS FROM COOKSTOVES
Mar Viana
1, Candela de la Sota
2, Moustapha Kane
3, Javier Mazorra
2, Julio Lumbreras
2, Issakha Youm
3
1Institute of Environmental Assessment and Water Research (IDAEA-CSIC), Barcelona, Spain.
2Technical University of Madrid, Madrid, Spain.
3Centre for Studies and Research on Renewable Energy (CERER) Dakar, Senegal.
Keywords: cookstove emissions, elemental carbon, black carbon, indoor air quality, cooking.
*Presenting author email: [email protected]
Black carbon is the second largest contributor to climate change, which poses risks to human health. (Ahmed et al., 2009). It is composed of sub-micrometer particles with a strong absorption of visible light and a high resistance to chemical transformation (Bond et al., 2013; Petzold et al., 2013). Twenty-five percent of the total global BC emissions is attributed to emissions of BC from residential biomass burning (Lamarque et al., 2010). Biomass is used worldwide by >2 billion people as their primary energy source for domestic needs such as heating and cooking. Thus, BC emissions resulting from solid biomass burning in traditional cookstoves is a global concern (Arora and Jain, 2015). Its measurement is critical to understand and evaluate the effectiveness of BC mitigation actions, such as the introduction of cleaner and more efficient cooking technologies, also known as improved cookstoves. Despite the need for BC emissions estimates for residential biomass burning from cooking, quantitative data are still scarce. This scarcity is mainly due to the scattered location of the stoves, as well as relatively costly and complex analytical methods available. In this work, two low cost and easy-to-use optical methods (a cell-phone based system and smoke stain reflectometry) were compared to elemental carbon (EC) concentrations by the Sunset OCEC thermos-optical transmittance Analyzer (TOT). The three techniques were challenged with different aerosol types (urban and biomass cookstoves), and different filter substrates (quartz and glass fibre). In total, 73 quartz fibre filters collected in Senegal and 76 in Barcelona were analysed with the three analytical methods, and 52 glass fibre filters sampled in Senegal were analysed with the cell-phone system and the reflectometer. Results evidenced a good agreement between the two low cost techniques and the reference system for the aerosol types and concentrations assessed, although the relationship was statistically different for each type of aerosol. The quantification of correction factors with
respect to the reference method for the specific conditions under study is essential with either of the low-cost techniques. BC measurements from the cell-phone system and the reflectometer were moderately affected by the filter substrate. This paper shows that, for the aerosol types and concentrations tested and ensuring that calibration is carried out with local aerosols, optical methods such as reflectometry or a cell-phone based system may constitute low-cost alternatives for the estimation of BC or EC concentrations on filter substrates in cookstove studies under resource-constrained conditions.
Fig. 1. EC load (µg/cm
2) determined by TOT plotted
against reflectance readings from the smoke stain reflectometer.
This work was supported by CSIC (project COOPB20122), the Global Alliance for Clean Cookstoves (GACC, RTKC2), and Iberdrola Foundation. Nexleaf Analytics is acknowledged for their technical support. Ahmed et al. (2009), Atmos. Environ. 43. Arora et al. (2015), Environ. Sci. Technol. 49. Bond et al. (2013), Aerosol Sci. Technol. 30. Lamarque et al. (2010), Atmospheric Chem. Phys. 10, Petzold et al. (2013), Atmospheric Chem. Phys. 13.
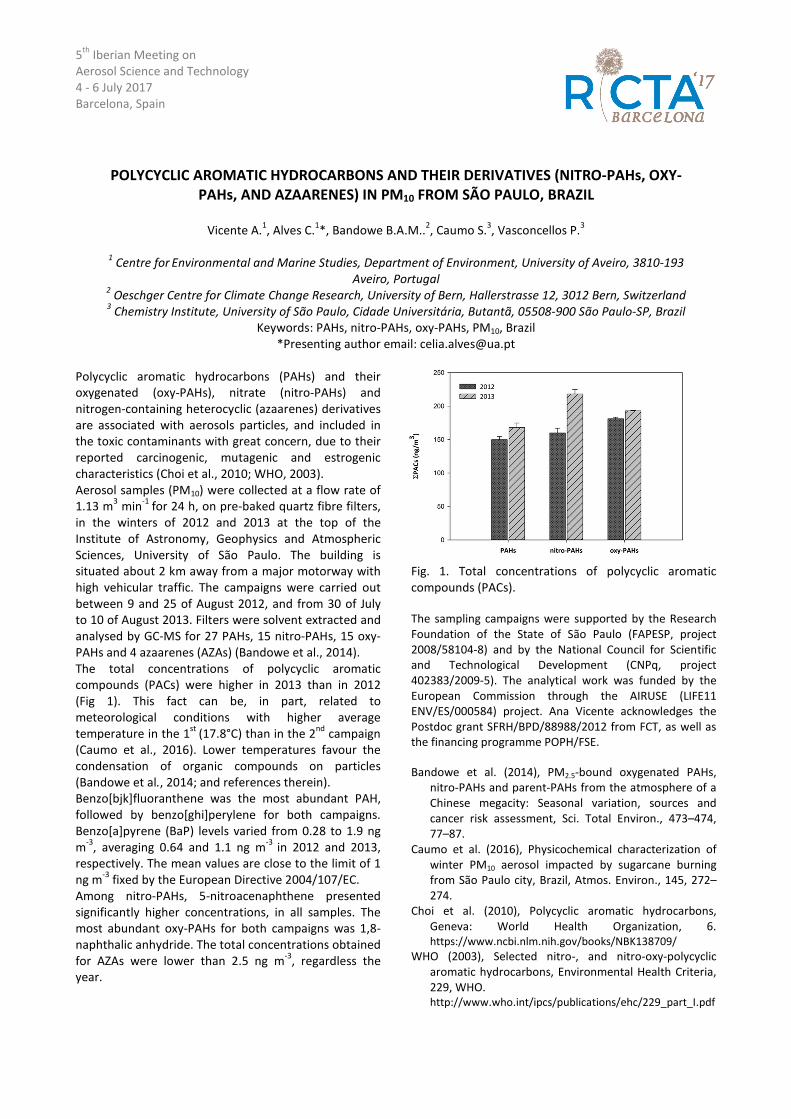
5th
Iberian Meeting on
Aerosol Science and Technology
4 - 6 July 2017
Barcelona, Spain
POLYCYCLIC AROMATIC HYDROCARBONS AND THEIR DERIVATIVES (NITRO-PAHs, OXY-PAHs, AND AZAARENES) IN PM10 FROM SÃO PAULO, BRAZIL
Vicente A.1, Alves C.
1*, Bandowe B.A.M..
2, Caumo S.
3, Vasconcellos P.
3
1 Centre for
Environmental and Marine Studies, Department of Environment, University of Aveiro, 3810-193
Aveiro, Portugal 2 Oeschger Centre for Climate Change Research, University of Bern, Hallerstrasse 12, 3012 Bern, Switzerland
3 Chemistry Institute, University of São Paulo, Cidade Universitária, Butantã, 05508-900 São Paulo-SP, Brazil
Keywords: PAHs, nitro-PAHs, oxy-PAHs, PM10, Brazil
*Presenting author email: [email protected]
Polycyclic aromatic hydrocarbons (PAHs) and their
oxygenated (oxy-PAHs), nitrate (nitro-PAHs) and
nitrogen-containing heterocyclic (azaarenes) derivatives
are associated with aerosols particles, and included in
the toxic contaminants with great concern, due to their
reported carcinogenic, mutagenic and estrogenic
characteristics (Choi et al., 2010; WHO, 2003).
Aerosol samples (PM10) were collected at a flow rate of
1.13 m3 min
-1 for 24 h, on pre-baked quartz fibre filters,
in the winters of 2012 and 2013 at the top of the
Institute of Astronomy, Geophysics and Atmospheric
Sciences, University of São Paulo. The building is
situated about 2 km away from a major motorway with
high vehicular traffic. The campaigns were carried out
between 9 and 25 of August 2012, and from 30 of July
to 10 of August 2013. Filters were solvent extracted and
analysed by GC-MS for 27 PAHs, 15 nitro-PAHs, 15 oxy-
PAHs and 4 azaarenes (AZAs) (Bandowe et al., 2014).
The total concentrations of polycyclic aromatic
compounds (PACs) were higher in 2013 than in 2012
(Fig 1). This fact can be, in part, related to
meteorological conditions with higher average
temperature in the 1st
(17.8°C) than in the 2nd
campaign
(Caumo et al., 2016). Lower temperatures favour the
condensation of organic compounds on particles
(Bandowe et al., 2014; and references therein).
Benzo[bjk]fluoranthene was the most abundant PAH,
followed by benzo[ghi]perylene for both campaigns.
Benzo[a]pyrene (BaP) levels varied from 0.28 to 1.9 ng
m-3
, averaging 0.64 and 1.1 ng m-3
in 2012 and 2013,
respectively. The mean values are close to the limit of 1
ng m-3
fixed by the European Directive 2004/107/EC.
Among nitro-PAHs, 5-nitroacenaphthene presented
significantly higher concentrations, in all samples. The
most abundant oxy-PAHs for both campaigns was 1,8-
naphthalic anhydride. The total concentrations obtained
for AZAs were lower than 2.5 ng m-3
, regardless the
year.
Fig. 1. Total concentrations of polycyclic aromatic
compounds (PACs).
The sampling campaigns were supported by the Research
Foundation of the State of São Paulo (FAPESP, project
2008/58104-8) and by the National Council for Scientific
and Technological Development (CNPq, project
402383/2009-5). The analytical work was funded by the
European Commission through the AIRUSE (LIFE11
ENV/ES/000584) project. Ana Vicente acknowledges the
Postdoc grant SFRH/BPD/88988/2012 from FCT, as well as
the financing programme POPH/FSE.
Bandowe et al. (2014), PM2.5-bound oxygenated PAHs,
nitro-PAHs and parent-PAHs from the atmosphere of a
Chinese megacity: Seasonal variation, sources and
cancer risk assessment, Sci. Total Environ., 473–474,
77–87.
Caumo et al. (2016), Physicochemical characterization of
winter PM10 aerosol impacted by sugarcane burning
from São Paulo city, Brazil, Atmos. Environ., 145, 272–
274.
Choi et al. (2010), Polycyclic aromatic hydrocarbons,
Geneva: World Health Organization, 6.
https://www.ncbi.nlm.nih.gov/books/NBK138709/
WHO (2003), Selected nitro-, and nitro-oxy-polycyclic
aromatic hydrocarbons, Environmental Health Criteria,
229, WHO.
http://www.who.int/ipcs/publications/ehc/229_part_I.pdf
5th
Iberian Meeting on
Aerosol Science and Technology
4 - 6 July 2017
Barcelona, Spain
IMPACT OF WOOD COMBUSTION ON INDOOR AIR QUALITY
Vicente E., Vicente A. M., Alves C.*
Centre for Environmental and Marine Studies, Department of Environment, University of Aveiro, 3810-193
Aveiro, Portugal
Keywords: Indoor air quality, OC/EC, Particulate matter, Residential biomass combustion.
*Presenting author email: [email protected]
Biomass burning appliances have regained popularity
over the past years due, at least in part, to the recent
economic crises and the climate change policies
(Sigsgaard et al., 2015). In Europe, biomass burning for
residential heating is recognised as an important source
of particulate matter outdoors (e.g. Amato et al., 2016).
However, the contribution of this pollution source to
the indoor air pollution may be even higher. This study
aimed to evaluate the impact of wood burning
appliances on indoor pollutant concentrations.
Two uninhabited houses in a small Portuguese village,
one with a brick open fireplace and the other equipped
with a cast iron woodstove, were selected. During the
monitoring campaign, only the wood burning devices
were operated and no other domestic activities took
place. To mimic the common practice of residential
combustion appliances in rural residents’ daily lives,
wood logs were added to the combustion chamber at
intervals and the bed of charcoal and wood was
periodically stirred. To start the combustion cycle, pre
weighed split pine wood logs, eucalypt logs and two
pine cones were inserted into the stove chamber and
ignited. The combustion appliances were operated for 7
to 8 hours and were refueled when only a hot bed of
charcoal remained in the combustion chamber. The
sampling campaign took place between 1st
and 5th
of
January 2017 in the house with a fireplace. To evaluate
the effect of a woodstove on the indoor air quality, the
sampling campaign was carried out between 31st
January and 03rd
February 2017. Temperature, relative
humidity, CO2, CO were continuously monitored with
indoor air quality probes inside (TSI, model 7545) and
outside (Gray Wolf®, WolfSense IQ-610) the houses.
Real-time laser photometric instruments (TSI, DustTrak
DRX 8533) were used to record particulate matter
variations over time in the indoor and outdoor
environments, simultaneously. All the continuous
monitoring instruments were operated with 1-min
resolution. Simultaneous sampling with two PM10 high
volume air MCV (model CAV-A/mb) instruments for
gravimetric quantification was carried out. The
equipment was operated at a flow of 30 m3 h
−1. Samples
were collected during the wood burning period,
simultaneously indoors and outdoors. These samplers
and other monitors were placed in the middle of the
room at a height of about 1.5 m. The PM10 samples for
gravimetric and chemical analyses were collected on
150 mm diameter quartz fibre filters (Pallflex®). The
gravimetric quantification was performed with a
microbalance (model AG245, Mettler Toledo). After
gravimetric determinations, thermal-optical analysis of
PM10 filters was performed to obtain the carbonaceous
content. Water-soluble ions were analysed by ion
chromatography. Organic compounds were solvent
extracted and analysed by gas chromatography-mass
spectrometry (GC-MS).
During the fireplace experiments, the particulate
emissions showed an evolution in accordance with the
combustion stages. PM10 concentrations indoors highly
exceeded the protection limit of 50 µg.m-3
. Moreover,
during the burning period, the PM10 concentrations
were observed to be higher indoors than outdoors.
When using the woodstove, refueling represented the
main source of indoor pollutants. Opening the
woodstove door to put in a batch of fuel allows the
pollutants to be released into the room. Meteorological
conditions may also play an important role in indoor air
quality. During the woodstove experiments, it was also
observed an increase in the particle concentration when
compared to the background measurements without
operation of the combustion appliance. However, the
concentrations were much lower than the ones
recorded for the open fireplace. Even though, during
some periods, it was possible to observe concentrations
above the protection limit.
Thanks are given to the Portuguese Foundation of
Science and Technology for funding the scholarships
SFRH/BPD/88988/2012 and SFRH/BD/117993/2016.
Amato et al. (2016), AIRUSE-LIFE+: A harmonized PM
speciation and source apportionment in five
southern European cities, Atmos. Chem. Phys. 16.
Sigsgaard et al. (2015), Health impacts of anthropogenic
biomass burning in the developed world, Eur. Respir.
J. 46.
5th
Iberian Meeting on
Aerosol Science and Technology
4 - 6 July 2017
Barcelona, Spain
PARTICULATE-BOND ORGANIC COMPOUNDS FROM CHARCOAL BURNING IN BARBECUE
GRILLS
Vicente E.D.1, Vicente A. M.
1, Evtyugina M.
1, Carvalho R.L.
1,2, Alves C.*
1
1Centre for Environmental and Marine Studies, Department of Environment, University of Aveiro, 3810-193
Aveiro, Portugal 2Thermochemical Energy Conversion Laboratory, Department of Applied Physics and Electronics, Sweden, 901
87, Umeå, Sweden
Keywords: Barbecue grill, Charcoal, Organic compounds, PM2.5
*Presenting author email: [email protected]
The proportion of persons relying on solid fuels as their
primary fuel for cooking has decreased between 1980
and 2010 and nowadays this practice is most prevalent
in Africa and Southeast Asia (Bonjour et al., 2013).
However, charbroiling and grilling food is very common
and popular worldwide. In Portugal, charcoal
combustion is widely used in barbecue grills. The aim of
this study was to characterise the PM2.5 emissions from
charcoal combustion in a typical Portuguese barbecue
grill. The chemical speciation of the organic component
can help to estimate the contribution of charcoal
combustion sources to the atmospheric PM levels and
to understand their impact on the air quality.
A laboratory facility replicating the traditional
Portuguese charcoal barbecue grills was used. These
have side and back walls built of refractory brick and a
chimney hood. A device consisting of a charcoal ash tray
and grid and a grill in zincked iron is also included. The
vegetal charcoal used in the burning experiments was
purchased from a local supplier. The tests were initiated
by lightning small pieces of wood on the top of the
batch of charcoal. A total of four cold start tests were
conducted. The experiments were made with batches of
1 kg of fuel and lasted approximately 1.5 to 2 hours.
PM2.5 sampling was carried out in a dilution tunnel
connected to the flue gas stack, under isokinetic
conditions, with a TCR TECORA (model 2.004.01)
operated at a flow of 2.3 m3 h
−1. The mass of particles
(PM2.5) emitted was determined by gravimetry. Quartz
filters were extracted together with dichloromethane
for 24 h and then three times with methanol in an
ultrasonic bath. The total organic extract was separated
into five different organic fractions of increasing polarity
by flash chromatography on a silica gel column. After
each elution, the different organic fractions were
vacuum concentrated and dried by nitrogen blow down.
The extracts were analysed by gas chromatography-
mass spectrometry (GC-MS). Before injection, the
compounds with hydroxylic and carboxylic groups were
converted into the corresponding trimethylsilyl
derivatives.
The PM2.5 emission factor for the charcoal burning was
7.8±0.37 g kg-1
of fuel burned (dry basis), which is only
two times lower than the emission factor obtained from wood burning in a brick fireplace (Alves et al.,
2011).
The aliphatic fraction comprised the homologous series
of n-alkanes and n-alkenes and multicyclic compounds.
n-Alkanes were in the range from C11 to C30, maximising
at C24, C29 and C30. As regards n-alkenes, the highest
concentrations were observed for the C18 homologues,
followed by the C20 and C16.
Hopanes, detected through the m/z 191
fragmentogram, represent a class of triterpenic markers
mainly emitted during the combustion of different fossil
fuels. These compounds are usually used to identify
traffic-related and coal combustion emissions (Zhang et
al., 2015). Steranes (m/z 217), diasteranes (m/z 218)
and methylphenanthrenes (m/z 192), which are also
known as fossil fuel molecular markers, were also
detected in the particulate samples.
Coniferyl alcohol, described as the basic unit from which
conifer lignin is biosynthesised, was the hydroxyl
compound with highest concentration. Apart from the
charcoal itself, the wood added at the beginning of the
combustion as kindling might had some contribution to
the measured concentrations.
Thanks are given to the Portuguese Foundation of
Science and Technology for funding the scholarships
SFRH/BPD/88988/2012, SFRH/BD/117993/2016 and
SFRH/BPD/123176/2016.
Alves et al. (2011), Fireplace and woodstove fine
particle emissions from combustion of western
Mediterranean wood types, Atmos. Res. 101.
Bonjour et al. (2013), Solid fuel use for household
cooking: Country and regional estimates for 1980–
2010, Environ. Health Perspect. 121.
Zhang et al. (2015). Source apportionment of elemental
carbon in Beijing, China: Insights from rand organic
marker measurements. Environ. Sci. Technol. 49.
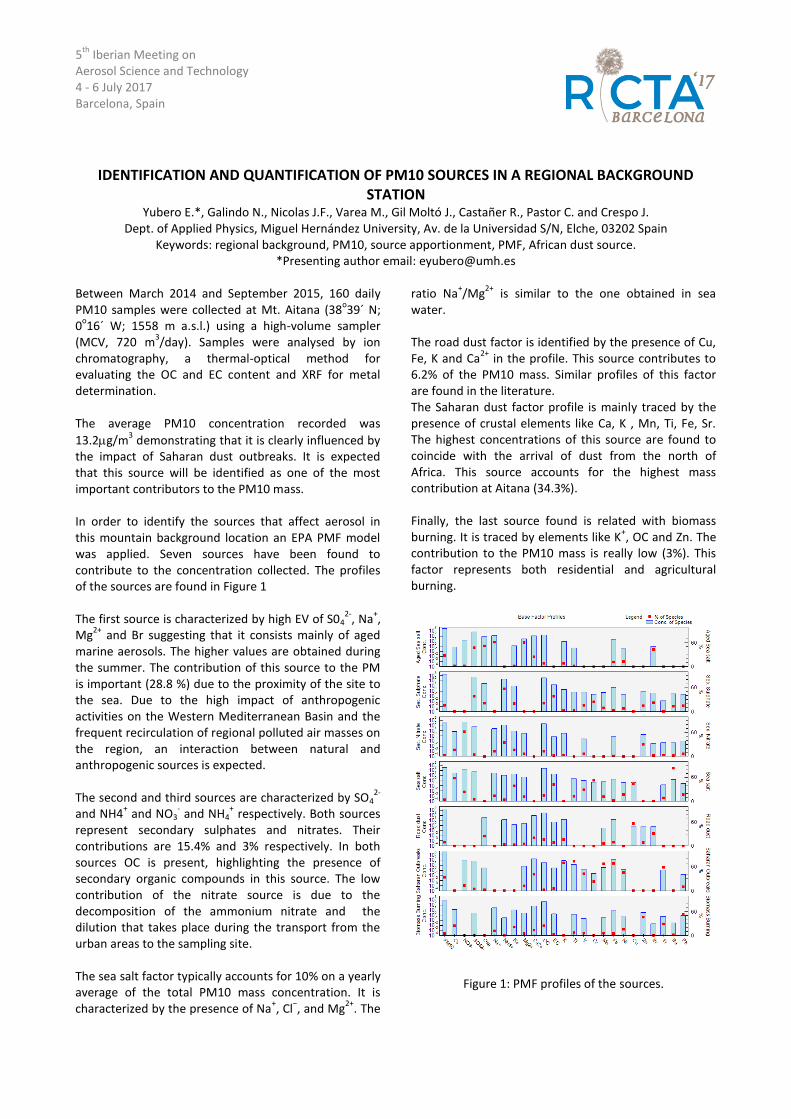
5th
Iberian Meeting on Aerosol Science and Technology 4 - 6 July 2017 Barcelona, Spain
IDENTIFICATION AND QUANTIFICATION OF PM10 SOURCES IN A REGIONAL BACKGROUND STATION
Yubero E.*, Galindo N., Nicolas J.F., Varea M., Gil Moltó J., Castañer R., Pastor C. and Crespo J. Dept. of Applied Physics, Miguel Hernández University, Av. de la Universidad S/N, Elche, 03202 Spain
Keywords: regional background, PM10, source apportionment, PMF, African dust source. *Presenting author email: [email protected]
Between March 2014 and September 2015, 160 daily PM10 samples were collected at Mt. Aitana (38
o39´ N;
0o16´ W; 1558 m a.s.l.) using a high-volume sampler
(MCV, 720 m3/day). Samples were analysed by ion
chromatography, a thermal-optical method for evaluating the OC and EC content and XRF for metal determination. The average PM10 concentration recorded was
13.2g/m3 demonstrating that it is clearly influenced by
the impact of Saharan dust outbreaks. It is expected that this source will be identified as one of the most important contributors to the PM10 mass. In order to identify the sources that affect aerosol in this mountain background location an EPA PMF model was applied. Seven sources have been found to contribute to the concentration collected. The profiles of the sources are found in Figure 1 The first source is characterized by high EV of S04
2-, Na
+,
Mg2+
and Br suggesting that it consists mainly of aged marine aerosols. The higher values are obtained during the summer. The contribution of this source to the PM is important (28.8 %) due to the proximity of the site to the sea. Due to the high impact of anthropogenic activities on the Western Mediterranean Basin and the frequent recirculation of regional polluted air masses on the region, an interaction between natural and anthropogenic sources is expected. The second and third sources are characterized by SO4
2-
and NH4+ and NO3
- and NH4
+ respectively. Both sources
represent secondary sulphates and nitrates. Their contributions are 15.4% and 3% respectively. In both sources OC is present, highlighting the presence of secondary organic compounds in this source. The low contribution of the nitrate source is due to the decomposition of the ammonium nitrate and the dilution that takes place during the transport from the urban areas to the sampling site. The sea salt factor typically accounts for 10% on a yearly average of the total PM10 mass concentration. It is characterized by the presence of Na
+, Cl
−, and Mg
2+. The
ratio Na+/Mg
2+ is similar to the one obtained in sea
water. The road dust factor is identified by the presence of Cu, Fe, K and Ca
2+ in the profile. This source contributes to
6.2% of the PM10 mass. Similar profiles of this factor are found in the literature. The Saharan dust factor profile is mainly traced by the presence of crustal elements like Ca, K , Mn, Ti, Fe, Sr. The highest concentrations of this source are found to coincide with the arrival of dust from the north of Africa. This source accounts for the highest mass contribution at Aitana (34.3%). Finally, the last source found is related with biomass burning. It is traced by elements like K
+, OC and Zn. The
contribution to the PM10 mass is really low (3%). This factor represents both residential and agricultural burning.
Figure 1: PMF profiles of the sources.
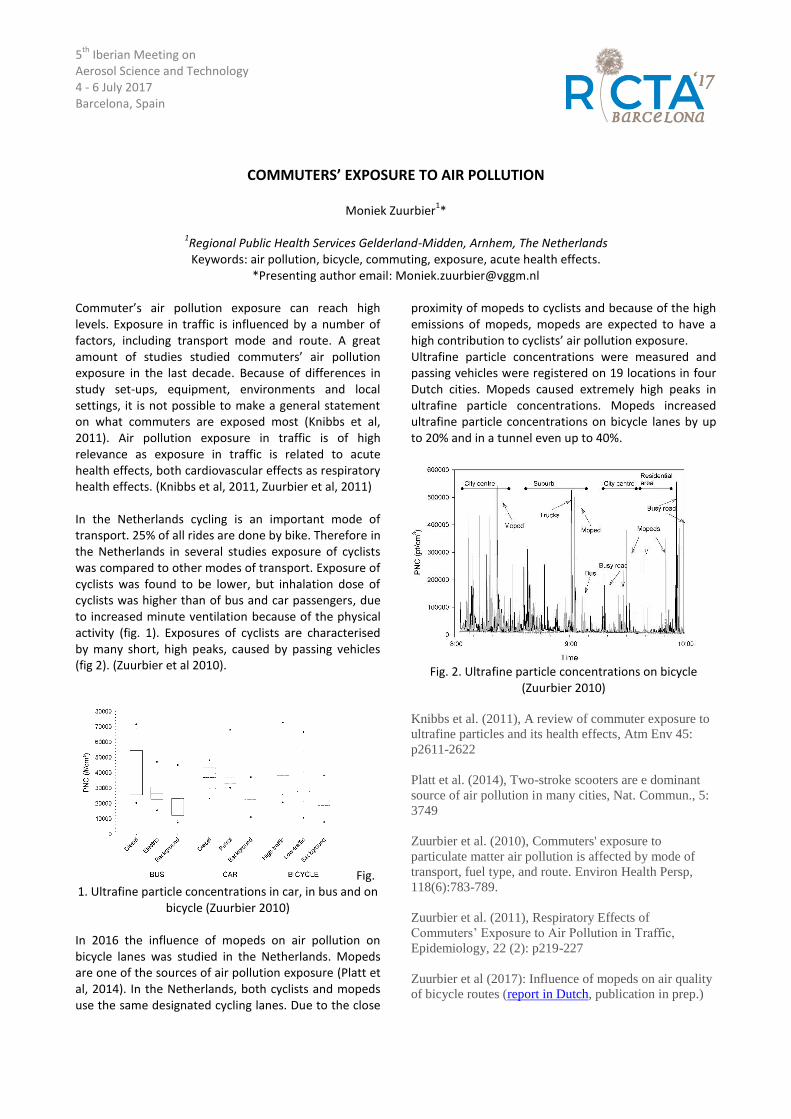
5th
Iberian Meeting on Aerosol Science and Technology 4 - 6 July 2017 Barcelona, Spain
COMMUTERS’ EXPOSURE TO AIR POLLUTION
Moniek Zuurbier1*
1Regional Public Health Services Gelderland-Midden, Arnhem, The Netherlands Keywords: air pollution, bicycle, commuting, exposure, acute health effects.
*Presenting author email: [email protected]
Commuter’s air pollution exposure can reach high levels. Exposure in traffic is influenced by a number of factors, including transport mode and route. A great amount of studies studied commuters’ air pollution exposure in the last decade. Because of differences in study set-ups, equipment, environments and local settings, it is not possible to make a general statement on what commuters are exposed most (Knibbs et al, 2011). Air pollution exposure in traffic is of high relevance as exposure in traffic is related to acute health effects, both cardiovascular effects as respiratory health effects. (Knibbs et al, 2011, Zuurbier et al, 2011) In the Netherlands cycling is an important mode of transport. 25% of all rides are done by bike. Therefore in the Netherlands in several studies exposure of cyclists was compared to other modes of transport. Exposure of cyclists was found to be lower, but inhalation dose of cyclists was higher than of bus and car passengers, due to increased minute ventilation because of the physical activity (fig. 1). Exposures of cyclists are characterised by many short, high peaks, caused by passing vehicles (fig 2). (Zuurbier et al 2010).
Fig. 1. Ultrafine particle concentrations in car, in bus and on
bicycle (Zuurbier 2010) In 2016 the influence of mopeds on air pollution on bicycle lanes was studied in the Netherlands. Mopeds are one of the sources of air pollution exposure (Platt et al, 2014). In the Netherlands, both cyclists and mopeds use the same designated cycling lanes. Due to the close
proximity of mopeds to cyclists and because of the high emissions of mopeds, mopeds are expected to have a high contribution to cyclists’ air pollution exposure. Ultrafine particle concentrations were measured and passing vehicles were registered on 19 locations in four Dutch cities. Mopeds caused extremely high peaks in ultrafine particle concentrations. Mopeds increased ultrafine particle concentrations on bicycle lanes by up to 20% and in a tunnel even up to 40%.
Fig. 2. Ultrafine particle concentrations on bicycle
(Zuurbier 2010)
Knibbs et al. (2011), A review of commuter exposure to
ultrafine particles and its health effects, Atm Env 45:
p2611-2622
Platt et al. (2014), Two-stroke scooters are e dominant
source of air pollution in many cities, Nat. Commun., 5:
3749
Zuurbier et al. (2010), Commuters' exposure to
particulate matter air pollution is affected by mode of
transport, fuel type, and route. Environ Health Persp,
118(6):783-789.
Zuurbier et al. (2011), Respiratory Effects of
Commuters’ Exposure to Air Pollution in Traffic,
Epidemiology, 22 (2): p219-227
Zuurbier et al (2017): Influence of mopeds on air quality
of bicycle routes (report in Dutch, publication in prep.)
Copyright © 2022 FDOKUMEN