DEBIASING EQ-5D TARIFFS. NEW ESTIMATIONS OF THE SPANISH EQ-5D VALUE SET UNDER NONEXPECTED UTILITY
35
-
Upload
independent -
Category
Documents
-
view
0 -
download
0
Transcript of DEBIASING EQ-5D TARIFFS. NEW ESTIMATIONS OF THE SPANISH EQ-5D VALUE SET UNDER NONEXPECTED UTILITY

DOCUMENTO DE TRABAJO. E2009/ 06
Debiasing EQ-5D Tariffs. New estimation of the Spanish EQ-5D value set under nonexpected utility.
JOSE Mª ABELLÁN-PERPIÑÁNJORGE EDUARDO MARTÍNEZ PÉREZFERNANDO IGNACIO SÁNCHEZ MARTÍNEZILDEFONSO MÉNDEZ MARTÍNEZ
Cen
tro
de
Est
ud
ios
An
dal
uce
s El Centro de Estudios Andaluces es una entidad de carácter científico y cultural, sin ánimo de lucro, adscrita a la Consejería de la Presidencia de la Junta de Andalucía. El objetivo esencial de esta institución es fomentar cuantitativa y cualitativamente una línea de estudios e investigaciones científicas que contribuyan a un más preciso y detallado conocimiento de Andalucía, y difundir sus resultados a través de varias líneas estratégicas. El Centro de Estudios Andaluces desea generar un marco estable de relaciones con la comunidad científica e intelectual y con movimientos culturales en Andalucía desde el que crear verdaderos canales de comunicación para dar cobertura a las inquietudes intelectuales y culturales. Las opiniones publicadas por los autores en esta colección son de su exclusiva responsabilidad © 2009. Fundación Centro de Estudios Andaluces. Consejería de Presidencia. Junta de Andalucía © Autores Depósito Legal: SE 4439-2009 Ejemplar gratuito. Prohibida su venta.

Cen
tro
de
Est
ud
ios
An
dal
uce
s
E2009/06
Debiasing EQ-5D Tariffs. New estimations of the Spanish EQ-5D value set under nonexpected utility.
José María Abellán Perpiñán* Fernando Ignacio Sánchez Martínez
Jorge Eduardo Martínez Pérez Ildefonso Méndez Martínez
Universidad de Murcia
*Autor correspondencia: [email protected] ** Acknowledgements: the authors thank Fundación Centro de Estudios Andaluces for financial support (research grant PRY103/08)

Cen
tro
de
Est
ud
ios
An
dal
uce
s
2
ABSTRACT
In this paper we focus on the important issue of the validity of EQ‐5D tariffs.
Specifically, we present two new estimations of the Spanish EQ‐5D tariff, which try to
account for two biases, utility curvature of life duration and probability weighting. Our
results reveal that it is possible to remove biases from EQ‐5D algorithms in an efficient
way (i.e., without inconsistencies at aggregate level and with a goodness of fit fairly
similar to comparable tariffs). Although our scoring algorithms are derived from
Spanish preferences, the methodology applied can be used to estimate new national
tariffs in other countries. New directions for future research are discussed.
Keywords: EQ‐5D, social tariff, utility curvature, probability weighting, rank‐dependent
utility, time trade‐off, value lottery equivalence, certainty equivalence.
RESUMEN
Este artículo se centra en la cuestión de la validez de las tarifas EQ‐5D. En particular, se
presentan dos nuevas estimaciones de la tarifa española del EQ‐5D que tratan de
corregir dos sesgos, la curvatura de la función de utilidad del tiempo de vida, y la
transformación de la probabilidad. Nuestros resultados ponen de manifiesto que es
posible eliminar los sesgos de los algoritmos EQ‐5D de un modo eficiente (es decir, sin
inconsistencias a nivel agregado y con una bondad de ajuste bastante próxima a las
tarifas comparables). Si bien nuestros algoritmos han sido estimados a partir de
preferencias de la población española, la metodología aplicada puede usarse para
estimar nuevas tarifas nacionales en otros países. Algunas nuevas vías de investigación
futura son objeto de discusión.
Palabras clave: EQ‐5D, tarifa social, curvatura de la utilidad, transformación de la
probabilidad, utilidad dependiente del orden, value lottery equivalence, equivalente
de certeza
Cen
tro
de
Est
ud
ios
An
dal
uce
s
3
1. INTRODUCTION
The EQ‐5D was proposed two decades ago as an instrument for the description and
valuation of health (EuroQol Group, 1990). Since then, the EQ‐5D descriptive system
has become very popular in the field of the economic evaluation of health
programmes. One of the reasons for its reputation is that EQ‐5D is based on people’s
preferences. Thus, the EQ‐5D system is not merely a multi‐attribute system of
classification for health related quality of life (HRQoL), but it also embodies a scoring
algorithm which allows for the calculation of utilities for the 243 health states that the
system is able to describe (i.e. the EQ‐5D value set or ‘tariff’). This is in contrast to
other HRQoL instruments (e.g. Sickness Impact Profile) which cannot measure
preferences and, consequently, are not suitable to be used in the calculation of Quality
Adjusted Life Years (QALYs), the index of health outcomes applied in cost‐utility
analyses.
Moreover, compared to similar instruments (i.e. instruments based on preferences),
the EQ‐5D has the advantage of a greater simplicity or parsimony, both regarding the
characterization of the health states, and with respect to their direct valuation. It has
been said (Brazier et al., 1999) that the EQ‐5D descriptive system is easier to
administer and explain than other HRQoL generic measures such as the Health Utility
Index (HUI). The availability of two standardized questionnaires –one for the
interviewee to self‐assess his/her own health state, and another for the valuation of
thirteen hypothetical health states with a Visual Analogue Scale (VAS)– has made it
possible for doctors and researchers to gather both patients and population’s
preferences in a fast and cheap way.
This is perhaps the reason why the amount of available EQ‐5D country‐specific value
sets largely outweighs the number of ‘tariffs’ obtained for any other instrument.
According to the EuroQOL group web page (http://www.euroqol.org), there are eight
countries where Time Trade‐Off (TTO) value sets have been derived: the UK, Spain,
Germany, Denmark, the Netherlands, Japan, Zimbabwe and the USA. In four of these
countries –the UK, Spain, Germany and Denmark– EQ‐5D visual analogue scale value
sets have been produced too. VAS tariffs are also available for Belgium, Finland, New
Zealand and Slovenia. Finally, a value set has also been derived taking together VAS

Cen
tro
de
Est
ud
ios
An
dal
uce
s
4
valuations from six European countries.1 Conversely, in the case of the SF‐6D, a multi‐
attribute system proposed by Brazier et al. (2002), there are only published tariffs for
the UK (Brazier et al. 2002; 2004) and, recently, for Hong Kong (Lam et al. 2008)2. This
makes the EQ‐5D the most important measure of health outcomes in the present, and,
consequently, the research on its theoretical grounds and its empirical validity is
largely justified.
Our study has to do with both theoretical and empirical issues regarding the
estimation of EQ‐5D value sets. In particular, we focus on the assumptions underlying
EQ‐5D tariffs, some of which are questionable and may be provoking biases when
QALYs are calculated using these value sets. Our intention in this study is to correct
those biases that may be induced by EQ‐5D tariffs as a result of assuming two
statements: (a) That the utility function of life years is linear; and (b) that expected
utility theory describes individual preferences properly. In other study (Abellán et al.,
2009) we have found empirical evidence against both assumptions, therefore in this
paper we present the estimation of a new Spanish EQ‐5D tariff assuming non‐linearity
in the utility function of life duration and applying a non‐expected utility theory
(namely, rank‐dependent utility theory) in the calculation of health utilities.
Additionally, since most EQ‐5D tariffs are based on the application of the TTO, a
riskless method, but as in the end they are commonly used in medical decision making,
normally a risky context, we propose a different elicitation method as the basis for EQ‐
5D tariffs, the ‘value lottery equivalence’, that can be viewed as a TTO under risk and
thus, might be more consistent with the context in which EQ‐5D utilities are actually
used. Although our estimations are country‐specific (i.e., Spain), debiasing procedures
used in this study can be applied to any other EQ‐5D tariff.
The following section summarizes the methods commonly used to derive EQ‐5D tariffs
and some of the biases that these procedures might provoke. In that section we also
report the evidence that we recently found when performing several axiomatic tests of
1 Recently, Augustovski et al. (2009) have derived both TTO and VAS sets for Argentina. There are also more specific tariffs within some countries, as the ‘hispanic value set’ estimated by Zarate et al. (2008) in the USA. 2 Notwithstanding, at the University of Sheffield website it can be read that “SF‐6D preference scores are available for Australia, Brazil, Hong Kong, Japan, Portugal and Singapore”. As far as we know, these studies have not been yet published (http://www.shef.ac.uk/scharr/sections/heds/mvh/sf‐6d/faqs.html).
Cen
tro
de
Est
ud
ios
An
dal
uce
s
5
the QALY model under both expected utility and rank‐dependent utility. In section 3
we describe the survey we used to elicit health state values, the methods applied to
correct the biases that are supposed to affect the QALY model, and the methodology
for the estimation of our unbiased tariff. The results of the elicitation of health utilities
through different methods under non‐expected utility theory, as well as the outcome
of the regression analyses performed to derive the tariffs are presented in section 4. In
section 5 we discuss the results and suggest further research.
2. BACKGROUND
The EQ‐5D describes a health state by using 5 dimensions or ‘attributes’: degree of
mobility (MO), ability to care of oneself (SC), ability to do usual activities (UA), degree
of pain‐discomfort (PD), and psychological stress, in particular anxiety or depresion
(AD). Each of these dimensions admits three levels, from 1 (no problem in the
dimension) to 3 (a lot of problems). The combination of five dimensions and three
levels yields a total of 243 EQ‐5D health states. The value sets that are available for an
increasing number of countries, assign an index of utility to each of the 243 health
states, by using a scoring algorithm (i.e. a set of coefficients) previously estimated by
regression techniques.
All the EQ‐5D value sets which have been derived to date are the result of a two‐ stage
procedure. Firstly, a protocol for the administration of a questionnaire is designed. By
means of this questionnaire, a sample of the general population directly values a
selection of EQ‐5D health states. In a second stage, an econometric model is specified
in order to obtain a complete tariff from the direct valuations previously elicited.
Leaving aside the tariffs based on VAS scores, whose predicted values are commonly
considered unable to capture meaningful cardinal preferences (e.g., Robinson et al.,
2001), the existing EQ‐5D value sets have their origin in direct valuations of selected
health states using the time trade‐off (TTO) technique. TTO utilities are commonly
calculated assuming that the utility function for life years is linear which implies, under
a multiplicative QALY model, that the utility that an individual derives from a period of
time (T) in a certain health condition (Q) may be represented as:
U(Q,T) = H(Q) L(T) = H(Q) T (1)

Cen
tro
de
Est
ud
ios
An
dal
uce
s
6
Nevertheless, there is a significant body of evidence showing that the utility function
for life duration is concave rather than linear (Sttiggelbout et al., 1994; Stalmeier et al.,
1996; Martin et al., 2000; Abellán et al, 2006). This evidence would imply that TTO
utilities could be biased downwards (Bleichrodt, 2002). Recently, Abellán et al. (2009)
found robust evidence in favour of a non‐linear QALY model with a power utility
function for life years, as follows:3
U(Q,T) = H(Q) L(T) = H(Q) T β (2)
At present there are various procedures through which the curvature parameter of the
utility function of life duration (β) may be derived. Accordingly what could be called
the ‘standard’ procedure, coefficient β is estimated by eliciting a series of certainty
equivalents (CEs) (McNeil et al., 1978; Sutherland et al., 1982). This traditional fashion
of estimating the utility curvature has two major features: the CEs are linked in such a
way that each utility score that is derived from the sequence equals the midpoint
between a lower and a higher score4, and all the CEs data are analyzed by assuming
the validity of expected utility.
Later on, Miyamoto and Eraker (1985) presented the way according to which the
traditional chained CE procedure could be used for adjusting TTO valuations for risk
attitude. Miyamoto and Eraker’s method was first applied by Stiggelbout et al. (1994)
to adjust TTO scores. The resulting adjusted TTO values were, however, consistently
lower than SG utilities. One of the hypotheses conjectured by Stiggelbout et al. to
explain such a discrepancy was the potential effect of probability weighting, the bias
caused because people seem to process probabilities in a non‐linear way, on both the
CE and the SG. Such a bias represents one of the main deviations from expected utility,
which is accounted for by both rank‐dependent utility theory (Quiggin, 1982) and
prospect theory (Tversky and Kahneman, 1992).
As the TTO method does not contain probabilities (it is a method framed under
certainty), raw TTO valuations cannot be distorted by the bias of probability weighting,
but adjusted TTO values may be, as far as adjustments have been performed by using a
3 The multiplicative form of the non‐linear QALY model requires that L is independent on the health state. Conversely, the non‐multiplicative QALY model allows utility curvature to vary according to the health state: U(Q,T) = H(Q) L(TQ). Abellán et al., (2009) concluded that a multiplicative model was a reasonable way to describe individual preferences. 4 This way of eliciting CEs is commonly referred to as the bisection version of the CE method (Keeney and Raiffa, 1976).
Cen
tro
de
Est
ud
ios
An
dal
uce
s
7
risk method (such as the CE) and the responses elicited by such a method have been
analyzed under expected utility (as commonly occurs with the standard chained CE
procedure). In consequence, a second source of biases may arise from violations of
expected utility.
Expected utility treats probabilities of a risky prospect ((Q1, T1), p; (Q2, T2))5 in a linear
way, in such a way that the utility of the prospect can be written as
p U(Q1, T1) + (1‐p) U(Q2, T2) (3)
Rank‐dependent utility generalizes expected utility by allowing that probabilities are
transforming in a non‐linear way; hence the utility of the previous prospect can be re‐
written as
w(p) U(Q1, T1) + (1‐w(p)) U(Q2, T2) (4)
where w(p) is a probability weighting function which is increasing and satisfies w(0)=0
and w(1)=1.
In this paper we apply an improvement of Miyamoto and Eraker’s (1985) procedure,
which was presented by Miyamoto (2000), and that, to the best of our knowledge, has
never been used previously to adjust TTO valuations from a survey6. This new
procedure retains the main advantage of the standard method (i.e., that only a small
number of elicitations are needed to adjust a utility curve per subject), but improves it
in at least two ways. Firstly, the CEs are not linked and, therefore, not prone to error
propagation. Secondly, the method corrects the distortion caused by probability
weighting without making parametric assumptions. In addition to these two
advantages over the standard chained CE method, Miyamoto’s procedure is
implemented in our study in such a way that the same framing is able to elicit
preferences for life duration, irrespective of the health state in which life years are
spent is regarded as better or as worse than death by respondents. On the contrary,
Miyamoto (2000) only restricted his attention to health states that are better than
death, which is the standard practice among the researchers who have attempted to
correct TTO scores for the utility of life duration. The specific way according to which
5 This binary prospect yields the outcome (Q1, T1) with probability p and the outcome (Q2, T2) with probability 1‐p. If p = 1 or p = 0 the prospect is riskless, otherwise it is risky. 6 Miyamoto (2000) only illustrated his method with data from four participants in an experiment conducted by Miyamoto and Eraker (1988).

Cen
tro
de
Est
ud
ios
An
dal
uce
s
8
such an unchained CE procedure estimates the coefficient of utility curvature will be
explained in detail in the next section.
There are two other alternative methods for eliciting the utility curvature for life
duration. The oldest was presented by Wakker and Deneffe (1996) and is called the
trade‐off method. It is chained, the same as the ‘standard’ procedure based on CEs,
but it is robust to probability weighting when all outcomes are of the same sign (i.e.,
either gains or losses). Bleichrodt and Pinto (2005) used the trade‐off method to
estimate the utility for life duration in three different health states. We are not aware
that the trade‐off method has ever been used for adjusting TTO values.
Very recently, Attema and Brouwer (2008, 2009) have presented a new method for
adjusting TTO utilities for utility curvature which is risk‐free, so it is not affected by
violations of expected utility. The risk‐free nature of such a method raises the question
as to whether adjusted TTO utilities will accordingly be the same utilities as
measurements that are applied under risk. In fact, the question of whether riskless and
risky utilities may be the same irrespective of the decision context in which they are
applied is the third of the issues with which we are concerned with in this paper.
EQ‐5D tariffs are currently derived from direct measures which have been obtained
with a riskless method, the TTO, whereas they are commonly used in a risky or
uncertain context such as the medical decision making field. In contrast to such a
common practice, if some form of contextual‐dependence was present, it would be
reasonable to expect that health state utilities measured by means of a method
framed under risk were more consistent with the final environment (i.e., uncertainty)
in which EQ‐5D utilities are actually used. One of these methods is the so‐called ‘value
lottery equivalence’ (VLE), a specific type of lottery equivalence method (McCord and
de Neufville, 1986) or ‘risk‐risk’ procedure (Bleichrodt et al., 2007) which resembles
the idea of a TTO under risk. In fact, the VLE method, such as Abellán et al. (2009)
showed, should lead to the same utility score as the TTO, unless what they called
‘transferability’ (a restrictive implication of the condition of stochastic dominance) is
violated7. This was the case observed in the abovementioned paper, where using the
7 Such an identity between the scores elicited by the two methods only holds, however, for those health states regarded by the respondents as better than death.

Cen
tro
de
Est
ud
ios
An
dal
uce
s
9
same database on which the new EQ‐5D tariffs presented in this paper are estimated,
found significant differences between the TTO and the VLE in not too few cases. In the
following section the VLE technique will be described in detail.
In sum, EQ‐5D tariffs based on TTO measures may be biased due to the assumption of
linearity in the utility function of life years which is implicit in the elicitation technique.
Secondly, the usual practice of assuming transferability from a riskless context, such as
the one in which health utilities are measured with the TTO, to an uncertain or risky
context, such as the medical decision making field intrinsically is, may be a source of
biases too. For convenience, we will used the same symbol H(Q) for utilities measured
by the VLE as for utilities measured by the TTO, even though, a priori, these utilities
might be different. Finally, if the assumption of linearity is relaxed when TTO utilities
are obtained (using a method such as the unchained CE proposed by Miyamoto, 2000),
and/or the TTO technique is replaced by a risky method, such as the VLE, violations of
expected utility may provoke biased estimations again8. Probability weighting bias
could then be corrected by assuming rank‐dependent utility, one of the main
descriptive alternatives to expected utility.
3. METHODS
3.1. Health states selected and their valuation
3.1.1. Selection of health states.
In previous studies, two different approaches have been used for the selection of the
subset of health states, out of the 243 EQ‐5D states, to be directly valued. The
approach first used in the UK study (Dolan, 1997) and, with or without some changes,
in Denmark, Germany, Spain and Zimbabwe, is based on the selection of 42 states,
with sub‐samples of individuals valuing a smaller number of them (between 13 and
15). The second approach, used in the Netherlands and in Japan, consists in the
selection of 17 states, all of them being valued by each respondent in the survey.9
8 As is explained in the next section the VLE is only exposed to probability weighting for the specific context of worse‐than‐death health states. For states regarded as better than dead, responses elicited by the VLE cannot be distorted by probability weighting, the same as the SG method cannot be affected by the bias of utility curvature. 9 This subset of 17 was suggested by Macran and Kind (2000) as the minimum efficient size in order to model the social tariff for the 243 health state utilities. Lamers et al. (2006) reached an analogous conclusion in a simulation study, since that subset of 17 states allowed for the estimation of the EQ‐5D

Cen
tro
de
Est
ud
ios
An
dal
uce
s
10
We have chosen a design which partially differs from both approaches, since the
selection of health states is nearly identical to that in the second approach, but
individuals only value a subset of these states, as it is the case in the first approach. In
our study, each respondent only values two health states, thus an even number of
states was needed. We included in our questionnaire the 17 health states from the
Dutch and Japanese studies plus another one: the EQ‐5D state 13212.10
The health states were set in pairs (and anonymously labelled as X and W) in such a
manner that each invidivual assessed a pair of states which could be logically ranked,
that is, for each of the 9 pairs, the state X is ‘logically’ preferred to the state W.11 Table
1 shows the 18 health states directly valued by the participants.
Table 1. Health states directly valued X states W states 11112 32313 11113 32223 11121 11133 11131 23232 11211 13311 13212 33333 12111 32211 21111 22222 11312 33323
3.1.2. Elicitation methods
As has previously been stated, we apply two different methods for preference
elicitation: the TTO and the VLE. In the case of TTO method, we try to find the value of
t that achieves the following indifference:
(FH, t) ~ (Q, 10) (5)
Where FH stands for ‘full health’ and Q refers to the health state whose utility is being
measured. When the individual regards a health state as worse than death (i.e. the
tariff with a mean absolute error (MAE) that was only slightly greater than those from previous studies as, for instance, the MVH study (Dolan, 1997). 10 The 18th state was selected by the researchers because of its ability to capture differences between some levels and dimensions not represented sufficiently in the other seventeen. 11 Two health states can be logically ranked if the levels for one state in all of its five dimensions are equal or higher than the levels for the other state.

Cen
tro
de
Est
ud
ios
An
dal
uce
s
11
respondent would prefer to die rather than suffering the health state for the rest of
his/her life)12, the framing of the TTO changes to the following:
(Q, 10 ‐ t*) following by (FH, t*) ~ Death (6)
With the VLE method, the aim is to find the number of healthy life years (t) which
makes the subject indifferent between the following prospects:
[(FH, t), 0.5; Death] ~ [(Q, 10), 0.5; Death] (7)
For states regarded as worse than death, the frame changes to:
[(FH, 10), 0.5; (Q, 10)] ~ [(FH, t*), 0.5; Death] (8)
One of the advantages of the VLE method over the TTO is that the framings used in
equations (7) and (8) ask for the indifference value t* in the same way (i.e., the more
time is attached to full health, the higher is the score for health state Q). Compare now
the framings commonly used in TTO measurements (Equations 5‐6). Such framings
search for indifference in an asymmetric fashion. Whereas for the better‐than‐death
version of the TTO occurs the same as the corresponding version of the VLE, for the
TTO for worse than death states just occurs the contrary (i.e., the more time is
attached to full health, the lower is the score for Q). As has been argued elsewhere
(Robinson and Spencer, 2006), procedural differences such as those we have just
pointed out call into question the validity of aggregating better than and worse than
death TTO values.
On the other hand, the certainty equivalent (CE) procedure conceived by Miyamoto
(2000) is used to obtain the curvature parameter of the utility function of life years (β).
This value will then be used to transform linear utilities, thus introducing a more
realistic assumption, namely, that the utility yielded by each additional year of life is
not a constant. The frame of the method is as follows:
[(Q, D), 0.5; (Q, d)] ~ (Q, CE)] (9)
Where D and d stand for two life durations whose values are varied throughout a
sequence of six CE elicitations, in such a way that duration D is always longer than d.
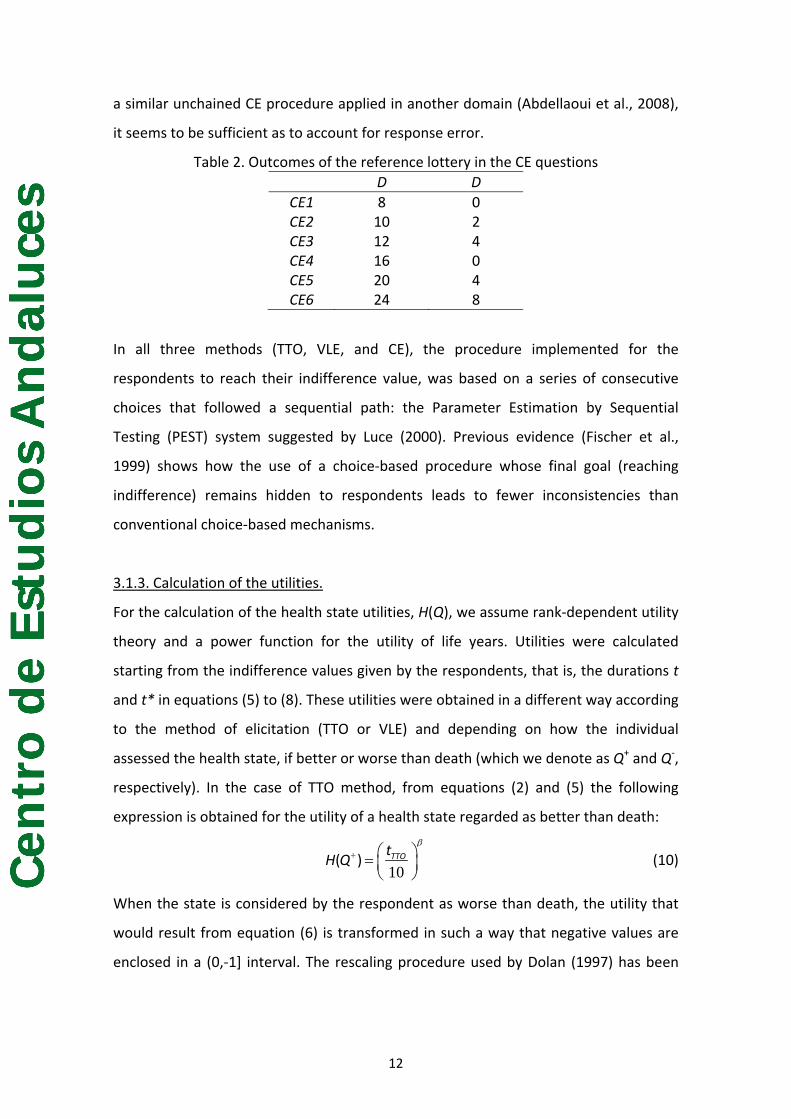
Table 2 shows the pairs used as stimuli in our CE questions. The number of six CEs is
not lower than the one frequently elicited with the traditional chained CE procedure
(which usually ranges from 3 to 7 elicitations) and, according to the results obtained by
12 An initial question allowed us to identify the individuals who considered a particular health state to be as worse than death.
Cen
tro
de
Est
ud
ios
An
dal
uce
s
12
a similar unchained CE procedure applied in another domain (Abdellaoui et al., 2008),
it seems to be sufficient as to account for response error.
Table 2. Outcomes of the reference lottery in the CE questions D D
CE1 8 0 CE2 10 2 CE3 12 4 CE4 16 0 CE5 20 4 CE6 24 8
In all three methods (TTO, VLE, and CE), the procedure implemented for the
respondents to reach their indifference value, was based on a series of consecutive
choices that followed a sequential path: the Parameter Estimation by Sequential
Testing (PEST) system suggested by Luce (2000). Previous evidence (Fischer et al.,
1999) shows how the use of a choice‐based procedure whose final goal (reaching
indifference) remains hidden to respondents leads to fewer inconsistencies than
conventional choice‐based mechanisms.
3.1.3. Calculation of the utilities.
For the calculation of the health state utilities, H(Q), we assume rank‐dependent utility
theory and a power function for the utility of life years. Utilities were calculated
starting from the indifference values given by the respondents, that is, the durations t
and t* in equations (5) to (8). These utilities were obtained in a different way according
to the method of elicitation (TTO or VLE) and depending on how the individual
assessed the health state, if better or worse than death (which we denote as Q+ and Q‐,
respectively). In the case of TTO method, from equations (2) and (5) the following
expression is obtained for the utility of a health state regarded as better than death:
10
β+ ⎛ ⎞= ⎜ ⎟
⎝ ⎠TTOt
H Q( ) (10)
When the state is considered by the respondent as worse than death, the utility that
would result from equation (6) is transformed in such a way that negative values are
enclosed in a (0,‐1] interval. The rescaling procedure used by Dolan (1997) has been

Cen
tro
de
Est
ud
ios
An
dal
uce
s
13
applied and then utilities have been adjusted assuming the power utility function for
life duration. The result is as follows:
10
β− ⎛ ⎞= −⎜ ⎟
⎝ ⎠TTOt
H Q( ) (11)
The evaluation under rank‐dependent utility theory (equation 4) of the VLE question
for better‐than‐death health states (equation 7) yields the following formula:
10
β+ ⎛ ⎞= ⎜ ⎟
⎝ ⎠VLEt
H Q( ) (12)
As anticipated in Section 2, notice that for better‐than‐death states, probabilities
cancel out and the expression is exactly the same as that derived from the TTO
method. This feature makes the VLE version for better‐than‐death states very similar
to Wakker and Deneffe’s (1996) trade‐off method, since it is robust to probability
weighting and also, as it is shown in the Appendix, to loss aversion. Conversely,
probability weighting influences worse than death valuations13 such as follows:
( ) ( )[ ]
0 5 10
1 0 5 10
β β
β−
⎡ ⎤−⎢ ⎥⎣ ⎦=−
VLEw tH Q
w
*( . )( )
( . ) (13)
Another valuable property of the VLE comes from making the rescaling of negative
utilities unnecessary, since worse than death scores are naturally bounded above and
below by minus one and zero. As has been recognized by the rescaling proponents
themselves (Patrick et al., 1994), such a practice is an arbitrary device from a
theoretical point of view, which is applied in order to force that utility ranges above
and below death are similar. Therefore, the VLE solves the problem of getting
symmetric utility ranges in a theoretically consistent way.
The curvature parameter (β) is estimated through non linear regression analysis from
equation (9). However, since rank‐dependent utility theory assumes that individuals
13 As in this paper all adjustments are performed assuming rank‐dependent utility, all the outcomes of the lotteries are treated as gains. Hence, loss aversion, though might affect both VLE and CE methods, is not considered here. The reason for leaving aside loss aversion is that Miyamoto’s (2000) procedure cannot identify properly so many parameters as can be necessary if prospect theory is assumed. Similarly, TTO measurements may be also affected by loss aversion, but there is no quantitative correction of TTO utilities available at present.

Cen
tro
de
Est
ud
ios
An
dal
uce
s
14
transform the probabilities through the function w(p), the estimation of this weighting
function is also required. Various parametrical specifications have been proposed for
the probability weighting function (Bleichrodt and Pinto, 2000), but for our purpose we
do not need to assume any specific functional form for w(p), since it is only required
the estimate of the probability weight of one probability (p=0.5), that is the estimate of
w(0.5). Because of under rank‐dependent utility w(p) is regarded as the weight
assigned to the utility of the best possible outcome in the lottery, w(0.5) will go with
the larger duration D for better‐than‐death states and with the shorter duration d for
worse‐than‐death states. Thus, if the health state is regarded as better than death,
parameters β and w(p) are estimated through regression analysis from the following
equation:14
CE = [w(0.5) Dβ + (1‐w(0.5)) dβ] 1/β (14)
Conversely, if the individual considers that the health state is worse than death, the
equation changes to:
CE = [(1‐w(0.5)) Dβ + w(0.5) dβ] 1/β (15)
3.2. The survey
The sample included 720 adult individuals, living in the Autonomous Community of
Andalusia. Age and gender quotas were imposed to ensure that the sample was
representative of the Spanish general population. The sample was divided into 9
balanced subsamples (ni=80 each), maintaining representativeness within them. The
survey, consisted of a computer assisted questionnaire, was conducted in the province
of Sevilla from October to December of 2008. All the interviews were run on laptop
computers and responses collected through personal interview sessions. Average
timer per interview was about 20 minutes.
The questionnaire had five sections (for details, see Abellán et al., 2009), some of them
put in order randomly. Sections 1 (description of the health states and VAS scoring)
and 3 (CE questions), as well as the last one (socio‐demographic characteristics), were
identical for all the respondents, except for the health states assessed by the
14 The weight of p=0.5 is only required in equation (13), that is for the calculation of VLE utilities of health states regarded as worse than death. Nevertheless, equation (14) has to be solved in order to obtain de value of β when the health state is regarded by the individual as better than death.

Cen
tro
de
Est
ud
ios
An
dal
uce
s
15
individuals. Nevertheless, parts 2 and 4, containing the health utility elicitation
methods (TTO and VLE), were presented to subjects varied at random from one
interview to another. Thus, some individuals first answered TTO questions and then
VLE questions; whereas the order was reversed for the remaining respondents. The
order of appearance of the health states (X and W) were also randomized in each of
the valuations tasks (VAS, VLE, TTO and CE).
Consequently, for each of the two EQ‐5D health states (X and W), the respondents had
to: a) score the health state by a VAS (section 1); b) answer the questions
corresponding to the VLE and TTO methods (sections 2 and 4, or 4 and 2); and c)
answer the six CE questions (section 3). Finally, they had to fill the part of the
questionnaire containing socio‐demographic questions.
3.4. Modeling
Regression analyses were applied to predict new Spanish EQ‐5D tariffs from the direct
valuation of the 18 selected health states. Overall, we estimated two different EQ‐5D
scoring algorithms on the basis that both direct TTO and VLE valuations were
‘debiased’. As previously explained (see Section 3.1.3), estimates for a power
coefficient were assessed under rank‐dependent utility theory in such a way that raw
TTO and VLE valuations were adjusted accordingly, accounting for utility curvature and
probability weighting all together. Such adjusted utilities were used to predict two
different tariffs, one TTO‐based and the other VLE‐based. Whether such tariffs should
be applied to the same decision contexts (i.e., risky vs. riskless) is a matter whose
elucidation requires more empirical work, which is beyond the scope of this paper.
Notwithstanding, such a topic is discussed later on in the light of the results derived
from the estimations presented in this manuscript, and the previous differences
detected by Abellán et al. (2009) between the direct TTO and VLE measurements.
We estimated two additive models for each tariff, namely: the main effects model and
the (so‐called) N3 model. Both models were individual data‐based. We chose between
both according to the usual criteria of consistency, goodness of fit, and parsimony
(Dolan, 1997).
The main effects model explains the utility score that respondent i assigns to health
state j using a set of ten dummy variables that indicate the presence of either a level 2

Cen
tro
de
Est
ud
ios
An
dal
uce
s
16
or 3 (denoted as l) for any dimension (d) of the evaluated state. The model is formally
written as follows:
α β∈ ∈
= + +∑∑ij ld ldd D l L
y z e (16)
where α is the intercept, zld represents the ten dummy variables, which indicate the
presence of either level 2 or 3 in a given dimension, β are the parameters to be
estimated, and e is a zero‐mean error term.15
The N3 model is an extended version of Equation (16), in such a way that it controls for
whether the maximum level of severity is reached in at least one of the dimensions
that characterize health state j:
3α β γ∈ ∈
= + + +∑∑ij ld ldd D l L
y z N e (17)
where N3 is a dummy that indicates whether at least one dimension is at level 3, and γ
is the attached parameter.
Since both TTO and VLE scores have been measured by assuming the convention that
the utility of full health is equal to one, the ‘right’ value in theoretical terms for the
estimated constant term α is one (i.e., if there is ‘no problem’ in all the five EQ‐5D
dimensions then the expected value for the utility of state 11111 is unity). However, in
practice it is frequent to find that α is significantly lower than one, a problem that was
focused on in previous EQ‐5D algorithm estimations (e.g., Badía et al., 2001) by
interpreting the estimated constant term as representing any move away from full
health. On the contrary, the promoters of the Short‐Form (SF)‐6D algorithm (Brazier et
al., 2002, 2004) have remarked the lack of theoretical justification of such an
interpretation, claiming that the best way to ensure that the health state describing
full health (state 11111 in the EQ‐5D system) has a value of one is to restrict the
intercept to unity. We agree with Brazier and colleagues, in such a way that all our
estimations restrict the constant term to unity.
The models were estimated using the Random Effects (RE) estimators, that is,
assuming that the error term is normally distributed. In particular, we used the RE
15 The dummy variables are commonly written as MO2, MO3, SC2, SC3, UA2, UA3, PD2, PD3, AD2, AD3, where MO, SC, UA, PD and AD stand, respectively, for the dimensions of mobility, self‐care, usual activities, pain‐discomfort, and anxiety‐depression; and 2, 3 refer to the levels of severity.
Cen
tro
de
Est
ud
ios
An
dal
uce
s
17
estimator because it takes into account that the same individual values several health
states, increasing the efficiency of the estimates relative to an OLS estimator. Thus, the
error term e in Equations 16 and 17 is decomposed into an individual‐specific error
term (ηi)16 and a traditional error term unique to each health state and individual (εij).
4. RESULTS
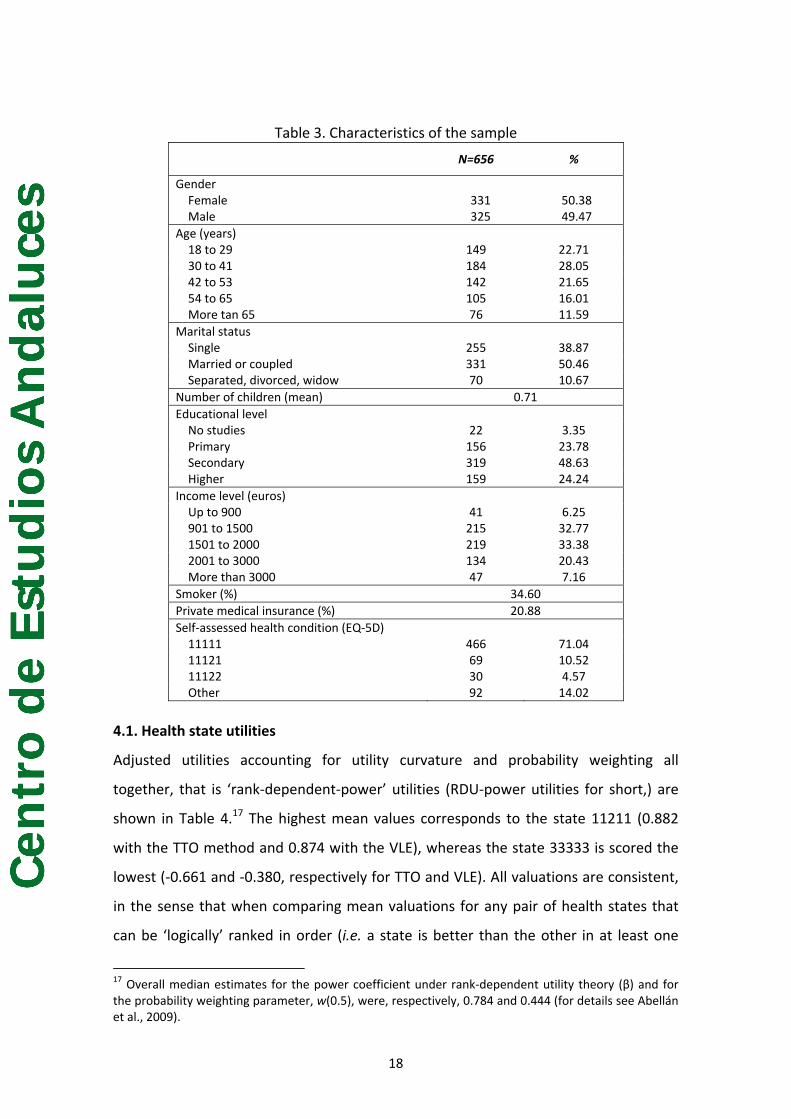
4.1. Sample
A total of 63 individuals were excluded from the analysis, since their answers revealed
various types of inconsistent behavior. Firstly, 34 participants assigned valuations to
the W state higher than those assigned to the X state (remember that all pairs of
health states can be ‘logically’ ordered). Six out of those 34 were inconsistent in their
VAS valuations, 13 in the TTO responses and the rest (15) in the VLE task. On the other
hand, 30 individuals considered one of the health states (generally, the W state) as
worse than death when they answered the questions in one of the elicitations
methods, whereas in the other method they scored the same state as better than
death. This type of ‘preference reversal’ occurred between TTO and VLE for 13
individuals, and between EC and one of the two mentioned methods for the other 17
subjects. Consequently, the final sample was made up of 656 individuals, whose main
characteristics are shown in Table 3. The representativeness of the sample was hardly
affected as a result of the exclusions.
16 Alternatively, the fixed‐effects estimator could be used to correct for individual valuation effects. However, there are efficiency reasons to prefer the RE estimator because the explanatory variables describe a hypothetical health state and, thus, are uncorrelated to the respondent’s valuation. The results of the Hausman test confirm this reasoning. These results are available upon request to the authors.
Cen
tro
de
Est
ud
ios
An
dal
uce
s
18
Table 3. Characteristics of the sample
N=656 %
Gender Female 331 50.38 Male 325 49.47
Age (years) 18 to 29 149 22.71 30 to 41 184 28.05 42 to 53 142 21.65 54 to 65 105 16.01 More tan 65 76 11.59
Marital status Single 255 38.87 Married or coupled 331 50.46 Separated, divorced, widow 70 10.67
Number of children (mean) 0.71Educational level No studies 22 3.35 Primary 156 23.78 Secondary 319 48.63 Higher 159 24.24
Income level (euros) Up to 900 41 6.25 901 to 1500 215 32.77 1501 to 2000 219 33.38 2001 to 3000 134 20.43 More than 3000 47 7.16
Smoker (%) 34.60Private medical insurance (%) 20.88Self‐assessed health condition (EQ‐5D) 11111 466 71.04 11121 69 10.52 11122 30 4.57 Other 92 14.02
4.1. Health state utilities
Adjusted utilities accounting for utility curvature and probability weighting all
together, that is ‘rank‐dependent‐power’ utilities (RDU‐power utilities for short,) are
shown in Table 4.17 The highest mean values corresponds to the state 11211 (0.882
with the TTO method and 0.874 with the VLE), whereas the state 33333 is scored the
lowest (‐0.661 and ‐0.380, respectively for TTO and VLE). All valuations are consistent,
in the sense that when comparing mean valuations for any pair of health states that
can be ‘logically’ ranked in order (i.e. a state is better than the other in at least one
17 Overall median estimates for the power coefficient under rank‐dependent utility theory (β) and for the probability weighting parameter, w(0.5), were, respectively, 0.784 and 0.444 (for details see Abellán et al., 2009).

Cen
tro
de
Est
ud
ios
An
dal
uce
s
19
dimension and equal in the rest of the dimensions) no inconsistencies arise. This is an
interesting result, as it gives support to the feasibility of obtaining utility measures for
a great number of health states by spreading them among independent subsamples of
individuals (hence preventing errors resulting from the respondents’ fatigue).
Table 4. RDU‐power TTO and VLE valuations
Health state Obs. TTO VLE
Mean (SD) Mean (SD)
11112 74 0,867 (0,183) 0,868 (0,168)
11113 74 0,634 (0,218) 0,639 (0,253)
11121 74 0,861 (0,141) 0,855 (0,173)
11131 73 0,580 (0,262) 0,594 (0,315)
11133 74 0,380 (0,284) 0,319 (0,375)
11211 75 0,882 (0,097) 0,874 (0,101)
11312 69 0,523 (0,223) 0,538 (0,248)
12111 75 0,794 (0,184) 0,849 (0,236)
13212 72 0,405 (0,264) 0,358 (0,313)
13311 75 0,447 (0,231) 0,363 (0,304)
21111 70 0,826 (0,141) 0,825 (0,141)
22222 70 0,166 (0,195) 0,098 (0,437)
23232 73 ‐0,272 (0,499) ‐0,164 (0,515)
32211 75 0,228 (0,378) 0,195 (0,417)
32223 74 ‐0,309 (0,372) ‐0,262 (0,368)
32313 74 ‐0,178 (0,407) ‐0,205 (0,421)
33323 69 ‐0,572 (0,385) ‐0,299 (0,306)
33333 72 ‐0,661 (0,383) ‐0,380 (0,341)
There are six health states18 for which significant differences arise between TTO and
VLE utilities (paired t‐test, p < 0.01). All of them, except for state 12111, were labelled
by Dolan (1997) as ‘moderate’ or ‘severe’. Furthermore, two out of such health states
(33323 and 33333) have the most negative utilities and, in addition, are those in which
a largest difference emerge between both elicitation methods. Thus, discrepancies
between RDU‐power TTO and VLE valuations tend to accumulate in non‐mild health
states, accounting for most of the total difference.
4.2. EQ‐5D tariffs
18 States 12111, 13212, 11133, 13311, 33323, and 33333.

Cen
tro
de
Est
ud
ios
An
dal
uce
s
20
The results of the estimations of the TTO and VLE based tariffs are shown in Table 5.
Columns 1 and 2 include the estimates based on TTO values, both with the ‘main
effects’ specification and with the N3 model. Columns 3 and 4 show the results for the
same models based on VLE utilities. In all four estimations, the constant term has been
restricted to unity, according to Brazier et al. (2002, 2004).
Table 5. Estimates from RDU‐power models
(1) (2) (3) (4) TTO TTO‐N3 VLE VLE‐N3 Constant 1.000 1.000 1.000 1.000 Mobility 2 ‐0.204 ‐0.213 ‐0.154 ‐0.200 Mobility 3 ‐0.438 ‐0.439 ‐0.256 ‐0.272 Self Care 2 ‐0.183 ‐0.180 ‐0.230 ‐0.206 Self Care 3 ‐0.329 ‐0.323 ‐0.256 ‐0.229 Usual Activities 2 ‐0.137 ‐0.126 ‐0.223 ‐0.157 Usual Activities 3 ‐0.247 ‐0.234 ‐0.299 ‐0.224 Pain/Discomfort 2 ‐0.187 ‐0.194 ‐0.160 ‐0.186 Pain/Discomfort 3 ‐0.368 ‐0.360 ‐0.380 ‐0.316 Anxiety/Depression 2 ‐0.182 ‐0.178 ‐0.164 ‐0.139 Anxiety/Depression 3 ‐0.313 ‐0.303 ‐0.314 ‐0.240 N3 ‐‐‐‐‐ ‐0.025 ‐‐‐‐‐ ‐0.143 Observations 1312 1312 1312 1312 Median absolute error 0.038 0.034 0.045 0.029 |pred. Error| < k k = 0.01 3.35 3.27 3.43 2.51 k = 0.05 16.16 16.08 16.38 16.08 k = 0.10 32.85 32.39 29.80 31.25
The coefficients of the four models have the expected sign and are highly significant in
both cases (paired t‐test, p < 0.001). This conclusion partially holds for the coefficient
associated to N3 in the models including this variable (columns 2 and 4): it is negative,
but quantitatively relevant and highly significant only in the case of the VLE model.
Additionally, the estimates are consistent in the sense that the coefficient associated
to a particular level is never significantly lower than the coefficient associated to the
immediately milder level.
The estimates in Table 5 suggest that the greatest welfare loss associated to the
maximum level of severity occurs for the ‘Mobility’ and ‘Pain/discomfort’ dimensions,
with the precise order varying among the models. Regarding the intermediate level of
severity (i.e. level 2), the estimates agree in that having some/moderate problems in
the ‘Mobility’, ‘Self‐care’ and ‘Pain/discomfort’ dimensions results in greater utility

Cen
tro
de
Est
ud
ios
An
dal
uce
s
21
losses than having those problems in other dimensions.19 Thus, our respondents are
particularly concerned with deviations from full health in the ‘Mobility’ and
‘Pain/discomfort’ dimensions.
Considerable differences emerge when comparing the coefficients of TTO tariffs with
those of VLE tariffs. On average, the difference between the absolute value of the
estimated coefficients in columns 1 and 3 of Table 5 amounts to 22.6% of the TTO
model coefficients, with no clear direction of change or correlation with the level of
severity being valued. The difference between coefficients of the N3 models (columns
2 and 4), excluding the N3 coefficient itself, amounts to 17.6%. Again, no direction of
change or correlation with the level of severity emerges. Importantly, the higher
sensitivity of the estimates to the elicitation method mainly stems from the coefficient
associated to the N3 variable, that is, to the ‘maximum level of severity’ effect. The N3
coefficient in the TTO model is not just nearly a sixth of the VLE one; it is not
statistically significant either.
The estimates were used to predict values for the 242 health states that can be
defined using the EQ‐5D classification system (excluding full health). The within‐sample
predictive ability of the calculated tariffs is summarized at the bottom of Table 5.
According to the Mean Absolute Error (MAE), the VLE‐N3 model is better than the VLE‐
‘plain’ one, which presents a 55% higher MAE. In the case of TTO models, both ‘plain’
and N3 models yield median errors which are very close, as it is the percentage of
predictions within ±k units of the actual value. Hence, the TTO ‘plain’ model is chosen
by reasons of parsimony, since it has one less variable and predicts as well as the N3
model (the N3 coefficient results, further, statistically non significant). On the other
hand, the N3 model is the one selected in the case of VLE because of its MAE is lower
than that of the VLE ‘plain’ model.
When comparing the predictive ability of TTO and VLE selected models (columns 1 and
4 in Table 5) it could be said that the VLE model is slightly better than the TTO one,
since the MAE of the VLE tariff is a 24% lower than that of the TTO model. The
opposite is true, however, when looking at the percentage of predictions that are
within ±k units of the actual value. More than 3.3 percent of the values calculated
19 The only exemption occurs in the VLE‐based model augmented with the N3 variable (column 4), where the estimate with the smallest absolute value corresponds to the variable “Mobility 2”.

Cen
tro
de
Est
ud
ios
An
dal
uce
s
22
using the predictions of the TTO ‘plain’ model are within 0.01 units of the actual value.
The corresponding percentage for the VLE‐N3 model is only 2.5. Equivalently, almost
33 percent of the values calculated using the coefficients estimated for the TTO model
are within 0.1 units of the actual value reported by the respondent, that is, more than
1.5 percentage points above the corresponding figure of the VLE model. Nevertheless,
the differences are of such small magnitude that it could be stated that both models
are very similar in terms of their predictive ability.
Compared to previously estimated EQ‐5D tariffs which used a similar number of
directly valued health states as in our study, the predictive ability of our models is
fairly acceptable. Lamers et al. (2006) reported mean errors of 0.06 and 0.03 for the
‘plain’ and the N3 Dutch models, respectively. Tsuchiya et al. (2002), however,
obtained MAEs lower than ours in their estimations of the Japanese tariff: 0.015 for
the ‘plain’ model and 0.014 for the N3 model.
The distributions of the estimated value sets are summarized in Table 6. If we compare
the distribution resulting from TTO tariff with that obtained by VLE tariff, the similarity
in average valuations only appears in some of the moments of the corresponding
distributions of values. Differences between TTO (‘plain’ model) and VLE (N3 model)
range from 11% to 14% for the 75th and 90th percentiles. For the 10th and 25th
percentiles the gap is much higher in relative terms (30% and 51%, respectively)
though in the latter, the absolute value is very small (0.04). Differences in distribution
are the largest in the 50th percentile: median utilities are nearly identical in absolute
value but just of the opposite sign (‐0.133 vs. 0.132).
Table 6. Descriptive statistics for the value TTO and VLE sets derived under selected RDU‐power models
TTO plain VLE‐N3 Mean 0.137 0.153St. Dev. 0.315 0.269Minimum (33333) ‐0.695 ‐0.424
Percentiles 10 ‐0.272 ‐0.18425 ‐0.083 ‐0.04150 ‐0.133 0.13275 0.363 0.31290 0.550 0.494
Negative values (%) 34.15 30.04

Cen
tro
de
Est
ud
ios
An
dal
uce
s
23
Likeness emerges in the higher predicted utility (apart from 11111) by each of the
algorithms. These higher predicted values are 0.863 with the TTO ‘plain’ tariff and
0.861 for the VLE‐N3 model, although in the first case the value corresponds to the
health state 11211 whereas in the VLE tariff the state with the highest predicted utility
is 11112. Notwithstanding, there are important differences between value sets as a
consequence of the discrepancies found in the coefficients in Table 5. As it has been
suggested, the main discrepancy occurs in the realm of negative values (i.e. health
states regarded as worse than death). The proportion of predicted negative values is 4
percentage points higher in the TTO value set than in the VLE distribution. The
minimum valuation in the TTO tariff is much lower (‐0.695) than the minimum value in
the VLE‐based distribution (‐0.424). It is not surprising that the larger gaps between
moments of the distribution of values are, precisely, below the median. As a
consequence, the aggregate mean values of the VLE distributions are higher than the
mean values of the TTO value sets.
5. DISCUSSION
Quality Adjusted Life Year (QALY) is the most widely used index of health outcomes in
economic evaluation of health technologies. The availability of preference‐based
health related quality of life (HRQoL) instruments, such as the EQ‐5D, the HUI or the
SF‐6D, allow analysts to save time and resources required for measuring health state
utilities directly from patients (Drummond et al., 2005). In addition to that, scoring
algorithms for those instruments are based on community’s preferences, according to
the ‘societal’ perspective claimed for allocating health resources (Gold et al., 1996).
Such advantages are worthwhile, but they might vanish in case social tariffs were
unable to reflect people’s true preferences as accurately as possible. If the algorithms
were derived under questionable assumptions and/or through elicitation methods
liable to suffer from certain biases, then the use of the utilities stemming from the
tariffs might result in wrong calculations and, consequently, in suboptimal decisions
regarding health allocation resources.
In this paper we have focused on the important issue of the validity of EQ‐5D tariffs. It
is important because the EQ‐5D is the most widely extended instrument for generating
national utilities sets, but also because some of the leading ‘fourth hurdle’ agencies

Cen
tro
de
Est
ud
ios
An
dal
uce
s
24
(e.g., the NICE) encourage the analysts and the industry to derive utilities from such
tariffs for use in cost per QALY calculations. Thus, any effort for improving the validity
of EQ‐5D tariffs should be welcome.
Apparently, our attempt for improving the status quo (i.e., EQ‐5D tariffs based on raw
time trade‐off measurements) has been successful, as far as the survey design,
interview protocol, and elicitation procedures applied have yielded two new EQ‐5D
tariffs which are consistent and able to predict observed preferences with similar
accuracy to the existing ones, providing utilities which have been adjusted by utility
curvature and probability weighting.
A first lesson that can be extracted from this study is that it is feasible to estimate an
‘adjusted’ EQ‐5D tariff free of inconsistencies at aggregate level. Both in Dutch and
Japanese studies each interviewee valued seventeen health states. In the present
study each respondent only valued two health states by means of two different
elicitation methods, the TTO and the value lottery equivalence (VLE). In addition to
that, a total of twelve certainty equivalents were obtained per subject (six per health
state). Therefore, we needed one less elicitation than the abovementioned studies for
obtaining consistent models in which adjustments for utility curvature and probability
weighting were implemented. The number of questions would lessen if only one
method was used to measure the raw utilities of the health states. Additionally, if
multiplicative QALY model were assumed, the number of elicitations required would
be even lower than the one needed in the MVH protocol, since only six certainty
equivalents would be required. Abellán et al. (2009) found wide evidence supporting
the multiplicative assumption though limited at individual level, hence further research
is required to guarantee that a unique curvature parameter per respondent could be
derived from a series of CE questions assuming certain health condition (presumably,
full health). Nevertheless, we think that this finding shows that attempts to correct EQ‐
5D tariffs in an efficient way are possible, without increasing respondents’ cognitive
burden.
The fact that we have estimated two tariffs, one TTO‐based and the other VLE‐based,
was motivated for previous evidence contrary to the assumption of a unified concept
of utility, valid for both riskless and risky decision contexts. Abellán et al. (2009) tested
whether TTO and VLE responses can be transferable, founding that for more than one‐

Cen
tro
de
Est
ud
ios
An
dal
uce
s
25
third of the eighteen health states used for estimating the tariffs presented in this
paper transferability did not hold.
The comparison of the two algorithms estimated in our study reveals an asymmetry
between the distributions of utilities generated. Absolute differences in predicted
values are larger for the states with the lowest utilities: beyond 0.2 for states 33332,
33233, 33323 and 33333, and beyond 0.1 for states 32333 and 23333. In general, the
adjusted TTO tariff yields lower (i.e. more negative) scores than the VLE one. Hence, to
the previous failure of the assumption of transferability for the versions of the TTO and
the VLE for better than death states, it is now added the asymmetry observed among
worse than death states. At this point, and bearing in mind the deficiencies of the TTO
version for worse than death states (i.e., quite different framing from the version for
better than death states and also the necessity of rescaling negative raw scores), we
would advise caution about the use of TTO‐based tariffs in economic evaluation of
health care technologies.
The previous caveat also includes the adjusted TTO tariff presented in this article. If
TTO utilities would not be finally applicable to risky contexts for a significant number of
individuals, the adjustment of TTO scores for utility curvature performed in our study
would be wrong. This conclusion follows from that the unchained certainty equivalent
procedure used is a risk‐based method, whereas the TTO compares sure outcomes.
This does not mean that TTO scores cannot be adjusted by utility curvature, but only
that such an adjustment should be done by a ‘risk‐free’ method, such as the one
proposed by Attema and Brouwer (2009). It has to be noted, however, that even in
that case, practitioners should be cautious on the application of the resulting adjusted
TTO scores to risk environments. Although Attema et al. (2007) did not find significant
differences between their risk‐free method and Wakker and Deneffe’s trade‐off
method, such evidence was limited since the common subdomain for which both
methods could be compared was small, elicitations were performed assuming full
health, and only sixty‐seven subjects were included in the analysis. Thus, further
research would be required to test whether direct violations of transferability are
observed for more health states. Such a task is, notwithstanding, difficult to achieve in
one single study.
Cen
tro
de
Est
ud
ios
An
dal
uce
s
26
The other tariff which has been estimated in this study, the VLE‐based one, seems to
be apparently an improvement over the existing tariffs. The VLE method is framed
under risk; hence it is susceptible to be used in medical decision analysis and economic
evaluation. This assert is directly valid for the version of the VLE addressed to value
health states regarded as better than death. For worse‐than‐death states VLE
valuations have been corrected to account probability weighting. Previous evidence
(Abellán et al., 2007) prevented us of applying unadjusted methods, though they are
framed in terms of risk. Therefore, in absence of any evidence on the external validity
of the VLE, we opted for adjusting it. Consistency of lottery equivalence methods is still
widely unknown since the present evidence on that topic is scarce (Oliver, 2005),
controversial (Spencer at al., 2005; Oliver, 2006), and restricted to a different version
from which is used in this study (the method referred as ‘probability lottery
equivalence’ by Bleichrodt et al., 2007). Therefore, an interesting topic for the future
would be to test both the internal and external validity of the VLE procedure.
Another valuable property of the VLE technique is that provides a natural lower bound
for worse than dead scores. How to handle negative valuations is a long‐debated issue
in the field of utility measurement and, to the best of our knowledge, only Robinson
and Spencer (2006) have previously provided an alternative, precisely for TTO
measurements. Robinson and Spencer’s ‘life profile’ approach allow for calculating
both positive and negative utilities with the same framing, without necessity of
rescaling. The VLE method offers the same result (symmetry for utilities above and
below zero) in the domain of risk.
We are aware of the limitations of our work and recognize that the debate about how
EQ‐5D tariffs should be estimated is not still closed. Probably the most notable
limitation of this study is that our adjustment for the utility of life duration was not
able to deal with loss aversion. In this sense, the way recently opens by Abdellaoui et
al. (2008), who use an unchained certainty equivalent procedure for measuring the
utility of money outcomes along the full domain of gains and losses, would worthwhile
to be explored in the context of the health outcomes. Such a method only adds an
additional question for assessing the loss aversion parameter. Notwithstanding, as
Abdellaoui et al. only consider money outcomes, they can assume the zero value as
the reference point. Implicit to the rank‐dependent utility evaluations presented in this

Cen
tro
de
Est
ud
ios
An
dal
uce
s
27
paper is that the reference point may vary from one elicitation to another, in such a
way that all the outcomes are always treated as gains. This approach is congruent with
Bleichrodt et al.’s (2007) formula (equation 2, p. 471) for gain prospects. The
application of prospect theory to health outcomes is always problematic, as long as we
are not sure what the location of the reference point is (van Osch et al., 2006).
The estimation of social tariffs requires to survey general population, and such a costly
task cannot be performed by using excessively sophisticated methods, even though
they offer important theoretical advantages. Because time and resources for surveying
are scarce a balance between feasibility and theoretical soundness is needed, and we
think that our proposal, although improvable, goes a step further than previous
attempts.
Appendix
Prospect theory assumes that people evaluates the different outcomes included in
risky prospects with respect to a reference point, in such a way that outcomes are
expressed as gains or losses depending whether they are preferred or not to such a
reference point (i.e., sign‐dependence). When a risky prospect involves no loss, it is
called a gain prospect. Conversely, a prospect involving no gain is called a loss
prospect. Finally, there is also mixed prospects, that is, prospects involving both gains
and losses.
In addition to sign‐dependence, prospect theory also assumes that losses are
perceived by people as larger than gains, even though both gains and losses are of the
same size (i.e., loss aversion).
The VLE version for health states regarded as better than death offers in principle
three possible references points, since outcome ‘death’ is present in the two lotteries.
According to the previous evidence obtained by Bleichrodt et al. (2001) and Bleichrodt
et al. (2007), we discard outcome (FH, t*) as a plausible reference point, since such an
outcome is used to match the two lotteries and, consequently, it does not seem a
natural ‘anchor’ from which evaluate the remaining outcomes. Therefore, two natural
candidates remain: ‘death’ and ‘(Q, 10)’.
If ‘death’ is taken as the reference point, then both (FH, t*) and (Q, 10) are interpreted
as gains. Thus, this case is equivalent to assume rank‐dependent utility, since rank‐

Cen
tro
de
Est
ud
ios
An
dal
uce
s
28
dependent utility and prospect theory are coincidental when there is no loss (Tversky
and Kahneman, 1992). In consequence, equation (2) is applied to both sides of the
indifference represented by Eq. (6), resulting in 10
β+ ⎛ ⎞= ⎜ ⎟
⎝ ⎠VLEt
H Q( ) , the adjusted VLE
utility described in equation (12).
If (Q, 10) is assumed to be the reference point, then two possible reference points
arise, depending on whether (FH, t) is considered preferable or not to (Q, 10). In case
(FH, t) is regarded a gain, then the lottery on the left side of Equation (6) will be a
mixed lottery (i.e., it contains both a gain, (FH, t*), and a loss, Death) whereas the
lottery on the right side of Eq. (6) will be a loss lottery (i.e., Death is treated as a loss).
From the application of Bleichrodt et al.’s (2007) formulae (1) and (3) follows the same
utility as before (Eq. 12). Conversely, if (FH, t*) is taken as a loss with respect to (Q, 10),
then there is no mixed gamble. The two lotteries contain losses, so only Bleichrodt et
al.’s formula (3) is applied to both alternatives in the VLE question. It is easy to check
that the final result is the same as before, in such a way that equation (12) follows
again. Hence, the VLE version applied to better‐than‐death states leads to the same
utility score, regardless the location of the reference point.

Cen
tro
de
Est
ud
ios
An
dal
uce
s
29
REFERENCES
Abdellaoui M, Bleichrodt H, L’Haridon O. A tractable method to measure utility and
loss aversion under prospect theory. Journal of Risk and Uncertainty 2008, 36: 245‐66.
Abellán‐Perpiñán JM, Pinto Prades JL, Méndez Martínez I, Badía X. Towards a better
QALY model. Health Economics 2006, 15(7): 665‐76.
Abellán‐Perpiñán JM, Bleichrodt H, Pinto Prades JL. Testing the predictive validity of
the Time Trade‐Off and the Standard Gamble. Fundación Centro de Estudios
Andaluces. Documento de Trabajo E.2007/14. Consejería de la Presidencia. Junta de
Andalucía. 2007 (http://www.centrodeestudiosandaluces.info/PDFS/E200714.pdf).
Abellán‐Perpiñán JM, Martínez‐Pérez JE, Sánchez‐Martínez FI, Méndez I. The QALY
model which came in from a general population survey, roughly multiplicative, broadly
nonlinear and sometimes context‐dependent. Fundación Centro de Estudios
Andaluces. Documento de Trabajo E.2009/04. Consejería de la Presidencia. Junta de
Andalucía. 2009 (http://www.centrodeestudiosandaluces.info/PDFS/E200904.pdf).
Attema AE, Bleichrodt H, Wakker PP. A new method for measuring the utility of life
duration. Erasmus University Rotterdam. 2007. (available at URL
http://oldwww.bmg.eur.nl/personal/attema/ABW_Life_Duration.pdf).
Attema AE, Brouwer WBF. Can we fix it? Yes we can! But what? A new test of
procedural invariance in TTO‐measurement. Health Economics 2008, 17(7): 877‐85.
Attema AE, Brouwer WBF. The correction of TTO‐scores for utility curvature using a
risk‐free utility elicitation method. Journal of Health Economics 2009, 28: 234‐43.
Augustovski FA, Irazola VE, Velazquez AP, Gibbons L, Craig BM. Argentine Valuation of
the EQ‐5D Health States. Value in Health 2009, 12(4): 587‐96.
Badia X, Roset R, Herdman, M, Kind P. A comparison of GB and Spanish general
population time trade‐off values for EQ‐5D health states. Medical Decision Making
2001, 21(1): 7‐16.
Bleichrodt H. A new explanation for the difference between time trade‐off utilities and
standard gamble utilities. Health Economics 2002, 11: 447‐56.
Cen
tro
de
Est
ud
ios
An
dal
uce
s
30
Bleichrodt H, Abellan‐Perpiñan JM, Pinto JL, Mendez I. Resolving Inconsistencies in
Utility Measurement under Risk: Tests of Generalizations of Expected Utility.
Management Science 2007, 53: 469‐82.
Bleichrodt H, Pinto JL. A Parameter‐Free Elicitation of the Probability Weighting
Function in Medical Decision Analysis. Management Science 2000, 46(11): 1485‐96.
Bleichrodt H, Pinto JL. The Validity of QALYs under Nonexpected Utility. The Economic
Journal 2005, 115: 533‐50.
Bleichrodt H, Pinto JL. Wakker P. Making Descriptive Use of Prospect Theory to
Improve the Prescriptive Use of Expected Utility. Management Science 2001, 47(11):
1498‐514.
Brazier J, Deverill M, Green C, Harper R, Booth A. A review of the use of health status
measures in economic evaluation. Health Technology Assessment 1999; 3(9).
Brazier J, Roberts J, Deverill M. The estimation of a preference‐based measure of
health from the SF‐36. Journal of Health Economics 2002; 21: 271‐92.
Brazier J, Roberts J, Tsuchiya A, Busschbach J. A comparison of the EQ‐5D and SF‐6D
across seven patients groups. Health Economics 2004; 13: 873‐84.
Dolan P. Modeling valuations for EuroQol health states. Medical Care 1997;
35(11):1095‐108.
Drummond M, Sculpher M, Torrance G, O’Brien B ,Stoddart G. Methods for the
economic evaluation of health care programmes. Oxford: Oxford University Press,
2005.
EuroQol Group. EuroQol‐a new facility for the measurement of health‐related quality
of life. Health Policy 1990; 16: 199‐208.
Fischer GW, Carmon Z, Ariely D, Zauberman G. Goal‐based Construction of
Preferences: Task Goals and the Prominence Effect. Management Science 1999, 45:
1057‐75.

Cen
tro
de
Est
ud
ios
An
dal
uce
s
31
Gold MR, Siegel JE, Russell LB, Weinstein MC, editors. Cost‐Effectiveness in Health and
Medicine. Report of the Panel on Cost‐Effectiveness in Health and Medicine. New York:
Oxford UniversityPress. 1996.
Keeney R, Raiffa H. Decisions with multiple objectives. New York, Wiley. 1976.
Lam CLK, Brazier J, McGhee SM. Valuation of the SF‐6D Health States Is Feasible,
Acceptable, Reliable, and Valid in a Chinese Population. Value in Health 2008; 11(2):
295‐303.
Lamers LM, McDonnell J, Stalmeier PFM, Krabbe PFM, Busschbach JJV. The Dutch
tariff: results and arguments for an effective design for national EQ‐5D valuation
studies. Health Economics 2006, 15: 1121‐32.
Luce RD. Utility of Gains and Losses: Measurement‐Theoretical and Experimental
Approaches. New Jersey: Lawrence Erlbaum Associates, Inc. 2000.
Macran S, Kind P. Valuing EQ‐5D health states using a modifiesd MVH protocol:
preliminary results. In: Badia X, Herdman M, Roset M (eds). 16th Plenary Meeting of
the EuroQol Group, Sitges 6‐9 November 1999. Discussion Papers. Institut de Salut
Pública de Catalunya, 2000.
Martin AJ, Glasziou PP, Simes RJ, Lumley T. A comparison of standard gamble, time
trade‐off, and adjusted time trade‐off scores. International Journal of Technology
Assessment in Health Care 2000, 16 (1): 137–47.
McCord M, de Neufville R. Lottery equivalents: reduction of the certainty effect
problem in utility assessment, Management Science 1986, 32: 56–60.
McNeil BJ, Weichselbaum R, Pauker SG. Fallacy of five‐year survival in lung cancer.
New England Journal of Medicine 1978, 299: 1397‐401.
Miyamoto JM. Utility assessment under expected utility and rank‐dependent utility
assumptions. En: Chapman GB, Sonnenberg FA (eds). Decision Making in Health Care,
Cambridge University Press: Cambridge. 2000.
Miyamoto JM, Eraker SA. Parameter Estimates for a QALY Utility Model. Medical
Decision Making 1985, 5: 191‐213.
Cen
tro
de
Est
ud
ios
An
dal
uce
s
32
Miyamoto JM, Eraker SA. A mulliplicative model of the utility of survival duration and
health quality. Journal of Experimental Psychology: General 1988, 117: 3‐20.
Oliver A. Testing the internal consistency of the lottery equivalents method using
health outcomes. Health Economics 2005, 14(2): 149‐59.
Oliver A. On the lottery equivalents method: a response to Spencer et al. Health
Economics 2006, 15(3): 323‐5.
Patrick DL, Starks HE, Cain KC, Uhlmann RF, Pearlman RA. Measuring preferences for
health states worse than death. Medical Decision Making 1994, 14: 9–18.
Quiggin J. A Theory of Anticipated Utility. Journal of Economic Behaviour and
Organization 1982, 3(4): 323‐43.
Robinson A, Spencer A. Exploring challenges to TTO utilities: valuing states worse than
dead. Health Economics 2006, 15(4): 393‐402.
Robinson A, Loomes G, Jones‐Lee M. Visual analogue scales, standard gambles and
relative risk aversion. Medical Decision Making 2001, 21: 17‐27.
Spencer A, Covey J, Chilton S, Taylor M. Testing the internal consistency of the lottery
equivalents method using health outcomes: a comment to Oliver. Health Economics
2005, 14(2): 161‐7.
Stalmeier PFM, Bezembinder TGG, Unic IJ. Proportional Heuristics in Time Trade Off
and Conjoint Measurements. Medical Decision Making 1996, 16: 36‐44.
Stiggelbout AM, Kiebert GM, Kievit J, Leer JWH, Stoter G, de Haes JCJM. Utility
Assessment in Cancer Patients: Adjustment of Time Tradeoff Scores for the Utility of
Life Years and Comparison with Standard Gamble Scores. Medical Decision Making
1994, 14: 82‐90.
Sutherland HJ, Llewellyn‐Thomas H, Boyd NF, Till JE. Attitudes towards quality of
survival: The concept of ‘maximum endurable time’. Medical Decision Making 1982, 2:
299‐309.
Tsuchiya A, Ikeda S, Ikegami N, Nishimura S, Sakai I, Fukuda T et al. Estimating an EQ‐
5D population value set: the case of Japan. Health Economics 2002; 11: 341‐53.

Cen
tro
de
Est
ud
ios
An
dal
uce
s
33
Tversky A, Kahneman D. Advances in prospect theory: Cumulative representation of
uncertainty. Journal of Risk and Uncertainty 1992, 5: 297‐323.
van Osch SMC, Wakker PP, van den Hout WB, Stiggelbout AM. Correcting biases in
standard gamble and time tradeoff utilities. Medical DecisionMaking 2004, 24: 511‐7.
Wakker P, Deneffe D. Eliciting von Neumann‐Morgenstern Utilities When Probabilities
Are Distroted or Unknown. Management Science 1996, 42(8): 1131‐49.
Zarate V, Kind P, Chuang LH. Hispanic Valuation of the EQ‐5D Health States: A Social
Value Set for Latin Americans. Value in Health 2008; 11(7): 1170‐7.