Italian Population-Based Values of EQ-5D Health States
9
Available online at www.sciencedirect.com journal homepage: www.elsevier.com/locate/jval Italian Population-Based Values of EQ-5D Health States Luciana Scalone, ScD, PhD 1,2, , Paolo A. Cortesi, PhD 1,2 , Roberta Ciampichini, MSc 1 , Andrea Belisari, MSc 1 , Lucia S. D’Angiolella, PharmD 1 , Giancarlo Cesana, MD 2 , Lorenzo G. Mantovani, DSc 1,3 1 CHARTA Foundation, Milan, Italy; 2 Research Centre on Public Health (CESP), University of Milan-Bicocca, Monza, Italy; 3 Department of Clinical Medicine and Surgery, University Federico II of Naples, Naples, Italy ABSTRACT Objective: To estimate a value set for the calculation of Italian- specific quality-adjusted life years (QALYs), based on preferences elicited on EuroQol five-dimensional (EQ-5D) questionnaire health states using the time trade-off technique. Methods: The revised standard Measurement and Valuation of Health protocol was fol- lowed. Twenty-five health states, divided into three groups and given to 450 subjects, were selected to obtain 300 observations per state. Subjects aged 18 to 75 years were recruited to be representa- tive of the Italian general adult population for age, sex, and geo- graphical distribution. To improve efficiency, face-to-face interviews were conducted by using the Computer Assisted Per- sonal Interviewing approach. Several random effects regression models were tested to predict the full set of EQ-5D questionnaire health states. Model selection was based on logical consistency of the estimates, sign and magnitude of the regression coefficients, goodness of fit, and parsimony. Results: The model that satisfied the criteria of logical consistency and was more efficient includes 10 main effect dummy variables for the EQ-5D questionnaire domain levels and the D1 interaction term, which accounts for the number of dimensions at levels 2 or 3 beyond the first. This model has an R 2 of 0.389 and a mean absolute error of 0.03, which are comparable to or better than those of models used in other countries. The utility estimates after state 11111 range from 0.92 (21111) to −0.38 (33333). Italian utility estimates are higher than those estimated in the United Kingdom and Spain and used so far to assess QALYs and conduct cost-utility evaluations in Italy. Conclusions: A specific value set is now available to calculate QALYs for the conduction of health economic studies targeted at the Italian health care system. Keywords: cost-utility analysis, EQ-5D, health-related quality of life, quality-adjusted life years, time trade-off. Copyright & 2013, International Society for Pharmacoeconomics and Outcomes Research (ISPOR). Published by Elsevier Inc. Introduction In 2011, the Italian National Health Service spent €113 billion on health care [1]. Information on health-related quality of life (HRQOL) and quality-adjusted life years (QALYs) is increasingly being taken into consideration to support the decision-making process regarding the utilization of available resources in Italy [2–4]. In the last few years, the EuroQol five-dimensional (EQ-5D) questionnaire has being recognized and used in the Italian health care system for its abilities to easily describe, measure, and value individuals’ health in several health care sectors [5–12]. The EQ-5D questionnaire is a quickly administered instru- ment that makes it possible to obtain a meaningful description and measurement of health. Values assigned to the health states are estimated by combining the responses to the EQ-5D questionnaire descriptive system with an algorithm based on the individuals’ preferences. The EQ-5D questionnaire is currently one of the most commonly used instruments for estimating QALYs in health economic evaluations [13], and the time trade-off (TTO) is generally the approach used to elicit preferences for the valuation of EQ-5D questionnaire health states [14–28]. Comparisons of different national value sets have underlined the existence of differences across countries and the importance of assessing utilities that are country specific [17,28–31]. Never- theless, value sets are still not available for a number of countries. In these cases, the social tariffs established for other countries are used to estimate utilities. Italy is one of the countries where a specific value set is missing. To compensate for this lack, till now, the UK or the Spanish sets have been used to conduct health economic evalua- tions for the Italian health care system [8,10,12]. The aim of the present study was to develop an Italian- specific value set of the EQ-5D questionnaire health states, by using the TTO method to elicit preferences. Methods Source of Methods and Materials This study was conducted following the standard Measurement and Valuation of Health (MVH) protocol, revised in 2009, which introduced a few changes to the original MVH protocol [14,32,33]. 1098-3015/$36.00 – see front matter Copyright & 2013, International Society for Pharmacoeconomics and Outcomes Research (ISPOR). Published by Elsevier Inc. http://dx.doi.org/10.1016/j.jval.2013.04.008 Conflict of Interest: The authors have no conflict of interest to declare. E-mail: [email protected]. * Address correspondence to: Luciana Scalone, CHARTA Foundation, Via Visconti di Modrone, 18 - I-20122 Milan, Italy. VALUE IN HEALTH 16 (2013) 814 – 822
-
Upload
independent -
Category
Documents
-
view
0 -
download
0
Transcript of Italian Population-Based Values of EQ-5D Health States
Avai lable onl ine at www.sc iencedirect .com
V A L U E I N H E A L T H 1 6 ( 2 0 1 3 ) 8 1 4 – 8 2 2
1098-3015/$36.00 –
Published by Elsevie
http://dx.doi.org/10.
Conflict of Intere
E-mail: luciana.s* Address correspo
journal homepage: www.elsevier .com/ locate / jva l
Italian Population-Based Values of EQ-5D Health States
Luciana Scalone, ScD, PhD1,2,�, Paolo A. Cortesi, PhD1,2, Roberta Ciampichini, MSc1, Andrea Belisari, MSc1,Lucia S. D’Angiolella, PharmD1, Giancarlo Cesana, MD2, Lorenzo G. Mantovani, DSc1,31CHARTA Foundation, Milan, Italy; 2Research Centre on Public Health (CESP), University of Milan-Bicocca, Monza, Italy; 3Department of Clinical Medicine andSurgery, University Federico II of Naples, Naples, Italy
A B S T R A C T
Objective: To estimate a value set for the calculation of Italian-specific quality-adjusted life years (QALYs), based on preferenceselicited on EuroQol five-dimensional (EQ-5D) questionnaire healthstates using the time trade-off technique. Methods: The revisedstandard Measurement and Valuation of Health protocol was fol-lowed. Twenty-five health states, divided into three groups andgiven to 450 subjects, were selected to obtain 300 observations perstate. Subjects aged 18 to 75 years were recruited to be representa-tive of the Italian general adult population for age, sex, and geo-graphical distribution. To improve efficiency, face-to-faceinterviews were conducted by using the Computer Assisted Per-sonal Interviewing approach. Several random effects regressionmodels were tested to predict the full set of EQ-5D questionnairehealth states. Model selection was based on logical consistency ofthe estimates, sign and magnitude of the regression coefficients,goodness of fit, and parsimony. Results: The model that satisfiedthe criteria of logical consistency and was more efficient includes 10
see front matter Copyright & 2013, International S
r Inc.
1016/j.jval.2013.04.008
st: The authors have no conflict of interest to de
[email protected] to: Luciana Scalone, CHARTA Foundation,
main effect dummy variables for the EQ-5D questionnaire domainlevels and the D1 interaction term, which accounts for the numberof dimensions at levels 2 or 3 beyond the first. This model has an R2
of 0.389 and a mean absolute error of 0.03, which are comparable toor better than those of models used in other countries. The utilityestimates after state 11111 range from 0.92 (21111) to −0.38 (33333).Italian utility estimates are higher than those estimated in theUnited Kingdom and Spain and used so far to assess QALYs andconduct cost-utility evaluations in Italy. Conclusions: A specificvalue set is now available to calculate QALYs for the conductionof health economic studies targeted at the Italian health caresystem.Keywords: cost-utility analysis, EQ-5D, health-related quality of life,quality-adjusted life years, time trade-off.
Copyright & 2013, International Society for Pharmacoeconomics andOutcomes Research (ISPOR). Published by Elsevier Inc.
Introduction
In 2011, the Italian National Health Service spent €113 billion onhealth care [1]. Information on health-related quality of life (HRQOL)and quality-adjusted life years (QALYs) is increasingly beingtaken into consideration to support the decision-making processregarding the utilization of available resources in Italy [2–4]. In thelast few years, the EuroQol five-dimensional (EQ-5D) questionnairehas being recognized and used in the Italian health care system forits abilities to easily describe, measure, and value individuals’health in several health care sectors [5–12].
The EQ-5D questionnaire is a quickly administered instru-ment that makes it possible to obtain a meaningful descriptionand measurement of health. Values assigned to the healthstates are estimated by combining the responses to the EQ-5Dquestionnaire descriptive system with an algorithm basedon the individuals’ preferences. The EQ-5D questionnaire iscurrently one of the most commonly used instruments forestimating QALYs in health economic evaluations [13], and thetime trade-off (TTO) is generally the approach used to elicitpreferences for the valuation of EQ-5D questionnaire healthstates [14–28].
Comparisons of different national value sets have underlinedthe existence of differences across countries and the importanceof assessing utilities that are country specific [17,28–31]. Never-theless, value sets are still not available for a number ofcountries. In these cases, the social tariffs established for othercountries are used to estimate utilities.
Italy is one of the countries where a specific value set ismissing. To compensate for this lack, till now, the UK or theSpanish sets have been used to conduct health economic evalua-tions for the Italian health care system [8,10,12].
The aim of the present study was to develop an Italian-specific value set of the EQ-5D questionnaire health states, byusing the TTO method to elicit preferences.
Methods
Source of Methods and Materials
This study was conducted following the standard Measurementand Valuation of Health (MVH) protocol, revised in 2009, whichintroduced a few changes to the original MVH protocol [14,32,33].
ociety for Pharmacoeconomics and Outcomes Research (ISPOR).
clare.Via Visconti di Modrone, 18 - I-20122 Milan, Italy.
Table 1 – Sets of health states valued by theparticipants.
Set 1 Set 2 Set 3
21111� 21111� 11211�
12111� 12111� 11121�
13311� 13311� 32211�
11113� 11113� 11112�
11131� 11131� 11312�
22222� 22222� 11133�
23232� 23232� 32223�
32313� 32313� 33323�
11211� 22121 2212111121� 21323 2132332211� 22122 2212211112� 22233 2223311312� 33321 3332111133� 13332 1333232223� 23313 2331333323� 33232 33232
þ33333� þ33333� þ33333�
þ11111 þ11111 þ11111þDead þ Dead þDead� Health states included in the Macran and Kind [37] study.
V A L U E I N H E A L T H 1 6 ( 2 0 1 3 ) 8 1 4 – 8 2 2 815
Accordingly, the following differences with the original MVHprotocol were included in our study: 1) we presented eachrespondent with a selection of health states based on fixed setsof health states (see details below) instead of sampling them eachtime from the full set of 24 states, so as to guarantee a balanceddistribution of all states across the study sample; 2) the state“unconscious,” which was originally used in addition to the EQ-5D questionnaire states, was removed from valuation; 3) thewords “immediate death,” which can imply that the respondentimagines dying instantly, were replaced with “dead”; 4) the visualanalogue scale rating warm-up exercise was modified by remov-ing the fractionation exercise; that is, the rank-ordered cardswere removed from display before conducting the rating exercise,in order to minimize recall bias; and 5) the health states to beanalyzed during the visual analogue scale rating exercise weregiven in random order after completing the previous rankingwarm-up exercise.
For practical reasons, however, when consistent with thecriteria adopted in accordance with the MVH protocol, we alsoadopted some approaches and materials used in the recentFrench valuation study [25,34]: the same number of respondents,the same selection of EQ-5D questionnaire health states, and theComputer Assisted Personal Interviewing (CAPI) approach tocollect the data (details below).
The instruments and materials used during data collectionand available in English (from the MVH protocol) and/or Frenchlanguage (from the French study) were translated into the targetlanguage (except the EQ-5D questionnaire, already available in astandard Italian version at www.euroqol.org) and conceptuallyreviewed by L.S. and P.A.C., both native Italian speakers andfamiliar with the source languages, with expertise in HRQOLassessment, in translation and validation of HRQOL instruments,in preference elicitation methods, and use of the EQ-5Dquestionnaire.
The EQ-5D questionnaire descriptive system comprises fivedomains (mobility, self-care, usual activities, pain/discomfort,and anxiety/depression), each one with three possible levels: noproblems (corresponding to level 1), some problems (correspond-ing to level 2), and severe problems (corresponding to level 3).Overall, 243 (35) health-state descriptions can be obtained withthis system by combining every domain level, with 11111 repre-senting the best and 33333 the worst health state [35].
The TTO approach, used to elicit the participants’ preferences,consists of finding the point where the respondent considersliving 10 years in a certain health state (better than dead) asequivalent to living t ≤ 10 years in the best health state (11111).Instead, for states considered worse than dead, it consists offinding the point where a combination of 10 – t years lived in theevaluated health state followed by t o 10 years in the health state11111 is considered equivalent to be dead. The point is found bychanging the length of time until the two options are indifferentfor the respondent [36].
Selection of Health States
The selection of health states to be valued was made according toChevalier and de Pouvourville [25] and is specified in Table 1.Overall, 24 health states þ 33333 were selected to be directlyvalued. We decided to choose these states for some reasons: theirselection was in accordance with suggestions provided by recentresearch [17,18], which shows that a properly reduced number ofstates, than the 42 used in the original MVH protocol, can providesimilar results. Furthermore, because the choice of number statesand related number of respondents can also depend on practicalreasons, those decided in the French valuation study [25] wereconsistent with our budget availabilities. Furthermore, the com-bination of the health states in subsets was already programmed
in the CAPI system that we adopted from the French study;hence, we did not have to reorganize them.
In particular, the states were selected according to thisapproach. To allow the comparison with other valuation studies,the same 17 states (16 states þ 33333) considered by Macran andKind [37] and in several other valuation studies were used [14–24].To reach the number of 24, 8 additional states were randomlyselected from the original subset of 42 states used in the originalMVH protocol [14,32].
According to previous research, 24 (þ 33333) states wereconsidered too many to be valued by one person; hence, theywere divided into three fixed blocks of 8 health states and thesewere paired to create three sets of 16 states each (Table 1)[17,18,25–28,32]. State 33333 was added to each set, making atotal of 17 health states that were assigned to each participant sothat a balanced distribution of all states according to the parti-cipants’ age, gender, and geographical distribution could beguaranteed.
Study Sample
Three hundred observations were estimated to be necessary tovalue each health state. In particular, the sample size calcula-tions were based on the number of respondents needed to obtainan estimation of the TTO mean score with a 95% probability thatthe true mean falls in the interval �0.05. [14,38]. In this calcu-lation, the maximum allowable difference between the samplemean and the true mean in the population was 0.05 and the SDwas 0.4, corresponding to the mean SD observed in previousstudies [25]. The number of respondents per health state calcu-lated was in agreement with the results by Lamers et al. [17].
To obtain 300 observations for each state, a total of 450subjects were necessary (Table 1). Subjects aged between 18 and75 years were recruited to be representative of the Italian generaladult population as regards age (within the established agerange), gender, and geographical distribution. Namely, 30 citiesdistributed on all the country regions were selected according topopulation density. From these cities, the participants meetingthe eligibility criteria were identified and recruited. Non-Italiansubjects were considered eligible if they had lived in Italy for
V A L U E I N H E A L T H 1 6 ( 2 0 1 3 ) 8 1 4 – 8 2 2816
at least 10 years and were able to understand the interview inItalian.
Recruitment and Data Collection
Recruitment and data collection was undertaken from a surveyagency operating in the health care sector (Kantar Health) duringMarch 2012, using the data available in a national database ofinterviews. The eligible subjects were contacted telephonically by30 interviewers (one in each city), and if they accepted theinvitation to participate, an appointment was fixed to conductthe face-to-face interview. By using a written guide, L.S. andP.A.C. directly trained the Kantar Health data collection coordi-nator and four interviewers who were also area managers. Thearea managers then trained the other 26 interviewers under thesupervision of the researchers L.S. and P.A.C. The written guidewas given to the interviewers as an aid. Furthermore, L.S. andP.A.C. were available for any clarification or help needed by theinterviewers during the recruitment and interviews.
We used the CAPI approach to perform the face-to-faceinterviews. With this approach, the interviewers were guidedstep by step in the conduction of the interviews, with the aim tostandardize the process and minimize the potential interviewerbias. The interviewer entered the set of states to be assigned (onpaper cards) to each respondent in the CAPI. The CAPI randomlyselected the order of presentation of the states to be followedduring the TTO exercise and assisted the interviewer in each ofthe activities to be undertaken during the interview.
The interview was performed through a series of tasks. Thefirst task consisted of self-completing a paper format of the EQ-5Dquestionnaire on the respondent’s current health state. Theinterviewer then entered the responses in the CAPI, and therespondent performed the warm-up ranking and rating exercisesby using 19 cards, including the set of 17 states selected for thatinterviewee, state 11111, and dead. To minimize memory effect,the cards were shuffled at each exercise. The participant then didthe TTO exercise, using a two-side TTO board (shown in AppendixA in Supplemental Materials found at http://dx.doi.org/10.1016/j.jval.2013.04.008), one side for states better and the other side forstates worse than dead, reflecting the board used and recom-mended in the MVH protocol [14,32,36]. In particular, each side ofthe TTO board contains a sliding scale to change the length oftime. The exercise was conducted through an iterative process,and started by asking the respondent whether a given state (byinserting the corresponding green card in a transparent pocket onthe board) is worse or better than dead. If the state wasconsidered better than dead, the respondent was asked if he orshe preferred to live 5 years in full health or 10 years in the givenstate, followed by dead. The answer determined whether the 5years would increase to a maximum of 10 years, or decrease to aminimum of 0. The number of years was changed progressively to1 year per time. If the state was considered worse than dead,the respondent was asked if he or she preferred to live 5 years inthe given state followed by 5 years in full health followed by dead,or if he or she rather would have preferred being dead.The answer determined whether the 5 years in a given statewould increase to a maximum of 10 years and the 5 years in fullhealth decrease to a minimum of 0 or vice versa, changingprogressively the number of years to 1 year per time. The exerciseended at the time length when the respondent considered the twooptions equivalent. Finally, respondents were asked to providesociodemographic information, whether they had religiousbeliefs, whether they believed in life after death, and to reporttheir own level of health by using the General Health Itemquestion with five possible levels: excellent (coded as 5), verygood (4), good (3), fair (2), and poor (1) [39]. Finally, they gave theircomments (open questions) on the TTO exercise. The interview
took place at the respondents’ households, and each respondentreceived a gift of the value of around €20 for his or her participation after the interview.
Data Management and Statistical Analyses
Before analyzing the valuation data, we checked for subjects whowere likely not to have understood the task. Those providingincomplete or inconsistent TTO responses according to thefollowing criteria were excluded from the analyses: data missingfor all health states, only one or two states assessed, all statesreporting the same value, and all states valued as worse thandead [40].
The respondents’ characteristics were assessed by usingproportions for categorical data, mean and/or median values ascentral tendency parameters for continuous data, and SD valuesas dispersion parameters. The sample characteristics were com-pared with those available on the Italian population [41].
The responses to the TTO exercise were linearly transformedto obtain values between 1 and �1. For states better than dead,the TTO value (v) was assessed with the following formula:QUOTE v ¼ t/10, where t is the number of years in state 11111.For states worse than dead, we used the following monotonictransformation:
v0 ¼ v1−v
¼ −t10
with t being the number of years in state 11111 [42].The TTO values observed for each health state were described
by using mean, SD, and median values, and reporting thepercentage of respondents valuing the states worse than dead.
Modeling
To estimate the TTO values on all 243 EQ-5D questionnaire healthstates, we tested a number of different models. First, we expecteda relationship to exist between the values given to the differenthealth states evaluated by each subject, violating one keyassumption of the ordinary least square models. Accordingly,we initially checked whether fixed effects and random effects (RE)regression models produced different results. Unlike the fixedeffects approach, the RE approach takes into account the fact thateach individual may have a different pattern of responses incomparison with the population average, which could result inhigher or lower TTO values. Hence, the variance of the error termin the model would be partially determined by each respondent.
The dependent variable included in the regression models wascomputed as 1 minus the observed TTO value and ranges from0 to 2, where lower values correspond to higher utility. We inves-tigated several models in which different independent variables,investigated in previous researches [14,15,17–20,23,25,26,28,43–45],were inserted in several different combinations to find the bestregression model that fits our data. All models were tested andcompared with the others by using the following criteria: logicalconsistency, sign and magnitude of the regression coefficients,model goodness of fit, and parsimony. We report the results of themodel that better satisfied all the criteria specified below, andcompare them with those of a main effects only model (namedbasic model), of the UK model [15], used so far to calculate utilitiesfrom Italian EQ-5D questionnaire data, and of those used in the USmodel [19], of which we adopt some variables to account forinteractions between different dimensions in the Italian model(see Results for details).
Logical consistency between the statesThe predicted value for one health state had to be greater than orequal to the predicted value for another health state if the formerwas better than the latter in at least one dimension and was no

V A L U E I N H E A L T H 1 6 ( 2 0 1 3 ) 8 1 4 – 8 2 2 817
worse in any other dimension [19]. For example, the value of state12111 had to be greater than or equal to the value of state 12121.
Sign and magnitude of the regression coefficientsAmong the logically consistent models we also checked the signand magnitude of each regression coefficient, expecting positivecoefficients for the health-state domain levels and, for each domain,the coefficient of level 3 higher than the coefficient of level 2.
Goodness of fitOn the models chosen according to the criteria specified above,we calculated the mean absolute error (MAE), the number ofhealth states with an absolute error of more than 0.025, morethan 0.05, and more than 0.1, the Pearson correlation coefficient(R2), the Akaike information criterion, and the Bayesian informa-tion criterion. The MAE (which should be o0.05 [38]), the absoluteerror for each health state, and the R2 were calculated betweenthe observed and predicted values and need to be calculated on asample different from the modeling one [14]. Because our samplewas not big enough to be split into a modeling and a validationsample (approach used in the MVH study [14,32]), we used thebootstrap to obtain from our sample (modeling sample) 500validation samples. The bootstrap approach consists of a randomselection with replacements of respondents from the modelingsample. The sample size for the validation samples was the sameas the modeling sample size. For each of these validation samples,the MAE, the absolute error for each health state, and the R2 werecalculated. The arithmetic mean of the MAE and R2 between the500 validation samples is reported. The smaller the Akaike infor-mation criterion , Bayesian information criterion, MAE, and num-ber of states more than 0.025, more than 0.05, and more than 0.1,and higher the R2, the better the goodness of fit of the model.
Principle of parsimonyFinally, we checked and chose the model with the lowest numberof independent variables, among those meeting the criteriaspecified above. This model was selected for the Italian value set.
Further, we used the Wald test to check whether the regressioncoefficients were statistically significantly different from 0 andwhether the different levels within each domain (e.g., regressioncoefficients of MO2 compared with those of MO3) were significantlydifferent from each other, at a two-tailed P value of less than 0.05.
We calculated the mean and the maximum absolute differ-ence between health state values to compare the full Italian EQ-5D questionnaire value set with those of other European andnon-European countries: the United Kingdom and Spain [15],France [25], Germany [26], Poland [28], the United States [19], andJapan [18].
Statistical analyses were performed by using PASW 18.0 andSTATA 11.0 software.
Results
All 450 participants completed the interview. The data of 11(2.4%) respondents, however, were excluded from the analysesbecause they provided the same value for all the states valued.Table 2 shows that the study sample was representative of theItalian general population for age, gender, and geographicaldistribution. The slight difference found in marital status is likelyattributable to the different categories used to define “married”and “unmarried” (see details in the table legend).
More frequently the respondents reported some or severeproblems in pain/discomfort (33.5% of those entering in theanalyses) and anxiety/depression (26.5%), while the domain withfewest problems was self-care. The mean � SD visual analogue
scale score was 84.8 � 13.8, and less than 10% of the respondentsreported fair or poor health with the general health item question.
Each state was answered by at least 282 respondents (Table 3).The TTO exercise was considered too long or difficult by 18.7% ofthe respondents. After the linear transformation, the mean(median) TTO values observed ranged from 0.91(1.00) for states11121, 11211, and 11112 to –0.39 (�0.53) for state 33333. Similarlyto other studies [15,17,25,28], the SDs of the estimates obtainedwere larger among the more severe states. The frequency ofrespondents giving a negative value to the states ranged from0.7% (state 11211) to 68.7% (state 33333).
The observed mean TTO values were always higher than thoseobserved in the UK and Spanish studies [15], on the basis of whichQALYs have been calculated so far for Italy (Fig. 1). Among thedifferences, while 12% of the 25 valued states were on averageconsidered worse than dead in our study, 44% had negative valuesin the Spanish and in the UK valuation studies [15].
After testing different possible models, we chose the onenamed Italian model, shown in Table 4. It is an RE model including10 main effect dummy variables to capture, for each healthdimension, the shift from having no problems to having someproblems (MO2, SC2, UA2, PD2, and AD2), and to having extremeproblems (MO3, SC3, UA3, PD3, and AD3); it does not include theintercept, while the D1 variable (as in the US model [19]) is addedto account for interactions between different dimensions. Inparticular, the D1 variable captures the number of dimensionsaway from level 1 beyond the first and has a value that rangesfrom 0 to 4 (e.g., for state 11231, D1 ¼ 1; for state 21221, D1 ¼ 2).The other interaction variables tested in the US model (I2, I3, I2sq,and I3sq) were not included in the Italian model because theresults did not satisfy the logical consistency or the efficiencycriteria. The model chosen allows for estimates that are logicallyconsistent, with an R2 value of 0.389, an MAE of 0.03, and only twohealth states with an absolute error higher than 0.05. Thegoodness-of-fit results are similar to those of the models usedin other valuation studies [14,17,19,20,22,23,25,28,43,44]. All theregression coefficients are statistically significantly different from0, and the severity levels of each domain are significantly differ-ent from each other (P o 0.0001).
The final Italian model is more efficient than the base model,which includes only the main effects and intercept, and moreefficient than the UK model, used in the Spanish and UKvaluation studies, which have an MAE of more than 0.05(Table 4). The US model proved to be slightly more efficient thanthe Italian model (Table 4); however, the estimates obtained withthe US model presented logical inconsistencies between somestates. Finally, the Italian model, which includes 11 parameters,is also more parsimonious than the UK and the US models, whichcontain 12 and 14 independent variables, respectively.
The Italian utility index for each EQ-5D questionnaire healthstate can be computed by using the following formula:
Utility ¼ 1 – 0.076MO2 – 0.518MO3 – 0.100SC2 – 0.289SC3 –
0.085UA2 – 0.198UA3 – 0.098PD2 – 0.334PD3 –
0.095AD2 – 0.213AD3 – (�0.043)D1The full Italian value set on the 243 EQ-5D questionnaire health
states is shown in Appendix B in Supplemental Materials found athttp://dx.doi.org/10.1016/j.jval.2013.04.008. Figure 2 shows differentpatterns for the estimated Italian value set and those estimated inother countries: our estimates are systematically higher than thoseobtained with the UK and Spanish algorithms established manyyears ago [15]: in particular, the mean (maximum) absolute differences correspond to 0.296 (0.551) with the UK tariffs and to 0.301(0.506) with the Spanish tariffs, respectively. Similar differenceswere found with the estimates obtained in France a few years agofrom the same selection of health states and a similar number ofobservations: the mean (maximum) absolute differences with theFrench estimates [25] corresponded to 0.354 (0.700). Instead, the
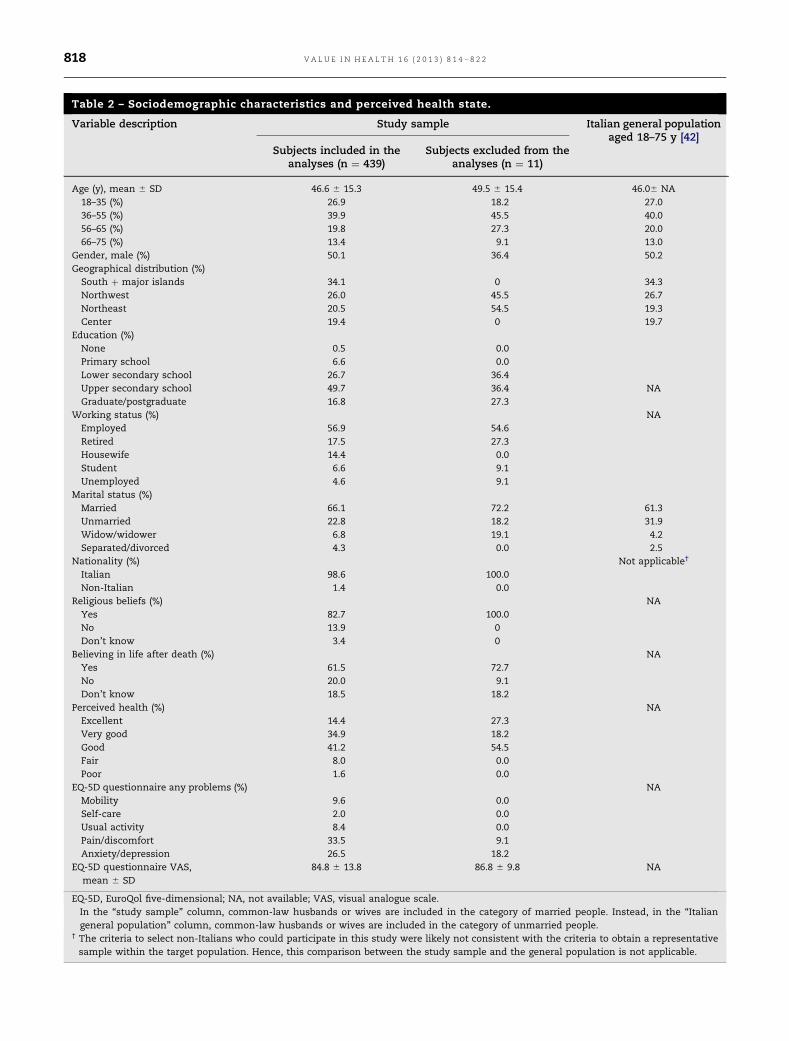
Table 2 – Sociodemographic characteristics and perceived health state.
Variable description Study sample Italian general populationaged 18–75 y [42]
Subjects included in theanalyses (n ¼ 439)
Subjects excluded from theanalyses (n ¼ 11)
Age (y), mean � SD 46.6 � 15.3 49.5 � 15.4 46.0� NA18–35 (%) 26.9 18.2 27.036–55 (%) 39.9 45.5 40.056–65 (%) 19.8 27.3 20.066–75 (%) 13.4 9.1 13.0
Gender, male (%) 50.1 36.4 50.2Geographical distribution (%)South þ major islands 34.1 0 34.3Northwest 26.0 45.5 26.7Northeast 20.5 54.5 19.3Center 19.4 0 19.7
Education (%)None 0.5 0.0Primary school 6.6 0.0Lower secondary school 26.7 36.4Upper secondary school 49.7 36.4 NAGraduate/postgraduate 16.8 27.3
Working status (%) NAEmployed 56.9 54.6Retired 17.5 27.3Housewife 14.4 0.0Student 6.6 9.1Unemployed 4.6 9.1
Marital status (%)Married� 66.1 72.2 61.3Unmarried� 22.8 18.2 31.9Widow/widower 6.8 19.1 4.2Separated/divorced 4.3 0.0 2.5
Nationality (%) Not applicable†
Italian 98.6 100.0Non-Italian 1.4 0.0
Religious beliefs (%) NAYes 82.7 100.0No 13.9 0Don’t know 3.4 0
Believing in life after death (%) NAYes 61.5 72.7No 20.0 9.1Don’t know 18.5 18.2
Perceived health (%) NAExcellent 14.4 27.3Very good 34.9 18.2Good 41.2 54.5Fair 8.0 0.0Poor 1.6 0.0
EQ-5D questionnaire any problems (%) NAMobility 9.6 0.0Self-care 2.0 0.0Usual activity 8.4 0.0Pain/discomfort 33.5 9.1Anxiety/depression 26.5 18.2
EQ-5D questionnaire VAS,mean � SD
84.8 � 13.8 86.8 � 9.8 NA
EQ-5D, EuroQol five-dimensional; NA, not available; VAS, visual analogue scale.� In the “study sample” column, common-law husbands or wives are included in the category of married people. Instead, in the “Italiangeneral population” column, common-law husbands or wives are included in the category of unmarried people.
† The criteria to select non-Italians who could participate in this study were likely not consistent with the criteria to obtain a representativesample within the target population. Hence, this comparison between the study sample and the general population is not applicable.
V A L U E I N H E A L T H 1 6 ( 2 0 1 3 ) 8 1 4 – 8 2 2818

Table 3 – Estimates on the observed TTO values.
Health state No. of observations Mean Median SD Respondents valuingthe state as WTD (%)
11121 294 0.91 1.00 0.23 1.711211 293 0.91 1.00 0.20 0.711112 294 0.91 1.00 0.25 1.721111 290 0.90 1.00 0.22 1.012111 290 0.89 1.00 0.29 3.422121 288 0.84 0.93 0.24 1.411113 288 0.77 0.93 0.38 4.222122 286 0.77 0.93 0.38 5.911312 290 0.73 0.88 0.39 5.522222 283 0.70 0.85 0.44 7.411131 286 0.64 0.83 0.47 9.113311 286 0.61 0.73 0.49 9.121323 286 0.57 0.73 0.48 10.811133 289 0.53 0.73 0.51 12.822233 287 0.35 0.63 0.58 21.623313 286 0.35 0.63 0.59 23.432211 288 0.35 0.63 0.59 22.223232 282 0.30 0.53 0.60 24.513332 283 0.18 0.38 0.62 30.032223 285 0.15 0.33 0.63 33.332313 286 0.14 0.28 0.62 33.233321 285 0.04 0.00 0.64 41.133232 286 �0.10 0.00 0.63 49.033323 290 �0.21 -0.38 0.59 55.533333 431 �0.39 -0.53 0.55 68.7
TTO, time trade-off; WTD, worse than dead.
Fig. 1 – Comparison of the TTO mean values (represented in the y-axis) estimated on the 25 health states (specified in the x-axis) that were valued in the Italian, UK, and Spanish valuation studies [15]. The health states are ranked in decreasing orderaccording to the mean values estimated for Italy and represented with the black curve, compared with the UK values (darkgrey curve) and with the Spanish values (light grey curve).
V A L U E I N H E A L T H 1 6 ( 2 0 1 3 ) 8 1 4 – 8 2 2 819
Italian values show more similarities with those recently esti-mated in other European countries (e.g., Germany [26] and Poland[28]), the United States [19] and Japan [18], with the following mean(maximum) absolute differences: 0.132 (0.401) with German tariffs,0.106 (0.320) with Polish tariffs, 0.103 (0.271) with US tariffs, and0.083 (0.270) with the Japanese ones.
Discussion
To the best of our knowledge, this is the first valuation studyproviding Italian-specific utility values for the estimation ofQALYs on Italian EQ-5D questionnaire data.
To perform this study, we followed the MVH protocol revisedin 2009 [33] on a sample that was representative of the Italiangeneral adult population for age (between 18 and 75 years),gender, and geographical distribution. An RE regression modelwas used to take into account the relationships existing betweenthe values attributed by each subject to the different health statesevaluated. We investigated several regression models, with maineffects and interaction terms differently coded, to find the oneproviding estimates logically consistent and with a good level ofstatistical efficiency. The best model found includes, togetherwith the 10 dummy variables for every EQ-5D questionnairedomain level, a D1 variable that takes into account interactions
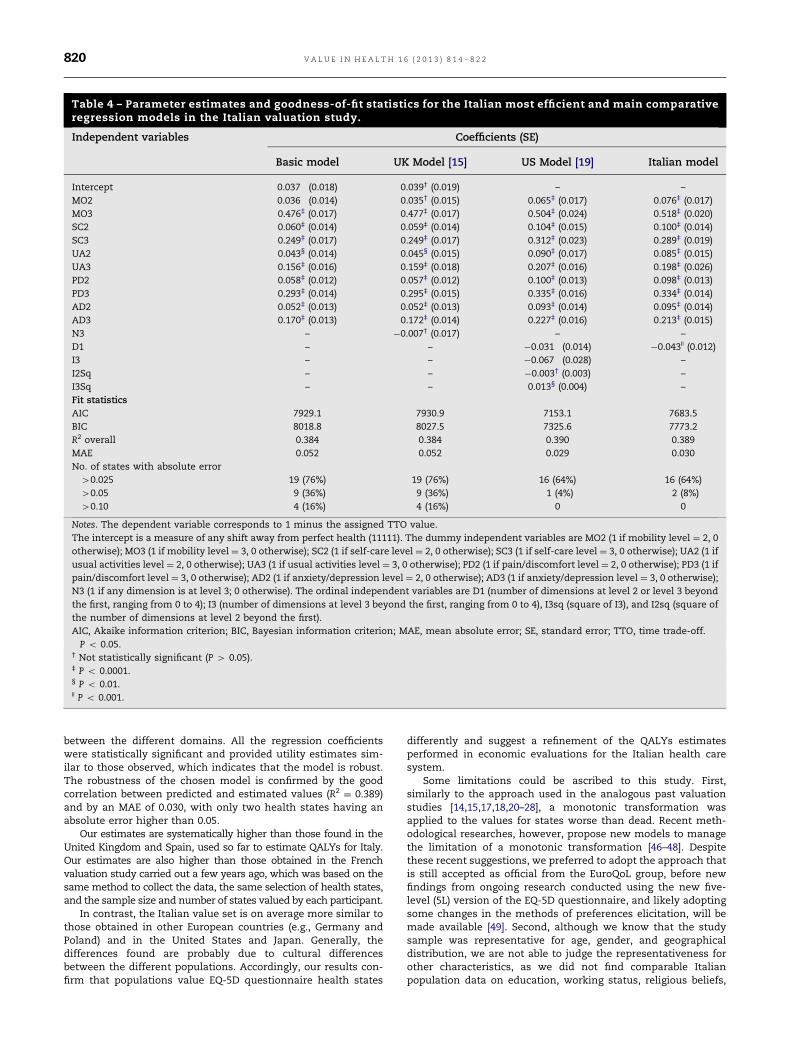
Table 4 – Parameter estimates and goodness-of-fit statistics for the Italian most efficient and main comparativeregression models in the Italian valuation study.
Independent variables Coefficients (SE)
Basic model UK Model [15] US Model [19] Italian model
Intercept 0.037� (0.018) 0.039† (0.019) – –
MO2 0.036� (0.014) 0.035† (0.015) 0.065‡ (0.017) 0.076‡ (0.017)MO3 0.476‡ (0.017) 0.477‡ (0.017) 0.504‡ (0.024) 0.518‡ (0.020)SC2 0.060‡ (0.014) 0.059‡ (0.014) 0.104‡ (0.015) 0.100‡ (0.014)SC3 0.249‡ (0.017) 0.249‡ (0.017) 0.312‡ (0.023) 0.289‡ (0.019)UA2 0.043§ (0.014) 0.045§ (0.015) 0.090‡ (0.017) 0.085‡ (0.015)UA3 0.156‡ (0.016) 0.159‡ (0.018) 0.207‡ (0.016) 0.198‡ (0.026)PD2 0.058‡ (0.012) 0.057‡ (0.012) 0.100‡ (0.013) 0.098‡ (0.013)PD3 0.293‡ (0.014) 0.295‡ (0.015) 0.335‡ (0.016) 0.334‡ (0.014)AD2 0.052‡ (0.013) 0.052‡ (0.013) 0.093‡ (0.014) 0.095‡ (0.014)AD3 0.170‡ (0.013) 0.172‡ (0.014) 0.227‡ (0.016) 0.213‡ (0.015)N3 – �0.007† (0.017) – –
D1 – – �0.031� (0.014) �0.043|| (0.012)I3 – – �0.067� (0.028) –
I2Sq – – �0.003† (0.003) –
I3Sq – – 0.013§ (0.004) –
Fit statisticsAIC 7929.1 7930.9 7153.1 7683.5BIC 8018.8 8027.5 7325.6 7773.2R2 overall 0.384 0.384 0.390 0.389MAE 0.052 0.052 0.029 0.030No. of states with absolute error40.025 19 (76%) 19 (76%) 16 (64%) 16 (64%)40.05 9 (36%) 9 (36%) 1 (4%) 2 (8%)40.10 4 (16%) 4 (16%) 0 0
Notes. The dependent variable corresponds to 1 minus the assigned TTO value.The intercept is a measure of any shift away from perfect health (11111). The dummy independent variables are MO2 (1 if mobility level ¼ 2, 0otherwise); MO3 (1 if mobility level ¼ 3, 0 otherwise); SC2 (1 if self-care level ¼ 2, 0 otherwise); SC3 (1 if self-care level ¼ 3, 0 otherwise); UA2 (1 ifusual activities level ¼ 2, 0 otherwise); UA3 (1 if usual activities level ¼ 3, 0 otherwise); PD2 (1 if pain/discomfort level ¼ 2, 0 otherwise); PD3 (1 ifpain/discomfort level ¼ 3, 0 otherwise); AD2 (1 if anxiety/depression level ¼ 2, 0 otherwise); AD3 (1 if anxiety/depression level ¼ 3, 0 otherwise);N3 (1 if any dimension is at level 3; 0 otherwise). The ordinal independent variables are D1 (number of dimensions at level 2 or level 3 beyondthe first, ranging from 0 to 4); I3 (number of dimensions at level 3 beyond the first, ranging from 0 to 4), I3sq (square of I3), and I2sq (square ofthe number of dimensions at level 2 beyond the first).AIC, Akaike information criterion; BIC, Bayesian information criterion; MAE, mean absolute error; SE, standard error; TTO, time trade-off.� P o 0.05.† Not statistically significant (P 4 0.05).‡ P o 0.0001.§ P o 0.01.|| P o 0.001.
V A L U E I N H E A L T H 1 6 ( 2 0 1 3 ) 8 1 4 – 8 2 2820
between the different domains. All the regression coefficientswere statistically significant and provided utility estimates sim-ilar to those observed, which indicates that the model is robust.The robustness of the chosen model is confirmed by the goodcorrelation between predicted and estimated values (R2 ¼ 0.389)and by an MAE of 0.030, with only two health states having anabsolute error higher than 0.05.
Our estimates are systematically higher than those found in theUnited Kingdom and Spain, used so far to estimate QALYs for Italy.Our estimates are also higher than those obtained in the Frenchvaluation study carried out a few years ago, which was based on thesame method to collect the data, the same selection of health states,and the sample size and number of states valued by each participant.
In contrast, the Italian value set is on average more similar tothose obtained in other European countries (e.g., Germany andPoland) and in the United States and Japan. Generally, thedifferences found are probably due to cultural differencesbetween the different populations. Accordingly, our results con-firm that populations value EQ-5D questionnaire health states
differently and suggest a refinement of the QALYs estimatesperformed in economic evaluations for the Italian health caresystem.
Some limitations could be ascribed to this study. First,similarly to the approach used in the analogous past valuationstudies [14,15,17,18,20–28], a monotonic transformation wasapplied to the values for states worse than dead. Recent meth-odological researches, however, propose new models to managethe limitation of a monotonic transformation [46–48]. Despitethese recent suggestions, we preferred to adopt the approach thatis still accepted as official from the EuroQoL group, before newfindings from ongoing research conducted using the new five-level (5L) version of the EQ-5D questionnaire, and likely adoptingsome changes in the methods of preferences elicitation, will bemade available [49]. Second, although we know that the studysample was representative for age, gender, and geographicaldistribution, we are not able to judge the representativeness forother characteristics, as we did not find comparable Italianpopulation data on education, working status, religious beliefs,
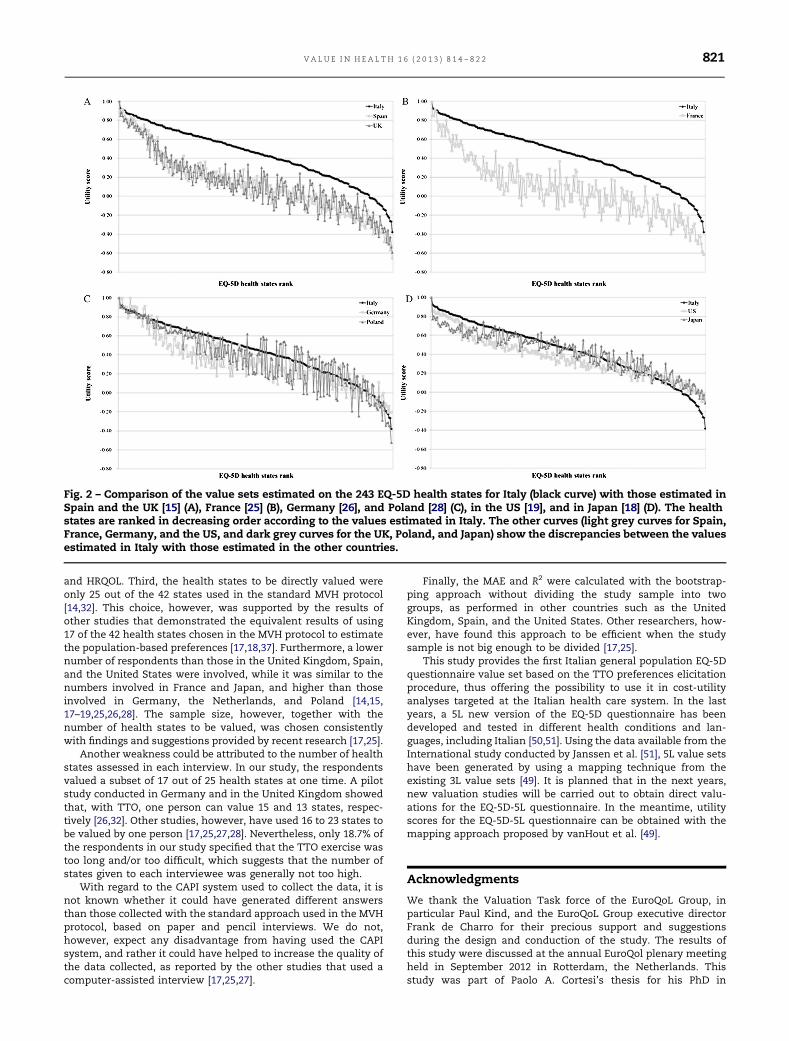
Fig. 2 – Comparison of the value sets estimated on the 243 EQ-5D health states for Italy (black curve) with those estimated inSpain and the UK [15] (A), France [25] (B), Germany [26], and Poland [28] (C), in the US [19], and in Japan [18] (D). The healthstates are ranked in decreasing order according to the values estimated in Italy. The other curves (light grey curves for Spain,France, Germany, and the US, and dark grey curves for the UK, Poland, and Japan) show the discrepancies between the valuesestimated in Italy with those estimated in the other countries.
V A L U E I N H E A L T H 1 6 ( 2 0 1 3 ) 8 1 4 – 8 2 2 821
and HRQOL. Third, the health states to be directly valued wereonly 25 out of the 42 states used in the standard MVH protocol[14,32]. This choice, however, was supported by the results ofother studies that demonstrated the equivalent results of using17 of the 42 health states chosen in the MVH protocol to estimatethe population-based preferences [17,18,37]. Furthermore, a lowernumber of respondents than those in the United Kingdom, Spain,and the United States were involved, while it was similar to thenumbers involved in France and Japan, and higher than thoseinvolved in Germany, the Netherlands, and Poland [14,15,17–19,25,26,28]. The sample size, however, together with thenumber of health states to be valued, was chosen consistentlywith findings and suggestions provided by recent research [17,25].
Another weakness could be attributed to the number of healthstates assessed in each interview. In our study, the respondentsvalued a subset of 17 out of 25 health states at one time. A pilotstudy conducted in Germany and in the United Kingdom showedthat, with TTO, one person can value 15 and 13 states, respec-tively [26,32]. Other studies, however, have used 16 to 23 states tobe valued by one person [17,25,27,28]. Nevertheless, only 18.7% ofthe respondents in our study specified that the TTO exercise wastoo long and/or too difficult, which suggests that the number ofstates given to each interviewee was generally not too high.
With regard to the CAPI system used to collect the data, it isnot known whether it could have generated different answersthan those collected with the standard approach used in the MVHprotocol, based on paper and pencil interviews. We do not,however, expect any disadvantage from having used the CAPIsystem, and rather it could have helped to increase the quality ofthe data collected, as reported by the other studies that used acomputer-assisted interview [17,25,27].
Finally, the MAE and R2 were calculated with the bootstrap-ping approach without dividing the study sample into twogroups, as performed in other countries such as the UnitedKingdom, Spain, and the United States. Other researchers, how-ever, have found this approach to be efficient when the studysample is not big enough to be divided [17,25].
This study provides the first Italian general population EQ-5Dquestionnaire value set based on the TTO preferences elicitationprocedure, thus offering the possibility to use it in cost-utilityanalyses targeted at the Italian health care system. In the lastyears, a 5L new version of the EQ-5D questionnaire has beendeveloped and tested in different health conditions and lan-guages, including Italian [50,51]. Using the data available from theInternational study conducted by Janssen et al. [51], 5L value setshave been generated by using a mapping technique from theexisting 3L value sets [49]. It is planned that in the next years,new valuation studies will be carried out to obtain direct valu-ations for the EQ-5D-5L questionnaire. In the meantime, utilityscores for the EQ-5D-5L questionnaire can be obtained with themapping approach proposed by vanHout et al. [49].
Acknowledgments
We thank the Valuation Task force of the EuroQoL Group, inparticular Paul Kind, and the EuroQoL Group executive directorFrank de Charro for their precious support and suggestionsduring the design and conduction of the study. The results ofthis study were discussed at the annual EuroQol plenary meetingheld in September 2012 in Rotterdam, the Netherlands. Thisstudy was part of Paolo A. Cortesi’s thesis for his PhD in

V A L U E I N H E A L T H 1 6 ( 2 0 1 3 ) 8 1 4 – 8 2 2822
Epidemiology and Biostatistics, at the University of Milan-Bicocca.
Source of financial support: This work was funded by theCHARTA Foundation and the EuroQoL group.
Supplemental Materials
Supplemental material accompanying this article can be found inthe online version as a hyperlink at http://dx.doi.org/10.1016/j.jval.2013.04.008 or, if a hard copy of article, at www.valueinhealthjournal.com/issues (select volume, issue, and article).
R E F E R E N C E S
[1] Ministry of Health—Italian National Health Service spending (2011).Ministry of Health Web site: http://www.salute.gov.it/dettaglio/dettaglioNews.jsp?id=2086&tipo=new. [Accessed October 29, 2012].
[2] Capri S, Ceci A, Terranova L, et al. Guidelines for economic evaluationsin Italy: recommendations from the Italian Group ofPharmacoeconomic Studies. Drug Inf J 2001;35:189–201.
[3] AIES. Proposta di Linee Guida per la valutazione economia degliinterventi sanitari. Politiche Sanitarie 2009;10:91–9.
[4] Ministry of Health. Piano Nazionale di Prevenzione Vaccinale. Availablefrom: http://www.salute.gov.it/imgs/C_17_pubblicazioni_1721_allegato.pdf. [Accessed October 29, 2012].
[5] Benedini V, Caporaso N, Corazza GR, et al. Burden of Crohn’s disease:economics and quality of life aspects in Italy. Clinicoecon OutcomesRes 2012;4:209–18.
[6] Allegra L, Cremonesi G, Girbino G, et al. PRISMA (ProspectIve Study onasthMA control) Study Group. Real-life prospective study on asthmacontrol in Italy: cross-sectional phase results. Respir Med2012;106:205–14.
[7] Faggioli G, Scalone L, Mantovani LG, et al. Preferences of patients, theirfamily caregivers and vascular surgeons in the choice of abdominalaortic aneurysms treatment options: the PREFER study. Eur J VascEndovasc Surg 2011;42:26–34.
[8] Giardina S, Pane B, Spinella G, et al. An economic evaluation of anabdominal aortic aneurysm screening program in Italy. J Vasc Surg2011;54:938–46.
[9] Gualtierotti R, Scalone L, Ingegnoli F, et al. [Health related quality of lifeassessment in patients with systemic sclerosis]. Reumatismo2010;62:210–4. (Italian).
[10] Olivieri I, de Portu S, Salvarani C, et al. The psoriatic arthritis costevaluation study: a cost-of-illness study on tumour necrosis factorinhibitors in psoriatic arthritis patients with inadequate response toconventional therapy. Rheumatology (Oxford) 2008;47:1664–70.
[11] Scalone L, Mantovani LG, Krol M, et al. Costs, quality of life, treatmentsatisfaction and compliance in patients with β-thalassemia majorundergoing iron chelation therapy: the ITHACA study. Curr Med ResOpin 2008;24:1905–17.
[12] Gringeri A, Mantovani LG, Scalone L, Mannucci PM. Cost of care andquality of life in hemophilia complicated by inhibitors: the COCIS StudyGroup. Blood 2003;102:2358–63.
[13] Stamuli E. Health outcomes in economic evaluation: who should valuehealth? Br Med Bull 2011;97:197–210.
[14] Dolan P. Modeling valuations for EuroQol health states. Med Care1997;35:1095–108.
[15] Badia X, Roset M, Herdman M, et al. A comparison of United Kingdomand Spanish general population time trade-off values for EQ-5D healthstates. Med Decis Making 2001;21:7–16.
[16] Bansback N, Tsuchiya A, Brazier J, et al. Valuation of EQ-5D healthstates: preliminary value set and considerations for future valuationstudies. PloS One 2012;7:e31115.
[17] Lamers LM, McDonnell J, Stalmeier PF, et al. The Dutch tariff: resultsand arguments for an effective design for national EQ-5D valuationstudies. Health Econ 2006;15:1121–32.
[18] Tsuchiya A, Ikeda S, Ikegami N, et al. Estimating an EQ-5D populationvalue set: the case of Japan. Health Econ 2002;11:341–53.
[19] Shaw JW, Johnson JA, Coons SJ. US valuation of the EQ-5D health states:development and testing of the D1 valuation model. Med Care2005;43:203–20.
[20] Zarate V, Kind P, Chuang LH. Hispanic valuation of the EQ-5D healthstates: a social value set for Latin Americans. Value Health2008;11:1170–7.
[21] Augustovski FA, Irazola VE, Velazquez AP, et al. Argentine valuation ofthe EQ-5D health states. Value Health 2009;12:587–96.
[22] Yusof FA, Goh A, Azmi S. Estimating an EQ-5D value set for Malaysiausing time trade-off and visual analogue scale methods. Value Health2012;15(1, Suppl.):S85–90.
[23] Zarate V, Kind P, Valenzuela P, et al. Social evaluation of EQ-5D healthstates: the Chilean case. Value Health 2011;14:1135–41.
[24] Viney R, Norman R, King MT, et al. Time trade-off derived EQ-5Dweights for Australia. Value Health 2011;14:928–36.
[25] Chevalier J, de Pouvourville G. Valuing EQ-5D using time trade-off inFrance. Eur J Health Econ 2013;14(1):57–66.
[26] Greiner W, Claes C, Busschbach JJ, et al. Validating the EQ-5D with timetrade-off for the German population. Eur J Health Econ 2005;6:124–30.
[27] Wittrup-Jensen KU, Lauridsen J, Gudex C, et al. Generation of a DanishTTO value set for EQ-5D health states. Scand J Public Health2009;37:459–66.
[28] Golicki D, Jakubczyk M, Niewada M, et al. Valuation of EQ-5D healthstates in Poland: first TTO-based social value set in Central and EasternEurope. Value Health 2010;13:289–97.
[29] Johnson JA, Ohinmaa A, Murti B, et al. Comparison of Finnish and U.S.-based visual analog scale valuations of the EQ-5D measure. Med DecisMaking 2000;20:281–9.
[30] Johnson JA, Luo N, Shaw J, et al. Valuations of EQ-5D health states: arethe United States and United Kingdom different? Med Care2005;43:221–8.
[31] Heijink R, van Baal P, Oppe M, et al. Decomposing cross-countrydifferences in quality adjusted life expectancy: the impact of value sets.Population Health Metrics 2011;9:17.
[32] Dolan P, Gudex C, Kind P, et al. The time trade-off method: results froma general population study. Health Econ 1996;5:141–54.
[33] Kind P. A revised protocol for the valuation of health states defined bythe EQ-5D-3L classification system – learning the lessons from the MVHstudy. Presented at: 26th Plenary Meeting of the EuroQoL Group. Paris,2009.
[34] Chevalier J, de Pouvourville G. Valuing EQ-5D using time trade-off inFrance. Presented at: 26th Plenary Meeting of the EuroQoL Group. Paris,2009.
[35] Rabin R, de Charro F. EQ-5D: a measure of health status from theEuroQol Group. Ann Med 2001;33:337–43.
[36] Gudex C. Time Trade-Off User Manual: Props and Self-CompletionMethods. York: Centre for Health Economics, University of York, 1994.
[37] Macran S, Kind P. Valuing EQ-5D health states using a modified MVHprotocol: preliminary results. In: Badia X, Herdman M, Roset M, eds.,Proceedings of the 16th Plenary Meeting of the EuroQol Group, pp. 205–40. Barcelona, Spain: Institut de SalutPublica de Catalunya, 2000.
[38] O’Brien BJ, Drummond MF. Statistical versus quantitative significancein the socioeconomic evaluation of medicines. Pharmacoeconomic1994;5:389.
[39] McDowell I, Newell C. Measuring Health: A Guide to Rating Scales andQuestionnaires, (2nd Ed.). Oxford, UK: Oxford University Press, 1996.
[40] Szende A, Oppe M, Devlin N. EQ-5D Value Sets: Inventory, ComparativeReview and User Guide. Dordrecht, The Netherlands: Springer, 2007.
[41] Italian National Institute of Statistic. Demo Istat 2010. Available from:http://demo.istat.it/pop2010/index.html. [Accessed October 31, 2012].
[42] Lamers LM. The transformation of utilities for health states worse thandeath: consequences for the estimation of EQ-5D value sets. Med Care2007;45:238–44.
[43] Jo MW, Yun SC, Lee SI. Estimating quality weights for EQ-5D healthstates with the time trade-off method in South Korea. Value Health2008;11:1186–9.
[44] Lee YK, Nam HS, Chuang LH, et al. South Korean time trade-off valuesfor EQ-5D health states: modeling with observed values for 101 healthstates. Value Health 2009;12:1187–93.
[45] Tongsiri S, Cairns J. Estimating population-based values for EQ-5Dhealth states in Thailand. Value Health 2011;14:1142–5.
[46] Craig BM, Busschbach JJV. The episodic random utility model unifiestime trade-off and discrete choice approaches in health state valuation.Population Health Metrics 2009;7:3.
[47] Augestad LA, Rand-Hendriksen K, Kristiansen ISN, Stavem K. Impact oftransformation of negative values and regression models ondifferences between the UK and US EQ-5D time trade-off value sets.Pharmacoeconomics 2012;30:1203–14.
[48] Craig BM, Busschbach JJ. Revisiting United States valuation of EQ-5Dstates. J Health Econ 2011;30:1057–63.
[49] vanHout B, Janssen MF, Feng YS, et al. Value sets for the EQ-5D-5L: amapping approach. Value Health 2012;15:708–15.
[50] Scalone L, Ciampichini R, Fagiuoli S, et al. Comparing the performanceof the standard EQ-5D 3L with the new version EQ-5D 5L in patientswith chronic hepatic diseases. Qual Life Res 2012 [Epub ahead of print].
[51] Janssen MF, Pickard AS. Golicki D, et al. Measurement properties of theEQ-5D-5L compared to the EQ-5D-3L across eight patient groups: amulti-country study. Qual Life Res 2012 [Epub ahead of print].