Mt Carbine Bankable Feasibility Study - EQ Resources Limited
257
MT CARBINE BANKABLE FEASIBILITY STUDY CHAPTER 3: GEOLOGY AND RESOURCES DECEMBER 2021
-
Upload
khangminh22 -
Category
Documents
-
view
1 -
download
0
Transcript of Mt Carbine Bankable Feasibility Study - EQ Resources Limited
MT CARBINE BANKABLE FEASIBILITY STUDY
CHAPTER 3: GEOLOGY AND RESOURCES DECEMBER 2021

Mt Carbine Bankable Feasibility Study – Chapter 3: Geology and Resources
1
Document History
REVISION DATE AUTHOR CHANGE DESCRIPTION APPROVED BY
A 5/11/21 AB Initial Draft PJ
B 20/11/21 AB Issued for Review KM
C 2/12/21 AB Issued for Approval KM
0 08/12/21 AB Issued for Use KM

Mt Carbine Bankable Feasibility Study – Chapter 3: Geology and Resources
2
CONTENTS
1. INTRODUCTION ............................................................................................................................ 1
1.1 Context ........................................................................................................................................... 1
1.1. Purpose .......................................................................................................................................... 1
2. TENURE ......................................................................................................................................... 2
3. EXPLORATION AND MINING HISTORY ..................................................................................... 3
4. REGIONAL GEOLOGY ................................................................................................................. 6
5. DEPOSIT GEOLOGY .................................................................................................................... 8
5.1. Host Rock Geological History ........................................................................................................ 8
5.2. Mineralisation ................................................................................................................................. 8
5.3. Structure .......................................................................................................................................12
5.4. Tungsten Model ...........................................................................................................................15
6. EXPLORATION ...........................................................................................................................17
6.1. Previous Exploration ....................................................................................................................17
6.2. Data Collection .............................................................................................................................17
6.3. Exploration Results ......................................................................................................................20
6.4. Exploration Potential ....................................................................................................................22
7. LOW GRADE STOCKPILE ASSESSMENT ...............................................................................25
7.1. LGS Summary ..............................................................................................................................25
7.2. Historical Ore Extraction & Dump Formation ...............................................................................25
7.3. Sampling ......................................................................................................................................25
7.4. Current Mining of LGS .................................................................................................................30
8. QUALITY ASSURANCE, CONTROL AND SAMPLING .............................................................32
8.1. Recheck of Old Core Visual Results ............................................................................................32
8.2. Drillings Sampling Procedure .......................................................................................................32
8.3. QAQC Results ..............................................................................................................................33
9. RESOURCE ESTIMATION ..........................................................................................................36
10. METALLURGICAL CHARACTERISATION ................................................................................38
11. HYDROGEOLOGY ......................................................................................................................41
11.1. Groundwater.................................................................................................................................41
11.2. Water Quality................................................................................................................................42
11.3. Ongoing Hydrogeological Assessment ........................................................................................42
12. GEOTECHNICAL APPRAISAL...................................................................................................43
12.1. Drill Hole Data ..............................................................................................................................43
12.2. Geotechnical Conditions ..............................................................................................................43
12.3. Geotechnical Considerations to Mining .......................................................................................45
13. GRADE CONTROL .....................................................................................................................46
13.1. Ongoing Grade Control Activities .................................................................................................46
13.2. Geological Department Functions ................................................................................................48
14. REFERENCES .............................................................................................................................50
15. LIST OF ABBREVIATIONS .........................................................................................................52

Mt Carbine Bankable Feasibility Study – Chapter 3: Geology and Resources
3
LIST OF TABLES
Table 1: Historical Mt Carbine Studies ............................................................................................................ 17
Table 2: Total Drill Hole Statistics .................................................................................................................... 20
Table 3: LGS Grade by Size Distribution ......................................................................................................... 25
Table 4: LGS Head Grade ............................................................................................................................... 30
Table 5: Mt Carbine Mineral Resource – September 2021 ............................................................................. 36
Table 6: Element Differences in Host and Ore Bodies .................................................................................... 39
Table 7: GCPL Interpretation of Strength of Intact Rock and Structure .......................................................... 45
Table 8: Grade Control Cost Estimate ............................................................................................................. 46
Table 9: Geological Department Operational Costs ........................................................................................ 47
Table 10: Geological Department .................................................................................................................... 49
LIST OF FIGURES
Figure 1: Mt Carbine Lease Boundaries and Surrounding Exploration Tenements .......................................... 2
Figure 2: 1946 Government Map of Historical Workings ................................................................................... 3
Figure 3: Mt Carbine Open Pit ........................................................................................................................... 4
Figure 4: Aerial View of Low Grade Stockpile ................................................................................................... 5
Figure 5: Regional Geological Setting of Mt Carbine ........................................................................................ 6
Figure 6: Mt Carbine Geology Area Showing Intrusives and Sediments of the Hodkinson Formation ............. 7
Figure 7: King Veins Showing Coarse Vein Textures of Wolframite Crystals ................................................... 9
Figure 8: Core Showing Late Replacement of Wolframite by Fine Network Retrograde Scheelite .................. 9
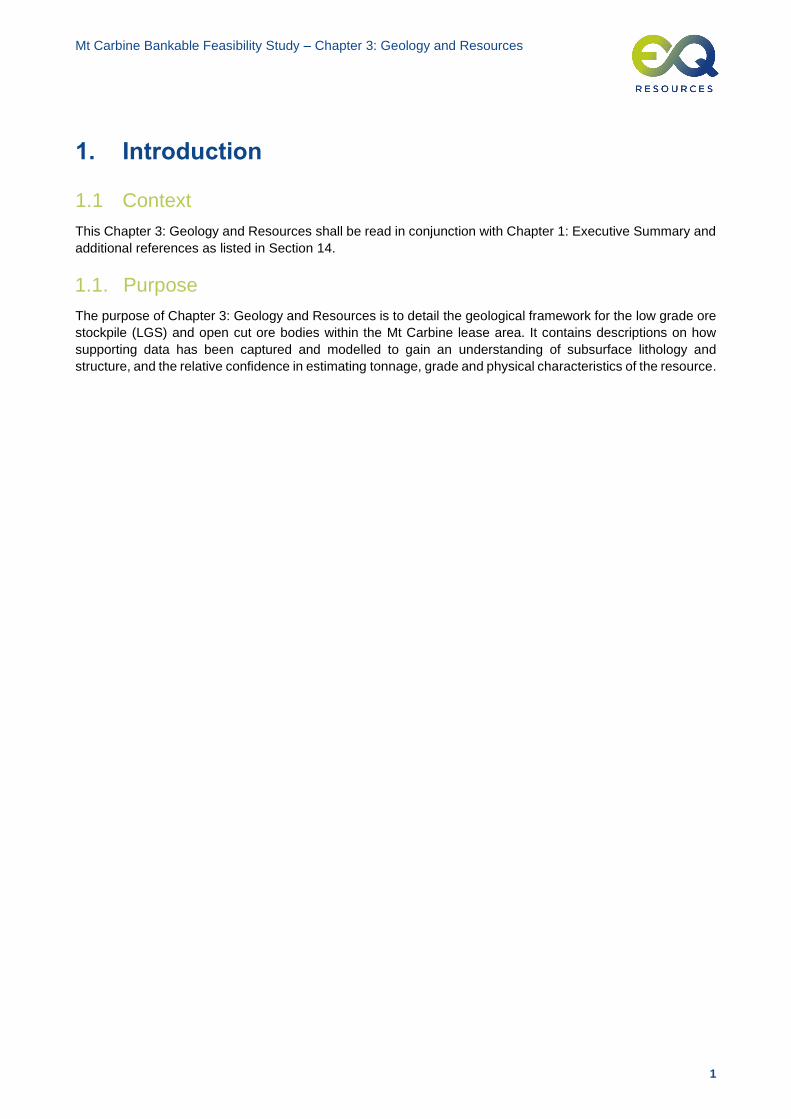
Figure 9: Close up of Wolframite from Drilling ................................................................................................. 10
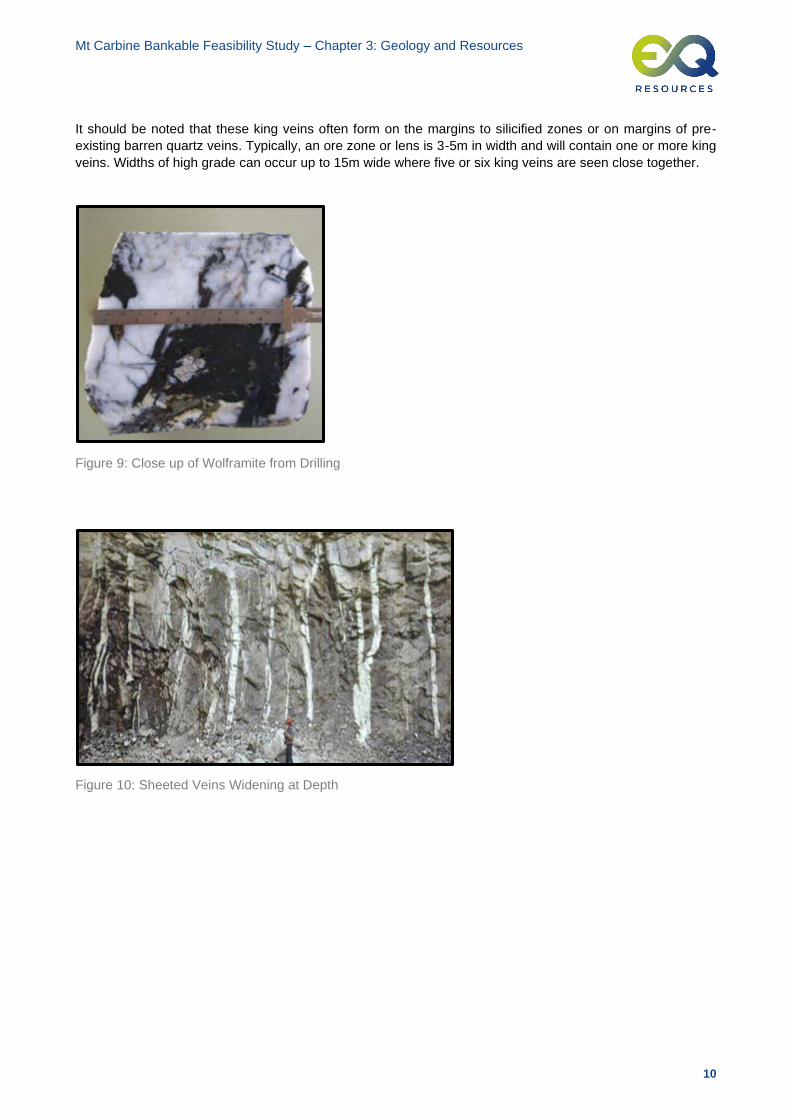
Figure 10: Sheeted Veins Widening at Depth ................................................................................................. 10
Figure 11: Typical Ore Section Through Open Pit .......................................................................................... 11
Figure 12: Zone of Silicified Cherts & Metasediments with King Veins on Margins ........................................ 12
Figure 13: Open Pit Showing South Wall Fault ............................................................................................... 13
Figure 14: Formation of Veins at Mt Carbine Outlining the Structural Stress at the Time .............................. 14
Figure 15: Consistent Representation of Faults in Structure of Pit Area Deposit ........................................... 14
Figure 16: Poles to Mineralised Veins Highlighting the Conjugate Set of Veins ............................................. 15
Figure 17: Tungsten Model Concepts on sheeted Vein Systems in China ..................................................... 16
Figure 18: Drill Results .................................................................................................................................... 19
Figure 19: Survey Coordinates ........................................................................................................................ 20
Figure 20: Drill Hole Location Map .................................................................................................................. 21
Figure 21: Current and Previous Resource Definition Areas .......................................................................... 22
Figure 22: Open Pit and Location of Iron Duke Prospect ................................................................................ 23
Figure 23: Regional Exploration Targets ......................................................................................................... 24
Figure 24: LGS Sampling Locations ................................................................................................................ 27
Figure 25: LGS Sampling Summary ................................................................................................................ 28
Figure 26: Sampling Size Fraction Summary .................................................................................................. 29
Figure 27: Example of Pit Sampling Underway ............................................................................................... 29
Figure 28: Weight by Grade Summary ............................................................................................................ 30

Mt Carbine Bankable Feasibility Study – Chapter 3: Geology and Resources
4
Figure 29: Scalping Size Fractions for Testwork at LGS ................................................................................. 31
Figure 30: Comparison of Visual vs Assay Results ......................................................................................... 32
Figure 31: QAQC Results Compared to Known Value .................................................................................... 34
Figure 32: Results of Inserted Blank with Variations Shown on the Below Box Plats .................................... 35
Figure 33: Wolframite Composition ................................................................................................................. 38
Figure 34: Scheelite Composition .................................................................................................................... 38
Figure 35: Box Plots of Ore Zones .................................................................................................................. 39
Figure 36: Summary of Multielement Analysis ................................................................................................ 40
Figure 37: Cleavage Partings in Hodgkinson Formation Rocks (Near Open Pit) ........................................... 41
Figure 38: Typical Section Showing RQD Through the Centre of the Deposit ............................................... 43
Figure 39: Kinematic Analysis of interaction of Foliation with Joint Sets B1 and C1 ...................................... 44
Figure 40: Grade Control Drill Pattern ............................................................................................................. 47
Figure 41: Flitch of the 290m RL Level Showing Ore Zones and Grade ........................................................ 48
Figure 42: Same Flitch Showing Grade Control Pattern to Define Lens Location .......................................... 48
LIST OF APPENDICES
Appendix A Geology and Mineral Resource Estimate ................................................................................... 53
Appendix B METS Ignited Report ................................................................................................................... 54
Appendix C 2021 Pit Drill Intercepts used in Resource Assessment ............................................................. 55
Appendix D Petrological Study Report ........................................................................................................... 58
Appendix E QAQC Results ............................................................................................................................. 72
Appendix F QAQC Survey.............................................................................................................................. 74
Mt Carbine Bankable Feasibility Study – Chapter 3: Geology and Resources
1
1. Introduction
1.1 Context
This Chapter 3: Geology and Resources shall be read in conjunction with Chapter 1: Executive Summary and
additional references as listed in Section 14.
1.1. Purpose
The purpose of Chapter 3: Geology and Resources is to detail the geological framework for the low grade ore
stockpile (LGS) and open cut ore bodies within the Mt Carbine lease area. It contains descriptions on how
supporting data has been captured and modelled to gain an understanding of subsurface lithology and
structure, and the relative confidence in estimating tonnage, grade and physical characteristics of the resource.

Mt Carbine Bankable Feasibility Study – Chapter 3: Geology and Resources
2
2. Tenure
The Mt Carbine mining area is confined within two Mining Leases, ML4867 and ML 4919 totalling 366.39
hectares. The mining licenses are surrounded by EQR’s EPM Tenements EPM 14872, EPM 14871 and EPM
27394 covering an additional 115 km2.
A map of the tenure boundaries is shown in Figure 1.
Figure 1: Mt Carbine Lease Boundaries and Surrounding Exploration Tenements
ML4867 (358.5 Ha) was first granted on 25 July 1974 and has been continually renewed until today. The latest
renewal of 19 years expires on 31 July 2022, before which time EQR will submit a renewal application for a
further 19 years. The renewal will be based on the new resource and completion of the Mt Carbine feasibility
study outlining the planned future mining activity. ML4919 (7.891 Ha) was first granted on 24 August 1974 and
has been continually renewed with the latest 19 year renewal expiring on 23 August 2023 and likewise a
renewal application will be submitted in Q1, 2022.
Mt Carbine mining licenses are not associated with Native Title, having been granted prior to 1 September
1994.
In June 2019 EQR acquired a 100% interest Mt Carbine Quarries Pty Ltd and has ownership of the two Mining
Leases and surrounding exploration projects.
Mt Carbine currently has approvals to mine up to 1 Mtpa of ore from the two Mining Leases. In addition to
mining, the operation crushes rock from the Mt Carbine mine waste stockpile to make different grades of road
base and construction materials.

Mt Carbine Bankable Feasibility Study – Chapter 3: Geology and Resources
3
3. Exploration and Mining History
The Mt Carbine tungsten deposit was discovered around 1883, with production first commencing in 1895 and
was mined up to the end of the First World War by small-scale underground narrow vein mining. Ore was
processed through a stamp battery and wolfram concentrates recovered by gravity recovery methods.
Approximately 150 miners occupied the site in groups and worked in over 30 small underground operations.
Each group hand mined ore on rich veins some of which followed the same vein for a strike distance over
300m and 60m vertically. A major shaft was placed down the Bluff zone in an area where the vein widened to
over 10m and became very rich. This became the central point for the Mt Carbine mining activity. A gravity
processing plant with a 10 head stamper was built on a co-operative basis, ore was treated, and concentrates
returned to the miner. Historical workings at the mine from 1946 are shown in Figure 2.
Figure 2: 1946 Government Map of Historical Workings
Following the purchase of the property from North Broken Hill Ltd, who carried out significant exploration
diamond drilling, Queensland Wolfram Limited processed the deposit from 1974 to 1987 by means of an open
pit at a rate of around 1 Mt per annum. During this period the mine produced an average of 1,000 tonnes per
annum of high grade wolframite (72% WO3) and scheelite (68% WO3) concentrates in the ratio of
approximately 4 tonnes of wolframite to 1 tonne of scheelite. The impurities in the products were exceptionally
low, and although not known with certainty, the recovered grade of ore was reported to be approximately
0.12% WO3.
Before the mine closed in 1987, Queensland Wolfram Limited entered a joint venture with Poseidon Limited,
whereby Poseidon Limited funded the proposed underground development which aimed at a bulk underground
mine by sub-level cave retreat, with the intent of mining panels of ore totalling 7.5 Mt with an estimated grade

Mt Carbine Bankable Feasibility Study – Chapter 3: Geology and Resources
4
of >0.22% WO3. Four hundred metres of 8 x 4.5 metre decline was developed with an underground conveyor
system installed. The mine’s final closure was in 1988 and it has remained closed until the present.
Since its closure, the site has changed hands and additional exploration and study activities have been
conducted. Carbine Tungsten Limited and Icon Resources (predecessors of EQR) carried out further
exploration drilling in 2011 and 2012 and produced two resource statements published by Geostats and
Geosun in 2010 and 2013 respectively.
In June 2019, EQR purchased the mine and quarry. EQR re-established the processing plant and currently it
has been repurposed to treat tailings and existing stockpiles of low grade ore produced from previous mining
activities.
Figure 3 below illustrates how EQR found the project in 2019 with a total of 22 Mt of rock taken out by
conventional mining methods. Water level in the pit was 55m deep in July 2019 and found to be clean
uncontaminated water of slightly alkaline nature (pH 7.1).
Figure 3: Mt Carbine Open Pit
Figure 4 illustrates the low grade stockpile at Mt Carbine that remains from previous mining activities that is
currently being processed by EQR.

Mt Carbine Bankable Feasibility Study – Chapter 3: Geology and Resources
5
Figure 4: Aerial View of Low Grade Stockpile
During the historic mining activities, 12 Mt of low grade material was sent directly to the LGS and 10 Mt was
optically sorted to extract white quartz from the ore. The optically sorted ore resulted in 6 Mt of sorter reject
and 4Mt of higher grade ore, that was sent for processing. This processed ore generated 4Mt of quartz rich
tailings.
Head grades were not recorded but rather back calculated from recovered grade using a nominal 70%
recovery figure to be 0.14% WO3. Several authors e.g. A. White 2006 have subsequently postulated a higher
feed grade based on a lower recovery at the processing plant with the head grade being as high as 0.16%
WO3 globally. The tailings current grade of approximately 0.08% WO3 is similar to the LGS of 0.075% WO3.
During the mining years, grade control on the pit was difficult since mining focused on quartz vein content and
deciding whether it was ore or waste was based on percentage of quartz. Since then, it has been observed
that an early major barren quartz vein event occurred. Typically mining was done on the +5% quartz content
level with the LGS stockpile being below the 5% quartz content marker.
This process placed high ore into the waste pile and diluted the ore that was processed. Hence, the lack of an
effective grade control system was instrumental in a significant quantity of high grade material ending up in
the LGS.

Mt Carbine Bankable Feasibility Study – Chapter 3: Geology and Resources
6
4. Regional Geology
The Mt Carbine mine site is located within the Siluro-Devonian Hodgkinson sedimentary province. The thick
sedimentary sequence was complexly folded and regionally metamorphosed prior to and during extensive
granitic intrusions in the Carboniferous and Permian. The regional geology is shown in Figure 5.
Figure 5: Regional Geological Setting of Mt Carbine
Within the permit north-north-west trending Hodgkinson Formation turbidite and siltstones are intruded by the
Mareeba Granite dated at 277My, and the Mt Alto Granite, dated at 271±5My (Bultitude et al., 1999). Contact
metamorphic aureoles marked by formation of cordierite Hornfels surround the granite intrusive and numerous
acid to intermediate dykes intrude the metasediments. In the western portion of the tenement, a prominent
metabasalt-chert ridge is a significant Hodgkinson formation stratigraphic component.
Fluids from the large granite batholith (>400km2) has provided the hydrothermal fluids for mineral deposition
around the margins of the intrusive. The Mt Carbine deposit is a direct result of these fluids travelling out from
the granite into surrounding structurally prepared ground (granite formations can be seen in Figure 6). There
is a preference for the better tungsten mineralisation (Mt Carbine & Peterson) to be located on failed fold
hinges in the isoclinal folding Hodkinson Formation. These sites have the highest structural deformation to
allow these fluids to penetrate and deposit quartz and minerals. The fact that the granite is a ‘S’ Type Granite
dictates that the fluids will carry Sn, W, Rare Earths and Mo as the main economic minerals.

Mt Carbine Bankable Feasibility Study – Chapter 3: Geology and Resources
7
Figure 6: Mt Carbine Geology Area Showing Intrusives and Sediments of the Hodkinson Formation

Mt Carbine Bankable Feasibility Study – Chapter 3: Geology and Resources
8
5. Deposit Geology
5.1. Host Rock Geological History
The simplified geological history at Mt Carbine (after Forsythe and Higgins, 1990) is as follows:
• Deposition of the Siluro-Devonian Hodgkinson Formation sequence.
• Several stages of complex folding and faulting of the Hodgkinson Formation.
• Intrusion of minor andesite and dolerite dykes.
• Intrusion of mineralizing granite plutons with associated hornfelsing of country rock.
• Emplacement of major sheeted quartz-wolframite-tin veining and hydrothermal alteration of wall-rock
• Intrusion of post mineralisation dykes
In the pit the following rock types are encountered in order of abundance:
Metasedimentary – a range of hornfelsed mudstones and interbedded rudites. The major rock unit in the pit
can look like slate with prominent cleavage. Various alteration from pervasive silicification to only hornfelsed
cordierite chlorotic rock. Breaks along cleavage and schistosity planes. Tends to break down to form a nice
gravel sized rock. No clay development and would form about 70% of the dump material.
Metavolcanic – located on the eastern end of the pit and on the south side of the SWF this unit is pale green
with greenschist facies alteration. Forms about 20% of the dump material and is less likely to contain the
mineralisation, as it is a peripheral unit. It contains locally hard siliceous chert bands that form some of the
larger rocks on the waste dump
Quartz Veins – these are the white rocks and reach up to 10% by volume of the dump material, and are found
in all sizes but typically less than 20cm in size. Angular pieces of hard material yet fractures and shatters when
blasted so ends up as powders and shards throughout a lot of the dump. Can be barren or contain tungsten.
Dyke Material – two types of dykes are observed, 1) a pale uniform fine-grained felsic dyke that is seen to be
exposed over a 10-15m wide dyke at the western end of the pit 2) a dark green/grey basic dyke that is present
on most benches as a 0.5-1m dyke cross cutting the pit. In the dumps, it is not obvious these rock types and
would form less than 2% of the dump material.
5.2. Mineralisation
The Mt Carbine tungsten deposit consists of a number of vertical to sub vertical sheeted quartz veins ranging
in width up to 7m but averaging around 50cm. Only about 20% of the quartz veins are mineralised due to an
early barren quartz event and a later high-grade quartz event. Economic minerals are the tungsten minerals
of wolframite and scheelite mineralisation.
A typical section through the canter of the deposit has over 35 quartz veins ranging from 10cm to 6m in width
with 5-8 zones of overprinting narrow mineralised quartz veins of 10-150cm in width. These high grade veins
containing rich quartz - feldspar tungsten minerals and have been designated as “King Veins”.
The tungsten occurs as coarse crystalline varieties of Wolframite up to 10cm crystal size and with varying
degrees of intergrown scheelite that is volumetrically less significant. Tungsten minerals can form up to 50%
of the quartz vein zone, as intersected and with such coarse nature to the zones has potential to cause a
nugget effect to the mineralisation. In later retrograde stages of the mineral deposition, a later scheelite
overprinting event occurred that is represented mostly as fine scheelite fractures and replacement over
wolframite. The Scheelite-Wolframite ratio is seen to increase to the grid north and grid east of the deposit and
this mostly appears to be a local effect due to the host rocks they are crossing becoming more calcareous. In
general the veins are persistent and strong and cross all rock types and occur due to structural control.
Examples of mineralisation in core samples are shown in Figure 7 and Figure 8.

Mt Carbine Bankable Feasibility Study – Chapter 3: Geology and Resources
9
Figure 7: King Veins Showing Coarse Vein Textures of Wolframite Crystals
Figure 8: Core Showing Late Replacement of Wolframite by Fine Network Retrograde Scheelite
The mineralisation interpretation is that there are two primary mineralising events with the first phase being a
pervasive gaseous front that forms broader scale silicification / veining and deposits a lower grade background
level of tungsten mineralisation. A rich brine fluid then entered later through later fracturing of the now silicified
host rock. These brine veins (king veins shown above) are recognised to have higher temperature and higher
salinities in fluid inclusion work attesting to their direct magmatic origin. Conversely the gaseous veins result
in fluid inclusions with more gases and a composition showing mixing with groundwater has occurred. The
king veins can be as high as 50% WO3 but typically are in the 1-2% WO3 range.
Minor molybdenum is found in the deeper parts of the system and to the western parts of the veins.
Molybdenum generally deposits before tungsten and this gives a rough fluid outflow direction. Mineralisation
at Mt Carbine with the exception of the Johnson vein demonstrates a localised level control, with the bulk of
the tungsten occurring in the 200-350m RL zone. At these RLs the veins are 10-50cm thick but as the same
veins go deeper below 200m RL we see the vein width increase dramatically and a decrease in tungsten
content. Similarly, at higher elevations, the veining also changes dramatically, thinning down to 1-10cm veins/
stringers with low and variable amounts of wolframite.
Along the Mt Carbine ridge line which sits above +450m RL, a number of these narrow stringer veinlets are
seen that may be leaders to better grades of mineralisation at depth.
Along the grid E-W strike to the mineralisation, the veins have been grouped into lenses, where one or more
of the high-grade king veins are close enough to define a composite value above a cut off of 2m 0.25% WO3.
Mt Carbine Bankable Feasibility Study – Chapter 3: Geology and Resources
10
It should be noted that these king veins often form on the margins to silicified zones or on margins of pre-
existing barren quartz veins. Typically, an ore zone or lens is 3-5m in width and will contain one or more king
veins. Widths of high grade can occur up to 15m wide where five or six king veins are seen close together.
Figure 9: Close up of Wolframite from Drilling
Figure 10: Sheeted Veins Widening at Depth

Mt Carbine Bankable Feasibility Study – Chapter 3: Geology and Resources
11
Figure 11: Typical Ore Section Through Open Pit
Alteration minerals associated with the wolframite mineralisation consist of brown tourmaline, biotite-
muscovite, apatite, clinopyroxene and silicification. Very minor molybdenite and bismuthinite occur with the
wolframite. Minor fluorite – chlorite – cassiterite – pyrite/arsenopyrite and calcite are randomly present.
There is only mild marginal vein alteration typically of sericite-clay-chlorite for only a few centimetres if at all.
The mineralised veins appear to have had little effected on the host rocks with the fluids entering hot rocks at
depth.
The observed fact that Mt Carbine is a boron system (significant tourmaline) as compared to a fluorine system
(little fluorite) would suggest that the deposit occurred in hydrostatic equilibrium with the rising brine fluids with
little or no pressure build up occurring. Fluorine rich deposits are more volatile and typically form breccia pipes,
stock working and large intensive alteration systems (Wolfram Camp is a nearby example of this).

Mt Carbine Bankable Feasibility Study – Chapter 3: Geology and Resources
12
Figure 12: Zone of Silicified Cherts & Metasediments with King Veins on Margins
5.3. Structure
Mt Carbine sits at a spur on a major arc parallel fault called the South Wall Fault (SWF -Along the Mossman
Orogeny trend) which can be traced through the Hodkinson formation for over 100km strike length. At an
intersection of a major fault junction the SWF we see an inflection point likely due to a change in compressional
regime due to oblique pressures. The SWF is a thrust that appears to be a long lasting fault forming at the time
of compression and the district scale isoclinal folding of the basement rock right through to post tungsten
mineralisation movement.
EQR has kept this terminology consistent, on the local scale, with this thrust also called the ‘South Wall Fault’
(SWF). The SWF truncates the tungsten orebody at an angle of 70 degrees to the grid north. It forms a
boundary fault on the south west side of the mineralisation (deposit). Evidence suggest it is a reverse thrust
fault (N.Oliver 2021) and by studying stratigraphic marker beds (chert-metabasalt unit) it is postulated
movement is of the order of 2-300m. The truncated parts of the Mt Carbine ore body should still be at depth in
the footwall region of this fault.
Other minor faults occur, orientated in a northerly direction and show less severe movement. The Central /
Iron Duke and Christmas Faults both show strike slip movement and in the case of the central fault there is
strike movement across a dyke of 120m in a left lateral sense. Little movement is detected on the Christmas
fault.

Mt Carbine Bankable Feasibility Study – Chapter 3: Geology and Resources
13
Figure 13: Open Pit Showing South Wall Fault
Within the confines of the pit the rocks, have been hornfelsed but several deformation lineation’s can still be
seen i.e. S0 bedding, S1 minor folding & S2 isoclinal folding planes. The mineralised veins postdate this
basement deformation and EQR sees little or no movement on the pit scale.
Veins can be traced over vertical distances of 3-400m and strike distances for over 1,200m without much
offsets. Occasionally in the pit, a regular low angle fault occurs that locally shifts the veins up to 3-4 meters.
This low angle fracture forms a blocky fracture which is the main geotech assessment needed when
underground mining occurs.
A structural consultant Mr Nick Oliver was engaged to interpret the structure at Mt Carbine and his findings
are summarised in Figure 14, Figure 15 and Figure 16.

Mt Carbine Bankable Feasibility Study – Chapter 3: Geology and Resources
14
Figure 14: Formation of Veins at Mt Carbine Outlining the Structural Stress at the Time
Figure 15: Consistent Representation of Faults in Structure of Pit Area Deposit

Mt Carbine Bankable Feasibility Study – Chapter 3: Geology and Resources
15
Figure 16: Poles to Mineralised Veins Highlighting the Conjugate Set of Veins
5.4. Tungsten Model
The Mount Carbine tungsten deposit is similar to well documented sheeted vein-type tungsten deposits in
South China and these are divided into endo-contact (granite hosted) and exo-contact (wall-rock hosted) types.
Mt Carbine is an exo-contact type.
The vertical structural zoning model for vein type exo-contact tungsten deposits observed in China
(Yidou,1993) directly applies to the Mount Carbine vein system.

Mt Carbine Bankable Feasibility Study – Chapter 3: Geology and Resources
16
Figure 17: Tungsten Model Concepts on sheeted Vein Systems in China

Mt Carbine Bankable Feasibility Study – Chapter 3: Geology and Resources
17
6. Exploration
6.1. Previous Exploration
The information below provides a summary of the exploration work undertaken at Mt Carbine by EQR’s
predecessor companies prior to EQR acquiring it in 2019.
A summary of the major exploration work is summarised in Table 1.
Table 1: Historical Mt Carbine Studies
Work Carried out up to 2012
Date Prepared by
Reserve
Ore Reserve Assessment 2011 Icon Resources Limited
Resource Estimate 2010 Geostat Pty Ltd
Resource Estimate 2012 Geostat Pty Ltd
Feasibility Studies
Preliminary Mine Design 2012 Mine One
Ore Sorter Mass Balances 2012 John McIntyre & Assoc
Environmental Studies
Environmental Impact Study – Stage 1
2010 Landline
Metallurgy
Testwork: Comminution Testing
2012 JK Tech
In July 2019, EQR acquired a 100% interest in Mt Carbine Quarries Pty Ltd, an entity that owns mining leases
ML4867 and ML4919 along with the associated quarry.
EQR re-established the processing plant which has been re-purposed to treat tailings and existing stockpiles
of low-grade ore produced from previous mining activities.
EQR acquired the Project in 2019 with a total of 22 Mt of rock taken out by conventional mining methods and
a water level in the pit that was 55m deep.
6.2. Data Collection
Best practice techniques were adopted for pit sampling and drill core assessment and data collected for each
component is summarised below.
6.2.1. Core Logging
The following items were measured during the process of core logging:
1. Hole location;
2. Date, of start & stop of hole;
3. Geologist;
4. Depth;
5. Down hole surveys;
6. Sample interval;

Mt Carbine Bankable Feasibility Study – Chapter 3: Geology and Resources
18
7. Depth of water table (BOX, POX boundaries);
8. Recovery by drill interval;
9. Lithology sescription;
10. Alteration Facies & Minerals;
11. Mineralisation sescription;
12. Key mineral percentages;
13. Quartz seins;
14. Orientation of bedding, fractures and quartz veins;
15. RQDs;
16. Fracture measurement & analysis;
17. Meter marking;
18. Hardness and porosity of core;
19. Density of core rocks;
20. Photography – wet and dry;
21. Sample interval markers;
22. Cut Core in half over sampling zones;
23. Petrography markers;
24. Core Boxes marked and tagged;
25. Core Stored on pallets & cling wrapped;
26. Petrographic analysis of each rock type and alteration;
27. Chemical analysis of core sample for multi-element amounts;
28. Storage of well-marked rejects should further assaying be required;
29. Plotting of hole using Leapfrog software;
30. Updating database with key hole information;
31. Highlighting zones that are mineralised and section interpretations;
32. Connection of zones over drill sections; and
33. 3D interpretation of mineralised zones (Measured Group Brisbane).
The location and grade of the drill results are shown in Figure 18.

Mt Carbine Bankable Feasibility Study – Chapter 3: Geology and Resources
19
Figure 18: Drill Results
6.2.2. Mapping
The following activities were recorded and undertaken in the mapping process:
1. Base maps prepared that have accurate survey information;
2. GPS location mapping;
3. Recording lithology, faults & fractures, mineralisation and alteration; and
4. Identification of any sampling required.
6.2.3. Survey
Brazier Motti Surveying Consultancy was engaged to re-establish the local grid and pick up accurately the
collars of the previous and current drilling programs. In addition, all key survey markers around the open cut
were re-established. (Refer Appendix F)
A LIDAR survey was flown over the mining license using a Drone with a 10cm accuracy on topography. This
was important to establish the accuracy of historical contour maps for the pit and LGS. (Refer Appendix F).
Given there is currently 44m of water in the open pit, a sonar survey of the pit floor was completed. The sonar
survey confirmed the pit floor contours were the same as the digital survey pit shape left from the end of mining
in 1987 and was accurate in that no further disturbance to the pit had occurred.
A summary of the survey coordinates are shown in Figure 19.

Mt Carbine Bankable Feasibility Study – Chapter 3: Geology and Resources
20
Figure 19: Survey Coordinates
6.3. Exploration Results
The infill drilling of sixteen diamond drill holes for 4,074m by EQR during Q2 2021 showed that the high-grade
lenses have integrity and could be traced and linked back to the old underground mapping recorded. The
reclogging of the historical core completed this new interpretation and resource model. All mineralised samples
have been assayed at either ALS, Analabs or Amedel laboratories with two laboratories often being used to
check results.
Only the recent EQR drilling used core orientation systems, to provide definitive direction to the logged rock
boundaries, structure and veining. This definitive orientation has provided the basis to join the mineralsed
zones from hole to hole.
The breakdown of the drilling to date used in the resource modelling is shown in Table 2, and the hole locations
are shown in Figure 20. Three early drill holes remain as visual results only due to poor core records of these
holes. Any other drill holes with visual results were all re-assayed (this work is detailed further in Section 8).
Table 2: Total Drill Hole Statistics
Hole Type Pre-2021 Drilling 2021 Drilling Total Holes
Diamond Drilling 16,355.55m 63 Holes
Diamond Drilling 4,068.30m 16 Holes
TOTAL 20,423.85m 79 Holes
Mt Carbine Bankable Feasibility Study – Chapter 3: Geology and Resources
21
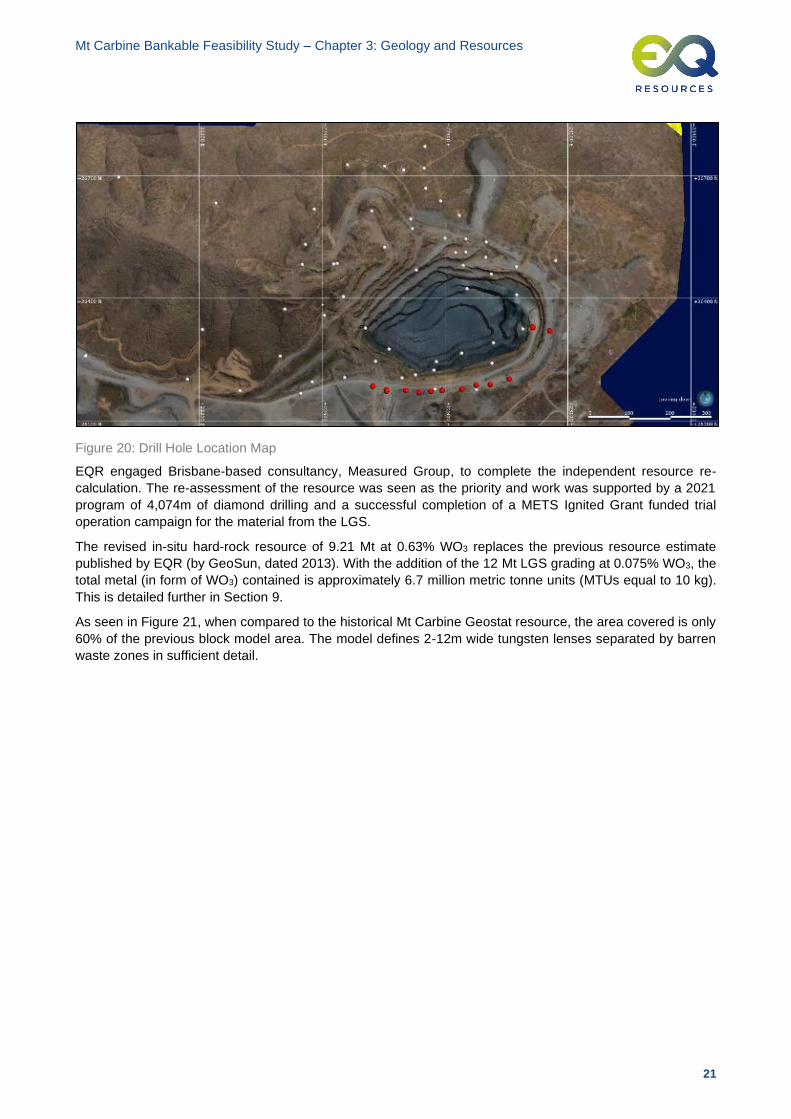
Figure 20: Drill Hole Location Map
EQR engaged Brisbane-based consultancy, Measured Group, to complete the independent resource re-
calculation. The re-assessment of the resource was seen as the priority and work was supported by a 2021
program of 4,074m of diamond drilling and a successful completion of a METS Ignited Grant funded trial
operation campaign for the material from the LGS.
The revised in-situ hard-rock resource of 9.21 Mt at 0.63% WO3 replaces the previous resource estimate
published by EQR (by GeoSun, dated 2013). With the addition of the 12 Mt LGS grading at 0.075% WO3, the
total metal (in form of WO3) contained is approximately 6.7 million metric tonne units (MTUs equal to 10 kg).
This is detailed further in Section 9.
As seen in Figure 21, when compared to the historical Mt Carbine Geostat resource, the area covered is only
60% of the previous block model area. The model defines 2-12m wide tungsten lenses separated by barren
waste zones in sufficient detail.

Mt Carbine Bankable Feasibility Study – Chapter 3: Geology and Resources
22
Figure 21: Current and Previous Resource Definition Areas
In Figure 21, the blue area outlines the current resource calculation area whilst the yellow reflects the GeoStat
previous resource calculation. The green line represents the existing decline with orange indicating the
historical extension plan. Grey areas are future drill targets with the strike extent of Mt Carbine open to the
west and depth.
Appendix C details the significant drilling results from the whole database of 79 holes including the 16 recent
holes by EQR. Significant results are above 2m @ +0.25% WO3.
6.4. Exploration Potential
This feasibility study is confined to the red square area in Figure 22. The green square represents the inferred
resources also delineated. The blue zone shows the brownfield exploration targets that aim to achieve four
key objectives:
• Upgrade the Iron Duke inferred resources into indicated resources. Iron Duke has 5.8Mt @ 0.59%
WO3;
• Extend the known veins along strike extents both grid west and east;
• Drill to depth where tungsten continues in Iron Duke – Talis Zone; and
• Evaluate and test the True Blue, Daisy, MacDonald’s and Red Cap Zones.

Mt Carbine Bankable Feasibility Study – Chapter 3: Geology and Resources
23
Figure 22: Open Pit and Location of Iron Duke Prospect
Given the extent of surface vein traces, the open depth consideration and the five immediate tungsten working
areas it is conceivable that the resource could significantly increase from its current size. Much of the future
drilling will be targeting to continue to replace mined ore.
On a regional scale, there are over 50 past diggings within the EQR tenements that have located either
tungsten or tin. Knowledge that the surface exposure might be minimal for this style of deposit and rather a
blossom zone occurs at the right RLs, many of these know occurrences will be drill tested. The potential
exploration targets within EQR’s exploration permits are shown in Figure 23 below.

Mt Carbine Bankable Feasibility Study – Chapter 3: Geology and Resources
24
Figure 23: Regional Exploration Targets

Mt Carbine Bankable Feasibility Study – Chapter 3: Geology and Resources
25
7. Low Grade Stockpile Assessment
7.1. LGS Summary
The LGS consists of material from fine dust to large 1-1.5m boulders consisting of the waste rock blasted and
hauled direct from the pit. It is heterogeneous in nature and reflected loosely in bands of material depending
on where the blasting was occurring. In several isolated locations, banded layers are occurring that reflect an
increasing quartz content from a brown earthy upper bank with less quartz to a clean rock quartz mix. This
cycle may in fact represent a strip back from top of pit to bottom with the lower quartz content being the upper
layers where the quartz narrows and the quartz rich layers being in the lower benches where the veins are
much larger and occupy more of the face.
Table 3, taken from the METS Ignited Study Report (attached as Appendix B) shows the size distribution of
the material on the LGS.
Table 3: LGS Grade by Size Distribution
Particle Size Fraction (mm) Grade (%WO3) Particle Size Distribution (%)
+170 0.043 30
-170x100 0.050 14
-100x30 0.077 14
-30x6 0.095 20
-6x0 0.110 22
7.2. Historical Ore Extraction & Dump Formation
The LGS is material that has come directly from the open cut during the mining process. It is all random and
unsorted direct from where the mining was occurring.
The basis for determining whether the mined rock went to the LGS rather than being sent through to the
primary Jaw Crusher and then onto the optical sorting circuit was primarily based on quartz content.
The grade control used in the bench blast system was designed to take material with +10% quartz content to
the plant and the lower quartz material to the dumps. No drilling or sampling grade control was done during
mining with only the quartz content being the guide to ore.
It has been demonstrated that there is a poor correlation of quartz vs tungsten and grade reconciliation was
one of the biggest historical issues. The fact that much of the historical ore (0.13% WO3) veins showed up in
the dump showed that the quartz alone criteria was not effective.
The historical ‘ore head grade’ was nominally 0.13% WO3, and the LGS grade holistically at 0.075% WO3
shows approximately 41% of the tungsten was reporting to the LGS.
The dumps were deposited in two layers with mining from years 1978 to 1983 being the larger 8 Mt layer and
from 1983 to 1987 being the 4 Mt layer from deeper in the pit.
7.3. Sampling
Sampling of large dumps is never easy and great care was taken to determine at what scale would a sample
be representative. As such, the main sampling to determine overall grade was taken as follows
Sites Selection – The dump was divided into quadrants with a major and minor sample location being marked.
In two of the quadrants, two sample sites were selected to see repeatability.

Mt Carbine Bankable Feasibility Study – Chapter 3: Geology and Resources
26
Sample Size - 6 trench samples (each trench taken at approximately 10m wide x 5m deep x 40m length was
deemed to be representative of that part of the dump each comprising a 3,500t sample.
Method – The sample was collected using 25t trucks and 30t excavator being careful to load all the material
from the sample trench and the run over the weighbridge to determine weight before being added to a large
stockpile. A total of 22,000t was collected form the 6 separate locations. This was then cone and quartered
down to a subset sample of 2,000t which was fully crushed to a nominal 40mm and sampled.
The bulk sample average was 0.075% WO3.
The LGS sampling locations are shown on Figure 24.

Mt Carbine Bankable Feasibility Study – Chapter 3: Geology and Resources
27
Figure 24: LGS Sampling Locations

Mt Carbine Bankable Feasibility Study – Chapter 3: Geology and Resources
28
Further sampling of the LGS for environmental permitting purposes involved taking 80 grab samples from the
surface of the stockpile. Each sample was approximately 20kg of -100mm material. The average grade of
these samples was 0.088% WO3. Trails indicated that at optimum settings, the XRT Sorter produces a pre-
concentrate that is approximately 12% of the original feed and has a grade of approximately 0.65% WO3 at
90% WO3 recovery. 88% of the material sent to the sorter was rejected as waste. Local grade distribution
within the stockpile is expected to vary and has not been quantified.
To date, two larger pits have been mined – the NE pit and the Central pit have had 30,000t and 86,000t
respectively mined at the timing of this report and is ongoing. The methodology involves screening out the -
6mm direct for processing and crushing with all the material +6mm, -170mm down to -40mm size being sent
for XRT sorting.
This extensive test work was designed to mimic EQR’s planned flow sheet and to determine the LGS grades
based on the fines and sorter product. Both these categories were crushed to fine size prior to sampling. A
summary of the sampling results is shown below in Figure 25.
Figure 25: LGS Sampling Summary
The crushing of the sample feed generated further 0-6mm fines and although the quantity varied considerably
total fines that were natural and crushed is approximately 30-35%. +170mm oversize was returned to the
stockpile and was also about 30% of the dump, leaving approximately 40% of the dump that was sorted through
the XRT Sorter.
Below in Figure 26 is a summary of the regular sampling in size fractions taken from the 0-6mm natural fraction
at 6 pit site locations separate to the initial 6 trench locations.
Size (µm)Head
Feed (kg)
% Total
HF
Head
Grade %
Weight x
gradeCon (g)
Con
GradeMids (g)
% Total
Mids
Mids
Grade
Weight x
grade
mids
Tails (kg)% Total
Tails
Tails
Grade
Weight x
grade
tails
Recovere
d Grade
%-300 116.20 32.15 0.24 27.89 530 26.4 - - - - 115.67 32.11 0.14 16.19 0.12
300-850 245.25 67.85 0.21 51.50 440 49 290 100 16.6 4814 244.52 67.89 0.06 14.67 0.09
Total 361.45 100 79.39 970 290 100 4814 360.19 100 30.87 0.10
Weighted average 0.22 16.6 0.09
Size (µm)Head
Feed (kg)
% Total
HF
Head
Grade %
Weight x
gradeCon (g)
Con
GradeMids (g)
% Total
Mids
Mids
Grade
Weight x
grade Tails (kg)
% Total
Tails
Tails
Grade
Weight x
grade
Recovere
d Grade
-300 72.00 25.00 1.43 102.96 801 64.4 438 19.51 21.8 9548.4 70.76 25.05 0.18 12.74 0.72
300-850 135.65 47.10 2 271.30 1873 57.9 1497 66.68 25.3 37874.1 132.28 46.82 0.15 19.84 0.80
850+ 80.35 27.90 0.72 57.85 582 48.2 310 13.81 12.75 3952.5 79.46 28.13 0.17 13.51 0.35
Total 288 100 432.11 3256 2245 100 51375 282.50 100 46.09 0.65
Weighted average 1.50 22.88 0.16
Sorter Product
Sorter Fines -8mm

Mt Carbine Bankable Feasibility Study – Chapter 3: Geology and Resources
29
Figure 26: Sampling Size Fraction Summary
Figure 27 shows an example of the pit sampling being undertaken on the LGS.
Figure 27: Example of Pit Sampling Underway
Figure 28 shows the variation in different size fractions in the 0-6mm material with generally the finer fractures
showing slightly higher results.

Mt Carbine Bankable Feasibility Study – Chapter 3: Geology and Resources
30
Figure 28: Weight by Grade Summary
7.4. Current Mining of LGS
Table 4 summarises the head feed of 0-8mm taken during mining of approximately 100,000t of LGS material.
This material is elevated from the overall dump grade of 0.075% WO3 due to the fact that the tungsten minerals
are soft and preferentially break down and end up naturally in the finer size fractions. Conversely the larger
rocks have less tungsten.
Table 4: LGS Head Grade
Date Head Feed (%)
2020-11-27 0.22
2020-11-24 0.18
2020-12-11 0.38
2020-12-22 0.16
2021-01-06 0.27
2020-11-26 0.15
2020-11-28 0.13
2021-01-12 0.11

Mt Carbine Bankable Feasibility Study – Chapter 3: Geology and Resources
31
Date Head Feed (%)
2021-01-27 0.16
Average 0.20
Figure 29 shows the process by which the LGS material was scalped to separate the various size fractions.
Figure 29: Scalping Size Fractions for Testwork at LGS

Mt Carbine Bankable Feasibility Study – Chapter 3: Geology and Resources
32
8. Quality Assurance, Control and Sampling
8.1. Recheck of Old Core Visual Results
A total of 58 samples that remained in the database as visual results, were resampled and laboratory analysis
completed. These intervals were resampled using half core as per normal sample procedures.
Comparison results are shown here with the low grade results (below 0.25% WO3) show an increase of 105%
in grade for the same intervals but the high grade ore samples dropped 24% in grade from the visual results.
In the database only results assayed by the laboratory under quality assurance and quality control (QAQC)
conditions were used in calculating resources. This eliminated any inaccuracies by using visual estimates.
A comparison of the visual results compared with the assay results is shown in Error! Reference source not f
ound..
Figure 30: Comparison of Visual vs Assay Results
8.2. Drillings Sampling Procedure
From the total of 4,068m of drilling completed in 2021, 1,404 samples were sent to ALS Laboratories (ALS) in
Brisbane, Queensland. QAQC samples were included in all assay sheets using the JORC Code 2012
guidelines and full details of the sampling methodology and procedures are outlined in attached JORC Tables
1 and 2 attached to the Geology and Mineral Resource Estimate attached in Appendix A.
All zones of potential mineralisation were logged and sampled by cutting the core interval selected in half and
the complete half core being sent to ALS for analysis.
Before cutting and sampling, the core is logged, photographed in high resolution images with clear depth
markers and geotechnical logs completed. All zones with visual minerals of wolframite and scheelite are
recorded by their percentages. Scheelite glows under ultraviolet light and although difficult to distinguish under
ordinary light from quartz-carbonate it is visual under the shortwave 254nm UV light with a common technique
to estimate grade being to trace out individual crystals and determine the overall percentage shown on the
face of the core. Often the mineralisation is manifested as very coarse tungsten mineral crystals of up to 10cm
in size.
The method used by ALS for the analysis of tungsten was the ME-XRF15b with 10% of the samples being
QAQC either blanks or known standards. The entire core sample was pulverised and spilt into a small
subsample that was melted into a fusion disk to produce a homogenised clear glass disk. This disk was then
analysed by a Bruker x-ray fluorescent machine.

Mt Carbine Bankable Feasibility Study – Chapter 3: Geology and Resources
33
ALS is a registered laboratory that conducts internal and external round-robin analysis to maintain its
accreditation and does its own calibration test work to ensure accuracy. The assaying is completed at 10ppm
accuracy. It is important in this process that the sample is homogenous, and as such the sample is prepared
by crushing and grinding to less than 75 microns to ensure homogeneity.
All quartz veins intersected in the drilling have been assayed as separate samples. Where the veins are more
than 1m in downhole length then the sample is broken into two or more samples each with a maximum of 1m
interval. The minimum sized vein that was assayed separately was 5cm in width with stringer zones below this
assayed on larger meter intervals. Since the mineralisation at Mt Carbine often occurs in narrow vein widths
of 5-500cm then it is important to assay each such narrow zone. On either side of the mineralised zone,
samples were also taken of the host rock at intervals of 1m to ascertain if the mineralisation extended into the
host rocks.
Drilling at Mt Carbine was completed by an HQ and NQ sized diamond drilling rig that used both double and
triple tube-drilling techniques. HQ was drilled down until the south wall fault was intersected and then cased
off before continuing in NQ drill size. The footwall of this fault has no mineralisation as noted in Section 5 and
this fault truncates all observed mineralisation. The full core collected was marked for its depth and orientation.
The drilling was done using digital orientation methods, specifically the Reflex Act III tool system. The recording
hole orientation and hole survey orientations were wirelessly transmitted to the back-end computer for
recording.
The core is cut in half using a diamond saw along the centre line marked as being the line mark for the
orientation of the core. Half core was used in all sampling collections.
Each sample was weighed and marked correctly in consecutive order with a space left for the insertion of
standards and this was done every 10th sample for 10% checks and balances. No samples were combined for
assay with each sample assayed separately and noted as either a vein or host rock.
EQR completed a comprehensive assessment of past core including duplicates and repeats to establish that
the ALS assaying shows consistency and accuracy, and historical results were accurate. With each batch of
results sent there is a minimum of five check samples inserted.
8.3. QAQC Results
The total number of standards and blanks samples inserted into this assaying program was 146 samples
comprising just over 10.2% of the samples submitted. These were subdivided as follows:
• 79 tungsten sample standards were analysed on a 1 in 20 basis; and
• 67 blank samples were tested inserted on a 1 in 20 basis.
The figures below are plots of the standards against the normalised known value. The errors were within a 3%
margin for all QAQC results with the likely variation being that stated variation within the standard itself. The
laboratory checking showed there was little drift or errors in the results and that quality and accuracy were
established at ALS.
The QAQC results are tabled in Appendix E.

Mt Carbine Bankable Feasibility Study – Chapter 3: Geology and Resources
34
Figure 31: QAQC Results Compared to Known Value

Mt Carbine Bankable Feasibility Study – Chapter 3: Geology and Resources
35
Figure 32: Results of Inserted Blank with Variations Shown on the Below Box Plats
The Blanks were within 0.0055 of known value. Slightly higher results were observed only when using blank
core which although perceived to be barren by the geologists had slight background tungsten values up to
0.025% WO3. This slight variance in stand blank sample values was noted in six blanks out of the 67 sample
blanks used, where half core showed very low background values were encountered.

Mt Carbine Bankable Feasibility Study – Chapter 3: Geology and Resources
36
9. Resource Estimation
Appendix A includes the full independent Geology and Mineral Resource Estimate prepared by Measured
Group and signed by Competent Person, Chris Grove as Principal Geologist. The resource has been reviewed
by James Knowles, Principal Geologist and Director of Measured Group and approved by Lyon Barett,
Managing Director of Measured Group.
It was determined by Measured Group, drilling indicated mineralisation continues for up to a 1,300m strike and
up to 600m in width. The limits of mineralisation have not been completely defined and are open at depth and
along strike.
The methodology for the resource calculation was undertaken by constraining the ore body to defined lenses
based on geological interpretation from the drilling. By the use of orientated drilling, it allowed the interpretation
of the geology and to pin down the high-grade ore shoot directions into a 3D Model.
A complete geostatistical evaluation of the orebody was undertaken to determine the variography of the deposit
with attention on highlighting the acceptable range for grade projections for mineralisation and their domains.
All domains were interpolated using ordinary kriging (OK) with mineralisation modelled as three-dimensional
blocks with a parent block size 10m x 10m x 10m with sub-celling block size of 0.5m x 0.5m x 0.5m.
Validation of the block model was made by:
• Checking that drill holes used for the estimation plotted in expected positions;
• Checking that flagged domains intersections lay within, and corresponded with, domain wireframes;
• Ensuring whether statistical analyses indicated that grade cutting was required;
• Checking that the volumes of the wireframes of domains matched the volumes of blocks of domains
in the block model; and
• Checking plots of the grades in the block model against plots of drill holes.
The resource estimation for the LGS and in-situ hard rock resources is summarised in
Table 5: Mt Carbine Mineral Resource – September 2021
Classification Tonnes (million) Grade (% WO3) WO3 (mtu)
Low Grade Stockpile
Indicated 12.00 0.075 900,000
In-Situ Hard Rock Resources
Indicated 2.40 0.74 1,776,000
Inferred 6.81 0.59 4,017,900
Sub-Total 9.21 0.63 5,793,900
Total Mt Carbine Mineral Resource
21.21 6,693,900
NOTES:
1. Total estimates are rounded to reflect confidence and resource categorisation.
2. Classification of Mineral Resources incorporates the terms and definitions from the Australasian Code for Reporting of Exploration
Results, Mineral Resources and Ore Reserves (JORC Code, 2012) published by the Joint Ore Reserve Committee (JORC)
3. No upper cut was applied to individual assays for this resource, a lower cut of 0.25% WO3 was applied
Compared to the Mt Carbine historical resources published by Icon Resources Limited (Geosun, 2013) the
revised resource covers only 60% of the previous block model area. The model defines 2 -12m wide tungsten

Mt Carbine Bankable Feasibility Study – Chapter 3: Geology and Resources
37
lenses separated by barren waste zones in sufficient detail. With the tightening of the drill spacing, it allows
the model to more clearly define the resources into higher grade narrower lenses.
Most of the previously inferred resources around the open cut, have now been converted to indicated
resources, and confidence was gained that further drilling will continue to also convert the inferred Iron Duke
Zone into indicated resources.

Mt Carbine Bankable Feasibility Study – Chapter 3: Geology and Resources
38
10. Metallurgical Characterisation
Attached in Appendix D is a description from Petrology for the major rock types at Mt Carbine. The rocks
hosting the ore are dominantly pelitic schists, metavolcanics and minor cherts. Quartz content may reach as
high as 20% of the rock content and but mineralisation is less than 1% by volume.
Alteration minerals are minor other than pervasive early-stage green schist facies, which has replaced the
pelitic mudstones with fine chlorite.
Gangue for the mineralised lenses include quartz, feldspar, tourmaline, muscovite (biotite) with minor amounts
of apatite, calcite, pyrite - arsenopyrite, magnetite and zircon. In places in the host rock cordierite is developed.
Only arsenopyrite and apatite concentrate alongside with wolframite – scheelite with arsenic reaching up to 1-
2% in concentrate samples from a low base of 300ppm.
Economic tungsten minerals are wolframite and scheelite with a typical ratio of 4:1 in the deposit. Each of
these minerals contain different tungsten percentages and have different properties. The overriding property
that assists in the processing of these minerals is their specific density being high in the 6-7 gm/cm3 range
compared to the host quartz-mudstones at 2-3 gm/cm3.
The composition of the wolframite mineral summarised in Figure 33.
Figure 33: Wolframite Composition
The composition of the scheelite mineral is summarised in Figure 34.
Figure 34: Scheelite Composition
By the process of XRT sorting, pit ore and LGS ore will be upgraded approximately 10 times which significantly
reduces the tonnage required to be processed, ie. < 25% of this material will be sent to the plant. The final ore
is ground down to <1mm for gravity processing.
There are no significant sulphides in the deposit with sulphur at 0.147% on average relating to less than 0.3%
sulphides in the pit rocks. No acid rock drainage nor acid-metal issues have been evident on the dumps and
it should be noted that over the 44 years that water has resided in the pit, it remained slightly alkaline and is
clear clean water with plentiful fish. Some water tests record slightly high in fluorine.

Mt Carbine Bankable Feasibility Study – Chapter 3: Geology and Resources
39
Future waste rock and tailings from mining a pit extension is a continuation of the same rock that is being
stored now (in the LGS). The minor amounts of sulphides in the deposit as noted above report in the gravity
circuit to the concentrate. This will be separated from the concentrates by flotation.
A full 26-element analysis was done on over 2,000 drill core samples with the following average geochemistry
noted.
Figure 35: Box Plots of Ore Zones
Tungsten distribution within the site domains is shown above. This distribution plot shows the effects of mining
the ore zones separately compared to mining the entire pit zone. Mean results for the ore is 0.72% W whilst
0.13% W is for combined rock - waste. Effectively this is what RB Mining did by sending most of the material
direct to the ore sorting plant.
A complete analysis for 26 elements has been performed on all core samples submitted to ALS. As the ore
occurs in a quartz vein rather than silicified host several key multi-element differences can be noted in Table
6 and Figure 36.
Table 6: Element Differences in Host and Ore Bodies
Element Host Ore Comment
Al2O3 16.3 % 4.16 % Low Silicate minerals in the ore.
SiO2 64.9 % 88.4 % Ore is in qtz, host rock is highly silicified.
K2O 3.12 % 1.02 % A lot of biotite surrounding alteration.
S 0.09 % 0.06 % Ore & host have low sulphide contents.
Fe 3.79 % 1.61 % Less ferromagnesium minerals in ore.
TiO2 0.62 % 0.08 % Host has a lot of rutile alteration.
MgO 1.78 % 0.25 % Host has tourmaline alteration.

Mt Carbine Bankable Feasibility Study – Chapter 3: Geology and Resources
40
Figure 36: Summary of Multielement Analysis
Domain Eleement Count Length MeanStandard
deviation
Coefficient
of variationVariance Minimum
Lower
quartileMedian
Upper
quartileMaximum
Al2O3 48 24.35 14.382 4.216 0.293 17.778 3 12.9 15.7 16.95 23.2
As 39 18.43 0.042 0.063 1.510 0.004 0.01 0.01 0.01 0.03 0.27
BaO 46 23.54 0.053 0.020 0.367 0.000 0.01 0.04 0.05 0.07 0.11
Bi 7 3.37 0.027 0.020 0.746 0.000 0.01 0.02 0.02 0.03 0.08
CaO 48 24.35 1.402 0.533 0.381 0.285 0.39 1.11 1.36 1.68 2.86
CeO2 24 12.21 0.011 0.003 0.292 0.000 0.01 0.01 0.01 0.01 0.02
Co 0 0 0 0 0 0 0 0 0 0 0
Cr 1 0.44 0.030 0.03 0.03 0.03 0.03 0.03
Cu 37 18.01 0.017 0.045 2.610 0.002 0.005 0.006 0.007 0.014 0.335
Fe 48 24.35 3.512 0.930 0.265 0.865 1.24 3.15 3.69 3.93 7.73
HfO2 0 0 0 0 0 0 0 0 0 0 0
K2O 47 23.86 3.117 1.065 0.342 1.134 0.59 2.8 3.33 3.8 5.72
La2O3 25 12.76 0.010 0.000 0.000 0.000 0.01 0.01 0.01 0.01 0.01
MgO 48 24.35 1.607 0.847 0.527 0.717 0.29 1.3 1.71 1.88 6.62
Mn 48 24.35 0.071 0.022 0.308 0.000 0.02 0.06 0.07 0.09 0.14
Mo 4 1.08 0.019 0.021 1.109 0.000 0.007 0.007 0.008 0.022 0.05
Nb 1 1.17 0.007 0.007 0.007 0.007 0.007 0.007
Ni 4 2.67 0.007 0.002 0.233 0.000 0.006 0.006 0.006 0.006 0.009
P2O5 48 24.35 0.244 0.278 1.139 0.077 0.09 0.12 0.14 0.25 1.54
Pb 4 0.9 0.019 0.019 0.966 0.000 0.005 0.005 0.016 0.041 0.041
Rb 46 23.06 0.031 0.014 0.444 0.000 0.006 0.026 0.03 0.037 0.106
S 48 24.35 0.158 0.424 2.682 0.180 0.02 0.05 0.07 0.14 3.59
Sb 1 0.24 0.007 0.007 0.007 0.007 0.007 0.007
SiO2 48 24.35 68.171 8.393 0.123 70.450 52.3 63.1 65.8 69.7 92.3
Sn 41 21.77 0.009 0.003 0.321 0.000 0.005 0.008 0.009 0.012 0.022
Sr 43 21.66 0.016 0.007 0.441 0.000 0.01 0.01 0.01 0.02 0.03
TiO2 48 24.35 0.503 0.161 0.320 0.026 0.1 0.42 0.57 0.62 0.68
V 34 18.37 0.010 0.000 0.000 0.000 0.01 0.01 0.01 0.01 0.01
W 43 21.85 0.087 0.257 2.943 0.066 0.001 0.002 0.004 0.027 1.125
Y2O3 31 14.64 0.006 0.001 0.164 0.000 0.005 0.005 0.006 0.007 0.01
Zn 46 23.23 0.016 0.016 1.010 0.000 0.005 0.01 0.011 0.016 0.135
Zr 45 22.71 0.013 0.004 0.353 0.000 0.01 0.01 0.01 0.02 0.02
Al2O3 110 79.19 16.015 1.937 0.121 3.751 4.58 15.7 16.3 17.05 19.2
As 79 55.04 0.030 0.059 1.971 0.003 0.01 0.01 0.02 0.02 0.43
BaO 109 78.96 0.051 0.013 0.248 0.000 0.01 0.04 0.05 0.06 0.09
Bi 3 2.06 0.010 0.000 0.000 0.000 0.01 0.01 0.01 0.01 0.01
CaO 110 79.19 1.192 0.428 0.359 0.183 0.53 0.93 1.12 1.32 4.05
CeO2 69 48.38 0.010 0.001 0.134 0.000 0.01 0.01 0.01 0.01 0.02
Co 0 0 0 0 0 0 0 0 0 0 0
Cr 3 1.42 0.012 0.006 0.468 0.000 0.01 0.01 0.01 0.01 0.02
Cu 75 52.15 0.011 0.015 1.302 0.000 0.005 0.007 0.008 0.01 0.115
Fe 110 79.19 3.759 0.516 0.137 0.266 1.88 3.66 3.79 3.96 5.65
HfO2 0 0 0 0 0 0 0 0 0 0 0
K2O 110 79.19 3.060 0.642 0.210 0.413 0.78 2.76 3.12 3.39 5.33
La2O3 67 47.77 0.010 0.001 0.065 0.000 0.01 0.01 0.01 0.01 0.02
MgO 110 79.19 1.725 0.268 0.155 0.072 0.43 1.7 1.78 1.86 2.06
Mn 110 79.19 0.075 0.020 0.262 0.000 0.05 0.06 0.07 0.09 0.21
Mo 3 1.68 0.005 0.000 0.000 0.000 0.005 0.005 0.005 0.005 0.005
Nb 3 1.66 0.006 0.002 0.446 0.000 0.005 0.005 0.005 0.005 0.01
Ni 13 7.96 0.012 0.007 0.610 0.000 0.005 0.006 0.007 0.016 0.024
P2O5 110 79.19 0.160 0.083 0.520 0.007 0.05 0.12 0.14 0.16 0.53
Pb 12 9.84 0.006 0.001 0.234 0.000 0.005 0.005 0.005 0.006 0.009
Rb 110 79.19 0.026 0.007 0.253 0.000 0.005 0.023 0.027 0.03 0.048
S 110 79.19 0.101 0.078 0.772 0.006 0.01 0.06 0.09 0.12 0.5
Sb 3 2.46 0.005 0.001 0.113 0.000 0.005 0.005 0.005 0.006 0.006
SiO2 110 79.19 65.686 3.749 0.057 14.052 58.6 64 64.9 66.4 88.5
Sn 82 57 0.008 0.003 0.335 0.000 0.005 0.006 0.007 0.009 0.019
Sr 105 76.18 0.015 0.006 0.410 0.000 0.01 0.01 0.01 0.02 0.03
TiO2 110 79.19 0.600 0.096 0.160 0.009 0.13 0.59 0.62 0.65 0.73
V 102 72.52 0.010 0.000 0.000 0.000 0.01 0.01 0.01 0.01 0.01
W 84 60.5 0.067 0.287 4.292 0.083 0.001 0.002 0.003 0.008 1.79
Y2O3 65 48.96 0.006 0.001 0.170 0.000 0.005 0.005 0.006 0.006 0.009
Zn 110 79.19 0.013 0.007 0.535 0.000 0.006 0.01 0.011 0.014 0.079
Zr 109 77.9 0.014 0.005 0.360 0.000 0.01 0.01 0.01 0.02 0.03
Al2O3 155 46.93 5.552 4.585 0.826 21.021 0.15 2.32 4.16 7.64 19.1
As 90 27.55 0.035 0.055 1.562 0.003 0.01 0.01 0.01 0.02 0.35
BaO 112 30.97 0.029 0.029 0.996 0.001 0.01 0.01 0.02 0.03 0.18
Bi 58 17.96 0.018 0.019 1.059 0.000 0.01 0.01 0.01 0.02 0.22
CaO 154 46.82 0.881 1.211 1.374 1.466 0.08 0.36 0.61 1 9.31
CeO2 13 2.32 0.010 0.000 0.000 0.000 0.01 0.01 0.01 0.01 0.01
Co 0 0 0 0 0 0 0 0 0 0 0
Cr 1 0.54 0.010 0 0 0 0.01 0.01 0.01 0.01 0.01
Cu 58 17.09 0.049 0.128 2.602 0.016 0.005 0.006 0.012 0.02 0.742
Fe 155 46.93 1.697 0.867 0.511 0.751 0.58 0.99 1.61 2.06 10.05
HfO2 3 0.36 0.010 0.000 0.000 0.000 0.01 0.01 0.01 0.01 0.01
K2O 144 45.56 1.875 2.220 1.184 4.927 0.03 0.51 1.02 2.5 13.15
La2O3 18 2.27 0.010 0.000 0.000 0.000 0.01 0.01 0.01 0.01 0.01
MgO 155 46.93 0.359 0.365 1.016 0.133 0.02 0.11 0.25 0.44 2.03
Mn 155 46.93 0.066 0.122 1.829 0.015 0.01 0.02 0.03 0.05 1.73
Mo 26 4.99 0.012 0.012 0.966 0.000 0.005 0.006 0.007 0.013 0.069
Nb 23 7.64 0.020 0.039 1.922 0.002 0.005 0.007 0.014 0.021 0.317
Ni 10 2.45 0.015 0.015 0.994 0.000 0.005 0.008 0.011 0.014 0.052
P2O5 154 46.24 0.161 0.191 1.188 0.036 0.01 0.04 0.11 0.19 1.34
Pb 62 18.08 0.009 0.009 1.007 0.000 0.005 0.005 0.006 0.011 0.119
Rb 106 31.31 0.020 0.018 0.890 0.000 0.005 0.006 0.013 0.028 0.081
S 147 44.8 0.137 0.237 1.721 0.056 0.01 0.03 0.06 0.13 2.45
Sb 10 2.47 0.007 0.001 0.196 0.000 0.005 0.006 0.008 0.008 0.01
SiO2 155 46.93 85.268 10.874 0.128 118.248 6.28 81.7 88.4 92.8 99.7
Sn 51 12.99 0.013 0.012 0.914 0.000 0.005 0.007 0.012 0.014 0.068
Sr 58 13.07 0.019 0.030 1.551 0.001 0.01 0.01 0.01 0.02 0.22
TiO2 153 45.8 0.115 0.120 1.048 0.014 0.01 0.04 0.08 0.15 0.68
V 19 3.23 0.010 0.000 0.000 0.000 0.01 0.01 0.01 0.01 0.01
W 123 34.6 0.896 2.792 3.117 7.796 0.001 0.002 0.097 0.653 39.7
Y2O3 28 6.5 0.005 0.001 0.144 0.000 0.005 0.005 0.005 0.006 0.009
Zn 84 22.03 0.016 0.037 2.284 0.001 0.005 0.006 0.007 0.01 0.203
Zr 38 8.4 0.011 0.003 0.259 0.000 0.01 0.01 0.01 0.01 0.02
Statistics of Multi-Element for Mt Carbine
Host
rock
Host
+ v
eins
Vein

Mt Carbine Bankable Feasibility Study – Chapter 3: Geology and Resources
41
11. Hydrogeology
The hydrogeological regime at Mt Carbine was originally assessed in 2012 by Rob Lait and Associates, and a
further gap analysis was performed by Australasian Groundwater and Environmental Consultants in 2020.
Further hydrogeological assessments and modelling are currently ongoing to support the Project’s
environmental approvals process, which is described in Chapter 10: Environment and Approvals. This work is
ongoing and no outcomes have been included in this study.
The details below are based off the work completed in 2012 and 2020 by Rob Lait and Associates and
Australasian Groundwater and Environmental Consultants.
11.1. Groundwater
The greatest potential for groundwater at Mt Carbine occurs within the Hodgkinson Formation. Fractured rocks
within the Hodgkinson Formation contain aquifers that generally have secondary porosity, may be hydraulically
disjointed and can be difficult to analyse because of these characteristics.
Figure 37 shows the almost vertical attitude of cleavage within fine-grained rocks of the Hodgkinson Formation.
These rocks are situated in Manganese Creek just to the east of the existing open pit. Open cleavage partings
such as those shown in Photograph 1 offer the greatest opportunity for recharging rainfall to penetrate fractured
rock aquifers and accumulate as groundwater at depths of 50 to 60m.
Groundwater primarily resides along the cleavage partings and along the traces of fractures.
Figure 37: Cleavage Partings in Hodgkinson Formation Rocks (Near Open Pit)
11.1.1. Groundwater Recharge
The primary mechanism for recharge to the aquifers in the area is the direct infiltration of rainfall. Recharge to
fractured zones in the Hodgkinson Formation will be rapid in areas where open cleavage partings are both

Mt Carbine Bankable Feasibility Study – Chapter 3: Geology and Resources
42
exposed at the surface and persist to depths of 50 to 60m. There are significant areas to the north of the
Mulligan Highway where such conditions exist.
A secondary mechanism for recharge to the aquifers at Mt Carbine is episodic or flood recharge. During a
major rainfall event, 80% of water not lost by evaporation may discharge as surface runoff. The maximum
opportunity for recharge to these aquifers will occur where cleavage partings are exposed in ephemeral gullies
that traverse the site and flow during the wet season.
There is little or no evidence of exposed Hodgkinson Formation to the south of the Mulligan Highway.
11.1.2. Groundwater Supply Opportunities
After the raw water supply from the open pit is exhausted, an additional supply of water is required.
Rob Lait and Associates have performed an analysis of the ground water supply opportunities and identified a
bore location suitable to supply sufficient flow rate to meet the Project’s requirements.
This is detailed further in Chapter 6: Infrastructure.
11.1.3. Groundwater Flow
The elevations of the groundwater in the monitoring bores were calculated from the groundwater level
measurements, and the elevations of the measurement reference points. The elevation of the water level in
the open pit is also known. Groundwater flow is from the northeast to the south and to the west.
11.1.4. Groundwater Discharge
There is no evidence of springs or seeps in the ephemeral gullies during the dry season. There is no report of
springs or seeps in the immediate vicinity of Mount Carbine either in the Natural Resources Management
(NRM) groundwater database or anecdotally.
There are no recognisable or known groundwater dependent ecosystems within the Project’s operation area.
11.2. Water Quality
Mt Carbine’s EA requires quarterly measurements of pH, electrical conductivity (EC), major cations and anions,
fluoride, filtered metals (aluminium, antimony, arsenic, cadmium, chromium, cobalt, copper, lead, manganese,
molybdenum, nickel, selenium, tungsten and zinc), total petroleum hydrocarbons and total hardness. The EA
contains groundwater quality objectives (GQOs) against which monitoring data from compliance bores are
assessed. The GQOs for the shallow compliance bores are either default values or values derived from the
shallow reference site concentrations. For the deep compliance bores, reference site concentrations are used.
Groundwaters at Mt Carbine are generally circumneutral (pH 7.1 to 7.8), fresh to moderately saline (EC 1,500
to 7,000 µS/cm) and with relatively low dissolved metal concentrations (limit of reporting to <1mg/L). EA trigger
values for electrical conductivity (EC), sulfate, copper (filtered) and zinc (filtered) are commonly exceeded in
groundwater beneath the Mt Carbine site. These exceedances tend to follow a pattern whereby a specific bore
consistently exceeds for a specific analyte. This suggests that the current reference bore approach is not
appropriate for the groundwater quality conditions on site. These conditions may be due to natural variability
or mine related influences on the chemical quality of groundwater.
11.3. Ongoing Hydrogeological Assessment
A hydrogeological assessment to support the Project’s approvals process is ongoing. EQR has engaged Rob
Lait and Associates to develop a hydrogeological model based on the outcomes of 10 years’ worth of bore
monitoring from the wells installed in 2011. EQR is planning to install additional monitoring bores to assist in
this assessment and the ongoing monitoring and management of groundwater.

Mt Carbine Bankable Feasibility Study – Chapter 3: Geology and Resources
43
12. Geotechnical Appraisal
A geotechnical assessment was undertaken for the project by Ian McEnhill of Geotechnical Consultants Pty
Ltd.
12.1. Drill Hole Data
79 holes in the deposit have been tested by geotechnical analysis. The holes are spread across the resource
area covering a zone of 1.3km in strike and 600m in width. The holes were all diamond drilling so a good
understanding of structure, recovery, morphology and domains could be established. All the core is stored
safely at site in a core shed and on pallets. Clear labelling of the depth and hole number exists.
The holes vary from 50 to 741m in depth with an average of 261m. Recovery observed in the drilling was
above 98% as the core is very competent with few clay zones. Mineralised bodies are hard with very few strong
boundary factures showing that the core rarely preferentially breaks on the vein margins.
Attached in Appendix D is a summary of the geotechnical characteristics of the rock types. It was found in
completing over 430m of decline tunnel on a large 8 x 4m size that there was no need for rock bolting of the
backs as the ground was competent. The 20m bench rock faces exposed now for 48 years are in remarkable
preservation with only a few minor rock falls.
Figure 38: Typical Section Showing RQD Through the Centre of the Deposit
12.2. Geotechnical Conditions
Significant geotechnical data has been collected during the previous mining of the 22 Mt open cut and 430m
of large-scale decline. Geotechnical Consulting Pty Ltd (GCPL) completed a desktop review of the following
reports and documents.
• Piteau Report HD042 : Slope Stability Analysis & Design (April 1982);
• Golder Report HD035 : Review of Rock Mechanics (July 1984);

Mt Carbine Bankable Feasibility Study – Chapter 3: Geology and Resources
44
• Australian Coal Industry Research Laboratories UCS Test Results (December 1984);
• Baczynski : Plan of Action to DME for Re-Opening the Mt Carbine Decline (April 2021) and
• MOSHAB Code of Practice : Surface Rock Support for Underground Mines (Feb 1999).
GCPL examined the historical data and concluded that in the initial 30m or so of surface the rock mass appears
to be moderately weathered with an estimated intact rock strength of 10 to 30MPa. Up to four joint sets bisect
the rock, to define moderately - sized slabs and flaggy conditions. GCPL stereographic analysis indicate that
the pronounced slabs are delineated by persistent, steeply SW – dipping foliation, sub-vertical quartz veins
and B1 jointing which runs near-parallel to the decline.
Potential release from the backs of a decline or from slopes of a pit face, will probably be controlled by dominant
joint set C1, spaced at 0.5 to 1.0m and dipping flatly at 15 to 300 to the east.
In GCPL’s analysis of these joints the situation is more relevant to the interaction of any future decline with the
dominant structure as it indicates that the formation of potentially unstable tetrahedral wedges in the backs of
the decline is kinematically feasible (refer Figure 39).
Figure 39: Kinematic Analysis of interaction of Foliation with Joint Sets B1 and C1
The geotechnical data for the open pit is summarised in Table 7.

Mt Carbine Bankable Feasibility Study – Chapter 3: Geology and Resources
45
Table 7: GCPL Interpretation of Strength of Intact Rock and Structure
12.3. Geotechnical Considerations to Mining
The geotechnical assessment, with consideration to mining activities, is detailed in Chapter 4: Mining.
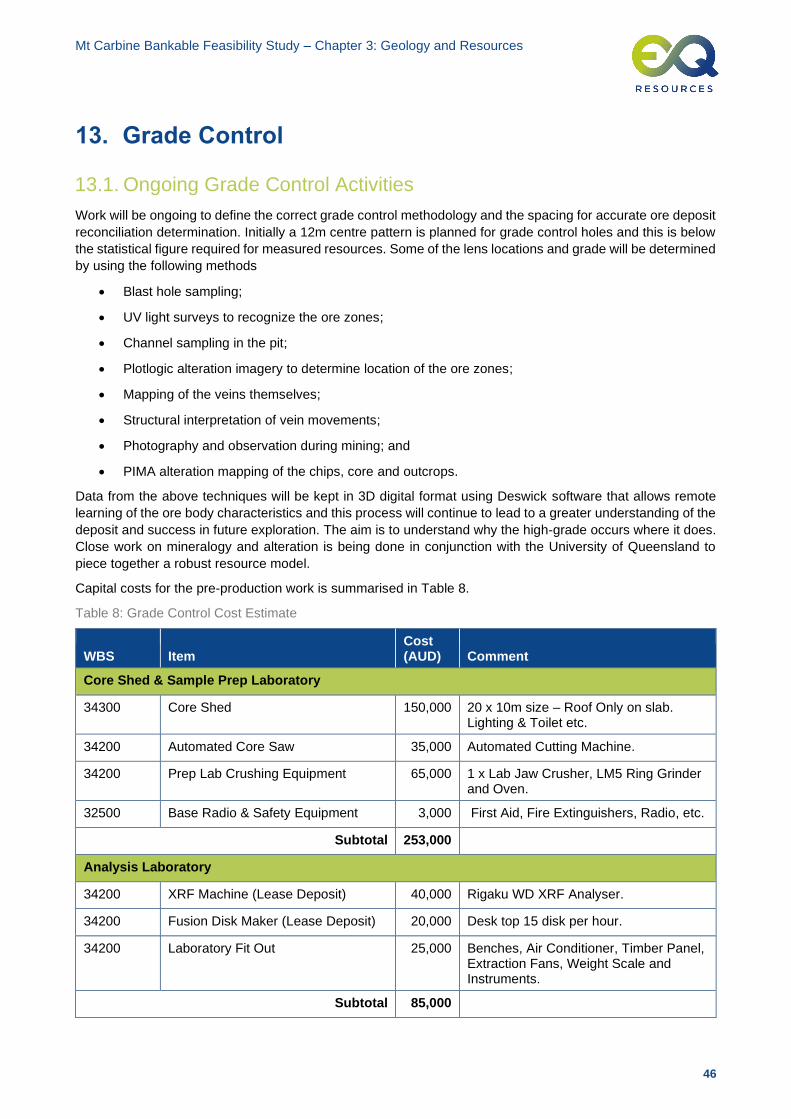
Mt Carbine Bankable Feasibility Study – Chapter 3: Geology and Resources
46
13. Grade Control
13.1. Ongoing Grade Control Activities
Work will be ongoing to define the correct grade control methodology and the spacing for accurate ore deposit
reconciliation determination. Initially a 12m centre pattern is planned for grade control holes and this is below
the statistical figure required for measured resources. Some of the lens locations and grade will be determined
by using the following methods
• Blast hole sampling;
• UV light surveys to recognize the ore zones;
• Channel sampling in the pit;
• Plotlogic alteration imagery to determine location of the ore zones;
• Mapping of the veins themselves;
• Structural interpretation of vein movements;
• Photography and observation during mining; and
• PIMA alteration mapping of the chips, core and outcrops.
Data from the above techniques will be kept in 3D digital format using Deswick software that allows remote
learning of the ore body characteristics and this process will continue to lead to a greater understanding of the
deposit and success in future exploration. The aim is to understand why the high-grade occurs where it does.
Close work on mineralogy and alteration is being done in conjunction with the University of Queensland to
piece together a robust resource model.
Capital costs for the pre-production work is summarised in Table 8.
Table 8: Grade Control Cost Estimate
WBS Item Cost (AUD) Comment
Core Shed & Sample Prep Laboratory
34300 Core Shed 150,000 20 x 10m size – Roof Only on slab. Lighting & Toilet etc.
34200 Automated Core Saw 35,000 Automated Cutting Machine.
34200 Prep Lab Crushing Equipment 65,000 1 x Lab Jaw Crusher, LM5 Ring Grinder and Oven.
32500 Base Radio & Safety Equipment 3,000 First Aid, Fire Extinguishers, Radio, etc.
Subtotal 253,000
Analysis Laboratory
34200 XRF Machine (Lease Deposit) 40,000 Rigaku WD XRF Analyser.
34200 Fusion Disk Maker (Lease Deposit) 20,000 Desk top 15 disk per hour.
34200 Laboratory Fit Out 25,000 Benches, Air Conditioner, Timber Panel, Extraction Fans, Weight Scale and Instruments.
Subtotal 85,000

Mt Carbine Bankable Feasibility Study – Chapter 3: Geology and Resources
47
Geological Office
81900 Mining Software 50,000 Leapfrog License & Deswick License.
Total 388,000
The ongoing operational costs for the running of the Project’s Geological Department are summarised in Table
9.
Table 9: Geological Department Operational Costs
Item Description Cost (AUD/year) Comment
Grade Control
Reverse Circulation
RC Hire / $70/m
All in
120,000 Total for 3 year pit mine life is expected to be 5,000m of grade control drilling.
XRF Lease Monthly Lease 48,000 Lease Cost for XRF & Fusion Machine
Mining Software Maintenance Cost of Software
10,000 Leapfrog & Deswick
Geology Consumables
Grade Control Drilling Consumables, Prep Lab Consumables
30,000 Core trays, Maintenance for Lab
Sample Bags, Survey markers etc.
Staff Costs Labour 460,000
Total 668,000
One of the major ongoing costs for mining operations is the grade control drilling.
Essentially each of the lenses will be drilled on a 20 x 10m x 20m cross pattern prior to mining. This drilling will
be done on two bench levels at a time (40m vertical).
The drilling will be completed by a reverse circulation drilling rig using four inch holes and taking 1m sample
intervals. These holes will be angled from the pit floor or from prepared upper benches and each hole is
designed to intersect the lens at a high angle to strike as shown in Figure 40: Grade Control Drill Pattern.
Figure 40: Grade Control Drill Pattern
Sampling of the 1m grade control intervals will generate a detailed flitch map for that bench with the 1m
intervals being composited into the lens widths and provide a single grade point on that lens position. Ongoing
reconciliation of predicted grade and actual grade is a daily basis, and this in turn can be used to verify the
grade control pattern to ultimately reach the optimised pattern. Where possible the blast holes will also be used
as additional data points and may replace some of the grade control holes in time.

Mt Carbine Bankable Feasibility Study – Chapter 3: Geology and Resources
48
The target is to generate a more detailed block model with robust grade on 1.0 x 1.0 x 1.0m size within the
larger lens blocks of 20 x 20m x lens width having a minimum of 400 grade-controlled subblocks. This will
allow for detailed mark-up of the ore for mining on minimum mine widths based on the nearest metre.
Given the lenses on average are 3.8m mining equipment will be specialised for the ore as opposed to the
larger waste lenses.
Figure 41: Flitch of the 290m RL Level Showing Ore Zones and Grade
Figure 42: Same Flitch Showing Grade Control Pattern to Define Lens Location
13.2. Geological Department Functions
Geology and grade control require daily sampling, mapping, marking out of ore zones, control of mining and
waste designations, updating the model daily with new results, structural analysis, geotechnical assessment
and grade reconciliation. Exploration work and location of additional resources is also part of this Department’s
responsibility. The Department is to be staffed by the personnel summarised in Table 10.

Mt Carbine Bankable Feasibility Study – Chapter 3: Geology and Resources
49
Table 10: Geological Department
Role Quantity
Pit Geologist 1
Resource Geologist 1
Core Shed Manager 1
Laboratory Manager 1
Field Assistant 1
TOTAL 5
The tungsten ore zones have the benefit that they can be visually recognised using a UV light and will be
checked and marked up during night shift. This will be reconfirmed by both channel sampling and grade control
drill holes. It is expected on average,15 samples per shift will be collected for the in-house laboratory.

Mt Carbine Bankable Feasibility Study – Chapter 3: Geology and Resources
50
14. References
Title Author Date
Mount Carbine Tunsgten Deposit, in Geology of the Mineral Deposits of Australia and Papua New Guinea
D.L. Forsythe, N.C. Higgins
1990
Poly-type model for tungsten deposits and vertical structural zoning model for vein-type tungsten deposits in south China
Li Yidou 1993
Rumula Geological Map 1:100,000 Sheet 7964. Department of Mines and Energy Brisbane
R.J. Bultitude et al. 1999
Feasibility Study 1/83 Underground Mining Proposal for the Mt Carbine Mine
Queensland Wolfram Pty Ltd
1983
Brief review and structural assessment/scoping of Iron Duke Petersens Mt Carbine EPM 14872
N. Oliver 2020
Carbine Tungsten Limited Stockpile Testwork Results A. White 2006
Report on Geological Mapping of Iron Duke and Petersens Lodes Scheelite Prospects, Mt Carbine Tungsten District
A. White 2013
A Review of the Geology, Underground Ore Reserves and Exploration Targets
D.L. Forsythe Mar-89
Report on the Compilation of Information Pertaining to the Geology, Resources and Mining History of the Mt Carbine Tungsten Deposit, North Queensland
Grahame Hamilton Cullen Exploration Pty Ltd
Aug-06
Mt Carbine Diamond Drill Hole Register 1969-1984 Unknown 1984
Mt Carbine Diamond Drill Hole logs H. Stevenson Unknown
Estimation of Underground Ore Reserves at Mt Carbine and Compilation of Mine Data
D.L. Forsythe Feb-84
First Supplement to Diamond Drill Core Logs CB1- CB29A x 2 documents Quartz Vein Premeasurement with Preliminary Observations of Feldspar and Muscovite
D.L. Forsythe Jun-85
Mt Carbine D.D.H.’s CB 38-45 x 2 documents Supplementary Logs & Data i) Survey ii) Mechanical Properties Logs iii) Foliation iv) R.Q.D. v) U.C.S. Quartz Content vi) Vein Mineral Summary Sheets
Unknown Jun-85
Mt Carbine Diamond Drill Hole Surveys Unknown Unknown
The Mt Carbine Mine Review of Underground Mining Proposal
Golder Associates Pty Ltd
Apr-84
Mt Carbine Project Remaining Tungsten Mineralization within the Mining Leases 4867 & 4919
John Sainsbury Consultants Pty Ltd
Mar-05
Proposal for Development of X-ray Transmission Wolframite Detector & Sorter Interface System
Ritz Ore Sorters Mar-81
Quartz Content, Etc of Drill Core Samples x 2 documents A.S. Joyce Ceochempet Services
Dec-84
R.B. Mining Pty Ltd Mt Carbine Mine Review of Underground Mining Proposal
Golder Associates Consulting Geotechnical & Mining Engineers
Apr-84

Mt Carbine Bankable Feasibility Study – Chapter 3: Geology and Resources
51
Title Author Date
Recent Observations on the Feldspar – Mica Selvage Transition at Mt Carbine
D.L. Forsythe Feb-85
Report on the Mt Carbine Wolframite Deposit Report 1/70 R.B. Mining Pty Ltd Nov-70
Mt Carbine Tungsten Project Scoping Study for Icon Resources + Appendices (2 Separately Bound Documents)
AJE Project Development Consultancy
Oct-09
Underground Mining at Mt Carbine Preliminary Schedules, Geological Requirements, Grade and Volume Parameters
H. Stevensen Feb-83
Geostatistically Analysis and Ore Body Modelling (Extract) Mt Carbine Tungsten Project
University of Queensland Steven David Potter
Jun-94
Geology of Mt Carbine Area, North Queensland D.L. Forsythe, R.B. Mining Pty Ltd
Aug-83
Icon Resources Ltd Mt Carbine Project Resource Estimate Geostat Services Oct-10
Resource Estimate Audit Report Geosun Pty Ltd Apr-13

Mt Carbine Bankable Feasibility Study – Chapter 3: Geology and Resources
52
15. List of Abbreviations
Abbreviation Description
ALS ALS Laboratories
EA Environmental Authority
EC Electrical conductivity
EQR EQ Resources Limited
GCPL Geotechnical Consulting Pty Ltd
GQO Ground Quality Objective
Ha Hectare
LGS Low grade stockpile
ML Mining lease
OK Ordinary kriging
QAQC Quality assurance and quality control
RL Relative level
SWF South wall fault
UV Ultra violet

Mt Carbine Bankable Feasibility Study – Chapter 3: Geology and Resources
53

A REPORT BY MEASURED GROUP PTY LTD
GEOLOGY AND
MINERAL RESOURCE ESTIMATE
MT CARBINE TUNGSTEN PROJECT
EQ RESOURCES PTY LTD
3 December 2021
REPORT NO: MG748_MT CARBINE GEOLOGY AND MINERAL RESOURCES_03122021

MT CARBINE GEOLOGY AND MINERAL RESOURCE ESTIMATE
EQ RESOURCES PTY LTD
measuredgroup.com.au i
DOCUMENT ISSUES AND APPROVALS
DOCUMENT INFORMATION
Project: Mt Carbine Tungsten Project
Document Number: MG748_Mt Carbine Geology and Mineral Resources_03122021
Title: Geology and Mineral Resource Estimate
Client: EQ Resources Pty Ltd
Date: 03 December 2021
CONTRIBUTORS
Name Position Signature
Prepared by: Chris Grove Principal Geologist
Reviewed by: Marcus Trost Principal Geologist
Approved by: James Knowles Director and Principal
Geologist
DISTRIBUTION
Company Attention Hard Copy Electronic
Copy
EQ Resources Pty Ltd Kevin MacNeill No Yes

MT CARBINE GEOLOGY AND MINERAL RESOURCE ESTIMATE
EQ RESOURCES PTY LTD
measuredgroup.com.au ii
PURPOSE OF REPORT
Measured Group Pty Ltd (MG) has prepared this report for the management of EQ Resources Pty
Ltd (EQR). The purpose of the report is to provide EQR with an objective assessment, estimation
and statement of Mineral Resources that is consistent with the Australasian Code for Reporting
of Exploration Results, Mineral Resources, and Ore Reserves, 2012 edition (The JORC Code).
The report includes a summary of steps taken to verify and validate all available geoscience data
used to build geoscience models for the Mt Carbine orebodies that will be used as the basis for
feasibility studies and mine design activities. The report also includes a Mineral Resource
estimate for Insitu orebody and the Low-Grade Stockpile (LGS).

MT CARBINE GEOLOGY AND MINERAL RESOURCE ESTIMATE
EQ RESOURCES PTY LTD
measuredgroup.com.au iii
LIMITATIONS AND LIABILITY
Measured Group, after due enquiry and subject to the limitations of the Report hereunder,
confirms that:
− The conclusions presented in this report are professional opinions based solely upon
Measured Group’s interpretations of the documentation received, interviews and
conversations with personnel knowledgeable about the site and other available
information, as referenced in this report. These conclusions are intended exclusively for
the purposes stated herein.
− For these reasons, the reader must make their own assumptions and their own
assessments of the subject matter of this report.
− Opinions presented in this report apply to the site’s conditions and features as they existed
at the time of Measured Group’s investigations, and those reasonably foreseeable. These
opinions do not necessarily apply to conditions and features that may arise after the date
of this report, about which Measured Group have had no prior knowledge nor had the
opportunity to evaluate.
Limited Liability
Measured Group will not be liable for any loss or damage suffered by a third party relying on this
report regardless of the cause of action, whether breach of contract, tort (including negligence) or
otherwise unless and to the extent that that third party has signed a reliance letter in the form
required by Measured Group (in its sole discretion). Measured Group's liability in respect of this
report (if any) will be specified in that reliance letter.
Responsibility and Context of this Report
The contents of this report have been created using data and/or information provided by or on
behalf of the Customer. Measured Group accepts no liability for the accuracy or completeness of
data and information provided to it by, or obtained by it from, the Customer or any third parties,
even if that data and information has been incorporated into or relied upon in creating this report.
The report has been produced by Measured Group using information that is available to Measured
Group as at the date stated on the cover page. This report cannot be relied upon in any way if the
information provided to Measured Group changes. Measured Group is under no obligation to
update the information contained in the report at any time.

MT CARBINE GEOLOGY AND MINERAL RESOURCE ESTIMATE
EQ RESOURCES PTY LTD
measuredgroup.com.au iv
COMPETENT PERSONS STATEMENT
I, Chris Grove, confirm that I am the Competent Person for this Report and:
− I have read and understood the requirements of the 2012 Edition of the Australasian Code
for Reporting of Exploration Results, Mineral Resources and Ore Reserves (JORC Code,
2012 Edition).
− I am a Competent Person as defined by the JORC Code 2012 Edition, having at least five
years of experience that is relevant to the style of mineralisation and type of deposit
described in this Report, and to the activity for which I am accepting responsibility.
− I am a Member of The Australasian Institute of Mining and Metallurgy (AusIMM).
− I am the author of the Report to which this Consent Statement applies.
I am a full-time employee of Measured Group Pty Ltd and have been engaged by EQR to prepare
the documentation for the Mt Carbine Tungsten Project on which the Report is based, for the
period ended October 2021.
I have more than 24 years of experience in the estimation of Mineral Resources both in Australia
and overseas. This expertise has been acquired principally through exploration and evaluation
assignments at operating mines and exploration areas.
I have disclosed to the reporting company the full nature of the relationship between myself and
the company, including any issue that could be perceived by investors as a conflict of interest.
I verify that the Report is based on and fairly and accurately reflects in the form and context in
which it appears, the information in my supporting documentation relating to Mineral Resources.
Pursuant to the requirements of ASX Listing Rules 5.6, 5.22 and 5.24 and Clause 9 of the JORC
Code 2012 Edition, I consent to the release of this Report and this Consent Statement by EQR.
…………………………………………………………………………
Chris Grove B. App Sci.(Geol), MAusIMM
Member AusIMM – 310106

MT CARBINE GEOLOGY AND MINERAL RESOURCE ESTIMATE
EQ RESOURCES PTY LTD
measuredgroup.com.au v
EXECUTIVE SUMMARY
Measured Group Pty Ltd (MG) has prepared this report for the management of EQ Resources Pty
Ltd (EQR). The purpose of the report is to provide EQR with an objective assessment, estimation
and statement of Mineral Resources that is consistent with the Australasian Code for Reporting
of Exploration Results, Mineral Resources, and Ore Reserves, 2012 edition (The JORC Code).
The report includes a summary of steps taken to verify and validate all available geoscience data
used to build geoscience models for the Mt Carbine orebodies that will be used as the basis for
feasibility studies and mine design activities. The report also includes a Mineral Resource
estimate for Insitu orebody and the Low-Grade Stockpile (LGS).
The Mt Carbine Mine is located 130 km north of the city of Cairns in Far North Queensland,
Australia. EQR acquired the mine and associated quarry in July 2019 and have been operating
the mine and quarry concurrently, with the mine currently processing tailings and low-grade ore
stockpiles located on the site that are remnant from previous operations on the site.
The Mt Carbine mining area is contained in two Mining Leases - ML 4867, ML 4919 and three
Exploration Permit for Minerals - EPM 14872, EPM 14871, EPM 27394.
The Mt Carbine project is located within the Siluro-Devonian Hodgkinson sedimentary province.
The thick sedimentary sequence was complexly folded and regionally metamorphosed before
and during extensive granitic intrusions in the Carboniferous and Permian.
The Mt Carbine tungsten deposit consists of several vertical to sub-vertical sheeted quartz veins
ranging in width up to 7 metres but averaging around 50 cm. Economic minerals are the tungsten
minerals of wolframite and scheelite mineralisation.
A typical section through the centre of the deposit shows quartz veins ranging from 10 cm to 6 m
in width with 5-8 zones of secondary narrow mineralised quartz veins of 10 cm to 150 cm in width.
These high-grade veins contain rich quartz-feldspar tungsten minerals and have been designated
as “King Veins”.
The Mt Carbine tungsten deposit was discovered in 1883 by prospectors following on from the
discovery of tungsten located in Manganese Creek south of the deposit. The area was mined
sporadically until Queensland Wolfram Limited systematically mined the deposit from 1972 to
1987 and extracted approximately 22 Mt via open-pit mining at a rate of 1.5 Mt per annum. As a
result of the previous mining 12 Mt of low grade material was wasted directly to what is now
referred to as the Low-Grade Stockpile (LGS).
Since its closure, the mine has changed hands and additional exploration and study activities
have been conducted to reopen the mine. Limited exploration drilling was completed in 2011 and
2012, with two Mineral Resource estimates in 2010 and 2013 respectively.
Recently (2021) 16 oriented drilling holes (EQ001 – EQ016) were completed totalling 4,074 metres
of diamond drilling. These drill holes and the historical data has enabled an updated geological
interpretation and model to be developed to support an estimate of Mineral Resources for the
insitu orebody.

MT CARBINE GEOLOGY AND MINERAL RESOURCE ESTIMATE
EQ RESOURCES PTY LTD
measuredgroup.com.au vi
In addition, recent sampling and investigation into the tonnage and grade of the Low-Grade
Stockpile (LGS) has enabled an estimate of Mineral Resources for the LGS orebody.
The following is a summary of the Mineral Resource estimate for the insitu and Low-Grade
Stockpiles, as at 21 September 2021:
Table 1-1: Mt Carbine Resource Estimate, as at September 2021
Orebody Resource
Classification Tonnes
(Mt) Grade
(WO3 %) WO3 (mtu)
Low-Grade Stockpile Indicated 12 0.075 900,000
In Situ
Indicated 2.40 0.74 1,776,000
Inferred 6.81 0.59 4,017,900
Total 9.21 0.63 5,793,900
All Total 21.21 6,693,900
Notes: 1. Total estimates are rounded to reflect confidence and resource categorisation. 2. Classification of Mineral Resources incorporates the terms and definitions from the Australasian Code for Reporting of Exploration Results, Mineral Resources and Ore Reserves (JORC Code, 2012) published by the Joint Ore Reserve Committee (JORC) 3. No uppercut was applied to individual assays for this resource, a lower cut of 0.15% WO3 was applied, which is the grade where the mineralisation forms distinct veins. 4. Drilling used in this methodology was all diamond drilling with ½ core sent according to geological intervals to ALS for XRF15b analysis. 5. Resource estimation was completed using Kriging Methodology. 6. Indicated spacing is approximately 30 m x 30 m; Inferred is approximately 60 m x 60 m. 7. The deposit is a sheeted vein system with subparallel zones of quartz tungsten mineralisation that extend for >1.2 km in length and remain open. At depth, the South Wall Fault cuts the Iolanthe to Johnson veins but the Iron Duke zones remain open to depth.
EQR is completing various studies on the Mt Carbine orebodies to assess the viability and
economics of maintaining the current operations and developing future mining domains in the
deeper orebodies. The results of work completed for Mt Carbine is assisting EQR in refining the
current plan for the ongoing studies for the Mt Carbine Open cut and Underground project. EQR
has multiple paths to continue to mine and develop future mining domains in the various orebodies
at Mt Carbine.
Measured Group is satisfied that there has been sufficient study, economic analysis, and the
opportunity to apply technological developments in mining methods to meet the reasonable
prospects for the eventual economic extraction (“RPEEE”) test. Currently, there is a reasonable
basis to assume the Mineral Resource estimated for Mt Carbine orebodies will be mined in future.

MT CARBINE GEOLOGY AND MINERAL RESOURCE ESTIMATE
EQ RESOURCES PTY LTD
measuredgroup.com.au vii
TABLE OF CONTENTS
DOCUMENT ISSUES AND APPROVALS............................................................................. i
PURPOSE OF REPORT ...................................................................................................... ii
LIMITATIONS AND LIABILITY ............................................................................................ iii
COMPETENT PERSONS STATEMENT ............................................................................. iv
EXECUTIVE SUMMARY ..................................................................................................... v
TABLE OF CONTENTS ..................................................................................................... vii
LIST OF FIGURES ............................................................................................................... x
LIST OF TABLES ............................................................................................................... xii
1. SCOPE OF WORK .................................................................................................. 13
2. INTRODUCTION ..................................................................................................... 14
2.1 Location ............................................................................................................... 14
2.2 Tenure ................................................................................................................. 14
2.3 Site Infrastructure................................................................................................. 17
2.3.1 Dams ............................................................................................................ 17
2.3.2 Drainage ....................................................................................................... 17
2.4 Climate ................................................................................................................ 17
3. HISTORICAL EXPLORATION AND MINING ........................................................... 19
3.1.1 Low-Grade Stockpile ..................................................................................... 19
4. GEOLOGY .............................................................................................................. 23
4.1 Regional Geology ................................................................................................ 23
4.2 Deposit geology ................................................................................................... 26
4.3 Structure .............................................................................................................. 27
4.4 Mineralisation ...................................................................................................... 31
4.5 Weathering .......................................................................................................... 36
4.6 Alteration ............................................................................................................. 37
5. DATA ACQUISITION ............................................................................................... 38
5.1 Recent Exploration Drilling ................................................................................... 38
5.2 Collar and Topography Surveys ........................................................................... 40
5.3 Downhole Survey ................................................................................................. 40
5.4 Drill Hole Data ...................................................................................................... 40
5.5 Core Photography ................................................................................................ 41
6. SAMPLE PREPARATION, ANALYSES AND SECURITY ........................................ 42
6.1 Insitu Orebody ..................................................................................................... 42
6.1.1 Low-Grade Stockpile ..................................................................................... 43

MT CARBINE GEOLOGY AND MINERAL RESOURCE ESTIMATE
EQ RESOURCES PTY LTD
measuredgroup.com.au viii
6.2 Petrology ............................................................................................................. 43
6.3 Sample Data Location, Spacing and Distribution .................................................. 45
6.4 Sample Data Orientation in Relation to Geological Structure ............................... 45
6.5 Sampling Audit ..................................................................................................... 45
7. QA/QC..................................................................................................................... 46
7.1 Review of Visual Results ...................................................................................... 46
7.2 QA/QC Samples .................................................................................................. 48
7.2.1 Standards ..................................................................................................... 48
7.2.2 Blanks ........................................................................................................... 49
7.2.3 Umpire Laboratory Pulp Assay Verification ................................................... 50
8. LOW-GRADE STOCKPILE ASSESSMENT ............................................................ 51
8.1 Historical ‘Ore’ Extraction and Waste Dump Formation ........................................ 51
8.2 Grade Distribution in Low-Grade Stockpile........................................................... 51
8.3 Processing of Low-Grade Stockpile Material ........................................................ 53
8.4 Results From Current Mining Activities ................................................................ 55
9. MINERAL RESOURCE ESTIMATE ......................................................................... 57
9.1 Site Visit ............................................................................................................... 57
9.2 Key Assumptions ................................................................................................. 57
9.3 Resource Limits ................................................................................................... 57
9.4 Points of Observation ........................................................................................... 59
9.5 Geological Modelling............................................................................................ 59
9.6 Compositing ......................................................................................................... 59
9.7 Geostatistics ........................................................................................................ 59
9.7.1 Spatial Location of Samples Selection .......................................................... 60
9.7.2 Sample Length .............................................................................................. 60
9.7.3 Sample vs. Block Histogram ......................................................................... 60
9.7.4 Variography .................................................................................................. 63
9.8 Estimation and Modelling Techniques .................................................................. 64
9.8.1 Insitu Orebody .............................................................................................. 64
9.8.2 Low-Grade Stockpile ..................................................................................... 66
9.9 Moisture ............................................................................................................... 66
9.10 Cut-Off Parameters .............................................................................................. 66
9.11 Orebody Extents .................................................................................................. 66
9.12 Mining Factors and Assumptions ......................................................................... 67
9.13 Metallurgical Factors and Assumptions ................................................................ 67
9.14 Environmental Factors and Assumptions ............................................................. 67
9.15 Bulk Density ......................................................................................................... 67

MT CARBINE GEOLOGY AND MINERAL RESOURCE ESTIMATE
EQ RESOURCES PTY LTD
measuredgroup.com.au ix
9.16 Resource Classification ....................................................................................... 68
9.17 Reasonable Prospects for Eventual Economic Extraction .................................... 70
9.18 Model Validation .................................................................................................. 70
10. STATEMENT OF MINERAL RESOURCES ............................................................. 71
10.1 Reconciliation To Prior Estimates ........................................................................ 73
11. EXPLORATION POTENTIAL .................................................................................. 74
12. REFERENCES ........................................................................................................ 77
APPENDIX A: JORC TABLE 1 – INSITU OREBODY .......................................................... 78
APPENDIX B: JORC TABLE 1 – LOW-GRADE STOCKPILE ............................................. 92
APPENDIX C: DRILL HOLE DATA .................................................................................. 105
APPENDIX D: PETROLOGY STUDY REPORT ............................................................... 112
APPENDIX E: QA/QC ASSAY RESULTS ........................................................................ 127
APPENDIX F: QA/QC FOR SURVEY .............................................................................. 129
APPENDIX G: QA/QC ANALYSIS OF STANDARDS ....................................................... 134
APPENDIX H: MULTI-ELEMENT STATISTICS FOR MT CARBINE ................................ 140

MT CARBINE GEOLOGY AND MINERAL RESOURCE ESTIMATE
EQ RESOURCES PTY LTD
measuredgroup.com.au x
LIST OF FIGURES
Figure 2-1: Mt Carbine Location ......................................................................................... 15
Figure 2-2: Mt Carbine Tenements ..................................................................................... 16
Figure 2-3: Mt Carbine Site Layout ..................................................................................... 18
Figure 3-1: Current Pit Showing Historical 20m Benches ................................................... 20
Figure 3-2: Aerial Photo of Low-Grade Stockpile ................................................................ 22
Figure 4-1: Regional Geological ......................................................................................... 24
Figure 4-2: Local Geology .................................................................................................. 25
Figure 4-3: Tungsten Conceptual Deposit Models (after Yidou,1993) ................................. 26
Figure 4-4: Main Faults of Mt Carbine ................................................................................ 28
Figure 4-5: South Wall Fault in Open Pit ............................................................................ 29
Figure 4-6: Vein Formation at Mt Carbine outlining the structural stress (after Oliver, 2021)30
Figure 4-7: Stereonet Illustrating the Orientation of Veins with Structural Stress (after Oliver, 2021) .......................................................................................................................................... 31
Figure 4-8: King Veins with Various Coarse Vein Textures of Wolframite Crystals ............. 33
Figure 4-9: Late Replacement of Coarse wolframite by Fine Scheelite ............................... 33
Figure 4-10: Sheeted Veins at the Base of the Pit and wolframite on the Left Side. ............ 34
Figure 4-11: Cross Section at 22850E ................................................................................ 35
Figure 4-12: Core with Mineralisation Zones (Highlighted) ................................................. 36
Figure 5-1: Drill Hole Locations .......................................................................................... 39
Figure 5-2: Example of Core Photography ......................................................................... 41
Figure 6-1: Wolframite Minerals (after Pterosaur Petrology, 2021) ..................................... 44
Figure 6-2: Scheelite Mineral (after Pterosaur Petrology, 2021) ......................................... 44
Figure 6-3: Examples of Coarse Wolframite with Scheelite Quartz ..................................... 44
Figure 7-1: Comparison of Visual vs. Assay Results .......................................................... 46
Figure 7-2: Scatterplots (left) and Q-Q Plots (right) of Laboratory Assays vs Visual Estimates (after Bainbridge, 2021) ............................................................................................................... 47
Figure 7-3: Plot of Results of Inserted Blank Samples ........................................................ 49
Figure 7-4: Blank Samples Distribution .............................................................................. 49
Figure 7-5: Scatterplot (left) and Q-Q Plot (right) of ALS pulps vs Burnie pulps (EQR, 2021)50
Figure 8-1: Low-Grade Stockpile Sampling Locations ........................................................ 52
Figure 8-2: Example of Pit Sampling .................................................................................. 54
Figure 8-3: Scalping Out Size Fractions for LGS Test Work ............................................... 56
Figure 9-1: Insitu Resource Model Limits ........................................................................... 58
Figure 9-2: Histogram of Sample Grades ........................................................................... 60
Figure 9-3: Histogram of Block Model Grades .................................................................... 61

MT CARBINE GEOLOGY AND MINERAL RESOURCE ESTIMATE
EQ RESOURCES PTY LTD
measuredgroup.com.au xi
Figure 9-4: Sample Box Plot .............................................................................................. 62
Figure 9-5: Block Model Box Plot ....................................................................................... 62
Figure 9-6: Example Variogram.......................................................................................... 63
Figure 9-7: Block Model Extents ......................................................................................... 65
Figure 9-8: Resource Classification .................................................................................... 69
Figure 10-1: Mt Carbine Insitu Mineral Resource Estimate Grade - Tonnage Curve ........... 72
Figure 11-1: Potential Mineral Resource and Orebody Extension Areas ............................ 74
Figure 11-2: Regional Targets Within EQR’s Exploration Tenements ................................. 75
Figure 11-3: Targets within EQR’s Exploration Tenements ................................................ 76

MT CARBINE GEOLOGY AND MINERAL RESOURCE ESTIMATE
EQ RESOURCES PTY LTD
measuredgroup.com.au xii
LIST OF TABLES
Table 1-1: Mt Carbine Resource Estimate, as at September 2021 ...................................... vi
Table 2-1: Tenure Summary .............................................................................................. 14
Table 3-1: Recent Holders of Mt Carbine Tenements ......................................................... 21
Table 3-2: Historical Mt Carbine Exploration/Study ............................................................ 21
Table 3-3: Particle Size Distribution for Low-Grade Stockpile ............................................. 22
Table 5-1: EQR Drill Hole Details ....................................................................................... 38
Table 6-1: Key Differences Between Host Rock and Ore ................................................... 45
Table 7-1: CRM Used in the 2021 Exploration Programme ................................................ 48
Table 7-2: Univariate Statistics of ALS and Burnie Labs WO3% ......................................... 50
Table 7-3: Bivariate Statistics of ALS and Burnie Labs WO3% ........................................... 50
Table 8-1: X-Ray Sorter fines Samples .............................................................................. 53
Table 8-2: Summary of the size fractions from the 6 locations (after METS, 2021) ............. 54
Table 8-3: Variation in Different Size Fractions for 6 Trenches ........................................... 55
Table 8-4: Samples of the head feed of 0-8 mm ................................................................. 56
Table 9-1: Model Extents and Block Size ........................................................................... 64
Table 9-2: List of variables for the Insitu Zone block model ................................................ 64
Table 10-1: Mt Carbine Resource Estimate, as at September 2021 ................................... 71
Table 10-2: Mt Carbine Insitu Mineral Resource Estimate Grade - Tonnage (by Cut-off Grade) .......................................................................................................................................... 72
Table 10-3: Comparison with Previous Resource Estimates .............................................. 73

MT CARBINE GEOLOGY AND MINERAL RESOURCE ESTIMATE
EQ RESOURCES PTY LTD
measuredgroup.com.au 13
1. SCOPE OF WORK
The geological review of the Mt Carbine region and geoscience data verification, modelling and
resource estimation for the Mt Carbine Project ("the project") commenced on 21 April 2021. The
following is a summary of the agreed scope:
1. Data receipt, validation, and database build:
a). Access, retrieve and collate critical data within the priority ore deposit.
b). Process, Validate and Develop Database;
i). Validate drilling, update as required.
ii). Accurately correct orebody contact depths using both historical data and recent
data/core photography.
iii). Review and correct downhole Azimuth surveys.
iv). Review, validate and correct Assay Data against original laboratory reports.
v). Review, collate and validate any other data/reports considered pertinent by MG
to the accuracy of the final model build.
c). Complete QA/QC of final database and test database for accuracy and error
validation.
2. Geoscience modelling:
a). Model Validation (wireframe checks).
b). Grade Estimation.
c). Block modelling.
d). Geostatistical review.
e). Interpolation.
f). Model Validation.
3. Resource Estimate and reporting:
a). Resource Classification and Reporting.
b). Points of observations/classification passes.
c). Reporting tonnage and grades.
d). Resource estimation; and,
e). Final Report and Model Delivery.

MT CARBINE GEOLOGY AND MINERAL RESOURCE ESTIMATE
EQ RESOURCES PTY LTD
measuredgroup.com.au 14
2. INTRODUCTION
2.1 LOCATION
Mt Carbine Mine is located at the northern end of the Atherton Tablelands approximately 130 km
northwest of Cairns and 40 km west of Port Douglas (see Figure 2-1). There is a and a small
town, historic hotel and caravan park located adjacent to the mine site.
2.2 TENURE
EQR acquired the mine and associated quarry in July 2019 from Mt Carbine Quarries Pty Ltd and
retains 100% ownership of two Mining Leases (ML) and three Exploration Permits for Minerals
(EPM). EQR have recently been operating the mine and quarry concurrently. The mine is
currently processing tailings and low-grade ore stockpiles located on the site, which are remnant
from previous mining operations.
The Mt Carbine mining area is contained within two Mining Leases (ML) - ML 4867 and ML 4919,
which cover 366.39 hectares. The mining leases are surrounded by Exploration Permit for
Minerals (EPM) - EPM 14872, EPM 14871, EPM 27394 that are held by EQR and cover an
additional 115 km2. A summary of the tenements held by EQR is provided in Table 2-1, and a
map of the Mt Carbine Mining Lease boundaries is shown in Figure 2-2.
ML 4867 and ML 4919 have both been renewed continually since their grant date and both
tenements are due to expire within the next two years. EQR have advised MG that they will
submit applications to renew both tenements for a further 19 years at the appropriate time prior
to expiry of he tenements. The renewal applications will be supported by MG’s Mineral Resource
estimate and the updated Mt Carbine feasibility studies, which sets out the company’s planned
future mining activities.
Table 2-1: Tenure Summary
Tenement Name Area Grant Date Expiry Date
ML4919 Mt Carbine Open Pit 7.891 Ha 24/08/1974 31/8/2023
ML4867 Mt Carbine Tailings Project 358.5 Ha 25/07/1974 31/7/2022
EPM 14872
EPM 14871
EPM 27394
Mt Carbine currently has approval to mine up to 1 Mtpa of ore from two Mining Leases. In addition
to mining, the operation crushes rock from mine waste stockpiles to make various grades of road
metal and construction materials. Mt Carbine operates the quarry and mining activities under
Environmental Authority permits EPPR00438313 and EPML00956913 (respectively).
The operation is situated on the Brooklyn Pastoral Holding and is subject to a compensation
agreement that requires Mt Carbine to supply 500 m3 of gravel per year. Mt Carbine’s mining
licenses are free and clear of Native Title, having been granted before 1 September 1994.

MT CARBINE GEOLOGY AND MINERAL RESOURCE ESTIMATE
EQ RESOURCES PTY LTD
measuredgroup.com.au 15
Figure 2-1: Mt Carbine Location

MT CARBINE GEOLOGY AND MINERAL RESOURCE ESTIMATE
EQ RESOURCES PTY LTD
measuredgroup.com.au 16
Figure 2-2: Mt Carbine Tenements

MT CARBINE GEOLOGY AND MINERAL RESOURCE ESTIMATE
EQ RESOURCES PTY LTD
measuredgroup.com.au 17
2.3 SITE INFRASTRUCTURE
Mt Carbine is currently operating as a quarry and mine and is well serviced with existing on-site
infrastructure to support the operations. EQR will continue to utilise as much of the existing site
infrastructure as possible, and only construct new infrastructure as required to support new or
upgraded facilities. A plan of the site infrastructure is shown in Figure 2-3.
2.3.1 DAMS
No new dams are required for the project. A site water balance was developed for the project
which has determined that the existing site dams are capable of servicing the operational
requirements and are capable of containing rainfall and runoff under typical rainfall events.
The sites main dams that will be used for the storage of water are the tailings dam (TSF4, 417.3
ML capacity) and the process water dam near TSF4 (20 ML capacity) which can be seen in
Figure 2-3.
2.3.2 DRAINAGE
There are no proposed changes from the existing site drainage system that exists on the site.
Water that flows into the open pit will be transported via pump and pipeline to the TSF4. The
open-pit dewatering pump is diesel-powered due to the need to continually relocate it with the pit
development and the risk of trailing cables around operating heavy vehicles. Supply and
maintenance of the open pit dewatering pump are included in the mining contractor scope of
services.
2.4 CLIMATE
The Far North Queensland climate is generally hot and humid. The region is characterised by
two distinct seasons, with warm temperatures and low rainfall during the winter period while
summer sees higher rainfall and warmer, balmy temperatures. The average temperature is
approximately 27°C, with highs of ~30°C and lows of ~18°C. Winter is more commonly known as
the 'dry' season and runs from May to October enjoying low humidity and generally clear
conditions. Conversely, summer is therefore known as the 'wet' season and experiences tropical
downpours later in the day with the occasional storm activity from November to April. Annual
rainfall averages 300 mm/annum.

MT CARBINE GEOLOGY AND MINERAL RESOURCE ESTIMATE
EQ RESOURCES PTY LTD
measuredgroup.com.au 18
Figure 2-3: Mt Carbine Site Layout

MT CARBINE GEOLOGY AND MINERAL RESOURCE ESTIMATE
EQ RESOURCES PTY LTD
measuredgroup.com.au 19
3. HISTORICAL EXPLORATION AND MINING
The Mt Carbine tungsten deposit was discovered in 1883 by prospectors after the discovery of
tungsten at Manganese Creek located to the south of Mt Carbine. Up to 150 miners occupied the
site after its discovery and mined approximately 30 small open-cut and underground adits/shafts.
Each group hand-mined ore on rich veins, some of which were reported to extended for over 300
m strike distance and 60 m vertical distance.
A major shaft was mined down into the Bluff zone, an area where the mineralised veins widened
to over 10 m, and this became the central point for mining activity at Mt Carbine. A gravity plant
with a 10 head stamper was built on a cooperative basis, where ore was treated, and concentrates
returned to the miner.
North Broken Hill Ltd held the area and completed basic exploration work up until 1966.
Queensland Wolfram Limited mined the deposit from 1972 to 1987 and extracted approximately
22 Mt via open-pit mining at a rate of 1.5 Mt per annum.
During this period, the mine produced an average of 1,100 tonnes per annum of high-grade
wolframite (72% WO3) and scheelite (68% WO3) concentrates in the ratio of approximately 4
tonnes of wolframite to 1 tonne of scheelite. The impurities in the products were low, with a
recovered grade of ore at approximately 0.10% WO3.
Before the mine closed in 1987, Queensland Wolfram Limited entered a joint venture with
Poseidon Ltd, whereby Poseidon Ltd funded the proposed underground development and was
targeting an underground mine by sub-level cave retreat for extraction of 7.5 Mt @ >0.3% WO3
(QWL, 1983). Four hundred metres of a 6 x 4.5-metre decline was developed with an underground
conveyor system installed. The mine closed in 1988 and has remained closed until the present
day. Figure 3-1 shows the current pit layout, with historical 20 m benches.
Since its closure, the mine has changed hands and additional exploration and study activities
have been conducted to reopen the mine. Limited exploration drilling was completed in 2011 and
2012, with two Mineral Resource estimates in 2010 and 2013 respectively.
A summary of the recent holders of tenements at Mt Carbine is shown in Table 3-1 and a summary
of the major work completed by previous holders is shown in
Table 3-2.
3.1.1 LOW-GRADE STOCKPILE
During mining operations undertaken by Queensland Wolfram Limited, 22 Mt was mined from the
pit. 12 Mt of low grade material was sent directly to the Low-Grade Stockpile (LGS), 10 Mt was
optically sorted to extract white quartz from the ore, which resulted in 6 Mt of reject material (now
since disposed) and 4 Mt of higher-grade ore that was processed.
A nearly complete record of mine production, including the amounts of mined rock consigned to
the LGS has been compiled by EQR using published and unpublished archives, including using
reports for State Royalty returns. Head grades were not recorded, rather they were calculated

MT CARBINE GEOLOGY AND MINERAL RESOURCE ESTIMATE
EQ RESOURCES PTY LTD
measuredgroup.com.au 20
from the recovered grade using a nominal 70% recovery. The calculated head grade for the mine
using this method was 0.14% WO3. Several authors (e.g. White. A, 2006) have subsequently
postulated a higher feed grade based on a lower recovery at the processing plant with the head
grade being as high as 0.16% WO3.
During mining, grade control in the pit was difficult since the mining process focused on quartz
vein content, with the percentage of quartz used to decide whether material was ore or waste.
Since the completion of mining, geological interpretations have suggested that an early major
barren quartz vein intrusion event occurred. This resulted in the processing of increased amounts
of barren quartz, and the wasting of mineralised material to the LGS. The lack of an effective
grade control system was instrumental in allowing higher-grade material to be dumped on to the
LGS.
The LGS consists of material ranging from fines to large boulders. It is largely heterogeneous
and consists of layers of similarly sized material, which reflects the position of the mine at the time
of emplacement. Cross sections through the LGS confirm the cyclic nature of the emplacement
of material, with layers of similar sized material observed.
Significant work has been completed to understand the size distribution of the LGS and Table 3-3
provides a summary of the Particle Size Distribution and grade for the LGS.
Figure 3-1: Current Pit Showing Historical 20m Benches

MT CARBINE GEOLOGY AND MINERAL RESOURCE ESTIMATE
EQ RESOURCES PTY LTD
measuredgroup.com.au 21
Table 3-1: Recent Holders of Mt Carbine Tenements
Holder Date Held
From Date Held
To
Specialty Metals International Limited 21/05/2014 12/0102021
Tungsten Resources Pty Ltd 13/12/2011 21/05/2014
Kangaroo Minerals Pty Ltd 24/09/2006 13/12/2011
Stonebase Pty Ltd 27/11/2006 24/09/2006
Conquest Mining Limited 27/06/2006 27/11/2006
Lightstar Pty Ltd 16/11/2004 27/06/2006
Table 3-2: Historical Mt Carbine Exploration/Study
Type of Work Completed Date Author
Ore Reserve Assessment 2011 Icon Resources
Resource Estimate 2010 Geostat P/L
Resource Estimate 2012 Geostat P/L
Feasibility Study - Underground 1983 S.B. Management Pty. Ltd.
Scoping Study – Mt Carbine 2009 Icon Resources Pty Ltd
Preliminary Mine Design 2012 Mine One
Ore Sorter Mass Balances 2012 John McIntyre & Assoc
Environmental Impact Study – Stage 1 2010 Landline
Test work: Comminution Testing 2012 JK Tech

MT CARBINE GEOLOGY AND MINERAL RESOURCE ESTIMATE
EQ RESOURCES PTY LTD
measuredgroup.com.au 22
Figure 3-2: Aerial Photo of Low-Grade Stockpile
Table 3-3: Particle Size Distribution for Low-Grade Stockpile
Particle Size Fraction (mm) Grade (%WO3) Particle size distribution (%)
+170 0.043 30
-170 x 100 0.050 14
-100 x 30 0.077 14
-30 x 6 0.095 20
-6 x 0 0.110 22

MT CARBINE GEOLOGY AND MINERAL RESOURCE ESTIMATE
EQ RESOURCES PTY LTD
measuredgroup.com.au 23
4. GEOLOGY
4.1 REGIONAL GEOLOGY
Mt Carbine is located within the Siluro-Devonian Hodgkinson sedimentary province. The thick
sedimentary sequence was subjected to complex folding and regional metamorphism before, and
during, extensive granitic intrusions in the Carboniferous and Permian. Figure 4-1 shows the
regional geology of the area.
Within the permit, the north-northwest trending Hodgkinson Formation turbidite and siltstone
sequence is intruded by the Mareeba Granite dated at 277 My, and the Mt Alto Granite dated at
271±5 My (Bultitude et al., 1999). Contact metamorphic aureoles marked by the formation of
cordierite Hornfels that surround the granite intrusive, and numerous acid intermediate dykes
intrude the metasediments. In the western portion of the tenement, a prominent metabasaltic-
chert ridge is a significant stratigraphic component of the Hodgkinson Formation.
Fluids from the large granite batholith (>400 km2) were the source of hydrothermal fluids for
mineral deposition around the margins of the intrusive. The Mt Carbine deposit is a direct result
of these fluids travelling out from the granite into surrounding structured ground.
There appears to be a preference for the higher grade tungsten mineralisation to be located on
failed fold hinges, associated with the isoclinal folding of the Hodkinson Formation. These
locations have the highest structural deformation and have allowed these fluids to penetrate into
structures and deposit quartz and minerals. The granites associated with Mt Carbine are ‘S’ Type
Granites, which can mobilise tin, tungsten, molybdenum and rare earth elements in fluids and
deposit these as the main economic minerals. Figure 4-2 shows the local geology of the Mt
Carbine area, with the relationships between intrusions and sediments of the Hodkinson
Formation.

MT CARBINE GEOLOGY AND MINERAL RESOURCE ESTIMATE
EQ RESOURCES PTY LTD
measuredgroup.com.au 24
Figure 4-1: Regional Geological

MT CARBINE GEOLOGY AND MINERAL RESOURCE ESTIMATE
EQ RESOURCES PTY LTD
measuredgroup.com.au 25
Figure 4-2: Local Geology

MT CARBINE GEOLOGY AND MINERAL RESOURCE ESTIMATE
EQ RESOURCES PTY LTD
measuredgroup.com.au 26
4.2 DEPOSIT GEOLOGY
The Mt Carbine tungsten deposit is similar to sheeted vein-type tungsten deposits in South China
and these are divided into endo-contact (granite hosted) and exo-contact (wall-rock hosted) types
- Mt Carbine is interpreted to be an exo-contact type.
The vertical structural zoning model for vein-type exo-contact tungsten deposits observed in
China (Yidou,1993) directly applies to the Mt Carbine vein system. The model is being
incorporated in an evolving exploration model for the Mt Carbine and Mt Holmes vein systems,
with Mt Holmes considered to be situated closer to the underlying mineralising granite than Mt
Carbine (Figure 4-3).
The simplified conceptual geological model of the Mt Carbine area is based on that of Mt Holmes
(Forsythe and Higgins, 1990):
− Deposition of the Siluro-Devonian Hodgkinson Formation sequence.
− Several stages of complex folding and faulting of the Hodgkinson Formation.
− The intrusion of minor andesite and dolerite dykes.
− The intrusion of mineralising granite plutons with associated hornfels in the country rock.
− Emplacement of major sheeted quartz-wolframite-tin veining and hydrothermal alteration
of wall-rock.
− The intrusion of post mineralisation dykes.
Figure 4-3: Tungsten Conceptual Deposit Models (after Yidou,1993)

MT CARBINE GEOLOGY AND MINERAL RESOURCE ESTIMATE
EQ RESOURCES PTY LTD
measuredgroup.com.au 27
Essentially, in the open-cut pit, the following rock types are observed in the order of abundance:
Metasediments – a range of hornfelsed mudstones and interbedded rudites. The major rock unit
in the pit can look similar to a slate with prominent cleavage. Various alterations from pervasive
silicification are present, represented as a hornfelsed cordierite chloritic rock. Typically breakage
planes are along cleavage and schistosity planes.
Metavolcanics – located on the eastern end of the pit and the south side of the Southwest Fault
(SWF) this unit is pale green with greenschist facies alteration. It forms about 20% of waste
material and is less likely to contain mineralisation as it is a peripheral unit. It contains locally
hard siliceous chert bands that form some of the larger rocks on the waste dump
Quartz Veins – this rock type makes up to 10% by volume of the waste material and is found in all
sizes but typically less than 20 cm. It presents as powder and shards throughout much of the
dump material, which is interpreted to be a product of shattering during blasting. As previously
discussed, quartz veins can be barren or can contain tungsten mineralisation.
Dyke Material – two types of dykes are observed:
1. Pale uniform fine-grained felsic dyke that is exposed as a 10-15 m wide dyke at the
western end of the pit; and
2. Dark green/grey basic dyke that is present on most benches as a 0.5-1 m dyke cross-
cutting the open pit.
4.3 STRUCTURE
Mt Carbine sits at a spur on a major arc parallel fault called the South Wall Fault (SWF), along
with the Mossman Orogeny trend, which can be traced through the Hodkinson formation for over
100 km in strike length (Figure 4-4). The inflection point is likely due to a change in compressional
regime due to oblique pressures present at an intersection of a major fault junction, the South
West Fault (SWF). The SWF is a thrust fault formed at the time of compression and development
of regional isoclinal folding of the basement rock, remaining active through to post tungsten
mineralisation movement.
This terminology on the local scale with this thrust also called the ‘South Wall Fault’ (SWF) at Mt
Carbine was kept. The SWF truncates the tungsten orebody at an angle of 70 degrees to the grid
north. It forms a boundary fault on the southwest side of the mineralisation. Evidence suggests it
is a reverse thrust fault (Oliver, 2021), and by studying stratigraphic marker beds (chert-
metabasalt unit) it is postulated that the throw is of the order of 200-300 m. The truncated parts
of the Mt Carbine Tungsten mineralisation should still be open at depth in the footwall region of
this fault. Figure 4-5 shows the location of the SWF in the open pit.
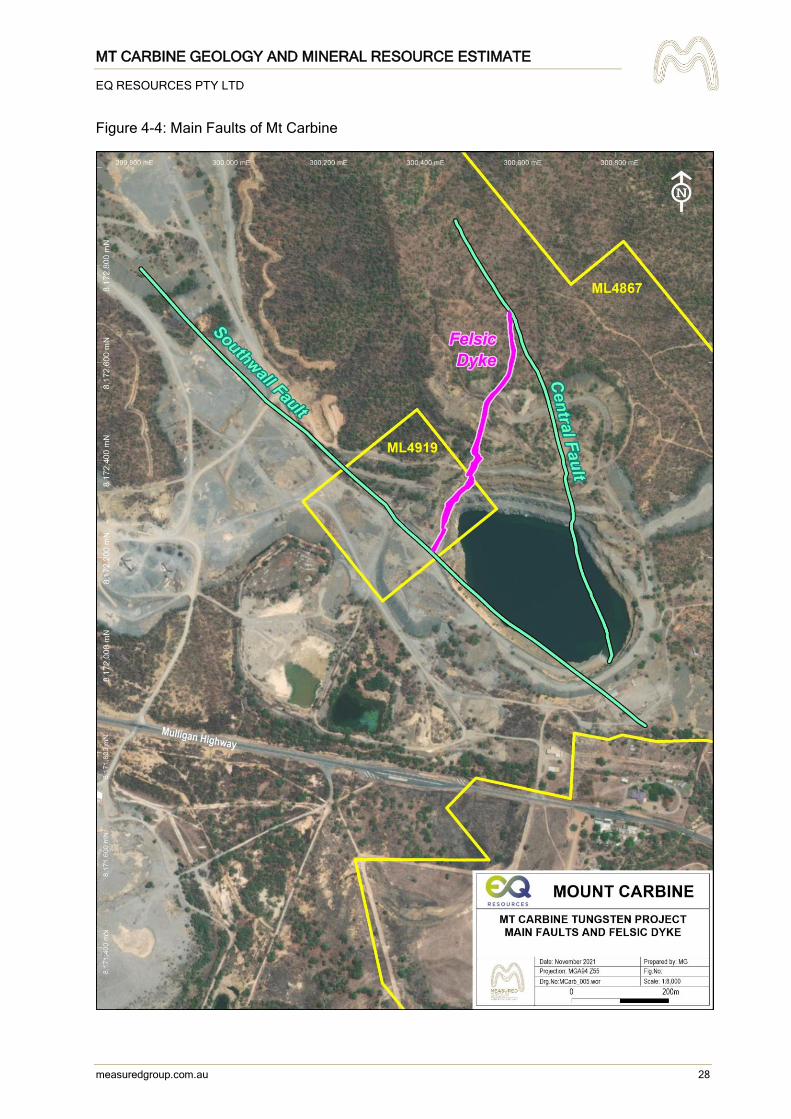
MT CARBINE GEOLOGY AND MINERAL RESOURCE ESTIMATE
EQ RESOURCES PTY LTD
measuredgroup.com.au 28
Figure 4-4: Main Faults of Mt Carbine

MT CARBINE GEOLOGY AND MINERAL RESOURCE ESTIMATE
EQ RESOURCES PTY LTD
measuredgroup.com.au 29
Figure 4-5: South Wall Fault in Open Pit
Other minor faults are typically orientated on a north-south strike direction and exhibit localised
movement. The Central / Iron Duke and Christmas Faults both show strike-slip movement and in
the case of the central fault, there is strike-slip movement across a dyke of 120 m in a left lateral
direction. Whereas minimal throw is noted on the Christmas fault.
Within the confines of the pit, the rocks have been hornfelsed but several deformation lineations
can still be seen i.e. S0 (bedding), S1 minor folding and S2 isoclinal folding planes. The
mineralised veins postdate this basement deformation, and there is little or no movement on the
pit scale.
Veins can be traced over vertical distances of 300-400 m and strike distances for over 1,200 m
with very few offsets. Occasionally in the pit, a regular low angle fault occurs that locally shifts the
veins up to 3-4 metres. This low angle fracture regime has a tendency to form blocks which will
require geotechnical considerations for underground mining.

MT CARBINE GEOLOGY AND MINERAL RESOURCE ESTIMATE
EQ RESOURCES PTY LTD
measuredgroup.com.au 30
Figure 4-6 illustrates the formation of veins at Mt Carbine outlining the structural stress at the time
(Oliver, 2021). The veins are tensile veins with two general environments:
1. Bulk N-S extension (and potentially related normal faults (left)); and
2. A N-S extension component within a transpressional or transtensional (strike-slip)
environment (right).
Figure 4-6: Vein Formation at Mt Carbine outlining the structural stress (after Oliver, 2021)
The Mt Carbine tungsten deposit is similar to sheeted vein-type tungsten deposits in South China
and these are divided into endo-contact (granite hosted) and exo-contact (wall-rock hosted) types.
Mt Carbine is an exo-contact type.
The vertical structural zoning model for vein-type exo-contact tungsten deposits observed in
China (Yidou,1993) directly applies to the Mt Carbine vein system. Figure 4-7 shows a stereonet
illustrating the orientation of veins at Mt Carbine outlining the structural stress at the time (Oliver,
2021).

MT CARBINE GEOLOGY AND MINERAL RESOURCE ESTIMATE
EQ RESOURCES PTY LTD
measuredgroup.com.au 31
Figure 4-7: Stereonet Illustrating the Orientation of Veins with Structural Stress (after Oliver,
2021)
4.4 MINERALISATION
The Mt Carbine tungsten deposit consists of numerous vertical to sub-vertical sheeted quartz
veins ranging in width up to 7 metres but averaging around 50 cm. Approximately 20% of the
quartz veins are mineralised due to an early barren quartz event and a later high-grade quartz
event. Economic minerals are the tungsten minerals of wolframite and scheelite mineralisation.
A typical section through the centre of the deposit shows quartz veins ranging from 10 cm to 6 m
in width with 5-8 zones of secondary narrow mineralised quartz veins of 10 cm to 150 cm in width.

MT CARBINE GEOLOGY AND MINERAL RESOURCE ESTIMATE
EQ RESOURCES PTY LTD
measuredgroup.com.au 32
These high-grade veins contain rich quartz-feldspar tungsten minerals and have been designated
as “King Veins”.
The tungsten occurs as a coarse crystalline variety of wolframite with up to 10 cm crystals and
varying degrees of intergrown scheelite that is volumetrically less significant. Tungsten minerals
can form up to 50% of the quartz vein zone, and because of the coarse crystalline nature, has the
potential to cause a nugget effect to the mineralisation.
In later retrograde stages of the mineral deposition, a secondary scheelite overprinting event
occurred that is represented mostly as fine scheelite fractures and replacement over wolframite.
The scheelite-wolframite ratio is seen to increase to the grid north and grid east of the deposit
and this mostly appears to be a local effect due to the host rocks becoming more calcareous. In
general, the veins are persistent, widespread and are a product of structural control.
The mineralisation interpretation is that there are two primary mineralising events with the first
phase being a pervasive gaseous front that forms broader scale silicification/veining and deposits
a lower grade background level of tungsten mineralisation. This was followed by a rich brine
incursion and fracturing of the now silicified rock. These brine veins are recognized to have higher
temperature and higher salinities in fluid inclusion work attesting to their direct magmatic origin.
Conversely, the gaseous veins result in fluid inclusions with increased gas and a composition
suggesting interaction with groundwater occurred. The King Veins can be as high as 50% WO3
but typically are in the 1-2% WO3 range.
Figure 4-8 shows King Veins with various coarse vein textures of the large wolframite crystals.
The matrix has about 10% scheelite and the cream gangue mineral is feldspar. Figure 4-9 shows
King Veins in Drill Core with late replacement of coarse wolframite by fine network retrograde
scheelite.
Minor Molybdenum is found in the deeper parts of the system and the western parts of the vein
zones. Molybdenum generally deposits before tungsten, and this gives a rough fluid outflow
direction. Mineralisation at Mt Carbine (except Johnson's vein) demonstrates a localized level of
control, with the bulk of the tungsten occurring in the 200-350 m RL zone. At these RL’s the veins
are 10-50 cm thick but as the same veins go deeper below 200 m RL the vein width increases
dramatically and a decrease in tungsten content is noted. Similarly, at higher elevations, the
veining also changes dramatically, thinning down to 1-10 cm veins/ stringers with low and variable
amounts of wolframite present.
Along the grid E-W strike to the mineralisation, the veins have been grouped into lenses, where
one or more of the high-grade King Veins are close enough to define a composite value above a
cut-off of 2 m at 0.25% WO3 it has been recorded a lens. It should be noted that these King Veins
often form on the margins to silicified zones or the margins of pre-existing barren quartz veins.
Typically, an “ore zone” or lens is 3-5 m in width and will contain one or more King Veins. Widths
of high grade can occur up to 15 m wide where 5 or 6 King Veins are seen close together. Figure
4-10 illustrates sheeted veins at the base of the pit that narrow towards the top and widen as
going deeper into the system and wolframite on the left side from drilling.

MT CARBINE GEOLOGY AND MINERAL RESOURCE ESTIMATE
EQ RESOURCES PTY LTD
measuredgroup.com.au 33
Figure 4-8: King Veins with Various Coarse Vein Textures of Wolframite Crystals
Figure 4-9: Late Replacement of Coarse wolframite by Fine Scheelite

MT CARBINE GEOLOGY AND MINERAL RESOURCE ESTIMATE
EQ RESOURCES PTY LTD
measuredgroup.com.au 34
Figure 4-10: Sheeted Veins at the Base of the Pit and wolframite on the Left Side.
A typical ore section through the middle of the open pit is presented in Figure 4-11. The sheeted
vein nature of the deposit is clearly shown.

MT CARBINE GEOLOGY AND MINERAL RESOURCE ESTIMATE
EQ RESOURCES PTY LTD
measuredgroup.com.au 35
Figure 4-11: Cross Section at 22850E

MT CARBINE GEOLOGY AND MINERAL RESOURCE ESTIMATE
EQ RESOURCES PTY LTD
measuredgroup.com.au 36
Figure 4-12: Core with Mineralisation Zones (Highlighted)
4.5 WEATHERING
Examination of the historical data concluded that in the initial 30 m of the surface the rock mass
appears to be moderately weathered with an estimated intact rock strength of 10 to 30 MPa.
Weathering surfaces were constructed from drill hole information.

MT CARBINE GEOLOGY AND MINERAL RESOURCE ESTIMATE
EQ RESOURCES PTY LTD
measuredgroup.com.au 37
4.6 ALTERATION
Alteration minerals associated with the wolframite mineralisation consist of brown tourmaline,
biotite-muscovite, apatite, clinopyroxene and silicification. Very minor molybdenite and
bismuthinite occur with the wolframite. Minor fluorite–chlorite–cassiterite–pyrite/arsenopyrite and
calcite are randomly present.
There is only mild marginal vein alteration typically of sericite-clay-chlorite for only a few
centimetres if at all. The mineralised veins appear to have had little effect on the host rocks with
the fluids entering hot rocks at depth.
The observed fact that Mt Carbine is a Boron System (significant tourmaline) as compared to a
Fluorine System (little fluorite) would suggest that the deposit occurred in hydrostatic equilibrium
with the rising brine fluids with little or no pressure build-up occurring. Fluorine rich deposits are
more volatile and typically form breccia pipes, stock working and large intensive alteration
systems e.g., Wolfram Camp, Tommy Burns etc.
Alteration minerals are minor other than pervasive early-stage greenschist facies, which has
replaced the pelitic mudstones with fine chlorite.

MT CARBINE GEOLOGY AND MINERAL RESOURCE ESTIMATE
EQ RESOURCES PTY LTD
measuredgroup.com.au 38
5. DATA ACQUISITION
5.1 RECENT EXPLORATION DRILLING
EQR completed 16 angled diamond drill holes (EQ001 – EQ016) in 2021, for a total of 4,074 m.
The drill holes targeted high-grade ore shoots below the current pit, to improve confidence in the
lithology, structural interpretations, and mineralisation limits and to improve the resolution of
geological models.
A summary of the drilling completed in 2021 is presented in Table 5-1 below and Figure 5-1 shows
the drill hole location map relative to the historical pit. The red coloured locations are showing the
2021 Drilling program.
Table 5-1: EQR Drill Hole Details
Drill holes were surveyed using the mine’s local grid, which is laid out on a 51 degree rotation to
the west from true north.

MT CARBINE GEOLOGY AND MINERAL RESOURCE ESTIMATE
EQ RESOURCES PTY LTD
measuredgroup.com.au 39
Figure 5-1: Drill Hole Locations

MT CARBINE GEOLOGY AND MINERAL RESOURCE ESTIMATE
EQ RESOURCES PTY LTD
measuredgroup.com.au 40
5.2 COLLAR AND TOPOGRAPHY SURVEYS
Brazzier Motti Surveying Consultancy was engaged to re-establish the local grid and survey the
collars of previous drill holes and the drill holes completed in 2021. In addition, all key survey
markers around the open cut were re-surveyed (see APPENDIX F: ).
Surveying of drill holes was completed using a Garmin GPS61 model GPS for locating the collar
coordinates in the WGS84 Datum system. A LIDAR survey was flown over the mining license
using a Drone with a 10 cm resolution accuracy on topography. This was important to establish
the accuracy of historical contour maps for the pit and Low-grade Stockpiles (see APPENDIX F:
).
Due to the water contained in the current open-pit (approximately 44 m deep), it was necessary
to complete a sonar survey to establish a reliable pit floor geometry. The sonar survey confirmed
the current pit floor geometry is consistent with existing contours of the mined surface taken from
1987 and confirmed that no additional mining of the pit has occurred since then.
5.3 DOWNHOLE SURVEY
Downhole surveys were conducted every 30 m downhole except for the pre collar zones. Pre-
collars were up to 120 m in depth with HW casing being installed before continuing drilling using
NQ coring equipment. The core was oriented using a digital orientation method called the Reflex
Act III tool system, which recorded hole orientation and downhole survey by wirelessly
transmitting data back to surface for recording. All survey data were input into the database and
then plotted using Leapfrog Mining Software to check deviation in drill holes.
5.4 DRILL HOLE DATA
Drill holes completed in 2021 were collared perpendicular to the strike of the tungsten
mineralisation. Drilling utilised HQ and NQ sized diamond core equipment (with double and triple
tube-drilling techniques). HQ diamond core was drilled down to the South Wall Fault (SWF),
which was then cased off before continuing with NQ diamond drilling equipment.
The full core was collected and marked up for depth and orientation. Core was marked with core
blocks typically at 1.5 m and 3.0 m intervals by the drilling company using stick up techniques that
ensure measurement to 1 cm accuracy.
Core recovery was consistently high, with 99% of core recovered for the entire campaign. As a
result of the hardness of the quartz zones, minimal loss from drilling was recorded in these zones.
Generally, the core was found to be competent and hard, with all assay samples located below
the base of oxidation.
Host rocks were logged as metasediments that have been silicified and crosscut by sheeted white
quartz veins. Core logging was semi-quantitative in its description of alteration intensity, mineral
types in percentages using geological percentage charts. Each mineralised interval was recorded
by the Site Geologist and checked for accuracy by the company’s Chief Geologist before cutting

MT CARBINE GEOLOGY AND MINERAL RESOURCE ESTIMATE
EQ RESOURCES PTY LTD
measuredgroup.com.au 41
and sampling. Post sampling, the core was selected for alteration mapping and petrographic
studies.
Drill core was transported daily to a secure storage facility on-site. The core storage facility
remains locked after work hours and contains a shed with core racks installed to house the drill
core. For longer term storage, drill core is cling wrapped for preservation and archived at this
facility.
Data was collected using a paper log sheet with the information then transferred to a digital
database, which holds all drill hole, drilling, survey, sample, assay, recovery, geotechnical data
and information. All data was validated prior to entered into EQR’s final geoscience database.
5.5 CORE PHOTOGRAPHY
Core was re-joined into longer sticks and photographed in core boxes using a high-resolution
camera for both dry and wet images. The core was marked up and measured for recovery and
orientation line was marked down the full length of the core. Figure 5-2 shows an example of the
core photographs taken of Mt Carbine core.
Figure 5-2: Example of Core Photography

MT CARBINE GEOLOGY AND MINERAL RESOURCE ESTIMATE
EQ RESOURCES PTY LTD
measuredgroup.com.au 42
6. SAMPLE PREPARATION, ANALYSES AND SECURITY
6.1 INSITU OREBODY
All zones of potential mineralisation were logged and sampled by cutting the selected core interval
in half using a diamond saw along the centre core orientation line mark. Before cutting and
sampling, the core was logged for zones of visual mineralisation, with wolframite and scheelite
recorded by their visual contained percentage.
Scheelite glows under ultraviolet light, and although difficult to distinguish under ordinary light
from quartz-carbonate, it is visual under the shortwave 254 nm UV light. A common technique to
estimate grade in core is to trace out individual crystals to determine the overall percentage shown
on the face of the core. The mineralisation was often observed as very coarse tungsten mineral
crystals of up to 10 cm in size.
All quartz veins intersected in drill core were assayed as separate samples. Where the veins
were more than 1 m in downhole length, the sample was broken into two or more samples - each
with a maximum of 1 m interval. The minimum vein assayed was 5 cm in width, because the
mineralisation often occurs in narrow widths of 5 cm to 500 cm and it is important to assay each
narrow mineralised zone. On either side of the mineralised zone, samples were taken of the host
rock at intervals of 1 m to ascertain whether the mineralisation had disseminated into the host
rock.
X-ray fluorescence assay techniques were used to determine the tungsten grade (ME-XRF15b).
Using this technique, a fusion disk is created for the representative sample of the core sample, it
is created by grinding the sample to achieve a homogenous sample (<200 microns). The sample
is then melted in an arc furnace to produce a clear fused disc, which is then x-rayed with the
fluorescence recording spectral peaks.
The instrument used to determine the tungsten grade is a Bruker multi-shot XRF machine with an
X-ray scan of 1 minute applied to each disk to ascertain the light and heavy elements. The XRF
machine is calibrated by the laboratory to maintain reliable and repeatable results.
Approximately 10% of each batch that is sent to the laboratory includes check samples, which
are submitted alternatively as being either a blank, a tungsten standard or a repeat sample with
a known grade. This process was successfully used to resolve an issue with samples 100216
and 100217, which are samples vein and host rock (respectively). The results for these samples
did not match the visual grade determination or the weights of the samples and it was established
that the grade of 0.72% was in the vein, not the host rock. It was concluded that samples were
mistakenly switched at the laboratory, and this was rectified prior to loading into the assay
database.
ALS was used for assaying samples. ALS is a NATA accredited laboratory that conducts internal
and external round-robin analysis to maintain its certification and to ensure their equipment is
correctly calibrated and reliable.

MT CARBINE GEOLOGY AND MINERAL RESOURCE ESTIMATE
EQ RESOURCES PTY LTD
measuredgroup.com.au 43
Final samples were bagged and prepared for transport to Brisbane via road or rail. Reserves
from the assayed samples have been archived for future re-sampling. Chain of custody between
EQR and ALS requires both parties to record and check sample and/or batch numbers on
dispatch/receipt of sample shipments and check for any signs of tampering or damage.
6.1.1 LOW-GRADE STOCKPILE
Bulk sampling was completed by excavating 8 costeans around the perimeter of the historical
stockpile, costeans ranging up to 10 m deep and 50 m long were completed. The bulk sample
was coned and quartered with the excavator to 2,000 tonnes. This sub-sample was crushed to
minus 50 mm and screened into three size ranges: 20 mm to 50 mm, 10 mm to 20 mm and minus
10 mm. Each size fraction was sampled by channel sampling. The bulk samples were analysed
by fused disk methods and check analyses were carried out on-site with a Niton portable XRF
analyser (after calibration of this instrument).
Grab sampling was completed on 80 locations (samples approximately 20 kg each of minus
100 mm material) for mineralogical and chemical characterisation of mineralised rock for
environmental permitting purposes. The grab samples were crushed to a minus 3 mm split and
sub-samples were pulverised and assayed for a range of elements including tungsten.
The bulk sample crushed, and screened size splits are stored on-site, and the crushed grab
samples and pulverized splits are stored in the mine’s core storage facility.
6.2 PETROLOGY
Petrology tests were carried out during the study by Pterosaur Petrology. Appendix E provides a
description for the petrology of the major rock types at Mt Carbine. The rocks hosting the ore are
predominantly Pelitic Schists, Metavolcanics and minor cherts. Quartz content can reach as high
as 20% of the total rock content and mineralisation is less than 1% by volume.
Alteration minerals are minor, other than pervasive early-stage green schist facies, which has
replaced the pelitic mudstones with fine chlorite.
Gangue or host rock of the mineralised lenses includes quartz, feldspar, tourmaline, muscovite
(Biotite) with minor amounts of apatite, calcite, pyrite-arsenopyrite, magnetite and zircon. In
places in the host rock, cordierite is developed. Only arsenopyrite and apatite concentrate
alongside wolframite–scheelite with Arsenic reaching up to 1-2% in concentrate samples from a
low base of 300 ppm.
Economic tungsten minerals are wolframite and scheelite with a typical ratio of 4:1 in the deposit.
Each of these minerals contains different tungsten percentages and have different properties.
The overriding property that assists in the processing of these minerals is their specific density
being high in the 6-7 gm/cm3 range compared to the host quartz-mudstones at 2-3 gm/cm3.
Properties for wolframite are shown in Figure 6-1 and for scheelite in Figure 6-2.

MT CARBINE GEOLOGY AND MINERAL RESOURCE ESTIMATE
EQ RESOURCES PTY LTD
measuredgroup.com.au 44
Figure 6-1: Wolframite Minerals (after Pterosaur Petrology, 2021)
Figure 6-2: Scheelite Mineral (after Pterosaur Petrology, 2021)
By the process of rock sorting, insitu ore and material from the LGS is upgraded approximately
10x and significantly reduces the tonnage required to be processed (i.e. < 25% of this material
will be processed after the final ore is ground down to <1 mm for gravity processing).
There are no significant sulphides found in the deposit, with an average sulphur level of 0.147%
relating to less than 0.3% sulphides in the insitu orebody. No ARD acid-metal issues have been
identified in the dumps and it should be noted that the pit has been full of water for 34 years and
it has remained clear and is slightly alkaline. Water tests have recorded elevated fluorine levels.
Figure 6-3 shows examples of coarse wolframite (black) with scheelite in quartz - scheelite glows
on blue in the right hand picture. Note that some scheelite is a secondary replacement of
wolframite.
A complete analysis for 26 elements has been performed on all core samples submitted to ALS
(APPENDIX H: ). As the ore occurs in a quartz vein rather than a silicified host, several key multi-
element differences can be noted (Table 6-1).
Figure 6-3: Examples of Coarse Wolframite with Scheelite Quartz

MT CARBINE GEOLOGY AND MINERAL RESOURCE ESTIMATE
EQ RESOURCES PTY LTD
measuredgroup.com.au 45
Table 6-1: Key Differences Between Host Rock and Ore
Element Host Rock Ore Comment
Al2O3 16.30% 4.16% Low Silicate minerals in Ore
SiO2 64.90% 88.40% Ore is in qtz, the Host rock is highly silicified
K2O 3.12% 1.02% A lot of biotite surrounding alteration
S 0.09% 0.06% Ore & Host have low sulphide contents
Fe 3.79% 1.61% Less ferromagnesium minerals in the ore
TiO2 0.62% 0.08% The host has a lot of rutile alteration
MgO 1.78% 0.25% The host has tourmaline alteration
6.3 SAMPLE DATA LOCATION, SPACING AND DISTRIBUTION
Drilling is currently designed to complete the testing of the zone beneath the open-cut pit at a
spacing of 50 x 50 m. In several locations, drill spacing was reduced down to 25 m to provide
additional data and confirm the grade and widths of mineralised zones.
6.4 SAMPLE DATA ORIENTATION IN RELATION TO GEOLOGICAL STRUCTURE
The drilling was completed at right angles to the trend of mineralisation, on a localised grid that
has been used since the 1960s – the local grid was used to orientate all drill holes to allow for
regular spacing and interpretation of the mineralised vein system.
Depending on the hole angle and attitude of the mineralised veins, the actual downhole intervals
will report as a longer interval than the true width of the vein. No bias has been observed for the
mineralisation. The mineralised veins show consistent parallel zones, and the drilling was
completed at the optimum angle to give a true indication of the zones.
6.5 SAMPLING AUDIT
An internal audit of sampling techniques was completed to check for sample bias and did not
identify any bias. The sampling procedures were reviewed by the Competent Person and deemed
to be appropriate for the purposes of estimating a Mineral Resource.

MT CARBINE GEOLOGY AND MINERAL RESOURCE ESTIMATE
EQ RESOURCES PTY LTD
measuredgroup.com.au 46
7. QA/QC
The results of the QA/QC work confirmed that no systematic bias is present in the assay results
used in the Mineral Resource estimate.
7.1 REVIEW OF VISUAL RESULTS
A total of 58 samples, which are contained in the database as visual results, were resampled and
laboratory analysis completed. These intervals were resampled using ½ core as per normal
sample procedures outlined in Section Figure 7-1.
Comparison results of Laboratory Assays vs Visual Estimates are shown in Figure 7-1, with the
low-grade results (below 0.25% WO3) showing an increase of 105% in grade for the same
intervals but the high-grade ore samples dropped 24% in grade from the visual results.
In the database, only results assayed by the laboratory under QA/QC conditions were used in
estimating the Mineral Resource. The relationships between the visual results vs the actual assay
results are shown in Figure 7-2.
Figure 7-1: Comparison of Visual vs. Assay Results

MT CARBINE GEOLOGY AND MINERAL RESOURCE ESTIMATE
EQ RESOURCES PTY LTD
measuredgroup.com.au 47
Figure 7-2: Scatterplots (left) and Q-Q Plots (right) of Laboratory Assays vs Visual Estimates
(after Bainbridge, 2021)

MT CARBINE GEOLOGY AND MINERAL RESOURCE ESTIMATE
EQ RESOURCES PTY LTD
measuredgroup.com.au 48
7.2 QA/QC SAMPLES
From the total 4,068 m of drilling completed in 2021, 1,404 samples were sent to ALS laboratory
in Brisbane. Standards and blanks were included in all batches sent for assay. The total number
of standards and blanks inserted into this assaying programme was 146 samples comprising just
over 10.2% of the samples submitted, comprising the following:
− 79 tungsten sample standards were analysed on a 1 in 20 basis; and
− 67 blank samples were tested inserted on a 1 in 20 basis.
7.2.1 STANDARDS
During the 2021 drilling campaign, a total of 13 standards were assayed to assess the reliability
of the laboratory. Standards were inserted at random into sample batches using one standard
(MC-3), which represented a bulk sample taken from the LGS, with an average grade of 0.225%
WO3.
The errors were within a 3% margin for all QA/QC standard results with the likely variation being
that stated variation within the standard itself. The checks showed there was little drift or error in
the results determined by the laboratory. The standards assay results were well within the
allowed ±10% range of the expected values. Table 7-1 shows the Certified Reference Material
(CRM) used in the current exploration program.
Table 7-1: CRM Used in the 2021 Exploration Programme
CRM Value of CRM +2SD -2SD
1003 4.32 4.30 4.30
1016 0.047 0.05 0.05
1023 1.595 1.60 1.60
1024 0.128 0.13 0.13
1026 0.366 0.36 0.36
1038 0.031 0.03 0.03
1043 0.206 0.21 0.21
1052 0.046 0.04 0.04
1099 0.11 0.11 0.11
1122 0.108 0.10 0.10
100138 0.453 0.47 0.47
100186 1.419 1.42 1.42
Appendix H contains the figures for standards against the normalized known value for the 2021
exploration programme.

MT CARBINE GEOLOGY AND MINERAL RESOURCE ESTIMATE
EQ RESOURCES PTY LTD
measuredgroup.com.au 49
7.2.2 BLANKS
The majority of blank samples were less than 0.0055% WO3. Slightly higher results were
observed only when using blank core samples which, although perceived to be barren by the
geologists, had background Tungsten values of up to 0.025% WO3. This slight variance in blank
sample values was noted in 6 blank samples out of the 67 blank samples used where ½ core
showed very low background values were encountered. Figure 7-3 illustrates the results of the
inserted blank samples with variations shown in Figure 7-4.
Figure 7-3: Plot of Results of Inserted Blank Samples
Figure 7-4: Blank Samples Distribution
0
0.005
0.01
0.015
0.02
0.025
100000 100200 100400 100600 100800 101000 101200 101400 101600
WO
3 %
Sample No
Blanks WO3 %

MT CARBINE GEOLOGY AND MINERAL RESOURCE ESTIMATE
EQ RESOURCES PTY LTD
measuredgroup.com.au 50
7.2.3 UMPIRE LABORATORY PULP ASSAY VERIFICATION
A total of 116 pulps (5% of the total sample) were submitted to Burnie Labs in Tasmania for re-
assay via fused-disk XRF analysis, to test the accuracy of the results from the primary laboratory
(ALS in Brisbane). Comparison of these pulp assays with the original pulp assays from ALS
Brisbane shows a relative bias of 16% (Table 7-2 and Table 7-3) and an absolute bias of 0.01.
With a very low absolute bias present, the Competent Person’s opinion is that the pulp assays
from ALS are acceptable and were endorsed for use in the resource model.
Table 7-2: Univariate Statistics of ALS and Burnie Labs WO3%
Parameter ALS BURNIE
Number 116 116
Minimum 0.05 0.02
Maximum 21.313 20.792
Mean 1.249 1.239
Median 0.255 0.204
Std Dev 2.94 2.93
Variance 8.61 8.57
Coeff Var 2.35 2.36
Table 7-3: Bivariate Statistics of ALS and Burnie Labs WO3%
Parameter ALS vs BURNIE
Covariance 8.52
Correlation Coefficient 1.00
Relative Bias 16%
Absolute Bias 0.01
Figure 7-5: Scatterplot (left) and Q-Q Plot (right) of ALS pulps vs Burnie pulps (EQR, 2021)

MT CARBINE GEOLOGY AND MINERAL RESOURCE ESTIMATE
EQ RESOURCES PTY LTD
measuredgroup.com.au 51
8. LOW-GRADE STOCKPILE ASSESSMENT
8.1 HISTORICAL ‘ORE’ EXTRACTION AND WASTE DUMP FORMATION
The LGS is material that has come directly from the open cut during previous mining of the open-
pit. Material distribution is random and unsorted direct from where the mining was occurring. The
dumps were deposited in two layers, with mining from years 1978 to 1983 resulting in 8 Mt and
mining from 1983 to 1987 resulting in 4 Mt.
8.2 GRADE DISTRIBUTION IN LOW-GRADE STOCKPILE
To determine the grade distribution of the LGS, a comprehensive sampling programme was
developed to achieve representative sampling of the stockpile material. The sampling that was
undertaken to achieve this is summarised below, while Figure 8-1 shows the location of the
samples:
Sites Selection – The dump was divided into quadrants with a major and minor sample location
being marked. In two of the quadrants, two sample sites were selected to see repeatability.
Sample Size - 6 trench samples (each trench taken at approximately 10 m wide x 5 m deep x 40
m length was deemed to be representative of that part of the dump each comprising a 3,500-t
sample.
Method – The sample was collected using 25 t trucks and a 30 t excavator being careful to load
all the material from the sample trench and the run over the weighbridge to determine weight
before being added to a large stockpile. A total of 22,000 t was collected from the 6 separate
locations. This was then cone and quartered down to a subset sample of 2,000 t which was fully
crushed to a nominal 40 mm and sampled.
The bulk sample average was determined to be 0.075% WO3.
Further sampling of the LGS for environmental permitting purposes involved taking 80 grab
samples from the surface of the stockpile. Each sample was approximately 20 kg of minus
100 mm material. The average grade of these samples was 0.088% WO3.

MT CARBINE GEOLOGY AND MINERAL RESOURCE ESTIMATE
EQ RESOURCES PTY LTD
measuredgroup.com.au 52
Figure 8-1: Low-Grade Stockpile Sampling Locations

MT CARBINE GEOLOGY AND MINERAL RESOURCE ESTIMATE
EQ RESOURCES PTY LTD
measuredgroup.com.au 53
8.3 PROCESSING OF LOW-GRADE STOCKPILE MATERIAL
Trials indicated that at optimum settings, the X-ray Sorter could produce a pre-concentrate of
approximately 12% of the original feed and has a grade of approximately 0.65% WO3 at 90% WO3
recovery. Approximately 88% of the material sent to the sorter was rejected as waste. The local
variation in grade distribution within the stockpile is expected to be variable and this has not yet
been quantified.
Two pits have been mined, the NE pit and the Central pit, which have had 30,000 t and 86,000 t
respectively mined from these locations. The processing methodology involves screening out the
minus 6 mm for processing and crushing all the material between 6 mm and 170 mm down to less
than 40 mm for XRT sorting.
This test work was designed to mimic the planned flow sheet and to determine the LGS grades
based on the fines and XRT sorter product. Both these categories were crushed to various sizes
before sampling (Table 8-1). This generated further 0-6 mm fines and although the quantity varies
considerably, total fines that are natural and crushed is approximately 30-35%. +170 mm
oversize is returned to the stockpile and is also about 30% of the dump, leaving approximately
40% of the dump that is sorted through the XRT Tomra Sorter.
Table 8-2 shows a summary of the regular sampling in size fractions taken from the 0-6 mm
natural fraction at 6 pit sites locations separate from the initial 6 trench locations. An example of
pit sampling is shown in Figure 8-2.
Table 8-1: X-Ray Sorter fines Samples
Size (µm)Head
Feed (kg)
% Total
HF
Head
Grade %
Weight x
gradeCon (g)
Con
GradeMids (g)
% Total
Mids
Mids
Grade
Weight x
grade
mids
Tails (kg)% Total
Tails
Tails
Grade
Weight x
grade
tails
Recovere
d Grade
%-300 116.20 32.15 0.24 27.89 530 26.4 - - - - 115.67 32.11 0.14 16.19 0.12
300-850 245.25 67.85 0.21 51.50 440 49 290 100 16.6 4814 244.52 67.89 0.06 14.67 0.09
Total 361.45 100 79.39 970 290 100 4814 360.19 100 30.87 0.10
Weighted average 0.22 16.6 0.09
Size (µm)Head
Feed (kg)
% Total
HF
Head
Grade %
Weight x
gradeCon (g)
Con
GradeMids (g)
% Total
Mids
Mids
Grade
Weight x
grade Tails (kg)
% Total
Tails
Tails
Grade
Weight x
grade
Recovere
d Grade
-300 72.00 25.00 1.43 102.96 801 64.4 438 19.51 21.8 9548.4 70.76 25.05 0.18 12.74 0.72
300-850 135.65 47.10 2 271.30 1873 57.9 1497 66.68 25.3 37874.1 132.28 46.82 0.15 19.84 0.80
850+ 80.35 27.90 0.72 57.85 582 48.2 310 13.81 12.75 3952.5 79.46 28.13 0.17 13.51 0.35
Total 288 100 432.11 3256 2245 100 51375 282.50 100 46.09 0.65
Weighted average 1.50 22.88 0.16
Sorter Product
Sorter Fines -8mm

MT CARBINE GEOLOGY AND MINERAL RESOURCE ESTIMATE
EQ RESOURCES PTY LTD
measuredgroup.com.au 54
Table 8-2: Summary of the size fractions from the 6 locations (after METS, 2021)
Figure 8-2: Example of Pit Sampling

MT CARBINE GEOLOGY AND MINERAL RESOURCE ESTIMATE
EQ RESOURCES PTY LTD
measuredgroup.com.au 55
Table 8-3 shows the variation in different size fractions in the 0-6mm material with generally the
finer fractures showing slightly higher results.
Table 8-3: Variation in Different Size Fractions for 6 Trenches
8.4 RESULTS FROM CURRENT MINING ACTIVITIES
Table 8-4 shows samples of the head feed of 0-8 mm taken during mining of the approximately
100,000 t of LGS material.
This material is elevated from the overall dump grade of 0.075% WO3 because the tungsten
minerals are soft and preferentially break down and end up naturally in the finer fractures.
Conversely, the larger rocks have less tungsten. Table 8-4 shows the scalping of the different
size fractions.

MT CARBINE GEOLOGY AND MINERAL RESOURCE ESTIMATE
EQ RESOURCES PTY LTD
measuredgroup.com.au 56
Table 8-4: Samples of the head feed of 0-8 mm
Date Head Feed
2020-11-27 0.22
2020-11-24 0.18
2020-12-11 0.38
2020-12-22 0.16
2021-01-06 0.27
2020-11-26 0.15
2020-11-28 0.13
2021-01-12 0.11
2021-01-27 0.16
Average 0.20
Figure 8-3: Scalping Out Size Fractions for LGS Test Work

MT CARBINE GEOLOGY AND MINERAL RESOURCE ESTIMATE
EQ RESOURCES PTY LTD
measuredgroup.com.au 57
9. MINERAL RESOURCE ESTIMATE
9.1 SITE VISIT
The Competent Person (Mr Chris Grove) completed a site visit to the Mt Carbine Tungsten Project
in April 2021. During the site visit, Mr Grove verified the existence and location of a subset of the
historic drill hole collars in the field, inspected the drill core, reviewed the metallurgical and
mineralogical test work that was previously completed, reviewed the extensive geological
database.
During the site visit, Mr Grove verified the existence and location of the production history and
inspected the LGS to form an opinion of the data retrieved from the historical production data. Mr
Grove verified the current drilling practices and procedures and sampling and pre-processing of
samples before sending them to the laboratory. Mr Grove considers that the work has been
completed to an acceptable industry standard and fit for use in estimating the Mineral Resource.
9.2 KEY ASSUMPTIONS
The October 2021 Mineral Resource estimate (MRE) for the insitu orebody is based on a detailed
review of the Project completed by the Competent Person. It has incorporated EQR’s current
view of near and long-term Tungsten prices, cost assumptions, mining and metallurgy
performance to select cut-off grades and physical mining parameters.
The Mineral Resource estimate for the Low-Grade Stockpile is based on sampling of the LGS
and the results of trial mining and processing. No cut-off criteria has been applied to the October
2021 Mineral Resource estimate.
9.3 RESOURCE LIMITS
The limits for the insitu orebody and LGS orebody were created to encompass all drill hole,
sampling locations and stockpile limits. The extents of the insitu geological model is shown in
Figure 9-1 and the extents of the LGS model is the physical extents of the LGS.

MT CARBINE GEOLOGY AND MINERAL RESOURCE ESTIMATE
EQ RESOURCES PTY LTD
measuredgroup.com.au 58
Figure 9-1: Insitu Resource Model Limits

MT CARBINE GEOLOGY AND MINERAL RESOURCE ESTIMATE
EQ RESOURCES PTY LTD
measuredgroup.com.au 59
9.4 POINTS OF OBSERVATION
Points of observation (POB’s) for the Insitu Mineral Resource were identified as drill hole intervals
where assays contained Tungsten and had been validated and verified as part of the data
management process. Reviewing the Tungsten assay data in Vulcan and using the ranges from
variography, the POBs were used to create first pass resource classification boundaries
(Measured, Indicated, and Inferred) for the Mineral Resource estimate.
The resource classification boundaries were set using the numerical model feature and the
distance function to set the ranges for each category and apply the trend of the orebody used in
the geological model process.
9.5 GEOLOGICAL MODELLING
Geological setting and mineralisation controls of the Mt Carbine Project mineralisation were
established from drill hole logging and geological mapping and included in an updated model of
the major rock units for the Mt Carbine deposit.
The geological domains are based on a minimum 2 m downhole interval of mineralisation. The
composited grades are based on assayed results and barren zones to create a zone of
mineralisation for geological modelling and resource estimation based on these composited
grades. Due to the confidence in the understanding of mineralisation controls and the robustness
of the geological model, investigation of alternative interpretations was deemed unnecessary.
9.6 COMPOSITING
Prior to the undertaking of a geostatistical analysis, samples were composited into equal lengths
to provide a constant sample volume, honouring sample support theories.
The WO3 grade data at Mt Carbine shows that there are higher and lower grade zones within the
deposit, with the preferentially mineralised zones related to coarser-grained hornfels or fracturing
localised in areas of rheological contrast at the contacts.
The gradation between zones of higher and lower grade is observed as a lateral zonation rather
than a predictable grade trend from top to bottom contact within the stratigraphy. Recognising
the absence of grade trends and to overcome the variable number of samples per intersection,
the Competent Person elected to create a single composite for each of the drillholes per
intersected horizon (‘zone-composites’). This was done to ensure variography and block grade
estimation focused on variability along stratigraphy.
9.7 GEOSTATISTICS
For the Mt Carbine estimation, the following geostatistical workflow was undertaken:
− Exploratory Data Analysis;
− Spatial Analysis;
− Variography;

MT CARBINE GEOLOGY AND MINERAL RESOURCE ESTIMATE
EQ RESOURCES PTY LTD
measuredgroup.com.au 60
− Kriging Neighbourhood Analysis; and
− Estimation;
Exploratory data and spatial analysis were used to analyse the overall deposits data distribution
and to investigate the spatial distribution of the WO3. Included in this analysis was the
assessment outliers and if any potential domains existed within the deposit.
9.7.1 SPATIAL LOCATION OF SAMPLES SELECTION
Swath plots of the variables generally show consistent ranges of values across the deposit. In
the easterly section, there are broader ranges at the boundaries of the orebody, but this is due to
drilling/sampling seeking to define the extent of mineralisation. Overall, there were no observed
increasing or decreasing trends.
9.7.2 SAMPLE LENGTH
The average sample length of the two project areas is 2 m. The sample length and stabilization
of the block covariance at around 2 m were the main factors in deciding the discretization distance
of 2 m in the ordinary kriging parameters.
9.7.3 SAMPLE VS. BLOCK HISTOGRAM
The following figures show a comparable relationship between the sample data and the estimated
block model. The sample histogram of WO3 (Figure 9-2) and the block model histogram of WO3
(Figure 9-3) show comparable distributions of grade with the blocks adhering to the local sample
intervals. The individual zones reflect the smoothing of the grades during grade estimation.
Figure 9-2: Histogram of Sample Grades
0
5
10
15
20
25
30
35
40
45
Pe
rce
nta
ge
of T
ota
l S
am
ple
s
WO3%

MT CARBINE GEOLOGY AND MINERAL RESOURCE ESTIMATE
EQ RESOURCES PTY LTD
measuredgroup.com.au 61
Figure 9-3: Histogram of Block Model Grades
The Grade distribution for the samples and the block model are presented as Box Plots in Figure
9-4 and
Figure 9-5. The minimum and maximum grades have been reproduced and the mean and median
grades are comparable. The grade estimation has smoothed the samples to estimate within the
individual zones and the model grades reflect the nature of the deposit.
0
5
10
15
20
25
30
35
40
Pe
rce
nta
ge
of T
ota
l S
am
ple
s
WO3%

MT CARBINE GEOLOGY AND MINERAL RESOURCE ESTIMATE
EQ RESOURCES PTY LTD
measuredgroup.com.au 62
Figure 9-4: Sample Box Plot
Figure 9-5: Block Model Box Plot
gt pt3
Q1 0.280
Min 0.200
Median 0.440
Mean 0.636
Max 5.179
Q3 0.725
NSamples 276
0.000
1.000
2.000
3.000
4.000
5.000
6.000
WO3 Grade Distribution Samples
gt pt3
Q1 0.300
Min 0.200
Median 0.492
Mean 0.658
Max 5.179
Q3 0.831
NSamples 229523
0.000
1.000
2.000
3.000
4.000
5.000
6.000
WO3 Grade Distribution Block Model

MT CARBINE GEOLOGY AND MINERAL RESOURCE ESTIMATE
EQ RESOURCES PTY LTD
measuredgroup.com.au 63
9.7.4 VARIOGRAPHY
Variography analysis was performed to determine the major directions of grade continuity for WO3
and an example variogram is presented in Figure 9-6.
To construct semi-variograms and their resultant models, the following steps were undertaken:
1. Generate Variogram Maps for each variable – check for anisotropy; and
2. Generate experimental variograms and fit semi-variogram models.
Variogram maps for horizontal and vertical directions were interrogated to determine directions
of greatest continuity. When viewing the variograms of greatest vs. least directions of continuity,
it was found that the resultant variograms were very similar (virtually the same). Therefore, the
deposit has been treated as isotropic with no direction of greatest continuity.
Figure 9-6: Example Variogram

MT CARBINE GEOLOGY AND MINERAL RESOURCE ESTIMATE
EQ RESOURCES PTY LTD
measuredgroup.com.au 64
9.8 ESTIMATION AND MODELLING TECHNIQUES
9.8.1 INSITU OREBODY
Creation of the block models were constructed using Maptek’s Vulcan v21.0.1 3D modelling
software. The block model for the Insitu Zone was created for the deposit with the extents and
block size shown in Table 9-1 and Figure 9-7.
Inputs into the Insitu Zone block model includes topography, orebody grade shells, weathering
wireframes, estimation data, density, and resource classification. Block sizes were determined
from sample length within the assay data set. A list of variables for the Insitu Zone block model is
listed in Table 9-2.
Table 9-1: Model Extents and Block Size
Parameter Origin Range (m)
X 21850 1300
Y 26100 700
Z -250 800
Parent block size 10 x 10 x 10
Subblock size 0.5 x 0.5 x 0.5
Table 9-2: List of variables for the Insitu Zone block model
Variable Name in Block Model
Description
Rock Insitu Rock vs Air
Wo3 Tungsten estimation data
Density Global Density data
Zone Mineralised domains
Rescat Resource classification
Mined Mined out region
Estimflag_wo3 Flag when estimated with WO3
Num_holes Number of holes used to estimate the block
Num_samples Number of samples used to estimate the block
Statistical analysis was undertaken on the composited drill hole file to assess the appropriateness
of the domaining process and as such, no additional domaining was undertaken. All domains
were interpolated using ordinary kriging (“OK”). To maintain the strong correlation between actual
drill hole values in the estimated block model, estimated using ordinary kriging, using 3 separate
input parameters increasing the search ellipsoid during subsequent passes.
Mineralisation was modelled as three-dimensional blocks of parent size 10 m with sub-celling
allowed to 0.5 m. No assumptions were made regarding the modelling of selective mining units.

MT CARBINE GEOLOGY AND MINERAL RESOURCE ESTIMATE
EQ RESOURCES PTY LTD
measuredgroup.com.au 65
Figure 9-7: Block Model Extents

MT CARBINE GEOLOGY AND MINERAL RESOURCE ESTIMATE
EQ RESOURCES PTY LTD
measuredgroup.com.au 66
9.8.2 LOW-GRADE STOCKPILE
The detailed distribution of grade through the LGS is not known, as no record was kept of
placement of rock consigned to the stockpile, nor was any sampling carried out. The average of
assays of the three size range subsamples of the bulk sample is 0.075% WO3. This reconciles
well with a calculation from historic mine records of production and mill recovery and based on
the recent resource estimate which took account of the resource mined during the previous open
pit operation, of a global average grade of 0.075% WO3 for the Low-Grade Stockpile.
The samples taken for the LGS average 0.088% WO3 (fused disk XRF analysis), which suggests
that the tungsten grade of the finer fraction (<200 mm) of the stockpile is higher than the global
average grade of the bulk sample that included fragments up to 500 mm.
9.9 MOISTURE
Tonnages were estimated on a dry basis for the insitu orebody, while tonnages for the LGS are
estimated on an air-dried basis.
9.10 CUT-OFF PARAMETERS
No cut-off grades were applied to the Mt Carbine Resource Estimate. The mineralised material
is interpreted to have ‘reasonable prospects of eventual economic extraction’ by open-pit methods
and by underground mining methods.
No top cuts were applied to the drill hole results or the compositing. The contiguous nature of the
veins observed, both in the open pit and the underground development, shows that the grade and
geometry are consistent and follows the grades intercepted in the drill hole assay results. The
lenses are able to be correlated in the open-pit areas and drilling and are correlated to form
modelled veins to provide discreet zones for resource estimation.
No cut off for the LGS has been applied to the stockpile grade estimation, however, it is planned
to screen the stockpiled material at 500 mm and only crush and ore sort the minus 500 mm
fraction, since a growing body of data from ongoing tests indicates that this fraction contains the
bulk of the tungsten minerals that it is planned to recover.
9.11 OREBODY EXTENTS
Drilling indicates that the mineralisation continues up to 1300 m along strike and is up to 600 m
wide. The limits of mineralisation have not been completely defined and are open at depth and
along strike.
The 12 Mt estimated to be contained in the LGS has been derived from a nearly complete set of
historical mining records as well as estimating the physical extents of the LGS. An independent
reconciliation was completed to estimate the total tonnes mined from the open pit (22 Mt) less
10 Mt of material that was processed through the mill.

MT CARBINE GEOLOGY AND MINERAL RESOURCE ESTIMATE
EQ RESOURCES PTY LTD
measuredgroup.com.au 67
9.12 MINING FACTORS AND ASSUMPTIONS
The insitu Mineral Resource estimate has been completed with the assumption that it will be
mined using open cut and underground mining methods. No other detailed assumptions have
been made to date. The LGS Mineral Resource estimate has been completed with the
assumption that it will be mined using quarrying methods. No other detailed assumptions have
been made to date.
EQR is completing feasibility studies, which will provide additional detailed assumptions for future
Mineral Resource and Reserve estimates.
9.13 METALLURGICAL FACTORS AND ASSUMPTIONS
Historical production records show that the Mt Carbine Project was in the lowest quartile cost of
production of western producers and produced high-grade wolframite (>70% WO3) and scheelite
(68-72% WO3) concentrates with minimal or very low impurity penalties.
The mineralogy of the material contained in the stockpile is identical to that of the hard rock ore
body. The Mt Carbine ore body is low grade in comparison with many other tungsten deposits.
However, the successful application of ore sorting to pre-concentrate the ore to a high-grade mill
feed has been demonstrated using optical ore sorters, and by extensive trials of X-ray sorting of
bulk samples of the stockpile and run of mine ore.
Process design and anticipated recoveries have been derived from historical mill flow sheets,
reports and trials that have been confirmed by repeated metallurgical testing of bulk samples.
The work completed by EQR to date indicate that the Mineral Resource has ‘reasonable
prospects for eventual economic extraction’.
9.14 ENVIRONMENTAL FACTORS AND ASSUMPTIONS
EQR has been granted an Environmental Authority by the Queensland Department of
Environment and Science (“DES”) for the Low-Grade Stockpile. Based on a sampling of existing
stockpiles, tailings storage facilities and analytical characterisation of the mineralisation, the only
elements present at hazardous values are fluorine (as fluorite) and arsenic (as arsenopyrite).
Previous mine practice and the present Environmental Management Plan approved by the DES
include measures to manage the environmental hazards these elements present. Sampling of
the existing stockpiles and tailings storage facility indicates that acid mine drainage will not be a
hazard created by future mining and waste storage.
9.15 BULK DENSITY
A total of 1,048 density measurements from the drill core were completed. Density measurements
were analysed for any spatial trends by easting, northing and depth, with no obvious trends
detected. An average density of 2.74 g/m3 was applied to the insitu orebody. The tonnes
estimated to be contained in the LGS were derived independently by a third party engaged by
EQR and this has been adopted for use by the Competent Person.

MT CARBINE GEOLOGY AND MINERAL RESOURCE ESTIMATE
EQ RESOURCES PTY LTD
measuredgroup.com.au 68
9.16 RESOURCE CLASSIFICATION
Classification of the Mineral Resource estimate was interpreted on several criteria, including
confidence in the geological interpretation, the integrity of the data, the spatial continuity of the
mineralisation and the quality of the estimation.
An assessment of the historical mining showed increased confidence in the surrounding areas of
the open pit and confirmed by drilling results.
The classification reflected the author’s confidence in the location, quantity, grade, geological
characteristics, and continuity of the Mineral Resources (Figure 9-8).
The data spacing and distribution is sufficient to establish geological and grade continuity
appropriate for Mineral Resource estimation and classification and the results appropriately
reflect the Competent Person’s view of the deposit.
Based on the criteria outlined above, the 818,453 blocks that were interpolated in the Insitu Mt
Carbine model, were classified as follows: 19% is classified as Indicated and 81% is Inferred
Mineral Resources. The remaining blocks are flagged as Target (non-ore lithologies).
Following extensive metallurgical testing of bulk samples from the stockpile that provide robust
anticipated recovery and quality of product, the LGS has been classified as an Indicated
Resource.

MT CARBINE GEOLOGY AND MINERAL RESOURCE ESTIMATE
EQ RESOURCES PTY LTD
measuredgroup.com.au 69
Figure 9-8: Resource Classification

MT CARBINE GEOLOGY AND MINERAL RESOURCE ESTIMATE
EQ RESOURCES PTY LTD
measuredgroup.com.au 70
9.17 REASONABLE PROSPECTS FOR EVENTUAL ECONOMIC EXTRACTION
EQR has completed and is completing various studies on the Mt Carbine orebodies to assess the
viability and economics of maintaining the current operations and developing future mining
domains in the deeper orebodies.
The results of work completed for Mt Carbine is assisting EQR in refining the current plan for the
ongoing studies for the Mt Carbine Open cut and Underground project. EQR has multiple paths
to continue to mine and develop future mining domains in the various orebodies at Mt Carbine.
Measured Group is satisfied that there has been sufficient study, economic analysis, and the
opportunity to apply technological developments in mining methods to meet the reasonable
prospects for the eventual economic extraction (“RPEEE”) test.
Currently, there is a reasonable basis to assume the Mineral Resource estimated for Mt Carbine
orebodies will be mined in future.
9.18 MODEL VALIDATION
Validation of the block model was made by:
− Checking that drill holes used for the estimation plotted in expected positions;
− checking that flagged domains intersections lay within, and corresponded with, domain
wireframes;
− ensuring whether statistical analyses indicated that grade cutting was required;
− checking that the volumes of the wireframes of domains matched the volumes of blocks
of domains in the block model; and
− checking plots of the grades in the block model against plots of drill holes.
Historical estimates were examined and the comparisons were similar yet inconclusive due to the
‘discreet’ style of geological interpretation in this estimate compared to the larger, all-
encompassing lower grade style previously.
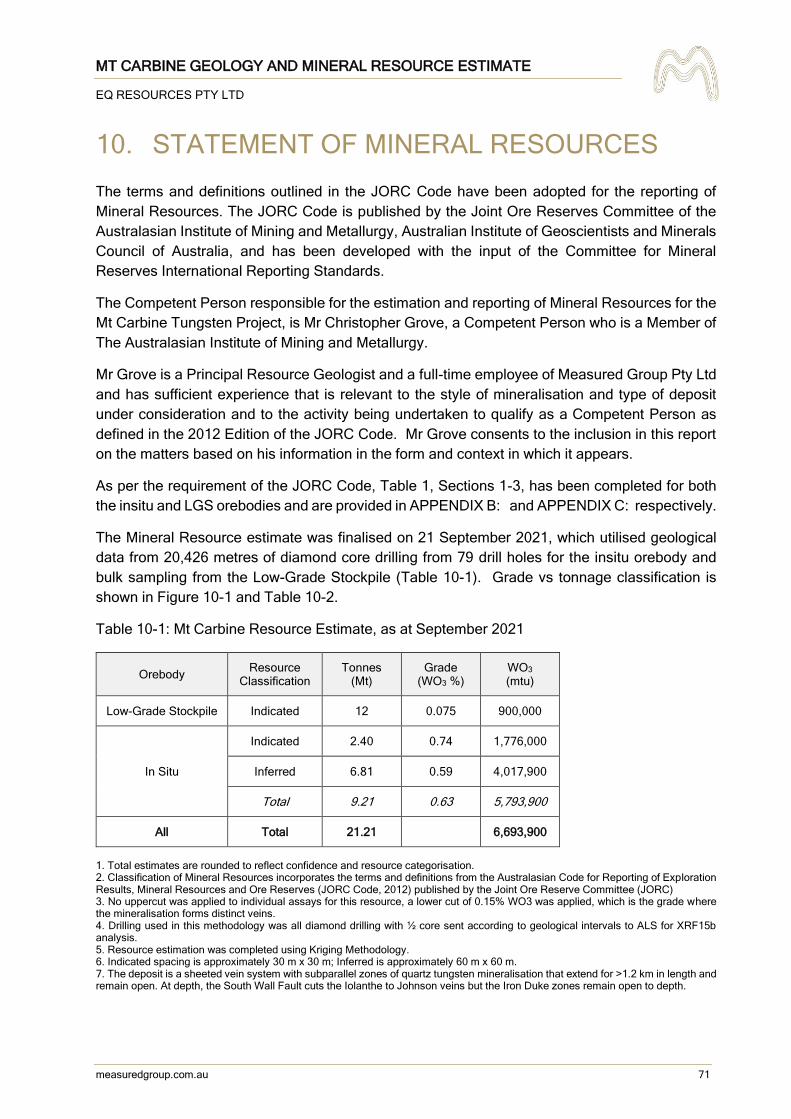
MT CARBINE GEOLOGY AND MINERAL RESOURCE ESTIMATE
EQ RESOURCES PTY LTD
measuredgroup.com.au 71
10. STATEMENT OF MINERAL RESOURCES
The terms and definitions outlined in the JORC Code have been adopted for the reporting of
Mineral Resources. The JORC Code is published by the Joint Ore Reserves Committee of the
Australasian Institute of Mining and Metallurgy, Australian Institute of Geoscientists and Minerals
Council of Australia, and has been developed with the input of the Committee for Mineral
Reserves International Reporting Standards.
The Competent Person responsible for the estimation and reporting of Mineral Resources for the
Mt Carbine Tungsten Project, is Mr Christopher Grove, a Competent Person who is a Member of
The Australasian Institute of Mining and Metallurgy.
Mr Grove is a Principal Resource Geologist and a full-time employee of Measured Group Pty Ltd
and has sufficient experience that is relevant to the style of mineralisation and type of deposit
under consideration and to the activity being undertaken to qualify as a Competent Person as
defined in the 2012 Edition of the JORC Code. Mr Grove consents to the inclusion in this report
on the matters based on his information in the form and context in which it appears.
As per the requirement of the JORC Code, Table 1, Sections 1-3, has been completed for both
the insitu and LGS orebodies and are provided in APPENDIX B: and APPENDIX C: respectively.
The Mineral Resource estimate was finalised on 21 September 2021, which utilised geological
data from 20,426 metres of diamond core drilling from 79 drill holes for the insitu orebody and
bulk sampling from the Low-Grade Stockpile (Table 10-1). Grade vs tonnage classification is
shown in Figure 10-1 and Table 10-2.
Table 10-1: Mt Carbine Resource Estimate, as at September 2021
Orebody Resource
Classification Tonnes
(Mt) Grade
(WO3 %) WO3 (mtu)
Low-Grade Stockpile Indicated 12 0.075 900,000
In Situ
Indicated 2.40 0.74 1,776,000
Inferred 6.81 0.59 4,017,900
Total 9.21 0.63 5,793,900
All Total 21.21 6,693,900
1. Total estimates are rounded to reflect confidence and resource categorisation. 2. Classification of Mineral Resources incorporates the terms and definitions from the Australasian Code for Reporting of Exploration Results, Mineral Resources and Ore Reserves (JORC Code, 2012) published by the Joint Ore Reserve Committee (JORC) 3. No uppercut was applied to individual assays for this resource, a lower cut of 0.15% WO3 was applied, which is the grade where the mineralisation forms distinct veins. 4. Drilling used in this methodology was all diamond drilling with ½ core sent according to geological intervals to ALS for XRF15b analysis. 5. Resource estimation was completed using Kriging Methodology. 6. Indicated spacing is approximately 30 m x 30 m; Inferred is approximately 60 m x 60 m. 7. The deposit is a sheeted vein system with subparallel zones of quartz tungsten mineralisation that extend for >1.2 km in length and remain open. At depth, the South Wall Fault cuts the Iolanthe to Johnson veins but the Iron Duke zones remain open to depth.

MT CARBINE GEOLOGY AND MINERAL RESOURCE ESTIMATE
EQ RESOURCES PTY LTD
measuredgroup.com.au 72
Figure 10-1: Mt Carbine Insitu Mineral Resource Estimate Grade - Tonnage Curve
Table 10-2: Mt Carbine Insitu Mineral Resource Estimate Grade - Tonnage (by Cut-off Grade)
Cut-off (%) WO3% Tonnage Kton
0 0.63 9208
0.1 0.63 9169
0.2 0.64 9005
0.3 0.8 6444
0.4 0.93 4976
0.5 1.02 4188
0.6 1.13 3410
0.7 1.26 2671
0.8 1.39 2129
0.9 1.56 1614
1 1.76 1221
1.1 1.85 1078
1.2 1.94 958
1.3 2.06 814
1.4 2.21 675
1.5 2.43 524
1.6 2.69 401
1.7 3.02 308
1.8 3.04 303
1.9 3.13 282
2 3.24 258
2.1 3.31 243
2.2 3.32 242
2.3 3.32 240
920891699005
6444
4976
4188
3410
2671
2129
161412211078958 814 675 524 401 308 303 282 258 243 242 240
0.63 0.63 0.64
0.80.93
1.021.13
1.261.39
1.56
1.761.85
1.942.06
2.21
2.43
2.69
3.02 3.043.13
3.243.31 3.32 3.32
0
0.5
1
1.5
2
2.5
3
3.5
0
1000
2000
3000
4000
5000
6000
7000
8000
9000
10000
0 0.5 1 1.5 2 2.5
Gra
de
s
To
nn
ag
e K
ton
Cut-off Grade (WO3%)
Mt Carbine Grade/TonneClassification
Tonnage Kton wo3

MT CARBINE GEOLOGY AND MINERAL RESOURCE ESTIMATE
EQ RESOURCES PTY LTD
measuredgroup.com.au 73
10.1 RECONCILIATION TO PRIOR ESTIMATES
The current estimate (September 2021) covers approximately 60% of the previously modelled
area, which accounts for the large tonnage difference between the current and previous
estimates. The difference in grade between the current estimate (higher) and the previous
estimate (lower) is due to the different modelling methodology – the current estimate is more
selective in modelling the orebody, when compared to the previous estimate that modelled a bulk
mining scenario.
The following table (Table 10-3) shows a summary of differences between the current and
previous Mineral Resource estimates.
Table 10-3: Comparison with Previous Resource Estimates
T onne s
(Mt)WO3 (%) WO3 (mtu)
T onnes
(Mt)WO3 (%)
WO3
(mtu)
T onnes
(Mt)WO3 (%) WO3 (mtu)
Measured - - - - - -
Indicated
Inferred 127.6 0.064
Measured - - - - - -
Indicated 18 0.14 2,252,000 12 0.07 840,000
Inferred 29.3 0.12 3,516,000
Measured - - - - - -
Indicated 2.4 0.74 1,776,000 12 0.075 900,000
Inferred 6.81 0.59 4,017,900
21.21 6,693,900
2010Mt Carbine Insitu GeoStat
59.3 6,876,000
127.6 0.064
Mt Carbine InsituMeasured
Group2021
T o ta l
Mt Carbine Insitu White 2014
In Pit Ha rd Rock
Dep osit Estima to r Yea r Class
LGS

MT CARBINE GEOLOGY AND MINERAL RESOURCE ESTIMATE
EQ RESOURCES PTY LTD
measuredgroup.com.au 74
11. EXPLORATION POTENTIAL
The recent geological works have been confined to the red and green squares in Figure 11-1
below. The Blue zone shows the area identified as having potential to extend the Mt Carbine
orebody, which includes 4 major targets:
1. Upgrade the Iron Duke Inferred Mineral Resources into Indicated Resources (Figure
11-1) - Iron Duke contains 5.8 Mt @ 0.59% WO3.
2. Extend the known veins along strike extents both Grid West and East.
3. Drill to the depth where tungsten continues in Iron Duke – Talis Zone.
4. Evaluate and test the True Blue, Daisy, MacDonald’s and Red Cap Zones.
Figure 11-1: Potential Mineral Resource and Orebody Extension Areas
Given the extent of surface vein traces, the open depth consideration and the 5 immediate
tungsten working areas it is conceivable that the resource could significantly increase from its
current size. EQR should consider targeting future drilling to continue to replace mined ore.
On a regional scale, there are over 50 locations with historical workings within EQR’s exploration
tenements, which have reported tungsten or tin mineralisation and it is recommended that
geological mapping, sampling and follow up drilling be completed. The location of drill targets
within EQR’s exploration tenements is shown Figure 11-2 and Figure 11-3 below.

MT CARBINE GEOLOGY AND MINERAL RESOURCE ESTIMATE
EQ RESOURCES PTY LTD
measuredgroup.com.au 75
Figure 11-2: Regional Targets Within EQR’s Exploration Tenements

MT CARBINE GEOLOGY AND MINERAL RESOURCE ESTIMATE
EQ RESOURCES PTY LTD
measuredgroup.com.au 76
Figure 11-3: Targets within EQR’s Exploration Tenements

MT CARBINE GEOLOGY AND MINERAL RESOURCE ESTIMATE
EQ RESOURCES PTY LTD
measuredgroup.com.au 77
12. REFERENCES
QWL. 1983. Feasibility Study 1/83 Underground Mining Proposal for the Mt Carbine Mine
D.L. Forsythe. 1989. A Review of the Geology, Underground Ore Reserves and Exploration
Targets, MT Carbide
Forsythe and Higgins.1990. Mount Carbine Tungsten Deposit, in Geology of the Mineral Deposits
of Australia and Papua New Guinea (Ed. F.E.Hughes) pp 1557-1560
Yidou. Li. 1993. Poly-type model for tungsten deposits and vertical structural zoning model for
vein-type tungsten deposits in south China. In Kirkham, R.V., Sinclair, W.D., Thorpe, R.I., and
Duke, J.M., (Eds) Mineral Deposit Modelling. Geological Association of Canada Special Paper
40, p555-568
R.J. Bultitude, P.D. Garrad, L.C. Cranfield, C.W. Roberts. 1999. Rumula Geological Map
1:100,000 Sheet 7964. Department of Mines and Energy Brisbane
A White. 2006. Carbine Tungsten Limited Stockpile Testwork Results
Geostat Services. 2010. Icon Resources Ltd, Mt Carbine Project Resource Estimate
Geosun Pty Ltd. 2013. Mt Carbine Resource Estimate Audit Report
N.Oliver. 2021. Brief review and structural assessment/scoping of Iron Duke–Petersens-Mt
Carbine EPM 14872

MT CARBINE GEOLOGY AND MINERAL RESOURCE ESTIMATE
EQ RESOURCES PTY LTD
measuredgroup.com.au 78
APPENDIX A: JORC TABLE 1 – INSITU OREBODY

MT CARBINE GEOLOGY AND MINERAL RESOURCE ESTIMATE
EQ RESOURCES PTY LTD
measuredgroup.com.au 79
Section 1 - Sampling Techniques and Data
(Criteria in this section apply to all succeeding sections)
Criteria JORC Code Explanation Details
Sampling
techniques
• Nature and quality of sampling (e.g.- cut channels, random chips, or specific specialised industry standard measurement tools appropriate to the minerals under investigation, such as down hole gamma sondes, or handheld XRF instruments, etc). These examples should not be taken as limiting the broad meaning of sampling.
• Include reference to measures taken to ensure sample representivity and the appropriate calibration of any measurement tools or systems used.
• Aspects of the determination of mineralisation that are Material to the Public Report. In cases where ‘industry standard’ work has been done this would be relatively simple (e.g.- ‘reverse circulation drilling was used to obtain 1 m samples from which 3 kg was pulverised to produce a 30 g charge for fire assay’). In other cases, more explanation may be required, such as where there is coarse gold that has inherent sampling problems. Unusual commodities or mineralisation types (e.g.- submarine nodules) may warrant disclosure of detailed information.
- All zones of potential mineralisation were logged and sampled by cutting the core interval selected in half and
the complete half core being sent to ALS Laboratories in Brisbane Australia for analysis.
- Before cutting and sampling the core is logged with zones of visual minerals of wolframite and scheelite recorded
by their percentages. scheelite glows under ultraviolet light and although difficult to distinguish under ordinary
light from quartz-carbonate it is visual under the shortwave 254nm UV light with a common technique to estimate
grade being to trace out individual crystals and determine the overall percentage shown on the face of the core.
Often the mineralisation is manifested as very coarse tungsten mineral crystals of up to 10cm in size.
- The method used for the analysis of Tungsten was ME-XRF15b where the sample was fused into a disk in a
furnace and then analysed by a Bruker X-ray Fluorescent machine. ALS is a registered laboratory that conducts
internal and external round-robin analysis to maintain its certification and to ensure that the machine being used
for analysis is correctly calibrated. The Assaying is completed at 10ppm accuracy, It is important in this process
that the sample is homogenous, and as such the sample is prepared by crushing and grinding to less than 200
microns to ensure homogeneity.
- All quartz veins intersected in the drilling have been assayed as separate samples. Where the veins are more
than 1m in downhole length then the sample is broken into two or more samples each with a maximum of 1m
intervals. The minimum vein assayed is 5cm in width. Since the mineralisation at Mt Carbine often occurs in
narrow widths of 5-500cm then it is important to assay each such narrow zones. On either side of the mineralised
zone, samples are also taken of the host rock at intervals of 1m to ascertain if the mineralisation has extended
into the host rocks.
- Drilling at Mt Carbine was completed by HQ and NQ sized diamond drilling rig that used both double and triple
tube-drilling techniques, HQ was drilled down until the South Wall Fault was intersected and then cased off
before continuing in NQ drill size. The footwall of this fault has no mineralisation as noted under the geology
section and this fault truncates all observed mineralisation. The full core being collected and marked for its depth
and orientation. The core was drilled using a digital orientation method and the Reflex Act III tool system.
Recording hole orientation and hole survey that is wirelessly transmitted to back-end computer for recording.
Drilling
techniques
• Drill type (e.g.- core, reverse circulation, open-hole hammer, rotary air blast, auger, Bangka, sonic, etc) and details (e.g.- core diameter, triple or standard tube, depth of diamond tails, face-sampling bit or other type, whether core is oriented and if so, by what method, etc).
- Drilling at Mt Carbine was completed by HQ and NQ sized diamond drilling rig that used both double and triple
tube-drilling techniques, HQ was drilled down until the South Wall Fault was intersected and then cased off
before continuing in NQ drill size. The footwall of this fault has no mineralisation as noted under the geology
section and this fault truncates all observed mineralisation. The full core being collected and marked for its depth
and orientation. The core was drilled using a digital orientation method and the Reflex Act III tool system.
Recording hole orientation and hole survey that is wirelessly transmitted to back-end computer for recording.
-

MT CARBINE GEOLOGY AND MINERAL RESOURCE ESTIMATE
EQ RESOURCES PTY LTD
measuredgroup.com.au 80
Criteria JORC Code Explanation Details
Drill sample
recovery
• Method of recording and assessing core and chip sample recoveries and results assessed.
• Measures taken to maximise sample recovery and ensure representative nature of the samples.
• Whether a relationship exists between sample recovery and grade and whether sample bias may have occurred due to preferential loss/gain of fine/coarse material.
- Core was marked with core blocks typically at 1.5 & 3.0m intervals by the drilling company using stick up
techniques that ensure measurement to 1cm accuracy.
- The core showed very high recoveries with 99% recovered on the entire campaign to date. With the extreme
hardness of the quartz zones, no loss from drilling has been recorded to date, nevertheless, each interval is
measured to ensure this is the case. The core is hard and competent and all sampling in this programme is
below the base of oxidation. Host rocks are metasediments that have been silicified and then crosscut by
sheeted white quartz veins.
Logging • Whether core and chip samples have been geologically and
geotechnically logged to a level of detail to support appropriate Mineral Resource estimation, mining studies and metallurgical studies.
• Whether logging is qualitative or quantitative in nature. Core (or costean, channel, etc) photography.
• The total length and percentage of the relevant intersections logged.
- The core has been re-joined into long sticks and photographed using a high-resolution camera for both dry and
wet images. The core has a geotechnical log completed and core marked up and measured for recovery etc.
Using the marks provided during the drilling an orientation line is marked down the full length of the core. Post
sampling, the core has been selected for alteration mapping and petrographic studies but have yet to be sent to
the relevant consultancy’s.
- Logging is quantitative in its description of alteration intensity, mineral types in percentages using geological
percentage charts.
Sub-sampling
techniques and
sample
preparation
• If core, whether cut or sawn and whether quarter, half or all core taken.
• If non-core, whether riffled, tube sampled, rotary split, etc and whether sampled wet or dry.
• For all sample types, the nature, quality and appropriateness of the sample preparation technique.
• Quality control procedures adopted for all sub-sampling stages to maximise representivity of samples.
• Measures taken to ensure that the sampling is representative of the in situ material collected, including for instance results for field duplicate/second-half sampling.
• Whether sample sizes are appropriate to the grain size of the material being sampled.
- The core is cut in half using a diamond saw along the centre line marked referred above being the mark for the
orientation of the core. Half core was used in all sampling collections.
- Each sample was weighed and marked correctly in consecutive order with a space left for the insertion of
standards and this was done every 10th sample for 10% checks and balances. No samples were combined for
assay with each sample assayed separately and are either a vein or host rock.
- EQR completed a comprehensive assessment of past core including duplicates and repeats to establish that
the ALS assaying shows consistency and accuracy and historical results were accurate. EQR inputs 10% of the
samples sent to the laboratory as either a blank or predetermined assay standard. With each batch of results
sent there is a minimum of 5 check samples inserted.
Quality of assay
data and
laboratory tests
• The nature, quality and appropriateness of the assaying and laboratory procedures used and whether the technique is considered partial or total.
• For geophysical tools, spectrometers, handheld XRF instruments, etc, the parameters used in determining the
- Tungsten best corresponds to X-ray Fluorescence assay techniques and the best of these techniques uses a
fusion disk where a representative sample of the core is taken after fine grinding until a homogenous sample is
obtained (<200 microns) and then melted in an arc furnace to produce a clear fused disc. This disk is then x
rayed with the fluorescence recorded by way of spectral peaks. The machine needs to be calibrated to record
quantitative results. The instrument is a Bruker multi-shot XRF machine with an X-ray scan of 1 minute applied
to each disk to get the light and heavy elements.
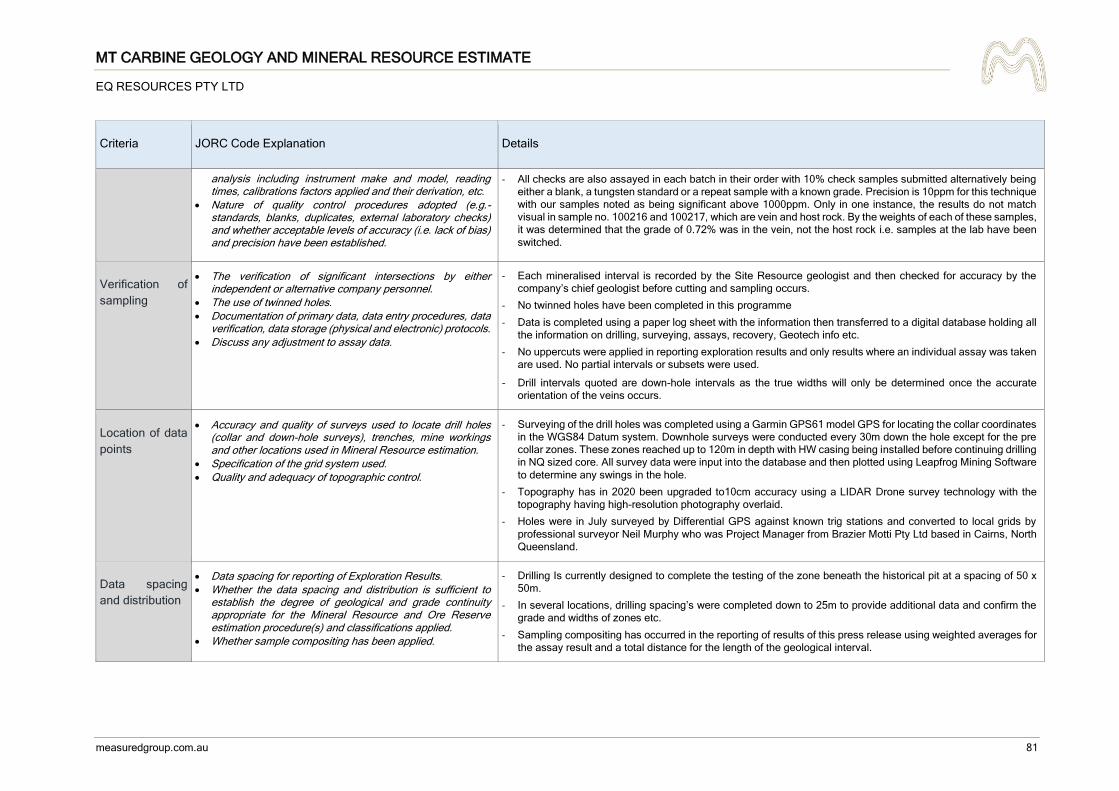
MT CARBINE GEOLOGY AND MINERAL RESOURCE ESTIMATE
EQ RESOURCES PTY LTD
measuredgroup.com.au 81
Criteria JORC Code Explanation Details
analysis including instrument make and model, reading times, calibrations factors applied and their derivation, etc.
• Nature of quality control procedures adopted (e.g.- standards, blanks, duplicates, external laboratory checks) and whether acceptable levels of accuracy (i.e. lack of bias) and precision have been established.
- All checks are also assayed in each batch in their order with 10% check samples submitted alternatively being
either a blank, a tungsten standard or a repeat sample with a known grade. Precision is 10ppm for this technique
with our samples noted as being significant above 1000ppm. Only in one instance, the results do not match
visual in sample no. 100216 and 100217, which are vein and host rock. By the weights of each of these samples,
it was determined that the grade of 0.72% was in the vein, not the host rock i.e. samples at the lab have been
switched.
Verification of
sampling
• The verification of significant intersections by either independent or alternative company personnel.
• The use of twinned holes.
• Documentation of primary data, data entry procedures, data verification, data storage (physical and electronic) protocols.
• Discuss any adjustment to assay data.
- Each mineralised interval is recorded by the Site Resource geologist and then checked for accuracy by the
company’s chief geologist before cutting and sampling occurs.
- No twinned holes have been completed in this programme
- Data is completed using a paper log sheet with the information then transferred to a digital database holding all
the information on drilling, surveying, assays, recovery, Geotech info etc.
- No uppercuts were applied in reporting exploration results and only results where an individual assay was taken
are used. No partial intervals or subsets were used.
- Drill intervals quoted are down-hole intervals as the true widths will only be determined once the accurate
orientation of the veins occurs.
Location of data
points
• Accuracy and quality of surveys used to locate drill holes (collar and down-hole surveys), trenches, mine workings and other locations used in Mineral Resource estimation.
• Specification of the grid system used.
• Quality and adequacy of topographic control.
- Surveying of the drill holes was completed using a Garmin GPS61 model GPS for locating the collar coordinates
in the WGS84 Datum system. Downhole surveys were conducted every 30m down the hole except for the pre
collar zones. These zones reached up to 120m in depth with HW casing being installed before continuing drilling
in NQ sized core. All survey data were input into the database and then plotted using Leapfrog Mining Software
to determine any swings in the hole.
- Topography has in 2020 been upgraded to10cm accuracy using a LIDAR Drone survey technology with the
topography having high-resolution photography overlaid.
- Holes were in July surveyed by Differential GPS against known trig stations and converted to local grids by
professional surveyor Neil Murphy who was Project Manager from Brazier Motti Pty Ltd based in Cairns, North
Queensland.
Data spacing
and distribution
• Data spacing for reporting of Exploration Results.
• Whether the data spacing and distribution is sufficient to establish the degree of geological and grade continuity appropriate for the Mineral Resource and Ore Reserve estimation procedure(s) and classifications applied.
• Whether sample compositing has been applied.
- Drilling Is currently designed to complete the testing of the zone beneath the historical pit at a spacing of 50 x
50m.
- In several locations, drilling spacing’s were completed down to 25m to provide additional data and confirm the
grade and widths of zones etc.
- Sampling compositing has occurred in the reporting of results of this press release using weighted averages for
the assay result and a total distance for the length of the geological interval.

MT CARBINE GEOLOGY AND MINERAL RESOURCE ESTIMATE
EQ RESOURCES PTY LTD
measuredgroup.com.au 82
Criteria JORC Code Explanation Details
Orientation of
data in relation
to geological
structure
• Whether the orientation of sampling achieves unbiased sampling of possible structures and the extent to which this is known, considering the deposit type.
• If the relationship between the drilling orientation and the orientation of key mineralised structures is considered to have introduced a sampling bias, this should be assessed and reported if material.
- The drilling was done at right angles to trend of the mineralisation on a localized grid that has been used since
the 1960s and this local grid has been used to orientate all 90+ drill holes completed on the property. This
allows for regular spacing and interpretations of the deposit veins.
- Depending on the hole angle and attitude of the vein the released results which are down-hole intervals will
report a longer interval than the true width of the vein. No bias has been determined for the mineralisation as
the mineralised veins show remarkable parallel zones and it is deemed that the drilling has been completed at
the best angle to give a true indication of the zones.
Sample security • The measures taken to ensure sample security. - The core is transported daily to a fenced core shed yard. This yard remains locked after work hours and contains
a roofed shed within which core racks are installed the house the core. On a more permanent basis, each hole
is cling wrapped and put on a separate pallet and put in its number place at the core farm.
- All samples are taken and bagged and placed in this locked enclosure in larger 1-tonne bags. Rejects from the
sampling are also stored should a check be required or further element analysis is needed. The larger bags are
inspected on arrival at ALS to ensure no tampering has occurred to the samples.
Audits or
reviews
• The results of any audits or reviews of sampling techniques and data.
- An internal audit of techniques was completed to check for any sample bias or variances being introduced to
the samples. No biases were encountered.

MT CARBINE GEOLOGY AND MINERAL RESOURCE ESTIMATE
EQ RESOURCES PTY LTD
measuredgroup.com.au 83
Section 2 - Reporting of Exploration Results
(Criteria listed in the preceding section also apply to this section.)
Criteria JORC Code Explanation Details
Mineral
tenement and
land tenure
status
• Type, reference name/number, location and ownership including agreements or material issues with third parties such as joint ventures, partnerships, overriding royalties, native title interests, historical sites, wilderness or national park and environmental settings.
• The security of the tenure held at the time of reporting along with any known impediments to obtaining a licence to operate in the area.
- All 16 holes completed to date have been located within ML4919 and ML4867 owned by Mt Carbine Quarries
Pty Ltd which is a 100% wholly-owned subsidiary of EQR. All licenses are in good standing.
- ML4867 (358.5Ha) is up for renewal on 31/7/2022 and ML4919 (7.891Ha) is up for renewal on 31/8/2023. No
impediments exist at the current point for operations on these licenses.
Exploration
done by other
parties
• Acknowledgment and appraisal of exploration by other parties.
- Historical drilling is extensive with the history of previous mining and drilling outlined in the Company’s Annual
reports available on the Company’s website.
- In reference to this drilling all historical holes with their intersections compiled using the same criteria as current
drilling have been reported previously (High-grade structural zones extend for 1.2 km: Mt Carbine historical
drilling reinterpretation – 16th October 2020) has been recorded on all sections and plans and this has been
completed by various companies over the past 25 years.
Geology • Deposit type, geological setting and style of mineralisation. - The deposit falls into the sheeted hydrothermal tungsten vein style that is associated with the Mareeba
Granodiorite. The veins are narrow from 5 to 500cm in width and extend for up to 1.2 km along strike as currently
understood. They have been drilled over a 400m vertical extent and occur in groups designated as zones and
referred to as Iolanthe, Bluff, Wayback, Johnson, Dazzler and Iron Duke. The veins with higher grade
mineralisation occur as late veins and overprints on an extensive early vein system that has weaker tungsten
mineralisation or no mineralisation. This late overprint is what EQR is chasing in the current drill programme.

MT CARBINE GEOLOGY AND MINERAL RESOURCE ESTIMATE
EQ RESOURCES PTY LTD
measuredgroup.com.au 84
Criteria JORC Code Explanation Details
Drill hole
Information
• A summary of all information material to the understanding of the exploration results including a tabulation of the following information for all Material drill holes: o easting and northing of the drill hole collar o elevation or RL (Reduced Level – elevation above
sea level in metres) of the drill hole collar o dip and azimuth of the hole o down hole length and interception depth o hole length.
• If the exclusion of this information is justified on the basis that the information is not Material and this exclusion does not detract from the understanding of the report, the Competent Person should clearly explain why this is the case.
- Included in the sections and plans are all the relevant information required to show the hole location and the
mineralised sample location.
- Any zones from historical drilling are also shown on the sections and included in any interpretation presented.
To be complete, the table here shows the hole status to date. This release refers to Holes
EQ019,011,012,013,014,015 & EQ016. No other drill results are pending and this release concludes the full
core assaying of the drill programme conducted at Mt Carbine in May-July 2021.
- Final Surveyed Collar Coordinates are as follows:

MT CARBINE GEOLOGY AND MINERAL RESOURCE ESTIMATE
EQ RESOURCES PTY LTD
measuredgroup.com.au 85
Criteria JORC Code Explanation Details
Data
aggregation
methods
• In reporting Exploration Results, weighting averaging techniques, maximum and/or minimum grade truncations (e.g.- cutting of high grades) and cut-off grades are usually Material and should be stated.
• Where aggregate intercepts incorporate short lengths of high-grade results and longer lengths of low-grade results, the procedure used for such aggregation should be stated and some typical examples of such aggregations should be shown in detail.
• The assumptions used for any reporting of metal equivalent values should be clearly stated.
- Weighted averages are used for any results combined with no uppercuts applied. A zone reported may contain
results with no grade provided it is the same zone used on other sections, to maintain geological uniformity
between the sections.
- Only those zones where the combined metal factor being the ‘grade x interval’ is above [email protected]% * i.e. a metal
factor of 0.5) Tungsten Trioxide (WO3) are reported as being significant in this release. e.g. 0.3 @ 8.0% WO3
has a metal factor of 2.4 and qualifies but 4m @ 0.1% with metal factor of 0.4 does not qualify.
Relationship
between
mineralisation
widths and
intercept length
• These relationships are particularly important in the reporting of Exploration Results.
• If the geometry of the mineralisation with respect to the drill hole angle is known, its nature should be reported.
• If it is not known and only the downhole lengths are reported, there should be a clear statement to this effect (e.g.- ‘down hole length, true width not known’).
- The results reported are downhole intercepts’ and not true widths. Although all drilling has been completed at
right angles to the strike of the veins, the holes may intercept the vein at an angle given that the veins generally
are from 60-90 degrees in dip. To determine true width requires the individual veins to be orientated in space
and the surveyed hole to also be known at that point.
- For orientation, all veins are being measured for both Alpha and Beta angels to enable the absolute dip and
direction of each vein to be determined in the orientated core. The veins do vary in their strike and dip and until
the orientations have been entered into the database along with the surveyed hole angles, and run through the
leapfrog mining software true widths are not known. Interception true widths may vary from being 0.3 of the
downhole interval to no change to the downhole intervals. The point of interception of the vein and the attitude
of the hole at this point determines the true width and this calculation has not been done. It should also be noted
that in quite a few instances the angles of the same vein varies significantly on either margin. In these instances,
true width will be calculated on the average dip and strike When any resources will be calculated in the future
only true width intervals will be used.
Diagrams • Appropriate maps and sections (with scales) and tabulations
of intercepts should be included for any significant discovery being reported. These should include, but not be limited to a plan view of drill hole collar locations and appropriate sectional views.
- A local grid is used in the drilling to ensure the drilling has been completed at right angles to the strike of the
mineralisation. The local grid is at a 51-degree rotation westwards to true north; i.e.
- Local Grid North-South is aligned at 51 degrees against true north with a yearly deviation occurring as the
continents drift.
- The six sections included in this press release show both of the sections where results have been received and
also shows the current interpretation of the geology for these section including faults, surveyed hole traces
including any historical old holes traces and their results. As the spacing of the current holes is nominally 50m,
each section represents a slice that is 25m on either side of the reported drill hole for completeness. The sections
are shown looking grid west with a true north arrow indicating the lock grid offset. North and South are shown
on the sections to orientate the reader as well as the Easting of the section clearly shown at the top of each
section. To show how the sections relate to each other and other holes completed in this programme a plan is
provided with grid sale and each section has been marked by its Local Grid Easting on which it occurs. Scale is

MT CARBINE GEOLOGY AND MINERAL RESOURCE ESTIMATE
EQ RESOURCES PTY LTD
measuredgroup.com.au 86
Criteria JORC Code Explanation Details
shown in metres by a 50 x 50m grid pattern over both plans and sections. On both plans and sections, the
present geological interpretation is indicative to give the reader guidance on the zones being drilled. Holes with
no assay information are shown in blue.
Balanced
reporting
• Where comprehensive reporting of all Exploration Results is not practicable, representative reporting of both low and high grades and/or widths should be practiced to avoid misleading reporting of Exploration Results.
- All zones that meet the criteria of significance as defined above have been recorded and shown on the
associated cross-sections. Where there is a blank it means no results met with the criteria used as significant
results. At this point, only the data is represented with the most recent geological interpretation, but no resource
association is implied with the release of these results.
- The zones on each section refer only to the results being released for the current hole and the results of adjacent
old holes are not included as this is not new information.
Other
substantive
exploration data
• Other exploration data, if meaningful and material, should be reported including (but not limited to): geological observations; geophysical survey results; geochemical survey results; bulk samples – size and method of treatment; metallurgical test results; bulk density, groundwater, geotechnical and rock characteristics; potential deleterious or contaminating substances.
- The mineralisation occurs as narrow late quartz veins overprinting an earlier phase of quartz veining that
reaches up to 30% of the zones marked on the sections. Although all quartz veins are sampled to be complete,
most are from the earlier event that has no mineralisation associated with it. The interpretation is cantered on
those veins that do carry tungsten and what is perceived as the controls to these zones.
- More than 100 bulk densities have been completed at the project and the host rock and mineralised zones
record bulk densities of 2.6 and 2.8 respectively with 2.74 as the average bulk density
- The South Wall Fault marked on the maps has truncated much of the veining as shown on the sections. The
current interpretation of this fault is that is a reverse thrust fault with the footwall dropping an unknown distance.
Further work • The nature and scale of planned further work (e.g.- tests for
lateral extensions or depth extensions or large-scale step-out drilling).
• Diagrams clearly highlighting the areas of possible extensions, including the main geological interpretations and future drilling areas, provided this information is not commercially sensitive.
- The company continues to drill to outline the limits of the mineralisation in both strike and depth constraints. The
target is limited to what might be considered in an open cut extension of the pit but several holes were extended
to look at the potential of additional veins such as Iron Duke for a future underground operation.

MT CARBINE GEOLOGY AND MINERAL RESOURCE ESTIMATE
EQ RESOURCES PTY LTD
measuredgroup.com.au 87
Section 3 - Estimation and Reporting of Mineral Resources
Criteria JORC Code Explanation Details
Database
integrity
• Measures taken to ensure that data has not been corrupted by, for example, transcription or keying errors, between its initial collection and its use for Mineral Resource estimation purposes.
• Data validation procedures used.
- The specific measures taken by previous parties to ensure database integrity are not known but the
creation of a digital database has allowed for ongoing review of the integrity of the data.
- EQR maintains a database that contains all drill hole surveys, drilling details, lithological data and
assay results. Where possible, all original geological logs, hole collar survey files, digital laboratory
data and reports and other similar source data are maintained by EQR. The database is the primary
source for all such information and was used by the Competent Person to estimate resources.
- The Competent Person undertook consistency checks between the database and original data
sources as well as routine internal checks of database validity including spot checks and the use of
validation tools. No material inconsistencies were identified.
Site visits • Comment on any site visits undertaken by the Competent
Person and the outcome of those visits.
• If no site visits have been undertaken indicate why this is the case.
- The Competent Person (Mr C. Grove) carried out a site visit to the Mt Carbine Tungsten Project in
North Queensland, Australia in April 2021. During the site visit, Mr Grove verified the existence and
location of a subset of the historic drill hole collars in the field, inspected the drill core, reviewed the
metallurgical and mineralogical test work that was previously completed, reviewed the extensive
geological database.
- Mr Grove verified the current drilling practices and procedures and sampling and pre-processing of
samples before sending them to the laboratory.
- Mr Grove considers the work completed to be of industry standard and acceptable for use in the
estimation of mineral resources.
Geological
interpretation
• Confidence in (or conversely, the uncertainty of) the geological interpretation of the mineral deposit.
• Nature of the data used and of any assumptions made.
• The effect, if any, of alternative interpretations on Mineral Resource estimation.
• The use of geology in guiding and controlling Mineral Resource estimation.
• The factors affecting continuity both of grade and geology.
- Geological setting and mineralisation controls of the Mt Carbine Project mineralisation have been
confidently established from drill hole logging and geological mapping, including the development
of a robust three-dimensional model of the major rock units.
- The geological domains are based on a minimum 2m downhole depth of mineralisation. The
composited grades are based on sampled, assayed results and barren zones to create a zone of
mineralisation for geological modelling and resource estimation based on these composited grades.
- Due to the confidence in the understanding of mineralisation controls and the robustness of the
geological model, investigation of alternative interpretations is unnecessary.
Dimensions • The extent and variability of the Mineral Resource
expressed as length (along strike or otherwise), plan width, - Drilling indicates that the mineralisation continues up to 1300m along strike and up to 600m wide.

MT CARBINE GEOLOGY AND MINERAL RESOURCE ESTIMATE
EQ RESOURCES PTY LTD
measuredgroup.com.au 88
Criteria JORC Code Explanation Details
and depth below surface to the upper and lower limits of the Mineral Resource.
- The limits of mineralisation have not been completely defined and are open at depth and along
strike.
Estimation and
modelling
techniques
• The nature and appropriateness of the estimation technique(s) applied and key assumptions, including treatment of extreme grade values, domaining, interpolation parameters and maximum distance of extrapolation from data points. If a computer assisted estimation method was chosen include a description of computer software and parameters used.
• The availability of check estimates, previous estimates and/or mine production records and whether the Mineral Resource estimate takes appropriate account of such data.
• The assumptions made regarding recovery of by-products.
• Estimation of deleterious elements or other non-grade variables of economic significance (e.g.- sulphur for acid mine drainage characterisation).
• In the case of block model interpolation, the block size in relation to the average sample spacing and the search employed.
• Any assumptions behind modelling of selective mining units.
• Any assumptions about correlation between variables.
• Description of how the geological interpretation was used to control the resource estimates.
• Discussion of basis for using or not using grade cutting or capping.
• The process of validation, the checking process used, the comparison of model data to drill hole data, and use of reconciliation data if available.
- A statistical analysis was undertaken on the composited drillhole file to assess the appropriateness
of the domaining process and as such, no additional domaining was undertaken. All domains were
interpolated using ordinary kriging (“OK”).
- Mineralisation was modelled as three-dimensional blocks of parent size 10m X 10m X 10m with
sub-celling allowed to 0.5m X 0.5m X 0.5m.
- No assumptions were made regarding the modelling of selective mining units.
- Validation of the block model was made by:
- checking that drill holes used for the estimation plotted in expected positions;
- checking that flagged domains intersections lay within, and corresponded with, domain wireframes;
- ensuring whether statistical analyses indicated that grade cutting was required;
- checking that the volumes of the wireframes of domains matched the volumes of blocks of domains
in the block model;
- checking plots of the grades in the block model against plots of drill holes;
- Historical estimates were examined and the comparisons were similar yet inconclusive due to the
‘discreet’ style of geological interpretation in this estimate compared to the larger, all-encompassing
lower grade style previously.
Moisture • Whether the tonnages are estimated on a dry basis or with
natural moisture, and the method of determination of the moisture content.
- Tonnages were estimated on a dry basis.
Cut-off
parameters
• The basis of the adopted cut-off grade(s) or quality parameters applied.
- No cut-off grades were applied to the Mt Carbine Resource Estimate.
- The mineralised material is interpreted to have ‘reasonable prospects of eventual economic
extraction’ by open-pit methods and by underground mining methods.

MT CARBINE GEOLOGY AND MINERAL RESOURCE ESTIMATE
EQ RESOURCES PTY LTD
measuredgroup.com.au 89
Criteria JORC Code Explanation Details
Mining factors or
assumptions
• Assumptions made regarding possible mining methods, minimum mining dimensions and internal (or, if applicable, external) mining dilution. It is always necessary as part of the process of determining reasonable prospects for eventual economic extraction to consider potential mining methods, but the assumptions made regarding mining methods and parameters when estimating Mineral Resources may not always be rigorous. Where this is the case, this should be reported with an explanation of the basis of the mining assumptions made.
- The resource estimate has been completed with the assumption that it will be mined using open cut
and underground mining methods. No other detailed assumptions have been made to date.
However, EQR will be completing a Feasibility Study on this resource estimate model, and when
completed, more detailed assumptions will be able to be applied.
Metallurgical
factors or
assumptions
• The basis for assumptions or predictions regarding metallurgical amenability. It is always necessary as part of the process of determining reasonable prospects for eventual economic extraction to consider potential metallurgical methods, but the assumptions regarding metallurgical treatment processes and parameters made when reporting Mineral Resources may not always be rigorous. Where this is the case, this should be reported with an explanation of the basis of the metallurgical assumptions made.
- Historical production shows the Mt Carbine Project was in the lowest quartile cost of production of
western producers and produce very high-grade wolframite (>70% WO3) and scheelite (68-
72%WO3) concentrates with no or very low impurity penalties.
- The main processes involve crushing to several different product sizes and then screening to create
the product.
- These processes are in current production and lead to the ‘reasonable prospects for eventual
economic extraction’ considered by the Competent Person.
Environmental
factors or
assumptions
• Assumptions made regarding possible waste and process residue disposal options. It is always necessary as part of the process of determining reasonable prospects for eventual economic extraction to consider the potential environmental impacts of the mining and processing operation. While at this stage the determination of potential environmental impacts, particularly for a Greenfields project, may not always be well advanced, the status of early consideration of these potential environmental impacts should be reported. Where these aspects have not been considered this should be reported with an explanation of the environmental assumptions made.
- There has been recorded mining activity at the Mt Carbine Project between 1974-1987.
- There is currently re-processing of low-grade ore from the stockpile constructed from the discarded
material and existing tailings dam.
- Near the project site, the land is mainly used for forestry, livestock farming and recreational
activities.
- As the potential mine area contained an active open-pit mine up until 1987; and is still by law
considered an active Mining Licence Area, development near the deposit has been limited.
- A surface water sampling programme (now in place for two years) for environmental monitoring.
- Completion of 5 twinned water monitoring bores to aid monitoring of groundwater regimes for
environmental management.
- Development of an application for a higher level of Environmental Approval to cover the mining
activities and processing.

MT CARBINE GEOLOGY AND MINERAL RESOURCE ESTIMATE
EQ RESOURCES PTY LTD
measuredgroup.com.au 90
Criteria JORC Code Explanation Details
Bulk density • Whether assumed or determined. If assumed, the basis for
the assumptions. If determined, the method used, whether wet or dry, the frequency of the measurements, the nature, size and representativeness of the samples.
• The bulk density for bulk material must have been measured by methods that adequately account for void spaces (i.e. vugs, porosity, etc), moisture and differences between rock and alteration zones within the deposit.
• Discuss assumptions for bulk density estimates used in the evaluation process of the different materials.
- A total of 1,048 density measurements from drill core were completed.
- The methodology of density measurements was as follows:
- A length of solid and intact/unbroken core with essentially zero porosity was selected and the ends
were carefully cut with a diamond saw to make a near-perfect cylinder.
- The core was then sun-dried and the length and diameter of the cylinder (average of three readings
with callipers) and an accurate weight were recorded to permit a simple volume/dry weight density
estimate.
- Density measurements were analysed for any spatial trends by easting, northing and depth, with
no obvious trends detected.
- Hence, an average density of 2.74 was applied to the whole deposit.
Classification • The basis for the classification of the Mineral Resources into
varying confidence categories.
• Whether appropriate account has been taken of all relevant factors (i.e. relative confidence in tonnage/grade estimations, reliability of input data, confidence in continuity of geology and metal values, quality, quantity and distribution of the data).
• Whether the result appropriately reflects the Competent Person’s view of the deposit.
- Classification of the Mineral Resource estimate was interpreted on several criteria, including
confidence in the geological interpretation, the integrity of the data, the spatial continuity of the
mineralisation and the quality of the estimation.
- An assessment of the historical mining showed increased confidence in the surrounding areas of
the open-pit and confirmed by drilling results.
- The classification reflected the author’s confidence in the location, quantity, grade, geological
characteristics and continuity of the Mineral Resources.
- The data spacing and distribution is sufficient to establish geological and grade continuity
appropriate for Mineral Resource estimation and classification and the results appropriately reflect
the Competent Person’s view of the deposit.
Audits or
reviews
• The results of any audits or reviews of Mineral Resource estimates.
- An internal audit of techniques was completed to check for any bias or variances being introduced
to the resource estimate. No biases were encountered.
Discussion of
relative
accuracy/
confidence
• Where appropriate a statement of the relative accuracy and confidence level in the Mineral Resource estimate using an approach or procedure deemed appropriate by the Competent Person. For example, the application of statistical or geostatistical procedures to quantify the relative accuracy of the resource within stated confidence limits, or, if such an approach is not deemed appropriate, a qualitative
- The estimates made for this report are global estimates. Predicted tonnages and grades made from
such block estimates are useful for feasibility studies, and long-, medium- and short-term mine
planning. Individual, as distinct from aggregated, block estimates should not be relied upon for block
selection for mining.

MT CARBINE GEOLOGY AND MINERAL RESOURCE ESTIMATE
EQ RESOURCES PTY LTD
measuredgroup.com.au 91
Criteria JORC Code Explanation Details
discussion of the factors that could affect the relative accuracy and confidence of the estimate.
• The statement should specify whether it relates to global or local estimates, and, if local, state the relevant tonnages, which should be relevant to technical and economic evaluation. Documentation should include assumptions made and the procedures used.
• These statements of relative accuracy and confidence of the estimate should be compared with production data, where available.
- Local block model estimates, or grade control estimates, whose block grades are to be relied upon
for selection of ore from waste at the time of mining will require additional drilling and sampling of
blast holes.
- Confidence in the relative accuracy of the estimates is reflected in the classification of estimates as
Indicated and Inferred.
- Variography was completed for Tungsten. The variogram models were interpreted as being
isotropic in the plane with shorter ranges perpendicular to the plane of maximum continuity.
- Validation checks have been completed on raw data, composited data, model data and Resource
estimates.
- The model is checked to ensure it honours the validated data and no obvious anomalies exist which
are not geologically sound.
- The mineralised zones are based on actual intersections. These intersections are checked against
the drill hole data. The Competent Person has independently checked laboratory sample data. The
picks are sound and suitable to be used in the modelling and estimation process.
- Further drilling also needs to be completed to improve the Resource classification of the Inferred
Resource.

MT CARBINE GEOLOGY AND MINERAL RESOURCE ESTIMATE
EQ RESOURCES PTY LTD
measuredgroup.com.au 92
APPENDIX B: JORC TABLE 1 – LOW-GRADE STOCKPILE

MT CARBINE GEOLOGY AND MINERAL RESOURCE ESTIMATE
EQ RESOURCES PTY LTD
measuredgroup.com.au 93
Section 1 - Sampling Techniques and Data
(Criteria in this section apply to all succeeding sections.)
Criteria Explanation Commentary
Sampling techniques
• Nature and quality of sampling (e.g. cut channels, random chips, or specific specialised industry standard measurement tools appropriate to the minerals under investigation, such as down hole gamma sondes, or handheld XRF instruments, etc.). These examples should not be taken as limiting the broad meaning of sampling.
• Include reference to measures taken to ensure sample representivity and the appropriate calibration of any measurement tools or systems used.
• Aspects of the determination of mineralisation that are Material to the Public Report. In cases where ‘industry standard’ work has been done this would be relatively simple (e.g. ‘reverse circulation drilling was used to obtain 1 m samples from which 3 kg was pulverised to produce a 30 g charge for fire assay’). In other cases, more explanation may be required, such as where there is coarse gold that has inherent sampling problems. Unusual commodities or mineralisation types (e.g. submarine nodules) may warrant disclosure of detailed information.
- Bulk sampling utilizing 8 costeans dug with an excavator around the perimeter of the stockpile,
costeans ranging up to 10m deep and 50m long.
- Grab sampling at 80 locations (samples approximately 20kg each of minus 100mm material) for
mineralogical and chemical characterisation of mineralised rock for environmental permitting
purposes.
Drilling techniques
• Drill type (e.g. core, reverse circulation, open-hole hammer, rotary air blast, auger, Bangka, sonic, etc.) and details (e.g. core diameter, triple or standard tube, depth of diamond tails, face-sampling bit or other type, whether core is oriented and if so, by what method, etc.).
- N/A
Drill sample recovery
• Method of recording and assessing core and chip sample recoveries and results assessed.
- N/A

MT CARBINE GEOLOGY AND MINERAL RESOURCE ESTIMATE
EQ RESOURCES PTY LTD
measuredgroup.com.au 94
Criteria Explanation Commentary
• Measures taken to maximise sample recovery and ensure representative nature of the samples.
• Whether a relationship exists between sample recovery and grade and whether sample bias may have occurred due to preferential loss/gain of fine/coarse material.
Logging • Whether core and chip samples have been geologically and geotechnically logged to a level of detail to support appropriate Mineral Resource estimation, mining studies and metallurgical studies.
• Whether logging is qualitative or quantitative in nature. Core (or costean, channel, etc.) photography.
• The total length and percentage of the relevant intersections logged.
- N/A
Sub-sampling techniques and sample preparation
• If core, whether cut or sawn and whether quarter, half or all core taken.
• If non-core, whether riffled, tube sampled, rotary split, etc. and whether sampled wet or dry.
• For all sample types, the nature, quality and appropriateness of the sample preparation technique.
• Quality control procedures adopted for all sub-sampling stages to maximise representivity of samples.
• Measures taken to ensure that the sampling is representative of the in situ material collected, including for instance results for field duplicate/second-half sampling.
• Whether sample sizes are appropriate to the grain size of the material being sampled.
- The bulk sample was coned and quartered with the excavator to 2,000 tonnes. This subsample was
crushed to minus 50mm and screened into three size ranges: 20-50mm, 10-20mm and minus
10mm. Each size fraction was sampled by channel sampling.
- The grab samples were crushed to minus 3mm, split, and sub-samples pulverised and assayed for
a range of elements including tungsten (the latter by fused disk XRF).
Quality of assay data and
• The nature, quality and appropriateness of the assaying and laboratory procedures used and whether the technique is considered partial or total.
- The channel samples were analysed by fused disk and check analyses were carried out on-site
with a Niton portable XRF analyser after careful calibration of this instrument.

MT CARBINE GEOLOGY AND MINERAL RESOURCE ESTIMATE
EQ RESOURCES PTY LTD
measuredgroup.com.au 95
Criteria Explanation Commentary
laboratory tests
• For geophysical tools, spectrometers, handheld XRF instruments, etc., the parameters used in determining the analysis including instrument make and model, reading times, calibrations factors applied and their derivation, etc.
• Nature of quality control procedures adopted (e.g. standards, blanks, duplicates, external laboratory checks) and whether acceptable levels of accuracy (i.e. lack of bias) and precision have been established.
Verification of sampling and assaying
• The verification of significant intersections by either independent or alternative company personnel.
• The use of twinned holes.
• Documentation of primary data, data entry procedures, data verification, data storage (physical and electronic) protocols.
• Discuss any adjustment to assay data
- See Above
Location of data points
• Accuracy and quality of surveys used to locate drill holes (collar and down-hole surveys), trenches, mine workings and other locations used in Mineral Resource estimation.
• Specification of the grid system used.
• Quality and adequacy of topographic control.
- Costean locations are shown in the body of the report.
Data spacing and distribution
• Data spacing for reporting of Exploration Results.
• Whether the data spacing and distribution is sufficient to establish the degree of geological and grade continuity appropriate for the Mineral Resource and Ore Reserve estimation procedure(s) and classifications applied.
• Whether sample compositing has been applied.
- Costean locations are shown in the body of the report.

MT CARBINE GEOLOGY AND MINERAL RESOURCE ESTIMATE
EQ RESOURCES PTY LTD
measuredgroup.com.au 96
Criteria Explanation Commentary
Orientation of data in relation to geological structure
• Whether the orientation of sampling achieves unbiased sampling of possible structures and the extent to which this is known, considering the deposit type.
• If the relationship between the drilling orientation and the orientation of key mineralised structures is considered to have introduced a sampling bias, this should be assessed and reported if material.
- N/A
Sample security
• The measures taken to ensure sample security. - The bulk sample crushed and screened size splits are stored on-site, and the crushed grab samples
and pulverized splits are stored in the mine core shed.
Audits or reviews
• The results of any audits or reviews of sampling techniques and data.
- The bulk sampling procedures were subject to review by the Competent Person retained to
supervise the X-ray ore sorter trials.
Section 2 - Reporting of Exploration Results
(Criteria listed in the preceding section also apply to this section.)
Criteria Explanation Commentary
Mineral tenement and land tenure status
• Type, reference name/number, location and ownership including agreements or material issues with third parties such as joint ventures, partnerships, overriding royalties, native title interests, historical sites, wilderness or national park and environmental settings.
• The security of the tenure held at the time of reporting along with any known impediments to obtaining a licence to operate in the area.
- The resource estimates reported herein are all within Mining Leases 4867 (358.5ha, expiry 31-07-
22) and 4919 (7.891ha, expiry 31-08-2023), held by Mt Carbine Quarries Pty Ltd. The Mining
Leases lie within Brooklyn Grazing Homestead Perpetual Lease. Native Title has been
extinguished in the Mining Leases by Deed of Grant.

MT CARBINE GEOLOGY AND MINERAL RESOURCE ESTIMATE
EQ RESOURCES PTY LTD
measuredgroup.com.au 97
Criteria Explanation Commentary
Exploration done by other parties
• Acknowledgment and appraisal of exploration by other parties.
- No previous examination of the LGS was carried out.
- A nearly complete record of mine production, including amounts of mined rock consigned to the
LGS has been compiled using published and unpublished archives, including reporting for State
Royalty returns.
Geology • Deposit type, geological setting and style of mineralisation.
- The Deposit
- The Mt Carbine tungsten deposit is a sheeted quartz vein deposit. Many sub-parallel, sub-vertical
quartz veins have been deposited in fractures developed in the host rocks metasediments in a
zone that drilling and mapping of historical surface workings have shown to be approximately 300m
wide and at least 1.4 km long, trending at about 315 degrees.
- Grade Variation
- Sampling, drill core logging, geostatistical analysis of drill core assay data and mapping of the
open pit have determined that all the material mined during the previous operation was mineralised
to some extent and that the mineralogy of the deposit was uniform. There is little doubt that the
mineralogy of the stockpile material is identical to that mined and processed. The material in the
stockpile comprises a single formation, the result of the alteration of Siluro-Devonian meta-
sedimentary host rocks (Forsythe and Higgins, 1990).
- The amount of quartz veining varies within the mineralised zone and previous mining and
exploration have been concentrated at the south-eastern end of the mineralised zone. It is well
understood that there are high-grade zones within the mineralisation in this part of the deposit and
that the higher-grade zones are surrounded by lower grade mineralisation. Interpretation of recent
drilling suggests that the main high-grade zone may plunge to the north of the present open pit.
The previous mine assumption that quartz vein abundance is directly correlated with grade is not
supported by an independent review of quartz vein abundance and grade.
-
-
Drill hole Information
• A summary of all information material to the understanding of the exploration results including a tabulation of the following information for all Material drill holes:
• easting and northing of the drill hole collar
- N/A

MT CARBINE GEOLOGY AND MINERAL RESOURCE ESTIMATE
EQ RESOURCES PTY LTD
measuredgroup.com.au 98
Criteria Explanation Commentary
• elevation or RL (Reduced Level – elevation above sea level in metres) of the drill hole collar
• dip and azimuth of the hole
• down hole length and interception depth
• hole length.
• If the exclusion of this information is justified on the basis that the information is not Material and this exclusion does not detract from the understanding of the report, the Competent Person should clearly explain why this is the case
Data aggregation methods
• In reporting Exploration Results, weighting averaging techniques, maximum and/or minimum grade truncations (e.g. cutting of high grades) and cut-off grades are usually Material and should be stated.
• Where aggregate intercepts incorporate short lengths of high grade results and longer lengths of low grade results, the procedure used for such aggregation should be stated and some typical examples of such aggregations should be shown in detail.
• The assumptions used for any reporting of metal equivalent values should be clearly stated
- N/A
Relationship between mineralisation widths and intercept length
• These relationships are particularly important in the reporting of Exploration Results.
• If the geometry of the mineralisation with respect to the drill hole angle is known, its nature should be reported. • If it is not known and only the down hole lengths are reported, there should be a clear statement to this effect (e.g. ‘down hole length, true width not known’).
- N/A
Diagrams • Appropriate maps and sections (with scales) and tabulations of intercepts should be included for any significant discovery being reported These should
- A plan view of sampling is shown in the body of the report.

MT CARBINE GEOLOGY AND MINERAL RESOURCE ESTIMATE
EQ RESOURCES PTY LTD
measuredgroup.com.au 99
Criteria Explanation Commentary
include, but not be limited to a plan view of drill hole collar locations and appropriate sectional views.
Balanced reporting
• Where comprehensive reporting of all Exploration Results is not practicable, representative reporting of both low and high grades and/or widths should be practiced to avoid misleading reporting of Exploration Results.
- N/A
Other substantive exploration data
• Other exploration data, if meaningful and material, should be reported including (but not limited to): geological observations; geophysical survey results; geochemical survey results; bulk samples – size and method of treatment; metallurgical test results; bulk density, groundwater, geotechnical and rock characteristics; potential deleterious or contaminating substances.
- N/A
Further work • The nature and scale of planned further work (e.g. tests for lateral extensions or depth extensions or large-scale step-out drilling).
• Diagrams clearly highlighting the areas of possible extensions, including the main geological interpretations and future drilling areas, provided this information is not commercially sensitive.
- The bulk sample was subjected to a series of trials through a pilot-scale X-ray ore sorter over 2
months. This work demonstrated that an optimum 6 times upgrade of the tungsten content in the
ore sorter accepts and ensuing feasibility studies indicate that the LGS is economic to process
utilizing X-ray ore sorting and concentration of mineral in the ore sorter accepts in a conventional
gravity mill.

MT CARBINE GEOLOGY AND MINERAL RESOURCE ESTIMATE
EQ RESOURCES PTY LTD
measuredgroup.com.au 100
Section 3 - Estimation and Reporting of Mineral Resources
(Criteria listed in section 1, and where relevant in section 2, also apply to this section.)
Criteria Explanation - Commentary
Database integrity
• Measures taken to ensure that data has not been corrupted by, for example, transcription or keying errors, between its initial collection and its use for Mineral Resource estimation purposes.
• Data validation procedures used.
- N/A
Site visits • Comment on any site visits undertaken by the Competent Person and the outcome of those visits.
• If no site visits have been undertaken indicate why this is the case.
- The Competent Person (Mr C. Grove) carried out a site visit to the Mt Carbine Tungsten Project in North
Queensland, Australia in April 2021. During the site visit, Mr Grove verified the existence and location of the
production history and inspected the LGS to form an opinion of the data retrieved from the historical
production data.
- Mr Grove verified the current production practices and procedures, sampling and processing of ore through
crushing and screening before the final product is sent to market.
- Mr Grove considers the work completed to be of industry standard and acceptable for use in the estimation
of mineral resources.
Geological interpretation
• Confidence in (or conversely, the uncertainty of) the geological interpretation of the mineral deposit.
• Nature of the data used and of any assumptions made.
• The effect, if any, of alternative interpretations on Mineral Resource estimation.
• The use of geology in guiding and controlling Mineral Resource estimation.
• The factors affecting continuity both of grade and geology.
- Senior geological staff including the Competent Person have developed a sound understanding of the
geology and importantly, geometallurgy of the deposit.
Dimensions • The extent and variability of the Mineral Resource expressed as length (along strike or otherwise), plan width, and depth below surface to the upper and lower limits of the Mineral Resource.
- The 12Mt tonnes estimated to be contained in the LGS has been derived from nearly complete historical
mine records, confirmed by the reconciliation of an independent estimate of total tonnes mined from the
open pit (22Mt) less 10Mt material processed through the mill.

MT CARBINE GEOLOGY AND MINERAL RESOURCE ESTIMATE
EQ RESOURCES PTY LTD
measuredgroup.com.au 101
Criteria Explanation - Commentary
Estimation and modelling techniques
• The nature and appropriateness of the estimation technique(s) applied and key assumptions, including treatment of extreme grade values, domaining, interpolation parameters and maximum distance of extrapolation from data points. If a computer assisted estimation method was chosen include a description of computer software and parameters used.
• The availability of check estimates, previous estimates and/or mine production records and whether the Mineral Resource estimate takes appropriate account of such data.
• The assumptions made regarding recovery of by-products.
• Estimation of deleterious elements or other non-grade variables of economic significance (e.g. sulphur for acid mine drainage characterisation).
• In the case of block model interpolation, the block size in relation to the average sample spacing and the search employed.
• Any assumptions behind modelling of selective mining units.
• Any assumptions about correlation between variables.
• Description of how the geological interpretation was used to control the resource estimates.
• Discussion of basis for using or not using grade cutting or capping.
• The process of validation, the checking process used, the comparison of model data to drill hole data, and use of reconciliation data if available.
- The detailed distribution of grade through the LGS is not known, as no record was kept of placement of rock
consigned to the stockpile, nor was any sampling carried out. The average of assays of the three size range
subsamples of the bulk sample is 0.075% WO3. This reconciles very favourably with a back-calculation from
historic mine records of production and mill recovery and based on the recent resource estimate which took
account of the resource mined during the previous open pit operation, of a global average grade of 0.075%
WO3 for the Low-Grade Stockpile.
- It should be noted that the historical mine records state that 3.5Mt of rock described as ore was consigned
to the stockpile in 1982.
- The grab samples average 0.088% WO3 (fused disk XRF analysis), which is taken to indicate that the
tungsten grade of the finer fraction (<200mm) of the stockpile is higher than the global average grade of the
bulk sample that included fragments up to 500mm.

MT CARBINE GEOLOGY AND MINERAL RESOURCE ESTIMATE
EQ RESOURCES PTY LTD
measuredgroup.com.au 102
Criteria Explanation - Commentary
Moisture • Whether the tonnages are estimated on a dry basis or with natural moisture, and the method of determination of the moisture content.
- Tonnages are estimated on an air-dried basis.
Cut-off parameters
• The basis of the adopted cut-off grade(s) or quality parameters applied.
- No cut off has been applied to the stockpile grade estimation, however, it is planned to screen the stockpiled
material at 500mm and only crush and ore sort the minus 500mm fraction, since a growing body of data from
ongoing tests indicates that this fraction contains the bulk of the tungsten minerals that it is planned to
recover.
Mining factors or assumptions
• Assumptions made regarding possible mining methods, minimum mining dimensions and internal (or, if applicable, external) mining dilution. It is always necessary as part of the process of determining reasonable prospects for eventual economic extraction to consider potential mining methods, but the assumptions made regarding mining methods and parameters when estimating Mineral Resources may not always be rigorous. Where this is the case, this should be reported with an explanation of the basis of the mining assumptions made.
- The stockpile fills a valley and will readily be recovered by excavator and truck.
Metallurgical factors or assumptions
• The basis for assumptions or predictions regarding metallurgical amenability. It is always necessary as part of the process of determining reasonable prospects for eventual economic extraction to consider potential metallurgical methods, but the assumptions regarding metallurgical treatment processes and parameters made when reporting Mineral Resources may not always be rigorous. Where this is the case, this should be reported with an explanation of the basis of the metallurgical assumptions made.
- The mineralogy of the material contained in the stockpile is identical to that of the hard rock ore body. The
Mt Carbine ore body is low grade in comparison with many other tungsten deposits, however, the highly
successful application of ore sorting to preconcentrate this ore to a high-grade mill feed has been
demonstrated firstly in the previous mining operation which used optical ore sorters, and secondly by
extensive recent trials of X-ray ore sorting of bulk samples of the stockpile and Run of Mine ore by EQR.
- Process design and anticipated recoveries have been derived from historical mill flow sheets, reports and
trials that have been confirmed by repeat metallurgical testing of bulk samples of stockpile material including
Run of Mine ore.

MT CARBINE GEOLOGY AND MINERAL RESOURCE ESTIMATE
EQ RESOURCES PTY LTD
measuredgroup.com.au 103
Criteria Explanation - Commentary
Environmental factors or assumptions
• Assumptions made regarding possible waste and process residue disposal options. It is always necessary as part of the process of determining reasonable prospects for eventual economic extraction to consider the potential environmental impacts of the mining and processing operation. While at this stage the determination of potential environmental impacts, particularly for a greenfields project, may not always be well advanced, the status of early consideration of these potential environmental impacts should be reported. Where these aspects have not been considered this should be reported with an explanation of the environmental assumptions made.
- EQR has been granted an Environmental Authority by the Queensland Department of Environment and
Science (“DES”) for the Low-Grade Stockpile. Based on the sampling of existing stockpiles, tailings storage
facilities and analytical characterisation of the mineralisation, the only elements present at hazardous values
are fluorine (as fluorite) and arsenic (as arsenopyrite). Previous mine practice and the present Environmental
Management Plan approved by the DES include measures to manage the environmental hazards these
elements present. The sampling of the existing stockpiles and tailings storage facility indicates that acid mine
drainage will not be a hazard created by future mining and waste storage.
Bulk density • Whether assumed or determined. If assumed, the basis for the assumptions. If determined, the method used, whether wet or dry, the frequency of the measurements, the nature, size and representativeness of the samples.
• The bulk density for bulk material must have been measured by methods that adequately account for void spaces (vugs, porosity, etc.), moisture and differences between rock and alteration zones within the deposit.
• Discuss assumptions for bulk density estimates used in the evaluation process of the different materials.
- N/A. The tonnes estimated to be contained in the stockpile have been derived independently of calculation
by multiplying volume by density.
Classification • The basis for the classification of the Mineral Resources into varying confidence categories.
• Whether appropriate account has been taken of all relevant factors (i.e. relative confidence in tonnage/grade estimations, reliability of input data, confidence in continuity of geology and
- Following extensive metallurgical testing of bulk samples from the stockpile that provide robust anticipated
recovery and quality of product, the LGS has been classified as an Indicated Resource.

MT CARBINE GEOLOGY AND MINERAL RESOURCE ESTIMATE
EQ RESOURCES PTY LTD
measuredgroup.com.au 104
Criteria Explanation - Commentary
metal values, quality, quantity and distribution of the data).
• Whether the result appropriately reflects the Competent Person’s view of the deposit.
Audits or reviews.
• The results of any audits or reviews of Mineral Resource estimates.
- The estimates for the LGS have been subject to internal Company and Independent Competent Persons
Company review.
Discussion of relative accuracy/ confidence
• Where appropriate a statement of the relative accuracy and confidence level in the Mineral Resource estimate using an approach or procedure deemed appropriate by the Competent Person. For example, the application of statistical or geostatistical procedures to quantify the relative accuracy of the resource within stated confidence limits, or, if such an approach is not deemed appropriate, a qualitative discussion of the factors that could affect the relative accuracy and confidence of the estimate.
• The statement should specify whether it relates to global or local estimates, and, if local, state the relevant tonnages, which should be relevant to technical and economic evaluation. Documentation should include assumptions made and the procedures used.
• These statements of relative accuracy and confidence of the estimate should be compared with production data, where available.
- The success of the proposed stockpile treatment is underpinned by the fact that the same orebody was
profitably mined for 13 years by the previous operators. The mine only closed in 1987 because of the price
collapse caused by oversupply from Chinese producers dumping products on the market, resulting in the
closure of most western tungsten producing mines. Before the price collapse, the Mt Carbine mine operators
and their joint venture partners had carried out detailed plans to extend the mine life and maintain production
for a further ten years.
- The Mt Carbine mine had not run out of ore (there was an estimated 3.5Mt of ore to be extracted from the
existing pit before any mine expansion had to be considered). The ore treatment process was well
documented, and studies spurred by the collapsing price showed that mill recovery could be significantly
increased. This has since been confirmed by test work carried out by EQR.

MT CARBINE GEOLOGY AND MINERAL RESOURCE ESTIMATE
EQ RESOURCES PTY LTD
measuredgroup.com.au 105
APPENDIX C: DRILL HOLE DATA

MT CARBINE GEOLOGY AND MINERAL RESOURCE ESTIMATE
EQ RESOURCES PTY LTD
measuredgroup.com.au 106
Table D 1: Drillhole Collar Locations (Local Grid)
HOLE ID EAST NORTH ELEVATION TOTAL DEPTH
CB001 22772.4 26224.6 396 303.28
CB002 22914 26241.4 396 236.4
CB003 22775.4 26178.4 387 320.18
CB004 22912.4 26459 386 146.46
CB005 22853.2 26423.3 410 215.04
CB006 22729.5 26469 443 146.08
CB007 22974.5 26408.4 394 145.66
CB008 22630 26246.1 391 166.27
CB009 22694.5 26205.7 383 215.04
CB011 22989.6 26325.2 388 102.52
CB012 22554.5 26206.5 384 253
CB013 22500.8 26385.5 430 140.04
CB014 22475 26196 386 297
CB015 22605.5 26327.2 416 152
CB016 22663 26276 387 240.78
CB017 22844 26480 404 176.5
CB018 22748.4 26717.2 383 700
CB019 22003 26695 446 331
CB020 22875.9 26176.9 383 0
CB021 22727.3 26213.1 379 68
CB022 22973.5 26476.6 381 245
CB024 22711.4 27075.7 372 448.2
CB025 23052.4 27272.5 367 268
CB029A 22788.9 26637.3 384 404
CB036 23020 27327 365 143
CB037 22988 27370 365 125
CB038 22825.2 26511.5 390 325
CB039 22850.3 26512.6 389 324.7
CB040 22850.6 26544.8 391 351
CB041 22898.8 26499.9 380 279
CB042 22900.2 26537.2 386 142
CB043 22778.4 26245.4 347 50
CB044 22917.8 26291.3 348 50
CB045 22840.1 26266 347 50
CB046 22450.98 26482.17 462 78.5
CB047 22458.7 26531.3 446 131.5
CB048 22551.2 26404.2 435 120
CB049 22408.4 26373.5 450 129.8
CB050 22527.6 26483.5 452 60.5
CB051 22752.13 26668.19 389 267
CB052 22834.46 26601.99 385 399.2
CB053 22698.47 26712.59 389 216
CB054 22698.28 26713.3 389 225.2

MT CARBINE GEOLOGY AND MINERAL RESOURCE ESTIMATE
EQ RESOURCES PTY LTD
measuredgroup.com.au 107
CB055 22651.61 26722.25 391 320.6
CB056 22447.25 26167.74 385 246.8
CB057 22397.04 26258.86 407 251.7
CB058 22170.48 26202.81 393 251.8
CB059 22298.42 26174.39 393 182.7
CB060 22504.96 26358.22 426 248.9
CB061 22207.41 26323.7 417 291
CB062 22651.92 26524.41 431 306
CB063 22620.61 26613.22 435 311.8
CB064 22536.23 26485 452 368.5
CB065 22715.73 26593.13 407 440.8
CB066 22561.36 26725.57 388 248.8
CB067 22750.16 26770.3 378 398.9
EQ001 22793.295 26175.821 389 309.1
EQ002 22793.418 26175.394 389 341.8
EQ003 22735.677 26170.491 387 299
EQ004 22704.388 26174.923 386 327.3
EQ005 22657.446 26173.679 387 312.3
EQ006 22876.196 26188.593 384 309.3
EQ007 23014.294 26328.151 364 48
EQ008 23014.278 26329.307 364 60.5
EQ009 23013.849 26330.958 364 171.5
EQ010 22656.842 26177.017 387 243.3
EQ011 22765.358 26173.378 389 285.3
EQ012 22624.095 26185.785 388 414.6
EQ013 22910.78 26189.687 383 294.2
EQ014 22956.998 26203.604 383 300.4
EQ015 22841.076 26177.612 387 306.3
EQ016 23055.566 26321.271 380 48.4
MTC01 22799.45 26546.47 401 401.5
MTC02 22719.89 26569.7 411 400
MTCB001 23069.35 26491.65 374 339.3
MTCB002 22480.08 26617.27 411 567.4
MTCB003 22240.19 26632.11 430 663.4
MTCB004 21922.84 26260.15 397 186.4
MTCB005 21920.87 26258.46 397 741.4

MT CARBINE GEOLOGY AND MINERAL RESOURCE ESTIMATE
EQ RESOURCES PTY LTD
measuredgroup.com.au 108
Table D 2: 2021 Significant Assay Results (by Drillhole)
Hole ID East North Rl EOH Dip Azm (TN) From To Interval WO3 %
EQ001 22,798 26,177 389.5 309.1 -49 50 164.73 169.00 4.27 1.27
Incl. 166.47 166.57 0.10 50.07
185.07 191.13 6.06 0.54
Incl. 187.82 187.99 0.17 17.40
202.02 208.74 6.72 0.53
Incl. 202.02 202.78 0.76 3.87
221.06 221.41 0.35 2.13
228.84 231.37 2.53 0.48
296.51 305.63 9.12 0.48
Incl. 296.51 297.75 1.24 2.64
Incl. 305.12 305.63 0.51 2.07
EQ002 22,798 26,177 389.5 389.5 -57 50 207.20 211.55 4.35 0.26
Incl. 207.20 207.62 0.42 1.95
262.50 263.13 0.63 0.50
308.67 313.94 5.27 0.38
Incl. 308.67 308.86 0.19 1.92
Incl. 312.77 313.94 1.17 1.42
EQ003 22,730 26,181 387.66 290.0 -50 50 120.85 122.16 1.31 1.36
124.82 127.82 3.00 1.51
Incl. 126.32 127.82 1.50 2.88
139.79 140.17 0.38 1.26
154.58 154.72 0.14 11.55
285.65 286.55 0.90 0.19
291.77 293.32 1.55 0.46
EQ004 22707 26182.7 386.7 325.0 50 50 114.09 119.42 5.33 1.32
Incl. 118.40 119.42 1.02 6.68
127.09 135.75 8.66 0.45
Incl. 135.06 135.75 0.69 5.37
173.33 181.54 8.21 1.13
Incl. 173.33 173.82 0.49 17.60
Incl. 180.90 181.54 0.64 0.95
223.46 224.16 0.70 0.39
310.20 310.38 0.18 0.73
318.76 325.30 6.54 0.14
EQ005 22665 26187.6 387.0 327.3 -58 50 115.67 118.37 2.70 0.50
Incl. 115.67 115.87 0.20 5.32
Incl. 118.30 118.37 0.07 4.13
141.81 145.47 3.66 0.28
Incl. 145.31 145.47 0.16 6.02
154.24 156.98 2.74 0.35

MT CARBINE GEOLOGY AND MINERAL RESOURCE ESTIMATE
EQ RESOURCES PTY LTD
measuredgroup.com.au 109
Hole ID East North Rl EOH Dip Azm (TN) From To Interval WO3 %
Incl. 154.56 154.71 0.15 5.85
174.00 174.89 0.89 0.25
Incl. 174.58 174.89 0.31 0.57
212.22 213.92 1.70 0.13
Incl. 213.59 213.92 0.33 0.64
217.46 219.60 2.14 0.18
Incl. 217.90 218.11 0.21 1.43
300.98 301.45 0.47 0.21
EQ006 22,873 26,202 383.90 -48 50 123.37 127.72 4.35 1.31
Incl. 124.08 124.62 0.54 8.03
Incl. 127.26 127.72 0.46 2.71
131.00 135.12 4.12 0.53
Incl. 131.00 132.24 1.24 1.00
150.30 152.41 2.11 0.56
Incl. 152.36 152.41 0.05 20.05
162.30 163.65 1.35 2.37
Incl. 162.30 162.41 0.11 1.82
Incl. 163.17 163.65 0.48 6.14
253.06 253.39 0.33 2.48
267.31 270.19 2.88 0.38
Incl. 267.31 267.50 0.19 3.83
278.28 281.98 3.70 0.78
Incl. 281.77 281.98 0.21 12.93
287.17 290.44 3.27 0.33
Incl. 287.17 287.32 0.15 7.14
EQ007 23017 26329 365.0 48.0 -45 230 28.35 28.50 0.15 7.97
EQ008 23017 26329 365.0 60.5 230 47.70 50.20 2.50 0.31
Incl. 47.70 47.87 0.17 0.78
Incl. 50.09 50.20 0.11 1.58
EQ009 23017 26329.0 365.0 171.5 -60 50 34.40 35.00 0.60 0.31
Incl. 34.40 34.45 0.05 2.72
43.60 45.78 2.18 0.44
Incl. 45.26 45.55 0.29 2.84
53.24 53.41 0.17 0.86
80.39 83.22 2.83 0.67
101.96 104.57 2.61 0.41
Incl. 101.96 102.10 0.14 6.47
Incl. 104.46 104.57 0.11 1.33
125.90 127.30 1.40 0.60
Incl. 126.91 126.98 0.07 9.50
148.62 149.65 1.03 0.21

MT CARBINE GEOLOGY AND MINERAL RESOURCE ESTIMATE
EQ RESOURCES PTY LTD
measuredgroup.com.au 110
Hole ID East North Rl EOH Dip Azm (TN) From To Interval WO3 %
Incl. 148.62 148.68 0.06 2.71
161.04 161.25 0.21 0.28
EQ010 22656.8 26177.0 243.3 245.0 -45 50 136.92 139.16 2.24 0.27
Incl. 139.04 139.16 0.12 4.99
156.84 159.45 2.61 0.21
Incl. 158.37 159.45 1.08 0.50
167.51 171.11 3.60 0.32
Incl. 167.51 168.05 0.54 2.08
173.49 182.16 8.67 0.30
Incl. 181.23 182.16 0.93 2.59
EQ011 22765.4 26173.4 285.3 285.3 -45 51 118.48 119.06 0.58 2.26
137.38 138.52 1.14 0.43
141.55 141.70 0.15 6.36
144.95 145.47 0.52 2.08
176.67 176.93 0.26 3.31
222.53 223.20 0.67 4.22
EQ012 22624.1 26185.8 414.6 412.0 -45 50 111.46 113.60 2.14 0.53
Incl. 111.46 111.73 0.27 4.10
137.82 141.66 3.84 0.32
Incl. 138.88 139.01 0.13 5.90
141.50 141.66 0.16 2.53
327.11 328.78 1.67 3.28
Incl. 327.11 328.34 1.23 5.44
346.41 349.59 3.18 0.67
Incl. 346.41 346.78 0.37 4.33
382.08 385.21 3.13 1.93
Incl. 383.21 384.21 1.00 5.92
EQ013 22910.8 26189.7 294.2 294.2 -45 48 135.95 148.87 12.92 0.59
Incl. 135.95 136.65 0.70 1.02
140.46 140.61 0.15 3.95
148.39 148.87 0.48 12.40
165.76 170.85 5.09 1.41
Incl. 165.76 166.64 0.88 3.42
170.67 170.85 0.18 15.55
257.12 266.13 9.01 0.38
Incl. 257.12 257.94 0.82 2.49
265.77 266.13 0.36 3.43
277.00 284.18 7.18 1.42
Incl. 277.00 277.30 0.30 3.61
282.90 284.18 1.28 6.96
EQ014 22957.0 26203.6 300.4 300.4 -45 45 133.32 143.03 9.71 0.53

MT CARBINE GEOLOGY AND MINERAL RESOURCE ESTIMATE
EQ RESOURCES PTY LTD
measuredgroup.com.au 111
Hole ID East North Rl EOH Dip Azm (TN) From To Interval WO3 %
Incl. 134.18 134.47 0.29 2.92
139.20 139.44 0.24 13.90
142.78 143.03 0.25 3.25
146.35 150.40 4.05 1.41
Incl. 146.35 146.70 0.35 1.65
150.08 150.40 0.32 16.10
159.74 165.04 5.30 0.66
Incl. 159.74 160.12 0.38 2.55
162.41 162.85 0.44 4.87
164.90 165.04 2.25 1.79
261.05 263.30 2.25 1.72
Incl. 261.05 261.40 0.35 8.02
263.13 263.30 0.17 6.09
EQ015 22841.1 26177.6 306.3 306.3 -45 50 138.79 147.90 9.11 1.21
Incl. 139.87 140.91 1.04 2.35
144.77 145.14 0.37 20.00
156.35 160.80 4.45 5.09
Incl. 156.35 156.81 0.46 10.80
156.81 157.11 0.30 1.27
158.13 158.46 0.33 7.57
159.74 160.80 1.06 13.85
199.29 209.99 10.70 0.93
Incl. 199.29 199.86 0.57 14.15
207.23 207.62 0.39 3.12
209.88 209.99 0.11 5.63
245.85 252.88 7.03 0.33
Incl. 245.85 246.35 0.50 1.15
247.71 248.11 0.40 1.86
252.64 252.88 0.24 4.04
263.74 268.90 5.16 1.18
Incl. 263.74 264.00 0.26 1.24
264.62 265.32 0.70 7.03
268.57 268.90 0.33 2.47
282.51 290.45 7.94 0.26
Incl. 282.51 283.15 0.64 2.97
EQ016 23053 26305 380.4 48.4 -45 230 No Significant Results
- Intervals represent downhole depths, not true thickness with no applied upper cut
- Results are shown where weighted averages are greater than 2m @ 0.25% WO3

MT CARBINE GEOLOGY AND MINERAL RESOURCE ESTIMATE
EQ RESOURCES PTY LTD
measuredgroup.com.au 112
APPENDIX D: Petrology Study report

MT CARBINE GEOLOGY AND MINERAL RESOURCE ESTIMATE
EQ RESOURCES PTY LTD
measuredgroup.com.au 113
Table E 1: Summary of Petrological Study of Mt Carbine Geology
EQ RESOURCES MT CARBINE PROJECT - PETROGRAPHIC REVIEW (PTEROSAUR PETROLOGY 2021)SECTION SAMPLE CORE HOLE ID FROM m TO m Lithology
HOST ROCK
MINERALS
VEINS / FRACTURE
INFILL Event 1
WALLROCK
ALTERATION E1
VEINS / FRACTURE
INFILL Event 2
WALLROCK
ALTERATION E2
VEINS / FRACTURE
INFILL Event 3
WALLROCK
ALTERATION E3
VEINS / FRACTURE
INFILL Event 4
WALLROCK
ALTERATION E4
TS2109-4.1 MCP01 HQ EQ010 162.50 162.73 Veined & altered hornfelsed
phyllite
Ms-Qz-Bt Qz ?Chl Sau-Tur-Po Ser-Si-Chl-Tur-Po-
(Ccp-Asp)
Qz-Cal Cal-(Py)
TS2109-4.2 MCP02 HQ EQ006 109.60 109.70 Complex milled breccia of
dacite dyke(?)
Qz-Pl-Kfs 3x Breccia cement:
Si-(FeOx)
(Py) 1x Breccia cement:
Sau-Ep-Tur
Qz-Cal-(Ccp-Po-Sp) (Cal-Ccp-Po-Sp) Qz
TS2109-4.3 MCP03 HQ EQ012 37.30 37.50 Complexly veined & altered
pelitic phyllite
Ms-Qz Qz-Si-(Ttn) ?Chl Breccia cement:
Chl-Sau-Si
Chl-Tur? Sau-Ep-Py-Po-Ccp-Sp (Po-Ccp-Sp) Py-Sd-Chl
TS2109-4.4 MCP04 HQ EQ012 40.90 41.18 Brecciated & cemented latite
dyke(?)
Qz-Pl-Kfs Breccia cement: Si Breccia cement:
Si-Sau-Chl-Py
Sau-Chl-Si-(Asp-Ccp-
Gn?)
Cal-Py Py
TS2109-4.5 MCP05 HQ EQ012 96.12 96.24 Tourmaline-fluorite altered
phyllite(?)
?Ms-(Qz)? Qz-Ap-(Tur) Tur-Fl-(?Ccp-Asp-Po) Breccia cement: Si Sau-Cal-Py-(Ccp-Sp) (Ccp-Sp-Asp-Gn?)
TS2109-4.6 MCP06 HQ EQ013 137.80 138.20 Brecciated altered hornfelsed
phyllite
Ms-Qz-And Qz ?Chl-Tur Sau-Ep-Chl-Si-(Ttn) Qz-Si-(Py-Ccp-Sp) (Py-Ccp-Sp, Po-Sd)
TS2109-4.7 MCP07 HQ? EQ013 208.32 208.55 Veined & altered hornfelsed
phyllite
Ms-Qz-And Qz ?Chl-Tur Sau-Chl-(Qz-Po) Po-(Ccp-Sp) Sau-Qz-Py Py Py
TS2109-4.8 MCP08 HQ? EQ014 127.80 127.96 Fractured & veined psammitic
phyllite
Qz-Ms Qz ?Chl-Tur Sau-Chl-(Ep-Qz-Po) (Po-Ccp-Sp) Cal-Qz Py-(Chl) + Py
TS2109-4.9 MCP09 HQ EQ014 166.81 167.12 Skarn-altered psammite Qz-Ms-(Cal?) Qz ?Chl Grs-Ves-Czo-(Qz-Si) Grs-Czo-Chl-(Po) Cal-Ep-Qz-(Po-Ccp-
Sp-Asp)
Cal-Ch-Qz-Ep-Ms-(Po)
TS2109-4.10 MCP10 NQ EQ015 46.62 46.71 Sheared, veined & altered
meta-basalt(?)
Act-Sau Qz-Chl ?Chl Act-Czo-Qz-Chl-Po-Py Sau-Chl-Po-(Ccp-Asp) Chl-Po-(Cal) Chl-Po Py
TS2109-4.11 MCP11 NQ EQ015 49.61 49.68 Sheared, veined & altered
psammo-pelitic phyllite
Ms-Qz Qz ?Chl-(Tur) Sau-Chl-(Ttn) Sau-Chl ? Qz-Chl-Cal-Py-(Ccp) Chl-Cal-Py-(Asp) Py
TS2109-4.12a MCP12 NQ EQ015 159.74 160.80 Scheelite-sphalerite veined
albite
Ab vein Sch-Sp-Chl Chl Py-Cal-(Po-Asp-Ccp) Chl-Py
TS2109-4.12b MCP12 NQ EQ015 159.74 160.80 Sphalerite-scheelite veined
adularia
Adl-Qz vein Sp-Sch (Ab?) Cal-Chl-Py-Po-(Ccp) Cal-Py-Qz-Chl-(Asp-
Mrc?)
TS2109-4.13 MCP13 NQ EQ012 306.25 306.40 Veined & altered, hornfelsed
phyllite
Qz-Ms-Bt Qz Tur-Ttn-(Po-Sau) Tur Qz-Chl-Ep (Ccp-Asp)
TS2109-4.14 MCP14 HQ EQ010 189.48 189.64 Scheelite veined & altered
phyllite
Ms-Qz Qz-Ccp-(Sp-Asp) Chl? Tur-Chl-Po-Sau Tur-Chl-Po-(Sau) Sch-Chl-Fl Chl
TS2109-4.15 MCP15 NQ EQ012 279.75 279.90 Zeolite-calcite veined quartz Qz-(Ap?) vein Zeo? Cal-Qz-(Ms-Sch?)
Abbrev. Mineral (trace levels) Sau Saussurite
Ab Albite Ccp Chalcopyrite Kfs K-feldspar Sch Scheelite
Act Actinolite Chl Chlorite Ms Muscovite Sd Siderite
Adl Adularia Czo Clinozoisite Mrc Marcasite Ser Sericite
And Andalusite Ep Epidote Pl Plagioclase Si Micro-silica (& cristobalite?)
Ap Apatite FeOx Iron-oxide Po Pyrrhotite Sp Sphalerite
Asp Arsenopyrite Fl Flourite Py Pyrite Ttn Titanite
Bt Biotite Gn Galena Qz Quartz Tur Tourmaline
Cal Calcite Grs Grossular garnet Rt Rutile Zeo Zeolite

MT CARBINE GEOLOGY AND MINERAL RESOURCE ESTIMATE
EQ RESOURCES PTY LTD
measuredgroup.com.au 114
Petrological Sample Results
Sample MCP01
Rock Type Hole ID From To
Chert with qz/scheelite/sulphides and black and green minerals EQ010 162.5 162.73
Sample MCP02
Rock Type Hole ID From To
Chert in hanging wall EQ006 109.6 109.7
Sample MCP03
Rock Type Hole ID From To
Metavolcanics/metasediment/chert mixture? in hanging wall EQ012 37.3 37.5

MT CARBINE GEOLOGY AND MINERAL RESOURCE ESTIMATE
EQ RESOURCES PTY LTD
measuredgroup.com.au 115
Sample MCP04
Rock Type Hole ID From To
Felsite dyke containing spotty black mineral with haloes EQ012 40.94 41.18
Sample MCP05
Rock Type Hole ID From To
Qz vein with dravite and fluorapatite? EQ012 96.12 96.24
Sample MCP06
Rock Type Hole ID From To
Metavolcanics/metasediment? In hanging wall EQ013 137.8 138.2

MT CARBINE GEOLOGY AND MINERAL RESOURCE ESTIMATE
EQ RESOURCES PTY LTD
measuredgroup.com.au 116
Sample MCP07
Rock Type Hole ID From To
Metasediment with spotty black mineral EQ013 208.32 208.55
Sample MCP08
Rock Type Hole ID From To
Metasediments? in footwall EQ014 127.8 127.96
Sample MCP09
Rock Type Hole ID From To
Potassic alteration EQ014 166.81 167.12

MT CARBINE GEOLOGY AND MINERAL RESOURCE ESTIMATE
EQ RESOURCES PTY LTD
measuredgroup.com.au 117
Sample MCP10
Rock Type Hole ID From To
Metavolcanics in footwall EQ015 46.62 46.71
Sample MCP11
Rock Type Hole ID From To
Metasediment + chert in footwall EQ015 49.61 49.68
Sample MCP12
Rock Type Hole ID From To
Mineralised vein with altered k-feldspar EQ015 159.74 160.8

MT CARBINE GEOLOGY AND MINERAL RESOURCE ESTIMATE
EQ RESOURCES PTY LTD
measuredgroup.com.au 118
Sample MCP13
Rock Type Hole ID From To
Metasediment EQ012 306.25 306.4
Sample MCP14
Rock Type Hole ID From To
Metasediment + chert with scheelite EQ010 189.48 189.64
Sample MCP15
Rock Type Hole ID From To
Grey/blue Qz vein with minor scheelite/fluorapatite EQ012 279.75 279.9

MT CARBINE GEOLOGY AND MINERAL RESOURCE ESTIMATE
EQ RESOURCES PTY LTD
measuredgroup.com.au 119
Example of Petrological Study on Rock Types and Mineralisation.

MT CARBINE GEOLOGY AND MINERAL RESOURCE ESTIMATE
EQ RESOURCES PTY LTD
measuredgroup.com.au 120

MT CARBINE GEOLOGY AND MINERAL RESOURCE ESTIMATE
EQ RESOURCES PTY LTD
measuredgroup.com.au 121

MT CARBINE GEOLOGY AND MINERAL RESOURCE ESTIMATE
EQ RESOURCES PTY LTD
measuredgroup.com.au 122

MT CARBINE GEOLOGY AND MINERAL RESOURCE ESTIMATE
EQ RESOURCES PTY LTD
measuredgroup.com.au 123

MT CARBINE GEOLOGY AND MINERAL RESOURCE ESTIMATE
EQ RESOURCES PTY LTD
measuredgroup.com.au 124

MT CARBINE GEOLOGY AND MINERAL RESOURCE ESTIMATE
EQ RESOURCES PTY LTD
measuredgroup.com.au 125

MT CARBINE GEOLOGY AND MINERAL RESOURCE ESTIMATE
EQ RESOURCES PTY LTD
measuredgroup.com.au 126

MT CARBINE GEOLOGY AND MINERAL RESOURCE ESTIMATE
EQ RESOURCES PTY LTD
measuredgroup.com.au 127
APPENDIX E: QA/QC Assay Results
Table F 1: Assay for Blanks
Hole_ID Sample No Blank Type WO3%
EQ001 100033 Blank Core 0.005044
EQ001 100063 Blank Core 0.001261
EQ001 100083 Blank Core 0.001261
EQ001 100103 Blank Core 0
EQ002 100137 Blank Core 0.001261
EQ002 100157 Blank Core 0
EQ002 100177 Blank Core 0.002522
EQ003 100379 Blank Core 0.002
EQ003 100399 Blank Core 0.002
EQ003 100419 Blank Core 0.002
EQ003 100439 Blank Core 0.001
EQ003 100459 Blank Core <0.001
EQ003 100479 Blank Core 0.001
EQ003 100499 Blank Core 0.001
EQ004 100526 Blank Core 0.003
EQ004 100546 Blank Core 0.003
EQ004 100566 Blank Core <0.001
EQ004 100586 Blank Core 0.004
EQ004 100606 Blank Core <0.001
EQ004 100626 Blank Core 0.002
EQ005 100663 Blank 1058 0.001% WO3 0.004
EQ005 100683 Blank 1058 0.001% WO3 0.004
EQ005 100703 Blank 1058 0.001% WO3 0.004
EQ005 100723 Blank Core 0.004
EQ005 100743 Blank 1058 0.001% WO3 0.001
EQ005 100763 Blank 1058 0.001% WO3 0.003
EQ006 100211 Blank Core 0.001261
EQ006 100231 Blank Core 0.003783
EQ006 100251 Blank Core 0.002522
EQ006 100271 Blank Core 0.001261
EQ006 100291 Blank Core 0.001261
EQ006 100311 Blank Core 0.003783
EQ006 100331 Blank Core 0.005044
EQ006 100351 Blank Core 0.003783
EQ007 100798 Blank Core 0.02
EQ007 100818 Blank Core 0.009
EQ008 100853 Blank Core 0.008
EQ009 100897 Blank 1083 0.003% WO3 0.001
EQ009 100907 Blank 1083 0.003% WO3 0.005
EQ009 100927 Blank 1083 0.003% WO3 0.003
EQ009 100947 Blank 1083 0.003% WO3 0.005
EQ009 100967 Blank 1083 0.003% WO3 0.001
EQ010 100995 Blank 1083 0.003% WO3 0.002
EQ010 101015 Blank Core 0.003
EQ010 101035 Blank Core 0.003
EQ010 101091 Blank Core <0.001
EQ011 101122 Blank 1031 0.002% WO3 0.001
EQ011 101132 Blank 1031 0.002% WO3 0.007
EQ011 101152 Blank 1031 0.002% WO3 0.002
EQ011 101172 Blank 1031 0.002% WO3 0.001
EQ012 101207 Blank 1031 0.002% WO3 0.009
EQ012 101227 Blank 1031 0.002% WO3 0.003
EQ012 101247 Blank 1031 0.002% WO3 0.004
EQ012 101267 Blank 1031 0.002% WO3 0.004
EQ012 101287 Blank Core 0.002
EQ012 101307 Blank 1031 0.002% WO3 0.002
EQ012 101056 Blank Core 0.024
EQ013 101339 Blank Core 0.001
EQ013 101359 Blank Core 0.002
EQ013 101379 Blank Core <0.001
EQ014 101406 Blank Core <0.001
EQ014 101426 Blank Core <0.001
EQ014 101446 Blank Core 0.002
EQ015 101472 Blank Core 0.002
EQ015 101492 Blank Core <0.001
EQ015 101512 Blank Core 0.002
EQ015 101532 Blank Core <0.001

MT CARBINE GEOLOGY AND MINERAL RESOURCE ESTIMATE
EQ RESOURCES PTY LTD
measuredgroup.com.au 128
Table F 2: Tungsten Assay for Standards
Hole_ID Sample NoPrevious
sample No
Previous
grade (ME-
XRF15b)
WO3% (ME-
XRF15b)error
EQ001 100023 1014 0.688 0.692 0.004
EQ001 100043 1052 0.046 0.044 -0.002
EQ001 100053 1047 2.850 2.875 0.025
EQ001 100073 1052 0.046 0.043 -0.003
EQ001 100093 1052 0.046 0.044 -0.002
EQ001 100113 1052 0.046 0.044 -0.002
EQ002 100127 1043 0.206 0.207 0.001
EQ002 100147 1026 0.366 0.361 -0.005
EQ002 100167 1026 0.366 0.364 -0.002
EQ002 100187 1043 0.206 0.207 0.001
EQ003 100369 1003 4.320 4.300 -0.020
EQ003 100389 1043 0.206 0.204 -0.002
EQ003 100409 1026 0.366 0.366 0.000
EQ003 100429 1026 0.366 0.372 0.006
EQ003 100449 1043 0.206 0.205 -0.001
EQ003 100469 1026 0.366 0.367 0.001
EQ003 100489 1026 0.366 0.372 0.006
EQ004 100516 1003 4.320 4.320 0.000
EQ004 100536 1026 0.366 0.362 -0.004
EQ004 100556 1026 0.366 0.370 0.004
EQ004 100576 1043 0.206 0.207 0.001
EQ004 100596 1026 0.366 0.369 0.003
EQ004 100616 1026 0.366 0.363 -0.003
EQ004 100636 1034 0.444 0.431 -0.013
EQ005 100653 1024 0.128 0.126 -0.002
EQ005 100673 1024 0.128 0.130 0.002
EQ005 100693 1024 0.128 0.126 -0.002
EQ005 100713 1024 0.128 0.128 0.000
EQ005 100733 1023 1.595 1.595 0.000
EQ005 100753 1024 0.128 0.124 -0.004
EQ005 100773 1023 1.595 1.585 -0.010
EQ006 100201 1003 4.320 4.338 0.018
EQ006 100221 1026 0.366 0.366 0.000
EQ006 100241 1026 0.366 0.357 -0.009
EQ006 100261 1026 0.366 0.362 -0.004
EQ006 100281 1026 0.366 0.357 -0.009
EQ006 100301 1043 0.206 0.207 0.001
EQ006 100321 1026 0.366 0.358 -0.008
EQ006 100341 1003 4.320 4.275 -0.045
EQ007 100788 1024 0.128 0.122 -0.006
EQ007 100808 1122 0.108 0.099 -0.009
EQ007 100828 1122 0.108 0.102 -0.006
EQ008 100843 1122 0.108 0.100 -0.008
EQ008 100863 1099 0.110 0.105 -0.005
EQ009 100877 1023 1.595 1.585 -0.010
EQ009 100887 1017 1.885 1.880 -0.005
EQ009 100917 1099 0.110 0.102 -0.008
EQ009 100937 1099 0.110 0.102 -0.008
EQ009 100957 1023 1.595 1.575 -0.020
EQ010 100985 1072 0.146 0.144 -0.002
EQ010 101005 1023 1.595 1.570 -0.025
EQ010 101025 1072 0.146 0.140 -0.006
EQ010 101081 1074 0.251 0.243 -0.008
EQ011 101102 1009 0.855 0.837 -0.018
EQ011 101112 1023 1.595 1.575 -0.020
EQ011 101142 1016 0.047 0.050 0.003
EQ011 101162 1016 0.047 0.050 0.003
EQ011 101182 1038 0.031 0.031 0.000
EQ012 101197 1038 0.031 0.031 0.000
EQ012 101217 1016 0.047 0.048 0.001
EQ012 101237 1038 0.031 0.030 -0.001
EQ012 101257 1016 0.047 0.052 0.005
EQ012 101277 1038 0.031 0.031 0.000
EQ012 101297 1038 0.031 0.033 0.002
EQ012 101317 1038 0.031 0.033 0.002
EQ012 101046 1023 1.595 1.575 -0.020
EQ012 101066 1074 0.251 0.244 -0.007
EQ013 101329 1038 0.031 0.038 0.007
EQ013 101349 1038 0.031 0.031 0.000
EQ013 101369 1006 3.090 3.060 -0.030
EQ014 101396 100186 1.419 1.420 0.001
EQ014 101416 100138 0.453 0.468 0.015
EQ014 101436 100138 0.453 0.457 0.004
EQ015 101462 100138 0.453 0.455 0.002
EQ015 101482 100186 1.419 1.420 0.001
EQ015 101502 100138 0.453 0.456 0.003
EQ015 101522 100138 0.453 0.453 0.000
EQ015 101542 100138 0.453 0.452 -0.001
EQ016 101555 100138 0.453 0.456 0.003

MT CARBINE GEOLOGY AND MINERAL RESOURCE ESTIMATE
EQ RESOURCES PTY LTD
measuredgroup.com.au 129
APPENDIX F: QA/QC for Survey

MT CARBINE GEOLOGY AND MINERAL RESOURCE ESTIMATE
EQ RESOURCES PTY LTD
measuredgroup.com.au 130
LIDAR Survey Report

MT CARBINE GEOLOGY AND MINERAL RESOURCE ESTIMATE
EQ RESOURCES PTY LTD
measuredgroup.com.au 131
LIDAR Survey Area

MT CARBINE GEOLOGY AND MINERAL RESOURCE ESTIMATE
EQ RESOURCES PTY LTD
measuredgroup.com.au 132
Survey Stations & Local Grid Conversion

MT CARBINE GEOLOGY AND MINERAL RESOURCE ESTIMATE
EQ RESOURCES PTY LTD
measuredgroup.com.au 133

MT CARBINE GEOLOGY AND MINERAL RESOURCE ESTIMATE
EQ RESOURCES PTY LTD
measuredgroup.com.au 134
APPENDIX G: QA/QC Analysis of Standards
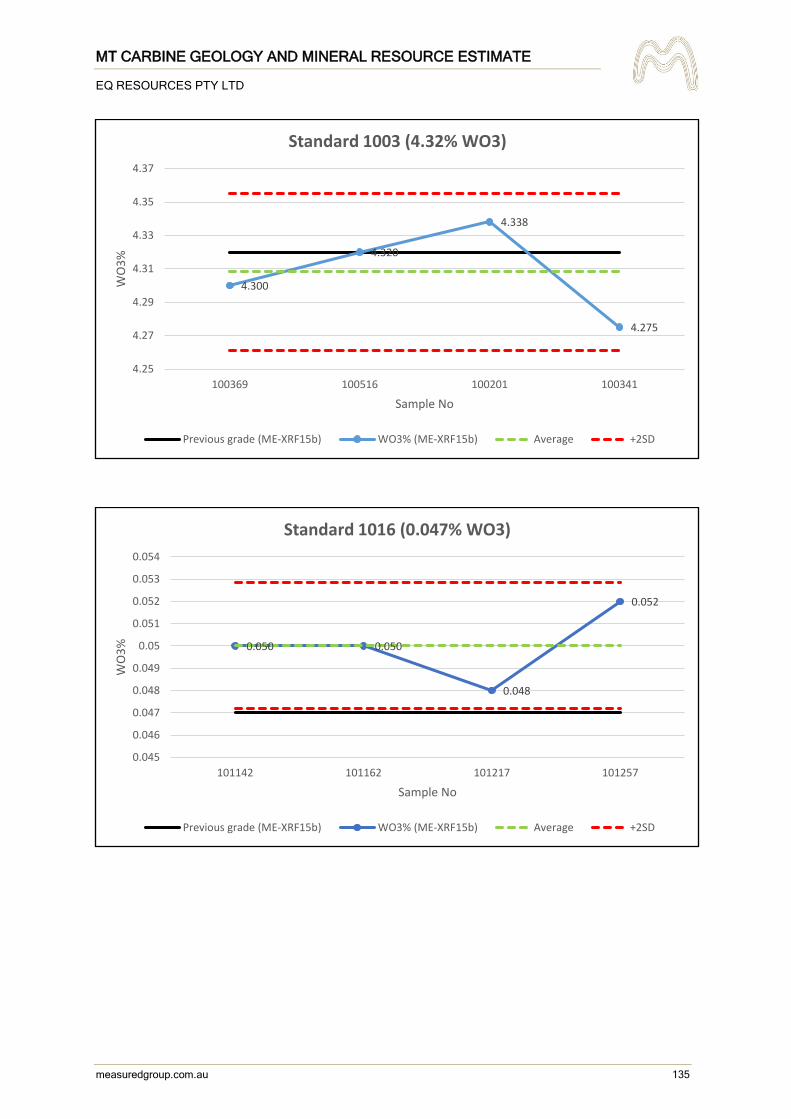
MT CARBINE GEOLOGY AND MINERAL RESOURCE ESTIMATE
EQ RESOURCES PTY LTD
measuredgroup.com.au 135
4.300
4.320
4.338
4.275
4.25
4.27
4.29
4.31
4.33
4.35
4.37
100369 100516 100201 100341
WO
3%
Sample No
Standard 1003 (4.32% WO3)
Previous grade (ME-XRF15b) WO3% (ME-XRF15b) Average +2SD
0.050 0.050
0.048
0.052
0.045
0.046
0.047
0.048
0.049
0.05
0.051
0.052
0.053
0.054
101142 101162 101217 101257
WO
3%
Sample No
Standard 1016 (0.047% WO3)
Previous grade (ME-XRF15b) WO3% (ME-XRF15b) Average +2SD

MT CARBINE GEOLOGY AND MINERAL RESOURCE ESTIMATE
EQ RESOURCES PTY LTD
measuredgroup.com.au 136
1.595
1.585 1.585
1.575
1.570
1.575 1.575
1.55
1.555
1.56
1.565
1.57
1.575
1.58
1.585
1.59
1.595
1.6
100733 100773 100877 100957 101005 101112 101046
WO
3 %
Sample No
Standard 1023 (1.595% WO3)
Previous grade (ME-XRF15b) WO3% (ME-XRF15b) Average +2SD
0.126
0.130
0.126
0.128
0.124
0.122
0.118
0.12
0.122
0.124
0.126
0.128
0.13
0.132
100653 100673 100693 100713 100753 100788
WO
3 %
Sample No
Standard 1024 (0.128% WO3)
Previous grade (ME-XRF15b) WO3% (ME-XRF15b) Average +2SD

MT CARBINE GEOLOGY AND MINERAL RESOURCE ESTIMATE
EQ RESOURCES PTY LTD
measuredgroup.com.au 137
0.361
0.3640.366
0.372
0.367
0.372
0.362
0.370 0.369
0.363
0.366
0.357
0.362
0.3570.358
0.35
0.355
0.36
0.365
0.37
0.375
0.38
WO
3%
Sample No
Standard 1026 (0.366% WO3)
Previous grade (ME-XRF15b) WO3% (ME-XRF15b) Average +2SD
0.031 0.0310.030
0.031
0.033 0.033
0.038
0.031
0.023
0.025
0.027
0.029
0.031
0.033
0.035
0.037
0.039
101182 101197 101237 101277 101297 101317 101329 101349
WO
3 %
Sample No
Standard 1038 (0.031% WO3)
Previous grade (ME-XRF15b) WO3% (ME-XRF15b) Average +2SD

MT CARBINE GEOLOGY AND MINERAL RESOURCE ESTIMATE
EQ RESOURCES PTY LTD
measuredgroup.com.au 138
0.207 0.207
0.204
0.205
0.207 0.207
0.202
0.203
0.204
0.205
0.206
0.207
0.208
0.209
100127 100187 100389 100449 100576 100301
WO
3 %
Sample No
Standard 1043 (0.206% WO3)
Previous grade (ME-XRF15b) WO3% (ME-XRF15b) Average +2SD
0.044
0.043
0.044 0.044
0.041
0.042
0.043
0.044
0.045
0.046
0.047
100043 100073 100093 100113
WO
3 %
Sample No
Standard 1052 (0.046% WO3)
Previous grade (ME-XRF15b) WO3% (ME-XRF15b) Average +2SD

MT CARBINE GEOLOGY AND MINERAL RESOURCE ESTIMATE
EQ RESOURCES PTY LTD
measuredgroup.com.au 139
1.420 1.420
1.418
1.419
1.420
1.421
101396 101482
WO
3 %
Sample No
Standard 100186 (1.419% WO3)
Previous grade (ME-XRF15b) WO3% (ME-XRF15b) Average
0.105
0.102 0.102
0.098
0.1
0.102
0.104
0.106
0.108
0.11
0.112
100863 100917 100937
WO
3 %
Sample No
Standard 1099 (0.11% WO3)
Previous grade (ME-XRF15b) WO3% (ME-XRF15b) Average +2SD

MT CARBINE GEOLOGY AND MINERAL RESOURCE ESTIMATE
EQ RESOURCES PTY LTD
measuredgroup.com.au 140
APPENDIX H: Multi-Element Statistics for Mt Carbine

MT CARBINE GEOLOGY AND MINERAL RESOURCE ESTIMATE
EQ RESOURCES PTY LTD
measuredgroup.com.au 141
Domain Eleement Count Length MeanStandard
deviation
Coefficient
of variationVariance Minimum
Lower
quartileMedian
Upper
quartileMaximum
Al2O3 48 24.35 14.382 4.216 0.293 17.778 3 12.9 15.7 16.95 23.2
As 39 18.43 0.042 0.063 1.510 0.004 0.01 0.01 0.01 0.03 0.27
BaO 46 23.54 0.053 0.020 0.367 0.000 0.01 0.04 0.05 0.07 0.11
Bi 7 3.37 0.027 0.020 0.746 0.000 0.01 0.02 0.02 0.03 0.08
CaO 48 24.35 1.402 0.533 0.381 0.285 0.39 1.11 1.36 1.68 2.86
CeO2 24 12.21 0.011 0.003 0.292 0.000 0.01 0.01 0.01 0.01 0.02
Co 0 0 0 0 0 0 0 0 0 0 0
Cr 1 0.44 0.030 0.03 0.03 0.03 0.03 0.03
Cu 37 18.01 0.017 0.045 2.610 0.002 0.005 0.006 0.007 0.014 0.335
Fe 48 24.35 3.512 0.930 0.265 0.865 1.24 3.15 3.69 3.93 7.73
HfO2 0 0 0 0 0 0 0 0 0 0 0
K2O 47 23.86 3.117 1.065 0.342 1.134 0.59 2.8 3.33 3.8 5.72
La2O3 25 12.76 0.010 0.000 0.000 0.000 0.01 0.01 0.01 0.01 0.01
MgO 48 24.35 1.607 0.847 0.527 0.717 0.29 1.3 1.71 1.88 6.62
Mn 48 24.35 0.071 0.022 0.308 0.000 0.02 0.06 0.07 0.09 0.14
Mo 4 1.08 0.019 0.021 1.109 0.000 0.007 0.007 0.008 0.022 0.05
Nb 1 1.17 0.007 0.007 0.007 0.007 0.007 0.007
Ni 4 2.67 0.007 0.002 0.233 0.000 0.006 0.006 0.006 0.006 0.009
P2O5 48 24.35 0.244 0.278 1.139 0.077 0.09 0.12 0.14 0.25 1.54
Pb 4 0.9 0.019 0.019 0.966 0.000 0.005 0.005 0.016 0.041 0.041
Rb 46 23.06 0.031 0.014 0.444 0.000 0.006 0.026 0.03 0.037 0.106
S 48 24.35 0.158 0.424 2.682 0.180 0.02 0.05 0.07 0.14 3.59
Sb 1 0.24 0.007 0.007 0.007 0.007 0.007 0.007
SiO2 48 24.35 68.171 8.393 0.123 70.450 52.3 63.1 65.8 69.7 92.3
Sn 41 21.77 0.009 0.003 0.321 0.000 0.005 0.008 0.009 0.012 0.022
Sr 43 21.66 0.016 0.007 0.441 0.000 0.01 0.01 0.01 0.02 0.03
TiO2 48 24.35 0.503 0.161 0.320 0.026 0.1 0.42 0.57 0.62 0.68
V 34 18.37 0.010 0.000 0.000 0.000 0.01 0.01 0.01 0.01 0.01
W 43 21.85 0.087 0.257 2.943 0.066 0.001 0.002 0.004 0.027 1.125
Y2O3 31 14.64 0.006 0.001 0.164 0.000 0.005 0.005 0.006 0.007 0.01
Zn 46 23.23 0.016 0.016 1.010 0.000 0.005 0.01 0.011 0.016 0.135
Zr 45 22.71 0.013 0.004 0.353 0.000 0.01 0.01 0.01 0.02 0.02
Al2O3 110 79.19 16.015 1.937 0.121 3.751 4.58 15.7 16.3 17.05 19.2
As 79 55.04 0.030 0.059 1.971 0.003 0.01 0.01 0.02 0.02 0.43
BaO 109 78.96 0.051 0.013 0.248 0.000 0.01 0.04 0.05 0.06 0.09
Bi 3 2.06 0.010 0.000 0.000 0.000 0.01 0.01 0.01 0.01 0.01
CaO 110 79.19 1.192 0.428 0.359 0.183 0.53 0.93 1.12 1.32 4.05
CeO2 69 48.38 0.010 0.001 0.134 0.000 0.01 0.01 0.01 0.01 0.02
Co 0 0 0 0 0 0 0 0 0 0 0
Cr 3 1.42 0.012 0.006 0.468 0.000 0.01 0.01 0.01 0.01 0.02
Cu 75 52.15 0.011 0.015 1.302 0.000 0.005 0.007 0.008 0.01 0.115
Fe 110 79.19 3.759 0.516 0.137 0.266 1.88 3.66 3.79 3.96 5.65
HfO2 0 0 0 0 0 0 0 0 0 0 0
K2O 110 79.19 3.060 0.642 0.210 0.413 0.78 2.76 3.12 3.39 5.33
La2O3 67 47.77 0.010 0.001 0.065 0.000 0.01 0.01 0.01 0.01 0.02
MgO 110 79.19 1.725 0.268 0.155 0.072 0.43 1.7 1.78 1.86 2.06
Mn 110 79.19 0.075 0.020 0.262 0.000 0.05 0.06 0.07 0.09 0.21
Mo 3 1.68 0.005 0.000 0.000 0.000 0.005 0.005 0.005 0.005 0.005
Nb 3 1.66 0.006 0.002 0.446 0.000 0.005 0.005 0.005 0.005 0.01
Ni 13 7.96 0.012 0.007 0.610 0.000 0.005 0.006 0.007 0.016 0.024
P2O5 110 79.19 0.160 0.083 0.520 0.007 0.05 0.12 0.14 0.16 0.53
Pb 12 9.84 0.006 0.001 0.234 0.000 0.005 0.005 0.005 0.006 0.009
Rb 110 79.19 0.026 0.007 0.253 0.000 0.005 0.023 0.027 0.03 0.048
S 110 79.19 0.101 0.078 0.772 0.006 0.01 0.06 0.09 0.12 0.5
Sb 3 2.46 0.005 0.001 0.113 0.000 0.005 0.005 0.005 0.006 0.006
SiO2 110 79.19 65.686 3.749 0.057 14.052 58.6 64 64.9 66.4 88.5
Sn 82 57 0.008 0.003 0.335 0.000 0.005 0.006 0.007 0.009 0.019
Sr 105 76.18 0.015 0.006 0.410 0.000 0.01 0.01 0.01 0.02 0.03
TiO2 110 79.19 0.600 0.096 0.160 0.009 0.13 0.59 0.62 0.65 0.73
V 102 72.52 0.010 0.000 0.000 0.000 0.01 0.01 0.01 0.01 0.01
W 84 60.5 0.067 0.287 4.292 0.083 0.001 0.002 0.003 0.008 1.79
Y2O3 65 48.96 0.006 0.001 0.170 0.000 0.005 0.005 0.006 0.006 0.009
Zn 110 79.19 0.013 0.007 0.535 0.000 0.006 0.01 0.011 0.014 0.079
Zr 109 77.9 0.014 0.005 0.360 0.000 0.01 0.01 0.01 0.02 0.03
Al2O3 155 46.93 5.552 4.585 0.826 21.021 0.15 2.32 4.16 7.64 19.1
As 90 27.55 0.035 0.055 1.562 0.003 0.01 0.01 0.01 0.02 0.35
BaO 112 30.97 0.029 0.029 0.996 0.001 0.01 0.01 0.02 0.03 0.18
Bi 58 17.96 0.018 0.019 1.059 0.000 0.01 0.01 0.01 0.02 0.22
CaO 154 46.82 0.881 1.211 1.374 1.466 0.08 0.36 0.61 1 9.31
CeO2 13 2.32 0.010 0.000 0.000 0.000 0.01 0.01 0.01 0.01 0.01
Co 0 0 0 0 0 0 0 0 0 0 0
Cr 1 0.54 0.010 0 0 0 0.01 0.01 0.01 0.01 0.01
Cu 58 17.09 0.049 0.128 2.602 0.016 0.005 0.006 0.012 0.02 0.742
Fe 155 46.93 1.697 0.867 0.511 0.751 0.58 0.99 1.61 2.06 10.05
HfO2 3 0.36 0.010 0.000 0.000 0.000 0.01 0.01 0.01 0.01 0.01
K2O 144 45.56 1.875 2.220 1.184 4.927 0.03 0.51 1.02 2.5 13.15
La2O3 18 2.27 0.010 0.000 0.000 0.000 0.01 0.01 0.01 0.01 0.01
MgO 155 46.93 0.359 0.365 1.016 0.133 0.02 0.11 0.25 0.44 2.03
Mn 155 46.93 0.066 0.122 1.829 0.015 0.01 0.02 0.03 0.05 1.73
Mo 26 4.99 0.012 0.012 0.966 0.000 0.005 0.006 0.007 0.013 0.069
Nb 23 7.64 0.020 0.039 1.922 0.002 0.005 0.007 0.014 0.021 0.317
Ni 10 2.45 0.015 0.015 0.994 0.000 0.005 0.008 0.011 0.014 0.052
P2O5 154 46.24 0.161 0.191 1.188 0.036 0.01 0.04 0.11 0.19 1.34
Pb 62 18.08 0.009 0.009 1.007 0.000 0.005 0.005 0.006 0.011 0.119
Rb 106 31.31 0.020 0.018 0.890 0.000 0.005 0.006 0.013 0.028 0.081
S 147 44.8 0.137 0.237 1.721 0.056 0.01 0.03 0.06 0.13 2.45
Sb 10 2.47 0.007 0.001 0.196 0.000 0.005 0.006 0.008 0.008 0.01
SiO2 155 46.93 85.268 10.874 0.128 118.248 6.28 81.7 88.4 92.8 99.7
Sn 51 12.99 0.013 0.012 0.914 0.000 0.005 0.007 0.012 0.014 0.068
Sr 58 13.07 0.019 0.030 1.551 0.001 0.01 0.01 0.01 0.02 0.22
TiO2 153 45.8 0.115 0.120 1.048 0.014 0.01 0.04 0.08 0.15 0.68
V 19 3.23 0.010 0.000 0.000 0.000 0.01 0.01 0.01 0.01 0.01
W 123 34.6 0.896 2.792 3.117 7.796 0.001 0.002 0.097 0.653 39.7
Y2O3 28 6.5 0.005 0.001 0.144 0.000 0.005 0.005 0.005 0.006 0.009
Zn 84 22.03 0.016 0.037 2.284 0.001 0.005 0.006 0.007 0.01 0.203
Zr 38 8.4 0.011 0.003 0.259 0.000 0.01 0.01 0.01 0.01 0.02
Statistics of Multi-Element for Mt CarbineHo
st ro
ckHo
st +
vei
nsVe
in

Mt Carbine Bankable Feasibility Study – Chapter 3: Geology and Resources
54

Mets Ignited Final Report: Grade by Size characterisation of low-grade stockpile for ore sorting applications – Mt Carbine
Sustainable Minerals Institute 8 August 2021

Mets Ignited Final Report: Grade by Size characterisation of low-grade stockpile for ore sorting applications – Mt Carbine 2
Contents
1. Introduction ............................................................................................................................................. 4
1.1 Mt Carbine Tungsten deposit ...................................................................................................... 4
2. Sample materials .................................................................................................................................... 5
2.1 Trench 1 and Trench 2: Ore sorter trials .................................................................................... 5
2.2 Sample Pits 1 to 6: Grade by size samples ................................................................................ 6
3. Ore sorter trial results ............................................................................................................................ 9
3.1 Trench 1 and Trench 2 Mass distribution ................................................................................... 9
3.2 Trench 1 and 2 Tungsten Head Grade and Distribution ........................................................... 11
3.3 Ore Sorter Feed Grade and Tungsten Distribution................................................................... 11
4. Bulk Sample Grade by Size Results Pits 1 to 6 ................................................................................. 12
4.1 Particle Size distribution (PSD) Pits 1 to 6 ............................................................................... 12
4.2 Natural Grade by Size Results ................................................................................................. 14
5. Acknowledgements ................................................................................... Error! Bookmark not defined.
6. References ............................................................................................................................................ 24
7. Appendices ........................................................................................................................................... 24
Tables
Table 1. Ore sorter feed and undersize masses from Trenches 1 and 2 as part of the initial sorter trial. ........ 6
Table 2. Trench 1 mass and grade distribution and ore sorter feed and accept response (sorter yield) for Trench 1 as part of the initial sorter trial. ....................................................................................... 6
Table 3. Trench 2 mass and grade distribution and ore sorter feed and accept response (sorter yield) for Trench 1 as part of the initial sorter trial. ....................................................................................... 6
Table 4. Masses and particle size distribution (PSD) data for bulk samples processed at SMI-UQ from sample Pits 1 to 6 as part of the grade by size study ................................................................... 6
Table 5. Sample mass distribution, WO3 assay grade (%) and tungsten distribution for bulk samples processed at SMI-UQ from Pits 1 to 6 as part of the grade by size study .................................... 6
Table 6. Induced grade by size deportment results for head size fractions -106+75 mm, -75 +53 mm and -53 +26.5 mm each crushed to 100% passing -26.5 mm and screened to -26.5+8 mm (ore sorter feed size), -8 +1 mm and -1 mm (undersize screen sizes) ........................................................... 6
Appendices
Appendix 1: State-Wide And Cape York/NEQ Maps
Appendix 2: Digital Data Appendix: Underlying datasets and priority target areas.

Mets Ignited Final Report: Grade by Size characterisation of low-grade stockpile for ore sorting applications – Mt Carbine 3

METS IGNITED – GRADE BY SIZE RESULTS Page 4
1. Introduction
1.1 Mt Carbine Tungsten deposit
The Mt Carbine tungsten deposit is located approximately 80 km northwest of Cairns in far NE Queensland
and is amongst the largest of a cluster of Sn-W deposits related to Permian-aged felsic magmatism in the
region (Figure 1). Tungsten mineralisation in the region occurs as granite-related greisens and sheeted veins
which are hosted by Silurian to Carboniferous-aged metasediments of the Hodgkinson Formation. Signifcant
tungsten deposits include the Watershed W-Sn deposit with an in situ resource of 49.3 Mt at 0.14 % WO3 and
the Wolfram Camp W-Mo-Bi depsoit which produced 10,243 t of tungsten, molybdenum and bismuth between
1894 and 2017.
Mount Carbine was discovered in the 1880s and mined intermittantly until the main phase of operation
between 1969 and 1987 which produced 14,800 tonnes of high-grade WO3 concentrate from 10.3 million
tonnes of crushed ore (White, 2014). In 2012, the indicated and inferred hard rock resource at Mt Carbine was
47.3 Mt at 0.13 % WO3. The hard rock resource is currently undergoing a phase of further resource definition
drilling by EQ Resources. An additional resource of 4.0 Mt at 0.06 % WO3 is contained in historical ore sorter
rejects and 2.0 Mt at 0.1 % WO3 in coarse, historical tailings. The subject of this study is the low grade historical
surface stockpile with an indicated resource of 12.0 Mt at 0.075 % WO3 (White, 2014). Part of this study is to
evaluate the grade heterogeneity across the low grade stockpile based on bulk sampling and to determine the
distribution of tungsten grade across different particle sizes. The aim is to evaluate the opportunities for coarse
waste rejection and ore sorter feed characteristics for improved reprocessing of this historical low grade
material.
Figure 1: Location of the tin and tungsten dominated mineral occurrences of Queensland (From Gow and Lisitsin, 2021).

METS IGNITED – GRADE BY SIZE RESULTS Page 5
2. Sample materials
This study has involved two sampling phases from the low grade stockpile (Figure 2):
1) Two initial bulk sample trenches (Trench 1 and 2) which were crushed on site and screened prior to ore
sorting on site. Sample materials collected for characterisation included:
- Ore sorter accept material
- Ore sorter reject material
- Undersize (-8 mm) material (fines)
2) Collection of 6 bulk samples (Pits 1 to 6), each between 600 and 1,000 kg in total mass, for systematic
grade-by-size analysis involving screening and size-based assay with targeted mineralogical analysis.
Figure 2: Location of trench samples 1 and 2 for the sorter trial and Pits 1 to 6 for the grade by size assessment within the low grade stockpile at Mt Carbine.
2.1 Trench 1 and Trench 2: Ore sorter trials
Bulk materials were extrated from the low grade stockpile at locations designated as Trench 1 and Trench 2
(Figure 2; Table 1) using a front end loader. These materials were screened to remove the +160 mm material
prior to crushing on site to 100% passing 25 mm. The crushed product was screened to generate a -25 mm +
8 mm fraction (sorter feed) and -8 mm (undersize) fraction, intended to be directed to the beneficiation plant.
The total mass of the trench materials trialled were 785,000 kg and 650,000 kg for trenches 1 and 2
respectively (Table 1). The -25 +8 mm material from each trench was fed through the Tomra X-ray transmission
(XRT) ore sorter on site at Mt Carbine using the parameters outlined in Table 1.

METS IGNITED – GRADE BY SIZE RESULTS Page 6
The initial sorter trials from Trench 1 and 2 indicate that nearly 65 % of the bulk sample mass reported
to the undersize fraction (-8 mm) after crushing with the remaining 35 % of mass being directed to the sorter
at feed rates of between 23 and 29 tonnes per hour (equivalent to approximately 10 hours per sample; Table
1). These initial trials suggest that the crushing phase may have generated an excess of undersize material.
The University of Queensland was provided with representative samples from the ore sorter testwork program
to evaluate the grade distribution and elemental deportment during ore sorting. The full sorting results including
sorter yield for these trench samples are discussed in Section 3.
Table 1. Ore sorter feed and undersize masses from Trenches 1 and 2 as part of the initial sorter trial. Sorter yield is tabulated in Table 3).
Location Head Feed
(t)
-8 mm
undersize (t)
-8 mm
undersize (%)
Sorter Feed (t) Sorter Feed (%) Sorter feed rate
(t/h)
Trench 1 785 509 64.8 276 35.2 29
Trench 2 650 418 64.3 232 35.7 23
2.2 Sample Pits 1 to 6: Grade by size samples
Bulk samples were excavated from six pits (Figure 2) using a front end loader. The bulk samples were
scalped to remove +106 mm material which was stockpiled separately. The -106 mm material from each pit
was subsampled by cone and quartering to individual sample lots ranging between 729 and 990 kg (Figure
3; Table 2). These samples were sent to the SMI at UQ for grade by size analysis (Figure 4). The samples
were transferred from bulka bags to 44 gallon drums and hand screened through Gilson screens (Figure 4B).
The following Gilson screens were used for initial screening: 75 mm, 53 mm, 26.5 mm and 8 mm. These
screens were chosen to align with site-based screening equipment capabilities and to produce materials
suitable for ore sorter feed (e.g., -53 +26.5 mm and -26.5 +8 mm fractions). The -8 mm fraction represents
the undersize material screened prior to sorting and the +75 mm material represents oversize material that
would be crushed prior to ore sorting. The -8 mm material was further screened to -8 + 1 mm and -1 mm size
fractions using a 1 mm Gilson screen to investigate the deportment of tungsten phases in the undersize
material.
2.2.1 Natural Grade by Size testing
The screened materials in the following size fractions: -106 +75 mm; -75 +53 mm; -53 +26.5 mm; -26.5 +8
mm; -8 +1 mm and -1 mm were weighed to obtain the fraction mass to produce particle size distribution
charts. The fractions were representatively sub-sampled for chemical assay at ALS (Brisbane) to determine
tungsten grade and multielement geochemistry of each fraction. This data was used to evaluate the natural
distribution of tungsten grades across each size fraction for integration with economic modelling, mine
planning and scheduling carried out by DAS. The results of the natural grade by size study are discussed in
Section 4. Figure 5 illustrates the simplified flow chart used in the natural grade by size study.
2.2.2 Induced Grade by Size testing
The natural size fractions -106 +75 mm, -75 mm +53 mm and -53 +26.5 mm were crushed using a jaw
crusher at the SMI Indooroopilly Pilot Plant using a closed side setting of 25 mm (Figure 5). The progeny
from each crushed fraction was then screened to -25 +8 mm, -8 + 1 mm and -1 mm fractions. This test work
was designed to investigate the effects of coarse liberation and coarse waste rejection opportunities for size
fractions greater than that optimised for the ore sorter. For example, if the results of the natural grade by size
study indicate that a particular coarse fraction (e.g., -106 +75 mm) is naturally very low grade, the crushing
test was designed to evaluate if coarse crushing would provide a significant upgrade in tungsten grade to the
undersize fractions (-8 + 1mm and -1 mm). This may present opportunities for size-based screening and/or
ore sorting of the coarse progeny (>8 mm) after crushing. The -26.5 + 8 mm size fraction was not crushed in
the crushing trial as this is the optimal feed size for the XRT ore sorter. Due to timing constraints, the
crushed products were not able to be tested in the field on the XRT ore sorter, but this remains a further
testing opportunity.

METS IGNITED – GRADE BY SIZE RESULTS Page 7
Figure 3: Site based pit sampling and screening. A) Initial sampling of Pit 5; B) Screening of bulk sample materials; C) Bulka bags of sub-sampled material from Pits 1 to 6 prior to dispatch to SMI.
Figure 4: Screening of bulka bag samples from Pits 1 to 6 at the SMI – UQ Indooroopilly Pilot Plant. A) Transfer of samples from bulka bags to drums; B) Screening of bulk sample materials using Gilson screens; C) Example of +75 mm
particle with quartz-wolframite-scheelite vein on Gilson screen.

METS IGNITED – GRADE BY SIZE RESULTS Page 8
Figure 5: Simplified flow sheet for analysis of screened samples as part of the natural grade by size and induced grade by size test work program.

METS IGNITED – GRADE BY SIZE RESULTS Page 9
3. Ore sorter trial results
The results of the ore sorter trial results from Trench 1 and 2 (Figure 2 and Table 1) are briefly summarised.
These formed an initial part of the broader sorter trial work program carried out by EQ Resources as part of
this study.
3.1 Trench 1 and Trench 2 Mass distribution
Table 1 summarises the material mass ontained from Trenches 1 and 2 and the proportion of material in the -
25 + 8 mm size range that was fed to the XRT ore sorter as part of the sorter trial. Tables 2 and 3 summarise
the results of the initial sorter trial in terms of sorter accept yield (IE. the percentage of feed material that was
classified as ore grade and accepted by the ore sorter). For Trench 1 material, from 276,000 kg of material fed
to the ore sorter, 52,000 kg was accepted indicating a sorter yield of 18.8 % and a rejection of more than 80
% of the mass (Table 2). In contrast, Trench 2 had a lower sorter yield of 8.6 % based on total sorter feed of
232,000 kg and sorter accept mass of 20,000 kg indicating a higher mass rejection of 91.4 % (Table 3; Figure
6).
Table 2. Trench 1 mass and grade distribution and ore sorter feed and accept response (sorter yield) for Trench 1 as part of the initial sorter trial.
Trench 1 – Full Trench Summary
Sample ID Material Type Mass (kg) Mass % Assay W
(ppm)
Assay W (wt.
%)
Assay W
(WO3 %)
Tungsten Dist.
(%)
Upgrade
Factor
METS-201015-
200-A-001
-8 mm
Undersize 509,000 64.8 935 0.094 0.118 51.8 0.80
METS-201015-
300-A-002
-25 +8 mm
Sorter Accept 52,000 6.6 8,300 0.830 1.047 46.9 7.09
METS-201015-
400-A-003
-25 +8 mm
Sorter Reject 224,000 28.5 53 0.005 0.007 1.3 0.05
Trench Head
Grade/Totals 785,000 100.0 1,171 0.117 0.148 100
Trench 1 – Ore sorter feed only (-25 +8 mm fraction only)
Sample ID Material Type Mass (kg) Yield Mass % Assay W
(ppm)
Assay W (wt.
%)
Assay W
(WO3 %)
Tungsten Dist.
(%)
Upgrade
Factor
METS-201015-
300-A-002
+8 - 25 mm
Sorter Accept 52,000 18.8 8,300 0.830 1.047 97.3 5.17
METS-201015-
400-A-003
+8 - 25 mm
Sorter Reject 224,000 81.2 53 0.005 0.007 2.7 0.03
Sorter Feed
Head Grade 276,000 100.0 1,607 0.161 0.203 100

METS IGNITED – GRADE BY SIZE RESULTS Page 10
Table 3. Trench 2 mass and grade distribution and ore sorter feed and accept response (sorter yield) as part of the initial sorter trial.
Trench 2 – Full Trench Summary
Sample ID Material Type Mass (kg) Mass % Assay W
(ppm)
Assay W (wt.
%)
Assay W
(WO3 %)
Tungsten Dist.
(%)
Upgrade
Factor
METS-201021-
200-A-004
-8 mm
Undersize 418,000 64.3 802 0.080 0.101 77.4 1.2
METS-201021-
300-A-005
+8 - 25 mm
Soter Accept 20,000 3.1 4,480 0.448 0.565 20.7 6.7
METS-201021-
400-A-006
+8 - 25 mm
Sorter Reject 212,000 32.6 39 0.004 0.005 1.9 0.1
Trench Head
Grade/Totals 650,000 100.0 666 0.067 0.084 100
Trench 2 – Ore sorter feed only (-25 +8 mm fraction only)
Sample ID Material Type Mass (kg) Yield Mass % Assay W
(ppm)
Assay W (wt.
%)
Assay W
(WO3 %)
Tungsten Dist.
(%)
Upgrade
Factor
METS-201021-
300-A-005
+8 - 25 mm
Sorter Accept 20,000 8.6 4,480 0.448 0.565 91.6 10.6
METS-201021-
400-A-006
+8 - 25 mm
Sorter Reject 212,000 91.4 39 0.004 0.005 8.4 0.1
Sorter Feed
Head Grade/
Totals
232,000 100.0 422 0.042 0.053 100

METS IGNITED – GRADE BY SIZE RESULTS Page 11
Figure 6: Results of the initial sorter trial on crushed materials from Trench 1 and Trench 2 showing WO3 grade and mass distribution. See Table 2 and Table 3.
3.2 Trench 1 and 2 Tungsten Head Grade and Distribution
The assay grades for material types tested from Trenches 1 and 2 as part of the sorter trials are shown in
Figure 6 and Figure 7 indicating that both Trench 1 and 2 have low calculated head grades of 0.15 and 0.08
% WO3 respectively (Tables 2 and 3). The undersize material (-8 mm) from both trenches accounts for more
than 64 % of the total mass of the sample (Tables 2 and 3; Figure 6) and equates to more than 50 % of the
WO3 distribution in Trench 1 and 77 % of the WO3 in Trench 2 (Figure 6). The upgrade factor for the undersize
(-8 mm material) is calculated to be 0.8 and 1.2 for Trench 1 and 2, respectively. This indicates that there is
apparantly no significant induced upgrade of tungsten bearing mineral phases (scheelite or wolframite) to the
fine fraction for these trench materials in this trial. This is significant in terms of recovery of tungsten given that
losses during the beneficiation stage may be greater than during ore sorting stages. Discussion with EQ
Resources suggests that the generation of large quantities of undersize (-8 mm) material (>64 %) is attributed
to crusher settings used for this trial. Optimised crushing to minimise generation of undersize and maximise
production of material in the -25 +8 mm fraction would lead to high mass being directed to the ore sorter.
Figure 6 highlights that the sorter accept material represents 6.6 % and 3.1 % of the total mass of
Trench 1 and Trench 2 material, respectively whilst accounting for 46 % of the total WO3 in Trench 1 but only
20 % of WO3 in Trench 2 (Tables 2 and 3). Relative to the head grades for Trench 1 and 2, the sorter accept
material represents an upgrade of 7.1 and 6.7 (Tables 2 and 3).
3.3 Ore Sorter Feed Grade and Tungsten Distribution
The removal of the undersize material prior to ore sorting produced a feed material of -25 +8 mm with a head
grade of 0.203 % WO3 for Trench 1 and 0.053 % WO3 for Trench 2 (Tables 2 and 3; Figure 7). This represents
significnat variablility of the feed grade to the sorter where the feed grade for Trench 2 is nearly 4 times lower
than that of Trench 1 (Figure 7). The grade of the sorter accept materials of 1.0 % WO3 and 0.56 % WO3 for
Trench 1 and 2 respectively correlates with the lower overall feed grade. However, the overall sorter yield from
Trench 1 of 18.8 % compared to 8.6 % for Trench 2 indicates that more material was rejected from the lower
grade Trench 2 (Tables 2 and 3; Figure 7). Figure 7 indicates that the lower yield from Trench 2 correlates with
slightly higher tungsten losses to the ore sorter reject material (8.4 % of tungsten in 91.4 % of the mass with a
sorter reject head grade of only 0.005 % WO3 (Table 3). In contrast, the lower proportion of rejected mass from

METS IGNITED – GRADE BY SIZE RESULTS Page 12
Trench 1 (81.2 %) accounts for only 1.9 % of tungsten in sorter feed with an assay grade for the rejected
material of 0.005 % WO3.
The resulting calculated upgrade from the ore sorting trials carried out on Trench 1 and 2 indicate
upgrades of between 6.7 and 10.6 respectively highlighting the significant role ore sorting plays in transforming
very low grade feed material from the low grade stockpile at Mt Carbine into upgraded ore for the beneficiation
plant.
Figure 7: Sorter feed head grades and sorter yield results for Trench 1 and Trench 2 highlighting WO3 grade and mass distribution along with overall tungsten distribution. See Table 2 and Table 3 for corresponding data.
4. Bulk Sample Grade by Size Results Pits 1 to 6
4.1 Particle Size distribution (PSD) Pits 1 to 6
The particle size distribution (PSD) was determined for all bulk material samples from Pits 1 to 6 received at
the SMI-UQ Pilot Plant. The PSD for the main size fractions used for grade by size testing described in Section
2.2.2 are tabulated in Table 4. The full PSD obtained for each bulk sample are compiled in Appendix A and
shown graphically in Figure 8. The PSD data indicate that Pit 1 has a different overall particle size distribution
to the other pits in the study (Figure 8) with a P80 of approximately 23.4 mm compared to the average P80 for
the 5 other pit samples of 49.7 mm. This has been attributed to a higher abundance of finer material, potentially
dominated by clays observed during extraction of the sample in Pit 1.
The results of the PSD indicate that overall, between 20 and 50 % of the natural mass in the Pit
materials sampled is less than 8 mm and would report to the undersize material during screening prior to ore
sorting (Table 4; Figure 8). For optimal ore sorting applications with minimal crushing, it is beneficial for a
significant proportion of the natural stockpile mass to be contained within the -26.5 +8 mm size fraction. The
PSD indicates that between approximately 26 and 30 % of the total mass from each pit sample naturally occurs
in this size fraction range (Table 4). This program investigates if generation of addition sorter feed material in
this size fraction range (-26.5 +8 mm) by crushing coarser size fractions (IE. fractions >26.5 mm) is beneficial.

METS IGNITED – GRADE BY SIZE RESULTS Page 13
Table 4. Masses and particle size distribution (PSD) data for bulk samples processed at SMI-UQ from Pits 1 to 6 as part of the grade by size study.
Pit 1 Pit 2 Pit 3
Screen
size
(mm)
Fraction
range
Mass
(kg)
Mass %
Retained
Cum.
Mass
Retained
%
Cum. %
Passing
Mass
(kg)
Mass %
Retained
Cum.
Mass
Retained
%
Cum. %
Passing
Mass
(kg)
Mass %
Retained
Cum.
Mass
Retained
%
Cum. %
Passing
Head 729 100 880 100 850 100
+75 -106 + 75
mm 7.0 1.0 100.0 99.0 31.0 3.5 100.0 96.5 19.2 2.3 100.0 97.7
+53 -75 + 53 mm 30.0 4.1 99.0 94.9 77.0 8.8 96.5 87.7 88.2 10.4 97.7 87.4
+26.5 -53 + 26.5
mm 91.0 12.5 94.9 82.4 212.0 24.1 87.7 63.6 220.1 25.9 87.4 61.5
+8 -26.5 + 8
mm 239.4 32.8 82.4 49.6 304.4 34.6 63.6 29.1 283.6 33.4 61.5 28.1
+1 -8 + 1 mm 291.1 39.9 49.6 9.7 219.6 25.0 29.1 4.1 179.2 21.1 28.1 7.0
0 -1 mm 70.5 9.7 9.7 - 36.0 4.1 4.1 - 59.7 7.0 7.0 -
Pit 4 Pit 5 Pit 6
Screen
size
(mm)
Fraction
range
Mass
(kg)
Mass %
Retained
Cum.
Mass
Retained
%
Cum. %
Passing
Mass
(kg)
Mass %
Retained
Cum.
Mass
Retained
%
Cum. %
Passing
Mass
(kg)
Mass %
Retained
Cum.
Mass
Retained
%
Cum. %
Passing
Head 990 100 787 100 932 100
+75 -106 + 75
mm
28.0 2.8 100.0 97.2 46.0 5.8 100.0 94.2 66.0 7.1 100.0 92.9
+53 -75 + 53 mm 121.0 12.2 97.2 84.9 100.0 12.7 94.2 81.4 131.0 14.1 92.9 78.9
+26.5 -53 + 26.5
mm
237.0 23.9 84.9 61.0 210.0 26.7 81.4 54.8 284.0 30.5 78.9 48.4
+8 -26.5 + 8
mm
269.3 27.2 61.0 33.8 225.7 28.7 54.8 26.1 269.3 28.9 48.4 19.5
+1 -8 + 1 mm 250.4 25.3 33.8 8.5 154.1 19.6 26.1 6.5 124.9 13.4 19.5 6.1
0 -1 mm 84.3 8.5 8.5 - 51.2 6.5 6.5 - 56.8 6.1 6.1 -

METS IGNITED – GRADE BY SIZE RESULTS Page 14
Figure 8: Full particle size distribution plot for bulk samples from Pits 1 to 6. Refer to Appendix A-1 for full PSD data and Table 4 for PSD data for key size fractions.
4.2 Natural Grade by Size Results
4.2.1 Natural Grade by Size behaviour – Pits 1 to 6
The natural grade distribution across the analysed size fractions for each pit sample are tabulated in Table 5.
Figure 9 shows the calculated head WO3 grade (from Table 5) for each bulk sample from Pits 1 to 6 highlighting
that the head grade of the minus 106 mm material varies across the low grade stockpile from a minimum of
0.053 % WO3 in Pit 2 to a maximum of 0.126 % WO3 in Pit 1. It is emphasised that the calculated head grades
in Table 5 and Figure 9 are only for the materials received at the SMI and do not represent head grade of the
stockpile due to the absence of sample materials in size fractions greater than 106 mm.
Figure 9: Calculated head grade for bulk samples from Pits 1 to 6: Note that this data only relates to the -106 mm fraction from each pit and does not therefore represent the head grade of the whole pit or stockpile.
0.000
0.020
0.040
0.060
0.080
0.100
0.120
0.140
1 2 3 4 5 6
Hea
d G
rad
e W
O3
%
Pit Number
Head Grade (WO3) Pits 1 to 6

METS IGNITED – GRADE BY SIZE RESULTS Page 15
Table 5. Sample mass distribution, WO3 assay grade (%) and tungsten distribution for bulk samples processed at SMI-UQ from Pits 1 to 6 as part of the grade by size study.
Pit 1 Pit 2
Screen
size
Fraction
(mm) Mass %
Cum. Mass
% WO3%
W %
Distribution
W % Dist.
Cum. Mass %
Cum. Mass
% WO3 %
W %
Distribution
W % Dist.
Cum.
Head 100 100 0.126 100 100 100 100 0.053 100 100
+75 -106 + 75 1.0 100 0.004 0.03 100 3.5 100.0 0.003 0.18 100
+53 -75 + 53 4.1 99.0 0.004 0.12 100 8.8 96.5 0.069 11.2 99.8
+26.5 -53 + 26.5 12.5 94.9 0.013 1.3 99.8 24.1 87.7 0.012 5.3 88.6
+8 -26.5 + 8 32.8 82.4 0.141 36.9 98.6 34.6 63.6 0.057 36.9 83.3
+1 -8 + 1 39.9 49.6 0.144 45.6 61.7 25.0 29.1 0.071 33.0 46.4
-1 -1 9.7 9.7 0.209 16.1 16.1 4.1 4.1 0.175 13.4 13.4
Pit 3 Pit 4
Screen
size
Fraction
(mm) Mass %
Cum. Mass
% WO3%
W %
Distribution
W % Dist.
Cum. Mass %
Cum. Mass
% WO3 %
W %
Distribution
W % Dist.
Cum.
Head 100 100 0.124 100 100 100 100 0.110 100 100
+75 -106 + 75 2.3 100 0.556 10.2 100 2.8 100 0.794 20.5 100
+53 -75 + 53 10.4 97.7 0.116 9.7 89.8 12.2 97.2 0.115 12.8 79.5
+26.5 -53 + 26.5 25.9 87.4 0.068 14.3 80.1 23.9 84.9 0.024 5.2 66.7
+8 -26.5 + 8 33.4 61.5 0.146 39.5 65.8 27.2 61.0 0.100 24.9 61.4
+1 -8 + 1 21.1 28.1 0.125 21.3 26.4 25.3 33.8 0.106 24.5 36.6
-1 -1 7.0 7.0 0.090 5.1 5.1 8.5 8.5 0.155 12.1 12.1

METS IGNITED – GRADE BY SIZE RESULTS Page 16
Table 5 (continued). Sample mass distribution, WO3 assay grade (%) and tungsten distribution for bulk samples processed at SMI-UQ from Pits 1 to 6 as part of the grade by size study.
Pit 5 Pit 6
Screen
size
Fraction
(mm) Mass %
Cum. Mass
% WO3%
W %
Distribution
W % Dist.
Cum. Mass %
Cum. Mass
% WO3 %
W %
Distribution
W % Dist.
Cum.
Head 100 100 0.116 100 100 100 100 0.087 100 100
+75 -106 + 75 5.8 100 0.225 11.4 100 7.1 100 0.009 0.76 100
+53 -75 + 53 12.7 94.2 0.016 1.7 88.6 14.1 92.9 0.030 4.9 99.2
+26.5 -53 + 26.5 26.7 81.4 0.041 9.5 86.9 30.5 78.9 0.095 33.3 94.4
+8 -26.5 + 8 28.7 54.8 0.051 12.5 77.4 28.9 48.4 0.034 11.4 61.1
+1 -8 + 1 19.6 26.1 0.260 43.8 64.9 13.4 19.5 0.173 26.5 49.7
-1 -1 6.5 6.5 0.376 21.1 21.1 6.1 6.1 0.333 23.2 23.2
The distribution of tungsten grades between the different analysed size fractions from the bulk
materials indicate that in some Pits, there can be a natural tendancy for tungsten minerals to preferentially
fractionate into the finer size fractions (Figure 10). This is indicated by the elevated WO3 grade particularly in
the -1 mm fraction but also in the -8 +1 mm fraction in Pits 5 and 6 where the WO3 grade in the -1 mm fraction
is up to 3 times higher than the head grade (Figure 10). In other Pits (e.g., Pit 3 and Pit 4) the highest tungsten
grades occur in the coarsest (-106 +75 mm) size fractions. This suggests that highly mineralised coarse
particles occur in the coarser size fractions. Preliminary modelling based on measured particle density data
from Pits 3 and 4 suggest that these elevated grades can be attributed to only one or two mineralised particles
occuring in this size fraction.
The natural distribution of grade across the measured size fractions can be attributed to the degree of
liberation of the target ore phases, wolframite and scheelite which are the main tungsten bearing phases at Mt
Carbine. The preferential deportment of WO3 grade to the finer fractions indicates that wolframite and scheelite
has been liberated from its geological host mineral phases (likely to be dominantly quartz vein material) during
progressive breakage. Initial breakage would have occurred during blasting of the material potentially causing
coarse liberation of wolframite and scheelite if mineralised veins preferentially reopened and fractured. This
would cause coarsely libereated wolframite and scheelite to preferentially naturally deport into size fractions
broadly equivalent to its natural grain size. In Pits 5 and 6, the high grade of the -8 mm and -1 mm fractions
(Figure 10) suggest that the original source material contained mineralised quartz veins with coarsely
crystalline (>1 mm) wolframite and scheelite. Previous work (White, 2014) and this study, confirm the grain
size of wolframite and scheelite in mineralised samples can exceed 10 mm diameter.
The opposite trend observed in Pits 3 and 4 where the highest tungsten grades occur in the coarsest
analysed size fraction (+75 mm) indicate that wolframite and scheelite were less likely to have been liberated
at coarse sizes during breakage (blasting, hauling and dumping). Coarse particles with high densities and
textural evidence for wolframite and scheelite mineralisation are indicative of high tungsten grades. Potential
further work could investigate new density separation methods to selectively identfy and separate dense,
mineralised particles, from barren, unmineralised particles in these coarser size fractions.

METS IGNITED – GRADE BY SIZE RESULTS Page 17
Figure 10: Natural grade by size (Blue bars, WO3 %) and mass distribution (Orange line, mass %) for bulk materials from Pits 1 to 6 along with calculated head grade for each pit (Red bars). See Table 5 for values. Purple horizontal lines extrapolate the head grade in each Pit sample.
4.2.2 Natural Tungsten Grade Distribution – Pits 1 to 6
Table 5 and Figure 11 summarise the distribution of tungsten between each analysed size fraction for each
Pit. The results consider the mass and grade of material in each size fraction to determine the proportion of
tungsten that deports to each size fraction. This data is significant when considering size-based separation
methods and mass rejection strategies (Figure 12).

METS IGNITED – GRADE BY SIZE RESULTS Page 18
Figure 11: Calculated tungsten distribution (Blue bars, WO3 %) and mass distribution (Orange lines/markers, mass %) for bulk materials from Pits 1 to 6. Red bars represent 100 % of tungsten recovered from 100 % of mass. See Table 5 for values. Figure 11 indicates the cumulative tungsten and mass distribution as a function of particle size.
Figure 11 indicates that material in the ore sorter feed size range (-26.5 +8 mm) from Pits 1, 2, 3 and 4
represents between 25 and 40 % of the total tungsten contained in each bulk sample whilst representing only
approximately 30 % of the total mass. The head grade of the -26.5 +8 mm material from Pits 1 to 4 ranges
from very low grade of 0.057 % WO3 (Pit 2) to higher grades of 0.146 % WO3 in Pit 3 (Figure 10 and Table 5).
The results of preliminary sorter trials carried out on crushed material in this sorter feed size range indicate
that high tungsten recovery is possible from such materials with a significant tungsten upgrade potential (See
Section 3). The low sorter feed grades of the -26.5 +8 mm fraction from Pit 2 (0.057 % WO3) is similar to that
for Trench 2 material analysed as part of the sorter trial (Section 3) which produced a lower sorter yield, but a
more highly upgraded sorter product (Table 3). In contrast, the higher grade sorter feed material (-26.5 +8 mm)
from Trenches 1, 3 and 4 is more similar to the sorter feed material from Trench 1 (Section 3) which produced
higher sorter yield but lower overall upgrade ratio (Table 2).

METS IGNITED – GRADE BY SIZE RESULTS Page 19
Figure 12: Cumulative mass (%) vs. cumulative tungsten distribution (%) plots for bulk materials from Pits 1 to 6. The 1:1 line represents the trend where there is no significant upgrade through mass rejection. Curved dashed lines indicate a polynomial (2nd order) fit to the datapoints for each Pit. Vertical lines at 50% cumulative mass (x-axis) correspond to the proportion of tungsten (y-axis) that would be lost to waste at a 50 % mass rejection rate. See text for explanation.
The -26.5 + 8 mm material in Pit 5 and Pit 6 is very low grade (0.051 and 0.034 % WO3
respectively;Table 5; Figure 10) such that despite this size fraction having an overall mass distribution of
around 30 % (Figure 11), the tungsten distribution is low at 12.5 and 11.4 % respectively (Figure 11).
Consequently, this material from Pit 5 and 6 may not be best suited for ore sorting applications due to the low
tungsten distribution in the -26.5 +8 mm fraction, Pits 5 and 6 demonstrate a higher overall deportment of
tungsten to the sorter undersize fractions (-8 +1 mm and -1 mm) of between 50 and 60 % (Figure 11; Table
5). In contrast, Pits 3 and 4 have a lower overall distribution of tungsten in the undersize size fractions than
Pits 1 and 2 (Figure 11) which reflects the lower head grade (and lower degree of natural fractionation) into
these size fractions. The high tungsten grades in the -106 +75 mm material in Pits 3 and 4 (Figure 10) results
in an overall tungsten distributon in these fractions of 10 and 20 % respectively (Figure 11). For these bulk
samples, it is likely that further processin of this coarse material may be economically beneficial, depending
on the method employed. The results of the crushing test work on these size fractions is discussed in Section
4.2.3.

METS IGNITED – GRADE BY SIZE RESULTS Page 20
Cumulative mass distribution vs. cumulative tungsten distribution curves for each of the six bulk
samples are shown in Figure 12. These graphs indicate that for samples where the coarser size fractions have
low tungsten grades and an tendancy for finer fractions to have a higher tungsten grade (e.g., Pits 1, 2, 5 and
6) there is a natural amenability for potential coarse waste rejection strategies.
4.2.3 Crushing Induced Grade by Size Assay Results: Pits 1 to 6
Head size fractions greater than the ore sorter feed size (>26.5 mm) from the natural grade by size study were
subjected to a systematic crushing test (Figure 5) which aimed to characterise:
1) The degree of induced deportment of tungsten minerals to the undersize (-8 +1 mm and -1 mm
size fractions) during crushing to evaluate if these materials can be upgraded by crushing and
screening;
2) To predict the mass and grade of material generated from coarser fractions during crushing that
is of a size range suitable for XRT ore sorting (IE. -26.5 +8 mm).
A representative split of the uncrushed coarse size fractions (-106 +75 mm; -75 +53 mm and -53 2.5
mm) from the natural grade by size study were subjected to controlled crushing using a jaw crusher with a
closed side setting (CSS) of 19 mm. Each fraction was screened using a range of sieves and the mass
recorded prior to compositing to -26.5 +8 mm; -8 +1 mm and -1 mm size fractions for assay and mineralogical
analysis (Figure 5).
The results of the crushing tests for coarse materials from each pit are summarised in Table 6 and
Figure 13. Full graphical results are collated in Appendix A-2. Overall, the results indicate that during crushing,
the coarse size fraction materials from all Pit samples generate a reasonably consistent proportion of material
in the size range suitable for XRT ore sorting (-26.5 +8 mm) of between 68 and 78 % of the total mass (Figure
13; Table 6). The majority of the remaining mass predominantly occurs in the -1 mm fracton with a mass
distribution in this fraction of between 19 and 28 %, with the exception of Pit 3 which generated a low mass of
-1 mm material (<7.4 %) from all crushed head size fractions (Figure 13; Table 6). The coarsest size fraction
tested (-106 +75 mm) from Pits 1 and 2 have very low tungsten head grades (<0.004 % WO3; not visible in
Figure 13 due to the scale) and despite yielding moderate induced fractionation of tungsten into the -1 mm
crushed fraction (0.007 % WO3; Figure 13; Table 6) this fraction overall contains a very low overall distribution
of total tungsten in the bulk sample (0.03 %; Table 5). A similar result is observed for the same size fraction in
Pit 2 (Tables 5 and 6; Figure 13). These results indicate that the crushed product of the -106 +75 mm size
fraction from Pit 1 would yield an ore sorter feed (-26.5 +8 mm) with a feed grade of 0.002 % WO3 and
undersize (-8 mm and -1 mm material) with a head grades of 0.003 and 0.007 % WO3 respectively (Table 5).
This highlights that even with effects of preferential deportment induced by crushing, these low grade materials
from Pit 1 should be rejected without crushing/screening and are not amenable to significant upgrade.

METS IGNITED – GRADE BY SIZE RESULTS Page 21
Table 6. Induced grade by size deportment results for head size fractions -106+75 mm, -75 +53 mm and -53 +26.5 mm each crushed to 100% passing -26.5 mm and screened to -26.5+8 mm (ore sorter feed size), -8 +1 mm and -1 mm (undersize screen sizes).
Pit Location Head Fraction Head Grade (WO3) Crushed Size
Fraction Mass (%) WO3 (%) W Distribution (%)
Pit 1 -106 +75 mm 0.003 -26.5 +8 mm 73.7 0.002 38.7
-8 +1 mm 4.2 0.003 4.2
-1 mm 22.1 0.007 57.1
-75 + 53.5 mm 0.010 -26.5 +8 mm 71.0 0.002 14.3
-8 +1 mm 4.1 0.004 1.7
-1 mm 24.9 0.034 84.0
-53.5 + 26.5 mm 0.027 -26.5 +8 mm 71.4 0.014 36.0
-8 +1 mm 3.9 0.018 2.5
-1 mm 24.7 0.068 61.5
Pit 2 -106 +75 mm 0.004 -26.5 +8 mm 66.5 0.004 62.9
-8 +1 mm 5.2 0.003 4.5
-1 mm 28.4 0.004 32.6
-75 + 53.5 mm 0.014 -26.5 +8 mm 71.1 0.004 19.3
-8 +1 mm 4.3 0.020 5.9
-1 mm 24.6 0.044 74.8
-53.5 + 26.5 mm 0.022 -26.5 +8 mm 76.2 0.010 35.0
-8 +1 mm 3.6 0.027 4.5
-1 mm 20.2 0.065 60.4
Pit 3 -106 +75 mm 0.556 -26.5 +8 mm 76.6 0.550 75.7
-8 +1 mm 18.5 0.565 18.8
-1 mm 4.9 0.625 5.5
-75 + 53.5 mm 0.116 -26.5 +8 mm 68.9 0.088 52.5
-8 +1 mm 23.7 0.175 35.9
-1 mm 7.4 0.182 11.6
-53.5 + 26.5 mm 0.068 -26.5 +8 mm 74.3 0.069 75.6
-8 +1 mm 19.2 0.054 15.2
-1 mm 6.5 0.097 9.2

METS IGNITED – GRADE BY SIZE RESULTS Page 22
Table 6 (continued). Induced grade by size deportment results for head size fractions -106+75 mm, -75 +53 mm and -53 +26.5 mm each crushed to 100% passing -26.5 mm and screened to -26.5+8 mm (ore sorter feed size), -8 +1 mm and -1 mm (undersize screen sizes).
Pit Location Head Fraction Head Grade (WO3) Crushed Size
Fraction Mass (%) WO3 (%) W Distribution (%)
Pit 4 -106 +75 mm 1.129 -26.5 +8 mm 69.4 1.079 66.3
-8 +1 mm 4.0 1.293 4.6
-1 mm 26.6 1.235 29.1
-75 + 53.5 mm 0.059 -26.5 +8 mm 66.0 0.012 14.0
-8 +1 mm 5.1 0.132 11.5
-1 mm 28.9 0.151 74.5
-53.5 + 26.5 mm 0.102 -26.5 +8 mm 72.3 0.111 78.2
-8 +1 mm 4.4 0.059 2.5
-1 mm 23.4 0.084 19.2
Pit 5 -106 +75 mm 0.242 -26.5 +8 mm 66.5 0.155 42.6
-8 +1 mm 5.2 0.399 8.5
-1 mm 28.4 0.417 48.9
-75 + 53.5 mm 0.027 -26.5 +8 mm 65.9 0.012 30.2
-8 +1 mm 5.1 0.011 2.2
-1 mm 29.0 0.062 67.6
-53.5 + 26.5 mm 0.063 -26.5 +8 mm 68.0 0.027 29.2
-8 +1 mm 5.2 0.053 4.4
-1 mm 26.8 0.155 66.4
Pit 6 -106 +75 mm 0.018 -26.5 +8 mm 67.6 0.006 23.0
-8 +1 mm 5.1 0.009 2.5
-1 mm 27.4 0.048 74.5
-75 + 53.5 mm 0.055 -26.5 +8 mm 67.5 0.021 25.6
-8 +1 mm 4.8 0.029 2.5
-1 mm 27.8 0.141 71.9
-53.5 + 26.5 mm 0.107 -26.5 +8 mm 76.7 0.081 57.9
-8 +1 mm 3.8 0.136 4.8
-1 mm 19.6 0.204 37.2

METS IGNITED – GRADE BY SIZE RESULTS Page 23
Figure 13: Summary results of crushing trials performed on coarse size fractions -106 +75 mm; -75 +53 mm and -53 +26.5 mm from the natural grade by size study on each Pit sample. Upper graphs show the mass distribution for crushed products in each size range for Pits 1 to 6. Middle plot shows the calculated head grade of each fraction and the corresponding grade deportment between the crushed fractions (NB. Pits 1 and 2 are very low grade <0.004 % WO3 and do not plot on these graphs; See Appendix 2 for full results). Lower plot illustrates the tungsten distribution between the crushed size fractions.
In contrast to the poor upgrade performance of coarse material from Pit 1, the -106 +75 mm materials from
Pits 3 and 4 contained significant head grades of tungsten (0.556 and 0.794 % WO3, respectively; Table 5)
accounting for 10 and 20 % respectively of total tungsten in the bulk samples. Opportunities to upgrade this
material prior to ore sorting would could be transformative for the economics of this coarse fraction. The
crushed products of the -106 +75 mm fractions from Pits 3 and 4 show a moderate increase in tungsten grade
into the finest fraction (-1 mm) but tungsten grades are high across all of the progeny size fractions (Table 6
and Figure 13). This suggests that wolframite and scheelite are not liberated during crushing and likely remain
locked in all size fractions. The tungsten distribution graphs (Figure 13) for Pits 3 and 4 indicate that for this
size fraction (-106 +75 mm), the -26.5 +8 mm sorter feed fraction contains the majority of tungsten and could
potentially be recovered through ore sorting.

METS IGNITED – GRADE BY SIZE RESULTS Page 24
Overall, preferential deportment of tungsten grade increases through crushing of progressively the
progressively finer size fractions (Figure 13). This effect is particularly evident in Pits 4, 5 and 6 for the -75 +53
mm fraction and the -53 +26.5 mm fractions (Figure 13) where the -1 mm progeny is upgraded relative to the
head grade of the size fraction by 2 to 4 times. The same trend of increasing tungsten grade into the crushed
undersize is observed in both the -75 +53 mm and -53 +26.5 mm head fractions for all Pits (Figure 13).
Significantly, in these materials, the -1 mm crushed fractions account for more than 70 % of the tungsten
distribution in less than 30 % of the total mass. This means that ore sorting of the coarser fractions (-26.5 +8
mm) from these crushed products would yield only a maximum of 30 % of tungsten from typically more than
70 % of the total mass. Economic considerations should dictate the effectiveness of ore sorting of these
crushed products based on scale-up test work and crusher optimisation. This crushing testwork generated a
considerably lower mass proportion of undersize (-8 mm) material (<30 %) than the initial ore sorter test work
(>64 % for Trenches 1 and 2; Section 3). Test work to optimise the crusher settings either for maximum
production of upgraded undersize material, or for optimal mass in the ore sorting size range is key to early
waste rejection strategies.
To reference this document:
Fox, N., White, K., Parbhakar-Fox, A.K., 2021. Mt Carbine Grade by Size Results – METS Ignited Program,
Sustainable Minerals Institute, University of Queensland.
5. References
White, A., 2014, Review of the Mt Carbine Tungsten Resource, Consultant Report, p. 20.
6. Appendices

METS IGNITED – GRADE BY SIZE RESULTS Page 25
A-1 FULL PARTICLE SIZE DISTRIBUTION PLOTS – NATURAL GRADE BY SIZE STUDY
Table A-1 Full particle size distribution for Pit samples 1 to 6.
Pit 1 Pit 2 Pit 3
Screen size
(mm) Mass (kg)
Mass % Retained
Cum. Mass Retained
% Cum. % Passing
Mass (kg)
Mass % Retained
Cum. Mass Retained
% Cum. % Passing
Mass (kg)
Mass % Retained
Cum. Mass Retained
% Cum. % Passing
106 0.0 0.0 0.0 100.0 0.0 0.0 0.0 100.0 0.0 0.0 0.0 100.0
75 7.0 1.0 100.0 99.0 31.0 3.5 100.0 96.5 19.2 2.3 100.0 97.7
53 30.0 4.1 99.0 94.9 77.0 8.8 96.5 87.7 88.2 10.4 97.7 87.4
26.5 91.0 12.5 94.9 82.4 212.0 24.1 87.7 63.6 220.1 25.9 87.4 61.5
22.4 25.9 3.6 82.4 78.9 52.8 6.0 63.6 57.6 37.6 4.4 61.5 57.0
19 29.9 4.1 78.9 74.8 50.1 5.7 57.6 51.9 46.8 5.5 57.0 51.5
16 40.7 5.6 74.8 69.2 40.3 4.6 51.9 47.4 47.1 5.5 51.5 46.0
13.2 37.1 5.1 69.2 64.1 24.6 2.8 47.4 44.6 33.0 3.9 46.0 42.1
12.5 21.1 2.9 64.1 61.2 12.5 1.4 44.6 43.1 18.7 2.2 42.1 39.9
11.2 15.3 2.1 61.2 59.1 12.8 1.5 43.1 41.7 15.3 1.8 39.9 38.1
9.5 31.3 4.3 59.1 54.8 64.1 7.3 41.7 34.4 59.6 7.0 38.1 31.1
8 38.2 5.2 54.8 49.6 47.0 5.3 34.4 29.1 25.6 3.0 31.1 28.1
6.7 31.8 4.4 49.6 45.2 41.8 4.8 29.1 24.3 24.6 2.9 28.1 25.2
5.6 34.7 4.8 45.2 40.5 34.5 3.9 24.3 20.4 22.9 2.7 25.2 22.5
4.75 35.0 4.8 40.5 35.7 30.5 3.5 20.4 16.9 36.2 4.3 22.5 18.3
3.35 53.9 7.4 35.7 28.3 44.4 5.0 16.9 11.9 18.6 2.2 18.3 16.1
2.8 25.9 3.6 28.3 24.7 20.5 2.3 11.9 9.5 16.0 1.9 16.1 14.2
2.36 24.4 3.4 24.7 21.4 13.0 1.5 9.5 8.1 26.4 3.1 14.2 11.1
1.7 40.1 5.5 21.4 15.9 17.6 2.0 8.1 6.1 15.1 1.8 11.1 9.3
1.18 34.5 4.7 15.9 11.2 13.3 1.5 6.1 4.5 11.2 1.3 9.3 8.0
1 10.8 1.5 11.2 9.7 4.0 0.5 4.5 4.1 8.2 1.0 8.0 7.0
0 70.5 9.7 9.7 36.0 4.1 4.1 59.7 7.0 7.0
Totals 729 100 880 100 100 850.02 100 100

METS IGNITED – GRADE BY SIZE RESULTS Page 26
Pit 4 Pit 5 Pit 6
Screen size
(mm) Mass (kg)
Mass % Retained
Cum. Mass Retained
% Cum. % Passing
Mass (kg)
Mass % Retained
Cum. Mass Retained
% Cum. % Passing
Mass (kg)
Mass % Retained
Cum. Mass Retained %
Cum. % Passing
106 0.0 0.0 0.0 100.0 0.0 0.0 0.0 100.0 0.0 0.0 0.0 100.0
75 28.0 2.8 100.0 97.2 46.0 5.8 100.0 94.2 66.0 7.1 100.0 92.9
53 121.0 12.2 97.2 84.9 100.0 12.7 94.2 81.4 131.0 14.1 92.9 78.9
26.5 237.0 23.9 84.9 61.0 210.0 26.7 81.4 54.8 284.0 30.5 78.9 48.4
22.4 43.7 4.4 61.0 56.6 41.2 5.2 54.8 49.5 53.1 5.7 48.4 42.7
19 47.3 4.8 56.6 51.8 40.2 5.1 49.5 44.4 68.5 7.3 42.7 35.3
16 39.8 4.0 51.8 47.8 28.9 3.7 44.4 40.7 48.7 5.2 35.3 30.1
13.2 41.9 4.2 47.8 43.6 33.6 4.3 40.7 36.5 29.9 3.2 30.1 26.9
12.5 18.8 1.9 43.6 41.7 17.5 2.2 36.5 34.3 17.3 1.9 26.9 25.1
11.2 17.2 1.7 41.7 39.9 13.7 1.7 34.3 32.5 9.6 1.0 25.1 24.0
9.5 29.1 2.9 39.9 37.0 23.5 3.0 32.5 29.5 22.8 2.4 24.0 21.6
8 31.5 3.2 37.0 33.8 27.0 3.4 29.5 26.1 19.4 2.1 21.6 19.5
6.7 26.8 2.7 33.8 31.1 22.0 2.8 26.1 23.3 16.3 1.8 19.5 17.7
5.6 24.2 2.4 31.1 28.7 19.4 2.5 23.3 20.8 15.4 1.7 17.7 16.1
4.75 23.9 2.4 28.7 26.2 19.9 2.5 20.8 18.3 15.4 1.7 16.1 14.4
3.35 42.6 4.3 26.2 21.9 27.2 3.5 18.3 14.8 21.3 2.3 14.4 12.1
2.8 24.2 2.4 21.9 19.5 13.4 1.7 14.8 13.2 11.4 1.2 12.1 10.9
2.36 20.1 2.0 19.5 17.5 10.9 1.4 13.2 11.8 7.7 0.8 10.9 10.1
1.7 38.0 3.8 17.5 13.6 13.5 1.7 11.8 10.1 16.0 1.7 10.1 8.4
1.18 40.9 4.1 13.6 9.5 21.2 2.7 10.1 7.4 15.7 1.7 8.4 6.7
1 9.7 1.0 9.5 8.5 6.7 0.8 7.4 6.5 5.6 0.6 6.7 6.1
0 84.3 8.5 8.5 51.2 6.5 6.5 56.8 6.1 6.1
Totals 990 100 100 787 100 100 932 100 100

METS IGNITED – GRADE BY SIZE RESULTS Page 27
A-2 INDUCED CRUSHING RESULTS

METS IGNITED – GRADE BY SIZE RESULTS Page 28

METS IGNITED – GRADE BY SIZE RESULTS Page 29

METS IGNITED – GRADE BY SIZE RESULTS Page 30

METS IGNITED – GRADE BY SIZE RESULTS Page 31

METS IGNITED – GRADE BY SIZE RESULTS Page 32

Mt Carbine Bankable Feasibility Study – Chapter 3: Geology and Resources
55
Hole # East North Rl EOH Dip Azm (TN) To Interval WO3 % Zone
EQ001 22,793 26,176 389.4 309.1 -49 50 164.73 169.00 4.27 1.27 Iolanthe
Incl. 166.47 166.57 0.10 50.07 Iolanthe
185.07 191.13 6.06 0.54 Bluff
Incl. 187.82 187.99 0.17 17.40 Bluff
202.02 208.74 6.72 0.53 Bluff
Incl. 202.02 202.78 0.76 3.87 Bluff
221.06 221.41 0.35 2.13 Wayback
228.84 231.37 2.53 0.48 Wayback
296.51 305.63 9.12 0.48 Johnson
Incl. 296.51 297.75 1.24 2.64 Johnson
Incl. 305.12 305.63 0.51 2.07 Johnson
EQ002 22,793 26,175 389.5 389.5 -57 50 207.20 211.55 4.35 0.26 Bluff
Incl. 207.20 207.62 0.42 1.95 Bluff
262.50 263.13 0.63 0.50 Wayback
308.67 313.94 5.27 0.38 Johnson
Incl. 308.67 308.86 0.19 1.92 Johnson
Incl. 312.77 313.94 1.17 1.42 Johnson
EQ003 22,736 26,171 387.40 290.0 -50 50 120.85 127.82 6.97 0.90 Iolanthe
Incl. 120.85 122.16 1.31 1.36 Iolanthe
Incl. 126.32 127.82 1.50 2.88 Iolanthe
139.79 140.17 0.38 1.26 Iolanthe
148.44 154.72 6.28 0.26 Bluff
Incl. 154.58 154.72 0.14 11.55 Bluff
291.77 293.32 1.55 0.46 Johnson
EQ004 22704 26174.9 386.3 325 -50 50 114.09 119.42 5.33 1.32 Iolanthe
Incl. 118.40 119.42 1.02 6.68 Iolanthe
127.09 135.75 8.66 0.45 Iolanthe
Incl. 135.06 135.75 0.69 5.37 Iolanthe
173.33 181.54 8.21 1.13 Bluff
Incl. 173.33 173.82 0.49 17.60 Bluff
Incl. 180.90 181.54 0.64 0.95 Bluff
EQ005 22657 26173.7 386.8 327.3 -58 50 115.67 118.37 2.70 0.50 Iolanthe
Incl. 115.67 115.87 0.20 5.32 Iolanthe
Incl. 118.30 118.37 0.07 4.13 Iolanthe
141.81 145.47 3.66 0.26 Iolanthe
Incl. 145.31 145.47 0.16 6.02 Iolanthe
154.24 156.98 2.74 0.35 Bluff
Incl. 154.56 154.71 0.15 5.85 Bluff
217.46 218.73 1.27 0.28 Bluff
Incl. 217.90 218.11 0.21 1.43 Bluff
EQ006 22,876 26,189 383.60 309.3 -48 50 123.37 127.72 4.35 1.31 Iolanthe
Incl. 124.08 124.62 0.54 8.03 Iolanthe
Incl. 127.26 127.72 0.46 2.71 Iolanthe
131.00 135.12 4.12 0.53 Iolanthe
Incl. 131.00 132.24 1.24 1.00 Iolanthe
150.30 152.41 2.11 0.56 Bluff
Incl. 152.36 152.41 0.05 20.05 Bluff
162.30 163.65 1.35 2.37 Bluff
Incl. 162.30 162.41 0.11 1.82 Bluff
Incl. 163.17 163.65 0.48 6.14 Bluff
253.06 253.39 0.33 2.48 Wayback
267.31 270.19 2.88 0.38 Johnson
Incl. 267.31 267.50 0.19 3.83 Johnson
278.28 281.98 3.70 0.78 Johnson
Incl. 281.77 281.98 0.21 12.93 Johnson
287.17 290.44 3.27 0.33 Johnson
Incl. 287.17 287.32 0.15 7.14 Johnson
EQ Resources Drilling Campaign 2021 Results continuedFrom

Mt Carbine Bankable Feasibility Study – Chapter 3: Geology and Resources
56
Hole # East North Rl EOH Dip Azm (TN) To Interval WO3 % Zone
EQ007 23014 26328 364.2 48.0 -45 230 28.35 30.48 2.13 0.57 Iolanthe
Incl. 28.35 28.50 0.15 7.97 Iolanthe
EQ008 23014 26329 364.1 60.5 -65 230 48.95 50.20 1.25 0.25 Iolanthe
Incl. 50.09 50.20 0.11 1.58 Iolanthe
EQ009 23014 26331.0 364.2 171.5 -60 50 43.60 45.78 2.18 0.44 Wayback
Incl. 45.26 45.55 0.29 2.84 Wayback
80.39 83.22 2.83 0.67 Johnson
Incl. 80.39 80.50 0.11 5.47 Johnson
Incl. 83.00 83.22 0.22 5.86 Johnson
101.96 104.57 2.61 0.41 Johnson
Incl. 101.96 102.10 0.14 6.47 Johnson
125.90 127.30 1.40 0.60 Johnson
EQ010 22657 26177 387 245 -45 50 136.92 139.16 2.24 0.27 Bluff
Incl. 139.04 139.16 0.12 4.99 Bluff
156.84 159.45 2.61 0.21 Bluff
Incl. 158.37 159.45 1.08 0.50 Bluff
167.51 171.11 3.60 0.32 Bluff
Incl. 167.51 168.05 0.54 2.08 Bluff
173.49 182.16 8.67 0.30 Bluff
Incl. 181.23 182.16 0.93 2.59 Bluff
EQ011 22765 26173 389 285 -45 51 118.48 119.06 0.58 2.26 Iolanthe
137.38 138.52 1.14 0.43 Bluff
141.55 141.70 0.15 6.36 Bluff
144.95 145.47 0.52 2.08 Bluff
176.67 176.93 0.26 3.31 Bluff 222.53 223.20 0.67 4.22 Johnson
EQ012 22624 26186 387.8 412.0 -45 50 111.46 113.60 2.14 0.53 Iolanthe
Incl. 111.46 111.73 0.27 4.10 Iolanthe
137.82 141.66 3.84 0.32 Bluff
Incl. 138.88 139.01 0.13 5.90 Bluff
141.50 141.66 0.16 2.53 Bluff
327.11 328.78 1.67 3.28 Dazzler
Incl. 327.11 328.34 1.23 5.44 Dazzler
346.41 349.59 3.18 0.67 Dazzler
Incl. 346.41 346.78 0.37 4.33 Dazzler
382.08 385.21 3.13 1.93 Dazzler
Incl. 383.21 384.21 1.00 5.92 Dazzler
EQ013 22911 26190 382.8 294.2 -45 48 135.95 148.87 12.92 0.59 bluff
Incl. 135.95 136.65 0.70 1.02 bluff
140.46 140.61 0.15 3.95 bluff
148.39 148.87 0.48 12.40 bluff
165.76 170.85 5.09 1.14 bluff
Incl. 165.76 166.64 0.88 3.42 bluff
170.67 170.85 0.18 15.55 bluff
257.12 266.13 9.01 0.38 Johnson
Incl. 257.12 257.94 0.82 2.49 Johnson
265.77 266.13 0.36 3.43 Johnson
277.00 284.18 7.18 1.42 Johnson
Incl. 277.00 277.30 0.30 3.61 Johnson
282.90 284.18 1.28 6.96 Johnson
EQ Resources Drilling Campaign 2021 Results continuedFrom
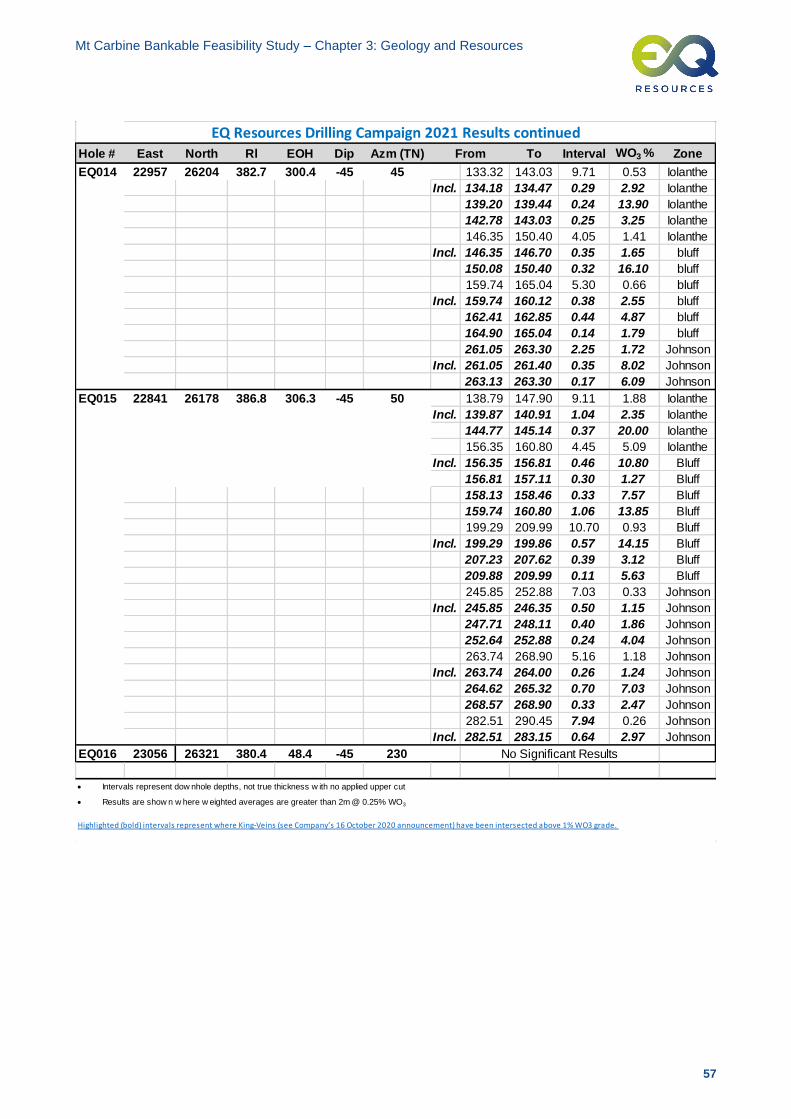
Mt Carbine Bankable Feasibility Study – Chapter 3: Geology and Resources
57
Hole # East North Rl EOH Dip Azm (TN) To Interval WO3 % Zone
EQ014 22957 26204 382.7 300.4 -45 45 133.32 143.03 9.71 0.53 Iolanthe
Incl. 134.18 134.47 0.29 2.92 Iolanthe
139.20 139.44 0.24 13.90 Iolanthe
142.78 143.03 0.25 3.25 Iolanthe
146.35 150.40 4.05 1.41 Iolanthe
Incl. 146.35 146.70 0.35 1.65 bluff
150.08 150.40 0.32 16.10 bluff
159.74 165.04 5.30 0.66 bluff
Incl. 159.74 160.12 0.38 2.55 bluff
162.41 162.85 0.44 4.87 bluff
164.90 165.04 0.14 1.79 bluff
261.05 263.30 2.25 1.72 Johnson
Incl. 261.05 261.40 0.35 8.02 Johnson
263.13 263.30 0.17 6.09 Johnson
EQ015 22841 26178 386.8 306.3 -45 50 138.79 147.90 9.11 1.88 Iolanthe
Incl. 139.87 140.91 1.04 2.35 Iolanthe
144.77 145.14 0.37 20.00 Iolanthe
156.35 160.80 4.45 5.09 Iolanthe
Incl. 156.35 156.81 0.46 10.80 Bluff
156.81 157.11 0.30 1.27 Bluff
158.13 158.46 0.33 7.57 Bluff
159.74 160.80 1.06 13.85 Bluff
199.29 209.99 10.70 0.93 Bluff
Incl. 199.29 199.86 0.57 14.15 Bluff
207.23 207.62 0.39 3.12 Bluff
209.88 209.99 0.11 5.63 Bluff
245.85 252.88 7.03 0.33 Johnson
Incl. 245.85 246.35 0.50 1.15 Johnson
247.71 248.11 0.40 1.86 Johnson
252.64 252.88 0.24 4.04 Johnson
263.74 268.90 5.16 1.18 Johnson
Incl. 263.74 264.00 0.26 1.24 Johnson
264.62 265.32 0.70 7.03 Johnson
268.57 268.90 0.33 2.47 Johnson
282.51 290.45 7.94 0.26 Johnson
Incl. 282.51 283.15 0.64 2.97 Johnson
EQ016 23056 26321 380.4 48.4 -45 230
Highlighted (bold) intervals represent where King-Veins (see Company’s 16 October 2020 announcement) have been intersected above 1% WO3 grade.
No Significant Results
• Intervals represent dow nhole depths, not true thickness w ith no applied upper cut
• Results are show n w here w eighted averages are greater than 2m @ 0.25% WO3
EQ Resources Drilling Campaign 2021 Results continuedFrom

Mt Carbine Bankable Feasibility Study – Chapter 3: Geology and Resources
58
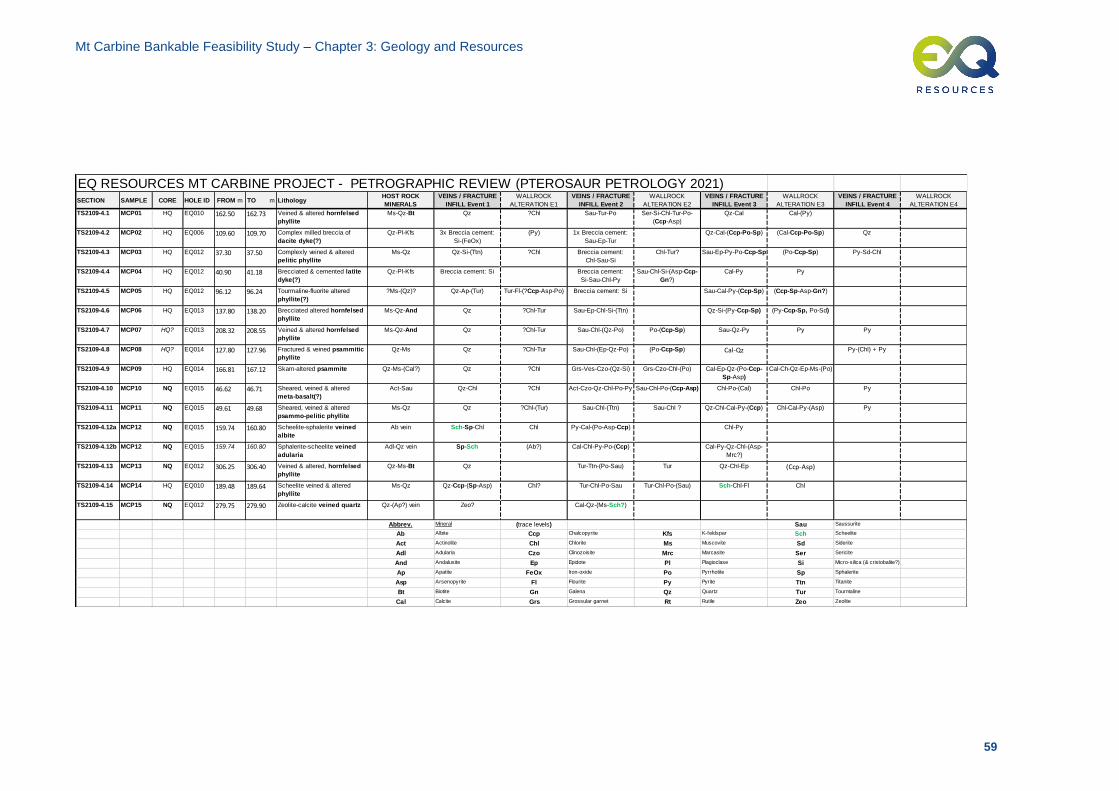
Mt Carbine Bankable Feasibility Study – Chapter 3: Geology and Resources
59
EQ RESOURCES MT CARBINE PROJECT - PETROGRAPHIC REVIEW (PTEROSAUR PETROLOGY 2021)SECTION SAMPLE CORE HOLE ID FROM m TO m Lithology
HOST ROCK
MINERALS
VEINS / FRACTURE
INFILL Event 1
WALLROCK
ALTERATION E1
VEINS / FRACTURE
INFILL Event 2
WALLROCK
ALTERATION E2
VEINS / FRACTURE
INFILL Event 3
WALLROCK
ALTERATION E3
VEINS / FRACTURE
INFILL Event 4
WALLROCK
ALTERATION E4
TS2109-4.1 MCP01 HQ EQ010 162.50 162.73 Veined & altered hornfelsed
phyllite
Ms-Qz-Bt Qz ?Chl Sau-Tur-Po Ser-Si-Chl-Tur-Po-
(Ccp-Asp)
Qz-Cal Cal-(Py)
TS2109-4.2 MCP02 HQ EQ006 109.60 109.70 Complex milled breccia of
dacite dyke(?)
Qz-Pl-Kfs 3x Breccia cement:
Si-(FeOx)
(Py) 1x Breccia cement:
Sau-Ep-Tur
Qz-Cal-(Ccp-Po-Sp) (Cal-Ccp-Po-Sp) Qz
TS2109-4.3 MCP03 HQ EQ012 37.30 37.50 Complexly veined & altered
pelitic phyllite
Ms-Qz Qz-Si-(Ttn) ?Chl Breccia cement:
Chl-Sau-Si
Chl-Tur? Sau-Ep-Py-Po-Ccp-Sp (Po-Ccp-Sp) Py-Sd-Chl
TS2109-4.4 MCP04 HQ EQ012 40.90 41.18 Brecciated & cemented latite
dyke(?)
Qz-Pl-Kfs Breccia cement: Si Breccia cement:
Si-Sau-Chl-Py
Sau-Chl-Si-(Asp-Ccp-
Gn?)
Cal-Py Py
TS2109-4.5 MCP05 HQ EQ012 96.12 96.24 Tourmaline-fluorite altered
phyllite(?)
?Ms-(Qz)? Qz-Ap-(Tur) Tur-Fl-(?Ccp-Asp-Po) Breccia cement: Si Sau-Cal-Py-(Ccp-Sp) (Ccp-Sp-Asp-Gn?)
TS2109-4.6 MCP06 HQ EQ013 137.80 138.20 Brecciated altered hornfelsed
phyllite
Ms-Qz-And Qz ?Chl-Tur Sau-Ep-Chl-Si-(Ttn) Qz-Si-(Py-Ccp-Sp) (Py-Ccp-Sp, Po-Sd)
TS2109-4.7 MCP07 HQ? EQ013 208.32 208.55 Veined & altered hornfelsed
phyllite
Ms-Qz-And Qz ?Chl-Tur Sau-Chl-(Qz-Po) Po-(Ccp-Sp) Sau-Qz-Py Py Py
TS2109-4.8 MCP08 HQ? EQ014 127.80 127.96 Fractured & veined psammitic
phyllite
Qz-Ms Qz ?Chl-Tur Sau-Chl-(Ep-Qz-Po) (Po-Ccp-Sp) Cal-Qz Py-(Chl) + Py
TS2109-4.9 MCP09 HQ EQ014 166.81 167.12 Skarn-altered psammite Qz-Ms-(Cal?) Qz ?Chl Grs-Ves-Czo-(Qz-Si) Grs-Czo-Chl-(Po) Cal-Ep-Qz-(Po-Ccp-
Sp-Asp)
Cal-Ch-Qz-Ep-Ms-(Po)
TS2109-4.10 MCP10 NQ EQ015 46.62 46.71 Sheared, veined & altered
meta-basalt(?)
Act-Sau Qz-Chl ?Chl Act-Czo-Qz-Chl-Po-Py Sau-Chl-Po-(Ccp-Asp) Chl-Po-(Cal) Chl-Po Py
TS2109-4.11 MCP11 NQ EQ015 49.61 49.68 Sheared, veined & altered
psammo-pelitic phyllite
Ms-Qz Qz ?Chl-(Tur) Sau-Chl-(Ttn) Sau-Chl ? Qz-Chl-Cal-Py-(Ccp) Chl-Cal-Py-(Asp) Py
TS2109-4.12a MCP12 NQ EQ015 159.74 160.80 Scheelite-sphalerite veined
albite
Ab vein Sch-Sp-Chl Chl Py-Cal-(Po-Asp-Ccp) Chl-Py
TS2109-4.12b MCP12 NQ EQ015 159.74 160.80 Sphalerite-scheelite veined
adularia
Adl-Qz vein Sp-Sch (Ab?) Cal-Chl-Py-Po-(Ccp) Cal-Py-Qz-Chl-(Asp-
Mrc?)
TS2109-4.13 MCP13 NQ EQ012 306.25 306.40 Veined & altered, hornfelsed
phyllite
Qz-Ms-Bt Qz Tur-Ttn-(Po-Sau) Tur Qz-Chl-Ep (Ccp-Asp)
TS2109-4.14 MCP14 HQ EQ010 189.48 189.64 Scheelite veined & altered
phyllite
Ms-Qz Qz-Ccp-(Sp-Asp) Chl? Tur-Chl-Po-Sau Tur-Chl-Po-(Sau) Sch-Chl-Fl Chl
TS2109-4.15 MCP15 NQ EQ012 279.75 279.90 Zeolite-calcite veined quartz Qz-(Ap?) vein Zeo? Cal-Qz-(Ms-Sch?)
Abbrev. Mineral (trace levels) Sau Saussurite
Ab Albite Ccp Chalcopyrite Kfs K-feldspar Sch Scheelite
Act Actinolite Chl Chlorite Ms Muscovite Sd Siderite
Adl Adularia Czo Clinozoisite Mrc Marcasite Ser Sericite
And Andalusite Ep Epidote Pl Plagioclase Si Micro-silica (& cristobalite?)
Ap Apatite FeOx Iron-oxide Po Pyrrhotite Sp Sphalerite
Asp Arsenopyrite Fl Flourite Py Pyrite Ttn Titanite
Bt Biotite Gn Galena Qz Quartz Tur Tourmaline
Cal Calcite Grs Grossular garnet Rt Rutile Zeo Zeolite

Mt Carbine Bankable Feasibility Study – Chapter 3: Geology and Resources
60
Sample MCP01
Rock Type Hole ID From To
Chert with qz/scheelite/sulphides and black and green minerals EQ010 162.5 162.73
Sample MCP02
Rock Type Hole ID From To
Chert in hanging wall EQ006 109.6 109.7
Sample MCP03
Rock Type Hole ID From To
Metavolcanics/metasediment/chert mixture in hanging wall EQ012 37.3 37.5
Sample MCP04

Mt Carbine Bankable Feasibility Study – Chapter 3: Geology and Resources
61
Rock Type Hole ID From To
Felsite dyke containing spotty black mineral with halos EQ012 40.94 41.18
Sample MCP05
Rock Type Hole ID From To
Qz vein with dravite and fluorapatite EQ012 96.12 96.24
Sample MCP06
Rock Type Hole ID From To
Metavolcanics/metasediment In hanging wall EQ013 137.8 138.2
Sample MCP07
Rock Type Hole ID From To
Metasediment with spotty black mineral EQ013 208.32 208.55
Sample MCP08

Mt Carbine Bankable Feasibility Study – Chapter 3: Geology and Resources
62
Rock Type Hole ID From To
Metasediments in footwall EQ014 127.8 127.96
Sample MCP09
Rock Type Hole ID From To
Potassic alteration EQ014 166.81 167.12
Sample MCP10
Rock Type Hole ID From To
Metavolcanics in footwall EQ015 46.62 46.71
Sample MCP11
Rock Type Hole ID From To
Metasediment + chert in footwall EQ015 49.61 49.68
Sample MCP12

Mt Carbine Bankable Feasibility Study – Chapter 3: Geology and Resources
63
Rock Type Hole ID From To
Mineralised vein with altered k-feldspar EQ015 159.74 160.8
Sample MCP13
Rock Type Hole ID From To
Metasediment EQ012 306.25 306.4
Sample MCP14
Rock Type Hole ID From To
Metasediment + chert with scheelite EQ010 189.48 189.64
Sample MCP15
Rock Type Hole ID From To
Grey/blue Qz vein with minor scheelite/fluorapatite EQ012 279.75 279.9

Mt Carbine Bankable Feasibility Study – Chapter 3: Geology and Resources
64
Example of Petrological Study on Rock Types & Mineralisation

Mt Carbine Bankable Feasibility Study – Chapter 3: Geology and Resources
65

Mt Carbine Bankable Feasibility Study – Chapter 3: Geology and Resources
66

Mt Carbine Bankable Feasibility Study – Chapter 3: Geology and Resources
67

Mt Carbine Bankable Feasibility Study – Chapter 3: Geology and Resources
68

Mt Carbine Bankable Feasibility Study – Chapter 3: Geology and Resources
69

Mt Carbine Bankable Feasibility Study – Chapter 3: Geology and Resources
70

Mt Carbine Bankable Feasibility Study – Chapter 3: Geology and Resources
71

Mt Carbine Bankable Feasibility Study – Chapter 3: Geology and Resources
72

Mt Carbine Bankable Feasibility Study – Chapter 3: Geology and Resources
73
Hole_ID Sample No Blank Type WO3%
EQ001 100033 Blank Core 0.005044
EQ001 100063 Blank Core 0.001261
EQ001 100083 Blank Core 0.001261
EQ001 100103 Blank Core 0
EQ002 100137 Blank Core 0.001261
EQ002 100157 Blank Core 0
EQ002 100177 Blank Core 0.002522
EQ003 100379 Blank Core 0.002
EQ003 100399 Blank Core 0.002
EQ003 100419 Blank Core 0.002
EQ003 100439 Blank Core 0.001
EQ003 100459 Blank Core <0.001
EQ003 100479 Blank Core 0.001
EQ003 100499 Blank Core 0.001
EQ004 100526 Blank Core 0.003
EQ004 100546 Blank Core 0.003
EQ004 100566 Blank Core <0.001
EQ004 100586 Blank Core 0.004
EQ004 100606 Blank Core <0.001
EQ004 100626 Blank Core 0.002
EQ005 100663 Blank 1058 0.001% WO3 0.004
EQ005 100683 Blank 1058 0.001% WO3 0.004
EQ005 100703 Blank 1058 0.001% WO3 0.004
EQ005 100723 Blank Core 0.004
EQ005 100743 Blank 1058 0.001% WO3 0.001
EQ005 100763 Blank 1058 0.001% WO3 0.003
EQ006 100211 Blank Core 0.001261
EQ006 100231 Blank Core 0.003783
EQ006 100251 Blank Core 0.002522
EQ006 100271 Blank Core 0.001261
EQ006 100291 Blank Core 0.001261
EQ006 100311 Blank Core 0.003783
EQ006 100331 Blank Core 0.005044
EQ006 100351 Blank Core 0.003783
EQ007 100798 Blank Core 0.02
EQ007 100818 Blank Core 0.009
EQ008 100853 Blank Core 0.008
EQ009 100897 Blank 1083 0.003% WO3 0.001
EQ009 100907 Blank 1083 0.003% WO3 0.005
EQ009 100927 Blank 1083 0.003% WO3 0.003
EQ009 100947 Blank 1083 0.003% WO3 0.005
EQ009 100967 Blank 1083 0.003% WO3 0.001
EQ010 100995 Blank 1083 0.003% WO3 0.002
EQ010 101015 Blank Core 0.003
EQ010 101035 Blank Core 0.003
EQ010 101091 Blank Core <0.001
EQ011 101122 Blank 1031 0.002% WO3 0.001
EQ011 101132 Blank 1031 0.002% WO3 0.007
EQ011 101152 Blank 1031 0.002% WO3 0.002
EQ011 101172 Blank 1031 0.002% WO3 0.001
EQ012 101207 Blank 1031 0.002% WO3 0.009
EQ012 101227 Blank 1031 0.002% WO3 0.003
EQ012 101247 Blank 1031 0.002% WO3 0.004
EQ012 101267 Blank 1031 0.002% WO3 0.004
EQ012 101287 Blank Core 0.002
EQ012 101307 Blank 1031 0.002% WO3 0.002
EQ012 101056 Blank Core 0.024
EQ013 101339 Blank Core 0.001
EQ013 101359 Blank Core 0.002
EQ013 101379 Blank Core <0.001
EQ014 101406 Blank Core <0.001
EQ014 101426 Blank Core <0.001
EQ014 101446 Blank Core 0.002
EQ015 101472 Blank Core 0.002
EQ015 101492 Blank Core <0.001
EQ015 101512 Blank Core 0.002
EQ015 101532 Blank Core <0.001
Hole_ID Sample NoPrevious
sample No
Previous
grade (ME-
XRF15b)
WO3% (ME-
XRF15b)error
EQ001 100023 1014 0.688 0.692 0.004
EQ001 100043 1052 0.046 0.044 -0.002
EQ001 100053 1047 2.850 2.875 0.025
EQ001 100073 1052 0.046 0.043 -0.003
EQ001 100093 1052 0.046 0.044 -0.002
EQ001 100113 1052 0.046 0.044 -0.002
EQ002 100127 1043 0.206 0.207 0.001
EQ002 100147 1026 0.366 0.361 -0.005
EQ002 100167 1026 0.366 0.364 -0.002
EQ002 100187 1043 0.206 0.207 0.001
EQ003 100369 1003 4.320 4.300 -0.020
EQ003 100389 1043 0.206 0.204 -0.002
EQ003 100409 1026 0.366 0.366 0.000
EQ003 100429 1026 0.366 0.372 0.006
EQ003 100449 1043 0.206 0.205 -0.001
EQ003 100469 1026 0.366 0.367 0.001
EQ003 100489 1026 0.366 0.372 0.006
EQ004 100516 1003 4.320 4.320 0.000
EQ004 100536 1026 0.366 0.362 -0.004
EQ004 100556 1026 0.366 0.370 0.004
EQ004 100576 1043 0.206 0.207 0.001
EQ004 100596 1026 0.366 0.369 0.003
EQ004 100616 1026 0.366 0.363 -0.003
EQ004 100636 1034 0.444 0.431 -0.013
EQ005 100653 1024 0.128 0.126 -0.002
EQ005 100673 1024 0.128 0.130 0.002
EQ005 100693 1024 0.128 0.126 -0.002
EQ005 100713 1024 0.128 0.128 0.000
EQ005 100733 1023 1.595 1.595 0.000
EQ005 100753 1024 0.128 0.124 -0.004
EQ005 100773 1023 1.595 1.585 -0.010
EQ006 100201 1003 4.320 4.338 0.018
EQ006 100221 1026 0.366 0.366 0.000
EQ006 100241 1026 0.366 0.357 -0.009
EQ006 100261 1026 0.366 0.362 -0.004
EQ006 100281 1026 0.366 0.357 -0.009
EQ006 100301 1043 0.206 0.207 0.001
EQ006 100321 1026 0.366 0.358 -0.008
EQ006 100341 1003 4.320 4.275 -0.045
EQ007 100788 1024 0.128 0.122 -0.006
EQ007 100808 1122 0.108 0.099 -0.009
EQ007 100828 1122 0.108 0.102 -0.006
EQ008 100843 1122 0.108 0.100 -0.008
EQ008 100863 1099 0.110 0.105 -0.005
EQ009 100877 1023 1.595 1.585 -0.010
EQ009 100887 1017 1.885 1.880 -0.005
EQ009 100917 1099 0.110 0.102 -0.008
EQ009 100937 1099 0.110 0.102 -0.008
EQ009 100957 1023 1.595 1.575 -0.020
EQ010 100985 1072 0.146 0.144 -0.002
EQ010 101005 1023 1.595 1.570 -0.025
EQ010 101025 1072 0.146 0.140 -0.006
EQ010 101081 1074 0.251 0.243 -0.008
EQ011 101102 1009 0.855 0.837 -0.018
EQ011 101112 1023 1.595 1.575 -0.020
EQ011 101142 1016 0.047 0.050 0.003
EQ011 101162 1016 0.047 0.050 0.003
EQ011 101182 1038 0.031 0.031 0.000
EQ012 101197 1038 0.031 0.031 0.000
EQ012 101217 1016 0.047 0.048 0.001
EQ012 101237 1038 0.031 0.030 -0.001
EQ012 101257 1016 0.047 0.052 0.005
EQ012 101277 1038 0.031 0.031 0.000
EQ012 101297 1038 0.031 0.033 0.002
EQ012 101317 1038 0.031 0.033 0.002
EQ012 101046 1023 1.595 1.575 -0.020
EQ012 101066 1074 0.251 0.244 -0.007
EQ013 101329 1038 0.031 0.038 0.007
EQ013 101349 1038 0.031 0.031 0.000
EQ013 101369 1006 3.090 3.060 -0.030
EQ014 101396 100186 1.419 1.420 0.001
EQ014 101416 100138 0.453 0.468 0.015
EQ014 101436 100138 0.453 0.457 0.004
EQ015 101462 100138 0.453 0.455 0.002
EQ015 101482 100186 1.419 1.420 0.001
EQ015 101502 100138 0.453 0.456 0.003
EQ015 101522 100138 0.453 0.453 0.000
EQ015 101542 100138 0.453 0.452 -0.001
EQ016 101555 100138 0.453 0.456 0.003

Mt Carbine Bankable Feasibility Study – Chapter 3: Geology and Resources
74

Mt Carbine Bankable Feasibility Study – Chapter 3: Geology and Resources
75

Mt Carbine Bankable Feasibility Study – Chapter 3: Geology and Resources
76
Survey Stations & Local Grid Conversion

Mt Carbine Bankable Feasibility Study – Chapter 3: Geology and Resources
77

Mt Carbine Bankable Feasibility Study – Chapter 3: Geology and Resources
78
REGISTERED OFFICE:
Level 4, 100 Albert Road, South Melbourne, VIC 3205
ABN: 77 115 009 106 (ASX: EQR)
T: (07) 4094 3072
F: (07) 4094 3036
W: eqresources.com.au