DB2 PM Online Monitor User's Guide - Your.Org
318
DB2 Performance Monitor for OS/390 Online Monitor User’s Guide Version 6 SC26-9168-00 IBM
-
Upload
khangminh22 -
Category
Documents
-
view
1 -
download
0
Transcript of DB2 PM Online Monitor User's Guide - Your.Org

DB2 Performance Monitor for OS/390
Online Monitor User’s GuideVersion 6
SC26-9168-00
IBM
NoteBefore using this information and the product it supports, be sure to read the information in “Appendix C. Notices” onpage 277.
First Edition, June 1999
This edition applies to Version 6 of IBM DATABASE 2 Performance Monitor for OS/390, a feature ofIBM DATABASE 2 Universal Database Server for OS/390 Version 6 (5645-DB2), and to all subsequent releases andmodifications until otherwise indicated in new editions.
© Copyright International Business Machines Corporation 1985, 1999. All rights reserved.US Government Users Restricted Rights – Use, duplication or disclosure restricted by GSA ADP Schedule Contractwith IBM Corp.

Contents
About This Book . . . . . . . . . . . . . . . . . . . . . . . ixWho Should Read This Book . . . . . . . . . . . . . . . . . . . ixHow to Send Your Comments . . . . . . . . . . . . . . . . . . . ixHow to Use This Book . . . . . . . . . . . . . . . . . . . . . . xHow This Book Is Organized . . . . . . . . . . . . . . . . . . . xProgramming Interface Information . . . . . . . . . . . . . . . . . xiPrerequisites . . . . . . . . . . . . . . . . . . . . . . . . . xiiHow to Read the Syntax Diagrams . . . . . . . . . . . . . . . . . xiiSummary of Changes . . . . . . . . . . . . . . . . . . . . . . xiii
Workstation Online Monitor for Windows NT and OS/2 . . . . . . . . . xivDB2 PM Installer . . . . . . . . . . . . . . . . . . . . . . . xiv
Part 1. Overview of the Online Monitor . . . . . . . . . . . . . . . . . . . . 1
Chapter 1. Introduction to the Online Monitor . . . . . . . . . . . . 3Purpose and Function . . . . . . . . . . . . . . . . . . . . . . 3DB2 Performance Data Generation . . . . . . . . . . . . . . . . . 4Overview of the Online Monitor . . . . . . . . . . . . . . . . . . 4
Display Thread Activity. . . . . . . . . . . . . . . . . . . . . 4Display Statistics . . . . . . . . . . . . . . . . . . . . . . . 5Display System Parameters . . . . . . . . . . . . . . . . . . . 5Options . . . . . . . . . . . . . . . . . . . . . . . . . . 5Control Exception Processing . . . . . . . . . . . . . . . . . . 6Collect Report Data . . . . . . . . . . . . . . . . . . . . . . 6IRF - Create and Execute DB2 PM Commands . . . . . . . . . . . 6IRF - Display and Print Graphs . . . . . . . . . . . . . . . . . 6IRF - Maintain Parameter Data Sets. . . . . . . . . . . . . . . . 7Explain . . . . . . . . . . . . . . . . . . . . . . . . . . 7
Chapter 2. Monitoring and Problem Determination . . . . . . . . . . 9The DB2 Operating Environment . . . . . . . . . . . . . . . . . . 10Performance Objectives and Exception Processing . . . . . . . . . . . 10Monitoring . . . . . . . . . . . . . . . . . . . . . . . . . . 11
Monitoring Using Reports. . . . . . . . . . . . . . . . . . . . 11Monitoring Using the Online Monitor. . . . . . . . . . . . . . . . 12
Observing Trends . . . . . . . . . . . . . . . . . . . . . . . 12Determining Problems . . . . . . . . . . . . . . . . . . . . . . 12
Problems Detected in Periodic Exception Processing . . . . . . . . . 12Problems Detected in Exception Event Processing . . . . . . . . . . 13Problems Detected in Exception Reports . . . . . . . . . . . . . . 14
Other Uses for DB2 PM . . . . . . . . . . . . . . . . . . . . . 14
Part 2. How to Use the Online Monitor . . . . . . . . . . . . . . . . . . . . 15
Chapter 3. Using the Online Monitor . . . . . . . . . . . . . . . . 17Authority . . . . . . . . . . . . . . . . . . . . . . . . . . . 17Input Data . . . . . . . . . . . . . . . . . . . . . . . . . . 17Accessing the Online Monitor . . . . . . . . . . . . . . . . . . . 18Moving between Panels . . . . . . . . . . . . . . . . . . . . . 19Updating Values . . . . . . . . . . . . . . . . . . . . . . . . 19Leaving the Online Monitor . . . . . . . . . . . . . . . . . . . . 20Online Monitor Options . . . . . . . . . . . . . . . . . . . . . 21
© Copyright IBM Corp. 1985, 1999 iii
DB2 Subsystem Windows . . . . . . . . . . . . . . . . . . . 22History Defaults Window . . . . . . . . . . . . . . . . . . . . 24History Thread Qualification Window . . . . . . . . . . . . . . . 25Monitor Output Window . . . . . . . . . . . . . . . . . . . . 25Auto Display Window . . . . . . . . . . . . . . . . . . . . . 26Session Options . . . . . . . . . . . . . . . . . . . . . . . 27Current SQLID Window . . . . . . . . . . . . . . . . . . . . 28
Online Help . . . . . . . . . . . . . . . . . . . . . . . . . . 29Function Key Default Settings . . . . . . . . . . . . . . . . . . . 29Issuing DB2 Commands . . . . . . . . . . . . . . . . . . . . . 32COLLECT Command . . . . . . . . . . . . . . . . . . . . . . 33OPTIONS Command . . . . . . . . . . . . . . . . . . . . . . 34Correlation ID Translation . . . . . . . . . . . . . . . . . . . . 34
Changing the Default Translation . . . . . . . . . . . . . . . . . 35How Large and Missing Values Are Displayed . . . . . . . . . . . . . 35Elapsed Time Formats. . . . . . . . . . . . . . . . . . . . . . 36Date Formats . . . . . . . . . . . . . . . . . . . . . . . . . 36
Chapter 4. Common Errors Using DB2 PM . . . . . . . . . . . . . 37STEPLIB Missing from IRF-Generated JCL . . . . . . . . . . . . . . 37Command Not Found . . . . . . . . . . . . . . . . . . . . . . 37
Part 3. Monitoring and Tuning with the Online Monitor . . . . . . . . . . . . . 39
Chapter 5. Viewing Past Data . . . . . . . . . . . . . . . . . . 43
Chapter 6. Exception Processing . . . . . . . . . . . . . . . . . 47Exception Processing Modes . . . . . . . . . . . . . . . . . . . 47
Display Exception Processing . . . . . . . . . . . . . . . . . . 47Periodic Exception Processing . . . . . . . . . . . . . . . . . . 48Exception Event Processing. . . . . . . . . . . . . . . . . . . 48Past Data and Exceptions . . . . . . . . . . . . . . . . . . . 49
Exception Notification Window . . . . . . . . . . . . . . . . . . . 49Difference between Batch and Online Monitor Exception Processing . . . . . 50How to Define Exception Threshold Values . . . . . . . . . . . . . . 50
Notes on Matching Instrumentation and Records . . . . . . . . . . . 55How to Start Exception Processing . . . . . . . . . . . . . . . . . 56
Exception Processor Panel . . . . . . . . . . . . . . . . . . . 56Starting Display Exception Processing . . . . . . . . . . . . . . . 59Starting Periodic Exception Processing. . . . . . . . . . . . . . . 59Starting Exception Event Notification . . . . . . . . . . . . . . . 59
How to Restart Exception Processing . . . . . . . . . . . . . . . . 59REINIT Command . . . . . . . . . . . . . . . . . . . . . . 60
Examining Exception Messages . . . . . . . . . . . . . . . . . . 60Examining the Periodic Exceptions List . . . . . . . . . . . . . . 62Examining Periodic Exception Messages . . . . . . . . . . . . . . 63Examining the Display Exception List . . . . . . . . . . . . . . . 64Examining Authorization Failure Summary . . . . . . . . . . . . . 65Examining Exception Event Summary . . . . . . . . . . . . . . . 66Examining Exception Event Messages . . . . . . . . . . . . . . . 67
Exception Processor Output Data Sets. . . . . . . . . . . . . . . . 67Exception Log File Data Set. . . . . . . . . . . . . . . . . . . 67Exception DPMOUT Data Set . . . . . . . . . . . . . . . . . . 68
Stopping Exception Processing . . . . . . . . . . . . . . . . . . 69
Chapter 7. Displaying Thread Activity . . . . . . . . . . . . . . . 71
iv DB2 PM Online Monitor User’s Guide

Panels . . . . . . . . . . . . . . . . . . . . . . . . . . . 72Display Thread Activity Overview . . . . . . . . . . . . . . . . . . 72
Accounting Times . . . . . . . . . . . . . . . . . . . . . . 73Parallelism Considerations . . . . . . . . . . . . . . . . . . . 74
Thread Summary Panel . . . . . . . . . . . . . . . . . . . . . 76Thread Detail Panel. . . . . . . . . . . . . . . . . . . . . . . 79Thread Activity Windows . . . . . . . . . . . . . . . . . . . . . 82
Thread Identification Window . . . . . . . . . . . . . . . . . . 82Current Package/DBRM Window . . . . . . . . . . . . . . . . . 85Thread Times Window . . . . . . . . . . . . . . . . . . . . . 88Locking (IRLM) Activity Window . . . . . . . . . . . . . . . . . 90Locked Resources Window . . . . . . . . . . . . . . . . . . . 93RID List Processing Window . . . . . . . . . . . . . . . . . . 95SQL Activity Window . . . . . . . . . . . . . . . . . . . . . 96Buffer Manager Activity Window . . . . . . . . . . . . . . . . . 99SQL Statement and Package Window . . . . . . . . . . . . . . . 101Distributed Data Window . . . . . . . . . . . . . . . . . . . . 102IFI (Class 5) and Data Capture Window . . . . . . . . . . . . . . 105Query Parallelism Data Window . . . . . . . . . . . . . . . . . 106Data Sharing Locking Activity Window . . . . . . . . . . . . . . . 109Group Buffer Pools Activity Window . . . . . . . . . . . . . . . . 110Stored Procedures Window . . . . . . . . . . . . . . . . . . . 112
Thread Activity Commands . . . . . . . . . . . . . . . . . . . . 112AUTO Command. . . . . . . . . . . . . . . . . . . . . . . 112EXPLAIN Command . . . . . . . . . . . . . . . . . . . . . 113HISTORY Command . . . . . . . . . . . . . . . . . . . . . 114RESET Command . . . . . . . . . . . . . . . . . . . . . . 115PURGE Command . . . . . . . . . . . . . . . . . . . . . . 115QUALIFY Command . . . . . . . . . . . . . . . . . . . . . 116SORT Command . . . . . . . . . . . . . . . . . . . . . . . 120
Chapter 8. Viewing DB2 Statistics . . . . . . . . . . . . . . . . . 125Statistics Panels . . . . . . . . . . . . . . . . . . . . . . . . 126Statistics Processing Modes. . . . . . . . . . . . . . . . . . . . 126
Regular Processing Mode . . . . . . . . . . . . . . . . . . . 127Interval Processing Mode. . . . . . . . . . . . . . . . . . . . 127Delta Processing Mode . . . . . . . . . . . . . . . . . . . . 127
Statistics Panel Overview. . . . . . . . . . . . . . . . . . . . . 130DB2 Statistics Detail Panel . . . . . . . . . . . . . . . . . . . . 130DB2 Statistics Windows . . . . . . . . . . . . . . . . . . . . . 133
EDM Pool Window . . . . . . . . . . . . . . . . . . . . . . 133Buffer Manager Window . . . . . . . . . . . . . . . . . . . . 134Locking Activity Window . . . . . . . . . . . . . . . . . . . . 140Open/Close Management Window . . . . . . . . . . . . . . . . 142Bind Processing Window . . . . . . . . . . . . . . . . . . . . 143Plan and Package Allocation Window . . . . . . . . . . . . . . . 145Log Manager Window . . . . . . . . . . . . . . . . . . . . . 145Subsystem Service Window. . . . . . . . . . . . . . . . . . . 147SQL Activity Window . . . . . . . . . . . . . . . . . . . . . 150PREPARE Detail Window . . . . . . . . . . . . . . . . . . . 152Query Parallelism Data Window . . . . . . . . . . . . . . . . . 153RID List Processing Window . . . . . . . . . . . . . . . . . . 155Distributed Data Window . . . . . . . . . . . . . . . . . . . . 156CPU Times and Other Data Window . . . . . . . . . . . . . . . 159Data Sharing Locking Activity Window . . . . . . . . . . . . . . . 163Group Buffer Pools Activity Window . . . . . . . . . . . . . . . . 166
Contents v
Global Group Buffer Pool Statistics Window . . . . . . . . . . . . . 169Stored Procedures Window . . . . . . . . . . . . . . . . . . . 172
Statistics Commands . . . . . . . . . . . . . . . . . . . . . . 172AUTO Command. . . . . . . . . . . . . . . . . . . . . . . 172DELTA Command . . . . . . . . . . . . . . . . . . . . . . 174INTERVAL Command . . . . . . . . . . . . . . . . . . . . . 174RESET Command . . . . . . . . . . . . . . . . . . . . . . 175HISTORY Command . . . . . . . . . . . . . . . . . . . . . 175History and Statistics Processing Modes . . . . . . . . . . . . . . 176
Chapter 9. Monitoring the Access Path—Explain . . . . . . . . . . . 177Authorizations Required to Use Explain . . . . . . . . . . . . . . . 177Performance Considerations . . . . . . . . . . . . . . . . . . . 178What to Look for in the EXPLAIN Information . . . . . . . . . . . . . 179Plan Table Considerations . . . . . . . . . . . . . . . . . . . . 180
Create PLAN_TABLE . . . . . . . . . . . . . . . . . . . . . 180Upgrade PLAN_TABLE . . . . . . . . . . . . . . . . . . . . 181
Explain an SQL Statement . . . . . . . . . . . . . . . . . . . . 181Explaining an SQL Statement from Thread Activity . . . . . . . . . . 182Selecting Explain from the Online Monitor Main Menu . . . . . . . . . 182Explaining an SQL Statement from an ISPF/PDF Editor . . . . . . . . 183
Explain Menu . . . . . . . . . . . . . . . . . . . . . . . . . 183Explain Existing Entry in Plan Table . . . . . . . . . . . . . . . . 184Explain an SQL Statement of a Package . . . . . . . . . . . . . . 186Explain an SQL Statement of a DBRM . . . . . . . . . . . . . . . 188Explain Dynamic SQL Statement . . . . . . . . . . . . . . . . . 190SQL Text Edit Panel . . . . . . . . . . . . . . . . . . . . . 191
Explain Output. . . . . . . . . . . . . . . . . . . . . . . . . 192DB2 Explain Output Panel . . . . . . . . . . . . . . . . . . . 192
Online Monitor EXPLAIN Command . . . . . . . . . . . . . . . . . 194Source Explain . . . . . . . . . . . . . . . . . . . . . . . . 194
Source Explain Options Window . . . . . . . . . . . . . . . . . 195SQL Statement Selection Panel . . . . . . . . . . . . . . . . . 197Source EXPLAIN Command . . . . . . . . . . . . . . . . . . 197
Chapter 10. Viewing System Parameters . . . . . . . . . . . . . . 199DB2 System Parameters Detail Panel . . . . . . . . . . . . . . . . 199System Parameters Commands . . . . . . . . . . . . . . . . . . 200
HISTORY Command . . . . . . . . . . . . . . . . . . . . . 201
Chapter 11. Problem Identification Examples . . . . . . . . . . . . 203Example of Exception Processing . . . . . . . . . . . . . . . . . 203Example of Thread Monitoring . . . . . . . . . . . . . . . . . . . 215Using the Online Monitor in Deadlock Resolution . . . . . . . . . . . . 221
Deadlock Detection . . . . . . . . . . . . . . . . . . . . . . 221Deadlock Resolution . . . . . . . . . . . . . . . . . . . . . 221
Part 4. Customizing the Online Monitor . . . . . . . . . . . . . . . . . . . .223
Chapter 12. Tailoring Exception Thresholds—Exception Profiling . . . . 225Exception Profiling Panel . . . . . . . . . . . . . . . . . . . . . 225Profiling Method . . . . . . . . . . . . . . . . . . . . . . . . 226Exception Profiling Input Data . . . . . . . . . . . . . . . . . . . 227Sample Exception Profiling Report . . . . . . . . . . . . . . . . . 227
Chapter 13. Customizing Panels . . . . . . . . . . . . . . . . . 229
vi DB2 PM Online Monitor User’s Guide

Panel Customization Example . . . . . . . . . . . . . . . . . . . 229How to Customize Panels . . . . . . . . . . . . . . . . . . . . 230
Tailoring the Thread Detail Panel . . . . . . . . . . . . . . . . . 230Editing Exception Fields . . . . . . . . . . . . . . . . . . . . 231Editing Selection Fields . . . . . . . . . . . . . . . . . . . . 231
Chapter 14. Data Collector Purpose and Function . . . . . . . . . . 233Viewing Past Data . . . . . . . . . . . . . . . . . . . . . . . 233Periodic Exceptions . . . . . . . . . . . . . . . . . . . . . . . 233Exception Events. . . . . . . . . . . . . . . . . . . . . . . . 234Collection of Parallelism Data . . . . . . . . . . . . . . . . . . . 234Data Agent for Workstation Online Monitor . . . . . . . . . . . . . . 234
Chapter 15. Administrator User . . . . . . . . . . . . . . . . . . 235Active Data Collector List Window . . . . . . . . . . . . . . . . . 235Data Collector Parameters Window . . . . . . . . . . . . . . . . . 235History Qualification Window . . . . . . . . . . . . . . . . . . . 237
Part 5. Appendixes . . . . . . . . . . . . . . . . . . . . . . . . . . . . .239
Appendix A. Online Monitor Field Table . . . . . . . . . . . . . . 241
Appendix B. Exception Log File Output Record . . . . . . . . . . . 273Layout of the Exception Log File Output Record . . . . . . . . . . . . 273
Appendix C. Notices . . . . . . . . . . . . . . . . . . . . . . 277Trademarks and Service Marks . . . . . . . . . . . . . . . . . . 278
Glossary . . . . . . . . . . . . . . . . . . . . . . . . . . 281
Bibliography . . . . . . . . . . . . . . . . . . . . . . . . . 289
Index . . . . . . . . . . . . . . . . . . . . . . . . . . . . 291
Readers’ Comments — We’d Like to Hear from You . . . . . . . . . . 301
Contents vii

viii DB2 PM Online Monitor User’s Guide
About This Book
This book describes how to use the Online Monitor of IBM DATABASE 2(TM)Performance Monitor for OS/390 Version 6. DB2 PM is a performance analysis toolthat helps you monitor and tune the following IBM DATABASE 2 products:
v IBM DATABASE 2 Universal Database Server for OS/390 (DB2 UDB for OS/390)Version 6, Program Product 5645-DB2
v IBM DATABASE 2 Server for OS/390 (DB2 for OS/390) Version 5, ProgramProduct 5655-DB2
v IBM DATABASE 2 for MVS/ESA (DB2 MVS/ESA(TM)) Version 4, ProgramProduct 5695-DB2.
DB2 PM Version 6 is a feature of DB2 UDB for OS/390.
The tuning information in this book may not be appropriate for all sites. In particular,the tuning information in this book applies to situations from a performanceviewpoint only. At some sites, there may be other factors of higher priority that needto be considered.
The panel examples shown in this book apply to DB2 UDB for OS/390 Version 6unless otherwise specified. In some cases, panel examples for DB2 for OS/390Version 5 and DB2 for MVS/ESA Version 4 are also shown where they displayinformation not shown on the DB2 UDB for OS/390 Version 6 panel of the samename. All panels have a short and long function key display. In this book, only thelong form is shown under the command line.
Who Should Read This Book
This book is helpful to any DB2 user responsible for one or more of the followingactivities:v Determining total DB2 system performance and efficiencyv Analyzing and improving SQL statementsv Tuning DB2 subsystems and DB2 applicationsv Identifying and removing potential bottlenecks in the systemv Problem determination.
How to Send Your Comments
Your feedback is important in helping to provide the most accurate and high-qualityinformation. If you have any comments about this book or any other DB2 PMdocumentation, send your comments using:
v Internet. The address is: [email protected].
v The form at the back of this book. Return it by mail or fax, or give it to an IBMrepresentative. The fax number is: +49-7031-166901.
v IBM Mail Exchange. The address is: DEIBM3P3 at IBMMAIL.
Be sure to include the name of the book, the version of DB2 PM, and, if applicable,the specific location of the text you are commenting on (for example, a pagenumber or a table number).
© Copyright IBM Corp. 1985, 1999 ix

How to Use This Book
Whether you are a database administrator, a data processing manager, a DB2application programmer, or a system programmer, read “Chapter 1. Introduction tothe Online Monitor” on page 3 and “Chapter 2. Monitoring and ProblemDetermination” on page 9 the first time you use this book. We also recommend thatyou read “Authority” on page 17, and “Input Data” on page 17. Any time you havequestions about a specific Online Monitor function, refer to the correspondingchapter.
How This Book Is Organized
This book describes the Online Monitor performance analysis tool. It consists of thefollowing chapters:
v “Chapter 1. Introduction to the Online Monitor” on page 3 describes the purposeand function of the Online Monitor, and gives an overview of the Online Monitormain menu options.
v “Chapter 2. Monitoring and Problem Determination” on page 9 describes howDB2 PM supports monitoring and tuning.
v “Chapter 3. Using the Online Monitor” on page 17 describes the Online Monitoroptions, using the online help, the function key default settings, Interactive ReportFacility (IRF) options, how the Online Monitor performs correlation ID translation,how to issue DB2 commands from the Online Monitor, global commands, andcommon errors encountered when using DB2 PM.
v “Chapter 4. Common Errors Using DB2 PM” on page 37 describes problemsoften encountered using DB2 PM.
v “Chapter 5. Viewing Past Data” on page 43 describes how to view previousthread activity data, previous DB2 statistics, and previous DB2 systemparameters.
v “Chapter 6. Exception Processing” on page 47 describes display exception,periodic exception, and exception event processing. This chapter also coversexception threshold data set maintenance.
v “Chapter 7. Displaying Thread Activity” on page 71 describes the thread activitypanels, associated commands, thread activity tuning information, and the threaddiagnosis panels.
v “Chapter 8. Viewing DB2 Statistics” on page 125 describes the statistics panels,associated commands, and statistics tuning information.
v “Chapter 9. Monitoring the Access Path—Explain” on page 177 describes OnlineMonitor explain, source explain, associated panels and commands, performanceconsiderations, and tuning advice.
v “Chapter 10. Viewing System Parameters” on page 199 describes the systemparameters option and the DB2 System Parameters Detail panel.
v “Chapter 11. Problem Identification Examples” on page 203 shows examples ofusing the Online Monitor to identify potential problems on a subsystem-wide orthread basis.
v “Chapter 12. Tailoring Exception Thresholds—Exception Profiling” on page 225describes how to use DB2 PM to calculate exception thresholds from previoussystem activity.
x DB2 PM Online Monitor User’s Guide
v “Chapter 13. Customizing Panels” on page 229 describes how to customize theThread Detail panel, DB2 Statistics Detail panel, and DB2 System ParametersDetail panel.
v “Chapter 14. Data Collector Purpose and Function” on page 233 describes thepurpose and function of the data collector, and how it affects various datacollector dependent functions.
v “Chapter 15. Administrator User” on page 235 describes the purpose of anadministrator user and the administrator dialog panels in detail.
Programming Interface Information
This publication is intended as a guide for using the DB2 PM Online Monitor tomonitor and tune DB2.
This publication also documents product-sensitive programming interface andassociated guidance information provided by IBM DATABASE 2 (DB2) only, as wellas diagnosis, modification, or tuning information provided by IBM DATABASE 2Performance Monitor (DB2 PM) only.
Product-sensitive programming interfaces allow the customer installation to performtasks such as diagnosing, modifying, monitoring, repairing, tailoring, or tuning DB2.Use of such interfaces creates dependencies on the detailed design orimplementation of the IBM software product. Product-sensitive programminginterfaces should be used only for these specialized purposes. Because of theirdependencies on detailed design and implementation, it is to be expected thatprograms written to such interfaces may need to be changed in order to run withnew product releases or versions, or as a result of service.
Product-sensitive programming interface and associated guidance information isidentified where it occurs by the following marking:
Product-Sensitive Programming Interface
Product-sensitive programming interface and associated guidance information...
End of Product-Sensitive Programming Interface
Diagnosis, modification, or tuning information is provided to help the customerperform diagnosis, monitoring, or tuning of DB2.
Warning: Do not use this diagnosis, modification, or tuning information as aprogramming interface.
Diagnosis, modification, or tuning information is identified where it occurs by thefollowing marking:
Diagnosis, Modification, or Tuning Information
Diagnosis, modification, or tuning information...
End of Diagnosis, Modification, or Tuning Information
About This Book xi
Prerequisites
A working knowledge of, and experience with, either one of the following IBMDATABASE 2 products is required:
v DB2 UDB for OS/390 Version 6
v DB2 for OS/390 Version 5
v DB2 for MVS/ESA Version 4.
How to Read the Syntax Diagrams
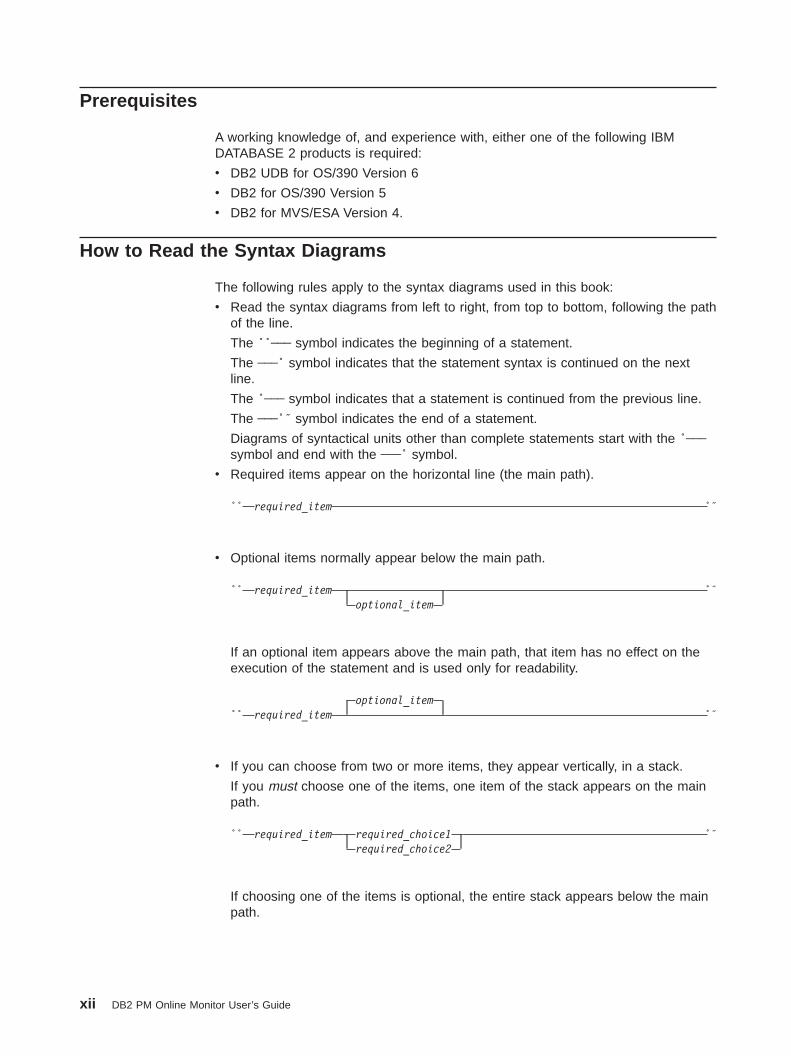
The following rules apply to the syntax diagrams used in this book:
v Read the syntax diagrams from left to right, from top to bottom, following the pathof the line.
The ÊÊ─── symbol indicates the beginning of a statement.
The ───Ê symbol indicates that the statement syntax is continued on the nextline.
The Ê─── symbol indicates that a statement is continued from the previous line.
The ───ÊÍ symbol indicates the end of a statement.
Diagrams of syntactical units other than complete statements start with the Ê───symbol and end with the ───Ê symbol.
v Required items appear on the horizontal line (the main path).
ÊÊ required_item ÊÍ
v Optional items normally appear below the main path.
ÊÊ required_itemoptional_item
ÊÍ
If an optional item appears above the main path, that item has no effect on theexecution of the statement and is used only for readability.
ÊÊoptional_item
required_item ÊÍ
v If you can choose from two or more items, they appear vertically, in a stack.
If you must choose one of the items, one item of the stack appears on the mainpath.
ÊÊ required_item required_choice1required_choice2
ÊÍ
If choosing one of the items is optional, the entire stack appears below the mainpath.
xii DB2 PM Online Monitor User’s Guide

ÊÊ required_itemoptional_choice1optional_choice2
ÊÍ
If one of the items is the default, it appears above the main path and theremaining choices are shown below.
ÊÊ required_itemdefault_choice
optional_choiceoptional_choice
ÊÍ
v An arrow returning to the left, above the main line, indicates an item that can berepeated.
ÊÊ required_item · repeatable_item ÊÍ
If the repeat arrow contains a comma, you must separate repeated items with acomma.
ÊÊ required_item ·
,
repeatable_item ÊÍ
If the repeat arrow contains a number in brackets, the number represents themaximum number of times that item can appear.
ÊÊ required_item ·
(5)
repeatable_item ÊÍ
A repeat arrow above a stack indicates that you can repeat the items in thestack.
v Keywords appear in uppercase (for example, FROM). Variables appear in alllowercase letters (for example, column name). They represent user-suppliednames or values.
v If punctuation marks, parentheses, arithmetic operators, or other such symbolsare shown, you must enter them as part of the syntax.
Summary of Changes
This section lists the changes to DB2 PM in Version 6. DB2 PM Version 6supports all the functions available in DB2 PM Version 4 and Version 5. In addition,all new instrumentation data of DB2 UDB for OS/390 Version 6 is supported by theWorkstation Online Monitor and batch reports.
v DB2 PM now shows time and events for the newly introduced triggers anduser-defined functions.
v DB2 PM monitors the behavior of large objects and the new ROWID data type.
About This Book xiii

v Service task switch time and synchronous I/O time are broken down into variousclass-3 times.
v DDF threads are shown in more detail, such as information on the end user’suser ID, the workstation name, and the transaction name, which you can use asordering and filtering criteria to customize your report sets.
The following sections describe the components and functions that are new orenhanced for DB2 PM Version 6.
Workstation Online Monitor for Windows NT and OS/2
DB2 PM Version 5 introduced the Workstation Online Monitor for both the OS/2(R)and Windows NT environments. The Workstation Online Monitor offers somesignificant advantages:
v Eliminate the need to monitor through TSO
v Improve your efficiency with an easy-to-use graphical interface
v Monitor multiple DB2 subsystems concurrently
v Offer improved tuning recommendations on a per-field basis
v Let you submit DB2 commands from DB2 PM workstation windows
v Display historical data in enhanced System Health graphics.
For Version 6, the Workstation Online Monitor adds several new functions, such as:
v Thread qualification and thread sort
v Intervall processing
v Reporting of statistics delta
v Statistics data is provided for cached SQL statements so you can analyze andevaluate their efficiency.
DB2 PM Installer
In Version 6, you can install, migrate, and customize DB2 PM from yourworkstation using a graphical interface, which guides you through the installationsequence. You can activate the DB2 PM Installer as a subfunction from the DB2Installer and
v Install DB2 PM and control the overall installation process
v Run SMP/E installation jobs.
You receive job status information dynamically, and you can edit JCL, perform jobcleanup, and examine job output from the workstation. The DB2 PM Installerenhances your productivity significantly whether you are installing DB2 PM for thefirst time or are an experienced installer.
xiv DB2 PM Online Monitor User’s Guide

Part 1. Overview of the Online Monitor
Chapter 1. Introduction to the Online Monitor . . . . . . . . . . . . 3Purpose and Function . . . . . . . . . . . . . . . . . . . . . . 3DB2 Performance Data Generation . . . . . . . . . . . . . . . . . 4Overview of the Online Monitor . . . . . . . . . . . . . . . . . . 4
Display Thread Activity. . . . . . . . . . . . . . . . . . . . . 4Display Statistics . . . . . . . . . . . . . . . . . . . . . . . 5Display System Parameters . . . . . . . . . . . . . . . . . . . 5Options . . . . . . . . . . . . . . . . . . . . . . . . . . 5Control Exception Processing . . . . . . . . . . . . . . . . . . 6Collect Report Data . . . . . . . . . . . . . . . . . . . . . . 6IRF - Create and Execute DB2 PM Commands . . . . . . . . . . . 6IRF - Display and Print Graphs . . . . . . . . . . . . . . . . . 6IRF - Maintain Parameter Data Sets. . . . . . . . . . . . . . . . 7Explain . . . . . . . . . . . . . . . . . . . . . . . . . . 7
Chapter 2. Monitoring and Problem Determination . . . . . . . . . . 9The DB2 Operating Environment . . . . . . . . . . . . . . . . . . 10Performance Objectives and Exception Processing . . . . . . . . . . . 10Monitoring . . . . . . . . . . . . . . . . . . . . . . . . . . 11
Monitoring Using Reports. . . . . . . . . . . . . . . . . . . . 11Monitoring Using the Online Monitor. . . . . . . . . . . . . . . . 12
Observing Trends . . . . . . . . . . . . . . . . . . . . . . . 12Determining Problems . . . . . . . . . . . . . . . . . . . . . . 12
Problems Detected in Periodic Exception Processing . . . . . . . . . 12Problems Detected in Exception Event Processing . . . . . . . . . . 13Problems Detected in Exception Reports . . . . . . . . . . . . . . 14
System Problems . . . . . . . . . . . . . . . . . . . . . 14Application Problems . . . . . . . . . . . . . . . . . . . . 14
Other Uses for DB2 PM . . . . . . . . . . . . . . . . . . . . . 14
© Copyright IBM Corp. 1985, 1999 1

2 DB2 PM Online Monitor User’s Guide

Chapter 1. Introduction to the Online Monitor
You can use the Online Monitor to determine overall performance of a DB2subsystem or to identify potential performance problems on an individual threadbasis.
Performance counters for DB2 versions up to and including Version 5 aresupported. If you want to monitor counters introduced in DB2 Version 6, you shoulduse the Workstation Online Monitor or batch reports.
The Online Monitor displays subsystem-wide performance information such as CPUtimes, buffer pool usage, locking, log, and I/O activity. For an individual thread, theOnline Monitor displays information such as the elapsed time, the time spent inDB2, the time it was suspended, the read and write activity involved, the locksobtained, and the SQL statements executed.
By analyzing this information, you can identify areas where tuning is required toenhance the performance of a DB2 subsystem, applications, or queries.
Purpose and Function
DB2 generates data about its own performance, but it does not provide anyreporting facilities for analyzing this data. The Online Monitor provides you with thecapability to view an active DB2 subsystem and identify performance problemsonline.
The Online Monitor displays DB2 performance information in a comprehensive formthat is easy to understand and analyze.
You can use the Online Monitor to:v Determine total DB2 system performance and efficiencyv Measure an application’s performance and resource usev Evaluate an application’s impact on other applications and the systemv Analyze and improve SQL statementsv Identify potential problemsv Determine tuning requirements for DB2.
When changes are made to an application or to the DB2 subsystem, the OnlineMonitor can help you determine the impact. This is very important for determiningwhether the changes increased or decreased performance.
When DB2 performance is not satisfactory, the Online Monitor can help you identifyareas where tuning is required to optimize the performance of DB2. The OnlineMonitor can log DB2 activities and events and provide this information for laterviewing to assist you in determining the cause of potential problems.
You can also perform a thread diagnosis to view an analysis of a thread’sperformance and suggested improvements.
For a long-term view of DB2 performance, your needs are best served by theDB2 PM Batch reporting capabilities.
© Copyright IBM Corp. 1985, 1999 3

DB2 Performance Data Generation
DB2 generates trace information about performance and events in the DB2subsystem. The Online Monitor retrieves and displays this information.
Overview of the Online Monitor
The Online Monitor displays DB2 system and application performance data onpanels which you access from the DB2 PM Online Monitor Main Menu (Figure 1).
You can access the following Online Monitor options from this menu.
Display Thread Activity
Display Thread Activity is used to view detailed thread and locking information forall threads currently connected to a DB2 subsystem.
You can view active threads in a summary format, or examine them individually ingreater detail.
When you select this option, the Thread Summary panel is displayed listing allactive threads. You can filter the listing using the QUALIFY command (refer to“QUALIFY Command” on page 116 for more information). You can also sort thethreads listed using the SORT command (refer to “SORT Command” on page 120for more information). From the Thread Summary panel, you can select any activethread to display the Thread Detail panel, where you can examine the thread.
The Thread Detail panel provides an overview of key values for the selected thread.From the Thread Detail panel, you can access additional windows to view threadactivity data in greater detail.
DGOMMENU 13:01 DB2 PM Online Monitor Main Menu PMO1DLOC DSN1 V6GROUP001 MEMBER01
Select one of the following.
__ 1. Display Thread Activity2. Display Statistics3. Display System Parameters4. Options5. Control Exception Processing6. Collect Report Data7. IRF - Create and execute DB2 PM commands8. IRF - Display and print graphs9. IRF - Maintain parameter data sets10. Explain
Command ===> _________________________________________________________________F1=Help F2=Split F3=Exit F9=Swap F12=Cancel F16=LookF17=Collect
Figure 1. DB2 PM Online Monitor Main Menu
Introduction
4 DB2 PM Online Monitor User’s Guide

Refer to “Chapter 7. Displaying Thread Activity” on page 71 for more information onviewing thread activity.
The headings, field labels, fields displayed, and the order they appear on theThread Detail panel can be tailored. Refer to “Chapter 13. Customizing Panels” onpage 229 for more information.
Display Statistics
The Display Statistics option is used to view important statistics and ratios of a DB2subsystem in a summary format or in detail.
When you select this option, the DB2 Statistics Detail panel is displayed providingan overview of key statistics values for the system. From this panel, you can accessadditional windows to view statistics data in greater detail.
Refer to “Chapter 8. Viewing DB2 Statistics” on page 125 for more information.
The headings, field labels, fields displayed, and the order they appear on the DB2Statistics Detail panel can be tailored. Refer to “Chapter 13. Customizing Panels” onpage 229 for more information.
Display System Parameters
The Display System Parameters option is used to view an overview of the currentDSNZPARM values in effect for a DB2 subsystem including any changes to thebuffer pool and group buffer pool parameters.
When you select this option, the DB2 System Parameters Detail panel is displayedproviding an overview of key system parameter values. From this panel, you canaccess additional windows providing system parameters information in greaterdepth.
Refer to “Chapter 10. Viewing System Parameters” on page 199 for moreinformation.
The headings, field labels, fields displayed, and the order they appear on the DB2System Parameters Detail panel can be tailored. Refer to “Chapter 13. CustomizingPanels” on page 229 for more information.
Options
Options is used to change the parameters affecting the behavior of your own OnlineMonitor session. You can use this option to:
v Select the DB2 subsystem to be monitored.
v Display your installation-specific history parameters (only available if the datacollector is installed at your site). Refer to “Chapter 14. Data Collector Purposeand Function” on page 233 and the following chapters for a description of thedata collector.
v Control the writing of monitor records to an output data set.
v Set the default auto-display interval.
v Set various Interactive Report Facility (IRF) session options.
v Set the current SQLID for explain processing.
Introduction
Chapter 1. Introduction to the Online Monitor 5

Refer to “Online Monitor Options” on page 21 for more information.
Control Exception Processing
The Control Exception Processing option is used to activate or deactivate exceptionprocessing. You can use exception processing to identify DB2 threads and statisticsdata with fields that contain values outside limits you have specified. Use this optionto better manage service levels by identifying performance problems in a DB2subsystem, or performance problems with application threads.
Refer to “Chapter 6. Exception Processing” on page 47 for more information.
Collect Report Data
The Collect Report Data option is used to start and stop DB2 traces, eithermanually or automatically by specified triggers. The resulting trace data can bedirected to a data set for immediate input to DB2 PM Batch reporting. The DB2traces started are determined by the reports you want to produce.
Refer to the DB2 PM Batch User’s Guide for more information.
IRF - Create and Execute DB2 PM Commands
The IRF - Create and execute DB2 PM commands option is used to generate andexecute DB2 PM Batch report command streams.
Refer to the DB2 PM Report Reference and the DB2 PM Batch User’s Guide formore information.
IRF - Display and Print Graphs
The IRF - Display and print graphs option is used to produce graphical reports. Thefollowing types of graphs can be produced:v Accounting by field identifiersv Accounting by DB2 PM identifiersv Statisticsv Frequency distribution.
Refer to the DB2 PM Batch User’s Guide for more information.
Introduction
6 DB2 PM Online Monitor User’s Guide

IRF - Maintain Parameter Data Sets
The IRF - Maintain parameter data sets option is used to maintain the exceptionthreshold data set, the correlation translation member, the timezone informationmember, and the MAINPACK definition member.
Refer to the DB2 PM Batch User’s Guide for more information.
Explain
The Explain option is used to examine the access path method chosen by DB2 fora given SQL statement in an easy-to-read format. The SQL statement you want toexplain can be an existing entry in a specific PLAN_TABLE, an SQL statement froma previously bound plan or package, or a dynamically entered SQL statement.
You can view detailed information on packages, DBRMs, tables, indexes, and theSQL text. The SQL statement can be modified for online tuning.
You can also explain an SQL statement from within the thread activity function toexplain a currently executing SQL statement, or from within an ISPF/PDF editor toexplain an SQL statement imbedded in a source program or SPUFI input.
Refer to “Chapter 9. Monitoring the Access Path—Explain” on page 177 for moreinformation.
Introduction
Chapter 1. Introduction to the Online Monitor 7

8 DB2 PM Online Monitor User’s Guide
Chapter 2. Monitoring and Problem Determination
This chapter describes how to monitor a DB2 subsystem and how to determineperformance problems using both the Batch reports and the Online Monitorfunctions of DB2 PM.
You can use DB2 PM for the continuous or periodic monitoring of a DB2 subsystemas well as for determining specific performance problems in DB2. DB2 PM can helpyou in:
v Determining how an application will perform or is performing over a period oftime
v Indicating where there are tuning opportunities in your system
v Distinguishing between subsystem and application problems
v Monitoring an application in a detailed manner so you can identify problem areas
v Analyzing constraints acting on an application
v Determining the performance impact of any adjustments made within the DB2subsystem
v Determining whether performance objectives are being met.
DB2 PM offers different ways for you to monitor your subsystem depending onwhether you want to see current or past activity: the Online Monitor is used tomonitor an active subsystem as well as to view events that happened in the recentpast, whereas the Batch reports are used to examine performance problems in themore distant past and trends over a period of time.
The amount of data generated for monitoring a DB2 subsystem is vast, so limitingthe amount of data to show only potential problem areas is essential. DB2 PMoffers various ways of reducing the amount of data that needs to be examined, themost important of which is exception processing. Exception processing makes iteasy for you to focus on possible performance problems by highlighting data that isoutside limits you have specified. It is available in both Batch reporting and theOnline Monitor.
The recommended approach is to monitor an active DB2 subsystem using OnlineMonitor exception processing (you do not need to be logged on to have exceptionprocessing running) and to regularly generate statistics and accounting exceptionreports. Online Monitor exception processing alerts you to performance problems assoon as they occur, and the accounting and statistics reports give you a detailedpicture of application and system performance over a period of time.
Deadlock and timeout participant details are available online through eventexception processing. You should also consider generating deadlock and timeouttraces regularly, because in this way information is available to help you investigateany locking problems in detail. There is no significant performance overhead on theDB2 side in collecting the data for these reports.
The best way for you to investigate performance trends is by using IRF graphicsand by producing accounting and statistics reports ordered by interval.
To detect problems as they occur, use the Online Monitor periodic exceptionprocessing. When you detect poor thread performance, you can examinine the
© Copyright IBM Corp. 1985, 1999 9
comprehensive performance data shown on thread and statistics panels. If youthink the problem is caused by SQL, you can analyze the access path using theonline explain function.
If the problem occurred in the recent past, you can use the Online MonitorHISTORY command to view the events surrounding the problem without having torecreate it.
If the panels do not provide enough information to solve the problem, you can usethe Online Monitor to collect instrumentation data for batch reports. You can specifythe data collection to be triggered by exception thresholds; in this way you canminimize the time high-volume and high-cost traces are active and ensure that thedata needed is collected at the right time.
DB2 PM provides a comprehensive set of reports with different levels of detail andfor different areas of performance. This represents a top-down approach to problemdetermination: the most generic reports indicate the problem area and, if necessary,more details can be shown to narrow down the cause of the problem.
The DB2 Operating Environment
The performance of a DB2 transaction or query is dependent not only on theperformance of the DB2 subsystem, but also on the performance of the transactionmanager, such as CICS(R) or IMS(TM), and the MVS(TM) system itself. Thereforethe environment in which the DB2 subsystem is operating should be tuned beforeDB2 is tuned.
For example, if the MVS system is overloaded, tuning a DB2 subsystem is unlikelyto improve DB2 system performance. DB2 performance can only be improved byreducing or balancing the load of the MVS system.
Specialized tools are available to monitor the different system components:v CICSplex System Manager for CICSv IMS/VS DC Monitor or IMSPARS for IMSv RMF(TM) for MVS.
The relationship between the different systems and performance tools is complexand it is not within the scope of this book to describe them. Refer to the IBM DB2Universal Database Server for OS/390 Version 6 Administration Guide for moreinformation about them. For the purposes of this book it is assumed that theenvironment in which the DB2 subsystem is operating is well tuned.
Performance Objectives and Exception Processing
Before you can start monitoring the system, you should define your performanceobjectives on the basis of the business needs, the workload for the system, and theresources available. Typically, the objectives would include acceptable responsetimes, average throughput, and system availability.
These objectives are usually formalized in service-level agreements between theusers and the data processing groups in an organization. The agreements caninclude expectations of, for example, query response times and transactionthroughput.
With DB2 PM, you can monitor how well these objectives are being met.
Monitoring DB2
10 DB2 PM Online Monitor User’s Guide
The most efficient way to do this is to set limits, exception thresholds, for key fieldsthat reflect your performance objectives using exception processing.
Exception profiling can assist you in establishing exception thresholds. This facilitysets exception thresholds automatically based on your application configuration. Forreports, the accounting TOP option is also useful in determining accountingexception thresholds.
You can, for example, monitor response times by setting exception thresholds forclass 1 and class 2 elapsed times to reflect the acceptable response times for yourenvironment. Class 1 elapsed time shows the thread time (from thread creation tothread termination) and class 2 time shows the time DB2 spent processing SQLstatements.
Monitoring
The key to effective performance monitoring is in identifying unusual situations andthereby limiting the amount of data that needs to be examined. In addition toexception processing, DB2 PM offers various other ways of filtering the data andhighlighting potential problems.
The following are available in Batch reporting:v Filtering data by date and time (FROM/TO)v Filtering data by identifiers such as user ID (INCLUDE/EXCLUDE)v Filtering data by resource usage (TOP)v Ordering data on reports by interval (INTERVAL)v Summarizing and sorting data on SQL reportsv Tailoring report layouts for your own needs (UTR).
The following are available in the Online Monitor:v Qualify and sort functionsv History data collection with qualifications.
Monitoring Using Reports
You can filter the data shown on reports by using the INCLUDE/EXCLUDE andFROM/TO filters to show, for example, information only for certain plans,authorization IDs, or locations within specified times.
Another way to limit the data that needs to be examined is to use the accountingTOP option to obtain a high water mark type of reporting on resource usage. TheTOP lists, printed at the end of an accounting report or trace, identify, for example,the threads or users that have required the most use of the resources specified inthe TOP option. Alternatively, you can use the TOP ONLY option to filter entriesbased on resource usage and produce a report showing only entries with thehighest resource usage.
By ordering your accounting and statistics reports by interval you can summarizedata for certain periods. It can be useful, for example, to summarize data for thepeak periods during the day.
When you produce SQL activity reports and traces, potential problems can behighlighted by sorting and summarizing the information within the report and traceentries by various criteria. For example, a problem cursor can be identified by
Monitoring DB2
Chapter 2. Monitoring and Problem Determination 11

summarizing SQL activity by cursor and ordering the cursors by TCB times. Thesorted entries provide an easy way to identify SQL statements that might becausing performance problems.
You can tailor your own report and trace layouts using the user-tailored reportingfeature (UTR). This function gives you full control over the volume, contents, andlayout of your traces and reports.
Monitoring Using the Online Monitor
The Online Monitor qualify and sort functions can help you limit and prioritize thethreads listed on the Thread Summary panel.
Use the qualify function to filter threads by DB2 PM identifiers, thread status, andthread type, and to effectively reduce the amount of data that needs to beexamined. For example, if you want to view the active threads in lock wait statusonly, you can qualify the threads by selecting the In lock wait field on the DB2Thread Qualification Parameters window.
Use the sort function to specify the order in which the threads are listed. Forexample, if you want to view the threads that are spending the most time withinDB2, you can sort the threads by class 2 time in descending order. Threads inexception status are automatically sorted to the top of the list.
Observing Trends
You can use DB2 PM reports and graphs to summarize data over periods ofseveral days, weeks, or months to observe trends in performance.
In monitoring trends, you should pay special attention to peak periods of activity,both for new applications and for the system as a whole. During peak periods,constraints and response-time problems are most evident.
Some trends to look for are:
v Increases in response times, number of I/Os, resource contention, and CPUusage
v Changing workload patterns over a period
v Changes in the transaction distribution and frequency
v Changes in the SQL activity pattern.
Determining Problems
When you find that there are performance problems when you are monitoring thesystem, you can use various panels and reports to investigate the cause of theproblems.
Problems Detected in Periodic Exception Processing
If you are using periodic exception processing in the Online Monitor and you arenotified about a problem, the best way to find out what caused it is to examine thethread activity panels, especially thread diagnosis, or statistics panels, dependingon the type of problem (see Figure 2 on page 13).
Monitoring DB2
12 DB2 PM Online Monitor User’s Guide

To view the past events surrounding the problem online, you can use the HISTORYcommand. The amount of historical data available is determined byinstallation-defined options. Note, however, that the batch reports are morecomprehensive than the Online Monitor panels. Therefore, if the panels do notprovide enough information to solve a problem, the Online Monitor collect reportdata function should be used to gather information in a data set for input to thebatch reports.
Problems Detected in Exception Event Processing
If you detect a problem using the online event exception processing and the OnlineMonitor panels do not provide sufficient information to determine the cause, thenyou should collect the appropriate trace data to produce locking reports, I/O activityreports, audit reports, or record traces. The following table shows you how toproceed when you analyze a specific event exception:
Exception How to proceed
Deadlock or Timeout If deadlocks or timeouts occur too often, generate aLockout report to see which applications andobjects are affected. Having identified the objectsand applications causing the deadlocks or timeouts,use EXPLAIN to understand the locking behavior ofthe SQL statements or consider reorganizing thedatabase.
EDM Pool Full First check online or batch statistics to get moreinformation about the EDM Pool situation. Moredetails are provided in the I/O Activity EDM Poolreport.
Authorization Failure If authorization failures occur too often, generate anAudit authorization failure report for details.
Thread Commit Indoubt Run Record Trace on the Statistics Class 4 IFCIDsto see details of communication problems. Theseare likely to be either VTAM(R) or DB2(R) internalproblems.
Coupling Facility Rebuild Use the COLLECT command to automatically starttracing IFCID 268 (CF rebuild end) when a couplingfacility rebuild starts, and run Record Trace for thisIFCID. You can get more details about couplingfacility behavior from RMF reports.
Figure 2. Problems Found in Periodic Exception Processing
Monitoring DB2
Chapter 2. Monitoring and Problem Determination 13

Problems Detected in Exception Reports
If you use the accounting and statistics exception reports to monitor your system,you can often detect the cause of a performance problem using the comprehensiveinformation they offer without producing other reports. You should produce thesereports using the TOP option in accounting or the INTERVAL option in bothaccounting and statistics so that you can immediately focus on potential problemareas. Sometimes, however, you require more detailed reports to determine theexact cause of a problem.
System Problems
If exception processing indicates problems in system-wide resource usage and astatistics trace does not clarify the reason for the problem, but points to EDM poolor logging activity, consider running I/O activity reports. Or, if the statistics traceindicates a problem with binds, you should generate utility activity reports. If thenumber of deadlocks is high, you should run locking reports. If none of these reportsets offer adequate information to determine the cause of the problem, you can runa record trace to format the individual instrumentation records.
Application Problems
If exception processing indicates an application-related problem (usually an elapsedtime problem for an application or a user), use explain reports to determine theaccess path of the suspected plan and, if necessary, generate accounting traceswith the TOP option. If accounting and explain have not identified the reason forpoor SQL performance, use SQL activity for detailed information on the specificstatement such as scans or I/O per page set or sort specifics. If the accountingtrace indicates a locking problem, run locking reports, or, if the problem seems tobe with binds or DB2 utilities, run utility activity reports. As with system-relatedproblem determination, you can run a record trace if none of these report setsprovide adequate information to determine the cause of the problem.
Other Uses for DB2 PM
You can also use DB2 PM in application development and capacity planning.
The explain and the SQL activity reports can help you anticipate how an applicationwill perform. The Online Monitor explain and source explain functions as well assome functions of thread activity can assist you in tuning your application’s SQLonline.
Accounting and statistics reports ordered by INTERVAL are useful in capacityplanning. Use these reports to identify peak periods in system activity as well as theneed to adjust system resources.
Monitoring DB2
14 DB2 PM Online Monitor User’s Guide

Part 2. How to Use the Online Monitor
Chapter 3. Using the Online Monitor . . . . . . . . . . . . . . . . 17Authority . . . . . . . . . . . . . . . . . . . . . . . . . . . 17Input Data . . . . . . . . . . . . . . . . . . . . . . . . . . 17Accessing the Online Monitor . . . . . . . . . . . . . . . . . . . 18Moving between Panels . . . . . . . . . . . . . . . . . . . . . 19Updating Values . . . . . . . . . . . . . . . . . . . . . . . . 19Leaving the Online Monitor . . . . . . . . . . . . . . . . . . . . 20Online Monitor Options . . . . . . . . . . . . . . . . . . . . . 21
DB2 Subsystem Windows . . . . . . . . . . . . . . . . . . . 22History Defaults Window . . . . . . . . . . . . . . . . . . . . 24History Thread Qualification Window . . . . . . . . . . . . . . . 25Monitor Output Window . . . . . . . . . . . . . . . . . . . . 25Auto Display Window . . . . . . . . . . . . . . . . . . . . . 26Session Options . . . . . . . . . . . . . . . . . . . . . . . 27Current SQLID Window . . . . . . . . . . . . . . . . . . . . 28
Online Help . . . . . . . . . . . . . . . . . . . . . . . . . . 29Function Key Default Settings . . . . . . . . . . . . . . . . . . . 29Issuing DB2 Commands . . . . . . . . . . . . . . . . . . . . . 32COLLECT Command . . . . . . . . . . . . . . . . . . . . . . 33OPTIONS Command . . . . . . . . . . . . . . . . . . . . . . 34Correlation ID Translation . . . . . . . . . . . . . . . . . . . . 34
Changing the Default Translation . . . . . . . . . . . . . . . . . 35How Large and Missing Values Are Displayed . . . . . . . . . . . . . 35Elapsed Time Formats. . . . . . . . . . . . . . . . . . . . . . 36Date Formats . . . . . . . . . . . . . . . . . . . . . . . . . 36
Chapter 4. Common Errors Using DB2 PM . . . . . . . . . . . . . 37STEPLIB Missing from IRF-Generated JCL . . . . . . . . . . . . . . 37Command Not Found . . . . . . . . . . . . . . . . . . . . . . 37
© Copyright IBM Corp. 1985, 1999 15

16 DB2 PM Online Monitor User’s Guide

Chapter 3. Using the Online Monitor
This chapter outlines the privileges and traces required to use the Online Monitor,shows you how to change parameters affecting the behavior of your Online Monitorsession, describes the online help, default function key settings, moving betweenOnline Monitor panels, issuing DB2 commands, global commands, and commonerrors encountered when using DB2 PM.
Authority
The following description applies only if you do not use the user authorization exit. Ifthe user exit is active, the description about the user authorization exit provided inthe DB2 PM Installation and Customization manual applies.
In order to use the Online Monitor, you must have the following authorities:
v Access to a DB2 Version 6, Version 5, or Version 4 subsystem
v EXECUTE authority on the Online Monitor plan (default plan name isDGOPMOM unless changed during installation)
v MONITOR1 privilege
v Display trace privilege.
You also need the DB2 authority for any DB2 commands you issue.
The following authorities are recommended:
v MONITOR2 or SYSADM privilege if you need access to the currently executingSQL statement
v DB2 privilege to start or stop a DB2 trace if you want to collect report data.
Important Note
Granting MONITOR2 privilege allows access to potentially sensitive data, thatis, the SQL statement being executed.
Input Data
To use the DB2 PM Online Monitor, ensure that the DB2 monitor trace is active.Monitor trace class 1 is required for the Online Monitor to display data, but it isrecommended that monitor trace classes 2, 3, 7, and 8 also be activated.
As long as the monitor trace is active, there is no need to activate DB2 statisticsand accounting traces.
Monitor trace class 2 provides DB2 CPU and elapsed times for the thread activitypanels and class 7 provides DB2 CPU and elapsed times for packages. Note thatmonitor trace class 2 is also required for class-1 TCB time to appear.
Monitor trace class 3 provides DB2 suspension times for the thread activity panelsand class 8 provides DB2 suspension times for packages.
© Copyright IBM Corp. 1985, 1999 17

Note: The version and release numbers of the DB2 load library allocated to theOnline Monitor session must match the version and release numbers of theDB2 subsystems being monitored.
To change the version of DB2 you are monitoring, exit from the Online Monitor andISPF to reallocate the DB2 load library. For information on how to reallocate theDB2 load library at your site, consult your system programmer.
Accessing the Online Monitor
The DB2 PM Online Monitor is accessed from the IBM Database 2 PerformanceMonitor menu. To access this menu, select the required option to start yourDB2 PM session from the TSO/ISPF environment.
The IBM Database 2 Performance Monitor menu is shown in Figure 3.
From this menu, select option 3 (View online DB2 activity) to use the DB2 PMOnline Monitor.
If the selected subsystem is part of a data sharing group, the group name andmember name are displayed in the header of the panel. The header also shows thelocation name, the subsystem name, and the version of the DB2 subsystem you areconnected to. See Figure 1 on page 4 for an example.
DGOFMENU IBM Database 2 Performance Monitor
Select one of the following.
__ 1. Create and execute DB2 PM commands2. Display and print graphs3. View online DB2 activity4. Maintain parameter data sets5. Customize DB2 PM report and trace layouts6. Exception profiling
┌───────────────────────────────────────────────────┐│ IBM DB2 UDB Performance Monitor for OS/390 V6 ││ Licensed Materials - Property of IBM ││ 5645-DB2 (C) Copyright IBM Corp. 1985, 1998. ││ All rights reserved. ││ US Government Users Restricted Rights - ││ Use, duplication or disclosure restricted ││ by GSA ADP Schedule Contract with IBM Corp. │└───────────────────────────────────────────────────┘Command ===> _________________________________________________________________F1=Help F2=Split F3=Exit F6=History F9=Swap F12=CancelF17=Collect
Figure 3. IBM Database 2 Performance Monitor Menu
Using the Online Monitor
18 DB2 PM Online Monitor User’s Guide

Moving between Panels
When you have entered a command on the command line, or have entered theinformation required to complete a panel, press Enter .
To go back to a previous panel or menu, press F3 (Exit).
Each time you press Enter or F3 (Exit), data entered on that panel is validated. Ifan error is detected, an error message is displayed and the cursor is positioned onthe field in error. If no error is detected, processing continues.
To leave a panel without saving the entries and return to the previous panel, or tocancel all windows, press F12 (Cancel).
You can move between various Online Monitor options by typing = followed by theOnline Monitor main menu option number on the command line of any OnlineMonitor panel:=1 Jumps to display thread activity.=2 Jumps to display statistics.=3 Jumps to display system parameters.=4 Jumps to options.=5 Jumps to control exception processing.=6 Jumps to collect report data.=7 Jumps to IRF create and execute DB2 PM commands.=8 Jumps to IRF display and print graphs.=9 Jumps to IRF maintain parameter data sets.=10 Jumps to explain.=X Exits the Online Monitor.
Updating Values
To refresh thread activity, statistics, and system parameters panels with new datafrom DB2, press Enter . Values are not updated when:v Any DB2 PM or ISPF command is entered on the command linev Windows are selected for displayv Function keys are usedv Diagnosing a thread.
Note: The values shown on the Thread Summary and Threads Holding Resourcepanels are refreshed automatically each time the panels are displayed.
Using the Online Monitor
Chapter 3. Using the Online Monitor 19

Leaving the Online Monitor
To exit the Online Monitor from the DB2 PM Online Monitor Main Menu, press F3(Exit) or F12 (Cancel). From any other Online Monitor panel, type =X on thecommand line and press Enter .
If any asynchronous tasks are active when you exit the Online Monitor, you arenotified by one of the Asynchronous Task Termination panels. If the data collector isnot active, the tasks are terminated when you exit the Online Monitor. If the datacollector is active, you have the choice of leaving the selected tasks active or notwhen you exit the Online Monitor. Refer to Figure 4 for an example of anAsynchronous Task Termination panel and to “Chapter 14. Data Collector Purposeand Function” on page 233 and the following chapters for a description of the datacollector.
To exit the Online Monitor from this window, press Enter . If the data collector isactive, any tasks selected on this window remain active.
To return to the DB2 PM Online Monitor Main Menu, press F3 (Exit) or F12(Cancel). All active tasks remain active.
DGOMGP01 Asynchronous Task Termination
Press Enter to exit the Online Monitor or request Exit or Cancel toreturn to the Online Monitor Main Menu.
Leaving the Online Monitor results in the termination of allnon-selected tasks as well as the stopping of all the DB2 traces startedby the collect report data facility.
Exception/Collect tasks Status---------------------------------------------- ---------------------------
_ Periodic Exception Active_ Exception Event Active
Collect Task A Not activeCollect Task B Not activeCollect Task C Not activeCollect Task D Not active
Command ===> ______________________________________________________________F1=Help F2=Split F3=Exit F9=Swap F12=Cancel F16=LookF17=Collect
Figure 4. Asynchronous Task Termination Panel
Using the Online Monitor
20 DB2 PM Online Monitor User’s Guide
Online Monitor Options
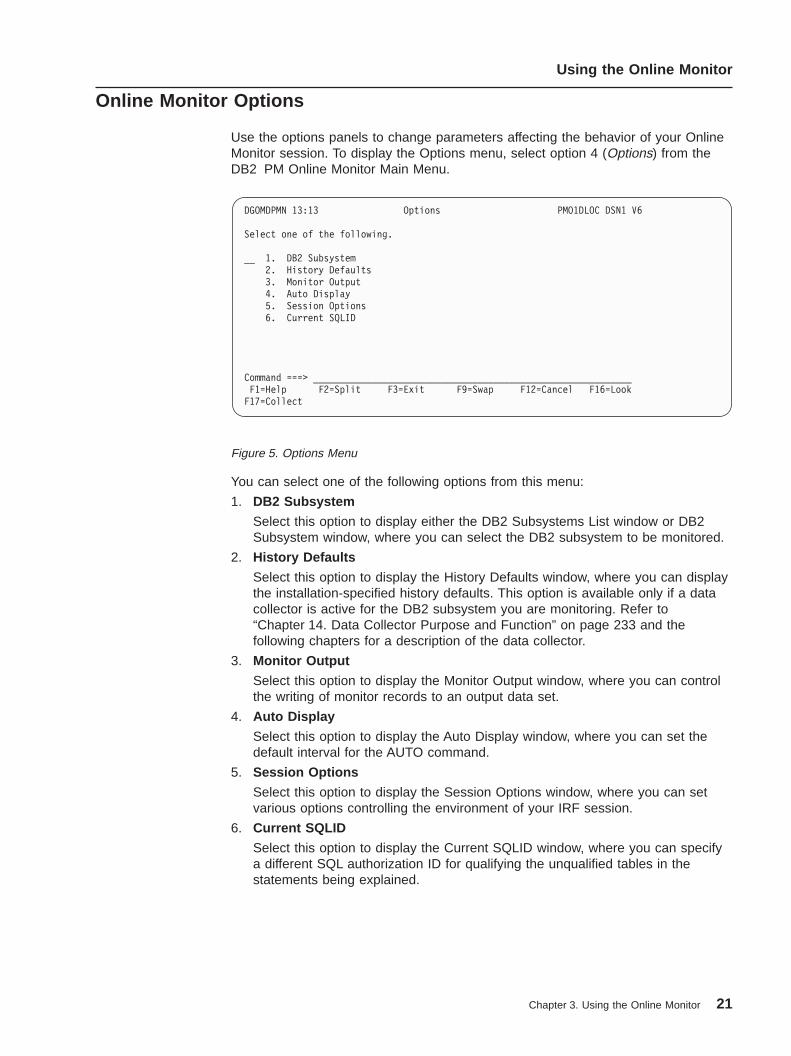
Use the options panels to change parameters affecting the behavior of your OnlineMonitor session. To display the Options menu, select option 4 (Options) from theDB2 PM Online Monitor Main Menu.
You can select one of the following options from this menu:
1. DB2 Subsystem
Select this option to display either the DB2 Subsystems List window or DB2Subsystem window, where you can select the DB2 subsystem to be monitored.
2. History Defaults
Select this option to display the History Defaults window, where you can displaythe installation-specified history defaults. This option is available only if a datacollector is active for the DB2 subsystem you are monitoring. Refer to“Chapter 14. Data Collector Purpose and Function” on page 233 and thefollowing chapters for a description of the data collector.
3. Monitor Output
Select this option to display the Monitor Output window, where you can controlthe writing of monitor records to an output data set.
4. Auto Display
Select this option to display the Auto Display window, where you can set thedefault interval for the AUTO command.
5. Session Options
Select this option to display the Session Options window, where you can setvarious options controlling the environment of your IRF session.
6. Current SQLID
Select this option to display the Current SQLID window, where you can specifya different SQL authorization ID for qualifying the unqualified tables in thestatements being explained.
DGOMDPMN 13:13 Options PMO1DLOC DSN1 V6
Select one of the following.
__ 1. DB2 Subsystem2. History Defaults3. Monitor Output4. Auto Display5. Session Options6. Current SQLID
Command ===> ____________________________________________________________F1=Help F2=Split F3=Exit F9=Swap F12=Cancel F16=LookF17=Collect
Figure 5. Options Menu
Using the Online Monitor
Chapter 3. Using the Online Monitor 21
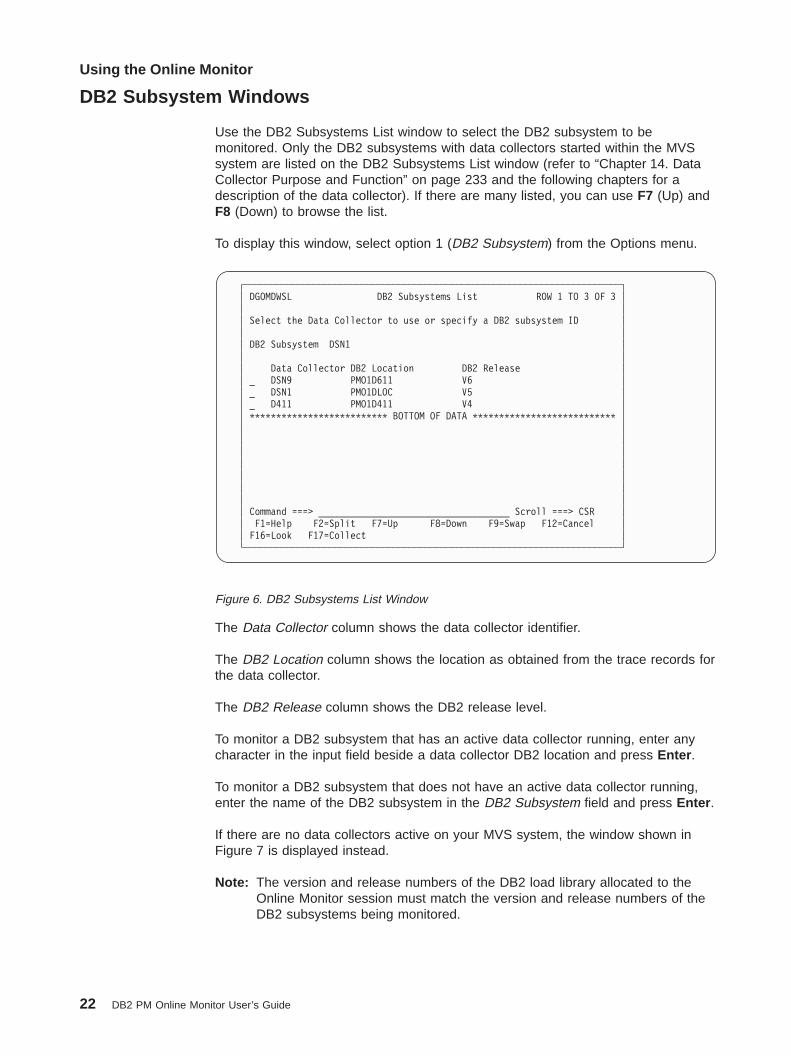
DB2 Subsystem Windows
Use the DB2 Subsystems List window to select the DB2 subsystem to bemonitored. Only the DB2 subsystems with data collectors started within the MVSsystem are listed on the DB2 Subsystems List window (refer to “Chapter 14. DataCollector Purpose and Function” on page 233 and the following chapters for adescription of the data collector). If there are many listed, you can use F7 (Up) andF8 (Down) to browse the list.
To display this window, select option 1 (DB2 Subsystem) from the Options menu.
The Data Collector column shows the data collector identifier.
The DB2 Location column shows the location as obtained from the trace records forthe data collector.
The DB2 Release column shows the DB2 release level.
To monitor a DB2 subsystem that has an active data collector running, enter anycharacter in the input field beside a data collector DB2 location and press Enter .
To monitor a DB2 subsystem that does not have an active data collector running,enter the name of the DB2 subsystem in the DB2 Subsystem field and press Enter .
If there are no data collectors active on your MVS system, the window shown inFigure 7 is displayed instead.
Note: The version and release numbers of the DB2 load library allocated to theOnline Monitor session must match the version and release numbers of theDB2 subsystems being monitored.
┌───────────────────────────────────────────────────────────────────────┐│ DGOMDWSL DB2 Subsystems List ROW 1 TO 3 OF 3 ││ ││ Select the Data Collector to use or specify a DB2 subsystem ID ││ ││ DB2 Subsystem DSN1 ││ ││ Data Collector DB2 Location DB2 Release ││ _ DSN9 PMO1D611 V6 ││ _ DSN1 PMO1DLOC V5 ││ _ D411 PMO1D411 V4 ││ ************************** BOTTOM OF DATA *************************** ││ ││ ││ ││ ││ ││ ││ ││ Command ===> ____________________________________ Scroll ===> CSR ││ F1=Help F2=Split F7=Up F8=Down F9=Swap F12=Cancel ││ F16=Look F17=Collect │└───────────────────────────────────────────────────────────────────────┘
Figure 6. DB2 Subsystems List Window
Using the Online Monitor
22 DB2 PM Online Monitor User’s Guide

If the data collector is not installed at your site or the monitored DB2 subsystemdoes not have an active data collector running, the following Online Monitorfunctions are not available:
v Viewing past datav Periodic exception processing while you are not logged onv Exception event processingv Collection of parallel tasks for query CP parallelism.
Changing DB2 subsystems terminates all asynchronous tasks that were startedusing the Online Monitor. If you change DB2 subsystems while an asynchronoustask is active, you are notified by the Asynchronous Task Termination panel. Referto Figure 8.
Note that if you are in split screen mode and you change the subsystem in onesession, asynchronous tasks are terminated even if they were activated in the othersession.
To change DB2 subsystems, press Enter . All asynchronous tasks are terminated.
┌─────────────────────────────────────────────────────────────────┐│ DGOMDWS1 DB2 Subsystem ││ ││ Enter the subsystem ID of the DB2 subsystem to monitor and ││ press Enter. ││ ││ DB2 Subsystem ____ ││ ││ ││ ││ F1=Help F2=Split F9=Swap F12=Cancel │└─────────────────────────────────────────────────────────────────┘
Figure 7. DB2 Subsystem Window
DGOMGP03 Asynchronous Task Termination
Press Enter to change Subsystem or request Cancel to restore theSubsystem ID to its previous value.
Changing the Subsystem results in the termination of all activetasks as well as the stopping of all the DB2 traces started by thecollect report data facility.
Exception/Collect tasks Status---------------------------------------------- ---------------------------Periodic Exception ActiveException Event Not active
Collect data for acct/io/stats/audit ActiveCICS problem ActiveCollect Task C Not activeCollect Task D Not active
Command ===> _______________________________________________________________F1=Help F2=Split F3=Exit F9=Swap F12=Cancel F16=LookF17=Collect
Figure 8. Asynchronous Task Termination Panel
Using the Online Monitor
Chapter 3. Using the Online Monitor 23
To return to the previous panel without changing DB2 subsystems, press F3 (Exit)or F12 (Cancel). All active asynchronous tasks remain active.
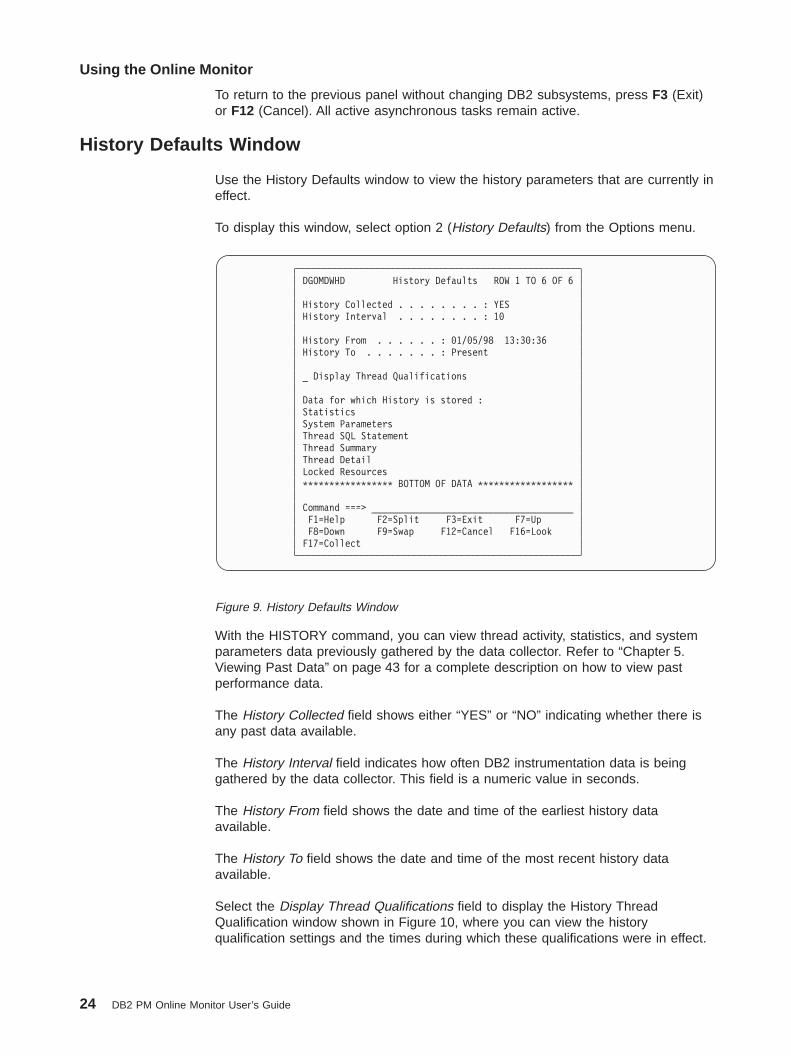
History Defaults Window
Use the History Defaults window to view the history parameters that are currently ineffect.
To display this window, select option 2 (History Defaults) from the Options menu.
With the HISTORY command, you can view thread activity, statistics, and systemparameters data previously gathered by the data collector. Refer to “Chapter 5.Viewing Past Data” on page 43 for a complete description on how to view pastperformance data.
The History Collected field shows either “YES” or “NO” indicating whether there isany past data available.
The History Interval field indicates how often DB2 instrumentation data is beinggathered by the data collector. This field is a numeric value in seconds.
The History From field shows the date and time of the earliest history dataavailable.
The History To field shows the date and time of the most recent history dataavailable.
Select the Display Thread Qualifications field to display the History ThreadQualification window shown in Figure 10, where you can view the historyqualification settings and the times during which these qualifications were in effect.
┌─────────────────────────────────────────────────────┐│ DGOMDWHD History Defaults ROW 1 TO 6 OF 6 ││ ││ History Collected . . . . . . . . : YES ││ History Interval . . . . . . . . : 10 ││ ││ History From . . . . . . : 01/05/98 13:30:36 ││ History To . . . . . . . : Present ││ ││ _ Display Thread Qualifications ││ ││ Data for which History is stored : ││ Statistics ││ System Parameters ││ Thread SQL Statement ││ Thread Summary ││ Thread Detail ││ Locked Resources ││ ***************** BOTTOM OF DATA ****************** ││ ││ Command ===> ______________________________________ ││ F1=Help F2=Split F3=Exit F7=Up ││ F8=Down F9=Swap F12=Cancel F16=Look ││ F17=Collect │└─────────────────────────────────────────────────────┘
Figure 9. History Defaults Window
Using the Online Monitor
24 DB2 PM Online Monitor User’s Guide
The Data for which History is stored field lists the types of data gathered by thedata collector. This list includes the data types specified at data collector startupand subsequent changes made by the administrator users. Statistics history keepssubsystem-wide statistical information for a DB2 subsystem. For thread activity, youcan collect thread history individually in a summary format, in detail format, or indetail format with locking information, SQL statement, or both. System Parametershistory keeps an overview of DSNZPARM values for a DB2 subsystem.
For more information about viewing past data, refer to “Chapter 5. Viewing PastData” on page 43. For more information about data collector installation options,refer to DB2 PM Installation and Customization.
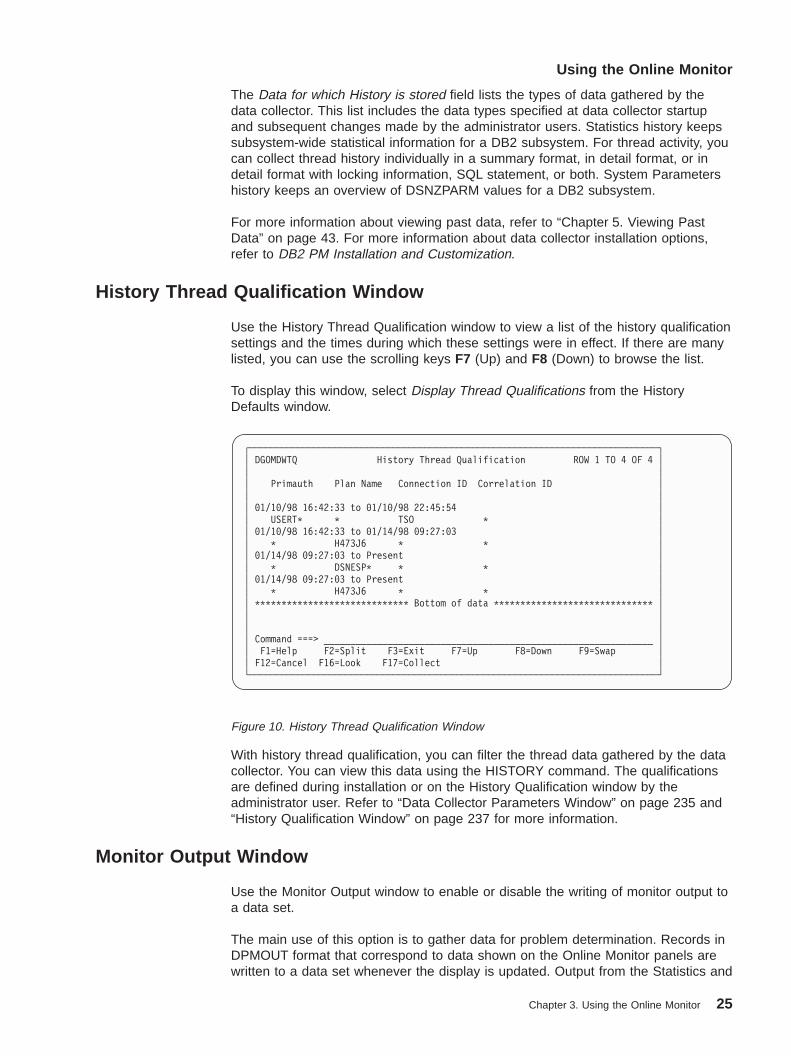
History Thread Qualification Window
Use the History Thread Qualification window to view a list of the history qualificationsettings and the times during which these settings were in effect. If there are manylisted, you can use the scrolling keys F7 (Up) and F8 (Down) to browse the list.
To display this window, select Display Thread Qualifications from the HistoryDefaults window.
With history thread qualification, you can filter the thread data gathered by the datacollector. You can view this data using the HISTORY command. The qualificationsare defined during installation or on the History Qualification window by theadministrator user. Refer to “Data Collector Parameters Window” on page 235 and“History Qualification Window” on page 237 for more information.
Monitor Output Window
Use the Monitor Output window to enable or disable the writing of monitor output toa data set.
The main use of this option is to gather data for problem determination. Records inDPMOUT format that correspond to data shown on the Online Monitor panels arewritten to a data set whenever the display is updated. Output from the Statistics and
┌─────────────────────────────────────────────────────────────────────────────┐│ DGOMDWTQ History Thread Qualification ROW 1 TO 4 OF 4 ││ ││ Primauth Plan Name Connection ID Correlation ID ││ ││ 01/10/98 16:42:33 to 01/10/98 22:45:54 ││ USERT* * TSO * ││ 01/10/98 16:42:33 to 01/14/98 09:27:03 ││ * H473J6 * * ││ 01/14/98 09:27:03 to Present ││ * DSNESP* * * ││ 01/14/98 09:27:03 to Present ││ * H473J6 * * ││ ***************************** Bottom of data ****************************** ││ ││ ││ Command ===> ______________________________________________________________ ││ F1=Help F2=Split F3=Exit F7=Up F8=Down F9=Swap ││ F12=Cancel F16=Look F17=Collect │└─────────────────────────────────────────────────────────────────────────────┘
Figure 10. History Thread Qualification Window
Using the Online Monitor
Chapter 3. Using the Online Monitor 25

System Parameter panels can be used as input to the Batch statistics and systemparameter reports respectively. The output from the Thread Display panels can onlybe processed by batch record trace.
To display this window, select option 3 (Monitor Output) from the Options menu.
The Write output field is used to specify whether you want monitor output written toa data set. Enter 1 in this field to enable the writing of monitor output to a data set.
The Dataset name field requires the name of the data set to which the data is to bewritten.
If you specify a disposition of 3 (new), the data set is dynamically allocated with thefollowing attributes:RECFM: VBSLRECL: 32 756BLKSIZE: 6 233
Auto Display Window
Use the Auto Display window to set the auto-display refresh interval for data shownon the Online Monitor panels. When auto display is active, the values displayed onthe current panel are updated periodically, as specified on the Auto Display window.If you activate auto-display mode while viewing past data, the panel is updated withsubsequent past records at every auto-display interval. The time difference betweenthese records is determined by the history interval when the data was collected,and not by the current auto-display interval.
To display this window, select option 4 (Auto Display) from the Options menu.
┌──────────────────────────────────────────────────────────────────────────┐│ DGOMDWMO Monitor Output ││ ││ To write monitor output, enter 1 and dataset name and disposition ││ ││ Write output . . . . . . 2 1=yes 2=no ││ ││ Dataset name . . . . . . ______________________________________________ ││ Disposition . . . . . . 1 1=append 2=overwrite 3=new ││ ││ F1=Help F2=Split F9=Swap F12=Cancel │└──────────────────────────────────────────────────────────────────────────┘
Figure 11. Monitor Output Window
Using the Online Monitor
26 DB2 PM Online Monitor User’s Guide

Use the Units field to specify the units of time for the value entered in the Intervalfield on this window.
Use the Interval field to specify how frequently the panels are refreshed when theAUTO command is issued.
To start auto-display mode, type AUTO on any thread activity or statistics panelcommand line and press Enter . To stop auto-display mode, press the Attentionkey. You cannot perform any other actions with your Online Monitor session whileauto-display mode is running.
Session Options
Use the Session Options window to set various options controlling the environmentof your IRF session.
To display this window, select option 5 (Session Options) from the Options menu, ortype OPTIONS on any command line and press Enter .
The field values shown in Figure 13 are the default settings.
Use the Confirmation display field to specify whether or not you want to beprompted each time you issue a delete, replace, or reset request.
┌───────────────────────────────────────────────────────────────┐│ DGOMDWAD Auto Display ││ ││ Update values then Enter ││ ││ Units . . . . . . . . . 1 1=seconds ││ 2=minutes ││ ││ Interval . . . . . . . . 10 1-7200 seconds ││ 1-120 minutes ││ ││ ││ F1=Help F2=Split F9=Swap F12=Cancel │└───────────────────────────────────────────────────────────────┘
Figure 12. Auto Display Window
┌─────────────────────────────────────────────────────────────────────────────┐│ DGOFOPTS Session Options ││ ││ Update fields as required, then press Enter. ││ ││ Confirmation display . . . . . . . . . . 1 1=yes 2=no ││ Initial menu choice . . . . . . . . . . . _ 1-6 or blank ││ Execution mode . . . . . . . . . . . . . 1 1=Background ││ 2=Foreground ││ 3=Prompt ││ ││ DPMPARMS data set . . . __________________________________________________ ││ ││ F1=Help F2=Split F9=Swap F12=Cancel │└─────────────────────────────────────────────────────────────────────────────┘
Figure 13. Session Options Window
Using the Online Monitor
Chapter 3. Using the Online Monitor 27

Use the Initial menu choice field to specify the panel you want to start on whenentering the DB2 PM. Possible values for this field are:
1 To start at the Interactive Report Selections panel (DGOOMENU)
2 To start at the Graphics Selection menu (DGOGMENU)
3 To start at the DB2 PM Online Monitor Main Menu (DGOMMENU)
4 To start at the Data Set Maintenance Menu (DGOPMENU)
5 To start at the User-Tailored Report Layout Generation menu (DGOBMENU)
6 To start at the Exception Profiling menu (DGOFEP00)
Blank To start at the IBM Database 2 Performance Monitor main menu(DGOFMENU).
The Execution mode field applies to the execution of batch jobs.
Use the DPMPARMS data set field to specify the DPMPARMS data set to be usedby the Online Monitor. The DPMPARMS data set contains information aboutexception thresholds, customized report layouts, time zone specifications,correlation ID translation, and the MAINPACK identifier. Only the correlation IDtranslation part is used by the Online Monitor.
For more information about the DPMPARMS data set, refer to “Correlation IDTranslation” on page 34 and to the DB2 PM Report Reference.
Current SQLID Window
Use the Current SQLID window to specify a different SQL authorization ID forqualifying the unqualified tables in the statements being explained if they do notbelong to a plan or package. The Current SQLID window is also used to qualify theplan table to be accessed.
To display this window, select option 6 (Current SQLID) from the Options menu.
If the Current SQLID field on this window is not specified, it defaults to your user ID.
┌───────────────────────────────────────────────────┐│ DGOMDWSS Current SQLID ││ ││ Specify the current SQLID, then press Enter. ││ ││ ││ Current SQLID . . . . . USERT001 ││ ││ ││ F1=Help F2=Split F9=Swap F12=Cancel │└───────────────────────────────────────────────────┘
Figure 14. Current SQLID Window
Using the Online Monitor
28 DB2 PM Online Monitor User’s Guide

Online Help
Comprehensive panel help can be accessed from any Online Monitor panel, andfield help can be accessed from fields on these panels. Panel help shows generalinformation describing the purpose of the panel and the commands available fromthat panel, whereas field help shows a field description and system tuninginformation for that field if appropriate.
To view panel help, press F1 (Help) on a panel. To view field help, move the cursorinto the data area of the field and press F1.
To view help on the following topics, press F1 (Help) on the Online Monitor mainmenu:v General information about the Online Monitorv Authority requiredv Online Monitor input datav Moving between panelsv Updating valuesv Online Monitor commandsv Function key default settings.
Notes:
1. On some panels where lists are shown, field help is not available on the list.Help on these lists is provided in the panel help instead.
2. The online help follows the standard conventions for help in the ISPFenvironment. For a complete guide to ISPF help navigation, refer to the OS/390ISPF Dialog Developer’s Guide and Reference and the related ISPFdocumentation.
Function Key Default Settings
Use the function key default settings to help you perform the following with a singlekeystroke:v View help.v Move between panels.v Access certain Online Monitor and ISPF functions.
Notes:
1. The DB2 PM Online Monitor is an ISPF application, and all normal ISPFbehaviors apply.
2. The default function key settings on help panels follow the standard conventionsfor help in the ISPF environment.
Table 1 describes the Online Monitor function keys, their default settings, theirfunctions, and the Online Monitor panels on which they are available.
Using the Online Monitor
Chapter 3. Using the Online Monitor 29

Table 1. Function Key Default Settings
Function Key Default Setting FunctionOnline MonitorPanels
F1 HELP Used to view help information on a panel or field. All panels
F2 SPLIT Used to divide the display into two logical displaysseparated by a horizontal line and starts another ISPFsession, or changes the location of the horizontal line.
All panels
F3 EXIT Used to validate and save the data entered on a panel,exit the panel, and return to the previous panel.
All panels containing acommand line
F4 PROMPT Used to view a list of possible values for a field. Theprompt fields are followed by a + symbol.
Some collect reportdata panels andException ThresholdField Details panel
F5 AUTO Used to refresh the data shown on the current panelperiodically.
All thread andstatistics panels
ADD Used to add a new exception threshold entry. Exception ThresholdField Details panel
F6 HISTORY Used for viewing historical data on panels.Note: If your installation has installed the Online Monitorwithout the data collector, this function is not available.
All thread activity,statistics, and systemparameters panels
DELETE Used to delete an exception threshold entry. Exception ThresholdField Details panel
F7 UP Used to scroll toward the top of the data. All scrolling panels
F8 DOWN Used to scroll toward the bottom of the data. All scrolling panels
F9 SWAP Used to switch between ISPF sessions. All panels
F10 QUALIFY Used to filter the threads listed on the Thread Summarypanel.
Thread Summarypanel
DELTA Used to begin delta processing mode that calculates thestatistics values between the last two times you pressedEnter .
All statistics panels
PREVIOUS Used to display the previous exception threshold entryfor a field.
Exception ThresholdField Details panel
F11 SORT Used to sort the threads listed on the Thread Summarypanel.
Thread Summarypanel
INTERVAL Used to establish a base point in time from whichstatistics are to be calculated.
All statistics panels
NEXT Used to display the next exception threshold entry for afield.
Exception ThresholdField Details panel
F12 CANCEL Used to exit a panel without saving the entries, andreturn to the previous panel canceling all related panels.
All panels
F16 LOOK Used to view the following exception information andauthorization failures:
v Periodic exceptionsv Periodic exceptions messagesv Display exceptionsv Authorization failure summaryv Exception event summaryv Exception event messages.
All panels (exceptLOOK and relatedpanels)
Using the Online Monitor
30 DB2 PM Online Monitor User’s Guide

Table 1. Function Key Default Settings (continued)
Function Key Default Setting FunctionOnline MonitorPanels
F17 COLLECT Used to display the Collect Report Data panel, whereyou can collect specific DB2 instrumentation data anddirect this data to a data set.
All panels (exceptcollect report datapanels)
F18 EXPLAIN Used to explain the access path methods chosen byDB2 for a given SQL statement.
All thread diagnosticpanels, and threadpanels that show theSQL statement
F19 LEFT Used to scroll toward the left. Thread Summarypanel
F20 RIGHT Used to scroll toward the right. Thread Summarypanel
F22 PURGE Used to purge a thread currently processing in the DB2subsystem you are monitoring. You require the DB2privilege to perform CANCEL THREAD.
All thread activitypanels
The following ISPF commands can be used to alter the function key settings:
KEYLIST Changes the function key settings.
FKA Alternates between the function key long displayformat, short display format, and no function keydisplay at all.
PFSHOW Toggles on and off the display of function keysettings.
PFSHOW TAILOR Specifies how function keys are displayed.
All function keys correspond to a command entered on the command line. Forexample, typing the command CANCEL on the command line is the same as pressingthe F12 (Cancel) key.
You can use the command line with the function keys to enter function parameters.To do this, type the parameters on the command line and press the function key toactivate the command.
You can use the ISPF PANELID command to choose whether to display a panel IDon the top line of the panels. To toggle the panel ID display, type PANELID on thecommand line and press Enter .
For a complete guide to ISPF commands, refer to the OS/390 ISPF DialogDeveloper’s Guide and Reference and the related ISPF documentation.
Using the Online Monitor
Chapter 3. Using the Online Monitor 31
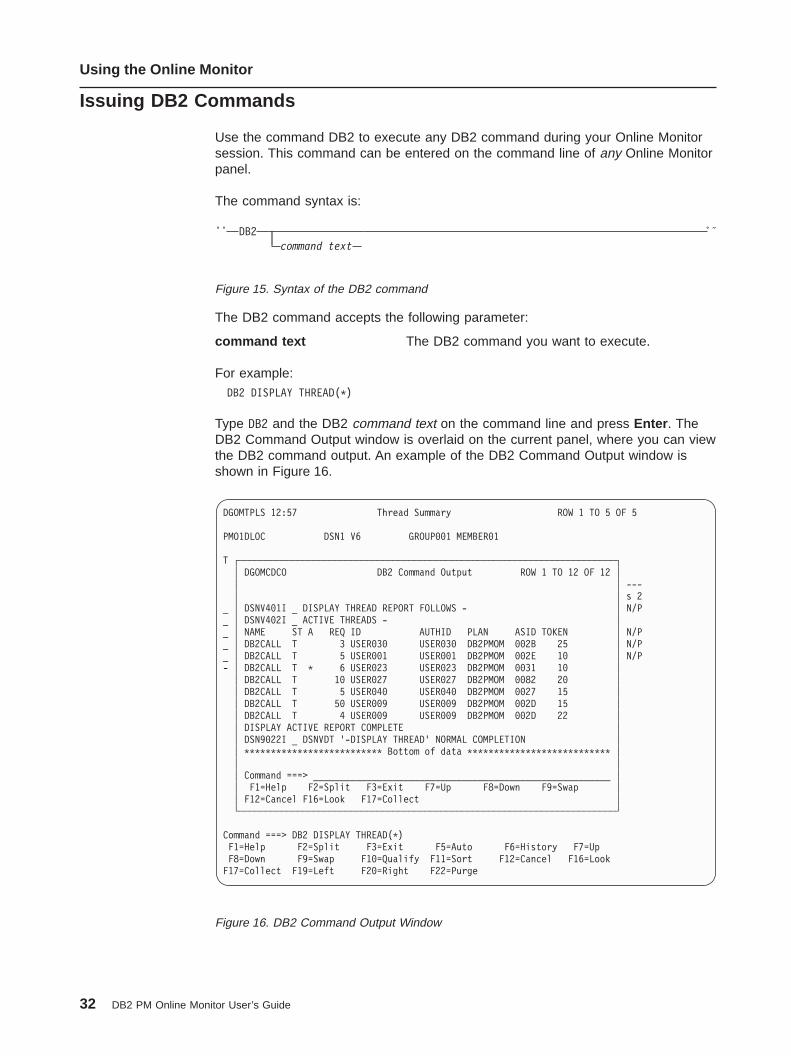
Issuing DB2 Commands
Use the command DB2 to execute any DB2 command during your Online Monitorsession. This command can be entered on the command line of any Online Monitorpanel.
The command syntax is:
The DB2 command accepts the following parameter:
command text The DB2 command you want to execute.
For example:DB2 DISPLAY THREAD(*)
Type DB2 and the DB2 command text on the command line and press Enter . TheDB2 Command Output window is overlaid on the current panel, where you can viewthe DB2 command output. An example of the DB2 Command Output window isshown in Figure 16.
ÊÊ DB2command text
ÊÍ
Figure 15. Syntax of the DB2 command
DGOMTPLS 12:57 Thread Summary ROW 1 TO 5 OF 5
PMO1DLOC DSN1 V6 GROUP001 MEMBER01
T ┌───────────────────────────────────────────────────────────────────────┐│ DGOMCDCO DB2 Command Output ROW 1 TO 12 OF 12 ││ │ ---│ │ s 2
_ │ DSNV401I _ DISPLAY THREAD REPORT FOLLOWS - │ N/P_ │ DSNV402I _ ACTIVE THREADS - │_ │ NAME ST A REQ ID AUTHID PLAN ASID TOKEN │ N/P_ │ DB2CALL T 3 USER030 USER030 DB2PMOM 002B 25 │ N/P_ │ DB2CALL T 5 USER001 USER001 DB2PMOM 002E 10 │ N/P- │ DB2CALL T * 6 USER023 USER023 DB2PMOM 0031 10 ││ DB2CALL T 10 USER027 USER027 DB2PMOM 0082 20 ││ DB2CALL T 5 USER040 USER040 DB2PMOM 0027 15 ││ DB2CALL T 50 USER009 USER009 DB2PMOM 002D 15 ││ DB2CALL T 4 USER009 USER009 DB2PMOM 002D 22 ││ DISPLAY ACTIVE REPORT COMPLETE ││ DSN9022I _ DSNVDT '-DISPLAY THREAD' NORMAL COMPLETION ││ ************************** Bottom of data *************************** ││ ││ Command ===> ________________________________________________________ ││ F1=Help F2=Split F3=Exit F7=Up F8=Down F9=Swap ││ F12=Cancel F16=Look F17=Collect │└───────────────────────────────────────────────────────────────────────┘
Command ===> DB2 DISPLAY THREAD(*)F1=Help F2=Split F3=Exit F5=Auto F6=History F7=UpF8=Down F9=Swap F10=Qualify F11=Sort F12=Cancel F16=LookF17=Collect F19=Left F20=Right F22=Purge
Figure 16. DB2 Command Output Window
Using the Online Monitor
32 DB2 PM Online Monitor User’s Guide
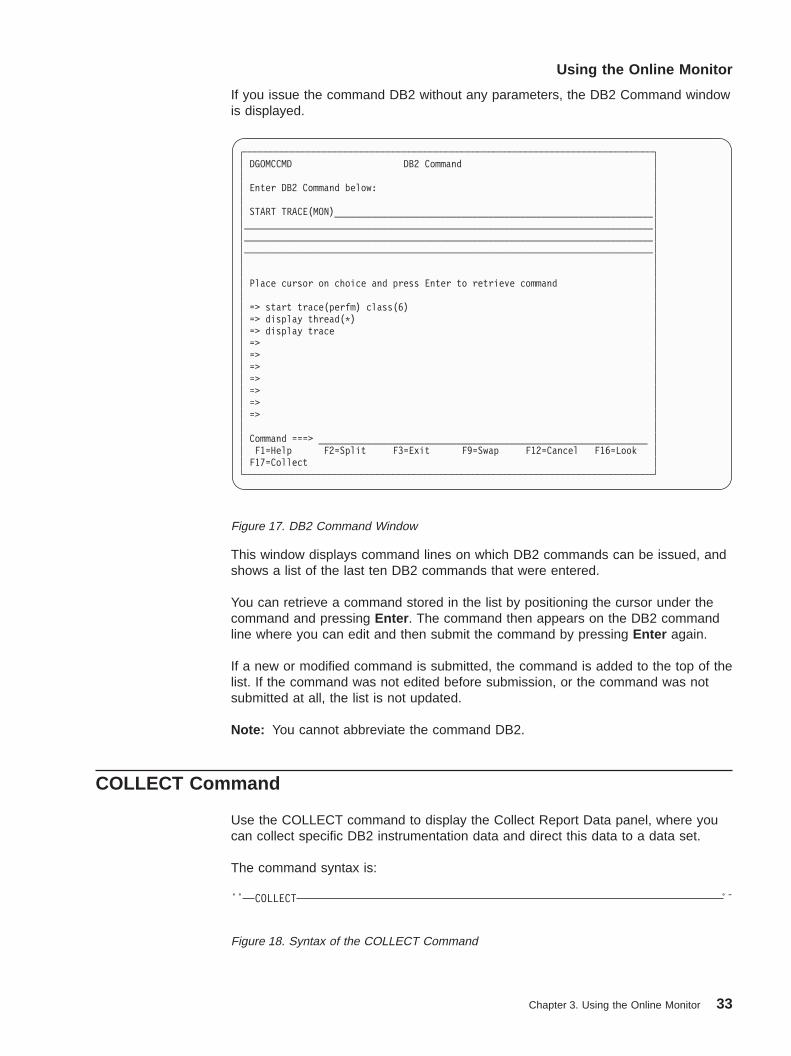
If you issue the command DB2 without any parameters, the DB2 Command windowis displayed.
This window displays command lines on which DB2 commands can be issued, andshows a list of the last ten DB2 commands that were entered.
You can retrieve a command stored in the list by positioning the cursor under thecommand and pressing Enter . The command then appears on the DB2 commandline where you can edit and then submit the command by pressing Enter again.
If a new or modified command is submitted, the command is added to the top of thelist. If the command was not edited before submission, or the command was notsubmitted at all, the list is not updated.
Note: You cannot abbreviate the command DB2.
COLLECT Command
Use the COLLECT command to display the Collect Report Data panel, where youcan collect specific DB2 instrumentation data and direct this data to a data set.
The command syntax is:
┌─────────────────────────────────────────────────────────────────────────────┐│ DGOMCCMD DB2 Command ││ ││ Enter DB2 Command below: ││ ││ START TRACE(MON)____________________________________________________________││_____________________________________________________________________________││_____________________________________________________________________________││_____________________________________________________________________________││ ││ ││ Place cursor on choice and press Enter to retrieve command ││ ││ => start trace(perfm) class(6) ││ => display thread(*) ││ => display trace ││ => ││ => ││ => ││ => ││ => ││ => ││ => ││ ││ Command ===> ______________________________________________________________ ││ F1=Help F2=Split F3=Exit F9=Swap F12=Cancel F16=Look ││ F17=Collect │└─────────────────────────────────────────────────────────────────────────────┘
Figure 17. DB2 Command Window
ÊÊ COLLECT ÊÍ
Figure 18. Syntax of the COLLECT Command
Using the Online Monitor
Chapter 3. Using the Online Monitor 33
To issue the COLLECT command, type COLLECT (or one of its abbreviations) on thecommand line and press Enter .
Note: COLLECT can be used in any truncated form beginning with a minimum ofCOL.
For full information on collecting report data, refer to the DB2 PM Batch User’sGuide.
OPTIONS Command
Use OPTIONS to display the Session Options window, where you can set variousoptions controlling the environment of your IRF session.
The command syntax is:
To issue the OPTIONS command, type OPTIONS (or one of its abbreviations) on anycommand line and press Enter .
Note: OPTIONS can be used in any truncated form beginning with a minimum ofOPT.
Correlation ID Translation
The correlation ID is a DB2 field that identifies the task executed by DB2. Thecorrelation ID contains:
For batch jobs Jobname
For TSO applications Original authorization ID, that is, the logon user ID
For applications using theDB2 call attachment facility
Original authorization ID, that is, the logon user ID
For CICS transactions Connection type, thread type, thread number, and thetransaction ID
For IMS applications PST number and PSBNAME of the application
For RRS applications The character string provided by the application duringsignon.
Particularly for CICS and IMS it is useful to break the correlation ID into severalparts, so that you can easily distinguish the transaction ID (for CICS threads) fromthe PSBNAME (for IMS threads).
DB2 PM provides this function by translating the correlation ID into two separateidentifiers, the correlation name and the correlation number. Unless it was changedin your installation, this translation is based on the connection type of the threadand is done as follows:
ÊÊ OPTIONS ÊÍ
Figure 19. Syntax of the OPTIONS Command
Using the Online Monitor
34 DB2 PM Online Monitor User’s Guide
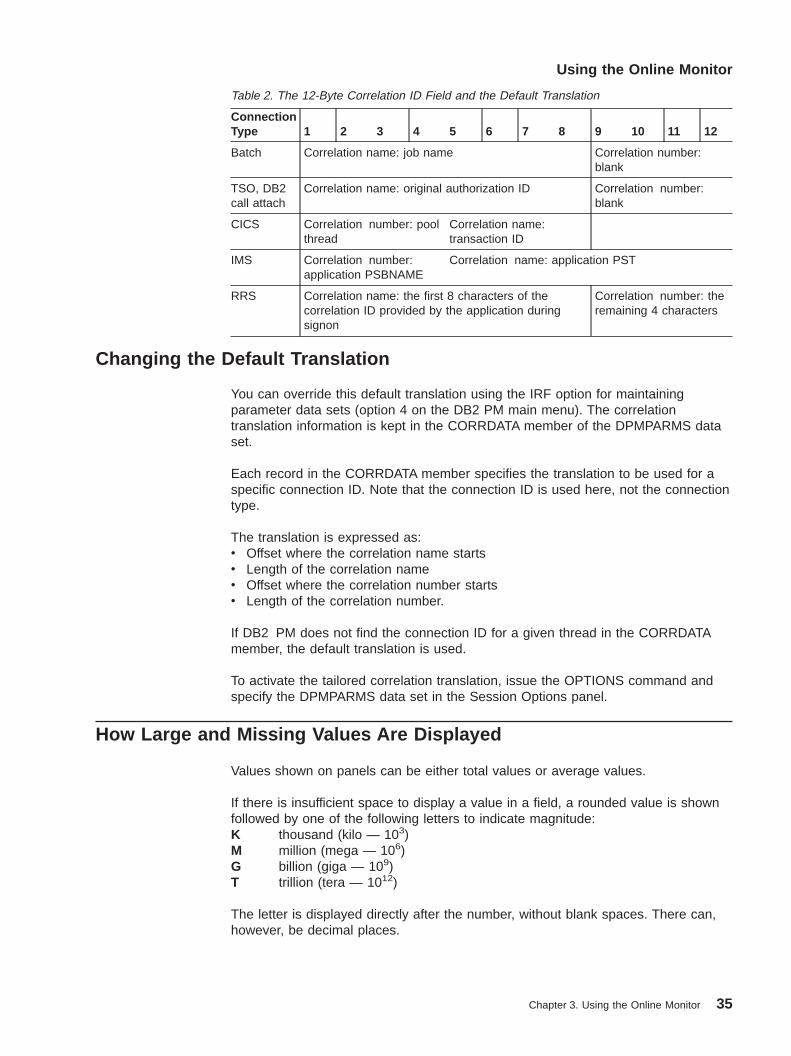
Table 2. The 12-Byte Correlation ID Field and the Default Translation
ConnectionType 1 2 3 4 5 6 7 8 9 10 11 12
Batch Correlation name: job name Correlation number:blank
TSO, DB2call attach
Correlation name: original authorization ID Correlation number:blank
CICS Correlation number: poolthread
Correlation name:transaction ID
IMS Correlation number:application PSBNAME
Correlation name: application PST
RRS Correlation name: the first 8 characters of thecorrelation ID provided by the application duringsignon
Correlation number: theremaining 4 characters
Changing the Default Translation
You can override this default translation using the IRF option for maintainingparameter data sets (option 4 on the DB2 PM main menu). The correlationtranslation information is kept in the CORRDATA member of the DPMPARMS dataset.
Each record in the CORRDATA member specifies the translation to be used for aspecific connection ID. Note that the connection ID is used here, not the connectiontype.
The translation is expressed as:v Offset where the correlation name startsv Length of the correlation namev Offset where the correlation number startsv Length of the correlation number.
If DB2 PM does not find the connection ID for a given thread in the CORRDATAmember, the default translation is used.
To activate the tailored correlation translation, issue the OPTIONS command andspecify the DPMPARMS data set in the Session Options panel.
How Large and Missing Values Are Displayed
Values shown on panels can be either total values or average values.
If there is insufficient space to display a value in a field, a rounded value is shownfollowed by one of the following letters to indicate magnitude:K thousand (kilo — 103)M million (mega — 106)G billion (giga — 109)T trillion (tera — 1012)
The letter is displayed directly after the number, without blank spaces. There can,however, be decimal places.
Using the Online Monitor
Chapter 3. Using the Online Monitor 35

Examples of Displayed Values
v Valid conversions of 12 345 include:– 12K– 12.35K– 12.3K
v Valid conversions of 1 234 567 include:– 1M– 1.2346M– 1235K
N/C is displayed if the data cannot be calculated.
N/P is displayed if the data is not present.
N/A is displayed if the field is not applicable.
Elapsed Time Formats
Time values are presented in one of the following formats:
v dd hh:mm:ss.ffffffff, where:dd represents dayshh represents hoursmm represents minutesss represents secondsffffffff represents the fractions of a second up to 8 decimal places.
For example, a time value of 1:30:25.10 represents 1 hour, 30 minutes, and 25.1seconds.
Some of the fields that use this format might not show days (dd) or hours (hh).
v ssssssss.ffffffff, where:ssssssss represents secondsffffffff represents the fractions of a second up to 8 decimal places.
The actual number of decimal places varies from one field to another.
Some time fields can be rounded. If there is insufficient space to display a timevalue, the time is rounded by removing decimal places as required. For elapsedtimes, a rounded value is displayed.
Date Formats
The date format for the Online Monitor is taken from your ISPF environment, and isconfigured during ISPF installation.
Using the Online Monitor
36 DB2 PM Online Monitor User’s Guide

Chapter 4. Common Errors Using DB2 PM
This chapter describes problems often encountered when using DB2 PM. If youcome across a problem, read this chapter before contacting IBM service.
STEPLIB Missing from IRF-Generated JCL
Symptom: The STEPLIB DD statement is missing from the IRF-generated JCL.
Probable Cause: Wrong option selected while running DGOJVARS.
Explanation: DGOJVARS is an EXEC provided with DB2 PM that displays a panelfor setting up certain DB2 PM defaults. One of the options on this panel specifieswhether the DB2 PM load library is in the system LNKLST concatenation. If thisoption is selected, then no STEPLIB DD statement is in the IRF-generated JCL.
Command Not Found
Symptom: Message IKJ56500I Command xxx not found is issued during theexecution of DB2 PM.
Probable Cause: The Program Control Facility (PCF) was not updated with the listof DB2 PM modules that are started as TSO command processors.
Explanation: The PCF makes a security check on all commands to see if they areincluded in the PCF command list. See your system administrator to ensure that allnecessary updates have been made. After the list has been updated, thecommands can be used.
© Copyright IBM Corp. 1985, 1999 37

38 DB2 PM Online Monitor User’s Guide
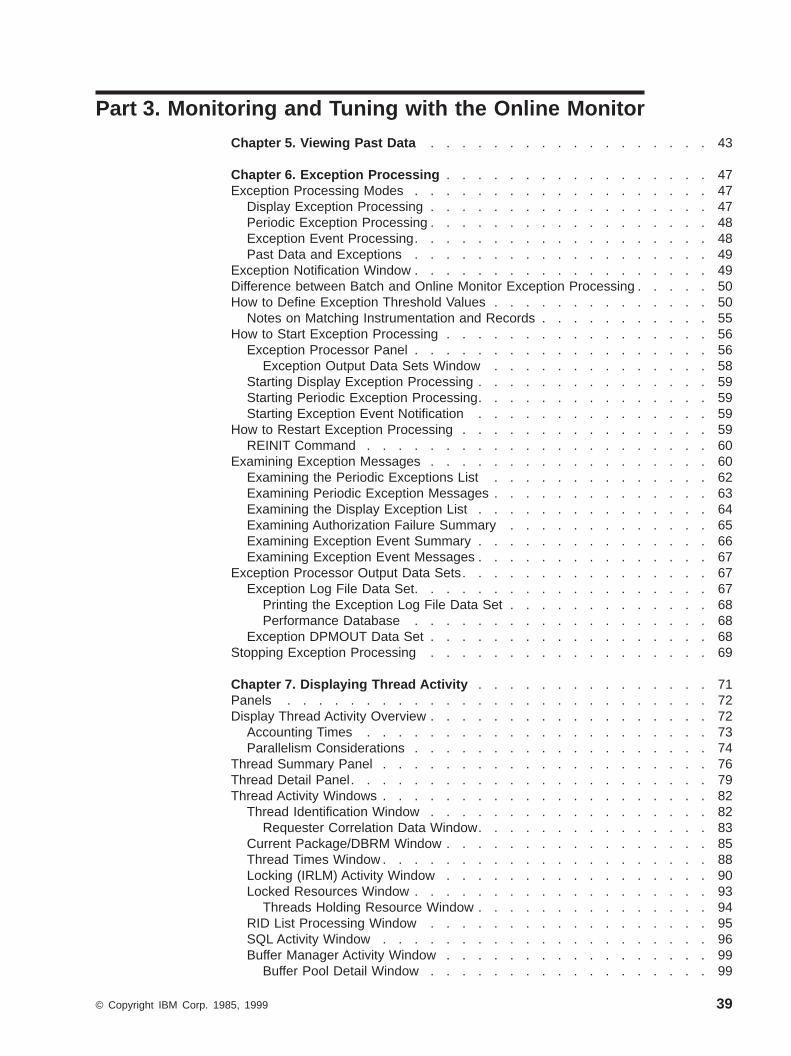
Part 3. Monitoring and Tuning with the Online Monitor
Chapter 5. Viewing Past Data . . . . . . . . . . . . . . . . . . 43
Chapter 6. Exception Processing . . . . . . . . . . . . . . . . . 47Exception Processing Modes . . . . . . . . . . . . . . . . . . . 47
Display Exception Processing . . . . . . . . . . . . . . . . . . 47Periodic Exception Processing . . . . . . . . . . . . . . . . . . 48Exception Event Processing. . . . . . . . . . . . . . . . . . . 48Past Data and Exceptions . . . . . . . . . . . . . . . . . . . 49
Exception Notification Window . . . . . . . . . . . . . . . . . . . 49Difference between Batch and Online Monitor Exception Processing . . . . . 50How to Define Exception Threshold Values . . . . . . . . . . . . . . 50
Notes on Matching Instrumentation and Records . . . . . . . . . . . 55How to Start Exception Processing . . . . . . . . . . . . . . . . . 56
Exception Processor Panel . . . . . . . . . . . . . . . . . . . 56Exception Output Data Sets Window . . . . . . . . . . . . . . 58
Starting Display Exception Processing . . . . . . . . . . . . . . . 59Starting Periodic Exception Processing. . . . . . . . . . . . . . . 59Starting Exception Event Notification . . . . . . . . . . . . . . . 59
How to Restart Exception Processing . . . . . . . . . . . . . . . . 59REINIT Command . . . . . . . . . . . . . . . . . . . . . . 60
Examining Exception Messages . . . . . . . . . . . . . . . . . . 60Examining the Periodic Exceptions List . . . . . . . . . . . . . . 62Examining Periodic Exception Messages . . . . . . . . . . . . . . 63Examining the Display Exception List . . . . . . . . . . . . . . . 64Examining Authorization Failure Summary . . . . . . . . . . . . . 65Examining Exception Event Summary . . . . . . . . . . . . . . . 66Examining Exception Event Messages . . . . . . . . . . . . . . . 67
Exception Processor Output Data Sets. . . . . . . . . . . . . . . . 67Exception Log File Data Set. . . . . . . . . . . . . . . . . . . 67
Printing the Exception Log File Data Set . . . . . . . . . . . . . 68Performance Database . . . . . . . . . . . . . . . . . . . 68
Exception DPMOUT Data Set . . . . . . . . . . . . . . . . . . 68Stopping Exception Processing . . . . . . . . . . . . . . . . . . 69
Chapter 7. Displaying Thread Activity . . . . . . . . . . . . . . . 71Panels . . . . . . . . . . . . . . . . . . . . . . . . . . . 72Display Thread Activity Overview . . . . . . . . . . . . . . . . . . 72
Accounting Times . . . . . . . . . . . . . . . . . . . . . . 73Parallelism Considerations . . . . . . . . . . . . . . . . . . . 74
Thread Summary Panel . . . . . . . . . . . . . . . . . . . . . 76Thread Detail Panel. . . . . . . . . . . . . . . . . . . . . . . 79Thread Activity Windows . . . . . . . . . . . . . . . . . . . . . 82
Thread Identification Window . . . . . . . . . . . . . . . . . . 82Requester Correlation Data Window. . . . . . . . . . . . . . . 83
Current Package/DBRM Window . . . . . . . . . . . . . . . . . 85Thread Times Window . . . . . . . . . . . . . . . . . . . . . 88Locking (IRLM) Activity Window . . . . . . . . . . . . . . . . . 90Locked Resources Window . . . . . . . . . . . . . . . . . . . 93
Threads Holding Resource Window . . . . . . . . . . . . . . . 94RID List Processing Window . . . . . . . . . . . . . . . . . . 95SQL Activity Window . . . . . . . . . . . . . . . . . . . . . 96Buffer Manager Activity Window . . . . . . . . . . . . . . . . . 99
Buffer Pool Detail Window . . . . . . . . . . . . . . . . . . 99
© Copyright IBM Corp. 1985, 1999 39

SQL Statement and Package Window . . . . . . . . . . . . . . . 101Distributed Data Window . . . . . . . . . . . . . . . . . . . . 102
Distributed Location Detail Window . . . . . . . . . . . . . . . 102Distributed Conversation Detail Window . . . . . . . . . . . . . 104
IFI (Class 5) and Data Capture Window . . . . . . . . . . . . . . 105Query Parallelism Data Window . . . . . . . . . . . . . . . . . 106Data Sharing Locking Activity Window . . . . . . . . . . . . . . . 109Group Buffer Pools Activity Window . . . . . . . . . . . . . . . . 110
Group Buffer Pool Detail Window . . . . . . . . . . . . . . . . 110Stored Procedures Window . . . . . . . . . . . . . . . . . . . 112
Thread Activity Commands . . . . . . . . . . . . . . . . . . . . 112AUTO Command. . . . . . . . . . . . . . . . . . . . . . . 112
Parameter Descriptions . . . . . . . . . . . . . . . . . . . 113Starting Auto Display Mode . . . . . . . . . . . . . . . . . . 113AUTO Command Examples . . . . . . . . . . . . . . . . . . 113
EXPLAIN Command . . . . . . . . . . . . . . . . . . . . . 113Invoking Explain . . . . . . . . . . . . . . . . . . . . . . 114
HISTORY Command . . . . . . . . . . . . . . . . . . . . . 114Parameter Descriptions . . . . . . . . . . . . . . . . . . . 114Viewing Past Data . . . . . . . . . . . . . . . . . . . . . 115
RESET Command . . . . . . . . . . . . . . . . . . . . . . 115Resetting Thread Display. . . . . . . . . . . . . . . . . . . 115
PURGE Command . . . . . . . . . . . . . . . . . . . . . . 115Purging a Thread. . . . . . . . . . . . . . . . . . . . . . 116
QUALIFY Command . . . . . . . . . . . . . . . . . . . . . 116Parameter Descriptions . . . . . . . . . . . . . . . . . . . 117Filtering Threads . . . . . . . . . . . . . . . . . . . . . . 117DB2 PM Identifiers . . . . . . . . . . . . . . . . . . . . . 118Thread Status . . . . . . . . . . . . . . . . . . . . . . . 119Thread Type . . . . . . . . . . . . . . . . . . . . . . . 119DB2 Thread Qualification Parameters Window Example . . . . . . . 119
SORT Command . . . . . . . . . . . . . . . . . . . . . . . 120Parameter Descriptions . . . . . . . . . . . . . . . . . . . 120Sorting Threads . . . . . . . . . . . . . . . . . . . . . . 121Sort Example 1 . . . . . . . . . . . . . . . . . . . . . . 122Sort Example 2 . . . . . . . . . . . . . . . . . . . . . . 122
Chapter 8. Viewing DB2 Statistics . . . . . . . . . . . . . . . . . 125Statistics Panels . . . . . . . . . . . . . . . . . . . . . . . . 126Statistics Processing Modes. . . . . . . . . . . . . . . . . . . . 126
Regular Processing Mode . . . . . . . . . . . . . . . . . . . 127Interval Processing Mode. . . . . . . . . . . . . . . . . . . . 127Delta Processing Mode . . . . . . . . . . . . . . . . . . . . 127
Snapshot Fields . . . . . . . . . . . . . . . . . . . . . . 128High Water Mark Fields . . . . . . . . . . . . . . . . . . . 129
Statistics Panel Overview. . . . . . . . . . . . . . . . . . . . . 130DB2 Statistics Detail Panel . . . . . . . . . . . . . . . . . . . . 130DB2 Statistics Windows . . . . . . . . . . . . . . . . . . . . . 133
EDM Pool Window . . . . . . . . . . . . . . . . . . . . . . 133Buffer Manager Window . . . . . . . . . . . . . . . . . . . . 134
Buffer Pool Windows . . . . . . . . . . . . . . . . . . . . 135Locking Activity Window . . . . . . . . . . . . . . . . . . . . 140Open/Close Management Window . . . . . . . . . . . . . . . . 142Bind Processing Window . . . . . . . . . . . . . . . . . . . . 143Plan and Package Allocation Window . . . . . . . . . . . . . . . 145Log Manager Window . . . . . . . . . . . . . . . . . . . . . 145
40 DB2 PM Online Monitor User’s Guide
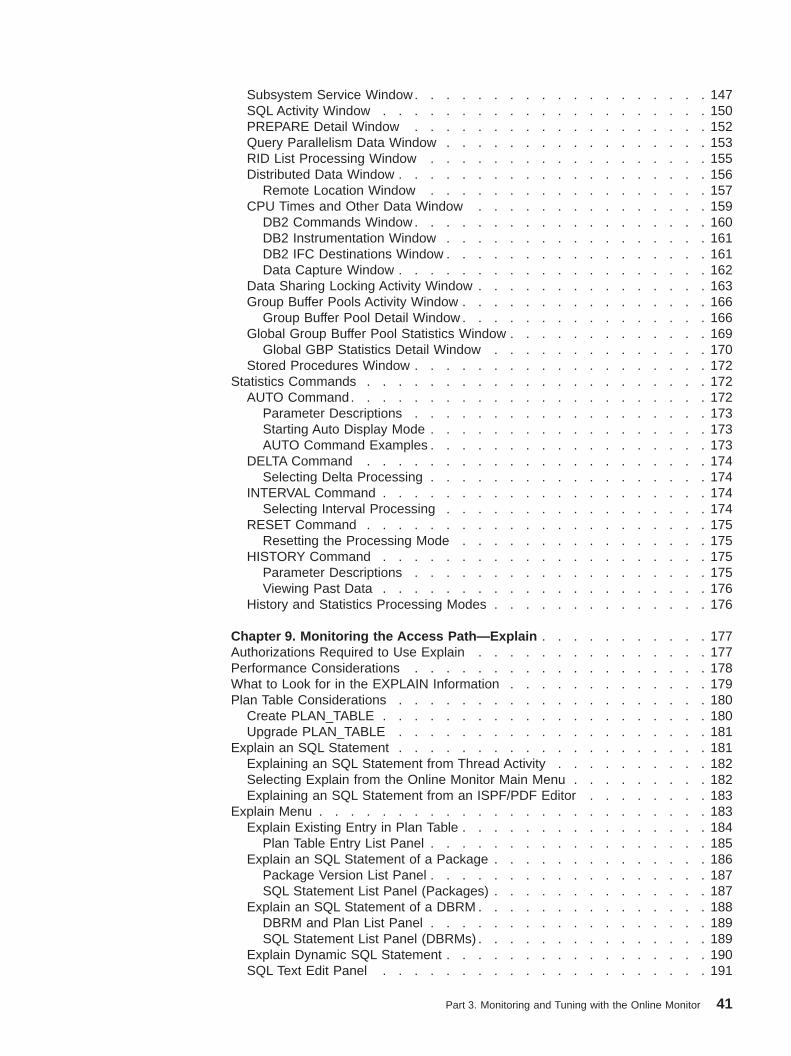
Subsystem Service Window. . . . . . . . . . . . . . . . . . . 147SQL Activity Window . . . . . . . . . . . . . . . . . . . . . 150PREPARE Detail Window . . . . . . . . . . . . . . . . . . . 152Query Parallelism Data Window . . . . . . . . . . . . . . . . . 153RID List Processing Window . . . . . . . . . . . . . . . . . . 155Distributed Data Window . . . . . . . . . . . . . . . . . . . . 156
Remote Location Window . . . . . . . . . . . . . . . . . . 157CPU Times and Other Data Window . . . . . . . . . . . . . . . 159
DB2 Commands Window . . . . . . . . . . . . . . . . . . . 160DB2 Instrumentation Window . . . . . . . . . . . . . . . . . 161DB2 IFC Destinations Window . . . . . . . . . . . . . . . . . 161Data Capture Window . . . . . . . . . . . . . . . . . . . . 162
Data Sharing Locking Activity Window . . . . . . . . . . . . . . . 163Group Buffer Pools Activity Window . . . . . . . . . . . . . . . . 166
Group Buffer Pool Detail Window . . . . . . . . . . . . . . . . 166Global Group Buffer Pool Statistics Window . . . . . . . . . . . . . 169
Global GBP Statistics Detail Window . . . . . . . . . . . . . . 170Stored Procedures Window . . . . . . . . . . . . . . . . . . . 172
Statistics Commands . . . . . . . . . . . . . . . . . . . . . . 172AUTO Command. . . . . . . . . . . . . . . . . . . . . . . 172
Parameter Descriptions . . . . . . . . . . . . . . . . . . . 173Starting Auto Display Mode . . . . . . . . . . . . . . . . . . 173AUTO Command Examples . . . . . . . . . . . . . . . . . . 173
DELTA Command . . . . . . . . . . . . . . . . . . . . . . 174Selecting Delta Processing . . . . . . . . . . . . . . . . . . 174
INTERVAL Command . . . . . . . . . . . . . . . . . . . . . 174Selecting Interval Processing . . . . . . . . . . . . . . . . . 174
RESET Command . . . . . . . . . . . . . . . . . . . . . . 175Resetting the Processing Mode . . . . . . . . . . . . . . . . 175
HISTORY Command . . . . . . . . . . . . . . . . . . . . . 175Parameter Descriptions . . . . . . . . . . . . . . . . . . . 175Viewing Past Data . . . . . . . . . . . . . . . . . . . . . 176
History and Statistics Processing Modes . . . . . . . . . . . . . . 176
Chapter 9. Monitoring the Access Path—Explain . . . . . . . . . . . 177Authorizations Required to Use Explain . . . . . . . . . . . . . . . 177Performance Considerations . . . . . . . . . . . . . . . . . . . 178What to Look for in the EXPLAIN Information . . . . . . . . . . . . . 179Plan Table Considerations . . . . . . . . . . . . . . . . . . . . 180
Create PLAN_TABLE . . . . . . . . . . . . . . . . . . . . . 180Upgrade PLAN_TABLE . . . . . . . . . . . . . . . . . . . . 181
Explain an SQL Statement . . . . . . . . . . . . . . . . . . . . 181Explaining an SQL Statement from Thread Activity . . . . . . . . . . 182Selecting Explain from the Online Monitor Main Menu . . . . . . . . . 182Explaining an SQL Statement from an ISPF/PDF Editor . . . . . . . . 183
Explain Menu . . . . . . . . . . . . . . . . . . . . . . . . . 183Explain Existing Entry in Plan Table . . . . . . . . . . . . . . . . 184
Plan Table Entry List Panel . . . . . . . . . . . . . . . . . . 185Explain an SQL Statement of a Package . . . . . . . . . . . . . . 186
Package Version List Panel . . . . . . . . . . . . . . . . . . 187SQL Statement List Panel (Packages) . . . . . . . . . . . . . . 187
Explain an SQL Statement of a DBRM . . . . . . . . . . . . . . . 188DBRM and Plan List Panel . . . . . . . . . . . . . . . . . . 189SQL Statement List Panel (DBRMs) . . . . . . . . . . . . . . . 189
Explain Dynamic SQL Statement . . . . . . . . . . . . . . . . . 190SQL Text Edit Panel . . . . . . . . . . . . . . . . . . . . . 191
Part 3. Monitoring and Tuning with the Online Monitor 41
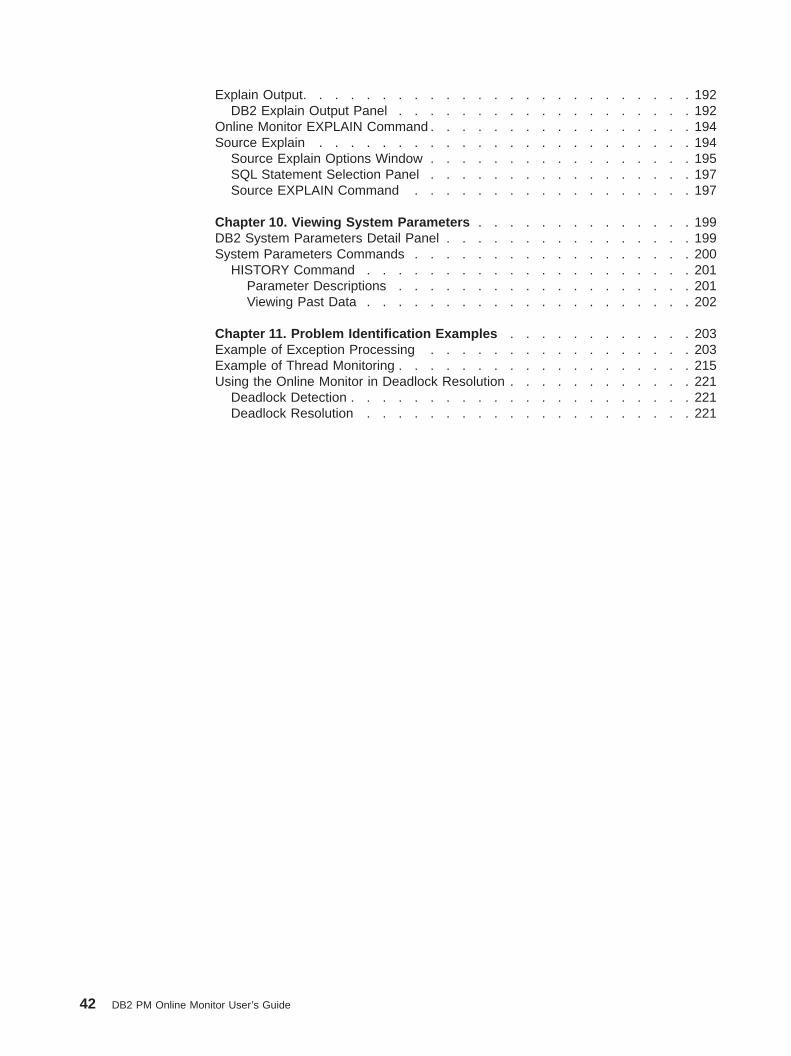
Explain Output. . . . . . . . . . . . . . . . . . . . . . . . . 192DB2 Explain Output Panel . . . . . . . . . . . . . . . . . . . 192
Online Monitor EXPLAIN Command . . . . . . . . . . . . . . . . . 194Source Explain . . . . . . . . . . . . . . . . . . . . . . . . 194
Source Explain Options Window . . . . . . . . . . . . . . . . . 195SQL Statement Selection Panel . . . . . . . . . . . . . . . . . 197Source EXPLAIN Command . . . . . . . . . . . . . . . . . . 197
Chapter 10. Viewing System Parameters . . . . . . . . . . . . . . 199DB2 System Parameters Detail Panel . . . . . . . . . . . . . . . . 199System Parameters Commands . . . . . . . . . . . . . . . . . . 200
HISTORY Command . . . . . . . . . . . . . . . . . . . . . 201Parameter Descriptions . . . . . . . . . . . . . . . . . . . 201Viewing Past Data . . . . . . . . . . . . . . . . . . . . . 202
Chapter 11. Problem Identification Examples . . . . . . . . . . . . 203Example of Exception Processing . . . . . . . . . . . . . . . . . 203Example of Thread Monitoring . . . . . . . . . . . . . . . . . . . 215Using the Online Monitor in Deadlock Resolution . . . . . . . . . . . . 221
Deadlock Detection . . . . . . . . . . . . . . . . . . . . . . 221Deadlock Resolution . . . . . . . . . . . . . . . . . . . . . 221
42 DB2 PM Online Monitor User’s Guide

Chapter 5. Viewing Past Data
You can recall and view statistics, thread activity, and system parameters datapreviously collected by the data collector. The data is gathered atinstallation-defined intervals. Refer to “Chapter 14. Data Collector Purpose andFunction” on page 233 and the following chapters for a description of the datacollector.
You can view past data by issuing the HISTORY command or pressing F6 (History)on any panel that can display past data.
When viewing past data, the word HISTORY is displayed on the line following theheading of the current panel, as shown in Figure 20:
The date and time following the word HISTORY indicate when the data beingdisplayed was collected.
Note: You can view past data only if the data collector is installed at your site.
Your installation can choose to collect data at the following levels:
v Thread Summaryv Thread Detailv Thread Detail with locking informationv Thread Detail with SQL statementv Thread Detail with locking information and SQL statementv Statisticsv System Parameters.
Historical data is kept in either a VSAM data set or data space. The data isgathered by the data collector. When the data set or data space is full, the data iswritten to the beginning again, writing over the earliest data gathered.
The availability of the data is limited by the collection rate, the size of the dataspace or data set used, the amount of historical data to be maintained, and thethread history qualification definitions (all of these are defined in the data collectorstartup parameters). Refer to the DB2 PM Installation and Customization manual fordetails.
The data collector parameters can also be modified by the administrator user. Referto “Chapter 15. Administrator User” on page 235 for more information.
DGOMTPSM 11:57 Thread Detail PMO1DLOC DSN1 V6GROUP001 MEMBER01 HISTORY 01/30/98 11:45:00
For details, place any character next to heading, then press Enter.
Figure 20. Thread Detail Panel Showing History Active
© Copyright IBM Corp. 1985, 1999 43
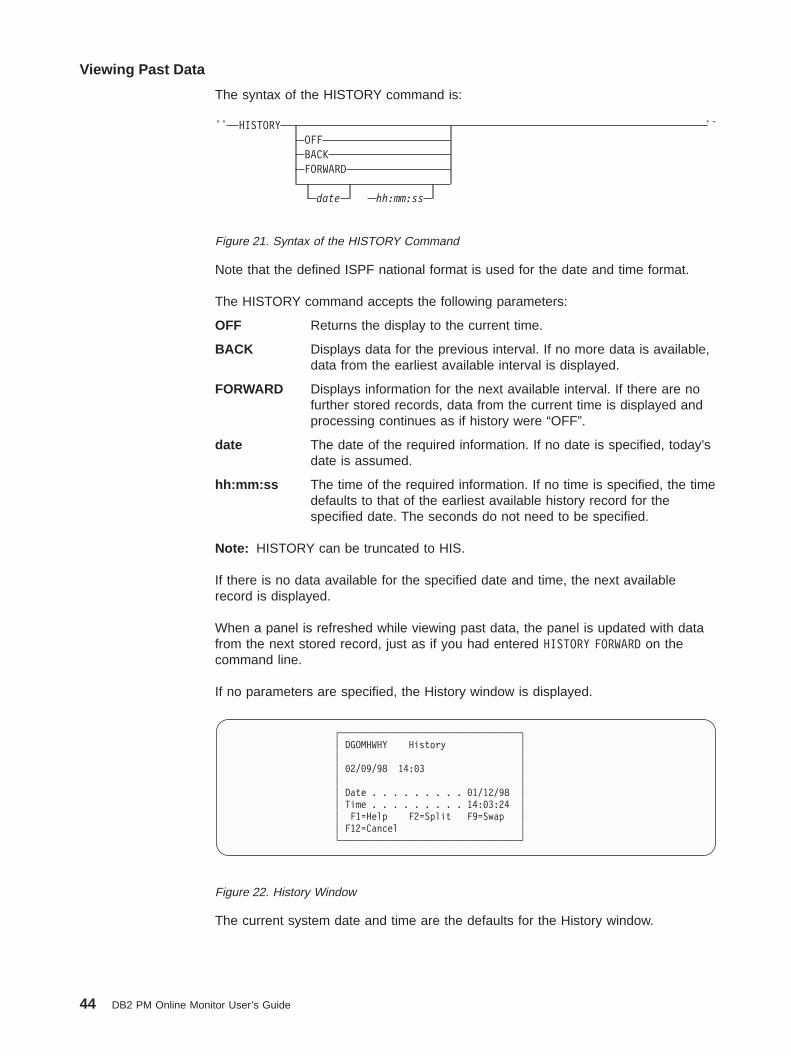
The syntax of the HISTORY command is:
Note that the defined ISPF national format is used for the date and time format.
The HISTORY command accepts the following parameters:
OFF Returns the display to the current time.
BACK Displays data for the previous interval. If no more data is available,data from the earliest available interval is displayed.
FORWARD Displays information for the next available interval. If there are nofurther stored records, data from the current time is displayed andprocessing continues as if history were “OFF”.
date The date of the required information. If no date is specified, today’sdate is assumed.
hh:mm:ss The time of the required information. If no time is specified, the timedefaults to that of the earliest available history record for thespecified date. The seconds do not need to be specified.
Note: HISTORY can be truncated to HIS.
If there is no data available for the specified date and time, the next availablerecord is displayed.
When a panel is refreshed while viewing past data, the panel is updated with datafrom the next stored record, just as if you had entered HISTORY FORWARD on thecommand line.
If no parameters are specified, the History window is displayed.
The current system date and time are the defaults for the History window.
ÊÊ HISTORYOFFBACKFORWARD
date hh:mm:ss
ÊÍ
Figure 21. Syntax of the HISTORY Command
┌──────────────────────────────────┐│ DGOMHWHY History ││ ││ 02/09/98 14:03 ││ ││ Date . . . . . . . . . 01/12/98 ││ Time . . . . . . . . . 14:03:24 ││ F1=Help F2=Split F9=Swap ││ F12=Cancel │└──────────────────────────────────┘
Figure 22. History Window
Viewing Past Data
44 DB2 PM Online Monitor User’s Guide
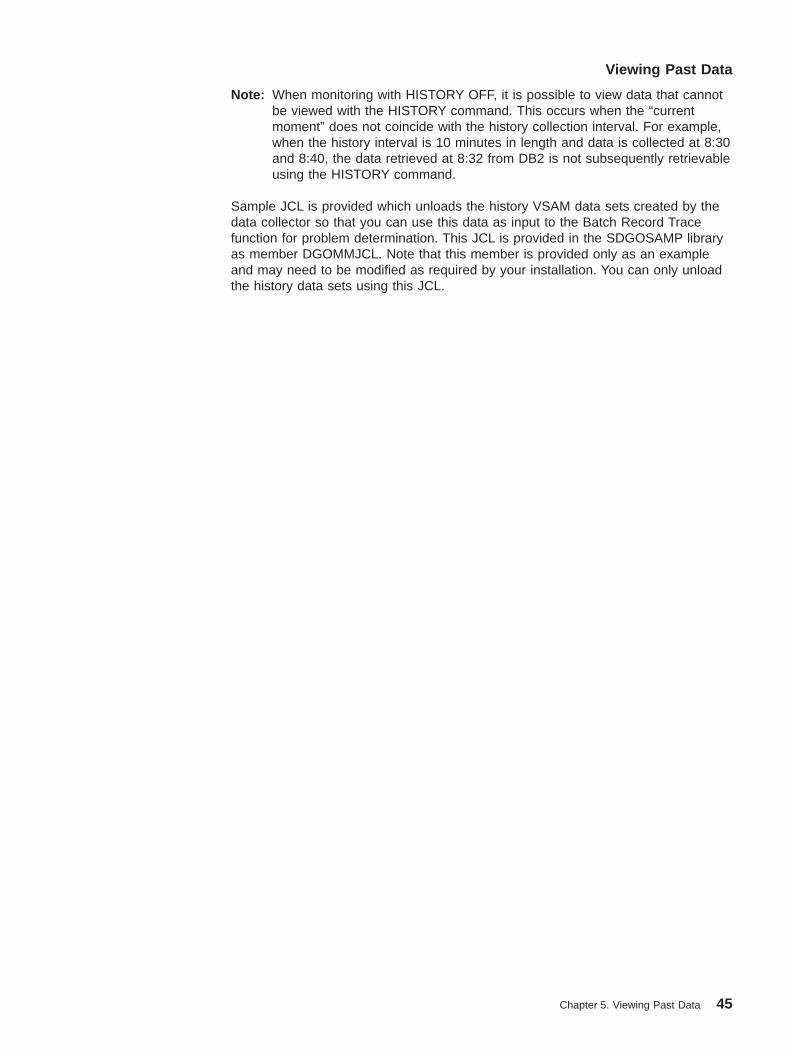
Note: When monitoring with HISTORY OFF, it is possible to view data that cannotbe viewed with the HISTORY command. This occurs when the “currentmoment” does not coincide with the history collection interval. For example,when the history interval is 10 minutes in length and data is collected at 8:30and 8:40, the data retrieved at 8:32 from DB2 is not subsequently retrievableusing the HISTORY command.
Sample JCL is provided which unloads the history VSAM data sets created by thedata collector so that you can use this data as input to the Batch Record Tracefunction for problem determination. This JCL is provided in the SDGOSAMP libraryas member DGOMMJCL. Note that this member is provided only as an exampleand may need to be modified as required by your installation. You can only unloadthe history data sets using this JCL.
Viewing Past Data
Chapter 5. Viewing Past Data 45

46 DB2 PM Online Monitor User’s Guide

Chapter 6. Exception Processing
Exception processing is the most effective way of using DB2 PM to identifyperformance problems. The first step in monitoring your DB2 system should alwaysbe to start thread and statistics exception processing.
Use Online Monitor exception processing to identify DB2 thread and statistics fieldsthat contain values outside limits you have specified. This gives you bettermanagement of service levels by identifying problems in the DB2 subsystem andthreads causing performance problems.
Using display and periodic exception processing, you can monitor and identify thefollowing:v Threads that might be experiencing problemsv Subsystem-wide DB2 conditions that might be causing performance problems.
Using exception event processing, you can monitor the following events:v Deadlockv Timeoutv EDM pool fullv Authorization failurev Thread commit indoubtv Coupling Facility (CF) rebuild/alter startv CF rebuild/alter endv Global trace started.
The threshold values for thread activity and statistics fields are specified in theexception threshold data set. When exceptions are detected during your monitoringsession, you are notified so that appropriate action can be taken. In addition, youcan activate a user exit that can automatically trigger any immediate reaction, forexample, issue an alert to NetView.
You can view information about any of the exceptions using the Online MonitorLOOK command.
With exception processing, you can create the following two data sets for lateranalysis:v The exception log file data set (to print a list of exceptions or to load exception
data into DB2)v The exception DPMOUT data set (records that had exceptions).
Exception Processing Modes
This section describes the three basic types of exception processing available:display exception processing, periodic exception processing, and exception eventprocessing.
Display Exception Processing
Use display exception processing to monitor the occurrence of a specific exception.This exception processing mode operates in the foreground of Online Monitorprocessing. With display exception processing you can view thread activity
© Copyright IBM Corp. 1985, 1999 47

exceptions, and statistics exceptions in interval or delta processing mode. Refer to“Statistics Processing Modes” on page 126 for an explanation of delta and intervalprocessing.
With display exception checking, fields shown on the current panel are checkedwhenever the display is refreshed with new or historical data. Fields with exceptionconditions are shown in reverse video, and the color of the field indicates the levelof the exception. Warning level exceptions are highlighted in yellow, while Problemlevel exceptions are highlighted in red. Note that these colors may differ if you havechanged your ISPF default colors. Selection fields on the detail panels are alsoshown in reverse video if any of their lower level windows contain fields inexception status. The exception notifications are stored and can be examined usingthe LOOK command.
Periodic Exception Processing
Use periodic exception processing to periodically monitor both thread activity andstatistics fields for exception conditions. This processing mode runs in thebackground of Online Monitor processing.
With periodic exception processing, data is tested for exception whenever theinterval you specified has elapsed (whether or not you are viewing the relevantdata). If any Problem level exceptions are detected, the Exception Notificationwindow is displayed. If only Warning level exceptions are detected, a message isdisplayed to notify that a periodic exception has occurred. This window is overlaidon the current panel and shows the number of periodic exceptions detected duringthe interval. The exception notifications are stored and can be examined using theLOOK command.
If the data collector is active, periodic exception processing can continue when youexit the Online Monitor. When you next use the Online Monitor, any periodicexceptions detected while you were not logged on are displayed. Periodic exceptionprocessing is not terminated until you stop it or until the data collector itself isterminated. If the data collector is not active, periodic exception processingterminates when you exit the Online Monitor.
Exception Event Processing
Use exception event processing to monitor the DB2 subsystem for the occurrenceof particular events. This processing mode runs in the background of Online Monitorprocessing. The following events can be monitored:v Deadlockv Timeoutv EDM pool fullv Authorization failurev Thread commit indoubtv CF rebuild/alter startv CF rebuild/alter endv Global trace started.
The events need to be specified with the EXCEPTIONEVENT data collectorparameter or on the Data Collector Parameters window before exception eventprocessing can be activated using the Exception Processor panel. Refer to the DB2PM Installation and Customization manual and “Data Collector Parameters Window”on page 235 for more information.
Exception Processing
48 DB2 PM Online Monitor User’s Guide
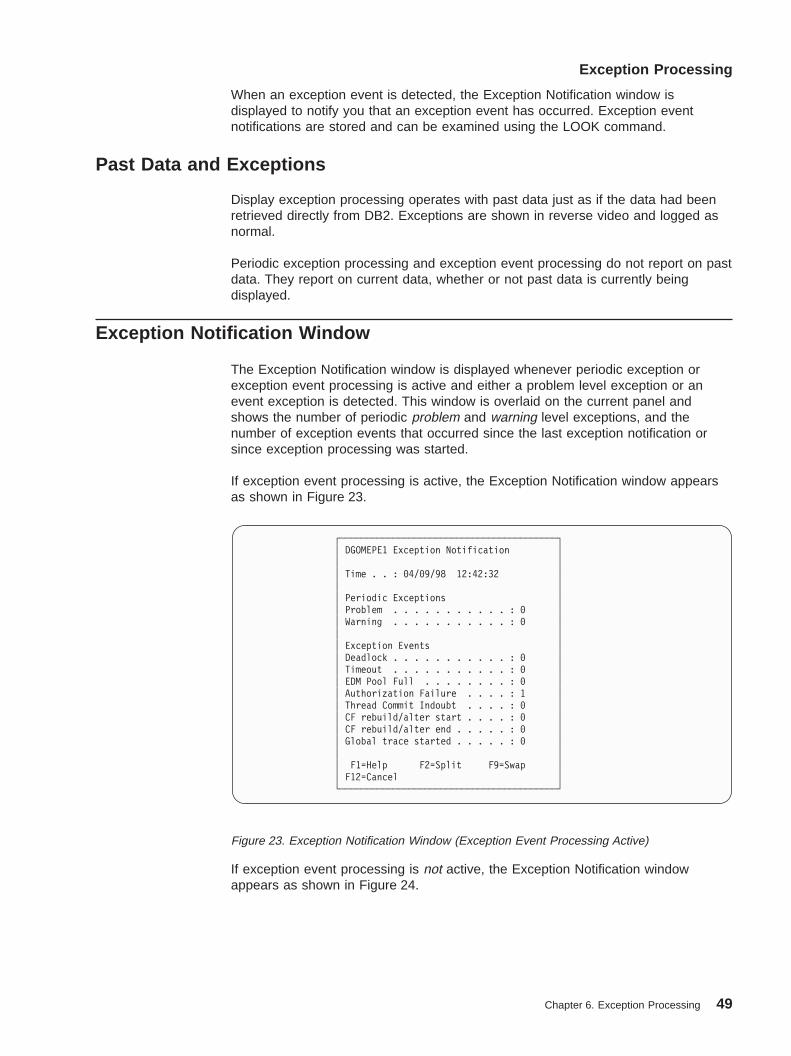
When an exception event is detected, the Exception Notification window isdisplayed to notify you that an exception event has occurred. Exception eventnotifications are stored and can be examined using the LOOK command.
Past Data and Exceptions
Display exception processing operates with past data just as if the data had beenretrieved directly from DB2. Exceptions are shown in reverse video and logged asnormal.
Periodic exception processing and exception event processing do not report on pastdata. They report on current data, whether or not past data is currently beingdisplayed.
Exception Notification Window
The Exception Notification window is displayed whenever periodic exception orexception event processing is active and either a problem level exception or anevent exception is detected. This window is overlaid on the current panel andshows the number of periodic problem and warning level exceptions, and thenumber of exception events that occurred since the last exception notification orsince exception processing was started.
If exception event processing is active, the Exception Notification window appearsas shown in Figure 23.
If exception event processing is not active, the Exception Notification windowappears as shown in Figure 24.
┌─────────────────────────────────────────┐│ DGOMEPE1 Exception Notification ││ ││ Time . . : 04/09/98 12:42:32 ││ ││ Periodic Exceptions ││ Problem . . . . . . . . . . . : 0 ││ Warning . . . . . . . . . . . : 0 ││ ││ Exception Events ││ Deadlock . . . . . . . . . . . : 0 ││ Timeout . . . . . . . . . . . : 0 ││ EDM Pool Full . . . . . . . . : 0 ││ Authorization Failure . . . . : 1 ││ Thread Commit Indoubt . . . . : 0 ││ CF rebuild/alter start . . . . : 0 ││ CF rebuild/alter end . . . . . : 0 ││ Global trace started . . . . . : 0 ││ ││ F1=Help F2=Split F9=Swap ││ F12=Cancel │└─────────────────────────────────────────┘
Figure 23. Exception Notification Window (Exception Event Processing Active)
Exception Processing
Chapter 6. Exception Processing 49

To exit the Exception Notification window and return to the panel you were viewing,press Enter or F12 (Cancel).
The Periodic Exceptions field shows the number of Problem and Warning levelperiodic exceptions that occurred since the last time you were notified of anexception.
The Exception Events section of this window shows the number of exception eventsthat occurred for various events since the last time you were notified of anexception. This field categorizes the seven different classes of exception events thatcan occur.
Difference between Batch and Online Monitor Exception Processing
The fundamental difference between batch and Online Monitor exceptionprocessing is that the Online Monitor shows an active view of DB2 subsystemactivity (active threads), whereas DB2 PM Batch shows activity that has beencompleted (threads that have ended). Therefore, the values shown by the OnlineMonitor and Batch are unlikely to match. For example, a thread shown to be inexception status in a Batch accounting trace is not necessarily in exception statusin the Online Monitor.
How to Define Exception Threshold Values
Exception threshold values are defined in the exception threshold data set. You canspecify these thresholds using the Exception Threshold Field Details panel, orcalculate the thresholds using exception profiling (refer to “Chapter 12. TailoringException Thresholds—Exception Profiling” on page 225). When exceptionprocessing is active, the DB2 instrumentation data is checked against values in theexception threshold data set. Fields containing values outside limits that you havespecified are reported.
To provide you with a starting point, sample threshold member DGOETV41 hasbeen provided in SDGODATA. This member is provided only as a sample and canbe modified as required by your installation.
Note that some of the entries in this member contain asterisks (*) in their exceptionthreshold fields. Values are substituted for these asterisks when exception profilingis performed. If you use this sample data set before performing exception profiling,the entries containing asterisks generate warning messages and are not processed,however, all other entries are processed in the normal manner.
┌─────────────────────────────────┐│ DGOMEPEX Exception Notification ││ ││ Time . . : 04/03/98 11:53:26 ││ ││ Periodic Exceptions ││ Problem : 1 ││ Warning : 2 ││ ││ F1=Help F2=Split F9=Swap ││ F12=Cancel │└─────────────────────────────────┘
Figure 24. Exception Notification Window (Exception Event Processing Inactive)
Exception Processing
50 DB2 PM Online Monitor User’s Guide
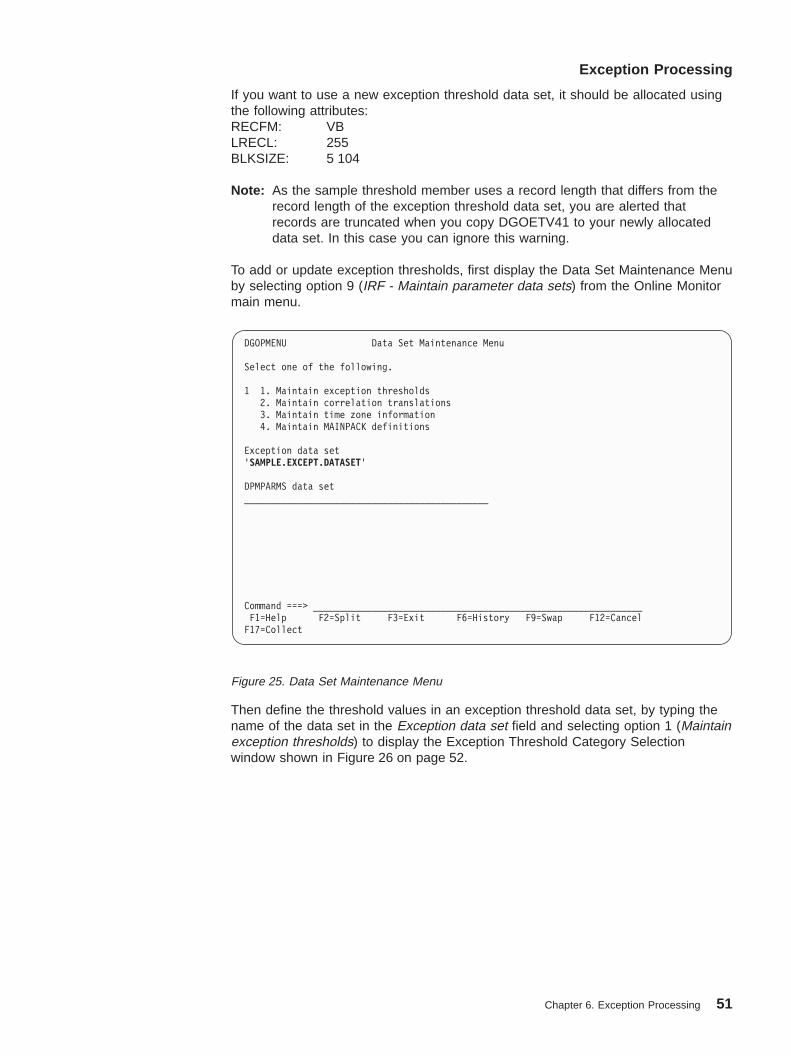
If you want to use a new exception threshold data set, it should be allocated usingthe following attributes:RECFM: VBLRECL: 255BLKSIZE: 5 104
Note: As the sample threshold member uses a record length that differs from therecord length of the exception threshold data set, you are alerted thatrecords are truncated when you copy DGOETV41 to your newly allocateddata set. In this case you can ignore this warning.
To add or update exception thresholds, first display the Data Set Maintenance Menuby selecting option 9 (IRF - Maintain parameter data sets) from the Online Monitormain menu.
Then define the threshold values in an exception threshold data set, by typing thename of the data set in the Exception data set field and selecting option 1 (Maintainexception thresholds) to display the Exception Threshold Category Selectionwindow shown in Figure 26 on page 52.
DGOPMENU Data Set Maintenance Menu
Select one of the following.
1 1. Maintain exception thresholds2. Maintain correlation translations3. Maintain time zone information4. Maintain MAINPACK definitions
Exception data set'SAMPLE.EXCEPT.DATASET'
DPMPARMS data set______________________________________________
Command ===> ______________________________________________________________F1=Help F2=Split F3=Exit F6=History F9=Swap F12=CancelF17=Collect
Figure 25. Data Set Maintenance Menu
Exception Processing
Chapter 6. Exception Processing 51
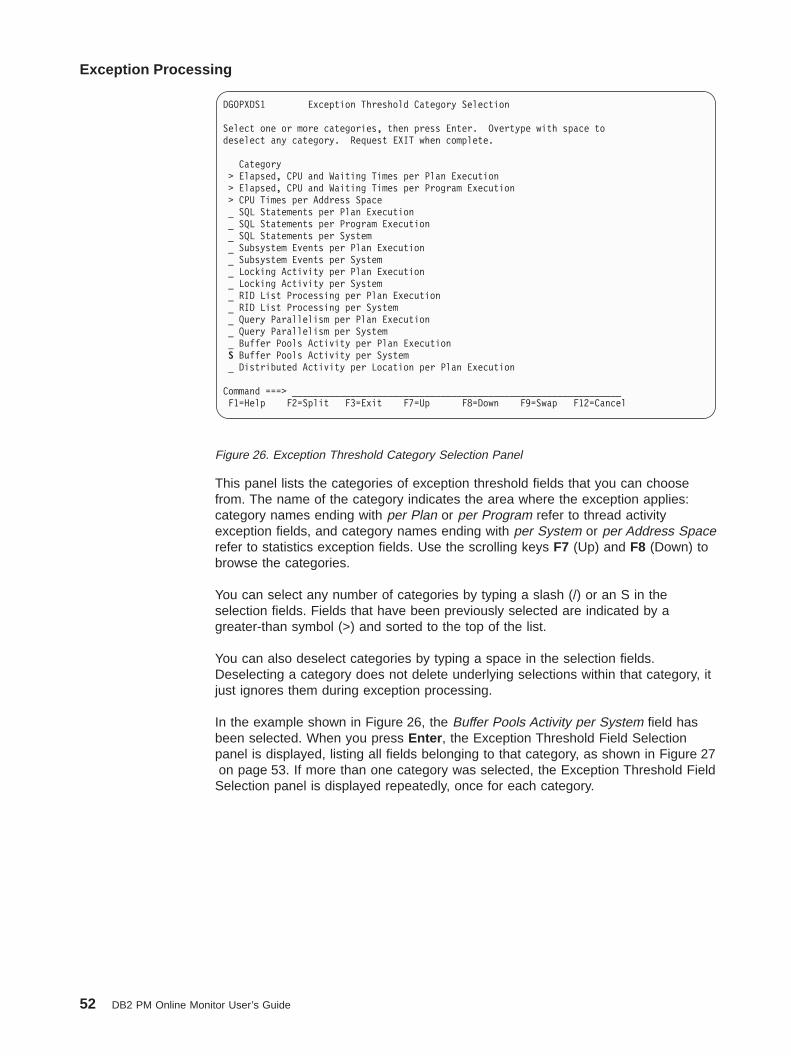
This panel lists the categories of exception threshold fields that you can choosefrom. The name of the category indicates the area where the exception applies:category names ending with per Plan or per Program refer to thread activityexception fields, and category names ending with per System or per Address Spacerefer to statistics exception fields. Use the scrolling keys F7 (Up) and F8 (Down) tobrowse the categories.
You can select any number of categories by typing a slash (/) or an S in theselection fields. Fields that have been previously selected are indicated by agreater-than symbol (>) and sorted to the top of the list.
You can also deselect categories by typing a space in the selection fields.Deselecting a category does not delete underlying selections within that category, itjust ignores them during exception processing.
In the example shown in Figure 26, the Buffer Pools Activity per System field hasbeen selected. When you press Enter , the Exception Threshold Field Selectionpanel is displayed, listing all fields belonging to that category, as shown in Figure 27on page 53. If more than one category was selected, the Exception Threshold FieldSelection panel is displayed repeatedly, once for each category.
DGOPXDS1 Exception Threshold Category Selection
Select one or more categories, then press Enter. Overtype with space todeselect any category. Request EXIT when complete.
Category> Elapsed, CPU and Waiting Times per Plan Execution> Elapsed, CPU and Waiting Times per Program Execution> CPU Times per Address Space_ SQL Statements per Plan Execution_ SQL Statements per Program Execution_ SQL Statements per System_ Subsystem Events per Plan Execution_ Subsystem Events per System_ Locking Activity per Plan Execution_ Locking Activity per System_ RID List Processing per Plan Execution_ RID List Processing per System_ Query Parallelism per Plan Execution_ Query Parallelism per System_ Buffer Pools Activity per Plan ExecutionS Buffer Pools Activity per System_ Distributed Activity per Location per Plan Execution
Command ===> ______________________________________________________________F1=Help F2=Split F3=Exit F7=Up F8=Down F9=Swap F12=Cancel
Figure 26. Exception Threshold Category Selection Panel
Exception Processing
52 DB2 PM Online Monitor User’s Guide

This panel displays all fields within the selected category. Use the scrolling keys F7(Up) and F8 (Down) to browse the list of fields.
You can select any number of fields from this panel. As a result, Field Detailspanels are displayed for each selection.
DGOPXDS2 Exception Threshold Field Selection
Select only one field, then press Enter. Overtype with space todeselect any field. Request EXIT when complete.
Field category . . : Buffer Pools Activity per System
FIELD DESCRIPTION
S SBRBUTP Percentage buffer pages in use_ QBSTCBA Current active buffers_ QBSTXFL Unavailable buffer-virtual pool full_ QBSTDSO Number of data set opens_ QBSTMIG DFHSM migrated data sets_ QBSTRTO DFSHM recall timeouts_ QBSTVPA Successful vpool expansions/contrac._ QBSTHPA Successful hpool expansions/contrac._ QBSTHPL Buffers allocated for hiperpool_ QBSTXFV Vpool or hpool expansion failure_ QBSTJIS Prefetch I/O streams reduction
Command ===> __________________________________________________________________F1=Help F2=Split F3=Exit F7=Up F8=Down F9=Swap F12=Cancel
Figure 27. Exception Threshold Field Selection Panel
Exception Processing
Chapter 6. Exception Processing 53
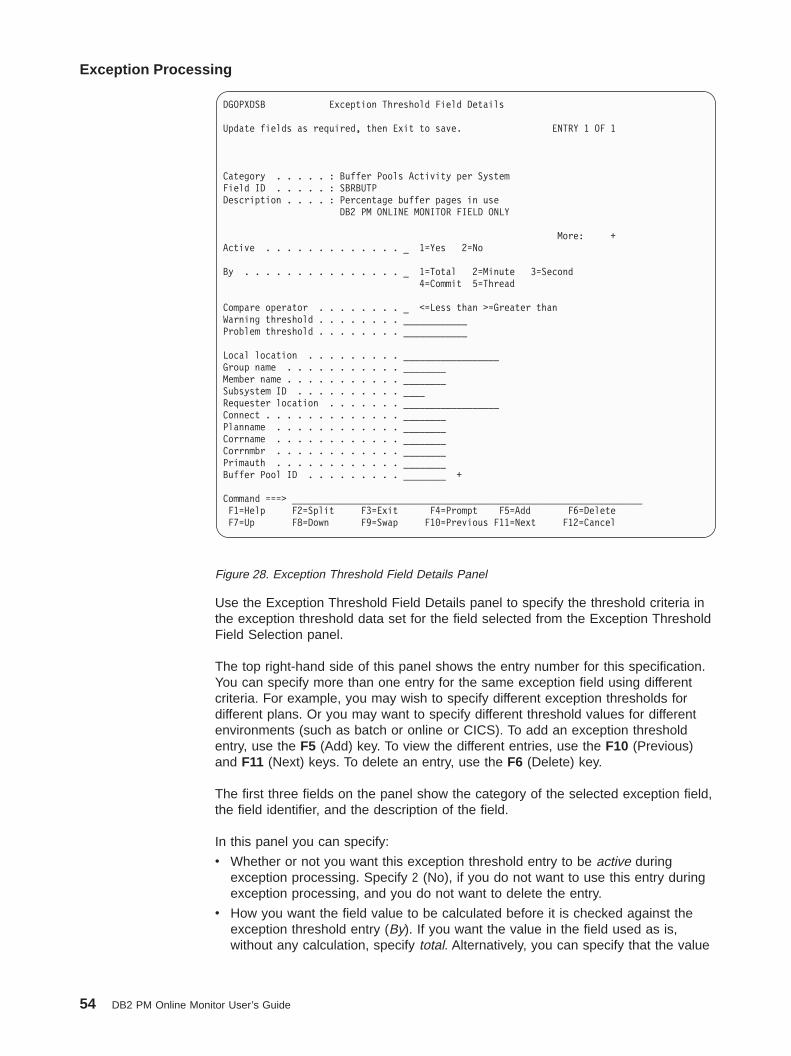
Use the Exception Threshold Field Details panel to specify the threshold criteria inthe exception threshold data set for the field selected from the Exception ThresholdField Selection panel.
The top right-hand side of this panel shows the entry number for this specification.You can specify more than one entry for the same exception field using differentcriteria. For example, you may wish to specify different exception thresholds fordifferent plans. Or you may want to specify different threshold values for differentenvironments (such as batch or online or CICS). To add an exception thresholdentry, use the F5 (Add) key. To view the different entries, use the F10 (Previous)and F11 (Next) keys. To delete an entry, use the F6 (Delete) key.
The first three fields on the panel show the category of the selected exception field,the field identifier, and the description of the field.
In this panel you can specify:
v Whether or not you want this exception threshold entry to be active duringexception processing. Specify 2 (No), if you do not want to use this entry duringexception processing, and you do not want to delete the entry.
v How you want the field value to be calculated before it is checked against theexception threshold entry (By). If you want the value in the field used as is,without any calculation, specify total. Alternatively, you can specify that the value
DGOPXDSB Exception Threshold Field Details
Update fields as required, then Exit to save. ENTRY 1 OF 1
Category . . . . . : Buffer Pools Activity per SystemField ID . . . . . : SBRBUTPDescription . . . . : Percentage buffer pages in use
DB2 PM ONLINE MONITOR FIELD ONLY
More: +Active . . . . . . . . . . . . . _ 1=Yes 2=No
By . . . . . . . . . . . . . . . _ 1=Total 2=Minute 3=Second4=Commit 5=Thread
Compare operator . . . . . . . . _ <=Less than >=Greater thanWarning threshold . . . . . . . . ____________Problem threshold . . . . . . . . ____________
Local location . . . . . . . . . __________________Group name . . . . . . . . . . . ________Member name . . . . . . . . . . . ________Subsystem ID . . . . . . . . . . ____Requester location . . . . . . . __________________Connect . . . . . . . . . . . . . ________Planname . . . . . . . . . . . . ________Corrname . . . . . . . . . . . . ________Corrnmbr . . . . . . . . . . . . ________Primauth . . . . . . . . . . . . ________Buffer Pool ID . . . . . . . . . ________ +
Command ===> __________________________________________________________________F1=Help F2=Split F3=Exit F4=Prompt F5=Add F6=DeleteF7=Up F8=Down F9=Swap F10=Previous F11=Next F12=Cancel
Figure 28. Exception Threshold Field Details Panel
Exception Processing
54 DB2 PM Online Monitor User’s Guide
for the field is divided by minutes, by seconds, or by the number of commits, oryou can specify that the exception threshold is checked for the average value perthread (which is useful in reports).
v The comparison operator. This field determines whether the value should begreater than or less than the threshold for an exception condition.
v The thresholds. You can specify two kinds of thresholds for a field: warning andproblem thresholds. Specify a warning threshold value to alert you aboutpotential problems and a problem threshold value to indicate a more seriouscondition.
v Use the fields on the bottom section of this panel to specify additional criteria forqualifying the thread data that you want checked during exception processing foran exception threshold entry.
These criteria are useful when you want to specify different exception thresholdvalues depending on the environment. For example, you might want to specifydifferent elapsed time thresholds for online transactions and batch jobs, in whichcase you would supply a specific connection ID for this entry, press F5 (Add),and specify a different connection ID for the second entry. You can specify ageneric name using an asterisk (*).
Usage Notes:v Specify the time value in seconds, for example, 90 to specify a threshold of 1
minute and 30 seconds.v Do not enter 2 or 3 in the By field for time values. Specifying “by minutes” or “by
seconds” only makes sense for fields that are not time-related.
Notes on Matching Instrumentation and Records
During exception processing, instrumentation data records are tested againstmatching thresholds in the exception threshold data set. When a record matchesmore than one threshold, DB2 PM chooses the best matching threshold of thosedetecting an exception.
The key fields of a record are: Location, Group, Subsystem ID, Member,Requesting Location, Connection, Plan Name, Correlation Name, CorrelationNumber, and Primary Authorization ID. DB2 PM compares these key fields with thecorresponding fields in the thresholds, and chooses the threshold that best matchesthe record. This is done by comparing the Location of the record with the Locationfield of the matching thresholds first. A key field not containing an asterisk isconsidered a better match than one containing asterisks. If two thresholds are foundto match the record equally, then the Group fields are compared with the record. Ifthese fields also match the record equally, the Subsystem ID fields are comparedwith the record, and so on for the Member, Requesting Location, Connection, PlanName, Correlation Name, Correlation Number, and Primary Authorization ID fields.
Exception Processing
Chapter 6. Exception Processing 55

How to Start Exception Processing
Exception processing is started from the Online Monitor Exception Processor panel.
All exception processing functions are activated from this panel.
Exception Processor Panel
Use the Exception Processor panel to activate and deactivate various exceptionprocesses by selecting exceptions under Activate/Deactivate Exception Processing.
To display this panel, select option 5 (Control Exception Processing) from theDB2 PM Online Monitor Main Menu.
The Periodic units field is used to specify whether the Periodic interval field value isin seconds or minutes. This field is only required for periodic exception processing.
The Periodic interval field specifies how often DB2 instrumentation data is gathered,examined for exceptions, and reported if an exception condition occurs. All periodicexception messages are gathered periodically as specified by this field, andreported when the display is next refreshed. After the elapsed period, if any periodicexceptions have occurred, the Exception Notification window is displayed showingthe number of warning and problem exceptions. This field is only required forperiodic exception processing.
You can request a log file data set or DPMOUT data set to be written by selectingLog file data set output needed or DPMOUT data set output needed from theException Processor panel, respectively. If a log or DPMOUT file is requested, theException Output Data Sets window is displayed. Refer to “Exception Output DataSets Window” on page 58 for details.
DGOMEP02 Exception Processor PMO1DLOC DSN1 V6
For any field enter any character to activateMore: - +
Activate/Deactivate Exception Processing_ Display thread summary_ Display thread detail_ Display statistics detail> Periodic > User Exit_ Exception event notification
OptionsPeriodic units . . . . . . . . . . . . . . 2 1=Seconds
2=MinutesPeriodic interval . . . . . . . . . . . . 10 1-7200 Seconds
1-120 Minutes> Disable auto-display for problem exceptions> Sound alarm for exception warnings_ Log file data set output needed_ DPMOUT data set output needed
Exception threshold data setName . . . . . . . . . ________________________________________________
Command ===> _______________________________________________________________F1=Help F2=Split F3=Exit F7=Up F8=Down F9=SwapF12=Cancel F16=Look F17=Collect
Figure 29. Exception Processor Panel
Exception Processing
56 DB2 PM Online Monitor User’s Guide

Previously selected fields are indicated by a greater-than symbol (>).
The Exception threshold data set field contains the name of the exception thresholddata set used as input to the exception processor. The data set is built using theException Threshold Field Details panel. The Online Monitor exception processoruses the information in this data set to test fields for exception conditions.
Note: A valid exception threshold data set needs to be specified on the ExceptionProcessor panel before activating display exception, periodic exception, orexception event processing.
DB2 PM supports a user exit to enhance the exception processing capabilities.This exit can handle both periodic exceptions and event exceptions. Therefore, youcan start the exception user exit for periodic processing, event processing, or both,depending on which kind of exception processing you have activated on theException Processor panel.
You can activate the user exit together with periodic exception processing, eventexception processing, or both. But you can also activate it when periodic exceptionprocessing, event exception processing, or both are already active.
To activate the user exit, type any character in the User Exit field. To deactivate theuser exit, enter a blank in this field. Note that the User Exit field is displayed only ifthe data collector is active.
Several users can invoke periodic exception processing or event exceptionprocessing simultaneously using different threshold data sets. The users can startor stop this user exit independently. The user exit routine can check for the user ID,the exception field name, the field value, or other characteristic items to selectindividual paths of processing.
DB2 PM provides a sample of the exception processing exit, called DGOMUPXT,which issues a message to the operator. The message text varies depending onwhether the situation is an event exception or a periodic exception. For adescription of the different formats of this message, see message numberDGOV0100I in the DB2 PM Messages manual.
You can modify DGOMUPXT according to your needs, for example, to examine thetype of exception and perform any action necessary to handle the situation.
For more details on user exits, refer to the DB2 PM Installation and Customizationmanual.
Exception Processing
Chapter 6. Exception Processing 57

Exception Output Data Sets Window
The Exception Output Data Sets window is displayed whenever a log file orDPMOUT data set is requested on the Exception Processor panel.
Use this window to enter the names of the exception log file and DPMOUT datasets you want the exception processor to write to. If the data collector is active foryour current subsystem, make sure that it is authorized to write to these data sets.Different data sets are used for display exceptions and periodic exceptions.
For data sets selected on the Exception Processor panel, a valid name is required.Do not specify a name for those data sets that were not selected. Therefore, if aLOG data set was selected but not a DPMOUT data set, then you must enter avalid name for the exception LOG data set but not for the DPMOUT data set.
You can enter the name of an output log file data set (to which exception conditionsare written). There is an entry written to the data set for each exception conditiondetected by the exception processor. This data set can subsequently be used asinput to the DB2 load utility, or printed using the DB2 PM exception log print utility.Refer to “Printing the Exception Log File Data Set” on page 68 for more information.For the layout of the exception log file data set, refer to “Appendix B. Exception LogFile Output Record” on page 273.
You can enter the name of an output DPMOUT data set (to whichDPMOUT-formatted records containing exception conditions are written). This dataset can be used as input to Batch record trace or statistics trace for a more detailedanalysis of exception conditions. Refer to the DB2 PM Report Reference forinformation on the layout of DPMOUT-formatted records.
The Disposition fields specify how the data is to be written to the data sets. Enter 1(append) to append the data, 2 (overwrite) to overwrite the old data, or 3 (new) todynamically allocate a new data set.
┌──────────────────────────────────────────────────────────────────┐│ DGOMEP03 Exception Output Data Sets ││ ││ Specify the data set(s) to be used, and press Enter ││ ││ ││ Display log file data set ││ Name . . . . . ______________________________________________ ││ Disposition . . 1 1=append 2=overwrite 3=new ││ ││ Display DPMOUT data set ││ Name . . . . . ______________________________________________ ││ Disposition . . 1 1=append 2=overwrite 3=new ││ ││ Periodic log file data set ││ Name . . . . . ______________________________________________ ││ Disposition . . 1 1=append 2=overwrite 3=new ││ ││ Periodic DPMOUT data set ││ Name . . . . . ______________________________________________ ││ Disposition . . 1 1=append 2=overwrite 3=new ││ ││ F1=Help F2=Split F7=Up F8=Down F9=Swap F12=Cancel │└──────────────────────────────────────────────────────────────────┘
Figure 30. Exception Output Data Sets Window
Exception Processing
58 DB2 PM Online Monitor User’s Guide

Press Enter to initialize exception processing and activate the selected functions. Ifthere are any errors during this process, a panel is displayed showing the errors.
Starting Display Exception Processing
Display exception processing is started from the Exception Processor panel underActivate/Deactivate Exception Processing (refer to Figure 29). Enter any characterin the following fields to activate display exception processing for the appropriatepanels:v Display thread summaryv Display thread detailv Display statistics detail
Starting Periodic Exception Processing
Periodic exception processing is started from the Exception Processor panel underActivate/Deactivate Exception Processing (refer to Figure 29). Enter any characterin the Periodic field and specify the periodic exception units and interval under theOptions field to activate periodic exception processing.
Starting Exception Event Notification
Exception event notification is started from the Exception Processor panel underActivate/Deactivate Exception Processing (refer to Figure 29). Enter any characterin the Exception event notification field to activate exception event notification.
Note that the events need to be specified with the EXCEPTIONEVENT datacollector parameter or on the Data Collector Parameters window of theadministrator user dialog before exception event processing can be activated usingthe Exception Processor panel. Refer to the DB2 PM Installation and Customizationmanual and “Data Collector Parameters Window” on page 235 for more information.
How to Restart Exception Processing
If the values in the exception threshold data set are changed during an OnlineMonitor session, the exception processor needs to be restarted (reinitialized) to loadand use the new values. Exception processing initialization occurs when you startdisplay or periodic exception processing using the options on the ExceptionProcessor panel as shown in Figure 29.
You can reinitialize exception processing in the following ways:
v Stop and then start exception processing using the Exception Processor panel.
v Restart the exception processor using the REINIT command.
Exception Processing
Chapter 6. Exception Processing 59
REINIT Command
The REINIT command restarts the exception processor using the latest values inthe exception threshold data set.
The command syntax is:
Type REINIT (or a valid abbreviation) on any command line (except on theAsynchronous Task Termination panel) as long as exception processing is activeand press Enter .
REINIT can be used in any truncated form beginning with a minimum of REI.
Examining Exception Messages
This section describes how to examine exception messages issued duringexception processing using the LOOK command.
Whenever an exception occurs, an exception message is written to the appropriateexception list where it can be examined using the LOOK command.
The command syntax is:
The LOOK parameters 1 to 6 correspond with the options on the Look Selectionsmenu. Refer to Figure 33.
To display the Look Selections menu, type LOOK and press Enter on any commandline, or press F16 (LOOK) on any panel.
ÊÊ REINIT ÊÍ
Figure 31. Syntax of the REINIT Command
ÊÊ LOOK123456
ÊÍ
Figure 32. Syntax of the LOOK Command
Exception Processing
60 DB2 PM Online Monitor User’s Guide
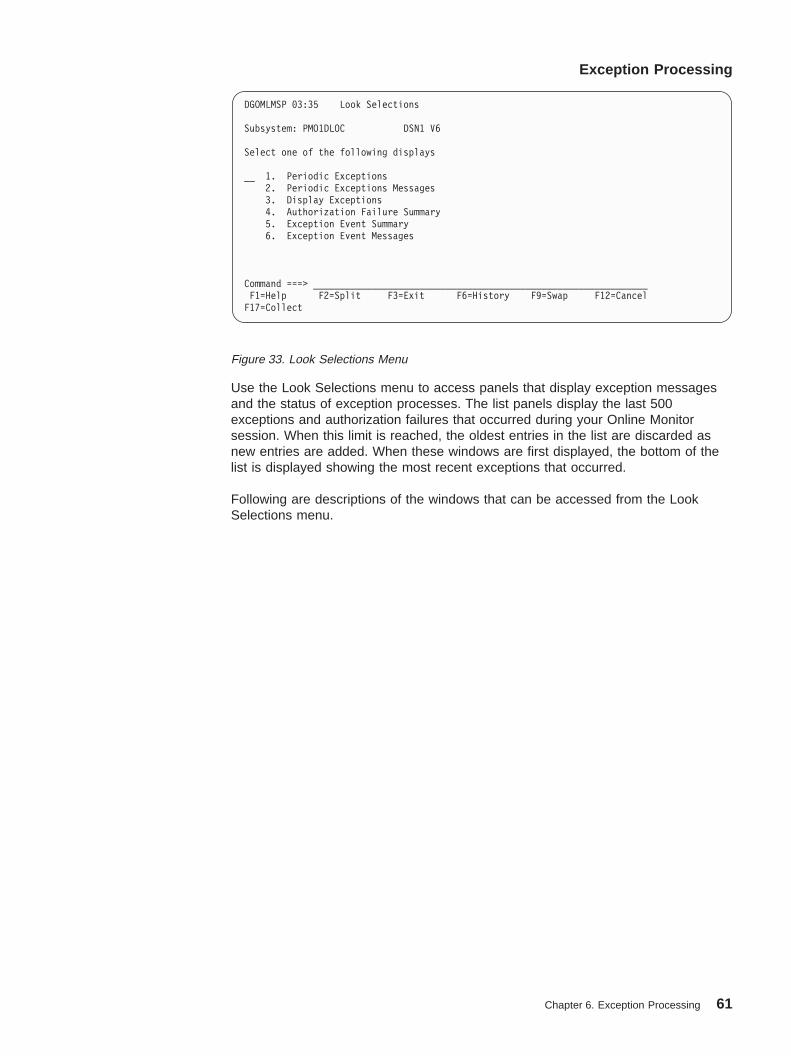
Use the Look Selections menu to access panels that display exception messagesand the status of exception processes. The list panels display the last 500exceptions and authorization failures that occurred during your Online Monitorsession. When this limit is reached, the oldest entries in the list are discarded asnew entries are added. When these windows are first displayed, the bottom of thelist is displayed showing the most recent exceptions that occurred.
Following are descriptions of the windows that can be accessed from the LookSelections menu.
DGOMLMSP 03:35 Look Selections
Subsystem: PMO1DLOC DSN1 V6
Select one of the following displays
__ 1. Periodic Exceptions2. Periodic Exceptions Messages3. Display Exceptions4. Authorization Failure Summary5. Exception Event Summary6. Exception Event Messages
Command ===> _______________________________________________________________F1=Help F2=Split F3=Exit F6=History F9=Swap F12=CancelF17=Collect
Figure 33. Look Selections Menu
Exception Processing
Chapter 6. Exception Processing 61
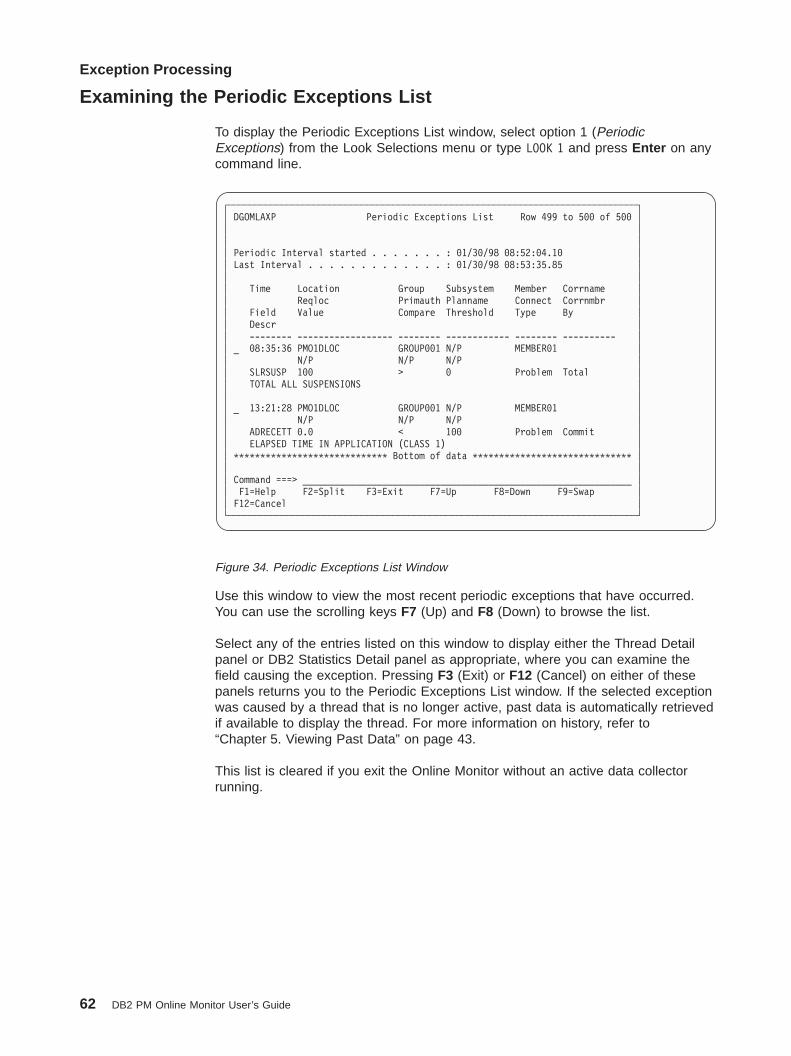
Examining the Periodic Exceptions List
To display the Periodic Exceptions List window, select option 1 (PeriodicExceptions) from the Look Selections menu or type LOOK 1 and press Enter on anycommand line.
Use this window to view the most recent periodic exceptions that have occurred.You can use the scrolling keys F7 (Up) and F8 (Down) to browse the list.
Select any of the entries listed on this window to display either the Thread Detailpanel or DB2 Statistics Detail panel as appropriate, where you can examine thefield causing the exception. Pressing F3 (Exit) or F12 (Cancel) on either of thesepanels returns you to the Periodic Exceptions List window. If the selected exceptionwas caused by a thread that is no longer active, past data is automatically retrievedif available to display the thread. For more information on history, refer to“Chapter 5. Viewing Past Data” on page 43.
This list is cleared if you exit the Online Monitor without an active data collectorrunning.
┌─────────────────────────────────────────────────────────────────────────────┐│ DGOMLAXP Periodic Exceptions List Row 499 to 500 of 500 ││ ││ ││ Periodic Interval started . . . . . . . : 01/30/98 08:52:04.10 ││ Last Interval . . . . . . . . . . . . . : 01/30/98 08:53:35.85 ││ ││ Time Location Group Subsystem Member Corrname ││ Reqloc Primauth Planname Connect Corrnmbr ││ Field Value Compare Threshold Type By ││ Descr ││ -------- ------------------ -------- ------------ -------- ---------- ││ _ 08:35:36 PMO1DLOC GROUP001 N/P MEMBER01 ││ N/P N/P N/P ││ SLRSUSP 100 > 0 Problem Total ││ TOTAL ALL SUSPENSIONS ││ ││ _ 13:21:28 PMO1DLOC GROUP001 N/P MEMBER01 ││ N/P N/P N/P ││ ADRECETT 0.0 < 100 Problem Commit ││ ELAPSED TIME IN APPLICATION (CLASS 1) ││ ***************************** Bottom of data ****************************** ││ ││ Command ===> ______________________________________________________________ ││ F1=Help F2=Split F3=Exit F7=Up F8=Down F9=Swap ││ F12=Cancel │└─────────────────────────────────────────────────────────────────────────────┘
Figure 34. Periodic Exceptions List Window
Exception Processing
62 DB2 PM Online Monitor User’s Guide
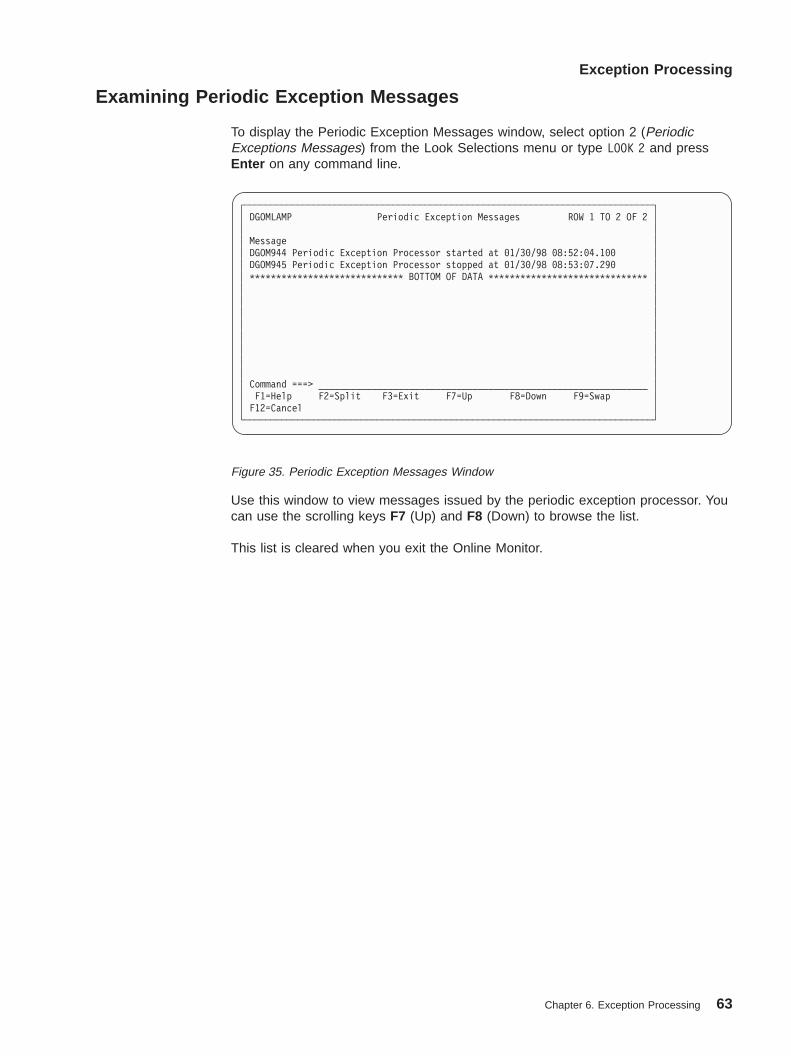
Examining Periodic Exception Messages
To display the Periodic Exception Messages window, select option 2 (PeriodicExceptions Messages) from the Look Selections menu or type LOOK 2 and pressEnter on any command line.
Use this window to view messages issued by the periodic exception processor. Youcan use the scrolling keys F7 (Up) and F8 (Down) to browse the list.
This list is cleared when you exit the Online Monitor.
┌─────────────────────────────────────────────────────────────────────────────┐│ DGOMLAMP Periodic Exception Messages ROW 1 TO 2 OF 2 ││ ││ Message ││ DGOM944 Periodic Exception Processor started at 01/30/98 08:52:04.100 ││ DGOM945 Periodic Exception Processor stopped at 01/30/98 08:53:07.290 ││ ***************************** BOTTOM OF DATA ****************************** ││ ││ ││ ││ ││ ││ ││ ││ ││ Command ===> ______________________________________________________________ ││ F1=Help F2=Split F3=Exit F7=Up F8=Down F9=Swap ││ F12=Cancel │└─────────────────────────────────────────────────────────────────────────────┘
Figure 35. Periodic Exception Messages Window
Exception Processing
Chapter 6. Exception Processing 63
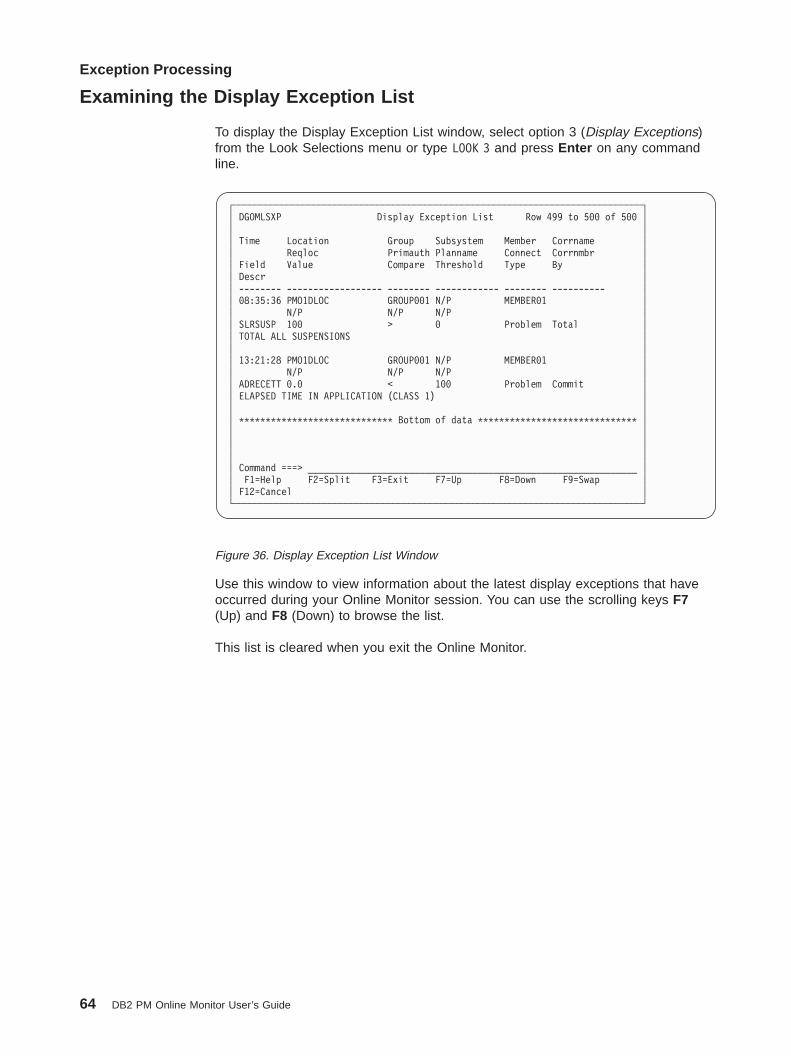
Examining the Display Exception List
To display the Display Exception List window, select option 3 (Display Exceptions)from the Look Selections menu or type LOOK 3 and press Enter on any commandline.
Use this window to view information about the latest display exceptions that haveoccurred during your Online Monitor session. You can use the scrolling keys F7(Up) and F8 (Down) to browse the list.
This list is cleared when you exit the Online Monitor.
┌─────────────────────────────────────────────────────────────────────────────┐│ DGOMLSXP Display Exception List Row 499 to 500 of 500 ││ ││ Time Location Group Subsystem Member Corrname ││ Reqloc Primauth Planname Connect Corrnmbr ││ Field Value Compare Threshold Type By ││ Descr ││ -------- ------------------ -------- ------------ -------- ---------- ││ 08:35:36 PMO1DLOC GROUP001 N/P MEMBER01 ││ N/P N/P N/P ││ SLRSUSP 100 > 0 Problem Total ││ TOTAL ALL SUSPENSIONS ││ ││ 13:21:28 PMO1DLOC GROUP001 N/P MEMBER01 ││ N/P N/P N/P ││ ADRECETT 0.0 < 100 Problem Commit ││ ELAPSED TIME IN APPLICATION (CLASS 1) ││ ││ ***************************** Bottom of data ****************************** ││ ││ ││ ││ Command ===> ______________________________________________________________ ││ F1=Help F2=Split F3=Exit F7=Up F8=Down F9=Swap ││ F12=Cancel │└─────────────────────────────────────────────────────────────────────────────┘
Figure 36. Display Exception List Window
Exception Processing
64 DB2 PM Online Monitor User’s Guide
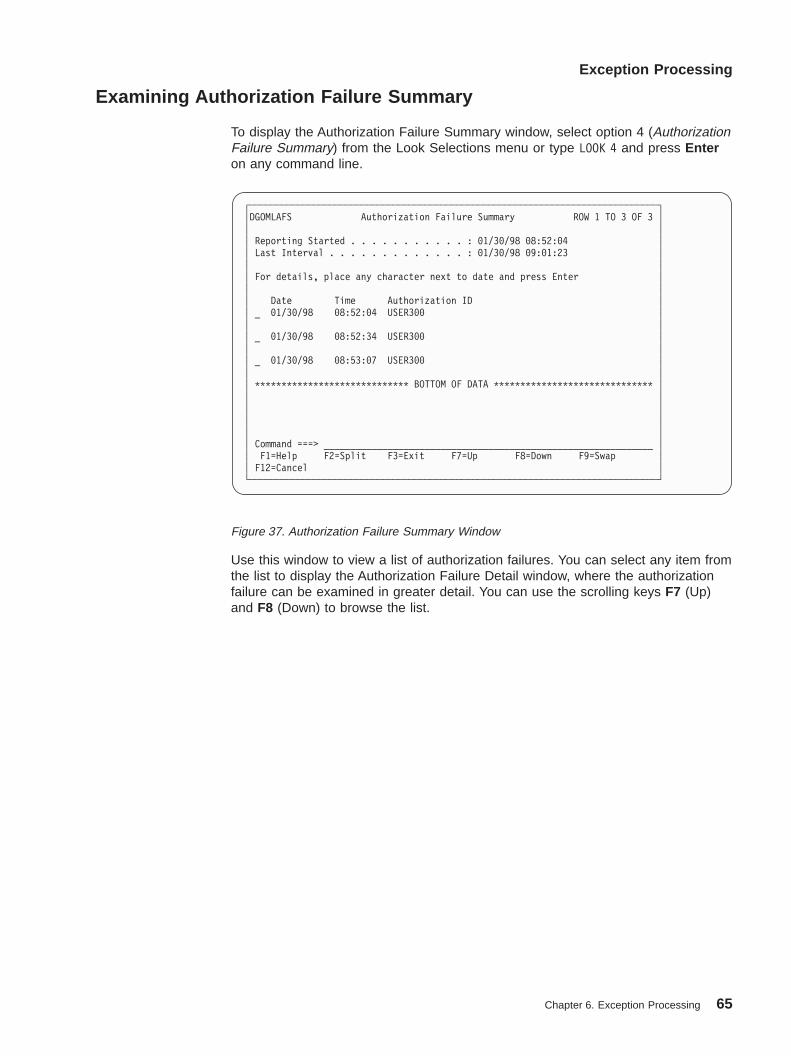
Examining Authorization Failure Summary
To display the Authorization Failure Summary window, select option 4 (AuthorizationFailure Summary) from the Look Selections menu or type LOOK 4 and press Enteron any command line.
Use this window to view a list of authorization failures. You can select any item fromthe list to display the Authorization Failure Detail window, where the authorizationfailure can be examined in greater detail. You can use the scrolling keys F7 (Up)and F8 (Down) to browse the list.
┌─────────────────────────────────────────────────────────────────────────────┐│DGOMLAFS Authorization Failure Summary ROW 1 TO 3 OF 3 ││ ││ Reporting Started . . . . . . . . . . . : 01/30/98 08:52:04 ││ Last Interval . . . . . . . . . . . . . : 01/30/98 09:01:23 ││ ││ For details, place any character next to date and press Enter ││ ││ Date Time Authorization ID ││ _ 01/30/98 08:52:04 USER300 ││ ││ _ 01/30/98 08:52:34 USER300 ││ ││ _ 01/30/98 08:53:07 USER300 ││ ││ ***************************** BOTTOM OF DATA ****************************** ││ ││ ││ ││ ││ Command ===> ______________________________________________________________ ││ F1=Help F2=Split F3=Exit F7=Up F8=Down F9=Swap ││ F12=Cancel │└─────────────────────────────────────────────────────────────────────────────┘
Figure 37. Authorization Failure Summary Window
Exception Processing
Chapter 6. Exception Processing 65

Examining Exception Event Summary
To display the Exception Event Summary window, select option 5 (Exception EventSummary) from the Look Selections menu or type LOOK 5 and press Enter on anycommand line.
Use this window to view the most recent exception events that occurred during yourOnline Monitor session. You can use the scrolling keys F7 (Up) and F8 (Down) tobrowse the list.
Select any event listed on the Exception Event Summary window for closerexamination. When an exception event is selected, one of the following windows isdisplayed as determined by the type of event:v EDM Pool Full Data windowv Deadlock Data windowv Timeout Data windowv Coupling Facility (CF) Rebuild/Alter Start Event windowv CF Rebuild End Event windowv CF Alter End Event windowv Unformatted Record panel (thread commit indoubt)v Global trace started.
┌──────────────────────────────────────────────────────────────────────────────┐│ DGOMLEXP Exception Event Summary ROW 1 TO 3 OF 3 ││ ││ Reporting Started . . . . . . . . . . . : 01/30/98 08:52:04 ││ Last Interval . . . . . . . . . . . . . : 01/30/98 09:01:23 ││ ││ Date Time IFCID ││ _ 01/30/98 08:52:50 172 ││ Deadlock ││ _ 01/30/98 08:53:06 267 ││ CF rebuild/alter started ││ _ 01/30/98 08:54:11 090 ││ Global trace started ││ ***************************** BOTTOM OF DATA ****************************** ││ ││ ││ ││ ││ ││ ││ ││ ││ Command ===> _______________________________________________________________ ││ F1=Help F2=Split F3=Exit F7=Up F8=Down F9=Swap ││ F12=Cancel │└──────────────────────────────────────────────────────────────────────────────┘
Figure 38. Exception Event Summary Window
Exception Processing
66 DB2 PM Online Monitor User’s Guide

Examining Exception Event Messages
To display the Exception Event Messages window, select option 6 (Exception EventMessages) from the Look Selections menu or type LOOK 6 and press Enter on anycommand line.
Use this window to view messages issued by the exception event processor. Youcan use the scrolling keys F7 (Up) and F8 (Down) to browse the list.
Exception Processor Output Data Sets
Exception processing output data can be written to data sets. Use these data setsfor further analysis of exception conditions.
Note: Always write monitor, trace, exception log file, and exception DPMOUT datato separate data sets.
Exception Log File Data Set
You can specify a particular exception log file data set to which information aboutexceptions is written. The contents of the exception log file data set can be eitherprinted or loaded into a DB2 table for further investigation.
To retain log file data on the same data set across multiple Online Monitor sessions,specify APPEND for the disposition.
To dynamically allocate a new exception log file data set with the followingattributes, specify NEW for the disposition:RECFM: VBLRECL: 512BLKSIZE: 4 096
The data set contains an entry for each field found in exception status.
Refer to “Appendix B. Exception Log File Output Record” on page 273 for the layoutof the exception log file data set.
┌──────────────────────────────────────────────────────────────────────────────┐│ DGOMLEMP Exception Event Messages ROW 1 TO 4 OF 4 ││ ---------------------------------------------------------------------------- ││ DGOM953 Exception event processor started at 01/30/98 08:52:04.100 ││ DGOM954 Exception event processor stopped at 01/30/98 08:52:10.100 ││ ***************************** BOTTOM OF DATA ******************************* ││ ││ ││ ││ ││ ││ ││ ││ Command ===> _______________________________________________________________ ││ F1=Help F2=Split F3=Exit F7=Up F8=Down F9=Swap ││ F12=Cancel │└──────────────────────────────────────────────────────────────────────────────┘
Figure 39. Exception Event Messages Window
Exception Processing
Chapter 6. Exception Processing 67
Printing the Exception Log File Data Set
You can print the contents of the exception log file data set using the exception logfile print utility.
To use this utility, submit the sample member DGOMEJCL found in theSDGOSAMP library. Note that this member is provided only as an example and canbe modified as required by your installation.
Performance Database
Exception data can be loaded into DB2 PM’s performance database. The CREATETABLE DDL, LOAD, CREATE VIEW statements, and sample SQL queries can befound in the SDGOSAMP library. Note that you can modify the table structureaccording to your needs.
Following are the names of the provided members in SDGOSAMP:CREATE TABLE statement:
DGOECFILLOAD utility control statements:
DGOELFILSample CREATE VIEW statement:
DGOEVFILSample SQL query:
DGOEQFIL
Exception DPMOUT Data Set
You can specify a particular exception DPMOUT output data set. This data setholds the DB2 instrumentation records that contain at least one field in exceptionstatus, in DPMOUT format. You can use this data set as input to batch record traceor statistics trace for a more detailed analysis of exception conditions.
To retain DPMOUT data on the same data set across multiple Online Monitorsessions, specify APPEND for the disposition.
To dynamically allocate a new DPMOUT data set with the following attributes,specify NEW for the disposition:RECFM: VBSLRECL: 32 756BLKSIZE: 6 233
Refer to the DB2 PM Report Reference for information on the layout of theDPMOUT record.
Exception Processing
68 DB2 PM Online Monitor User’s Guide
Stopping Exception Processing
The different types of exception processing can be stopped using the ExceptionProcessor panel by deselecting the appropriate fields under Activate/DeactivateException Processing (refer to Figure 29).
If an exception task is active when you exit the Online Monitor, you are notified byone of the Asynchronous Task Termination panels. You can either keep selectedtasks active (if the data collector is active) and exit the Online Monitor, or return tothe Online Monitor main menu keeping all asynchronous tasks active. Refer to“Leaving the Online Monitor” on page 20 for more information.
If an exception task is active when you change DB2 subsystems, you are notifiedby one of the Asynchronous Task Termination panels. You can either change DB2subsystems and terminate all asynchronous tasks, or return to the previous panelkeeping all asynchronous tasks active. Refer to “DB2 Subsystem Windows” onpage 22 for more information.
Note that if you are in a split screen mode and you change the subsystem in onesession, periodic exceptions are terminated even if they were turned on in the othersession.
Exception Processing
Chapter 6. Exception Processing 69

70 DB2 PM Online Monitor User’s Guide

Chapter 7. Displaying Thread Activity
Tuning DB2
This chapter identifies and describes the specific DB2 data which is reportedfor the purpose of tuning DB2. For general tuning advice on DB2, refer to theDB2 Administration Guide ‘Performance, Monitoring, and Tuning’ chapters forthe specific release of DB2.
All thread activity fields up to and including DB2 V5 are supported by thread activitydisplay. To view new fields introduced with DB2 V6, use the DB2 PM workstationonline monitor.
Use the thread activity panels to examine information about the current activity of allactive threads connected to a DB2 subsystem.
From the Thread Summary panel, you can view key values for all connectedthreads (qualified and sorted as you require). You can select any thread listed onthe Thread Summary panel to display the Thread Detail panel for furtherinvestigation of the thread.
The Thread Detail panel provides an overview of all thread information categoriesand also presents some values that are more detailed. By selecting a category, youget a window that shows all the information pertaining to this category.
© Copyright IBM Corp. 1985, 1999 71

Panels
The following table lists all the thread activity panels shown in this chapter.
Thread Activity Panels
Thread Summary panel . . . Figure 41 on page 76Thread Detail panel . . . Figure 45 on page 80Thread Identification window . . . Figure 46 on page 82Requester Correlation Data window . . . Figure 47 on page 84Current Package/DBRM window . . . Figure 48 on page 85Thread Times window . . . Figure 50 on page 89Locking (IRLM) Activity window . . . Figure 51 on page 91Locked Resources window . . . Figure 52 on page 94Threads Holding Resource window . . . Figure 53 on page 95RID List Processing window . . . Figure 54 on page 96SQL Activity window . . . Figure 55 on page 97Buffer Manager Activity window . . . Figure 56 on page 99Buffer Pool Detail window . . . Figure 57 on page 100SQL Statement and Package window . . . Figure 58 on page 101Distributed Data window . . . Figure 59 on page 102Distributed Location Detail window . . . Figure 60 on page 103Distributed Conversation Detail window . . . Figure 61 on page 104IFI (Class 5) and Data Capture window . . . Figure 62 on page 105Query Parallelism Data window . . . Figure 63 on page 106Data Sharing Locking Activity window . . . Figure 64 on page 109Group Buffer Pools Activity window . . . Figure 65 on page 110Group Buffer Pool Detail window . . . Figure 66 on page 111Stored Procedures window . . . Figure 67 on page 112DB2 Thread Qual. Parameters window . . . Figure 76 on page 118DB2 Thread Sort Specification window . . . Figure 79 on page 122
Display Thread Activity Overview
The Thread Summary panel shows a summary of all connected DB2 threadsqualified and sorted as defined by the QUALIFY and SORT commands.
Individual threads can be selected from the Thread Summary panel, ThreadsHolding Resource window, or the Periodic Exceptions List panel for viewing.Selecting a thread results in all currently displayed windows being removed and theThread Detail panel being displayed for the newly selected thread. This thread thenbecomes the monitored thread for further examination using the thread activitypanels. From the Thread Detail panel, you can view specific information about themonitored thread in greater detail. To do this, type any character in the selectionfield next to the corresponding headings and press Enter .
Data displayed on the current panel is refreshed whenever you press Enter withoutselecting a particular category to be displayed or executing a command.
Before you start displaying thread activity, make sure that the appropriate DB2monitor trace classes are set on. At least monitor class 1 must be set on, but it is a
Thread Activity
72 DB2 PM Online Monitor User’s Guide

good practice to also set on class 2 and class 3. If you also want to get class 5, 7,or 8 information, you must switch on the corresponding monitor trace class.
If display exception processing is active, any fields in exception status are shown inreverse video. If you are using a color terminal, fields in warning status arehighlighted in yellow, while fields in problem status are highlighted in red.Furthermore, a pop-up window shows the number of display exceptions detected.
You can purge a thread currently processing in a DB2 subsystem from any threadactivity panel using the PURGE command. You require the DB2 privilege to performCANCEL THREAD. Refer to “PURGE Command” on page 115 for more informationon purging a thread.
For a DB2 thread exploiting parallelism, DB2 PM reports aggregate values acrossall parallel tasks created to execute SQL statements within the thread. Therefore,and because of the nature of parallel work, some counters (particularly CPU andsuspension fields) may show unexpected large values, which do not necessarilyindicate problems. In some cases these values can be even larger than the entirewall-clock elapsed time. Besides query parallelism DB2 PM also reports DB2 utilityparallelism. Further details are described in the following paragraph.
Accounting Times
Accounting times are usually the prime indicator of a performance problem andmost often should be the starting point for analysis.
DB2 times are classified as follows:
v Class 1 time shows the time the application spent since connecting to DB2,including time spent outside DB2.
v Class 2 elapsed time shows the time spent in DB2. It is divided into CPU timeand waiting time.
v Class 3 elapsed time is divided into various waits, such as the duration ofsuspensions due to waits for locks and latches or waits for I/O.
Figure 40 shows the relationship between the different accounting times.
Thread Activity
Chapter 7. Displaying Thread Activity 73

Parallelism Considerations
This section applies to threads exploiting CP parallelism or utility parallelism.
If a thread exploits parallelism, several tasks (called parallel tasks) are scheduled toperform the parallel work. For each of these tasks an accounting record isgenerated, which contains counters and timers for the work performed by theparticular task. In addition, the accounting record for the thread contains the detailson non-parallel work within the thread as well as some parallel work-related data.
DB2 PM summarizes all accounting records generated for such a thread andpresents them as one logical accounting record. Table 3 on page 75 describeswhich values are a combination of the originating task’s and parallel tasks’ valuesand which are taken from the originating task only.
Figure 40. Accounting Times
Thread Activity
74 DB2 PM Online Monitor User’s Guide

To avoid incorrect time values, the data collector must be active with CCP=YESswitched on if query parallelism or utility parallelism is used. In this case, the datacollector can collect data of parallel tasks that have already terminated.
For Sysplex parallelism, thread activity information is only shown for the originatingtask and for those parallel tasks that are executing on the same member as theoriginating task. Parallel tasks that are executing on different members of theSysplex group are ignored. Sysplex parallelism threads are marked with *S* next tothe program name on the Thread Summary panel.
Especially interesting is the relationship between elapsed, CPU, and suspensiontimes in the case of query parallelism or utility parallelism. The elapsed time istaken from the originating record while CPU and suspension times are calculatedfrom all the parallel and originating records. Consequently, both CPU time andsuspension times can be larger than the elapsed time. Therefore, you can only getthe full picture of the response time distribution if the times for each participatingtask are known. Produce a long record trace for IFCID 3 using the Batch reportingfacilities, especially if you suspect that the CPU times or suspension times for athread where query parallelism or utility parallelism is used are large for otherreasons than the times being added for several tasks. In a long record trace, allaccounting records for parallel and originating threads are reported separately.
Table 3. Query Parallelism Related Data
Accounting Data Derivation
Identifiers (PRIMAUTH, PLANNAME, and so on) Originating task
Class 1 elapsed time Originating task
Class 1 TCB times Separate counters fororiginating task and sum ofall parallel tasks
Class 2 elapsed time Originating task
Class 2 TCB times Separate counters fororiginating task and sum ofall parallel tasks
Class 7 elapsed time Originating task
Class 7 TCB times Separate counters fororiginating task and sum ofall parallel tasks
Class 2 and class 7 DB2 entry/exit events Originating task
Class 3 and class 8 times Separate counters fororiginating task and sum ofall parallel tasks
Class 3 and class 8 events Sum of originating task andall parallel tasks
Class 5 times Originating task
SQL counters Originating task
RID List counters Sum of originating task andall parallel tasks
Query Parallelism counters Originating task
Locking (including data-sharing-specific) counters Sum of originating task andall parallel tasks
RLF data Originating task
Thread Activity
Chapter 7. Displaying Thread Activity 75

Table 3. Query Parallelism Related Data (continued)
Accounting Data Derivation
Buffer Pools counters Sum of originating task andall parallel tasks
Group Buffer Pools counters Sum of originating task andall parallel tasks
DDF counters Originating task
Data Capture counters Originating task
Thread Summary Panel
Use the Thread Summary panel to view a list of active threads connected to theDB2 subsystem.
To display the Thread Summary panel, select option 1 (Display Thread Activity)from the DB2 PM Online Monitor Main Menu.
When the Thread Summary panel is initially displayed, class 1 and class 2 elapsedtimes are shown. Additional information is available to the right of the screen. Youcan press F20 (Right) to view the portions of the panel that are not displayed.Figure 41, Figure 42, Figure 43, and Figure 44 show the Thread Summary panelwith all its possible fields.
DGOMTPLS 17:11 Thread Summary SORT QUALIFY ROW 1 TO 2 OF 2
PMO1DLOC DSN1 V6 GROUP001 MEMBER01
To display a thread, place any character next to it, then press Enter.
Program Connection ------- Elapsed -------Primauth Planname name ID Status Class 1 Class 2
_ USERT003 DSNESPCS DSNESM68 DB2CALL *DB2 19.664838 0.6458763_ USERT004 DSNUTILS DSNESM68 DB2CALL I/O 3.345235 0.2131145-- End of Thread list --
Command ===> _________________________________________________________________F1=Help F2=Split F3=Exit F5=Auto F6=History F7=UpF8=Down F9=Swap F10=Qualify F11=Sort F12=Cancel F16=LookF17=Collect F19=Left F20=Right F22=Purge
Figure 41. Thread Summary Panel
Thread Activity
76 DB2 PM Online Monitor User’s Guide
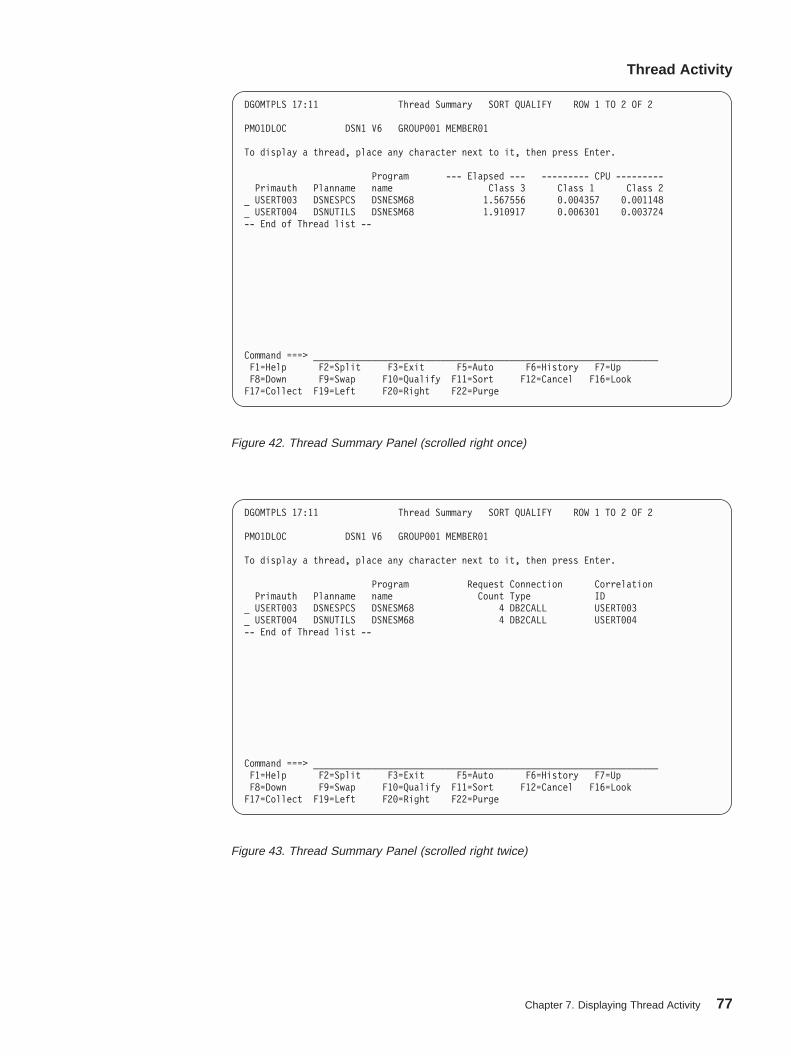
DGOMTPLS 17:11 Thread Summary SORT QUALIFY ROW 1 TO 2 OF 2
PMO1DLOC DSN1 V6 GROUP001 MEMBER01
To display a thread, place any character next to it, then press Enter.
Program --- Elapsed --- --------- CPU ---------Primauth Planname name Class 3 Class 1 Class 2
_ USERT003 DSNESPCS DSNESM68 1.567556 0.004357 0.001148_ USERT004 DSNUTILS DSNESM68 1.910917 0.006301 0.003724-- End of Thread list --
Command ===> _________________________________________________________________F1=Help F2=Split F3=Exit F5=Auto F6=History F7=UpF8=Down F9=Swap F10=Qualify F11=Sort F12=Cancel F16=LookF17=Collect F19=Left F20=Right F22=Purge
Figure 42. Thread Summary Panel (scrolled right once)
DGOMTPLS 17:11 Thread Summary SORT QUALIFY ROW 1 TO 2 OF 2
PMO1DLOC DSN1 V6 GROUP001 MEMBER01
To display a thread, place any character next to it, then press Enter.
Program Request Connection CorrelationPrimauth Planname name Count Type ID
_ USERT003 DSNESPCS DSNESM68 4 DB2CALL USERT003_ USERT004 DSNUTILS DSNESM68 4 DB2CALL USERT004-- End of Thread list --
Command ===> _________________________________________________________________F1=Help F2=Split F3=Exit F5=Auto F6=History F7=UpF8=Down F9=Swap F10=Qualify F11=Sort F12=Cancel F16=LookF17=Collect F19=Left F20=Right F22=Purge
Figure 43. Thread Summary Panel (scrolled right twice)
Thread Activity
Chapter 7. Displaying Thread Activity 77

When the data collector is active, the Thread Summary panel shows also threadsinitiated by DB2 PM besides other threads. Threads are collected for data collectortasks and for each Host Online Monitor user and Workstation Online Monitor user.
If there are many active threads, you can use F7 (Up) and F8 (Down) to browse thelist.
You can filter threads from being displayed on this panel using the QUALIFYcommand (refer to “QUALIFY Command” on page 116). You can also specify theorder in which the threads are listed using the SORT command (refer to “SORTCommand” on page 120).
The Status field displays one of the following values:
DB2 The thread is currently processing within DB2.
I/O The thread is performing I/O activity within DB2.
LOCK The thread is engaged in locking activity within DB2.
EOT The thread is in end-of-task processing.
APPL Processing is taking place within the application.
I/S The thread is in identify or signon state.
QUE The value specified for MAXUSERS on the DB2 install panel DSNTIPE hasbeen met and the thread creation is queued until an available slot is found.
SP The thread is running a stored procedure and is currently processing withinDB2.
SPA The thread is running a stored procedure, and processing is taking placeoutside DB2 (in stored procedure application code).
SPW The thread is waiting for a stored procedure to be scheduled within DB2.
DGOMTPLS 17:11 Thread Summary SORT QUALIFY ROW 1 TO 2 OF 2
PMO1DLOC DSN1 V6 GROUP001 MEMBER01
To display a thread, place any character next to it, then press Enter.
Program Requesting CollectionPrimauth Planname name Location ID
_ USERT003 DSNESPCS DSNESM68 DSNAPC7 N/P_ USERT004 DSNUTILS DSNESM68 DSNAPC7 N/P-- End of Thread list --
Command ===> _________________________________________________________________F1=Help F2=Split F3=Exit F5=Auto F6=History F7=UpF8=Down F9=Swap F10=Qualify F11=Sort F12=Cancel F16=LookF17=Collect F19=Left F20=Right F22=Purge
Figure 44. Thread Summary Panel (scrolled right three times)
Thread Activity
78 DB2 PM Online Monitor User’s Guide

NTCB Recoverable Resource Manager Services Attach Facility (RRSAF) agenthas no TCB.
The identifier fields Primauth, Planname, Package or DBRM, Connection ID, andStatus are highlighted in yellow when the status is DB2. Threads that are in I/O,Lock, SP, or SPW status are also highlighted in yellow because these are subsets ofthe DB2 status. The other fields on the Thread Summary panel are highlighted inreverse video when they are in exception status.
An asterisk (*) appears to the left of the Status field if the thread type is ‘ALLIEDDISTRIBUTED’ or ‘DBAT’.
When display exception processing is active, the exception fields displayed on theThread Summary panel are checked for an exception condition each time the paneldata is refreshed.
If you are filtering the threads listed on this panel, only the listed threads arechecked for exception conditions. Threads in exception also have an impact on thesort sequence. They are sorted to the top of the display, with problem levelexceptions first and warning level exceptions second.
From the Thread Summary panel, you can select any thread to display the ThreadDetail panel, where the thread can be examined in greater detail.
Thread Detail Panel
Use the Thread Detail panel to view detailed information on the thread beingmonitored. From the Thread Detail panel, you can access the category windowsshowing selected information about the monitored thread in greater detail.
To display the Thread Detail panel, select any active thread listed on the ThreadSummary panel, Threads Holding Resource window, or the Periodic Exceptions Listpanel.
Note: The Thread Detail panel displayed at your site may have been tailored byyour installation and consequently may not necessarily match the panelexample shown in this book.
Thread Activity
Chapter 7. Displaying Thread Activity 79
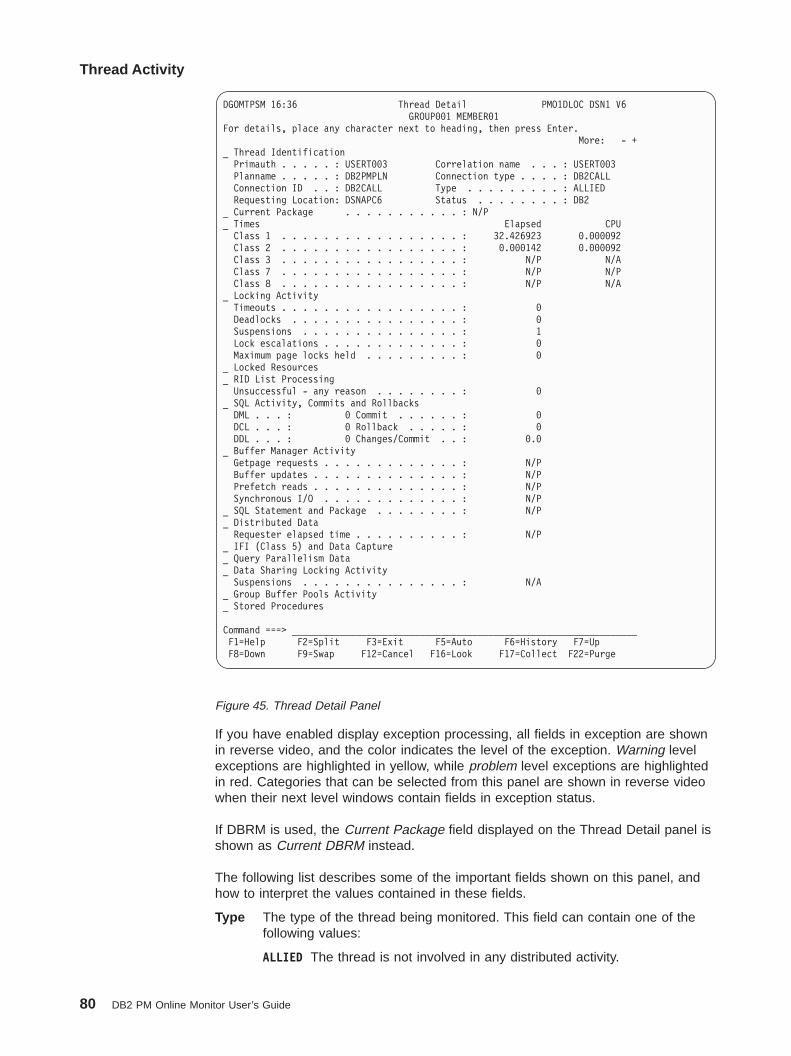
If you have enabled display exception processing, all fields in exception are shownin reverse video, and the color indicates the level of the exception. Warning levelexceptions are highlighted in yellow, while problem level exceptions are highlightedin red. Categories that can be selected from this panel are shown in reverse videowhen their next level windows contain fields in exception status.
If DBRM is used, the Current Package field displayed on the Thread Detail panel isshown as Current DBRM instead.
The following list describes some of the important fields shown on this panel, andhow to interpret the values contained in these fields.
Type The type of the thread being monitored. This field can contain one of thefollowing values:
ALLIED The thread is not involved in any distributed activity.
DGOMTPSM 16:36 Thread Detail PMO1DLOC DSN1 V6GROUP001 MEMBER01
For details, place any character next to heading, then press Enter.More: - +
_ Thread IdentificationPrimauth . . . . . : USERT003 Correlation name . . . : USERT003Planname . . . . . : DB2PMPLN Connection type . . . . : DB2CALLConnection ID . . : DB2CALL Type . . . . . . . . . : ALLIEDRequesting Location: DSNAPC6 Status . . . . . . . . : DB2
_ Current Package . . . . . . . . . . . : N/P_ Times Elapsed CPUClass 1 . . . . . . . . . . . . . . . . . : 32.426923 0.000092Class 2 . . . . . . . . . . . . . . . . . : 0.000142 0.000092Class 3 . . . . . . . . . . . . . . . . . : N/P N/AClass 7 . . . . . . . . . . . . . . . . . : N/P N/PClass 8 . . . . . . . . . . . . . . . . . : N/P N/A
_ Locking ActivityTimeouts . . . . . . . . . . . . . . . . . : 0Deadlocks . . . . . . . . . . . . . . . . : 0Suspensions . . . . . . . . . . . . . . . : 1Lock escalations . . . . . . . . . . . . . : 0Maximum page locks held . . . . . . . . . : 0
_ Locked Resources_ RID List ProcessingUnsuccessful - any reason . . . . . . . . : 0
_ SQL Activity, Commits and RollbacksDML . . . : 0 Commit . . . . . . : 0DCL . . . : 0 Rollback . . . . . : 0DDL . . . : 0 Changes/Commit . . : 0.0
_ Buffer Manager ActivityGetpage requests . . . . . . . . . . . . . : N/PBuffer updates . . . . . . . . . . . . . . : N/PPrefetch reads . . . . . . . . . . . . . . : N/PSynchronous I/O . . . . . . . . . . . . . : N/P
_ SQL Statement and Package . . . . . . . . : N/P_ Distributed DataRequester elapsed time . . . . . . . . . . : N/P
_ IFI (Class 5) and Data Capture_ Query Parallelism Data_ Data Sharing Locking ActivitySuspensions . . . . . . . . . . . . . . . : N/A
_ Group Buffer Pools Activity_ Stored Procedures
Command ===> _________________________________________________________________F1=Help F2=Split F3=Exit F5=Auto F6=History F7=UpF8=Down F9=Swap F12=Cancel F16=Look F17=Collect F22=Purge
Figure 45. Thread Detail Panel
Thread Activity
80 DB2 PM Online Monitor User’s Guide

A-DIST The thread is initiated by a DB2 attach and requests data from oneor more server locations.
DBAT The thread is initiated by, and performing work on behalf of, aremote (requester) location.
D-DIST Distributed database access thread, both a DDF server andrequester.
It is important to know if the thread is involved in distributed activity, sincethis can affect the fields you should monitor. For example, if the thread isinvolved in distributed activity, the class 1 elapsed time is higher than itwould be if there was no distributed activity, since this time includes networktime.
Class 1 TimesThis field shows the elapsed time and the CPU time for the processingperformed and includes the time spent not only in DB2 but also in theapplication.
CPU time is the sum of:v The agent’s CPU (TCB) timev The CPU time spent in stored proceduresv The accumulated processing time of the parallel tasks (if query
parallelism or utility parallelism is used).
Class 2 TimesThis field shows the elapsed time and the CPU time for the processingperformed in DB2 only. Elapsed time includes wait times.
CPU time is the sum of:v The agent’s CPU (TCB) timev The CPU time spent in stored proceduresv The accumulated processing time of the parallel tasks (if query
parallelism or utility parallelism is used).
Note that for threads exploiting query parallelism or utility parallelism, class2 CPU time can be larger than class 2 elapsed time because the CPU timeincludes the execution time of all parallel threads. To separate the agent’sCPU time from the sum of all parallel tasks’ CPU times, select Times, whichdisplays the Thread Times window. See also the discussion at thebeginning of “Accounting Times” on page 73.
Class 3 TimesThis field shows the total time spent waiting due to class 3 suspensions.Note that for threads exploiting query parallelism or utility parallelism, waittimes are summed for the originating task and all parallel tasks. See alsothe discussion at the beginning of “Accounting Times” on page 73.
SuspensionsThis field includes all types of lock suspensions.
Getpage requestsThis field shows the number of GETPAGE requests. Reducing GETPAGErequests reduces CPU usage and improves performance. Fewer GETPAGErequests also result in fewer synchronous reads, because fewer pages thatare not in the buffer pool must be fetched.
Prefetch readsThis includes number of prefetch reads done because of sequentialprefetch, list prefetch, and dynamic prefetch.
Thread Activity
Chapter 7. Displaying Thread Activity 81
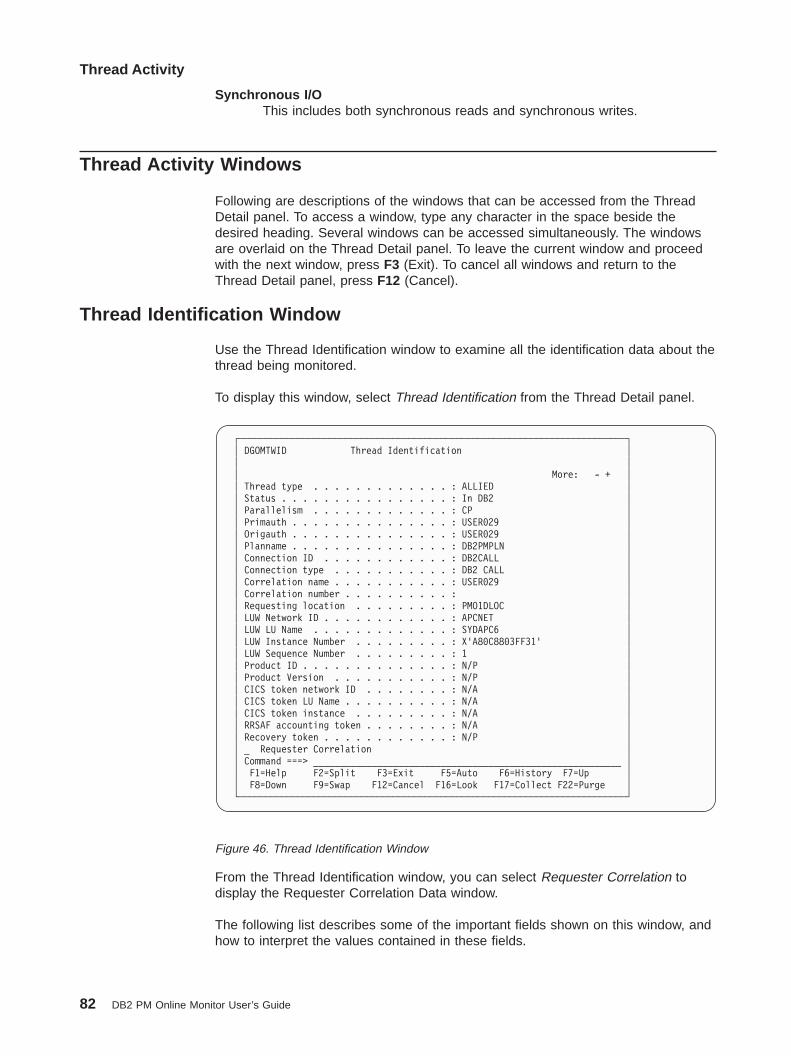
Synchronous I/OThis includes both synchronous reads and synchronous writes.
Thread Activity Windows
Following are descriptions of the windows that can be accessed from the ThreadDetail panel. To access a window, type any character in the space beside thedesired heading. Several windows can be accessed simultaneously. The windowsare overlaid on the Thread Detail panel. To leave the current window and proceedwith the next window, press F3 (Exit). To cancel all windows and return to theThread Detail panel, press F12 (Cancel).
Thread Identification Window
Use the Thread Identification window to examine all the identification data about thethread being monitored.
To display this window, select Thread Identification from the Thread Detail panel.
From the Thread Identification window, you can select Requester Correlation todisplay the Requester Correlation Data window.
The following list describes some of the important fields shown on this window, andhow to interpret the values contained in these fields.
┌─────────────────────────────────────────────────────────────────────────┐│ DGOMTWID Thread Identification ││ ││ More: - + ││ Thread type . . . . . . . . . . . . . : ALLIED ││ Status . . . . . . . . . . . . . . . . : In DB2 ││ Parallelism . . . . . . . . . . . . . : CP ││ Primauth . . . . . . . . . . . . . . . : USER029 ││ Origauth . . . . . . . . . . . . . . . : USER029 ││ Planname . . . . . . . . . . . . . . . : DB2PMPLN ││ Connection ID . . . . . . . . . . . . : DB2CALL ││ Connection type . . . . . . . . . . . : DB2 CALL ││ Correlation name . . . . . . . . . . . : USER029 ││ Correlation number . . . . . . . . . . : ││ Requesting location . . . . . . . . . : PMO1DLOC ││ LUW Network ID . . . . . . . . . . . . : APCNET ││ LUW LU Name . . . . . . . . . . . . . : SYDAPC6 ││ LUW Instance Number . . . . . . . . . : X'A80C8803FF31' ││ LUW Sequence Number . . . . . . . . . : 1 ││ Product ID . . . . . . . . . . . . . . : N/P ││ Product Version . . . . . . . . . . . : N/P ││ CICS token network ID . . . . . . . . : N/A ││ CICS token LU Name . . . . . . . . . . : N/A ││ CICS token instance . . . . . . . . . : N/A ││ RRSAF accounting token . . . . . . . . : N/A ││ Recovery token . . . . . . . . . . . . : N/P ││ _ Requester Correlation ││ Command ===> __________________________________________________________ ││ F1=Help F2=Split F3=Exit F5=Auto F6=History F7=Up ││ F8=Down F9=Swap F12=Cancel F16=Look F17=Collect F22=Purge │└─────────────────────────────────────────────────────────────────────────┘
Figure 46. Thread Identification Window
Thread Activity
82 DB2 PM Online Monitor User’s Guide
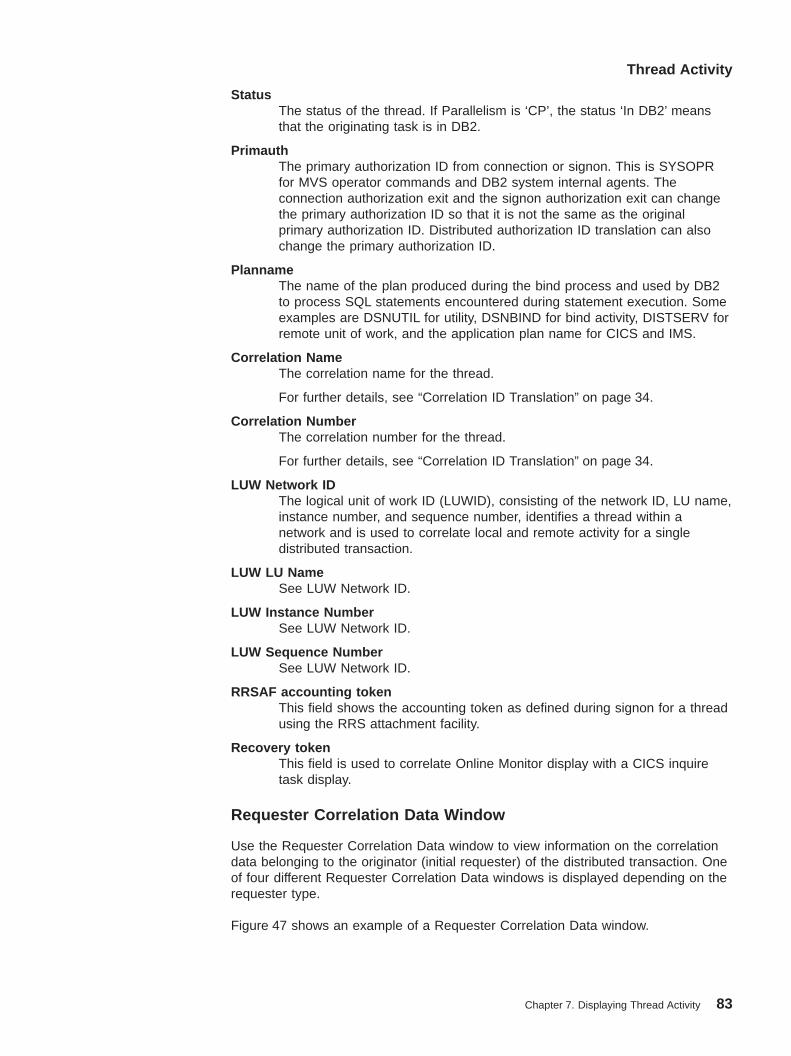
StatusThe status of the thread. If Parallelism is ‘CP’, the status ‘In DB2’ meansthat the originating task is in DB2.
PrimauthThe primary authorization ID from connection or signon. This is SYSOPRfor MVS operator commands and DB2 system internal agents. Theconnection authorization exit and the signon authorization exit can changethe primary authorization ID so that it is not the same as the originalprimary authorization ID. Distributed authorization ID translation can alsochange the primary authorization ID.
PlannameThe name of the plan produced during the bind process and used by DB2to process SQL statements encountered during statement execution. Someexamples are DSNUTIL for utility, DSNBIND for bind activity, DISTSERV forremote unit of work, and the application plan name for CICS and IMS.
Correlation NameThe correlation name for the thread.
For further details, see “Correlation ID Translation” on page 34.
Correlation NumberThe correlation number for the thread.
For further details, see “Correlation ID Translation” on page 34.
LUW Network IDThe logical unit of work ID (LUWID), consisting of the network ID, LU name,instance number, and sequence number, identifies a thread within anetwork and is used to correlate local and remote activity for a singledistributed transaction.
LUW LU NameSee LUW Network ID.
LUW Instance NumberSee LUW Network ID.
LUW Sequence NumberSee LUW Network ID.
RRSAF accounting tokenThis field shows the accounting token as defined during signon for a threadusing the RRS attachment facility.
Recovery tokenThis field is used to correlate Online Monitor display with a CICS inquiretask display.
Requester Correlation Data Window
Use the Requester Correlation Data window to view information on the correlationdata belonging to the originator (initial requester) of the distributed transaction. Oneof four different Requester Correlation Data windows is displayed depending on therequester type.
Figure 47 shows an example of a Requester Correlation Data window.
Thread Activity
Chapter 7. Displaying Thread Activity 83
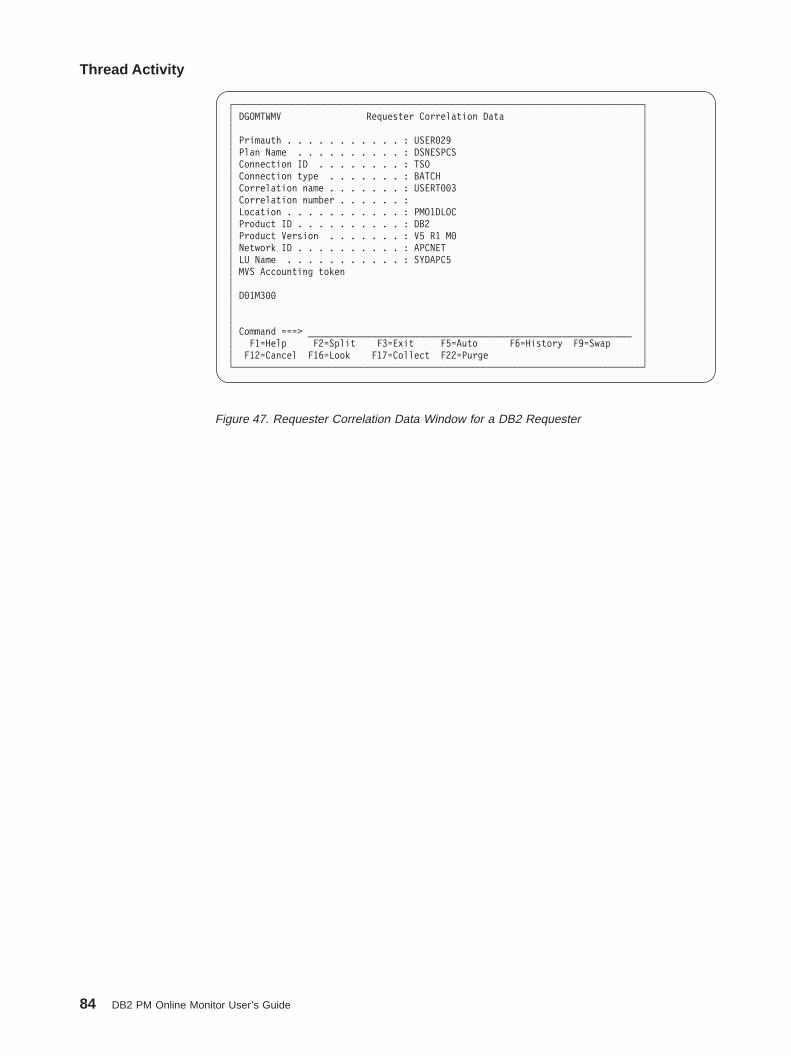
┌─────────────────────────────────────────────────────────────────────────────┐│ DGOMTWMV Requester Correlation Data ││ ││ Primauth . . . . . . . . . . . : USER029 ││ Plan Name . . . . . . . . . . : DSNESPCS ││ Connection ID . . . . . . . . : TSO ││ Connection type . . . . . . . : BATCH ││ Correlation name . . . . . . . : USERT003 ││ Correlation number . . . . . . : ││ Location . . . . . . . . . . . : PMO1DLOC ││ Product ID . . . . . . . . . . : DB2 ││ Product Version . . . . . . . : V5 R1 M0 ││ Network ID . . . . . . . . . . : APCNET ││ LU Name . . . . . . . . . . . : SYDAPC5 ││ MVS Accounting token ││ ││ D01M300 ││ ││ ││ Command ===> _____________________________________________________________ ││ F1=Help F2=Split F3=Exit F5=Auto F6=History F9=Swap ││ F12=Cancel F16=Look F17=Collect F22=Purge │└─────────────────────────────────────────────────────────────────────────────┘
Figure 47. Requester Correlation Data Window for a DB2 Requester
Thread Activity
84 DB2 PM Online Monitor User’s Guide
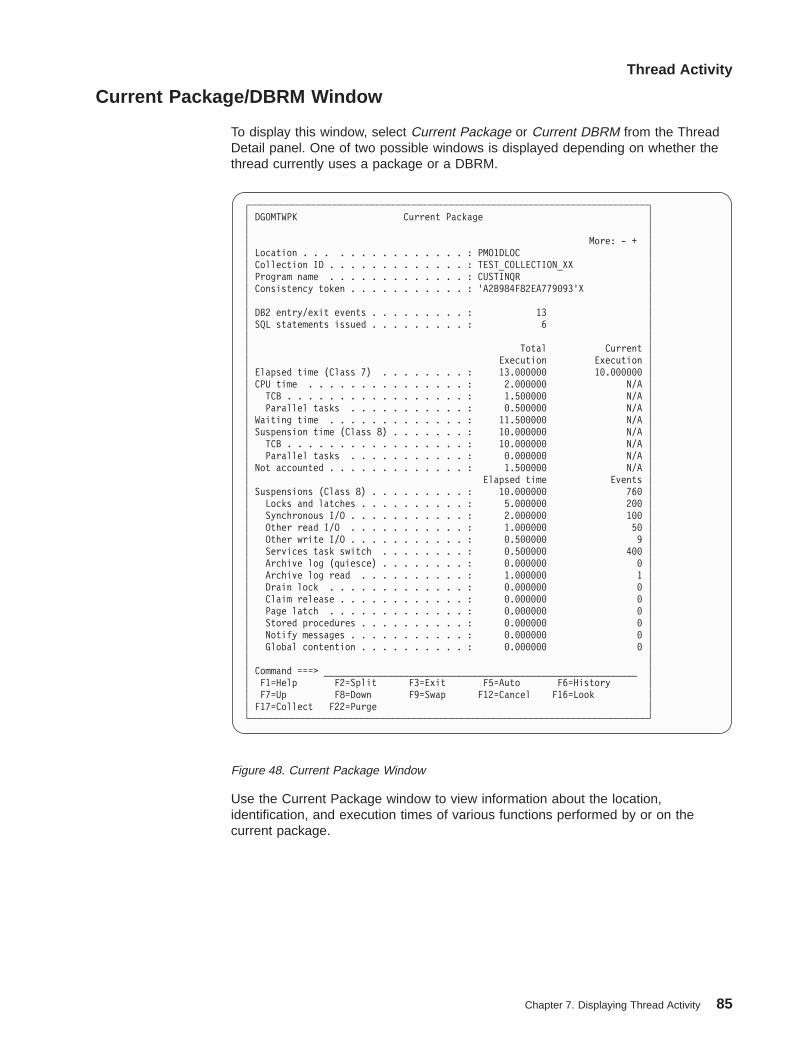
Current Package/DBRM Window
To display this window, select Current Package or Current DBRM from the ThreadDetail panel. One of two possible windows is displayed depending on whether thethread currently uses a package or a DBRM.
Use the Current Package window to view information about the location,identification, and execution times of various functions performed by or on thecurrent package.
┌───────────────────────────────────────────────────────────────────────────┐│ DGOMTWPK Current Package ││ ││ More: - + ││ Location . . . . . . . . . . . . . . . : PMO1DLOC ││ Collection ID . . . . . . . . . . . . . : TEST_COLLECTION_XX ││ Program name . . . . . . . . . . . . . : CUSTINQR ││ Consistency token . . . . . . . . . . . : 'A2B984F82EA779093'X ││ ││ DB2 entry/exit events . . . . . . . . . : 13 ││ SQL statements issued . . . . . . . . . : 6 ││ ││ Total Current ││ Execution Execution ││ Elapsed time (Class 7) . . . . . . . . : 13.000000 10.000000 ││ CPU time . . . . . . . . . . . . . . . : 2.000000 N/A ││ TCB . . . . . . . . . . . . . . . . . : 1.500000 N/A ││ Parallel tasks . . . . . . . . . . . : 0.500000 N/A ││ Waiting time . . . . . . . . . . . . . : 11.500000 N/A ││ Suspension time (Class 8) . . . . . . . : 10.000000 N/A ││ TCB . . . . . . . . . . . . . . . . . : 10.000000 N/A ││ Parallel tasks . . . . . . . . . . . : 0.000000 N/A ││ Not accounted . . . . . . . . . . . . . : 1.500000 N/A ││ Elapsed time Events ││ Suspensions (Class 8) . . . . . . . . . : 10.000000 760 ││ Locks and latches . . . . . . . . . . : 5.000000 200 ││ Synchronous I/O . . . . . . . . . . . : 2.000000 100 ││ Other read I/O . . . . . . . . . . . : 1.000000 50 ││ Other write I/O . . . . . . . . . . . : 0.500000 9 ││ Services task switch . . . . . . . . : 0.500000 400 ││ Archive log (quiesce) . . . . . . . . : 0.000000 0 ││ Archive log read . . . . . . . . . . : 1.000000 1 ││ Drain lock . . . . . . . . . . . . . : 0.000000 0 ││ Claim release . . . . . . . . . . . . : 0.000000 0 ││ Page latch . . . . . . . . . . . . . : 0.000000 0 ││ Stored procedures . . . . . . . . . . : 0.000000 0 ││ Notify messages . . . . . . . . . . . : 0.000000 0 ││ Global contention . . . . . . . . . . : 0.000000 0 ││ ││ Command ===> ___________________________________________________________ ││ F1=Help F2=Split F3=Exit F5=Auto F6=History ││ F7=Up F8=Down F9=Swap F12=Cancel F16=Look ││ F17=Collect F22=Purge │└───────────────────────────────────────────────────────────────────────────┘
Figure 48. Current Package Window
Thread Activity
Chapter 7. Displaying Thread Activity 85

Use the Current DBRM window to view information about the identification andexecution times of various functions performed by or on the current DBRM.
Refer to “Accounting Times” on page 73 for a discussion of how to interpret the timevalues for threads exploiting query parallelism or utility parallelism. Theseconsiderations apply to class 7 times (for elapsed times and CPU times) and toclass 8 times (for suspension times).
The following list describes some of the important fields shown on the CurrentPackage and Current DBRM windows, and how to interpret the values contained inthese fields.
Not accountedThis is derived as Waiting time - Suspension time (Class 8) TCB. It includesCPU wait times, paging, and open/close activity.
Suspensions (Class 8)If Waiting time and Suspension time (Class 8) are almost the same, thenexamine the reasons for suspensions which caused the wait. Otherwise,look at the Not accounted field in the Thread Times window.
┌───────────────────────────────────────────────────────────────────────────┐│ DGOMTWDB Current DBRM ││ ││ More: - + ││ Program Name . . . . . . . . . . . . . : CUSTINQR ││ ││ DB2 entry/exit events . . . . . . . . . : 13 ││ SQL statements issued . . . . . . . . . : 6 ││ ││ Total Current ││ Execution Execution ││ Elapsed time (Class 7) . . . . . . . . : 13.000000 10.000000 ││ CPU time . . . . . . . . . . . . . . . : 2.000000 N/A ││ TCB . . . . . . . . . . . . . . . . . : 1.500000 N/A ││ Parallel tasks . . . . . . . . . . . : 0.500000 N/A ││ Waiting time . . . . . . . . . . . . . : 11.500000 N/A ││ Suspension time (Class 8) . . . . . . . : 10.000000 N/A ││ TCB . . . . . . . . . . . . . . . . . : 10.000000 N/A ││ Parallel tasks . . . . . . . . . . . : 0.000000 N/A ││ Not accounted . . . . . . . . . . . . . : 1.500000 N/A ││ Elapsed time Events ││ Suspensions (Class 8) . . . . . . . . . : 10.000000 760 ││ Locks and latches . . . . . . . . . . : 5.000000 200 ││ Synchronous I/O . . . . . . . . . . . : 2.000000 100 ││ Other read I/O . . . . . . . . . . . : 1.000000 50 ││ Other write I/O . . . . . . . . . . . : 0.500000 9 ││ Services task switch . . . . . . . . : 0.500000 400 ││ Archive log (quiesce) . . . . . . . . : 0.000000 0 ││ Archive log read . . . . . . . . . . : 1.000000 1 ││ Drain lock . . . . . . . . . . . . . : 0.000000 0 ││ Claim release . . . . . . . . . . . . : 0.000000 0 ││ Page latch . . . . . . . . . . . . . : 0.000000 0 ││ Stored procedures . . . . . . . . . . : 0.000000 0 ││ Notify messages . . . . . . . . . . . : 0.000000 0 ││ Global contention . . . . . . . . . . : 0.000000 0 ││ ││ Command ===> ___________________________________________________________ ││ F1=Help F2=Split F3=Exit F5=Auto F6=History ││ F7=Up F8=Down F9=Swap F12=Cancel F16=Look ││ F17=Collect F22=Purge │└───────────────────────────────────────────────────────────────────────────┘
Figure 49. Current DBRM Window
Thread Activity
86 DB2 PM Online Monitor User’s Guide
Locks and latchesThis field shows the duration of suspensions resulting from a lock or latchnot being available immediately on request. If the suspension time is high,examine the Locking (IRLM) Activity window.
Synchronous I/OThis field shows the accumulated I/O elapsed wait time for I/O performedunder this thread. This field is for synchronous I/O only. It includessynchronous read and write I/O. If the time per I/O is high, one typicalproblem is an interference by prefetch or deferred write I/O.
Other read I/OThis field includes waits caused by read I/O performed under anotherthread, for example, sequential prefetch, list prefetch, or dynamic prefetch.
If the value in this field is high, the problem could be an I/O bound queryusing prefetch or an I/O contention. If it is an I/O bound query, DEGREEANY could drastically improve elapsed time of such a query. The applicationis accessing data from a busy data set/volume/control unit and iscontinually being suspended. The DBA and the MVS system programmershould be consulted.
Other write I/OThis field includes waits caused by write I/O performed under anotherthread, for example, asynchronous write.
If the value in this field is high, the problem could be I/O contention. Theapplication is accessing data from a busy data set/volume/control unit andis continually being suspended. The DBA and the MVS system programmershould be consulted to resolve possible data set placement problems.
Too small a buffer pool for sort and other updated data could also causethis problem.
Services task switchIncluded here are waits due to OPEN/CLOSE data set, SYSLGRNX update,COMMIT PHASE II for UPDATE threads, HSM recall for data set, dataspace manager services, DEFINE, EXTEND, and DELETE data set, andthe log I/Os for COMMIT and UPDATE processing.
Wait times in COMMIT are reported in the following fields:TSO/CAF/Batch single phase commit:
SER.TASK SWTCHCICS/IMS phase 1 commit:
SYNCHRON. I/OCICS/IMS phase 2 commit:
SER.TASK SWTCH
This means, for example, that an IMS COMMIT used to have 2synchronous I/O suspensions, whereas now it has 1 synchronous I/Osuspension and 1 service task suspension.
Both single and dual logs result in the same count.
There is no overlap between the elapsed time reported in this field and theother class 3 elapsed times. Since DB2 Version 4, if service tasksuspensions overlap other types of suspensions, the other types ofsuspensions are ignored. Previously the service task time was ignored.
Thread Activity
Chapter 7. Displaying Thread Activity 87
Preformatting the data sets is probably most important in terms of servicetask suspension.
Archive log (quiesce)Included here are waits due to processing of the ARCHIVE command (notthe time for the ARCHIVE command to complete).
Avoid issuing ARCHIVE LOG QUIESCE during peak periods.
Archive log readAccumulated wait time for archive reads (from tape).
Drain lockThe time spent waiting due to drain lock suspensions. If the value in thisfield is large, it may indicate that execution of a utility impacted the SQL.
Claim releaseThe time spent waiting for claims to be released.
Page latchThe time spent waiting for page latch contentions.
Thread Times Window
Use the Thread Times window to investigate the response times of different actionsperformed by the thread. Refer to “Accounting Times” on page 73 for a discussionon how to interpret the time values for threads exploiting query parallelism or utilityparallelism.
To display this window, select Times from the Thread Detail panel.
Thread Activity
88 DB2 PM Online Monitor User’s Guide
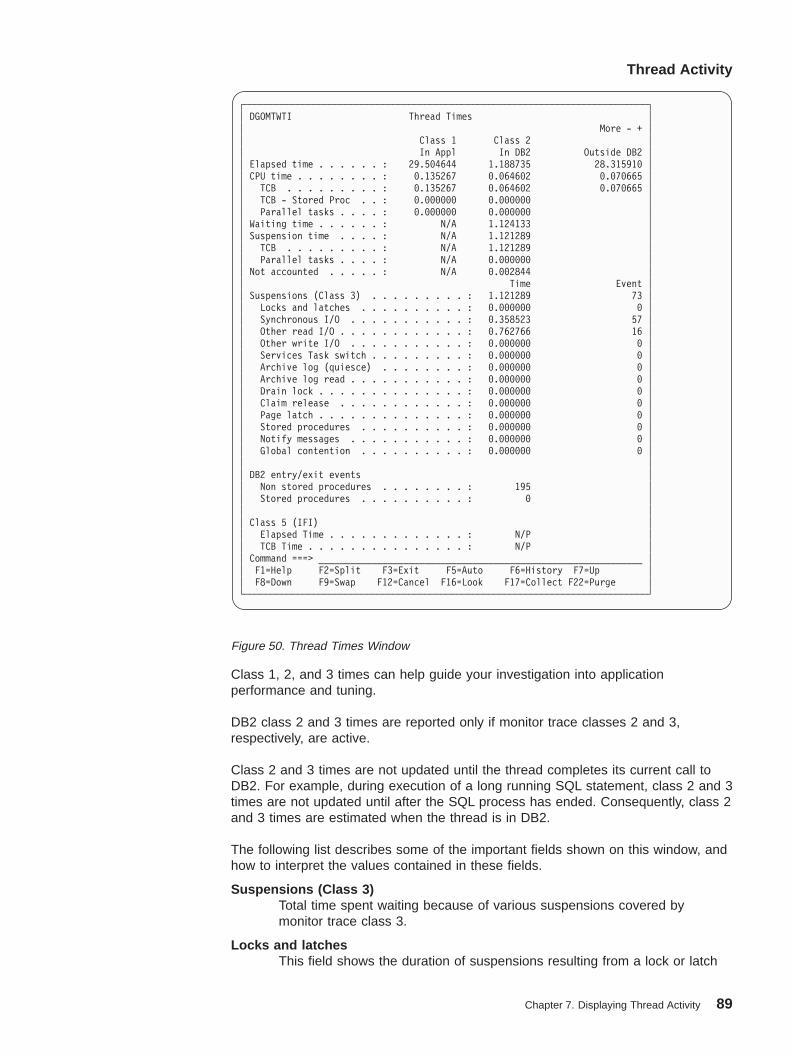
Class 1, 2, and 3 times can help guide your investigation into applicationperformance and tuning.
DB2 class 2 and 3 times are reported only if monitor trace classes 2 and 3,respectively, are active.
Class 2 and 3 times are not updated until the thread completes its current call toDB2. For example, during execution of a long running SQL statement, class 2 and 3times are not updated until after the SQL process has ended. Consequently, class 2and 3 times are estimated when the thread is in DB2.
The following list describes some of the important fields shown on this window, andhow to interpret the values contained in these fields.
Suspensions (Class 3)Total time spent waiting because of various suspensions covered bymonitor trace class 3.
Locks and latchesThis field shows the duration of suspensions resulting from a lock or latch
┌────────────────────────────────────────────────────────────────────────────┐│ DGOMTWTI Thread Times ││ More - + ││ Class 1 Class 2 ││ In Appl In DB2 Outside DB2 ││ Elapsed time . . . . . . : 29.504644 1.188735 28.315910 ││ CPU time . . . . . . . . : 0.135267 0.064602 0.070665 ││ TCB . . . . . . . . . : 0.135267 0.064602 0.070665 ││ TCB - Stored Proc . . : 0.000000 0.000000 ││ Parallel tasks . . . . : 0.000000 0.000000 ││ Waiting time . . . . . . : N/A 1.124133 ││ Suspension time . . . . : N/A 1.121289 ││ TCB . . . . . . . . . : N/A 1.121289 ││ Parallel tasks . . . . : N/A 0.000000 ││ Not accounted . . . . . : N/A 0.002844 ││ Time Event ││ Suspensions (Class 3) . . . . . . . . . : 1.121289 73 ││ Locks and latches . . . . . . . . . . : 0.000000 0 ││ Synchronous I/O . . . . . . . . . . . : 0.358523 57 ││ Other read I/O . . . . . . . . . . . . : 0.762766 16 ││ Other write I/O . . . . . . . . . . . : 0.000000 0 ││ Services Task switch . . . . . . . . . : 0.000000 0 ││ Archive log (quiesce) . . . . . . . . : 0.000000 0 ││ Archive log read . . . . . . . . . . . : 0.000000 0 ││ Drain lock . . . . . . . . . . . . . . : 0.000000 0 ││ Claim release . . . . . . . . . . . . : 0.000000 0 ││ Page latch . . . . . . . . . . . . . . : 0.000000 0 ││ Stored procedures . . . . . . . . . . : 0.000000 0 ││ Notify messages . . . . . . . . . . . : 0.000000 0 ││ Global contention . . . . . . . . . . : 0.000000 0 ││ ││ DB2 entry/exit events ││ Non stored procedures . . . . . . . . : 195 ││ Stored procedures . . . . . . . . . . : 0 ││ ││ Class 5 (IFI) ││ Elapsed Time . . . . . . . . . . . . . : N/P ││ TCB Time . . . . . . . . . . . . . . . : N/P ││ Command ===> _____________________________________________________________ ││ F1=Help F2=Split F3=Exit F5=Auto F6=History F7=Up ││ F8=Down F9=Swap F12=Cancel F16=Look F17=Collect F22=Purge │└────────────────────────────────────────────────────────────────────────────┘
Figure 50. Thread Times Window
Thread Activity
Chapter 7. Displaying Thread Activity 89
not being available immediately on request. If the suspension time is high,examine further the locking block in accounting.
Synchronous I/OThis field shows the accumulated I/O elapsed wait time for I/O performedunder this thread. This field is for synchronous I/O only. It includessynchronous read and write I/O. If the time per I/O is high, one typicalproblem is an interference by prefetch or deferred write I/O. The I/Oscheduling enhancement in DB2 Version 3 should reduce this problem byassigning higher I/O priority to synchronous I/O over asynchronous I/O.
Other read I/OThis field includes waits caused by read I/O performed under anotherthread, for example, sequential prefetch, list prefetch, or dynamic prefetch.
If the value in this field is high, the problem could be an I/O bound queryusing prefetch or an I/O contention. If it is an I/O bound query, DEGREEANY could drastically improve elapsed time of such a query. The applicationis accessing data from a busy data set/volume/control unit and iscontinually being suspended. The DBA and the MVS system programmershould be consulted.
Other write I/OThis field includes waits caused by write I/O performed under anotherthread, for example, asynchronous write.
If the value in this field is high, the problem could be I/O contention. Theapplication is accessing data from a busy data set/volume/control unit andis continually being suspended. The DBA and the MVS system programmershould be consulted to resolve possible data set placement problems.
Too small a buffer pool for sort and other updated data could also causethis problem.
Archive log (quiesce)Included here are waits due to processing of the ARCHIVE command (notthe time for the ARCHIVE command to complete).
Avoid issuing ARCHIVE LOG QUIESCE during peak periods.
Archive log readAccumulated wait time for archive reads (from tape).
Drain lockThe time spent waiting due to drain lock suspensions. If the value in thisfield is large, it may indicate that execution of a utility impacted the SQL.
Claim releaseThe time spent waiting for claims to be released.
Page latchThe time spent waiting for page latch contentions.
Locking (IRLM) Activity Window
Use the Locking (IRLM) Activity window to view information on locking activity forthe thread being monitored.
To display this window, select Locking Activity from the Thread Detail panel.
Thread Activity
90 DB2 PM Online Monitor User’s Guide

Deadlocks and timeouts displayed on this window can indicate the existence oflocking problems. These problems can be further investigated using the LockedResources window to examine resources that are either locked by or, in case theyare locked by another thread, unavailable to, the monitored thread.
The following list describes some of the important fields shown on this window, andhow to interpret the values contained in these fields.
TimeoutsNumber of times lock suspension ultimately resulted in a timeout. Thishappens when a requester for a lock on a resource has waited longer thanthe installation-specified RESOURCE TIMEOUT limit on the DB2 installpanel DSNTIPI.
DeadlocksNumber of times lock suspension ultimately resulted in a deadlock. Thishappens when two or more application processes each hold locks onresources that the others need, without which they cannot proceed. A singleprocess accessing data through an unclustered index can sometimesexperience a deadlock between a data page and an index page. Ifdeadlocks are not very frequent, they may not impact performance.
Lock requestsNumber of times a lock on a resource was requested.
Change requestsNumber of times a lock change was requested, for example, to promote ashared page lock to exclusive lock.
Suspensions - lockNumber of resource conflicts. A suspension is a wait for a lock, and each of
┌────────────────────────────────────────────────────────────────┐│ DGOMTWLK Locking (IRLM) Activity ││ ││ More: + ││ Lock and latch suspensions . . . . . . . . . . . . : 1 ││ Elapsed time . . . . . . . . . . . . . . . . : 0.000355 ││ ││ Timeouts . . . . . . . . . . . . . . . . . . . . . : 0 ││ Deadlocks . . . . . . . . . . . . . . . . . . . . : 0 ││ Lock requests . . . . . . . . . . . . . . . . . . : 19 ││ Unlock requests . . . . . . . . . . . . . . . . . : 18 ││ Change requests . . . . . . . . . . . . . . . . . : 1 ││ Query requests . . . . . . . . . . . . . . . . . . : 0 ││ Other IRLM requests . . . . . . . . . . . . . . . : 0 ││ Suspensions - lock . . . . . . . . . . . . . . . . : 0 ││ Suspensions - latch . . . . . . . . . . . . . . . : 1 ││ Suspensions - other . . . . . . . . . . . . . . . : 0 ││ Lock escalations - shared . . . . . . . . . . . . : 0 ││ Lock escalations - exclusive . . . . . . . . . . . : 0 ││ Maximum page or row locks held . . . . . . . . . . : 2 ││ Claim requests . . . . . . . . . . . . . . . . . . : 6 ││ Unsuccessful claim requests . . . . . . . . . . . : 0 ││ Drain requests . . . . . . . . . . . . . . . . . . : 0 ││ Unsuccessful drain requests . . . . . . . . . . . : 0 ││ ││ Command ===> ________________________________________________ ││ F1=Help F2=Split F3=Exit F5=Auto F6=History ││ F7=Up F8=Down F9=Swap F12=Cancel F16=Look ││ F17=Collect F22=Purge │└────────────────────────────────────────────────────────────────┘
Figure 51. Locking (IRLM) Activity Window
Thread Activity
Chapter 7. Displaying Thread Activity 91
these waits may adversely affect application performance. The suspensionmight ultimately result in normal resumption, timeout, or deadlock. Thenumber of lock suspensions is a function of the lock requests. Locksuspensions (or conflicts) can occur on either lock requests or changerequests.
The ratio of suspensions to lock requests is largely application dependent.
Lock escalations - sharedCount of lock escalations to shared mode. Number of times the LOCKSPER TABLE(SPACE) parameter on the DB2 Install panel DSNTIPJ wasexceeded and the table space lock was promoted from a page lock (IS) toa table space lock (S) for this thread. Escalation can cause unpredictableresponse times. The lock escalation to shared mode should only happen onan exception basis. For example, if a REPEATABLE READ applicationreferences most pages in a table.
Lock escalations - exclusiveCount of lock escalations to exclusive mode. Number of times the LOCKSPER TABLE(SPACE) parameter on the DB2 Install panel DSNTIPJ wasexceeded and the table space lock was promoted from a page lock (IX) toa table space lock (X) for this thread. Escalation can cause unpredictableresponse times. The lock escalation to exclusive mode should happenrarely, for example, if an application updates many pages in a table withoutissuing commits.
Check the event exception display for deadlocks occurring against theagent that causes the lock escalation. In a transaction processingenvironment, a moderate level of lockout is tolerable. If many escalationscause deadlocks and timeouts, then the recommendation is to change theescalation threshold value. Use of ANY is extremely desirable to preventunnecessary and expensive page locks, for example locking all pages in atablespace.
Lock escalations, shared or exclusive, should not be expected in atransaction environment.
In DB2 Version 4, the method of controlling Lock Escalation has changed.The escalation rules and locking hierarchy have changed to cater for theROW level locking. If escalation occurs when LOCKSIZE ROW is specified,the lock is escalated to the table level for a segmented tablespace and tothe tablespace level for a nonsegmented tablespace. This is the same asfor LOCKSIZE PAGE prior to DB2 Version 4.
A new clause LOCKMAX has been added to the CREATE TABLESPACEstatement. This provides for control of the maximum number of locks for anindividual tablespace in addition to the system-wide NUMLKTS parametercurrently provided.
The default is LOCKMAX 0 to make sure that PAGE level locking isconsistent with previous releases of DB2. If LOCKSIZE ANY is specified,DB2 chooses LOCKSIZE PAGE LOCKMAX SYSTEM. Prior to DB2 Version4, specifying LOCKSIZE PAGE prevented lock escalation.
Escalation is now possible with PAGE locking by specifying the LOCKMAXclause. This provides for initial PAGE level locking with escalation to tableor tablespace locking for segmented and nonsegmented tablespacesrespectively, based on the number of locks specified on the LOCKMAXclause. To disable escalation, specify LOCKMAX 0.
Thread Activity
92 DB2 PM Online Monitor User’s Guide

For high volume updates where contention is an issue, use type-2 indexesand specify one of the following:
v LOCKSIZE PAGE
v LOCKSIZE ROW for the high contention tables to improve concurrency.However, LOCKSIZE ROW should be considered only as an exceptionalcase, because of a potential for significant overhead. In fact, it is evenpossible that LOCKSIZE ROW causes deadlocks, which would nothappen with LOCKSIZE PAGE.
Omitting LOCKMAX results in LOCKMAX 0, which disables escalation. Ifescalation is to be allowed, users should carefully consider the threshold atwhich it should take place for each individual table.
Maximum page or row locks heldCount of the maximum number of page or row locks concurrently heldagainst all table spaces by a single thread during its execution. This countcannot exceed the value of the ‘LOCKS PER USER’ DB2 installationparameter (panel DSNTIPJ). Once the limit is reached, the next attempt toobtain a lock results in a RESOURCE UNAVAILABLE return code, and theSQL request is not processed.
Locking Considerations
The following aspects should be considered if concurrency is an issue:v Consistent data access sequence in applicationsv The mix of concurrent processing types (batch and transaction)v IRLM startup procedure options and DB2 installation optionsv DDL LOCKSIZEv DDL LOCKMAXv BIND parameters.
Refer to IBM DB2 Universal Database Server for OS/390 Version 6Administration Guide for detailed information.
Locked Resources Window
Use the Locked Resources window to view the list of thread resources that areeither locked by or, in case they are locked by another thread, unavailable to, themonitored thread. If there are many resources listed, you can use the scrolling keysF7 (Up) and F8 (Down) to browse the list.
The resources are listed in the following sequence:1. Resources that cause this thread to be suspended2. Resources that cause other threads to be suspended3. Resources that are held by more than one thread4. Resources that are held only by this thread.
To display this window, select Locked Resources from the Thread Detail panel.
Thread Activity
Chapter 7. Displaying Thread Activity 93
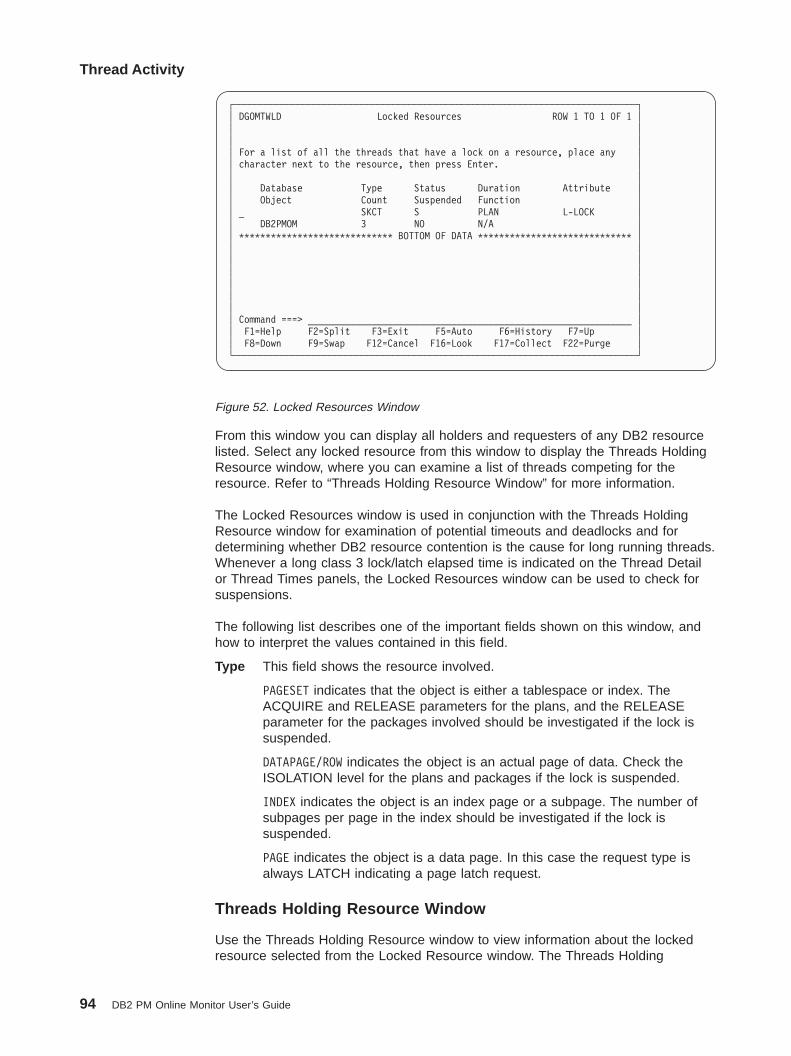
From this window you can display all holders and requesters of any DB2 resourcelisted. Select any locked resource from this window to display the Threads HoldingResource window, where you can examine a list of threads competing for theresource. Refer to “Threads Holding Resource Window” for more information.
The Locked Resources window is used in conjunction with the Threads HoldingResource window for examination of potential timeouts and deadlocks and fordetermining whether DB2 resource contention is the cause for long running threads.Whenever a long class 3 lock/latch elapsed time is indicated on the Thread Detailor Thread Times panels, the Locked Resources window can be used to check forsuspensions.
The following list describes one of the important fields shown on this window, andhow to interpret the values contained in this field.
Type This field shows the resource involved.
PAGESET indicates that the object is either a tablespace or index. TheACQUIRE and RELEASE parameters for the plans, and the RELEASEparameter for the packages involved should be investigated if the lock issuspended.
DATAPAGE/ROW indicates the object is an actual page of data. Check theISOLATION level for the plans and packages if the lock is suspended.
INDEX indicates the object is an index page or a subpage. The number ofsubpages per page in the index should be investigated if the lock issuspended.
PAGE indicates the object is a data page. In this case the request type isalways LATCH indicating a page latch request.
Threads Holding Resource Window
Use the Threads Holding Resource window to view information about the lockedresource selected from the Locked Resource window. The Threads Holding
┌────────────────────────────────────────────────────────────────────────────┐│ DGOMTWLD Locked Resources ROW 1 TO 1 OF 1 ││ ││ ││ For a list of all the threads that have a lock on a resource, place any ││ character next to the resource, then press Enter. ││ ││ Database Type Status Duration Attribute ││ Object Count Suspended Function ││ _ SKCT S PLAN L-LOCK ││ DB2PMOM 3 NO N/A ││ ***************************** BOTTOM OF DATA ***************************** ││ ││ ││ ││ ││ ││ ││ Command ===> _____________________________________________________________ ││ F1=Help F2=Split F3=Exit F5=Auto F6=History F7=Up ││ F8=Down F9=Swap F12=Cancel F16=Look F17=Collect F22=Purge │└────────────────────────────────────────────────────────────────────────────┘
Figure 52. Locked Resources Window
Thread Activity
94 DB2 PM Online Monitor User’s Guide

Resource window displays a list of all holders and requesters of the lockedresource. If there are many threads listed, you can use the scrolling keys F7 (Up)and F8 (Down) to browse the list.
To display the Threads Holding Resource window, select any locked resource listedon the Locked Resources window. The Threads Holding Resource window is thendisplayed. To leave the window and return to the Locked Resources window, pressF3 (Exit). To leave the window and return to the Thread Detail panel, press F12(Cancel).
The appearance of the Threads Holding Resource window differs depending on thetype of resource being held by the monitored thread. Figure 53 shows an exampleof a Threads Holding Resource window.
You can display the Thread Detail panel for any of the threads listed on thesewindows by typing any character in the selection field beside the thread andpressing Enter .
Use the Threads Holding Resource window in conjunction with the Locking (IRLM)Activity window to examine timeout or deadlock situations or to determine whetherDB2 resource contention is the cause for long running threads.
RID List Processing Window
Use the RID List Processing window to view information about the number ofsuccessful and unsuccessful RID (Record ID) list processing operations performed.This information can help you determine the maximum number of RID blocks toallocate for optimum system performance.
To display this window, select RID List Processing from the Thread Detail panel.
┌────────────────────────────────────────────────────────────────────────────┐│ DGOMTWR5 Threads Holding Resource ROW 1 TO 2 OF 2 ││ Command ===> _____________________________________________________________ ││ ││ ││ To display a new thread, place any character next to it, then press Enter. ││ The Thread Detail will be displayed. ││ ││ Resource type . . . . . : DBD PLCK Database . . : DSNDB06 ││ ││ Primauth Corrname Status Subsystem ││ Planname Connection Suspended Duration ││ _ TRIONA TRIONA IS N/P ││ DB2PMOM DB2CALL NO ALLOCATION ││ _ N/P N/P IS DSN1 ││ N/P N/P NO N/P ││ ***************************** BOTTOM OF DATA ***************************** ││ ││ ││ ││ ││ F1=Help F2=Split F3=Exit F5=Auto F6=History F7=Up ││ F8=Down F9=Swap F12=Cancel F16=Look F17=Collect F22=Purge │└────────────────────────────────────────────────────────────────────────────┘
Figure 53. Threads Holding Resource Window
Thread Activity
Chapter 7. Displaying Thread Activity 95

The following list describes some of the important fields shown on this window, andhow to interpret the values contained in these fields.
SuccessfulA nonzero value in this field indicates that DB2 has used list prefetchactivity. If you are looking at a transaction and list prefetch is used, you maywant to look into the access path selection.
Not used - no storageNumber of times RID list processing was terminated due to insufficientstorage.
This failure occurs when a RID list was not used for a given RID listprocess involving one or more indexes because no storage was available tohold the list of RIDs.
Not used - limit exceededNumber of times RID list processing was terminated due to one or moreinternal limits exceeded.
The cause of the failure should be investigated, either from statistics recordor from performance trace, before increasing the RID list storage size.Without proper investigation, merely increasing the RID list storage sizemay not solve the problem.
SQL Activity Window
Use the SQL Activity window to view the number of executions of SQL statementsduring the processing of a DB2 application, for the monitored thread.
To display this window, select SQL Activity, Commits, and Rollbacks from theThread Detail panel.
┌──────────────────────────────────────────────────────────┐│ DGOMTWRP RID List Processing ││ ││ Successful . . . . . . . . . . . . . . . . . . : 0 ││ Not used - no storage . . . . . . . . . . . . : 0 ││ Not used - limit exceeded . . . . . . . . . . : 0 ││ ││ Command ===> __________________________________________ ││ F1=Help F2=Split F3=Exit F5=Auto ││ F6=History F9=Swap F12=Cancel F16=Look ││ F17=Collect F22=Purge │└──────────────────────────────────────────────────────────┘
Figure 54. RID List Processing Window (Thread Activity)
Thread Activity
96 DB2 PM Online Monitor User’s Guide

This information displays the number of times specific SQL statements wereexecuted for the thread being monitored.
┌────────────────────────────────────────────────────┐│ DGOMTWSQ SQL Activity ││ More: - + ││ Incremental bind . . . . . . . . . . : 0 ││ Reoptimization . . . . . . . . . . . : 0 ││ Prepare statement match . . . . . . . : 0 ││ Prepare statement no match . . . . . : 0 ││ Implicit prepare . . . . . . . . . . : 0 ││ Prepare from cache . . . . . . . . . : 0 ││ Cache limit exceeded . . . . . . . . : 0 ││ Prepare statement purged . . . . . . : 0 ││ Commit . . . . . . . . . . . . . . . : 0 ││ Rollback . . . . . . . . . . . . . . : 0 ││ Changes/Commit . . . . . . . . . . . : 0.0 ││ ││ Total DML . . . . . . . . . . . . . . : 108 ││ Select . . . . . . . . . . . . . . : 2 ││ Insert . . . . . . . . . . . . . . : 0 ││ Update . . . . . . . . . . . . . . : 0 ││ Delete . . . . . . . . . . . . . . : 0 ││ Prepare . . . . . . . . . . . . . . : 10 ││ Describe . . . . . . . . . . . . . : 0 ││ Describe table . . . . . . . . . . : 0 ││ Open . . . . . . . . . . . . . . . : 3 ││ Close . . . . . . . . . . . . . . . : 3 ││ Fetch . . . . . . . . . . . . . . . : 90 ││ ││ Total DCL . . . . . . . . . . . . . . : 4 ││ Lock table . . . . . . . . . . . . : 0 ││ Grant . . . . . . . . . . . . . . . : 4 ││ Revoke . . . . . . . . . . . . . . : 0 ││ Set SQLID . . . . . . . . . . . . . : 0 ││ Set host variable . . . . . . . . . : 0 ││ Set current degree . . . . . . . . : 0 ││ Connect type 1 . . . . . . . . . . : 0 ││ Connect type 2 . . . . . . . . . . : 0 ││ Set connection . . . . . . . . . . : 0 ││ Release . . . . . . . . . . . . . . : 0 ││ Set current rules . . . . . . . . . : 0 ││ SQL call . . . . . . . . . . . . . : 0 ││ Associate locators . . . . . . . . : 0 ││ Allocate cursor . . . . . . . . . . : 0 ││ ││ Total DDL . . . . . . . . . . . . . . : 5 ││ Rename table . . . . . . . . . . . : 0 ││ Comment on . . . . . . . . . . . . : 0 ││ Label on . . . . . . . . . . . . . : 0 ││ ││ Create Drop Alter ││ Table . . . . : 1 1 0 ││ Temp. Table . : 0 N/A N/A ││ Index . . . . : 0 0 0 ││ Tablespace . : 0 0 0 ││ Database . . : 0 0 0 ││ Stogroup . . : 0 0 0 ││ Synonym . . . : 0 0 N/A ││ View . . . . : 0 0 N/A ││ Alias . . . . : 3 0 N/A ││ Package . . . : N/A 0 N/A ││ ││ Command ===> _____________________________________ ││ F1=Help F2=Split F3=Exit F5=Auto ││ F6=History F7=Up F8=Down F9=Swap ││ F12=Cancel F16=Look F17=Collect F22=Purge │└────────────────────────────────────────────────────┘
Figure 55. SQL Activity Window (Thread Activity)
Thread Activity
Chapter 7. Displaying Thread Activity 97
The SQL Activity window consists of the following sections:
Total DMLThis section shows the number of executions performed by various SQLstatements concerning the manipulation of data.
Total DCLThis section shows the number of executions performed by various SQLstatements concerning the controlling of various activities.
Total DDLThis section shows a table containing the number of executions performedby various DDL SQL statements for each of the applicable object types.These SQL statements are used to create, drop, and alter objects.
If you are looking at a transaction and there are nonzero values for Describe,Describe Table, or Prepare, it is an indication that the transaction is involved indynamic SQL activity. However, this is unlikely and you may want to investigatefurther.
If you are looking at a transaction, it is unlikely that you would see any SQL DCL orSQL DDL activity. However, if there is any SQL DDL activity, be sure to usefrequent commits to minimize DB2 catalog contention.
The following list describes some of the important fields shown on this window, andhow to interpret the values contained in these fields.
Incremental bindThe number of incremental binds that took place.
If a plan is bound with VALIDATE(RUN), DB2 performs validity checks atbind time and rechecks any failures at run time. This can result in catalogcontention and degraded application performance, depending on thenumber of statements flagged and how many times they are executed.Avoid VALIDATE(RUN) as much as possible. Ensure that all objects arecreated and all privileges are granted before bind, and select theVALIDATE(BIND) option.
In addition to plans bound with VALIDATE(RUN), this counter isincremented for plans using DB2 private protocol.
ReoptimizationThe total number of times reoptimization of the access path for static anddynamic SQL queries occurred during execution time.
Reoptimization can be triggered by the option REOPT(VARS) for BIND andREBIND PLAN and PACKAGE. Reoptimization is intended for statementswith host variables, parameter markers, and special registers with accesspaths that are so inappropriate that the performance improvement of thereoptimized path outweighs the overhead caused by the reoptimization.
CommitThe number of commit phase 1, commit phase 2, read only commit andsingle phase commits (syncs) that completed successfully.
Changes/CommitThis ratio shows the inserts, updates, and deletes per commit and rollback.
This ratio is useful in monitoring the frequency of commits. Too manyupdates per commit means a long running unit of recovery, which degradesIRLM performance and may prolong recovery in case of a failure. Too few
Thread Activity
98 DB2 PM Online Monitor User’s Guide

updates per commit hampers performance, since log writes are involved. Ifnecessary, look into the application to establish commit points appropriately.
The commit frequency can vary between online transactions and batchjobs.
Buffer Manager Activity Window
Use the Buffer Manager Activity window to view all buffer pools used by the thread.
To display this window, select Buffer Manager Activity from the Thread Detail panel.
You can select any buffer pool ID listed on this window to display the Buffer PoolDetail window, where you can view information on read and write activity both toand from that particular buffer pool, or select Total to view information on all of thelisted buffer pools combined.
By examining buffer pool read and write activity, you can determine the buffer poolsizes for optimum system performance.
Buffer Pool Detail Window
Use the Buffer Pool Detail window to view information on the buffer pool selectedfrom the Buffer Manager Activity window. These statistics show read and writeactivity both to and from that buffer pool. If Total was selected from the BufferManager Activity window, this window displays the combined statistics of all thebuffer pools used by the thread.
To display this window, select a buffer pool ID or Total from the Buffer ManagerActivity window.
┌───────────────────────────────────────────────────────────────────────┐│ DGOMTWBM Buffer Manager Activity ROW 1 TO 4 OF 4 ││ ││ ││ For additional details, type any character next to Buffer Pool ID, ││ then press Enter. ││ ││ Buffer Pool Getpage Buffer Pool Synchronous Buffer Updates ││ ID Requests hit ratio Read I/O ││ _ BP0 111 75.7 0 50 ││ _ BP7 200 33.2 0 125 ││ _ BP32K7 311 47.3 0 25 ││ _ Total 622 47.8 0 200 ││ --- End of Buffer Pool List --- ││ ││ ││ ││ Command ===> ________________________________________________________ ││ F1=Help F2=Split F3=Exit F5=Auto F6=History ││ F7=Up F8=Down F9=Swap F12=Cancel F16=Look ││ F17=Collect F22=Purge │└───────────────────────────────────────────────────────────────────────┘
Figure 56. Buffer Manager Activity Window
Thread Activity
Chapter 7. Displaying Thread Activity 99
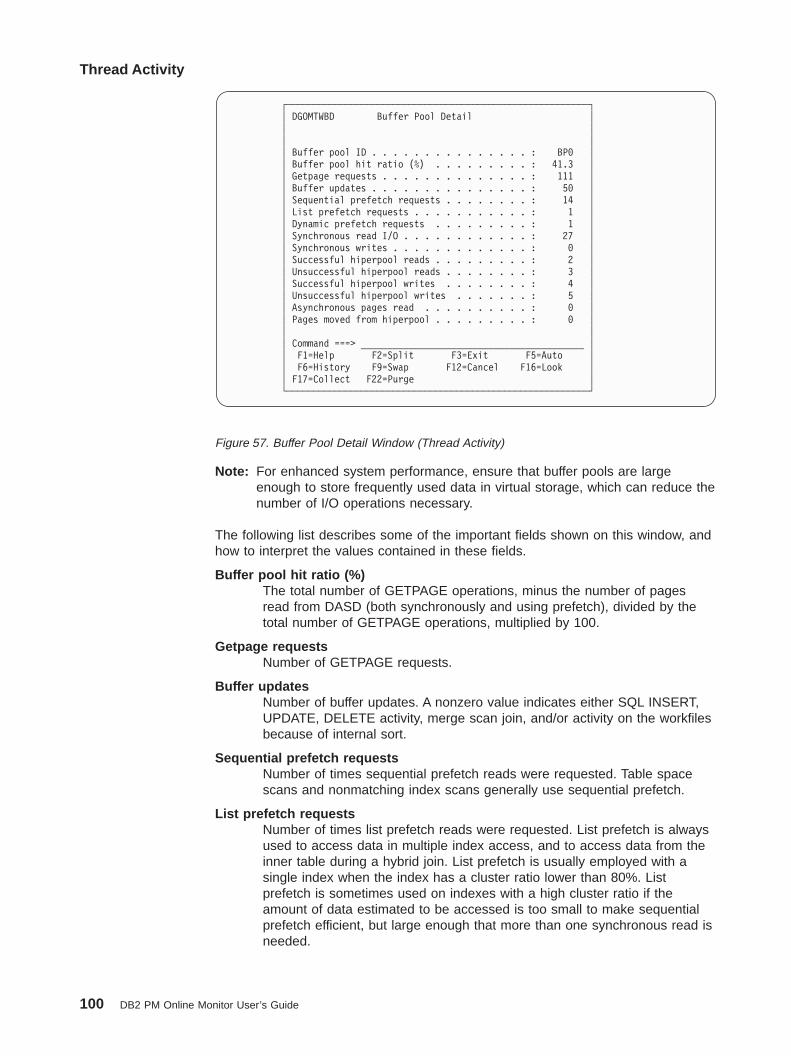
Note: For enhanced system performance, ensure that buffer pools are largeenough to store frequently used data in virtual storage, which can reduce thenumber of I/O operations necessary.
The following list describes some of the important fields shown on this window, andhow to interpret the values contained in these fields.
Buffer pool hit ratio (%)The total number of GETPAGE operations, minus the number of pagesread from DASD (both synchronously and using prefetch), divided by thetotal number of GETPAGE operations, multiplied by 100.
Getpage requestsNumber of GETPAGE requests.
Buffer updatesNumber of buffer updates. A nonzero value indicates either SQL INSERT,UPDATE, DELETE activity, merge scan join, and/or activity on the workfilesbecause of internal sort.
Sequential prefetch requestsNumber of times sequential prefetch reads were requested. Table spacescans and nonmatching index scans generally use sequential prefetch.
List prefetch requestsNumber of times list prefetch reads were requested. List prefetch is alwaysused to access data in multiple index access, and to access data from theinner table during a hybrid join. List prefetch is usually employed with asingle index when the index has a cluster ratio lower than 80%. Listprefetch is sometimes used on indexes with a high cluster ratio if theamount of data estimated to be accessed is too small to make sequentialprefetch efficient, but large enough that more than one synchronous read isneeded.
┌─────────────────────────────────────────────────────────┐│ DGOMTWBD Buffer Pool Detail ││ ││ ││ Buffer pool ID . . . . . . . . . . . . . . . : BP0 ││ Buffer pool hit ratio (%) . . . . . . . . . : 41.3 ││ Getpage requests . . . . . . . . . . . . . . : 111 ││ Buffer updates . . . . . . . . . . . . . . . : 50 ││ Sequential prefetch requests . . . . . . . . : 14 ││ List prefetch requests . . . . . . . . . . . : 1 ││ Dynamic prefetch requests . . . . . . . . . : 1 ││ Synchronous read I/O . . . . . . . . . . . . : 27 ││ Synchronous writes . . . . . . . . . . . . . : 0 ││ Successful hiperpool reads . . . . . . . . . : 2 ││ Unsuccessful hiperpool reads . . . . . . . . : 3 ││ Successful hiperpool writes . . . . . . . . : 4 ││ Unsuccessful hiperpool writes . . . . . . . : 5 ││ Asynchronous pages read . . . . . . . . . . : 0 ││ Pages moved from hiperpool . . . . . . . . . : 0 ││ ││ Command ===> __________________________________________ ││ F1=Help F2=Split F3=Exit F5=Auto ││ F6=History F9=Swap F12=Cancel F16=Look ││ F17=Collect F22=Purge │└─────────────────────────────────────────────────────────┘
Figure 57. Buffer Pool Detail Window (Thread Activity)
Thread Activity
100 DB2 PM Online Monitor User’s Guide

Dynamic prefetch requestsNumber of times dynamic prefetch reads were requested. Dynamic prefetchis typically used for a SELECT or UPDATE that is run repeatedly, accessingthe index for each access.
Synchronous read I/ONumber of synchronous read I/O operations.
Synchronous writesTotal number of immediate writes for a page. Although an immediate writeshould be rare, a small nonzero value is always expected. A large valueindicates that the system needs tuning.
SQL Statement and Package Window
Use the SQL Statement and Package window to view information about the currentSQL statement being executed or the last SQL statement that was executed, by thethread. For the last SQL statement executed, it is shown whether it is currentlyexecuting or has ended.
To display this window, select SQL Statement from the Thread Detail panel. One oftwo possible windows is displayed depending on whether the thread is using apackage or a DBRM. Only the SQL Statement and Package window is shown herein this section.
The SQL statement is displayed regardless of whether the agent is currentlyexecuting in DB2.
The SQL statement is displayed only if you have MONITOR2 or SYSADM privilege.If the SQL statement text is long, you can use the scrolling keys F7 (Up) and F8(Down) to browse the text.
Note: The maximum number of bytes on the SQL statement text that can beviewed is 2 KB. Any text exceeding this limit is not fully displayed. If the
┌─────────────────────────────────────────────────────────────────────────┐│ DGOMTWCS SQL Statement and Package ROW 1 TO 1 OF 1 ││ ││ Location . . . . . . . . . . . . . : PMO1DLOC ││ Collection ID . . . . . . . . . . : DSNESPCS ││ Program Name . . . . . . . . . . . : DSNESM68 ││ Consistency Token . . . . . . . . : X'128C2637049FB9B0 ││ Version ││ VER 6 ││ ││ Stored procedure . . . . . . . . . : STOREPROCEDURE0001 ││ Statement type . . . . . . . . . . : CLOSE ││ Statement number . . . . . . . . . : 137 ││ Thread status . . . . . . . . . . : In application ││ ││ SQL Statement ││ SELECT * FROM SYSIBM.SYSTABLES ││ *************************** BOTTOM OF DATA **************************** ││ ││ Command ===> __________________________________________________________ ││ F1=Help F2=Split F3=Exit F5=Auto F6=History F7=Up ││ F8=Down F9=Swap F12=Cancel F16=Look F17=Collect F18=Explain ││ F22=Purge │└─────────────────────────────────────────────────────────────────────────┘
Figure 58. SQL Statement and Package Window
Thread Activity
Chapter 7. Displaying Thread Activity 101
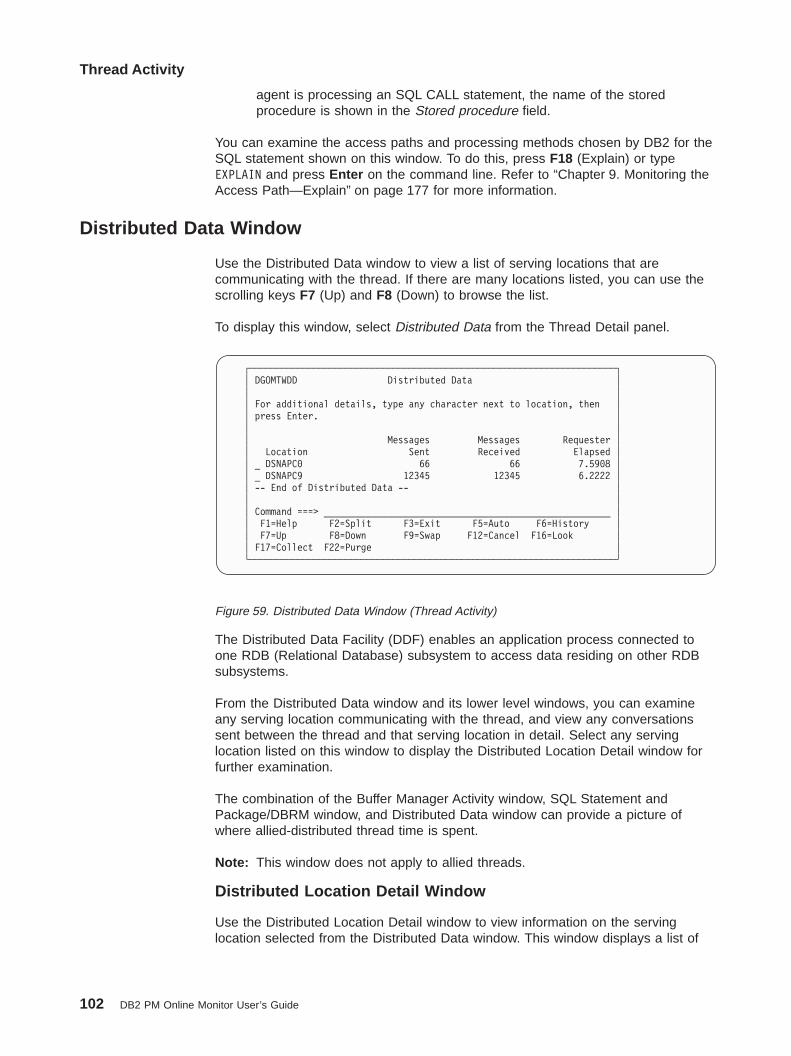
agent is processing an SQL CALL statement, the name of the storedprocedure is shown in the Stored procedure field.
You can examine the access paths and processing methods chosen by DB2 for theSQL statement shown on this window. To do this, press F18 (Explain) or typeEXPLAIN and press Enter on the command line. Refer to “Chapter 9. Monitoring theAccess Path—Explain” on page 177 for more information.
Distributed Data Window
Use the Distributed Data window to view a list of serving locations that arecommunicating with the thread. If there are many locations listed, you can use thescrolling keys F7 (Up) and F8 (Down) to browse the list.
To display this window, select Distributed Data from the Thread Detail panel.
The Distributed Data Facility (DDF) enables an application process connected toone RDB (Relational Database) subsystem to access data residing on other RDBsubsystems.
From the Distributed Data window and its lower level windows, you can examineany serving location communicating with the thread, and view any conversationssent between the thread and that serving location in detail. Select any servinglocation listed on this window to display the Distributed Location Detail window forfurther examination.
The combination of the Buffer Manager Activity window, SQL Statement andPackage/DBRM window, and Distributed Data window can provide a picture ofwhere allied-distributed thread time is spent.
Note: This window does not apply to allied threads.
Distributed Location Detail Window
Use the Distributed Location Detail window to view information on the servinglocation selected from the Distributed Data window. This window displays a list of
┌─────────────────────────────────────────────────────────────────────┐│ DGOMTWDD Distributed Data ││ ││ For additional details, type any character next to location, then ││ press Enter. ││ ││ Messages Messages Requester ││ Location Sent Received Elapsed ││ _ DSNAPC0 66 66 7.5908 ││ _ DSNAPC9 12345 12345 6.2222 ││ -- End of Distributed Data -- ││ ││ Command ===> ______________________________________________________ ││ F1=Help F2=Split F3=Exit F5=Auto F6=History ││ F7=Up F8=Down F9=Swap F12=Cancel F16=Look ││ F17=Collect F22=Purge │└─────────────────────────────────────────────────────────────────────┘
Figure 59. Distributed Data Window (Thread Activity)
Thread Activity
102 DB2 PM Online Monitor User’s Guide

conversations between the thread and this serving location. If there are manyconversations listed, you can use the scrolling keys F7 (Up) and F8 (Down) tobrowse the list.
To display this window, select any serving location listed on the Distributed Datawindow.
From this window you can select any conversation listed to display the DistributedConversation Detail window, where the conversation can be examined in greaterdetail.
The following list describes some of the important fields shown on this window, andhow to interpret the values contained in these fields.
Requester elapsedThis field shows the amount of elapsed time spent at the requester betweenthe sending of the SQL statement and the receipt of the answer from theserver. This includes the processing time in DB2, VTAM, and the network.
If this value is large, it could indicate block fetch may not have been used.
Messages ReceivedThis field shows the count of the messages the requester location receivedfrom the server location.
More messages might be sent from the server location than are received bythe requester location due to the manner in which distributed SQLstatements are processed internally.
Remote ElapsedThis field shows the amount of elapsed time spent at the server betweenthe actual receipt of the SQL statement and until the answer is sent toVTAM.
This is not applicable to DRDA(R) protocol
┌─────────────────────────────────────────────────────────────────────────────┐│ DGOMTWDL Distributed Location Detail ROW 1 TO 2 OF 2 ││ ││ For additional details, place any character next to conversation, then ││ press Enter. ││ ││ Remote Location . . . . . . . . . . : DSNAPC0 ││ Product ID . . . . . . . . . . . . . : DB2 ││ Product Version . . . . . . . . . . : V6 R1 M0 ││ Requester elapsed . . . . . . . . . : 7.5908 ││ Messages Sent . . . . . . . : 66 Remote Elapsed . . . . . : 3.4373 ││ Messages Received . . . . . : 66 Remote CPU . . . . . . . : 0.0731 ││ ││ ------ Conversation ------- Time of ││ State Type last message ││ _ SEND APPL-DIR 03:27:51.15 ││ _ ALLOC SYST-DIR 02:37:52.12 ││ -- End of Distributed Data -- ││ ││ Command ===> ______________________________________________________________ ││ F1=Help F2=Split F3=Exit F5=Auto F6=History F7=Up ││ F8=Down F9=Swap F12=Cancel F16=Look F17=Collect F22=Purge │└─────────────────────────────────────────────────────────────────────────────┘
Figure 60. Distributed Location Detail Window
Thread Activity
Chapter 7. Displaying Thread Activity 103
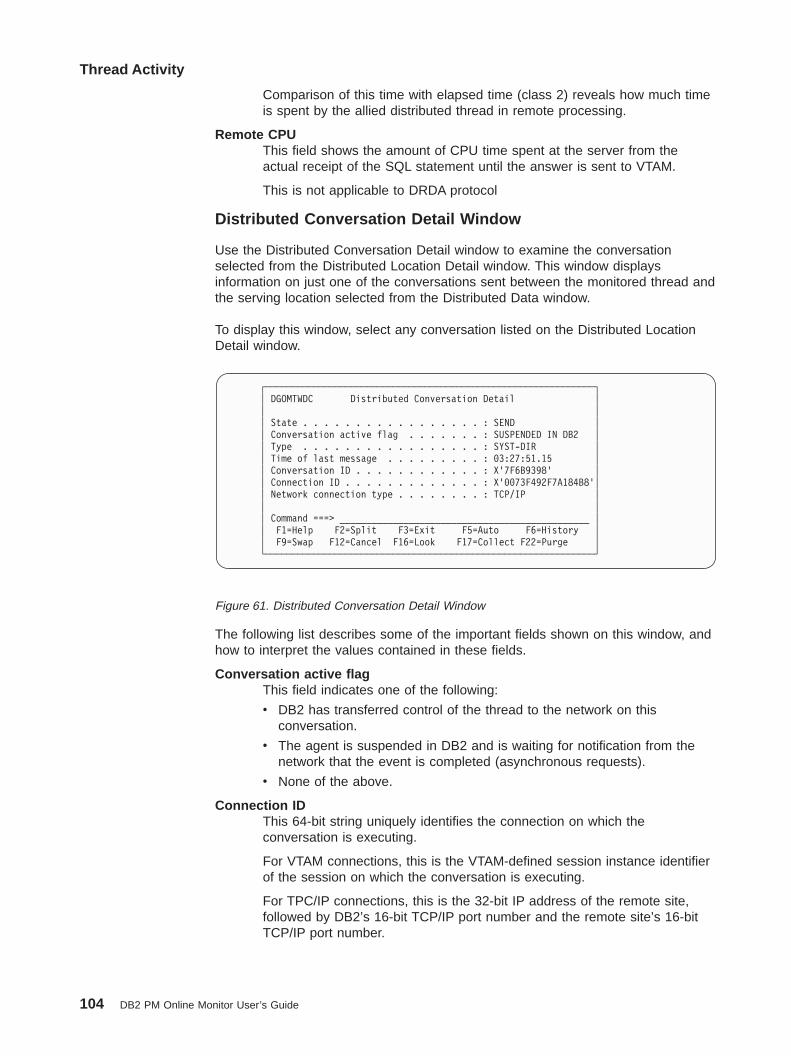
Comparison of this time with elapsed time (class 2) reveals how much timeis spent by the allied distributed thread in remote processing.
Remote CPUThis field shows the amount of CPU time spent at the server from theactual receipt of the SQL statement until the answer is sent to VTAM.
This is not applicable to DRDA protocol
Distributed Conversation Detail Window
Use the Distributed Conversation Detail window to examine the conversationselected from the Distributed Location Detail window. This window displaysinformation on just one of the conversations sent between the monitored thread andthe serving location selected from the Distributed Data window.
To display this window, select any conversation listed on the Distributed LocationDetail window.
The following list describes some of the important fields shown on this window, andhow to interpret the values contained in these fields.
Conversation active flagThis field indicates one of the following:
v DB2 has transferred control of the thread to the network on thisconversation.
v The agent is suspended in DB2 and is waiting for notification from thenetwork that the event is completed (asynchronous requests).
v None of the above.
Connection IDThis 64-bit string uniquely identifies the connection on which theconversation is executing.
For VTAM connections, this is the VTAM-defined session instance identifierof the session on which the conversation is executing.
For TPC/IP connections, this is the 32-bit IP address of the remote site,followed by DB2’s 16-bit TCP/IP port number and the remote site’s 16-bitTCP/IP port number.
┌──────────────────────────────────────────────────────────────┐│ DGOMTWDC Distributed Conversation Detail ││ ││ State . . . . . . . . . . . . . . . . . : SEND ││ Conversation active flag . . . . . . . : SUSPENDED IN DB2 ││ Type . . . . . . . . . . . . . . . . . : SYST-DIR ││ Time of last message . . . . . . . . . : 03:27:51.15 ││ Conversation ID . . . . . . . . . . . . : X'7F6B9398' ││ Connection ID . . . . . . . . . . . . . : X'0073F492F7A184B8'││ Network connection type . . . . . . . . : TCP/IP ││ ││ Command ===> _______________________________________________ ││ F1=Help F2=Split F3=Exit F5=Auto F6=History ││ F9=Swap F12=Cancel F16=Look F17=Collect F22=Purge │└──────────────────────────────────────────────────────────────┘
Figure 61. Distributed Conversation Detail Window
Thread Activity
104 DB2 PM Online Monitor User’s Guide

Network connection typeThis field indicates which type of network connection is used, TCP/IP orVTAM.
IFI (Class 5) and Data Capture Window
Use the IFI (Class 5) and Data Capture window to view the number of IFI callsmade, the CPU time spent processing these calls, and to examine statistics on datacapture activity for the thread.
To display this window, select IFI (Class 5) and Data Capture from the ThreadDetail panel.
┌────────────────────────────────────────────────────────────────┐│ DGOMTWCD IFI (Class 5) and Data Capture ││ ││ Elapsed time . . . . . . . . . . . . . . . . : 11.3441 ││ TCB time . . . . . . . . . . . . . . . . . . : 7.8120 ││ Describe time . . . . . . . . . . . . . . . . : 3.9182 ││ Log extraction time . . . . . . . . . . . . . : 1.2334 ││ ││ IFI calls . . . . . . . . . . . . . . . . . . : 3 ││ Log reads performed . . . . . . . . . . . . : 1 ││ Log records captured . . . . . . . . . . . . : 15 ││ Log records returned . . . . . . . . . . . . : 11 ││ Data rows returned . . . . . . . . . . . . . : 79 ││ Data descriptions returned . . . . . . . . . : 2 ││ Describes performed . . . . . . . . . . . . . : 2 ││ Tables returned . . . . . . . . . . . . . . . : 2 ││ ││ Command ===> _________________________________________________ ││ F1=Help F2=Split F3=Exit F5=Auto ││ F6=History F9=Swap F12=Cancel F16=Look ││ F17=Collect F22=Purge │└────────────────────────────────────────────────────────────────┘
Figure 62. IFI (Class 5) and Data Capture Window
Thread Activity
Chapter 7. Displaying Thread Activity 105

Query Parallelism Data Window
Use the Query Parallelism Data window to view information on the number ofparallel groups executed for the thread and to find out whether the type or degreeof parallelism was changed at run time.
To display this window, select Query Parallelism Data from the Thread Detail panel.
The main objective of query parallelism is to improve query response times.
By examining the information displayed on this window, you can discover thenumber of parallel groups that have fallen back to sequential mode and determinethe cause.
The following list describes some of the important fields shown on this window, andhow to interpret the values contained in these fields.
Maximum Degree of ParallelismMaximum degree of parallelism executed among all the parallel groups.This field indicates the extent to which query parallelism applies.
The degree can be set on the BIND and REBIND commands or the SETCURRENT DEGREE statement. The default is set by the CURRENTDEGREE installation parameter. If a query is I/O bound, I/O parallelism canhelp reduce the response time. If a query is CPU bound, query CPparallelism can reduce the response time. If both conditions apply, thebenefits for the query can be very large.
Parallel Groups ExecutedTotal number of parallel groups that have been executed.
┌───────────────────────────────────────────────────────────────────┐│ DGOMTWQP Query Parallelism Data ││ ││ Maximum Degree of Parallelism . . . . . . . . . . . . : 5 ││ ││ Parallel Groups Executed . . . . . . . . . . . . . . : 1 ││ ││ Number of Parallel Groups executed with ││ Planned Parallel Degree . . . . . . . . . . . . . . : 1 ││ Reduced Parallel Degree ││ No buffer . . . . . . . . . . . . . . . . . . . . : 0 ││ One DB2 ││ COORDINATOR Parm = NO . . . . . . . . . . . . . . : 0 ││ Isolation Level . . . . . . . . . . . . . . . . . : 0 ││ Fall back to sequential mode ││ Cursor . . . . . . . . . . . . . . . . . . . . . : 0 ││ No ESA . . . . . . . . . . . . . . . . . . . . . : 0 ││ No buffer . . . . . . . . . . . . . . . . . . . . : 0 ││ MVS/ESA Enclave Services. . . . . . . . . . . . . : 0 ││ ││ Member skipped (%) . . . . . . . . . . . . . . . . . : 0 ││ ││ Parallelism Disabled by RLF . . . . . . . . . . . . . : NO ││ Command ===> ____________________________________________________ ││ F1=Help F2=Split F3=Exit F5=Auto F6=History ││ F9=Swap F12=Cancel F16=Look F17=Collect F22=Purge │└───────────────────────────────────────────────────────────────────┘
Figure 63. Query Parallelism Data Window (Thread Activity)
Thread Activity
106 DB2 PM Online Monitor User’s Guide
Planned Parallel DegreeTotal number of parallel groups that executed to the planned paralleldegree. This field is incremented by one for each parallel group thatexecuted with the planned degree of parallelism (as determined by DB2).
Reduced Parallel Degree - No bufferTotal number of parallel groups that processed to a parallel degree lessthan planned because of a storage shortage or contention on the bufferpool. If this field is not zero, increase the size of the current buffer pool byusing the ALTER BUFFERPOOL command, or use the ALTERTABLESPACE statement to assign table spaces accessed by this query toa different buffer pool.
One DB2 COORDINATOR Parm = NOThe total number of parallel groups scheduled for Sysplex queryparallelism, but executed on a single DB2 due to the COORDINATORsubsystem value being set to NO. When the statement was bound, theCOORDINATOR subsystem value was set to YES. This situation can alsooccur when a package or plan is bound on a DB2 subsystem withCOORDINATOR=YES, but is run on a DB2 subsystem withCOORDINATOR=NO.
One DB2 Isolation LevelThe total number of parallel groups scheduled for Sysplex queryparallelism, but executed on a single DB2 due to repeatable-read orread-stability isolation.
CursorTotal number of parallel groups that fall back to sequential operationbecause of a cursor that can be used for update or delete.
No ESATotal number of parallel groups that fall back to sequential operationbecause of a lack of MVS/ESA sort support.
No bufferTotal number of parallel groups which fall back to sequential mode becauseof storage shortage or contention on the buffer pool.
Member skipped (%)The percentage of Sysplex parallel groups that were not distributed asplanned.
This field indicates situations where a member has insufficient buffers andso the parallelism coordinator has to bypass a DB2 when distributing tasks.
Parallelism Disabled by RLFThis field indicates whether parallelism was disabled by RLF governing fordynamic SQL statements of this thread.
Thread Activity
Chapter 7. Displaying Thread Activity 107

Query Parallelism ConsiderationsQuery parallelism is suited to both data-intensive and complex queries. Aquery is data-intensive if it has a high ratio of I/O compared to CPU andcomplex if it requires a high use of CPU to resolve complex predicates andfunctions.
In general queries are suited to query parallelism when the following apply:
v Partitioned tablespace
v Fast n-way processor
v Adequate buffer space to cater for multiple parallel tasks
v Dedicated environment.
Query I/O parallelism works best when there is:
v High ratio of I/O time to CPU time– Large record size– Very large tables– Query which scans many rows but returns few– Tablespace scan rather than index scan.
Query CP processing works best when there is:
v High ratio of CPU time to I/O time– Complex or many predicates– Complex many level subqueries– Column and scalar functions– Multi-way joins– Grouping and ordering clauses– Type 2 Index access and tablespace scans.
Thread Activity
108 DB2 PM Online Monitor User’s Guide
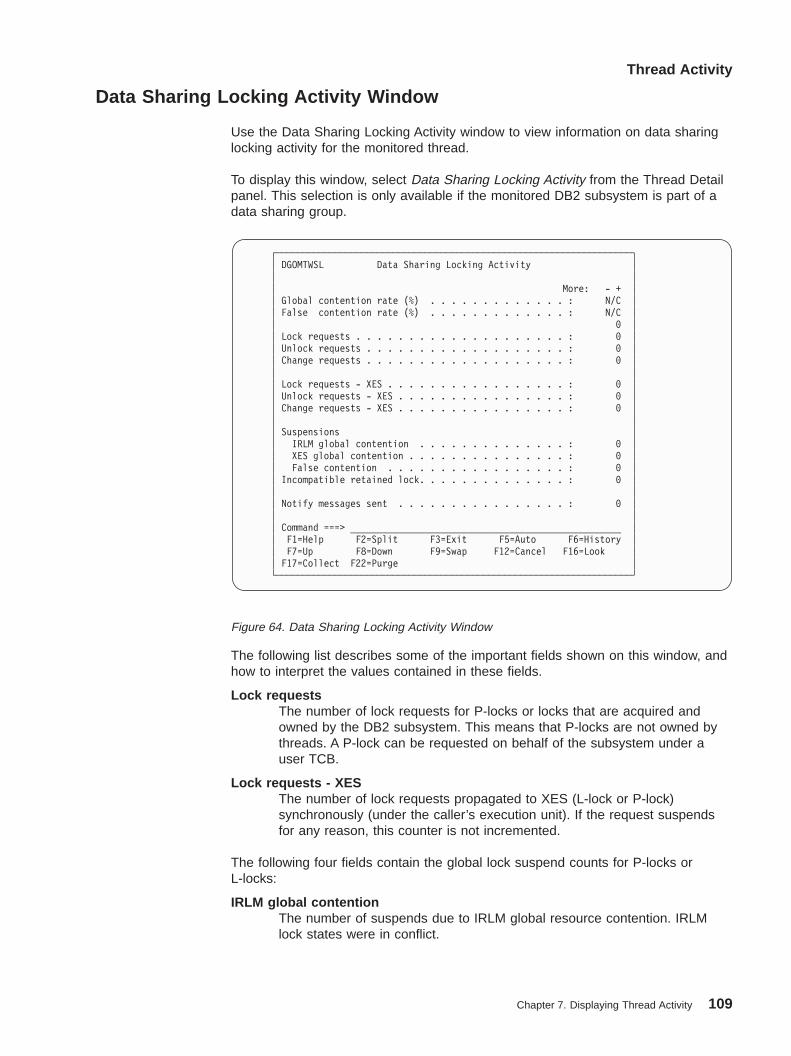
Data Sharing Locking Activity Window
Use the Data Sharing Locking Activity window to view information on data sharinglocking activity for the monitored thread.
To display this window, select Data Sharing Locking Activity from the Thread Detailpanel. This selection is only available if the monitored DB2 subsystem is part of adata sharing group.
The following list describes some of the important fields shown on this window, andhow to interpret the values contained in these fields.
Lock requestsThe number of lock requests for P-locks or locks that are acquired andowned by the DB2 subsystem. This means that P-locks are not owned bythreads. A P-lock can be requested on behalf of the subsystem under auser TCB.
Lock requests - XESThe number of lock requests propagated to XES (L-lock or P-lock)synchronously (under the caller’s execution unit). If the request suspendsfor any reason, this counter is not incremented.
The following four fields contain the global lock suspend counts for P-locks orL-locks:
IRLM global contentionThe number of suspends due to IRLM global resource contention. IRLMlock states were in conflict.
┌───────────────────────────────────────────────────────────────────┐│ DGOMTWSL Data Sharing Locking Activity ││ ││ More: - + ││ Global contention rate (%) . . . . . . . . . . . . . : N/C ││ False contention rate (%) . . . . . . . . . . . . . : N/C ││ 0 ││ Lock requests . . . . . . . . . . . . . . . . . . . . : 0 ││ Unlock requests . . . . . . . . . . . . . . . . . . . : 0 ││ Change requests . . . . . . . . . . . . . . . . . . . : 0 ││ ││ Lock requests - XES . . . . . . . . . . . . . . . . . : 0 ││ Unlock requests - XES . . . . . . . . . . . . . . . . : 0 ││ Change requests - XES . . . . . . . . . . . . . . . . : 0 ││ ││ Suspensions ││ IRLM global contention . . . . . . . . . . . . . . : 0 ││ XES global contention . . . . . . . . . . . . . . . : 0 ││ False contention . . . . . . . . . . . . . . . . . : 0 ││ Incompatible retained lock. . . . . . . . . . . . . . : 0 ││ ││ Notify messages sent . . . . . . . . . . . . . . . . : 0 ││ ││ Command ===> ___________________________________________________ ││ F1=Help F2=Split F3=Exit F5=Auto F6=History ││ F7=Up F8=Down F9=Swap F12=Cancel F16=Look ││ F17=Collect F22=Purge │└───────────────────────────────────────────────────────────────────┘
Figure 64. Data Sharing Locking Activity Window
Thread Activity
Chapter 7. Displaying Thread Activity 109

XES global contentionThe number of suspends due to XES global resource contention, but noIRLM global resource contention. XES lock states were in conflict, but theIRLM lock states were not.
False contentionThe number of false contentions. A false contention occurs when differentresource names hash to the same entry in the XES lock table. XES detectsa hash contention, but there is no actual resource contention.
Incompatible retained lockThe number of global lock or change requests denied or suspended due toan incompatible retained lock.
Group Buffer Pools Activity Window
Use the Group Buffer Pools Activity window to view all group buffer pools used bythe thread. If there are many group buffer pools listed, you can use the scrollingkeys F7 (Up) and F8 (Down) to browse the list.
To display this window, select Group Buffer Pools Activity from the Thread Detailpanel. This selection is only available if the monitored DB2 subsystem is part of adata sharing group.
You can select any group buffer pool ID listed on this window to display the GroupBuffer Pool Detail window, where you can view information on read and writeactivity both to and from that particular group buffer pool, or select Total to viewread and write activity on all of the listed group buffer pools combined.
Group Buffer Pool Detail Window
Use the Group Buffer Pool Detail window to view information on the group bufferpool selected from the Group Buffer Pools Activity window. These statistics showread and write activity both to and from that buffer pool. If Total was selected from
┌───────────────────────────────────────────────────────────────────────┐│ DGOMTWGB Group Buffer Pools Activity 1 TO 4 OF 4 ││ ││ ││ For additional details, type any character next to Group Buffer Pool ││ ID, then press Enter. ││ ││ Group Buffer ------------- Read (XI) ------------------- ││ Pool ID Data Returned No Data Returned ││ _ GBP0 15 0 ││ _ GBP2 6 0 ││ _ GBP32K7 3 0 ││ _ TOTAL 24 0 ││ -- End of Group buffer list -- ││ ││ ││ ││ ││ ││ Command ===> ________________________________________________________ ││ F1=Help F2=Split F3=Exit F5=Auto F6=History ││ F7=Up F8=Down F9=Swap F12=Cancel F16=Look ││ F17=Collect F22=Purge │└───────────────────────────────────────────────────────────────────────┘
Figure 65. Group Buffer Pools Activity Window
Thread Activity
110 DB2 PM Online Monitor User’s Guide
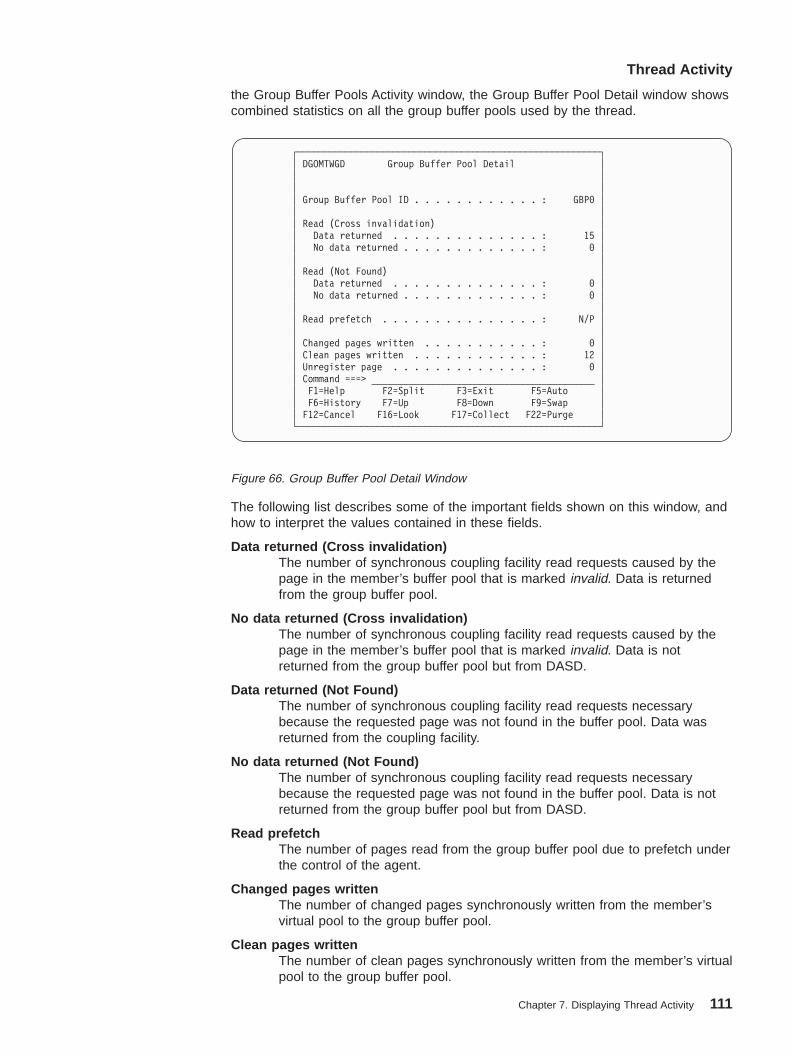
the Group Buffer Pools Activity window, the Group Buffer Pool Detail window showscombined statistics on all the group buffer pools used by the thread.
The following list describes some of the important fields shown on this window, andhow to interpret the values contained in these fields.
Data returned (Cross invalidation)The number of synchronous coupling facility read requests caused by thepage in the member’s buffer pool that is marked invalid. Data is returnedfrom the group buffer pool.
No data returned (Cross invalidation)The number of synchronous coupling facility read requests caused by thepage in the member’s buffer pool that is marked invalid. Data is notreturned from the group buffer pool but from DASD.
Data returned (Not Found)The number of synchronous coupling facility read requests necessarybecause the requested page was not found in the buffer pool. Data wasreturned from the coupling facility.
No data returned (Not Found)The number of synchronous coupling facility read requests necessarybecause the requested page was not found in the buffer pool. Data is notreturned from the group buffer pool but from DASD.
Read prefetchThe number of pages read from the group buffer pool due to prefetch underthe control of the agent.
Changed pages writtenThe number of changed pages synchronously written from the member’svirtual pool to the group buffer pool.
Clean pages writtenThe number of clean pages synchronously written from the member’s virtualpool to the group buffer pool.
┌─────────────────────────────────────────────────────────┐│ DGOMTWGD Group Buffer Pool Detail ││ ││ ││ Group Buffer Pool ID . . . . . . . . . . . . : GBP0 ││ ││ Read (Cross invalidation) ││ Data returned . . . . . . . . . . . . . . : 15 ││ No data returned . . . . . . . . . . . . . : 0 ││ ││ Read (Not Found) ││ Data returned . . . . . . . . . . . . . . : 0 ││ No data returned . . . . . . . . . . . . . : 0 ││ ││ Read prefetch . . . . . . . . . . . . . . . : N/P ││ ││ Changed pages written . . . . . . . . . . . : 0 ││ Clean pages written . . . . . . . . . . . . : 12 ││ Unregister page . . . . . . . . . . . . . . : 0 ││ Command ===> __________________________________________ ││ F1=Help F2=Split F3=Exit F5=Auto ││ F6=History F7=Up F8=Down F9=Swap ││ F12=Cancel F16=Look F17=Collect F22=Purge │└─────────────────────────────────────────────────────────┘
Figure 66. Group Buffer Pool Detail Window
Thread Activity
Chapter 7. Displaying Thread Activity 111

Unregister pageThe number of coupling facility requests to unregister a page.
Stored Procedures Window
Use the Stored Procedures window to view the stored procedures activity for thethread being monitored.
To display this window, select Stored Procedures from the Thread Detail panel.
CALL statements executedTotal number of SQL CALL statements that were executed for the currentthread.
Procedure abendsThe number of times a stored procedure terminated abnormally.
CALL statement timeoutsThe number of times an SQL CALL statement timed out while waiting to bescheduled.
CALL statements rejectedThe number of times an SQL CALL statement was rejected due to theprocedure being in the STOP ACTION(REJECT) state.
Thread Activity Commands
The following commands apply to thread activity panels. Commands are typed on apanel command line. Some commands are assigned to function keys. A list ofactive function keys is displayed at the bottom of each panel.
You can abbreviate commands down to three characters in length. For example, theAUTO command can be abbreviated to AUT.
AUTO Command
Use the AUTO command to refresh values displayed on panels without having topress Enter . When you activate auto-display mode, the displayed values areupdated periodically, as specified by the AUTO command. You cannot perform anyother tasks with your Online Monitor session while auto display-mode is running.
┌───────────────────────────────────────────────────────────────────┐│ DGOMTWSP Stored Procedures ││ ││ CALL statements executed . . . . . . . . . . . . . . : 0 ││ Procedure abends . . . . . . . . . . . . . . . . . . : 0 ││ CALL statement timeouts . . . . . . . . . . . . . . . : 0 ││ CALL statements rejected . . . . . . . . . . . . . . : 0 ││ ││ ││ Command ===> ___________________________________________________ ││ F1=Help F2=Split F3=Exit F5=Auto F6=History ││ F9=Swap F12=Cancel F16=Look F17=Collect F22=Purge │└───────────────────────────────────────────────────────────────────┘
Figure 67. Stored Procedures Window
Thread Activity
112 DB2 PM Online Monitor User’s Guide
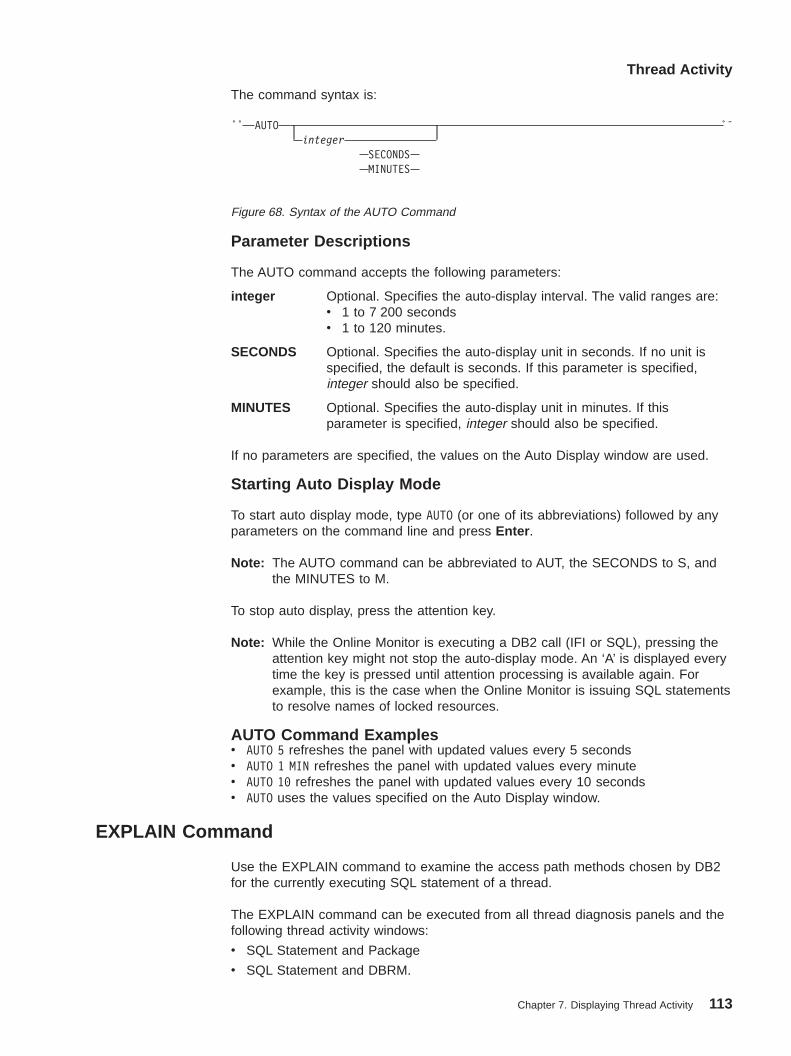
The command syntax is:
Parameter Descriptions
The AUTO command accepts the following parameters:
integer Optional. Specifies the auto-display interval. The valid ranges are:v 1 to 7 200 secondsv 1 to 120 minutes.
SECONDS Optional. Specifies the auto-display unit in seconds. If no unit isspecified, the default is seconds. If this parameter is specified,integer should also be specified.
MINUTES Optional. Specifies the auto-display unit in minutes. If thisparameter is specified, integer should also be specified.
If no parameters are specified, the values on the Auto Display window are used.
Starting Auto Display Mode
To start auto display mode, type AUTO (or one of its abbreviations) followed by anyparameters on the command line and press Enter .
Note: The AUTO command can be abbreviated to AUT, the SECONDS to S, andthe MINUTES to M.
To stop auto display, press the attention key.
Note: While the Online Monitor is executing a DB2 call (IFI or SQL), pressing theattention key might not stop the auto-display mode. An ‘A’ is displayed everytime the key is pressed until attention processing is available again. Forexample, this is the case when the Online Monitor is issuing SQL statementsto resolve names of locked resources.
AUTO Command Examplesv AUTO 5 refreshes the panel with updated values every 5 secondsv AUTO 1 MIN refreshes the panel with updated values every minutev AUTO 10 refreshes the panel with updated values every 10 secondsv AUTO uses the values specified on the Auto Display window.
EXPLAIN Command
Use the EXPLAIN command to examine the access path methods chosen by DB2for the currently executing SQL statement of a thread.
The EXPLAIN command can be executed from all thread diagnosis panels and thefollowing thread activity windows:
v SQL Statement and Package
v SQL Statement and DBRM.
ÊÊ AUTOinteger
SECONDSMINUTES
ÊÍ
Figure 68. Syntax of the AUTO Command
Thread Activity
Chapter 7. Displaying Thread Activity 113

Note: The EXPLAIN command can also be executed from the Thread Detail panelif it has been tailored to show the SQL statement text.
The command syntax is:
Invoking Explain
To examine the access path methods chosen by DB2 for an SQL statement shownon a thread activity panel, type EXPLAIN (or one of its abbreviations) on thecommand line and press Enter .
Note: The EXPLAIN command can be used in any truncated form beginning with aminimum of EXP.
For more information on how to explain an SQL statement, refer to “Chapter 9.Monitoring the Access Path—Explain” on page 177.
HISTORY Command
Use the HISTORY command to view past data that was previously collected by thedata collector. The data is gathered at installation-defined intervals. The date andtime on the panels supporting history indicate when the data being displayed wascollected.
You can only view past data if the data collector is active for the subsystem you aremonitoring and if it was started with the parameter HISTORY=YES. Refer to“Chapter 14. Data Collector Purpose and Function” on page 233 for informationabout the data collector.
The command syntax is:
Note that the defined ISPF national format is used for the date and time format.
Parameter Descriptions
The HISTORY command accepts the following parameters:
OFF Returns the display to the current time.
BACK Displays data for the previous interval. If no more data is available,data from the earliest available interval is displayed.
FORWARD Displays information for the next available interval. If there are no
ÊÊ EXPLAIN ÊÍ
Figure 69. Syntax of the EXPLAIN Command
ÊÊ HISTORYOFFBACKFORWARD
date hh:mm:ss
ÊÍ
Figure 70. Syntax of the HISTORY Command
Thread Activity
114 DB2 PM Online Monitor User’s Guide
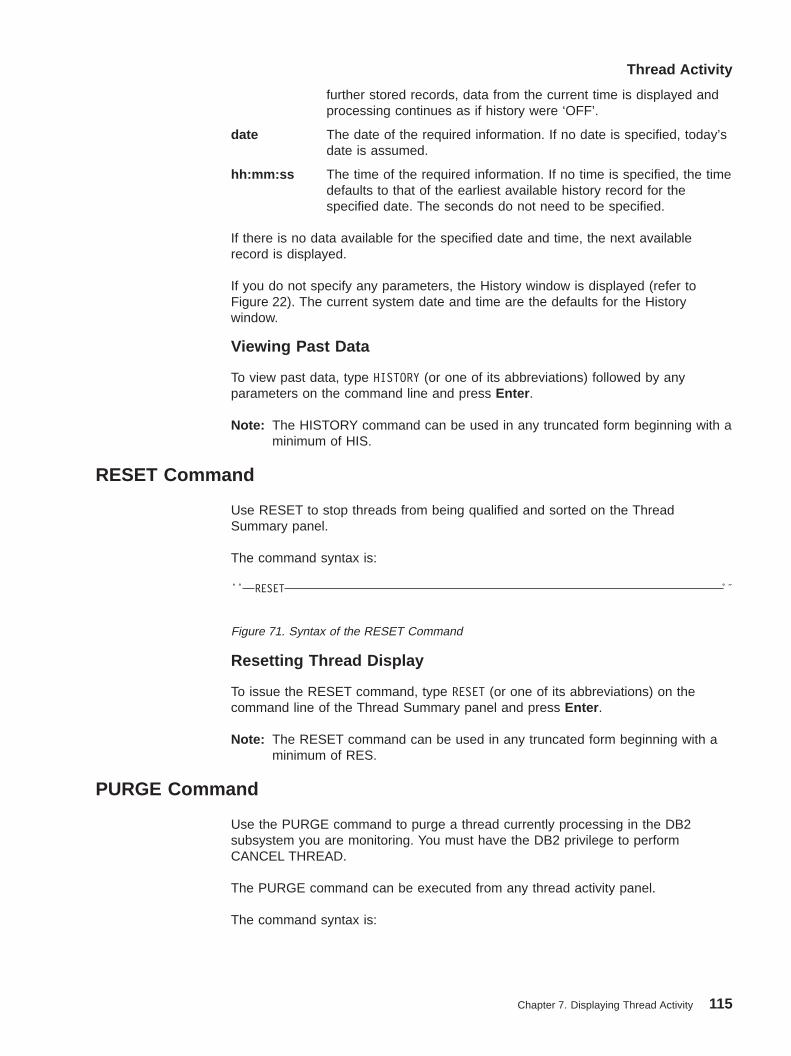
further stored records, data from the current time is displayed andprocessing continues as if history were ‘OFF’.
date The date of the required information. If no date is specified, today’sdate is assumed.
hh:mm:ss The time of the required information. If no time is specified, the timedefaults to that of the earliest available history record for thespecified date. The seconds do not need to be specified.
If there is no data available for the specified date and time, the next availablerecord is displayed.
If you do not specify any parameters, the History window is displayed (refer toFigure 22). The current system date and time are the defaults for the Historywindow.
Viewing Past Data
To view past data, type HISTORY (or one of its abbreviations) followed by anyparameters on the command line and press Enter .
Note: The HISTORY command can be used in any truncated form beginning with aminimum of HIS.
RESET Command
Use RESET to stop threads from being qualified and sorted on the ThreadSummary panel.
The command syntax is:
Resetting Thread Display
To issue the RESET command, type RESET (or one of its abbreviations) on thecommand line of the Thread Summary panel and press Enter .
Note: The RESET command can be used in any truncated form beginning with aminimum of RES.
PURGE Command
Use the PURGE command to purge a thread currently processing in the DB2subsystem you are monitoring. You must have the DB2 privilege to performCANCEL THREAD.
The PURGE command can be executed from any thread activity panel.
The command syntax is:
ÊÊ RESET ÊÍ
Figure 71. Syntax of the RESET Command
Thread Activity
Chapter 7. Displaying Thread Activity 115

Purging a Thread
To purge a thread listed on the Thread Summary panel, type PURGE (or one of itsabbreviations) on the command line, select the listed thread you want to purge, andpress Enter .
To purge the thread being monitored from the Thread Detail panel or any of itslower level windows, type PURGE (or one of its abbreviations) on the command lineand press Enter .
After issuing the PURGE command, the Purge Thread Confirmation window shownin Figure 73 is displayed.
To confirm the purge request, press Enter . To cancel the request and not purge thethread, press F12 (Cancel).
If you purge the thread currently being monitored from the Thread Detail panel orany of its lower level windows, you are returned to the Thread Summary panel.
Note: The PURGE command can be used in any truncated form beginning with aminimum of PUR.
QUALIFY Command
Use the QUALIFY command to filter the threads shown on the Thread Summarypanel. When qualify is active, only the threads matching the DB2 PM identifiersspecified on the DB2 Thread Qualification Parameters window are shown. TheQUALIFY command can be used only from the Thread Summary panel.
Thread qualification remains active until deactivated either by a QUALIFY OFFcommand or the RESET command, even across Online Monitor sessions.
The command syntax is:
ÊÊ PURGE ÊÍ
Figure 72. Syntax of the PURGE Command
┌──────────────────────────────────────────────────────────────────┐│ DGOMTCPR Purge Thread Confirmation ││ ││ Press Enter to purge thread or request CANCEL ││ ││ ││ Primauth . . : USERT003 Planname . . . . . . . : DSNESPCS ││ Program name : DSNESM68 Connection Id . . . . . : DB2CALL ││ ││ ││ F1=Help F2=Split F9=Swap F12=Cancel │└──────────────────────────────────────────────────────────────────┘
Figure 73. Purge Thread Confirmation
Thread Activity
116 DB2 PM Online Monitor User’s Guide
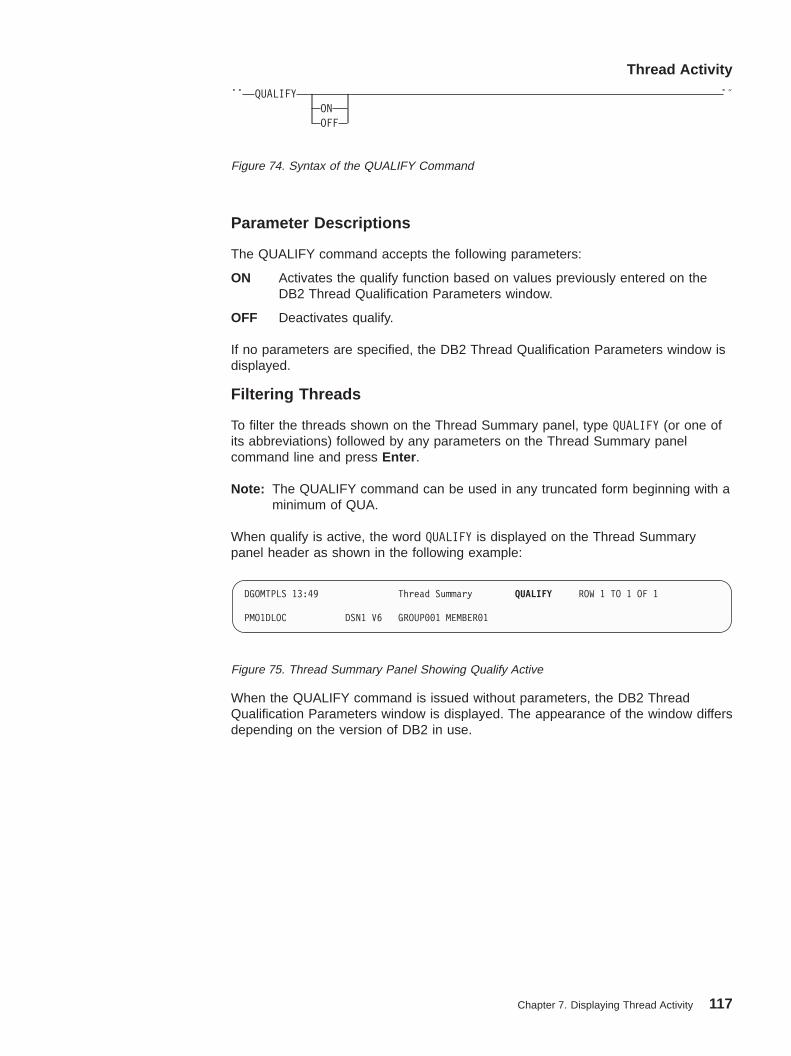
Parameter Descriptions
The QUALIFY command accepts the following parameters:
ON Activates the qualify function based on values previously entered on theDB2 Thread Qualification Parameters window.
OFF Deactivates qualify.
If no parameters are specified, the DB2 Thread Qualification Parameters window isdisplayed.
Filtering Threads
To filter the threads shown on the Thread Summary panel, type QUALIFY (or one ofits abbreviations) followed by any parameters on the Thread Summary panelcommand line and press Enter .
Note: The QUALIFY command can be used in any truncated form beginning with aminimum of QUA.
When qualify is active, the word QUALIFY is displayed on the Thread Summarypanel header as shown in the following example:
When the QUALIFY command is issued without parameters, the DB2 ThreadQualification Parameters window is displayed. The appearance of the window differsdepending on the version of DB2 in use.
ÊÊ QUALIFYONOFF
ÊÍ
Figure 74. Syntax of the QUALIFY Command
DGOMTPLS 13:49 Thread Summary QUALIFY ROW 1 TO 1 OF 1
PMO1DLOC DSN1 V6 GROUP001 MEMBER01
Figure 75. Thread Summary Panel Showing Qualify Active
Thread Activity
Chapter 7. Displaying Thread Activity 117
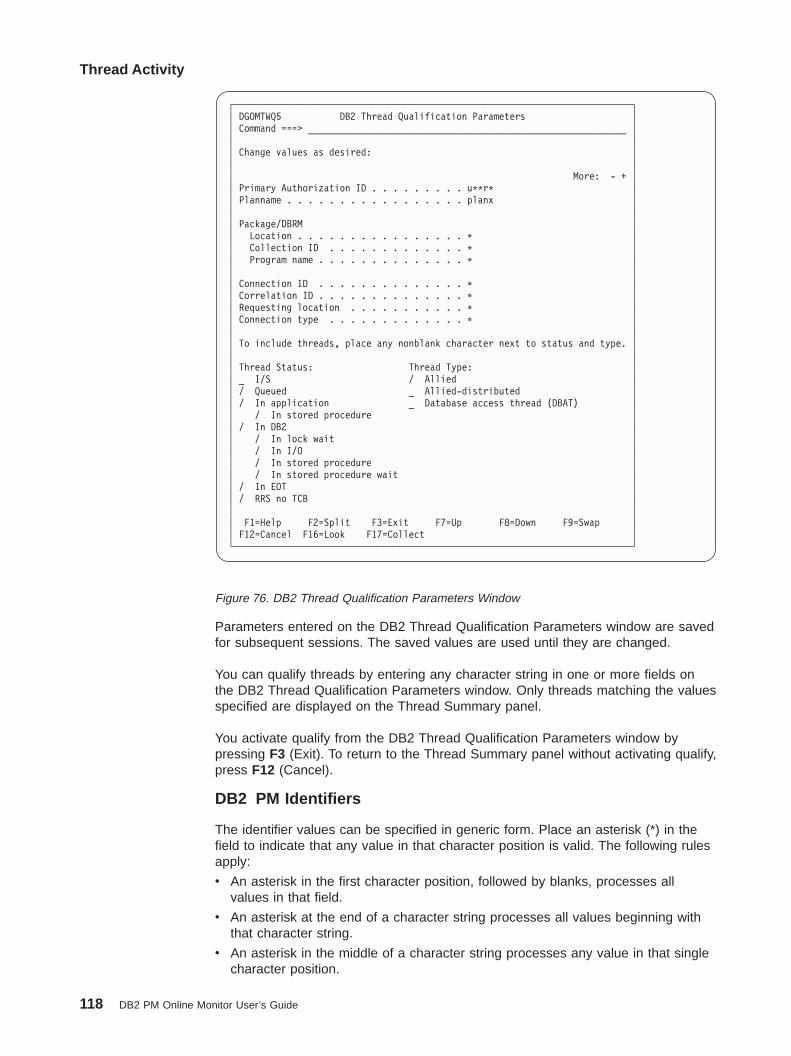
Parameters entered on the DB2 Thread Qualification Parameters window are savedfor subsequent sessions. The saved values are used until they are changed.
You can qualify threads by entering any character string in one or more fields onthe DB2 Thread Qualification Parameters window. Only threads matching the valuesspecified are displayed on the Thread Summary panel.
You activate qualify from the DB2 Thread Qualification Parameters window bypressing F3 (Exit). To return to the Thread Summary panel without activating qualify,press F12 (Cancel).
DB2 PM Identifiers
The identifier values can be specified in generic form. Place an asterisk (*) in thefield to indicate that any value in that character position is valid. The following rulesapply:
v An asterisk in the first character position, followed by blanks, processes allvalues in that field.
v An asterisk at the end of a character string processes all values beginning withthat character string.
v An asterisk in the middle of a character string processes any value in that singlecharacter position.
┌───────────────────────────────────────────────────────────────────────────┐│ DGOMTWQ5 DB2 Thread Qualification Parameters ││ Command ===> ____________________________________________________________ ││ ││ Change values as desired: ││ ││ More: - + ││ Primary Authorization ID . . . . . . . . . u**r* ││ Planname . . . . . . . . . . . . . . . . . planx ││ ││ Package/DBRM ││ Location . . . . . . . . . . . . . . . . * ││ Collection ID . . . . . . . . . . . . . * ││ Program name . . . . . . . . . . . . . . * ││ ││ Connection ID . . . . . . . . . . . . . . * ││ Correlation ID . . . . . . . . . . . . . . * ││ Requesting location . . . . . . . . . . . * ││ Connection type . . . . . . . . . . . . . * ││ ││ To include threads, place any nonblank character next to status and type. ││ ││ Thread Status: Thread Type: ││ _ I/S / Allied ││ / Queued _ Allied-distributed ││ / In application _ Database access thread (DBAT) ││ / In stored procedure ││ / In DB2 ││ / In lock wait ││ / In I/O ││ / In stored procedure ││ / In stored procedure wait ││ / In EOT ││ / RRS no TCB ││ ││ F1=Help F2=Split F3=Exit F7=Up F8=Down F9=Swap ││ F12=Cancel F16=Look F17=Collect │└───────────────────────────────────────────────────────────────────────────┘
Figure 76. DB2 Thread Qualification Parameters Window
Thread Activity
118 DB2 PM Online Monitor User’s Guide
Note: If you leave the value blank for the Plan Name or Correlation ID fields, onlythreads with blank values for these DB2 PM identifiers are displayed. If youleave the value blank for any of the other DB2 PM identifiers, an asterisk (*)is inserted by default and all values in that field are processed.
Thread Status
Place any character beside each status to be included in the threads displayed:I/S The thread is in identify or signon stateQueued The thread is queuedIn Application Processing is taking place within the applicationIn Application Stored Procedure
The thread is running a stored procedureapplication
In DB2 The thread is currently processing within DB2In Lock Wait The thread is currently suspended waiting for a lockIn I/O The thread is currently in input or output statusIn DB2 Stored Procedure The thread is running a stored procedure within
DB2In DB2 Stored Procedure Wait
The thread is waiting for a stored procedure to bescheduled within DB2
In EOT The thread is currently in end-of-task processing.
Thread Type
Place any character beside each type of thread to be included in the ThreadSummary panel:
Allied The thread is only doing local processing.
Allied-Distributed The thread is involved in distributed activity and isrequesting data from a remote system.
Database Access Thread (DBAT)The thread is doing work locally on behalf of anallied-distributed or DBAT-distributed thread createdat another site.
DB2 Thread Qualification Parameters Window Example
This section describes the effects of various parameters entered on the DB2 ThreadQualification Parameters window in Figure 76 on page 118.
Primary Authorization ID . . . . . . . . .U**R*
This line of the window specifies that only threads with the following authorizationIDs are shown:
v Beginning with Uv With any characters in positions 2 and 3v With an R in position 4v With any characters in positions 5 through 8.
Planname . . . . . . . . . . . . . . . . .PLANX
This line of the window specifies that only threads with the DB2 plan name PLANXare shown.
Thread Activity
Chapter 7. Displaying Thread Activity 119
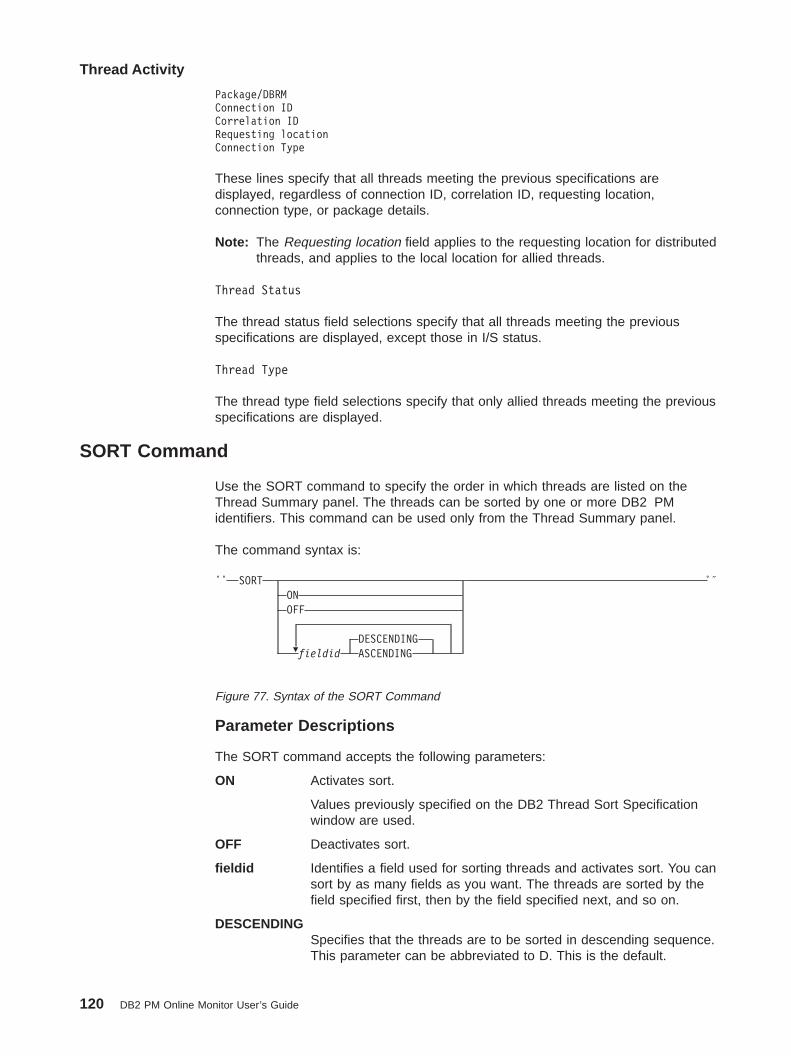
Package/DBRMConnection IDCorrelation IDRequesting locationConnection Type
These lines specify that all threads meeting the previous specifications aredisplayed, regardless of connection ID, correlation ID, requesting location,connection type, or package details.
Note: The Requesting location field applies to the requesting location for distributedthreads, and applies to the local location for allied threads.
Thread Status
The thread status field selections specify that all threads meeting the previousspecifications are displayed, except those in I/S status.
Thread Type
The thread type field selections specify that only allied threads meeting the previousspecifications are displayed.
SORT Command
Use the SORT command to specify the order in which threads are listed on theThread Summary panel. The threads can be sorted by one or more DB2 PMidentifiers. This command can be used only from the Thread Summary panel.
The command syntax is:
Parameter Descriptions
The SORT command accepts the following parameters:
ON Activates sort.
Values previously specified on the DB2 Thread Sort Specificationwindow are used.
OFF Deactivates sort.
fieldid Identifies a field used for sorting threads and activates sort. You cansort by as many fields as you want. The threads are sorted by thefield specified first, then by the field specified next, and so on.
DESCENDINGSpecifies that the threads are to be sorted in descending sequence.This parameter can be abbreviated to D. This is the default.
ÊÊ SORT
·
ONOFF
DESCENDINGfieldid ASCENDING
ÊÍ
Figure 77. Syntax of the SORT Command
Thread Activity
120 DB2 PM Online Monitor User’s Guide

ASCENDING Specifies that the threads are to be sorted in ascending sequence.This parameter can be abbreviated to A.
Notes:
1. If only one field is specified in a SORT command, you do not need to specifythe sequence. The sequence is descending by default.
2. If multiple fields are specified, the sequence (ascending or descending) needsto be specified for each field except the last one.
3. All parameters specified in the command are separated by a single space.
The following table lists all fields that can be used with the SORT command. Thefield identifiers can be truncated. Uppercase letters indicate the shortest validabbreviation for each field identifier.
Table 4. Sort Fields
Field Field ID
Primary Authorization ID PRImauth
Plan Name PLanname
Package/DBRM Program name PROgram
Package Collection ID COLlection
Correlation ID CORrelation
Connection ID CONNEct
Connection Type CONNType
Thread Status Status
Request Count REQUests
Requesting Location REQLoc
Class 1 elapsed time C1Elapsed
Class 1 CPU time C1Cpu
Class 2 elapsed time C2Elapsed
Class 2 CPU time C2Cpu
Class 3 time C3elapsed
Sorting Threads
To sort the threads shown on the Thread Summary panel, type SORT (or one of itsabbreviations) followed by any parameters on the command line of the ThreadSummary panel and press Enter . When sort is active, the word SORT is displayedon the Thread Summary panel header as shown in the following example:
If sort is issued without any parameters, the DB2 Thread Sort Specification windowis displayed. Parameters entered on this window are saved for subsequentsessions.
DGOMTPLS 13:49 Thread Summary SORT ROW 1 TO 1 OF 1
PMO1DLOC DSN1 V6 GROUP001 MEMBER01
Figure 78. Thread Summary Panel Showing Sort Active
Thread Activity
Chapter 7. Displaying Thread Activity 121
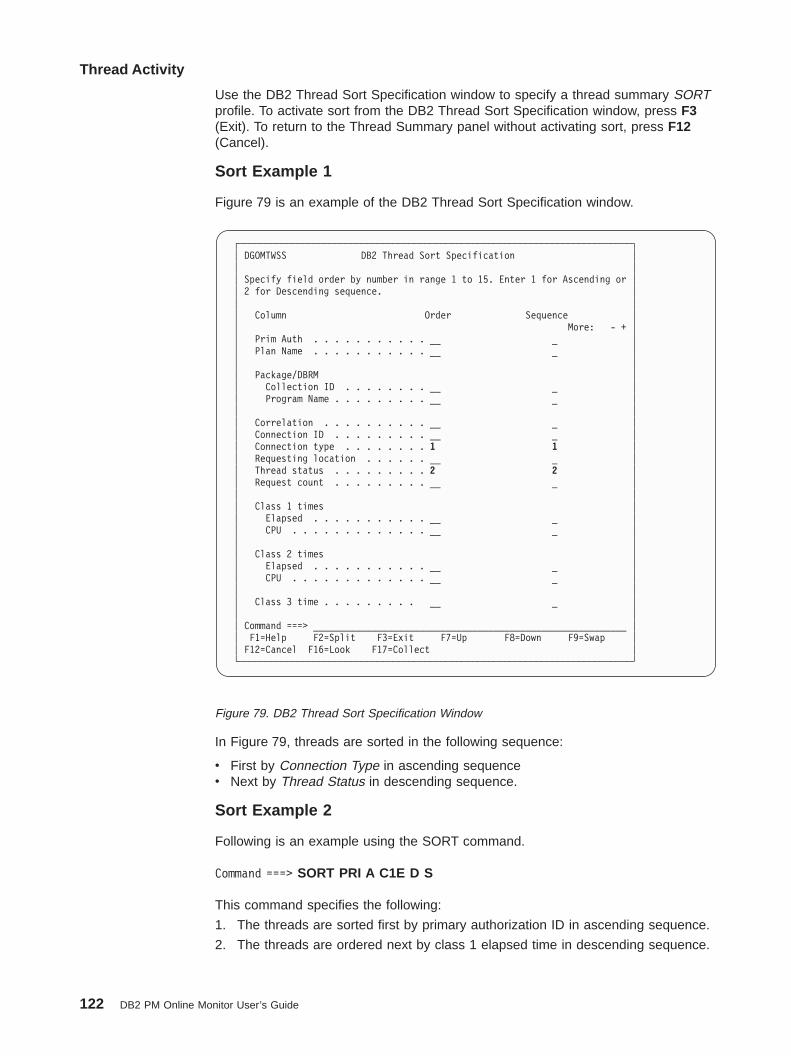
Use the DB2 Thread Sort Specification window to specify a thread summary SORTprofile. To activate sort from the DB2 Thread Sort Specification window, press F3(Exit). To return to the Thread Summary panel without activating sort, press F12(Cancel).
Sort Example 1
Figure 79 is an example of the DB2 Thread Sort Specification window.
In Figure 79, threads are sorted in the following sequence:
v First by Connection Type in ascending sequencev Next by Thread Status in descending sequence.
Sort Example 2
Following is an example using the SORT command.
Command ===> SORT PRI A C1E D S
This command specifies the following:
1. The threads are sorted first by primary authorization ID in ascending sequence.
2. The threads are ordered next by class 1 elapsed time in descending sequence.
┌──────────────────────────────────────────────────────────────────────────┐│ DGOMTWSS DB2 Thread Sort Specification ││ ││ Specify field order by number in range 1 to 15. Enter 1 for Ascending or ││ 2 for Descending sequence. ││ ││ Column Order Sequence ││ More: - + ││ Prim Auth . . . . . . . . . . . __ _ ││ Plan Name . . . . . . . . . . . __ _ ││ ││ Package/DBRM ││ Collection ID . . . . . . . . __ _ ││ Program Name . . . . . . . . . __ _ ││ ││ Correlation . . . . . . . . . . __ _ ││ Connection ID . . . . . . . . . __ _ ││ Connection type . . . . . . . . 1 1 ││ Requesting location . . . . . . __ _ ││ Thread status . . . . . . . . . 2 2 ││ Request count . . . . . . . . . __ _ ││ ││ Class 1 times ││ Elapsed . . . . . . . . . . . __ _ ││ CPU . . . . . . . . . . . . . __ _ ││ ││ Class 2 times ││ Elapsed . . . . . . . . . . . __ _ ││ CPU . . . . . . . . . . . . . __ _ ││ ││ Class 3 time . . . . . . . . . __ _ ││ ││ Command ===> ___________________________________________________________ ││ F1=Help F2=Split F3=Exit F7=Up F8=Down F9=Swap ││ F12=Cancel F16=Look F17=Collect │└──────────────────────────────────────────────────────────────────────────┘
Figure 79. DB2 Thread Sort Specification Window
Thread Activity
122 DB2 PM Online Monitor User’s Guide

3. The threads are sorted next by thread status. The sequence is descending bydefault.
Thread Activity
Chapter 7. Displaying Thread Activity 123

Thread Activity
124 DB2 PM Online Monitor User’s Guide

Chapter 8. Viewing DB2 Statistics
Tuning DB2
This chapter identifies and describes the specific DB2 data which is reportedfor the purpose of tuning DB2. For general tuning advice on DB2, refer to theDB2 Administration Guide ‘Performance, Monitoring, and Tuning’ chapters forthe specific release of DB2.
All statistics fields up to and including DB2 V5 are supported by thread activitydisplay. To view new fields introduced with DB2 V6, use the DB2 PM workstationonline monitor.
The Online Monitor statistics panels provide an overview of DB2 system activity.Use these panels to view important ratios and DB2 statistics values.
Most DB2 statistics field values accumulate while the DB2 subsystem is active.When DB2 is started, the accumulation process begins and continues until the DB2subsystem is stopped. There are, however, certain fields that are not cumulative.Some are reported as “snapshot” values, and some are reported as “high watermark” values. A snapshot value is a current value, and is updated each time thestatistics values are displayed. A high water mark is a maximum value since startup,and is updated each time the statistics values are displayed.
Fields that are not snapshot or high water mark values are known as delta values.They are derived differently for each of the statistics processing modes. They arecalculated by the statistics display. For further details, see “Interval ProcessingMode” on page 127 and “Delta Processing Mode” on page 127.
© Copyright IBM Corp. 1985, 1999 125
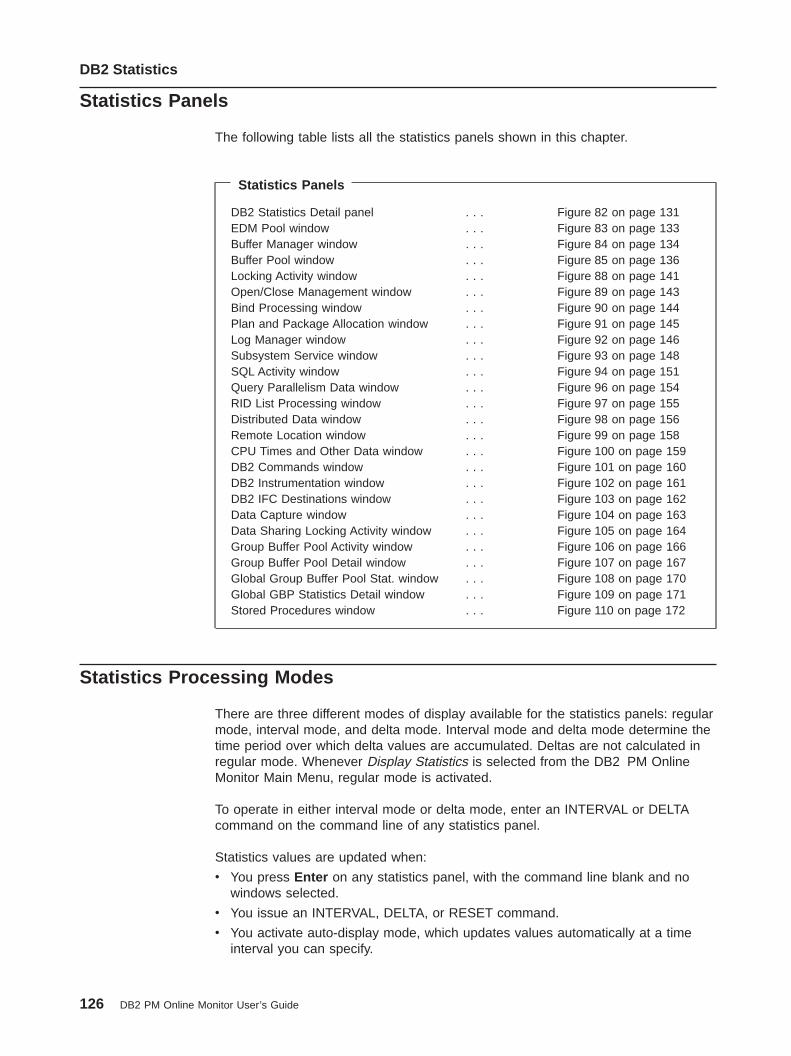
Statistics Panels
The following table lists all the statistics panels shown in this chapter.
Statistics Panels
DB2 Statistics Detail panel . . . Figure 82 on page 131EDM Pool window . . . Figure 83 on page 133Buffer Manager window . . . Figure 84 on page 134Buffer Pool window . . . Figure 85 on page 136Locking Activity window . . . Figure 88 on page 141Open/Close Management window . . . Figure 89 on page 143Bind Processing window . . . Figure 90 on page 144Plan and Package Allocation window . . . Figure 91 on page 145Log Manager window . . . Figure 92 on page 146Subsystem Service window . . . Figure 93 on page 148SQL Activity window . . . Figure 94 on page 151Query Parallelism Data window . . . Figure 96 on page 154RID List Processing window . . . Figure 97 on page 155Distributed Data window . . . Figure 98 on page 156Remote Location window . . . Figure 99 on page 158CPU Times and Other Data window . . . Figure 100 on page 159DB2 Commands window . . . Figure 101 on page 160DB2 Instrumentation window . . . Figure 102 on page 161DB2 IFC Destinations window . . . Figure 103 on page 162Data Capture window . . . Figure 104 on page 163Data Sharing Locking Activity window . . . Figure 105 on page 164Group Buffer Pool Activity window . . . Figure 106 on page 166Group Buffer Pool Detail window . . . Figure 107 on page 167Global Group Buffer Pool Stat. window . . . Figure 108 on page 170Global GBP Statistics Detail window . . . Figure 109 on page 171Stored Procedures window . . . Figure 110 on page 172
Statistics Processing Modes
There are three different modes of display available for the statistics panels: regularmode, interval mode, and delta mode. Interval mode and delta mode determine thetime period over which delta values are accumulated. Deltas are not calculated inregular mode. Whenever Display Statistics is selected from the DB2 PM OnlineMonitor Main Menu, regular mode is activated.
To operate in either interval mode or delta mode, enter an INTERVAL or DELTAcommand on the command line of any statistics panel.
Statistics values are updated when:
v You press Enter on any statistics panel, with the command line blank and nowindows selected.
v You issue an INTERVAL, DELTA, or RESET command.
v You activate auto-display mode, which updates values automatically at a timeinterval you can specify.
DB2 Statistics
126 DB2 PM Online Monitor User’s Guide

Note: The auto-display feature needs to be disabled before an INTERVAL,DELTA, or RESET command is issued. To stop auto-display, press theAttention key. The auto-display function can be activated again after theprocessing mode command is issued.
Regular Processing Mode
This is the default mode of operation whenever you select Display Statistics fromthe Online Monitor main menu. In this mode, the delta values displayed areaccumulated since DB2 startup. No calculations are performed on the statisticsvalues in this mode. You need to be in interval or delta processing mode to usedisplay exception processing. Use the RESET command to return to regular mode.
Interval Processing Mode
To activate interval processing mode, type INTERVAL on the command line of anystatistics panel and press Enter . In interval processing mode, the delta valuesdisplayed are accumulated since the last time the INTERVAL command wasentered on the command line. When interval mode is activated while viewing pastdata, the values are accumulated between the history time shown when theINTERVAL command was issued and the current history time.
Use interval mode to isolate DB2 statistics activity beginning at a specified time.Interval processing can help indicate the existence of a problem when running withexception processing. When you select interval processing mode, all statistics fieldvalues (with the exception of the high water mark and snapshot fields) are clearedand begin the accumulation process from the start. The first values displayed afterthe INTERVAL command is issued represent the values from the newly-establishedbase point to the first statistics record pair (IFCID 1 and IFCID 2) encountered afterthe INTERVAL command. Thereafter, the values are updated each time you pressEnter . The auto-display feature can be activated with interval processing mode.Statistics values are then updated automatically at the time interval you specified. Anew base point can be established by repeating the INTERVAL command.
When interval processing mode is activated, all statistics panels operate in intervalmode. The time elapsed since the base point was established is displayed on theline under the heading of each statistics panel, as shown in the following example:
Interval mode remains active until either it is turned off or you return to the mainmenu. You can deactivate interval mode using the RESET or DELTA command fromany statistics panel. Use the RESET command to return to regular mode.
Delta Processing Mode
To activate delta processing mode, type DELTA on the command line of any statisticspanel and press Enter . In delta processing mode, the values are accumulatedbetween the last two times you pressed Enter . When delta mode is activated while
DGOMSPSM 12:07 DB2 Statistics Detail PMO1DLOC DSN1 V6GROUP001 MEMBER01
INTERVAL 40.088For details, type any character next to heading, then press Enter.
Figure 80. DB2 Statistics Detail Panel Showing Interval Active
DB2 Statistics
Chapter 8. Viewing DB2 Statistics 127
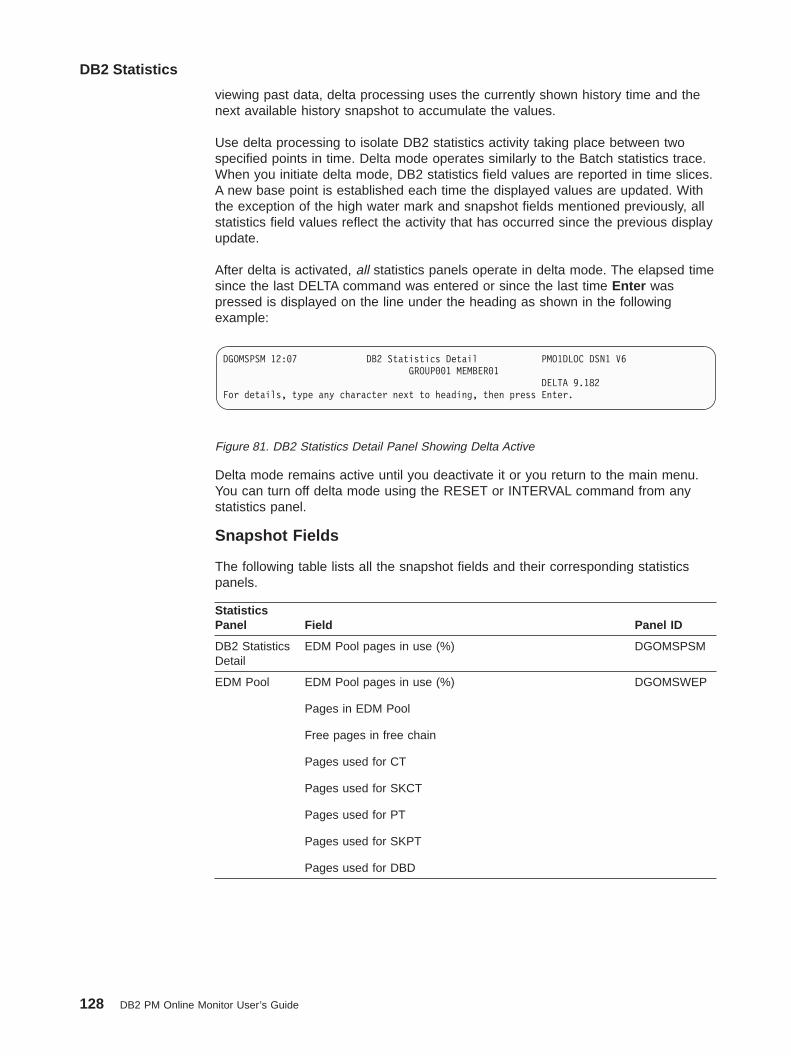
viewing past data, delta processing uses the currently shown history time and thenext available history snapshot to accumulate the values.
Use delta processing to isolate DB2 statistics activity taking place between twospecified points in time. Delta mode operates similarly to the Batch statistics trace.When you initiate delta mode, DB2 statistics field values are reported in time slices.A new base point is established each time the displayed values are updated. Withthe exception of the high water mark and snapshot fields mentioned previously, allstatistics field values reflect the activity that has occurred since the previous displayupdate.
After delta is activated, all statistics panels operate in delta mode. The elapsed timesince the last DELTA command was entered or since the last time Enter waspressed is displayed on the line under the heading as shown in the followingexample:
Delta mode remains active until you deactivate it or you return to the main menu.You can turn off delta mode using the RESET or INTERVAL command from anystatistics panel.
Snapshot Fields
The following table lists all the snapshot fields and their corresponding statisticspanels.
StatisticsPanel Field Panel ID
DB2 StatisticsDetail
EDM Pool pages in use (%) DGOMSPSM
EDM Pool EDM Pool pages in use (%)
Pages in EDM Pool
Free pages in free chain
Pages used for CT
Pages used for SKCT
Pages used for PT
Pages used for SKPT
Pages used for DBD
DGOMSWEP
DGOMSPSM 12:07 DB2 Statistics Detail PMO1DLOC DSN1 V6GROUP001 MEMBER01
DELTA 9.182For details, type any character next to heading, then press Enter.
Figure 81. DB2 Statistics Detail Panel Showing Delta Active
DB2 Statistics
128 DB2 PM Online Monitor User’s Guide

StatisticsPanel Field Panel ID
Buffer Pool Current active buffers
Buffers allocated for hiperpool
Buffers allocated for virtual buffer pool
ALTER BUFFERPOOL expansions and contractions - ForHiperpool
Hiperpool buffers backed
Maximum concurrent workfiles
DGOMSWBP
Open/CloseManagement
Open data sets - Current
Open data sets - With CLOSE(NO)
Open data sets - Not in use
Data sets on deferred close queue - Current
DGOMSOC2DGOMSWOC
QueryParallelismData
Maximum Degree of Parallelism DGOMSWQP
RID ListProcessing
RID blocks allocated - Current DGOMSWRP
DistributedData
Inactive DBATs - Currently
Active DBATs - Currently
DGOMSWDD
High Water Mark Fields
The following table lists all the high water mark fields and their correspondingstatistics panels:
StatisticsPanel Field Panel ID
DB2 StatisticsDetail
Open data sets - High Water Mark DGOMSPSM
Buffer pool Concurrent streams - HWM DGOMSWBP
Open/CloseManagement
Open data sets - HWM
Data sets on deferred close queue - Maximum
DGOMSWOC
RID ListProcessing
RID blocks allocated - Maximum DGOMSWRP
DistributedData
Inactive DBATs - HWM
Active DBATs - HWM
Total DBATs - HWM
DGOMSWDD
DB2 Statistics
Chapter 8. Viewing DB2 Statistics 129
Statistics Panel Overview
The DB2 Statistics Detail panel shows a summary of key statistics values. From thispanel, you can access windows providing statistics data in greater detail.
Moving between statistics panels does not cause the values shown to be updated.Data displayed on the current panel is refreshed whenever you press Enter withoutselecting a window to be displayed or executing a command.
DB2 Statistics Detail Panel
Use the DB2 Statistics Detail panel to view key DB2 performance data andpercentages, and important DB2 thresholds. The DB2 Statistics Detail panel shouldbe used as a regular check on the performance of DB2.
To display the DB2 Statistics Detail panel, select option 2 (Display Statistics) fromthe DB2 PM Online Monitor Main Menu.
Note: The DB2 Statistics Detail panel displayed at your site may have beentailored by your installation and consequently may not necessarily match thepanel example shown in this book.
DB2 Statistics
130 DB2 PM Online Monitor User’s Guide
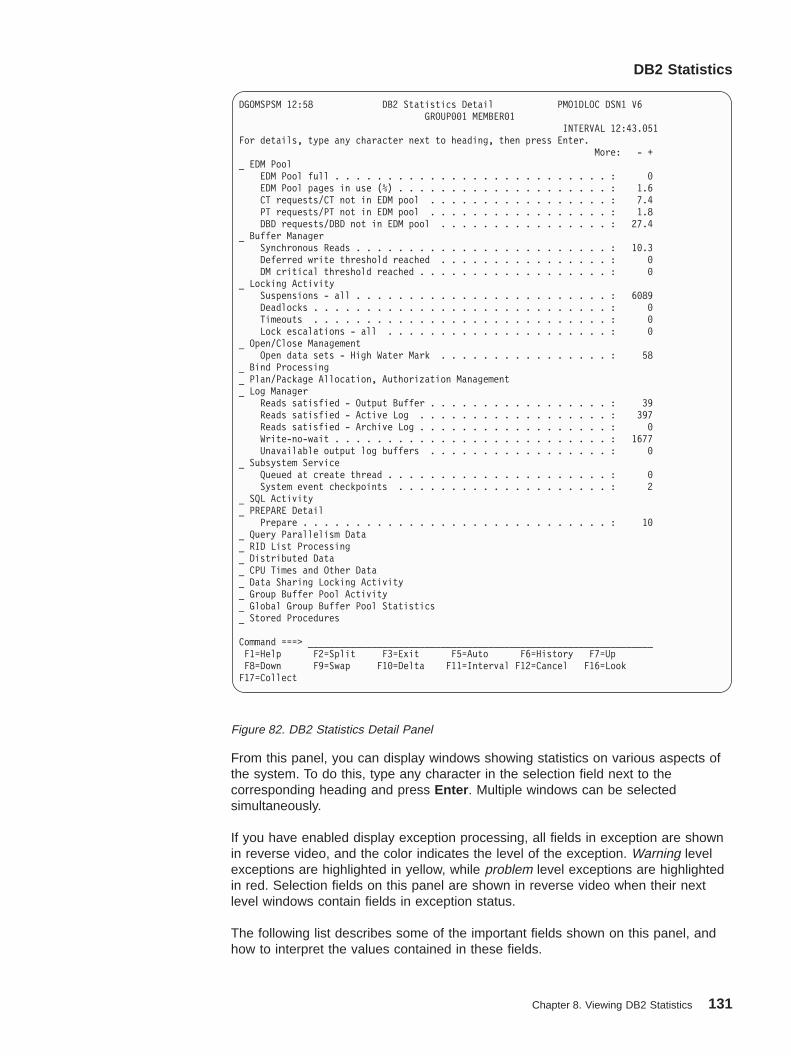
From this panel, you can display windows showing statistics on various aspects ofthe system. To do this, type any character in the selection field next to thecorresponding heading and press Enter . Multiple windows can be selectedsimultaneously.
If you have enabled display exception processing, all fields in exception are shownin reverse video, and the color indicates the level of the exception. Warning levelexceptions are highlighted in yellow, while problem level exceptions are highlightedin red. Selection fields on this panel are shown in reverse video when their nextlevel windows contain fields in exception status.
The following list describes some of the important fields shown on this panel, andhow to interpret the values contained in these fields.
DGOMSPSM 12:58 DB2 Statistics Detail PMO1DLOC DSN1 V6GROUP001 MEMBER01
INTERVAL 12:43.051For details, type any character next to heading, then press Enter.
More: - +_ EDM Pool
EDM Pool full . . . . . . . . . . . . . . . . . . . . . . . . . . : 0EDM Pool pages in use (%) . . . . . . . . . . . . . . . . . . . . : 1.6CT requests/CT not in EDM pool . . . . . . . . . . . . . . . . . : 7.4PT requests/PT not in EDM pool . . . . . . . . . . . . . . . . . : 1.8DBD requests/DBD not in EDM pool . . . . . . . . . . . . . . . . : 27.4
_ Buffer ManagerSynchronous Reads . . . . . . . . . . . . . . . . . . . . . . . . : 10.3Deferred write threshold reached . . . . . . . . . . . . . . . . : 0DM critical threshold reached . . . . . . . . . . . . . . . . . . : 0
_ Locking ActivitySuspensions - all . . . . . . . . . . . . . . . . . . . . . . . . : 6089Deadlocks . . . . . . . . . . . . . . . . . . . . . . . . . . . . : 0Timeouts . . . . . . . . . . . . . . . . . . . . . . . . . . . . : 0Lock escalations - all . . . . . . . . . . . . . . . . . . . . . : 0
_ Open/Close ManagementOpen data sets - High Water Mark . . . . . . . . . . . . . . . . : 58
_ Bind Processing_ Plan/Package Allocation, Authorization Management_ Log Manager
Reads satisfied - Output Buffer . . . . . . . . . . . . . . . . . : 39Reads satisfied - Active Log . . . . . . . . . . . . . . . . . . : 397Reads satisfied - Archive Log . . . . . . . . . . . . . . . . . . : 0Write-no-wait . . . . . . . . . . . . . . . . . . . . . . . . . . : 1677Unavailable output log buffers . . . . . . . . . . . . . . . . . : 0
_ Subsystem ServiceQueued at create thread . . . . . . . . . . . . . . . . . . . . . : 0System event checkpoints . . . . . . . . . . . . . . . . . . . . : 2
_ SQL Activity_ PREPARE Detail
Prepare . . . . . . . . . . . . . . . . . . . . . . . . . . . . . : 10_ Query Parallelism Data_ RID List Processing_ Distributed Data_ CPU Times and Other Data_ Data Sharing Locking Activity_ Group Buffer Pool Activity_ Global Group Buffer Pool Statistics_ Stored Procedures
Command ===> _________________________________________________________________F1=Help F2=Split F3=Exit F5=Auto F6=History F7=UpF8=Down F9=Swap F10=Delta F11=Interval F12=Cancel F16=LookF17=Collect
Figure 82. DB2 Statistics Detail Panel
DB2 Statistics
Chapter 8. Viewing DB2 Statistics 131
EDM Pool pages in use (%)The percentage of pages in the EDM pool that have been used or arecurrently in use (snapshot value). This means, it shows the number ofnonstealable pages.
During peak periods, the value in this field should be between 80 and 100percent. Because stealable pages are not represented here, a value closeto 100 percent does not necessarily indicate an EDM pool constraint. As thevalue approaches 100, examine the efficiency ratios to verify thatacceptable levels are met. If the EDM pool is too small, it causes increasedI/O activity in database DSNDB01, table spaces DBD01 and SCT02.
Note: The EDM pool use varies across the day. It is not only the pagesthat are in use, but also the pages that are not in use, waiting toavoid I/O, that are important for performance.
Synchronous ReadsNumber of synchronous read I/O operations performed by sequential andrandom requests.
DeadlocksNumber of times lock suspensions ultimately resulted in a deadlock. Thishappens when two or more application processes each hold locks onresources that the others need, without which they cannot proceed.Deadlocks result principally from an application design problem. Ensure thatall applications accessing the same tables access them in the same order.Deadlocks can also occur through index page splits if there is high insertactivity. In this case, it is suggested to set SUBPAGES to 1 for the index.
TimeoutsNumber of times lock suspensions ultimately resulted in a timeout. Thishappens when a requester for a lock on a resource has waited longer thanthe installation-specified RESOURCE TIMEOUT limit on the DB2 installpanel DSNTIPI.
Reads satisfied - Archive LogNumber of times DB2 needed to read log records, and had to go to thearchive log for the records. The value for this should ideally be zero.
System event checkpointsThe value in this field indicates the frequency of DB2 checkpoints. Forexample, if the statistics interval is 30 minutes and the value of this field is15, DB2 is taking checkpoints every 2 minutes.
PREPARE DetailSelect this field to display the PREPARE Detail panel.
PrepareThe number of prepares. It reflects the number of real PREPAREcommands received by DB2. If the PREPARE is satisfied by getting a copyfrom the cache rather than by the traditional prepare process, the count isincremented. If the prepares are done under control ofKEEPDYNAMIC(YES), the count is not incremented.
DB2 Statistics
132 DB2 PM Online Monitor User’s Guide
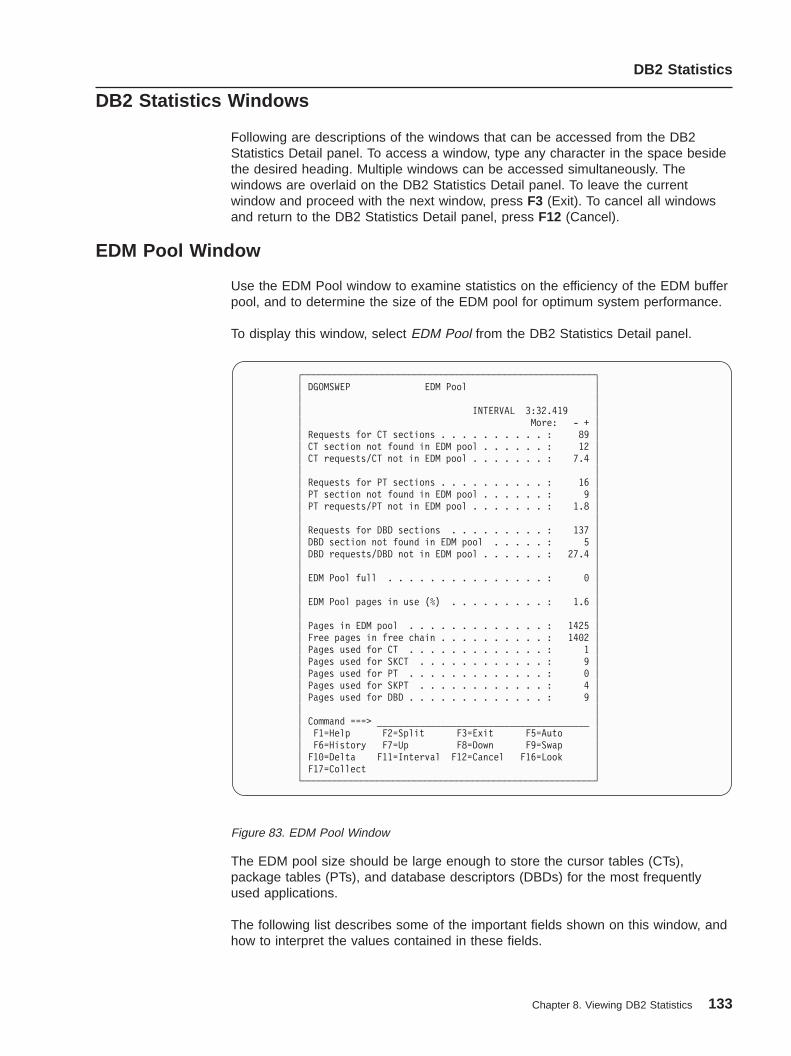
DB2 Statistics Windows
Following are descriptions of the windows that can be accessed from the DB2Statistics Detail panel. To access a window, type any character in the space besidethe desired heading. Multiple windows can be accessed simultaneously. Thewindows are overlaid on the DB2 Statistics Detail panel. To leave the currentwindow and proceed with the next window, press F3 (Exit). To cancel all windowsand return to the DB2 Statistics Detail panel, press F12 (Cancel).
EDM Pool Window
Use the EDM Pool window to examine statistics on the efficiency of the EDM bufferpool, and to determine the size of the EDM pool for optimum system performance.
To display this window, select EDM Pool from the DB2 Statistics Detail panel.
The EDM pool size should be large enough to store the cursor tables (CTs),package tables (PTs), and database descriptors (DBDs) for the most frequentlyused applications.
The following list describes some of the important fields shown on this window, andhow to interpret the values contained in these fields.
┌───────────────────────────────────────────────────────┐│ DGOMSWEP EDM Pool ││ ││ INTERVAL 3:32.419 ││ More: - + ││ Requests for CT sections . . . . . . . . . . : 89 ││ CT section not found in EDM pool . . . . . . : 12 ││ CT requests/CT not in EDM pool . . . . . . . : 7.4 ││ ││ Requests for PT sections . . . . . . . . . . : 16 ││ PT section not found in EDM pool . . . . . . : 9 ││ PT requests/PT not in EDM pool . . . . . . . : 1.8 ││ ││ Requests for DBD sections . . . . . . . . . : 137 ││ DBD section not found in EDM pool . . . . . : 5 ││ DBD requests/DBD not in EDM pool . . . . . . : 27.4 ││ ││ EDM Pool full . . . . . . . . . . . . . . . : 0 ││ ││ EDM Pool pages in use (%) . . . . . . . . . : 1.6 ││ ││ Pages in EDM pool . . . . . . . . . . . . . : 1425 ││ Free pages in free chain . . . . . . . . . . : 1402 ││ Pages used for CT . . . . . . . . . . . . . : 1 ││ Pages used for SKCT . . . . . . . . . . . . : 9 ││ Pages used for PT . . . . . . . . . . . . . : 0 ││ Pages used for SKPT . . . . . . . . . . . . : 4 ││ Pages used for DBD . . . . . . . . . . . . . : 9 ││ ││ Command ===> ________________________________________ ││ F1=Help F2=Split F3=Exit F5=Auto ││ F6=History F7=Up F8=Down F9=Swap ││ F10=Delta F11=Interval F12=Cancel F16=Look ││ F17=Collect │└───────────────────────────────────────────────────────┘
Figure 83. EDM Pool Window
DB2 Statistics
Chapter 8. Viewing DB2 Statistics 133
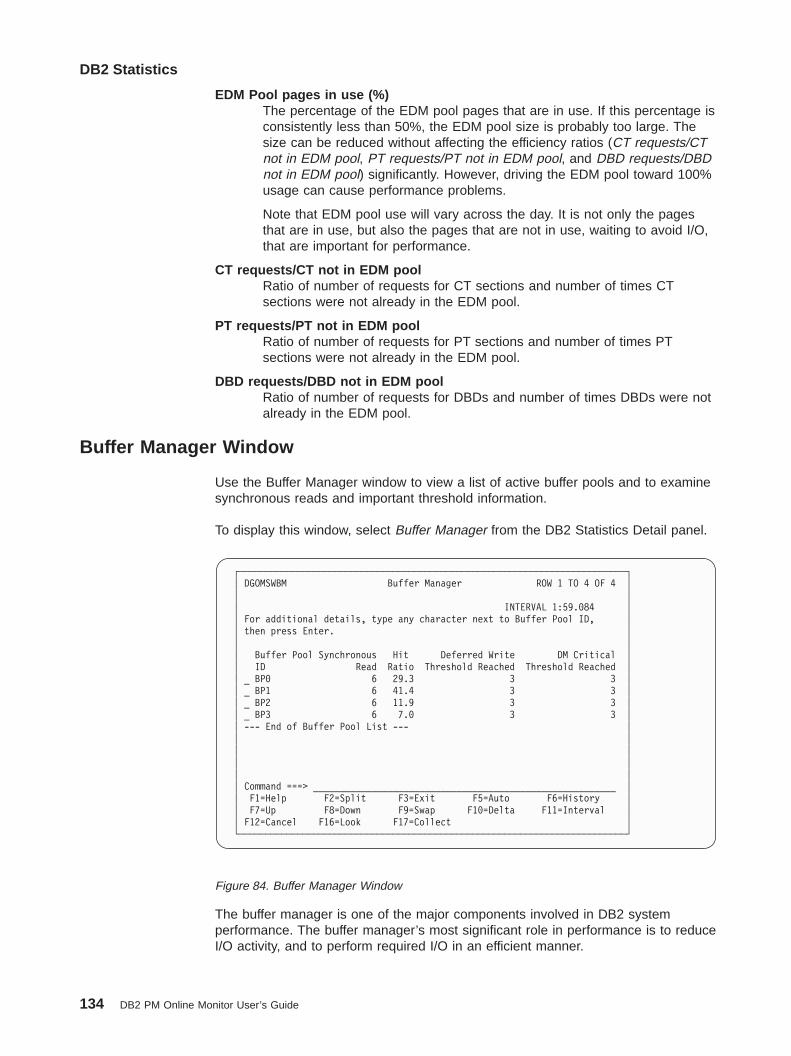
EDM Pool pages in use (%)The percentage of the EDM pool pages that are in use. If this percentage isconsistently less than 50%, the EDM pool size is probably too large. Thesize can be reduced without affecting the efficiency ratios (CT requests/CTnot in EDM pool, PT requests/PT not in EDM pool, and DBD requests/DBDnot in EDM pool) significantly. However, driving the EDM pool toward 100%usage can cause performance problems.
Note that EDM pool use will vary across the day. It is not only the pagesthat are in use, but also the pages that are not in use, waiting to avoid I/O,that are important for performance.
CT requests/CT not in EDM poolRatio of number of requests for CT sections and number of times CTsections were not already in the EDM pool.
PT requests/PT not in EDM poolRatio of number of requests for PT sections and number of times PTsections were not already in the EDM pool.
DBD requests/DBD not in EDM poolRatio of number of requests for DBDs and number of times DBDs were notalready in the EDM pool.
Buffer Manager Window
Use the Buffer Manager window to view a list of active buffer pools and to examinesynchronous reads and important threshold information.
To display this window, select Buffer Manager from the DB2 Statistics Detail panel.
The buffer manager is one of the major components involved in DB2 systemperformance. The buffer manager’s most significant role in performance is to reduceI/O activity, and to perform required I/O in an efficient manner.
┌─────────────────────────────────────────────────────────────────────────┐│ DGOMSWBM Buffer Manager ROW 1 TO 4 OF 4 ││ ││ INTERVAL 1:59.084 ││ For additional details, type any character next to Buffer Pool ID, ││ then press Enter. ││ ││ Buffer Pool Synchronous Hit Deferred Write DM Critical ││ ID Read Ratio Threshold Reached Threshold Reached ││ _ BP0 6 29.3 3 3 ││ _ BP1 6 41.4 3 3 ││ _ BP2 6 11.9 3 3 ││ _ BP3 6 7.0 3 3 ││ --- End of Buffer Pool List --- ││ ││ ││ ││ ││ Command ===> _________________________________________________________ ││ F1=Help F2=Split F3=Exit F5=Auto F6=History ││ F7=Up F8=Down F9=Swap F10=Delta F11=Interval ││ F12=Cancel F16=Look F17=Collect │└─────────────────────────────────────────────────────────────────────────┘
Figure 84. Buffer Manager Window
DB2 Statistics
134 DB2 PM Online Monitor User’s Guide

Buffer pools should be large enough to store frequently used data in virtual storage,reducing the amount of I/O necessary. However, to minimize paging I/O, you shouldchoose buffer pool sizes which can be backed by real or expanded storage.
Select any active buffer pool listed on the Buffer Manager window to display theBuffer Pool window, where you can view further details on an individual buffer pool.Multiple windows can be accessed simultaneously by selecting multiple fields. Thewindows are overlaid on the Buffer Manager window. To leave the current windowand proceed with the next window, press F3 (Exit). To cancel all windows andreturn to the DB2 Statistics Detail panel, press F12 (Cancel).
Buffer Pool Windows
Use the Buffer Pool window to view important statistics on an active buffer pool.
To display the Buffer Pool window, select any active buffer pool listed on the BufferManager window.
The following windows show all the information available on the Buffer Pool window.Use the scrolling keys F7 (Up) and F8 (Down) to view the portions of the windownot displayed.
DB2 Statistics
Chapter 8. Viewing DB2 Statistics 135

┌───────────────────────────────────────────────────────────────────────┐│ DGOMSWBP Buffer Pool BP0 ││ ││ INTERVAL 4:21.089 ││ More: - + ││ General ││ Virtual buffer pool pages in use (%) . . . . . . . . . . . : 4.6 ││ Buffer pool hit ratio (%) . . . . . . . . . . . . . . . . : 12.7 ││ Current active buffers . . . . . . . . . . . . . . . . . . : 46 ││ Buffer Pool full . . . . . . . . . . . . . . . . . . . . . : 0 ││ Virtual storage unavailable . . . . . . . . . . . . . . . : 0 ││ Successful data set opens . . . . . . . . . . . . . . . . : 59 ││ DFHSM migrated data sets . . . . . . . . . . . . . . . . . : 0 ││ DFHSM recall timeouts . . . . . . . . . . . . . . . . . . : 0 ││ ││ Buffers allocated ││ For Hiperpool . . . . . . . . . . . . . . . . . . . . . : 0 ││ For Virtual buffer pool . . . . . . . . . . . . . . . . : 0 ││ ││ ALTER BUFFERPOOL expansions and contractions ││ For Hiperpool . . . . . . . . . . . . . . . . . . . . . : 0 ││ For Virtual buffer pool . . . . . . . . . . . . . . . . : 0 ││ Hiperpool Buffers backed . . . . . . . . . . . . . . . . . : 0 ││ ││ Read Operations ││ ││ Getpage requests ││ Total . . . . . . . . . . . . . . . . . . . . . . . . . : 3565 ││ Sequential access only . . . . . . . . . . . . . . . . . : 0 ││ ││ Synchronous reads ││ Total . . . . . . . . . . . . . . . . . . . . . . . . . : 345 ││ Sequential access only . . . . . . . . . . . . . . . . . : 0 ││ ││ Sequential prefetch ││ Requested . . . . . . . . . . . . . . . . . . . . . . . : 14 ││ Reads . . . . . . . . . . . . . . . . . . . . . . . . . : 14 ││ Pages read . . . . . . . . . . . . . . . . . . . . . . . : 14 ││ ││ List prefetch ││ Requested . . . . . . . . . . . . . . . . . . . . . . . : 14 ││ Reads . . . . . . . . . . . . . . . . . . . . . . . . . : 14 ││ Pages read . . . . . . . . . . . . . . . . . . . . . . . : 14 ││ ││ Dynamic prefetch ││ Requested . . . . . . . . . . . . . . . . . . . . . . . : 14 ││ Reads . . . . . . . . . . . . . . . . . . . . . . . . . : 14 ││ Pages read . . . . . . . . . . . . . . . . . . . . . . . : 14 ││ ││ Prefetch disabled ││ No buffer . . . . . . . . . . . . . . . . . . . . . . . : 0 ││ No read engine . . . . . . . . . . . . . . . . . . . . . : 0 ││ ││ Command ===> ________________________________________________________ ││ F1=Help F2=Split F3=Exit F5=Auto F6=History ││ F7=Up F8=Down F9=Swap F10=Delta F11=Interval ││ F12=Cancel F16=Look F17=Collect │└───────────────────────────────────────────────────────────────────────┘
Figure 85. Buffer Pool Window (Screen 1)
DB2 Statistics
136 DB2 PM Online Monitor User’s Guide

┌───────────────────────────────────────────────────────────────────────┐│ DGOMSWBP Buffer Pool BPn ││ ││ INTERVAL 1:01.550 ││ More: - + ││ ││ Hiperpool reads ││ Synchronous . . . . . . . . . . . . . . . . . . . . . . : 0 ││ ││ Asynchronous ││ Without Asynchronous Data Mover Facility . . . . . . . : 0 ││ With Asynchronous Data Mover Facility . . . . . . . . : 0 ││ ││ Unsuccessful ││ Without Asynchronous Data Mover Facility . . . . . . . : 0 ││ With Asynchronous Data Mover Facility . . . . . . . . : 0 ││ Page-ins required for read I/O . . . . . . . . . . . . . . : 0 ││ ││ Write Operations ││ Buffer updates . . . . . . . . . . . . . . . . . . . . . . : 957 ││ Pages written . . . . . . . . . . . . . . . . . . . . . . : 168 ││ Synchronous writes . . . . . . . . . . . . . . . . . . . . : 0 ││ Asynchronous writes . . . . . . . . . . . . . . . . . . . : 41 ││ Write engine not available . . . . . . . . . . . . . . . . : 0 ││ ││ Thresholds reached ││ Deferred write . . . . . . . . . . . . . . . . . . . . . : 0 ││ Vertical deferred write . . . . . . . . . . . . . . . . : 0 ││ Data Manager critical . . . . . . . . . . . . . . . . . : 0 ││ ││ Hiperpool pages written ││ Synchronously . . . . . . . . . . . . . . . . . . . . . : 0 ││ ││ Asynchronously ││ Without Asynchronous Data Mover Facility . . . . . . . : 0 ││ With Asynchronous Data Mover Facility . . . . . . . . : 0 ││ ││ Unsuccessfully ││ Without Asynchronous Data Mover Facility . . . . . . . : 0 ││ With Asynchronous Data Mover Facility . . . . . . . . : 0 ││ Page-ins required for write I/O . . . . . . . . . . . . . : 0 ││ ││ Query Parallelism ││ ││ Prefetch I/O streams ││ Concurrent streams - high water mark . . . . . . . . . . : 0 ││ Streams reduced - buffer shortage . . . . . . . . . . . : 0 ││ Parallel query requests . . . . . . . . . . . . . . . . . : 0 ││ Reduced parallel query requests . . . . . . . . . . . . . : 0 ││ Prefetch quantity reduced to 1/2 . . . . . . . . . . . . . : 0 ││ Prefetch quantity reduced to 1/4 . . . . . . . . . . . . . : 0 ││ ││ Command ===> ________________________________________________________ ││ F1=Help F2=Split F3=Exit F5=Auto F6=History ││ F7=Up F8=Down F9=Swap F10=Delta F11=Interval ││ F12=Cancel F16=Look F17=Collect │└───────────────────────────────────────────────────────────────────────┘
Figure 86. Buffer Pool Window (Screen 2)
DB2 Statistics
Chapter 8. Viewing DB2 Statistics 137

The following list describes some of the important fields shown on this window, andhow to interpret the values contained in these fields.
Buffer pool hit ratio (%)The total number of GETPAGE operations, minus the number of pagesread from DASD (both synchronously and using prefetch), divided by thetotal number of GETPAGE operations, multiplied by 100.
Current active buffersTotal number of current active (nonstealable) buffers at the moment thestatistics were collected. A buffer critical condition is only shown if it occursat that moment. The buffer pool may be too small if the number of activebuffers is greater than the deferred write threshold (DWQT) of the bufferpool.
Getpage requests TotalThe number of GETPAGEs issued by sequential and random requests.
Synchronous reads TotalNumber of synchronous read I/O operations performed by sequential andrandom requests.
Sequential prefetch ReadsNumber of times sequential prefetch reads were performed.
Sequential prefetch Pages readNumber of pages read due to sequential prefetch.
Ratio of Sequential prefetch Pages read to Sequential prefetch Reads willbe between 0 and 32. Normally 32 is the maximum prefetch quantity fortable space scans, whether data or index.
List prefetch ReadsNumber of times list prefetch reads were performed.
List prefetch Pages readNumber of pages read due to list prefetch.
Ratio of List prefetch Pages read to List prefetch Reads will be between 0and 32.
┌───────────────────────────────────────────────────────────────────────┐│ DGOMSWBP Buffer Pool BPn ││ ││ INTERVAL 1:01.550 ││ More: - + ││ ││ Sort/Merge Work File Operations ││ Maximum concurrent work files . . . . . . . . . . . . . . : 0 ││ Requested for all merge passes . . . . . . . . . . . . . : 0 ││ Not created - no buffer . . . . . . . . . . . . . . . . : 0 ││ Prefetch not scheduled - zero quantity . . . . . . . . . : 0 ││ Pages marked to destruct . . . . . . . . . . . . . . . . : 0 ││ Pages not written . . . . . . . . . . . . . . . . . . . : 0 ││ Merge passes requested . . . . . . . . . . . . . . . . . . : 0 ││ Degraded - low buffers . . . . . . . . . . . . . . . . . : 0 ││ Workfile requests rejected - low buffers . . . . . . . . : 0 ││ ││ Command ===> ________________________________________________________ ││ F1=Help F2=Split F3=Exit F5=Auto F6=History ││ F7=Up F8=Down F9=Swap F10=Delta F11=Interval ││ F12=Cancel F16=Look F17=Collect │└───────────────────────────────────────────────────────────────────────┘
Figure 87. Buffer Pool Window (Screen 3)
DB2 Statistics
138 DB2 PM Online Monitor User’s Guide

Dynamic prefetch ReadsNumber of times dynamic prefetch reads were performed.
Dynamic prefetch Pages readNumber of pages read due to dynamic prefetch performed because ofsequential detection.
Ratio of Dynamic prefetch Pages read to Dynamic prefetch Reads arebetween 0 and 32.
Prefetch disabled No bufferNumber of times sequential prefetch was disabled because buffers were notavailable. In other words this is the number of times the sequential prefetchthreshold was reached. This fixed threshold is experienced if 90% of thepages in the buffer pool are unavailable. This has a significant effect onlarge and frequent scans that use sequential prefetch.
Hiperpool reads Unsuccessful Without Asynchronous Data Mover FacilityAn unsuccessful read occurs when a requested page was found in thehiperpool, but its content was discarded by MVS. This count does notinclude pages moved by the Asynchronous Data Mover facility.
Hiperpool reads Unsuccessful With Asynchronous Data Mover FacilityAn unsuccessful read occurs when a requested page is found in thehiperpool but its contents have been discarded by MVS. This count includespages moved by the Asynchronous Data Mover facility.
Buffer updatesNumber of times pages were updated in the buffer pool.
Pages writtenNumber of pages written. This field contains the number of pages in thebuffer pool written to DASD.
Synchronous writesTotal number of immediate writes for a page.
An immediate write can occur when:v Data set is closedv DB2 Checkpoint is takenv Immediate Write Threshold (97.5% pages in the buffer pool are
unavailable) which is a fixed thresholdv A write engine is not available.
Asynchronous writesNumber of asynchronous write I/O operations performed by media managerto a direct access storage device.
Thresholds reached Deferred writeNumber of times the deferred write threshold was reached. This threshold isa percentage of the virtual buffer pool that might be occupied by unavailablepages, including both updated pages and pages in use.
Thresholds reached Vertical deferred writeNumber of times the vertical deferred write threshold was reached. Thisthreshold is expressed as a percentage of the virtual buffer pool that mightbe occupied by updated pages from a single data set.
When this threshold is reached, writes are scheduled for that data set.
Thresholds reached Data manager criticalNumber of times the data manager critical threshold was reached. This
DB2 Statistics
Chapter 8. Viewing DB2 Statistics 139
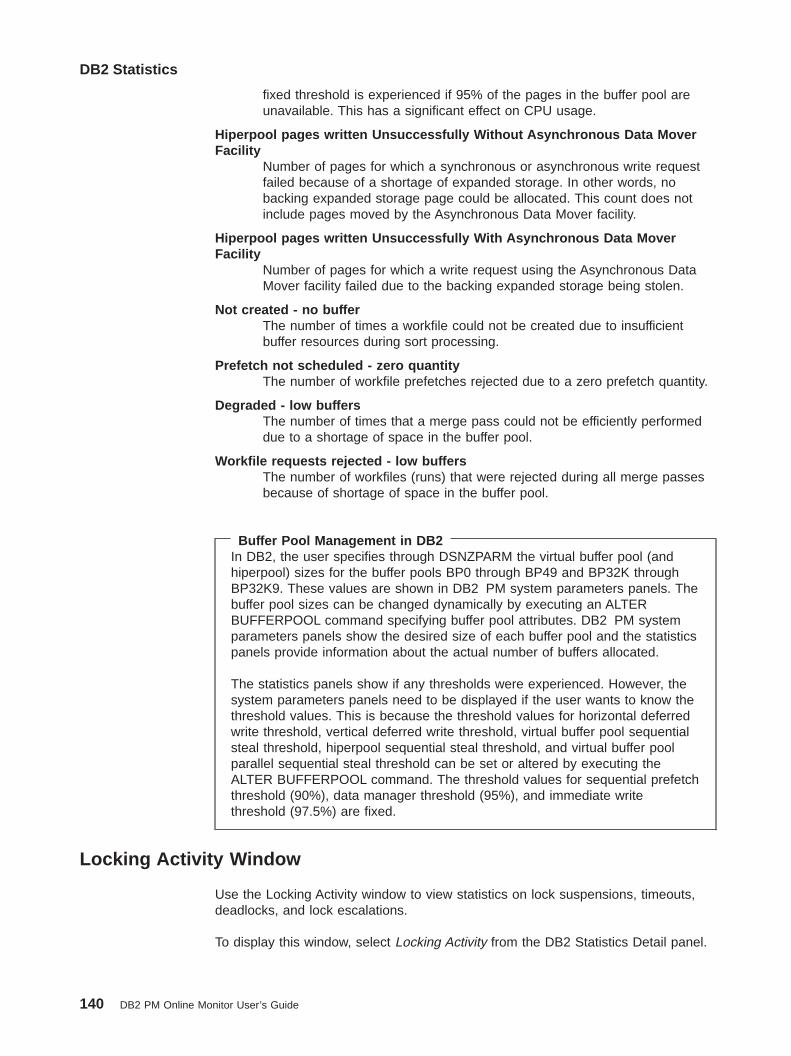
fixed threshold is experienced if 95% of the pages in the buffer pool areunavailable. This has a significant effect on CPU usage.
Hiperpool pages written Unsuccessfully Without Asynchronous Data MoverFacility
Number of pages for which a synchronous or asynchronous write requestfailed because of a shortage of expanded storage. In other words, nobacking expanded storage page could be allocated. This count does notinclude pages moved by the Asynchronous Data Mover facility.
Hiperpool pages written Unsuccessfully With Asynchronous Data MoverFacility
Number of pages for which a write request using the Asynchronous DataMover facility failed due to the backing expanded storage being stolen.
Not created - no bufferThe number of times a workfile could not be created due to insufficientbuffer resources during sort processing.
Prefetch not scheduled - zero quantityThe number of workfile prefetches rejected due to a zero prefetch quantity.
Degraded - low buffersThe number of times that a merge pass could not be efficiently performeddue to a shortage of space in the buffer pool.
Workfile requests rejected - low buffersThe number of workfiles (runs) that were rejected during all merge passesbecause of shortage of space in the buffer pool.
Buffer Pool Management in DB2In DB2, the user specifies through DSNZPARM the virtual buffer pool (andhiperpool) sizes for the buffer pools BP0 through BP49 and BP32K throughBP32K9. These values are shown in DB2 PM system parameters panels. Thebuffer pool sizes can be changed dynamically by executing an ALTERBUFFERPOOL command specifying buffer pool attributes. DB2 PM systemparameters panels show the desired size of each buffer pool and the statisticspanels provide information about the actual number of buffers allocated.
The statistics panels show if any thresholds were experienced. However, thesystem parameters panels need to be displayed if the user wants to know thethreshold values. This is because the threshold values for horizontal deferredwrite threshold, vertical deferred write threshold, virtual buffer pool sequentialsteal threshold, hiperpool sequential steal threshold, and virtual buffer poolparallel sequential steal threshold can be set or altered by executing theALTER BUFFERPOOL command. The threshold values for sequential prefetchthreshold (90%), data manager threshold (95%), and immediate writethreshold (97.5%) are fixed.
Locking Activity Window
Use the Locking Activity window to view statistics on lock suspensions, timeouts,deadlocks, and lock escalations.
To display this window, select Locking Activity from the DB2 Statistics Detail panel.
DB2 Statistics
140 DB2 PM Online Monitor User’s Guide
Application deadlocks and timeouts should be avoided if possible. Unusually highvalues for these fields indicate the existence of a problem application. Exceptionevents and console messages indicate deadlock participants. Use history to viewdetails of the event surrounding the deadlock. You can use the Locked Resourceswindow in thread activity to investigate thread resources locked or held.
Lock escalation counts greater than zero usually indicate an application processthat updates more pages than expected. If this is not the case, examine fields Maxpage locks per table space and Max locks per user on the DB2 System ParametersDetail panel to determine whether to increase DSNZPARM fields NUMLKTS andNUMLKUS (LOCKS PER TABLE(SPACE) and LOCKS PER USER respectively onthe INSTALL DB2 - IRLM PANEL 2 panel DSNTIPJ).
The following list describes some of the important fields shown on this window, andhow to interpret the values contained in these fields.
Lock requestsNumber of times a lock on a resource was requested.
Suspensions - lockNumber of resource conflicts. A suspension is a wait for a lock and each ofthese waits may contribute adversely to DB2 performance. The suspensionmay ultimately result in normal resumption, or, in the case of lockcontention, in a timeout or deadlock. The number of lock suspensions is afunction of the lock requests. Lock suspensions (or conflicts) may occur oneither lock request or change request.
Lock escalations - sharedCount of lock escalations to shared mode. Number of times the LOCKS
┌───────────────────────────────────────────────────┐│ DGOMSWLK Locking Activity ││ ││ INTERVAL 12.634 ││ More: - + ││ Timeouts . . . . . . . . . . . . . : 0 ││ Deadlocks . . . . . . . . . . . . . . . : 0 ││ ││ Lock requests . . . . . . . . . . . . . : 277897 ││ Unlock requests . . . . . . . . . . . . : 84033 ││ Query requests . . . . . . . . . . . . : 24763 ││ Change requests . . . . . . . . . . . . : 25798 ││ Other requests . . . . . . . . . . . . : 3 ││ Suspensions - lock . . . . . . . . . . : 3 ││ Suspensions - latch . . . . . . . . . . : 1540 ││ Suspensions - other . . . . . . . . . . : 24764 ││ Lock escalations - shared . . . . . . . : 0 ││ Lock escalations - exclusive . . . . . : 0 ││ Claim requests . . . . . . . . . . . . : 15149 ││ Unsuccessful claim requests . . . . . . : 6 ││ Drain requests . . . . . . . . . . . . : 1353 ││ Unsuccessful drain requests . . . . . . : 0 ││ ││ Lock and change requests ││ per lock suspensions . . . . . . . . : 101K ││ ││ Command ===> ____________________________________ ││ F1=Help F2=Split F3=Exit F5=Auto ││ F6=History F7=Up F8=Down F9=Swap ││ F10=Delta F11=Interval F12=Cancel F16=Look ││ F17=Collect │└───────────────────────────────────────────────────┘
Figure 88. Locking Activity Window (Statistics)
DB2 Statistics
Chapter 8. Viewing DB2 Statistics 141
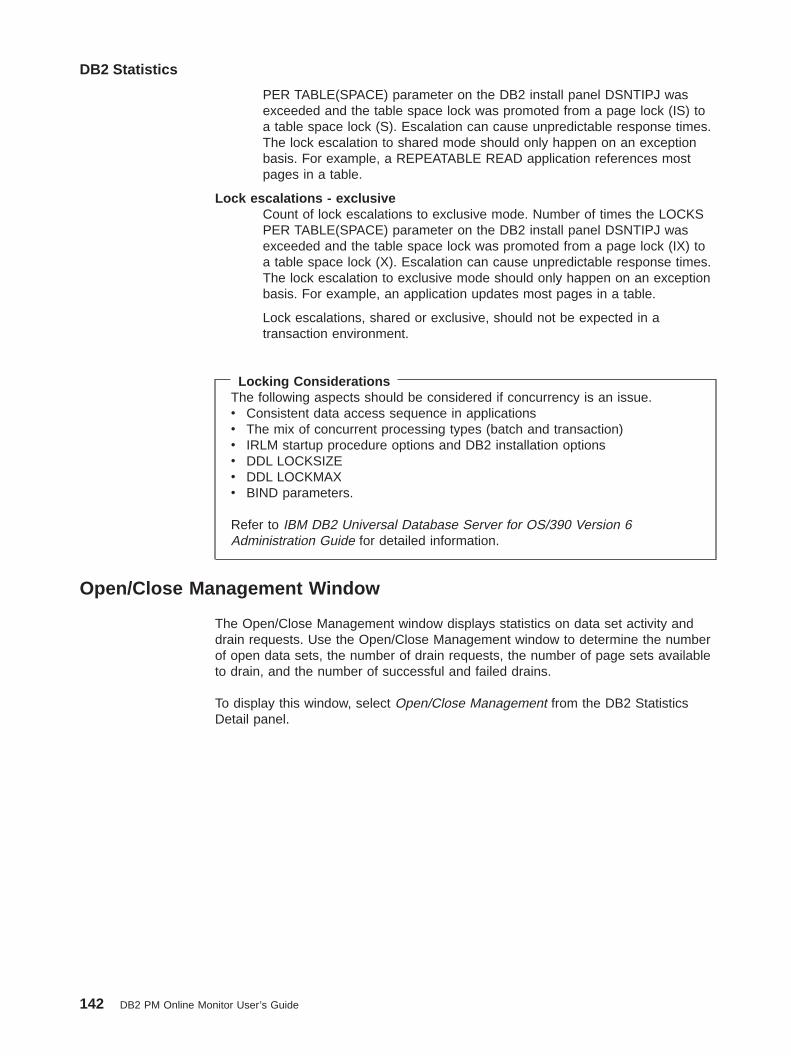
PER TABLE(SPACE) parameter on the DB2 install panel DSNTIPJ wasexceeded and the table space lock was promoted from a page lock (IS) toa table space lock (S). Escalation can cause unpredictable response times.The lock escalation to shared mode should only happen on an exceptionbasis. For example, a REPEATABLE READ application references mostpages in a table.
Lock escalations - exclusiveCount of lock escalations to exclusive mode. Number of times the LOCKSPER TABLE(SPACE) parameter on the DB2 install panel DSNTIPJ wasexceeded and the table space lock was promoted from a page lock (IX) toa table space lock (X). Escalation can cause unpredictable response times.The lock escalation to exclusive mode should only happen on an exceptionbasis. For example, an application updates most pages in a table.
Lock escalations, shared or exclusive, should not be expected in atransaction environment.
Locking ConsiderationsThe following aspects should be considered if concurrency is an issue.v Consistent data access sequence in applicationsv The mix of concurrent processing types (batch and transaction)v IRLM startup procedure options and DB2 installation optionsv DDL LOCKSIZEv DDL LOCKMAXv BIND parameters.
Refer to IBM DB2 Universal Database Server for OS/390 Version 6Administration Guide for detailed information.
Open/Close Management Window
The Open/Close Management window displays statistics on data set activity anddrain requests. Use the Open/Close Management window to determine the numberof open data sets, the number of drain requests, the number of page sets availableto drain, and the number of successful and failed drains.
To display this window, select Open/Close Management from the DB2 StatisticsDetail panel.
DB2 Statistics
142 DB2 PM Online Monitor User’s Guide

The following list describes some of the important fields shown on this window, andhow to interpret the values contained in these fields.
Open data sets High water markThe maximum number of data sets open concurrently (high water mark).
Monitor this field to see whether you are reaching the maximum number ofopen data sets permissible for your system. The maximum number of opendata sets depends on the MVS version, modifications to your system, andvarious other factors. Refer to OS/390 MVS Initialization and Tuning Guidefor the maximum number of open data sets permissible for your system.
Bind Processing Window
Use the Bind Processing window to view statistics on plans successfully bound,attempts to REBIND a plan, automatic binds, and attempts to FREE a plan.
To display this window, select Bind Processing from the DB2 Statistics Detail panel.
┌─────────────────────────────────────────────────────────────────┐│ DGOMSWOC Open/Close Management ││ ││ INTERVAL 3:32.419 ││ Open data sets ││ High water mark . . . . . . . . . . . . . . . . . . : 106 ││ Current . . . . . . . . . . . . . . . . . . . . . . : 105 ││ Not in use, not closed ││ High water mark . . . . . . . . . . . . . . . . . : 106 ││ Current . . . . . . . . . . . . . . . . . . . . . : 103 ││ In use . . . . . . . . . . . . . . . . . . . . . . : 2 ││ ││ Data sets closed - threshold reached . . . . . . . . : 0 ││ ││ Data sets converted from R/W to R/O . . . . . . . . : 1295 ││ ││ Command ===> _________________________________________________ ││ F1=Help F2=Split F3=Exit F5=Auto ││ F6=History F9=Swap F10=Delta F11=Interval ││ F12=Cancel F16=Look F17=Collect │└─────────────────────────────────────────────────────────────────┘
Figure 89. Open/Close Management Window
DB2 Statistics
Chapter 8. Viewing DB2 Statistics 143

The Bind Processing window consists of the following sections:
Bind This section shows statistics on bind events. These events occur when anexplicit DB2 BIND subcommand is issued to bind a plan or package.
RebindThis section shows statistics on rebind events. These events occur when anexplicit DB2 REBIND subcommand is issued to rebind an existing plan orpackage.
AutobindThis section shows statistics on autobind events. These events occur if theplan becomes invalid since the last time the plan was bound. In this case,DB2 rebinds the plan before the plan is executed.
Free This section shows statistics on free events. These events occur when anexplicit DB2 FREE subcommand is issued to remove a DB2 plan orpackage from the DB2 catalog and directory.
┌─────────────────────────────────────────────────────────────┐│ DGOMSWBI Bind Processing ││ ││ INTERVAL 9:21.950 ││ More: - + ││ Bind ││ Plans bound . . . . . . . . . . . . . . . . . . : 6 ││ Plan ADD subcommands . . . . . . . . . . . . . : 0 ││ Plan REPLACE subcommand . . . . . . . . . . . . : 6 ││ Test binds no plan ID . . . . . . . . . . . . . : 0 ││ Packages bound . . . . . . . . . . . . . . . . : 4 ││ Package ADD subcommands . . . . . . . . . . . . : 0 ││ Package REPLACE subcommands . . . . . . . . . . : 4 ││ ││ Rebind ││ Plan subcommands . . . . . . . . . . . . . . . : 0 ││ Plan attempts . . . . . . . . . . . . . . . . . : 0 ││ Plan successful . . . . . . . . . . . . . . . . : 0 ││ Package subcommands . . . . . . . . . . . . . . : 0 ││ Package attempts . . . . . . . . . . . . . . . : 0 ││ Package successful . . . . . . . . . . . . . . : 0 ││ ││ Autobind ││ Plan attempts . . . . . . . . . . . . . . . . : 6 ││ Plan successful . . . . . . . . . . . . . . . . : 2 ││ Invalid resource ID . . . . . . . . . . . . . . : 4 ││ Package attempts . . . . . . . . . . . . . . . : 0 ││ Package successful . . . . . . . . . . . . . . : 0 ││ ││ Free ││ Plan subcommands . . . . . . . . . . . . . . . : 0 ││ Plan attempts . . . . . . . . . . . . . . . . . : 0 ││ Plan successful . . . . . . . . . . . . . . . . : 0 ││ Package subcommands . . . . . . . . . . . . . . : 0 ││ Package attempts . . . . . . . . . . . . . . . : 0 ││ Package successful . . . . . . . . . . . . . . : 0 ││ ││ Command ===> _____________________________________________ ││ F1=Help F2=Split F3=Exit F5=Auto F6=History ││ F7=Up F8=Down F9=Swap F10=Delta F11=Interval ││ F12=Cancel F16=Look F17=Collect │└─────────────────────────────────────────────────────────────┘
Figure 90. Bind Processing Window
DB2 Statistics
144 DB2 PM Online Monitor User’s Guide
Plan and Package Allocation Window
Use the Plan and Package Allocation window to check plan/package allocationattempts and successes, and authorization management attempts and successes.
To display this window, select Plan/Package Allocation, Authorization Managementfrom the DB2 Statistics Detail panel.
Successful without catalog accessThe number of successful authorization checks not using the DB2 catalog,that is, using plan cache checks and public checks.
For transaction level security, ENABLE and DISABLE on BIND PACKAGEshould be used to ensure adequate security. Granting execute authority onthe plan to public may be quite adequate. Refer to IBM DB2 UniversalDatabase Server for OS/390 Version 6 Administration Guide for detailedinformation.
Log Manager Window
Use the Log Manager window to check read and write activity both to and from thelog.
To display this window, select Log Manager from the DB2 Statistics Detail panel.
┌───────────────────────────────────────────────────────────────┐│ DGOMSWSV Plan and Package Allocation ││ ││ INTERVAL 2:48.421 ││ More: - + ││ Plan Allocation ││ Attempts . . . . . . . . . . . . . . . . . . . . : 111 ││ Successful . . . . . . . . . . . . . . . . . . . : 107 ││ ││ Package Allocation ││ Attempts . . . . . . . . . . . . . . . . . . . . : 11 ││ Successful . . . . . . . . . . . . . . . . . . . : 11 ││ ││ Plan Authorization Management ││ Attempts . . . . . . . . . . . . . . . . . . . . : 206 ││ Successful . . . . . . . . . . . . . . . . . . . : 206 ││ Successful without catalog access . . . . . . . . : 65 ││ Successful public plan . . . . . . . . . . . . . : 65 ││ ││ Package Authorization Management ││ Successful . . . . . . . . . . . . . . . . . . . : 3 ││ Successful public . . . . . . . . . . . . . . . . : 1 ││ Unsuccessful - catalog required . . . . . . . . . : 1 ││ Overwritten authid in cache . . . . . . . . . . . : 1 ││ Overwritten in cache . . . . . . . . . . . . . . : 1 ││ Command ===> _______________________________________________ ││ F1=Help F2=Split F3=Exit F5=Auto ││ F6=History F7=Up F8=Down F9=Swap ││ F10=Delta F11=Interval F12=Cancel F16=Look ││ F17=Collect │└───────────────────────────────────────────────────────────────┘
Figure 91. Plan and Package Allocation Window
DB2 Statistics
Chapter 8. Viewing DB2 Statistics 145

If a high percentage of reads comes from the archive log, it might be necessary toincrease the size of the active log. For example, a large update job with fewcommits could fill the active log forcing an archive. If the job fails, recovery isrequired to retrieve records from the archive log. Archive activity can be expensivein terms of response time, especially if the archive log is placed on slow devicessuch as tape or cartridge.
The following list describes some of the important fields shown on this window, andhow to interpret the values contained in these fields.
Tape volume contentionNumber of read accesses delayed due to tape volume contention (that is, atape volume was already in use by another thread).
Unavailable resourceNumber of read accesses delayed due to an unavailable resource. This canbe due to an insufficient number of tape units allocated, or because thearchive log read service task is not available.
Write output log buffersThe number of write requests issued irrespective of single or dual logging.This field is updated once per buffer write. The update value is either one or
┌────────────────────────────────────────────────────────────────────┐│ DGOMSWLG Log Manager ││ ││ INTERVAL 2:48.421 ││ More: - + ││ Reads satisfied ││ From output buffer . . . . . . . . . . . . . . . . . . : 0 ││ From active log . . . . . . . . . . . . . . . . . . . . : 1475 ││ From archive log . . . . . . . . . . . . . . . . . . . : 0 ││ ││ Reads delayed ││ Tape volume contention . . . . . . . . . . . . . . . . : 0 ││ Unavailable resource . . . . . . . . . . . . . . . . . : 0 ││ ││ Look ahead mounts attempted . . . . . . . . . . . . . . . : 23 ││ Look ahead mounts successful . . . . . . . . . . . . . . : 3 ││ ││ Write-no-wait . . . . . . . . . . . . . . . . . . . . . . : 151 ││ Write output log buffers . . . . . . . . . . . . . . . . : 3 ││ ││ Total BSDS access requests . . . . . . . . . . . . . . . : 26 ││ Unavailable output log buffers . . . . . . . . . . . . . : 0 ││ ││ Active log ││ Control intervals created . . . . . . . . . . . . . . . : 3 ││ ││ Archive log ││ Read allocations . . . . . . . . . . . . . . . . . . . : 0 ││ Write allocations . . . . . . . . . . . . . . . . . . . : 0 ││ Control intervals offloaded . . . . . . . . . . . . . . : 0 ││ ││ Output log buffer writes per ││ active log control interval created . . . . . . . . . . : 1.0 ││ ││ Command ===> _____________________________________________________ ││ F1=Help F2=Split F3=Exit F5=Auto F6=History ││ F7=Up F8=Down F9=Swap F10=Delta F11=Interval ││ F12=Cancel F16=Look F17=Collect │└────────────────────────────────────────────────────────────────────┘
Figure 92. Log Manager Window
DB2 Statistics
146 DB2 PM Online Monitor User’s Guide

two I/Os, depending on which logging option is chosen (single or dual). Thisshould have a value consistent with the known workload update rate.
Unavailable output log buffersThis field shows how many times a write request to the active log had towait because no buffer was available. The value should ideally be zero asthese waits should not occur. If these waits do occur, the output buffermight be too small, or the size of the write threshold might be too close tothe size of the output buffer.
Active log Control intervals createdNumber of active log output control intervals created. Log records areplaced sequentially in output log buffers, which are formatted as VSAMcontrol intervals. The control intervals are written to a set of predefinedDASD active log data sets, which are used sequentially and recycled.
A useful ratio is: Write output log buffers divided by Active log Controlintervals created.
Logging Considerations
Minimize device contention on the log data sets by placing data sets correctly,that is, if using dual logging, do not place both logs on the same volume.
Avoid waits that occur because no log buffer is available.
Define enough active log data sets to prevent DB2 from waiting while a log isarchived.
Make the active logs large enough that backouts do not have to use thearchive log.
Consider the 3990 DASD FAST WRITE controller for the log. Performancemeasurements have shown that sequential access mode with DASD FASTWRITE provided substantially better performance than native DASD when theamount of log data written per commit was 24 KB or less. DASD FAST WRITEperformance was comparable to that of native DASD when 48 KB of log datawas written to DASD for each commit. When more than 48 KB was written,native DASD performed better than DASD FAST WRITE. Therefore there maybe a need to determine in which environments log performance is critical inorder to assess the value of DASD FAST WRITE.
Subsystem Service Window
Use the Subsystem Service window to view DB2 subsystem activity, such asconnections to DB2, threads, commits, and units of recovery. You can examinethese statistics to determine the work load of various subsystem functions, and tohelp you adjust DB2 system parameters for optimum system performance.
To display this window, select Subsystem Service from the DB2 Statistics Detailpanel.
DB2 Statistics
Chapter 8. Viewing DB2 Statistics 147

The following list describes some of the important fields shown on this window, andhow to interpret the values contained in these fields.
IdentifyThe number of successful connections to DB2 from an allied address space(for example TSO, BATCH, CICS, IMS, CAF, RRSAF, or UTILITY).
Create threadThe number of threads created. Thread creation can be a significant part ofthe cost in a short transaction. Thread reuse (discussed later) can helpimprove performance.
SignonThe number of signons that have occurred in IMS or CICS. If the number ofsignons is greater than the number of create thread occurrences, somethreads have been reused. In the case of the TSO attachment facility andthe call attachment facility (CAF), there is no sign-on, because the user isidentified when the TSO address space is connected.
┌─────────────────────────────────────────────────────────────┐│ DGOMSWSS Subsystem Service ││ ││ INTERVAL 2:48.421 ││ More: - + ││ Identify . . . . . . . . . . . . . . . . . . . . . : 60 ││ Create thread . . . . . . . . . . . . . . . . . . : 168 ││ Signon . . . . . . . . . . . . . . . . . . . . . . : 3 ││ Terminate . . . . . . . . . . . . . . . . . . . . : 107 ││ Rollback . . . . . . . . . . . . . . . . . . . . . : 6 ││ ││ Synchs (single phase commit) . . . . . . . . . . . : 106 ││ Queued at create thread . . . . . . . . . . . . . : 0 ││ ││ Commits ││ Phase 1 . . . . . . . . . . . . . . . . . . . . . : 1 ││ Phase 2 . . . . . . . . . . . . . . . . . . . . . : 0 ││ Read only . . . . . . . . . . . . . . . . . . . . : 1 ││ ││ Subsystem allied memory ││ End of task . . . . . . . . . . . . . . . . . . . : 3 ││ End of memory . . . . . . . . . . . . . . . . . . : 0 ││ ││ System event checkpoints . . . . . . . . . . . . . : 2 ││ ││ Units of Recovery ││ Indoubt resolved . . . . . . . . . . . . . . . . : 0 ││ Gone indoubt . . . . . . . . . . . . . . . . . . : 0 ││ ││ Command ===> ______________________________________________ ││ F1=Help F2=Split F3=Exit F5=Auto F6=History ││ F7=Up F8=Down F9=Swap F10=Delta F11=Interval ││ F12=Cancel F16=Look F17=Collect │└─────────────────────────────────────────────────────────────┘
Figure 93. Subsystem Service Window
DB2 Statistics
148 DB2 PM Online Monitor User’s Guide

Thread Reuse
The term thread reuse only applies to IMS and CICS attachments. In the caseof the TSO attachment facility and the call attachment facility (CAF), threadscannot be reused, because the threads are allocated to the user addressspace.
Thread reuse should be considered in the following cases:
v If transaction volume is high:
High volume transactions should achieve a high percentage of threadreuse. If threads are reused on low volume transactions, the number ofthreads needed increases because these threads are not automaticallyterminated by IMS when not being used. This may result in too many idlethreads for the level of the DB2 workload. Under CICS, protected threadsare terminated after the purge cycle (user-specified, with a minimum of 30seconds and up to 59 minutes and 59 seconds, and an average of 45seconds in DB2 V3) if no transaction eligible to reuse the thread has beenreceived.
v If thread creation cost is significant:
As a rule of thumb, more than 5% of the total CPU cost of transactionprocessing is considered significant.
The ACQUIRE and RELEASE parameters of BIND should be specified tominimize the thread creation cost, while providing the needed concurrency:
v If most of the application plan’s SQL statements are executed, thenACQUIRE(ALLOCATE) is cheaper than ACQUIRE(USE).
v If only a small number of the SQL statements are executed,ACQUIRE(USE) becomes cheaper and improves concurrency, because therequired resources are only acquired (locked) when the plan actuallyreferences (uses) them. An example would be a generalized plan used bymany different transactions. It would contain multiple logic paths referencingdifferent tables.
Note that when packages are involved, ACQUIRE(USE) is always implicitlyused.
v Concurrency in thread reuse is based on page locking provided by the ISand IX intent locks, whose duration is governed by ACQUIRE andRELEASE of BIND.
RELEASE(DEALLOCATE) is strongly recommended for thread-reusetransactions to reduce transaction CPU time.
When thread reuse is implemented, monitor the EDM pool. It should besufficient in size to accommodate expanding plans where the next transactionrequires additional plan sections over those already part of the EDM pool.
DB2 Statistics
Chapter 8. Viewing DB2 Statistics 149

TerminateThe number of threads that have been terminated. The value of this field isusually greater than the number of create thread occurrences, because italso includes the termination of connections to DB2 (IDENTIFY) and otherinternal counts.
Synchs (single phase commit)The number of commits from TSO, CAF, and UTILITY environments.
Queued at create threadThe number of create thread requests queued. This count does not includeDBATs.
Monitoring this field is useful in determining the right setting for the MAXUSERS option on the DSNTIPE installation panel. This parameter is usedto control the number of threads (excluding DBATs) in the DB2 system.
Rule of thumb: About 1% thread queuing is acceptable.
Commits Phase 1The number of successful requests for COMMIT PHASE 1 of two-phasecommit (BEGIN COMMIT). IMS, CICS, and RRS applications use thePREPARE and COMMIT sequence to commit work. This value does notinclude successful single-phase commits.
Commits Phase 2The number of successful requests for COMMIT PHASE 2. IMS, CICS, andRRS applications use the PREPARE and COMMIT sequence to commitwork. This value does not include successful single-phase commits. Anonzero value for this field indicates that updates have occurred.
Commits Read onlyThe number of times read operations were completed in a two-phasecommit environment.
System event checkpointsA count of the number of checkpoints DB2 has taken. The checkpointinterval is defined by the number of log records you specify for checkpointfrequency (LOGLOAD in DSN6SYSP). A checkpoint is taken when thespecified number of log records have been written. A checkpoint is alsotaken each time DB2 switches to a new active log data set. If the statisticsinterval is 30 minutes and the value of this field is 15, then DB2 is takingcheckpoints every 2 minutes.
SQL Activity Window
Use the SQL Activity window to view subsystem-wide SQL activity for determiningthe SQL workload on the system. This information displays the number of timeseach SQL statement has been executed. To display this window, select SQL Activityfrom the DB2 Statistics Detail panel.
DB2 Statistics
150 DB2 PM Online Monitor User’s Guide
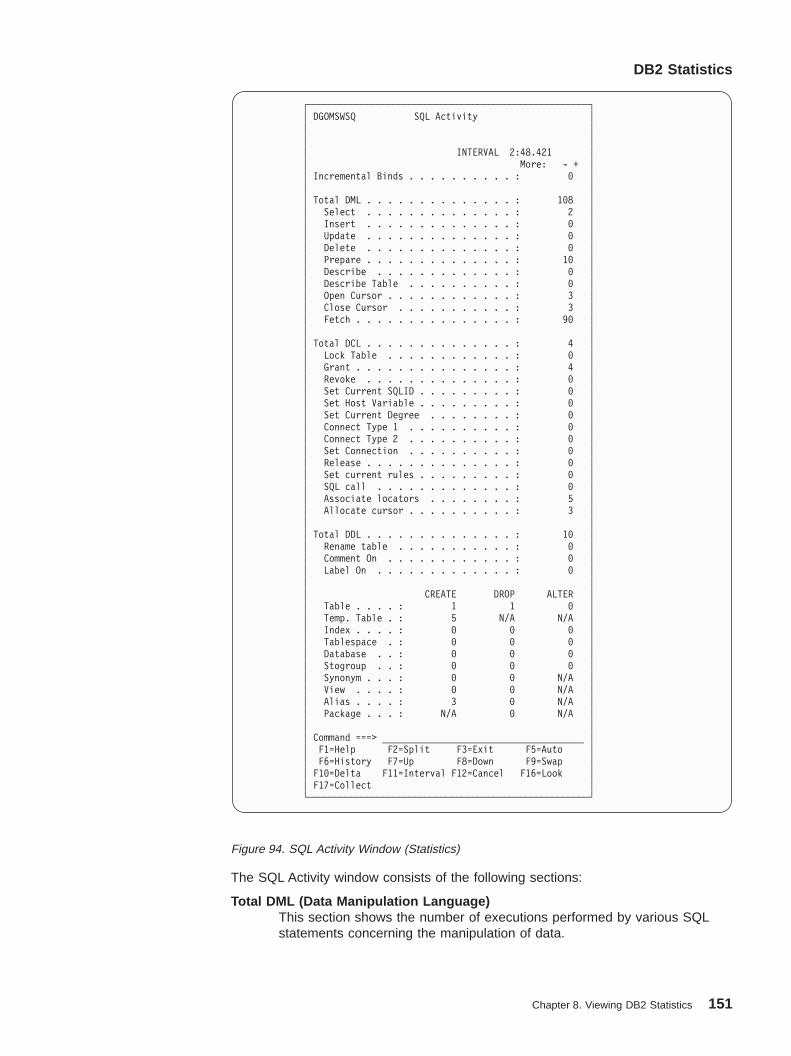
The SQL Activity window consists of the following sections:
Total DML (Data Manipulation Language)This section shows the number of executions performed by various SQLstatements concerning the manipulation of data.
┌─────────────────────────────────────────────────────┐│ DGOMSWSQ SQL Activity ││ ││ ││ INTERVAL 2:48.421 ││ More: - + ││ Incremental Binds . . . . . . . . . . : 0 ││ ││ Total DML . . . . . . . . . . . . . . : 108 ││ Select . . . . . . . . . . . . . . : 2 ││ Insert . . . . . . . . . . . . . . : 0 ││ Update . . . . . . . . . . . . . . : 0 ││ Delete . . . . . . . . . . . . . . : 0 ││ Prepare . . . . . . . . . . . . . . : 10 ││ Describe . . . . . . . . . . . . . : 0 ││ Describe Table . . . . . . . . . . : 0 ││ Open Cursor . . . . . . . . . . . . : 3 ││ Close Cursor . . . . . . . . . . . : 3 ││ Fetch . . . . . . . . . . . . . . . : 90 ││ ││ Total DCL . . . . . . . . . . . . . . : 4 ││ Lock Table . . . . . . . . . . . . : 0 ││ Grant . . . . . . . . . . . . . . . : 4 ││ Revoke . . . . . . . . . . . . . . : 0 ││ Set Current SQLID . . . . . . . . . : 0 ││ Set Host Variable . . . . . . . . . : 0 ││ Set Current Degree . . . . . . . . : 0 ││ Connect Type 1 . . . . . . . . . . : 0 ││ Connect Type 2 . . . . . . . . . . : 0 ││ Set Connection . . . . . . . . . . : 0 ││ Release . . . . . . . . . . . . . . : 0 ││ Set current rules . . . . . . . . . : 0 ││ SQL call . . . . . . . . . . . . . : 0 ││ Associate locators . . . . . . . . : 5 ││ Allocate cursor . . . . . . . . . . : 3 ││ ││ Total DDL . . . . . . . . . . . . . . : 10 ││ Rename table . . . . . . . . . . . : 0 ││ Comment On . . . . . . . . . . . . : 0 ││ Label On . . . . . . . . . . . . . : 0 ││ ││ CREATE DROP ALTER ││ Table . . . . : 1 1 0 ││ Temp. Table . : 5 N/A N/A ││ Index . . . . : 0 0 0 ││ Tablespace . : 0 0 0 ││ Database . . : 0 0 0 ││ Stogroup . . : 0 0 0 ││ Synonym . . . : 0 0 N/A ││ View . . . . : 0 0 N/A ││ Alias . . . . : 3 0 N/A ││ Package . . . : N/A 0 N/A ││ ││ Command ===> ______________________________________ ││ F1=Help F2=Split F3=Exit F5=Auto ││ F6=History F7=Up F8=Down F9=Swap ││ F10=Delta F11=Interval F12=Cancel F16=Look ││ F17=Collect │└─────────────────────────────────────────────────────┘
Figure 94. SQL Activity Window (Statistics)
DB2 Statistics
Chapter 8. Viewing DB2 Statistics 151

Total DCL (Data Control Language)This section shows the number of executions performed by various SQLstatements concerning the controlling of various activities.
Total DDL (Data Definition language)This section shows a table containing the number of executions performedby various DDL SQL statements for each of the applicable object types.These SQL statements are used to create, drop, and alter objects.
Incremental BindsThis field is the number of INCREMENTAL BINDs.
If a plan is bound with VALIDATE(RUN), DB2 performs validity checks(such as authorizations and existence of referenced DB2 objects) at bindtime and rechecks any failures at run time. This can result in catalogcontention and degraded application performance, depending on thenumber of statements flagged and the number of times they are executed.Therefore VALIDATE(RUN) should be avoided as much as possible. Ensurethat all objects are created and all privileges are granted before binding,and select the VALIDATE(BIND) option.
In addition to plans bound with VALIDATE(RUN), this counter isincremented for plans using DB2 private protocol.
PREPARE Detail Window
Use the PREPARE Detail window to view information about the treatment ofPREPARE commands as well as information on kept dynamic statements anddynamic cached statements.
To display this window, select PREPARE Detail from the DB2 Statistics Detail panel.
The following list describes the fields shown on this window, and how to interpretthe values contained in these fields.
Prepares satisfiedThe number of times a PREPARE command was satisfied by copying astatement from the prepared statement cache.
┌───────────────────────────────────────────────────────────┐│ DGOMSWPD PREPARE Detail ││ ││ ││ Prepares satisfied . . . . . . . . . . . . . : 123 ││ Prepares received . . . . . . . . . . . . . : 4 ││ Prepares implicit . . . . . . . . . . . . . : 12 ││ Prepares avoided . . . . . . . . . . . . . . : 12223 ││ Kept dynamic statement discarded . . . . . . : 12 ││ Dynamic cache statement purged . . . . . . . : 4 ││ ││ Command ===> ____________________________________________ ││ F1=Help F2=Split F3=Exit F5=Auto ││ F6=History F9=Swap F10=Delta F11=Interval ││ F12=Cancel │└───────────────────────────────────────────────────────────┘
Figure 95. PREPARE Detail Window (Statistics)
DB2 Statistics
152 DB2 PM Online Monitor User’s Guide
Prepares receivedThe number of times a PREPARE command was received, but a matchingstatement was not found in the prepared statement cache. Cache search isonly done for DML SQL.
Prepares implicitThe number of times an implicit prepare was performed becauseKEEPDYNAMIC(YES) was used and an open, execute, or describe for adynamic SQL statement has occurred after a commit.
Prepares avoidedThe number of times a prepare was avoided because theKEEPDYNAMIC(YES) bind option was used and an open, execute, ordescribe for a dynamic SQL statement has occurred after a commit.
Kept dynamic statement discardedThe number of times a kept dynamic statement was discarded because theMAXKEEPD system limit has been reached.
Dynamic cache statement purgedThe number of times a dynamic cached statement was purged from thecache because a dependent object was dropped or altered.
Query Parallelism Data Window
Use the Query Parallelism Data window to view information on the total number ofparallel groups executed and to find out whether the type or degree of parallelismwas changed at run time.
To display this window, select Query Parallelism Data from the DB2 Statistics Detailpanel.
DB2 Statistics
Chapter 8. Viewing DB2 Statistics 153
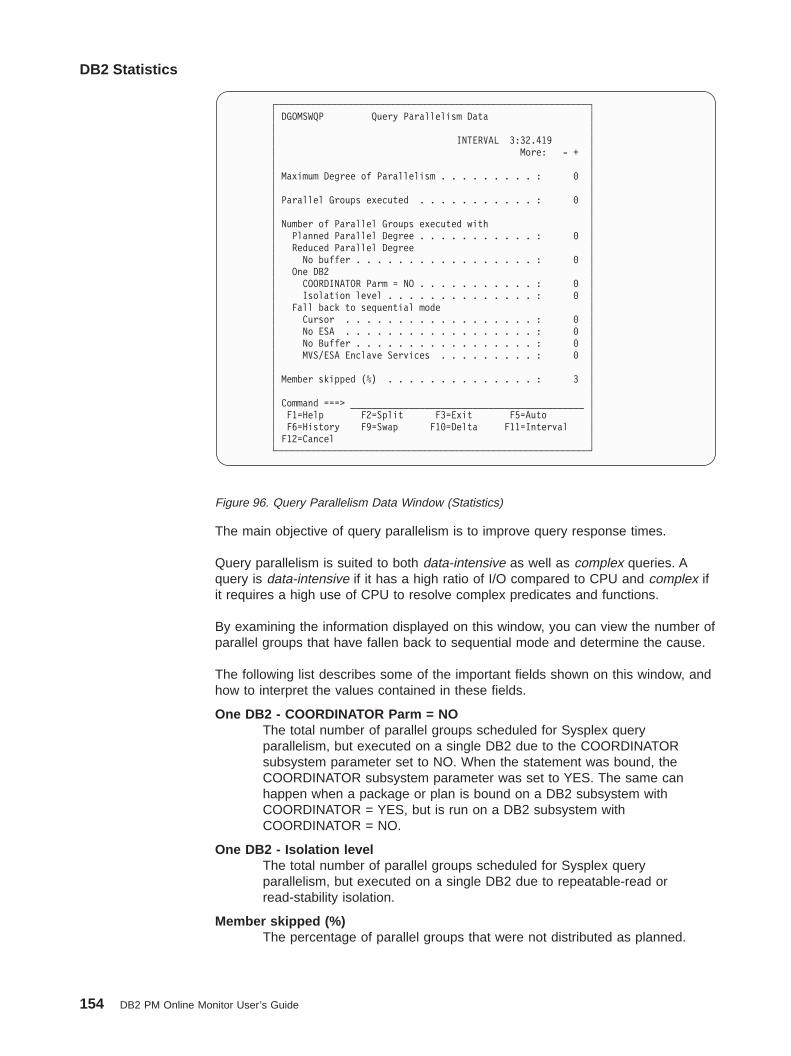
The main objective of query parallelism is to improve query response times.
Query parallelism is suited to both data-intensive as well as complex queries. Aquery is data-intensive if it has a high ratio of I/O compared to CPU and complex ifit requires a high use of CPU to resolve complex predicates and functions.
By examining the information displayed on this window, you can view the number ofparallel groups that have fallen back to sequential mode and determine the cause.
The following list describes some of the important fields shown on this window, andhow to interpret the values contained in these fields.
One DB2 - COORDINATOR Parm = NOThe total number of parallel groups scheduled for Sysplex queryparallelism, but executed on a single DB2 due to the COORDINATORsubsystem parameter set to NO. When the statement was bound, theCOORDINATOR subsystem parameter was set to YES. The same canhappen when a package or plan is bound on a DB2 subsystem withCOORDINATOR = YES, but is run on a DB2 subsystem withCOORDINATOR = NO.
One DB2 - Isolation levelThe total number of parallel groups scheduled for Sysplex queryparallelism, but executed on a single DB2 due to repeatable-read orread-stability isolation.
Member skipped (%)The percentage of parallel groups that were not distributed as planned.
┌───────────────────────────────────────────────────────────┐│ DGOMSWQP Query Parallelism Data ││ ││ INTERVAL 3:32.419 ││ More: - + ││ ││ Maximum Degree of Parallelism . . . . . . . . . : 0 ││ ││ Parallel Groups executed . . . . . . . . . . . : 0 ││ ││ Number of Parallel Groups executed with ││ Planned Parallel Degree . . . . . . . . . . . : 0 ││ Reduced Parallel Degree ││ No buffer . . . . . . . . . . . . . . . . . : 0 ││ One DB2 ││ COORDINATOR Parm = NO . . . . . . . . . . . : 0 ││ Isolation level . . . . . . . . . . . . . . : 0 ││ Fall back to sequential mode ││ Cursor . . . . . . . . . . . . . . . . . . : 0 ││ No ESA . . . . . . . . . . . . . . . . . . : 0 ││ No Buffer . . . . . . . . . . . . . . . . . : 0 ││ MVS/ESA Enclave Services . . . . . . . . . : 0 ││ ││ Member skipped (%) . . . . . . . . . . . . . . : 3 ││ ││ Command ===> ____________________________________________ ││ F1=Help F2=Split F3=Exit F5=Auto ││ F6=History F9=Swap F10=Delta F11=Interval ││ F12=Cancel │└───────────────────────────────────────────────────────────┘
Figure 96. Query Parallelism Data Window (Statistics)
DB2 Statistics
154 DB2 PM Online Monitor User’s Guide

The purpose of this count is to indicate situations with insufficient buffers ona member so that the parallelism coordinator has to bypass a DB2 whendistributing tasks.
RID List Processing Window
Use the RID List Processing window to view the number of blocks concurrentlyallocated for RID entries (maximum and current), and the number of times RID listprocessing has been terminated.
To display this window, select RID List Processing from the DB2 Statistics Detailpanel.
RID list processing can terminate because the number of RID entries exceeds theRDS limit, the number of RID entries exceeds the data manager limit, or becausethe maximum RID list storage is exceeded.
The following list describes some of the important fields shown on this window, andhow to interpret the values contained in these fields.
No storageNumber of times RID list processing was terminated due to insufficientstorage.
This failure occurs when the 2 GB limit is reached. You cannot increasevirtual storage beyond 2 GB.
RDS limit exceededThe number of times RID list processing was terminated because either thenumber of RID entries was greater than the maximum limit of 25% of thetable size, or because the number of RID entries that can fit into theguaranteed number of RID blocks was exceeded. The latter can onlyhappen when RID blocks allocated Maximum approaches the RID liststorage size. There is one guaranteed RID block.
DM limit exceededNumber of times RID list processing was terminated because the number ofRID entries exceeded the Data Manager limit of 16 million.
┌─────────────────────────────────────────────────────┐│ DGOMSWRP RID List Processing ││ ││ INTERVAL 3:32.419 ││ More: - + ││ RID blocks allocated ││ Maximum . . . . . . . . . . . . . . . . : 6 ││ Current . . . . . . . . . . . . . . . . : 0 ││ ││ Terminated ││ No storage . . . . . . . . . . . . . . : 0 ││ RDS limit exceeded . . . . . . . . . . : 0 ││ DM limit exceeded . . . . . . . . . . . : 0 ││ Process limit exceeded . . . . . . . . : 0 ││ ││ Command ===> ______________________________________ ││ F1=Help F2=Split F3=Exit F5=Auto ││ F6=History F9=Swap F10=Delta F11=Interval ││ F12=Cancel F16=Look F17=Collect │└─────────────────────────────────────────────────────┘
Figure 97. RID List Processing Window (Statistics)
DB2 Statistics
Chapter 8. Viewing DB2 Statistics 155

Process limit exceededNumber of times RID list processing was terminated due to the maximumRID list storage used.
The size is determined by the installation parameter RID POOL SIZE (DB2install panel DSNTIPC). It can be 0, or between 16 KB and 1 GB.
The general formula for calculating the RID pool size is:Number of concurrent RID processing activities xaverage number of RIDs x 2 x 5 bytes per RID
Distributed Data Window
Use the Distributed Data window to view subsystem-wide Distributed Data Facility(DDF) activity, and to examine a list of remote locations involved in this activity. Ifmany remote locations are involved in distributed activity, you can use the scrollingkeys F7 (Up) and F8 (Down) to browse the list.
To display this window, select Distributed Data from the DB2 Statistics Detail panel.
From this window, you can select any remote location listed to display the RemoteLocation window, where the remote location can be examined in greater detail.
DBATs queued - maximum activeMonitoring this field is useful in developing the right setting for theDSNTIPE parameter MAX REMOTE ACTIVE. This parameter is used tocontrol the number of DBATs that can be concurrently active in the DB2system.
Rule of thumb:
About 1% DBAT queuing is acceptable.
┌──────────────────────────────────────────────────────────────────────┐│ DGOMSWDD Distributed Data ROW 2 TO 2 OF 2 ││ ││ INTERVAL 3:03.838 ││ For additional details, type any character next to the location, ││ then press Enter. ││ ││ DBATs queued - maximum active . . . . . . . . . : 0 ││ Conversations deallocated - maximum concurrent . : 0 ││ Active / Inactive DBATs currently . . . . . . . : 0 / 0 ││ Active / Inactive DBATs high water mark . . . . : 14 / 0 ││ Total DBATs high water mark . . . . : 14 ││ Cold / warm start connections . . . . . . . . : 0 / 0 ││ Resynchronization attempted / succeeded . . . . : 0 / 0 ││ ││ Location Transactions Conversations ││ _ DSNAPC5 Sent 12 12 ││ Recv 0 0 ││ _ DSNAPC1 Sent 2 2 ││ Recv 0 0 ││ --- End of Location List --- ││ ││ Command ===> ______________________________________________________ ││ F1=Help F2=Split F3=Exit F5=Auto F6=History ││ F7=Up F8=Down F9=Swap F10=Delta F11=Interval ││ F12=Cancel F16=Look F17=Collect │└──────────────────────────────────────────────────────────────────────┘
Figure 98. Distributed Data Window (Statistics)
DB2 Statistics
156 DB2 PM Online Monitor User’s Guide

MAX REMOTE ACTIVE
The MAX REMOTE ACTIVE option on the install panel DSNTIPE isused to specify the number of database access threads that can beactive at the same time as opposed to MAX USERS on the samepanel which specifies the maximum number of allied threads. Thecombined maximum allowed for MAX USERS and MAX REMOTEACTIVE cannot exceed 2 000.
MAX REMOTE CONNECTED on the DB2 install panel DSNTIPErepresents the number of database access threads that canconcurrently exist. This number cannot exceed 25 000.
The total number of inactive database access threads is the differencebetween MAX REMOTE CONNECTED and MAX REMOTE ACTIVE.
An installation may choose, via DDF THREADS on the DB2 installpanel DSNTIPR, to have database access threads considered inactivewhen the last operation of the thread was a commit or rollback, allpackages used by the database access thread had the RELEASE(COMMIT) option, and the thread holds no database locks (includingnot having any cursors open with the HOLD option). When this is thecase, the thread is removed from active thread lists and moved toinactive thread lists.
If the limit set by MAX REMOTE ACTIVE parameter is reached,remote SQL requests are queued until a DBAT can be created. Thenumber of times queuing occurred is shown by the field DBATsqueued - maximum active. If necessary, the value of MAX REMOTEACTIVE should be increased.
Note: The Distributed Data window is not accessible if there is no distributedactivity.
Remote Location Window
Use the Remote Location window to view statistics regarding the distribution of databy the remote location selected from the Distributed Data window. These statisticsshow the number of distributed data events performed at this remote location.
To display this window, select any remote location listed on the Distributed Datawindow.
DB2 Statistics
Chapter 8. Viewing DB2 Statistics 157
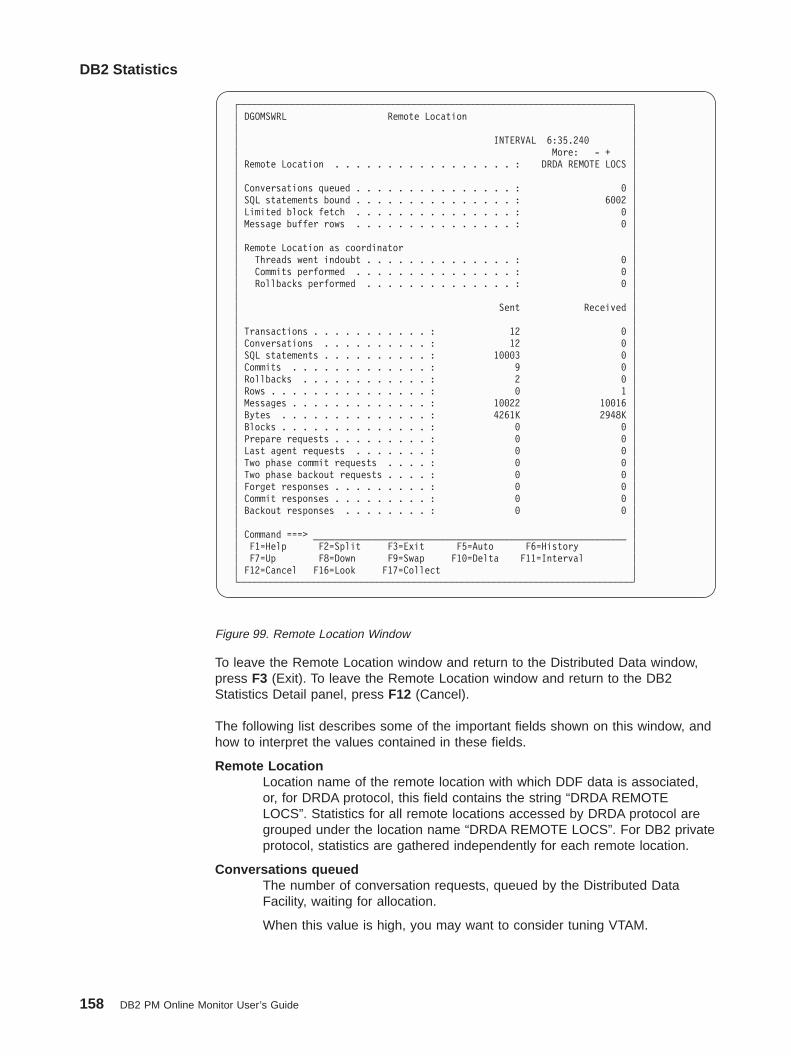
To leave the Remote Location window and return to the Distributed Data window,press F3 (Exit). To leave the Remote Location window and return to the DB2Statistics Detail panel, press F12 (Cancel).
The following list describes some of the important fields shown on this window, andhow to interpret the values contained in these fields.
Remote LocationLocation name of the remote location with which DDF data is associated,or, for DRDA protocol, this field contains the string “DRDA REMOTELOCS”. Statistics for all remote locations accessed by DRDA protocol aregrouped under the location name “DRDA REMOTE LOCS”. For DB2 privateprotocol, statistics are gathered independently for each remote location.
Conversations queuedThe number of conversation requests, queued by the Distributed DataFacility, waiting for allocation.
When this value is high, you may want to consider tuning VTAM.
┌──────────────────────────────────────────────────────────────────────────┐│ DGOMSWRL Remote Location ││ ││ INTERVAL 6:35.240 ││ More: - + ││ Remote Location . . . . . . . . . . . . . . . . . : DRDA REMOTE LOCS ││ ││ Conversations queued . . . . . . . . . . . . . . . : 0 ││ SQL statements bound . . . . . . . . . . . . . . . : 6002 ││ Limited block fetch . . . . . . . . . . . . . . . : 0 ││ Message buffer rows . . . . . . . . . . . . . . . : 0 ││ ││ Remote Location as coordinator ││ Threads went indoubt . . . . . . . . . . . . . . : 0 ││ Commits performed . . . . . . . . . . . . . . . : 0 ││ Rollbacks performed . . . . . . . . . . . . . . : 0 ││ ││ Sent Received ││ ││ Transactions . . . . . . . . . . . : 12 0 ││ Conversations . . . . . . . . . . : 12 0 ││ SQL statements . . . . . . . . . . : 10003 0 ││ Commits . . . . . . . . . . . . . : 9 0 ││ Rollbacks . . . . . . . . . . . . : 2 0 ││ Rows . . . . . . . . . . . . . . . : 0 1 ││ Messages . . . . . . . . . . . . . : 10022 10016 ││ Bytes . . . . . . . . . . . . . . : 4261K 2948K ││ Blocks . . . . . . . . . . . . . . : 0 0 ││ Prepare requests . . . . . . . . . : 0 0 ││ Last agent requests . . . . . . . : 0 0 ││ Two phase commit requests . . . . : 0 0 ││ Two phase backout requests . . . . : 0 0 ││ Forget responses . . . . . . . . . : 0 0 ││ Commit responses . . . . . . . . . : 0 0 ││ Backout responses . . . . . . . . : 0 0 ││ ││ Command ===> ___________________________________________________________ ││ F1=Help F2=Split F3=Exit F5=Auto F6=History ││ F7=Up F8=Down F9=Swap F10=Delta F11=Interval ││ F12=Cancel F16=Look F17=Collect │└──────────────────────────────────────────────────────────────────────────┘
Figure 99. Remote Location Window
DB2 Statistics
158 DB2 PM Online Monitor User’s Guide

Limited block fetchThe number of times a switch was made from continuous to limited blockfetch mode. This value applies only to DB2 private protocol.
When this value is high, you may want to consider tuning VTAM.
CPU Times and Other Data Window
Use the CPU Times and Other Data window to view statistics on the work thatvarious address spaces have accumulated.
To display this window, select CPU Times and Other Data from the DB2 StatisticsDetail panel.
The CPU Times fields display statistics on the accumulated CPU processing timespent in various address spaces, and on various tasks. Use these statistics toexamine system usage, and to determine if there are any problem areas consumingmore CPU time than expected. If the distributed data facility (DDF) is not installed,N/P is displayed in the DDF address space time fields.
The DB2 Application Programming Interface fields show the number of calls madeto the instrumentation facility interface (IFI) by various functions, and the number ofIFI abnormal terminations.
┌─────────────────────────────────────────────────────────────────────────┐│ DGOMSWOT CPU Times and Other Data ││ ││ INTERVAL 6:35.240 ││ For additional details, type any character next to heading, then ││ press Enter. ││ More: - + ││ ││ CPU Times TCB SRB Total ││ Time Time Time ││ System Services . . . . . . . . . . : 0.54272 0.18774 0.73047 ││ Database Services . . . . . . . . . : 0.65193 0.37567 1.02761 ││ IRLM . . . . . . . . . . . . . . . : 0.02337 0.01779 0.04116 ││ DDF address space . . . . . . . . . : 0.11245 0.03937 0.15183 ││ ││ DB2 Application Programming Interface ││ Abends . . . . . . . . . . . . . . : 0 ││ Unrecognized . . . . . . . . . . . : 0 ││ Command requests . . . . . . . . . : 1 ││ READA requests . . . . . . . . . . : 0 ││ READS requests . . . . . . . . . . : 7 ││ WRITE requests . . . . . . . . . . : 0 ││ ││ Miscellaneous ││ Log RBA . . . . . . . . . . . . . . : X'000000000EB8C7E6' ││ Reason invoked . . . . . . . . . . : IFI READS ││ Columns bypassed . . . . . . . . . : 89321 ││ ││ _ DB2 Commands ││ _ Instrumentation Record Counts ││ _ IFC Destination Data ││ _ Data Capture ││ ││ Command ===> __________________________________________________________ ││ F1=Help F2=Split F3=Exit F5=Auto F6=History ││ F7=Up F8=Down F9=Swap F10=Delta F11=Interval ││ F12=Cancel F16=Look F17=Collect │└─────────────────────────────────────────────────────────────────────────┘
Figure 100. Statistics CPU Times and Other Data Window
DB2 Statistics
Chapter 8. Viewing DB2 Statistics 159

From the CPU Times and Other Data window, you can access windows displayinginformation on DB2 commands, instrumentation record counts, IFC destination data,and data capture.
DB2 Commands Window
Use the DB2 Commands window to view the total number of executions of variousDB2 commands, whether or not they completed successfully.
To display this window, select DB2 Commands from the CPU Times and Other Datawindow.
┌──────────────────────────────────────────────────┐│ DGOMSWCM DB2 Commands ││ ││ INTERVAL 16.103 ││ More: - + ││ Start database . . . . . . . . . . . . : 0 ││ Start trace . . . . . . . . . . . . . : 2 ││ Start DB2 . . . . . . . . . . . . . . : 1 ││ Start RLIMIT . . . . . . . . . . . . . : 0 ││ Start DDF . . . . . . . . . . . . . . : 0 ││ Start Procedure . . . . . . . . . . . : 0 ││ ││ Display database . . . . . . . . . . . : 0 ││ Display thread . . . . . . . . . . . . : 0 ││ Display utility . . . . . . . . . . . : 0 ││ Display trace . . . . . . . . . . . . : 4 ││ Display RLIMIT . . . . . . . . . . . . : 0 ││ Display location . . . . . . . . . . . : 0 ││ Display archive . . . . . . . . . . . : 0 ││ Display bufferpool . . . . . . . . . . : 0 ││ Display Groupbufferpool . . . . . . . : 0 ││ Display Group . . . . . . . . . . . . : 0 ││ Display Procedure . . . . . . . . . . : 0 ││ ││ Stop database . . . . . . . . . . . . : 0 ││ Stop trace . . . . . . . . . . . . . . : 1 ││ Stop DB2 . . . . . . . . . . . . . . . : 0 ││ Stop RLIMIT . . . . . . . . . . . . . : 0 ││ Stop DDF . . . . . . . . . . . . . . . : 0 ││ Stop Procedure . . . . . . . . . . . . : 0 ││ ││ Cancel thread . . . . . . . . . . . . : 0 ││ Recover BSDS . . . . . . . . . . . . . : 0 ││ Recover Indoubt . . . . . . . . . . . : 0 ││ Reset Indoubt . . . . . . . . . . . . : 0 ││ Reset Genericlu . . . . . . . . . . . : 0 ││ Modify trace . . . . . . . . . . . . . : 0 ││ Term utility . . . . . . . . . . . . . : 0 ││ Archive log . . . . . . . . . . . . . : 0 ││ Set archive . . . . . . . . . . . . . : 0 ││ Alter bufferpool . . . . . . . . . . . : 0 ││ Alter Groupbufferpool . . . . . . . . : 0 ││ ││ Unrecognized commands . . . . . . . . : 0 ││ ││ Command ===> __________________________________ ││ F1=Help F2=Split F3=Exit F5=Auto ││ F6=History F7=Up F8=Down F9=Swap ││ F10=Delta F11=Interval F12=Cancel F16=Look ││ F17=Collect │└──────────────────────────────────────────────────┘
Figure 101. DB2 Commands Window
DB2 Statistics
160 DB2 PM Online Monitor User’s Guide
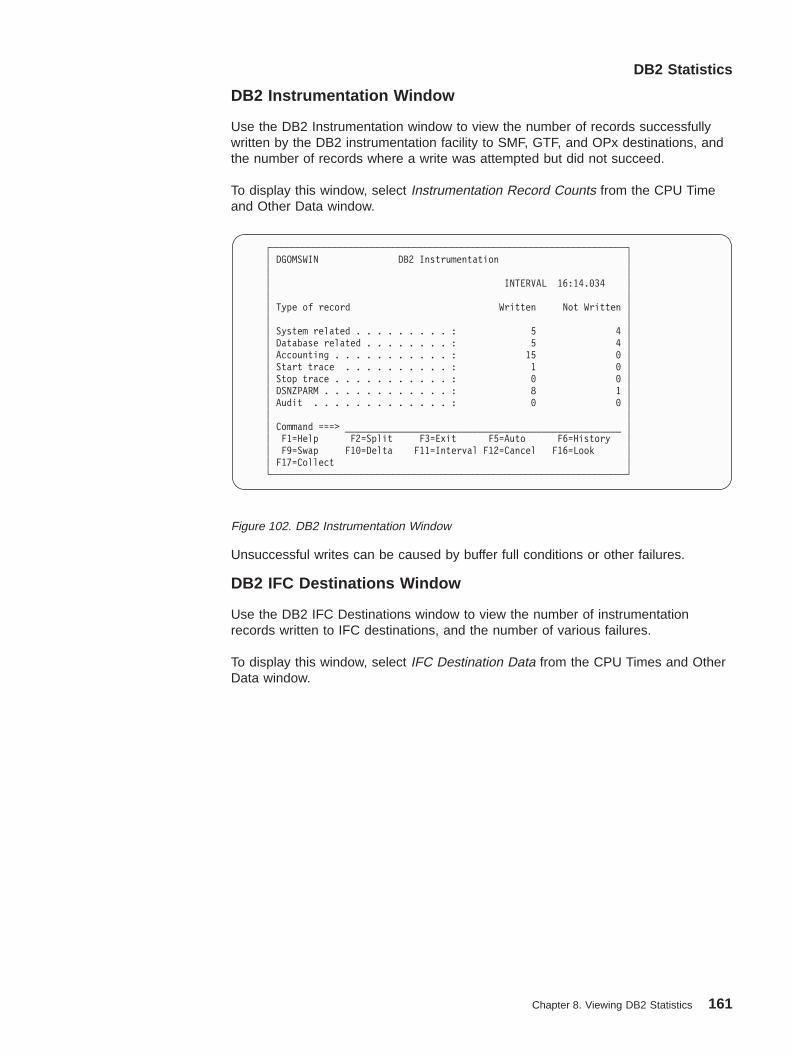
DB2 Instrumentation Window
Use the DB2 Instrumentation window to view the number of records successfullywritten by the DB2 instrumentation facility to SMF, GTF, and OPx destinations, andthe number of records where a write was attempted but did not succeed.
To display this window, select Instrumentation Record Counts from the CPU Timeand Other Data window.
Unsuccessful writes can be caused by buffer full conditions or other failures.
DB2 IFC Destinations Window
Use the DB2 IFC Destinations window to view the number of instrumentationrecords written to IFC destinations, and the number of various failures.
To display this window, select IFC Destination Data from the CPU Times and OtherData window.
┌───────────────────────────────────────────────────────────────────┐│ DGOMSWIN DB2 Instrumentation ││ ││ INTERVAL 16:14.034 ││ ││ Type of record Written Not Written ││ ││ System related . . . . . . . . . : 5 4 ││ Database related . . . . . . . . : 5 4 ││ Accounting . . . . . . . . . . . : 15 0 ││ Start trace . . . . . . . . . . : 1 0 ││ Stop trace . . . . . . . . . . . : 0 0 ││ DSNZPARM . . . . . . . . . . . . : 8 1 ││ Audit . . . . . . . . . . . . . : 0 0 ││ ││ Command ===> ____________________________________________________ ││ F1=Help F2=Split F3=Exit F5=Auto F6=History ││ F9=Swap F10=Delta F11=Interval F12=Cancel F16=Look ││ F17=Collect │└───────────────────────────────────────────────────────────────────┘
Figure 102. DB2 Instrumentation Window
DB2 Statistics
Chapter 8. Viewing DB2 Statistics 161

The IFC destinations on this window are:SMF System management facilityGTF Generalized trace facilityOP1 to OP8 Output buffer destinationsRES Resident trace table.
Use this window to examine instrumentation record write activity, and identifypossible problems. A nonzero value in the Not Written column can indicate aproblem. In this case, check for nonzero values in the Buffer Overrun, NotAccepted, and Write Failure columns to determine the possible cause.
Data Capture Window
Use the Data Capture window to view statistics on data capture activity.
To display this window, select Data Capture from the CPU Times and Other Datawindow.
┌────────────────────────────────────────────────────────────────────────────┐│ DGOMSWIF DB2 IFC Destinations ││ ││ INTERVAL 16:14.034 ││ ││ Destination Not Buffer Not Write ││ Written Written Overrun Accepted Failure ││ ││ More: - + ││ SMF . . : 27 0 0 0 0 ││ GTF . . : 0 0 N/A 0 0 ││ OP1 . . : 1 0 N/A 0 N/A ││ OP2 . . : 0 0 N/A 0 N/A ││ OP3 . . : 0 0 N/A 0 N/A ││ OP4 . . : 0 0 N/A 0 N/A ││ OP5 . . : 0 0 N/A 0 N/A ││ OP6 . . : 0 0 N/A 0 N/A ││ OP7 . . : 0 0 N/A 0 N/A ││ OP8 . . : 0 0 N/A 0 N/A ││ RES . . : 0 N/A N/A N/A N/A ││ ││ Command ===> _____________________________________________________________ ││ F1=Help F2=Split F3=Exit F5=Auto F6=History ││ F7=Up F8=Down F9=Swap F10=Delta F11=Interval ││ F12=Cancel F16=Look F17=Collect │└────────────────────────────────────────────────────────────────────────────┘
Figure 103. DB2 IFC Destinations Window
DB2 Statistics
162 DB2 PM Online Monitor User’s Guide
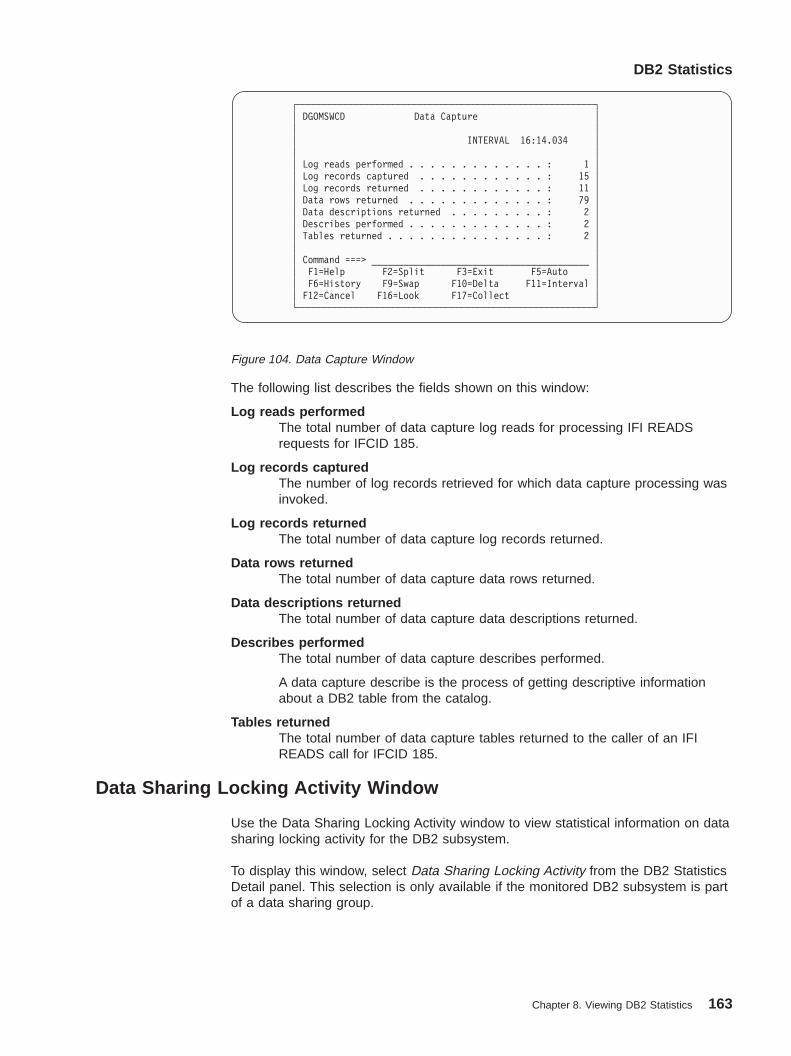
The following list describes the fields shown on this window:
Log reads performedThe total number of data capture log reads for processing IFI READSrequests for IFCID 185.
Log records capturedThe number of log records retrieved for which data capture processing wasinvoked.
Log records returnedThe total number of data capture log records returned.
Data rows returnedThe total number of data capture data rows returned.
Data descriptions returnedThe total number of data capture data descriptions returned.
Describes performedThe total number of data capture describes performed.
A data capture describe is the process of getting descriptive informationabout a DB2 table from the catalog.
Tables returnedThe total number of data capture tables returned to the caller of an IFIREADS call for IFCID 185.
Data Sharing Locking Activity Window
Use the Data Sharing Locking Activity window to view statistical information on datasharing locking activity for the DB2 subsystem.
To display this window, select Data Sharing Locking Activity from the DB2 StatisticsDetail panel. This selection is only available if the monitored DB2 subsystem is partof a data sharing group.
┌────────────────────────────────────────────────────────┐│ DGOMSWCD Data Capture ││ ││ INTERVAL 16:14.034 ││ ││ Log reads performed . . . . . . . . . . . . . : 1 ││ Log records captured . . . . . . . . . . . . : 15 ││ Log records returned . . . . . . . . . . . . : 11 ││ Data rows returned . . . . . . . . . . . . . : 79 ││ Data descriptions returned . . . . . . . . . : 2 ││ Describes performed . . . . . . . . . . . . . : 2 ││ Tables returned . . . . . . . . . . . . . . . : 2 ││ ││ Command ===> _________________________________________ ││ F1=Help F2=Split F3=Exit F5=Auto ││ F6=History F9=Swap F10=Delta F11=Interval ││ F12=Cancel F16=Look F17=Collect │└────────────────────────────────────────────────────────┘
Figure 104. Data Capture Window
DB2 Statistics
Chapter 8. Viewing DB2 Statistics 163
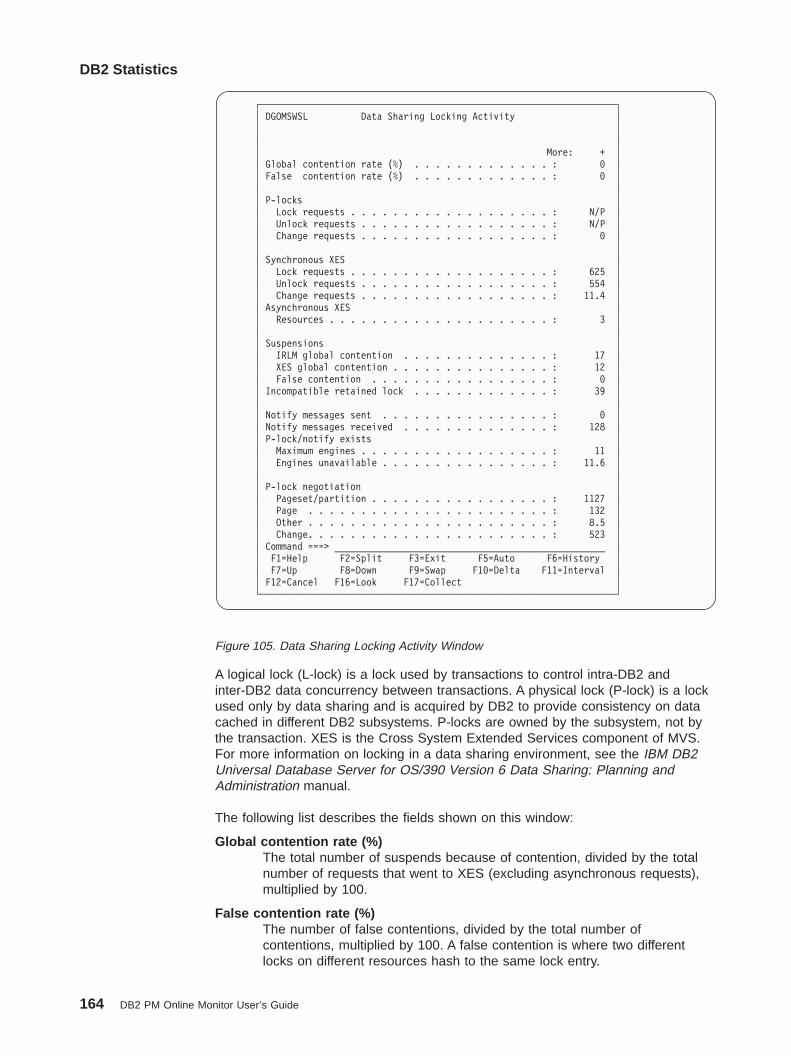
A logical lock (L-lock) is a lock used by transactions to control intra-DB2 andinter-DB2 data concurrency between transactions. A physical lock (P-lock) is a lockused only by data sharing and is acquired by DB2 to provide consistency on datacached in different DB2 subsystems. P-locks are owned by the subsystem, not bythe transaction. XES is the Cross System Extended Services component of MVS.For more information on locking in a data sharing environment, see the IBM DB2Universal Database Server for OS/390 Version 6 Data Sharing: Planning andAdministration manual.
The following list describes the fields shown on this window:
Global contention rate (%)The total number of suspends because of contention, divided by the totalnumber of requests that went to XES (excluding asynchronous requests),multiplied by 100.
False contention rate (%)The number of false contentions, divided by the total number ofcontentions, multiplied by 100. A false contention is where two differentlocks on different resources hash to the same lock entry.
┌───────────────────────────────────────────────────────────────────┐│ DGOMSWSL Data Sharing Locking Activity ││ ││ ││ More: + ││ Global contention rate (%) . . . . . . . . . . . . . : 0 ││ False contention rate (%) . . . . . . . . . . . . . : 0 ││ ││ P-locks ││ Lock requests . . . . . . . . . . . . . . . . . . . : N/P ││ Unlock requests . . . . . . . . . . . . . . . . . . : N/P ││ Change requests . . . . . . . . . . . . . . . . . . : 0 ││ ││ Synchronous XES ││ Lock requests . . . . . . . . . . . . . . . . . . . : 625 ││ Unlock requests . . . . . . . . . . . . . . . . . . : 554 ││ Change requests . . . . . . . . . . . . . . . . . . : 11.4 ││ Asynchronous XES ││ Resources . . . . . . . . . . . . . . . . . . . . . : 3 ││ ││ Suspensions ││ IRLM global contention . . . . . . . . . . . . . . : 17 ││ XES global contention . . . . . . . . . . . . . . . : 12 ││ False contention . . . . . . . . . . . . . . . . . : 0 ││ Incompatible retained lock . . . . . . . . . . . . . : 39 ││ ││ Notify messages sent . . . . . . . . . . . . . . . . : 0 ││ Notify messages received . . . . . . . . . . . . . . : 128 ││ P-lock/notify exists ││ Maximum engines . . . . . . . . . . . . . . . . . . : 11 ││ Engines unavailable . . . . . . . . . . . . . . . . : 11.6 ││ ││ P-lock negotiation ││ Pageset/partition . . . . . . . . . . . . . . . . . : 1127 ││ Page . . . . . . . . . . . . . . . . . . . . . . . : 132 ││ Other . . . . . . . . . . . . . . . . . . . . . . . : 8.5 ││ Change. . . . . . . . . . . . . . . . . . . . . . . : 523 ││ Command ===> ___________________________________________________ ││ F1=Help F2=Split F3=Exit F5=Auto F6=History ││ F7=Up F8=Down F9=Swap F10=Delta F11=Interval ││ F12=Cancel F16=Look F17=Collect │└───────────────────────────────────────────────────────────────────┘
Figure 105. Data Sharing Locking Activity Window
DB2 Statistics
164 DB2 PM Online Monitor User’s Guide
P-locks - Lock requestsThe number of lock requests for P-locks.
P-locks - Unlock requestsThe number of unlock requests for P-locks.
P-locks - Change requestsThe number of change requests for P-locks.
Synchronous XES - Lock requestsThe number of lock requests propagated to MVS XES synchronously.
Synchronous XES - Unlock requestsThe number of resources synchronously propagated to MVS XES by unlockrequests.
Synchronous XES - Change requestsThe number of change requests propagated to MVS XES synchronously.
Asynchronous XES - ResourcesThe number of resources propagated to MVS XES asynchronously byIRLM.
Suspensions - IRLM global contentionThe number of suspensions due to IRLM global contention. IRLM lockstates were in conflict.
Suspensions - XES global contentionThe number of suspensions due to MVS XES global contention. MVS XESlock states were in conflict, but IRLM was not.
Suspensions - False contentionThe number of suspensions due to false contention. This happens whendifferent resource names hash to the same entry in the Coupling FacilityLock Table. This causes MVS XES to detect contention on the hash class.However, when MVS XES determines that there is no real conflict on theresource, the contention is called false.
Incompatible retained lockThe number of global lock or change requests rejected or suspended dueto an incompatible retained lock.
Notify messages sentThe number of notify messages sent.
Notify messages receivedThe number of notify messages received.
P-lock/notify exits - Maximum enginesThe maximum number of engines available for P-lock exit or notify exitrequests.
P-lock/notify exits - Engines unavailableThe number of times an engine is not available for P-lock exit or notify exitrequests.
P-lock negotiation - Pageset/partitionThe number of times this DB2 was driven to negotiate a pageset or partitionP-lock due to changing inter-DB2 interest levels on the pageset or partition.
P-lock negotiation - PageThe number of times this DB2 was driven to negotiate a page P-lock due tointer-DB2 P-lock contention.
DB2 Statistics
Chapter 8. Viewing DB2 Statistics 165

P-lock negotiation - OtherThe number of times this DB2 was driven to negotiate another P-lock type(other than pageset/partition or page).
P-lock negotiation - ChangeThe number of times a P-lock change request was issued during P-locknegotiation.
Group Buffer Pools Activity Window
Use the Group Buffer Pools Activity window to view all group buffer pools used bythe DB2 subsystem. If there are many group buffer pools listed, you can use thescrolling keys F7 (Up) and F8 (Down) to browse the list.
You can select any group buffer pool ID listed on this window to display the GroupBuffer Pool Detail window, where you can view read and write activity both to andfrom that particular group buffer pool, or select Total to view read and write activityon all of the listed group buffer pools combined.
Group Buffer Pool Detail Window
Use the Group Buffer Pool Detail window to view statistics on the group buffer poolselected from the Group Buffer Pools Activity window. These statistics show readand write activity both to and from that buffer pool. If Total was selected from theGroup Buffer Pools Activity window, the Group Buffer Pool Detail window showscombined statistics on all the group buffer pools used by the thread.
┌───────────────────────────────────────────────────────────────────────┐│ DGOMSWGB Group Buffer Pools Activity ROW 1 TO 1 OF 1 ││ ││ ││ For additional details, type any character next to Group Buffer Pool ││ ID, then press Enter. ││ ││ Group Buffer ------ Synchronous Read (XI) -------- ││ Pool ID Data Returned No data returned ││ _ GBP0 0 0 ││ _ TOTAL 0 0 ││ --- End of Group buffer pool list --- ││ ││ ││ ││ ││ ││ ││ ││ ││ Command ===> ________________________________________________________ ││ F1=Help F2=Split F3=Exit F5=Auto F6=History ││ F7=Up F8=Down F9=Swap F10=Delta F11=Interval ││ F12=Cancel F16=Look F17=Collect │└───────────────────────────────────────────────────────────────────────┘
Figure 106. Group Buffer Pools Activity Window
DB2 Statistics
166 DB2 PM Online Monitor User’s Guide

The following list describes the fields shown on this window:
Synchronous read (Cross invalidation) - Data returnedThe number of synchronous coupling facility read requests caused by thepage in the member’s buffer pool that is marked invalid. Data is returnedfrom the group buffer pool.
Synchronous read (Cross invalidation) - No data returnedThe number of synchronous coupling facility read requests caused by thepage in the member’s buffer pool that is marked invalid. Data is notreturned from the group buffer pool but from DASD.
┌───────────────────────────────────────────────────────────────────────┐│ DGOMSWGD Group Buffer Pool Detail ││ ││ ││ More: - + ││ ││ Group Buffer Pool ID . . . . . . . . . . . . . . . . . . . : GBP0 ││ ││ Synchronous read (Cross invalidation) ││ Data returned . . . . . . . . . . . . . . . . . . . . . . : 0 ││ No data returned . . . . . . . . . . . . . . . . . . . . : 0 ││ Synchronous read (not found) ││ Data returned . . . . . . . . . . . . . . . . . . . . . . : 0 ││ No data returned . . . . . . . . . . . . . . . . . . . . : 0 ││ Unregister page . . . . . . . . . . . . . . . . . . . . . . : 0 ││ ││ Clean pages written synchronously . . . . . . . . . . . . . : 0 ││ Changed pages written synchronously . . . . . . . . . . . . : 0 ││ Clean pages written asynchronously . . . . . . . . . . . . : 0 ││ Changed pages written asynchronously . . . . . . . . . . . : 0 ││ ││ Asynchronous read - data returned . . . . . . . . . . . . . : 0 ││ Asynchronous read - no data returned. . . . . . . . . . . . : 0 ││ Register page list request . . . . . . . . . . . . . . . . : 0 ││ Clean pages read after register page list . . . . . . . . . : 0 ││ Changed pages read after register page list . . . . . . . . : 0 ││ ││ Pages Castout . . . . . . . . . . . . . . . . . . . . . . . : 0 ││ Unlock castout . . . . . . . . . . . . . . . . . . . . . . : 3 ││ Read castout class . . . . . . . . . . . . . . . . . . . . : 5 ││ Read castout statistics . . . . . . . . . . . . . . . . . . : 5 ││ ││ Read directory info . . . . . . . . . . . . . . . . . . . . : 21 ││ Read storage statistics . . . . . . . . . . . . . . . . . . : 1 ││ Register page . . . . . . . . . . . . . . . . . . . . . . . : 11 ││ Delete name . . . . . . . . . . . . . . . . . . . . . . . . : 0 ││ ││ Castout class threshold . . . . . . . . . . . . . . . . . . : 0 ││ Group buffer pool castout threshold . . . . . . . . . . . . : 0 ││ GBP checkpoints triggered . . . . . . . . . . . . . . . . . : 1 ││ Participate in GBP rebuild . . . . . . . . . . . . . . . . : 0 ││ ││ Castout engine unavailable . . . . . . . . . . . . . . . . : 0 ││ Write engine unavailable . . . . . . . . . . . . . . . . . : 0 ││ Read failed - no storage . . . . . . . . . . . . . . . . . : 0 ││ Write failed - no storage . . . . . . . . . . . . . . . . . : 0 ││ Command ===> ________________________________________________________ ││ F1=Help F2=Split F3=Exit F5=Auto F6=History ││ F7=Up F8=Down F9=Swap F10=Delta F11=Interval ││ F12=Cancel F16=Look F17=Collect │└───────────────────────────────────────────────────────────────────────┘
Figure 107. Group Buffer Pool Detail Window
DB2 Statistics
Chapter 8. Viewing DB2 Statistics 167
Synchronous read (not found) - Data returnedThe number of synchronous coupling facility read requests necessarybecause the requested page was not found in the buffer pool. Data wasreturned from the coupling facility.
Synchronous read (not found) - No data returnedThe number of synchronous coupling facility read requests necessarybecause the requested page was not found in the buffer pool. Data is notreturned from the group buffer pool but from DASD.
Unregister pageThe number of times DB2 unregistered interest to the group buffer pool fora single page. This is generally done by DB2 when it steals pages from thelocal buffer pool that belong to group buffer pool dependent page sets orpartitions.
Clean pages - Written asynchronouslyThe number of clean pages asynchronously written from the member’svirtual pool to the group buffer pool. If a buffer pool threshold is reached,pages can be forced out before the application commits. This can alsohappen when P-lock negotiation forces the pages on the vertical deferredwrite queue to be written to the group buffer pool.
Asynchronous read - Data returnedThe number of coupling facility reads for prefetch, in which data wasreturned from the coupling facility.
Asynchronous read - No data returnedThe number of coupling facility reads for prefetch, in which data was notreturned from the coupling facility, and a coupling facility directory entry wascreated, if it did not already exist.
Pages CastoutThe number of pages cast out from the group buffer pool to DASD.
Unlock castoutThe number of times DB2 issued an unlock request to the coupling facilityfor castout I/Os that have completed. When pages are in the process ofbeing cast out to DASD, they are locked for castout in the coupling facility.The castout lock is not an IRLM lock. Its purpose is to enforce that only onesystem can cast out a given page at a time.
Read castout classThe number of requests made to the group buffer pool to determine whichpages belonging to a given page set or partition are cached in the groupbuffer pool as changed pages and therefore need not be cast out.
The read castout class request is issued by the page set or partition castoutowner and also by the group buffer pool structure owner when theGBPOOLT threshold has been reached.
Read castout statisticsThe number of requests issued by the group buffer pool structure ownerwhen the GBPOOLT threshold has been reached. These requests are todetermine which castout classes have changed pages. Read castoutstatistics requests are usually issued only once or twice for eachoccurrence of the GBPOOLT threshold.
Read directory infoThe number of requests (issued by the group buffer pool structure owner)for group buffer pool checkpoints to read the directory entries of all changed
DB2 Statistics
168 DB2 PM Online Monitor User’s Guide
pages in the group buffer pool, so that the oldest recovery LRSN (LogRecord Sequence Number, displayed in message DSNB798I) can berecorded and used for recovery purposes in case the group buffer pool fails.Read directory information requests may have to be issued several timesfor each group buffer pool checkpoint in order to read the directory entriesfor all changed pages.
Read storage statisticsThe number of times DB2 requested statistics information from the groupbuffer pool. Usually this number should be relatively low. Requests forstatistics information are issued once per group buffer pool checkpoint bythe group buffer pool structure owner. They are also issued for DISPLAYGROUPBUFFERPOOL GDETAIL requests and to record IFCID 254.
Register pageThe number of times DB2 registered interest to the group buffer pool for asingle page. These are register-only requests, which means that DB2 doesnot request that data is returned for the page. DB2 knows that there is nodata cached in the group buffer pool for this page. The only purpose of theregister page request is to create a directory entry for the page forcross-invalidation when downgrading the P-lock on a page set or partitionfrom S mode to IS mode, or from SIX mode to IX mode.
Delete nameThe number of times DB2 issued a request to the group buffer pool todelete directory and data entries associated with a given page set orpartition. DB2 issues this request when it converts a page set or partitionfrom group buffer pool dependent to not group buffer pool dependent, andalso for GBPCACHE ALL objects when the first DB2 member opens theobject.
Read failed - no storageThe number of coupling facility read requests that could not complete dueto a lack of coupling facility storage resources. If the value of this counter isconstantly high, consider increasing the group buffer pool size.
Write failed - no storageThe number of coupling facility write requests that could not complete dueto a lack of coupling facility storage resources. If the value of this counter isconstantly high, consider increasing the group buffer pool size.
Global Group Buffer Pool Statistics Window
Use the Global Group Buffer Pool Statistics window to view various information onthe number of coupling facility read requests for the group buffer pools. While theGroup Buffer Pools Activity and the Group Buffer Pool Detail windows (seeFigure 106 on page 166 and Figure 107 on page 167) display statistics on the groupbuffer pool usage of the currently monitored subsystem, the Global Group BufferPool Statistics window and the associated Global GBP Statistics Detail windowprovide information on the group buffer pool usage across the whole data sharinggroup. If there are many group buffer pools listed, you can use the scrolling keys F7(Up) and F8 (Down) to browse the list.
To display this window, select Global Group Buffer Pool Statistics from the DB2Statistics Detail panel. This selection is only available if the monitored DB2subsystem is part of a data sharing group.
DB2 Statistics
Chapter 8. Viewing DB2 Statistics 169

You can select any group buffer pool listed on this window to display the GlobalGBP Statistics Detail window, where you can view more information on the bufferpool in greater detail.
Global GBP Statistics Detail Window
Use the Global GBP Statistics Detail window to view statistics on coupling facilityactivity for the group buffer pool selected from the Global Group Buffer PoolStatistics window.
┌─────────────────────────────────────────────────────────────────────────┐│ DGOMSWBC Global Group Buffer Pool Statistics ││ ││ ││ For additional details, type any character next to Group Buffer Pool ││ ID, then press Enter. ││ ││ Group Buffer Read miss ││ Pool ID Read hit directory hit ││ _ GBP0 0 0 ││ _ GBP7 200 0 ││ _ GBP32K7 311 0 ││ _ Total 511 0 ││ --- End of Group Buffer Pool List --- ││ ││ ││ ││ ││ Command ===> _________________________________________________________ ││ F1=Help F2=Split F3=Exit F5=Auto F6=History ││ F7=Up F8=Down F9=Swap F10=Delta F11=Interval ││ F12=Cancel F16=Look F17=Collect │└─────────────────────────────────────────────────────────────────────────┘
Figure 108. Global Group Buffer Pool Statistics Window
DB2 Statistics
170 DB2 PM Online Monitor User’s Guide

The following list describes some of the fields shown on this window:
Read miss assignment suppressedThe number of coupling facility read requests for a page, in which data wasnot returned, where the page name was not assigned in the coupling facilitydirectory, and where directory name assignment is suppressed.
DB2 requests suppression of the directory entry assignment in cases whereit does not have to register the page to coupling facility for crossinvalidation (XI). This is the case when DB2 is the only one in the groupwith read/write interest in the pageset or partition.
Read miss name assignedThe number of coupling facility read requests for a page, in which data wasnot returned, where the page name was not assigned in the coupling facilitydirectory, but a directory entry was successfully assigned to the new name.
Read miss cache fullThe number of coupling facility read requests for a page, in which the pagename was not assigned to a coupling facility directory entry and wherename assignment could not complete due to a lack of coupling facilitystorage resources.
┌───────────────────────────────────────────────────────────────┐│ DGOMSWBD Global GBP Statistics Detail ││ ││ INTERVAL 2:54.251 ││ More: - + ││ ││ Group buffer pool name . . . . . . . . . . . . : GBP1 ││ Read hit . . . . . . . . . . . . . . . . . . . : 258 ││ Read miss directory hit. . . . . . . . . . . . : 258 ││ Read miss assignment suppressed . . . . . . . : 0 ││ Read miss name assigned . . . . . . . . . . . : 557 ││ Read miss cache full . . . . . . . . . . . . . : 0 ││ Changed page write hit . . . . . . . . . . . . : 705 ││ Clean page write hit . . . . . . . . . . . . . : 0 ││ Write miss cache full . . . . . . . . . . . . : 0 ││ Directory entry reclaim . . . . . . . . . . . : 0 ││ Data entry reclaim . . . . . . . . . . . . . . : 214 ││ XI Directory entry reclaim . . . . . . . . . . : 0 ││ Castout . . . . . . . . . . . . . . . . . . . : 398 ││ Directory entry . . . . . . . . . . . . . . . : 843 ││ Data entry . . . . . . . . . . . . . . . . . . : 183 ││ Total changed . . . . . . . . . . . . . . . . : 67 ││ ││ Command ===> ________________________________________________ ││ F1=Help F2=Split F3=Exit F5=Auto F6=History ││ F7=Up F8=Down F9=Swap F10=Delta F11=Interval ││ F12=Cancel F16=Look F17=Collect │└───────────────────────────────────────────────────────────────┘
Figure 109. Global GBP Statistics Detail Window
DB2 Statistics
Chapter 8. Viewing DB2 Statistics 171

Stored Procedures Window
Use the Stored Procedures window to view activity on calls made to storedprocedures.
The following list describes the fields shown on this window:
CALL statements executedThe number of SQL CALL statements executed.
Procedure abendsThe number of times a called stored procedure terminated abnormally.
CALL statement timeoutsThe number of times an SQL CALL statement timed out while waiting to bescheduled.
CALL statements rejectedThe number of times an SQL CALL statement was rejected due to theprocedure being in the STOP ACTION (REJECT) state.
Statistics Commands
The following commands apply to statistics panels. You can type the commands onany statistics panel command line, or invoke them using the function keys. A list ofactive function keys is displayed at the bottom of each panel.
You can abbreviate commands down to three characters in length. For example, theAUTO command can be abbreviated to AUT.
AUTO Command
Use the AUTO command to refresh values displayed on panels without having topress Enter . When you activate auto-display mode, the displayed values areupdated periodically, as specified by the AUTO command. You cannot perform anyother tasks with your Online Monitor session while auto display-mode is running.
The command syntax is:
┌───────────────────────────────────────────────────────────────────┐│ DGOMSWSP Stored Procedures ││ ││ Interval 24.754 ││ ││ CALL statements executed . . . . . . . . . . . . . . : 0 ││ Procedure abends . . . . . . . . . . . . . . . . . . : 0 ││ CALL statement timeouts . . . . . . . . . . . . . . . : 0 ││ CALL statements rejected . . . . . . . . . . . . . . : 0 ││ ││ ││ Command ===> ___________________________________________________ ││ F1=Help F2=Split F3=Exit F5=Auto F6=History ││ F7=Up F8=Down F9=Swap F10=Delta F11=Interval ││ F12=Cancel F16=Look F17=Collect │└───────────────────────────────────────────────────────────────────┘
Figure 110. Stored Procedures Window
DB2 Statistics
172 DB2 PM Online Monitor User’s Guide
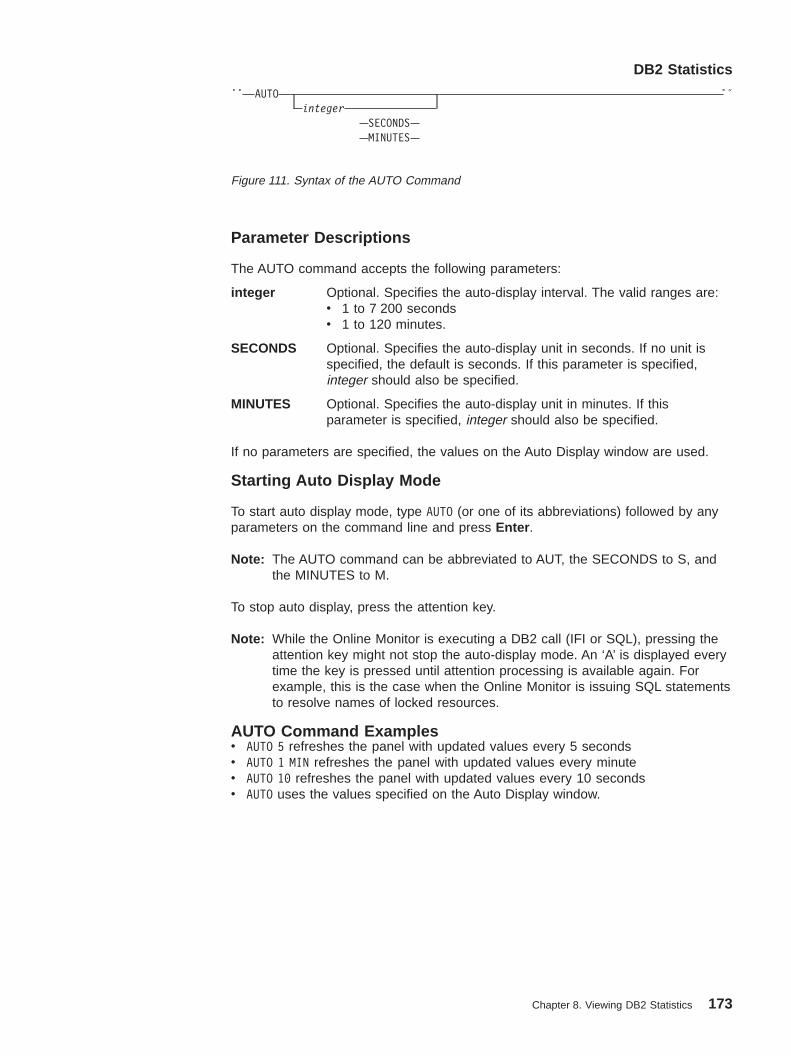
Parameter Descriptions
The AUTO command accepts the following parameters:
integer Optional. Specifies the auto-display interval. The valid ranges are:v 1 to 7 200 secondsv 1 to 120 minutes.
SECONDS Optional. Specifies the auto-display unit in seconds. If no unit isspecified, the default is seconds. If this parameter is specified,integer should also be specified.
MINUTES Optional. Specifies the auto-display unit in minutes. If thisparameter is specified, integer should also be specified.
If no parameters are specified, the values on the Auto Display window are used.
Starting Auto Display Mode
To start auto display mode, type AUTO (or one of its abbreviations) followed by anyparameters on the command line and press Enter .
Note: The AUTO command can be abbreviated to AUT, the SECONDS to S, andthe MINUTES to M.
To stop auto display, press the attention key.
Note: While the Online Monitor is executing a DB2 call (IFI or SQL), pressing theattention key might not stop the auto-display mode. An ‘A’ is displayed everytime the key is pressed until attention processing is available again. Forexample, this is the case when the Online Monitor is issuing SQL statementsto resolve names of locked resources.
AUTO Command Examplesv AUTO 5 refreshes the panel with updated values every 5 secondsv AUTO 1 MIN refreshes the panel with updated values every minutev AUTO 10 refreshes the panel with updated values every 10 secondsv AUTO uses the values specified on the Auto Display window.
ÊÊ AUTOinteger
SECONDSMINUTES
ÊÍ
Figure 111. Syntax of the AUTO Command
DB2 Statistics
Chapter 8. Viewing DB2 Statistics 173
DELTA Command
Use the DELTA command to view subsystem-wide DB2 statistics activity betweenthe times that you press Enter .
The command syntax is:
Selecting Delta Processing
To select delta processing mode, type DELTA (or one of its abbreviations) on thecommand line and press Enter .
Each time you press Enter , the displayed values are updated to reflect the systemactivity which occurred since the previous display update. If auto-display mode isactive, the values are updated on each auto-display interval.
When DELTA is active, the DELTA time is displayed on the message line.
To return to regular mode, issue the RESET command.
Note: The DELTA command can be used in any truncated form beginning with aminimum of DEL.
INTERVAL Command
Use the INTERVAL command to view an accumulation of statistics data from aspecified point in time.
The command syntax is:
Selecting Interval Processing
To select interval processing mode, type INTERVAL (or one of its abbreviations) onthe command line and press Enter .
When you invoke interval mode, the time of the current display is used as a basepoint for further displays. Each time you press Enter to update the display ininterval mode, the statistics data is accumulated from that base point. If the autodisplay function is active, the values are updated automatically from the base pointwith each auto-display cycle.
When INTERVAL is active, the interval elapsed time is displayed on the messageline.
To return to regular mode, issue the RESET command.
ÊÊ DELTA ÊÍ
Figure 112. Syntax of the DELTA Command
ÊÊ INTERVAL ÊÍ
Figure 113. Syntax of the INTERVAL Command
DB2 Statistics
174 DB2 PM Online Monitor User’s Guide

Note: The INTERVAL command can be used in any truncated form beginning witha minimum of INT.
RESET Command
Use RESET to deactivate delta or interval processing mode and revert back toregular display mode.
The command syntax is:
Resetting the Processing Mode
To deactivate delta or interval processing mode and revert back to regular displaymode, type RESET (or one of its abbreviations) on the command line and pressEnter .
Note: The RESET command can be used in any truncated form beginning with aminimum of RES.
HISTORY Command
Use the HISTORY command to view past data that was previously collected by thedata collector. The data is gathered at installation-defined intervals. The date andtime on the panels supporting history indicate when the data being displayed wascollected.
You can only view past data if the data collector is active for the subsystem you aremonitoring and if it was started with the parameter HISTORY=YES. Refer to“Chapter 14. Data Collector Purpose and Function” on page 233 for informationabout the data collector.
The command syntax is:
Note that the defined ISPF national format is used for the date and time format.
Parameter Descriptions
The HISTORY command accepts the following parameters:
OFF Returns the display to the current time.
BACK Displays data for the previous interval. If no more data is available,data from the earliest available interval is displayed.
ÊÊ RESET ÊÍ
Figure 114. Syntax of the RESET Command
ÊÊ HISTORYOFFBACKFORWARD
date hh:mm:ss
ÊÍ
Figure 115. Syntax of the HISTORY Command
DB2 Statistics
Chapter 8. Viewing DB2 Statistics 175
FORWARD Displays information for the next available interval. If there are nofurther stored records, data from the current time is displayed andprocessing continues as if history were ‘OFF’.
date The date of the required information. If no date is specified, today’sdate is assumed.
hh:mm:ss The time of the required information. If no time is specified, the timedefaults to that of the earliest available history record for thespecified date. The seconds do not need to be specified.
If there is no data available for the specified date and time, the next availablerecord is displayed.
If you do not specify any parameters, the History window is displayed (refer toFigure 22). The current system date and time are the defaults for the Historywindow.
Viewing Past Data
To view past data, type HISTORY (or one of its abbreviations) followed by anyparameters on the command line and press Enter .
Note: The HISTORY command can be used in any truncated form beginning with aminimum of HIS.
History and Statistics Processing Modes
History can be active simultaneously with either interval or delta processing mode.
Delta processing helps isolate DB2 statistics activity taking place betweenuser-specified points in time. When History is invoked, the delta is the time betweenthe currently displayed statistical data and the data requested by the HISTORYcommand. The two sets of statistics records are checked to determine which is theoldest in order to avoid the calculation of negative DELTA values.
Interval processing helps isolate DB2 statistics activity beginning at a certain pointin time. When History is invoked, the interval is the time between the first statisticsdata encountered after the INTERVAL command and the statistics data requestedby the HISTORY command. The two sets of statistics records are checked todetermine which is the oldest in order to avoid the calculation of negativeINTERVAL values.
DB2 Statistics
176 DB2 PM Online Monitor User’s Guide

Chapter 9. Monitoring the Access Path—Explain
Tuning DB2
This chapter identifies and describes the specific DB2 data which is reportedfor the purpose of tuning DB2. For general tuning advice on DB2, refer to theDB2 Administration Guide ‘Performance, Monitoring, and Tuning’ chapters forthe specific release of DB2.
Online Monitor explain provides a real-time analysis of the access path methodschosen by DB2 for a given SQL statement. You can also modify the SQL statementtext and reexplain it. This provides you with the ability to tune a DB2 subsystemwhile you are online.
This chapter describes how to select the SQL statement you want to explain fromwithin the Online Monitor or from within an ISPF/PDF editor, the authorizationrequired to use explain, performance considerations, tuning advice, and the DB2Explain Output panel.
Online Monitor explain is based on DB2’s SQL explain function. However, ittranslates the more important PLAN_TABLE codes into full English sentences, soyou need not know the values and columns of the PLAN_TABLE. In addition, itprovides direct access to related catalog information, that is, the catalog statistics ofthe tables and indexes used in the SQL statement.
Authorizations Required to Use Explain
Product-Sensitive Programming Interface
To explain an SQL statement, you should have DB2 EXECUTE privilege on theDB2 PM explain plan defined at installation. The default name of this plan isDGOPMEX.
The following DB2 PLAN_TABLE privileges might also be required:
v Explain an entry in a plan table.
You require DB2 SELECT privilege on the PLAN_TABLE.
v Explain an SQL statement from a previously bound plan or package.
You require DB2 SELECT privilege on the plan or package owner’sPLAN_TABLE. If you do not have the above privilege, a dynamic explain of thestatement is performed if you have UPDATE privilege on your ownPLAN_TABLE.
v Explain an SQL statement entered on the panel.
You require DB2 UPDATE privilege on your own PLAN_TABLE.
v Explain an SQL statement from a thread activity window.
You require DB2 SELECT privilege on the plan or package owner’sPLAN_TABLE. If you do not have the above privilege, a dynamic explain of thestatement is performed if you have UPDATE privilege on your ownPLAN_TABLE.
v CREATE or ALTER a plan table.
© Copyright IBM Corp. 1985, 1999 177
You require a minimum of CREATETAB authority on the database that thePLAN_TABLE is created in, or ALTER authority to modify the PLAN_TABLE.
End of Product-Sensitive Programming Interface
Performance Considerations
Product-Sensitive Programming Interface
The performance of a DB2 PM Batch explain execution directly depends on thefunctions and the processing options specified. The number of accesses to the DB2system catalog is the most important factor. The following catalog tables arenonindexed:v SYSIBM.SYSSTMTv SYSIBM.SYSDBRM.
One approach is to create user-defined indexes on the catalog tables:
v Two indexes for SYSIBM.SYSSTMT: one on the columns PLCREATOR,PLNAME, NAME, and STMTNO and one on the columns PLNAME, SEQNO,STMTNO, and SECTNO
v One index for SYSIBM.SYSDBRM: on the columns PLCREATOR, PLNAME, andNAME.
Note, however, that in addition to the usual costs of indexes (for more information,refer to the IBM DB2 Universal Database Server for OS/390 Version 6Administration Guide) you might experience a performance overhead in anenvironment with frequent DDL and static bind activity.
Another way to achieve better performance is to create copies of these catalogtables and add indexes to these copies. A sample member, DGOYCOPY, whichcreates such copies, is provided in SDGOSAMP. However, DB2 does notautomatically update the copied tables. To obtain up-to-date DB2 PM explaininformation, copy the data from the DB2 catalog tables to your tables on a dailybasis. For this procedure, another sample member, DGOYRSQL, is provided inSDGOSAMP. This member can be modified as required by your installation.
The execution time to explain a plan or package depends on the number of rows inthe accessed PLAN_TABLE. If the table has many rows, you can improveperformance by creating an index on PROGNAME, QUERYNO. Alternatively, deleteunnecessary rows from your PLAN_TABLE.
For further information on performance considerations, see also the DB2 PMProgram Directory.
End of Product-Sensitive Programming Interface
Explain
178 DB2 PM Online Monitor User’s Guide

What to Look for in the EXPLAIN Information
Product-Sensitive Programming Interface
When an SQL statement is being explained, it is very important that the explainingtakes place on the production DB2 subsystem, or at least on a DB2 subsystemwhere the catalog statistics have been updated to reflect the real productionsystem, for example, in terms of table size, available indexes, and other key values.Online Monitor explain lets you specify the “current server” on which explain is to beexecuted. This option makes it possible that you are connected to a DB2 testsubsystem while you execute the explain on the remote production system.
Following are some examples of explain information that can be useful indetermining why an application does not achieve the expected performance:
v Access path chosen
Table space scans and nonmatching index scans should be avoided unless youintend to access all rows in a given table or the table is very small. If the tablehas one or more indexes, try to reconstruct the SQL statement in such a waythat DB2 chooses a better access path. If there is no index, consider creatingone.
v Index Only Access
When selecting a few column values only, you should consider the possibility ofincluding these few columns in the column list of one of the indexes. In this way,all requested data can be found in the index. The access path message informsyou if you succeed in doing so. Likewise, if you are selecting a maximum value,you might consider building a descending index on that column (or ascendingindex, if the minimum value is requested). In this way, you can even avoidscanning of leaf pages in the index structure.
v Clustering versus clustered
Make sure that if a clustering index has been chosen by DB2, the actual index isclustered. On the Index Information window, if the clustered value is NO, or if thecluster ratio is less than 95%, the table space might need a reorganization inorder to bring the data rows into clustering sequence.
v Number of matching columns
On the Plan Table Data panel, if DB2 has selected a matching index scan, youshould verify on the Index Information window that the number of columns usedin the index is what you expect.
v Active pages versus pages with rows
Verify that the number of pages with rows is about the same as active pages,especially if you are performing table space scans. In other words, the valueshown in the Percentage of pages used field on the Table Information windowshould be as close as possible to 100 percent.
v Number of tables per tablespace
On the Table Space Information window, you should monitor the Tables field.This field shows the number of tables located in the tablespace. If the accesspath is “Tablespace scan” and the tablespace is not segmented, it isrecommended that there be only one table in the tablespace. In a nonsegmentedtablespace, all tables are scanned, not only the selected table.
v Host variable definitions versus column definitions
An inconsistent definition of host variables shown on the Host Variable Definitionwindow, compared to the corresponding column definitions shown on the KeyColumn Selection window, can indicate an inefficient access path selection,
Explain
Chapter 9. Monitoring the Access Path—Explain 179

resulting from a possible disqualification of index usage. If, for example, an indexcolumn is defined as 3 characters, and that column is being compared in aWHERE-clause with a host variable defined as 4 characters, then DB2 does notbase its access path selection on the mentioned index. You should verify that acolumn and a host variable being compared in a WHERE-clause havecompatible definitions.
End of Product-Sensitive Programming Interface
Plan Table Considerations
Whenever an SQL statement is explained, the result is written as an entry into aplan table. When the DB2 PM explain function performs a dynamic explain, theresult is written to the PLAN_TABLE of the current SQLID. The current SQLID iseither the same ID as the one used for your Online Monitor session or the one youspecify in the Explain Menu. You can then examine the explained SQL statementresiding in the plan table using the DB2 Explain Output panel, and its associatedwindows.
When a dynamic explain of an SQL statement is required, one of two windows isdisplayed if you do not have an up-to-date plan table. These windows prompt youto either:v Create a plan table if one does not currently exist.v Upgrade a plan table to match your current version of DB2.
These windows are described in the following sections.
Create PLAN_TABLE
If a plan table does not exist when a dynamic explain is required, the Create PlanTable window is displayed.
Use the Create Plan Table window to specify the database name (optional), andtable space name of the table to be created (optional). If neither are entered, a plantable is created in the default database DSNDB04. If this database does not exist oryou do not have sufficient authority, an error message is displayed.
┌──────────────────────────────────────────────────────────┐│ DGOMYWQC Create Plan Table ││ ││ You do not have a plan table. Update the database name ││ and table space name as required, then press Enter to ││ create the plan table. ││ ││ Database name . . . . . . . . . . DSNDB04 ││ Table space name . . . . . . . . . ________ ││ ││ F1=Help F2=Split F9=Swap F12=Cancel │└──────────────────────────────────────────────────────────┘
Figure 116. Create Plan Table Window
Explain
180 DB2 PM Online Monitor User’s Guide

Upgrade PLAN_TABLE
If a plan table exists but does not match your current version of DB2, the UpgradePlan Table window is displayed. Use this window to confirm that the table definitionbe upgraded to match your current version of DB2.
Explain an SQL Statement
You can explain an SQL statement by:
v Entering the EXPLAIN command or pressing F18 (Explain) on any threaddiagnosis panel or either the SQL Statement and Package window or SQLStatement and DBRM window.
The current SQL statement is then explained.
v Selecting option 10 (Explain) from the DB2 PM Online Monitor Main Menu.
The Explain Menu is displayed, where you can select one of four options forexplaining an SQL statement.
v Marking a range of lines to be explained from within an ISPF/PDF editor andissuing the EXPLAIN command from the editor command line.
Refer to “Source Explain” on page 194 for more information.
The SQL statement is then explained and the result displayed on the DB2 ExplainOutput panel.
Figure 118 shows the flow of the explain process.
┌──────────────────────────────────────────────────────────┐│ DGOMYWQU Upgrade Plan Table ││ ││ Your plan table definition does not include all the ││ columns required by DB2 PM. ││ ││ To upgrade the plan table, press Enter. ││ ││ F1=Help F2=Split F9=Swap F12=Cancel │└──────────────────────────────────────────────────────────┘
Figure 117. Upgrade Plan Table Window
Explain
Chapter 9. Monitoring the Access Path—Explain 181
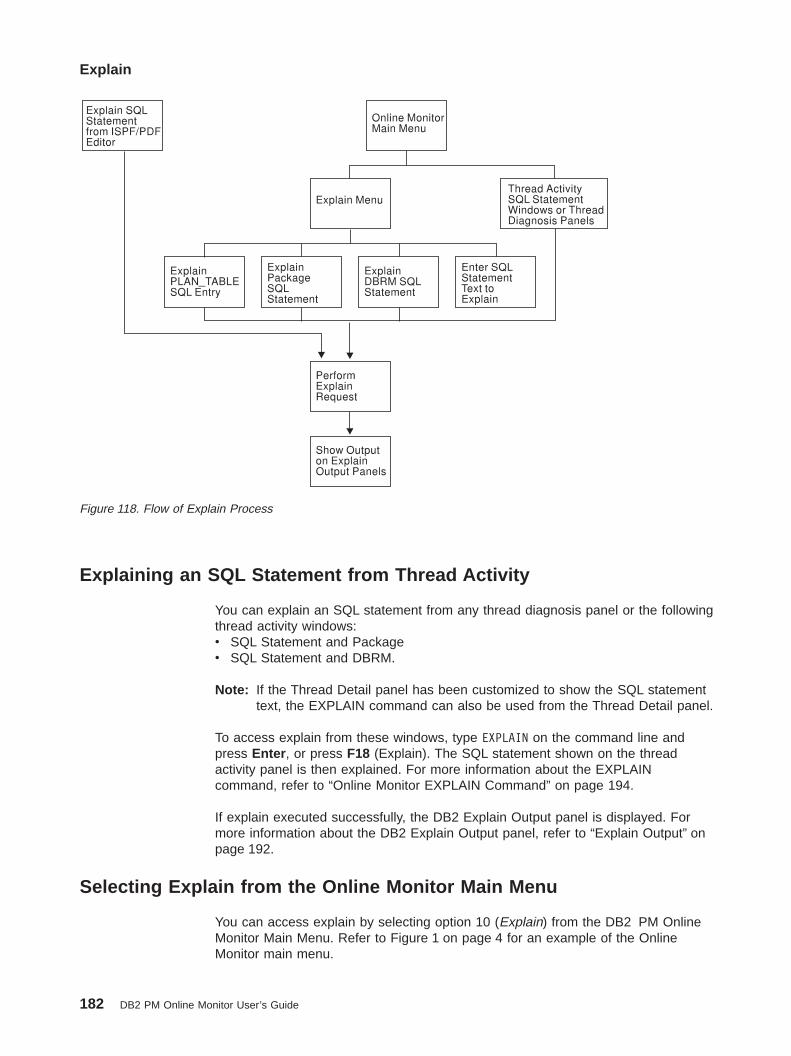
Explaining an SQL Statement from Thread Activity
You can explain an SQL statement from any thread diagnosis panel or the followingthread activity windows:v SQL Statement and Packagev SQL Statement and DBRM.
Note: If the Thread Detail panel has been customized to show the SQL statementtext, the EXPLAIN command can also be used from the Thread Detail panel.
To access explain from these windows, type EXPLAIN on the command line andpress Enter , or press F18 (Explain). The SQL statement shown on the threadactivity panel is then explained. For more information about the EXPLAINcommand, refer to “Online Monitor EXPLAIN Command” on page 194.
If explain executed successfully, the DB2 Explain Output panel is displayed. Formore information about the DB2 Explain Output panel, refer to “Explain Output” onpage 192.
Selecting Explain from the Online Monitor Main Menu
You can access explain by selecting option 10 (Explain) from the DB2 PM OnlineMonitor Main Menu. Refer to Figure 1 on page 4 for an example of the OnlineMonitor main menu.
Figure 118. Flow of Explain Process
Explain
182 DB2 PM Online Monitor User’s Guide

The Explain Menu is displayed, where you can select one of four methods forspecifying the SQL statement you want explained.
Explaining an SQL Statement from an ISPF/PDF Editor
You can explain an SQL statement that is imbedded in a source program or SPUFIinput from an ISPF/PDF editor. To do this, specify a range of source lines to explainusing the E line prefix command, then type EXPLAIN on the command line and pressEnter . Any valid SQL statements within the specified range can then be selectedfrom a list for explain processing. For more information about source explain, referto “Source Explain” on page 194.
If explain executed successfully, the DB2 Explain Output panel is displayed. Formore information about the DB2 Explain Output panel, refer to “Explain Output” onpage 192.
Explain Menu
Use the Explain Menu to specify the DB2 subsystem where the explain request isto be performed (optional), a different SQL authorization ID for qualifying theunqualified tables in the statements being explained, and to select an option forexplaining an SQL statement. To display the Explain Menu, select option 10(Explain) from the DB2 PM Online Monitor Main Menu.
Use the Current server input field to specify the DB2 subsystem where you wantthe explain request to be performed. This field makes it possible that you areconnected to a DB2 test subsystem while you execute the explain on the remoteproduction system. This field defaults to the local location.
Use the Current SQLID field to specify a different SQL authorization ID forqualifying the unqualified tables in the SQL statements being explained. TheCurrent SQLID field is also used to qualify the plan table to be accessed. If this fieldis not specified, it defaults to your user ID.
DGOMYPMN Explain Menu
Local Location . . . . : PMO1DLOC DSN1 V6Current Server . . . . : PMO1DLOC DSN1 V6
Change current server if required, then select one of the following.
_ 1. Explain an existing entry in the plan table2. Explain a package's SQL statement3. Explain a DBRM's SQL statement4. Enter an SQL statement to be explained
Current Server . . . . . PMO1DLOCCurrent SQLID . . . . . . ________
Command ===> ______________________________________________________________F1=Help F2=Split F3=Exit F9=Swap F12=Cretriev F13=HelpF14=Split F15=Exit F21=Swap F24=Cancel
Figure 119. Explain Menu
Explain
Chapter 9. Monitoring the Access Path—Explain 183
Whenever package or DBRM SQL statements are explained, the package or planqualifier is used to qualify unqualified SQL statements. The package or plan owneris used to qualify the plan table.
From this window, you can select one of the following options:
1. Explain an existing entry in the plan table
Select this option to display the Plan Table Entry window, where you caninterpret an existing entry in your plan table, or in another user’s plan table ifyou have the required DB2 authority.
2. Explain a package’s SQL statement
Select this option to display the Package SQL Statement window, where youcan explain an SQL statement for a previously bound package.
3. Explain a DBRM’s SQL statement
Select this option to display the DBRM SQL Statement window, where you canexplain an SQL statement for a previously bound plan.
4. Enter an SQL statement to be explained
Select this option to display the SQL Text Entry window, where you can explaina dynamic SQL statement. After you have specified the query number, the SQLText Edit panel is displayed, where you can enter and explain a dynamic SQLstatement.
Use these options, and related windows, to select the SQL statement you want toexplain. The SQL statement is then explained, and the result displayed on the DB2Explain Output panel.
Explain Existing Entry in Plan Table
Use the Plan Table Entry window to explain an entry in your plan table, or if youhave the required DB2 authority, an entry in another user’s plan table. Regardlessof the user specified, a DB2 plan table needs to exist for that user.
To display this window, select option 1 from the Explain Menu.
Explain
184 DB2 PM Online Monitor User’s Guide

Enter a user ID in the Owner of plan table field, or leave this field blank to specifyyour own plan table. Then specify the query number of the plan table entry youwant to explain.
If the Query number field is left blank, then all entries matching the plan name,program name, and version you specified are listed. Leaving any of these criteriafields blank defaults to an asterisk (*), which matches all entries. The Plan TableEntry List panel is then displayed listing all the matching entries in the plan table.
After selecting an entry in a plan table, the entry is processed and the result isshown on the DB2 Explain Output panel.
Plan Table Entry List Panel
Use the Plan Table Entry List panel to select an entry from the list of entriesbelonging to the plan table. If there are many table entries listed, you can use thescrolling keys F7 (Up) and F8 (Down) to browse the list.
┌─────────────────────────────────────────────────────────────────────┐│ DGOMYWPE Plan Table Entry ││ ││ Local location . . . . . . : PMO1DLOC DSN1 V6 ││ Current server . . . . . . : PMO1DLOC DSN1 V6 ││ ││ Specify the owner of the plan table. Then either specify a query ││ number, or leave query number blank and enter plan, program and ││ version details for a list of query numbers. ││ ││ Owner of plan table . . . . . . . . . . . ________ ││ ││ Query number . . . . . . . . . . . . . . . _________ ││ ││ Plan name . . . . . . . . . . . . . . . . ________ ││ Program name . . . . . . . . . . . . . . . ________ ││ Version ││ ________________________________________________________________ ││ ││ Command ===> ______________________________________________________ ││ F1=Help F2=Split F3=Exit F9=Swap F12=Cancel F13=Help ││ F14=Split F15=Exit F21=Swap F24=Cancel │└─────────────────────────────────────────────────────────────────────┘
Figure 120. Plan Table Entry Window
Explain
Chapter 9. Monitoring the Access Path—Explain 185

After making a selection, the entry is processed and the result is shown on the DB2Explain Output panel.
Explain an SQL Statement of a Package
Use the Package SQL Statement window to explain an SQL statement of apreviously bound package.
To display this window, select option 2 from the Explain Menu.
To explain an SQL statement from this window, type the collection identifier,package name, and version into the appropriate fields and press Enter . Wildcardsare accepted in these fields. The fields can also be left blank. If any of these fieldsare left blank, they default to an asterisk (*). The Package Version List panel is thendisplayed, where you can select a package from a list of all the matching packages.
DGOMYWPL Plan Table Entry List ROW 1 TO 2 OF 2
Local location . . . . . . : PMO1DLOC DSN1 V6Current server . . . . . . : PMO1DLOC DSN1 V6
Table . . . . : USERT003.PLAN_TABLE
Query Plan Program TimestampVersion
_ 1 LOCEXP1 LOCEXP1COL.LOCEXP 01/16/99 16:13:10.00DSN8610.PACKAGE.VERSION1
_ 3 LOCEXP3 LOCEXP3COL.LOCEXP3 01/17/99 14:47:12.30DSN8610.PACKAGE.VERSION1
******************************* BOTTOM OF DATA ********************************
Command ===> ______________________________________________________________F1=Help F2=Split F3=Exit F7=Up F8=Down F9=SwapF12=Cancel F16=Look F17=Collect
Figure 121. Plan Table Entry List Panel
┌─────────────────────────────────────────────────────────────────────┐│ DGOMYWKS Package SQL Statement ││ ││ Collection identifier . . . . . . . . . . __________________ ││ Package name . . . . . . . . . . . . . . . ________ ││ Version ││ DSN8610.PACKAGE.VERSION1 ││ ││ Command ===> ______________________________________________________ ││ F1=Help F2=Split F3=Exit F9=Swap F12=Cancel ││ F16=Look F17=Collect │└─────────────────────────────────────────────────────────────────────┘
Figure 122. Package SQL Statement Window
Explain
186 DB2 PM Online Monitor User’s Guide

Package Version List Panel
The Package Version List panel displays a list of packages matching the fieldsspecified on the Package SQL Statement window. If there are many packageslisted, you can use the scrolling keys F7 (Up) and F8 (Down) to browse the list.
From this window, you can select a package to display the SQL Statement Listpanel, where you can examine a list of SQL statements belonging to the package.
SQL Statement List Panel (Packages)
The SQL Statement List panel displays a list of SQL statements for the selectedpackage, showing the statement number and the first 118 characters of the SQLstatement text for each item listed. If there are many SQL statements listed, youcan use the scrolling keys F7 (Up) and F8 (Down) to browse the list.
DGOMYWKV Package Version List ROW 1 TO 2 OF 2
Local location . . . . . . : PMO1DLOC DSN1 V6Current server . . . . . . : PMO1DLOC DSN1 V6
Collection PackageVersion
_ LOCEXP1COL LOCEXP1DSN8610.PACKAGE.VERSION1
_ LOCEXP3COL LOCEXP3DSN8610.PACKAGE.VERSION3
******************************* BOTTOM OF DATA ********************************
Command ===> ______________________________________________________________F1=Help F2=Split F3=Exit F7=Up F8=Down F9=SwapF12=Cancel F16=Look F17=Collect
Figure 123. Package Version List Panel
Explain
Chapter 9. Monitoring the Access Path—Explain 187

From this window, you can select the SQL statement to be explained. The SQLstatement is then processed and the result is shown on the DB2 Explain Outputpanel.
Explain an SQL Statement of a DBRM
Use the DBRM SQL Statement window to explain an SQL statement of a previouslybound plan.
To display this window, select option 3 from the Explain Menu.
To explain an SQL statement from this window, type the DBRM name and planname into the appropriate fields and press Enter . Wildcards are accepted in thesefields. The fields can also be left blank. If any of these fields are left blank, theydefault to an asterisk (*). The DBRM and Plan List panel is then displayed, whereyou can select a DBRM from a list of all the matching DBRMs and plans.
DGOMYWKQ SQL Statement List ROW 1 TO 1 OF 1
Local location . . . . . . : PMO1DLOC DSN1 V6Current server . . . . . . : PMO1DLOC DSN1 V6
Collection . . . . . : LOCEXP1COL Package . . . : LOCEXP1VersionDSN8610.PACKAGE.VERSION1
Statement SQL Text_ 1 SELECT EMPNO, LASTNAME, WORKDEPT, BIRTHDATE FROM DSN8610.EMP WHERE (EMPNO BETWEEN '000170' AND '000190' AND WORKDEPT IN (
_ 23 SELECT LASTNAME WHERE EMPNO =:EMPLOYEE_NUMBER******************************* BOTTOM OF DATA ********************************
Command ===> ______________________________________________________________F1=Help F2=Split F3=Exit F7=Up F8=Down F9=SwapF12=Cancel F16=Look F17=Collect
Figure 124. SQL Statement List Panel
┌───────────────────────────────────────────────────────────┐│ DGOMYWDS DBRM SQL Statement ││ ││ DBRM name . . . . . . . . . . . . . . . . ________ ││ Plan name . . . . . . . . . . . . . . . . ________ ││ ││ Command ===> ___________________________________________ ││ F1=Help F2=Split F3=Exit F9=Swap ││ F12=Cancel F16=Look F17=Collect │└───────────────────────────────────────────────────────────┘
Figure 125. DBRM SQL Statement Window
Explain
188 DB2 PM Online Monitor User’s Guide

DBRM and Plan List Panel
The DBRM and Plan List panel displays a list of DBRMs and plans matching thefields specified on the DBRM SQL Statement window. If there are many itemslisted, you can use the scrolling keys F7 (Up) and F8 (Down) to browse the list.
From this window, you can select any DBRM listed to display the SQL StatementList panel, where you can examine a list of SQL statements belonging to theDBRM.
SQL Statement List Panel (DBRMs)
The SQL Statement List panel displays a list of SQL statements for the selectedDBRM. This window shows the statement number and the first 118 characters ofthe SQL statement text for each item listed. If there are many SQL statementslisted, you can use the scrolling keys F7 (Up) and F8 (Down) to browse the list.
DGOMYWDL DBRM and Plan List ROW 1 TO 2 OF 2
Local location . . . . . . : PMO1DLOC DSN1 V6Current server . . . . . . : PMO1DLOC DSN1 V6
DBRM Plan name_ LOCEXP1COL LOCEXP1_ LOCEXP3COL LOCEXP3******************************* BOTTOM OF DATA ********************************
Command ===> ______________________________________________________________F1=Help F2=Split F3=Exit F7=Up F8=Down F9=SwapF12=Cancel F16=Look F17=Collect
Figure 126. DBRM and Plan List Panel
Explain
Chapter 9. Monitoring the Access Path—Explain 189

From this window, you can select an SQL statement to be explained. The SQLstatement is then processed and the result is shown on the DB2 Explain Outputpanel.
Explain Dynamic SQL Statement
Use the SQL Text Entry window and its associated SQL Text Edit panel to enter anSQL statement to be explained.
To display this window, select option 4 from the Explain Menu.
From this window, enter the query number you want to assign to the SQLstatement. The query number identifies in the plan table the SQL statement that youare entering. If no query number is specified, it defaults to 999735912.
DGOMYWDQ SQL Statement List ROW 1 TO 1 OF 1
Local location . . . . . . : PMO1DLOC DSN1 V6Current server . . . . . . : PMO1DLOC DSN1 V6
DBRM . : LOCEXP1 Plan Name . . . . . . . . : LOCEXP1
Statement SQL Text_ 1 SELECT EMPNO, LASTNAME, WORKDEPT, BIRTHDATE FROM DSN8610.EMP WHERE (EMPNO BETWEEN '000170' AND '000190' AND WORKDEPT IN (
_ 23 SELECT LASTNAME WHERE EMPNO =:EMPLOYEE_NUMBER******************************* BOTTOM OF DATA ********************************
Command ===> ______________________________________________________________F1=Help F2=Split F3=Exit F7=Up F8=Down F9=SwapF12=Cancel F16=Look F17=Collect
Figure 127. SQL Statement List Panel
┌─────────────────────────────────────────────────────────────────────────┐│ DGOMYWES SQL Text Entry ││ ││ Enter query number if desired, then press Enter to display the SQL ││ Text Edit panel. ││ ││ Query number . . . . . . 999735912 ││ ││ _ Set current degree to ANY ││ ││ ││ ││ ││ F1=Help F2=Split F9=Swap F12=Cancel │└─────────────────────────────────────────────────────────────────────────┘
Figure 128. SQL Text Entry Window
Explain
190 DB2 PM Online Monitor User’s Guide

The Set current degree to ANY field specifies whether the SQL statement is eligiblefor query parallelism. If you enter a slash (/) in this field, the current degree ofparallelism is set to ANY. Otherwise, the current degree of parallelism is set to 1.
After you press Enter , the Edit SQL Text panel is displayed, where you can enterthe SQL statement text you want to explain.
SQL Text Edit Panel
Use this panel to view or modify the full text of an SQL statement for purposes ofonline tuning, or to create an SQL statement to be explained.
This panel is displayed by pressing Enter on the SQL Text Entry window, or byselecting the SQL Text field from the DB2 Explain Output panel.
From this panel, you can enter a new (or modify an existing) SQL statement inorder to assess the impact on access path selection. The statement can beadjusted and then explained again to dynamically assess the impact.
You can enter SQL text that exceeds the display depth by using the scrolling keysF7 (Up) and F8 (Down).
To process and explain the entered SQL text, press F3 (Exit). The DB2 ExplainOutput panel is displayed with a message indicating that the statement wasdynamically explained.
To ignore the changes and return to the previous panel, press F12 (Cancel).
EDIT ---- SYS90269.T082218.RA000.V$AI16.R0000028 ------------- COLUMNS 001 072****** ***************************** TOP OF DATA ******************************000001 SELECT EMPNO, LASTNAME, WORKDEPT, BIRTHDATE FROM DSN8230.EMP WHERE000002 (EMPNO BETWEEN '000170' AND '000190' AND WORKDEPT IN ('D01', 'E21')) OR000003 (EMPNO = '00100' AND (WORKDEPT = (SELECT MIN (DEPTNO) FROM DSN8230.DEPT000004 WHERE MGRNO = '000050')))000005000006000007000008000009000010000011000012000013000014000015
COMMAND ===> ________________________________________________ SCROLL ===> CSRF1=HELP F2=SPLIT F3=END F4=RETURN F5=RFIND F6=RCHANGEF7=UP F8=DOWN F9=SWAP F10=LEFT F11=RIGHT F12=RETRIEVE****** **************************** BOTTOM OF DATA ****************************
Figure 129. SQL Text Edit Panel
Explain
Chapter 9. Monitoring the Access Path—Explain 191

Explain Output
The DB2 Explain Output panel and catalog table windows can be used toinvestigate the access path methods of an explained SQL statement. Informationregarding packages, DBRMs, table spaces, tables, indices, and column attributescan also be viewed.
DB2 Explain Output Panel
Diagnosis, Modification, or Tuning Information
Use the DB2 Explain Output panel to examine the results of an explain request.
When an SQL statement has been chosen for explanation, the following processingdepends on the origin of the statement:
Explain existing entry in the plan tableThe specified PLAN_TABLE entry is shown as a result of the explainrequest.
Explain a package’s SQL statementThe plan table of the package owner is searched to check whether the SQLstatement has been explained during BIND. If the search is successful, thisPLAN_TABLE entry is taken. If the search is not successful, a dynamicexplain is performed, that is, SQL EXPLAIN is invoked for the statement.Then the result of this explain is displayed.
Explain a DBRM’s SQL statementThe plan table of the DBRM owner is searched to check whether the SQLstatement has been explained during BIND. If the search is successful, thisPLAN_TABLE entry is taken. If the search is not successful, a dynamicexplain is performed, that is, SQL EXPLAIN is invoked for the statement.Then the result of this explain is displayed.
SQL statement to be explained has been enteredA dynamic explain is performed, that is, SQL EXPLAIN is invoked for thestatement, and the result is displayed.
SQL statement is modified in DB2 Explain Output panelA dynamic explain is performed, that is, SQL EXPLAIN is invoked for themodified statement and the new result is displayed.
Only the DB2 Explain Output panel for packages (DGOMYPKM) is shown in thissection.
Explain
192 DB2 PM Online Monitor User’s Guide

The DB2 Explain Output panel is divided into three main sections.
The first section of the panel shows the plan name, and information about thepackage or DBRM containing the SQL statement. You can select this section forfurther investigation of the package, DBRM, or plan name associated with the SQLstatement.
The second section of the panel titled SQL Text shows the first 150 characters ofthe SQL statement text. You can view or modify the full SQL statement text byselecting the input field shown beside the SQL text. The SQL Text Edit panel is thendisplayed. For more information on the SQL Text Edit panel, refer to “SQL Text EditPanel” on page 191. After the SQL text is modified, the SQL statement isreexplained, and the new result is shown on the DB2 Explain Output panel. Fromthis section you can also access windows providing information on the host variabledefinitions.
The third section of the panel shows information on the access path methodschosen by DB2 for each of the individual query blocks and steps required toexecute the SQL statement. Each step also shows a list of the tables and indexesaccessed for that step. You can select any table or index listed in a step for furtherinvestigation. You can also display the raw PLAN_TABLE data for a step.
DGOMYPKM DB2 Explain Output More - +
Local location . . . . . . : PMO1DLOC DSN1 V6Current server . . . . . . : PMO1DLOC DSN1 V6
_ Package . . . . . . . . . . . . : LOCEXP1COL.LOCEXP1Version
DSN8610_PACKAGE_VERSION1Explain executed at . . . . : 13:10:52 04/16/99
------------------------------ SQL Text -----------------------------------_ SELECT EMPNO, LASTNAME, WORKDEPT, BIRTHDATE FROM DSN8410.EMP WHERE
(EMPNO BETWEEN '000170' AND '000190' AND WORKDEPT IN ('D01', 'E21')) ORStatus : Compiled-REOPT specified. Rebound at exec.time using valuesIsolation: Cursor stability
_ Host variable definitions
----- Access path summary for query block 1 step 1 -----Multiple index access path has been chosenIntersection of indexes XEMP1 and XEMP2Union of multiple indexes XEMP1 and above combinationPREFETCH table space scan through a page list will be performedLock mode is Share Lock at page levelPage range scan will not be used
_ Table DSN8610 EMP_ Index DSN8610 XEMP1_ Index DSN8610 XEMP2
_ PLAN_TABLE details for step
----- Access path summary for query block 1 step 2 -----Command ===> _________________________________________________________________F1=Help F2=Split F3=Exit F7=Up F8=Down F9=SwapF12=Cancel F16=Look F17=Collect
Figure 130. DB2 Explain Output Panel (Packages)
Explain
Chapter 9. Monitoring the Access Path—Explain 193
If the execution of the SQL statement contains many steps, you can use thescrolling keys F7 (Up) and F8 (Down) to browse through the steps.
End of Diagnosis, Modification, or Tuning Information
Online Monitor EXPLAIN Command
Use the EXPLAIN command to explain the currently executing SQL statement onany thread diagnosis panel or on the following thread activity panels:v SQL Statement and Packagev SQL Statement and DBRM.
Note: If the Thread Detail panel has been modified to show the SQL statementtext, the EXPLAIN command can be used from the Thread Detail panel aswell.
If the explain request was successful, the DB2 Explain Output panel is displayed.
The command syntax is:
Note: The EXPLAIN command can be used in any truncated form beginning with aminimum of EXP.
For a description of the DB2 Explain Output panel, refer to “Explain Output” onpage 192.
Source Explain
You use DB2 PM source explain to explain SQL statements that are embedded ina source program or SPUFI input. Source explain is performed from within theISPF/PDF editor. The supported languages are:v Assemblerv C/370(TM)v COBOLv FORTRANv PL/Iv SPUFI.
Note: Before you activate source explain, make sure that the DB2 load library isallocated to your TSO ISPF session.
To explain an SQL statement while editing a source program (or SPUFI input), youspecify the lines you want explained using the ISPF/PDF editor line prefix commandE, then you type EXPLAIN on the command line and press Enter . Ensure that sourceexplain has been installed at your site.
The E line prefix command can be used as follows:
E To explain a single line, you type E in the prefix area of the line to bescanned for SQL statements.
ÊÊ EXPLAIN ÊÍ
Figure 131. Syntax of the EXPLAIN Command
Explain
194 DB2 PM Online Monitor User’s Guide

EE To explain a range of lines, you type EE in the prefix area of the first andlast lines of the range to be scanned for SQL statements.
E[n] To explain a specific number of lines, type E[n] on the first line of the areato scan, where n is the number of lines to be scanned for SQL statements.
When you enter the EXPLAIN command, source explain scans the specified rangefor valid SQL statements. If a range is not specified, the entire source is scanned.Note that an SQL statement is processed even if the SQL statement text exceedsthe specified range.
Figure 132 is an example of how to explain an SQL statement while editing COBOLsource code. To explain a range of source from line 3040 to 3160, type EE in theline prefix area of lines 3040 and 3160 as shown in Figure 132. Type EXPLAIN onthe command line and press Enter to explain the SQL statements within thespecified range of lines.
If the Always display this window field has been selected, the Source ExplainOptions window is displayed. Otherwise, the SQL Statement Selection window isdisplayed.
Source Explain Options Window
You can display this window from the ISPF/PDF editor in one of the following ways:
v By typing EXPLAIN OPTIONS on the command line and pressing Enter
v By typing EXPLAIN on the command line and pressing Enter after the Alwaysdisplay this window field is selected
EDIT ---- SYS1.DSN610.SDSNSAMP(DSN8BC3) - 01.00 -------------- COLUMNS 001 072003010 *** CURSOR LISTS ALL EMPLOYEE NAMES WITH A PATTERN (%) OR (_)003020 *** FOR LAST NAME003030EE3040 EXEC SQL DECLARE TELE2 CURSOR FOR003050 SELECT *003060 FROM VPHONE003070 WHERE LASTNAME LIKE :LNAME-WORK003080 AND FIRSTNAME LIKE :FNAME-WORK003090 END-EXEC.003100003110 *** CURSOR LISTS ALL EMPLOYEES WITH A SPECIFIC003120 *** LAST NAME003130003140 EXEC SQL DECLARE TELE3 CURSOR FOR003150 SELECT *EE3160 FROM VPHONE003170 WHERE LASTNAME = :LNAME003180 AND FIRSTNAME LIKE :FNAME-WORK003190 END-EXEC.003200 /003210 /****************************************************003220 * FIELDS SENT TO MESSAGE ROUTINE *003230 *****************************************************003240 01 MAJOR PIC X(07) VALUE 'DSN8BC3'.003250003260 01 MSGCODE PIC X(4).COMMAND ===> explain SCROLL ===> CSRF1=HELP F2=SPLIT F3=END F4=RETURN F5=RFIND F6=RCHANGEF7=UP F8=DOWN F9=SWAP F10=LEFT F11=RIGHT F12=RETRIEVE
Figure 132. Source Explain Example
Explain
Chapter 9. Monitoring the Access Path—Explain 195

v From the SQL Statement Selection panel by typing OPTIONS on the command lineand pressing Enter .
You use the Source Explain Options window (Figure 133) to specify the sourceexplain processing options, such as the language of the source code you areediting, the subsystem ID of the explaining DB2, the SQLID to be used, and thedegree of parallelism.
The fields shown on the Source Explain Options window are:
Local DB2 SubsystemThe local DB2 subsystem to which you want to connect.
Current Server LocationThe DB2 subsystem where you want the source SQL statements to beexplained. This field makes it possible that you are connected to a DB2 testsubsystem, while you execute the explain on the remote production system.If this field is left blank, it defaults to the local DB2 subsystem.
Current SQLIDA different SQL authorization ID for qualifying the unqualified tables in theSQL statements being explained. A different SQL authorization ID is alsoused to qualify the plan table to be accessed. If this field is not specified, itdefaults to your user ID.
Query numberA number that identifies the explain statement. If left blank, the value999735912 is assigned to this field.
Set current degree to ANYTo specify whether the SQL statement is eligible for query parallelism. If youenter a slash (/) in this field, the current degree of parallelism is set to ANY.Otherwise, the current degree of parallelism is set to 1.
Always display this windowTo control the display of the Source Explain Options window. If you enter aslash (/) in this field, the Source Explain Options window is displayed on
┌─────────────────────────────────────────────────────────────┐│ DGOMYWSO Source Explain Options ││ ││ Update fields as required then press Enter ││ ││ Local DB2 Subsystem . . . . . . . . . ____ ││ Current Server Location . . . . . . . ________________ ││ Current SQLID . . . . . . . . . . . . ________ ││ Query number . . . . . . . . . . . . _________ ││ _ Set current degree to ANY ││ / Always display this window ││ Define source language . . . . . . . _ 1. Assembler ││ 2. C/370 ││ 3. COBOL ││ 4. FORTRAN ││ 5. PL/I ││ 6. SPUFI ││ ││ ││ F1=Help F2=Split F3=Exit F9=Swap ││ F12=Cretriev F13=Help F14=Split F15=Exit ││ F21=Swap F24=Cancel │└─────────────────────────────────────────────────────────────┘
Figure 133. Source Explain Options Window
Explain
196 DB2 PM Online Monitor User’s Guide
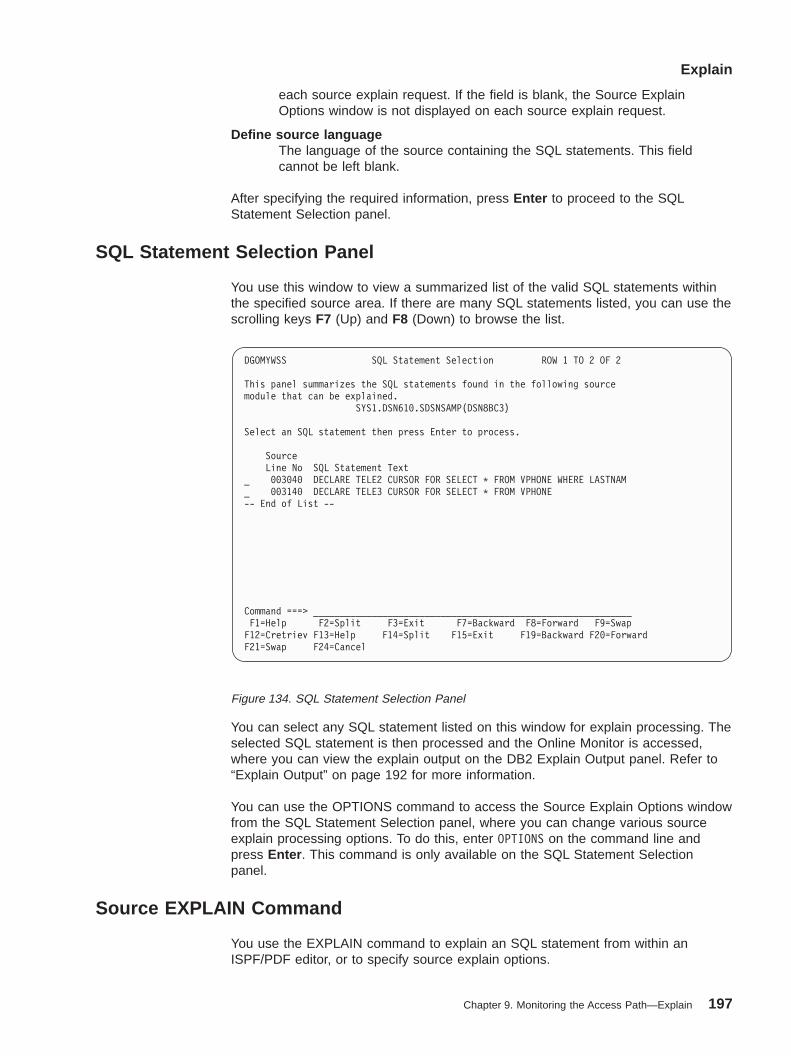
each source explain request. If the field is blank, the Source ExplainOptions window is not displayed on each source explain request.
Define source languageThe language of the source containing the SQL statements. This fieldcannot be left blank.
After specifying the required information, press Enter to proceed to the SQLStatement Selection panel.
SQL Statement Selection Panel
You use this window to view a summarized list of the valid SQL statements withinthe specified source area. If there are many SQL statements listed, you can use thescrolling keys F7 (Up) and F8 (Down) to browse the list.
You can select any SQL statement listed on this window for explain processing. Theselected SQL statement is then processed and the Online Monitor is accessed,where you can view the explain output on the DB2 Explain Output panel. Refer to“Explain Output” on page 192 for more information.
You can use the OPTIONS command to access the Source Explain Options windowfrom the SQL Statement Selection panel, where you can change various sourceexplain processing options. To do this, enter OPTIONS on the command line andpress Enter . This command is only available on the SQL Statement Selectionpanel.
Source EXPLAIN Command
You use the EXPLAIN command to explain an SQL statement from within anISPF/PDF editor, or to specify source explain options.
DGOMYWSS SQL Statement Selection ROW 1 TO 2 OF 2
This panel summarizes the SQL statements found in the following sourcemodule that can be explained.
SYS1.DSN610.SDSNSAMP(DSN8BC3)
Select an SQL statement then press Enter to process.
SourceLine No SQL Statement Text
_ 003040 DECLARE TELE2 CURSOR FOR SELECT * FROM VPHONE WHERE LASTNAM_ 003140 DECLARE TELE3 CURSOR FOR SELECT * FROM VPHONE-- End of List --
Command ===> ____________________________________________________________F1=Help F2=Split F3=Exit F7=Backward F8=Forward F9=SwapF12=Cretriev F13=Help F14=Split F15=Exit F19=Backward F20=ForwardF21=Swap F24=Cancel
Figure 134. SQL Statement Selection Panel
Explain
Chapter 9. Monitoring the Access Path—Explain 197

The command syntax is:
All lines within the specified source area are scanned for valid SQL statementswhich are then listed on the SQL Statement Selection panel. If no lines are marked,the entire source is scanned. You can then select any SQL statement from the SQLStatement Selection panel for explain processing.
If you specify OPTIONS or if the Always display this window field is selected, theSource Explain Options window is displayed before the SQL Statement Selectionpanel, where you can specify processing options such as the language of thesource code you are editing, the subsystem ID of the explaining DB2, the SQLID tobe used, and the degree of parallelism.
ÊÊ EXPLAINOPTIONS
ÊÍ
Figure 135. Syntax of the Source EXPLAIN Command
Explain
198 DB2 PM Online Monitor User’s Guide

Chapter 10. Viewing System Parameters
All system parameter fields up to and including DB2 V5 are supported by threadactivity display. To view new fields introduced with DB2 V6, use DB2 Visual Explain.
Use the system parameters panels to view current DSNZPARM and buffer poolvalues for the DB2 subsystem to which you are currently connected. The systemparameters values specified at subsystem startup time and current buffer poolvalues are shown. The information displayed on these panels is similar to thatpresented by the Batch system parameters report set.
DB2 System Parameters Detail Panel
Use the DB2 System Parameters Detail panel to view a summary of importantDSNZPARM values, maximum concurrent users, and IRLM thresholds. Use thescrolling keys F7 (Up) and F8 (Down) to view all the information on the DB2System Parameters Detail panel.
To display the DB2 System Parameters Detail window, select option 3 (DisplaySystem Parameters) from the DB2 PM Online Monitor Main Menu.
Figure 136 shows the DB2 System Parameters Detail panel (DGOMZPSM).
© Copyright IBM Corp. 1985, 1999 199
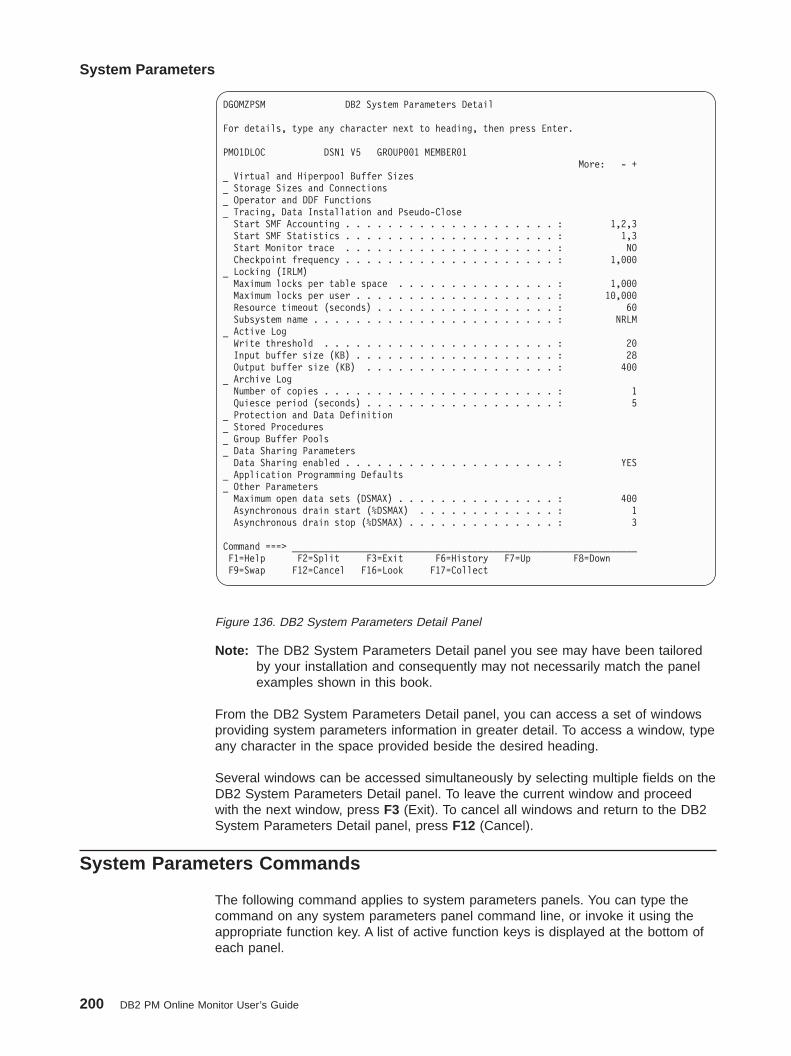
Note: The DB2 System Parameters Detail panel you see may have been tailoredby your installation and consequently may not necessarily match the panelexamples shown in this book.
From the DB2 System Parameters Detail panel, you can access a set of windowsproviding system parameters information in greater detail. To access a window, typeany character in the space provided beside the desired heading.
Several windows can be accessed simultaneously by selecting multiple fields on theDB2 System Parameters Detail panel. To leave the current window and proceedwith the next window, press F3 (Exit). To cancel all windows and return to the DB2System Parameters Detail panel, press F12 (Cancel).
System Parameters Commands
The following command applies to system parameters panels. You can type thecommand on any system parameters panel command line, or invoke it using theappropriate function key. A list of active function keys is displayed at the bottom ofeach panel.
DGOMZPSM DB2 System Parameters Detail
For details, type any character next to heading, then press Enter.
PMO1DLOC DSN1 V5 GROUP001 MEMBER01More: - +
_ Virtual and Hiperpool Buffer Sizes_ Storage Sizes and Connections_ Operator and DDF Functions_ Tracing, Data Installation and Pseudo-CloseStart SMF Accounting . . . . . . . . . . . . . . . . . . . . : 1,2,3Start SMF Statistics . . . . . . . . . . . . . . . . . . . . : 1,3Start Monitor trace . . . . . . . . . . . . . . . . . . . . : NOCheckpoint frequency . . . . . . . . . . . . . . . . . . . . : 1,000
_ Locking (IRLM)Maximum locks per table space . . . . . . . . . . . . . . . : 1,000Maximum locks per user . . . . . . . . . . . . . . . . . . . : 10,000Resource timeout (seconds) . . . . . . . . . . . . . . . . . : 60Subsystem name . . . . . . . . . . . . . . . . . . . . . . . : NRLM
_ Active LogWrite threshold . . . . . . . . . . . . . . . . . . . . . . : 20Input buffer size (KB) . . . . . . . . . . . . . . . . . . . : 28Output buffer size (KB) . . . . . . . . . . . . . . . . . . : 400
_ Archive LogNumber of copies . . . . . . . . . . . . . . . . . . . . . . : 1Quiesce period (seconds) . . . . . . . . . . . . . . . . . . : 5
_ Protection and Data Definition_ Stored Procedures_ Group Buffer Pools_ Data Sharing ParametersData Sharing enabled . . . . . . . . . . . . . . . . . . . . : YES
_ Application Programming Defaults_ Other ParametersMaximum open data sets (DSMAX) . . . . . . . . . . . . . . . : 400Asynchronous drain start (%DSMAX) . . . . . . . . . . . . . : 1Asynchronous drain stop (%DSMAX) . . . . . . . . . . . . . . : 3
Command ===> _________________________________________________________________F1=Help F2=Split F3=Exit F6=History F7=Up F8=DownF9=Swap F12=Cancel F16=Look F17=Collect
Figure 136. DB2 System Parameters Detail Panel
System Parameters
200 DB2 PM Online Monitor User’s Guide
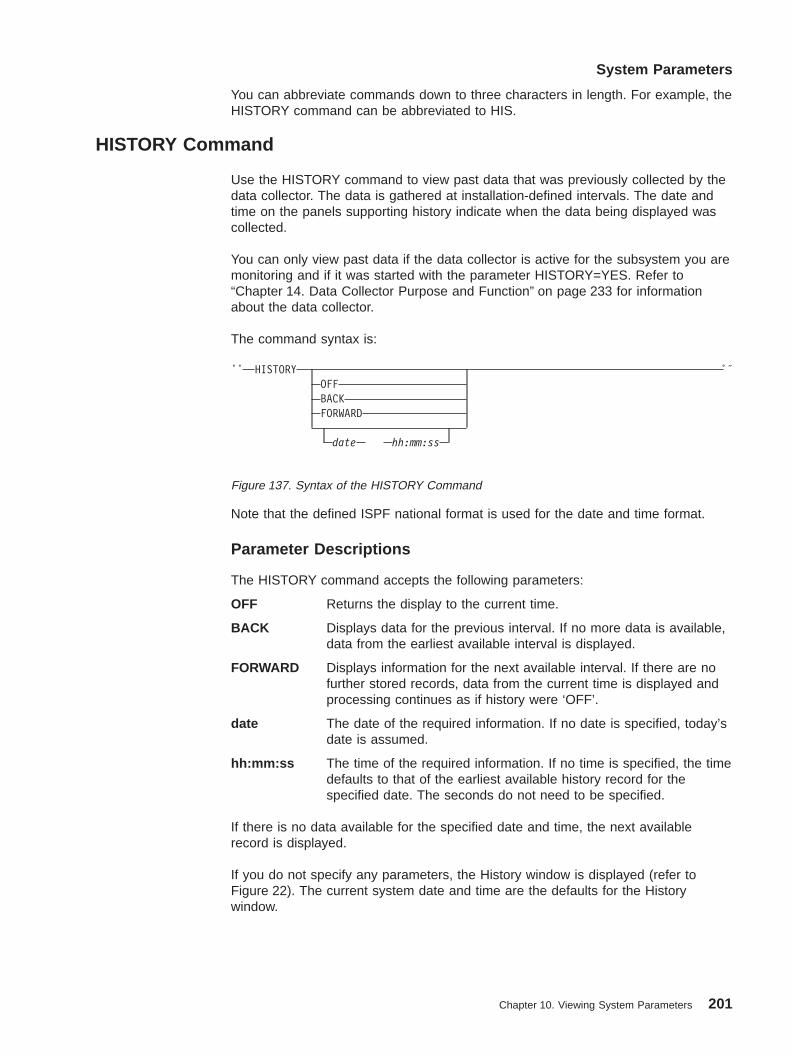
You can abbreviate commands down to three characters in length. For example, theHISTORY command can be abbreviated to HIS.
HISTORY Command
Use the HISTORY command to view past data that was previously collected by thedata collector. The data is gathered at installation-defined intervals. The date andtime on the panels supporting history indicate when the data being displayed wascollected.
You can only view past data if the data collector is active for the subsystem you aremonitoring and if it was started with the parameter HISTORY=YES. Refer to“Chapter 14. Data Collector Purpose and Function” on page 233 for informationabout the data collector.
The command syntax is:
Note that the defined ISPF national format is used for the date and time format.
Parameter Descriptions
The HISTORY command accepts the following parameters:
OFF Returns the display to the current time.
BACK Displays data for the previous interval. If no more data is available,data from the earliest available interval is displayed.
FORWARD Displays information for the next available interval. If there are nofurther stored records, data from the current time is displayed andprocessing continues as if history were ‘OFF’.
date The date of the required information. If no date is specified, today’sdate is assumed.
hh:mm:ss The time of the required information. If no time is specified, the timedefaults to that of the earliest available history record for thespecified date. The seconds do not need to be specified.
If there is no data available for the specified date and time, the next availablerecord is displayed.
If you do not specify any parameters, the History window is displayed (refer toFigure 22). The current system date and time are the defaults for the Historywindow.
ÊÊ HISTORYOFFBACKFORWARD
date hh:mm:ss
ÊÍ
Figure 137. Syntax of the HISTORY Command
System Parameters
Chapter 10. Viewing System Parameters 201

Viewing Past Data
To view past data, type HISTORY (or one of its abbreviations) followed by anyparameters on the command line and press Enter .
Note: The HISTORY command can be used in any truncated form beginning with aminimum of HIS.
System Parameters
202 DB2 PM Online Monitor User’s Guide
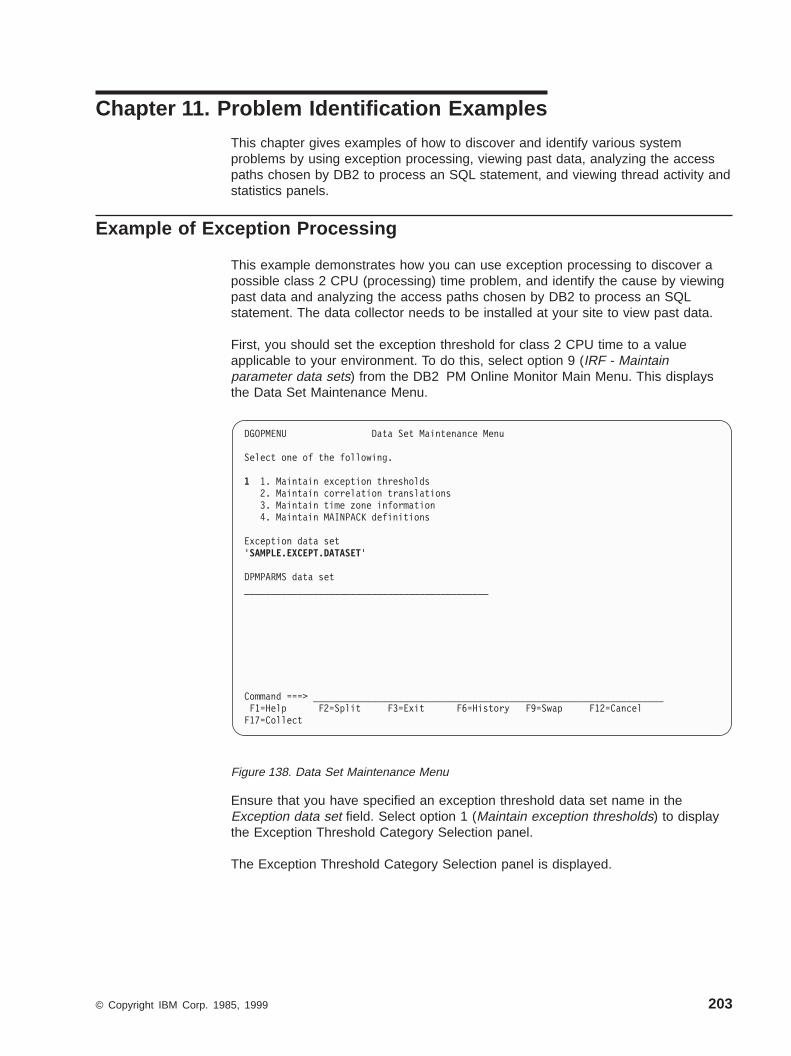
Chapter 11. Problem Identification Examples
This chapter gives examples of how to discover and identify various systemproblems by using exception processing, viewing past data, analyzing the accesspaths chosen by DB2 to process an SQL statement, and viewing thread activity andstatistics panels.
Example of Exception Processing
This example demonstrates how you can use exception processing to discover apossible class 2 CPU (processing) time problem, and identify the cause by viewingpast data and analyzing the access paths chosen by DB2 to process an SQLstatement. The data collector needs to be installed at your site to view past data.
First, you should set the exception threshold for class 2 CPU time to a valueapplicable to your environment. To do this, select option 9 (IRF - Maintainparameter data sets) from the DB2 PM Online Monitor Main Menu. This displaysthe Data Set Maintenance Menu.
Ensure that you have specified an exception threshold data set name in theException data set field. Select option 1 (Maintain exception thresholds) to displaythe Exception Threshold Category Selection panel.
The Exception Threshold Category Selection panel is displayed.
DGOPMENU Data Set Maintenance Menu
Select one of the following.
1 1. Maintain exception thresholds2. Maintain correlation translations3. Maintain time zone information4. Maintain MAINPACK definitions
Exception data set'SAMPLE.EXCEPT.DATASET'
DPMPARMS data set______________________________________________
Command ===> __________________________________________________________________F1=Help F2=Split F3=Exit F6=History F9=Swap F12=CancelF17=Collect
Figure 138. Data Set Maintenance Menu
© Copyright IBM Corp. 1985, 1999 203

Select the category containing the desired exception field. For this example, selectthe Elapsed, CPU and Waiting Times per Plan Execution field.
The Exception Threshold Field Selection panel is displayed.
This panel displays all available fields within the specified category. Select theADDBCPUT field and press Enter .
DGOPXDS1 Exception Threshold Category Selection
Select one or more categories, then press Enter. Overtype with space todeselect any category. Request EXIT when complete.
Category/ Elapsed, CPU and Waiting Times per Plan Execution_ Elapsed, CPU and Waiting Times per Program Execution_ CPU Times per Address Space_ SQL Statements per Plan Execution_ SQL Statements per Program Execution_ SQL Statements per System_ Subsystem Events per Plan Execution_ Subsystem Events per System_ Locking Activity per Plan Execution_ Locking Activity per System_ RID List Processing per Plan Execution_ RID List Processing per System_ Query Parallelism per Plan Execution_ Query Parallelism per System_ Buffer Pools Activity per Plan Execution_ Buffer Pools Activity per System_ Distributed Activity per Location per Plan Execution
Command ===> __________________________________________________________________F1=Help F2=Split F3=Exit F7=Up F8=Down F9=Swap F12=Cancel
Figure 139. Exception Threshold Category Selection Panel
DGOPXDS2 Exception Threshold Field Selection
Select only one field, then press Enter. Overtype with space todeselect any field. Request EXIT when complete.
Field category . . : Elapsed, CPU, and Waiting Times per Plan Execution
Field Description_ ADRECETT Elapsed time in application (Class 1)_ ADCPUT CPU time in application (Class 1)_ ADDB2ETT Elapsed time in DB2 (Class 2)/ ADDBCPUT CPU time in DB2 (Class 2)_ ADTWTDB Total wait time in DB2 (Class 2)_ ADTWTAP Total wait time in application (Class 1)_ ADTSUST Total Class 3 suspensions time_ ADTSUSC Total Class 3 suspensions_ QWACAWTL Lock/latch suspensions time (Class 3)_ ADLLSUSC Lock/latch suspensions (Class 3)_ QWACAWTI Synchronous I/O susp. time (Class 3)_ ADIOSUSC Synchronous I/O suspensions (Class 3)_ QWACAWTR Other read I/O susp. time (Class 3)
Command ===> __________________________________________________________________F1=Help F2=Split F3=Exit F7=Up F8=Down F9=Swap F12=Cancel
Figure 140. Exception Threshold Field Selection Panel
Problem Identification
204 DB2 PM Online Monitor User’s Guide

The Exception Threshold Field Details panel is displayed.
Use the Exception Threshold Field Details panel to specify the threshold criteria forthe exception field selected from the Exception Threshold Field Selection panel. Forthis example, enter a 1 in the Active field, set the By field to total (1), the Compareoperator field to a greater-than symbol (>), and the Problem threshold field to avalue of 0.1 seconds.
Note: You should choose a threshold value that is applicable to your environment.For information on defining exception threshold values, refer to “How toDefine Exception Threshold Values” on page 50.
Now that the exception threshold has been defined, select option 5 (ControlException Processing) from the Online Monitor main menu to display the ExceptionProcessor panel.
DGOPXDSN Exception Threshold Field Details
ENTRY 1 OF 1
Category . . . . . : Elapsed, CPU, and Waiting Times per Plan ExecutionField ID . . . . . : ADDBCPUTDescription . . . . : CPU time in DB2 (Class 2)
Active . . . . . . . 1 1=Yes 2=No
By . . . . . . . . . 1 1=Total 2=Minute 3=Second4=Commit 5=Thread
Compare operator . . > <=Less than >=Greater thanWarning threshold . . 0.09Problem threshold . . 0.1
Local location . . . *Group name . . . . . *Member name . . . . . *Subsystem ID . . . . *Requester location *Connect . . . . . . . *Planname . . . . . . *Corrname . . . . . . *Corrnmbr . . . . . . *Primauth . . . . . . *
Command ===> __________________________________________________________________F1=Help F2=Split F3=Exit F5=Add F6=Delete F7=UpF8=Down F9=Swap F10=Previous F11=Next F12=Cancel
Figure 141. Exception Threshold Field Details Panel
Problem Identification
Chapter 11. Problem Identification Examples 205

Use the Exception Processor panel to activate periodic exception processing. Enterthe exception threshold data set name you specified on the Data Set MaintenanceMenu and type a slash (/) in the Periodic field to activate periodic exceptionprocessing. In this example, the exception processor has been set to check forperiodic exceptions every 10 seconds.
For more information on activating exception processing, refer to “How to StartException Processing” on page 56.
When a periodic exception occurs, the Online Monitor notifies you by displaying theException Notification window. This window is overlaid on the current panel.
DGOMEP02 Exception Processor PMO1DLOC DSN1 V6
For any field enter any character to activate
Activate/Deactivate Exception Processing_ Display thread summary_ Display thread detail_ Display statistics detail/ Periodic _ User Exit_ Exception event notification
OptionsPeriodic units . . . . . . . . . . . . . . 1 1=Seconds
2=MinutesPeriodic interval . . . . . . . . . . . . 10 1-7200 Seconds
1-120 Minutes> Disable auto-display for problem exceptions> Sound alarm for exception warnings_ Log file data set output needed_ DPMOUT data set output needed
Exception threshold data setName . . . . . . . . . SAMPLE.EXCEPT.DATASET
Command ===> __________________________________________________________________F1=Help F2=Split F3=Exit F7=Up F8=Down F9=SwapF12=Cancel F16=Look F17=Collect
Figure 142. Exception Processor Panel
Problem Identification
206 DB2 PM Online Monitor User’s Guide

The Exception Notification window indicates that a periodic exception has occurred.You can examine the exception in greater detail using the LOOK command. TypeLOOK 1 on any command line and press Enter to display the Periodic ExceptionsList window.
DGOMTPSM 14:27 Thread Detail PMO1DLOC DSN1 V6GROUP001 MEMBER01
For details, place any character next to heading, then press Enter.More: - +
_ Thread IdentificationPrimauth . . . . . : TFA6 ┌───────────────────────────────────────────┐Planname . . . . . : CICSEMP │ DGOMEPEX Exception Notification │Connection ID . . : APPCICP3 │ │Requesting Location: PMO1DLOC │ Time . . : 04/03/99 14:27:41 │
_ Current Package . . . . . │ │_ Times │ Periodic Exceptions │Class 1 . . . . . . . . . . . │ Problem : 1 │Class 2 . . . . . . . . . . . │ Warning : 0 │Class 3 . . . . . . . . . . . │ │Class 7 . . . . . . . . . . . │ F1=Help F2=Split F9=Swap │Class 8 . . . . . . . . . . . │ F12=Cancel │
_ Locking Activity └───────────────────────────────────────────┘Timeouts . . . . . . . . . . . . . . . . . : 0Deadlocks . . . . . . . . . . . . . . . . : 0Suspensions . . . . . . . . . . . . . . . : 1Lock escalations . . . . . . . . . . . . . : 0Maximum page locks held . . . . . . . . . : 9
_ Locked Resources_ RID List ProcessingUnsuccessful - any reason . . . . . . . . : 0
_ SQL Activity, Commits and RollbacksDML . . . : 4 Commit . . . . . . . . : 0DCL . . . : 0 Rollback . . . . . . . : 0DDL . . . : 0 Changes/Commit . . . . : 0.0
_ Buffer Manager ActivityGetpage requests . . . . . . . . . . . . . : 60Buffer updates . . . . . . . . . . . . . . : 0Prefetch reads . . . . . . . . . . . . . . : 1Synchronous I/O . . . . . . . . . . . . . : 0
_ SQL Statement and Package . . . . . . . . : EMPSRCHDistributed DataRequester elapsed time . . . . . . . . . . : N/P
_ IFI (Class 5) and Data Capture_ Query Parallelism Data_ Data Sharing Locking ActivitySuspensions . . . . . . . . . . . . . . . : N/A
_ Group Buffer Pools Activity_ Stored Procedures
Command ===> _________________________________________________________________F1=Help F2=Split F3=Exit F5=Auto F6=History F7=UpF8=Down F9=Swap F12=Cancel F16=Look F17=Collect F22=Purge
Figure 143. Exception Notification Window (Overlaid on Thread Detail Panel)
Problem Identification
Chapter 11. Problem Identification Examples 207

From this window you can examine a list containing the last 500 periodic exceptionsthat have occurred. The most recent exceptions are displayed at the bottom of thelist.
In this example the thread causing the exception has ended. However, you can stillselect the exception to be examined from the list displayed on the PeriodicExceptions List window. If history and data collector are available, the OnlineMonitor retrieves past data and displays the Thread Detail panel where you canexamine the thread causing the exception.
┌─────────────────────────────────────────────────────────────────────────────┐│ DGOMLAXP Periodic Exceptions List Row 499 to 500 of 500 ││ ││ Periodic Interval started . . . . . . . : 04/03/99 11:43:26:10 ││ Last Interval . . . . . . . . . . . . . : 04/03/99 14:27:41:22 ││ ││ Time Location Group Subsystem Member Corrname ││ Reqloc Primauth Planname Connect Corrnmbr ││ Field Value Compare Threshold Type By ││ Descr ││ -------- ------------------ -------- ------------ -------- ---------- ││ _ 14:27:41 PMO1DLOC GROUP001 DSN1 MEMBER01 TESTDC6 ││ 'BLANK' TFA6 CICSEMP APPCICP3 'BLANK' ││ ADDBCPUT 0.108004 > 0.1 Problem Total ││ CPU TIME IN DB2 (CLASS 2) ││ ││ ***************************** Bottom of data ****************************** ││ ││ ││ ││ Command ===> ______________________________________________________________ ││ F1=Help F2=Split F3=Exit F7=Up F8=Down F9=Swap ││ F12=Cancel │└─────────────────────────────────────────────────────────────────────────────┘
Figure 144. Periodic Exceptions List Window
Problem Identification
208 DB2 PM Online Monitor User’s Guide
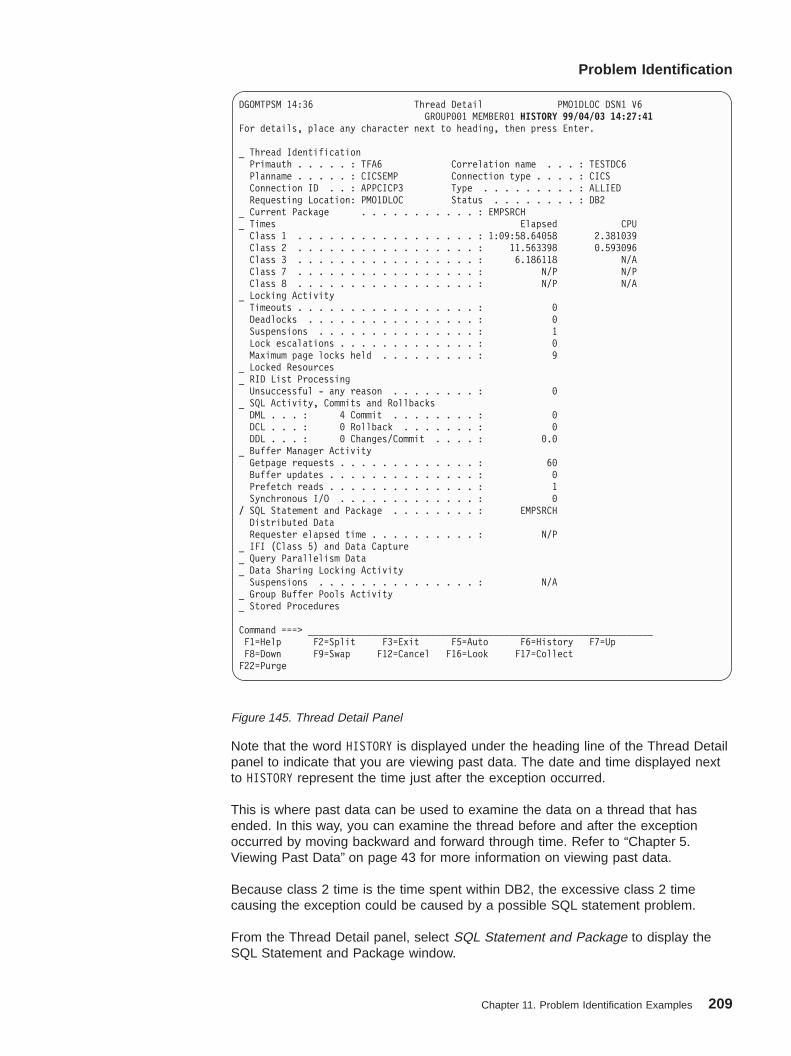
Note that the word HISTORY is displayed under the heading line of the Thread Detailpanel to indicate that you are viewing past data. The date and time displayed nextto HISTORY represent the time just after the exception occurred.
This is where past data can be used to examine the data on a thread that hasended. In this way, you can examine the thread before and after the exceptionoccurred by moving backward and forward through time. Refer to “Chapter 5.Viewing Past Data” on page 43 for more information on viewing past data.
Because class 2 time is the time spent within DB2, the excessive class 2 timecausing the exception could be caused by a possible SQL statement problem.
From the Thread Detail panel, select SQL Statement and Package to display theSQL Statement and Package window.
DGOMTPSM 14:36 Thread Detail PMO1DLOC DSN1 V6GROUP001 MEMBER01 HISTORY 99/04/03 14:27:41
For details, place any character next to heading, then press Enter.
_ Thread IdentificationPrimauth . . . . . : TFA6 Correlation name . . . : TESTDC6Planname . . . . . : CICSEMP Connection type . . . . : CICSConnection ID . . : APPCICP3 Type . . . . . . . . . : ALLIEDRequesting Location: PMO1DLOC Status . . . . . . . . : DB2
_ Current Package . . . . . . . . . . . : EMPSRCH_ Times Elapsed CPUClass 1 . . . . . . . . . . . . . . . . . : 1:09:58.64058 2.381039Class 2 . . . . . . . . . . . . . . . . . : 11.563398 0.593096Class 3 . . . . . . . . . . . . . . . . . : 6.186118 N/AClass 7 . . . . . . . . . . . . . . . . . : N/P N/PClass 8 . . . . . . . . . . . . . . . . . : N/P N/A
_ Locking ActivityTimeouts . . . . . . . . . . . . . . . . . : 0Deadlocks . . . . . . . . . . . . . . . . : 0Suspensions . . . . . . . . . . . . . . . : 1Lock escalations . . . . . . . . . . . . . : 0Maximum page locks held . . . . . . . . . : 9
_ Locked Resources_ RID List ProcessingUnsuccessful - any reason . . . . . . . . : 0
_ SQL Activity, Commits and RollbacksDML . . . : 4 Commit . . . . . . . . : 0DCL . . . : 0 Rollback . . . . . . . : 0DDL . . . : 0 Changes/Commit . . . . : 0.0
_ Buffer Manager ActivityGetpage requests . . . . . . . . . . . . . : 60Buffer updates . . . . . . . . . . . . . . : 0Prefetch reads . . . . . . . . . . . . . . : 1Synchronous I/O . . . . . . . . . . . . . : 0
/ SQL Statement and Package . . . . . . . . : EMPSRCHDistributed DataRequester elapsed time . . . . . . . . . . : N/P
_ IFI (Class 5) and Data Capture_ Query Parallelism Data_ Data Sharing Locking ActivitySuspensions . . . . . . . . . . . . . . . : N/A
_ Group Buffer Pools Activity_ Stored Procedures
Command ===> _________________________________________________________________F1=Help F2=Split F3=Exit F5=Auto F6=History F7=UpF8=Down F9=Swap F12=Cancel F16=Look F17=CollectF22=Purge
Figure 145. Thread Detail Panel
Problem Identification
Chapter 11. Problem Identification Examples 209

This window displays the SQL statement executing at the time the exceptionoccurred. To obtain details on the access paths chosen by DB2 to process the SQLstatement, press F18 (Explain) to explain the SQL statement and display the DB2Explain Output panel.
┌─────────────────────────────────────────────────────────────────────────┐│ DGOMTWCS SQL Statement and Package ROW 1 TO 1 OF 1 ││ HISTORY 99/04/03 14:27:41 ││ ││ Location . . . . . . . . . . . . . : PMO1DLOC ││ Collection ID . . . . . . . . . . : EMPLOYEE ││ Program Name . . . . . . . . . . . : EMPSRCH ││ Consistency Token . . . . . . . . : X'149EEA901A79FE48' ││ Version ││ EMPSRCH_PACKAGE_VERSION1 ││ ││ Statement type . . . . . . . . . . : CLOSE ││ Statement number . . . . . . . . . : 137 ││ ││ Thread status . . . . . . . . . . : In application ││ ││ SQL Statement ││ SELECT EMPNO, LASTNAME, WORKDEPT, BIRTHDATE FROM DSN8610.EMP WHERE ││ EMPNO = :H ││ *************************** BOTTOM OF DATA **************************** ││ ││ ││ ││ Command ===> __________________________________________________________ ││ F1=Help F2=Split F3=Exit F5=Auto F6=History F7=Up ││ F8=Down F9=Swap F12=Cancel F16=Look F17=Collect F18=Explain ││ F22=Purge │└─────────────────────────────────────────────────────────────────────────┘
Figure 146. SQL Statement and Package Window
Problem Identification
210 DB2 PM Online Monitor User’s Guide

Diagnosis, Modification, or Tuning Information
End of Diagnosis, Modification, or Tuning Information
The access path summary on the DB2 Explain Output panel shows that a tablespace scan is being used to access the table. This could indicate the reason for theexcessive class 2 time.
Select the table from the DB2 Explain Output panel to display the Table Informationwindow, where you can see if any indexes have been defined for the table.
DGOMYPKM DB2 Explain Output More - +
Local location . . . . . . : PMO1DLOC DSN1 V6Current server . . . . . . : PMO1DLOC DSN1 V6
_ Package . . . . . . . . . . . . : EMPLOYEE.EMPSRCHVersion . . . . . . . . . . . . : EMPSRCH_PACKAGE_VERSION1
Explain executed at . . . . : 13:10:52 03/16/99
------------------------------ SQL Text -----------------------------------_ SELECT EMPNO, LASTNAME, WORKDEPT, BIRTHDATE FROM DSN8610.EMP WHERE
EMPNO = :EMPLOYEE_NUMBERStatus : Compiled-REPORT specified. Rebound at exec.time using valuesIsolation: Cursor stability
_ Host variable definitions
----- Access path summary for query block 1 step 1 -----Table space scan - no index will be usedStandard sequential prefetch will be performedLock mode is share lock for the pagePage range scan will not be used
/ Table DSN8610 EMP
_ PLAN_TABLE details for step
----- Access path summary for query block 1 step 2 -----Command ===> _________________________________________________________________F1=Help F2=Split F3=Exit F7=Up F8=Down F9=SwapF12=Cancel F16=Look F17=Collect
Figure 147. DB2 Explain Output Panel (Packages)
Problem Identification
Chapter 11. Problem Identification Examples 211

From this window you can see that an index has been defined for the table. SelectIndexes to display the Index Selection window where you can select the index to beexamined. In this example, the index selected is DSN8610.XEMP1. This displaysthe Index Information window.
┌─────────────────────────────────────────────────────────────────────────┐│ DGOMYWTI Table Information ││ ││ Local location . . . . . . : PMO1DLOC DSN1 V6 ││ Current server . . . . . . : PMO1DLOC DSN1 V6 ││ More: - + ││ Table name . . . . . . . . . . . . . . . : DSN8610.EMP ││ Type . . . . . . . . . . . . . . . . . . : TABLE ││ / Indexes . . . . . . . . . . . . . . . . : YES ││ Database name . . . . . . . . . . . . . : DSN8D31A ││ _ Table space name . . . . . . . . . . . . : DSN8S31E ││ Table identifier . . . . . . . . . . . . : 14 ││ Columns . . . . . . . . . . . . . . . . : 14 ││ Rows . . . . . . . . . . . . . . . . . . : 32 ││ Status . . . . . . . . . . . . . . . . . : HAS PRIMARY INDEX ││ Maximum record length . . . . . . . . . : 107 ││ Pages . . . . . . . . . . . . . . . . . : 1 ││ Percentage of pages used . . . . . . . . : 2 ││ Last RUNSTATS . . . . . . . . . . . . . : 03/04/99 10:53:27 ││ EDIT procedure name . . . . . . . . . . : DSN8EAE1 ││ VALIDATION procedure . . . . . . . . . . : NONE ││ Auditing . . . . . . . . . . . . . . . . : NONE ││ DATA CAPTURE option . . . . . . . . . . : NONE ││ Row compression . . . . . . . . . . . . : 0 ││ Alias table or view . . . . . . . . . . : ││ Check constraints . . . . . . . . . . . : 0 ││ Encoding scheme . . . . . . . . . . . . : EBCDIC ││ ││ Command ===> __________________________________________________________ ││ F1=Help F2=Split F3=Exit F7=Up F8=Down F9=Swap ││ F12=Cancel F16=Look F17=Collect │└─────────────────────────────────────────────────────────────────────────┘
Figure 148. Table Information Window
Problem Identification
212 DB2 PM Online Monitor User’s Guide

From the Index Information window, you can select Key columns to display the KeyColumn Information window.
┌─────────────────────────────────────────────────────────────────────────────┐│ DGOMYWII Index Information ││ ││ Local location . . . . . . : PMO1DLOC DSN1 V6 ││ Current server . . . . . . : PMO1DLOC DSN1 V6 ││ More: - + ││ _ Index name . . . . . . . . . . . . . . . . . : DSN8610.XEMP1 ││ Index space name . . . . . . . . . . . . . . : XEMP1 ││ Table name . . . . . . . . . . . . . . . . . : DSN8610.EMP ││ Database name . . . . . . . . . . . . . . . : DSN8D31A ││ Buffer pool . . . . . . . . . . . . . . . . : BP0 ││ / Key columns . . . . . . . . . . . . . . . . : 1 ││ Subpage size (bytes) . . . . . . . . . . . . : 512 ││ Unique rule . . . . . . . . . . . . . . . . : PRIMARY - UNIQUE ││ Clustering index . . . . . . . . . . . . . . : YES ││ Currently clustered . . . . . . . . . . . . : YES ││ Cluster ratio . . . . . . . . . . . . . . . : 100 ││ Full key card . . . . . . . . . . . . . . . : 32 ││ First key card . . . . . . . . . . . . . . . : 32 ││ Levels . . . . . . . . . . . . . . . . . . . : 1 ││ Leaf pages . . . . . . . . . . . . . . . . . : 1 ││ Maximum piece size (KB) . . . . . . . . . . : 256 ││ Close rule . . . . . . . . . . . . . . . . . : LEAVE OPEN ││ Last RUNSTATS . . . . . . . . . . . . . . . : 03/04/99 10:53:27 ││ Allocated space . . . . . . . . . . . . . . : 0 ││ Erase rule . . . . . . . . . . . . . . . . . : NO ││ Index type . . . . . . . . . . . . . . . . . : 2 ││ Time of CREATE INDEX . . . . . . . . . . . . : 1998-10-11-08.12.59.000000 ││ Time of last ALTER INDEX . . . . . . . . . . : 1998-10-11-10.22.30.000000 ││ ││ Command ===> ______________________________________________________________ ││ F1=Help F2=Split F3=Exit F7=Up F8=Down F9=Swap ││ F12=Cancel F16=Look F17=Collect │└─────────────────────────────────────────────────────────────────────────────┘
Figure 149. Index Information Window
Problem Identification
Chapter 11. Problem Identification Examples 213

Use this window to examine the characteristics of the key column on which theindex has been defined.
One of the possible reasons for an index not being used is that the host variabledefined in the program does not match the characteristics of the column as definedin the table. To determine whether this is the reason for the index not being used,you can return to the DB2 Explain Output panel where the Host Variable Definitionwindow can be selected.
In this particular example, the Host Variable Definition window shows that thedefinitions do not match, thereby disqualifying use of the index.
The host variable defined in the source program should be changed to match thetable definition so that DB2 can use the index and thereby reduce the class 2 time.
┌───────────────────────────────────────────────────────────────────┐│ DGOMYWCI Key Column Information ││ ││ Local location . . . . . . : PMO1DLOC DSN1 V6 ││ Current server . . . . . . : PMO1DLOC DSN1 V6 ││ More: - + ││ Column name . . . . . . . . . : EMPNO ││ Table name . . . . . . . . . . : DSN8610.EMP ││ Index name . . . . . . . . . . : DSN8610.XEMP1 ││ Position . . . . . . . . . . . : 6 ││ Sequence . . . . . . . . . . . : Ascending ││ Type . . . . . . . . . . . . . : CHAR ││ Length . . . . . . . . . . . . : 6 ││ Scale . . . . . . . . . . . . : 0 ││ Key cardinality . . . . . . . : 123 ││ Null value . . . . . . . . . . : No ││ Second highest value . . . . . : 200330 ││ Second lowest value . . . . . : 000020 ││ Last RUNSTATS . . . . . . . . : 1999-03-04-13.10.33.103784 ││ ││ _ Show Key Distribution values ││ ││ Command ===> ____________________________________________________ ││ F1=Help F2=Split F3=Exit F7=Up F8=Down ││ F9=Swap F12=Cancel F16=Look F17=Collect │└───────────────────────────────────────────────────────────────────┘
Figure 150. Key Column Information Window
┌─────────────────────── Host Variable Definition ────────────────────────┐│ DGOMYWHV ││ ││ Local location . . . . . . . : PMO1DLOC DSN1 V6 ││ Current server . . . . . . . : PMO1DLOC DSN1 V6 ││ ││ ││ Name Type Length ││ EMPLOYEE_NUMBER FIXED CHARACTER 8 ││ ││ ││ Command ===> __________________________________________________________ ││ F1=Help F2=Split F3=Exit F7=Up F8=Down F9=Swap ││ F12=Cancel F16=Look F17=Collect │└─────────────────────────────────────────────────────────────────────────┘
Figure 151. Host Variable Definition Window
Problem Identification
214 DB2 PM Online Monitor User’s Guide
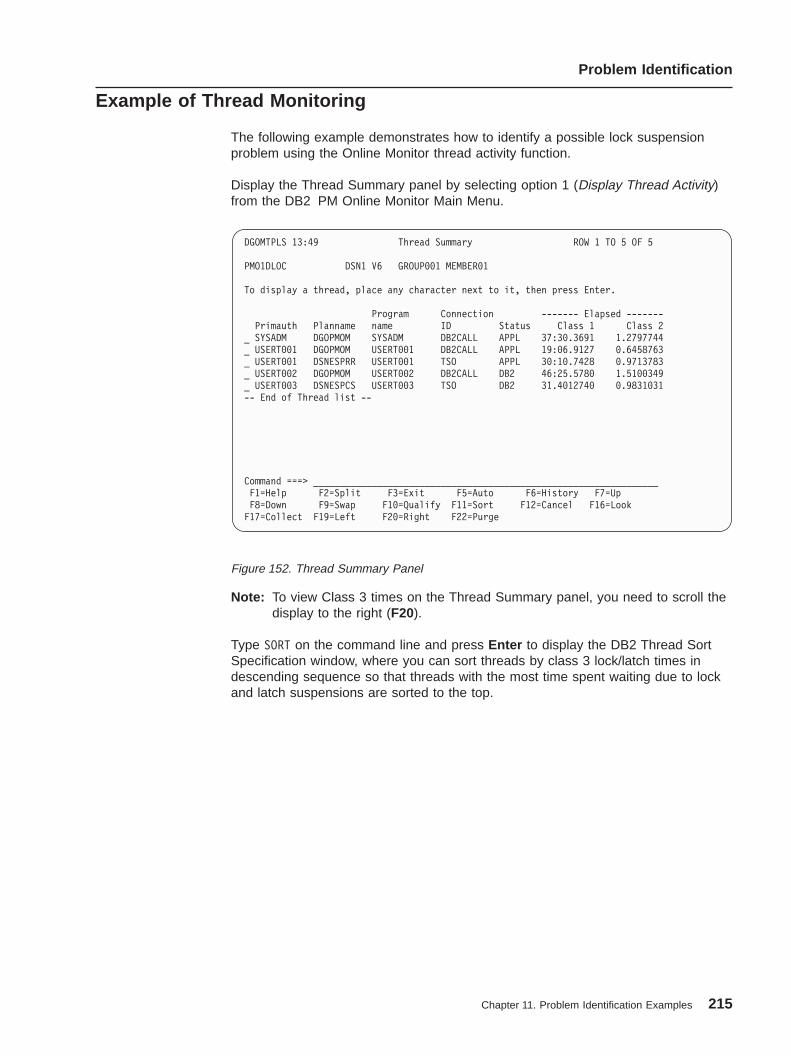
Example of Thread Monitoring
The following example demonstrates how to identify a possible lock suspensionproblem using the Online Monitor thread activity function.
Display the Thread Summary panel by selecting option 1 (Display Thread Activity)from the DB2 PM Online Monitor Main Menu.
Note: To view Class 3 times on the Thread Summary panel, you need to scroll thedisplay to the right (F20).
Type SORT on the command line and press Enter to display the DB2 Thread SortSpecification window, where you can sort threads by class 3 lock/latch times indescending sequence so that threads with the most time spent waiting due to lockand latch suspensions are sorted to the top.
DGOMTPLS 13:49 Thread Summary ROW 1 TO 5 OF 5
PMO1DLOC DSN1 V6 GROUP001 MEMBER01
To display a thread, place any character next to it, then press Enter.
Program Connection ------- Elapsed -------Primauth Planname name ID Status Class 1 Class 2
_ SYSADM DGOPMOM SYSADM DB2CALL APPL 37:30.3691 1.2797744_ USERT001 DGOPMOM USERT001 DB2CALL APPL 19:06.9127 0.6458763_ USERT001 DSNESPRR USERT001 TSO APPL 30:10.7428 0.9713783_ USERT002 DGOPMOM USERT002 DB2CALL DB2 46:25.5780 1.5100349_ USERT003 DSNESPCS USERT003 TSO DB2 31.4012740 0.9831031-- End of Thread list --
Command ===> _________________________________________________________________F1=Help F2=Split F3=Exit F5=Auto F6=History F7=UpF8=Down F9=Swap F10=Qualify F11=Sort F12=Cancel F16=LookF17=Collect F19=Left F20=Right F22=Purge
Figure 152. Thread Summary Panel
Problem Identification
Chapter 11. Problem Identification Examples 215
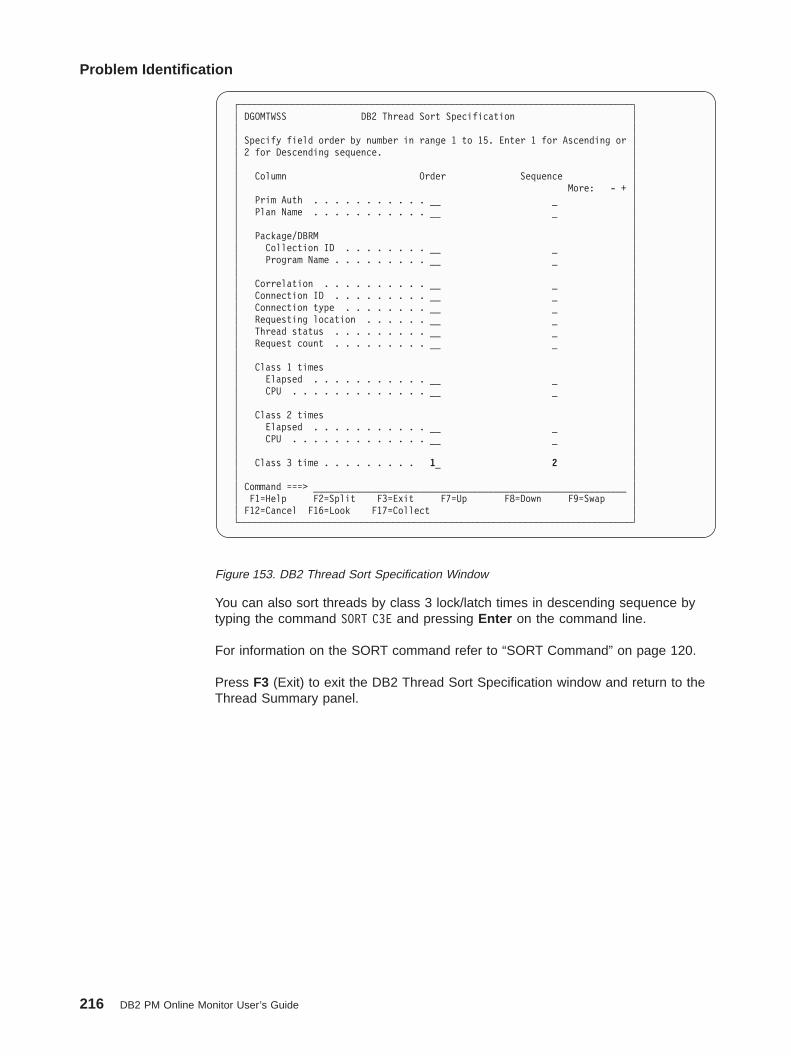
You can also sort threads by class 3 lock/latch times in descending sequence bytyping the command SORT C3E and pressing Enter on the command line.
For information on the SORT command refer to “SORT Command” on page 120.
Press F3 (Exit) to exit the DB2 Thread Sort Specification window and return to theThread Summary panel.
┌──────────────────────────────────────────────────────────────────────────┐│ DGOMTWSS DB2 Thread Sort Specification ││ ││ Specify field order by number in range 1 to 15. Enter 1 for Ascending or ││ 2 for Descending sequence. ││ ││ Column Order Sequence ││ More: - + ││ Prim Auth . . . . . . . . . . . __ _ ││ Plan Name . . . . . . . . . . . __ _ ││ ││ Package/DBRM ││ Collection ID . . . . . . . . __ _ ││ Program Name . . . . . . . . . __ _ ││ ││ Correlation . . . . . . . . . . __ _ ││ Connection ID . . . . . . . . . __ _ ││ Connection type . . . . . . . . __ _ ││ Requesting location . . . . . . __ _ ││ Thread status . . . . . . . . . __ _ ││ Request count . . . . . . . . . __ _ ││ ││ Class 1 times ││ Elapsed . . . . . . . . . . . __ _ ││ CPU . . . . . . . . . . . . . __ _ ││ ││ Class 2 times ││ Elapsed . . . . . . . . . . . __ _ ││ CPU . . . . . . . . . . . . . __ _ ││ ││ Class 3 time . . . . . . . . . 1_ 2 ││ ││ Command ===> ___________________________________________________________ ││ F1=Help F2=Split F3=Exit F7=Up F8=Down F9=Swap ││ F12=Cancel F16=Look F17=Collect │└──────────────────────────────────────────────────────────────────────────┘
Figure 153. DB2 Thread Sort Specification Window
Problem Identification
216 DB2 PM Online Monitor User’s Guide

At this point, all threads have been sorted in descending sequence by class 3lock/latch time, although this field is not displayed. You can press the F20 (Right)key to view class 3 times. Note that the word SORT is displayed in the header of theThread Summary panel.
If, for example, you want to view detailed information about the class 3 lock andlatch times of a particular thread, type any character next to that thread and pressEnter . The Thread Detail panel is displayed.
Note: The Thread Detail panel you see may have been tailored by your installationand consequently may not necessarily match the panel examples shown inthis book.
DGOMTPLS 13:54 Thread Summary SORT ROW 1 TO 5 OF 5
PMO1DLOC DSN1 V6 GROUP001 MEMBER01
To display a thread, place any character next to it, then press Enter.
Program Connection ------- Elapsed -------Primauth Planname name ID Status Class 1 Class 2
/ USERT003 DSNESPCS USERT003 TSO LOCK 2:43.66156 1:11.85677_ USERT001 DGOPMOM USERT001 DB2CALL APPL 19:06.9123 0.6458763_ USERT001 DSNESPRR USERT001 TSO APPL 30:10.7424 0.9713783_ USERT002 DGOPMOM USERT002 DB2CALL DB2 46:25.5787 1.5100349_ SYSADM DGOPMOM SYSADM DB2CALL APPL 37:30.369 1.2797744-- End of Thread list --
Command ===> _________________________________________________________________F1=Help F2=Split F3=Exit F5=Auto F6=History F7=UpF8=Down F9=Swap F10=Qualify F11=Sort F12=Cancel F16=LookF17=Collect F19=Left F20=Right F22=Purge
Figure 154. Thread Summary Panel
Problem Identification
Chapter 11. Problem Identification Examples 217
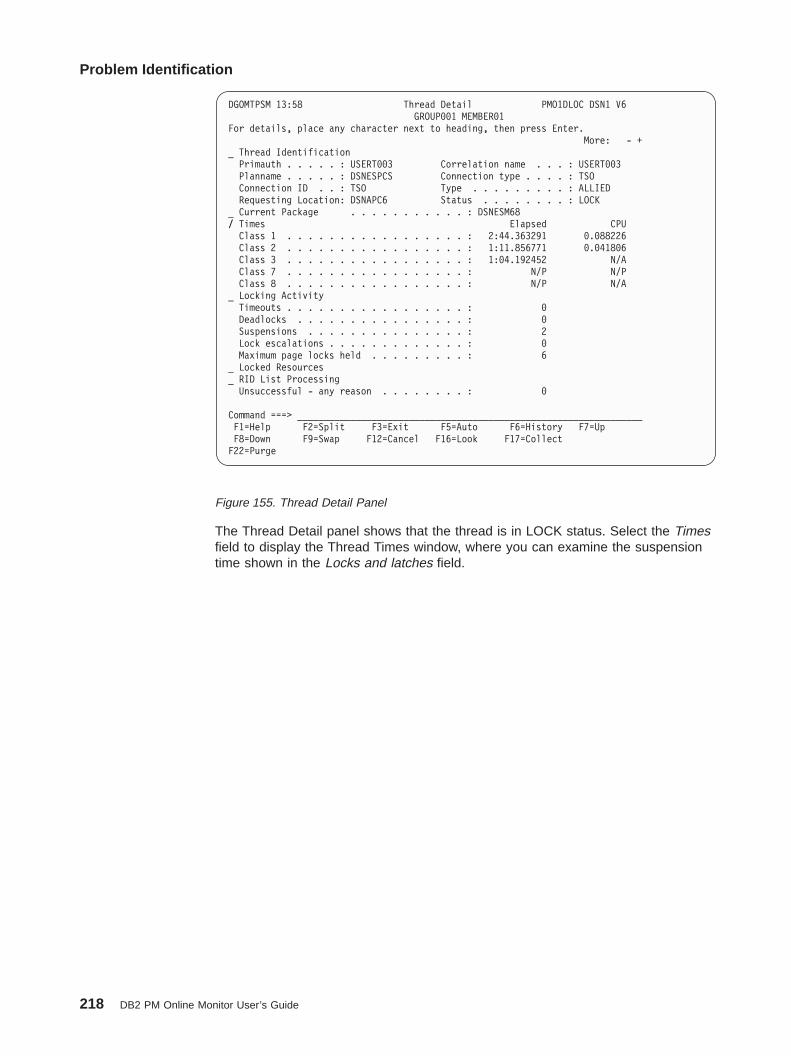
The Thread Detail panel shows that the thread is in LOCK status. Select the Timesfield to display the Thread Times window, where you can examine the suspensiontime shown in the Locks and latches field.
DGOMTPSM 13:58 Thread Detail PMO1DLOC DSN1 V6GROUP001 MEMBER01
For details, place any character next to heading, then press Enter.More: - +
_ Thread IdentificationPrimauth . . . . . : USERT003 Correlation name . . . : USERT003Planname . . . . . : DSNESPCS Connection type . . . . : TSOConnection ID . . : TSO Type . . . . . . . . . : ALLIEDRequesting Location: DSNAPC6 Status . . . . . . . . : LOCK
_ Current Package . . . . . . . . . . . : DSNESM68/ Times Elapsed CPUClass 1 . . . . . . . . . . . . . . . . . : 2:44.363291 0.088226Class 2 . . . . . . . . . . . . . . . . . : 1:11.856771 0.041806Class 3 . . . . . . . . . . . . . . . . . : 1:04.192452 N/AClass 7 . . . . . . . . . . . . . . . . . : N/P N/PClass 8 . . . . . . . . . . . . . . . . . : N/P N/A
_ Locking ActivityTimeouts . . . . . . . . . . . . . . . . . : 0Deadlocks . . . . . . . . . . . . . . . . : 0Suspensions . . . . . . . . . . . . . . . : 2Lock escalations . . . . . . . . . . . . . : 0Maximum page locks held . . . . . . . . . : 6
_ Locked Resources_ RID List ProcessingUnsuccessful - any reason . . . . . . . . : 0
Command ===> _________________________________________________________________F1=Help F2=Split F3=Exit F5=Auto F6=History F7=UpF8=Down F9=Swap F12=Cancel F16=Look F17=CollectF22=Purge
Figure 155. Thread Detail Panel
Problem Identification
218 DB2 PM Online Monitor User’s Guide

As you can see, most of the total class 3 suspension time is due to locks andlatches.
To view the locked resources associated with this thread, press F3 (Exit) to returnto the Thread Detail panel and select the Locked Resources field.
The Locked Resources window is displayed.
┌────────────────────────────────────────────────────────────────────────────┐│ DGOMTWTI Thread Times ││ ││ More: - + ││ Class 1 Class 2 ││ In Appl In DB2 Outside DB2 ││ Elapsed time . . . . . . : 2:44.363291 1:11.856771 1:32.106573 ││ CPU time . . . . . . . . : 0.088226 0.041806 0.046421 ││ TCB . . . . . . . . . : 0.088226 0.041806 0.046421 ││ TCB - Stored Proc . . : 0.000000 0.000000 ││ Parallel tasks . . . . : 0.000000 0.000000 ││ Waiting time . . . . . . : N/A 1:11.814965 ││ Suspension time . . . . : N/A 1:04.192450 ││ TCB . . . . . . . . . : N/A 1:04.192450 ││ Parallel tasks . . . . : N/A 0.000000 ││ Not accounted . . . . . : N/A 7.622515 ││ Time Event ││ Suspensions (Class 3). . . . . . . . . . : 1:04.19245 8 ││ Locks and latches . . . . . . . . . . : 1:04.16683 3 ││ Synchronous I/O . . . . . . . . . . . : 0.000000 0 ││ Other read I/O . . . . . . . . . . . : 0.000000 0 ││ Other write I/O . . . . . . . . . . . : 0.000000 0 ││ Services task switch . . . . . . . . : 0.025619 5 ││ Archive log (quiesce) . . . . . . . . : 0.000000 0 ││ Command ===> ___________________________________________________________ ││ F1=Help F2=Split F3=Exit F5=Auto F6=History F7=Up ││ F8=Down F9=Swap F12=Cancel F16=Look F17=Collect F22=Purge │└────────────────────────────────────────────────────────────────────────────┘
Figure 156. Thread Times Window
Problem Identification
Chapter 11. Problem Identification Examples 219

All locks held by the selected thread USERT003 are displayed.
You can see that a suspension has occurred for object MACBP2TB. To view allusers contending for the same object, type any character next to that object andpress Enter . The Threads Holding Resource window is displayed.
All threads involved in the locking of this resource are displayed. From this window,it can be seen that USERT001 is causing USERT003 to be suspended. Thisproblem can be resolved if USERT001 uses the SPUFI cursor stability plan(DSNESPCS), as does USERT003, instead of the SPUFI repeatable read plan
┌────────────────────────────────────────────────────────────────────────────┐│ DGOMTWLD Locked Resources ROW 1 TO 5 OF 5 ││ ││ ││ For a list of all the threads that have a lock on a resource, place any ││ character next to the resource, then press Enter. ││ ││ Database Type Status Duration Attribute ││ Object Count Suspended Function ││ / MACBP2DB PAGESET N/A COMMIT L-LOCK ││ MACBP2TB 2 YES LOCK ││ _ MACBP2DB PAGESET IS COMMIT L-LOCK ││ MACBP2TS 1 NO N/A ││ _ MACBP2DB DATABASE S COMMIT L-LOCK ││ N/A 1 NO N/A ││ _ DSNDB06 SKPT S COMMIT L-LOCK ││ SYSUSER 1 NO N/A ││ _ N/A SKCT S PLAN L-LOCK ││ DSNESPCS 1 NO N/A ││ ***************************** BOTTOM OF DATA ***************************** ││ ││ Command ===> _____________________________________________________________ ││ F1=Help F2=Split F3=Exit F5=Auto F6=History F7=Up ││ F8=Down F9=Swap F12=Cancel F16=Look F17=Collect F22=Purge │└────────────────────────────────────────────────────────────────────────────┘
Figure 157. Locked Resources Window
┌────────────────────────────────────────────────────────────────────────────┐│ DGOMTWRL Threads Holding Resource ROW 1 TO 2 OF 2 ││ ││ ││ To display a new thread, place any character next to it, then press Enter. ││ The Thread Detail will be displayed. ││ ││ Database . . . . . . . . : MACBP2DB Object . . . : MACBP2TB ││ Resource type . . . . . : PAGESET Resource . . : N/A ││ ││ Primauth Corrname Status Subsystem ││ Planname Connection Suspended Duration ││ _ USERT001 USERT001 S N/P ││ DSNESPRR TSO NO COMMIT ││ _ USERT003 USERT003 N/A N/P ││ DSNESPCS TSO YES COMMIT ││ ***************************** BOTTOM OF DATA ***************************** ││ ││ Command ===> ____________________________________________________________ ││ F1=Help F2=Split F3=Exit F5=Auto F6=History F7=Up ││ F8=Down F9=Swap F12=Cancel F16=Look F17=Collect F22=Purge │└────────────────────────────────────────────────────────────────────────────┘
Figure 158. Threads Holding Resource Window (Planname)
Problem Identification
220 DB2 PM Online Monitor User’s Guide

(DSNESPRR). You should decide whether it is necessary for USERT001 to useDSNESPRR, or if DSNESPCS can be used instead.
Using the Online Monitor in Deadlock Resolution
A deadlock is an error condition where processing cannot continue due to anunresolved contention for a particular resource. A deadlock is signaled when thedeadlock detection cycle time has been reached. You should ensure that theresource timeout limit is at least twice that of the deadlock detection cycle so thatdeadlocks are detected before a timeout occurs.
Deadlock Detection
Start the data collector to collect deadlock events.
Start exception event processing from the Exception Processor panel to be notifiedwhen an exception event occurs. Refer to “How to Start Exception Processing” onpage 56.
Deadlock Resolution
On detection of a deadlock, use LOOK to display the participants in the deadlock.
Problem Identification
Chapter 11. Problem Identification Examples 221

If the Locked resource Type field is Datapage, ensure that all applications (Holderand Waiter) access the resource in the same order.
If the deadlock concerns an index with high insert activity (that is, the Lockedresource Type field is Index Page), you should set the SUBPAGES parameter forthe index to 1 or consider converting the index to type 2. If the problem is notrelated to SUBPAGES, it could be that the commit frequency for an updateapplication is too low. The ratio of updates per commit can be viewed on the ThreadDetail panel.
┌─────────────────────────────────────────────────────────────────────────────┐│ DGOMLED0 Deadlock Data ││ More: - + ││ IFCID . . . . . . . . . . . . . . . . . : 172 ││ ││ Number of resources involved in deadlock : 2 ││ Deadlock interval counter . . . . . . . : 2 ││ Time deadlock detected . . . . . . . . . : 21:38:34.15 ││ ││ Locked resource ││ Type . . . . . . . . : Datapage ││ Database . . . . . . : 271 Object : 6 ││ Page # . . . . . . . : X'3001F1' ││ ││ Blocker ││ Member/DBMS identifier . . . . . . . . . : MEMBER01 ││ Plan name . . . . . . . . . . . . . . . : DDLD3P18 ││ Correlation identifier . . . . . . . . . : RUNPRG18 ││ Connection identifier . . . . . . . . . : BATCH ││ LUW identifier . . . . . . . . . . . . . : USIBMSY.SY10BDB2.A74AB9FEF91C ││ State . . . . . . . . . . . . . . . . . : EXCLUSIVE ││ Duration . . . . . . . . . . . . . . . . : COMMIT ││ Status . . . . . . . . . . . . . . . . . : WAIT ││ ││ Waiter ││ Member/DBMS identifier . . . . . . . . . : MEMBER02 ││ Plan name . . . . . . . . . . . . . . . : DDLD3P15 ││ Correlation identifier . . . . . . . . . : RUNPRG15 ││ Connection identifier . . . . . . . . . : BATCH ││ LUW identifier . . . . . . . . . . . . . : USIBMSY.SY30BDB2.A74AB9EE117F ││ Requested function . . . . . . . . . . . : LOCK ││ State . . . . . . . . . . . . . . . . . : UPDATE ││ Duration . . . . . . . . . . . . . . . . : MANUAL ││ DB2 assigned worth value . . . . . . . . : 18 ││ ││ Command ===> ______________________________________________________________ ││ F1=Help F2=Split F3=Exit F7=Up F8=Down ││ F9=Swap F12=Cancel │└─────────────────────────────────────────────────────────────────────────────┘
Figure 159. Deadlock Data Panel
Problem Identification
222 DB2 PM Online Monitor User’s Guide
Part 4. Customizing the Online Monitor
Chapter 12. Tailoring Exception Thresholds—Exception Profiling . . . . 225Exception Profiling Panel . . . . . . . . . . . . . . . . . . . . . 225Profiling Method . . . . . . . . . . . . . . . . . . . . . . . . 226Exception Profiling Input Data . . . . . . . . . . . . . . . . . . . 227Sample Exception Profiling Report . . . . . . . . . . . . . . . . . 227
Chapter 13. Customizing Panels . . . . . . . . . . . . . . . . . 229Panel Customization Example . . . . . . . . . . . . . . . . . . . 229How to Customize Panels . . . . . . . . . . . . . . . . . . . . 230
Tailoring the Thread Detail Panel . . . . . . . . . . . . . . . . . 230Editing Exception Fields . . . . . . . . . . . . . . . . . . . . 231Editing Selection Fields . . . . . . . . . . . . . . . . . . . . 231
Chapter 14. Data Collector Purpose and Function . . . . . . . . . . 233Viewing Past Data . . . . . . . . . . . . . . . . . . . . . . . 233Periodic Exceptions . . . . . . . . . . . . . . . . . . . . . . . 233Exception Events. . . . . . . . . . . . . . . . . . . . . . . . 234Collection of Parallelism Data . . . . . . . . . . . . . . . . . . . 234Data Agent for Workstation Online Monitor . . . . . . . . . . . . . . 234
Chapter 15. Administrator User . . . . . . . . . . . . . . . . . . 235Active Data Collector List Window . . . . . . . . . . . . . . . . . 235Data Collector Parameters Window . . . . . . . . . . . . . . . . . 235History Qualification Window . . . . . . . . . . . . . . . . . . . 237
© Copyright IBM Corp. 1985, 1999 223

224 DB2 PM Online Monitor User’s Guide
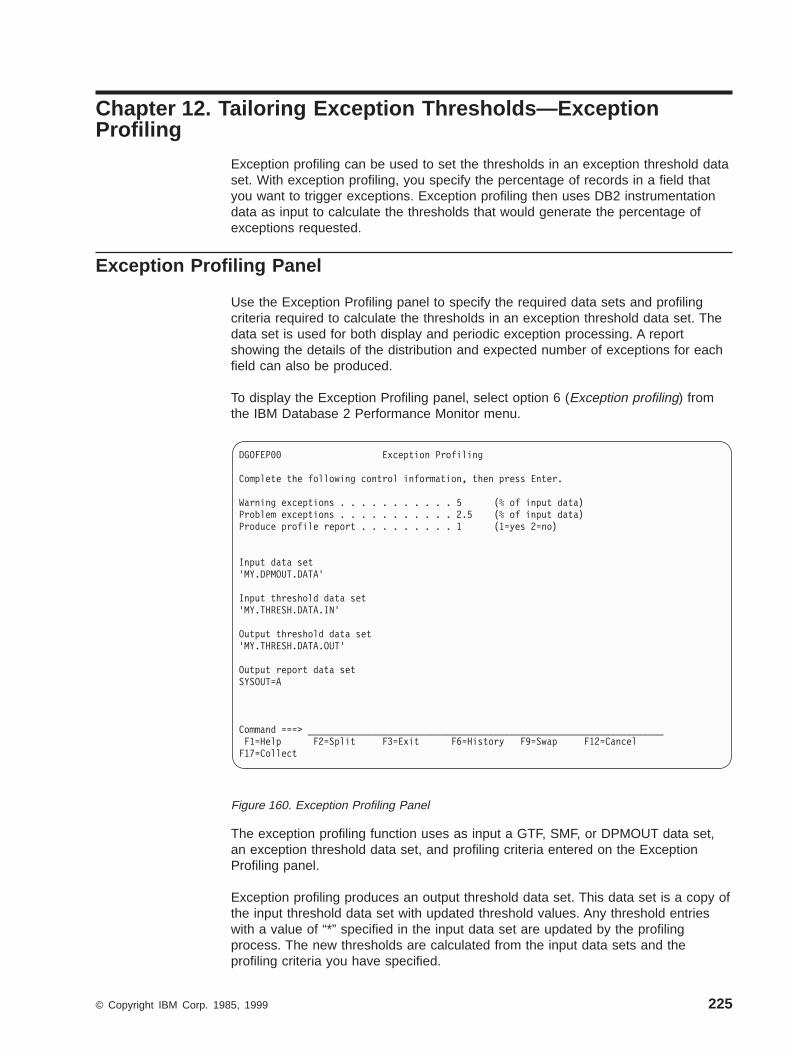
Chapter 12. Tailoring Exception Thresholds—ExceptionProfiling
Exception profiling can be used to set the thresholds in an exception threshold dataset. With exception profiling, you specify the percentage of records in a field thatyou want to trigger exceptions. Exception profiling then uses DB2 instrumentationdata as input to calculate the thresholds that would generate the percentage ofexceptions requested.
Exception Profiling Panel
Use the Exception Profiling panel to specify the required data sets and profilingcriteria required to calculate the thresholds in an exception threshold data set. Thedata set is used for both display and periodic exception processing. A reportshowing the details of the distribution and expected number of exceptions for eachfield can also be produced.
To display the Exception Profiling panel, select option 6 (Exception profiling) fromthe IBM Database 2 Performance Monitor menu.
The exception profiling function uses as input a GTF, SMF, or DPMOUT data set,an exception threshold data set, and profiling criteria entered on the ExceptionProfiling panel.
Exception profiling produces an output threshold data set. This data set is a copy ofthe input threshold data set with updated threshold values. Any threshold entrieswith a value of “*” specified in the input data set are updated by the profilingprocess. The new thresholds are calculated from the input data sets and theprofiling criteria you have specified.
DGOFEP00 Exception Profiling
Complete the following control information, then press Enter.
Warning exceptions . . . . . . . . . . . 5 (% of input data)Problem exceptions . . . . . . . . . . . 2.5 (% of input data)Produce profile report . . . . . . . . . 1 (1=yes 2=no)
Input data set'MY.DPMOUT.DATA'
Input threshold data set'MY.THRESH.DATA.IN'
Output threshold data set'MY.THRESH.DATA.OUT'
Output report data setSYSOUT=A
Command ===> ___________________________________________________________________F1=Help F2=Split F3=Exit F6=History F9=Swap F12=CancelF17=Collect
Figure 160. Exception Profiling Panel
© Copyright IBM Corp. 1985, 1999 225

An output report data set can also be produced by specifying 1 in the Produceprofile report field on the Exception Profiling panel. This profile report containsdetails about each field, including a table of the expected number of exceptions forvarious threshold entries. Refer to Figure 161 on page 228 for an example of thisreport.
After you have entered the required information on the Exception Profiling panel,press Enter to generate a job stream and to display the Job Processing Selectionspanel, where you can browse, edit, or submit the job.
To provide you with a starting point, sample threshold member DGOETV41 hasbeen provided in SDGODATA.
Note that this member is provided only as an example and can be modified asrequired by your installation. This member contains fields with predefined thresholdsand site-specific fields with “*” for threshold values. The “*” thresholds are replacedwith calculated threshold values during exception profiling.
You can also create and submit a job stream using option 6 (Exception profiling) onthe IBM Database 2 Performance Monitor menu. A sample job stream is shown inthe following box labeled Exception Profiling—Sample JCL.
Note: Foreground execution is possible, although background execution may bepreferable if there are many records to be processed.
Exception Profiling—Sample JCL//EPV300 EXEC PGM=DB2PMEP//STEPLIB DD DSN=DGO.V6R1M0.SDGOLOAD,DISP=SHRSHR//INPUTDD DD DSN=MY.DPMOUT.DATA,DISP=SHR//SYSPRINT DD SYSOUT=*//SYSOUT DD SYSOUT=*//INTHRSH DD DSN=MY.THRESH.DATA.IN,DISP=SHR//OUTTHRSH DD DSN=MY.THRESH.DATA.OUT,DISP=OLD//EPRPTDD DD DSN=SYSOUT=A,DISP=OLD//SYSIN DD *REPORTWARNING(10)PROBLEM(5)EXEC
Profiling Method
Each record in the input data set is processed as it would be for normal Batchexception processing. However, instead of checking each field for exception, thevalue of the field is recorded. When all records have been processed, statistics canbe calculated to determine the thresholds.
The thresholds are set to a value that would generate the percentage of warningand problem level exceptions you requested.
For example, suppose the field QISECT has been specified in the exceptionthreshold data set for location DSNAPC5, with the compare set to “>”, and thewarning and problem thresholds set to “*”. The profiling criteria are specified as 5%for warning and 2.5% for problem thresholds on the Exception Profiling panel. If the
226 DB2 PM Online Monitor User’s Guide

data set is processed and 320 records are found for field QISECT with the locationDSNAPC5, exception profiling sets the warning threshold to the 17th highest record.This would generate 16 warning exceptions on average, which is 5% of the records(as requested). Similarly, the problem threshold is set to the 9th largest record,averaging 8 problem exceptions, which is 2.5% of the records.
Exception Profiling Input Data
Input to exception profiling consists of the following:
v Exception threshold data set
An exception threshold data set is used to specify which thresholds you wantcalculated by exception profiling. Only the thresholds containing an asterisk (*)are calculated.
v Input data set
The input data set can be a GTF, SMF, or DPMOUT data set. Use theaccounting and statistics records you have collected over a normal work period.This can be a day or any representative number of hours. Usually these recordscome from SMF, although other sources such as GTF and collect report data arepossible. But it is simplest to use the data you have on hand for normal batchaccounting and statistics processing.
Exception profiling uses past input data to calculate threshold values appropriateto your system. Therefore, the records in the input data set should berepresentative of the type of data you expect to be generated in the future.
v Profiling criteria
The profiling criteria are entered on the Exception Profiling panel. The criteriaspecify the percentage of records you want to trigger warning exceptions (forexample 5.00%), and the percentage to trigger problem exceptions (for example2.50%). The percentage you specify can be as small as 0.01%. Refer to“Profiling Method” on page 226 for information about how this input is used todetermine threshold values.
Sample Exception Profiling Report
Use the exception profiling report to examine the results of exception profiling.
An example of an exception profiling report is shown in Figure 161.
Chapter 12. Tailoring Exception Thresholds—Exception Profiling 227
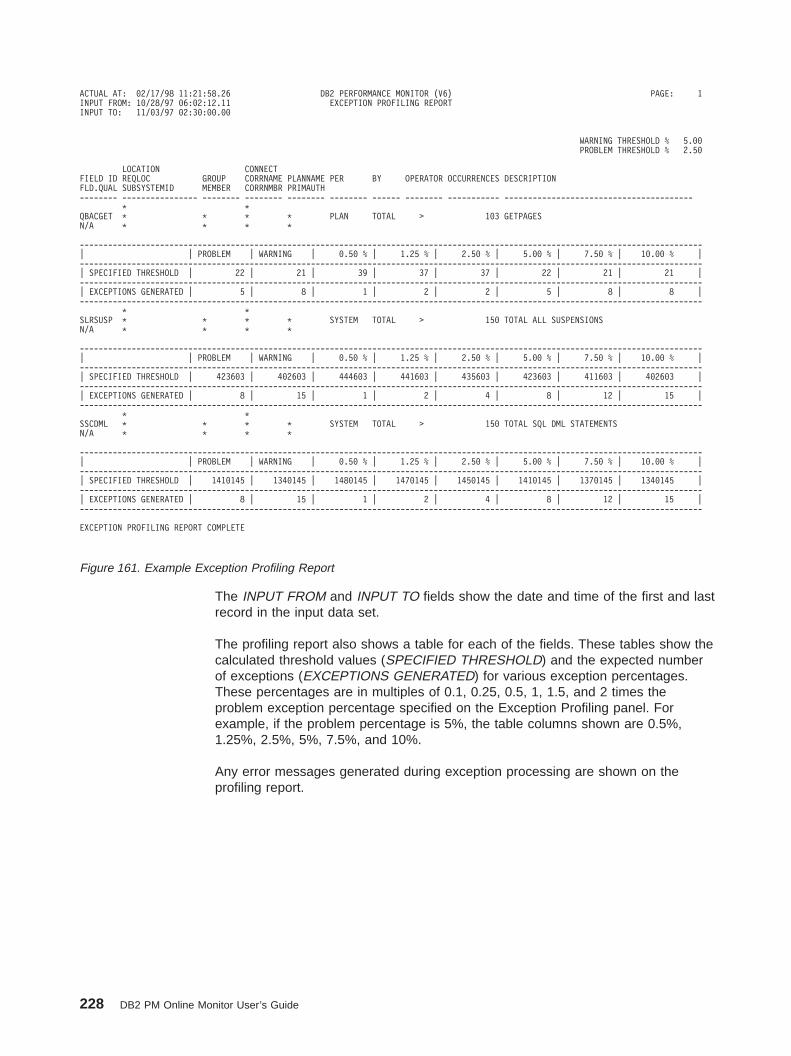
The INPUT FROM and INPUT TO fields show the date and time of the first and lastrecord in the input data set.
The profiling report also shows a table for each of the fields. These tables show thecalculated threshold values (SPECIFIED THRESHOLD) and the expected numberof exceptions (EXCEPTIONS GENERATED) for various exception percentages.These percentages are in multiples of 0.1, 0.25, 0.5, 1, 1.5, and 2 times theproblem exception percentage specified on the Exception Profiling panel. Forexample, if the problem percentage is 5%, the table columns shown are 0.5%,1.25%, 2.5%, 5%, 7.5%, and 10%.
Any error messages generated during exception processing are shown on theprofiling report.
ACTUAL AT: 02/17/98 11:21:58.26 DB2 PERFORMANCE MONITOR (V6) PAGE: 1INPUT FROM: 10/28/97 06:02:12.11 EXCEPTION PROFILING REPORTINPUT TO: 11/03/97 02:30:00.00
WARNING THRESHOLD % 5.00PROBLEM THRESHOLD % 2.50
LOCATION CONNECTFIELD ID REQLOC GROUP CORRNAME PLANNAME PER BY OPERATOR OCCURRENCES DESCRIPTIONFLD.QUAL SUBSYSTEMID MEMBER CORRNMBR PRIMAUTH-------- ---------------- -------- -------- -------- -------- ------ -------- ----------- ----------------------------------------
* *QBACGET * * * * PLAN TOTAL > 103 GETPAGESN/A * * * *
------------------------------------------------------------------------------------------------------------------------------------| | PROBLEM | WARNING | 0.50 % | 1.25 % | 2.50 % | 5.00 % | 7.50 % | 10.00 % |------------------------------------------------------------------------------------------------------------------------------------| SPECIFIED THRESHOLD | 22 | 21 | 39 | 37 | 37 | 22 | 21 | 21 |------------------------------------------------------------------------------------------------------------------------------------| EXCEPTIONS GENERATED | 5 | 8 | 1 | 2 | 2 | 5 | 8 | 8 |------------------------------------------------------------------------------------------------------------------------------------
* *SLRSUSP * * * * SYSTEM TOTAL > 150 TOTAL ALL SUSPENSIONSN/A * * * *
------------------------------------------------------------------------------------------------------------------------------------| | PROBLEM | WARNING | 0.50 % | 1.25 % | 2.50 % | 5.00 % | 7.50 % | 10.00 % |------------------------------------------------------------------------------------------------------------------------------------| SPECIFIED THRESHOLD | 423603 | 402603 | 444603 | 441603 | 435603 | 423603 | 411603 | 402603 |------------------------------------------------------------------------------------------------------------------------------------| EXCEPTIONS GENERATED | 8 | 15 | 1 | 2 | 4 | 8 | 12 | 15 |------------------------------------------------------------------------------------------------------------------------------------
* *SSCDML * * * * SYSTEM TOTAL > 150 TOTAL SQL DML STATEMENTSN/A * * * *
------------------------------------------------------------------------------------------------------------------------------------| | PROBLEM | WARNING | 0.50 % | 1.25 % | 2.50 % | 5.00 % | 7.50 % | 10.00 % |------------------------------------------------------------------------------------------------------------------------------------| SPECIFIED THRESHOLD | 1410145 | 1340145 | 1480145 | 1470145 | 1450145 | 1410145 | 1370145 | 1340145 |------------------------------------------------------------------------------------------------------------------------------------| EXCEPTIONS GENERATED | 8 | 15 | 1 | 2 | 4 | 8 | 12 | 15 |------------------------------------------------------------------------------------------------------------------------------------
EXCEPTION PROFILING REPORT COMPLETE
Figure 161. Example Exception Profiling Report
228 DB2 PM Online Monitor User’s Guide
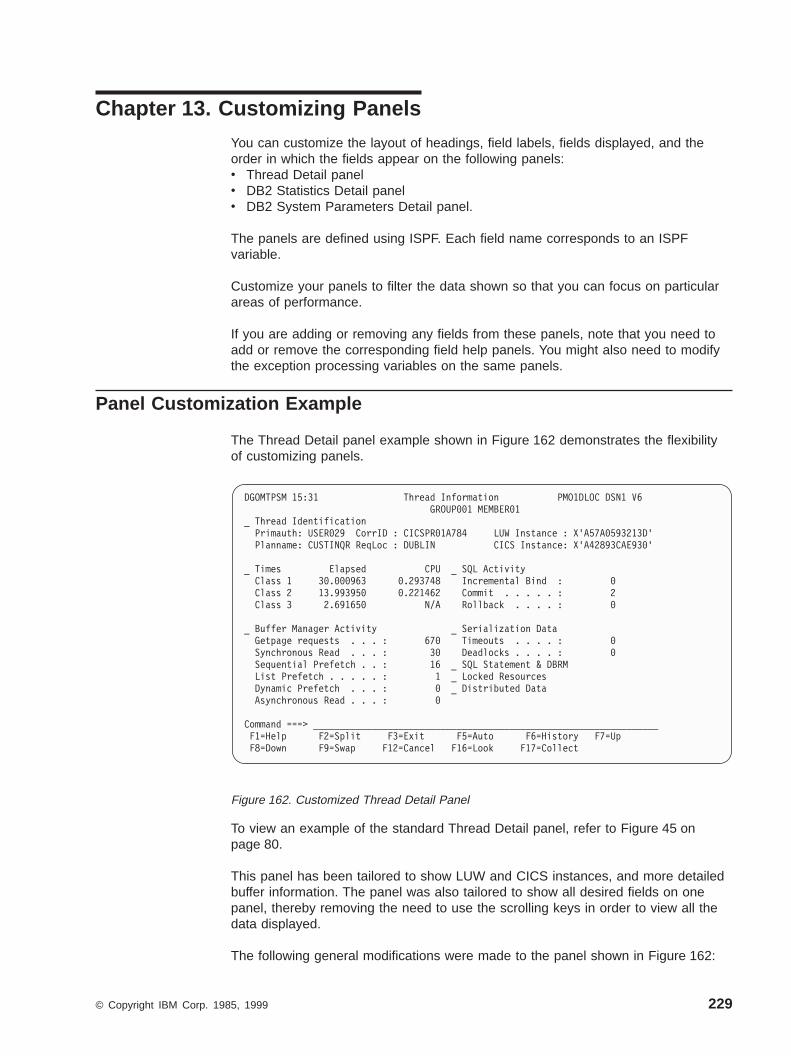
Chapter 13. Customizing Panels
You can customize the layout of headings, field labels, fields displayed, and theorder in which the fields appear on the following panels:v Thread Detail panelv DB2 Statistics Detail panelv DB2 System Parameters Detail panel.
The panels are defined using ISPF. Each field name corresponds to an ISPFvariable.
Customize your panels to filter the data shown so that you can focus on particularareas of performance.
If you are adding or removing any fields from these panels, note that you need toadd or remove the corresponding field help panels. You might also need to modifythe exception processing variables on the same panels.
Panel Customization Example
The Thread Detail panel example shown in Figure 162 demonstrates the flexibilityof customizing panels.
To view an example of the standard Thread Detail panel, refer to Figure 45 onpage 80.
This panel has been tailored to show LUW and CICS instances, and more detailedbuffer information. The panel was also tailored to show all desired fields on onepanel, thereby removing the need to use the scrolling keys in order to view all thedata displayed.
The following general modifications were made to the panel shown in Figure 162:
DGOMTPSM 15:31 Thread Information PMO1DLOC DSN1 V6GROUP001 MEMBER01
_ Thread IdentificationPrimauth: USER029 CorrID : CICSPR01A784 LUW Instance : X'A57A0593213D'Planname: CUSTINQR ReqLoc : DUBLIN CICS Instance: X'A42893CAE930'
_ Times Elapsed CPU _ SQL ActivityClass 1 30.000963 0.293748 Incremental Bind : 0Class 2 13.993950 0.221462 Commit . . . . . : 2Class 3 2.691650 N/A Rollback . . . . : 0
_ Buffer Manager Activity _ Serialization DataGetpage requests . . . : 670 Timeouts . . . . : 0Synchronous Read . . . : 30 Deadlocks . . . . : 0Sequential Prefetch . . : 16 _ SQL Statement & DBRMList Prefetch . . . . . : 1 _ Locked ResourcesDynamic Prefetch . . . : 0 _ Distributed DataAsynchronous Read . . . : 0
Command ===> _________________________________________________________________F1=Help F2=Split F3=Exit F5=Auto F6=History F7=UpF8=Down F9=Swap F12=Cancel F16=Look F17=Collect
Figure 162. Customized Thread Detail Panel
© Copyright IBM Corp. 1985, 1999 229

v Fields were added, removed, rearranged, and field labels were changed on thepanel.
v The heading of the panel was changed from Thread Detail to Thread Information.
You can also add or remove field help panels and modify the exception processingISPF variables to match the changes made to the fields.
Note: The DGOMTPSM, DGOMSPSM, and DGOMZPSM panels displayed at yoursite may have been tailored by your installation and consequently may notnecessarily match the panel examples shown in this book.
How to Customize Panels
Before you begin to modify any of the Online Monitor detail panels, you should befamiliar with the way ISPF panels are defined. Consult your system programmerbefore making any change to your ISPF or TSO environment.
You can customize the layout of the following Online Monitor detail panels bychanging the headings, field labels, fields displayed, and the order in which thefields appear on the panels.v Thread Detail panelv DB2 Statistics Detail panelv DB2 System Parameters Detail.
The Online Monitor panels are defined using ISPF. The procedure for customizingan Online Monitor panel involves copying the ISPF panel member to your ownlibrary, and editing your copy of the panel to match your requirements.
Each field name corresponds to an ISPF variable. If you are adding or removingfields, you also need to add or remove the corresponding help panels for theappropriate fields. For a list of all the Online Monitor fields available and theircorresponding help panel names, refer to “Appendix A. Online Monitor Field Table”on page 241.
Tailoring the Thread Detail Panel
You can modify the Thread Detail panel to include the first 200 characters of thecurrently executing SQL statement. This field is divided into 4 fields of 50 characterseach. The names of these fields are:QW01242T The first 50 characters of the SQL statement textQW012422 The second 50-character block of the SQL statement textQW012423 The third 50-character block of the SQL statement textQW012424 The fourth 50-character block of the SQL statement text.
The EXPLAIN command can also be made available on the Thread Detail panel sothat you can examine the access path methods of the SQL statement text that isshown. To make the command available:
v Add the following line to the INIT section of the panel:&SQLONDET='X'
v Change the following statement:)PANEL KEYLIST(MTTABLE,DGOF)
to:
Customizing Panels
230 DB2 PM Online Monitor User’s Guide
)PANEL KEYLIST(MTSQLKEY,DGOF)
The latter change assigns the EXPLAIN command to F18 (Explain).
Editing Exception Fields
Each Online Monitor exception field has a corresponding ISPF variable whichindicates the exception status of that field. The ISPF variable has the same nameas the DB2 PM field it represents, with the first letter of the field name replaced byan “X” for thread activity fields, and an “E” or a “T” for statistics fields. For example,the thread activity field ADRECETT (Class 1 elapsed time) has a correspondingexception ISPF variable with the name XDRECETT, and the statistics fieldQ3STABRT (Rollback) has a corresponding exception ISPF variable with the nameE3STABRT.
The exception ISPF variables are one character in length and can contain one ofthe following values:P Problem level exceptionW Warning level exceptionblank The corresponding field is not in exception status.
If you want your exception fields to be highlighted when they are in exception, youneed to test for an exception condition and highlight the field appropriately. Forexample, to test and highlight the Q3STABRT field on the Thread Detail panel, youwould add the following lines to the panel logic:
if (&x3stabrt = 'P').attr(q3stabrt) = 'color(red) hilite(reverse)'
if (&x3stabrt = 'W').attr(q3stabrt) = 'color(yellow) hilite(reverse)'
If you are removing an exception field, you should also remove the correspondingcode that tests and highlights the field.
Editing Selection Fields
The selection fields on the detail panels provide access to other Online Monitorpanels. These fields are selected by typing any nonblank character in the desiredselection field and pressing Enter .
You can remove or disable any of the selection fields on the Thread Detail panel,DB2 Statistics Detail panel, or DB2 System Parameters Detail panel.
Following is a list of all the selection field names and their correspondingsubheadings on the Thread Detail panel:C01 Thread IdentificationC02 Current Package/DBRMC03 TimesC04 Locking ActivityC05 Locked ResourcesC06 RID List ProcessingC07 SQL Activity, Commits and RollbacksC08 Buffer Manager ActivityC09 SQL Statement and Package/DBRMC10 Distributed DataC11 IFI (Class 5) and Data CaptureC12 Query Parallelism Data
Customizing Panels
Chapter 13. Customizing Panels 231
C13 Data Sharing Locking ActivityC14 Group Buffer Pools ActivityC15 Stored Procedures.
Following is a list of all the selection field names and their correspondingsubheadings on the DB2 Statistics Detail panel:C01T01 EDM PoolC01T02 Buffer ManagerC01T03 Locking ActivityC01T04 Open/Close ManagementC01T05 Bind ProcessingC01T06 Plan/Package Allocation, Authorization ManagementC01T07 Log ManagerC01T08 Subsystem ServicesC01T09 SQL ActivityC01T10 Query Parallelism DataC01T11 RID List ProcessingC01T12 Distributed DataC01T13 CPU Times and Other DataC01T14 Data Sharing Locking ActivityC01T15 Group Buffer Pool ActivityC01T16 Global Group Buffer Pool StatisticsC01T17 Stored Procedures.
Following is a list of all the selection field names and their correspondingsubheadings on the DB2 System Parameters Detail panel:C01T1 Virtual and Hiperpool Buffer SizesC01T2 Storages Sizes and ConnectionsC01T3 Operator and DDF FunctionsC01T4 Tracing, Data Installation and Pseudo-CloseC01T5 Locking (IRLM)C01T6 Active LogC01T7 Archive LogC01T8 Protection and Data DefinitionC01T9 Stored ProceduresC01T10 Group Buffer PoolsC01TA Data Sharing ParametersC01TB Application Programming DefaultsC01T11 Other Parameters.
For more information on defining ISPF panels, refer to OS/390 ISPF DialogDeveloper’s Guide and Reference and the related ISPF documentation.
Customizing Panels
232 DB2 PM Online Monitor User’s Guide

Chapter 14. Data Collector Purpose and Function
The data collector executes as a started task address space. The purpose of thedata collector is to support functions that are not suited to a TSO address space. Inaddition, the data collector is the host component of the Workstation Online Monitorand its interface to DB2.
The following functions are available if a data collector is installed and active atyour site:v Viewing past datav Periodic exception processing while you are not logged onv Exception event processingv Collection of parallel tasks for query CP parallelismv Data agent for Workstation Online Monitor.
There is one data collector for each DB2 subsystem.
Note: If a data collector is installed, it must match the version and release of theOnline Monitor.
Viewing Past Data
Before you can view past data, the data collector needs to be active so thatinstrumentation data can be gathered.
This data is gathered by the data collector at installation-defined intervals. You canspecify the types of data (IFCIDs) gathered and the interval at which the data iscollected using the data collector parameters. The data gathered is written to aVSAM history data set or data space where it can be later retrieved and browsedusing the HISTORY command.
You can qualify the thread activity data gathered by the data collector to reduceunnecessary system overhead and to limit the quantity of data stored using the datacollector parameters.
For information about specifying data collector parameters, refer to the DB2 PMInstallation and Customization manual. These parameters can be modified online bythe administrator user using the administrator dialog panels. See also “Chapter 15.Administrator User” on page 235.
Periodic Exceptions
With the data collector active, you can log off the system while periodic exceptionprocessing is running. Any periodic exception messages issued while you are offlineare gathered by the data collector and written to the periodic exceptions list, wherethey can be examined using the LOOK command. You are notified of any periodicexceptions when you next log on to your TSO system.
© Copyright IBM Corp. 1985, 1999 233

Exception Events
With exception event processing, you can monitor the DB2 subsystem for thepresence of specific events. When a specified event occurs and is detected, youare notified by the Exception Notification window.
You can log off the system while exception event processing is running. Anyexception event messages issued while you are offline are gathered by the datacollector and written to the exception event list, where they can be examined usingthe LOOK command. You are notified of any exception events when you next logon to your TSO system.
You can specify the exception event traces to start during data collector startupusing the data collector parameters. Refer to DB2 PM Installation andCustomization for more information. This parameter can be modified online by theadministrator user using the administrator dialog panels. Refer to “Chapter 15.Administrator User” on page 235 for details.
Collection of Parallelism Data
The data that the Online Monitor shows for threads exploiting utility parallelism orquery CP parallelism comes from three different sources:1. The originating task2. All currently active parallel tasks3. All parallel tasks that have finished processing.
While the first two types of data are readily available from DB2, the third type has tobe stored and administered separately. This is accomplished by the data collector ifit has been set up to do so. See parameter COLLECTCPUPARALLEL or CCP inthe DB2 PM Installation and Customization manual.
If your DB2 system exploits query CP parallelism, you have to set CCP to YES toenable the data collector to collect the parallel tasks that have finished processing.Otherwise, the performance data shown by the Online Monitor for a thread mightnot be correct, because it does not include all parallel tasks of that thread.
Data Agent for Workstation Online Monitor
The DB2 PM Workstation Online Monitor attaches to the data collector running onthe host system. All communication between the workstation and the host goesthrough the data collector. While the data collector is optional for the host-basedOnline Monitor, it becomes mandatory for the Workstation Online Monitor. If thedata collector is started for the Workstation Online Monitor only, it need not bedefined as an MVS subsystem. For further information refer to the DB2 PMInstallation and Customization manual.
Data Collector
234 DB2 PM Online Monitor User’s Guide
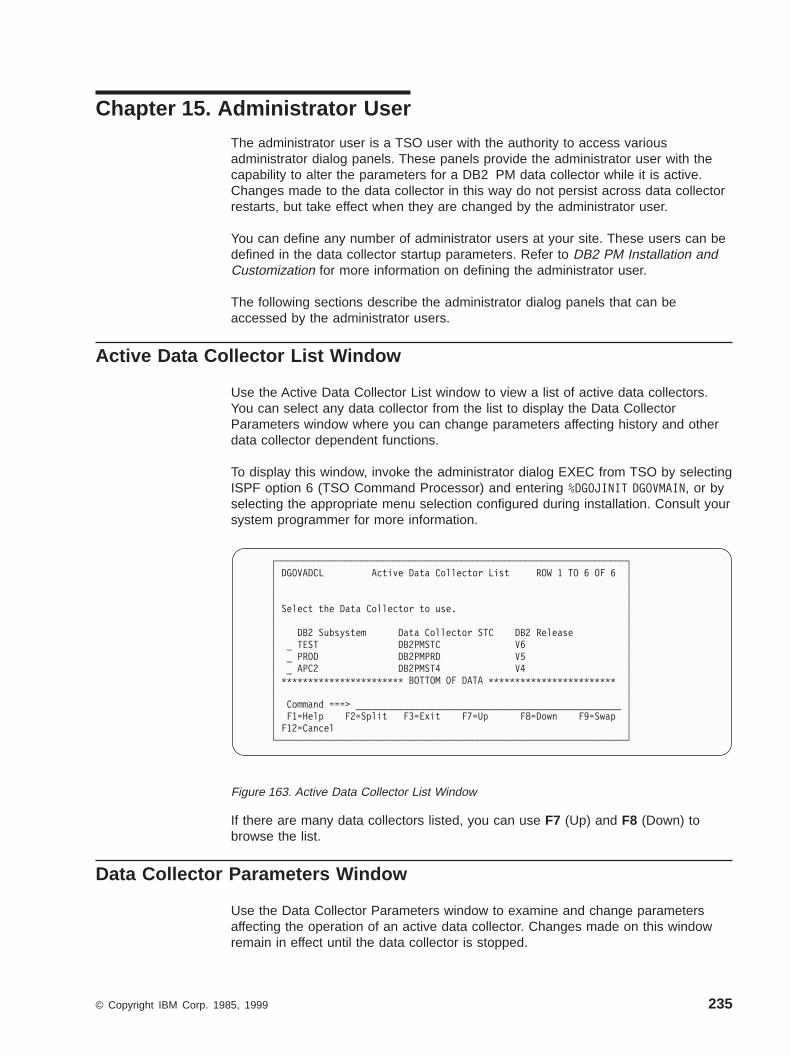
Chapter 15. Administrator User
The administrator user is a TSO user with the authority to access variousadministrator dialog panels. These panels provide the administrator user with thecapability to alter the parameters for a DB2 PM data collector while it is active.Changes made to the data collector in this way do not persist across data collectorrestarts, but take effect when they are changed by the administrator user.
You can define any number of administrator users at your site. These users can bedefined in the data collector startup parameters. Refer to DB2 PM Installation andCustomization for more information on defining the administrator user.
The following sections describe the administrator dialog panels that can beaccessed by the administrator users.
Active Data Collector List Window
Use the Active Data Collector List window to view a list of active data collectors.You can select any data collector from the list to display the Data CollectorParameters window where you can change parameters affecting history and otherdata collector dependent functions.
To display this window, invoke the administrator dialog EXEC from TSO by selectingISPF option 6 (TSO Command Processor) and entering %DGOJINIT DGOVMAIN, or byselecting the appropriate menu selection configured during installation. Consult yoursystem programmer for more information.
If there are many data collectors listed, you can use F7 (Up) and F8 (Down) tobrowse the list.
Data Collector Parameters Window
Use the Data Collector Parameters window to examine and change parametersaffecting the operation of an active data collector. Changes made on this windowremain in effect until the data collector is stopped.
┌──────────────────────────────────────────────────────────────────┐│ DGOVADCL Active Data Collector List ROW 1 TO 6 OF 6 ││ ││ ││ Select the Data Collector to use. ││ ││ DB2 Subsystem Data Collector STC DB2 Release ││ _ TEST DB2PMSTC V6 ││ _ PROD DB2PMPRD V5 ││ _ APC2 DB2PMST4 V4 ││ *********************** BOTTOM OF DATA ************************ ││ ││ Command ===> __________________________________________________ ││ F1=Help F2=Split F3=Exit F7=Up F8=Down F9=Swap ││ F12=Cancel │└──────────────────────────────────────────────────────────────────┘
Figure 163. Active Data Collector List Window
© Copyright IBM Corp. 1985, 1999 235

To display this window, select any data collector listed on the Active Data CollectorList window.
To edit history qualification parameters, type any character in the selection field nextto Qualifications and press Enter . The History Qualification window is thendisplayed, where you can qualify the thread data gathered for history. Refer to“History Qualification Window” on page 237 for more information.
To activate history, enter 1 in the History Active field. When history is active,instrumentation data is collected by the data collector at the interval specified in theCollection Interval field, and written to a VSAM history data set or a data space.
Use the Maximum Size of History Dataset field to specify the maximum size inkilobytes that the history data set can grow to. The maximum value for thisparameter must be less than or equal to the maximum possible size of the data set.If this field is set to 0, then no history data is stored in this data set.
Use the Dataspace size field to specify the size in kilobytes of the data space towhich history data is collected. If this field is set to 0, then no history data is storedin the data space.
┌────────────────────────────────────────────────────────────────────────────┐│ DGOVDCPA Data Collector Parameters ││ More: - + ││ Change values as required and press Exit to save ││ ││ DB2 Subsystem ID . . . . . . . . . . . : TEST ││ Data Collector STC . . . . . . . . . . : DB2PMSTC ││ DB2 Release . . . . . . . . . . . . . . : V6 ││ Plan Name . . . . . . . . . . . . . . . . ________ ││ ││ History ││ Select to change ││ _ Qualifications ││ ││ Active . . . . . . . . . . . . . . . . . . . . . . . _ 1=Yes,2=No ││ Collection Interval . . . . . . . . . . . . . . . . ____ Seconds ││ Maximum Size of History Dataset . . . . . . . . . . _____ Kilobytes ││ Dataspace size . . . . . . . . . . . . . . . . . . . _____ Kilobytes ││ ││ Select IFCIDs to be collected ││ _ Statistics ││ _ System Parameters ││ _ Thread Summary (147) ││ _ Thread Detail (148) ││ _ Locked Resources (150) ││ _ Thread SQL statement (124) ││ ││ Select Exception Event Traces to be started ││ _ EDM Pool ││ _ DDF ││ _ Timeout ││ _ Deadlock ││ _ Authorization failure ││ _ CF rebuild ││ _ Global trace ││ ││ Command ===> ___________________________________________________________ ││ F1=Help F2=Split F3=Exit F7=Up F8=Down F9=Swap ││ F12=Cancel │└────────────────────────────────────────────────────────────────────────────┘
Figure 164. Data Collector Parameters Window
Administrator User
236 DB2 PM Online Monitor User’s Guide
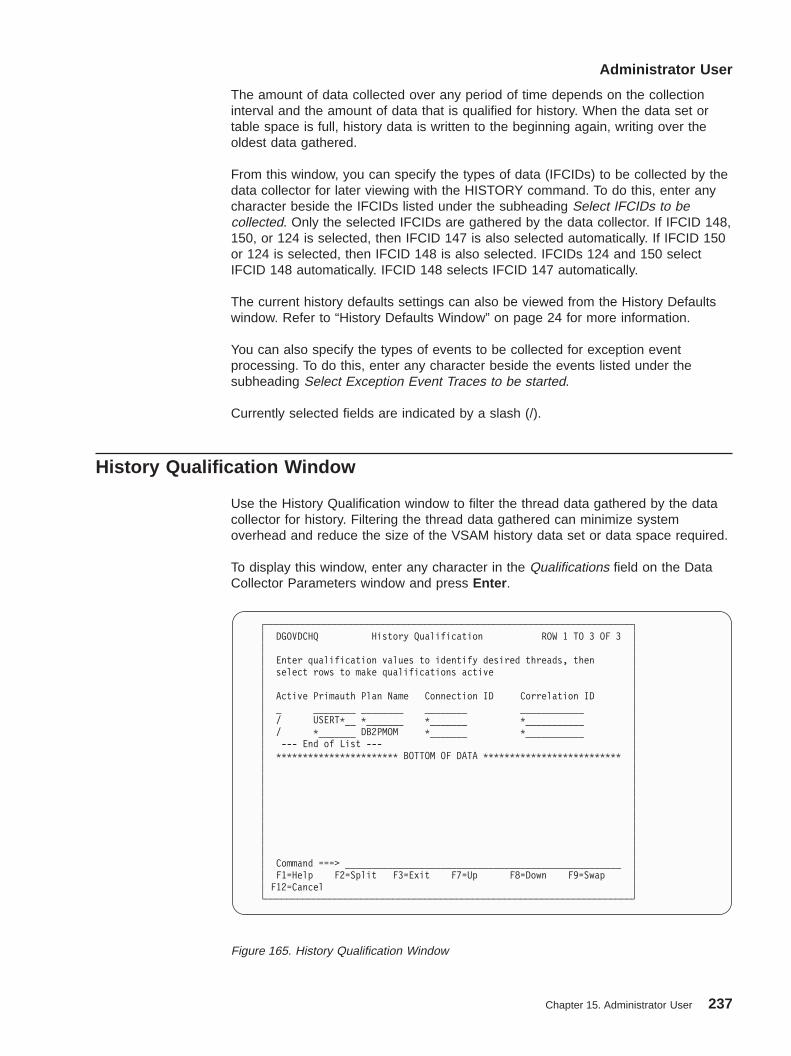
The amount of data collected over any period of time depends on the collectioninterval and the amount of data that is qualified for history. When the data set ortable space is full, history data is written to the beginning again, writing over theoldest data gathered.
From this window, you can specify the types of data (IFCIDs) to be collected by thedata collector for later viewing with the HISTORY command. To do this, enter anycharacter beside the IFCIDs listed under the subheading Select IFCIDs to becollected. Only the selected IFCIDs are gathered by the data collector. If IFCID 148,150, or 124 is selected, then IFCID 147 is also selected automatically. If IFCID 150or 124 is selected, then IFCID 148 is also selected. IFCIDs 124 and 150 selectIFCID 148 automatically. IFCID 148 selects IFCID 147 automatically.
The current history defaults settings can also be viewed from the History Defaultswindow. Refer to “History Defaults Window” on page 24 for more information.
You can also specify the types of events to be collected for exception eventprocessing. To do this, enter any character beside the events listed under thesubheading Select Exception Event Traces to be started.
Currently selected fields are indicated by a slash (/).
History Qualification Window
Use the History Qualification window to filter the thread data gathered by the datacollector for history. Filtering the thread data gathered can minimize systemoverhead and reduce the size of the VSAM history data set or data space required.
To display this window, enter any character in the Qualifications field on the DataCollector Parameters window and press Enter .
┌─────────────────────────────────────────────────────────────────────┐│ DGOVDCHQ History Qualification ROW 1 TO 3 OF 3 ││ ││ Enter qualification values to identify desired threads, then ││ select rows to make qualifications active ││ ││ Active Primauth Plan Name Connection ID Correlation ID ││ _ ________ ________ ________ ____________ ││ / USERT*__ *_______ *_______ *___________ ││ / *_______ DB2PMOM *_______ *___________ ││ --- End of List --- ││ *********************** BOTTOM OF DATA ************************** ││ ││ ││ ││ ││ ││ ││ ││ ││ Command ===> ____________________________________________________ ││ F1=Help F2=Split F3=Exit F7=Up F8=Down F9=Swap ││ F12=Cancel │└─────────────────────────────────────────────────────────────────────┘
Figure 165. History Qualification Window
Administrator User
Chapter 15. Administrator User 237
To qualify the history data collected, enter the required parameters on the HistoryQualification window and place any character in the Active column to activate thedesired qualification entry. To deactivate any entry, type a blank in the Activecolumn.
Wildcards can be used for the identifier values. Place an asterisk (*) in the field toindicate that any value in that character position is valid. The following rules apply:
v An asterisk in the first character position, followed by blanks, processes allvalues in that field.
v An asterisk at the end of a character string processes all values beginning withthat character string.
v An asterisk in the middle of a character string processes any value in that singlecharacter position.
Fields that are not specified default to an asterisk (*).
You may consider collecting only history data for particularly sensitive applications,otherwise the volume of data can be very large.
History qualification parameter settings and the period during which these settingswere active can be viewed from the History Thread Qualification window. Refer to“History Thread Qualification Window” on page 25 for more information.
Administrator User
238 DB2 PM Online Monitor User’s Guide

Part 5. Appendixes
© Copyright IBM Corp. 1985, 1999 239

240 DB2 PM Online Monitor User’s Guide

Appendix A. Online Monitor Field Table
Diagnosis, Modification, or Tuning Information
The tables in this appendix provide a list of the Online Monitor thread activity fields,statistics fields, and system parameters fields. You can use these tables tocross-reference exception field names for periodic and display exceptionprocessing, or to look up a field help panel name when customizing Online Monitorpanels.
Note: The exception fields used in the Online Monitor differ from the exceptionfields used by Batch. Refer to the DB2 PM Report Reference for a list ofvalid Batch exception fields.
The following is a description of the table columns:
Field NameThe name of the field.
Field DescriptionThe field title as the field appears on the panel. Note that the field titles varyslightly from panel to panel depending on the context in which the fields areused.
Help Panel NameThe member name of the associated help panel.
ExceptionIndicates if the field is an Online Monitor exception field.
DB2 6.1, DB2 5.1, DB2 4.1These columns indicate the DB2 release to which the field is applicable.
Table 5. Accounting - Buffer Pool Activity
Field Name Field Description Help PanelName
Excep-tion
DB26.1
DB25.1
DB24.1
ABCLSPR Prefetch Reads DGO0231 * * * *
ABCRWIO Synchronous I/O DGO0232 * * *
ADRGPRIO Getpage/Synchronous Reads DGO0233 * * * *
QBACDPF Dynamic Prefetch Requests DGO0222 * * *
QBACGET Getpage Requests DGO0217 * * * *
QBACHPG Pages Moved From Hiperpool DGO0230 * * *
QBACHRE Successful Hiperpool Reads DGO0223 * * *
QBACHRF Unsuccessful Hiperpool Reads DGO0224 * * * *
QBACHWF Unsuccessful Hiperpool Writes DGO0228 * * * *
QBACHWR Successful Hiperpool Writes DGO0227 * * *
QBACIMW Synchronous Writes DGO0226 * * * *
QBACLPF List Prefetch Requests DGO0221 * * *
QBACPID Buffer Pool ID DGO0215 * * *
QBACRIO Synchronous Read I/O DGO0219 * * * *
QBACSEQ Sequential Prefetch Requests DGO0220 * * *
QBACSIO Asynchronous Pages Read DGO0229 * * *
© Copyright IBM Corp. 1985, 1999 241
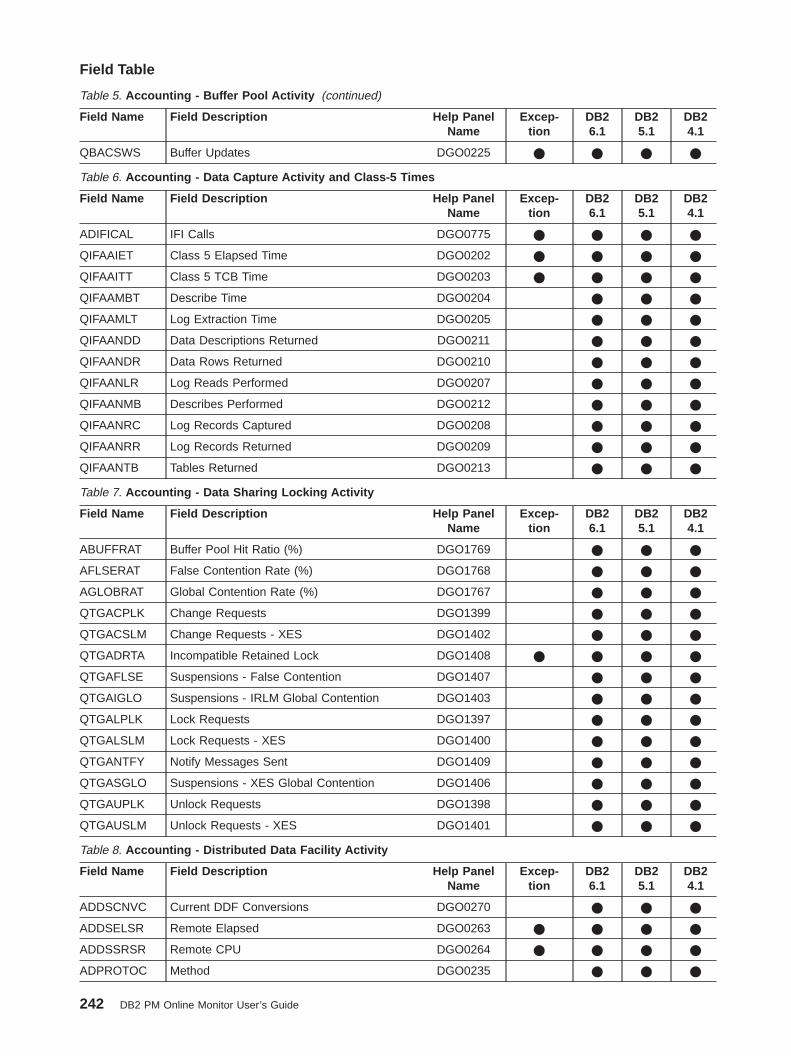
Table 5. Accounting - Buffer Pool Activity (continued)
Field Name Field Description Help PanelName
Excep-tion
DB26.1
DB25.1
DB24.1
QBACSWS Buffer Updates DGO0225 * * * *
Table 6. Accounting - Data Capture Activity and Class-5 Times
Field Name Field Description Help PanelName
Excep-tion
DB26.1
DB25.1
DB24.1
ADIFICAL IFI Calls DGO0775 * * * *
QIFAAIET Class 5 Elapsed Time DGO0202 * * * *
QIFAAITT Class 5 TCB Time DGO0203 * * * *
QIFAAMBT Describe Time DGO0204 * * *
QIFAAMLT Log Extraction Time DGO0205 * * *
QIFAANDD Data Descriptions Returned DGO0211 * * *
QIFAANDR Data Rows Returned DGO0210 * * *
QIFAANLR Log Reads Performed DGO0207 * * *
QIFAANMB Describes Performed DGO0212 * * *
QIFAANRC Log Records Captured DGO0208 * * *
QIFAANRR Log Records Returned DGO0209 * * *
QIFAANTB Tables Returned DGO0213 * * *
Table 7. Accounting - Data Sharing Locking Activity
Field Name Field Description Help PanelName
Excep-tion
DB26.1
DB25.1
DB24.1
ABUFFRAT Buffer Pool Hit Ratio (%) DGO1769 * * *
AFLSERAT False Contention Rate (%) DGO1768 * * *
AGLOBRAT Global Contention Rate (%) DGO1767 * * *
QTGACPLK Change Requests DGO1399 * * *
QTGACSLM Change Requests - XES DGO1402 * * *
QTGADRTA Incompatible Retained Lock DGO1408 * * * *
QTGAFLSE Suspensions - False Contention DGO1407 * * *
QTGAIGLO Suspensions - IRLM Global Contention DGO1403 * * *
QTGALPLK Lock Requests DGO1397 * * *
QTGALSLM Lock Requests - XES DGO1400 * * *
QTGANTFY Notify Messages Sent DGO1409 * * *
QTGASGLO Suspensions - XES Global Contention DGO1406 * * *
QTGAUPLK Unlock Requests DGO1398 * * *
QTGAUSLM Unlock Requests - XES DGO1401 * * *
Table 8. Accounting - Distributed Data Facility Activity
Field Name Field Description Help PanelName
Excep-tion
DB26.1
DB25.1
DB24.1
ADDSCNVC Current DDF Conversions DGO0270 * * *
ADDSELSR Remote Elapsed DGO0263 * * * *
ADDSSRSR Remote CPU DGO0264 * * * *
ADPROTOC Method DGO0235 * * *
Field Table
242 DB2 PM Online Monitor User’s Guide

Table 8. Accounting - Distributed Data Facility Activity (continued)
Field Name Field Description Help PanelName
Excep-tion
DB26.1
DB25.1
DB24.1
QLACLOCN Remote Location DGO0234 * * *
QW0148CT Type DGO0833 * * *
QW0148EL Requester Elapsed DGO1195 * * * *
QW0148MR Messages Received DGO0272 * * *
QW0148MS Messages Sent DGO0271 * * *
QW0148PT Product ID DGO0804 * * *
QW0148PV Product Version DGO1556 * * *
QW01488A Conversation Active Flag DGO0266 * * *
QW01488C Conversation ID DGO0269 * * *
QW01488L Remote Location DGO0836 * * *
QW01488N Network Connection Type DGO1722 * *
QW01488S Connection ID DGO0268 * * *
QW01488T Time of Last Message DGO0267 * * *
QW01488U State DGO0265 * * *
Table 9. Accounting - Group Buffer Pools Activity
Field Name Field Description Help PanelName
Excep-tion
DB26.1
DB25.1
DB24.1
ABGAMR Read (Not Found)-No Data Returned DGO1832 * * * *
ABGAXR Read (Cross Inval.)-No Data Returned DGO1833 * * * *
QBGADG Unregister Page DGO1721 * *
QBGAGN Group Buffer Pool ID DGO1579 * * *
QBGAMD Read (Not Found) - Data Returned DGO1413 * * * *
QBGAMN Read Prefetch DGO1415 * * *
QBGASW Changed Pages Written DGO1418 * * * *
QBGAWC Clean Pages Written DGO1417 * * * *
QBGAXD Read (Cross Invalidation) - Data Returned DGO1410 * * * *
Table 10. Accounting - Locking Activity
Field Name Field Description Help PanelName
Excep-tion
DB26.1
DB25.1
DB24.1
ALCLKET Lock Escalations DGO0190 * * * *
ALRSUSLL Number of Lock and Latch Suspensions DGO0179 * * * *
ALRSUSP Total Suspensions DGO0178 * * * *
QTXACHG Change Requests DGO0186 * * *
QTXACLNO Claim Requests DGO0192 * * *
QTXACLUN Unsuccessful Claim Requests DGO0193 * * * *
QTXADEA Deadlocks DGO0176 * * * *
QTXADRNO Drain Requests DGO0194 * * *
QTXADRUN Unsuccessful Drain Requests DGO0195 * * * *
QTXAIRLM Other IRLM Requests DGO0187 * * *
Field Table
Appendix A. Online Monitor Field Table 243
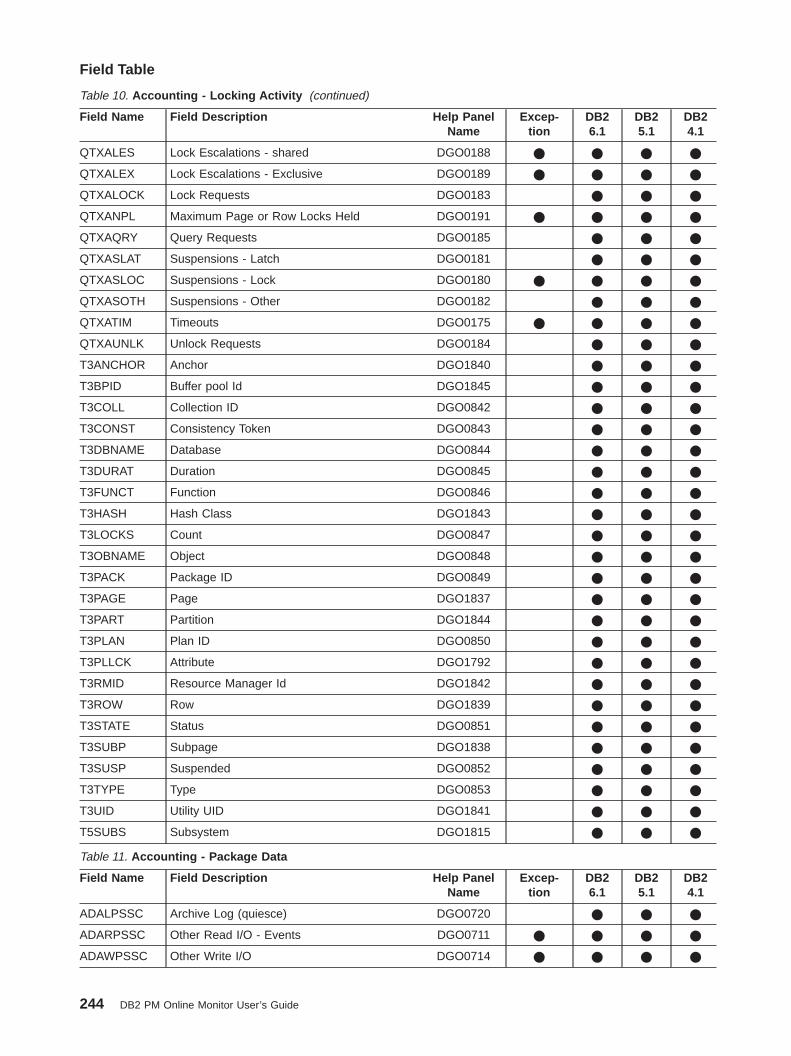
Table 10. Accounting - Locking Activity (continued)
Field Name Field Description Help PanelName
Excep-tion
DB26.1
DB25.1
DB24.1
QTXALES Lock Escalations - shared DGO0188 * * * *
QTXALEX Lock Escalations - Exclusive DGO0189 * * * *
QTXALOCK Lock Requests DGO0183 * * *
QTXANPL Maximum Page or Row Locks Held DGO0191 * * * *
QTXAQRY Query Requests DGO0185 * * *
QTXASLAT Suspensions - Latch DGO0181 * * *
QTXASLOC Suspensions - Lock DGO0180 * * * *
QTXASOTH Suspensions - Other DGO0182 * * *
QTXATIM Timeouts DGO0175 * * * *
QTXAUNLK Unlock Requests DGO0184 * * *
T3ANCHOR Anchor DGO1840 * * *
T3BPID Buffer pool Id DGO1845 * * *
T3COLL Collection ID DGO0842 * * *
T3CONST Consistency Token DGO0843 * * *
T3DBNAME Database DGO0844 * * *
T3DURAT Duration DGO0845 * * *
T3FUNCT Function DGO0846 * * *
T3HASH Hash Class DGO1843 * * *
T3LOCKS Count DGO0847 * * *
T3OBNAME Object DGO0848 * * *
T3PACK Package ID DGO0849 * * *
T3PAGE Page DGO1837 * * *
T3PART Partition DGO1844 * * *
T3PLAN Plan ID DGO0850 * * *
T3PLLCK Attribute DGO1792 * * *
T3RMID Resource Manager Id DGO1842 * * *
T3ROW Row DGO1839 * * *
T3STATE Status DGO0851 * * *
T3SUBP Subpage DGO1838 * * *
T3SUSP Suspended DGO0852 * * *
T3TYPE Type DGO0853 * * *
T3UID Utility UID DGO1841 * * *
T5SUBS Subsystem DGO1815 * * *
Table 11. Accounting - Package Data
Field Name Field Description Help PanelName
Excep-tion
DB26.1
DB25.1
DB24.1
ADALPSSC Archive Log (quiesce) DGO0720 * * *
ADARPSSC Other Read I/O - Events DGO0711 * * * *
ADAWPSSC Other Write I/O DGO0714 * * * *
Field Table
244 DB2 PM Online Monitor User’s Guide
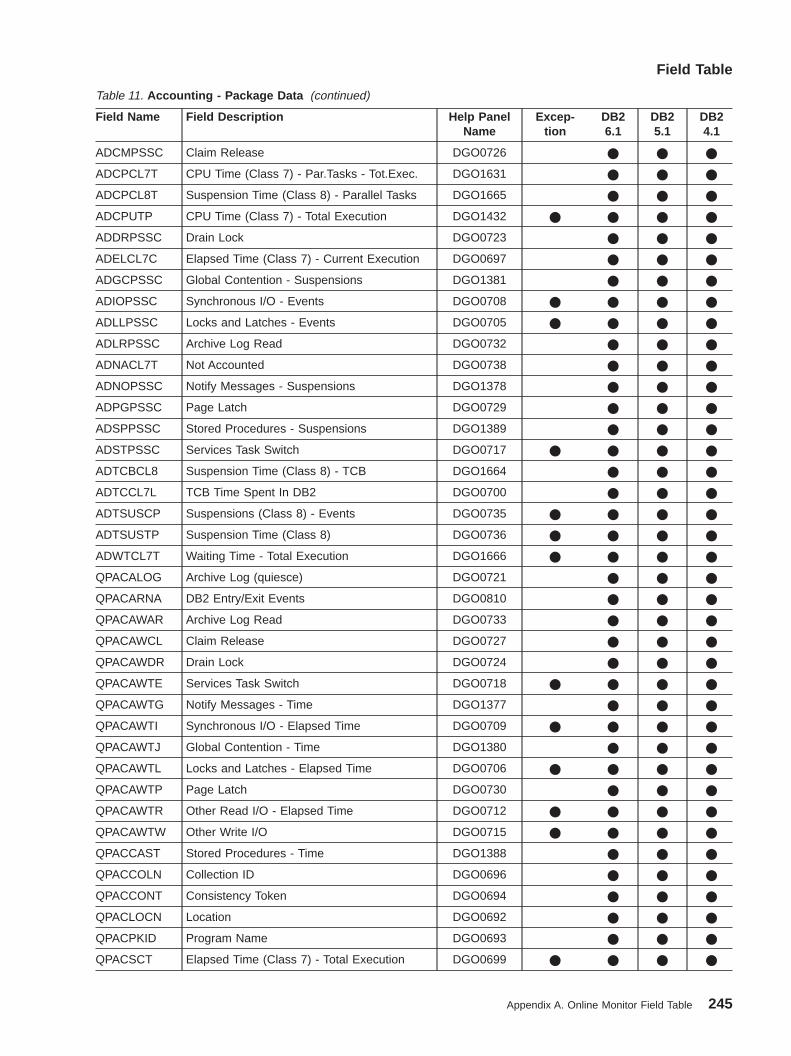
Table 11. Accounting - Package Data (continued)
Field Name Field Description Help PanelName
Excep-tion
DB26.1
DB25.1
DB24.1
ADCMPSSC Claim Release DGO0726 * * *
ADCPCL7T CPU Time (Class 7) - Par.Tasks - Tot.Exec. DGO1631 * * *
ADCPCL8T Suspension Time (Class 8) - Parallel Tasks DGO1665 * * *
ADCPUTP CPU Time (Class 7) - Total Execution DGO1432 * * * *
ADDRPSSC Drain Lock DGO0723 * * *
ADELCL7C Elapsed Time (Class 7) - Current Execution DGO0697 * * *
ADGCPSSC Global Contention - Suspensions DGO1381 * * *
ADIOPSSC Synchronous I/O - Events DGO0708 * * * *
ADLLPSSC Locks and Latches - Events DGO0705 * * * *
ADLRPSSC Archive Log Read DGO0732 * * *
ADNACL7T Not Accounted DGO0738 * * *
ADNOPSSC Notify Messages - Suspensions DGO1378 * * *
ADPGPSSC Page Latch DGO0729 * * *
ADSPPSSC Stored Procedures - Suspensions DGO1389 * * *
ADSTPSSC Services Task Switch DGO0717 * * * *
ADTCBCL8 Suspension Time (Class 8) - TCB DGO1664 * * *
ADTCCL7L TCB Time Spent In DB2 DGO0700 * * *
ADTSUSCP Suspensions (Class 8) - Events DGO0735 * * * *
ADTSUSTP Suspension Time (Class 8) DGO0736 * * * *
ADWTCL7T Waiting Time - Total Execution DGO1666 * * * *
QPACALOG Archive Log (quiesce) DGO0721 * * *
QPACARNA DB2 Entry/Exit Events DGO0810 * * *
QPACAWAR Archive Log Read DGO0733 * * *
QPACAWCL Claim Release DGO0727 * * *
QPACAWDR Drain Lock DGO0724 * * *
QPACAWTE Services Task Switch DGO0718 * * * *
QPACAWTG Notify Messages - Time DGO1377 * * *
QPACAWTI Synchronous I/O - Elapsed Time DGO0709 * * * *
QPACAWTJ Global Contention - Time DGO1380 * * *
QPACAWTL Locks and Latches - Elapsed Time DGO0706 * * * *
QPACAWTP Page Latch DGO0730 * * *
QPACAWTR Other Read I/O - Elapsed Time DGO0712 * * * *
QPACAWTW Other Write I/O DGO0715 * * * *
QPACCAST Stored Procedures - Time DGO1388 * * *
QPACCOLN Collection ID DGO0696 * * *
QPACCONT Consistency Token DGO0694 * * *
QPACLOCN Location DGO0692 * * *
QPACPKID Program Name DGO0693 * * *
QPACSCT Elapsed Time (Class 7) - Total Execution DGO0699 * * * *
Field Table
Appendix A. Online Monitor Field Table 245

Table 11. Accounting - Package Data (continued)
Field Name Field Description Help PanelName
Excep-tion
DB26.1
DB25.1
DB24.1
QPACSQLC SQL Statements Issued DGO0695 * * * *
QPACTJST CPU Time TCB - Class 7- Total Execution DGO0701 * * *
Table 12. Accounting - Query Parallelism
Field Name Field Description Help PanelName
Excep-tion
DB26.1
DB25.1
DB24.1
ADPARDIS Parallelism Disabled by RLF DGO1637 * * *
ADPARLEV Parallelism DGO1596 * * *
ADTOTPFL Fall Back To Sequential Mode DGO0684 * * * *
AXXCRAT Member Skipped (%) DGO1783 * *
QXCOORNO One DB2 COORDINATOR Parm = NO DGO1680 * *
QXDEGBUF Fall Back To Sequential Mode - No Buffer DGO0683 * * * *
QXDEGCUR Fall Back To Sequential Mode - Cursor DGO0774 * * * *
QXDEGENC Fall Back to Seq. - MVS/ESA EnclaveServices
DGO1429 * * * *
QXDEGESA Fall Back To Sequential Mode - No ESA DGO0682 * * * *
QXISORR One DB2 Isolation Level DGO1681 * *
QXMAXDEG Maximum Degree of Parallelism DGO0171 * * * *
QXNORGRP Planned Parallel Degree DGO0174 * * *
QXREDGRP Reduced Parallel Degree DGO0173 * * * *
QXTOTGRP Parallel Groups Executed DGO0773 * * *
Table 13. Accounting - RID List Processing
Field Name Field Description Help PanelName
Excep-tion
DB26.1
DB25.1
DB24.1
ARTTERM Unsuccessful - Any Reason DGO0170 * * * *
QXMIAP Successful DGO0167 * * *
QXMRMIAP Not Used - Limit Exceeded DGO0169 * * * *
QXNSMIAP Not Used - No Storage DGO0168 * * * *
Table 14. Accounting - SQL Activity (DML, DCL, DDl)
Field Name Field Description Help PanelName
Excep-tion
DB26.1
DB25.1
DB24.1
ADTDDL Total DDL DGO0166 * * * *
ASCDCL Total DCL DGO0137 * * * *
ASCDML Total DML DGO0122 * * * *
ASRIUDCA Changes/Commit DGO0127 * * * *
ASTOTALT Number of Alter Statements Executed DGO0165 * * *
ASTOTCRT Total DGO0163 * * *
ASTOTDRP Total DGO0164 * * *
QW0124SP Stored Procedure DGO1846 * * *
QW01482T SQL Statement DGO1863 * * *
QXALDAB Alter Database DGO0155 * * *
Field Table
246 DB2 PM Online Monitor User’s Guide
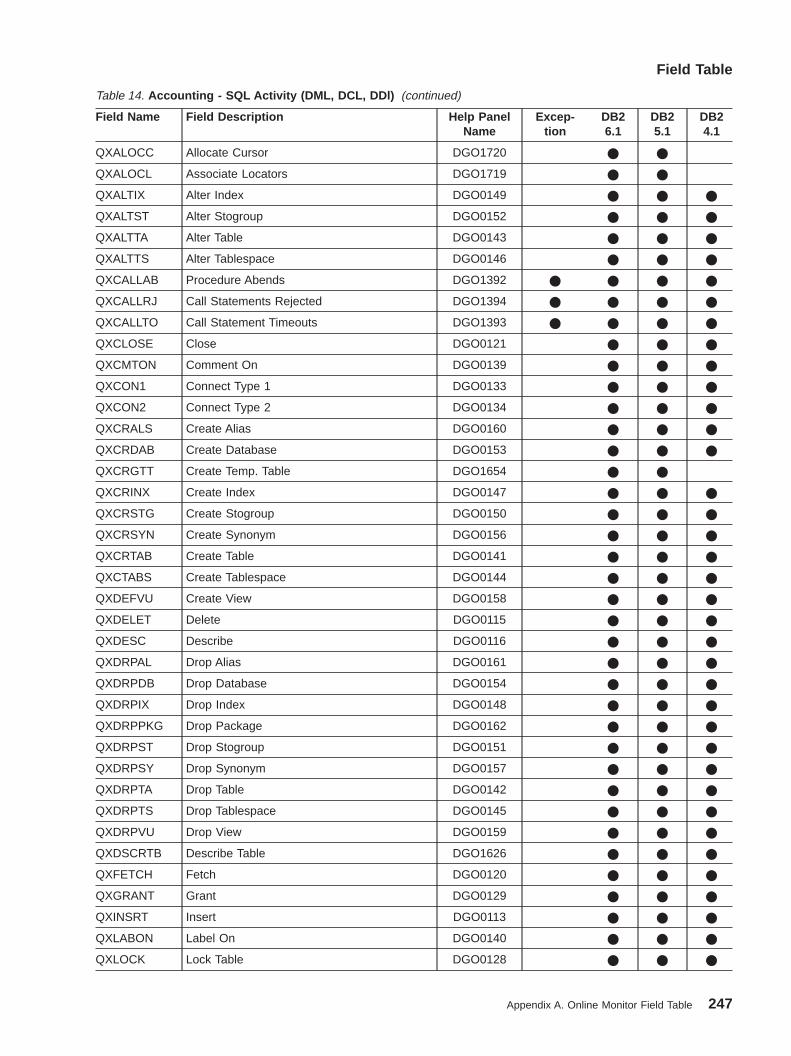
Table 14. Accounting - SQL Activity (DML, DCL, DDl) (continued)
Field Name Field Description Help PanelName
Excep-tion
DB26.1
DB25.1
DB24.1
QXALOCC Allocate Cursor DGO1720 * *
QXALOCL Associate Locators DGO1719 * *
QXALTIX Alter Index DGO0149 * * *
QXALTST Alter Stogroup DGO0152 * * *
QXALTTA Alter Table DGO0143 * * *
QXALTTS Alter Tablespace DGO0146 * * *
QXCALLAB Procedure Abends DGO1392 * * * *
QXCALLRJ Call Statements Rejected DGO1394 * * * *
QXCALLTO Call Statement Timeouts DGO1393 * * * *
QXCLOSE Close DGO0121 * * *
QXCMTON Comment On DGO0139 * * *
QXCON1 Connect Type 1 DGO0133 * * *
QXCON2 Connect Type 2 DGO0134 * * *
QXCRALS Create Alias DGO0160 * * *
QXCRDAB Create Database DGO0153 * * *
QXCRGTT Create Temp. Table DGO1654 * *
QXCRINX Create Index DGO0147 * * *
QXCRSTG Create Stogroup DGO0150 * * *
QXCRSYN Create Synonym DGO0156 * * *
QXCRTAB Create Table DGO0141 * * *
QXCTABS Create Tablespace DGO0144 * * *
QXDEFVU Create View DGO0158 * * *
QXDELET Delete DGO0115 * * *
QXDESC Describe DGO0116 * * *
QXDRPAL Drop Alias DGO0161 * * *
QXDRPDB Drop Database DGO0154 * * *
QXDRPIX Drop Index DGO0148 * * *
QXDRPPKG Drop Package DGO0162 * * *
QXDRPST Drop Stogroup DGO0151 * * *
QXDRPSY Drop Synonym DGO0157 * * *
QXDRPTA Drop Table DGO0142 * * *
QXDRPTS Drop Tablespace DGO0145 * * *
QXDRPVU Drop View DGO0159 * * *
QXDSCRTB Describe Table DGO1626 * * *
QXFETCH Fetch DGO0120 * * *
QXGRANT Grant DGO0129 * * *
QXINSRT Insert DGO0113 * * *
QXLABON Label On DGO0140 * * *
QXLOCK Lock Table DGO0128 * * *
Field Table
Appendix A. Online Monitor Field Table 247
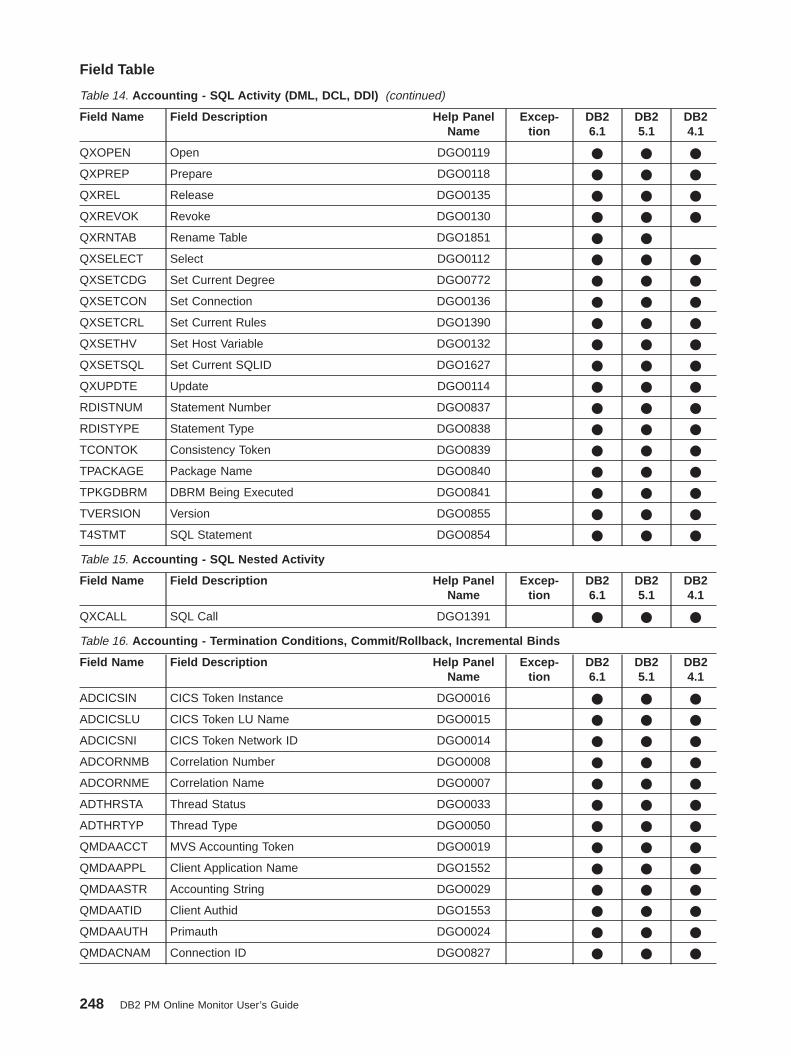
Table 14. Accounting - SQL Activity (DML, DCL, DDl) (continued)
Field Name Field Description Help PanelName
Excep-tion
DB26.1
DB25.1
DB24.1
QXOPEN Open DGO0119 * * *
QXPREP Prepare DGO0118 * * *
QXREL Release DGO0135 * * *
QXREVOK Revoke DGO0130 * * *
QXRNTAB Rename Table DGO1851 * *
QXSELECT Select DGO0112 * * *
QXSETCDG Set Current Degree DGO0772 * * *
QXSETCON Set Connection DGO0136 * * *
QXSETCRL Set Current Rules DGO1390 * * *
QXSETHV Set Host Variable DGO0132 * * *
QXSETSQL Set Current SQLID DGO1627 * * *
QXUPDTE Update DGO0114 * * *
RDISTNUM Statement Number DGO0837 * * *
RDISTYPE Statement Type DGO0838 * * *
TCONTOK Consistency Token DGO0839 * * *
TPACKAGE Package Name DGO0840 * * *
TPKGDBRM DBRM Being Executed DGO0841 * * *
TVERSION Version DGO0855 * * *
T4STMT SQL Statement DGO0854 * * *
Table 15. Accounting - SQL Nested Activity
Field Name Field Description Help PanelName
Excep-tion
DB26.1
DB25.1
DB24.1
QXCALL SQL Call DGO1391 * * *
Table 16. Accounting - Termination Conditions, Commit/Rollback, Incremental Binds
Field Name Field Description Help PanelName
Excep-tion
DB26.1
DB25.1
DB24.1
ADCICSIN CICS Token Instance DGO0016 * * *
ADCICSLU CICS Token LU Name DGO0015 * * *
ADCICSNI CICS Token Network ID DGO0014 * * *
ADCORNMB Correlation Number DGO0008 * * *
ADCORNME Correlation Name DGO0007 * * *
ADTHRSTA Thread Status DGO0033 * * *
ADTHRTYP Thread Type DGO0050 * * *
QMDAACCT MVS Accounting Token DGO0019 * * *
QMDAAPPL Client Application Name DGO1552 * * *
QMDAASTR Accounting String DGO0029 * * *
QMDAATID Client Authid DGO1553 * * *
QMDAAUTH Primauth DGO0024 * * *
QMDACNAM Connection ID DGO0827 * * *
Field Table
248 DB2 PM Online Monitor User’s Guide

Table 16. Accounting - Termination Conditions, Commit/Rollback, Incremental Binds (continued)
Field Name Field Description Help PanelName
Excep-tion
DB26.1
DB25.1
DB24.1
QMDACORR Correlation ID DGO0028 * * *
QMDACTYP Connection Type DGO0025 * * *
QMDALOCN Location DGO0021 * * *
QMDALUNM LU Name DGO0023 * * *
QMDANETN Network ID DGO0022 * * *
QMDAPLAN Plan Name DGO0828 * * *
QMDAPLAT Client Platform DGO1551 * * *
QMDAPTYP Product ID DGO0020 * * *
QMDAPVER Product Version DGO1555 * * *
QMDASUFX DDCS Accounting Suffix DGO1550 * * *
QWACABRT Rollback DGO0058 * * * *
QWACCOMM Commit DGO0057 * * * *
QWACNID Recovery Token DGO0829 * * *
QWHCAID Primauth DGO0006 * * *
QWHCATYL Connection Type DGO0830 * * *
QWHCATYP Conntype DGO0013 * * *
QWHCATYS Connection Type DGO0831 * * *
QWHCCN Connection ID DGO0010 * * *
QWHCCV Correlation ID DGO0009 * * *
QWHCOPID Origauth DGO0012 * * *
QWHCPLAN Planname DGO0011 * * *
QWHCTOKN RRSAF Accounting Token DGO1737 * *
QWHDPTYP Product ID DGO0018 * * *
QWHDPVER Product Version DGO1554 * * *
QWHDRQNM Requesting Location DGO0017 * * *
QWHSLOCN Reporting Location DGO0001 * * *
QWHSLUCC LUW Sequence Number DGO0800 * * *
QWHSLUNM LUW LU Name DGO0798 * * *
QWHSLUUV LUW Instance Number DGO0799 * * *
QWHSNID LUW Network ID DGO0797 * * *
QW0148RQ Request Count DGO0034 * * *
QXINCRB Incremental Bind DGO0059 * * * *
QXSTDEXP Cache Limit Exceeded DGO1806 * *
QXSTDINV Prepare Statement Purged DGO1807 * *
QXSTFND Prepare Statement Match DGO1802 * *
QXSTIPRP Implicit Prepare DGO1804 * *
QXSTNFND Prepare Statement No Match DGO1803 * *
QXSTNPRP Prepare from Cache DGO1805 * *
QXSTREOP Reoptimization DGO1801 * *
Field Table
Appendix A. Online Monitor Field Table 249
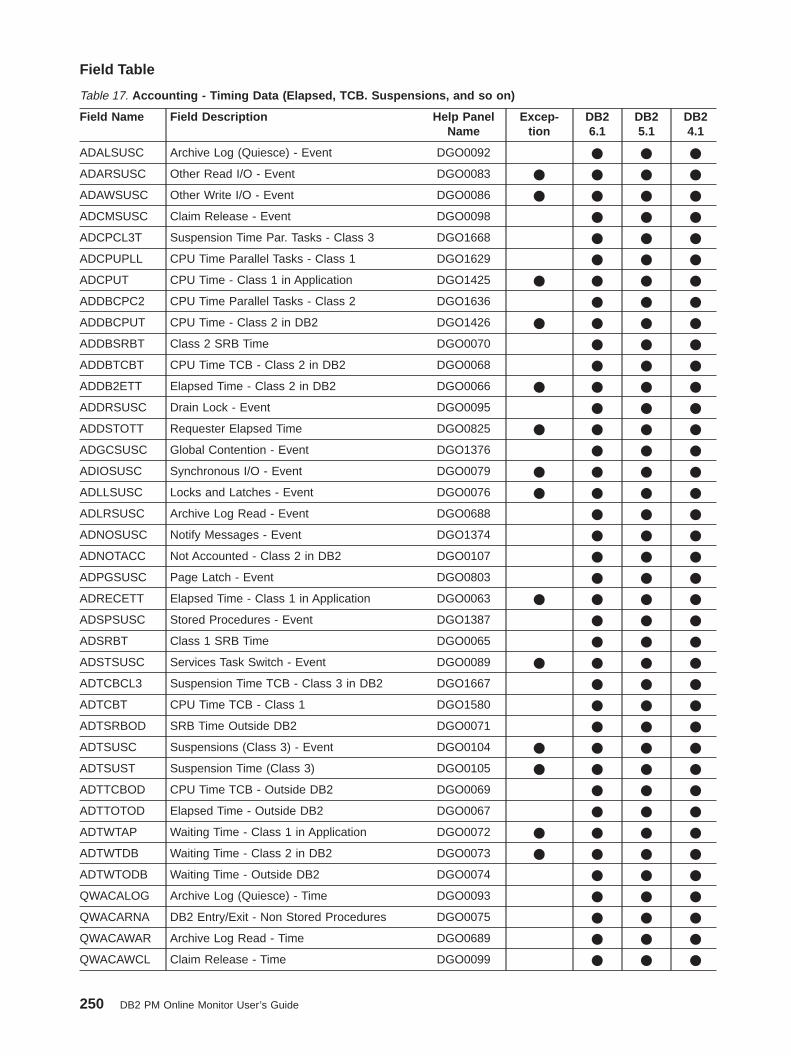
Table 17. Accounting - Timing Data (Elapsed, TCB. Suspensions, and so on)
Field Name Field Description Help PanelName
Excep-tion
DB26.1
DB25.1
DB24.1
ADALSUSC Archive Log (Quiesce) - Event DGO0092 * * *
ADARSUSC Other Read I/O - Event DGO0083 * * * *
ADAWSUSC Other Write I/O - Event DGO0086 * * * *
ADCMSUSC Claim Release - Event DGO0098 * * *
ADCPCL3T Suspension Time Par. Tasks - Class 3 DGO1668 * * *
ADCPUPLL CPU Time Parallel Tasks - Class 1 DGO1629 * * *
ADCPUT CPU Time - Class 1 in Application DGO1425 * * * *
ADDBCPC2 CPU Time Parallel Tasks - Class 2 DGO1636 * * *
ADDBCPUT CPU Time - Class 2 in DB2 DGO1426 * * * *
ADDBSRBT Class 2 SRB Time DGO0070 * * *
ADDBTCBT CPU Time TCB - Class 2 in DB2 DGO0068 * * *
ADDB2ETT Elapsed Time - Class 2 in DB2 DGO0066 * * * *
ADDRSUSC Drain Lock - Event DGO0095 * * *
ADDSTOTT Requester Elapsed Time DGO0825 * * * *
ADGCSUSC Global Contention - Event DGO1376 * * *
ADIOSUSC Synchronous I/O - Event DGO0079 * * * *
ADLLSUSC Locks and Latches - Event DGO0076 * * * *
ADLRSUSC Archive Log Read - Event DGO0688 * * *
ADNOSUSC Notify Messages - Event DGO1374 * * *
ADNOTACC Not Accounted - Class 2 in DB2 DGO0107 * * *
ADPGSUSC Page Latch - Event DGO0803 * * *
ADRECETT Elapsed Time - Class 1 in Application DGO0063 * * * *
ADSPSUSC Stored Procedures - Event DGO1387 * * *
ADSRBT Class 1 SRB Time DGO0065 * * *
ADSTSUSC Services Task Switch - Event DGO0089 * * * *
ADTCBCL3 Suspension Time TCB - Class 3 in DB2 DGO1667 * * *
ADTCBT CPU Time TCB - Class 1 DGO1580 * * *
ADTSRBOD SRB Time Outside DB2 DGO0071 * * *
ADTSUSC Suspensions (Class 3) - Event DGO0104 * * * *
ADTSUST Suspension Time (Class 3) DGO0105 * * * *
ADTTCBOD CPU Time TCB - Outside DB2 DGO0069 * * *
ADTTOTOD Elapsed Time - Outside DB2 DGO0067 * * *
ADTWTAP Waiting Time - Class 1 in Application DGO0072 * * * *
ADTWTDB Waiting Time - Class 2 in DB2 DGO0073 * * * *
ADTWTODB Waiting Time - Outside DB2 DGO0074 * * *
QWACALOG Archive Log (Quiesce) - Time DGO0093 * * *
QWACARNA DB2 Entry/Exit - Non Stored Procedures DGO0075 * * *
QWACAWAR Archive Log Read - Time DGO0689 * * *
QWACAWCL Claim Release - Time DGO0099 * * *
Field Table
250 DB2 PM Online Monitor User’s Guide

Table 17. Accounting - Timing Data (Elapsed, TCB. Suspensions, and so on) (continued)
Field Name Field Description Help PanelName
Excep-tion
DB26.1
DB25.1
DB24.1
QWACAWDR Drain Lock - Time DGO0096 * * *
QWACAWTE Services Task Switch - Time DGO0090 * * * *
QWACAWTG Notify Messages - Time DGO1373 * * *
QWACAWTI Synchronous I/O - Time DGO0081 * * * *
QWACAWTJ Global Contention - Time DGO1375 * * *
QWACAWTL Locks and Latches - Time DGO0077 * * * *
QWACAWTP Page Latch - Time DGO0102 * * *
QWACAWTR Other Read I/O - Time DGO0084 * * * *
QWACAWTW Other Write I/O - Time DGO0087 * * * *
QWACCAST Stored Procedures - Time DGO1386 * * *
QWACSPCP CPU Time TCB Stored Proc - Class 1 inApplic.
DGO1383 * * *
QWACSPNE DB2 Entry/Exit - Stored Procedures DGO1385 * * *
QWACSPTT CPU Time TCB Stored Proc - Class 2 in DB2 DGO1384 * * *
Table 18. Statistics - Authorization Management
Field Name Field Description Help PanelName
Excep-tion
DB26.1
DB25.1
DB24.1
QTAUCCH Authorization Succ. W/o Catalog Access DGO0460 * * *
QTAUCHK Authorization Attempts DGO0458 * * *
QTAUPUB Authorization Successful Public Plan DGO0461 * * *
QTAUSUC Authorization Successful DGO0459 * * *
QTPACAUT Package Authorization Management -Successful
DGO1774 * *
QTPACNOT P. A. M. Unsuccessful - Catalog Required DGO1776 * *
QTPACOW1 P. A. M. - Overwritten Authid in Cache DGO1777 * *
QTPACOW2 P. A. M. - Overwritten in Cache DGO1778 * *
QTPACPUB P. A. M. - Successful Public DGO1775 * *
Table 19. Statistics - Buffer Pool Activity
Field Name Field Description Help PanelName
Excep-tion
DB26.1
DB25.1
DB24.1
QBSTARA Hiperpool Reads Asynchr. With ADMF DGO0753 * * *
QBSTARF Hiperpool Reads Unsucc. With ADMF DGO0752 * * * *
QBSTAWA Hiperpool Pages Written Asynchr. with ADMF DGO0751 * * *
QBSTAWF Hiperpool Pages Written Unsucc. With ADMF DGO0750 * * * *
QBSTCBA Current Active Buffers DGO0331 * * * *
QBSTDIO Dynamic Prefetch Reads DGO0359 * * * *
QBSTDMC DM Critical Threshold Reached DGO0376 * * * *
QBSTDPF Dynamic Prefetch Requested DGO0358 * * * *
QBSTDPP Dynamic Prefetch Pages Read DGO0360 * * * *
QBSTDSO Successful Data Set Opens DGO0335 * * * *
Field Table
Appendix A. Online Monitor Field Table 251

Table 19. Statistics - Buffer Pool Activity (continued)
Field Name Field Description Help PanelName
Excep-tion
DB26.1
DB25.1
DB24.1
QBSTDWT Deferred Write Threshold Reached DGO0373 * * * *
QBSTDWV Thresholds Reached - Vertical Deferred Write DGO0374 * * * *
QBSTGET Getpage Request Total DGO0343 * * *
QBSTHBE Hiperpool Buffers Backed DGO0754 * * *
QBSTHPA Hiperpool Expansions or Contractions DGO0342 * * * *
QBSTHPL Buffers Allocated for Hiperpool DGO0340 * * * *
QBSTHRA Hiperpool Reads Asynchr. W/o ADMF DGO0366 * * *
QBSTHRE Hiperpool Read Sequential DGO0364 * * *
QBSTHRF Hiperpool Reads Unsucc. W/o ADMF DGO0365 * * * *
QBSTHWA Hiperpool Pages Written Asynchr. WithoutADMF
DGO0379 * * *
QBSTHWF Hiperpool Pages Written Unsucc. WithoutADMF
DGO0378 * * * *
QBSTHWR Hiperpool Pages Written Synchronously DGO0377 * * *
QBSTIMW Synchronous Writes DGO0370 * * * *
QBSTJIS Pref. I/O Streams - Reduced - BufferShortage
DGO0384 * * * *
QBSTLIO List Prefetch Reads DGO0355 * * * *
QBSTLPF List Prefetch Requested DGO0354 * * * *
QBSTLPP List Prefetch Pages Read DGO0356 * * * *
QBSTMAX Not Created - No Buffer DGO0394 * * * *
QBSTMIG DFHSM Migrated Data Sets DGO0336 * * * *
QBSTNGT Unsuccessful Page Requests DGO1862 * * *
QBSTPID Buffer Pool ID DGO0330 * * *
QBSTPIO Sequential Prefetch Reads DGO0351 * * * *
QBSTPL1 Prefetch Quantity Reduced To 1/2 DGO0387 * * * *
QBSTPL2 Prefetch Quantity Reduced To 1/4 DGO0388 * * * *
QBSTPQF Reduced Parallel Query Requests DGO0386 * * * *
QBSTPQO Parallel Query Requests DGO0385 * * *
QBSTPWS Pages Written DGO0368 * * * *
QBSTREE Prefetch Disabled No Read Engine DGO0363 * * * *
QBSTRIO Synchronous Reads Total DGO0346 * * * *
QBSTRPI Page-ins Required for Read I/O DGO0815 * * * *
QBSTRTO DFHSM Recall Timeouts DGO0337 * * * *
QBSTSEQ Sequential Prefetch Requested DGO0350 * * * *
QBSTSGT Getpage Request Sequential Access Only DGO0344 * * *
QBSTSIO Synchronous Reads Sequential Access Only DGO0347 * * * *
QBSTSPD Prefetch Disabled No Buffer DGO0362 * * * *
QBSTSPP Sequential Prefetch Pages Read DGO0352 * * * *
QBSTSWS Buffer Updates DGO0367 * * * *
Field Table
252 DB2 PM Online Monitor User’s Guide

Table 19. Statistics - Buffer Pool Activity (continued)
Field Name Field Description Help PanelName
Excep-tion
DB26.1
DB25.1
DB24.1
QBSTVPA Alter Buffer Pool Expansions andContractions
DGO0341 * * * *
QBSTVPL Buffers Allocated for Virtual Buffer Pool DGO0339 * * *
QBSTWBVQ Pages Not Written DGO0398 * * * *
QBSTWDRP Pages Marked To Destruct DGO0397 * * * *
QBSTWEE Write Engine Not Available DGO0375 * * * *
QBSTWFD Workfile Request Rejected - Low Buffers DGO0392 * * * *
QBSTWFF Degraded - Low Buffers DGO0391 * * * *
QBSTWFM Maximum Concurrent Work Files DGO0389 * * * *
QBSTWFR Merge Passes Requested DGO0390 * * *
QBSTWFT Requested for All Merge Pass DGO0393 * * *
QBSTWIO Asynchronous Writes DGO0371 * * * *
QBSTWKPD Prefetch Not Scheduled - Zero Quantity DGO0396 * * * *
QBSTWPI Page-ins Required for Write I/O DGO0816 * * * *
QBSTXFL Buffer Pool Full DGO0333 * * * *
QBSTXFV Virtual Storage Unavailable DGO0334 * * * *
QBSTXIS Prefetch I/O Streams, Concurrent Str. - HWM DGO0383 * * * *
SBRBUPW Buffer Updates / Pages Written DGO0369 * * *
SBRBUTP Virtual Buffer Pool Pages in Use (%) DGO0805 * * * *
SBRGPRIO Getpage per Synchronous Read Random DGO0349 * * *
SBRPPRIO Seq. Prefetch Pages Read / Seq. PrefetchRead
DGO0353 * * *
SBRPWWIO Pages Written per Write I/O DGO0372 * * *
SDDPPPIO Dynamic Prefetch Pages Read / Dyn. Pref.Read
DGO0361 * * *
SDGETRAN Getpage Request - Random DGO0345 * * *
SDLPPPIO List Prefetch Pages Read / List PrefetchRead
DGO0357 * * *
SDSTRAN Synchronous Reads - Random DGO0348 * * * *
Table 20. Statistics - Data Capture Activity
Field Name Field Description Help PanelName
Excep-tion
DB26.1
DB25.1
DB24.1
QWSDCDDD Data Descriptions Returned DGO0634 * * *
QWSDCDDR Data Rows Returned DGO0632 * * *
QWSDCDLC Log Records Captured DGO0629 * * *
QWSDCDLR Log Reads Performed DGO0630 * * *
QWSDCDMB Describes Performed DGO0633 * * *
QWSDCDRR Log Records Returned DGO0631 * * *
QWSDCDTB Tables Returned DGO0635 * * *
Field Table
Appendix A. Online Monitor Field Table 253
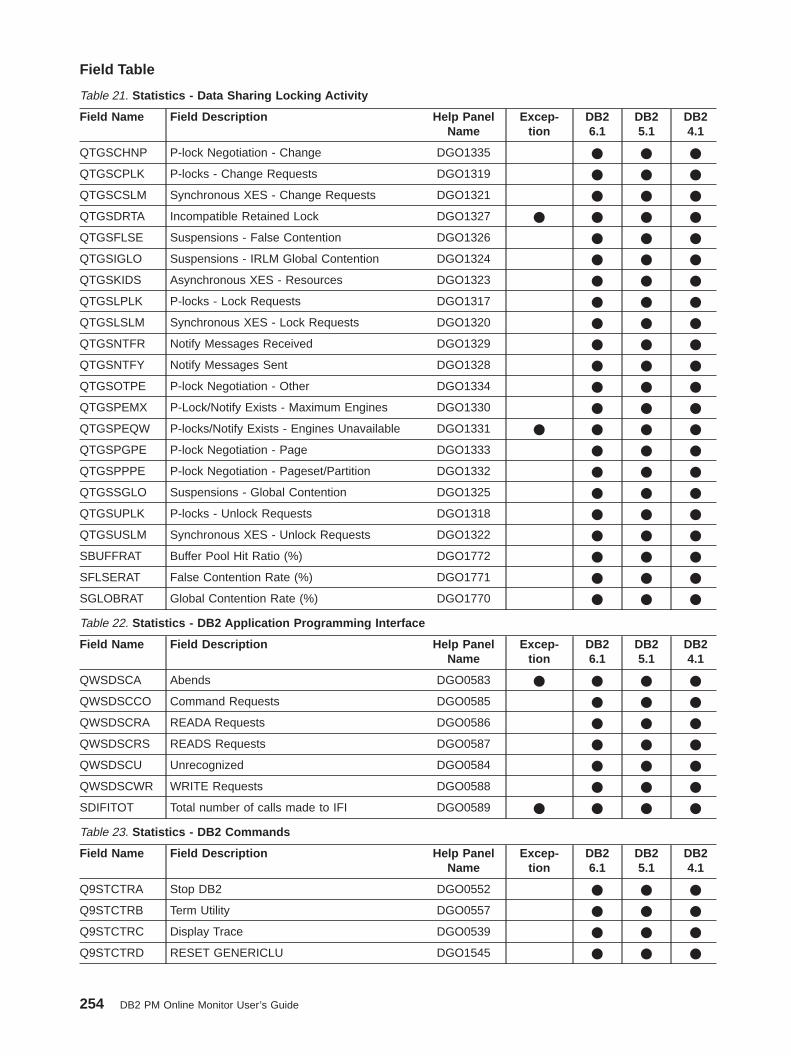
Table 21. Statistics - Data Sharing Locking Activity
Field Name Field Description Help PanelName
Excep-tion
DB26.1
DB25.1
DB24.1
QTGSCHNP P-lock Negotiation - Change DGO1335 * * *
QTGSCPLK P-locks - Change Requests DGO1319 * * *
QTGSCSLM Synchronous XES - Change Requests DGO1321 * * *
QTGSDRTA Incompatible Retained Lock DGO1327 * * * *
QTGSFLSE Suspensions - False Contention DGO1326 * * *
QTGSIGLO Suspensions - IRLM Global Contention DGO1324 * * *
QTGSKIDS Asynchronous XES - Resources DGO1323 * * *
QTGSLPLK P-locks - Lock Requests DGO1317 * * *
QTGSLSLM Synchronous XES - Lock Requests DGO1320 * * *
QTGSNTFR Notify Messages Received DGO1329 * * *
QTGSNTFY Notify Messages Sent DGO1328 * * *
QTGSOTPE P-lock Negotiation - Other DGO1334 * * *
QTGSPEMX P-Lock/Notify Exists - Maximum Engines DGO1330 * * *
QTGSPEQW P-locks/Notify Exists - Engines Unavailable DGO1331 * * * *
QTGSPGPE P-lock Negotiation - Page DGO1333 * * *
QTGSPPPE P-lock Negotiation - Pageset/Partition DGO1332 * * *
QTGSSGLO Suspensions - Global Contention DGO1325 * * *
QTGSUPLK P-locks - Unlock Requests DGO1318 * * *
QTGSUSLM Synchronous XES - Unlock Requests DGO1322 * * *
SBUFFRAT Buffer Pool Hit Ratio (%) DGO1772 * * *
SFLSERAT False Contention Rate (%) DGO1771 * * *
SGLOBRAT Global Contention Rate (%) DGO1770 * * *
Table 22. Statistics - DB2 Application Programming Interface
Field Name Field Description Help PanelName
Excep-tion
DB26.1
DB25.1
DB24.1
QWSDSCA Abends DGO0583 * * * *
QWSDSCCO Command Requests DGO0585 * * *
QWSDSCRA READA Requests DGO0586 * * *
QWSDSCRS READS Requests DGO0587 * * *
QWSDSCU Unrecognized DGO0584 * * *
QWSDSCWR WRITE Requests DGO0588 * * *
SDIFITOT Total number of calls made to IFI DGO0589 * * * *
Table 23. Statistics - DB2 Commands
Field Name Field Description Help PanelName
Excep-tion
DB26.1
DB25.1
DB24.1
Q9STCTRA Stop DB2 DGO0552 * * *
Q9STCTRB Term Utility DGO0557 * * *
Q9STCTRC Display Trace DGO0539 * * *
Q9STCTRD RESET GENERICLU DGO1545 * * *
Field Table
254 DB2 PM Online Monitor User’s Guide

Table 23. Statistics - DB2 Commands (continued)
Field Name Field Description Help PanelName
Excep-tion
DB26.1
DB25.1
DB24.1
Q9STCTRE Start RLIMIT DGO0548 * * *
Q9STCTRF Stop RLIMIT DGO0553 * * *
Q9STCTRG DISPLAY RLIMIT DGO0540 * * *
Q9STCTRH Modify Trace DGO0555 * * *
Q9STCTRI Start DDF DGO0549 * * *
Q9STCTRJ Stop DDF DGO0554 * * *
Q9STCTRK Cancel DDF Thread DGO0556 * * * *
Q9STCTRL Display Location DGO0541 * * *
Q9STCTRM Archive Log DGO0561 * * *
Q9STCTRN Alter Bufferpool DGO0544 * * * *
Q9STCTRO Display Bufferpool DGO0543 * * *
Q9STCTRP Set Archive DGO0562 * * *
Q9STCTRQ Display Archive DGO0542 * * *
Q9STCTRR Reset Indoubt DGO0560 * * *
Q9STCTRS ALTER GROUPBUFFERPOOL DGO1361 * * * *
Q9STCTRT DISPLAY GROUPBUFFERPOOL DGO1360 * * *
Q9STCTRU DISPLAY PROCEDURE DGO1456 * * *
Q9STCTRV START PROCEDURE DGO1457 * * *
Q9STCTRW STOP PROCEDURE DGO1458 * * *
Q9STCTRX DISPLAY GROUP DGO1544 * * *
Q9STCTR0 Display Database DGO0536 * * *
Q9STCTR1 Display Thread DGO0537 * * *
Q9STCTR2 Display Utility DGO0538 * * *
Q9STCTR3 Recover BSDS DGO0558 * * *
Q9STCTR4 Recover Indoubt DGO0559 * * *
Q9STCTR5 Start Database DGO0545 * * *
Q9STCTR6 Start Trace DGO0546 * * * *
Q9STCTR7 Start DB2 DGO0547 * * *
Q9STCTR8 Stop Database DGO0550 * * *
Q9STCTR9 Stop Trace DGO0551 * * *
Q9STEROR Unrecognized Commands DGO0563 * * *
SDSTTOTL Total number of DB2 commands issued DGO0564 * * * *
Table 24. Statistics - DB2 Destination Data
Field Name Field Description Help PanelName
Excep-tion
DB26.1
DB25.1
DB24.1
SDIGTFNW GTF Not Written DGO0596 * * *
SDIGTFRA GTF Not Accepted DGO0597 * * *
SDIGTFWF GTF Write Failure DGO0598 * * *
SDIGTFWR GTF Written DGO0595 * * *
Field Table
Appendix A. Online Monitor Field Table 255

Table 24. Statistics - DB2 Destination Data (continued)
Field Name Field Description Help PanelName
Excep-tion
DB26.1
DB25.1
DB24.1
SDIOP1NW OP1 Not Written DGO0600 * * *
SDIOP1RA OP1 Not Accepted DGO0601 * * *
SDIOP1WR OP1 Written DGO0599 * * *
SDIOP2NW OP2 Not Written DGO0603 * * *
SDIOP2RA OP2 Not Accepted DGO0604 * * *
SDIOP2WR OP2 Written DGO0602 * * *
SDIOP3NW OP3 Not Written DGO0606 * * *
SDIOP3RA OP3 Not Accepted DGO0607 * * *
SDIOP3WR OP3 Written DGO0605 * * *
SDIOP4NW OP4 Not Written DGO0609 * * *
SDIOP4RA OP4 Not Accepted DGO0610 * * *
SDIOP4WR OP4 Written DGO0608 * * *
SDIOP5NW OP5 Not Written DGO0612 * * *
SDIOP5RA OP5 Not Accepted DGO0613 * * *
SDIOP5WR OP5 Written DGO0611 * * *
SDIOP6NW OP6 Not Written DGO0615 * * *
SDIOP6RA OP6 Not Accepted DGO0616 * * *
SDIOP6WR OP6 Written DGO0614 * * *
SDIOP7NW OP7 Not Written DGO0618 * * *
SDIOP7RA OP7 Not Accepted DGO0619 * * *
SDIOP7WR OP7 Written DGO0617 * * *
SDIOP8NW OP8 Not Written DGO0621 * * *
SDIOP8RA OP8 Not Accepted DGO0622 * * *
SDIOP8WR OP8 Written DGO0620 * * *
SDIRTTWR RES Written DGO0623 * * *
SDISMFBF SMF Buffer Overrun DGO0593 * * * *
SDISMFNW SMF Not Written DGO0591 * * *
SDISMFRA SMF Not Accepted DGO0592 * * *
SDISMFWF SMF Write Failure DGO0594 * * *
SDISMFWR SMF Written DGO0590 * * *
SDTOTNA Total number of IFC records not accepted DGO0626 * * * *
SDTOTNW Total number of IFC records not written DGO0625 * * * *
SDTOTW Total number of IFC records succ. written DGO0624 * * * *
SDTOTWF Total number of IFC write failures DGO0628 * * * *
Table 25. Statistics - DB2 Instrumentation
Field Name Field Description Help PanelName
Excep-tion
DB26.1
DB25.1
DB24.1
SDBSCRNW System Parameters - Buffer Pools DGO0578 * * *
SDBSCRSW System Parameters - Buffer Pools DGO0577 * * *
Field Table
256 DB2 PM Online Monitor User’s Guide

Table 25. Statistics - DB2 Instrumentation (continued)
Field Name Field Description Help PanelName
Excep-tion
DB26.1
DB25.1
DB24.1
SDIACTN Accounting (not written) DGO0570 * * *
SDIACTW Accounting (written) DGO0569 * * *
SDIAUDN Audit (not written) DGO0580 * * *
SDIAUDW Audit (written) DGO0579 * * *
SDIDRRN Database Related (not written) DGO0568 * * *
SDIDRRW Database Related (written) DGO0567 * * *
SDISRRN System Related (not written) DGO0566 * * *
SDISRRW System Related (written) DGO0565 * * *
SDISTPN Stop Trace (not written) DGO0574 * * *
SDISTPW Stop Trace (written) DGO0573 * * *
SDISTRN Start Trace (not written) DGO0572 * * *
SDISTRW Start Trace (written) DGO0571 * * *
SDIZPMN Dsnzparm (not written) DGO0576 * * *
SDIZPMW Dsnzparm (written) DGO0575 * * *
SDTSCRNW Total count of all DB2 records not written DGO0582 * * * *
SDTSCRSW Total count of all DB2 records written DGO0581 * * * *
Table 26. Statistics - Distributed Data Facility - per Location
Field Name Field Description Help PanelName
Excep-tion
DB26.1
DB25.1
DB24.1
QLSTABRR Rollbacks Received DGO0650 * * *
QLSTABRS Rollbacks Sent DGO0649 * * *
QLSTBKRC Two Phase Backout Requests Received DGO0668 * * *
QLSTBKSE Two Phase Backout Requests DGO0667 * * *
QLSTBRBF Blocks Received DGO0660 * * * *
QLSTBROW Message Buffer Rows DGO0658 * * * *
QLSTBTBF Blocks Sent DGO0659 * * * *
QLSTBYTR Bytes Received DGO0656 * * *
QLSTBYTS Bytes Sent DGO0655 * * *
QLSTCBLB Limited Block Fetch DGO0657 * * * *
QLSTCNVQ Conversations Queued DGO0643 * * * *
QLSTCNVR Conversations Received DGO0642 * * *
QLSTCNVS Conversations Sent DGO0641 * * *
QLSTCOMR Commits Received DGO0648 * * *
QLSTCOMS Commits Sent DGO0647 * * *
QLSTCPTR Commits Performed DGO0676 * * *
QLSTCRRC Two Phase Commit Requests Received DGO0666 * * *
QLSTCRSE Two Phase Commit Requests Sent DGO0665 * * *
QLSTINDT Thread Went Indoubt DGO0675 * * * *
QLSTLARC Last Agent Requests Received DGO0664 * * *
Field Table
Appendix A. Online Monitor Field Table 257

Table 26. Statistics - Distributed Data Facility - per Location (continued)
Field Name Field Description Help PanelName
Excep-tion
DB26.1
DB25.1
DB24.1
QLSTLASE Last Agent Requests Sent DGO0663 * * *
QLSTLOCN Remote Location DGO0638 * * *
QLSTMSGR Messages Received DGO0654 * * *
QLSTMSGS Messages Sent DGO0653 * * *
QLSTPRRC Prepare Requests Received DGO0662 * * *
QLSTPRSE Prepare Requests Sent DGO0661 * * *
QLSTRBND Statements Bound DGO0644 * * * *
QLSTRBTR Rollbacks Performed DGO0677 * * *
QLSTROWR Rows Received DGO0652 * * *
QLSTROWS Rows Sent DGO0651 * * *
QLSTRRRC Forget Responses Received DGO0670 * * *
QLSTRRSE Forget Responses Sent DGO0669 * * *
QLSTSQLR SQL Statements Received DGO0646 * * * *
QLSTSQLS SQL Statements Sent DGO0645 * * * *
QLSTTRNR Transactions Received DGO0640 * * *
QLSTTRNS Transactions Sent DGO0639 * * *
QLSTVNRC Backout Responses Received DGO0674 * * *
QLSTVNSE Backout Responses Sent DGO0673 * * *
QLSTVYRC Commit Responses Received DGO0672 * * *
QLSTVYSE Commit Responses Sent DGO0671 * * *
Table 27. Statistics - Distributed Data Facility - Global
Field Name Field Description Help PanelName
Excep-tion
DB26.1
DB25.1
DB24.1
QDSTCNAT Active DBATs - Currently DGO1616 * * *
QDSTCSTR Cold Start Connections DGO0762 * * * *
QDSTHWAT Active DBATs - high water mark DGO1617 * * * *
QDSTHWDT Total DBATs - high water mark DGO1618 * * * *
QDSTQCIT Inactive DBATs - Currently DGO0760 * * *
QDSTQCRT Conversions Deallocated-MaximumConnected
DGO0759 * * *
QDSTQDBT DBAT Queued-Maximum Active DGO0758 * * * *
QDSTQMIT Inactive DBATs - HWM DGO0761 * * * *
QDSTRSAT Resynchronization Attempted DGO0764 * * * *
QDSTRSSU Resynchronization Succeeded DGO0765 * * * *
QDSTWSTR Warm Start Connections DGO0763 * * * *
Table 28. Statistics - EDM Pool Activity
Field Name Field Description Help PanelName
Excep-tion
DB26.1
DB25.1
DB24.1
QISECT Pages Used for CT DGO0402 * * *
QISECTG Requests for CT Sections DGO0408 * * *
Field Table
258 DB2 PM Online Monitor User’s Guide

Table 28. Statistics - EDM Pool Activity (continued)
Field Name Field Description Help PanelName
Excep-tion
DB26.1
DB25.1
DB24.1
QISECTL CT Section Not Found In EDM Pool DGO0409 * * * *
QISEDBD Pages Used for DBD DGO0403 * * *
QISEDBDG Requests for DBD Sections DGO0414 * * *
QISEDBDL DBD Section Not Found In EDM Pool DGO0415 * * * *
QISEDYNI Inserts for Dynamic Cache DGO1825 * *
QISEDYNP Pages Used for Cache DGO1827 * *
QISEDYNR Requests for Dynamic Cache Section DGO1826 * *
QISEFAIL EDM Pool Full DGO0407 * * * *
QISEFREE Free Pages In Free Chain DGO0401 * * *
QISEKT Pages Used for PT DGO0405 * * *
QISEKTG Requests for PT Sections DGO0411 * * *
QISEKTL PT Sections Not Found In EDM Pool DGO0412 * * * *
QISEPAGE Pages In EDM Pool DGO0399 * * *
QISESKCT Pages Used for Skct DGO0404 * * *
QISESKPT Pages Used for Skpt DGO0406 * * *
QXSTDEXP Kept Dynamic Statement Discarded DGO1823 * *
QXSTDINV Dynamic Cache Statement Purged DGO1824 * *
QXSTFND Prepares Satisfied DGO1819 * *
QXSTIPRP Prepares Implicit DGO1821 * *
QXSTNFND Prepares Received DGO1820 * *
QXSTNPRP Prepares Avoided DGO1822 * *
SERBUTP EDM Pool Pages In Use (%) DGO0400 * * *
SERCTLR CT Requests / CT Not In EDM Pool DGO0410 * * * *
SERDBLR DBD Requests / DBD Not In EDM Pool DGO0416 * * * *
SERPTLR PT Requests / PT Not In EDM DGO0413 * * * *
Table 29. Statistics - Global Group Buffer Pool Statistics
Field Name Field Description Help PanelName
Excep-tion
DB26.1
DB25.1
DB24.1
QBGBGCK Checkpoint Interval (Minutes) DGO1587 * * *
QBGBGCT Class Castout Threshold (%) DGO1585 * * *
QBGBGDR Actual Directory Entries DGO1588 * * *
QBGBGDT Actual Data Entries DGO1589 * * *
QBGBGGT Buffer Pool Castout Threshold (%) DGO1586 * * *
QBGBGR1 Current Directory to Data Ratio DGO1584 * * *
QBGBGR2 Pending Directory to Data Ratio DGO1590 * * *
QBGBGSZ Allocated Buffer Pool Size (4k) DGO1583 * * *
QW0254CC Castout DGO1575 * * * *
QW0254DE Directory Entry DGO1576 * * * *
QW0254DR Directory Entry Reclaim DGO1571 * * * *
Field Table
Appendix A. Online Monitor Field Table 259
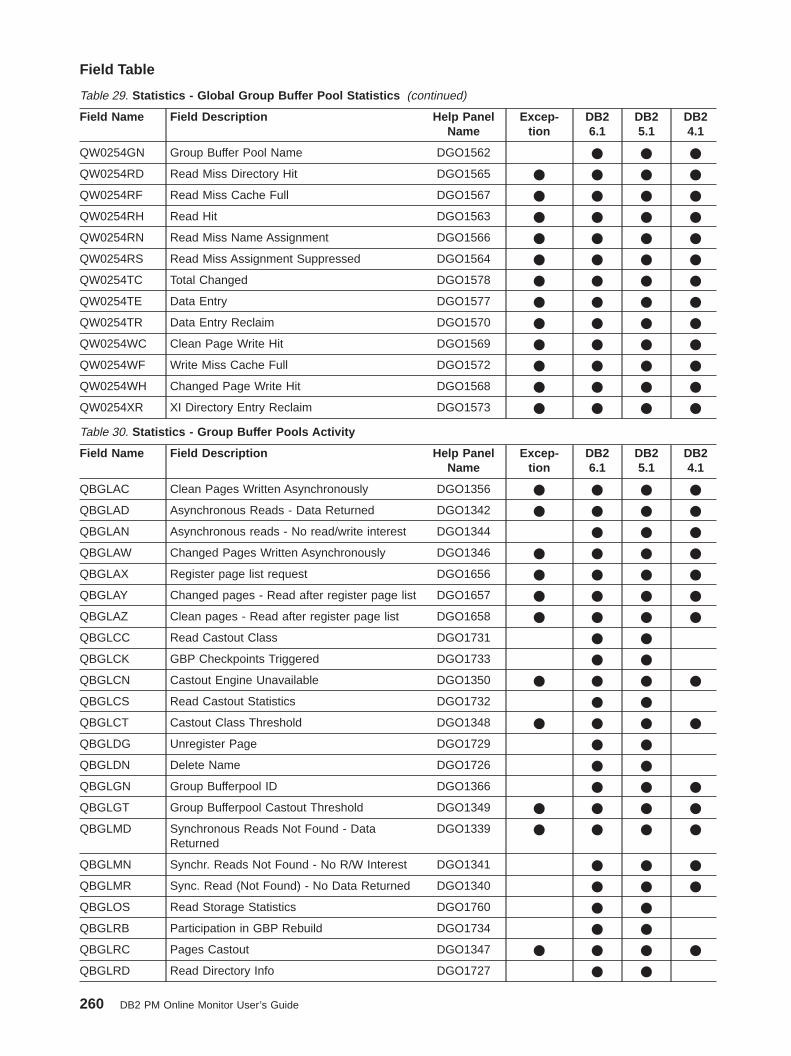
Table 29. Statistics - Global Group Buffer Pool Statistics (continued)
Field Name Field Description Help PanelName
Excep-tion
DB26.1
DB25.1
DB24.1
QW0254GN Group Buffer Pool Name DGO1562 * * *
QW0254RD Read Miss Directory Hit DGO1565 * * * *
QW0254RF Read Miss Cache Full DGO1567 * * * *
QW0254RH Read Hit DGO1563 * * * *
QW0254RN Read Miss Name Assignment DGO1566 * * * *
QW0254RS Read Miss Assignment Suppressed DGO1564 * * * *
QW0254TC Total Changed DGO1578 * * * *
QW0254TE Data Entry DGO1577 * * * *
QW0254TR Data Entry Reclaim DGO1570 * * * *
QW0254WC Clean Page Write Hit DGO1569 * * * *
QW0254WF Write Miss Cache Full DGO1572 * * * *
QW0254WH Changed Page Write Hit DGO1568 * * * *
QW0254XR XI Directory Entry Reclaim DGO1573 * * * *
Table 30. Statistics - Group Buffer Pools Activity
Field Name Field Description Help PanelName
Excep-tion
DB26.1
DB25.1
DB24.1
QBGLAC Clean Pages Written Asynchronously DGO1356 * * * *
QBGLAD Asynchronous Reads - Data Returned DGO1342 * * * *
QBGLAN Asynchronous reads - No read/write interest DGO1344 * * *
QBGLAW Changed Pages Written Asynchronously DGO1346 * * * *
QBGLAX Register page list request DGO1656 * * * *
QBGLAY Changed pages - Read after register page list DGO1657 * * * *
QBGLAZ Clean pages - Read after register page list DGO1658 * * * *
QBGLCC Read Castout Class DGO1731 * *
QBGLCK GBP Checkpoints Triggered DGO1733 * *
QBGLCN Castout Engine Unavailable DGO1350 * * * *
QBGLCS Read Castout Statistics DGO1732 * *
QBGLCT Castout Class Threshold DGO1348 * * * *
QBGLDG Unregister Page DGO1729 * *
QBGLDN Delete Name DGO1726 * *
QBGLGN Group Bufferpool ID DGO1366 * * *
QBGLGT Group Bufferpool Castout Threshold DGO1349 * * * *
QBGLMD Synchronous Reads Not Found - DataReturned
DGO1339 * * * *
QBGLMN Synchr. Reads Not Found - No R/W Interest DGO1341 * * *
QBGLMR Sync. Read (Not Found) - No Data Returned DGO1340 * * *
QBGLOS Read Storage Statistics DGO1760 * *
QBGLRB Participation in GBP Rebuild DGO1734 * *
QBGLRC Pages Castout DGO1347 * * * *
QBGLRD Read Directory Info DGO1727 * *
Field Table
260 DB2 PM Online Monitor User’s Guide

Table 30. Statistics - Group Buffer Pools Activity (continued)
Field Name Field Description Help PanelName
Excep-tion
DB26.1
DB25.1
DB24.1
QBGLRF Read Failed - No Storage DGO1352 * * * *
QBGLRG Register Page DGO1728 * *
QBGLSU Write Engine Unavailable DGO1351 * * * *
QBGLSW Changed Pages Written Synchronously DGO1345 * * * *
QBGLUN Unlock Castout DGO1730 * *
QBGLWC Clean Pages Written Synchronously DGO1355 * * * *
QBGLWF Write Failed - No Storage DGO1353 * * * *
QBGLXD Synchr. Reads Cross Valid. - Data Returned DGO1336 * * * *
QBGLXN Synchr. Reads Cross Valid. - No R/W Interest DGO1338 * * *
QBGLXR Synchronous Read (XI) - No Data Returned DGO1337 * * *
Table 31. Statistics - Locking Activity
Field Name Field Description Help PanelName
Excep-tion
DB26.1
DB25.1
DB24.1
QTXACHG Change Requests DGO0480 * * *
QTXACLNO Claim Requests DGO0486 * * *
QTXACLUN Unsuccessful Claim Requests DGO0487 * * * *
QTXADEA Deadlocks DGO0476 * * * *
QTXADRNO Drain Requests DGO0484 * * *
QTXADRUN Unsuccessful Drain Requests DGO0485 * * * *
QTXAIRLM Other Requests DGO0481 * * *
QTXALES Lock Escalation (shared) DGO0482 * * * *
QTXALEX Lock Escalation (exclusive) DGO0483 * * * *
QTXALOCK Lock Requests DGO0477 * * *
QTXAQRY Query Requests DGO0479 * * *
QTXASLAT Suspensions (latch only) DGO0473 * * *
QTXASLOC Suspensions (lock only) DGO0472 * * * *
QTXASOTH Suspensions (other) DGO0474 * * *
QTXATIM Timeouts DGO0475 * * * *
QTXAUNLK Unlock Requests DGO0478 * * *
SLCLKET Lock Escalations DGO0768 * * * *
SLRLCRLS Lock and Change Requests per LockSuspension
DGO0808 * * *
SLRSUSP Suspensions (all) DGO0471 * * * *
Table 32. Statistics - Log Activity
Field Name Field Description Help PanelName
Excep-tion
DB26.1
DB25.1
DB24.1
QJSTALR Archive Log Read Allocations DGO0519 * * *
QJSTALW Archive Log - Write Allocations DGO0520 * * *
QJSTBFFL Control Intervals Created DGO0518 * * *
QJSTBFWR Write Output Log Buffers DGO0515 * * *
Field Table
Appendix A. Online Monitor Field Table 261

Table 32. Statistics - Log Activity (continued)
Field Name Field Description Help PanelName
Excep-tion
DB26.1
DB25.1
DB24.1
QJSTBSDS Total BSDS Access Request DGO0516 * * *
QJSTCIOF Archive Log - Control Intervals Offloaded DGO0807 * * *
QJSTLAMA Look Ahead Mounts Attempted DGO0512 * * *
QJSTLAMS Look Ahead Mount Successful DGO0513 * * *
QJSTRACT Reads Satisfied - Active Log DGO0505 * * * *
QJSTRARH Reads Satisfied - Archive Log DGO0507 * * * *
QJSTRBUF Reads Satisfied - Output Buffer DGO0503 * * * *
QJSTTVC Reads Delayed - Tape Volume Contention DGO0510 * * * *
QJSTWRNW Write-no-wait DGO0514 * * *
QJSTWTB Unavailable Output Log Buffers DGO0517 * * * *
QJSTWUR Reads Delayed - Unavailable Resource DGO0511 * * * *
SARLRACT Reads Satisfied - Active Log(%) DGO0506 * * *
SARLRARC Reads Satisfied - Archive Log(%) DGO0508 * * *
SARLRBUF Reads Satisfied - Output Buffer(%) DGO0504 * * *
SARWBAC Out Log Buf Writes / Act. Log Cntl I’val DGO0806 * * * *
Table 33. Statistics - Miscellaneous
Field Name Field Description Help PanelName
Excep-tion
DB26.1
DB25.1
DB24.1
QISTCOLS Columns Bypassed DGO0770 * * *
QWSDLR Log RBA DGO0636 * * *
QWSDRINV Reason Invoke DGO0637 * * *
Table 34. Statistics - Open/Close Activity
Field Name Field Description Help PanelName
Excep-tion
DB26.1
DB25.1
DB24.1
QTDSDRN Data Sets Closed Threshold Reached DGO0426 * * * *
QTDSOPN Open Data Sets - Current DGO0418 * * * *
QTMAXDS Open Data Sets - HWM DGO0417 * * * *
QTMAXPB Open Data Sets - Not In Use, Not Closed(HWM)
DGO0422 * * * *
QTPCCT Data Sets Converted R/W To R/O DGO0755 * * * *
QTREOPN Successful Logical Reopens DGO0429 * * *
QTSLWDD Open DSs - Not In Use, Not Closed (current) DGO0420 * * * *
SDINUSEC Open Data Sets In Use DGO0757 * * * *
Table 35. Statistics - Plan/Package Processing
Field Name Field Description Help PanelName
Excep-tion
DB26.1
DB25.1
DB24.1
QTABIND Autobind Plan Successful DGO0442 * * * *
QTABINDA Autobind Plan Attempts DGO0441 * * * *
QTALLOC Plan Allocation Successful DGO0431 * * *
QTALLOCA Plan Allocation Attempts DGO0430 * * *
Field Table
262 DB2 PM Online Monitor User’s Guide

Table 35. Statistics - Plan/Package Processing (continued)
Field Name Field Description Help PanelName
Excep-tion
DB26.1
DB25.1
DB24.1
QTAUTOBA Auto Bind Package Attempts DGO0444 * * * *
QTBINDA Bind Plan Add Subcommands DGO0435 * * *
QTBINDPA Bind Package Add Subcommand DGO0439 * * *
QTBINDPR Bind Package Replace Subcommand DGO0440 * * *
QTBINDR Bind Plan Replace Subcommands DGO0436 * * *
QTFREE Free Plan Subcommands DGO0452 * * *
QTFREEA Free Plan Attempts DGO0453 * * *
QTFREEAP Free Package Attempts DGO0456 * * *
QTFREEP Free Package Subcommands DGO0455 * * *
QTINVRID Autobind Plan Invalid Resource ID DGO0443 * * * *
QTPKABND Auto Bind Packages Successful DGO0445 * * * *
QTPKALL Package Allocation Successful DGO0433 * * *
QTPKALLA Package Allocation Attempts DGO0432 * * *
QTPKGBD Packages Bound DGO0438 * * *
QTPKGFRD Free Package Successful DGO0457 * * *
QTPKGRBD Rebind Package Successful DGO0451 * * *
QTPLNBD Plans Bound DGO0434 * * *
QTPLNFRD Free Plan Successful DGO0454 * * *
QTPLNRBD Rebind Plan Successful DGO0448 * * *
QTRBINDA Rebind Plan Attempts DGO0447 * * *
QTRBINDP Rebind Package Subcommands DGO0449 * * *
QTRBNDPA Rebind Package Attempts DGO0450 * * *
QTREBIND Rebind Plan Subcommands DGO0446 * * *
QTTESTB Test Binds No Plan-ID DGO0437 * * *
Table 36. Statistics - Query Parallelism
Field Name Field Description Help PanelName
Excep-tion
DB26.1
DB25.1
DB24.1
QXCOORNO One DB2 - COORDINATOR Parm = NO DGO1672 * *
QXDEGBUF Fall To Sequential Mode (no buffer) DGO0327 * * * *
QXDEGCUR Fall To Sequential Mode Cursor DGO0748 * * * *
QXDEGENC MVS/ESA Enclave Services DGO1359 * * * *
QXDEGESA Fall To Sequential Mode No ESA DGO0747 * * * *
QXISORR One DB2 - Isolation Level DGO1673 * *
QXMAXDEG Maximum Degree of Parallelism DGO0326 * * *
QXNORGRP Planned Parallel Degree DGO0329 * * *
QXREDGRP Reduced Parallel Degree DGO0328 * * * *
QXTOTGRP Parallel Groups Executed DGO0749 * * *
SDTOTPFL Parallel Fall To Sequential DGO0746 * * * *
SXXCRAT Member Skipped (%) DGO1798 * *
Field Table
Appendix A. Online Monitor Field Table 263

Table 37. Statistics - RID List Processing
Field Name Field Description Help PanelName
Excep-tion
DB26.1
DB25.1
DB24.1
QISTRCUR RID Blocks Allocated - Current DGO0466 * * *
QISTRHIG RID Blocks Allocated - Maximum DGO0465 * * * *
QISTRLLM Terminated - RDS Limit Exceeded DGO0468 * * * *
QISTRMAX Terminated - Process Limit Exceeded DGO0470 * * * *
QISTRPLM Terminated - DM Limit Exceeded DGO0469 * * * *
QISTRSTG Terminated - No Storage DGO0467 * * * *
SRTTERM Number of Times RID List Processing NotUsed
DGO0767 * * * *
Table 38. Statistics - SQL Activity (DCL)
Field Name Field Description Help PanelName
Excep-tion
DB26.1
DB25.1
DB24.1
QXALOCC Allocate Cursor DGO1740 * *
QXALOCL Associate Locators DGO1739 * *
QXCON1 Connect Type 1 DGO0296 * * *
QXCON2 Connect Type 2 DGO0297 * * *
QXGRANT Grant DGO0292 * * *
QXLOCK Lock Table DGO0291 * * *
QXREL Release DGO0298 * * *
QXREVOK Revoke DGO0293 * * *
QXSETCDG Set Current Degree DGO0742 * * *
QXSETCON Set Connection DGO0299 * * *
QXSETCRL Set Current Rules DGO1357 * * *
QXSETHV Set Host Variable DGO0295 * * *
QXSETSQL Set Current SQLID DGO0294 * * *
SSCDCL Total DCL DGO0300 * * * *
Table 39. Statistics - SQL Activity (DDL)
Field Name Field Description Help PanelName
Excep-tion
DB26.1
DB25.1
DB24.1
QXALDAB Alter Database DGO0312 * * *
QXALTIX Alter Index DGO0310 * * *
QXALTST Alter Stogroup DGO0313 * * *
QXALTTA Alter Table DGO0309 * * *
QXALTTS Alter Tablespace DGO0311 * * *
QXCMTON Comment On DGO0323 * * *
QXCRALS Create Alias DGO0308 * * *
QXCRDAB Create Database DGO0306 * * *
QXCRGTT Temp. Table DGO1671 * *
QXCRINX Create Index DGO0302 * * *
QXCRSTG Create Stogroup DGO0307 * * *
QXCRSYN Create Synonym DGO0304 * * *
Field Table
264 DB2 PM Online Monitor User’s Guide
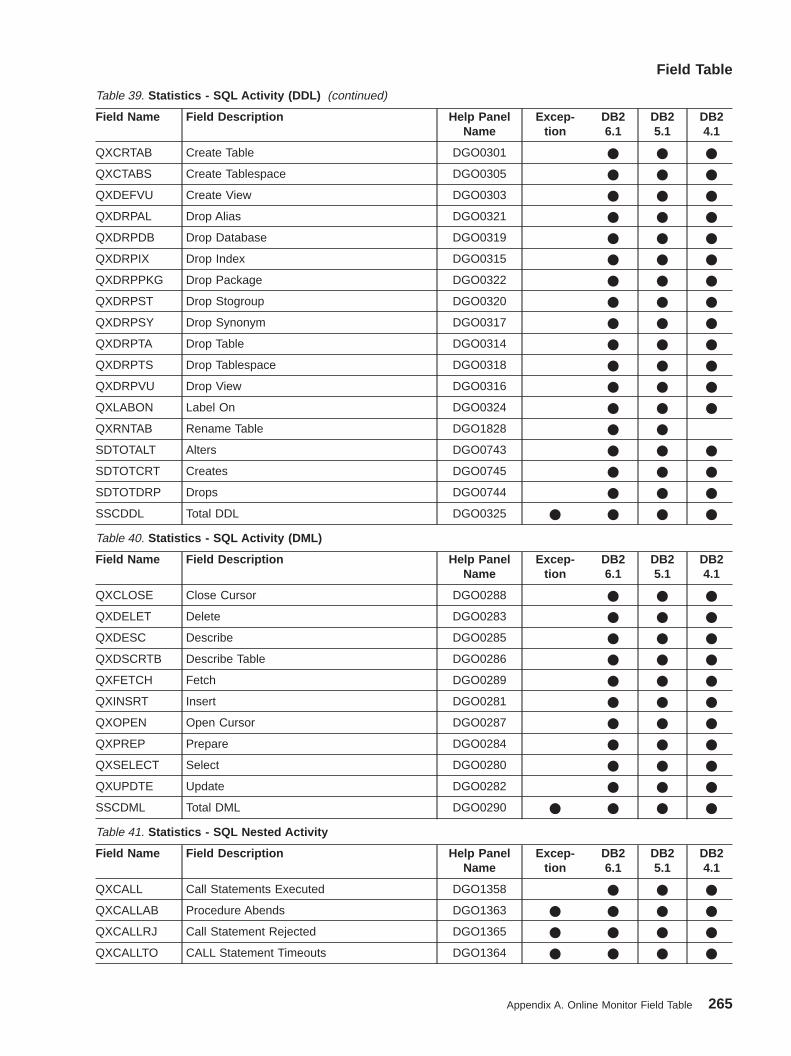
Table 39. Statistics - SQL Activity (DDL) (continued)
Field Name Field Description Help PanelName
Excep-tion
DB26.1
DB25.1
DB24.1
QXCRTAB Create Table DGO0301 * * *
QXCTABS Create Tablespace DGO0305 * * *
QXDEFVU Create View DGO0303 * * *
QXDRPAL Drop Alias DGO0321 * * *
QXDRPDB Drop Database DGO0319 * * *
QXDRPIX Drop Index DGO0315 * * *
QXDRPPKG Drop Package DGO0322 * * *
QXDRPST Drop Stogroup DGO0320 * * *
QXDRPSY Drop Synonym DGO0317 * * *
QXDRPTA Drop Table DGO0314 * * *
QXDRPTS Drop Tablespace DGO0318 * * *
QXDRPVU Drop View DGO0316 * * *
QXLABON Label On DGO0324 * * *
QXRNTAB Rename Table DGO1828 * *
SDTOTALT Alters DGO0743 * * *
SDTOTCRT Creates DGO0745 * * *
SDTOTDRP Drops DGO0744 * * *
SSCDDL Total DDL DGO0325 * * * *
Table 40. Statistics - SQL Activity (DML)
Field Name Field Description Help PanelName
Excep-tion
DB26.1
DB25.1
DB24.1
QXCLOSE Close Cursor DGO0288 * * *
QXDELET Delete DGO0283 * * *
QXDESC Describe DGO0285 * * *
QXDSCRTB Describe Table DGO0286 * * *
QXFETCH Fetch DGO0289 * * *
QXINSRT Insert DGO0281 * * *
QXOPEN Open Cursor DGO0287 * * *
QXPREP Prepare DGO0284 * * *
QXSELECT Select DGO0280 * * *
QXUPDTE Update DGO0282 * * *
SSCDML Total DML DGO0290 * * * *
Table 41. Statistics - SQL Nested Activity
Field Name Field Description Help PanelName
Excep-tion
DB26.1
DB25.1
DB24.1
QXCALL Call Statements Executed DGO1358 * * *
QXCALLAB Procedure Abends DGO1363 * * * *
QXCALLRJ Call Statement Rejected DGO1365 * * * *
QXCALLTO CALL Statement Timeouts DGO1364 * * * *
Field Table
Appendix A. Online Monitor Field Table 265

Table 42. Statistics - Subsystem Services
Field Name Field Description Help PanelName
Excep-tion
DB26.1
DB25.1
DB24.1
QWSDCKPT System Event Checkpoint DGO0535 * * * *
Q3STABRT Rollback DGO0525 * * * *
Q3STCOMM Commits Phase 2 DGO0527 * * *
Q3STCTHD Create Thread DGO0522 * * * *
Q3STCTHW Queued At Create Thread DGO0532 * * * *
Q3STIDEN Identify DGO0521 * * *
Q3STINDT Units of Recovery Gone Indoubt DGO0529 * * * *
Q3STMEOM Subsystem Allied Memory End of Memory DGO0534 * * * *
Q3STMEOT Subsystem Allied Memory End of Task DGO0533 * * * *
Q3STPREP Commits Phase 1 DGO0526 * * *
Q3STRDON Commits Read Only DGO0528 * * *
Q3STRIUR Units of Recovery Indoubt Resolved DGO0530 * * *
Q3STSIGN Signon DGO0523 * * * *
Q3STSYNC Synchs (single phase commit) DGO0531 * * *
Q3STTERM Terminate DGO0524 * * *
Table 43. Statistics - Times
Field Name Field Description Help PanelName
Excep-tion
DB26.1
DB25.1
DB24.1
SDDFSRBT DDF Address Space SRB Time DGO0498 * * *
SDDFTCBT DDF Address Space TCB Time DGO0497 * * *
SDDFTOTT DDF Address Space Total Time DGO0499 * * * *
SDISRBT IRLM SRB Time DGO0495 * * *
SDITCBT IRLM TCB Time DGO0494 * * *
SDITOTT IRLM Total Time DGO0496 * * * *
SDSRBT Database Services SRB Time DGO0492 * * *
SDTCBT Database Services TCB Time DGO0491 * * *
SDTLSRBT Total DGO0501 * * *
SDTLTCBT Total DGO0500 * * *
SDTLTOTT Total DGO0502 * * *
SDTOTT Database Services Total Time DGO0493 * * * *
SSSRBT System Services SRB Time DGO0489 * * *
SSTCBT System Services TCB Time DGO0488 * * *
SSTOTT System Services Total Time DGO0490 * * * *
Table 44. System Parameters - Application Programming Defaults
Field Name Field Description Help PanelName
DB2 6.1 DB2 5.1 DB2 4.1
QWPBAGID ASCII GBCS CCSID DGO1741 * *
QWPBAMID ASCII MBCS CCSID DGO1742 * *
QWPBAR Default Decimal Arithmetic DGO1748 * *
Field Table
266 DB2 PM Online Monitor User’s Guide
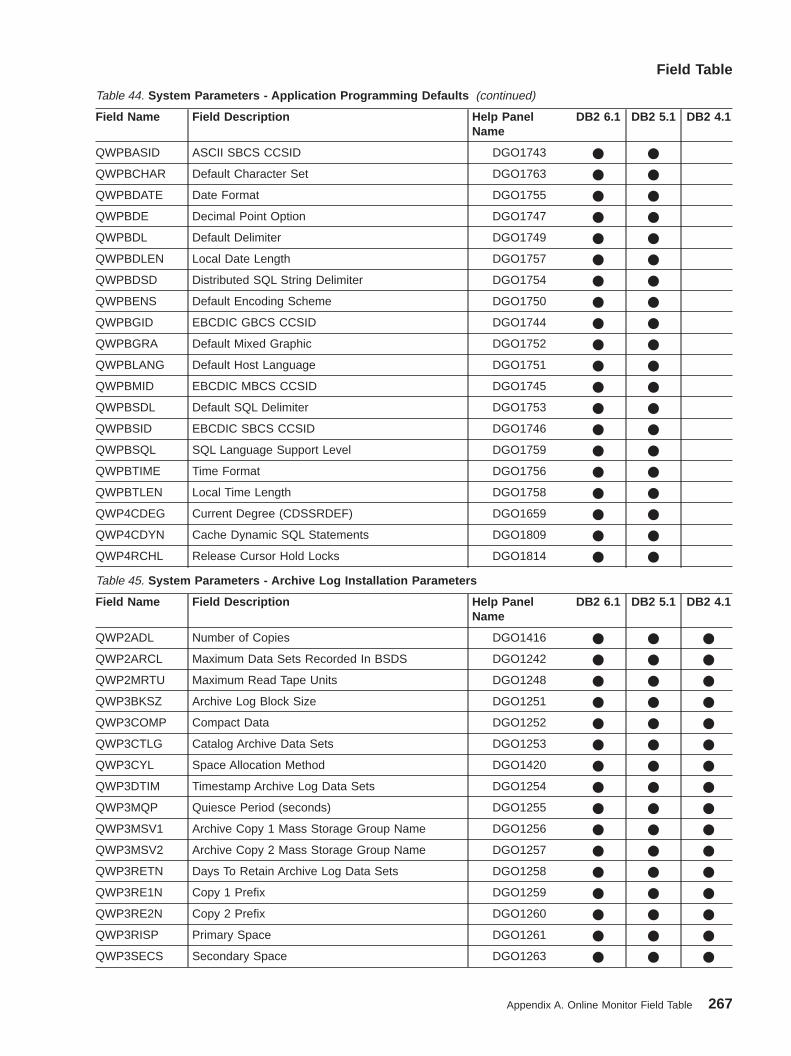
Table 44. System Parameters - Application Programming Defaults (continued)
Field Name Field Description Help PanelName
DB2 6.1 DB2 5.1 DB2 4.1
QWPBASID ASCII SBCS CCSID DGO1743 * *
QWPBCHAR Default Character Set DGO1763 * *
QWPBDATE Date Format DGO1755 * *
QWPBDE Decimal Point Option DGO1747 * *
QWPBDL Default Delimiter DGO1749 * *
QWPBDLEN Local Date Length DGO1757 * *
QWPBDSD Distributed SQL String Delimiter DGO1754 * *
QWPBENS Default Encoding Scheme DGO1750 * *
QWPBGID EBCDIC GBCS CCSID DGO1744 * *
QWPBGRA Default Mixed Graphic DGO1752 * *
QWPBLANG Default Host Language DGO1751 * *
QWPBMID EBCDIC MBCS CCSID DGO1745 * *
QWPBSDL Default SQL Delimiter DGO1753 * *
QWPBSID EBCDIC SBCS CCSID DGO1746 * *
QWPBSQL SQL Language Support Level DGO1759 * *
QWPBTIME Time Format DGO1756 * *
QWPBTLEN Local Time Length DGO1758 * *
QWP4CDEG Current Degree (CDSSRDEF) DGO1659 * *
QWP4CDYN Cache Dynamic SQL Statements DGO1809 * *
QWP4RCHL Release Cursor Hold Locks DGO1814 * *
Table 45. System Parameters - Archive Log Installation Parameters
Field Name Field Description Help PanelName
DB2 6.1 DB2 5.1 DB2 4.1
QWP2ADL Number of Copies DGO1416 * * *
QWP2ARCL Maximum Data Sets Recorded In BSDS DGO1242 * * *
QWP2MRTU Maximum Read Tape Units DGO1248 * * *
QWP3BKSZ Archive Log Block Size DGO1251 * * *
QWP3COMP Compact Data DGO1252 * * *
QWP3CTLG Catalog Archive Data Sets DGO1253 * * *
QWP3CYL Space Allocation Method DGO1420 * * *
QWP3DTIM Timestamp Archive Log Data Sets DGO1254 * * *
QWP3MQP Quiesce Period (seconds) DGO1255 * * *
QWP3MSV1 Archive Copy 1 Mass Storage Group Name DGO1256 * * *
QWP3MSV2 Archive Copy 2 Mass Storage Group Name DGO1257 * * *
QWP3RETN Days To Retain Archive Log Data Sets DGO1258 * * *
QWP3RE1N Copy 1 Prefix DGO1259 * * *
QWP3RE2N Copy 2 Prefix DGO1260 * * *
QWP3RISP Primary Space DGO1261 * * *
QWP3SECS Secondary Space DGO1263 * * *
Field Table
Appendix A. Online Monitor Field Table 267
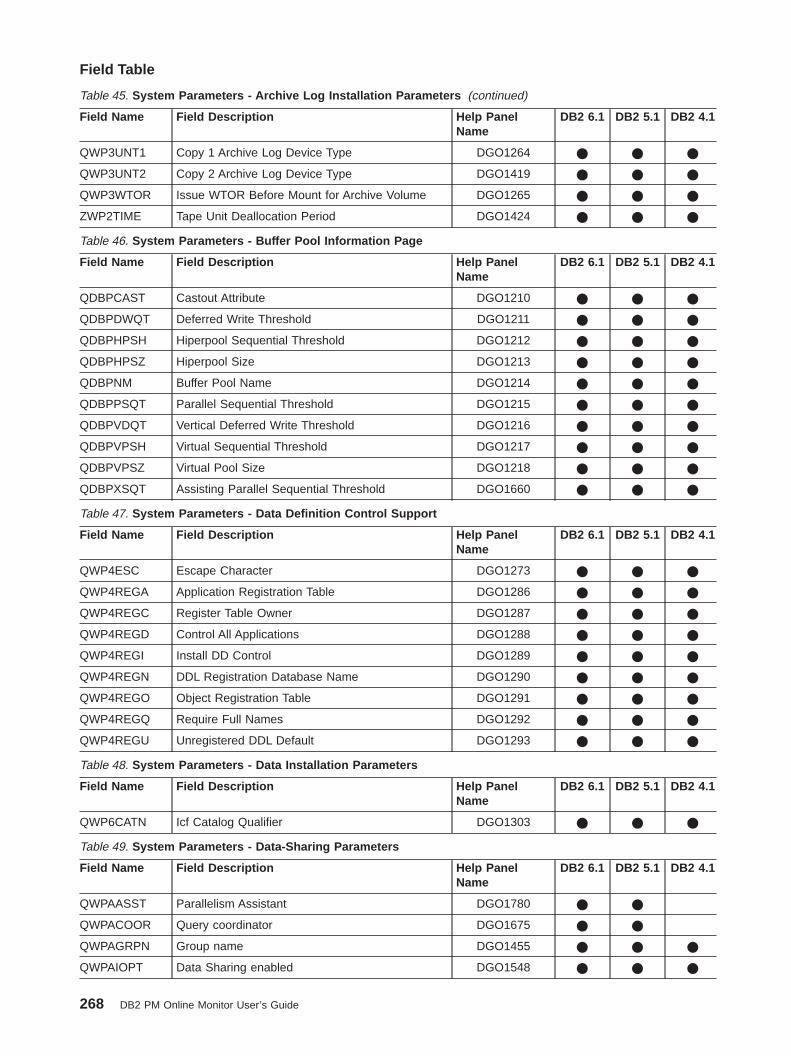
Table 45. System Parameters - Archive Log Installation Parameters (continued)
Field Name Field Description Help PanelName
DB2 6.1 DB2 5.1 DB2 4.1
QWP3UNT1 Copy 1 Archive Log Device Type DGO1264 * * *
QWP3UNT2 Copy 2 Archive Log Device Type DGO1419 * * *
QWP3WTOR Issue WTOR Before Mount for Archive Volume DGO1265 * * *
ZWP2TIME Tape Unit Deallocation Period DGO1424 * * *
Table 46. System Parameters - Buffer Pool Information Page
Field Name Field Description Help PanelName
DB2 6.1 DB2 5.1 DB2 4.1
QDBPCAST Castout Attribute DGO1210 * * *
QDBPDWQT Deferred Write Threshold DGO1211 * * *
QDBPHPSH Hiperpool Sequential Threshold DGO1212 * * *
QDBPHPSZ Hiperpool Size DGO1213 * * *
QDBPNM Buffer Pool Name DGO1214 * * *
QDBPPSQT Parallel Sequential Threshold DGO1215 * * *
QDBPVDQT Vertical Deferred Write Threshold DGO1216 * * *
QDBPVPSH Virtual Sequential Threshold DGO1217 * * *
QDBPVPSZ Virtual Pool Size DGO1218 * * *
QDBPXSQT Assisting Parallel Sequential Threshold DGO1660 * * *
Table 47. System Parameters - Data Definition Control Support
Field Name Field Description Help PanelName
DB2 6.1 DB2 5.1 DB2 4.1
QWP4ESC Escape Character DGO1273 * * *
QWP4REGA Application Registration Table DGO1286 * * *
QWP4REGC Register Table Owner DGO1287 * * *
QWP4REGD Control All Applications DGO1288 * * *
QWP4REGI Install DD Control DGO1289 * * *
QWP4REGN DDL Registration Database Name DGO1290 * * *
QWP4REGO Object Registration Table DGO1291 * * *
QWP4REGQ Require Full Names DGO1292 * * *
QWP4REGU Unregistered DDL Default DGO1293 * * *
Table 48. System Parameters - Data Installation Parameters
Field Name Field Description Help PanelName
DB2 6.1 DB2 5.1 DB2 4.1
QWP6CATN Icf Catalog Qualifier DGO1303 * * *
Table 49. System Parameters - Data-Sharing Parameters
Field Name Field Description Help PanelName
DB2 6.1 DB2 5.1 DB2 4.1
QWPAASST Parallelism Assistant DGO1780 * *
QWPACOOR Query coordinator DGO1675 * *
QWPAGRPN Group name DGO1455 * * *
QWPAIOPT Data Sharing enabled DGO1548 * * *
Field Table
268 DB2 PM Online Monitor User’s Guide

Table 49. System Parameters - Data-Sharing Parameters (continued)
Field Name Field Description Help PanelName
DB2 6.1 DB2 5.1 DB2 4.1
QWPAMAXM Maximum number of members DGO1549 * * *
QWPAMBRN Member name DGO1547 * * *
QWPASUCV SU conversion factor DGO1676 * *
Table 50. System Parameters - Distributed Data Facility Parameters
Field Name Field Description Help PanelName
DB2 6.1 DB2 5.1 DB2 4.1
QWP1SCER Extended Security DGO1674 * * *
QWP4HOP Hop Site Authorization DGO1274 * * *
QWP9CMST DBAT Status DGO1304 * * *
QWP9RLFN Resource Limit Spec. Table Error Action (DDF) DGO1305 * * *
QWP9RYC Resynchronization Interval (minutes) DGO1306 * * *
QWP9STRT DB2 Startup Option DGO1307 * * *
QWP9TTO Idle Thread Timeout Interval DGO1435 * * *
Table 51. System Parameters - Group Buffer Pools Parameters Page
Field Name Field Description Help PanelName
DB2 6.1 DB2 5.1 DB2 4.1
QBGBGAS AUTOREC (automatic recovery) DGO1725 * *
QBGBGDR Actual Directory Entry DGO1559 * * *
QBGBGDT Actual Data Entry DGO1560 * * *
QBGBGR2 Pending Directory to Data Ratio DGO1561 * * *
QBGBGSZ Allocated Buffer Pool Size (4K) DGO1558 * * *
Table 52. System Parameters - IRLM Installation Parameters
Field Name Field Description Help PanelName
DB2 6.1 DB2 5.1 DB2 4.1
QWP4IAUT Automatic Start DGO1405 * * *
QWP4IPRC Start Procedure Name DGO1276 * * *
QWP4ISID Subsystem Name DGO1277 * * *
QWP4ISWT Time DB2 Will Wait for Start (seconds) DGO1278 * * *
QWP4TOUT Resource Timeout (seconds) DGO1299 * * *
QWP4UTO Utility Timeout Factor DGO1300 * * *
Table 53. System Parameters - Lock Escalation Parameters
Field Name Field Description Help PanelName
DB2 6.1 DB2 5.1 DB2 4.1
QWP4LKTS Maximum Locks per Table Space DGO1279 * * *
QWP4LKUS Maximum Locks per User DGO1280 * * *
QWP4WAIT Wait For Retained Locks DGO1738 * * *
Table 54. System Parameters - Log Installation Parameters
Field Name Field Description Help PanelName
DB2 6.1 DB2 5.1 DB2 4.1
QWP2DUAL Number of Copies DGO1431 * * *
Field Table
Appendix A. Online Monitor Field Table 269

Table 54. System Parameters - Log Installation Parameters (continued)
Field Name Field Description Help PanelName
DB2 6.1 DB2 5.1 DB2 4.1
QWP2IBPS Input Buffer Size (KB) DGO1246 * * *
QWP2OBPS Output Buffer Size (KB) DGO1249 * * *
QWP2WRTH Write Threshold On Filled Buffers DGO1250 * * *
Table 55. System Parameters - Operator Functions Installation Parameters
Field Name Field Description Help PanelName
DB2 6.1 DB2 5.1 DB2 4.1
QWP1RLF Resource Limit Facility Automatic Start DGO1228 * * *
QWP1RLFN Resource Limit Spec. Table Error Action DGO1230 * * *
QWP1RLFT Resource Limit Specification Table Suffix DGO1231 * * *
QWP1SMRC WTO Route Codes DGO1236 * * *
QWP4ABN Allow Autobind Operations DGO1266 * * *
QWP4ABX Allow Explain At Autobind DGO1267 * * *
QWP4ENF DPROP Support DGO1404 * * *
QWP4SIT Site Type DGO1296 * * *
QWP9TCPA TCP/IP Already Verified DGO1761 * *
Table 56. System Parameters - Other System Parameters
Field Name Field Description Help PanelName
DB2 6.1 DB2 5.1 DB2 4.1
MZDBSTRT Databases and Table Spaces DGO1208 * * *
QWP1DFRQ Checkpoints Level ID Updates DGO1434 * * *
QWP2DBSD Dual BSDS Mode DGO1243 * * *
QWP4DSMX Maximum Open Data Sets (DSMAX) DGO1271 * * *
QWP4DSST Static describe (DESCSTAT) DGO1701 * *
QWP4ISWI IRLM Initial Inquiry by DB2 DGO1433 * * *
QWP4MDDN Asynchronous Drain Stop (%DSMAX) DGO1281 * * *
QWP4TDDN Asynchronous Drain Start (%DSMAX) DGO1298 * * *
QWP4WBMP IMS/BMP time-out factor (BMPTOUT) DGO1669 * * *
QWP4WDLI IMS/DLI time-out factor (DLITOUT) DGO1670 * * *
XWP4CDEG Current Degree (CDSSRDEF) DGO1859 *
Table 57. System Parameters - Protection Installation Parameters
Field Name Field Description Help PanelName
DB2 6.1 DB2 5.1 DB2 4.1
QWP1RLFA Resource Limit Table Creator Authid DGO1229 * * *
QWP3RTCT RACF Protect Archive Log DGO1262 * * *
QWP4ADM2 System Administrator 2 Authid DGO1268 * * *
QWP4AUCA Plan Authorization Cache Size DGO1428 * * *
QWP4AUTH DB2 Authorization Enabled DGO1269 * * *
QWP4BNVA Bind New Version DGO1430 * * *
QWP4DFID Default (unknown) User Authid DGO1270 * * *
QWP4OPR1 System Operator 1 Authid DGO1283 * * *
Field Table
270 DB2 PM Online Monitor User’s Guide

Table 57. System Parameters - Protection Installation Parameters (continued)
Field Name Field Description Help PanelName
DB2 6.1 DB2 5.1 DB2 4.1
QWP4OPR2 System Operator 2 Authid DGO1284 * * *
QWP4PAC Package Authorization Cache Size DGO1779 * *
QWP4SADM System Administrator 1 Authid DGO1294 * * *
Table 58. System Parameters - Storage Sizes Installation Parameters
Field Name Field Description Help PanelName
DB2 6.1 DB2 5.1 DB2 4.1
QWP1CDB Maximum Remote DGO1220 * * *
QWP1CT Maximum Concurrent Threads DGO1221 * * *
QWP1IDB Maximum Batch DGO1223 * * *
QWP1IDF Maximum TSO DGO1224 * * *
QWP1RMT Maximum Remote Active DGO1232 * * *
QWP4EDPL Maximum Size of EDM Pool DGO1272 * * *
QWP4IXTP Default Index Type DGO1546 * * *
QWP4MXKD Maximum Kept Dynamic Statements DGO1810 * *
QWP4PST Utility Cache Option DGO1766 * * *
QWP4RMAX Maximum Size of RID Pool DGO1396 * * *
QWP4SCAC 3990 Cache DGO1295 * * *
QWP4SPOL Maximum Size of Sort Pool DGO1297 * * *
Table 59. System Parameters - Stored Procedures Parameters
Field Name Field Description Help PanelName
DB2 6.1 DB2 5.1 DB2 4.1
QWP1SPAB Abends Allowed DGO1437 * * *
QWP1SPPN MVS Procedure Name DGO1436 * * *
QWP1SPTO Timeout Value DGO1438 * * *
Table 60. System Parameters - Tracing, Checkpoint and Pseudo-Close Parameters
Field Name Field Description Help PanelName
DB2 6.1 DB2 5.1 DB2 4.1
QWP1AUDT Start Audit Trace DGO1219 * * *
QWP1FREQ Pseudo-Close Frequency DGO1222 * * *
QWP1LOGL Checkpoint Frequency DGO1225 * * *
QWP1MON Start Monitor Trace DGO1226 * * *
QWP1MONS Monitor Buffer Size (bytes) DGO1227 * * *
QWP1SMFA Start SMF Accounting DGO1234 * * *
QWP1SMFS Start SMF Statistics Trace DGO1235 * * *
QWP1STIM Statistics Interval (minutes) DGO1237 * * *
QWP1TMR Pseudo-Close Timer DGO1238 * * *
QWP1TRST Start Global Trace DGO1239 * * *
QWP1TRSZ Trace Table Size (4KB multiple) DGO1240 * * *
QWP1URCK UR Check Frequency DGO1712 * *
Field Table
Appendix A. Online Monitor Field Table 271
End of Diagnosis, Modification, or Tuning Information
Field Table
272 DB2 PM Online Monitor User’s Guide

Appendix B. Exception Log File Output Record
Diagnosis, Modification, or Tuning Information
The table in this appendix outlines the format of the exception log file data setoutput record. Use these terms to interpret the table:
Offset Length from the beginning of the record to the start of the field.
LengthLength of the field, in bytes.
DB2 Data TypeThe format of the value in the field:v SMALLINTv INTEGERv CHARv TIMESTAMPv DOUBLE PRECISION
End of Diagnosis, Modification, or Tuning Information
Layout of the Exception Log File Output Record
Diagnosis, Modification, or Tuning Information
Table 61. Exception Log File Data Set
Offset(decimal)
Length(bytes) DB2 Data Type Description
N/A 2 SMALLINT Length of record (LL)
N/A 2 SMALLINT Binary zeros
0 1 CHAR Log record type:v F = Field-level exception recordv M = Exception message (Online Monitor
only).
1 1 CHAR Processing origin ID:
v B = Record written by batch exceptionprocessor
v S = Record written by online displayexception processor
v A = Record written by online periodicexception processor.
2 4 CHAR Per:v SYST = Systemv PROG = Programv PLAN = Plan name
6 16 CHAR Local location
22 2 CHAR Reserved
24 8 CHAR Primary authorization ID
32 8 CHAR Original authorization ID
40 8 CHAR Plan name
© Copyright IBM Corp. 1985, 1999 273
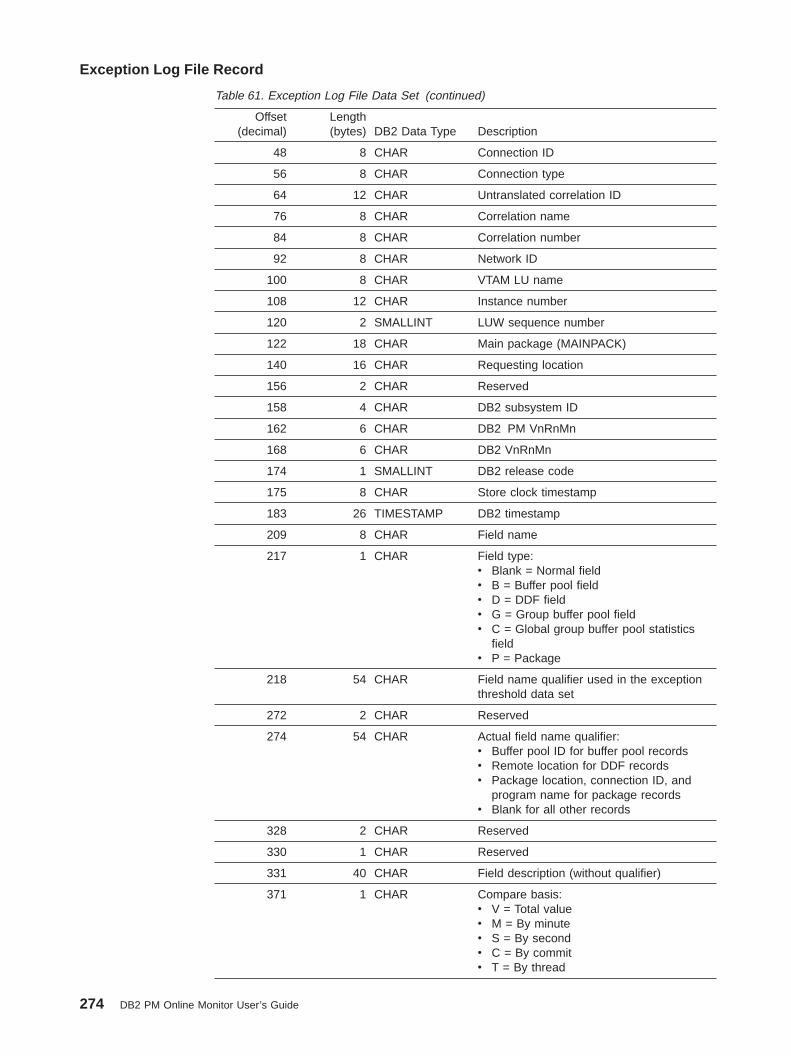
Table 61. Exception Log File Data Set (continued)
Offset(decimal)
Length(bytes) DB2 Data Type Description
48 8 CHAR Connection ID
56 8 CHAR Connection type
64 12 CHAR Untranslated correlation ID
76 8 CHAR Correlation name
84 8 CHAR Correlation number
92 8 CHAR Network ID
100 8 CHAR VTAM LU name
108 12 CHAR Instance number
120 2 SMALLINT LUW sequence number
122 18 CHAR Main package (MAINPACK)
140 16 CHAR Requesting location
156 2 CHAR Reserved
158 4 CHAR DB2 subsystem ID
162 6 CHAR DB2 PM VnRnMn
168 6 CHAR DB2 VnRnMn
174 1 SMALLINT DB2 release code
175 8 CHAR Store clock timestamp
183 26 TIMESTAMP DB2 timestamp
209 8 CHAR Field name
217 1 CHAR Field type:v Blank = Normal fieldv B = Buffer pool fieldv D = DDF fieldv G = Group buffer pool fieldv C = Global group buffer pool statistics
fieldv P = Package
218 54 CHAR Field name qualifier used in the exceptionthreshold data set
272 2 CHAR Reserved
274 54 CHAR Actual field name qualifier:v Buffer pool ID for buffer pool recordsv Remote location for DDF recordsv Package location, connection ID, and
program name for package recordsv Blank for all other records
328 2 CHAR Reserved
330 1 CHAR Reserved
331 40 CHAR Field description (without qualifier)
371 1 CHAR Compare basis:v V = Total valuev M = By minutev S = By secondv C = By commitv T = By thread
Exception Log File Record
274 DB2 PM Online Monitor User’s Guide
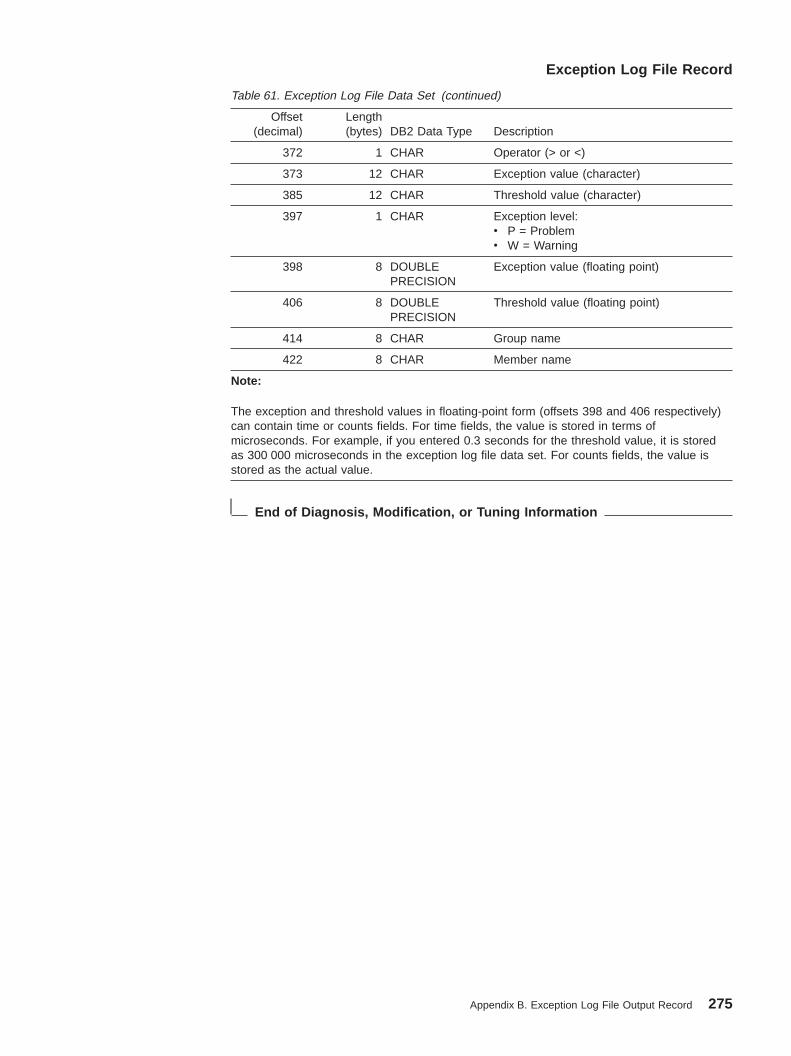
Table 61. Exception Log File Data Set (continued)
Offset(decimal)
Length(bytes) DB2 Data Type Description
372 1 CHAR Operator (> or <)
373 12 CHAR Exception value (character)
385 12 CHAR Threshold value (character)
397 1 CHAR Exception level:v P = Problemv W = Warning
398 8 DOUBLEPRECISION
Exception value (floating point)
406 8 DOUBLEPRECISION
Threshold value (floating point)
414 8 CHAR Group name
422 8 CHAR Member name
Note:
The exception and threshold values in floating-point form (offsets 398 and 406 respectively)can contain time or counts fields. For time fields, the value is stored in terms ofmicroseconds. For example, if you entered 0.3 seconds for the threshold value, it is storedas 300 000 microseconds in the exception log file data set. For counts fields, the value isstored as the actual value.
End of Diagnosis, Modification, or Tuning Information
Exception Log File Record
Appendix B. Exception Log File Output Record 275

Exception Log File Record
276 DB2 PM Online Monitor User’s Guide

Appendix C. Notices
This information was developed for products and services offered in the U.S.A. IBMmay not offer the products, services, or features discussed in this document in othercountries. Consult your local IBM representative for information on the products andservices currently available in your area. Any reference to an IBM product, program,or service is not intended to state or imply that only that IBM product, program, orservice may be used. Any functionally equivalent product, program, or service thatdoes not infringe any IBM intellectual property right may be used instead. However,it is the user’s responsibility to evaluate and verify the operation of any non-IBMproduct, program, or service.
IBM may have patents or pending patent applications covering subject matterdescribed in this document. The furnishing of this document does not give you anylicense to these patents. You can send license inquiries, in writing, to:
IBM Director of LicensingIBM CorporationNorth Castle DriveArmonk, NY 10504-1785U.S.A.
For license inquiries regarding double-byte (DBCS) information, contact the IBMIntellectual Property Department in your country or send inquiries, in writing, to:
IBM World Trade Asia CorporationLicensing2-31 Roppongi 3-chome, Minato-kuTokyo 106, Japan
The following paragraph does not apply to the United Kingdom or any othercountry where such provisions are inconsistent with local law:INTERNATIONAL BUSINESS MACHINES CORPORATION PROVIDES THISPUBLICATION “AS IS” WITHOUT WARRANTY OF ANY KIND, EITHER EXPRESSOR IMPLIED, INCLUDING, BUT NOT LIMITED TO, THE IMPLIED WARRANTIESOF NON-INFRINGEMENT, MERCHANTABILITY OR FITNESS FOR APARTICULAR PURPOSE. Some states do not allow disclaimer of express orimplied warranties in certain transactions, therefore, this statement may not apply toyou.
This information could include technical inaccuracies or typographical errors.Changes are periodically made to the information herein; these changes will beincorporated in new editions of the publication. IBM may make improvements and/orchanges in the product(s) and/or the program(s) described in this publication at anytime without notice.
Licensees of this program who wish to have information about it for the purpose ofenabling: (i) the exchange of information between independently created programsand other programs (including this one) and (ii) the mutual use of the informationwhich has been exchanged, should contact:
IBM DeutschlandInformationssysteme GmbHDepartment 3982Pascalstrasse 10070569 StuttgartGermany
© Copyright IBM Corp. 1985, 1999 277
Such information may be available, subject to appropriate terms and conditions,including in some cases, payment of a fee.
The licensed program described in this information and all licensed materialavailable for it are provided by IBM under terms of the IBM Customer Agreement,IBM International Program License Agreement, or any equivalent agreementbetween us.
Any performance data contained herein was determined in a controlledenvironment. Therefore, the results obtained in other operating environments mayvary significantly. Some measurements may have been made on development-levelsystems and there is no guarantee that these measurements will be the same ongenerally available systems. Furthermore, some measurement may have beenestimated through extrapolation. Actual results may vary. Users of this documentshould verify the applicable data for their specific environment.
Information concerning non-IBM products was obtained from the suppliers of thoseproducts, their published announcements or other publicly available sources. IBMhas not tested those products and cannot confirm the accuracy of performance,compatibility or any other claims related to non-IBM products. Questions on thecapabilities of non-IBM products should be addressed to the suppliers of thoseproducts.
This information contains examples of data and reports used in daily businessoperations. To illustrate them as completely as possible, the examples include thenames of individuals, companies, brands, and products. All of these names arefictitious and any similarity to the names and addresses used by an actual businessenterprise is entirely coincidental.
COPYRIGHT LICENSE:
This information contains sample application programs in source language, whichillustrates programming techniques on various operating platforms. You may copy,modify, and distribute these sample programs in any form without payment to IBM,for the purposes of developing, using, marketing or distributing application programsconforming to the application programming interface for the operating platform forwhich the sample programs are written. These examples have not been thoroughlytested under all conditions. IBM, therefore, cannot guarantee or imply reliability,serviceability, or function of these programs.
If you are viewing this information softcopy, the photographs and color illustrationsmay not appear.
Trademarks and Service Marks
The following terms are trademarks of the IBM Corporation in the United States orother countries or both:
C/370 CICSDATABASE 2 DB2DRDA IBMIMS MVSMVS/ESA OS/2OS/390 RACFRMF VTAM
278 DB2 PM Online Monitor User’s Guide

Microsoft, Windows, Windows NT, and the Windows logo are trademarks ofMicrosoft Corporation in the United States and/or other countries.
PC Direct is a trademark of Ziff Communications Company in the United Statesand/or other countries and is used by IBM Corporation under license.
UNIX is a registered trademark in the United States and/or other countries licensedexclusively through X/Open Company Limited.
C-bus is a trademark of Corollary, Inc. in the United States and/or other countries.
Java and all Java-based trademarks and logos are trademarks of SunMicrosystems, Inc. in the United States and/or other countries.
Other company, product or service names may be trademarks or service marks ofothers.
Appendix C. Notices 279

280 DB2 PM Online Monitor User’s Guide
Glossary
The following terms and abbreviations are definedas they pertain to DB2 PM. This glossary doesnot include terms defined in the prerequisite DB2manuals. If you do not find the term you arelooking for, refer to the index, to the glossary ofIBM DB2 Universal Database Server for OS/390Version 6 Administration Guide, or to the IBMDictionary of Computing, New York: McGraw-Hill,1994.
Aaccounting by DB2 PM identifier graphs. Graphsprovided by IRF graphics. The graphs show plotsrepresenting values of selected DB2 PM identifiers.
accounting by field identifier graphs. Graphsprovided by IRF graphics. The graphs show plotsrepresenting values of selected DB2 fields.
accounting data. Data that provides summaryinformation about DB2 resource use. Accounting data isused to summarize DB2 local and distributed activityassociated with the execution of specified applicationplans, detect potential problem areas within DB2, trackresource use on a regular basis, and identify DB2threads that fail to meet certain user-specified criteria.
accounting report set. A set of DB2 PM reportsproviding information about DB2 resource activityassociated with DB2 applications.
accounting trace data. DB2 trace data that providessummary information about DB2 resource use.
ACE. A DB2 PM identifier denoting agent controlelement address.
administrator user. A TSO user with the authority toaccess the administrator dialog panels, where datacollector parameters can be altered.
agent control element address (ACE). The absolutehexadecimal address of the DB2 agent control elementfor the thread. The ACE provides identification for eachthread, and can be used to select records for aparticular thread. Note that an ACE address can bereused after a thread terminates.
allied thread. A DB2 PM term for a thread thatoriginates and terminates at the same location withoutrequesting data from any other locations.
allied-distributed thread. A DB2 PM term for athread that originates and terminates at the samelocation and that requests data from at least one otherlocation.
audit report set. A set of DB2 PM reports thatprovide a means of tracking DB2 resource access. Theaudit reports include information on who performed anaudited action, when it was performed, and whatauditable DB2 objects were involved. The reports canbe used to track DB2 resource access, identify potentialsecurity breaches and violations, and track granting andrevoking of DB2 privileges.
audit trace data. DB2 trace data that identifiesresource users, persons issuing use authorization toothers, and possible security violations against auditedDB2 tables.
AUTHID. A DB2 PM identifier denoting authorizationID.
AUTO command. Used to refresh and redisplay thecurrent thread activity or statistics panel periodically.
auto display. A function that refreshes and redisplaysthe current thread activity or statistics panel periodically.
Bbackground processing. The execution of low-priorityjobs when higher-priority programs are not using thesystem resources. In TSO, a background job is enteredthrough the SUBMIT command or through SYSIN.Contrast with foreground processing.
BOUNDARY option. An option of the GLOBALcommand and the REDUCE subcommand that specifiesthe starting time of the intervals used to summarizerecords in the reduction process, by indicating a numberof minutes past the hour.
CCLASS. A DB2 PM identifier denoting trace class.
CODES option. An option of the DUMP andTAPECOPY commands used to define code values forrecords to be processed.
COLLECT command. Used to access the collectreport data facility.
collect report data. An option used to start one ormore DB2 traces, directing the resultant trace data to adata set.
collect task. A task that has been configured to startand stop DB2 traces for collecting specific DB2instrumentation data and directing this data to a dataset. Up to four independent collect tasks can beconfigured and started using the collect report datafacility.
© Copyright IBM Corp. 1985, 1999 281
CONNECT. See connection ID.
connection ID (CONNECT). A DB2 PM identifierderived from the connection ID of the correlationheader. This is the type of subsystem used to interfacewith DB2, such as CICS, TSO, or IMS.
connection type (CONNTYPE). An identifier showingthe type of connection for an associated thread.
CONNTYPE. See connection type.
CONVERT. A DB2 PM function to change SAVE datasets into sequential data sets suitable for use by theDB2 Load Utility. See also save-file utility.
correlation ID. An identifier consisting of two fields:the correlation name and the correlation number. It isused primarily by CICS and IMS. For some connectiontypes the correlation number is blank. DB2 PM defaultsto an 8-byte correlation name, followed by a 4-bytecorrelation number. You can specify a differenttranslation using the CORRDATA member of theDPMPARMS data set. See also correlation name,correlation number, and correlation translation.
correlation name (CORRNAME). An identifierassigned to a task. This value is a subset of thecorrelation ID. Its meaning varies with the connectiontype. See also correlation ID.
correlation number (CORRNMBR). An identifierassigned to a task. This field is a subset of thecorrelation ID. Its meaning varies with the connectiontype. See also correlation ID.
correlation translation. A DB2 PM function thatinterprets the information contained in the correlation ID.See correlation ID, correlation name, correlationnumber, and correlation translation data set.
correlation translation data set. A DB2 PM data setused to define and interpret the use of the correlation IDfor processing within DB2 PM reports and panels. Seealso correlation ID.
CORRNAME. See correlation ID.
CORRNMBR. See correlation ID.
DDATABASE. A DB2 PM identifier denoting the nameof the DB2 database.
database access thread (DBAT). A DB2 PM term fora thread that performs work at the request of anallied-distributed or DBAT-distributed thread originatingat another location.
database identifier (DBID). A decimal identifier of adatabase.
DATASET. A DB2 PM identifier consisting of the8-character name of the active log, the archive log, orthe bootstrap data set.
DBAT. A DB2 PM identifier denoting database accessthread.
DBAT-distributed. A DB2 PM term for a DBAT thatrequests work from another location.
DB2 instrumentation facility. A DB2 facility thatcontrols and collects DB2 monitoring, auditing,performance, accounting, statistics, and serviceability(global) data. Synonymous with DB2 trace facility.
DB2 location. The name assigned to the DB2subsystem. This name is unique within a set ofsubsystems that can communicate with each other. Seealso local location.
DB2 trace facility. Synonym for DB2 instrumentationfacility.
DB2ID. A DB2 PM identifier denoting DB2 subsystemID. Synonymous with SUBSYSTEMID.
DB2 PM command language. A set of commandsand subcommands used to control DB2 PM processing.
DB2 PM identifier. A DB2 PM term for an identifierthat specifies various attributes of the object upon whichDB2 PM is reporting. Used by DB2 PM to group data,order reports, and include or exclude specific data.
DB2 PM logs. Reports that provide summarizedinformation about events during DB2 PM execution.See exception log, message log, job summary log,IFCID frequency distribution log, and DPMLOG.
DDNAME option. An option specifying the DDNAMEof a data set. With REPORT and TRACEsubcommands, the option is used to specify the dataset where the report or trace is written; with the SAVEand FILE subcommands, it is used to specify thedestination data set to which the save data is written;with RESTORE, it is used to specify the data set fromwhich restored data is read.
DELTA command. Used to invoke delta processingmode for viewing system-wide statistics in time slices.
delta processing mode. A statistics processing modethat reports field values in time slices.
delta record. A data structure describing the activity ofa DB2 subsystem over a specific period of time.
delta value. A counter value found in a DB2 PMstatistics delta record representing activity in a DB2system over the time period described by the deltarecord.
282 DB2 PM Online Monitor User’s Guide
diagnostic view. A function used to analyze a thread’sperformance data, and to view an online diagnosis ofthe principal constraints acting on the thread.
display exception list. A list that contains a briefdescription of each exception condition that wasdetected by the display exception processor.
display exception processing. An Online Monitorsubtask used to check for exception conditions whileviewing DB2 activity on the screen.
DISTDD option. An option of the GLOBAL commandused to specify the DDNAME for the frequencydistribution data set.
DISTRIBUTE command. An auxiliary command usedto calculate frequency distributions for selected fields.The results can be viewed or printed using the graphicsfunction of the IRF.
DPMLOG. A DB2 PM log that contains messagesabout DB2 PM processing.
DPMOUT. The DB2 PM output data set. DB2 PMgenerates the output data using SMF or GTF data asinput. The DPMOUT data set contains data converted toa standardized format, sorted, and written to a formatthat can be used to create DB2 PM reports, traces, anddata sets.
DPMPARMS. A DB2 PM data set that containsinformation about customized functions.
Dump Name option. An option of the DUMPcommand used to specify a name to be printed on thedump.
DUMP processing. A DB2 PM function used toprovide a printout of an input data set in dump format.All records on the input data set, a selected range ofrecords, or specific record types can be used.
Eexception DPMOUT data set. A data set containingDB2 instrumentation records (in DPMOUT format) withat least one field in exception status. The data set canbe used as input to the Batch record trace or statisticstrace.
exception event processing. An Online Monitorsubtask used to monitor the DB2 subsystem for thepresence of particular events.
exception log. A log presenting a list that identifiesDB2 accounting and statistics records with at least onefield outside user-specified limits.
exception log file data set. A sequential data setsuitable for use by the DB2 load utility. The data set
contains a listing of accounting and statistics exceptionrecords identical to the listing in the exception log. Seeexception log.
exception processing. Reporting that provides ameans to identify DB2 threads and statistics intervalswith fields that contain exceptional values. It is used tohighlight problems in the DB2 subsystem and in threadscausing performance problems. Exception processing isperformed against accounting and statisticsinstrumentation data.
exception profiling. A DB2 PM function thatautomatically sets exception threshold values to theexception threshold data set. The values are based onuser-specified criteria and instrumentation data from aparticular DB2 site.
exception reports and traces. Reports and tracesthat are obtained using the EXCEPTION option of theaccounting or statistics REPORT or TRACEsubcommands. Exception reports and traces can havedifferent layouts. See also exception processing.
exception threshold data set. A data set used todefine exception thresholds for statistics and accountingfield IDs.
EXEC command. A command that instructs DB2 PMto execute the commands in a job stream.
EXEC option. An option of the DUMP andTAPECOPY commands used to define the DDNAME ofthe input data set.
EXPLAIN command. Used to invoke the explainfunction. Explain is a function that describes the accesspaths and processing methods chosen by DB2 for agiven SQL statement.
explain report set. A set of DB2 PM reportscontaining access path information and cataloginformation.
FFIELD. A DB2 PM identifier for a field in theinstrumentation record and comparison value, asdefined using the FIELD command.
FIELD command. An auxiliary command used tolocate exception conditions for individual DB2 records.The command can only be used with the record traceINCLUDE/EXCLUDE options.
FIELDID option. An option of the DISTRIBUTEcommand used to specify the keyword for the field.
FILE processing. A DB2 PM function used to formataccounting, audit, and statistics data and store it insequential data sets suitable for use with the DB2 loadutility.
Glossary 283
foreground. In TSO, the environment in whichprograms are swapped in and out of main storage sothat terminal users can share processing time. Contrastwith background.
frequency distribution data set. Distribution data setgenerated as a result of the DISTRIBUTE command.
frequency distribution graph. A graph provided bythe IRF graphics. It shows the distribution of a givenfield’s data over user-defined ranges.
FROM/TO option. An option that defines the range ofrecord timestamps processed by DB2 PM. FROMspecifies the starting date and time; TO specifies thefinishing date and time. The option can be used with theGLOBAL command and the REDUCE, REPORT,TRACE, and FILE subcommands.
GGLOBAL command. An auxiliary command used as aprimary filter for input records, and to specify defaultvalues for parameters within the other DB2 PMsubcommands.
global parameters function. Used to set the DB2subsystem ID and the plan name for an Online Monitorsession, specify output data sets, and establish defaultsfor the autodisplay function.
graphics processing. A capability provided byDB2 PM that allows creation of graphs representingstatistics, accounting, or frequency distributioninformation based on previously reduced data. Graphicsare part of the Interactive Report Facility.
GROUP. A DB2 PM identifier that specifies the nameof a Data Sharing Group.
GROUP command. An auxiliary command that can beused to specify up to ten values of one DB2 PMidentifier type.
Hhigh water mark. A status value found in a DB2 tracerecord representing the highest value of some aspect ofa DB2 system over a period starting when DB2 wasstarted and ending at the timestamp of the trace record.
HISTORY command. Used to recall and view threadactivity, statistics, and system parameters data (IFCrecords) previously collected by the data collector.
II/O activity report set. A set of DB2 PM reportsreflecting reads, writes, and other I/O activitiesperformed throughout the DB2 subsystem. The reportsare used to track I/O volumes and service times and to
summarize I/O activity for the active log, archive log,BSDS, the buffer pool manager, and the EDM poolmanager.
ICU. Interactive Chart Utility.
IDENTIFIERS option. An option of the DISTRIBUTEcommand used to specify the DB2 PM identifiers usedin collecting distribution data.
IFCID. A DB2 PM identifier denoting instrumentationfacility component identifier.
IFCID frequency distribution log. A DB2 logpresenting a count of input and processed records byIFCID, and the percentage of the total number of tracerecords that each IFCID represents.
INCLUDE/EXCLUDE option. An option used to selectrecords from an input data set. INCLUDE is used todefine a list of DB2 PM identifier values that areincluded in DB2 PM processing, and EXCLUDE todefine a list of DB2 PM identifier values that areexcluded from processing. The option is available withthe GLOBAL command and the REDUCE, REPORT,TRACE, and FILE subcommands.
INPUTDD option. An option of the GLOBAL commandused to specify the DDNAME of the input data set.
INSTANCE. A DB2 PM identifier that is part of theLUWID for distributed activity, and can be used tomatch the activity performed by DBATs,DBAT-distributed threads, and allied-distributed threads.
instance number. A DB2 PM identifier consisting of aunique number assigned to a thread involved indistributed activity. It is used to match anallied-distributed thread to its database access threads.
Interactive Chart Utility (ICU). A charting utility of thegraphical data display manager (GDDM).
Interactive Report Facility (IRF). A DB2 PM facilitythat allows request for reports through a set of menusand interactive panels. The IRF also creates andsubmits control statements for background generation ofDB2 PM reports.
INTERVAL command. Used to invoke Interval modefor viewing an accumulation of statistics data from aspecified time.
INTERVAL identifier. A DB2 PM identifier used inaccounting and statistics report sets to order dataaccording to the reduction intervals.
INTERVAL option. An option of the GLOBALcommand and the REDUCE subcommand that definesthe time interval for consolidating records.
interval processing mode. The statistics processingmode that displays an accumulation of statistics datafrom a specified time.
284 DB2 PM Online Monitor User’s Guide
IRF. Interactive Report Facility.
Jjob summary log. A DB2 PM log providing asummary of events during DB2 PM execution. Itprovides information about the detection of DB2START/STOP commands, report set reduction intervalcompletion, SAVE and RESTORE subcommandcompletion by report set, and major errors andmessages.
LLAYOUT option. An option of the accounting andstatistics REPORT and TRACE subcommands used tospecify the layout of the report and the amount of detail.
LEVEL option. An option of the REPORT, TRACE,and FILE subcommands used to specify the type ofreport or trace, and the amount of detail.
LIMITS option. An option of the DISTRIBUTEcommand used to specify the limits of the ten ranges forfrequency distribution.
LIST command. An auxiliary command used to definea named list of DB2 PM identifier values. A list cancontain up to ten members of one DB2 PM identifiertype.
local location. The location that is the focus of thereport (the location indicated in the report header). Seealso LOCATION.
LOCATION. A DB2 PM identifier denoting the nameassigned to a subsystem. See also local location.
locking report set. A set of DB2 PM reports andtraces providing lock suspension, lock timeout, anddeadlock information.
lockout. DB2 PM uses this term as an aggregatename for both timeout and deadlock.
LOOK command. Used to invoke the Look Selectionsmenu, or to select certain exception processing andtrace facility functions.
MMAINPACK. A DB2 PM identifier used to identify thefirst or last package or DBRM in a plan. MAINPACK isused in the accounting report set.
MAXDUMP option. An option of the DUMP commandused to define the length of dump in bytes.
MEMBER. A DB2 PM identifier that specifies thename of a member in a Data Sharing Group.
merged report. Reports and traces that include, in thesame report, the local and distributed activity associatedwith each thread. Information is provided for alliedthreads created at the local site, allied-distributedthreads created at the local site, and DBATs performedremotely on behalf of allied-distributed threads createdat the local site. Merged reports are available in theaccounting and SQL activity report sets.
message log. A DB2 PM log that lists messagesabout DB2 PM internal sort.
MIGRATE. A DB2 PM function to change SAVE datasets produced by previous releases into the currentrelease format. See also save-file utility.
monitor data. DB2 trace data that provides thread,statistical, and performance DB2 data to the OnlineMonitor component of DB2 PM.
multi-site report. Report or trace that contains datafrom multiple DB2 locations. Multi-site reports can benondistributed (when no interaction takes place betweenthe DB2 subsystems reported) or distributed (wheninteraction occurs between DB2 subsystems). Multi-sitereports are the default in all report sets. See alsosingle-site report.
NN/A. Not applicable.
N/C. Not calculated.
N/P. Not present.
NAME option. An option of the TAPECOPY commandused to define a name identifying the records copied.
NEWCOPY option. An option of the TAPECOPYcommand used to define the DDNAME of the outputdata set.
nonmerged report. Reports and traces that separateactivity according to the location where the activityoccurred. All threads performed at each location arereported together.
OOFFSET option. An option of the DUMP andTAPECOPY commands used to define the offset of therecord code.
Online Monitor. The online monitoring part ofDB2 PM used to monitor an active DB2 subsystem.
OPTIONS command. This command can either beused from an Online Monitor panel to set variousoptions controlling the environment of your IRF session,
Glossary 285

or from the source explain SQL Statement Selectionwindow to change various source explain processingoptions.
ORDER option. An option of the REPORT andTRACE subcommands. ORDER is used to specify theDB2 PM identifiers and their sequence, in sortingreported information.
ORIGAUTH. A DB2 PM identifier denoting originalauthorization ID.
original authorization ID (ORIGAUTH). A DB2 PMidentifier consisting of the original value of the PrimaryAuthorization ID when a thread was created (before itcould be changed by any authorization exits).
PPACKAGE. A DB2 PM identifier used to identify apackage, regardless of the plan it belongs to.PACKAGE is used in the accounting report set.
PAGESET. A DB2 PM identifier denoting the name ofa page set. A page set consists of a collection of tablesor an index.
PAGESIZE option. An option of the GLOBALcommand used to specify the number of printed linesper page.
performance trace data. DB2 trace data aboutvarious subsystem events that are used for program,resource, user, and subsystem-related tuning.
periodic exception list. A list that contains a briefdescription of each exception condition that wasdetected by the periodic exception processor.
periodic exception processing. An Online Monitorsubtask that gathers DB2 thread activity and statisticsinformation at user-specified intervals and analyzes thedata for exception conditions.
PLANNAME. A DB2 PM identifier denoting planname.
PRESORTED option. An option of the GLOBALcommand used to specify whether DB2 PM internal sortis used.
PRIMAUTH. A DB2 PM identifier denoting primaryauthorization ID.
QQUALIFY command. Used to filter the threads listedon the Thread Summary panel.
Rrecord trace report set. Reports that format eachDB2 trace record selected. This report set can be usedto format a subset of data obtained from DB2 statistics,accounting, or performance trace information. Thereports also provide access to users who need to viewDB2 serviceability fields.
REDUCE processing. A DB2 PM function used todecrease the volume of the input data to subsequentREPORT and SAVE processing. REDUCE consolidatesindividual records with certain common characteristicsinto one record for reporting purposes.
regular mode. Statistics processing mode thatdisplays values accumulated since DB2 startup.
REINIT command. A command used to restart theException Processor using the latest values in theException Threshold data set.
remote location. A location requesting or providingdata for the local location.
report. A listing that uses summarized data. In reportsevents are ordered by DB2 PM identifiers, such asauthorization ID or plan name.
report set. One or more DB2 PM reports containingthe same information in varying degrees of detail.Report set names indicate the nature of the informationincluded. For example, the statistics report setaddresses DB2 system-wide data and the I/O activityreport set addresses I/O activity.
REQLOC. A DB2 PM identifier denoting requestinglocation.
request type (REQUESTTYPE). A DB2 PM identifierused to identify a locking-related request.
requesting location (REQLOC). If the thread is anallied thread or the thread is an allied-distributed thread(this location is the requester), the requesting location isthe same as the local location. If the thread is adatabase access thread (this location is a server), therequesting location is the location that made therequest.
REQUESTTYPE. A DB2 PM identifier denotingrequest type.
RESET command. Used to reset the QUALIFY,SORT, DELTA, and INTERVAL commands.
resource manager ID (RMID). The decimal identifierof a DB2 Resource Manager.
resource type (RESOURCETYPE). A DB2 PMidentifier used to identify a locked resource.
286 DB2 PM Online Monitor User’s Guide

RESOURCETYPE. A DB2 PM identifier denotingresource type.
RESTORE processing. A DB2 PM function used toreload a previously saved data set for additionalprocessing. To restore reduced data, DB2 PM takes thesaved, reduced data out of the external data sets. Next,DB2 PM places that data in main storage in the samereduced format as it was before it was saved. It ispossible to restore previously reduced data,subsequently reduce new raw data, and use both forreporting or additional saving.
RID list. Record identifier list.
RMID. A DB2 PM identifier denoting resourcemanager ID.
SSAVE processing. A DB2 PM function used toproduce a data set containing reduced records. To savereduced data, DB2 PM copies the reduced data frommain storage to external data sets. Save is available inaccounting and statistics.
save-file utility. A utility which consists of theMIGRATE and CONVERT functions: to migrate savedata sets from one DB2 PM version to another(MIGRATE) and to change SAVE data sets intosequential data sets suitable for use by the DB2 loadutility (CONVERT). The save-file utility is used only withaccounting and statistics save data sets.
serving location. The name of a DB2 location thatperforms work on behalf of another (requesting)location. See also LOCATION.
single-site report. A single-site report includes datafrom a single DB2 subsystem only. It is obtained byprocessing an input data set containing data from asingle site or by specifying a single location usingINCLUDE/EXCLUDE. See also multi-site report.
SKIP option. An option of the DUMP and TAPECOPYcommands used to define the number of records to beskipped before processing begins.
snapshot. A status value found in a DB2 trace recordrepresenting the status of some aspect of a DB2system. Snapshot values are also found in DB2 PMstatistics delta records. In this case they represent thestatus of the DB2 system current at the end time of theperiod described by the delta record.
SORT command. Used to order the threads displayedon the Thread detail panel by one or more field values.
SORTBY. An option of the SQL activity REPORT andTRACE subcommands used to sort SQL events withineach summary level.
source explain. A facility used to explain SQLstatements that are embedded in a source program orSPUFI input from within an ISPF/PDF editor.
SQL activity report set. A set of reports that providesinformation on SQL activity taking place during theprocessing of a DB2 application. The reports are usedto analyze SQL calls within a logical unit of work,analyze the access path selected by the DB2 optimizerfor local SQL calls, observe the local Data Managerscans, locking activity, and Buffer Manager I/O activitytaking place during the execution of SQL requests, andgroup SQL activities by logical units of work.
statistics graph. A graph provided by the IRFgraphics. It shows plots representing values of collectedstatistics data.
statistics processing. A function of DB2 PM thatprovides information about the current activity over theentire DB2 subsystem. The data is logged at intervals,specified at DB2 installation. The panels are used toview system-wide statistics for key DB2 componentsand assess system-wide performance. Details of DB2statistics fields, buffer pools, and distributed activity canalso be viewed. See also exception processing.
statistics report set. A report set that providesinformation collected by the DB2 Instrumentation Facilityover the entire DB2 subsystem. The data is logged atintervals specified at DB2 installation. The reports areused to view system-wide statistics for key DB2components, compare system performance in severalreporting intervals, and assess system-wideperformance and summarize it in one report. See alsoexception processing.
statistics trace data. DB2 data used for DB2 capacityplanning and tuning the entire set of DB2 programs.
STOPAFT option. An option of the DUMP andTAPECOPY commands used to define the number ofrecords to be processed, starting after the number ofrecords to be skipped. See also SKIP option.
SUBSYSTEMID. A DB2 PM identifier denoting DB2subsystem ID. Synonymous with DB2ID.
SUMMARIZEBY. An option of the SQL activityREPORT and TRACE subcommands used tosummarize SQL events.
SYSPRMDD option. An option of the GLOBALcommand used to specify the DDNAME for the Systemparameters report. See also system parameters reportset.
system parameters. An option that displays thecurrent DSNZPARM values of a DB2 subsystem. Itdisplays user-assigned control values of key DB2installation values.
Glossary 287
system parameters report set. A report set thatshows current values of key DB2 installation values. Itshows user-assigned control values of key DB2installation values. See also SYSPRMDD option.
TTAPECOPY processing. A DB2 PM function used tomake a copy of all or part of an SMF input data set.
thread activity. A function that provides informationabout the current activity of all active threads connectedto a DB2 subsystem.
thread type (THREADTYPE). A DB2 PM identifierused to identify the type of thread.
THREADTYPE. A DB2 PM identifier denoting threadtype.
time zone information member. A member of theDPMPARMS data set that contains user-specifiedinformation about time zone processing.
timestamp. A value that consists of a date, a time,and a number of microseconds.
TIMEZONE option. An option of the GLOBALcommand used to specify the time difference betweenDB2 locations.
TOP option. An option in the accounting report setthat can be used to produce a list of applications orusers that have required most use of specific DB2resources.
trace. A listing that uses unreduced data and usuallyreports individual records. A trace generally producesoutput in a short or long format; these are similar to thereport summary and detail levels.
UUNITS option. An option of the DISTRIBUTEcommand used to specify the units for the LIMITSoption. See also LIMITS option.
user-tailored reporting. A DB2 PM function thatallows the users to tailor accounting and statistics reportand trace layouts. The tailoring is performed using theIRF.
utility activity report set. A set of DB2 PM reportsproviding DB2 application work information categorizedas bind processing and utilities. These reports are usedto determine workload distribution for local anddistributed activity and to associate DB2 work withindividual users or DB2 PM identifiers.
WWORKLOAD. An option of the SQL activity REPORTand TRACE subcommands used to display workloaddetail for SQL events.
288 DB2 PM Online Monitor User’s Guide

BibliographyIBM DB2 Performance Monitor for OS/390 Version 6 Report ReferenceVolume 1, SC26-9164
IBM DB2 Performance Monitor for OS/390 Version 6 Report ReferenceVolume 2, SC26-9165
IBM DB2 Performance Monitor for OS/390 Version 6 Online Monitor User’sGuide, SC26-9168
IBM DB2 Performance Monitor for OS/390 Version 6 Batch User’s Guide,SC26-9167
IBM DB2 Performance Monitor for OS/390 Version 6 Command Reference,SC26-9166
IBM DB2 Performance Monitor for OS/390 Version 6 Messages, SC26-9169
IBM DB2 Performance Monitor for OS/390 Version 6 Using the WorkstationOnline Monitor, SC26-9170
IBM DB2 Performance Monitor for OS/390 Version 6 Installation andCustomization, SC26-9171
IBM DB2 Performance Monitor for OS/390 Version 6 General Information,GC26-9172
Program Directory for IBM DB2 UDB Server for OS/390 DB2 PerformanceMonitor DB2 Workstation Analysis and Tuning Version 6, GI10-8183
IBM DB2 Universal Database Server for OS/390 Version 6 Administration Guide,SC26-9003
IBM DB2 Universal Database Server for OS/390 Version 6 CommandReference, SC26-9006
IBM DB2 Universal Database Server for OS/390 Version 6 SQL Reference,SC26-9014
IBM DB2 Universal Database Server for OS/390 Version 6 ApplicationProgramming and SQL Guide, SC26-9004
IBM DB2 Universal Database Server for OS/390 Version 6 Data Sharing:Planning and Administration, SC26-9007
IBM DB2 Universal Database Server for OS/390 Version 6 Installation Guide,GC26-9008
IBM DB2 Universal Database Server for OS/390 Version 6 Utility Guide andReference, SC26-9015
IBM DB2 Universal Database Server for OS/390 Version 6 Diagnosis Guide andReference, LY36-3736
IBM DB2 Universal Database Server for OS/390 Version 6 Messages andCodes, GC26-9011
DSFSMS/MVS Macro Instructions for Data Sets, SC26-4913
OS/390 MVS System Management Facilities (SMF), GC28-1783
DFSMS/MVS Access Method Services for ICF, SC26-4906
DFSMS/MVS Access Method Services for VSAM, SC26-4905
OS/390 MVS Initialization and Tuning Guide, SC28-1751
OS/390 MVS System Codes, GC28-1780
OS/390 MVS Programming: Authorized Assembler Services Guide, GC28-1763
OS/390 MVS Programming: Authorized Assembler Services Reference,GC28-1764 to GC28-1767
OS/390 MVS Writing Transaction Programs for APPC/MVS, GC28-1775
© Copyright IBM Corp. 1985, 1999 289
OS/390 ISPF Dialog Developer’s Guide and Reference, SC28-1273
OS/390 ISPF Services Guide, SC28-1272
OS/390 TSO/E Messages, GC28-1978
VTAM for MVS/ESA Resource Definition Reference, SC31-6552
OS/390 TSO/E REXX Reference, SC28-1975
TCP/IP for MVS: Application Programming Interface Reference, SC31-7187
TCP/IP Tutorial and Technical Overview, GG24-3376
ITSC - A Beginner’s Guide to MVS TCP/IP Socket Programming, GG24-2561
Graphic Data Display Manager/Presentation Graphics Feature: Interactive ChartFacility User’s Guide, SC33-0111
IBM Dictionary of Computing, New York: McGraw-Hill, 1994
Bibliography
290 DB2 PM Online Monitor User’s Guide
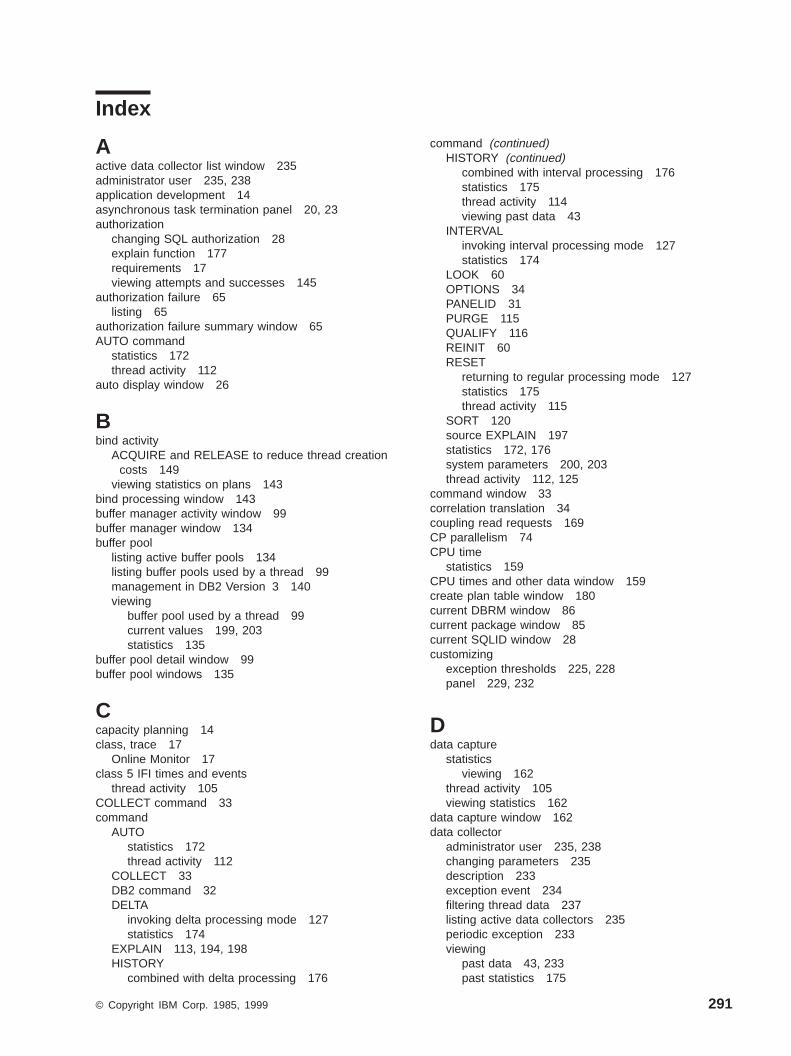
Index
Aactive data collector list window 235administrator user 235, 238application development 14asynchronous task termination panel 20, 23authorization
changing SQL authorization 28explain function 177requirements 17viewing attempts and successes 145
authorization failure 65listing 65
authorization failure summary window 65AUTO command
statistics 172thread activity 112
auto display window 26
Bbind activity
ACQUIRE and RELEASE to reduce thread creationcosts 149
viewing statistics on plans 143bind processing window 143buffer manager activity window 99buffer manager window 134buffer pool
listing active buffer pools 134listing buffer pools used by a thread 99management in DB2 Version 3 140viewing
buffer pool used by a thread 99current values 199, 203statistics 135
buffer pool detail window 99buffer pool windows 135
Ccapacity planning 14class, trace 17
Online Monitor 17class 5 IFI times and events
thread activity 105COLLECT command 33command
AUTOstatistics 172thread activity 112
COLLECT 33DB2 command 32DELTA
invoking delta processing mode 127statistics 174
EXPLAIN 113, 194, 198HISTORY
combined with delta processing 176
command (continued)HISTORY (continued)
combined with interval processing 176statistics 175thread activity 114viewing past data 43
INTERVALinvoking interval processing mode 127statistics 174
LOOK 60OPTIONS 34PANELID 31PURGE 115QUALIFY 116REINIT 60RESET
returning to regular processing mode 127statistics 175thread activity 115
SORT 120source EXPLAIN 197statistics 172, 176system parameters 200, 203thread activity 112, 125
command window 33correlation translation 34coupling read requests 169CP parallelism 74CPU time
statistics 159CPU times and other data window 159create plan table window 180current DBRM window 86current package window 85current SQLID window 28customizing
exception thresholds 225, 228panel 229, 232
Ddata capture
statisticsviewing 162
thread activity 105viewing statistics 162
data capture window 162data collector
administrator user 235, 238changing parameters 235description 233exception event 234filtering thread data 237listing active data collectors 235periodic exception 233viewing
past data 43, 233past statistics 175
© Copyright IBM Corp. 1985, 1999 291
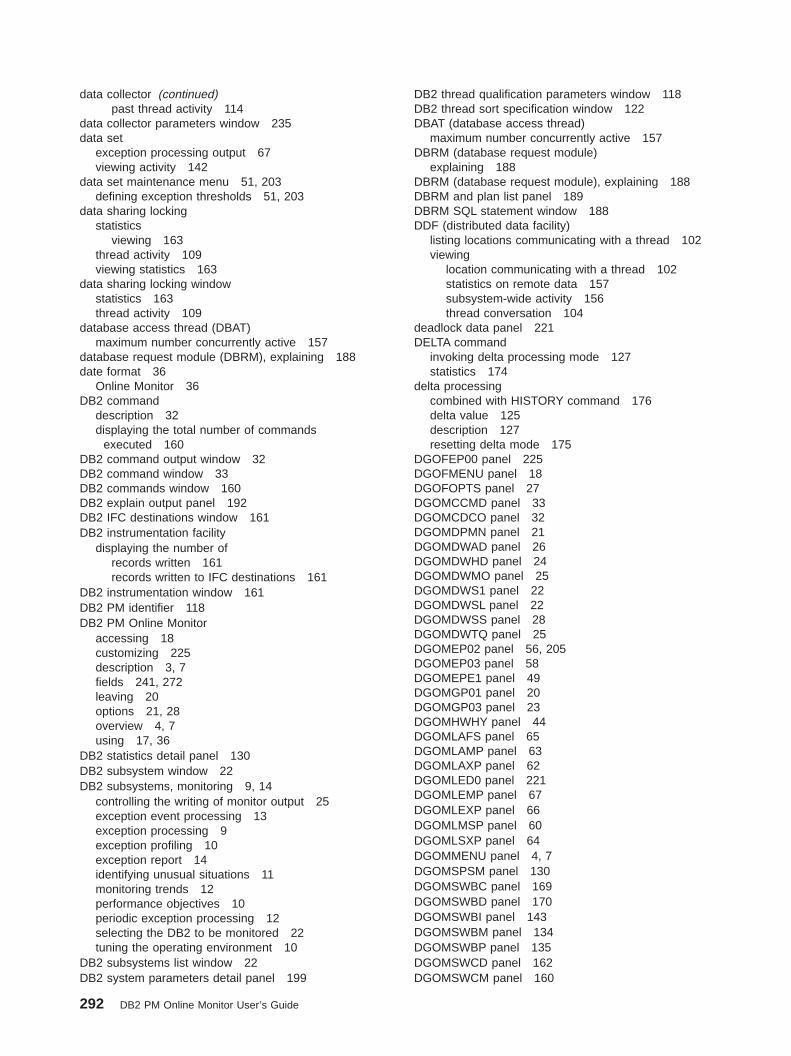
data collector (continued)past thread activity 114
data collector parameters window 235data set
exception processing output 67viewing activity 142
data set maintenance menu 51, 203defining exception thresholds 51, 203
data sharing lockingstatistics
viewing 163thread activity 109viewing statistics 163
data sharing locking windowstatistics 163thread activity 109
database access thread (DBAT)maximum number concurrently active 157
database request module (DBRM), explaining 188date format 36
Online Monitor 36DB2 command
description 32displaying the total number of commands
executed 160DB2 command output window 32DB2 command window 33DB2 commands window 160DB2 explain output panel 192DB2 IFC destinations window 161DB2 instrumentation facility
displaying the number ofrecords written 161records written to IFC destinations 161
DB2 instrumentation window 161DB2 PM identifier 118DB2 PM Online Monitor
accessing 18customizing 225description 3, 7fields 241, 272leaving 20options 21, 28overview 4, 7using 17, 36
DB2 statistics detail panel 130DB2 subsystem window 22DB2 subsystems, monitoring 9, 14
controlling the writing of monitor output 25exception event processing 13exception processing 9exception profiling 10exception report 14identifying unusual situations 11monitoring trends 12performance objectives 10periodic exception processing 12selecting the DB2 to be monitored 22tuning the operating environment 10
DB2 subsystems list window 22DB2 system parameters detail panel 199
DB2 thread qualification parameters window 118DB2 thread sort specification window 122DBAT (database access thread)
maximum number concurrently active 157DBRM (database request module)
explaining 188DBRM (database request module), explaining 188DBRM and plan list panel 189DBRM SQL statement window 188DDF (distributed data facility)
listing locations communicating with a thread 102viewing
location communicating with a thread 102statistics on remote data 157subsystem-wide activity 156thread conversation 104
deadlock data panel 221DELTA command
invoking delta processing mode 127statistics 174
delta processingcombined with HISTORY command 176delta value 125description 127resetting delta mode 175
DGOFEP00 panel 225DGOFMENU panel 18DGOFOPTS panel 27DGOMCCMD panel 33DGOMCDCO panel 32DGOMDPMN panel 21DGOMDWAD panel 26DGOMDWHD panel 24DGOMDWMO panel 25DGOMDWS1 panel 22DGOMDWSL panel 22DGOMDWSS panel 28DGOMDWTQ panel 25DGOMEP02 panel 56, 205DGOMEP03 panel 58DGOMEPE1 panel 49DGOMGP01 panel 20DGOMGP03 panel 23DGOMHWHY panel 44DGOMLAFS panel 65DGOMLAMP panel 63DGOMLAXP panel 62DGOMLED0 panel 221DGOMLEMP panel 67DGOMLEXP panel 66DGOMLMSP panel 60DGOMLSXP panel 64DGOMMENU panel 4, 7DGOMSPSM panel 130DGOMSWBC panel 169DGOMSWBD panel 170DGOMSWBI panel 143DGOMSWBM panel 134DGOMSWBP panel 135DGOMSWCD panel 162DGOMSWCM panel 160
292 DB2 PM Online Monitor User’s Guide

DGOMSWDD panel 156DGOMSWEP panel 133DGOMSWGB panel 166DGOMSWGD panel 166DGOMSWIF panel 161DGOMSWIN panel 161DGOMSWLG panel 145DGOMSWLK panel 140DGOMSWOC panel 142DGOMSWOT panel 159DGOMSWPD panel 152DGOMSWQP panel 153DGOMSWRL panel 157DGOMSWRP panel 155DGOMSWSL panel 163DGOMSWSP panel 172DGOMSWSQ panel 150DGOMSWSS panel 147DGOMSWSV panel 145DGOMTCPR panel 116DGOMTPLS panel 76, 215DGOMTPSM panel 79
customizing 230DGOMTWBD panel 99DGOMTWBM panel 99DGOMTWCD panel 105DGOMTWCS panel 101DGOMTWDB panel 86DGOMTWDC panel 104DGOMTWDD panel 102DGOMTWDL panel 102DGOMTWGB panel 110DGOMTWGD panel 110DGOMTWID panel 82DGOMTWLD panel 93DGOMTWLK panel 90DGOMTWMV panel 83DGOMTWPK panel 85DGOMTWQ5 panel 118DGOMTWQP panel 106DGOMTWR panel 94DGOMTWRP panel 95DGOMTWSL panel 109DGOMTWSP panel 112DGOMTWSQ panel 96DGOMTWSS panel 122DGOMTWTI panel 88DGOMXPE panel 49DGOMYPKM panel 192DGOMYPMN panel 183DGOMYWDL panel 189DGOMYWDQ panel 189DGOMYWDS panel 188DGOMYWES panel 190DGOMYWII panel 212DGOMYWKQ panel 187DGOMYWKS panel 186DGOMYWKV panel 187DGOMYWPE panel 184DGOMYWPL panel 185DGOMYWQC panel 180
DGOMYWQU panel 181DGOMYWSO panel 195DGOMYWSS panel 197DGOMYWTI panel 211DGOMZPSM panel 199DGOPMENU panel
defining exception thresholds 51, 203DGOPXDS1 panel 52DGOPXDS2 panel 53DGOPXDSB panel 54DGOVADCL panel 235DGOVDCHQ panel 237DGOVDCPA panel 235display exception list window 64display exception processing
description 47starting 59viewing exceptions 64
distributed conversation detail window 104distributed data window
statistics 156thread activity 102
distributed location detail window 102DPMOUT data set
exception processing 68specifying exception processor name 58
DPMPARMS data sethistory defaults 24
drain request, viewing number of 142DSNZPARM value
viewing 199, 203viewing summary 199
EEDM pool window 133elapsed time format
Online Monitor 36errors 37exception event messages window 67exception event processing 13
data collector 234description 48listing messages 67performance problem determination 13starting 59viewing events 66
exception event summary window 66exception field
editing 231exception field, editing 231exception log file data set
description 67output record layout 273, 275printing 68sample files 68specifying processor name 58
exception log file print utility 68exception notification window 49exception output data sets window 58exception processing 47, 69
Index 293

exception processing 47, 69 (continued)activating and deactivating 56, 205description 47difference between Online Monitor and batch
processing 50display exception
description 47starting 59viewing 64
exception event 13data collector 234description 48performance problem determination 13starting 59viewing 66
modes 47output data set 67performance problem identification 9
example 203periodic exception 12
data collector 233description 48listing messages 63performance problem identification 12starting 59viewing 62
restarting 59starting 56, 59stopping 69viewing messages and status 60, 67viewing past data 49
exception processor panel 56, 205exception profiling 225, 228
input data 227method 226performance problem identification 10report example 227
exception profiling panel 225exception report
monitoring 14exception threshold
defining 50, 55, 225, 228matching record against entry 55selecting category 52selecting fields within a category 53specifying threshold criteria 54
exception threshold category selection panel 52exception threshold field details panel 54exception threshold field selection panel 53explain 177, 198
accessing 182authorization 177DBRM 188description 177method 181output 192package 186performance considerations 178, 180PLAN_TABLE considerations 180plan table entry 184process overview 182
explain 177, 198 (continued)source explain 194, 198specifying the SQL statement 190SQL statement 181viewing access path method 192
EXPLAIN command 113, 194, 198source EXPLAIN 197thread activity 113
explain menu 183
Ffield description 241, 272
Online Monitor 241, 272filtering input 11function key
commands to change the defaults 31defaults 29
Gglobal group buffer pool
coupling read requests 169, 170statistics detail window 170statistics window 169
group buffer poollisting pools used by a thread 110listing pools used by DB2 166viewing
group buffer pool used by a thread 110pool used by a DB2 166statistics on backing coupling activity 170
group buffer pool detail windowstatistics 166thread activity 110
group buffer pools activity windowstatistics 166thread activity 110
Hhelp facility
description 29high-water mark fields 129high-water mark value 125history
data collector 233exception processing 49filtering thread data 237listing settings 25viewing 43
current parameters 24past data 43past statistics 175thread history 114
HISTORY commanddelta processing mode 176interval processing mode 176statistics 175thread activity 114
history defaults window 24
294 DB2 PM Online Monitor User’s Guide
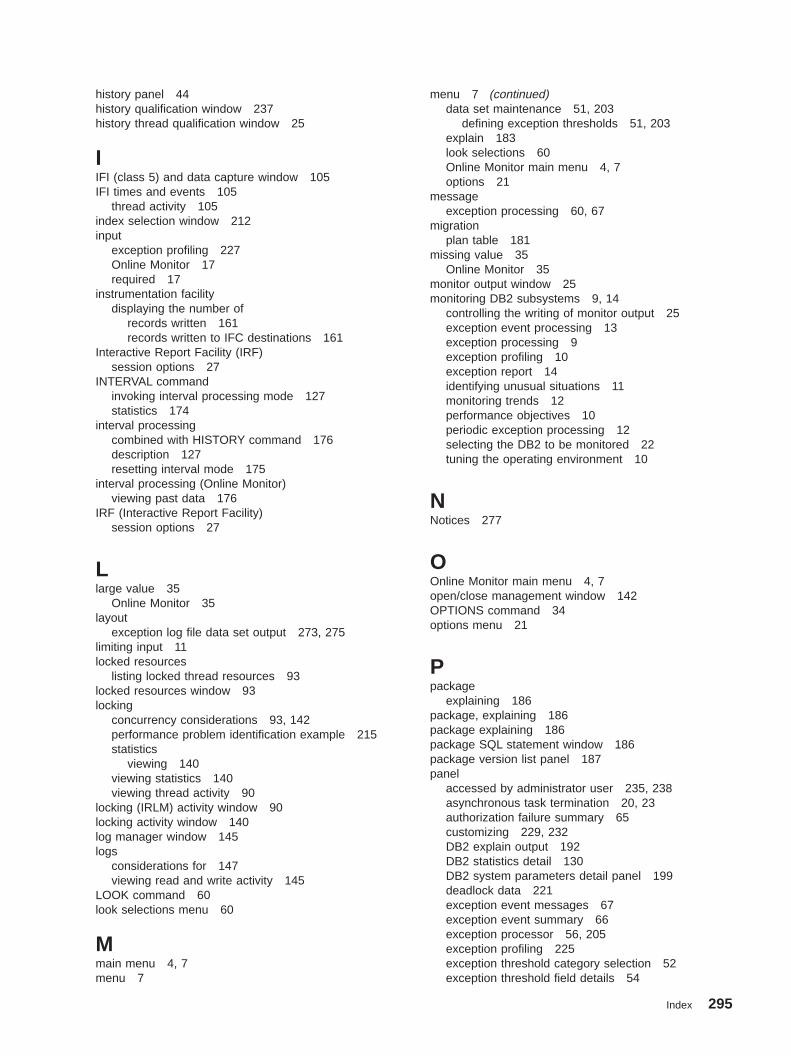
history panel 44history qualification window 237history thread qualification window 25
IIFI (class 5) and data capture window 105IFI times and events 105
thread activity 105index selection window 212input
exception profiling 227Online Monitor 17required 17
instrumentation facilitydisplaying the number of
records written 161records written to IFC destinations 161
Interactive Report Facility (IRF)session options 27
INTERVAL commandinvoking interval processing mode 127statistics 174
interval processingcombined with HISTORY command 176description 127resetting interval mode 175
interval processing (Online Monitor)viewing past data 176
IRF (Interactive Report Facility)session options 27
Llarge value 35
Online Monitor 35layout
exception log file data set output 273, 275limiting input 11locked resources
listing locked thread resources 93locked resources window 93locking
concurrency considerations 93, 142performance problem identification example 215statistics
viewing 140viewing statistics 140viewing thread activity 90
locking (IRLM) activity window 90locking activity window 140log manager window 145logs
considerations for 147viewing read and write activity 145
LOOK command 60look selections menu 60
Mmain menu 4, 7menu 7
menu 7 (continued)data set maintenance 51, 203
defining exception thresholds 51, 203explain 183look selections 60Online Monitor main menu 4, 7options 21
messageexception processing 60, 67
migrationplan table 181
missing value 35Online Monitor 35
monitor output window 25monitoring DB2 subsystems 9, 14
controlling the writing of monitor output 25exception event processing 13exception processing 9exception profiling 10exception report 14identifying unusual situations 11monitoring trends 12performance objectives 10periodic exception processing 12selecting the DB2 to be monitored 22tuning the operating environment 10
NNotices 277
OOnline Monitor main menu 4, 7open/close management window 142OPTIONS command 34options menu 21
Ppackage
explaining 186package, explaining 186package explaining 186package SQL statement window 186package version list panel 187panel
accessed by administrator user 235, 238asynchronous task termination 20, 23authorization failure summary 65customizing 229, 232DB2 explain output 192DB2 statistics detail 130DB2 system parameters detail panel 199deadlock data 221exception event messages 67exception event summary 66exception processor 56, 205exception profiling 225exception threshold category selection 52exception threshold field details 54
Index 295
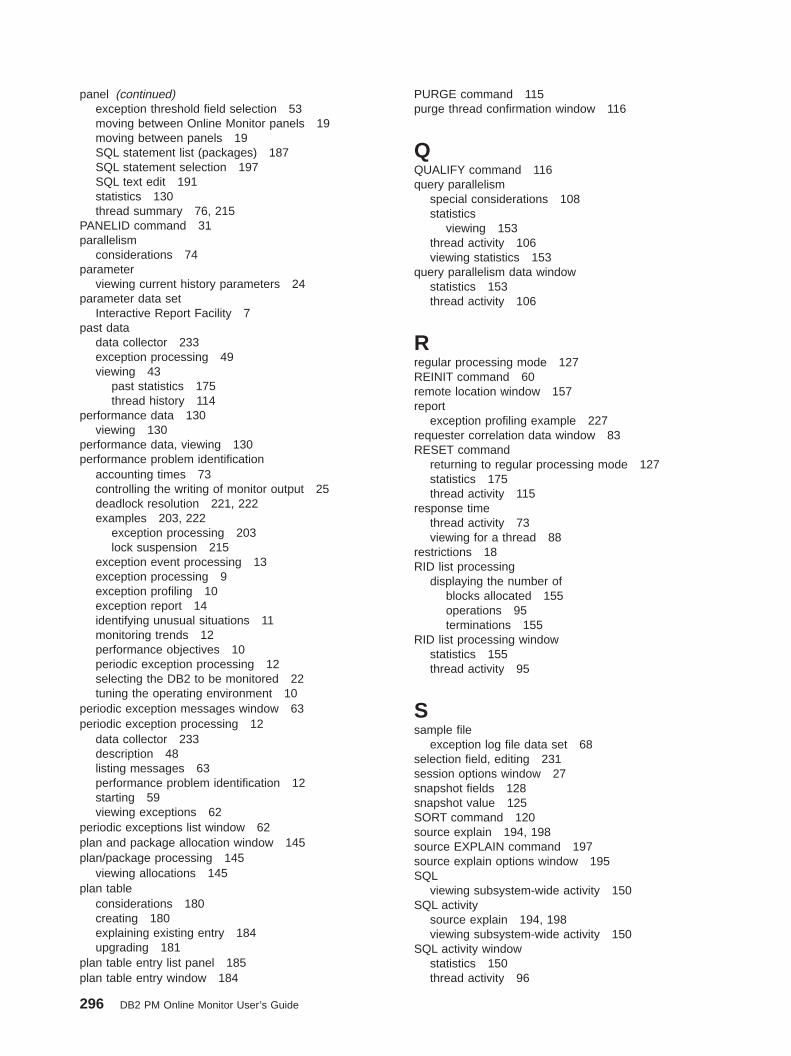
panel (continued)exception threshold field selection 53moving between Online Monitor panels 19moving between panels 19SQL statement list (packages) 187SQL statement selection 197SQL text edit 191statistics 130thread summary 76, 215
PANELID command 31parallelism
considerations 74parameter
viewing current history parameters 24parameter data set
Interactive Report Facility 7past data
data collector 233exception processing 49viewing 43
past statistics 175thread history 114
performance data 130viewing 130
performance data, viewing 130performance problem identification
accounting times 73controlling the writing of monitor output 25deadlock resolution 221, 222examples 203, 222
exception processing 203lock suspension 215
exception event processing 13exception processing 9exception profiling 10exception report 14identifying unusual situations 11monitoring trends 12performance objectives 10periodic exception processing 12selecting the DB2 to be monitored 22tuning the operating environment 10
periodic exception messages window 63periodic exception processing 12
data collector 233description 48listing messages 63performance problem identification 12starting 59viewing exceptions 62
periodic exceptions list window 62plan and package allocation window 145plan/package processing 145
viewing allocations 145plan table
considerations 180creating 180explaining existing entry 184upgrading 181
plan table entry list panel 185plan table entry window 184
PURGE command 115purge thread confirmation window 116
QQUALIFY command 116query parallelism
special considerations 108statistics
viewing 153thread activity 106viewing statistics 153
query parallelism data windowstatistics 153thread activity 106
Rregular processing mode 127REINIT command 60remote location window 157report
exception profiling example 227requester correlation data window 83RESET command
returning to regular processing mode 127statistics 175thread activity 115
response timethread activity 73viewing for a thread 88
restrictions 18RID list processing
displaying the number ofblocks allocated 155operations 95terminations 155
RID list processing windowstatistics 155thread activity 95
Ssample file
exception log file data set 68selection field, editing 231session options window 27snapshot fields 128snapshot value 125SORT command 120source explain 194, 198source EXPLAIN command 197source explain options window 195SQL
viewing subsystem-wide activity 150SQL activity
source explain 194, 198viewing subsystem-wide activity 150
SQL activity windowstatistics 150thread activity 96
296 DB2 PM Online Monitor User’s Guide

SQL statementdisplaying the number of statements executed for a
thread 96EXPLAIN command 113explain function 177, 198viewing thread details 101
SQL statement and package window 101SQL statement list panel (DBRMs) 189SQL statement list panel (packages) 187SQL statement selection panel 197SQL text edit panel 191SQL text entry window 190statistics
commands 172, 176AUTO 172DELTA 174HISTORY 175INTERVAL 174RESET 175
displaying the number ofDB2 commands executed 160instrumentation records 161instrumentation records written to IFC
destinations 161high-water mark fields 129listing active buffer pools 134listing group buffer pools used by DB2 166panel overview 130processing mode 126, 129
delta mode 127interval mode 127regular mode 127resetting delta or interval mode 175
refreshing panel values 172RID list processing 155snapshot fields 128viewing 125, 176
accumulated data 174active buffer pool 135activity on calls to user-written SQL programs at
DB2 server 172backing coupling activity 170bind processing 143CPU times and other data 159data capture activity 162data distributed by a remote location 157data set activity and drain requests 142data sharing locking activity 163EDM pool efficiency 133group buffer pool used by DB2 166key performance data 130locking activity 140log activity 145past data 43, 175plan and package allocation and authorization
management 145query parallelism 153subsystem-wide DB2 activity 147, 174subsystem-wide DDF activity 156subsystem-wide SQL activity 150
statistics detail panel 130
statusexception processing 60, 67
stored proceduresviewing activity on calls to user-written SQL
programs at DB2 server 172viewing for a thread 112
stored procedures windowstatistics 172thread activity 112
subsystem service window 147subsystem services 147
viewing subsystem-wide DB2 activity 147subsystem window 22system parameters reports
commands 200, 203viewing 199, 203viewing past data 43
Ttable information window 211tailoring
exception thresholds 225, 228panel 229, 232
threadaccounting times 73ACQUIRE and RELEASE to reduce thread creation
costs 149commands 112, 125
AUTO 112EXPLAIN 113HISTORY 114PURGE 115QUALIFY 116RESET 115SORT 120
disabling thread on thread summary panel 115displaying 71displaying the number of
RID list processing operations 95SQL statements executed 96
filtering data gathered by data collector 237filtering threads on thread summary panel 116limiting display on thread summary panel 116listing
active threads 76buffer pools used 99distributed data 102group buffer pools used 110locked thread resources 93
ordering threads on thread summary panel 120purging a thread 115refreshing panel values 112reuse considerations 149thread
observing trends 12thread activity overview 72viewing 125
buffer pool 99data sharing locking activity 109DBRM information 86
Index 297

thread (continued)distributed conversation 104group buffer pool used 110IFI calls and data capture information 105locked thread resource 94locking activity 90package information 85past data 43, 114query parallelism information 106requester correlation data 83response time 88specific distributed data 102SQL statement information 101stored procedures 112thread details 79thread identification 82
thread activityperformance problem identification example 215
thread detail panel 79thread identification window 82thread performance
parallelism considerations 74thread summary panel 76, 215
disabling threads 115limiting the number of threads displayed 116ordering threads 120QUALIFY command 116RESET command 115SORT command 120
thread times window 88threads holding resource window 94time
class 5thread activity 105
time, class 5 105time class 5 105time format 36
Online Monitor 36trace class 17
Online Monitor 17
Uupgrade plan table window 181
Vvalue
delta 125DSNZPARM 199, 203high-water mark 125large and missing 35Online Monitor 35refreshing 19
Online Monitor values 19Online Monitor values periodically 26periodically 26statistics values (AUTO command) 172thread activity values (AUTO command) 112
snapshot 125viewing current buffer pool values 199, 203
Wwindow
active data collector list 235auto display 26backing detail facility 170bind processing 143buffer manager 134buffer manager activity 99buffer pool 135buffer pool detail 99CPU times and other data 159create plan table 180current DBRM 86current package 85current SQLID 28data capture 162data collector parameters 235data sharing locking activity
statistics 163thread activity 109
DB2 command 33DB2 command output 32DB2 commands 160DB2 IFC destinations 161DB2 instrumentation 161DB2 subsystem 22DB2 subsystems list 22DB2 thread qualification parameters 118DB2 thread sort specification 122DBRM and plan list 189DBRM SQL statement 188display exception list 64distributed conversation detail 104distributed data
statistics 156thread activity 102
distributed location 102EDM pool 133exception notification 49exception output data sets 58global group bufferpool statistics 169group buffer pool detail
statistics 166thread activity 110
group buffer pools activitystatistics 166thread activity 110
history 44history defaults 24history qualification 237history thread qualification 25IFI (class 5) and data capture 105index selection 212locked resources 93locking (IRLM) activity 90locking activity 140log manager 145monitor output 25open/close management 142package SQL statement 186package version list 187
298 DB2 PM Online Monitor User’s Guide
window (continued)periodic exception messages 63periodic exceptions list 62plan and package allocation 145plan table entry 184plan table entry list 185PREPARE Detail 152purge thread confirmation 116query parallelism data
statistics 153thread activity 106
remote location 157requester correlation data 83RID list processing
statistics 155thread activity 95
session options 27source explain options 195SQL activity
statistics 150thread activity 96
SQL statement and package 101SQL statement list (DBRMs) 189SQL text entry window 190stored procedure
statistics 172thread activity 112
subsystem service 147table information 211thread identification 82thread times 88threads holding resource 94upgrade plan table 181
Index 299

300 DB2 PM Online Monitor User’s Guide

Readers’ Comments — We’d Like to Hear from You
DB2 Performance Monitor for OS/390Online Monitor User’s GuideVersion 6
Publication No. SC26-9168-00
Overall, how satisfied are you with the information in this book?
Very Satisfied Satisfied Neutral Dissatisfied Very DissatisfiedOverall satisfaction h h h h h
How satisfied are you that the information in this book is:
Very Satisfied Satisfied Neutral Dissatisfied Very DissatisfiedAccurate h h h h h
Complete h h h h h
Easy to find h h h h h
Easy to understand h h h h h
Well organized h h h h h
Applicable to your tasks h h h h h
Please tell us how we can improve this book:
Thank you for your responses. May we contact you? h Yes h No
When you send comments to IBM, you grant IBM a nonexclusive right to use or distribute your comments in anyway it believes appropriate without incurring any obligation to you.
Name Address
Company or Organization
Phone No.

Readers’ Comments — We’d Like to Hear from YouSC26-9168-00
SC26-9168-00
IBMRCut or FoldAlong Line
Cut or FoldAlong Line
Fold and Tape Please do not staple Fold and Tape
Fold and Tape Please do not staple Fold and Tape
PLACE
POSTAGE
STAMP
HERE
IBM Deutschland Entwicklung GmbHInformation Development, Dept. 0446Postfach 138071003 BoeblingenGermany
_ _ _ _ _ _ _ _ _ _ _ _ _ _ _ _ _ _ _ _ _ _ _ _ _ _ _ _ _ _ _ _ _ _ _ _ _ _ _ _ _ _ _ _ _ _ _ _ _ _ _ _ _ _ _ _ _ _ _ _ _ _ _ _ _ _ _ _ _ _ _ _ _ _ _ _ _ _ _ _ _ _ _ _ _ _ _ _
_ _ _ _ _ _ _ _ _ _ _ _ _ _ _ _ _ _ _ _ _ _ _ _ _ _ _ _ _ _ _ _ _ _ _ _ _ _ _ _ _ _ _ _ _ _ _ _ _ _ _ _ _ _ _ _ _ _ _ _ _ _ _ _ _ _ _ _ _ _ _ _ _ _ _ _ _ _ _ _ _ _ _ _ _ _ _ _
__
__
__
__
__
__
__
__
__
__
__
__
__
__
__
__
__
__
__
__
__
__
__
__
__
__
__
__
__
__
__
__
__
__
__
__
__
__
__
__
__
__
__
__
__
__
__
__
__
_


IBMR
Program Number: 5645-DB2
Printed in the United States of America
SC26-9168-00